Lynn County, TX Map & Demographics
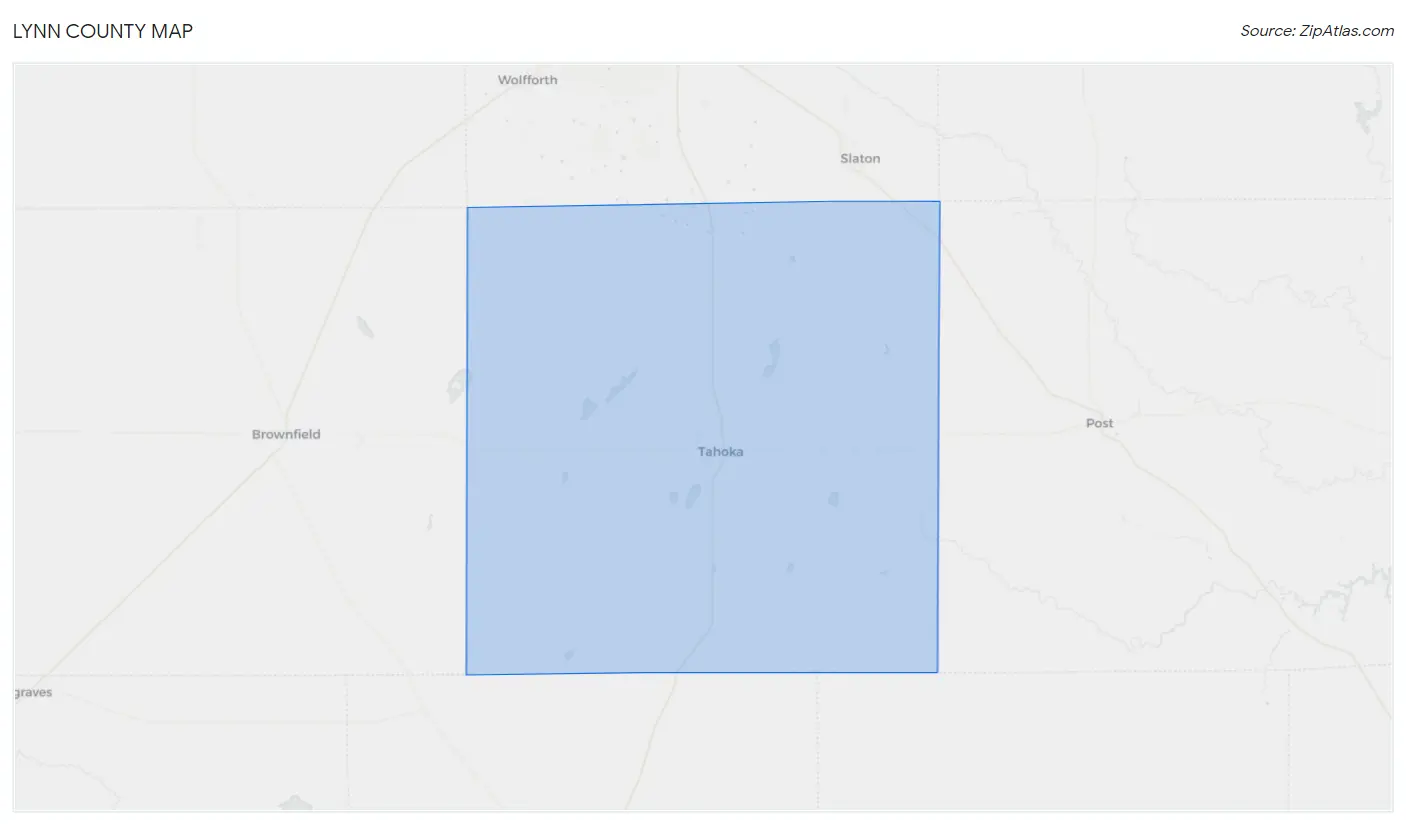
Lynn County Map
Lynn County Overview
$31,000
PER CAPITA INCOME
$69,205
AVG FAMILY INCOME
$52,996
AVG HOUSEHOLD INCOME
43.7%
WAGE / INCOME GAP [ % ]
56.3¢/ $1
WAGE / INCOME GAP [ $ ]
$11,017
FAMILY INCOME DEFICIT
0.48
INEQUALITY / GINI INDEX
5,619
TOTAL POPULATION
2,912
MALE POPULATION
2,707
FEMALE POPULATION
107.57
MALES / 100 FEMALES
92.96
FEMALES / 100 MALES
36.6
MEDIAN AGE
3.3
AVG FAMILY SIZE
2.7
AVG HOUSEHOLD SIZE
2,607
LABOR FORCE [ PEOPLE ]
61.2%
PERCENT IN LABOR FORCE
3.6%
UNEMPLOYMENT RATE
Lynn County Area Codes
Income in Lynn County
Income Overview in Lynn County
Per Capita Income in Lynn County is $31,000, while median incomes of families and households are $69,205 and $52,996 respectively.
| Characteristic | Number | Measure |
| Per Capita Income | 5,619 | $31,000 |
| Median Family Income | 1,423 | $69,205 |
| Mean Family Income | 1,423 | $92,168 |
| Median Household Income | 2,053 | $52,996 |
| Mean Household Income | 2,053 | $81,171 |
| Income Deficit | 1,423 | $11,017 |
| Wage / Income Gap (%) | 5,619 | 43.67% |
| Wage / Income Gap ($) | 5,619 | 56.33¢ per $1 |
| Gini / Inequality Index | 5,619 | 0.48 |
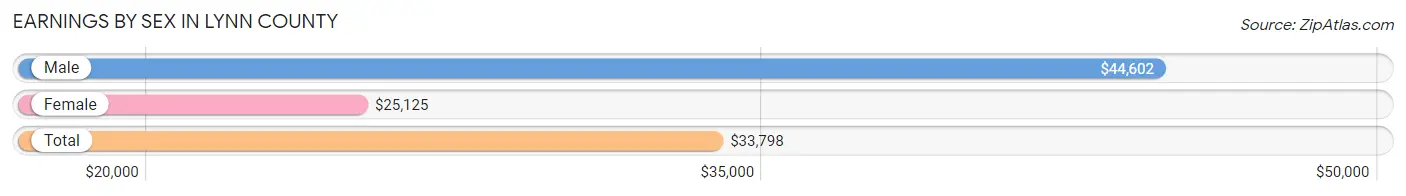
Earnings by Sex in Lynn County
Average Earnings in Lynn County are $33,798, $44,602 for men and $25,125 for women, a difference of 43.7%.
| Sex | Number | Average Earnings |
| Male | 1,579 (56.9%) | $44,602 |
| Female | 1,195 (43.1%) | $25,125 |
| Total | 2,774 (100.0%) | $33,798 |
Earnings by Sex by Income Bracket in Lynn County
The most common earnings brackets in Lynn County are $100,000+ for men (286 | 18.1%) and $2,499 or less for women (139 | 11.6%).
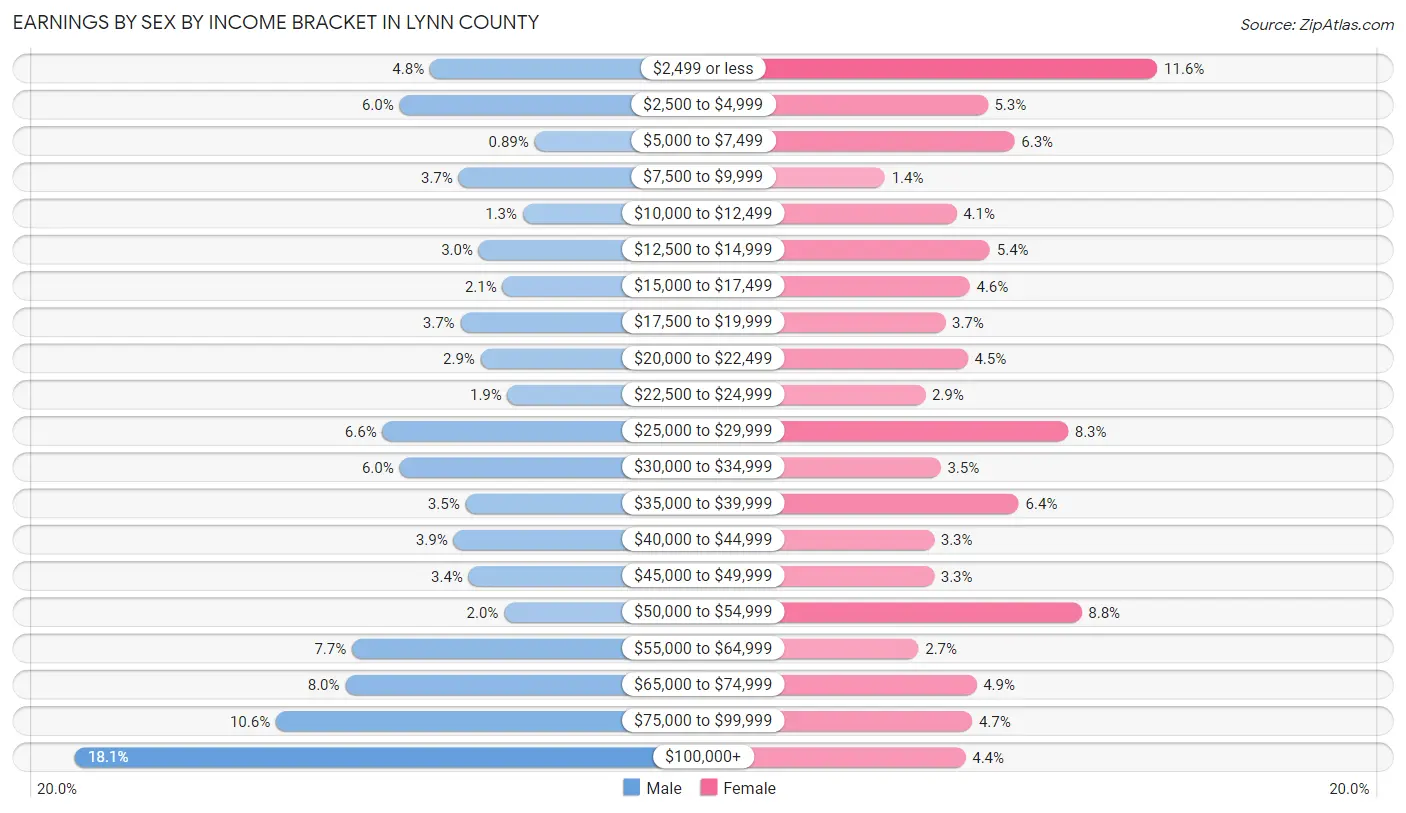
| Income | Male | Female |
| $2,499 or less | 76 (4.8%) | 139 (11.6%) |
| $2,500 to $4,999 | 94 (5.9%) | 63 (5.3%) |
| $5,000 to $7,499 | 14 (0.9%) | 75 (6.3%) |
| $7,500 to $9,999 | 59 (3.7%) | 17 (1.4%) |
| $10,000 to $12,499 | 21 (1.3%) | 49 (4.1%) |
| $12,500 to $14,999 | 47 (3.0%) | 64 (5.4%) |
| $15,000 to $17,499 | 33 (2.1%) | 55 (4.6%) |
| $17,500 to $19,999 | 58 (3.7%) | 44 (3.7%) |
| $20,000 to $22,499 | 46 (2.9%) | 54 (4.5%) |
| $22,500 to $24,999 | 30 (1.9%) | 35 (2.9%) |
| $25,000 to $29,999 | 104 (6.6%) | 99 (8.3%) |
| $30,000 to $34,999 | 94 (5.9%) | 42 (3.5%) |
| $35,000 to $39,999 | 55 (3.5%) | 77 (6.4%) |
| $40,000 to $44,999 | 62 (3.9%) | 39 (3.3%) |
| $45,000 to $49,999 | 53 (3.4%) | 39 (3.3%) |
| $50,000 to $54,999 | 32 (2.0%) | 105 (8.8%) |
| $55,000 to $64,999 | 122 (7.7%) | 32 (2.7%) |
| $65,000 to $74,999 | 126 (8.0%) | 58 (4.9%) |
| $75,000 to $99,999 | 167 (10.6%) | 56 (4.7%) |
| $100,000+ | 286 (18.1%) | 53 (4.4%) |
| Total | 1,579 (100.0%) | 1,195 (100.0%) |
Earnings by Sex by Educational Attainment in Lynn County
Average earnings in Lynn County are $55,921 for men and $27,577 for women, a difference of 50.7%. Men with an educational attainment of college or associate's degree enjoy the highest average annual earnings of $71,964, while those with less than high school education earn the least with $26,875. Women with an educational attainment of graduate degree earn the most with the average annual earnings of $66,500, while those with high school diploma education have the smallest earnings of $18,042.
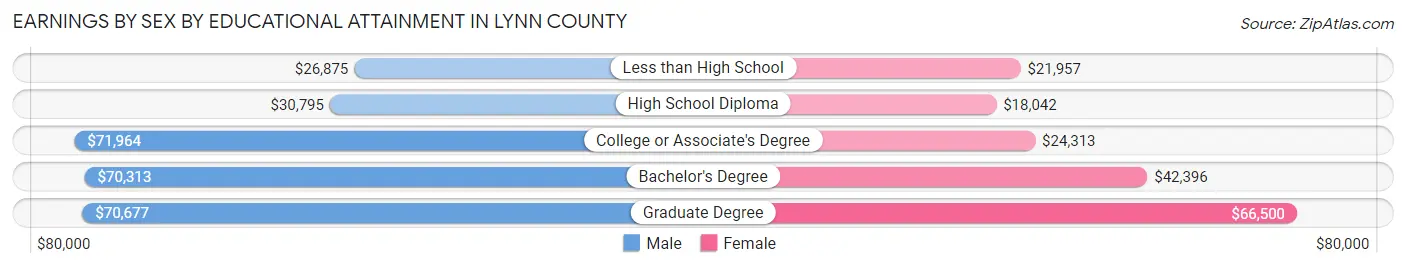
| Educational Attainment | Male Income | Female Income |
| Less than High School | $26,875 | $21,957 |
| High School Diploma | $30,795 | $18,042 |
| College or Associate's Degree | $71,964 | $24,313 |
| Bachelor's Degree | $70,313 | $42,396 |
| Graduate Degree | $70,677 | $66,500 |
| Total | $55,921 | $27,577 |
Family Income in Lynn County
Family Income Brackets in Lynn County
According to the Lynn County family income data, there are 231 families falling into the $100,000 to $149,999 income range, which is the most common income bracket and makes up 16.2% of all families. Conversely, the less than $10,000 income bracket is the least frequent group with only 43 families (3.0%) belonging to this category.
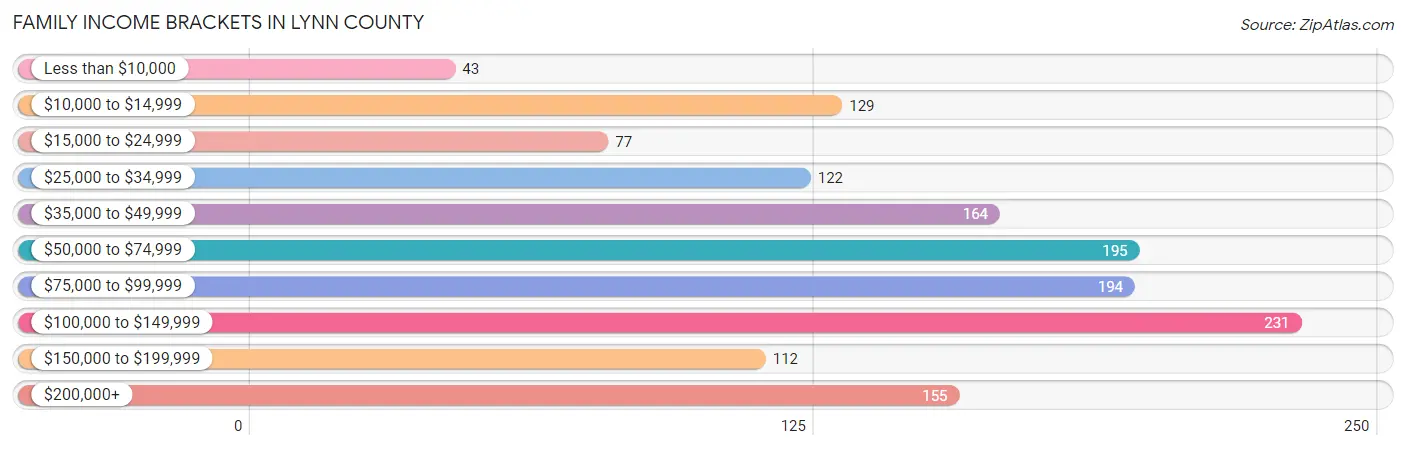
| Income Bracket | # Families | % Families |
| Less than $10,000 | 43 | 3.0% |
| $10,000 to $14,999 | 129 | 9.1% |
| $15,000 to $24,999 | 77 | 5.4% |
| $25,000 to $34,999 | 122 | 8.6% |
| $35,000 to $49,999 | 164 | 11.5% |
| $50,000 to $74,999 | 195 | 13.7% |
| $75,000 to $99,999 | 194 | 13.6% |
| $100,000 to $149,999 | 231 | 16.2% |
| $150,000 to $199,999 | 112 | 7.9% |
| $200,000+ | 155 | 10.9% |
Family Income by Famaliy Size in Lynn County
5-person families (181 | 12.7%) account for the highest median family income in Lynn County with $94,375 per family, while 2-person families (639 | 44.9%) have the highest median income of $37,260 per family member.
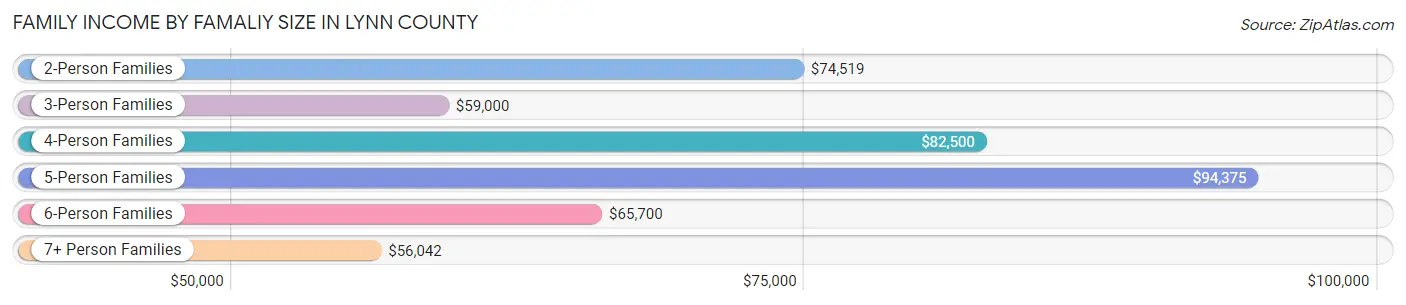
| Income Bracket | # Families | Median Income |
| 2-Person Families | 639 (44.9%) | $74,519 |
| 3-Person Families | 284 (20.0%) | $59,000 |
| 4-Person Families | 256 (18.0%) | $82,500 |
| 5-Person Families | 181 (12.7%) | $94,375 |
| 6-Person Families | 50 (3.5%) | $65,700 |
| 7+ Person Families | 13 (0.9%) | $56,042 |
| Total | 1,423 (100.0%) | $69,205 |
Family Income by Number of Earners in Lynn County
The median family income in Lynn County is $69,205, with families comprising 2 earners (662) having the highest median family income of $103,790, while families with no earners (155) have the lowest median family income of $27,202, accounting for 46.5% and 10.9% of families, respectively.
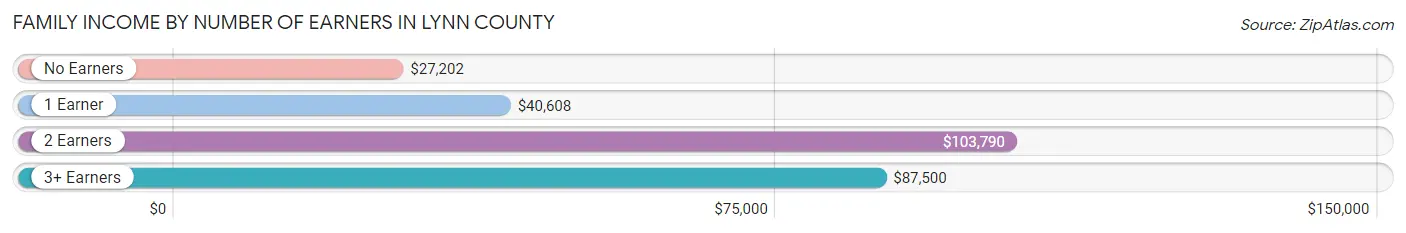
| Number of Earners | # Families | Median Income |
| No Earners | 155 (10.9%) | $27,202 |
| 1 Earner | 464 (32.6%) | $40,608 |
| 2 Earners | 662 (46.5%) | $103,790 |
| 3+ Earners | 142 (10.0%) | $87,500 |
| Total | 1,423 (100.0%) | $69,205 |
Household Income in Lynn County
Household Income Brackets in Lynn County
With 320 households falling in the category, the $100,000 to $149,999 income range is the most frequent in Lynn County, accounting for 15.6% of all households. In contrast, only 76 households (3.7%) fall into the less than $10,000 income bracket, making it the least populous group.
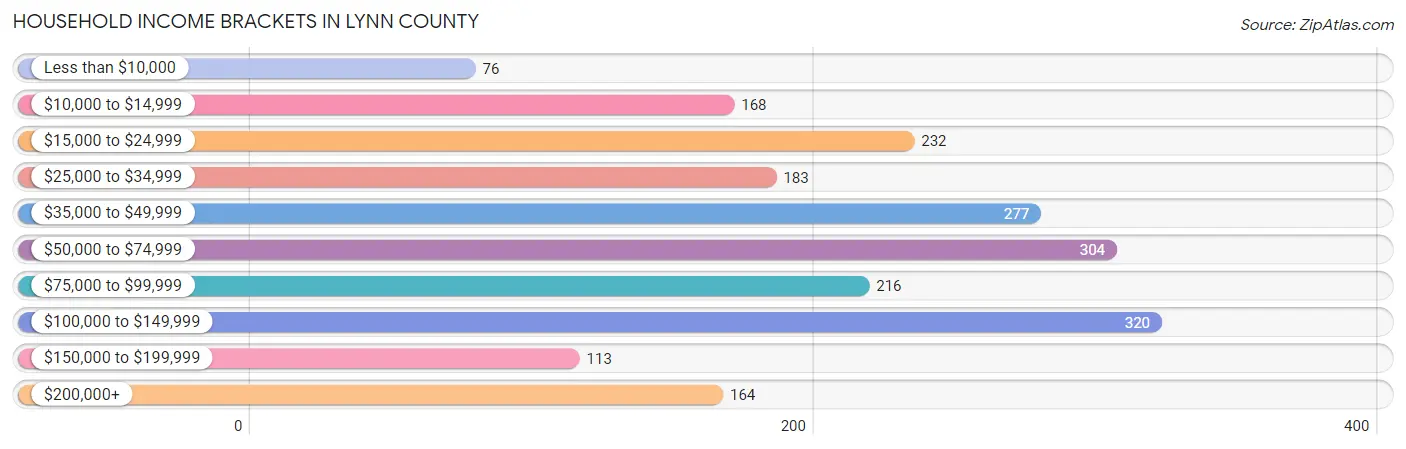
| Income Bracket | # Households | % Households |
| Less than $10,000 | 76 | 3.7% |
| $10,000 to $14,999 | 168 | 8.2% |
| $15,000 to $24,999 | 232 | 11.3% |
| $25,000 to $34,999 | 183 | 8.9% |
| $35,000 to $49,999 | 277 | 13.5% |
| $50,000 to $74,999 | 304 | 14.8% |
| $75,000 to $99,999 | 216 | 10.5% |
| $100,000 to $149,999 | 320 | 15.6% |
| $150,000 to $199,999 | 113 | 5.5% |
| $200,000+ | 164 | 8.0% |
Household Income by Householder Age in Lynn County
The median household income in Lynn County is $52,996, with the highest median household income of $85,000 found in the 25 to 44 years age bracket for the primary householder. A total of 670 households (32.6%) fall into this category. Meanwhile, the 15 to 24 years age bracket for the primary householder has the lowest median household income of $0, with 64 households (3.1%) in this group.
| Income Bracket | # Households | Median Income |
| 15 to 24 Years | 64 (3.1%) | $0 |
| 25 to 44 Years | 670 (32.6%) | $85,000 |
| 45 to 64 Years | 675 (32.9%) | $65,188 |
| 65+ Years | 644 (31.4%) | $34,125 |
| Total | 2,053 (100.0%) | $52,996 |
Poverty in Lynn County
Income Below Poverty by Sex and Age in Lynn County
With 16.6% poverty level for males and 21.1% for females among the residents of Lynn County, 6 to 11 year old males and 16 and 17 year old females are the most vulnerable to poverty, with 99 males (38.7%) and 48 females (64.0%) in their respective age groups living below the poverty level.
| Age Bracket | Male | Female |
| Under 5 Years | 69 (38.1%) | 43 (25.3%) |
| 5 Years | 13 (19.7%) | 22 (59.5%) |
| 6 to 11 Years | 99 (38.7%) | 55 (22.4%) |
| 12 to 14 Years | 0 (0.0%) | 69 (50.0%) |
| 15 Years | 10 (20.8%) | 8 (17.0%) |
| 16 and 17 Years | 4 (4.1%) | 48 (64.0%) |
| 18 to 24 Years | 41 (20.2%) | 78 (37.1%) |
| 25 to 34 Years | 88 (23.0%) | 48 (15.7%) |
| 35 to 44 Years | 38 (9.8%) | 104 (26.8%) |
| 45 to 54 Years | 10 (3.4%) | 16 (5.7%) |
| 55 to 64 Years | 46 (12.5%) | 43 (13.0%) |
| 65 to 74 Years | 44 (17.7%) | 20 (8.4%) |
| 75 Years and over | 9 (5.2%) | 16 (7.0%) |
| Total | 471 (16.6%) | 570 (21.1%) |
Income Above Poverty by Sex and Age in Lynn County
According to the poverty statistics in Lynn County, males aged 12 to 14 years and females aged 45 to 54 years are the age groups that are most secure financially, with 100.0% of males and 94.4% of females in these age groups living above the poverty line.
| Age Bracket | Male | Female |
| Under 5 Years | 112 (61.9%) | 127 (74.7%) |
| 5 Years | 53 (80.3%) | 15 (40.5%) |
| 6 to 11 Years | 157 (61.3%) | 191 (77.6%) |
| 12 to 14 Years | 132 (100.0%) | 69 (50.0%) |
| 15 Years | 38 (79.2%) | 39 (83.0%) |
| 16 and 17 Years | 94 (95.9%) | 27 (36.0%) |
| 18 to 24 Years | 162 (79.8%) | 132 (62.9%) |
| 25 to 34 Years | 295 (77.0%) | 257 (84.3%) |
| 35 to 44 Years | 348 (90.2%) | 284 (73.2%) |
| 45 to 54 Years | 288 (96.6%) | 267 (94.4%) |
| 55 to 64 Years | 322 (87.5%) | 288 (87.0%) |
| 65 to 74 Years | 204 (82.3%) | 217 (91.6%) |
| 75 Years and over | 163 (94.8%) | 212 (93.0%) |
| Total | 2,368 (83.4%) | 2,125 (78.8%) |
Income Below Poverty Among Married-Couple Families in Lynn County
The poverty statistics for married-couple families in Lynn County show that 8.4% or 96 of the total 1,142 families live below the poverty line. Families with 5 or more children have the highest poverty rate of 75.0%, comprising of 6 families. On the other hand, families with 1 or 2 children have the lowest poverty rate of 7.3%, which includes 22 families.
| Children | Above Poverty | Below Poverty |
| No Children | 594 (91.7%) | 54 (8.3%) |
| 1 or 2 Children | 281 (92.7%) | 22 (7.3%) |
| 3 or 4 Children | 169 (92.3%) | 14 (7.6%) |
| 5 or more Children | 2 (25.0%) | 6 (75.0%) |
| Total | 1,046 (91.6%) | 96 (8.4%) |
Income Below Poverty Among Single-Parent Households in Lynn County
According to the poverty data in Lynn County, 61.1% or 33 single-father households and 48.9% or 111 single-mother households are living below the poverty line. Among single-father households, those with no children have the highest poverty rate, with 33 households (86.8%) experiencing poverty. Likewise, among single-mother households, those with 3 or 4 children have the highest poverty rate, with 52 households (92.9%) falling below the poverty line.
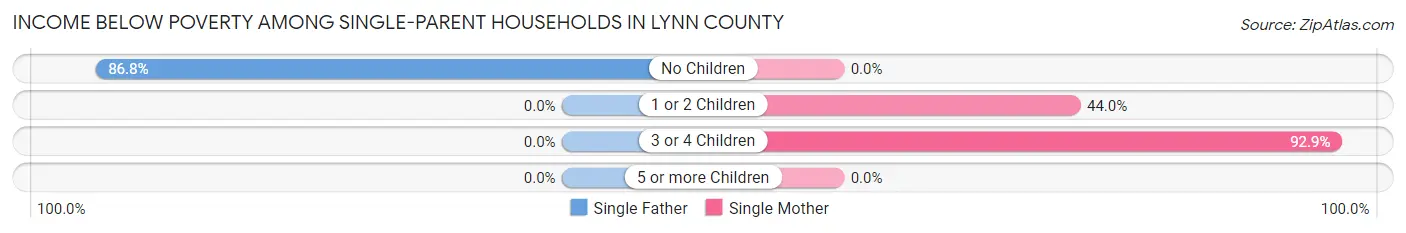
| Children | Single Father | Single Mother |
| No Children | 33 (86.8%) | 0 (0.0%) |
| 1 or 2 Children | 0 (0.0%) | 59 (44.0%) |
| 3 or 4 Children | 0 (0.0%) | 52 (92.9%) |
| 5 or more Children | 0 (0.0%) | 0 (0.0%) |
| Total | 33 (61.1%) | 111 (48.9%) |
Income Below Poverty Among Married-Couple vs Single-Parent Households in Lynn County
The poverty data for Lynn County shows that 96 of the married-couple family households (8.4%) and 144 of the single-parent households (51.2%) are living below the poverty level. Within the married-couple family households, those with 5 or more children have the highest poverty rate, with 6 households (75.0%) falling below the poverty line. Among the single-parent households, those with 3 or 4 children have the highest poverty rate, with 52 household (92.9%) living below poverty.
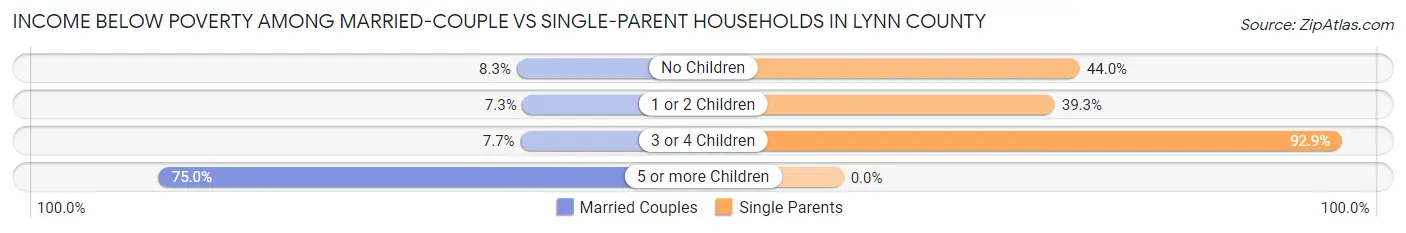
| Children | Married-Couple Families | Single-Parent Households |
| No Children | 54 (8.3%) | 33 (44.0%) |
| 1 or 2 Children | 22 (7.3%) | 59 (39.3%) |
| 3 or 4 Children | 14 (7.6%) | 52 (92.9%) |
| 5 or more Children | 6 (75.0%) | 0 (0.0%) |
| Total | 96 (8.4%) | 144 (51.2%) |
Race in Lynn County
The most populous races in Lynn County are White / Caucasian (4,032 | 71.8%), Hispanic or Latino (2,559 | 45.5%), and Two or more Races (1,114 | 19.8%).
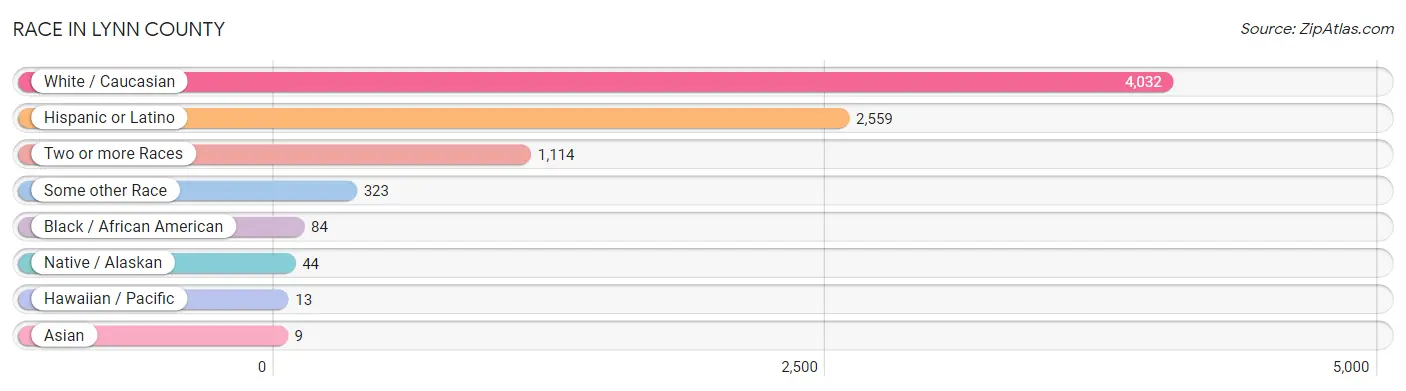
| Race | # Population | % Population |
| Asian | 9 | 0.2% |
| Black / African American | 84 | 1.5% |
| Hawaiian / Pacific | 13 | 0.2% |
| Hispanic or Latino | 2,559 | 45.5% |
| Native / Alaskan | 44 | 0.8% |
| White / Caucasian | 4,032 | 71.8% |
| Two or more Races | 1,114 | 19.8% |
| Some other Race | 323 | 5.8% |
| Total | 5,619 | 100.0% |
Ancestry in Lynn County
The most populous ancestries reported in Lynn County are Mexican (2,135 | 38.0%), German (511 | 9.1%), English (426 | 7.6%), Irish (407 | 7.2%), and American (209 | 3.7%), together accounting for 65.6% of all Lynn County residents.
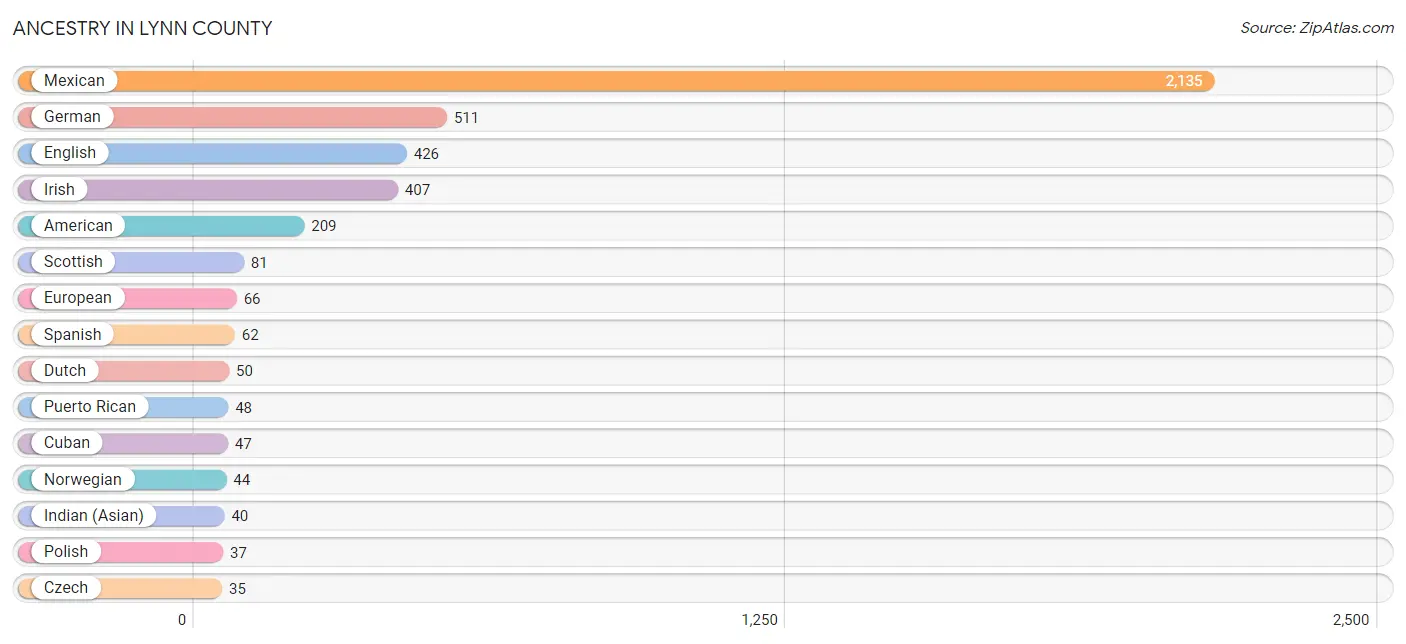
| Ancestry | # Population | % Population |
| African | 29 | 0.5% |
| American | 209 | 3.7% |
| Apache | 8 | 0.1% |
| Austrian | 7 | 0.1% |
| Bhutanese | 1 | 0.0% |
| Bolivian | 18 | 0.3% |
| British | 7 | 0.1% |
| Burmese | 8 | 0.1% |
| Central American | 6 | 0.1% |
| Creek | 11 | 0.2% |
| Cuban | 47 | 0.8% |
| Czech | 35 | 0.6% |
| Dutch | 50 | 0.9% |
| Dutch West Indian | 21 | 0.4% |
| English | 426 | 7.6% |
| European | 66 | 1.2% |
| French | 34 | 0.6% |
| German | 511 | 9.1% |
| Greek | 3 | 0.1% |
| Guamanian / Chamorro | 3 | 0.1% |
| Honduran | 1 | 0.0% |
| Indian (Asian) | 40 | 0.7% |
| Irish | 407 | 7.2% |
| Italian | 34 | 0.6% |
| Japanese | 1 | 0.0% |
| Korean | 3 | 0.1% |
| Laotian | 2 | 0.0% |
| Mexican | 2,135 | 38.0% |
| Nicaraguan | 3 | 0.1% |
| Norwegian | 44 | 0.8% |
| Panamanian | 2 | 0.0% |
| Polish | 37 | 0.7% |
| Puerto Rican | 48 | 0.9% |
| Russian | 2 | 0.0% |
| Scotch-Irish | 14 | 0.3% |
| Scottish | 81 | 1.4% |
| South American | 18 | 0.3% |
| Spaniard | 4 | 0.1% |
| Spanish | 62 | 1.1% |
| Subsaharan African | 29 | 0.5% |
| Swedish | 6 | 0.1% |
| Thai | 2 | 0.0% |
| Welsh | 20 | 0.4% | View All 43 Rows |
Immigrants in Lynn County
The most numerous immigrant groups reported in Lynn County came from Latin America (158 | 2.8%), Central America (121 | 2.1%), Mexico (118 | 2.1%), Caribbean (19 | 0.3%), and Bolivia (18 | 0.3%), together accounting for 7.7% of all Lynn County residents.
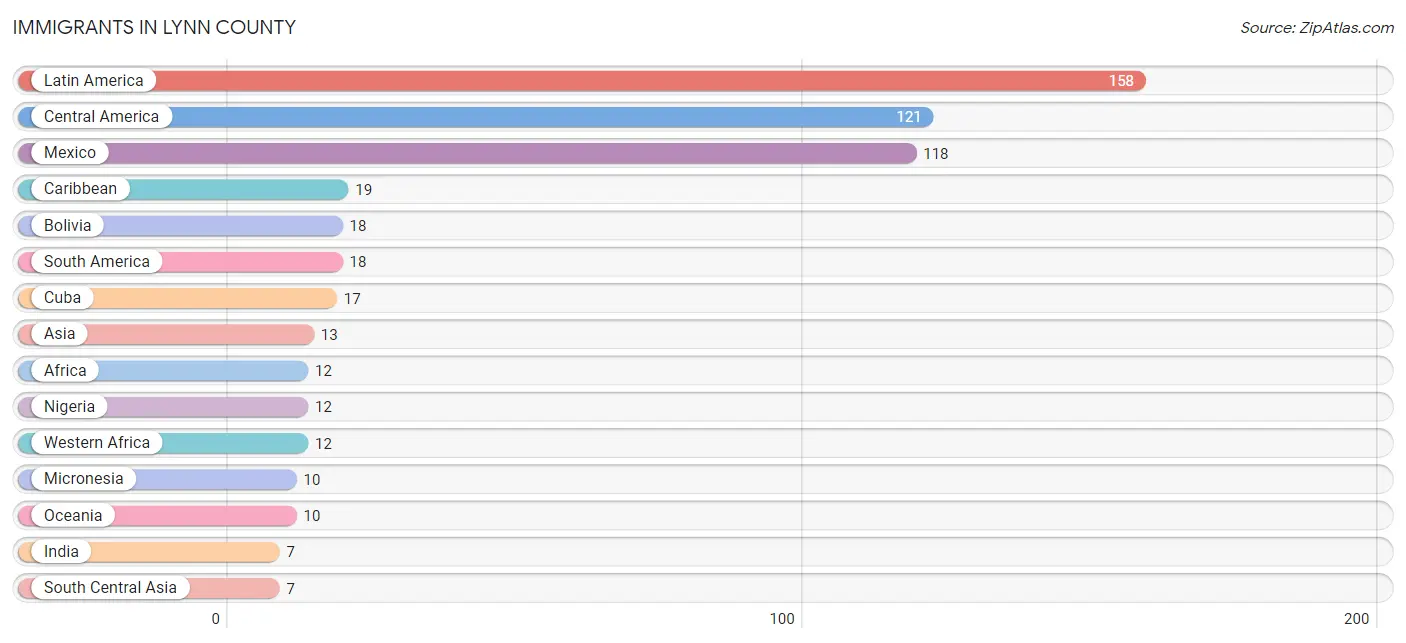
| Immigration Origin | # Population | % Population |
| Africa | 12 | 0.2% |
| Asia | 13 | 0.2% |
| Bolivia | 18 | 0.3% |
| Cambodia | 1 | 0.0% |
| Caribbean | 19 | 0.3% |
| Central America | 121 | 2.1% |
| Cuba | 17 | 0.3% |
| Eastern Asia | 2 | 0.0% |
| England | 2 | 0.0% |
| Europe | 3 | 0.1% |
| Honduras | 1 | 0.0% |
| India | 7 | 0.1% |
| Korea | 2 | 0.0% |
| Latin America | 158 | 2.8% |
| Mexico | 118 | 2.1% |
| Micronesia | 10 | 0.2% |
| Nigeria | 12 | 0.2% |
| Northern Europe | 3 | 0.1% |
| Oceania | 10 | 0.2% |
| Panama | 2 | 0.0% |
| Philippines | 3 | 0.1% |
| South America | 18 | 0.3% |
| South Central Asia | 7 | 0.1% |
| South Eastern Asia | 4 | 0.1% |
| Sweden | 1 | 0.0% |
| Trinidad and Tobago | 2 | 0.0% |
| Western Africa | 12 | 0.2% | View All 27 Rows |
Sex and Age in Lynn County
Sex and Age in Lynn County
The most populous age groups in Lynn County are 5 to 9 Years (270 | 9.3%) for men and 35 to 39 Years (217 | 8.0%) for women.
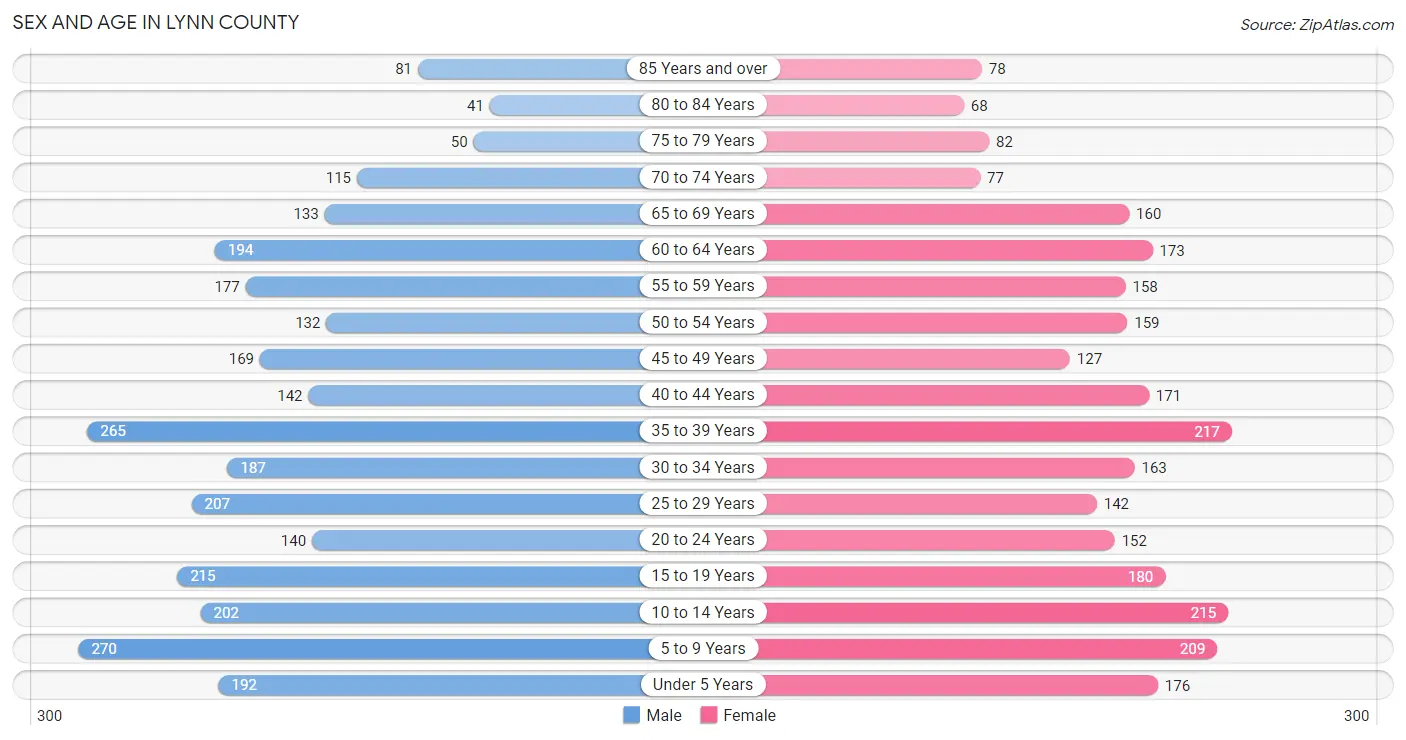
| Age Bracket | Male | Female |
| Under 5 Years | 192 (6.6%) | 176 (6.5%) |
| 5 to 9 Years | 270 (9.3%) | 209 (7.7%) |
| 10 to 14 Years | 202 (6.9%) | 215 (7.9%) |
| 15 to 19 Years | 215 (7.4%) | 180 (6.7%) |
| 20 to 24 Years | 140 (4.8%) | 152 (5.6%) |
| 25 to 29 Years | 207 (7.1%) | 142 (5.2%) |
| 30 to 34 Years | 187 (6.4%) | 163 (6.0%) |
| 35 to 39 Years | 265 (9.1%) | 217 (8.0%) |
| 40 to 44 Years | 142 (4.9%) | 171 (6.3%) |
| 45 to 49 Years | 169 (5.8%) | 127 (4.7%) |
| 50 to 54 Years | 132 (4.5%) | 159 (5.9%) |
| 55 to 59 Years | 177 (6.1%) | 158 (5.8%) |
| 60 to 64 Years | 194 (6.7%) | 173 (6.4%) |
| 65 to 69 Years | 133 (4.6%) | 160 (5.9%) |
| 70 to 74 Years | 115 (4.0%) | 77 (2.8%) |
| 75 to 79 Years | 50 (1.7%) | 82 (3.0%) |
| 80 to 84 Years | 41 (1.4%) | 68 (2.5%) |
| 85 Years and over | 81 (2.8%) | 78 (2.9%) |
| Total | 2,912 (100.0%) | 2,707 (100.0%) |
Families and Households in Lynn County
Median Family Size in Lynn County
The median family size in Lynn County is 3.30 persons per family, with single female/mother families (227 | 16.0%) accounting for the largest median family size of 4.22 persons per family. On the other hand, single male/father families (54 | 3.8%) represent the smallest median family size with 2.85 persons per family.
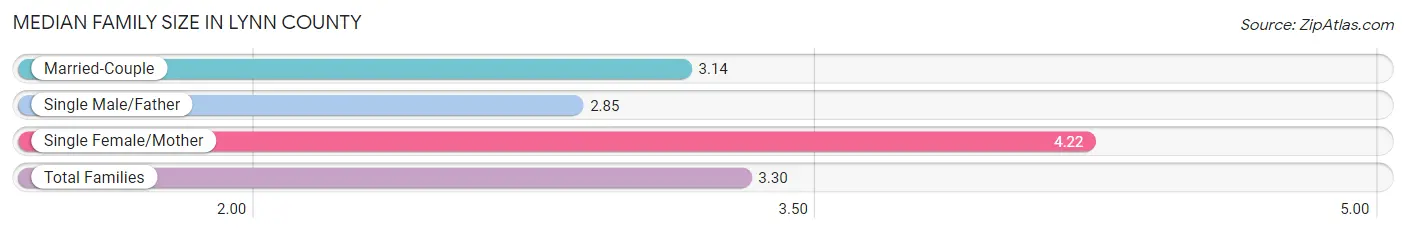
| Family Type | # Families | Family Size |
| Married-Couple | 1,142 (80.2%) | 3.14 |
| Single Male/Father | 54 (3.8%) | 2.85 |
| Single Female/Mother | 227 (16.0%) | 4.22 |
| Total Families | 1,423 (100.0%) | 3.30 |
Median Household Size in Lynn County
The median household size in Lynn County is 2.71 persons per household, with single female/mother households (227 | 11.1%) accounting for the largest median household size of 4.48 persons per household. non-family households (630 | 30.7%) represent the smallest median household size with 1.16 persons per household.
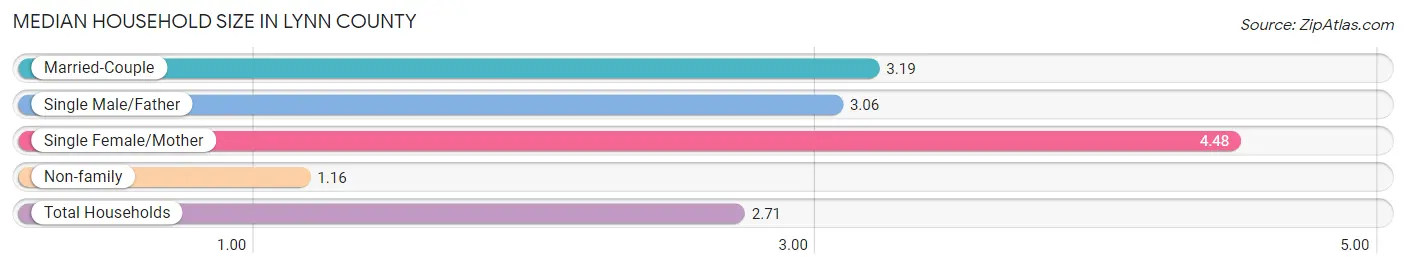
| Household Type | # Households | Household Size |
| Married-Couple | 1,142 (55.6%) | 3.19 |
| Single Male/Father | 54 (2.6%) | 3.06 |
| Single Female/Mother | 227 (11.1%) | 4.48 |
| Non-family | 630 (30.7%) | 1.16 |
| Total Households | 2,053 (100.0%) | 2.71 |
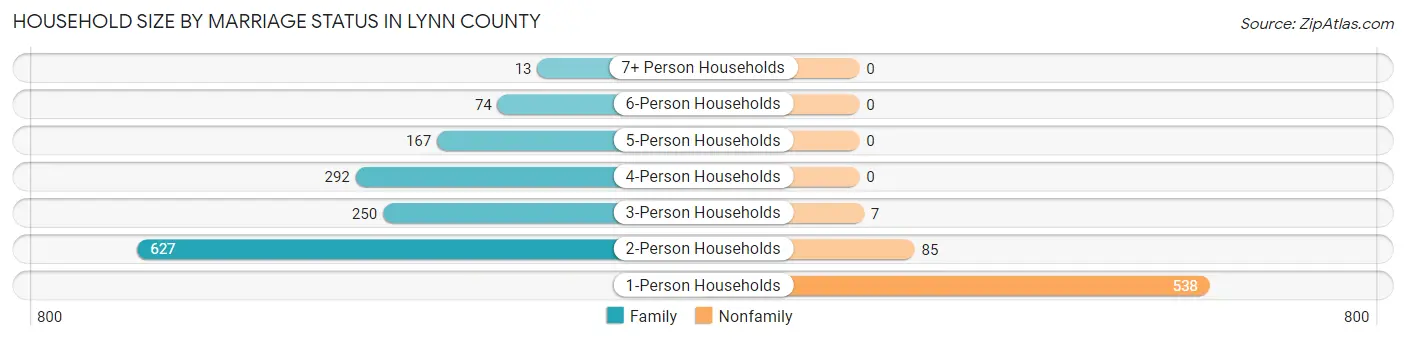
Household Size by Marriage Status in Lynn County
Out of a total of 2,053 households in Lynn County, 1,423 (69.3%) are family households, while 630 (30.7%) are nonfamily households. The most numerous type of family households are 2-person households, comprising 627, and the most common type of nonfamily households are 1-person households, comprising 538.
| Household Size | Family Households | Nonfamily Households |
| 1-Person Households | - | 538 (26.2%) |
| 2-Person Households | 627 (30.5%) | 85 (4.1%) |
| 3-Person Households | 250 (12.2%) | 7 (0.3%) |
| 4-Person Households | 292 (14.2%) | 0 (0.0%) |
| 5-Person Households | 167 (8.1%) | 0 (0.0%) |
| 6-Person Households | 74 (3.6%) | 0 (0.0%) |
| 7+ Person Households | 13 (0.6%) | 0 (0.0%) |
| Total | 1,423 (69.3%) | 630 (30.7%) |
Female Fertility in Lynn County
Fertility by Age in Lynn County
Average fertility rate in Lynn County is 74.0 births per 1,000 women. Women in the age bracket of 20 to 34 years have the highest fertility rate with 166.0 births per 1,000 women. Women in the age bracket of 20 to 34 years acount for 87.4% of all women with births.
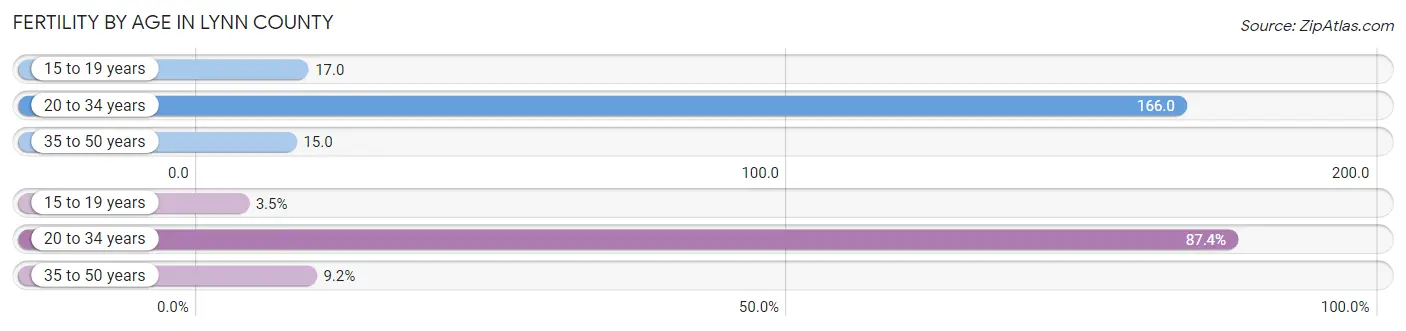
| Age Bracket | Women with Births | Births / 1,000 Women |
| 15 to 19 years | 3 (3.5%) | 17.0 |
| 20 to 34 years | 76 (87.4%) | 166.0 |
| 35 to 50 years | 8 (9.2%) | 15.0 |
| Total | 87 (100.0%) | 74.0 |
Fertility by Age by Marriage Status in Lynn County
74.7% of women with births (87) in Lynn County are married. The highest percentage of unmarried women with births falls into 15 to 19 years age bracket with 100.0% of them unmarried at the time of birth, while the lowest percentage of unmarried women with births belong to 35 to 50 years age bracket with 0.0% of them unmarried.
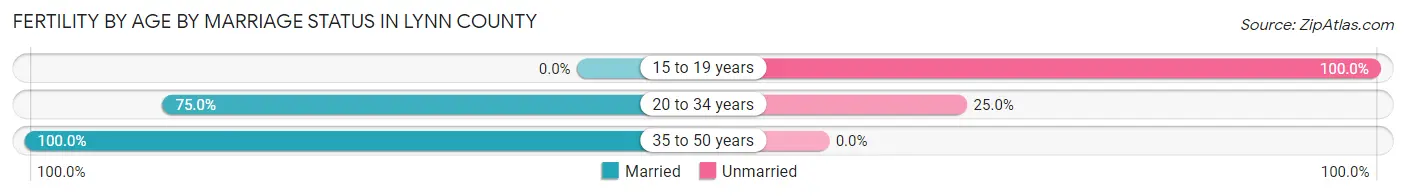
| Age Bracket | Married | Unmarried |
| 15 to 19 years | 0 (0.0%) | 3 (100.0%) |
| 20 to 34 years | 57 (75.0%) | 19 (25.0%) |
| 35 to 50 years | 8 (100.0%) | 0 (0.0%) |
| Total | 65 (74.7%) | 22 (25.3%) |
Fertility by Education in Lynn County
Average fertility rate in Lynn County is 74.0 births per 1,000 women. Women with the education attainment of bachelor's degree have the highest fertility rate of 189.0 births per 1,000 women, while women with the education attainment of high school diploma have the lowest fertility at 10.0 births per 1,000 women. Women with the education attainment of bachelor's degree represent 56.3% of all women with births.
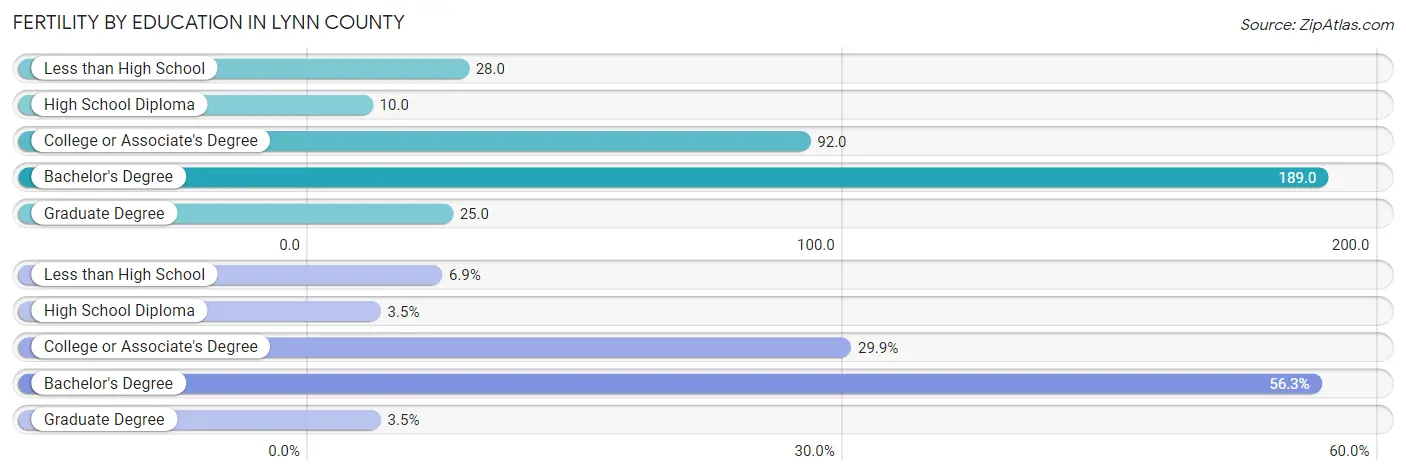
| Educational Attainment | Women with Births | Births / 1,000 Women |
| Less than High School | 6 (6.9%) | 28.0 |
| High School Diploma | 3 (3.5%) | 10.0 |
| College or Associate's Degree | 26 (29.9%) | 92.0 |
| Bachelor's Degree | 49 (56.3%) | 189.0 |
| Graduate Degree | 3 (3.5%) | 25.0 |
| Total | 87 (100.0%) | 74.0 |
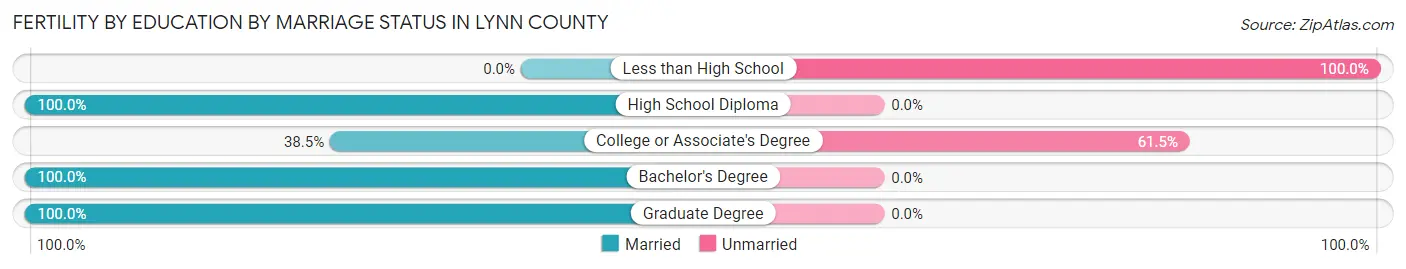
Fertility by Education by Marriage Status in Lynn County
25.3% of women with births in Lynn County are unmarried. Women with the educational attainment of high school diploma are most likely to be married with 100.0% of them married at childbirth, while women with the educational attainment of less than high school are least likely to be married with 100.0% of them unmarried at childbirth.
| Educational Attainment | Married | Unmarried |
| Less than High School | 0 (0.0%) | 6 (100.0%) |
| High School Diploma | 3 (100.0%) | 0 (0.0%) |
| College or Associate's Degree | 10 (38.5%) | 16 (61.5%) |
| Bachelor's Degree | 49 (100.0%) | 0 (0.0%) |
| Graduate Degree | 3 (100.0%) | 0 (0.0%) |
| Total | 65 (74.7%) | 22 (25.3%) |
Employment Characteristics in Lynn County
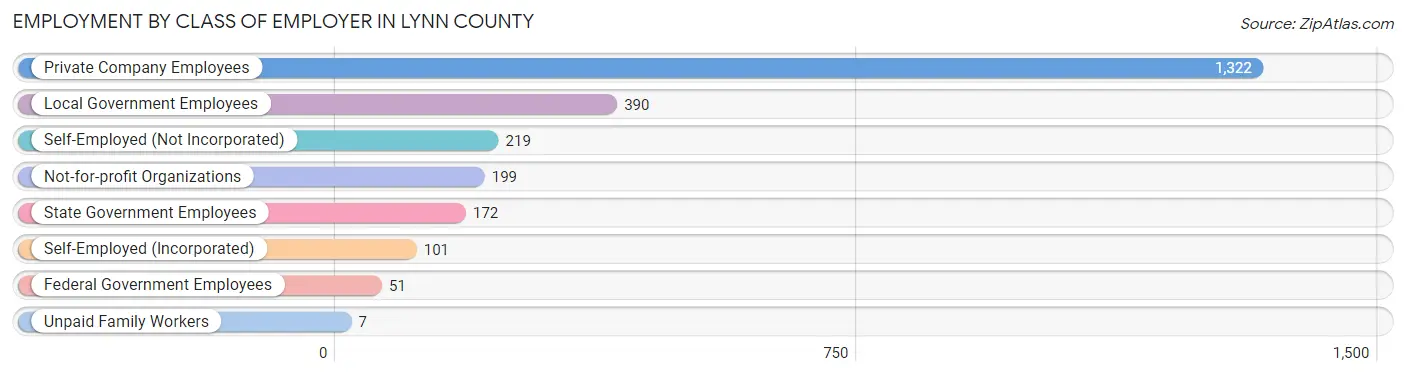
Employment by Class of Employer in Lynn County
Among the 2,461 employed individuals in Lynn County, private company employees (1,322 | 53.7%), local government employees (390 | 15.9%), and self-employed (not incorporated) (219 | 8.9%) make up the most common classes of employment.
| Employer Class | # Employees | % Employees |
| Private Company Employees | 1,322 | 53.7% |
| Self-Employed (Incorporated) | 101 | 4.1% |
| Self-Employed (Not Incorporated) | 219 | 8.9% |
| Not-for-profit Organizations | 199 | 8.1% |
| Local Government Employees | 390 | 15.9% |
| State Government Employees | 172 | 7.0% |
| Federal Government Employees | 51 | 2.1% |
| Unpaid Family Workers | 7 | 0.3% |
| Total | 2,461 | 100.0% |
Employment Status by Age in Lynn County
According to the labor force statistics for Lynn County, out of the total population over 16 years of age (4,260), 61.2% or 2,607 individuals are in the labor force, with 3.6% or 94 of them unemployed. The age group with the highest labor force participation rate is 25 to 29 years, with 86.8% or 303 individuals in the labor force. Within the labor force, the 20 to 24 years age range has the highest percentage of unemployed individuals, with 18.6% or 46 of them being unemployed.
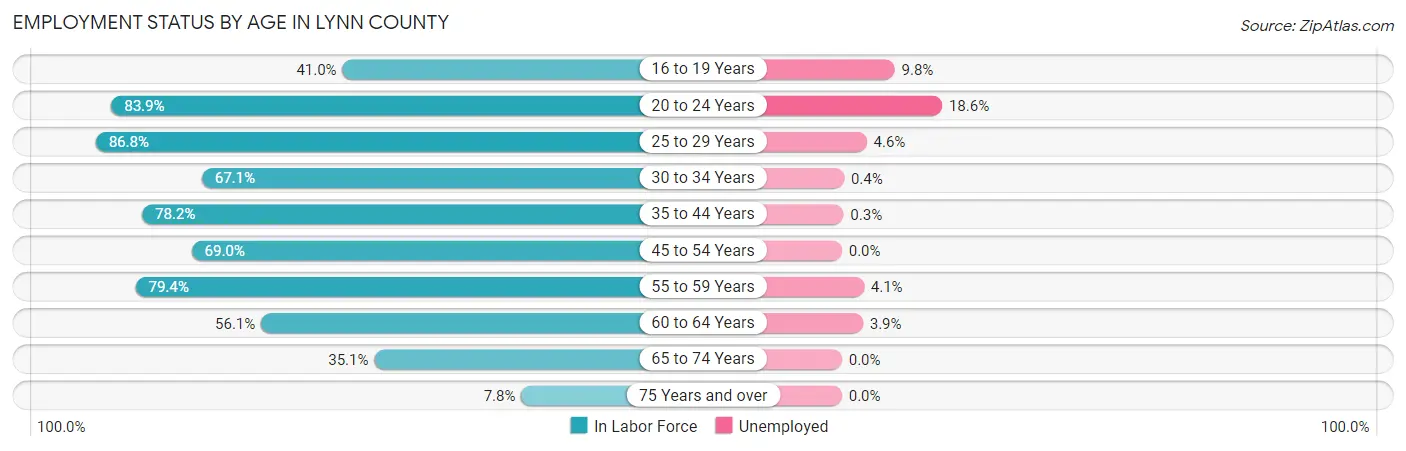
| Age Bracket | In Labor Force | Unemployed |
| 16 to 19 Years | 123 (41.0%) | 12 (9.8%) |
| 20 to 24 Years | 245 (83.9%) | 46 (18.6%) |
| 25 to 29 Years | 303 (86.8%) | 14 (4.6%) |
| 30 to 34 Years | 235 (67.1%) | 1 (0.4%) |
| 35 to 44 Years | 622 (78.2%) | 2 (0.3%) |
| 45 to 54 Years | 405 (69.0%) | 0 (0.0%) |
| 55 to 59 Years | 266 (79.4%) | 11 (4.1%) |
| 60 to 64 Years | 206 (56.1%) | 8 (3.9%) |
| 65 to 74 Years | 170 (35.1%) | 0 (0.0%) |
| 75 Years and over | 31 (7.8%) | 0 (0.0%) |
| Total | 2,607 (61.2%) | 94 (3.6%) |
Employment Status by Educational Attainment in Lynn County
According to labor force statistics for Lynn County, 73.2% of individuals (2,037) out of the total population between 25 and 64 years of age (2,783) are in the labor force, with 1.8% or 37 of them being unemployed. The group with the highest labor force participation rate are those with the educational attainment of bachelor's degree or higher, with 92.2% or 697 individuals in the labor force. Within the labor force, individuals with high school diploma education have the highest percentage of unemployment, with 2.4% or 11 of them being unemployed.
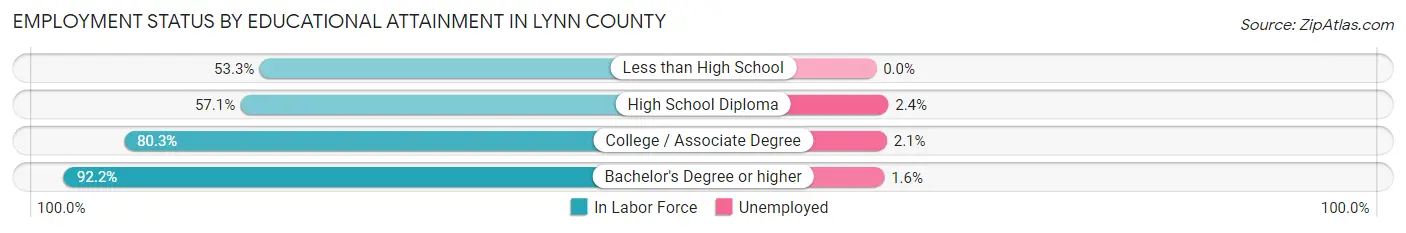
| Educational Attainment | In Labor Force | Unemployed |
| Less than High School | 208 (53.3%) | 0 (0.0%) |
| High School Diploma | 449 (57.1%) | 19 (2.4%) |
| College / Associate Degree | 683 (80.3%) | 18 (2.1%) |
| Bachelor's Degree or higher | 697 (92.2%) | 12 (1.6%) |
| Total | 2,037 (73.2%) | 50 (1.8%) |
Employment Occupations by Sex in Lynn County
Management, Business, Science and Arts Occupations
The most common Management, Business, Science and Arts occupations in Lynn County are Management (393 | 15.7%), Community & Social Service (331 | 13.2%), Education Instruction & Library (237 | 9.5%), Health Diagnosing & Treating (139 | 5.6%), and Health Technologists (108 | 4.3%).
Management, Business, Science and Arts Occupations by Sex
Within the Management, Business, Science and Arts occupations in Lynn County, the most male-oriented occupations are Computers & Mathematics (100.0%), Architecture & Engineering (100.0%), and Computers, Engineering & Science (92.2%), while the most female-oriented occupations are Health Technologists (96.3%), Health Diagnosing & Treating (90.6%), and Education Instruction & Library (81.4%).
| Occupation | Male | Female |
| Management | 282 (71.8%) | 111 (28.2%) |
| Business & Financial | 40 (53.3%) | 35 (46.7%) |
| Computers, Engineering & Science | 59 (92.2%) | 5 (7.8%) |
| Computers & Mathematics | 45 (100.0%) | 0 (0.0%) |
| Architecture & Engineering | 9 (100.0%) | 0 (0.0%) |
| Life, Physical & Social Science | 5 (50.0%) | 5 (50.0%) |
| Community & Social Service | 101 (30.5%) | 230 (69.5%) |
| Education, Arts & Media | 30 (65.2%) | 16 (34.8%) |
| Legal Services & Support | 12 (85.7%) | 2 (14.3%) |
| Education Instruction & Library | 44 (18.6%) | 193 (81.4%) |
| Arts, Media & Entertainment | 15 (44.1%) | 19 (55.9%) |
| Health Diagnosing & Treating | 13 (9.3%) | 126 (90.6%) |
| Health Technologists | 4 (3.7%) | 104 (96.3%) |
| Total (Category) | 495 (49.4%) | 507 (50.6%) |
| Total (Overall) | 1,405 (56.1%) | 1,101 (43.9%) |
Services Occupations
The most common Services occupations in Lynn County are Security & Protection (141 | 5.6%), Healthcare Support (112 | 4.5%), Food Preparation & Serving (99 | 4.0%), Law Enforcement (81 | 3.2%), and Firefighting & Prevention (60 | 2.4%).
Services Occupations by Sex
Within the Services occupations in Lynn County, the most male-oriented occupations are Law Enforcement (100.0%), Security & Protection (99.3%), and Firefighting & Prevention (98.3%), while the most female-oriented occupations are Healthcare Support (100.0%), Personal Care & Service (100.0%), and Food Preparation & Serving (62.6%).
| Occupation | Male | Female |
| Healthcare Support | 0 (0.0%) | 112 (100.0%) |
| Security & Protection | 140 (99.3%) | 1 (0.7%) |
| Firefighting & Prevention | 59 (98.3%) | 1 (1.7%) |
| Law Enforcement | 81 (100.0%) | 0 (0.0%) |
| Food Preparation & Serving | 37 (37.4%) | 62 (62.6%) |
| Cleaning & Maintenance | 27 (45.0%) | 33 (55.0%) |
| Personal Care & Service | 0 (0.0%) | 42 (100.0%) |
| Total (Category) | 204 (44.9%) | 250 (55.1%) |
| Total (Overall) | 1,405 (56.1%) | 1,101 (43.9%) |
Sales and Office Occupations
The most common Sales and Office occupations in Lynn County are Sales & Related (225 | 9.0%), and Office & Administration (219 | 8.7%).

Sales and Office Occupations by Sex
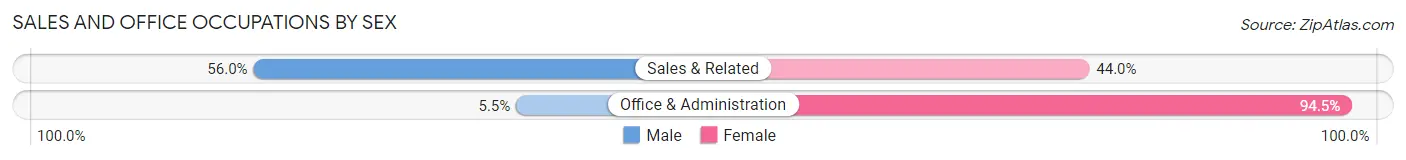
| Occupation | Male | Female |
| Sales & Related | 126 (56.0%) | 99 (44.0%) |
| Office & Administration | 12 (5.5%) | 207 (94.5%) |
| Total (Category) | 138 (31.1%) | 306 (68.9%) |
| Total (Overall) | 1,405 (56.1%) | 1,101 (43.9%) |
Natural Resources, Construction and Maintenance Occupations
The most common Natural Resources, Construction and Maintenance occupations in Lynn County are Construction & Extraction (232 | 9.3%), Farming, Fishing & Forestry (104 | 4.2%), and Installation, Maintenance & Repair (50 | 2.0%).
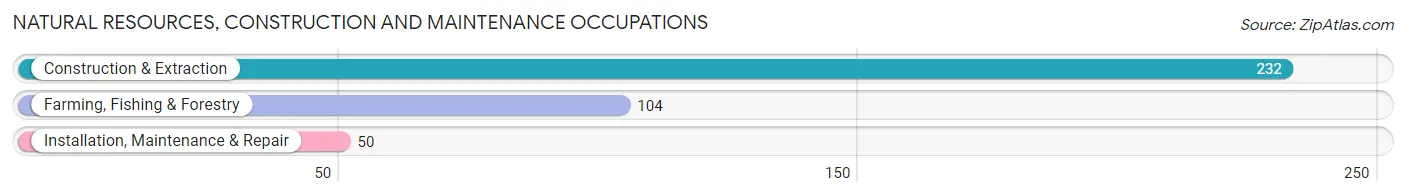
Natural Resources, Construction and Maintenance Occupations by Sex
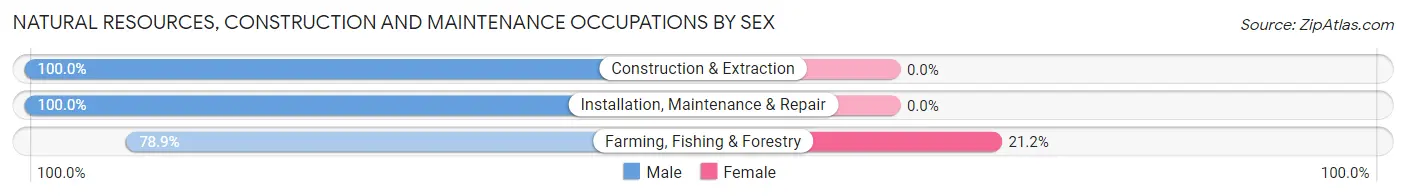
| Occupation | Male | Female |
| Farming, Fishing & Forestry | 82 (78.8%) | 22 (21.1%) |
| Construction & Extraction | 232 (100.0%) | 0 (0.0%) |
| Installation, Maintenance & Repair | 50 (100.0%) | 0 (0.0%) |
| Total (Category) | 364 (94.3%) | 22 (5.7%) |
| Total (Overall) | 1,405 (56.1%) | 1,101 (43.9%) |
Production, Transportation and Moving Occupations
The most common Production, Transportation and Moving occupations in Lynn County are Production (97 | 3.9%), Transportation (80 | 3.2%), and Material Moving (43 | 1.7%).
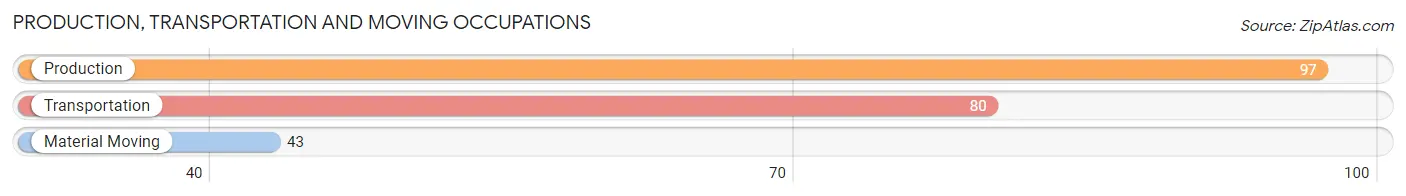
Production, Transportation and Moving Occupations by Sex
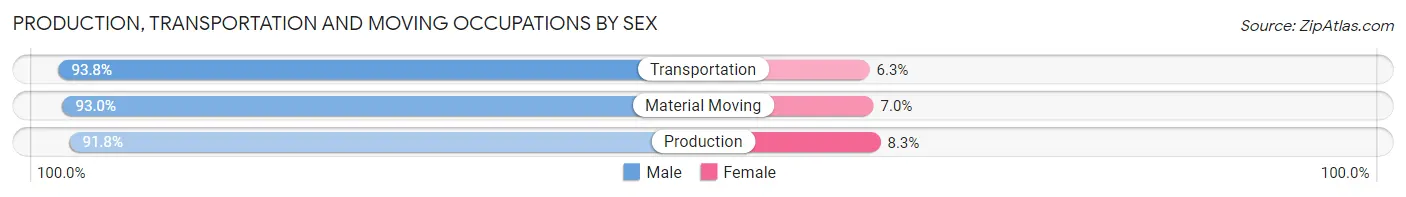
| Occupation | Male | Female |
| Production | 89 (91.7%) | 8 (8.3%) |
| Transportation | 75 (93.8%) | 5 (6.2%) |
| Material Moving | 40 (93.0%) | 3 (7.0%) |
| Total (Category) | 204 (92.7%) | 16 (7.3%) |
| Total (Overall) | 1,405 (56.1%) | 1,101 (43.9%) |
Employment Industries by Sex in Lynn County
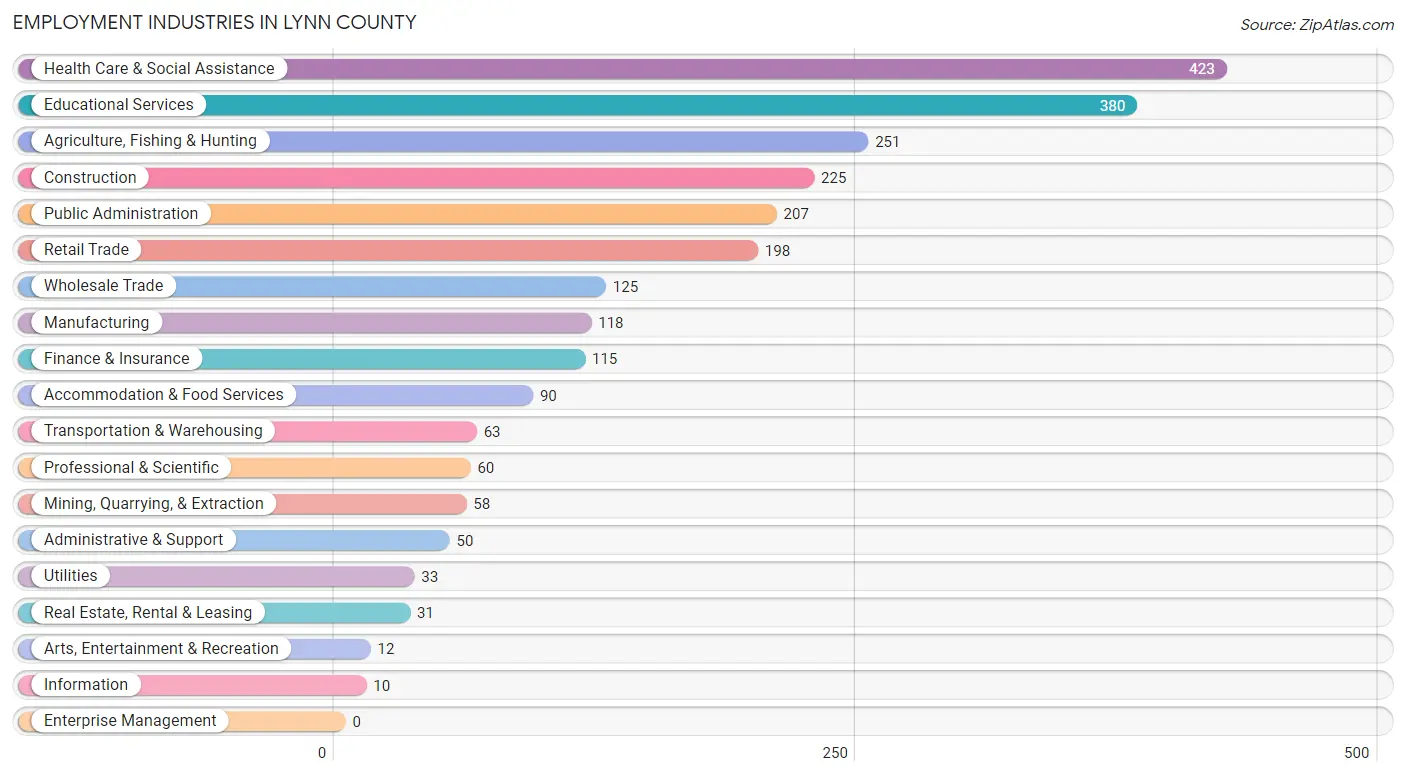
Employment Industries in Lynn County
The major employment industries in Lynn County include Health Care & Social Assistance (423 | 16.9%), Educational Services (380 | 15.2%), Agriculture, Fishing & Hunting (251 | 10.0%), Construction (225 | 9.0%), and Public Administration (207 | 8.3%).
Employment Industries by Sex in Lynn County
The Lynn County industries that see more men than women are Mining, Quarrying, & Extraction (100.0%), Manufacturing (93.2%), and Construction (92.9%), whereas the industries that tend to have a higher number of women are Arts, Entertainment & Recreation (100.0%), Information (80.0%), and Educational Services (74.2%).
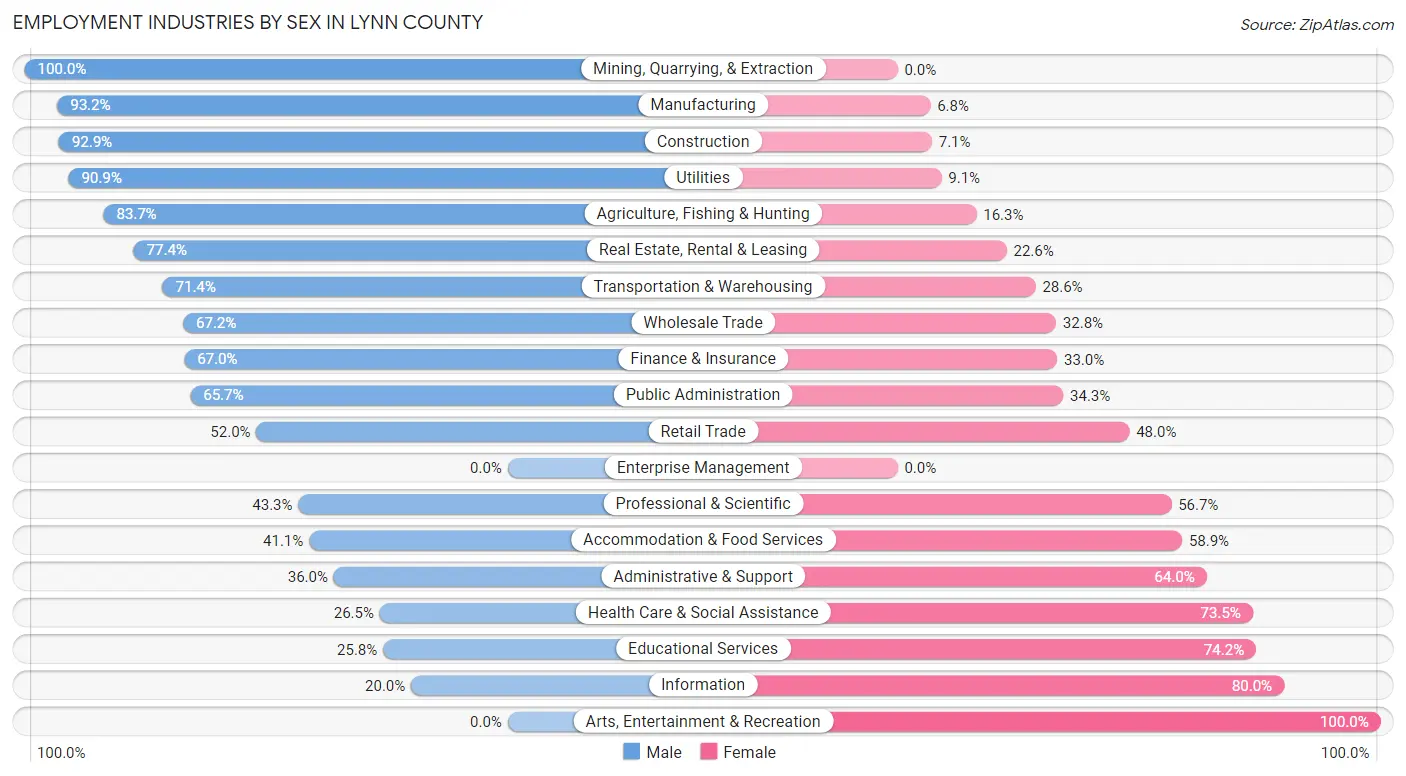
| Industry | Male | Female |
| Agriculture, Fishing & Hunting | 210 (83.7%) | 41 (16.3%) |
| Mining, Quarrying, & Extraction | 58 (100.0%) | 0 (0.0%) |
| Construction | 209 (92.9%) | 16 (7.1%) |
| Manufacturing | 110 (93.2%) | 8 (6.8%) |
| Wholesale Trade | 84 (67.2%) | 41 (32.8%) |
| Retail Trade | 103 (52.0%) | 95 (48.0%) |
| Transportation & Warehousing | 45 (71.4%) | 18 (28.6%) |
| Utilities | 30 (90.9%) | 3 (9.1%) |
| Information | 2 (20.0%) | 8 (80.0%) |
| Finance & Insurance | 77 (67.0%) | 38 (33.0%) |
| Real Estate, Rental & Leasing | 24 (77.4%) | 7 (22.6%) |
| Professional & Scientific | 26 (43.3%) | 34 (56.7%) |
| Enterprise Management | 0 (0.0%) | 0 (0.0%) |
| Administrative & Support | 18 (36.0%) | 32 (64.0%) |
| Educational Services | 98 (25.8%) | 282 (74.2%) |
| Health Care & Social Assistance | 112 (26.5%) | 311 (73.5%) |
| Arts, Entertainment & Recreation | 0 (0.0%) | 12 (100.0%) |
| Accommodation & Food Services | 37 (41.1%) | 53 (58.9%) |
| Public Administration | 136 (65.7%) | 71 (34.3%) |
| Total | 1,405 (56.1%) | 1,101 (43.9%) |
Education in Lynn County
School Enrollment in Lynn County
The most common levels of schooling among the 1,462 students in Lynn County are high school (391 | 26.7%), middle school (325 | 22.2%), and elementary school (323 | 22.1%).
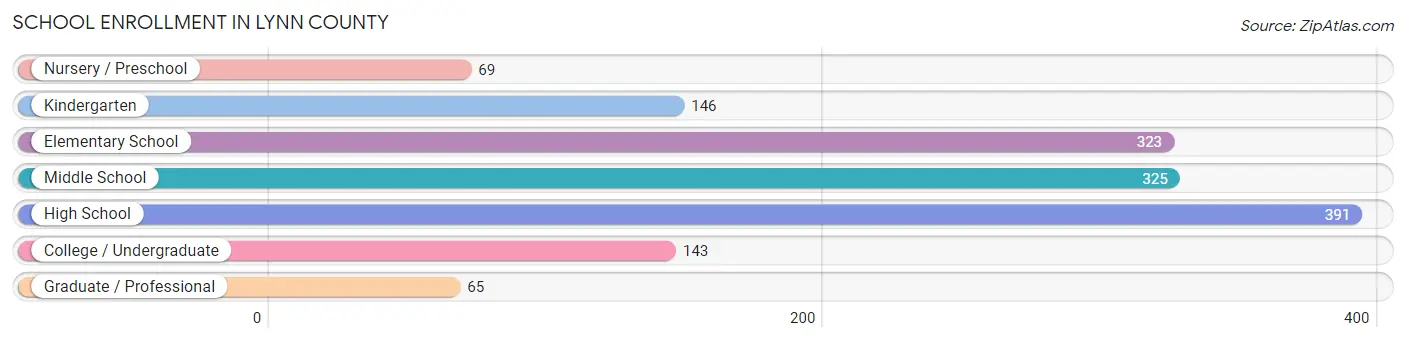
| School Level | # Students | % Students |
| Nursery / Preschool | 69 | 4.7% |
| Kindergarten | 146 | 10.0% |
| Elementary School | 323 | 22.1% |
| Middle School | 325 | 22.2% |
| High School | 391 | 26.7% |
| College / Undergraduate | 143 | 9.8% |
| Graduate / Professional | 65 | 4.4% |
| Total | 1,462 | 100.0% |
School Enrollment by Age by Funding Source in Lynn County
Out of a total of 1,462 students who are enrolled in schools in Lynn County, 235 (16.1%) attend a private institution, while the remaining 1,227 (83.9%) are enrolled in public schools. The age group of 35 years and over has the highest likelihood of being enrolled in private schools, with 27 (73.0% in the age bracket) enrolled. Conversely, the age group of 25 to 34 year olds has the lowest likelihood of being enrolled in a private school, with 48 (94.1% in the age bracket) attending a public institution.
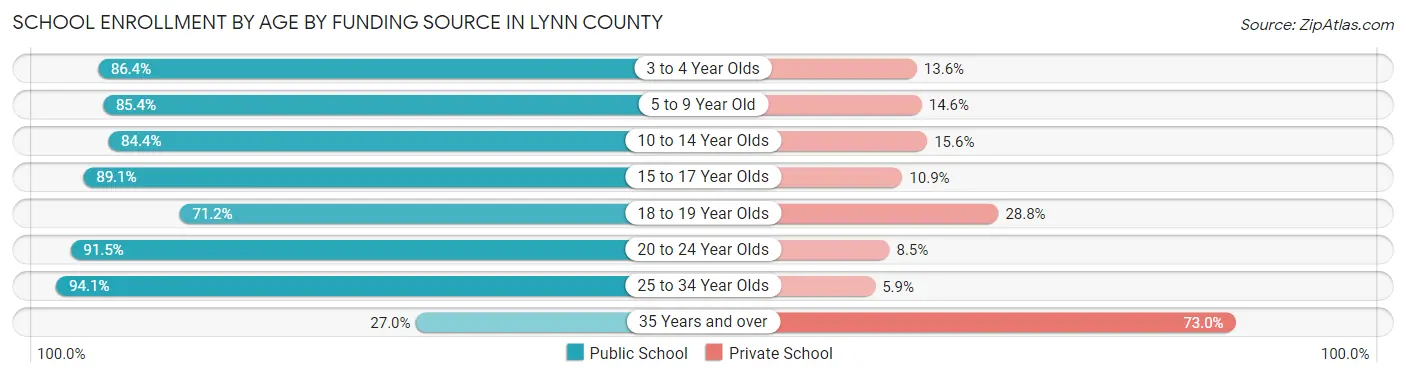
| Age Bracket | Public School | Private School |
| 3 to 4 Year Olds | 38 (86.4%) | 6 (13.6%) |
| 5 to 9 Year Old | 399 (85.4%) | 68 (14.6%) |
| 10 to 14 Year Olds | 342 (84.4%) | 63 (15.6%) |
| 15 to 17 Year Olds | 236 (89.1%) | 29 (10.9%) |
| 18 to 19 Year Olds | 79 (71.2%) | 32 (28.8%) |
| 20 to 24 Year Olds | 75 (91.5%) | 7 (8.5%) |
| 25 to 34 Year Olds | 48 (94.1%) | 3 (5.9%) |
| 35 Years and over | 10 (27.0%) | 27 (73.0%) |
| Total | 1,227 (83.9%) | 235 (16.1%) |
Educational Attainment by Field of Study in Lynn County
Bio, nature & agricultural (246 | 24.6%), science & technology (164 | 16.4%), education (159 | 15.9%), arts & humanities (115 | 11.5%), and business (74 | 7.4%) are the most common fields of study among 999 individuals in Lynn County who have obtained a bachelor's degree or higher.
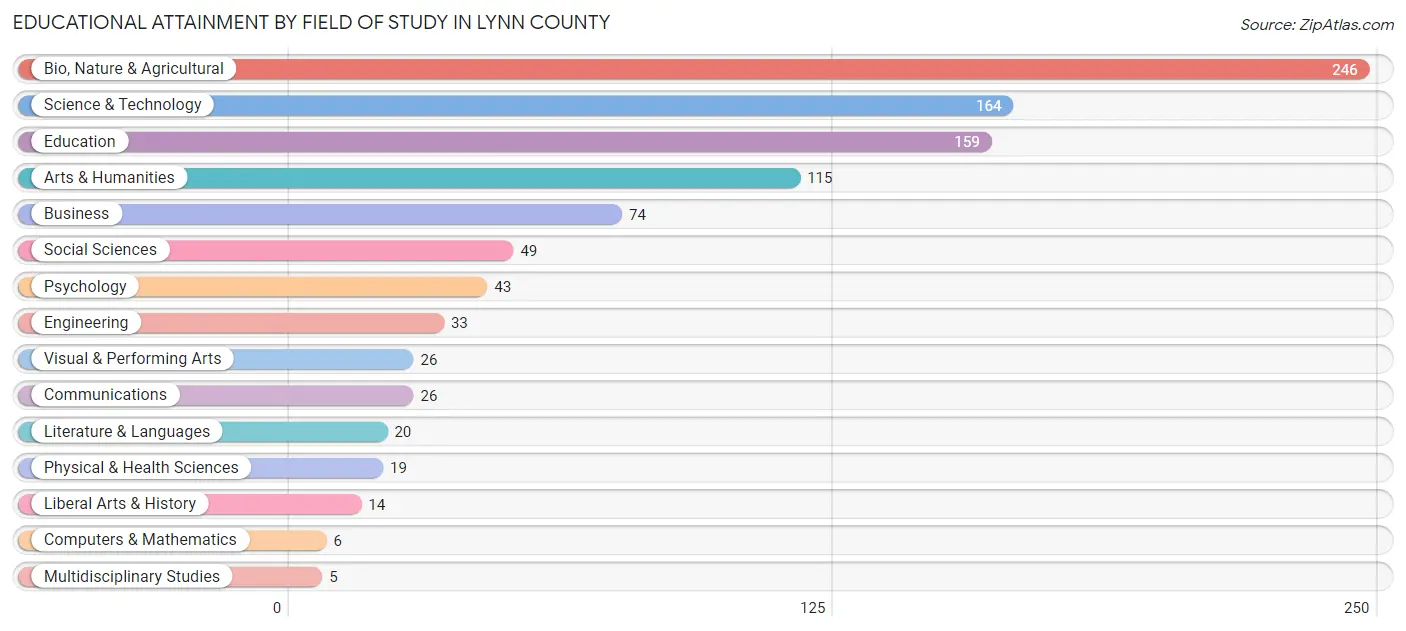
| Field of Study | # Graduates | % Graduates |
| Computers & Mathematics | 6 | 0.6% |
| Bio, Nature & Agricultural | 246 | 24.6% |
| Physical & Health Sciences | 19 | 1.9% |
| Psychology | 43 | 4.3% |
| Social Sciences | 49 | 4.9% |
| Engineering | 33 | 3.3% |
| Multidisciplinary Studies | 5 | 0.5% |
| Science & Technology | 164 | 16.4% |
| Business | 74 | 7.4% |
| Education | 159 | 15.9% |
| Literature & Languages | 20 | 2.0% |
| Liberal Arts & History | 14 | 1.4% |
| Visual & Performing Arts | 26 | 2.6% |
| Communications | 26 | 2.6% |
| Arts & Humanities | 115 | 11.5% |
| Total | 999 | 100.0% |
Transportation & Commute in Lynn County
Vehicle Availability by Sex in Lynn County
The most prevalent vehicle ownership categories in Lynn County are males with 2 vehicles (704, accounting for 50.8%) and females with 2 vehicles (535, making up 65.9%).
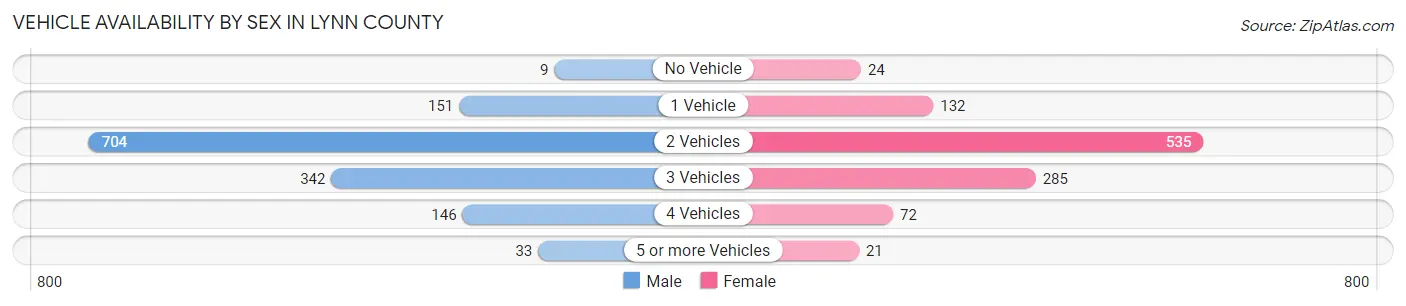
| Vehicles Available | Male | Female |
| No Vehicle | 9 (0.6%) | 24 (2.2%) |
| 1 Vehicle | 151 (10.9%) | 132 (12.3%) |
| 2 Vehicles | 704 (50.8%) | 535 (50.0%) |
| 3 Vehicles | 342 (24.7%) | 285 (26.7%) |
| 4 Vehicles | 146 (10.5%) | 72 (6.7%) |
| 5 or more Vehicles | 33 (2.4%) | 21 (2.0%) |
| Total | 1,385 (100.0%) | 1,069 (100.0%) |
Commute Time in Lynn County
The most frequently occuring commute durations in Lynn County are less than 5 minutes (386 commuters, 16.3%), 5 to 9 minutes (368 commuters, 15.6%), and 30 to 34 minutes (343 commuters, 14.5%).
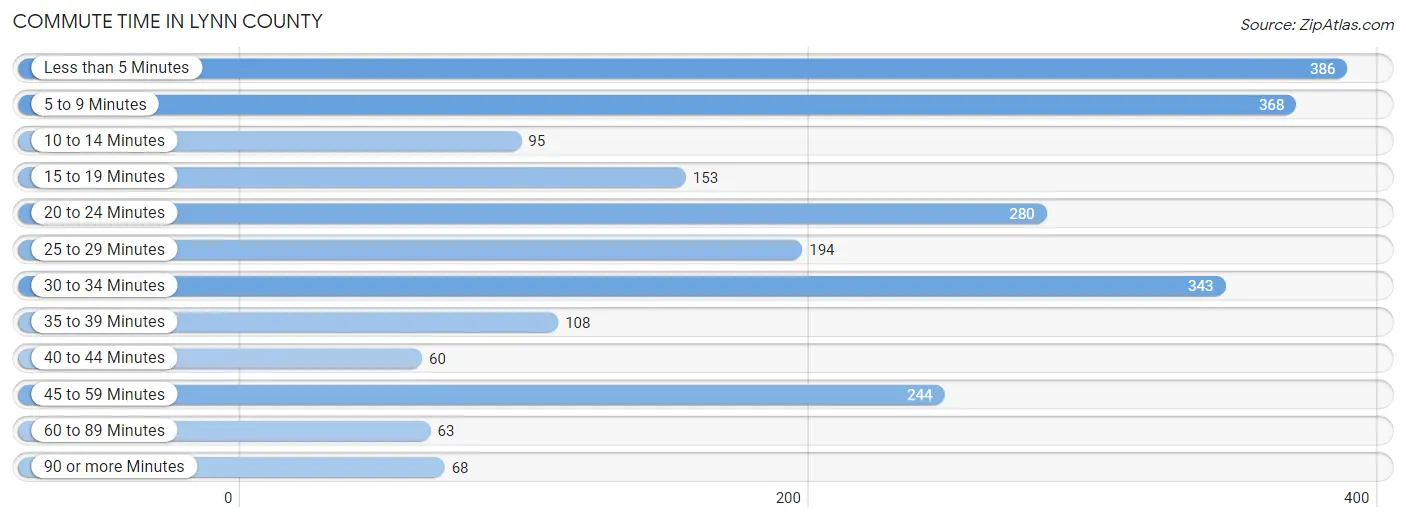
| Commute Time | # Commuters | % Commuters |
| Less than 5 Minutes | 386 | 16.3% |
| 5 to 9 Minutes | 368 | 15.6% |
| 10 to 14 Minutes | 95 | 4.0% |
| 15 to 19 Minutes | 153 | 6.5% |
| 20 to 24 Minutes | 280 | 11.8% |
| 25 to 29 Minutes | 194 | 8.2% |
| 30 to 34 Minutes | 343 | 14.5% |
| 35 to 39 Minutes | 108 | 4.6% |
| 40 to 44 Minutes | 60 | 2.5% |
| 45 to 59 Minutes | 244 | 10.3% |
| 60 to 89 Minutes | 63 | 2.7% |
| 90 or more Minutes | 68 | 2.9% |
Commute Time by Sex in Lynn County
The most common commute times in Lynn County are 30 to 34 minutes (202 commuters, 15.1%) for males and less than 5 minutes (264 commuters, 25.8%) for females.
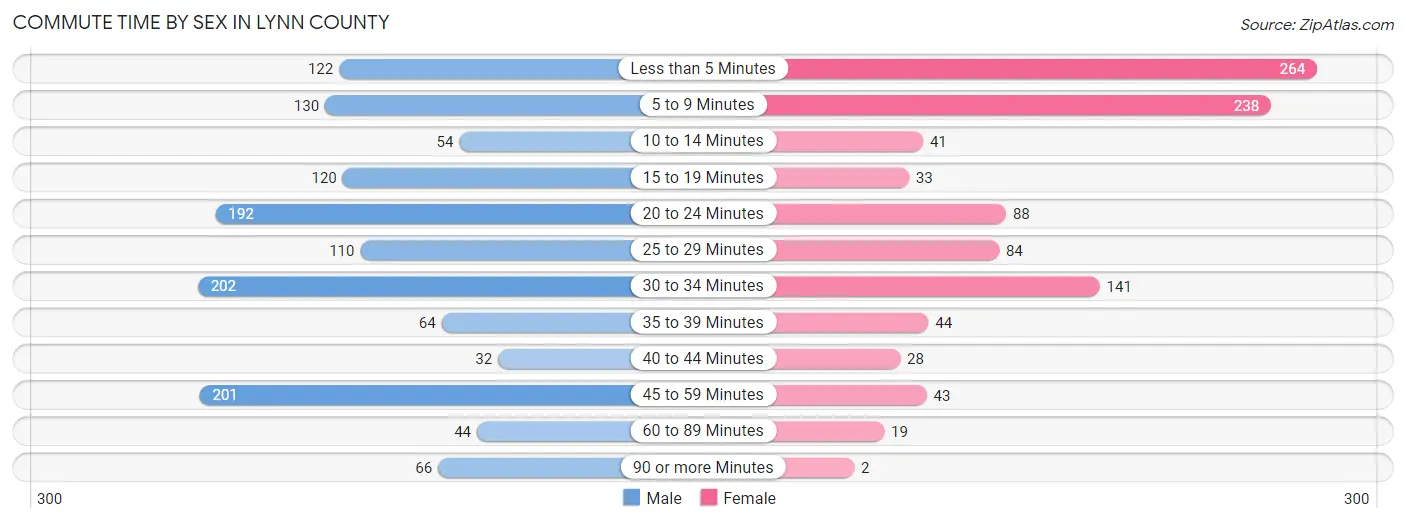
| Commute Time | Male | Female |
| Less than 5 Minutes | 122 (9.1%) | 264 (25.8%) |
| 5 to 9 Minutes | 130 (9.7%) | 238 (23.2%) |
| 10 to 14 Minutes | 54 (4.0%) | 41 (4.0%) |
| 15 to 19 Minutes | 120 (9.0%) | 33 (3.2%) |
| 20 to 24 Minutes | 192 (14.4%) | 88 (8.6%) |
| 25 to 29 Minutes | 110 (8.2%) | 84 (8.2%) |
| 30 to 34 Minutes | 202 (15.1%) | 141 (13.8%) |
| 35 to 39 Minutes | 64 (4.8%) | 44 (4.3%) |
| 40 to 44 Minutes | 32 (2.4%) | 28 (2.7%) |
| 45 to 59 Minutes | 201 (15.0%) | 43 (4.2%) |
| 60 to 89 Minutes | 44 (3.3%) | 19 (1.8%) |
| 90 or more Minutes | 66 (4.9%) | 2 (0.2%) |
Time of Departure to Work by Sex in Lynn County
The most frequent times of departure to work in Lynn County are 8:00 AM to 8:29 AM (333, 24.9%) for males and 7:30 AM to 7:59 AM (323, 31.5%) for females.
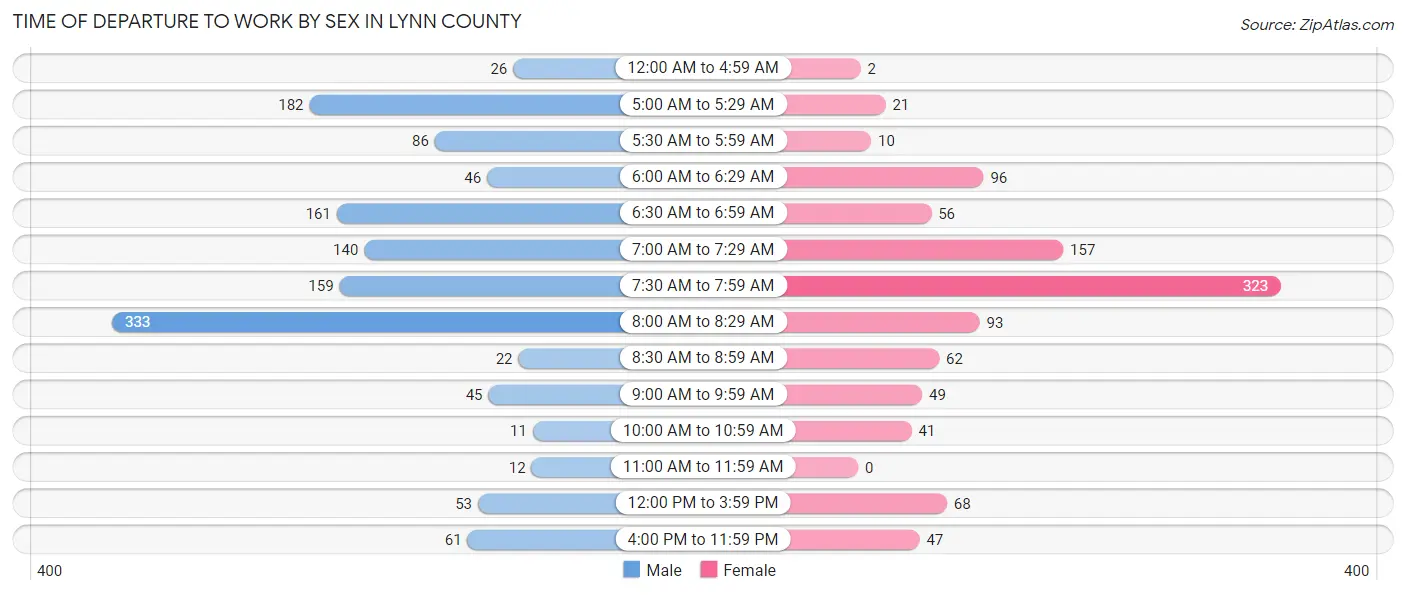
| Time of Departure | Male | Female |
| 12:00 AM to 4:59 AM | 26 (1.9%) | 2 (0.2%) |
| 5:00 AM to 5:29 AM | 182 (13.6%) | 21 (2.1%) |
| 5:30 AM to 5:59 AM | 86 (6.4%) | 10 (1.0%) |
| 6:00 AM to 6:29 AM | 46 (3.4%) | 96 (9.4%) |
| 6:30 AM to 6:59 AM | 161 (12.0%) | 56 (5.5%) |
| 7:00 AM to 7:29 AM | 140 (10.5%) | 157 (15.3%) |
| 7:30 AM to 7:59 AM | 159 (11.9%) | 323 (31.5%) |
| 8:00 AM to 8:29 AM | 333 (24.9%) | 93 (9.1%) |
| 8:30 AM to 8:59 AM | 22 (1.7%) | 62 (6.0%) |
| 9:00 AM to 9:59 AM | 45 (3.4%) | 49 (4.8%) |
| 10:00 AM to 10:59 AM | 11 (0.8%) | 41 (4.0%) |
| 11:00 AM to 11:59 AM | 12 (0.9%) | 0 (0.0%) |
| 12:00 PM to 3:59 PM | 53 (4.0%) | 68 (6.6%) |
| 4:00 PM to 11:59 PM | 61 (4.6%) | 47 (4.6%) |
| Total | 1,337 (100.0%) | 1,025 (100.0%) |
Housing Occupancy in Lynn County
Occupancy by Ownership in Lynn County
Of the total 2,053 dwellings in Lynn County, owner-occupied units account for 1,485 (72.3%), while renter-occupied units make up 568 (27.7%).
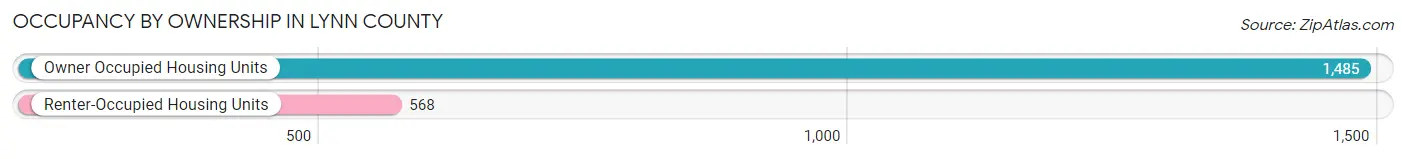
| Occupancy | # Housing Units | % Housing Units |
| Owner Occupied Housing Units | 1,485 | 72.3% |
| Renter-Occupied Housing Units | 568 | 27.7% |
| Total Occupied Housing Units | 2,053 | 100.0% |
Occupancy by Household Size in Lynn County
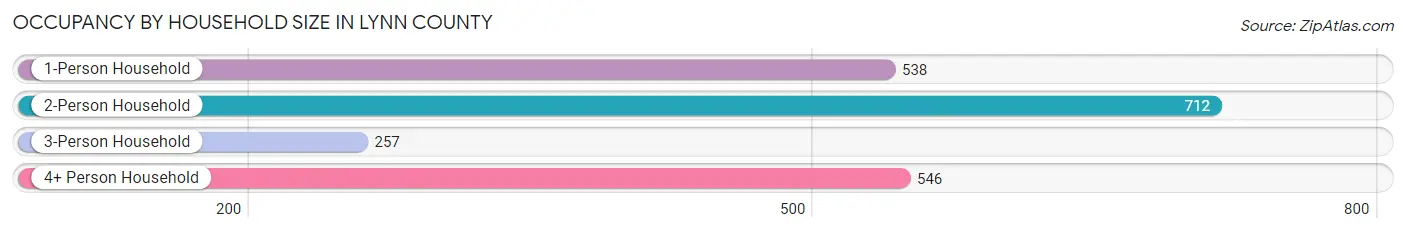
| Household Size | # Housing Units | % Housing Units |
| 1-Person Household | 538 | 26.2% |
| 2-Person Household | 712 | 34.7% |
| 3-Person Household | 257 | 12.5% |
| 4+ Person Household | 546 | 26.6% |
| Total Housing Units | 2,053 | 100.0% |
Occupancy by Ownership by Household Size in Lynn County
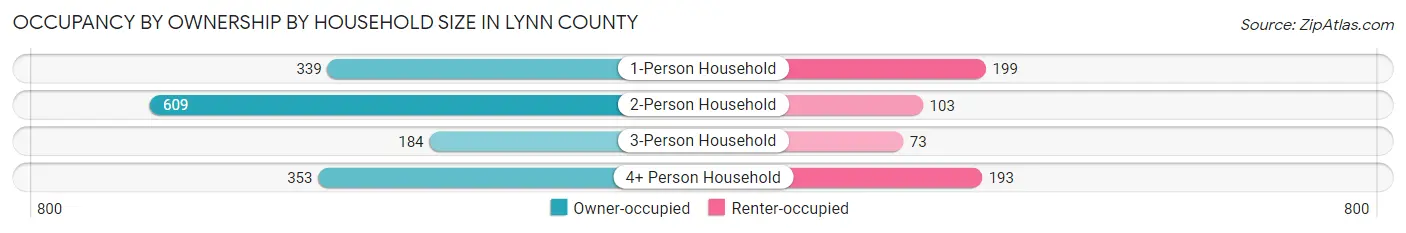
| Household Size | Owner-occupied | Renter-occupied |
| 1-Person Household | 339 (63.0%) | 199 (37.0%) |
| 2-Person Household | 609 (85.5%) | 103 (14.5%) |
| 3-Person Household | 184 (71.6%) | 73 (28.4%) |
| 4+ Person Household | 353 (64.6%) | 193 (35.3%) |
| Total Housing Units | 1,485 (72.3%) | 568 (27.7%) |
Occupancy by Educational Attainment in Lynn County
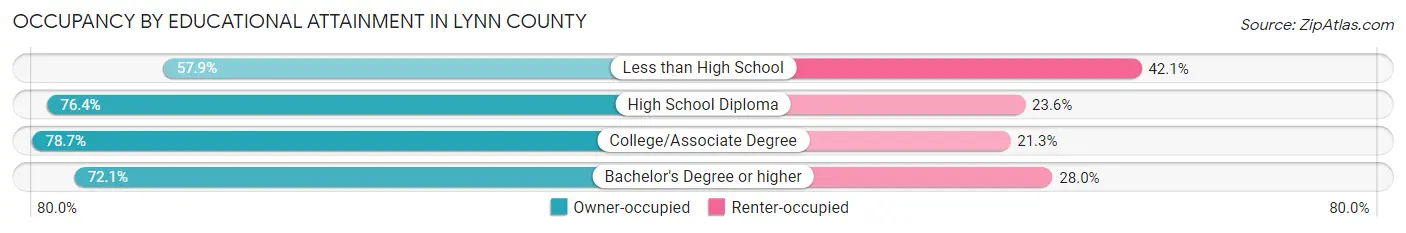
| Household Size | Owner-occupied | Renter-occupied |
| Less than High School | 245 (57.9%) | 178 (42.1%) |
| High School Diploma | 414 (76.4%) | 128 (23.6%) |
| College/Associate Degree | 496 (78.7%) | 134 (21.3%) |
| Bachelor's Degree or higher | 330 (72.1%) | 128 (28.0%) |
Occupancy by Age of Householder in Lynn County
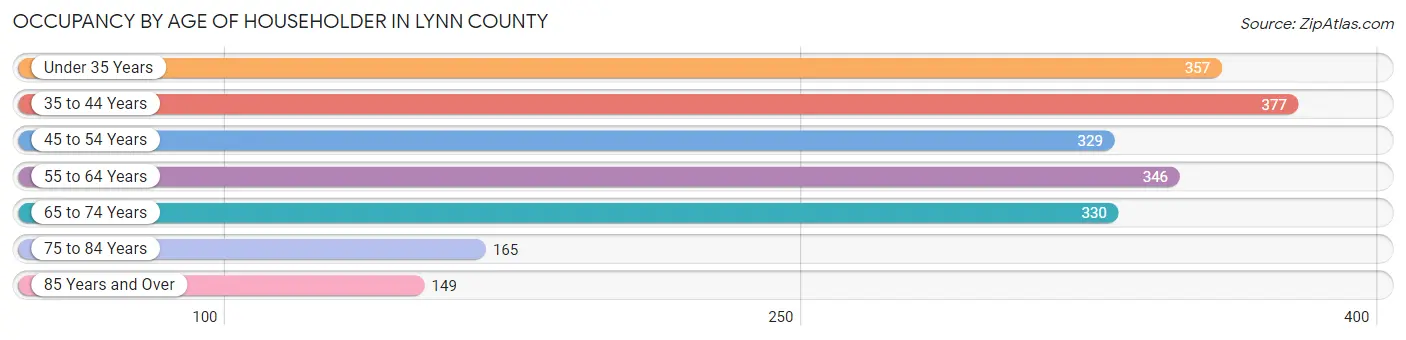
| Age Bracket | # Households | % Households |
| Under 35 Years | 357 | 17.4% |
| 35 to 44 Years | 377 | 18.4% |
| 45 to 54 Years | 329 | 16.0% |
| 55 to 64 Years | 346 | 16.9% |
| 65 to 74 Years | 330 | 16.1% |
| 75 to 84 Years | 165 | 8.0% |
| 85 Years and Over | 149 | 7.3% |
| Total | 2,053 | 100.0% |
Housing Finances in Lynn County
Median Income by Occupancy in Lynn County
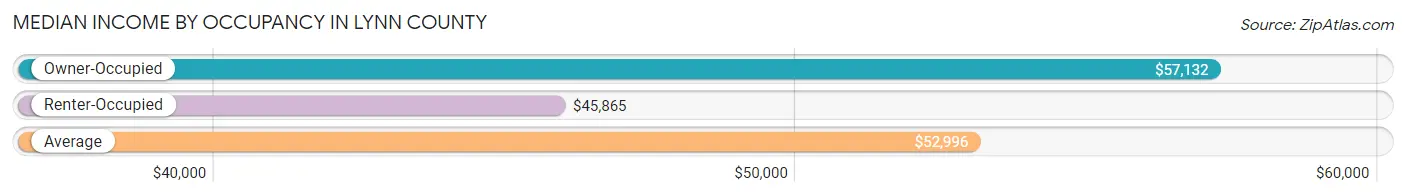
| Occupancy Type | # Households | Median Income |
| Owner-Occupied | 1,485 (72.3%) | $57,132 |
| Renter-Occupied | 568 (27.7%) | $45,865 |
| Average | 2,053 (100.0%) | $52,996 |
Occupancy by Householder Income Bracket in Lynn County
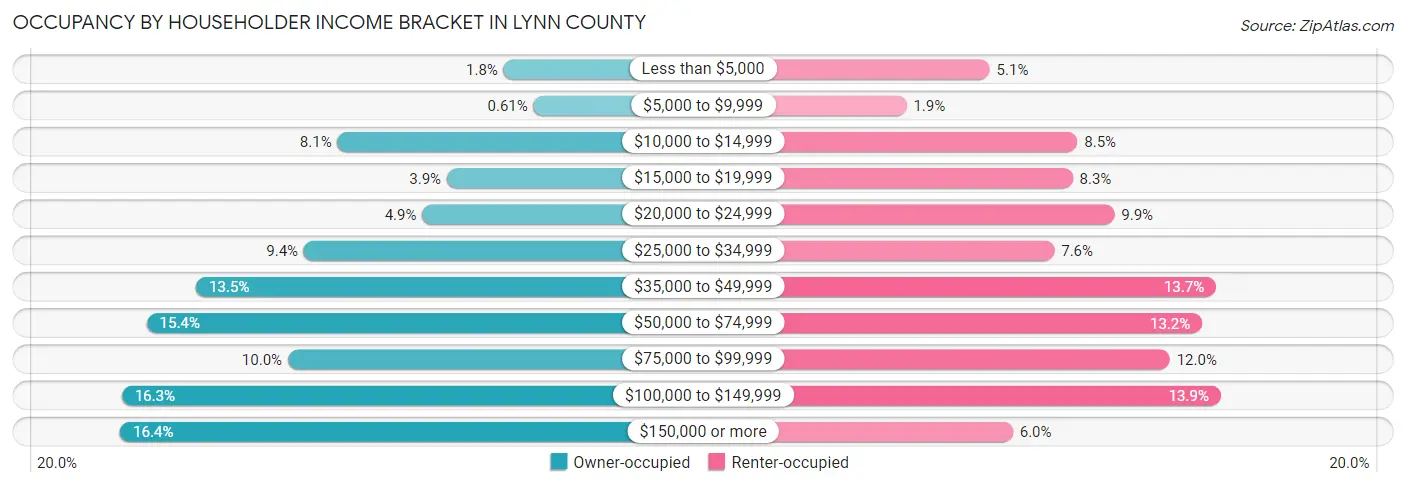
| Income Bracket | Owner-occupied | Renter-occupied |
| Less than $5,000 | 26 (1.8%) | 29 (5.1%) |
| $5,000 to $9,999 | 9 (0.6%) | 11 (1.9%) |
| $10,000 to $14,999 | 120 (8.1%) | 48 (8.5%) |
| $15,000 to $19,999 | 58 (3.9%) | 47 (8.3%) |
| $20,000 to $24,999 | 72 (4.9%) | 56 (9.9%) |
| $25,000 to $34,999 | 139 (9.4%) | 43 (7.6%) |
| $35,000 to $49,999 | 200 (13.5%) | 78 (13.7%) |
| $50,000 to $74,999 | 228 (15.3%) | 75 (13.2%) |
| $75,000 to $99,999 | 148 (10.0%) | 68 (12.0%) |
| $100,000 to $149,999 | 242 (16.3%) | 79 (13.9%) |
| $150,000 or more | 243 (16.4%) | 34 (6.0%) |
| Total | 1,485 (100.0%) | 568 (100.0%) |
Monthly Housing Cost Tiers in Lynn County
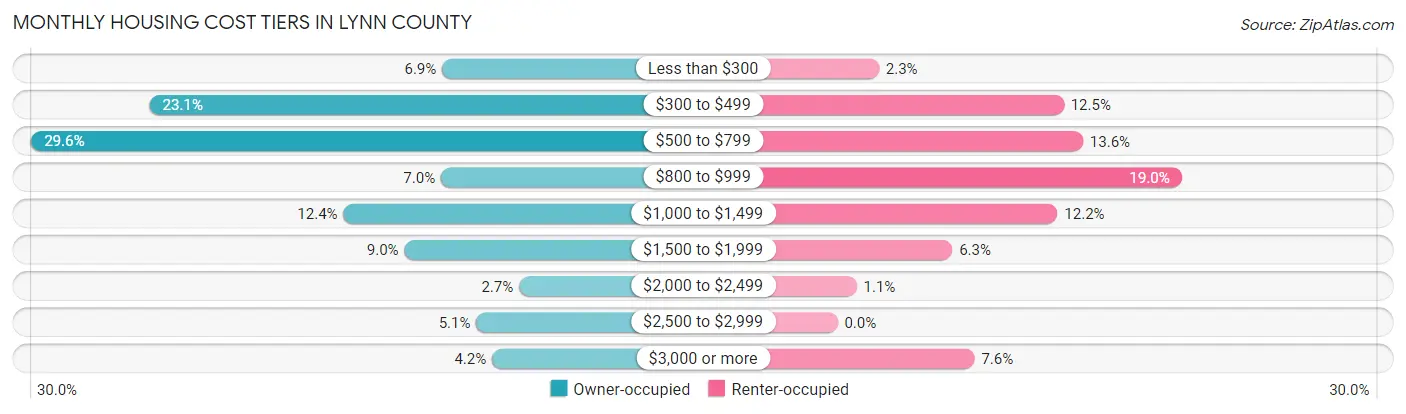
| Monthly Cost | Owner-occupied | Renter-occupied |
| Less than $300 | 103 (6.9%) | 13 (2.3%) |
| $300 to $499 | 343 (23.1%) | 71 (12.5%) |
| $500 to $799 | 440 (29.6%) | 77 (13.6%) |
| $800 to $999 | 104 (7.0%) | 108 (19.0%) |
| $1,000 to $1,499 | 184 (12.4%) | 69 (12.1%) |
| $1,500 to $1,999 | 134 (9.0%) | 36 (6.3%) |
| $2,000 to $2,499 | 40 (2.7%) | 6 (1.1%) |
| $2,500 to $2,999 | 75 (5.1%) | 0 (0.0%) |
| $3,000 or more | 62 (4.2%) | 43 (7.6%) |
| Total | 1,485 (100.0%) | 568 (100.0%) |
Physical Housing Characteristics in Lynn County
Housing Structures in Lynn County
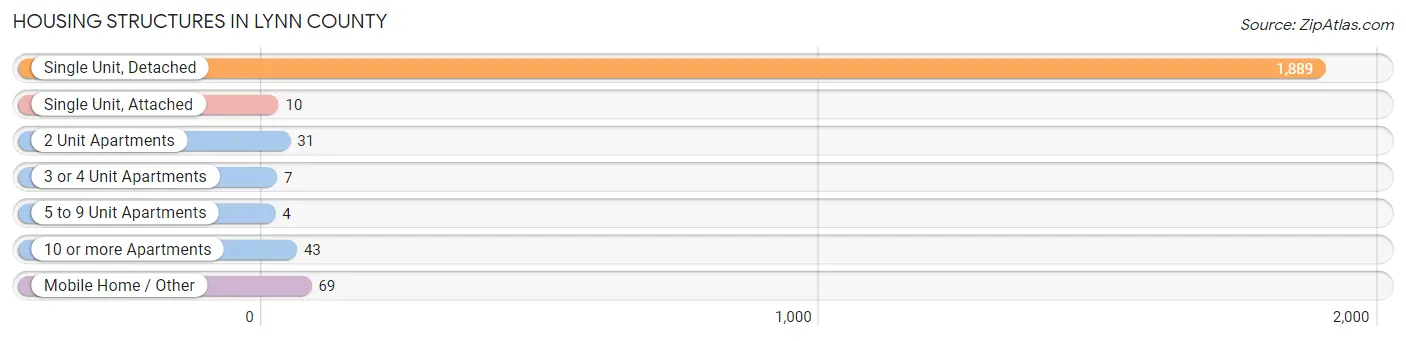
| Structure Type | # Housing Units | % Housing Units |
| Single Unit, Detached | 1,889 | 92.0% |
| Single Unit, Attached | 10 | 0.5% |
| 2 Unit Apartments | 31 | 1.5% |
| 3 or 4 Unit Apartments | 7 | 0.3% |
| 5 to 9 Unit Apartments | 4 | 0.2% |
| 10 or more Apartments | 43 | 2.1% |
| Mobile Home / Other | 69 | 3.4% |
| Total | 2,053 | 100.0% |
Housing Structures by Occupancy in Lynn County
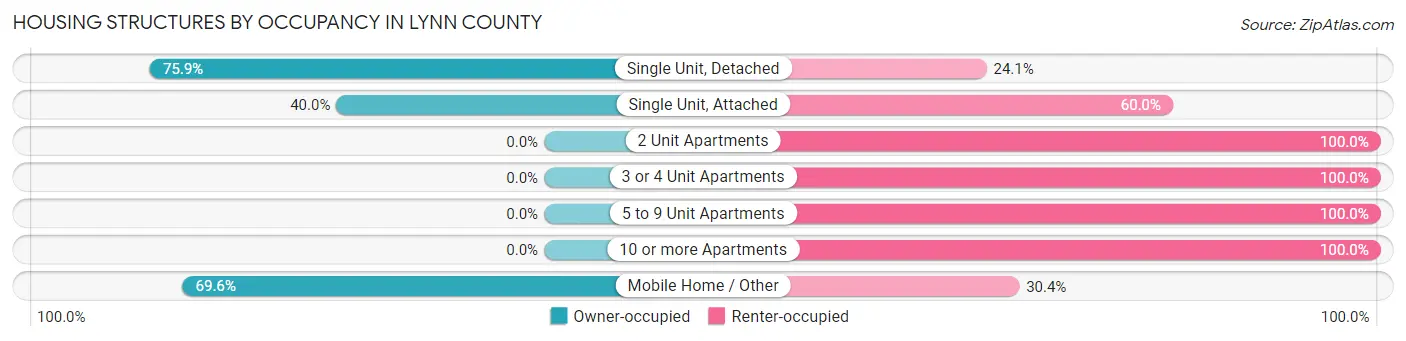
| Structure Type | Owner-occupied | Renter-occupied |
| Single Unit, Detached | 1,433 (75.9%) | 456 (24.1%) |
| Single Unit, Attached | 4 (40.0%) | 6 (60.0%) |
| 2 Unit Apartments | 0 (0.0%) | 31 (100.0%) |
| 3 or 4 Unit Apartments | 0 (0.0%) | 7 (100.0%) |
| 5 to 9 Unit Apartments | 0 (0.0%) | 4 (100.0%) |
| 10 or more Apartments | 0 (0.0%) | 43 (100.0%) |
| Mobile Home / Other | 48 (69.6%) | 21 (30.4%) |
| Total | 1,485 (72.3%) | 568 (27.7%) |
Housing Structures by Number of Rooms in Lynn County
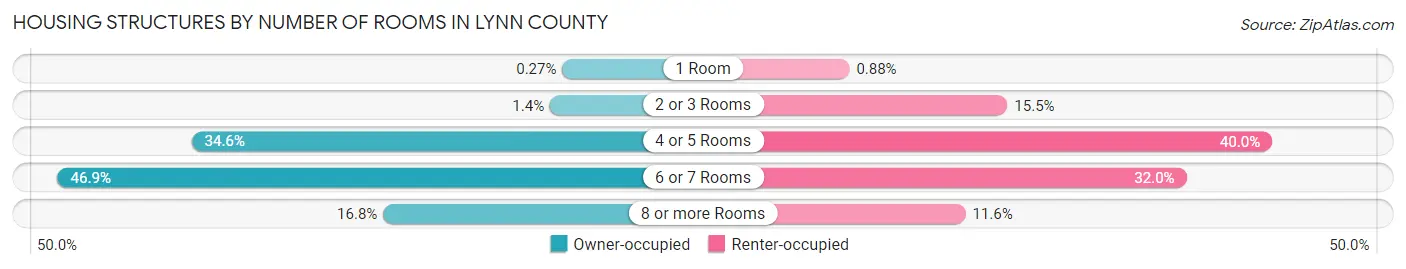
| Number of Rooms | Owner-occupied | Renter-occupied |
| 1 Room | 4 (0.3%) | 5 (0.9%) |
| 2 or 3 Rooms | 21 (1.4%) | 88 (15.5%) |
| 4 or 5 Rooms | 513 (34.5%) | 227 (40.0%) |
| 6 or 7 Rooms | 697 (46.9%) | 182 (32.0%) |
| 8 or more Rooms | 250 (16.8%) | 66 (11.6%) |
| Total | 1,485 (100.0%) | 568 (100.0%) |
Housing Structure by Heating Type in Lynn County
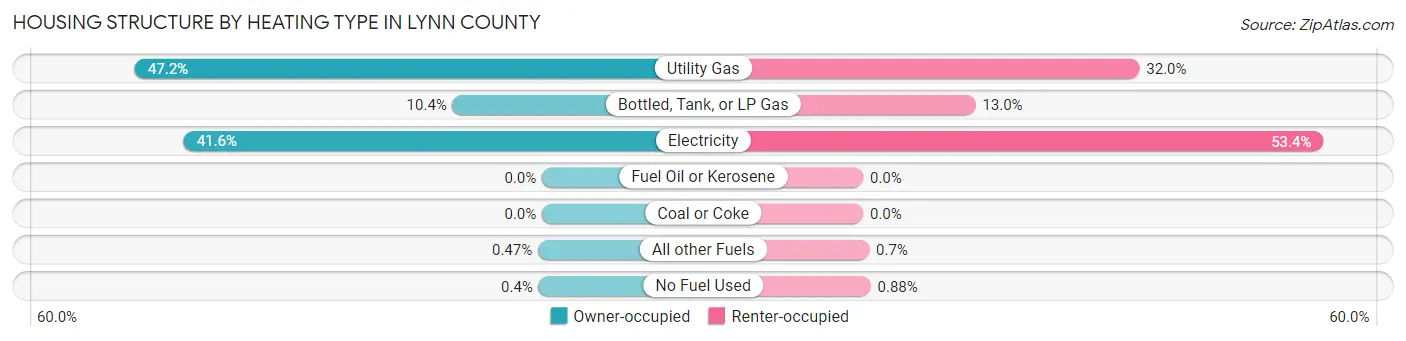
| Heating Type | Owner-occupied | Renter-occupied |
| Utility Gas | 701 (47.2%) | 182 (32.0%) |
| Bottled, Tank, or LP Gas | 154 (10.4%) | 74 (13.0%) |
| Electricity | 617 (41.5%) | 303 (53.3%) |
| Fuel Oil or Kerosene | 0 (0.0%) | 0 (0.0%) |
| Coal or Coke | 0 (0.0%) | 0 (0.0%) |
| All other Fuels | 7 (0.5%) | 4 (0.7%) |
| No Fuel Used | 6 (0.4%) | 5 (0.9%) |
| Total | 1,485 (100.0%) | 568 (100.0%) |
Household Vehicle Usage in Lynn County
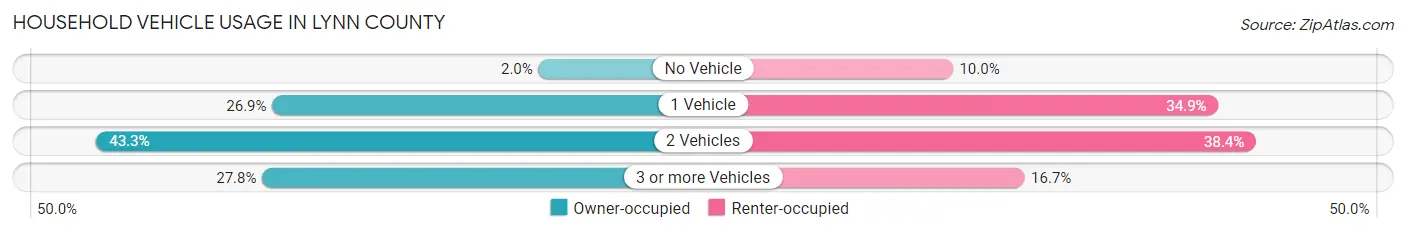
| Vehicles per Household | Owner-occupied | Renter-occupied |
| No Vehicle | 30 (2.0%) | 57 (10.0%) |
| 1 Vehicle | 399 (26.9%) | 198 (34.9%) |
| 2 Vehicles | 643 (43.3%) | 218 (38.4%) |
| 3 or more Vehicles | 413 (27.8%) | 95 (16.7%) |
| Total | 1,485 (100.0%) | 568 (100.0%) |
Real Estate & Mortgages in Lynn County
Real Estate and Mortgage Overview in Lynn County
| Characteristic | Without Mortgage | With Mortgage |
| Housing Units | 907 | 578 |
| Median Property Value | $97,800 | $175,000 |
| Median Household Income | $50,285 | $147 |
| Monthly Housing Costs | $518 | $58 |
| Real Estate Taxes | $1,509 | $7 |
Property Value by Mortgage Status in Lynn County
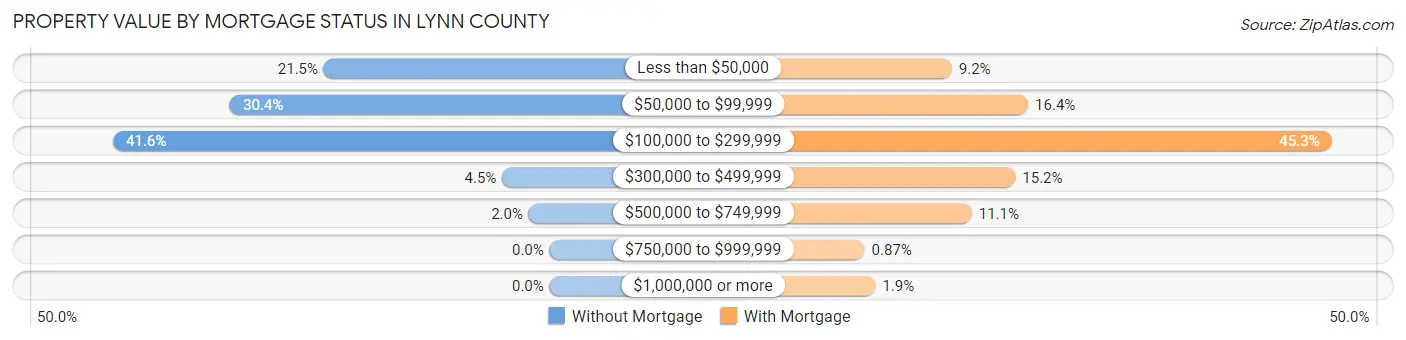
| Property Value | Without Mortgage | With Mortgage |
| Less than $50,000 | 195 (21.5%) | 53 (9.2%) |
| $50,000 to $99,999 | 276 (30.4%) | 95 (16.4%) |
| $100,000 to $299,999 | 377 (41.6%) | 262 (45.3%) |
| $300,000 to $499,999 | 41 (4.5%) | 88 (15.2%) |
| $500,000 to $749,999 | 18 (2.0%) | 64 (11.1%) |
| $750,000 to $999,999 | 0 (0.0%) | 5 (0.9%) |
| $1,000,000 or more | 0 (0.0%) | 11 (1.9%) |
| Total | 907 (100.0%) | 578 (100.0%) |
Household Income by Mortgage Status in Lynn County
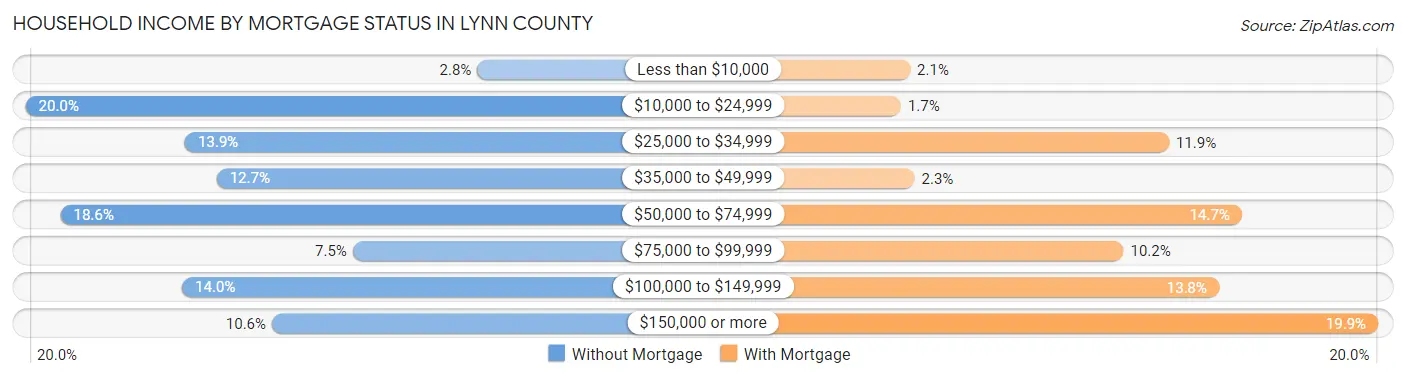
| Household Income | Without Mortgage | With Mortgage |
| Less than $10,000 | 25 (2.8%) | 12 (2.1%) |
| $10,000 to $24,999 | 181 (20.0%) | 10 (1.7%) |
| $25,000 to $34,999 | 126 (13.9%) | 69 (11.9%) |
| $35,000 to $49,999 | 115 (12.7%) | 13 (2.2%) |
| $50,000 to $74,999 | 169 (18.6%) | 85 (14.7%) |
| $75,000 to $99,999 | 68 (7.5%) | 59 (10.2%) |
| $100,000 to $149,999 | 127 (14.0%) | 80 (13.8%) |
| $150,000 or more | 96 (10.6%) | 115 (19.9%) |
| Total | 907 (100.0%) | 578 (100.0%) |
Property Value to Household Income Ratio in Lynn County
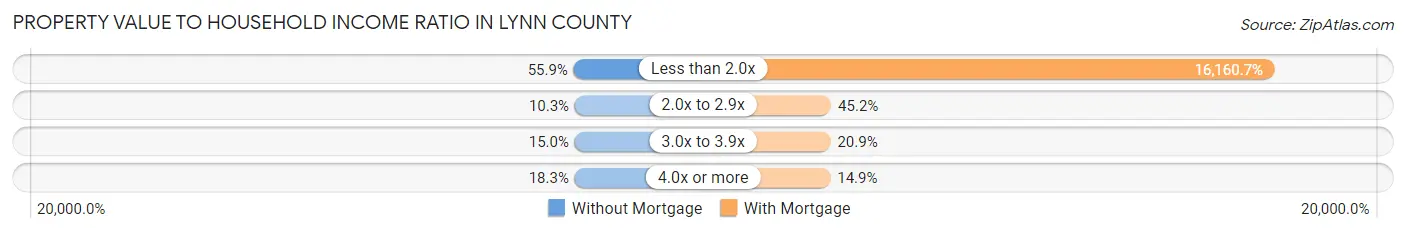
| Value-to-Income Ratio | Without Mortgage | With Mortgage |
| Less than 2.0x | 507 (55.9%) | 93,409 (16,160.7%) |
| 2.0x to 2.9x | 93 (10.2%) | 261 (45.2%) |
| 3.0x to 3.9x | 136 (15.0%) | 121 (20.9%) |
| 4.0x or more | 166 (18.3%) | 86 (14.9%) |
| Total | 907 (100.0%) | 578 (100.0%) |
Real Estate Taxes by Mortgage Status in Lynn County
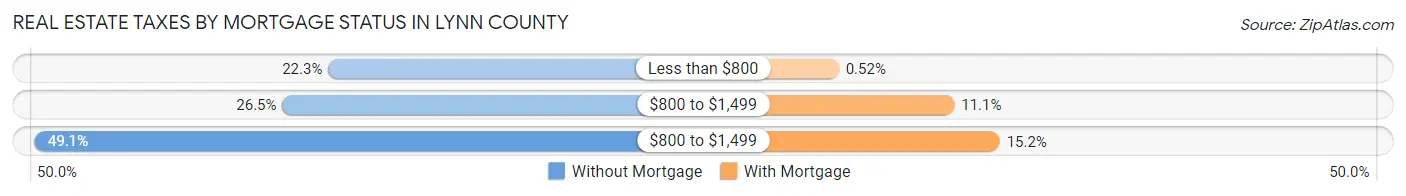
| Property Taxes | Without Mortgage | With Mortgage |
| Less than $800 | 202 (22.3%) | 3 (0.5%) |
| $800 to $1,499 | 240 (26.5%) | 64 (11.1%) |
| $800 to $1,499 | 445 (49.1%) | 88 (15.2%) |
| Total | 907 (100.0%) | 578 (100.0%) |
Health & Disability in Lynn County
Health Insurance Coverage by Age in Lynn County
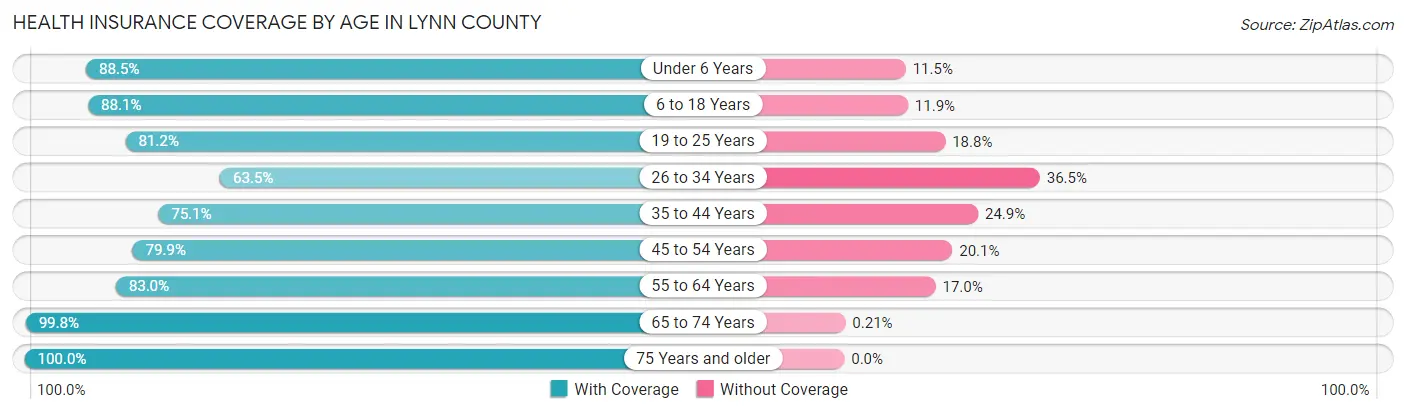
| Age Bracket | With Coverage | Without Coverage |
| Under 6 Years | 417 (88.5%) | 54 (11.5%) |
| 6 to 18 Years | 1,011 (88.1%) | 136 (11.9%) |
| 19 to 25 Years | 276 (81.2%) | 64 (18.8%) |
| 26 to 34 Years | 427 (63.5%) | 245 (36.5%) |
| 35 to 44 Years | 578 (75.1%) | 192 (24.9%) |
| 45 to 54 Years | 464 (79.9%) | 117 (20.1%) |
| 55 to 64 Years | 580 (83.0%) | 119 (17.0%) |
| 65 to 74 Years | 484 (99.8%) | 1 (0.2%) |
| 75 Years and older | 400 (100.0%) | 0 (0.0%) |
| Total | 4,637 (83.3%) | 928 (16.7%) |
Health Insurance Coverage by Citizenship Status in Lynn County
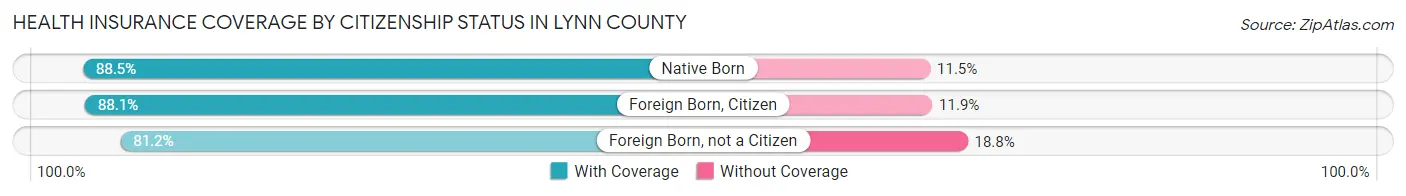
| Citizenship Status | With Coverage | Without Coverage |
| Native Born | 417 (88.5%) | 54 (11.5%) |
| Foreign Born, Citizen | 1,011 (88.1%) | 136 (11.9%) |
| Foreign Born, not a Citizen | 276 (81.2%) | 64 (18.8%) |
Health Insurance Coverage by Household Income in Lynn County
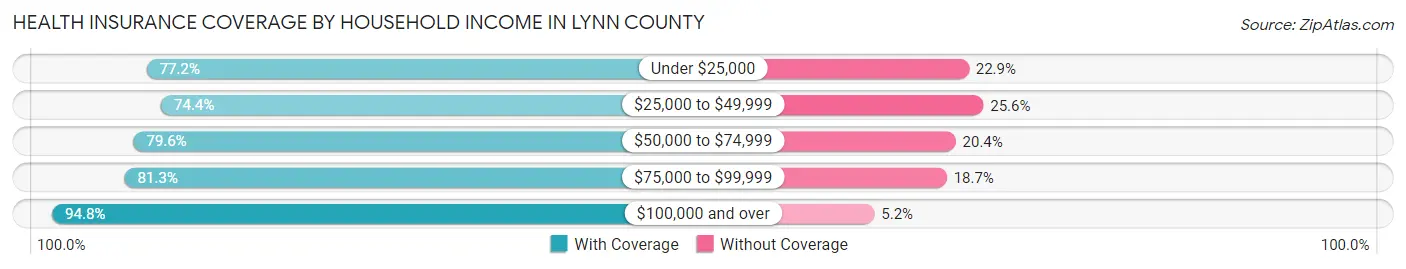
| Household Income | With Coverage | Without Coverage |
| Under $25,000 | 746 (77.1%) | 221 (22.9%) |
| $25,000 to $49,999 | 1,010 (74.4%) | 347 (25.6%) |
| $50,000 to $74,999 | 574 (79.6%) | 147 (20.4%) |
| $75,000 to $99,999 | 495 (81.3%) | 114 (18.7%) |
| $100,000 and over | 1,796 (94.8%) | 98 (5.2%) |
Public vs Private Health Insurance Coverage by Age in Lynn County
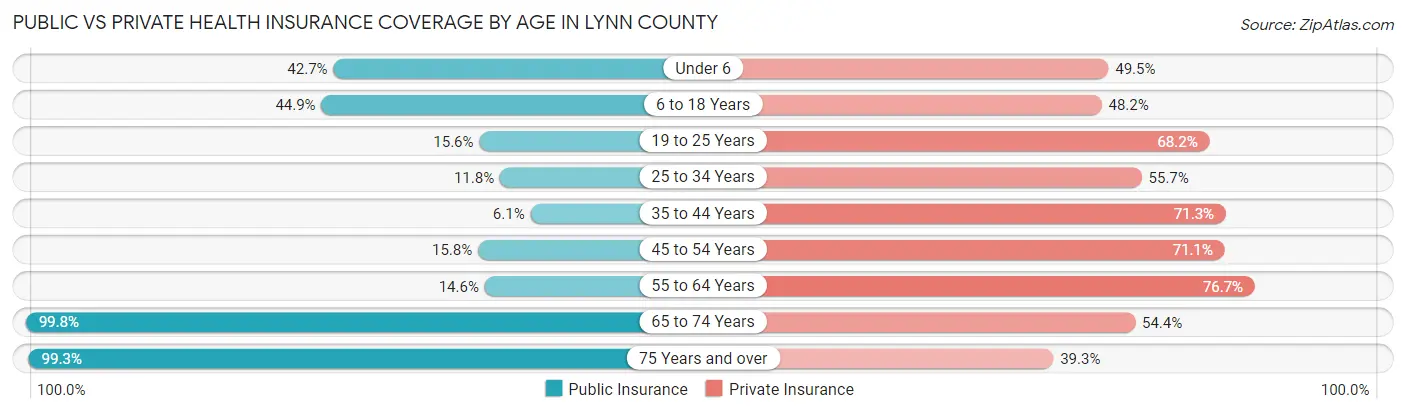
| Age Bracket | Public Insurance | Private Insurance |
| Under 6 | 201 (42.7%) | 233 (49.5%) |
| 6 to 18 Years | 515 (44.9%) | 553 (48.2%) |
| 19 to 25 Years | 53 (15.6%) | 232 (68.2%) |
| 25 to 34 Years | 79 (11.8%) | 374 (55.6%) |
| 35 to 44 Years | 47 (6.1%) | 549 (71.3%) |
| 45 to 54 Years | 92 (15.8%) | 413 (71.1%) |
| 55 to 64 Years | 102 (14.6%) | 536 (76.7%) |
| 65 to 74 Years | 484 (99.8%) | 264 (54.4%) |
| 75 Years and over | 397 (99.3%) | 157 (39.3%) |
| Total | 1,970 (35.4%) | 3,311 (59.5%) |
Disability Status by Sex by Age in Lynn County
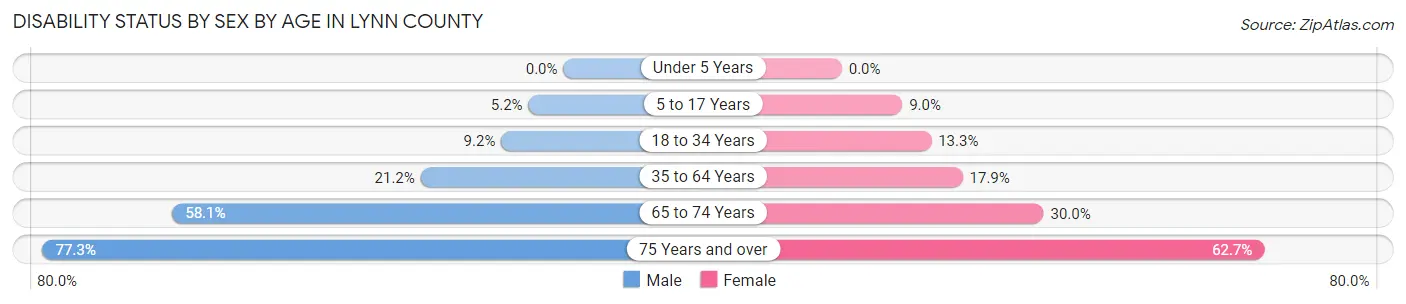
| Age Bracket | Male | Female |
| Under 5 Years | 0 (0.0%) | 0 (0.0%) |
| 5 to 17 Years | 32 (5.2%) | 49 (9.0%) |
| 18 to 34 Years | 54 (9.2%) | 68 (13.3%) |
| 35 to 64 Years | 223 (21.2%) | 179 (17.9%) |
| 65 to 74 Years | 144 (58.1%) | 71 (30.0%) |
| 75 Years and over | 133 (77.3%) | 143 (62.7%) |
Disability Class by Sex by Age in Lynn County
Disability Class: Hearing Difficulty
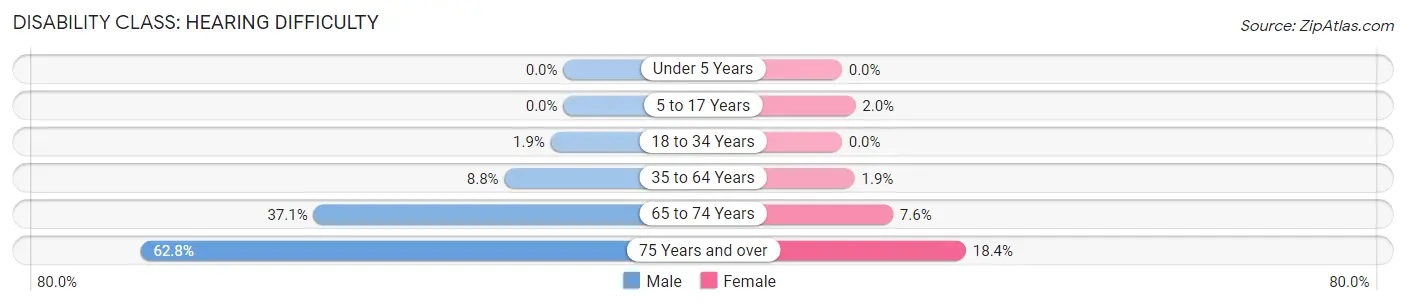
| Age Bracket | Male | Female |
| Under 5 Years | 0 (0.0%) | 0 (0.0%) |
| 5 to 17 Years | 0 (0.0%) | 11 (2.0%) |
| 18 to 34 Years | 11 (1.9%) | 0 (0.0%) |
| 35 to 64 Years | 92 (8.7%) | 19 (1.9%) |
| 65 to 74 Years | 92 (37.1%) | 18 (7.6%) |
| 75 Years and over | 108 (62.8%) | 42 (18.4%) |
Disability Class: Vision Difficulty
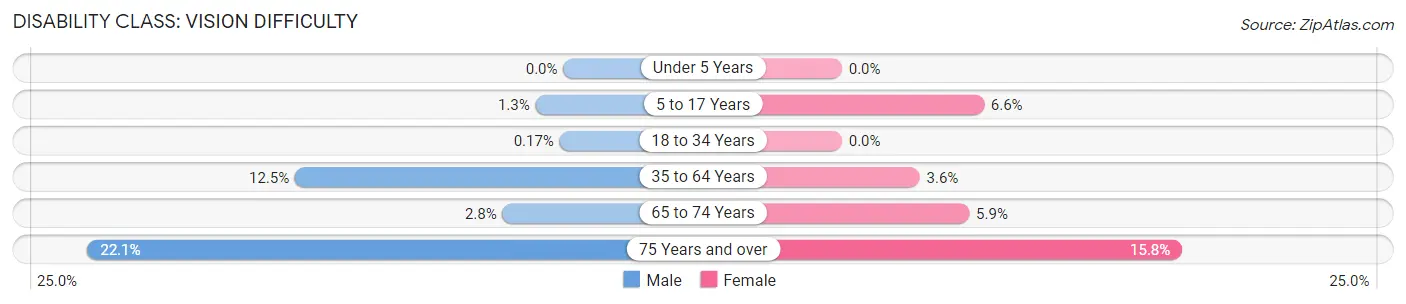
| Age Bracket | Male | Female |
| Under 5 Years | 0 (0.0%) | 0 (0.0%) |
| 5 to 17 Years | 8 (1.3%) | 36 (6.6%) |
| 18 to 34 Years | 1 (0.2%) | 0 (0.0%) |
| 35 to 64 Years | 131 (12.4%) | 36 (3.6%) |
| 65 to 74 Years | 7 (2.8%) | 14 (5.9%) |
| 75 Years and over | 38 (22.1%) | 36 (15.8%) |
Disability Class: Cognitive Difficulty
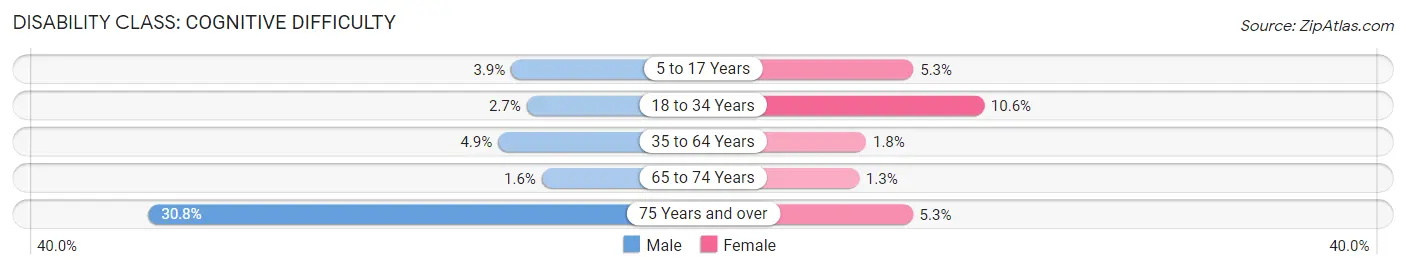
| Age Bracket | Male | Female |
| 5 to 17 Years | 24 (3.9%) | 29 (5.3%) |
| 18 to 34 Years | 16 (2.7%) | 54 (10.5%) |
| 35 to 64 Years | 51 (4.9%) | 18 (1.8%) |
| 65 to 74 Years | 4 (1.6%) | 3 (1.3%) |
| 75 Years and over | 53 (30.8%) | 12 (5.3%) |
Disability Class: Ambulatory Difficulty
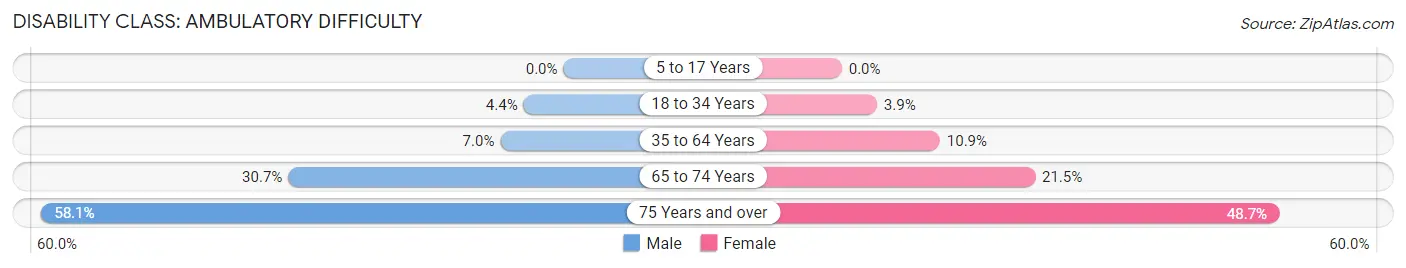
| Age Bracket | Male | Female |
| 5 to 17 Years | 0 (0.0%) | 0 (0.0%) |
| 18 to 34 Years | 26 (4.4%) | 20 (3.9%) |
| 35 to 64 Years | 74 (7.0%) | 109 (10.9%) |
| 65 to 74 Years | 76 (30.6%) | 51 (21.5%) |
| 75 Years and over | 100 (58.1%) | 111 (48.7%) |
Disability Class: Self-Care Difficulty

| Age Bracket | Male | Female |
| 5 to 17 Years | 0 (0.0%) | 0 (0.0%) |
| 18 to 34 Years | 8 (1.4%) | 0 (0.0%) |
| 35 to 64 Years | 13 (1.2%) | 57 (5.7%) |
| 65 to 74 Years | 16 (6.5%) | 0 (0.0%) |
| 75 Years and over | 81 (47.1%) | 28 (12.3%) |
Technology Access in Lynn County
Computing Device Access in Lynn County
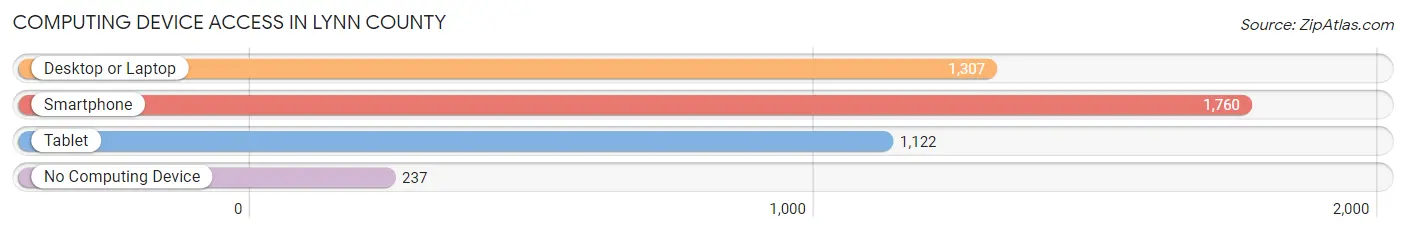
| Device Type | # Households | % Households |
| Desktop or Laptop | 1,307 | 63.7% |
| Smartphone | 1,760 | 85.7% |
| Tablet | 1,122 | 54.6% |
| No Computing Device | 237 | 11.5% |
| Total | 2,053 | 100.0% |
Internet Access in Lynn County
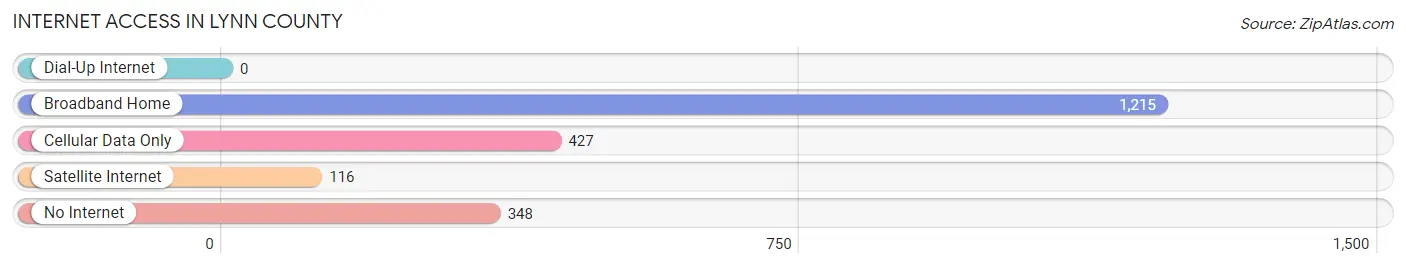
| Internet Type | # Households | % Households |
| Dial-Up Internet | 0 | 0.0% |
| Broadband Home | 1,215 | 59.2% |
| Cellular Data Only | 427 | 20.8% |
| Satellite Internet | 116 | 5.7% |
| No Internet | 348 | 17.0% |
| Total | 2,053 | 100.0% |
Lynn County Summary
Lynn County, Texas is located in the western part of the state, in the South Plains region. It is bordered by Garza County to the north, Terry County to the east, Borden County to the south, and Gaines County to the west. The county seat is Tahoka, and the largest city is New Home.
History
Lynn County was established in 1876 and named for a Confederate soldier, Stephen Lynn. The county was originally part of Bexar County, but was later divided into several smaller counties. The first settlers in the area were ranchers, who were attracted by the abundance of grasslands and water.
The county was largely rural until the early 20th century, when oil was discovered in the area. This led to an influx of people and businesses, and the county's population grew rapidly. The oil industry has remained an important part of the local economy ever since.
Geography
Lynn County covers an area of 902 square miles, making it the 33rd largest county in Texas. The terrain is mostly flat, with some rolling hills in the western part of the county. The county is drained by the White River and its tributaries.
The climate is semi-arid, with hot summers and mild winters. The average annual precipitation is about 18 inches.
Economy
The economy of Lynn County is largely based on agriculture and oil. The county is one of the leading producers of cotton in the state, and other crops grown in the area include corn, sorghum, wheat, and hay.
The oil industry is also an important part of the local economy. There are several oil and gas fields in the county, and the industry provides jobs for many of the county's residents.
Demographics
As of the 2010 census, the population of Lynn County was 10,890. The racial makeup of the county was 79.3% White, 0.7% African American, 0.7% Native American, 0.3% Asian, 0.1% Pacific Islander, 16.7% from other races, and 2.1% from two or more races. Hispanic or Latino of any race were 37.2% of the population.
The median household income was $35,945, and the median family income was $41,944. The per capita income was $17,845. About 17.2% of the population was below the poverty line.
The largest cities in Lynn County are Tahoka (population 2,845), New Home (population 1,845), and O'Donnell (population 1,072). The county seat is Tahoka.
Common Questions
What is Per Capita Income in Lynn County?
Per Capita income in Lynn County is $31,000.
What is the Median Family Income in Lynn County?
Median Family Income in Lynn County is $69,205.
What is the Median Household income in Lynn County?
Median Household Income in Lynn County is $52,996.
What is Income or Wage Gap in Lynn County?
Income or Wage Gap in Lynn County is 43.7%.
Women in Lynn County earn 56.3 cents for every dollar earned by a man.
What is Family Income Deficit in Lynn County?
Family Income Deficit in Lynn County is $11,017.
Families that are below poverty line in Lynn County earn $11,017 less on average than the poverty threshold level.
What is Inequality or Gini Index in Lynn County?
Inequality or Gini Index in Lynn County is 0.48.
What is the Total Population of Lynn County?
Total Population of Lynn County is 5,619.
What is the Total Male Population of Lynn County?
Total Male Population of Lynn County is 2,912.
What is the Total Female Population of Lynn County?
Total Female Population of Lynn County is 2,707.
What is the Ratio of Males per 100 Females in Lynn County?
There are 107.57 Males per 100 Females in Lynn County.
What is the Ratio of Females per 100 Males in Lynn County?
There are 92.96 Females per 100 Males in Lynn County.
What is the Median Population Age in Lynn County?
Median Population Age in Lynn County is 36.6 Years.
What is the Average Family Size in Lynn County
Average Family Size in Lynn County is 3.3 People.
What is the Average Household Size in Lynn County
Average Household Size in Lynn County is 2.7 People.
How Large is the Labor Force in Lynn County?
There are 2,607 People in the Labor Forcein in Lynn County.
What is the Percentage of People in the Labor Force in Lynn County?
61.2% of People are in the Labor Force in Lynn County.
What is the Unemployment Rate in Lynn County?
Unemployment Rate in Lynn County is 3.6%.