Llano County, TX Map & Demographics
Llano County Overview
$48,116
PER CAPITA INCOME
$78,092
AVG FAMILY INCOME
$64,241
AVG HOUSEHOLD INCOME
41.6%
WAGE / INCOME GAP [ % ]
58.4¢/ $1
WAGE / INCOME GAP [ $ ]
0.53
INEQUALITY / GINI INDEX
21,637
TOTAL POPULATION
10,332
MALE POPULATION
11,305
FEMALE POPULATION
91.39
MALES / 100 FEMALES
109.42
FEMALES / 100 MALES
57.4
MEDIAN AGE
2.7
AVG FAMILY SIZE
2.2
AVG HOUSEHOLD SIZE
8,749
LABOR FORCE [ PEOPLE ]
47.2%
PERCENT IN LABOR FORCE
6.0%
UNEMPLOYMENT RATE
Income in Llano County
Income Overview in Llano County
Per Capita Income in Llano County is $48,116, while median incomes of families and households are $78,092 and $64,241 respectively.
| Characteristic | Number | Measure |
| Per Capita Income | 21,637 | $48,116 |
| Median Family Income | 6,508 | $78,092 |
| Mean Family Income | 6,508 | $130,023 |
| Median Household Income | 9,612 | $64,241 |
| Mean Household Income | 9,612 | $107,193 |
| Income Deficit | 6,508 | $0 |
| Wage / Income Gap (%) | 21,637 | 41.58% |
| Wage / Income Gap ($) | 21,637 | 58.42¢ per $1 |
| Gini / Inequality Index | 21,637 | 0.53 |
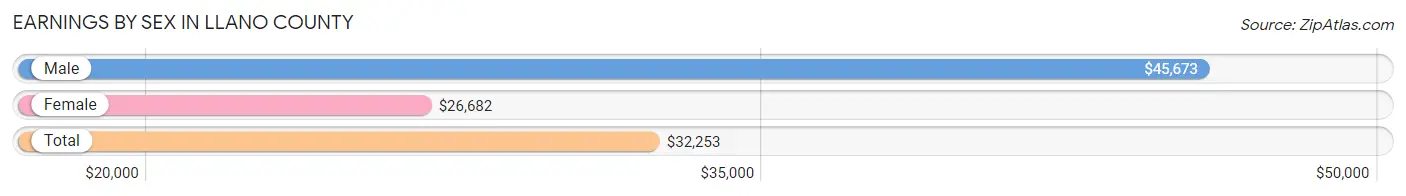
Earnings by Sex in Llano County
Average Earnings in Llano County are $32,253, $45,673 for men and $26,682 for women, a difference of 41.6%.
| Sex | Number | Average Earnings |
| Male | 4,860 (53.0%) | $45,673 |
| Female | 4,313 (47.0%) | $26,682 |
| Total | 9,173 (100.0%) | $32,253 |
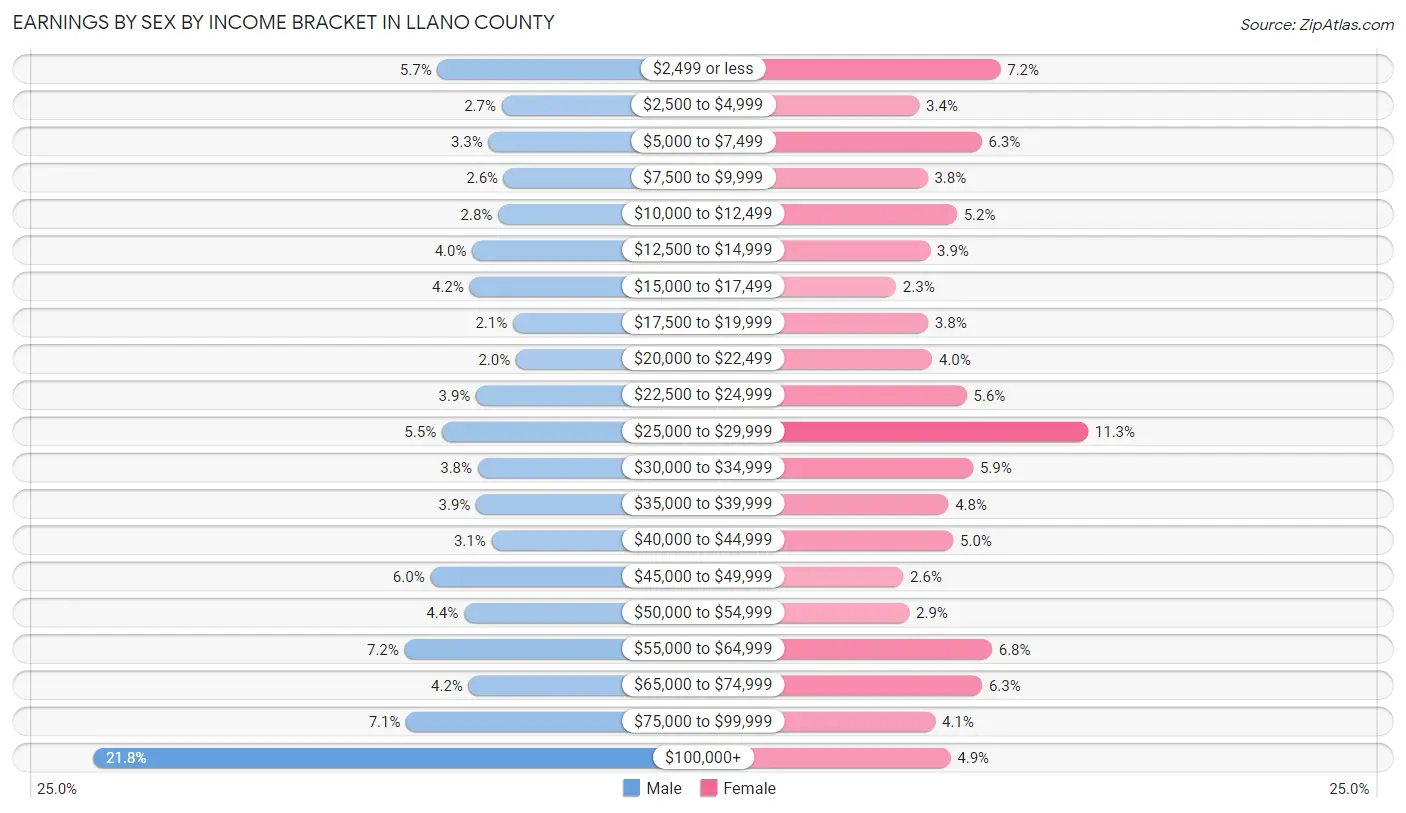
Earnings by Sex by Income Bracket in Llano County
The most common earnings brackets in Llano County are $100,000+ for men (1,059 | 21.8%) and $25,000 to $29,999 for women (487 | 11.3%).
| Income | Male | Female |
| $2,499 or less | 275 (5.7%) | 310 (7.2%) |
| $2,500 to $4,999 | 129 (2.6%) | 146 (3.4%) |
| $5,000 to $7,499 | 159 (3.3%) | 272 (6.3%) |
| $7,500 to $9,999 | 124 (2.5%) | 163 (3.8%) |
| $10,000 to $12,499 | 137 (2.8%) | 222 (5.1%) |
| $12,500 to $14,999 | 196 (4.0%) | 168 (3.9%) |
| $15,000 to $17,499 | 202 (4.2%) | 99 (2.3%) |
| $17,500 to $19,999 | 103 (2.1%) | 164 (3.8%) |
| $20,000 to $22,499 | 96 (2.0%) | 172 (4.0%) |
| $22,500 to $24,999 | 187 (3.8%) | 242 (5.6%) |
| $25,000 to $29,999 | 265 (5.4%) | 487 (11.3%) |
| $30,000 to $34,999 | 183 (3.8%) | 255 (5.9%) |
| $35,000 to $39,999 | 187 (3.8%) | 205 (4.8%) |
| $40,000 to $44,999 | 152 (3.1%) | 215 (5.0%) |
| $45,000 to $49,999 | 291 (6.0%) | 114 (2.6%) |
| $50,000 to $54,999 | 215 (4.4%) | 126 (2.9%) |
| $55,000 to $64,999 | 350 (7.2%) | 293 (6.8%) |
| $65,000 to $74,999 | 204 (4.2%) | 273 (6.3%) |
| $75,000 to $99,999 | 346 (7.1%) | 178 (4.1%) |
| $100,000+ | 1,059 (21.8%) | 209 (4.9%) |
| Total | 4,860 (100.0%) | 4,313 (100.0%) |
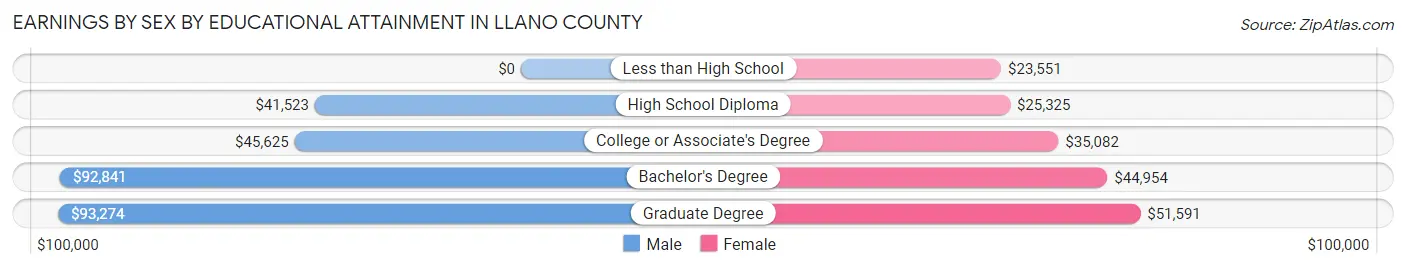
Earnings by Sex by Educational Attainment in Llano County
Average earnings in Llano County are $50,519 for men and $29,036 for women, a difference of 42.5%. Men with an educational attainment of graduate degree enjoy the highest average annual earnings of $93,274, while those with high school diploma education earn the least with $41,523. Women with an educational attainment of graduate degree earn the most with the average annual earnings of $51,591, while those with less than high school education have the smallest earnings of $23,551.
| Educational Attainment | Male Income | Female Income |
| Less than High School | - | - |
| High School Diploma | $41,523 | $25,325 |
| College or Associate's Degree | $45,625 | $35,082 |
| Bachelor's Degree | $92,841 | $44,954 |
| Graduate Degree | $93,274 | $51,591 |
| Total | $50,519 | $29,036 |
Family Income in Llano County
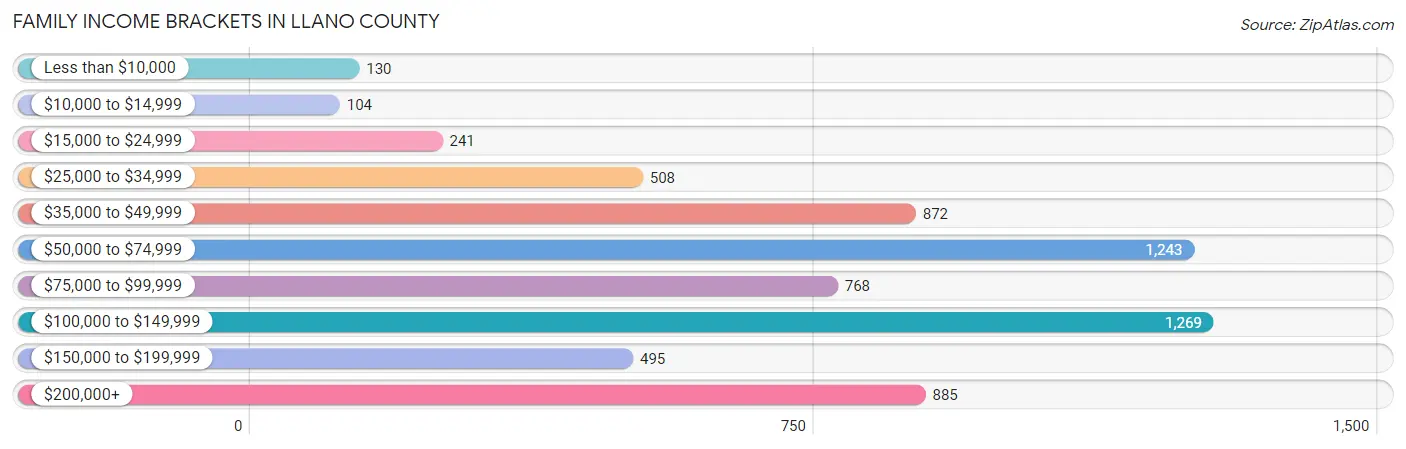
Family Income Brackets in Llano County
According to the Llano County family income data, there are 1,269 families falling into the $100,000 to $149,999 income range, which is the most common income bracket and makes up 19.5% of all families. Conversely, the $10,000 to $14,999 income bracket is the least frequent group with only 104 families (1.6%) belonging to this category.
| Income Bracket | # Families | % Families |
| Less than $10,000 | 130 | 2.0% |
| $10,000 to $14,999 | 104 | 1.6% |
| $15,000 to $24,999 | 241 | 3.7% |
| $25,000 to $34,999 | 508 | 7.8% |
| $35,000 to $49,999 | 872 | 13.4% |
| $50,000 to $74,999 | 1,243 | 19.1% |
| $75,000 to $99,999 | 768 | 11.8% |
| $100,000 to $149,999 | 1,269 | 19.5% |
| $150,000 to $199,999 | 495 | 7.6% |
| $200,000+ | 885 | 13.6% |
Family Income by Famaliy Size in Llano County
4-person families (736 | 11.3%) account for the highest median family income in Llano County with $81,250 per family, while 2-person families (4,454 | 68.4%) have the highest median income of $40,034 per family member.
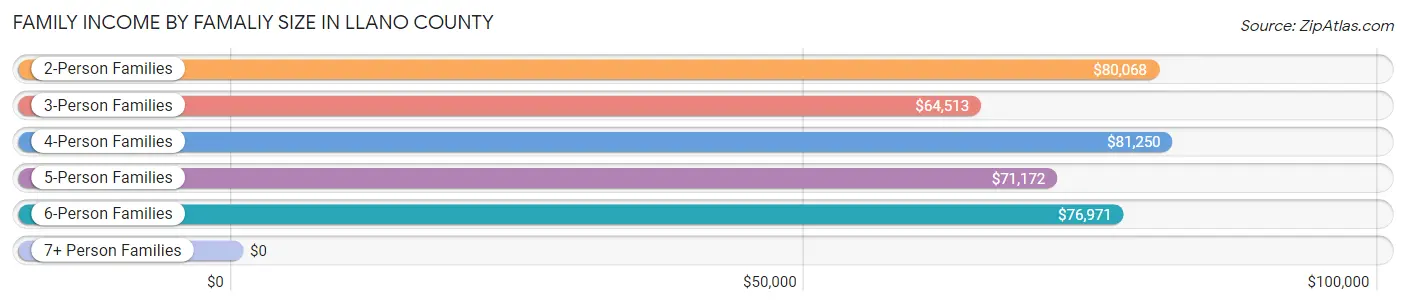
| Income Bracket | # Families | Median Income |
| 2-Person Families | 4,454 (68.4%) | $80,068 |
| 3-Person Families | 847 (13.0%) | $64,513 |
| 4-Person Families | 736 (11.3%) | $81,250 |
| 5-Person Families | 395 (6.1%) | $71,172 |
| 6-Person Families | 41 (0.6%) | $76,971 |
| 7+ Person Families | 35 (0.5%) | $0 |
| Total | 6,508 (100.0%) | $78,092 |
Family Income by Number of Earners in Llano County
The median family income in Llano County is $78,092, with families comprising 3+ earners (366) having the highest median family income of $105,893, while families with no earners (2,059) have the lowest median family income of $67,566, accounting for 5.6% and 31.6% of families, respectively.
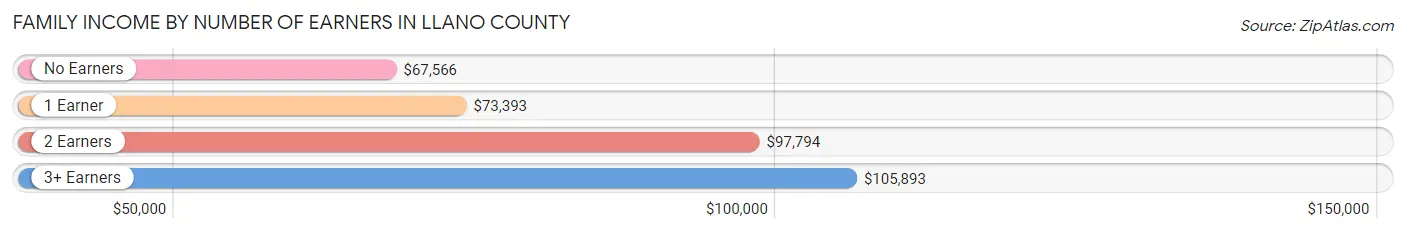
| Number of Earners | # Families | Median Income |
| No Earners | 2,059 (31.6%) | $67,566 |
| 1 Earner | 2,181 (33.5%) | $73,393 |
| 2 Earners | 1,902 (29.2%) | $97,794 |
| 3+ Earners | 366 (5.6%) | $105,893 |
| Total | 6,508 (100.0%) | $78,092 |
Household Income in Llano County
Household Income Brackets in Llano County
With 1,682 households falling in the category, the $50,000 to $74,999 income range is the most frequent in Llano County, accounting for 17.5% of all households. In contrast, only 308 households (3.2%) fall into the $10,000 to $14,999 income bracket, making it the least populous group.
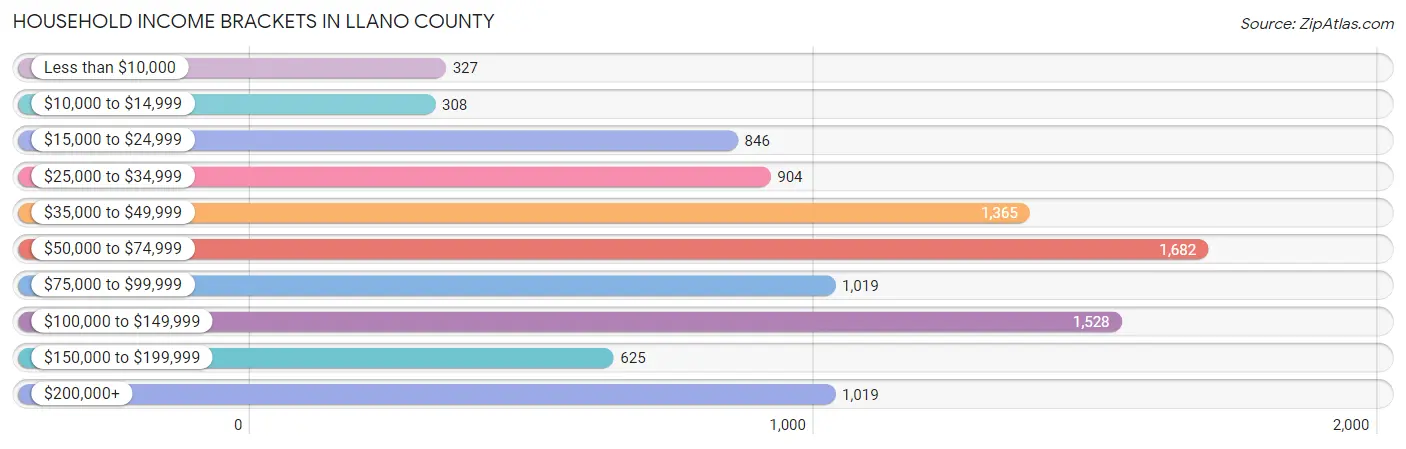
| Income Bracket | # Households | % Households |
| Less than $10,000 | 327 | 3.4% |
| $10,000 to $14,999 | 308 | 3.2% |
| $15,000 to $24,999 | 846 | 8.8% |
| $25,000 to $34,999 | 904 | 9.4% |
| $35,000 to $49,999 | 1,365 | 14.2% |
| $50,000 to $74,999 | 1,682 | 17.5% |
| $75,000 to $99,999 | 1,019 | 10.6% |
| $100,000 to $149,999 | 1,528 | 15.9% |
| $150,000 to $199,999 | 625 | 6.5% |
| $200,000+ | 1,019 | 10.6% |
Household Income by Householder Age in Llano County
The median household income in Llano County is $64,241, with the highest median household income of $75,702 found in the 45 to 64 years age bracket for the primary householder. A total of 2,936 households (30.5%) fall into this category. Meanwhile, the 65+ years age bracket for the primary householder has the lowest median household income of $56,433, with 5,004 households (52.1%) in this group.
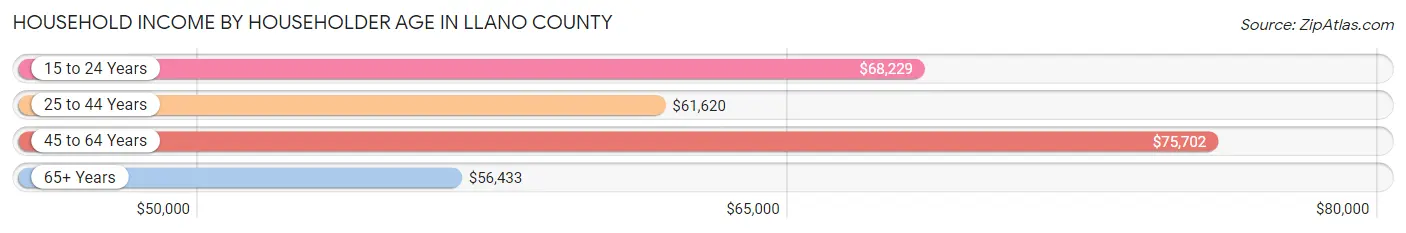
| Income Bracket | # Households | Median Income |
| 15 to 24 Years | 186 (1.9%) | $68,229 |
| 25 to 44 Years | 1,486 (15.5%) | $61,620 |
| 45 to 64 Years | 2,936 (30.5%) | $75,702 |
| 65+ Years | 5,004 (52.1%) | $56,433 |
| Total | 9,612 (100.0%) | $64,241 |
Poverty in Llano County
Income Below Poverty by Sex and Age in Llano County
With 9.1% poverty level for males and 13.3% for females among the residents of Llano County, 15 year old males and 16 and 17 year old females are the most vulnerable to poverty, with 36 males (22.9%) and 84 females (49.1%) in their respective age groups living below the poverty level.
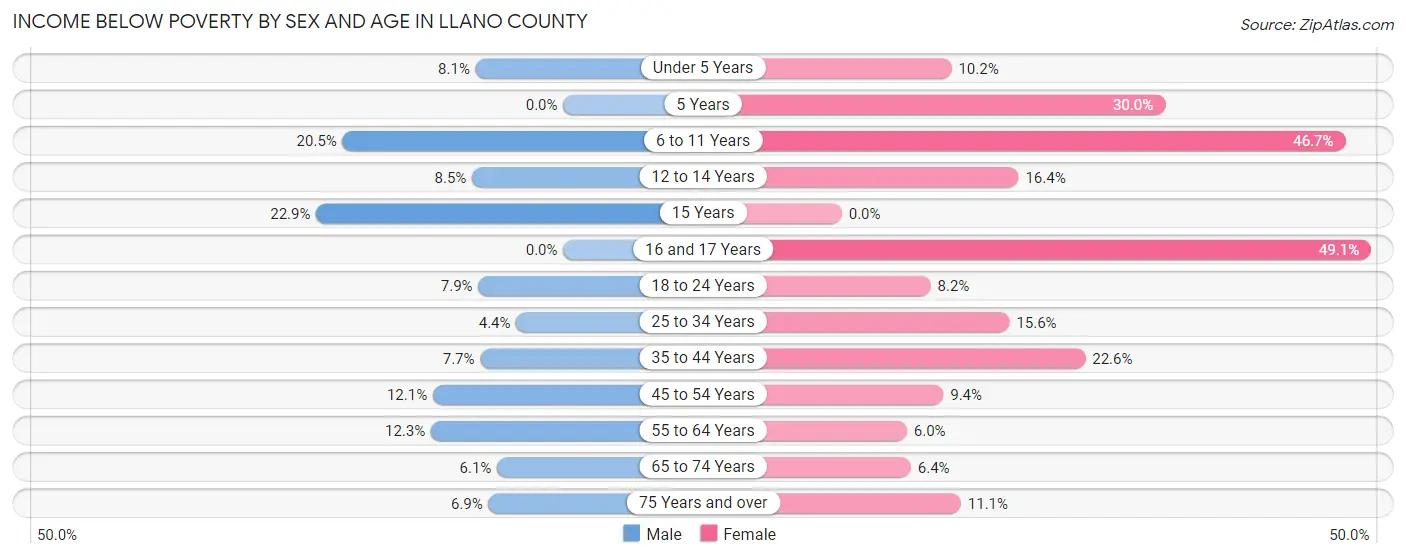
| Age Bracket | Male | Female |
| Under 5 Years | 17 (8.1%) | 52 (10.2%) |
| 5 Years | 0 (0.0%) | 18 (30.0%) |
| 6 to 11 Years | 128 (20.5%) | 350 (46.7%) |
| 12 to 14 Years | 34 (8.5%) | 41 (16.4%) |
| 15 Years | 36 (22.9%) | 0 (0.0%) |
| 16 and 17 Years | 0 (0.0%) | 84 (49.1%) |
| 18 to 24 Years | 45 (7.9%) | 44 (8.2%) |
| 25 to 34 Years | 34 (4.4%) | 147 (15.6%) |
| 35 to 44 Years | 59 (7.7%) | 188 (22.6%) |
| 45 to 54 Years | 137 (12.1%) | 100 (9.4%) |
| 55 to 64 Years | 206 (12.3%) | 109 (6.0%) |
| 65 to 74 Years | 127 (6.1%) | 152 (6.4%) |
| 75 Years and over | 117 (6.9%) | 195 (11.1%) |
| Total | 940 (9.1%) | 1,480 (13.3%) |
Income Above Poverty by Sex and Age in Llano County
According to the poverty statistics in Llano County, males aged 5 years and females aged 15 years are the age groups that are most secure financially, with 100.0% of males and 100.0% of females in these age groups living above the poverty line.
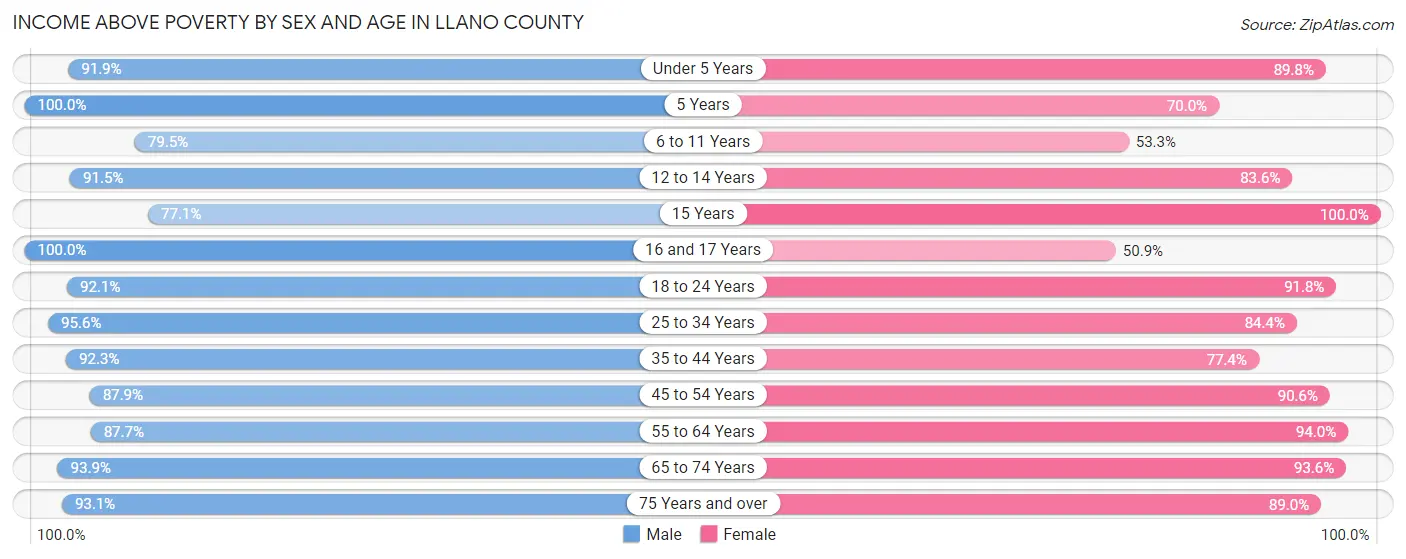
| Age Bracket | Male | Female |
| Under 5 Years | 192 (91.9%) | 459 (89.8%) |
| 5 Years | 20 (100.0%) | 42 (70.0%) |
| 6 to 11 Years | 497 (79.5%) | 399 (53.3%) |
| 12 to 14 Years | 368 (91.5%) | 209 (83.6%) |
| 15 Years | 121 (77.1%) | 69 (100.0%) |
| 16 and 17 Years | 178 (100.0%) | 87 (50.9%) |
| 18 to 24 Years | 526 (92.1%) | 490 (91.8%) |
| 25 to 34 Years | 745 (95.6%) | 798 (84.4%) |
| 35 to 44 Years | 707 (92.3%) | 644 (77.4%) |
| 45 to 54 Years | 995 (87.9%) | 962 (90.6%) |
| 55 to 64 Years | 1,472 (87.7%) | 1,697 (94.0%) |
| 65 to 74 Years | 1,941 (93.9%) | 2,218 (93.6%) |
| 75 Years and over | 1,568 (93.1%) | 1,569 (88.9%) |
| Total | 9,330 (90.8%) | 9,643 (86.7%) |
Income Below Poverty Among Married-Couple Families in Llano County
The poverty statistics for married-couple families in Llano County show that 5.7% or 286 of the total 5,034 families live below the poverty line. Families with 1 or 2 children have the highest poverty rate of 11.4%, comprising of 69 families. On the other hand, families with 3 or 4 children have the lowest poverty rate of 0.0%, which includes 0 families.
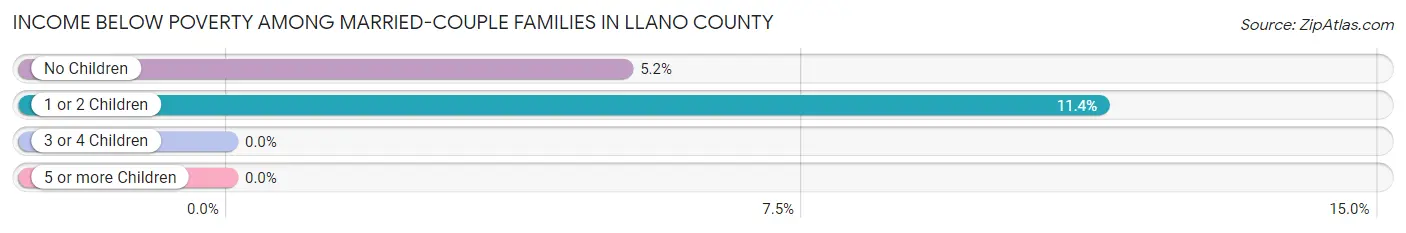
| Children | Above Poverty | Below Poverty |
| No Children | 3,985 (94.8%) | 217 (5.2%) |
| 1 or 2 Children | 538 (88.6%) | 69 (11.4%) |
| 3 or 4 Children | 209 (100.0%) | 0 (0.0%) |
| 5 or more Children | 16 (100.0%) | 0 (0.0%) |
| Total | 4,748 (94.3%) | 286 (5.7%) |
Income Below Poverty Among Single-Parent Households in Llano County
According to the poverty data in Llano County, 3.6% or 12 single-father households and 21.3% or 244 single-mother households are living below the poverty line. Among single-father households, those with no children have the highest poverty rate, with 12 households (5.8%) experiencing poverty. Likewise, among single-mother households, those with 3 or 4 children have the highest poverty rate, with 102 households (44.0%) falling below the poverty line.
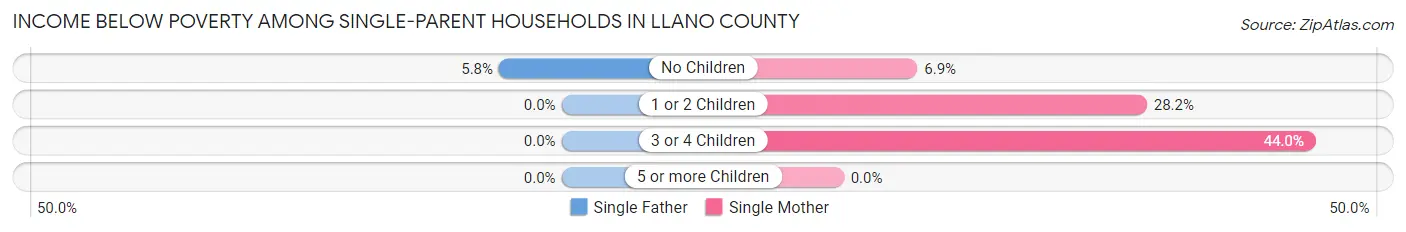
| Children | Single Father | Single Mother |
| No Children | 12 (5.8%) | 37 (6.9%) |
| 1 or 2 Children | 0 (0.0%) | 105 (28.2%) |
| 3 or 4 Children | 0 (0.0%) | 102 (44.0%) |
| 5 or more Children | 0 (0.0%) | 0 (0.0%) |
| Total | 12 (3.6%) | 244 (21.3%) |
Income Below Poverty Among Married-Couple vs Single-Parent Households in Llano County
The poverty data for Llano County shows that 286 of the married-couple family households (5.7%) and 256 of the single-parent households (17.4%) are living below the poverty level. Within the married-couple family households, those with 1 or 2 children have the highest poverty rate, with 69 households (11.4%) falling below the poverty line. Among the single-parent households, those with 3 or 4 children have the highest poverty rate, with 102 household (43.8%) living below poverty.
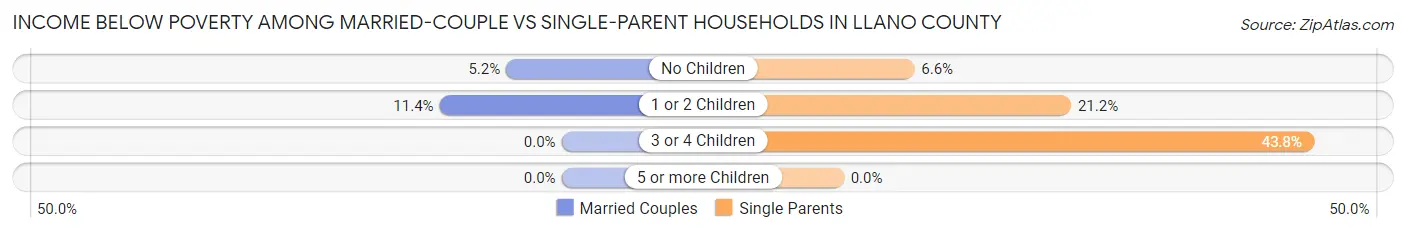
| Children | Married-Couple Families | Single-Parent Households |
| No Children | 217 (5.2%) | 49 (6.6%) |
| 1 or 2 Children | 69 (11.4%) | 105 (21.2%) |
| 3 or 4 Children | 0 (0.0%) | 102 (43.8%) |
| 5 or more Children | 0 (0.0%) | 0 (0.0%) |
| Total | 286 (5.7%) | 256 (17.4%) |
Race in Llano County
The most populous races in Llano County are White / Caucasian (19,493 | 90.1%), Hispanic or Latino (2,522 | 11.7%), and Two or more Races (1,232 | 5.7%).
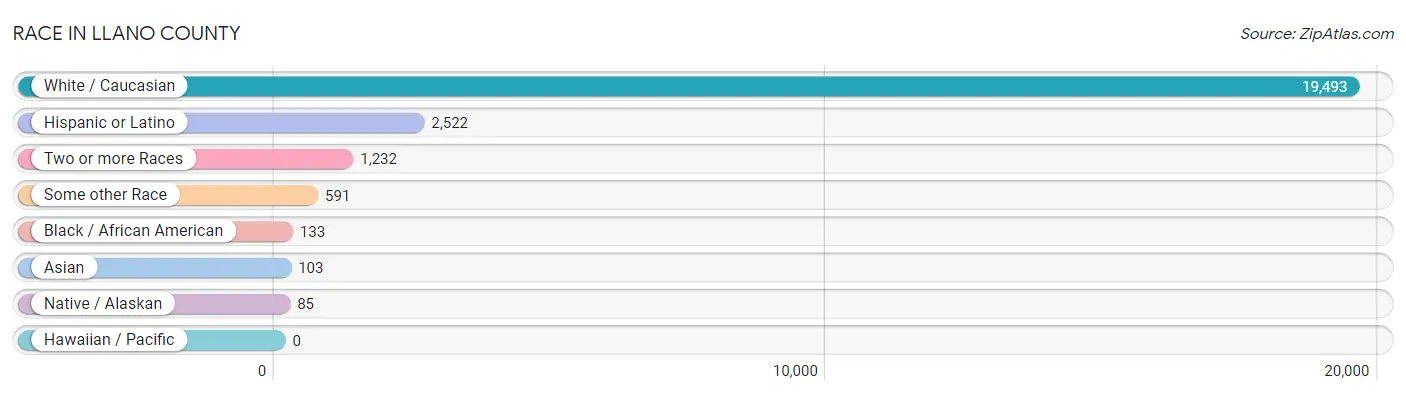
| Race | # Population | % Population |
| Asian | 103 | 0.5% |
| Black / African American | 133 | 0.6% |
| Hawaiian / Pacific | 0 | 0.0% |
| Hispanic or Latino | 2,522 | 11.7% |
| Native / Alaskan | 85 | 0.4% |
| White / Caucasian | 19,493 | 90.1% |
| Two or more Races | 1,232 | 5.7% |
| Some other Race | 591 | 2.7% |
| Total | 21,637 | 100.0% |
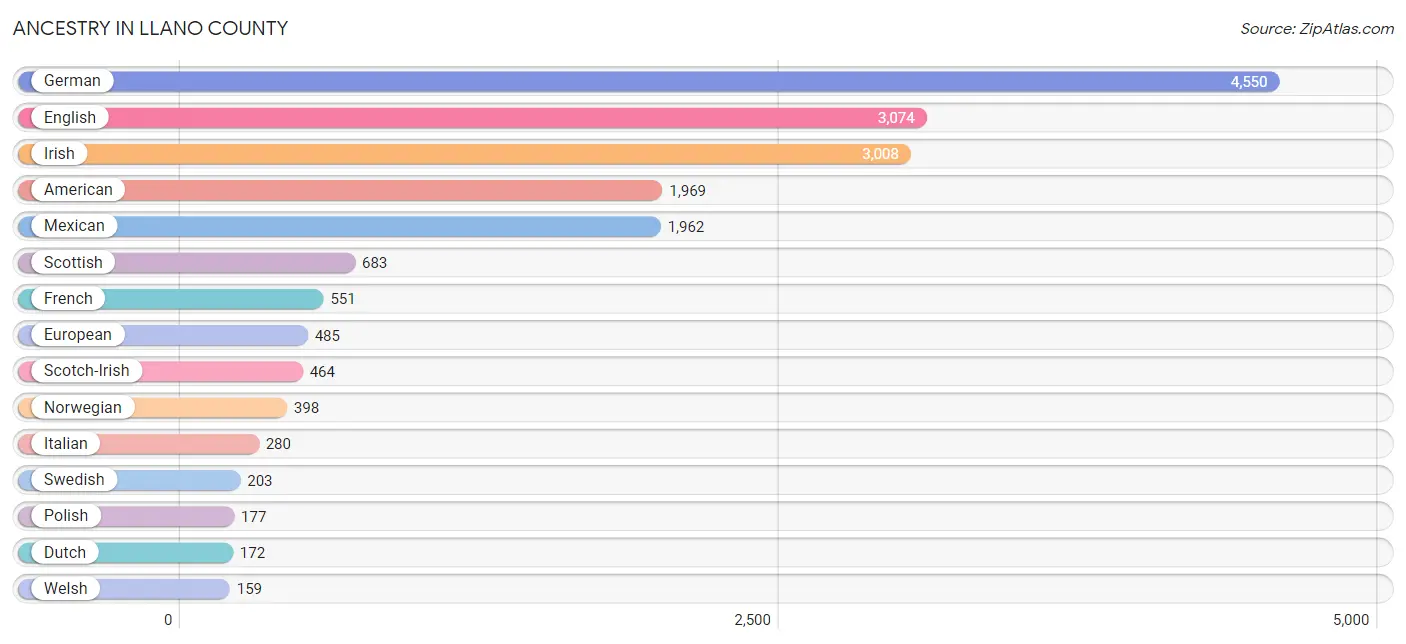
Ancestry in Llano County
The most populous ancestries reported in Llano County are German (4,550 | 21.0%), English (3,074 | 14.2%), Irish (3,008 | 13.9%), American (1,969 | 9.1%), and Mexican (1,962 | 9.1%), together accounting for 67.3% of all Llano County residents.
| Ancestry | # Population | % Population |
| American | 1,969 | 9.1% |
| Arab | 61 | 0.3% |
| Australian | 2 | 0.0% |
| Austrian | 21 | 0.1% |
| Belgian | 9 | 0.0% |
| Bhutanese | 66 | 0.3% |
| Blackfeet | 9 | 0.0% |
| British | 102 | 0.5% |
| Bulgarian | 88 | 0.4% |
| Burmese | 2 | 0.0% |
| Cajun | 3 | 0.0% |
| Cambodian | 3 | 0.0% |
| Canadian | 6 | 0.0% |
| Celtic | 11 | 0.1% |
| Central American | 147 | 0.7% |
| Cherokee | 98 | 0.4% |
| Chickasaw | 7 | 0.0% |
| Chilean | 4 | 0.0% |
| Choctaw | 5 | 0.0% |
| Colombian | 12 | 0.1% |
| Comanche | 24 | 0.1% |
| Creek | 7 | 0.0% |
| Croatian | 7 | 0.0% |
| Cuban | 83 | 0.4% |
| Czech | 63 | 0.3% |
| Czechoslovakian | 33 | 0.2% |
| Danish | 47 | 0.2% |
| Dutch | 172 | 0.8% |
| Dutch West Indian | 12 | 0.1% |
| Eastern European | 29 | 0.1% |
| English | 3,074 | 14.2% |
| European | 485 | 2.2% |
| Finnish | 24 | 0.1% |
| French | 551 | 2.5% |
| French Canadian | 52 | 0.2% |
| German | 4,550 | 21.0% |
| Greek | 33 | 0.2% |
| Honduran | 109 | 0.5% |
| Hungarian | 16 | 0.1% |
| Irish | 3,008 | 13.9% |
| Italian | 280 | 1.3% |
| Jamaican | 37 | 0.2% |
| Korean | 3 | 0.0% |
| Laotian | 4 | 0.0% |
| Lebanese | 61 | 0.3% |
| Lithuanian | 10 | 0.1% |
| Mexican | 1,962 | 9.1% |
| Nigerian | 4 | 0.0% |
| Northern European | 19 | 0.1% |
| Norwegian | 398 | 1.8% |
| Osage | 1 | 0.0% |
| Ottawa | 8 | 0.0% |
| Pennsylvania German | 18 | 0.1% |
| Peruvian | 16 | 0.1% |
| Polish | 177 | 0.8% |
| Portuguese | 50 | 0.2% |
| Pueblo | 42 | 0.2% |
| Puerto Rican | 27 | 0.1% |
| Romanian | 8 | 0.0% |
| Russian | 8 | 0.0% |
| Salvadoran | 38 | 0.2% |
| Scandinavian | 127 | 0.6% |
| Scotch-Irish | 464 | 2.1% |
| Scottish | 683 | 3.2% |
| Slovak | 11 | 0.1% |
| South American | 32 | 0.2% |
| Spaniard | 58 | 0.3% |
| Spanish | 18 | 0.1% |
| Sri Lankan | 117 | 0.5% |
| Subsaharan African | 4 | 0.0% |
| Swedish | 203 | 0.9% |
| Swiss | 7 | 0.0% |
| Welsh | 159 | 0.7% | View All 73 Rows |
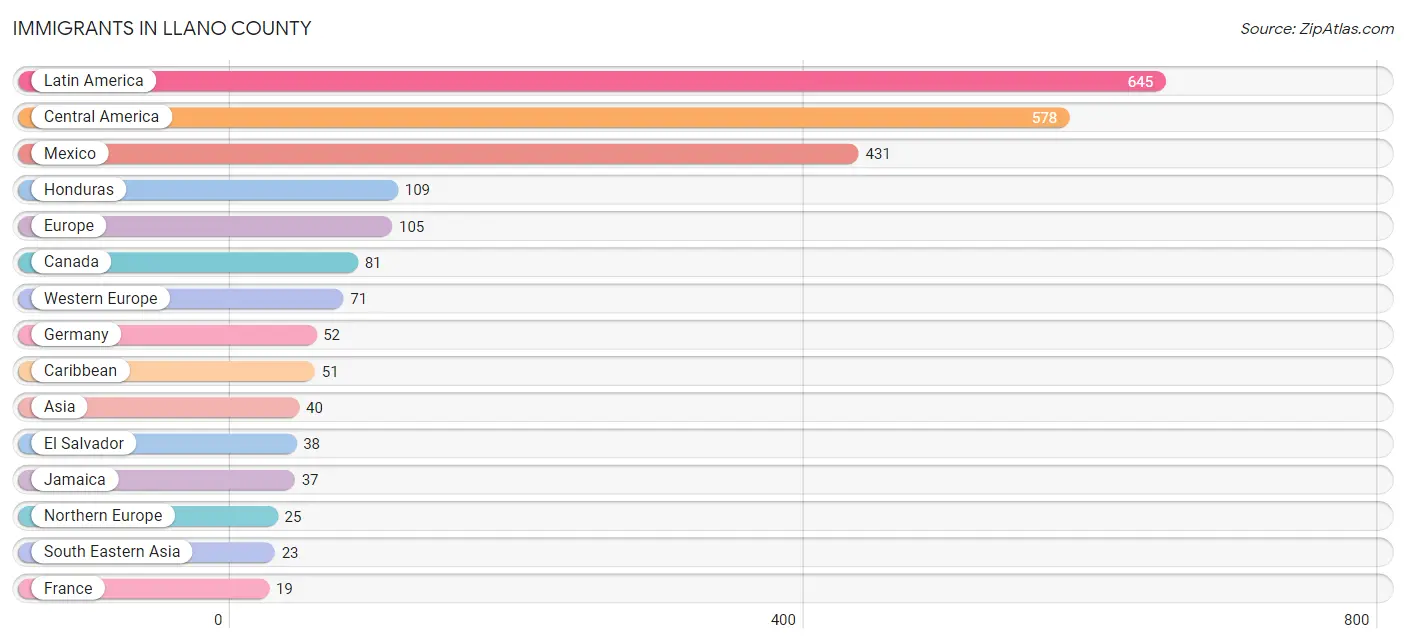
Immigrants in Llano County
The most numerous immigrant groups reported in Llano County came from Latin America (645 | 3.0%), Central America (578 | 2.7%), Mexico (431 | 2.0%), Honduras (109 | 0.5%), and Europe (105 | 0.5%), together accounting for 8.6% of all Llano County residents.
| Immigration Origin | # Population | % Population |
| Asia | 40 | 0.2% |
| Australia | 2 | 0.0% |
| Canada | 81 | 0.4% |
| Caribbean | 51 | 0.2% |
| Central America | 578 | 2.7% |
| Cuba | 14 | 0.1% |
| El Salvador | 38 | 0.2% |
| England | 1 | 0.0% |
| Europe | 105 | 0.5% |
| France | 19 | 0.1% |
| Germany | 52 | 0.2% |
| Honduras | 109 | 0.5% |
| Indonesia | 4 | 0.0% |
| Jamaica | 37 | 0.2% |
| Latin America | 645 | 3.0% |
| Mexico | 431 | 2.0% |
| Northern Europe | 25 | 0.1% |
| Oceania | 2 | 0.0% |
| Pakistan | 12 | 0.1% |
| Peru | 16 | 0.1% |
| Portugal | 9 | 0.0% |
| South America | 16 | 0.1% |
| South Central Asia | 12 | 0.1% |
| South Eastern Asia | 23 | 0.1% |
| Southern Europe | 9 | 0.0% |
| Vietnam | 19 | 0.1% |
| Western Asia | 5 | 0.0% |
| Western Europe | 71 | 0.3% | View All 28 Rows |
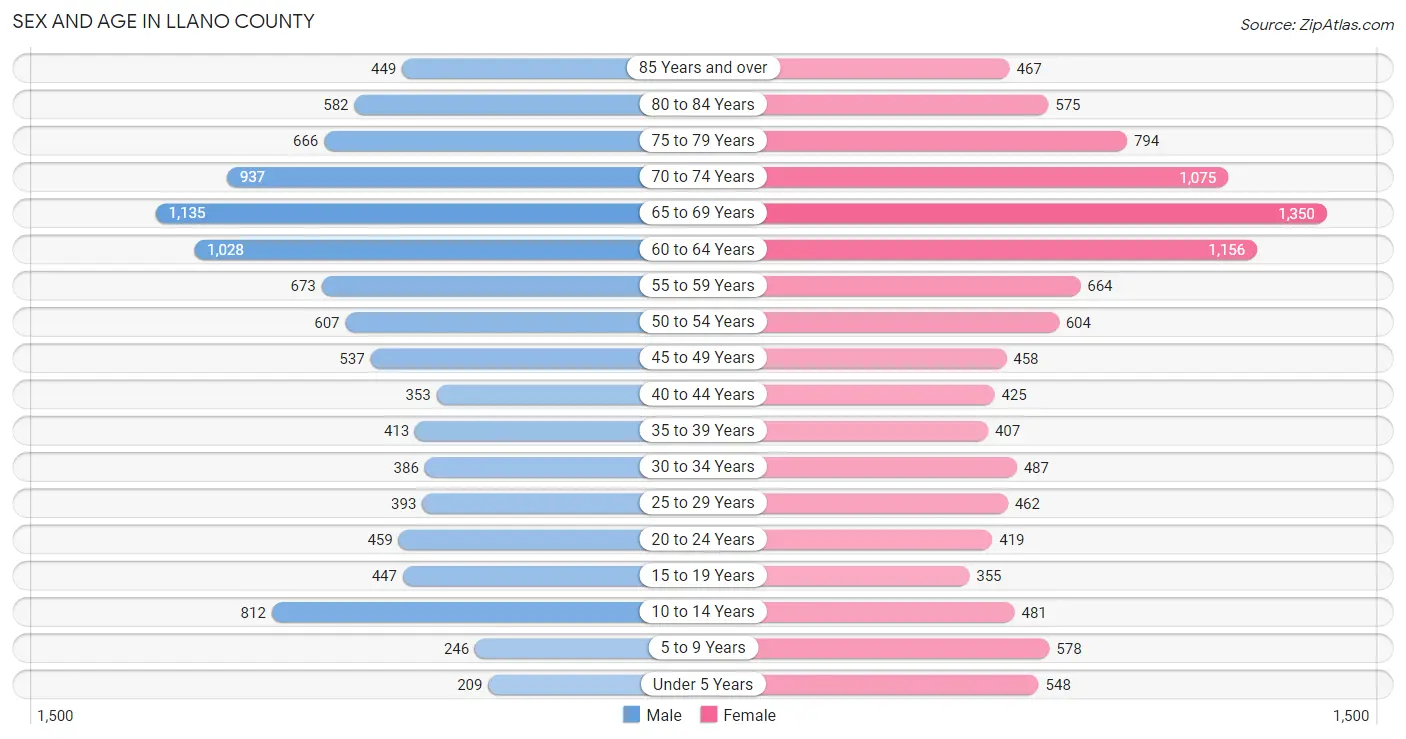
Sex and Age in Llano County
Sex and Age in Llano County
The most populous age groups in Llano County are 65 to 69 Years (1,135 | 11.0%) for men and 65 to 69 Years (1,350 | 11.9%) for women.
| Age Bracket | Male | Female |
| Under 5 Years | 209 (2.0%) | 548 (4.9%) |
| 5 to 9 Years | 246 (2.4%) | 578 (5.1%) |
| 10 to 14 Years | 812 (7.9%) | 481 (4.3%) |
| 15 to 19 Years | 447 (4.3%) | 355 (3.1%) |
| 20 to 24 Years | 459 (4.4%) | 419 (3.7%) |
| 25 to 29 Years | 393 (3.8%) | 462 (4.1%) |
| 30 to 34 Years | 386 (3.7%) | 487 (4.3%) |
| 35 to 39 Years | 413 (4.0%) | 407 (3.6%) |
| 40 to 44 Years | 353 (3.4%) | 425 (3.8%) |
| 45 to 49 Years | 537 (5.2%) | 458 (4.1%) |
| 50 to 54 Years | 607 (5.9%) | 604 (5.3%) |
| 55 to 59 Years | 673 (6.5%) | 664 (5.9%) |
| 60 to 64 Years | 1,028 (10.0%) | 1,156 (10.2%) |
| 65 to 69 Years | 1,135 (11.0%) | 1,350 (11.9%) |
| 70 to 74 Years | 937 (9.1%) | 1,075 (9.5%) |
| 75 to 79 Years | 666 (6.5%) | 794 (7.0%) |
| 80 to 84 Years | 582 (5.6%) | 575 (5.1%) |
| 85 Years and over | 449 (4.3%) | 467 (4.1%) |
| Total | 10,332 (100.0%) | 11,305 (100.0%) |
Families and Households in Llano County
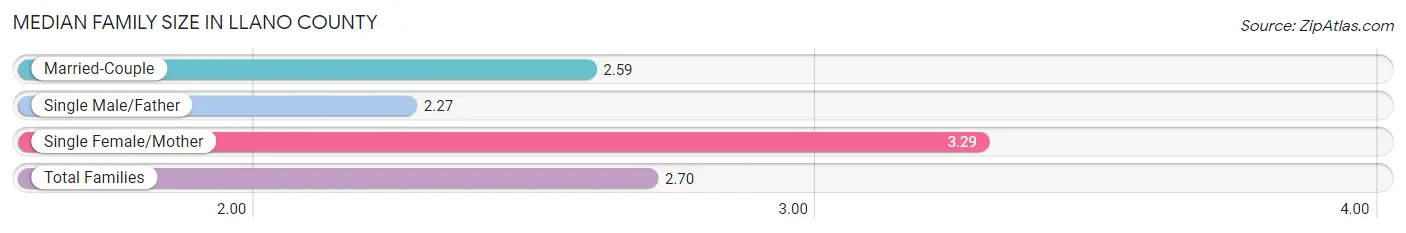
Median Family Size in Llano County
The median family size in Llano County is 2.70 persons per family, with single female/mother families (1,143 | 17.6%) accounting for the largest median family size of 3.29 persons per family. On the other hand, single male/father families (331 | 5.1%) represent the smallest median family size with 2.27 persons per family.
| Family Type | # Families | Family Size |
| Married-Couple | 5,034 (77.3%) | 2.59 |
| Single Male/Father | 331 (5.1%) | 2.27 |
| Single Female/Mother | 1,143 (17.6%) | 3.29 |
| Total Families | 6,508 (100.0%) | 2.70 |
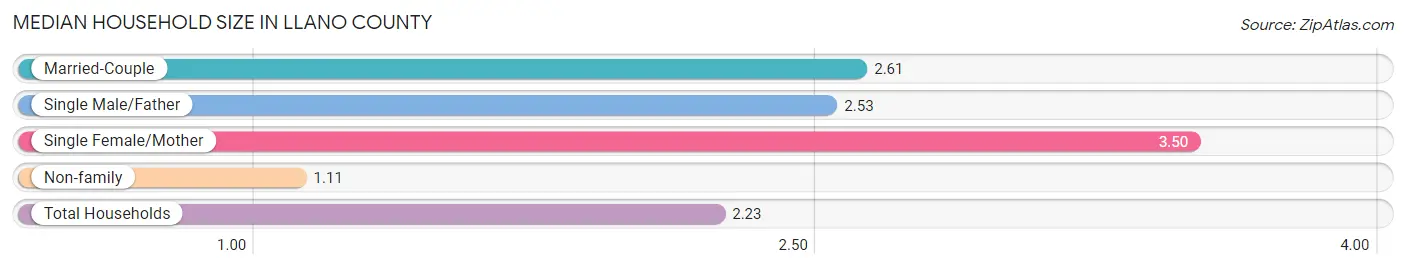
Median Household Size in Llano County
The median household size in Llano County is 2.23 persons per household, with single female/mother households (1,143 | 11.9%) accounting for the largest median household size of 3.5 persons per household. non-family households (3,104 | 32.3%) represent the smallest median household size with 1.11 persons per household.
| Household Type | # Households | Household Size |
| Married-Couple | 5,034 (52.4%) | 2.61 |
| Single Male/Father | 331 (3.4%) | 2.53 |
| Single Female/Mother | 1,143 (11.9%) | 3.50 |
| Non-family | 3,104 (32.3%) | 1.11 |
| Total Households | 9,612 (100.0%) | 2.23 |
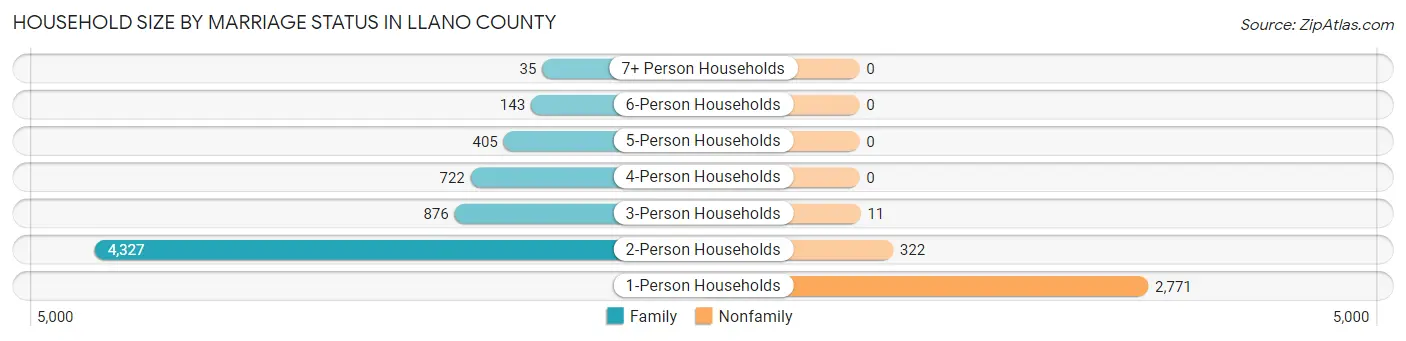
Household Size by Marriage Status in Llano County
Out of a total of 9,612 households in Llano County, 6,508 (67.7%) are family households, while 3,104 (32.3%) are nonfamily households. The most numerous type of family households are 2-person households, comprising 4,327, and the most common type of nonfamily households are 1-person households, comprising 2,771.
| Household Size | Family Households | Nonfamily Households |
| 1-Person Households | - | 2,771 (28.8%) |
| 2-Person Households | 4,327 (45.0%) | 322 (3.4%) |
| 3-Person Households | 876 (9.1%) | 11 (0.1%) |
| 4-Person Households | 722 (7.5%) | 0 (0.0%) |
| 5-Person Households | 405 (4.2%) | 0 (0.0%) |
| 6-Person Households | 143 (1.5%) | 0 (0.0%) |
| 7+ Person Households | 35 (0.4%) | 0 (0.0%) |
| Total | 6,508 (67.7%) | 3,104 (32.3%) |
Female Fertility in Llano County
Fertility by Age in Llano County
Average fertility rate in Llano County is 18.0 births per 1,000 women. Women in the age bracket of 20 to 34 years have the highest fertility rate with 37.0 births per 1,000 women. Women in the age bracket of 20 to 34 years acount for 94.4% of all women with births.
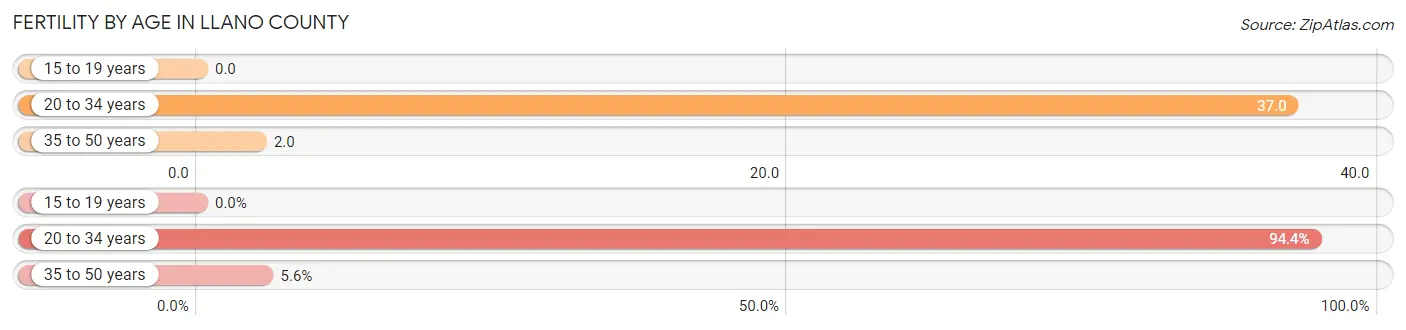
| Age Bracket | Women with Births | Births / 1,000 Women |
| 15 to 19 years | 0 (0.0%) | 0.0 |
| 20 to 34 years | 51 (94.4%) | 37.0 |
| 35 to 50 years | 3 (5.6%) | 2.0 |
| Total | 54 (100.0%) | 18.0 |
Fertility by Age by Marriage Status in Llano County
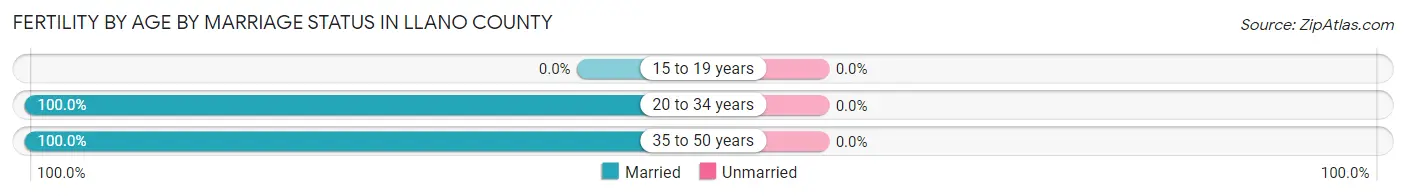
| Age Bracket | Married | Unmarried |
| 15 to 19 years | 0 (0.0%) | 0 (0.0%) |
| 20 to 34 years | 51 (100.0%) | 0 (0.0%) |
| 35 to 50 years | 3 (100.0%) | 0 (0.0%) |
| Total | 54 (100.0%) | 0 (0.0%) |
Fertility by Education in Llano County
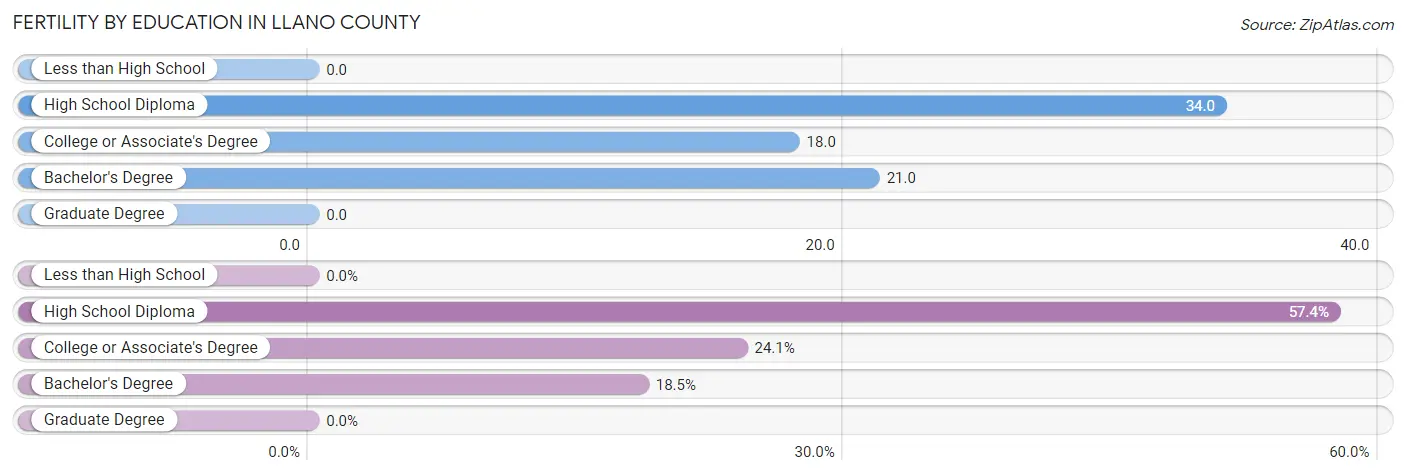
| Educational Attainment | Women with Births | Births / 1,000 Women |
| Less than High School | 0 (0.0%) | 0.0 |
| High School Diploma | 31 (57.4%) | 34.0 |
| College or Associate's Degree | 13 (24.1%) | 18.0 |
| Bachelor's Degree | 10 (18.5%) | 21.0 |
| Graduate Degree | 0 (0.0%) | 0.0 |
| Total | 54 (100.0%) | 18.0 |
Fertility by Education by Marriage Status in Llano County
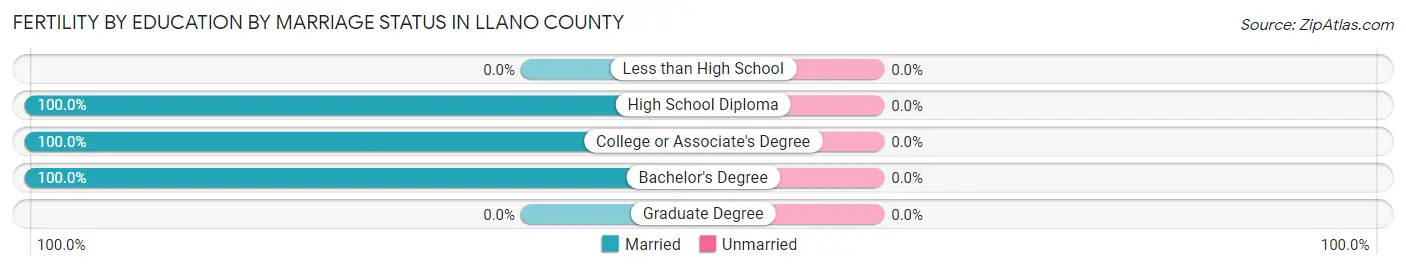
| Educational Attainment | Married | Unmarried |
| Less than High School | 0 (0.0%) | 0 (0.0%) |
| High School Diploma | 31 (100.0%) | 0 (0.0%) |
| College or Associate's Degree | 13 (100.0%) | 0 (0.0%) |
| Bachelor's Degree | 10 (100.0%) | 0 (0.0%) |
| Graduate Degree | 0 (0.0%) | 0 (0.0%) |
| Total | 54 (100.0%) | 0 (0.0%) |
Employment Characteristics in Llano County
Employment by Class of Employer in Llano County
Among the 8,055 employed individuals in Llano County, private company employees (4,735 | 58.8%), self-employed (not incorporated) (1,096 | 13.6%), and local government employees (714 | 8.9%) make up the most common classes of employment.
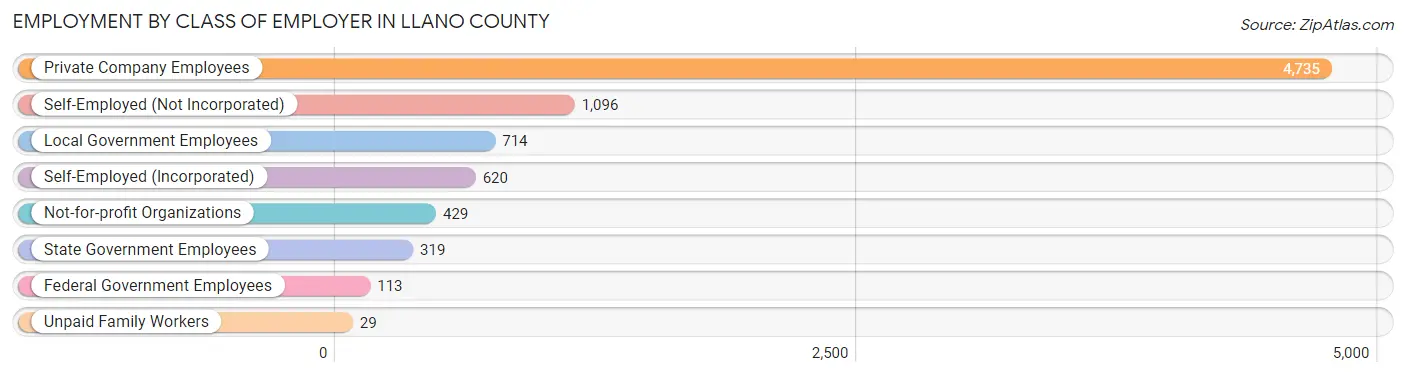
| Employer Class | # Employees | % Employees |
| Private Company Employees | 4,735 | 58.8% |
| Self-Employed (Incorporated) | 620 | 7.7% |
| Self-Employed (Not Incorporated) | 1,096 | 13.6% |
| Not-for-profit Organizations | 429 | 5.3% |
| Local Government Employees | 714 | 8.9% |
| State Government Employees | 319 | 4.0% |
| Federal Government Employees | 113 | 1.4% |
| Unpaid Family Workers | 29 | 0.4% |
| Total | 8,055 | 100.0% |
Employment Status by Age in Llano County
According to the labor force statistics for Llano County, out of the total population over 16 years of age (18,537), 47.2% or 8,749 individuals are in the labor force, with 6.0% or 525 of them unemployed. The age group with the highest labor force participation rate is 25 to 29 years, with 90.4% or 773 individuals in the labor force. Within the labor force, the 16 to 19 years age range has the highest percentage of unemployed individuals, with 45.1% or 114 of them being unemployed.
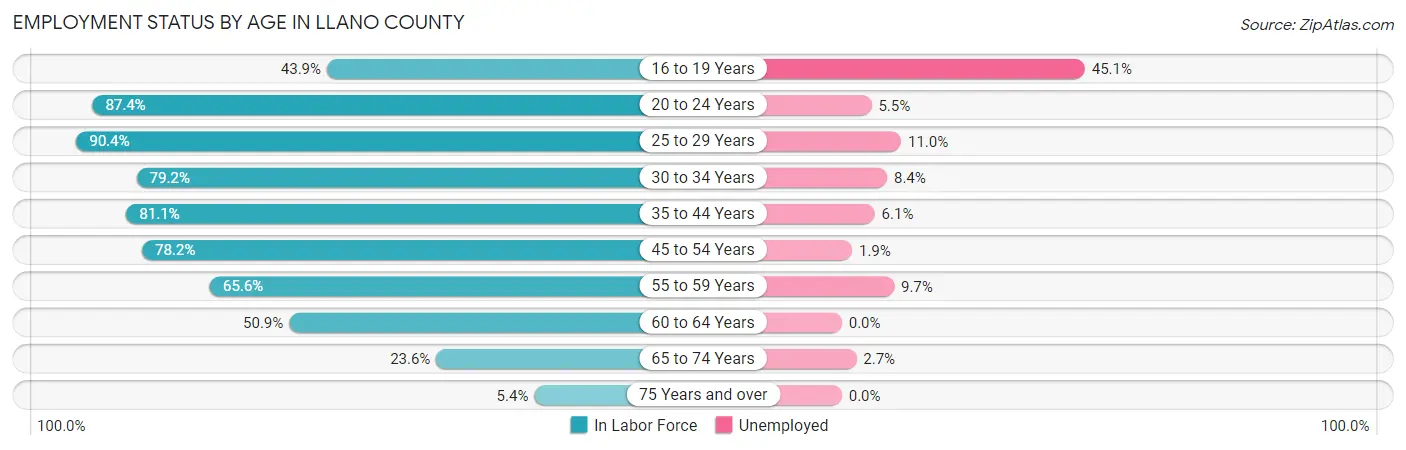
| Age Bracket | In Labor Force | Unemployed |
| 16 to 19 Years | 253 (43.9%) | 114 (45.1%) |
| 20 to 24 Years | 767 (87.4%) | 42 (5.5%) |
| 25 to 29 Years | 773 (90.4%) | 85 (11.0%) |
| 30 to 34 Years | 691 (79.2%) | 58 (8.4%) |
| 35 to 44 Years | 1,296 (81.1%) | 79 (6.1%) |
| 45 to 54 Years | 1,725 (78.2%) | 33 (1.9%) |
| 55 to 59 Years | 877 (65.6%) | 85 (9.7%) |
| 60 to 64 Years | 1,112 (50.9%) | 0 (0.0%) |
| 65 to 74 Years | 1,061 (23.6%) | 29 (2.7%) |
| 75 Years and over | 191 (5.4%) | 0 (0.0%) |
| Total | 8,749 (47.2%) | 525 (6.0%) |
Employment Status by Educational Attainment in Llano County
According to labor force statistics for Llano County, 71.5% of individuals (6,473) out of the total population between 25 and 64 years of age (9,053) are in the labor force, with 5.2% or 337 of them being unemployed. The group with the highest labor force participation rate are those with the educational attainment of high school diploma, with 78.1% or 2,159 individuals in the labor force. Within the labor force, individuals with high school diploma education have the highest percentage of unemployment, with 10.7% or 231 of them being unemployed.
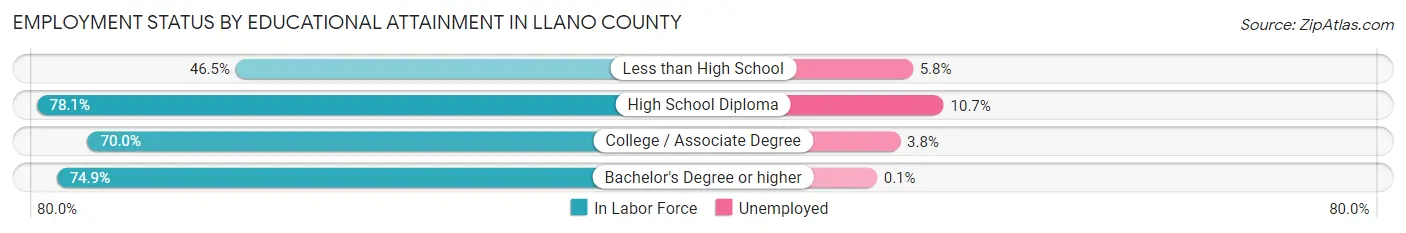
| Educational Attainment | In Labor Force | Unemployed |
| Less than High School | 394 (46.5%) | 49 (5.8%) |
| High School Diploma | 2,159 (78.1%) | 296 (10.7%) |
| College / Associate Degree | 2,244 (70.0%) | 122 (3.8%) |
| Bachelor's Degree or higher | 1,676 (74.9%) | 2 (0.1%) |
| Total | 6,473 (71.5%) | 471 (5.2%) |
Employment Occupations by Sex in Llano County
Management, Business, Science and Arts Occupations
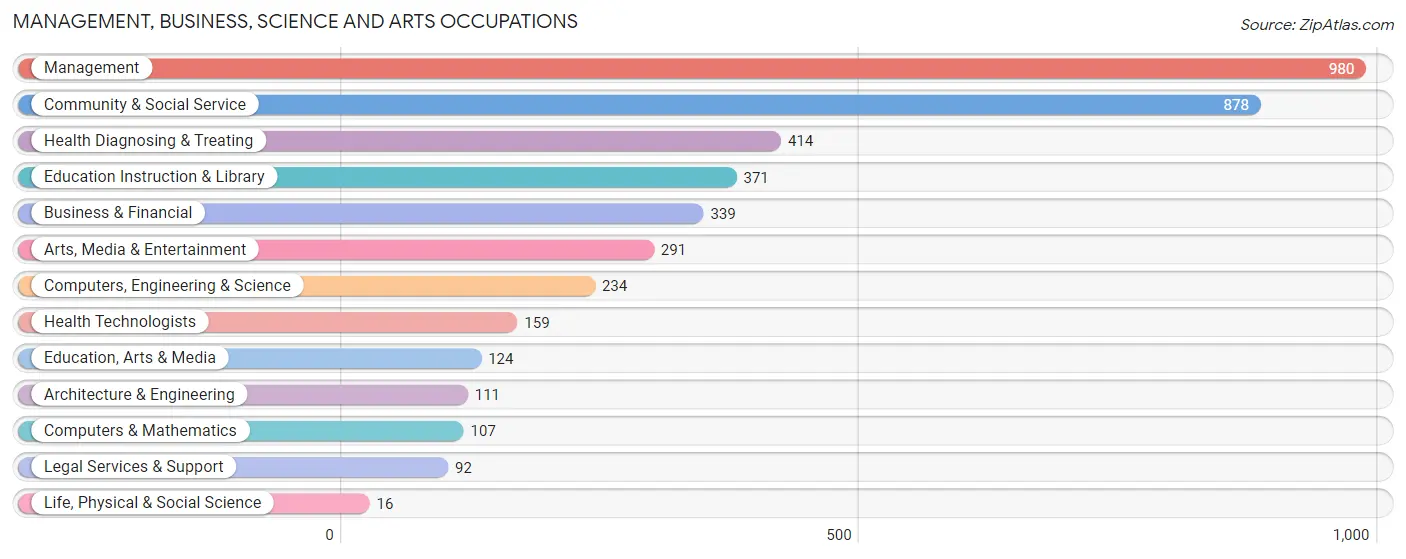
The most common Management, Business, Science and Arts occupations in Llano County are Management (980 | 11.9%), Community & Social Service (878 | 10.7%), Health Diagnosing & Treating (414 | 5.0%), Education Instruction & Library (371 | 4.5%), and Business & Financial (339 | 4.1%).
Management, Business, Science and Arts Occupations by Sex
Within the Management, Business, Science and Arts occupations in Llano County, the most male-oriented occupations are Architecture & Engineering (100.0%), Life, Physical & Social Science (93.8%), and Computers, Engineering & Science (91.4%), while the most female-oriented occupations are Health Diagnosing & Treating (88.2%), Arts, Media & Entertainment (76.3%), and Education Instruction & Library (75.5%).
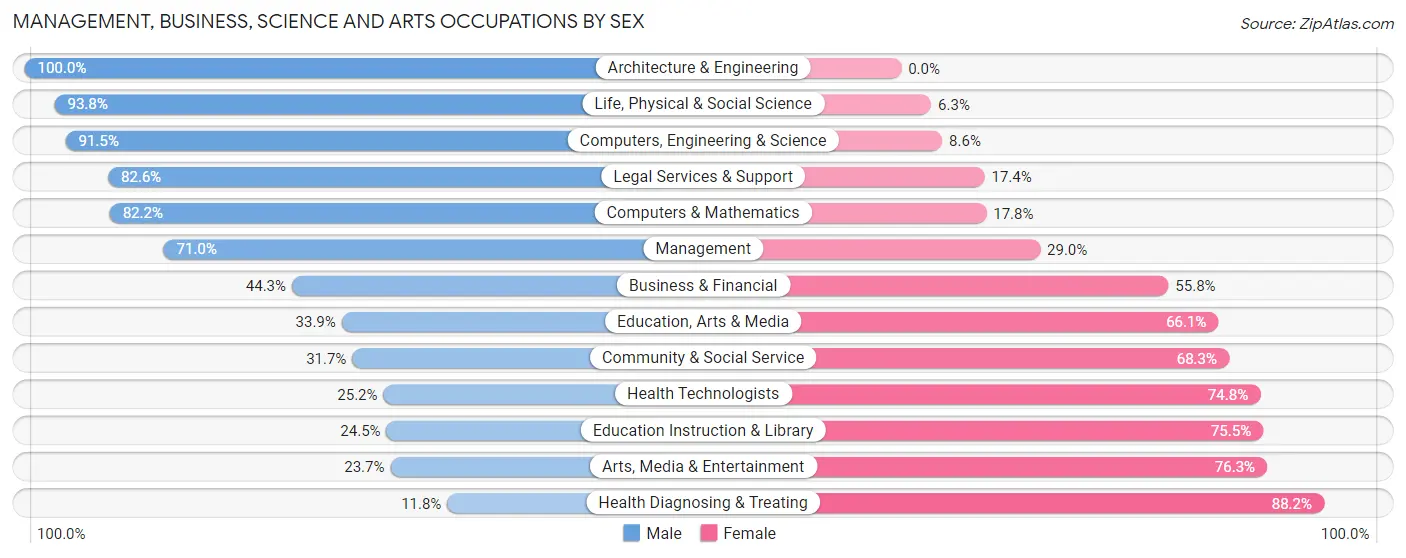
| Occupation | Male | Female |
| Management | 696 (71.0%) | 284 (29.0%) |
| Business & Financial | 150 (44.3%) | 189 (55.7%) |
| Computers, Engineering & Science | 214 (91.4%) | 20 (8.6%) |
| Computers & Mathematics | 88 (82.2%) | 19 (17.8%) |
| Architecture & Engineering | 111 (100.0%) | 0 (0.0%) |
| Life, Physical & Social Science | 15 (93.8%) | 1 (6.2%) |
| Community & Social Service | 278 (31.7%) | 600 (68.3%) |
| Education, Arts & Media | 42 (33.9%) | 82 (66.1%) |
| Legal Services & Support | 76 (82.6%) | 16 (17.4%) |
| Education Instruction & Library | 91 (24.5%) | 280 (75.5%) |
| Arts, Media & Entertainment | 69 (23.7%) | 222 (76.3%) |
| Health Diagnosing & Treating | 49 (11.8%) | 365 (88.2%) |
| Health Technologists | 40 (25.2%) | 119 (74.8%) |
| Total (Category) | 1,387 (48.7%) | 1,458 (51.2%) |
| Total (Overall) | 4,269 (52.0%) | 3,942 (48.0%) |
Services Occupations
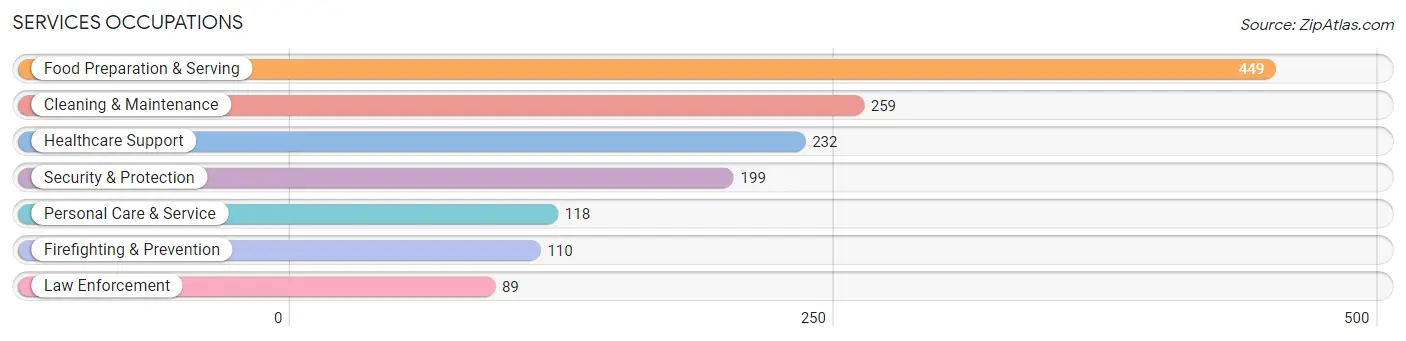
The most common Services occupations in Llano County are Food Preparation & Serving (449 | 5.5%), Cleaning & Maintenance (259 | 3.2%), Healthcare Support (232 | 2.8%), Security & Protection (199 | 2.4%), and Personal Care & Service (118 | 1.4%).
Services Occupations by Sex
Within the Services occupations in Llano County, the most male-oriented occupations are Law Enforcement (76.4%), Security & Protection (63.3%), and Personal Care & Service (56.8%), while the most female-oriented occupations are Healthcare Support (95.7%), Food Preparation & Serving (67.9%), and Cleaning & Maintenance (59.1%).
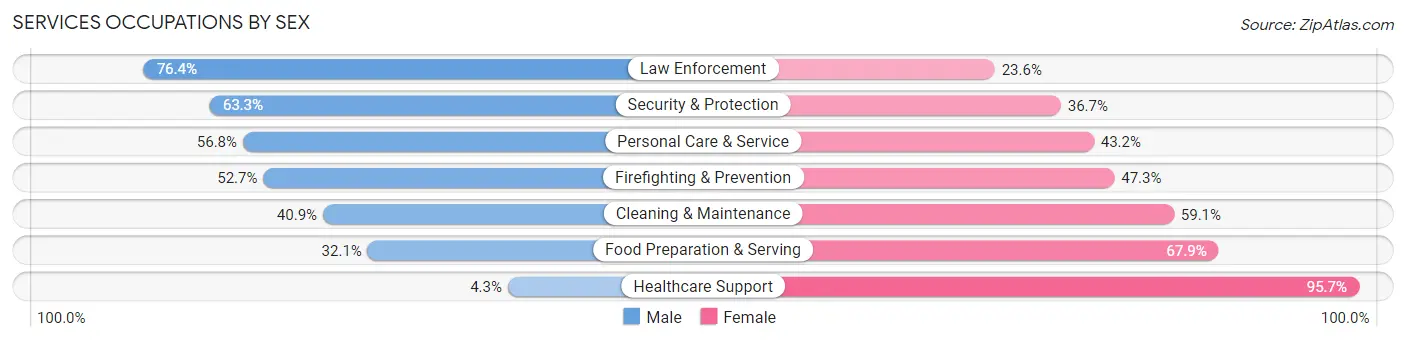
| Occupation | Male | Female |
| Healthcare Support | 10 (4.3%) | 222 (95.7%) |
| Security & Protection | 126 (63.3%) | 73 (36.7%) |
| Firefighting & Prevention | 58 (52.7%) | 52 (47.3%) |
| Law Enforcement | 68 (76.4%) | 21 (23.6%) |
| Food Preparation & Serving | 144 (32.1%) | 305 (67.9%) |
| Cleaning & Maintenance | 106 (40.9%) | 153 (59.1%) |
| Personal Care & Service | 67 (56.8%) | 51 (43.2%) |
| Total (Category) | 453 (36.0%) | 804 (64.0%) |
| Total (Overall) | 4,269 (52.0%) | 3,942 (48.0%) |
Sales and Office Occupations
The most common Sales and Office occupations in Llano County are Office & Administration (1,142 | 13.9%), and Sales & Related (962 | 11.7%).

Sales and Office Occupations by Sex

| Occupation | Male | Female |
| Sales & Related | 521 (54.2%) | 441 (45.8%) |
| Office & Administration | 252 (22.1%) | 890 (77.9%) |
| Total (Category) | 773 (36.7%) | 1,331 (63.3%) |
| Total (Overall) | 4,269 (52.0%) | 3,942 (48.0%) |
Natural Resources, Construction and Maintenance Occupations
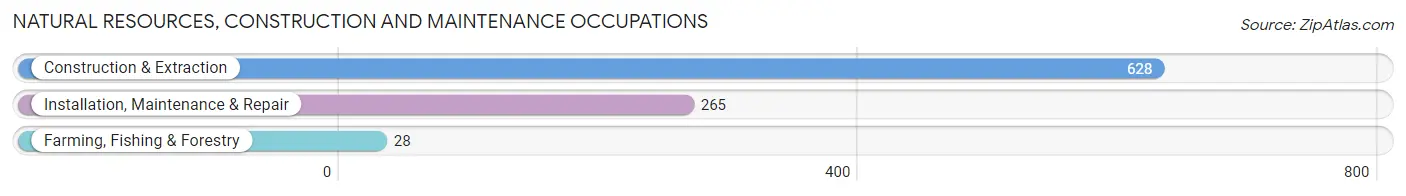
The most common Natural Resources, Construction and Maintenance occupations in Llano County are Construction & Extraction (628 | 7.6%), Installation, Maintenance & Repair (265 | 3.2%), and Farming, Fishing & Forestry (28 | 0.3%).
Natural Resources, Construction and Maintenance Occupations by Sex

| Occupation | Male | Female |
| Farming, Fishing & Forestry | 28 (100.0%) | 0 (0.0%) |
| Construction & Extraction | 612 (97.5%) | 16 (2.5%) |
| Installation, Maintenance & Repair | 265 (100.0%) | 0 (0.0%) |
| Total (Category) | 905 (98.3%) | 16 (1.7%) |
| Total (Overall) | 4,269 (52.0%) | 3,942 (48.0%) |
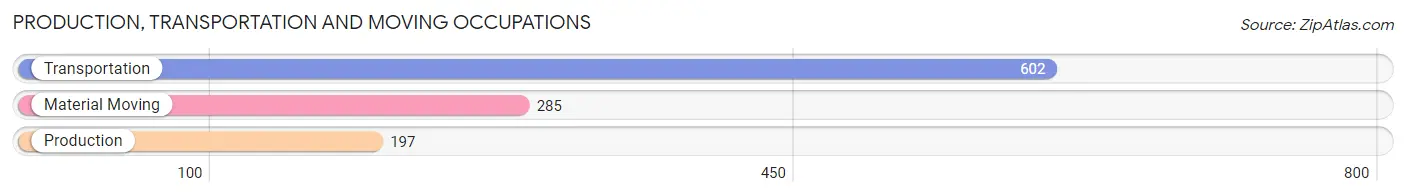
Production, Transportation and Moving Occupations
The most common Production, Transportation and Moving occupations in Llano County are Transportation (602 | 7.3%), Material Moving (285 | 3.5%), and Production (197 | 2.4%).
Production, Transportation and Moving Occupations by Sex
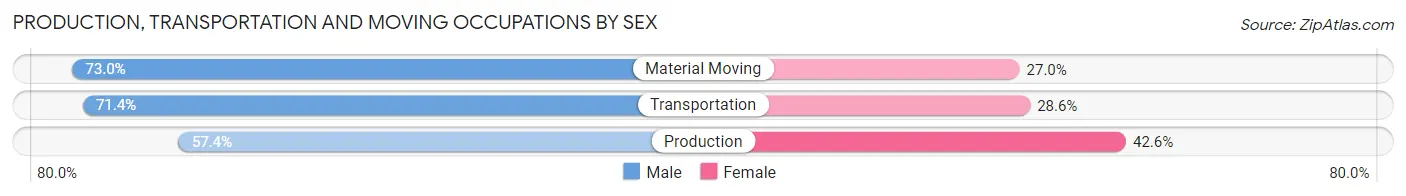
| Occupation | Male | Female |
| Production | 113 (57.4%) | 84 (42.6%) |
| Transportation | 430 (71.4%) | 172 (28.6%) |
| Material Moving | 208 (73.0%) | 77 (27.0%) |
| Total (Category) | 751 (69.3%) | 333 (30.7%) |
| Total (Overall) | 4,269 (52.0%) | 3,942 (48.0%) |
Employment Industries by Sex in Llano County
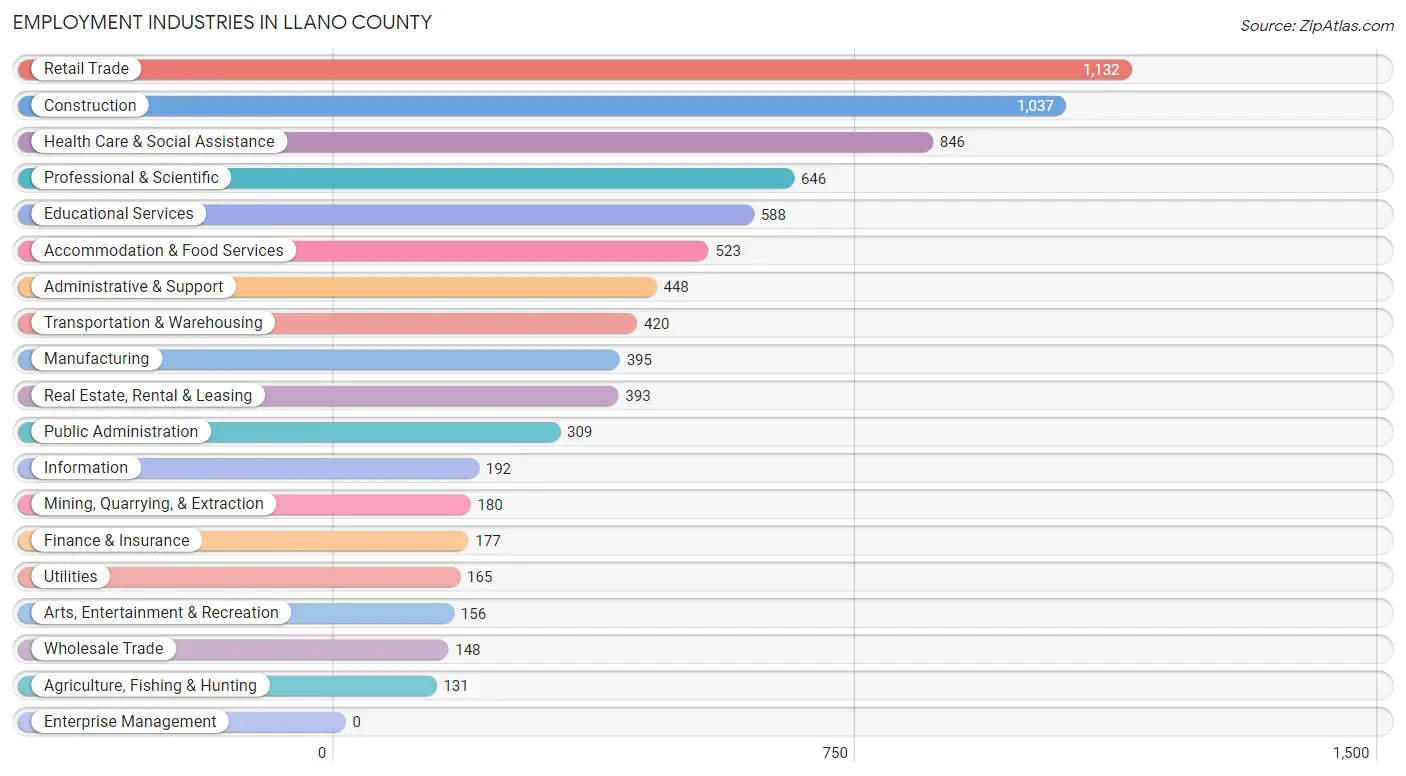
Employment Industries in Llano County
The major employment industries in Llano County include Retail Trade (1,132 | 13.8%), Construction (1,037 | 12.6%), Health Care & Social Assistance (846 | 10.3%), Professional & Scientific (646 | 7.9%), and Educational Services (588 | 7.2%).
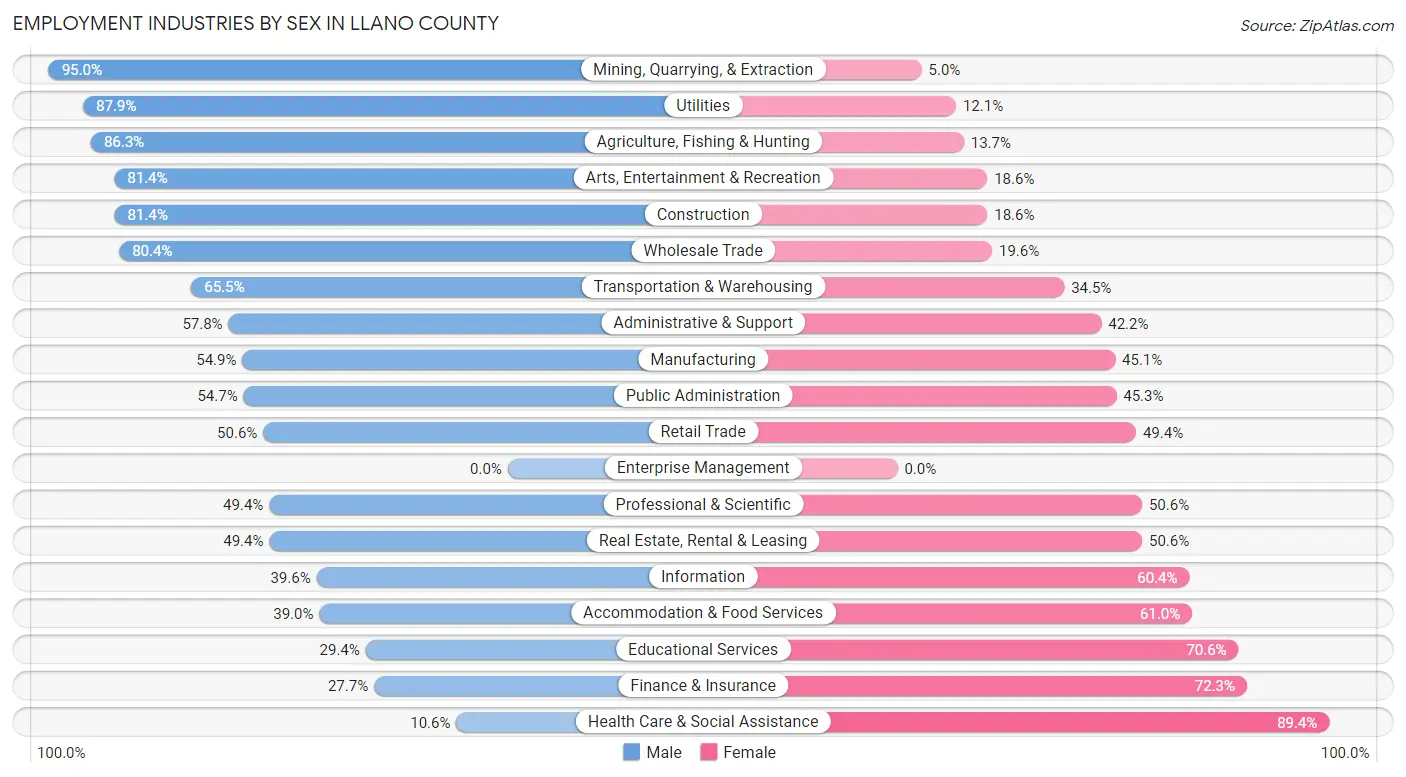
Employment Industries by Sex in Llano County
The Llano County industries that see more men than women are Mining, Quarrying, & Extraction (95.0%), Utilities (87.9%), and Agriculture, Fishing & Hunting (86.3%), whereas the industries that tend to have a higher number of women are Health Care & Social Assistance (89.4%), Finance & Insurance (72.3%), and Educational Services (70.6%).
| Industry | Male | Female |
| Agriculture, Fishing & Hunting | 113 (86.3%) | 18 (13.7%) |
| Mining, Quarrying, & Extraction | 171 (95.0%) | 9 (5.0%) |
| Construction | 844 (81.4%) | 193 (18.6%) |
| Manufacturing | 217 (54.9%) | 178 (45.1%) |
| Wholesale Trade | 119 (80.4%) | 29 (19.6%) |
| Retail Trade | 573 (50.6%) | 559 (49.4%) |
| Transportation & Warehousing | 275 (65.5%) | 145 (34.5%) |
| Utilities | 145 (87.9%) | 20 (12.1%) |
| Information | 76 (39.6%) | 116 (60.4%) |
| Finance & Insurance | 49 (27.7%) | 128 (72.3%) |
| Real Estate, Rental & Leasing | 194 (49.4%) | 199 (50.6%) |
| Professional & Scientific | 319 (49.4%) | 327 (50.6%) |
| Enterprise Management | 0 (0.0%) | 0 (0.0%) |
| Administrative & Support | 259 (57.8%) | 189 (42.2%) |
| Educational Services | 173 (29.4%) | 415 (70.6%) |
| Health Care & Social Assistance | 90 (10.6%) | 756 (89.4%) |
| Arts, Entertainment & Recreation | 127 (81.4%) | 29 (18.6%) |
| Accommodation & Food Services | 204 (39.0%) | 319 (61.0%) |
| Public Administration | 169 (54.7%) | 140 (45.3%) |
| Total | 4,269 (52.0%) | 3,942 (48.0%) |
Education in Llano County
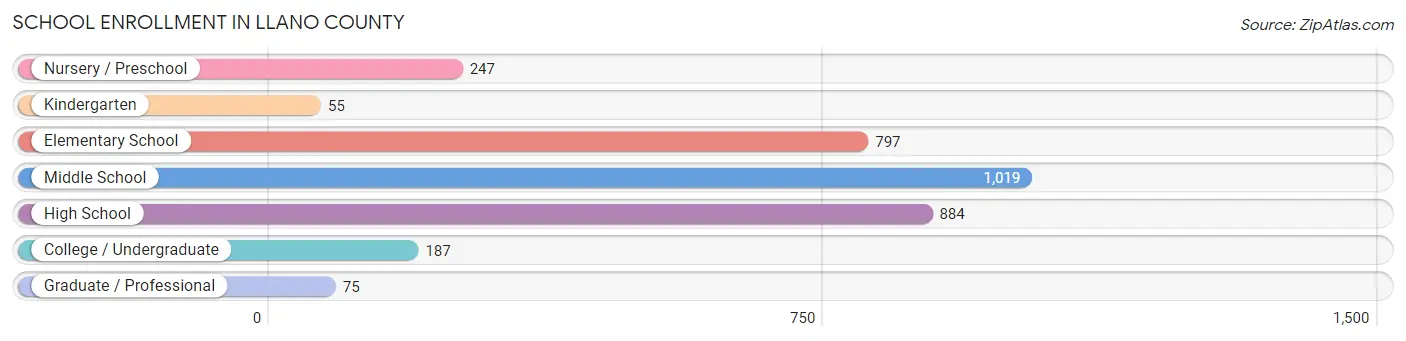
School Enrollment in Llano County
The most common levels of schooling among the 3,264 students in Llano County are middle school (1,019 | 31.2%), high school (884 | 27.1%), and elementary school (797 | 24.4%).
| School Level | # Students | % Students |
| Nursery / Preschool | 247 | 7.6% |
| Kindergarten | 55 | 1.7% |
| Elementary School | 797 | 24.4% |
| Middle School | 1,019 | 31.2% |
| High School | 884 | 27.1% |
| College / Undergraduate | 187 | 5.7% |
| Graduate / Professional | 75 | 2.3% |
| Total | 3,264 | 100.0% |
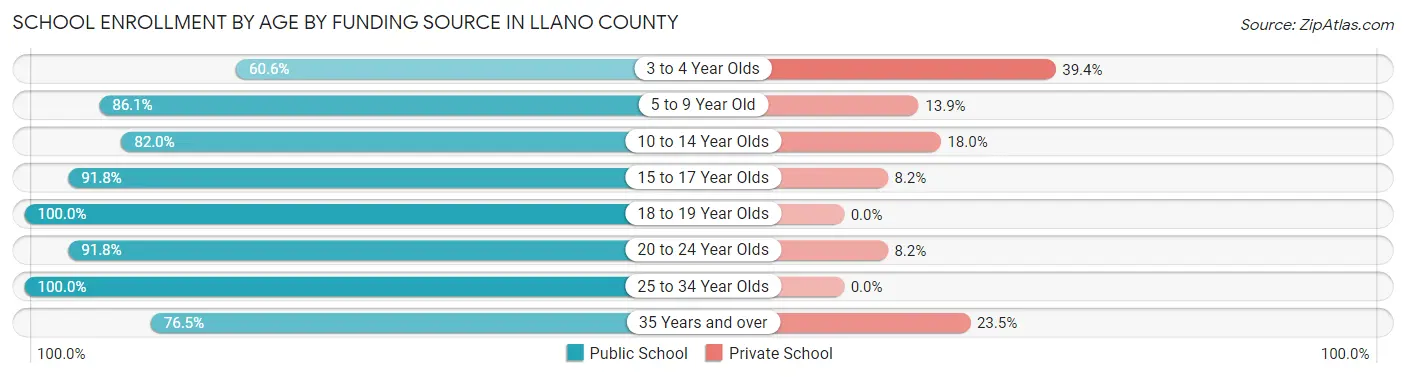
School Enrollment by Age by Funding Source in Llano County
Out of a total of 3,264 students who are enrolled in schools in Llano County, 512 (15.7%) attend a private institution, while the remaining 2,752 (84.3%) are enrolled in public schools. The age group of 3 to 4 year olds has the highest likelihood of being enrolled in private schools, with 80 (39.4% in the age bracket) enrolled. Conversely, the age group of 18 to 19 year olds has the lowest likelihood of being enrolled in a private school, with 94 (100.0% in the age bracket) attending a public institution.
| Age Bracket | Public School | Private School |
| 3 to 4 Year Olds | 123 (60.6%) | 80 (39.4%) |
| 5 to 9 Year Old | 705 (86.1%) | 114 (13.9%) |
| 10 to 14 Year Olds | 1,055 (82.0%) | 232 (18.0%) |
| 15 to 17 Year Olds | 528 (91.8%) | 47 (8.2%) |
| 18 to 19 Year Olds | 94 (100.0%) | 0 (0.0%) |
| 20 to 24 Year Olds | 45 (91.8%) | 4 (8.2%) |
| 25 to 34 Year Olds | 84 (100.0%) | 0 (0.0%) |
| 35 Years and over | 117 (76.5%) | 36 (23.5%) |
| Total | 2,752 (84.3%) | 512 (15.7%) |
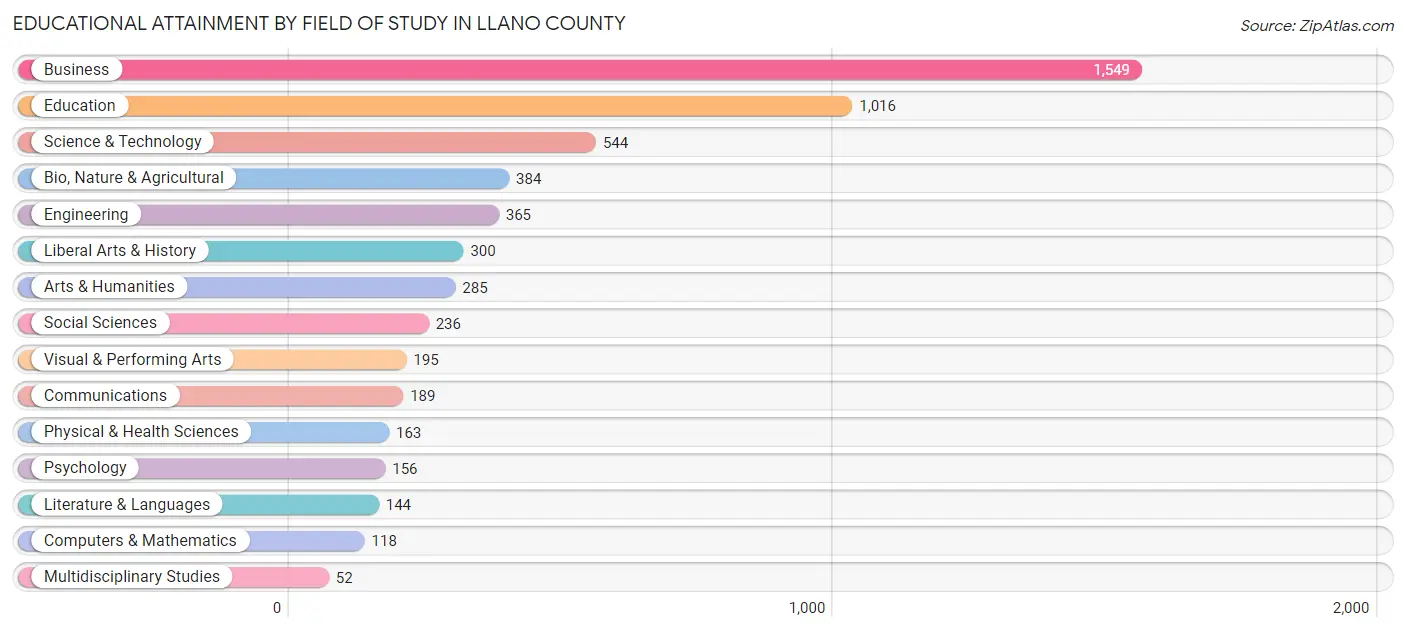
Educational Attainment by Field of Study in Llano County
Business (1,549 | 27.2%), education (1,016 | 17.8%), science & technology (544 | 9.6%), bio, nature & agricultural (384 | 6.7%), and engineering (365 | 6.4%) are the most common fields of study among 5,696 individuals in Llano County who have obtained a bachelor's degree or higher.
| Field of Study | # Graduates | % Graduates |
| Computers & Mathematics | 118 | 2.1% |
| Bio, Nature & Agricultural | 384 | 6.7% |
| Physical & Health Sciences | 163 | 2.9% |
| Psychology | 156 | 2.7% |
| Social Sciences | 236 | 4.1% |
| Engineering | 365 | 6.4% |
| Multidisciplinary Studies | 52 | 0.9% |
| Science & Technology | 544 | 9.6% |
| Business | 1,549 | 27.2% |
| Education | 1,016 | 17.8% |
| Literature & Languages | 144 | 2.5% |
| Liberal Arts & History | 300 | 5.3% |
| Visual & Performing Arts | 195 | 3.4% |
| Communications | 189 | 3.3% |
| Arts & Humanities | 285 | 5.0% |
| Total | 5,696 | 100.0% |
Transportation & Commute in Llano County
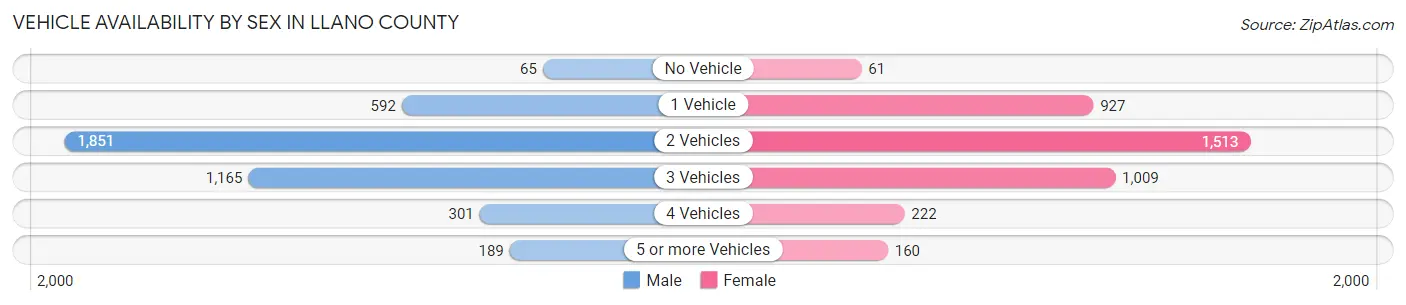
Vehicle Availability by Sex in Llano County
The most prevalent vehicle ownership categories in Llano County are males with 2 vehicles (1,851, accounting for 44.5%) and females with 2 vehicles (1,513, making up 47.6%).
| Vehicles Available | Male | Female |
| No Vehicle | 65 (1.6%) | 61 (1.6%) |
| 1 Vehicle | 592 (14.2%) | 927 (23.8%) |
| 2 Vehicles | 1,851 (44.5%) | 1,513 (38.9%) |
| 3 Vehicles | 1,165 (28.0%) | 1,009 (25.9%) |
| 4 Vehicles | 301 (7.2%) | 222 (5.7%) |
| 5 or more Vehicles | 189 (4.5%) | 160 (4.1%) |
| Total | 4,163 (100.0%) | 3,892 (100.0%) |
Commute Time in Llano County
The most frequently occuring commute durations in Llano County are 30 to 34 minutes (1,142 commuters, 16.1%), 5 to 9 minutes (1,040 commuters, 14.6%), and 20 to 24 minutes (887 commuters, 12.5%).
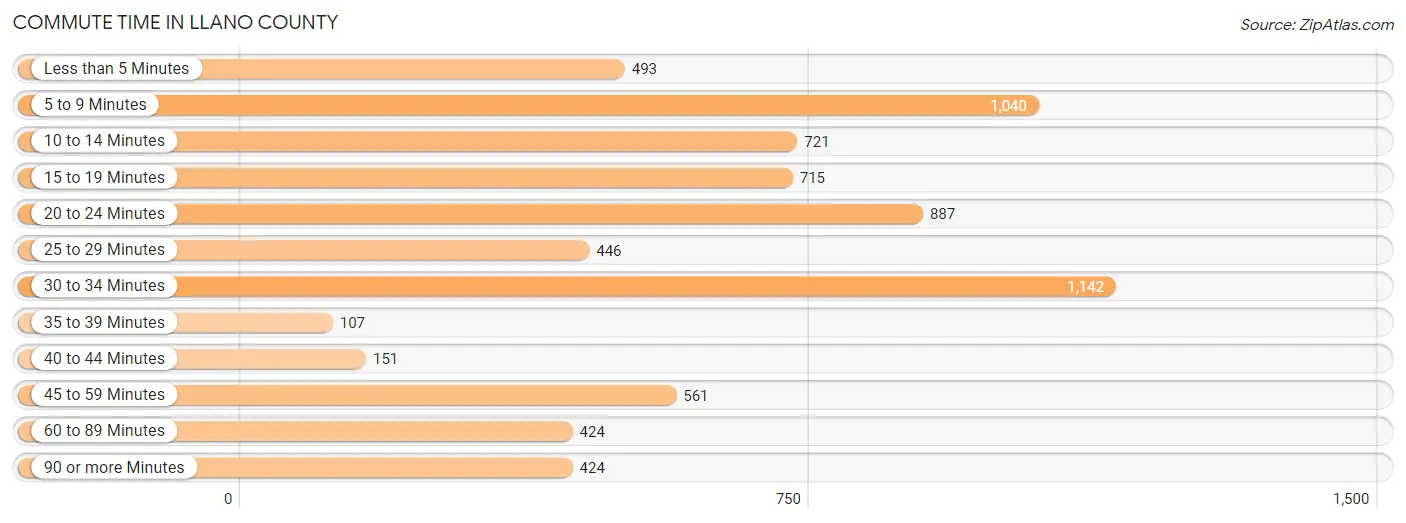
| Commute Time | # Commuters | % Commuters |
| Less than 5 Minutes | 493 | 6.9% |
| 5 to 9 Minutes | 1,040 | 14.6% |
| 10 to 14 Minutes | 721 | 10.1% |
| 15 to 19 Minutes | 715 | 10.1% |
| 20 to 24 Minutes | 887 | 12.5% |
| 25 to 29 Minutes | 446 | 6.3% |
| 30 to 34 Minutes | 1,142 | 16.1% |
| 35 to 39 Minutes | 107 | 1.5% |
| 40 to 44 Minutes | 151 | 2.1% |
| 45 to 59 Minutes | 561 | 7.9% |
| 60 to 89 Minutes | 424 | 6.0% |
| 90 or more Minutes | 424 | 6.0% |
Commute Time by Sex in Llano County
The most common commute times in Llano County are 30 to 34 minutes (585 commuters, 16.1%) for males and 5 to 9 minutes (596 commuters, 17.1%) for females.
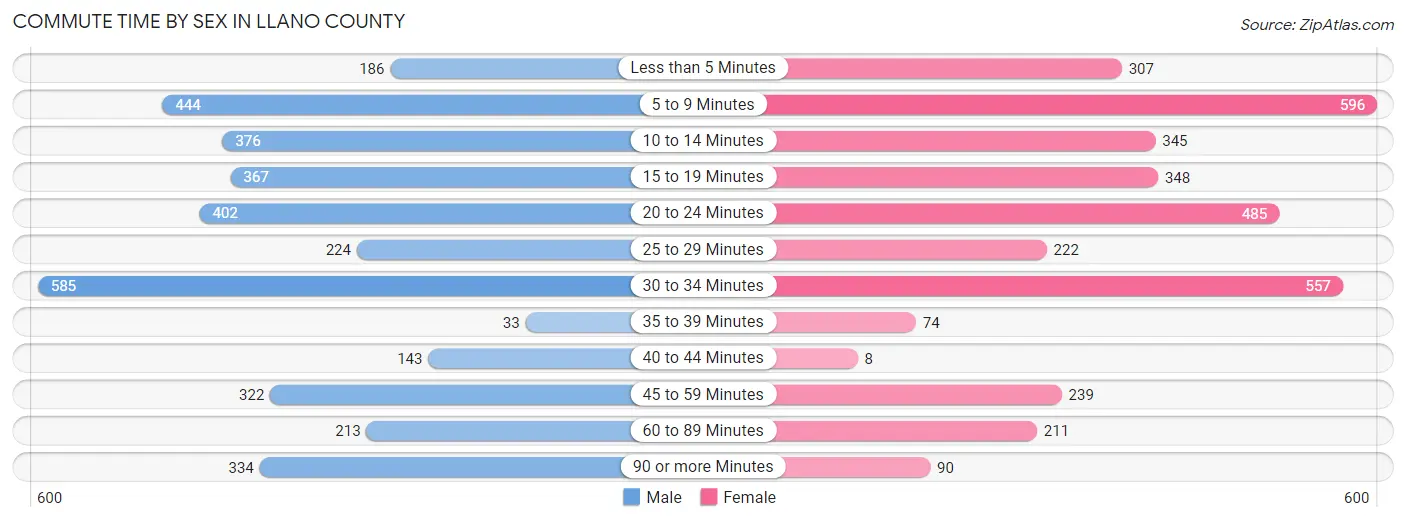
| Commute Time | Male | Female |
| Less than 5 Minutes | 186 (5.1%) | 307 (8.8%) |
| 5 to 9 Minutes | 444 (12.2%) | 596 (17.1%) |
| 10 to 14 Minutes | 376 (10.4%) | 345 (9.9%) |
| 15 to 19 Minutes | 367 (10.1%) | 348 (10.0%) |
| 20 to 24 Minutes | 402 (11.1%) | 485 (13.9%) |
| 25 to 29 Minutes | 224 (6.2%) | 222 (6.4%) |
| 30 to 34 Minutes | 585 (16.1%) | 557 (16.0%) |
| 35 to 39 Minutes | 33 (0.9%) | 74 (2.1%) |
| 40 to 44 Minutes | 143 (3.9%) | 8 (0.2%) |
| 45 to 59 Minutes | 322 (8.9%) | 239 (6.9%) |
| 60 to 89 Minutes | 213 (5.9%) | 211 (6.1%) |
| 90 or more Minutes | 334 (9.2%) | 90 (2.6%) |
Time of Departure to Work by Sex in Llano County
The most frequent times of departure to work in Llano County are 6:30 AM to 6:59 AM (525, 14.5%) for males and 7:00 AM to 7:29 AM (762, 21.9%) for females.
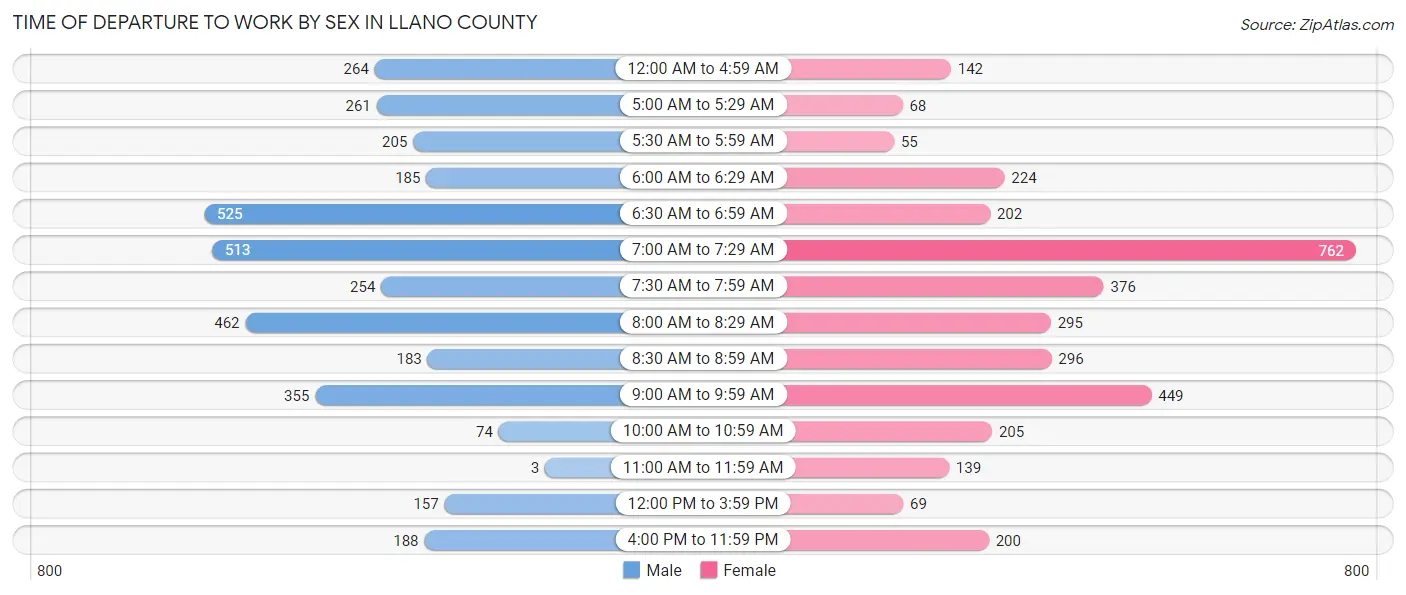
| Time of Departure | Male | Female |
| 12:00 AM to 4:59 AM | 264 (7.3%) | 142 (4.1%) |
| 5:00 AM to 5:29 AM | 261 (7.2%) | 68 (1.9%) |
| 5:30 AM to 5:59 AM | 205 (5.7%) | 55 (1.6%) |
| 6:00 AM to 6:29 AM | 185 (5.1%) | 224 (6.4%) |
| 6:30 AM to 6:59 AM | 525 (14.5%) | 202 (5.8%) |
| 7:00 AM to 7:29 AM | 513 (14.1%) | 762 (21.9%) |
| 7:30 AM to 7:59 AM | 254 (7.0%) | 376 (10.8%) |
| 8:00 AM to 8:29 AM | 462 (12.7%) | 295 (8.5%) |
| 8:30 AM to 8:59 AM | 183 (5.0%) | 296 (8.5%) |
| 9:00 AM to 9:59 AM | 355 (9.8%) | 449 (12.9%) |
| 10:00 AM to 10:59 AM | 74 (2.0%) | 205 (5.9%) |
| 11:00 AM to 11:59 AM | 3 (0.1%) | 139 (4.0%) |
| 12:00 PM to 3:59 PM | 157 (4.3%) | 69 (2.0%) |
| 4:00 PM to 11:59 PM | 188 (5.2%) | 200 (5.7%) |
| Total | 3,629 (100.0%) | 3,482 (100.0%) |
Housing Occupancy in Llano County
Occupancy by Ownership in Llano County
Of the total 9,612 dwellings in Llano County, owner-occupied units account for 7,579 (78.8%), while renter-occupied units make up 2,033 (21.1%).
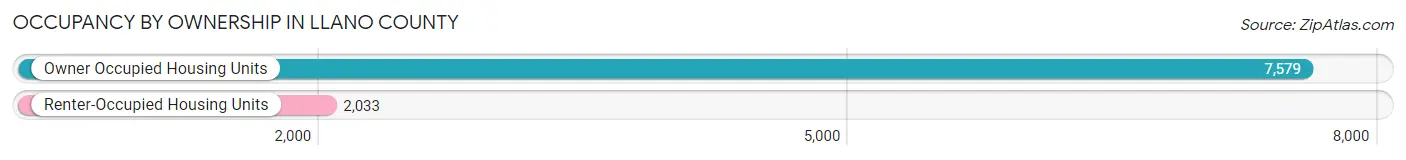
| Occupancy | # Housing Units | % Housing Units |
| Owner Occupied Housing Units | 7,579 | 78.8% |
| Renter-Occupied Housing Units | 2,033 | 21.1% |
| Total Occupied Housing Units | 9,612 | 100.0% |
Occupancy by Household Size in Llano County
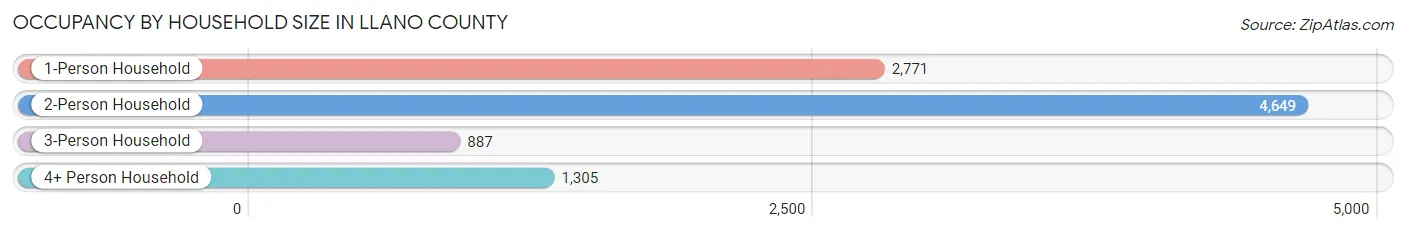
| Household Size | # Housing Units | % Housing Units |
| 1-Person Household | 2,771 | 28.8% |
| 2-Person Household | 4,649 | 48.4% |
| 3-Person Household | 887 | 9.2% |
| 4+ Person Household | 1,305 | 13.6% |
| Total Housing Units | 9,612 | 100.0% |
Occupancy by Ownership by Household Size in Llano County
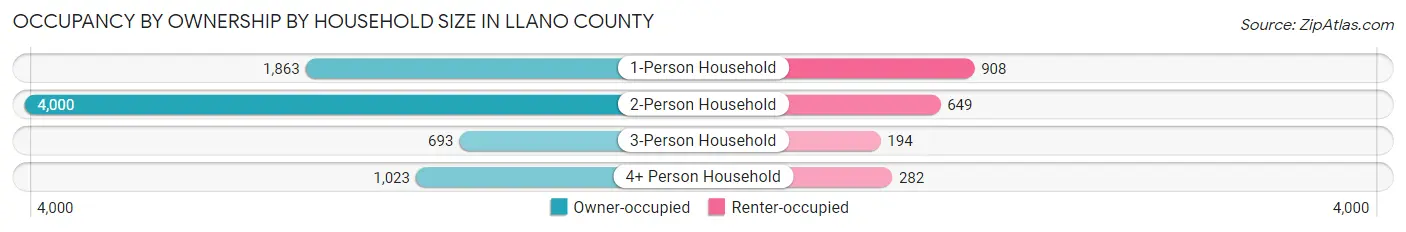
| Household Size | Owner-occupied | Renter-occupied |
| 1-Person Household | 1,863 (67.2%) | 908 (32.8%) |
| 2-Person Household | 4,000 (86.0%) | 649 (14.0%) |
| 3-Person Household | 693 (78.1%) | 194 (21.9%) |
| 4+ Person Household | 1,023 (78.4%) | 282 (21.6%) |
| Total Housing Units | 7,579 (78.8%) | 2,033 (21.1%) |
Occupancy by Educational Attainment in Llano County
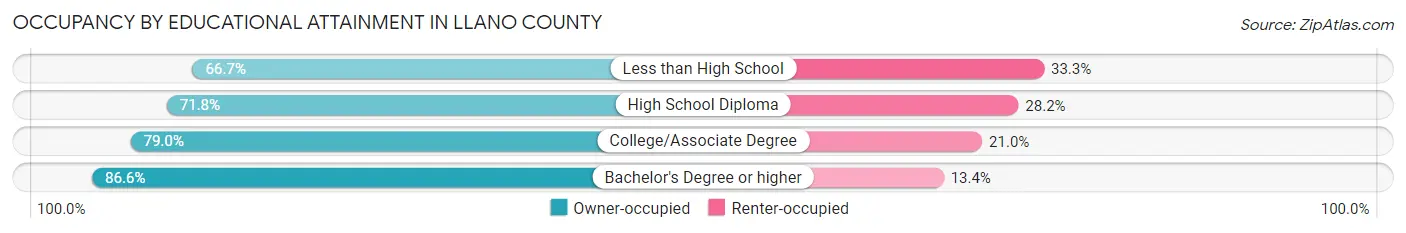
| Household Size | Owner-occupied | Renter-occupied |
| Less than High School | 571 (66.7%) | 285 (33.3%) |
| High School Diploma | 1,507 (71.8%) | 592 (28.2%) |
| College/Associate Degree | 2,745 (79.0%) | 730 (21.0%) |
| Bachelor's Degree or higher | 2,756 (86.6%) | 426 (13.4%) |
Occupancy by Age of Householder in Llano County
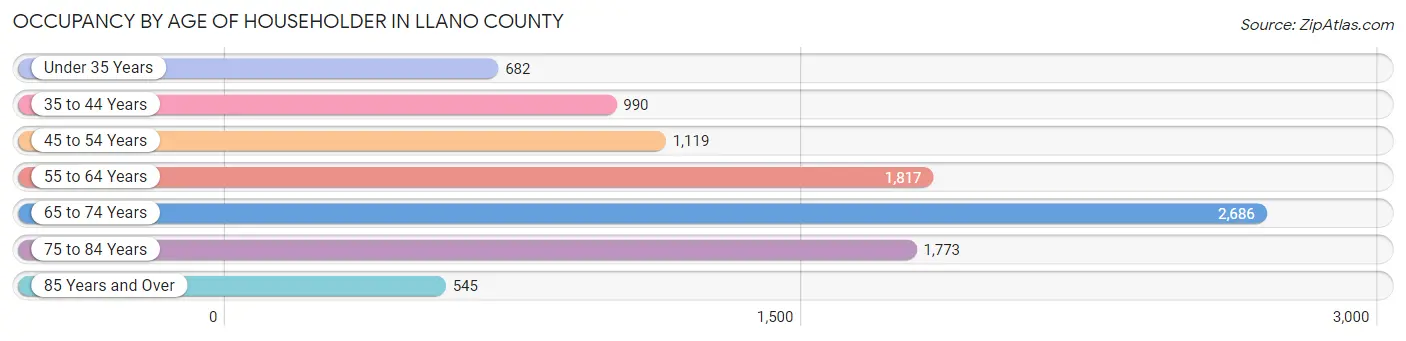
| Age Bracket | # Households | % Households |
| Under 35 Years | 682 | 7.1% |
| 35 to 44 Years | 990 | 10.3% |
| 45 to 54 Years | 1,119 | 11.6% |
| 55 to 64 Years | 1,817 | 18.9% |
| 65 to 74 Years | 2,686 | 27.9% |
| 75 to 84 Years | 1,773 | 18.4% |
| 85 Years and Over | 545 | 5.7% |
| Total | 9,612 | 100.0% |
Housing Finances in Llano County
Median Income by Occupancy in Llano County
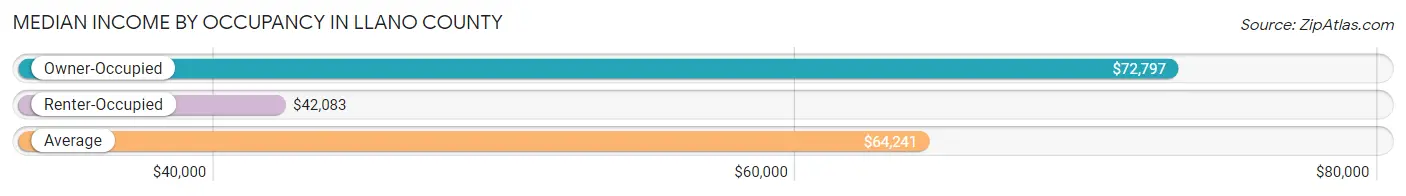
| Occupancy Type | # Households | Median Income |
| Owner-Occupied | 7,579 (78.8%) | $72,797 |
| Renter-Occupied | 2,033 (21.1%) | $42,083 |
| Average | 9,612 (100.0%) | $64,241 |
Occupancy by Householder Income Bracket in Llano County
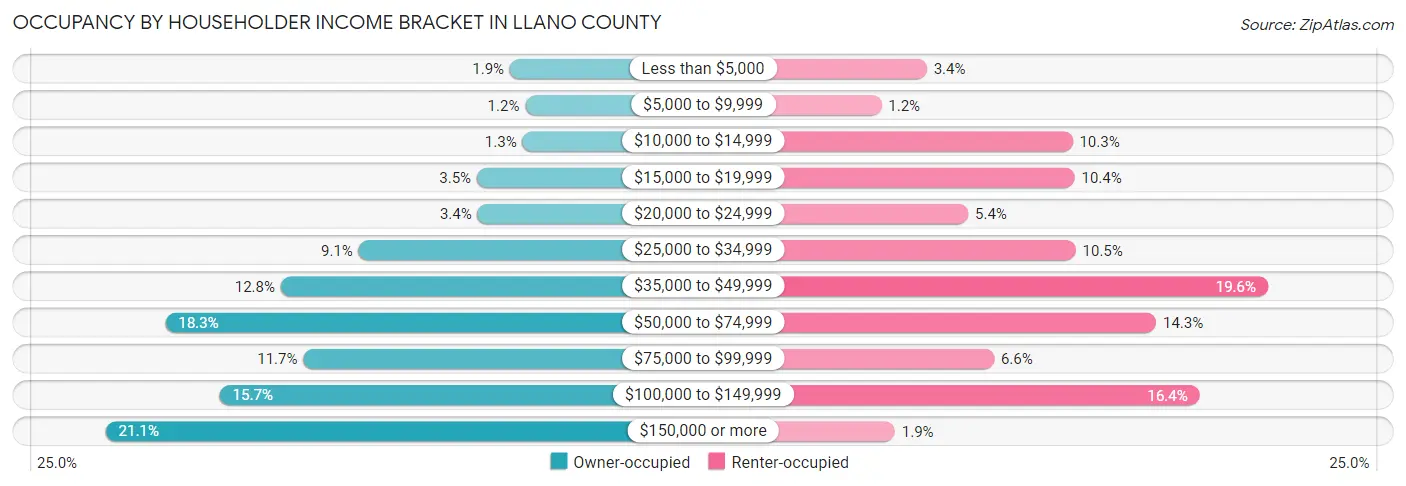
| Income Bracket | Owner-occupied | Renter-occupied |
| Less than $5,000 | 143 (1.9%) | 69 (3.4%) |
| $5,000 to $9,999 | 88 (1.2%) | 25 (1.2%) |
| $10,000 to $14,999 | 98 (1.3%) | 210 (10.3%) |
| $15,000 to $19,999 | 262 (3.5%) | 212 (10.4%) |
| $20,000 to $24,999 | 260 (3.4%) | 109 (5.4%) |
| $25,000 to $34,999 | 689 (9.1%) | 213 (10.5%) |
| $35,000 to $49,999 | 970 (12.8%) | 399 (19.6%) |
| $50,000 to $74,999 | 1,387 (18.3%) | 291 (14.3%) |
| $75,000 to $99,999 | 889 (11.7%) | 134 (6.6%) |
| $100,000 to $149,999 | 1,191 (15.7%) | 333 (16.4%) |
| $150,000 or more | 1,602 (21.1%) | 38 (1.9%) |
| Total | 7,579 (100.0%) | 2,033 (100.0%) |
Monthly Housing Cost Tiers in Llano County
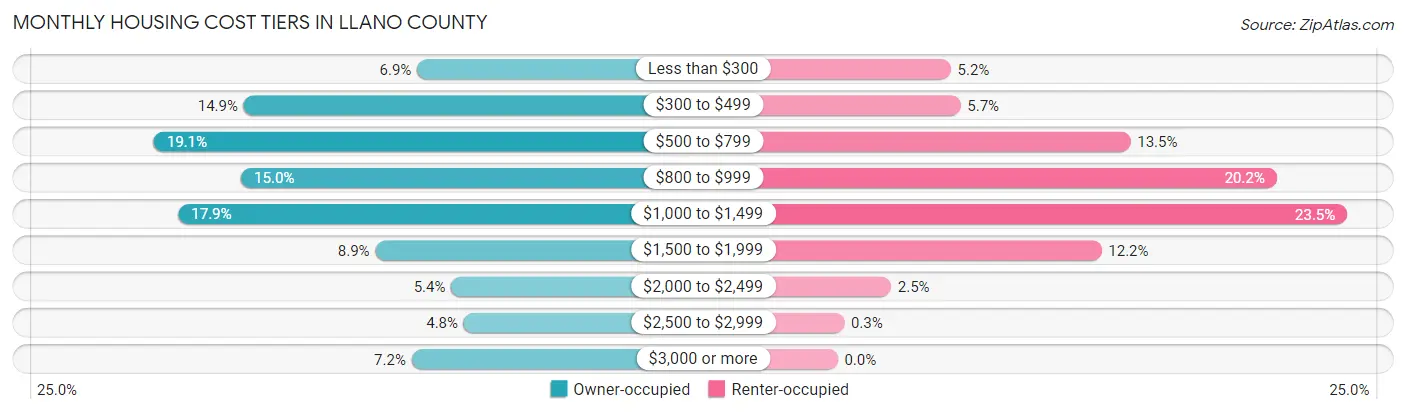
| Monthly Cost | Owner-occupied | Renter-occupied |
| Less than $300 | 525 (6.9%) | 106 (5.2%) |
| $300 to $499 | 1,130 (14.9%) | 115 (5.7%) |
| $500 to $799 | 1,444 (19.1%) | 274 (13.5%) |
| $800 to $999 | 1,139 (15.0%) | 411 (20.2%) |
| $1,000 to $1,499 | 1,358 (17.9%) | 477 (23.5%) |
| $1,500 to $1,999 | 671 (8.8%) | 247 (12.1%) |
| $2,000 to $2,499 | 406 (5.4%) | 50 (2.5%) |
| $2,500 to $2,999 | 362 (4.8%) | 6 (0.3%) |
| $3,000 or more | 544 (7.2%) | 0 (0.0%) |
| Total | 7,579 (100.0%) | 2,033 (100.0%) |
Physical Housing Characteristics in Llano County
Housing Structures in Llano County
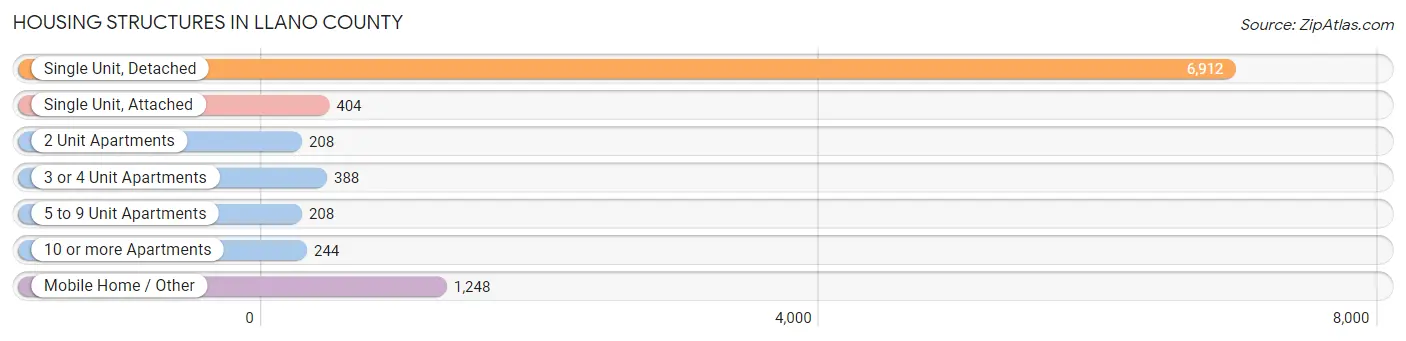
| Structure Type | # Housing Units | % Housing Units |
| Single Unit, Detached | 6,912 | 71.9% |
| Single Unit, Attached | 404 | 4.2% |
| 2 Unit Apartments | 208 | 2.2% |
| 3 or 4 Unit Apartments | 388 | 4.0% |
| 5 to 9 Unit Apartments | 208 | 2.2% |
| 10 or more Apartments | 244 | 2.5% |
| Mobile Home / Other | 1,248 | 13.0% |
| Total | 9,612 | 100.0% |
Housing Structures by Occupancy in Llano County
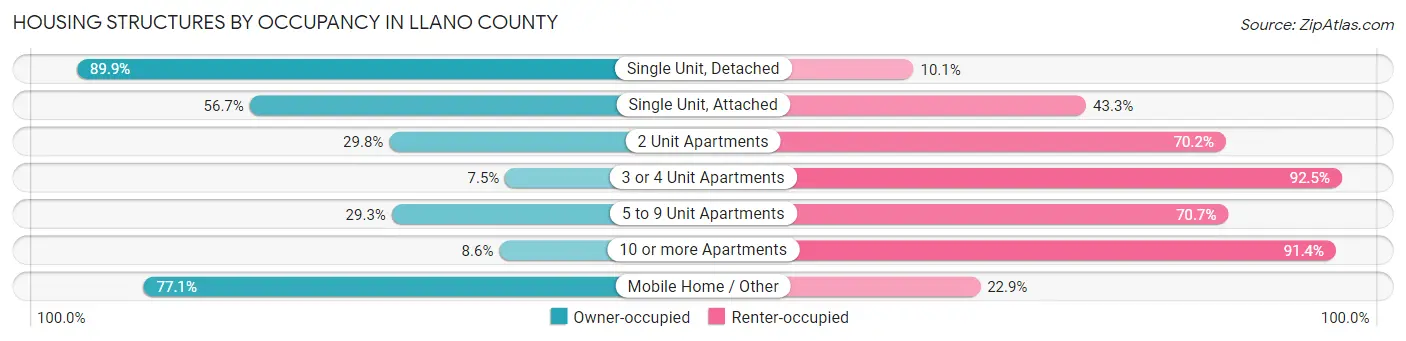
| Structure Type | Owner-occupied | Renter-occupied |
| Single Unit, Detached | 6,215 (89.9%) | 697 (10.1%) |
| Single Unit, Attached | 229 (56.7%) | 175 (43.3%) |
| 2 Unit Apartments | 62 (29.8%) | 146 (70.2%) |
| 3 or 4 Unit Apartments | 29 (7.5%) | 359 (92.5%) |
| 5 to 9 Unit Apartments | 61 (29.3%) | 147 (70.7%) |
| 10 or more Apartments | 21 (8.6%) | 223 (91.4%) |
| Mobile Home / Other | 962 (77.1%) | 286 (22.9%) |
| Total | 7,579 (78.8%) | 2,033 (21.1%) |
Housing Structures by Number of Rooms in Llano County
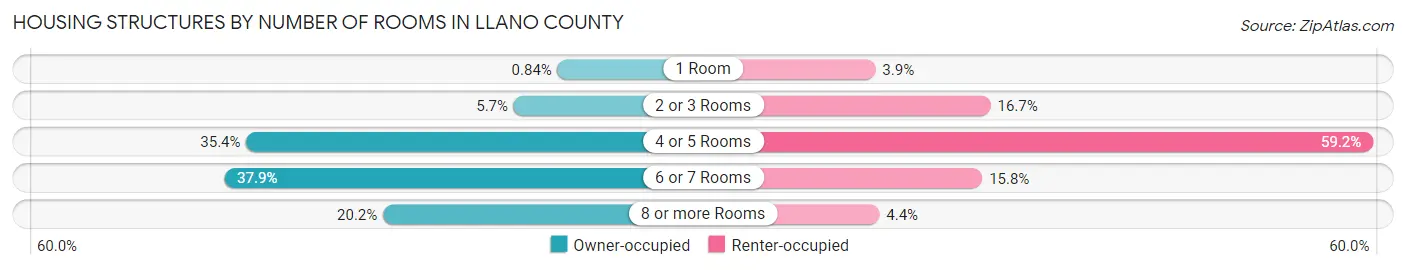
| Number of Rooms | Owner-occupied | Renter-occupied |
| 1 Room | 64 (0.8%) | 80 (3.9%) |
| 2 or 3 Rooms | 432 (5.7%) | 340 (16.7%) |
| 4 or 5 Rooms | 2,682 (35.4%) | 1,203 (59.2%) |
| 6 or 7 Rooms | 2,869 (37.9%) | 321 (15.8%) |
| 8 or more Rooms | 1,532 (20.2%) | 89 (4.4%) |
| Total | 7,579 (100.0%) | 2,033 (100.0%) |
Housing Structure by Heating Type in Llano County
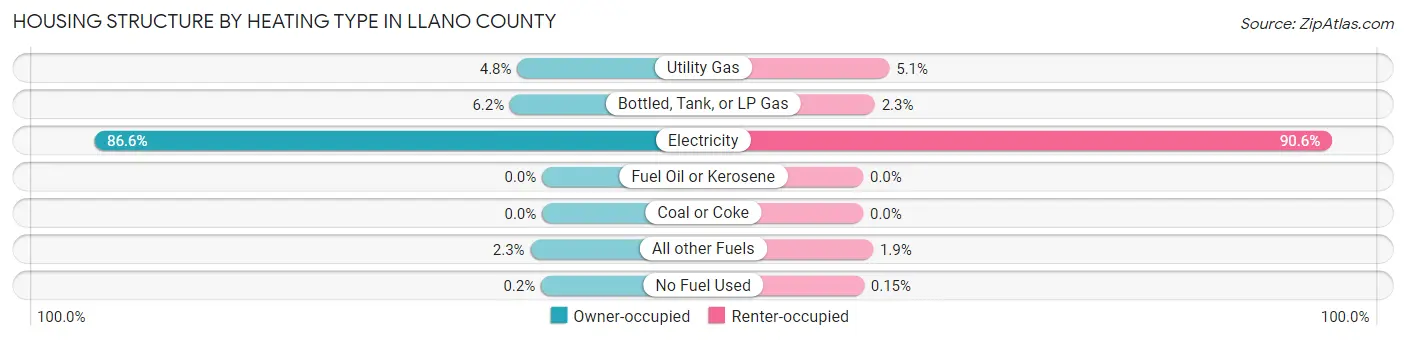
| Heating Type | Owner-occupied | Renter-occupied |
| Utility Gas | 362 (4.8%) | 103 (5.1%) |
| Bottled, Tank, or LP Gas | 469 (6.2%) | 46 (2.3%) |
| Electricity | 6,562 (86.6%) | 1,842 (90.6%) |
| Fuel Oil or Kerosene | 0 (0.0%) | 0 (0.0%) |
| Coal or Coke | 0 (0.0%) | 0 (0.0%) |
| All other Fuels | 171 (2.3%) | 39 (1.9%) |
| No Fuel Used | 15 (0.2%) | 3 (0.2%) |
| Total | 7,579 (100.0%) | 2,033 (100.0%) |
Household Vehicle Usage in Llano County
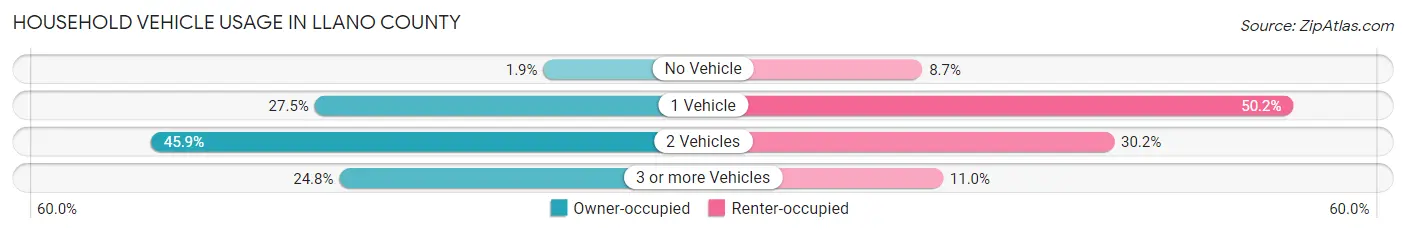
| Vehicles per Household | Owner-occupied | Renter-occupied |
| No Vehicle | 143 (1.9%) | 176 (8.7%) |
| 1 Vehicle | 2,085 (27.5%) | 1,021 (50.2%) |
| 2 Vehicles | 3,475 (45.9%) | 613 (30.1%) |
| 3 or more Vehicles | 1,876 (24.7%) | 223 (11.0%) |
| Total | 7,579 (100.0%) | 2,033 (100.0%) |
Real Estate & Mortgages in Llano County
Real Estate and Mortgage Overview in Llano County
| Characteristic | Without Mortgage | With Mortgage |
| Housing Units | 4,145 | 3,434 |
| Median Property Value | $299,600 | $265,800 |
| Median Household Income | $65,632 | $1,000 |
| Monthly Housing Costs | $646 | $487 |
| Real Estate Taxes | $2,455 | $88 |
Property Value by Mortgage Status in Llano County
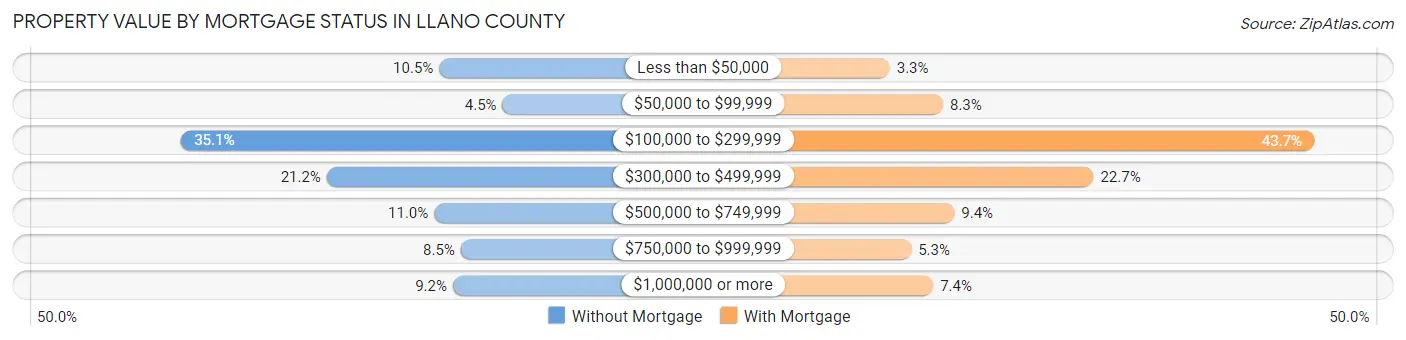
| Property Value | Without Mortgage | With Mortgage |
| Less than $50,000 | 436 (10.5%) | 112 (3.3%) |
| $50,000 to $99,999 | 186 (4.5%) | 286 (8.3%) |
| $100,000 to $299,999 | 1,454 (35.1%) | 1,499 (43.6%) |
| $300,000 to $499,999 | 880 (21.2%) | 778 (22.7%) |
| $500,000 to $749,999 | 456 (11.0%) | 323 (9.4%) |
| $750,000 to $999,999 | 351 (8.5%) | 182 (5.3%) |
| $1,000,000 or more | 382 (9.2%) | 254 (7.4%) |
| Total | 4,145 (100.0%) | 3,434 (100.0%) |
Household Income by Mortgage Status in Llano County
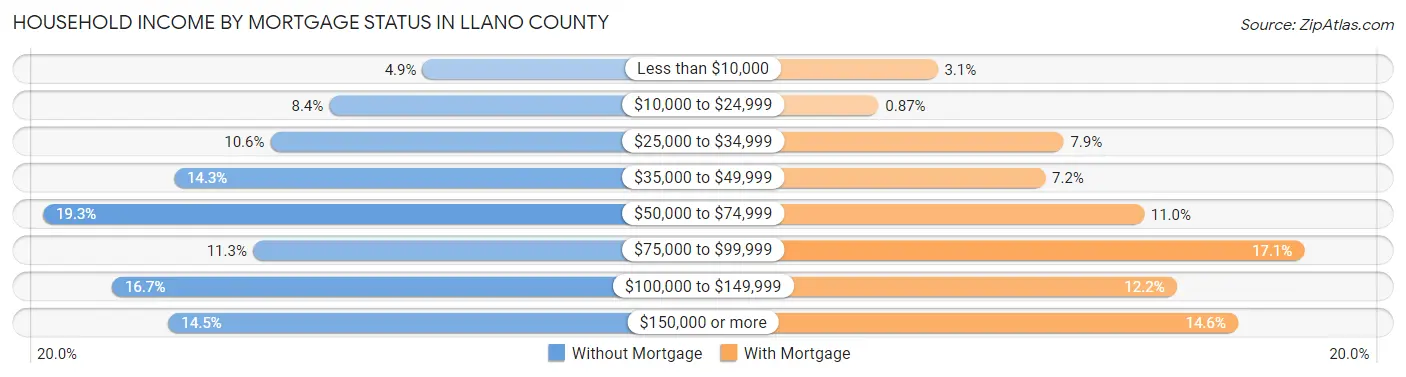
| Household Income | Without Mortgage | With Mortgage |
| Less than $10,000 | 201 (4.9%) | 107 (3.1%) |
| $10,000 to $24,999 | 348 (8.4%) | 30 (0.9%) |
| $25,000 to $34,999 | 441 (10.6%) | 272 (7.9%) |
| $35,000 to $49,999 | 593 (14.3%) | 248 (7.2%) |
| $50,000 to $74,999 | 800 (19.3%) | 377 (11.0%) |
| $75,000 to $99,999 | 469 (11.3%) | 587 (17.1%) |
| $100,000 to $149,999 | 691 (16.7%) | 420 (12.2%) |
| $150,000 or more | 602 (14.5%) | 500 (14.6%) |
| Total | 4,145 (100.0%) | 3,434 (100.0%) |
Property Value to Household Income Ratio in Llano County
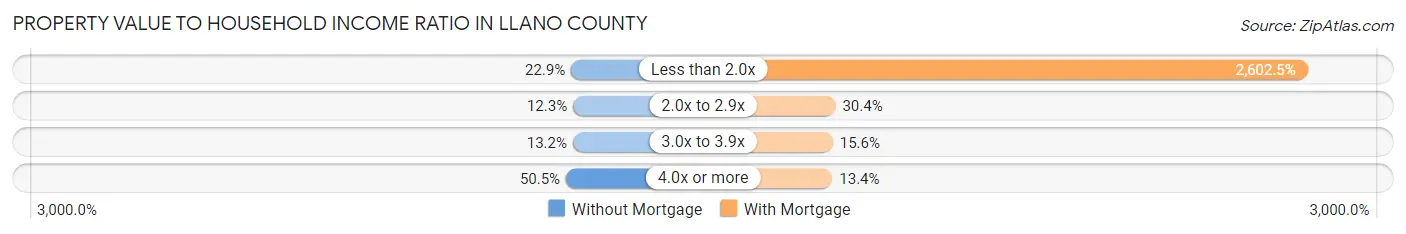
| Value-to-Income Ratio | Without Mortgage | With Mortgage |
| Less than 2.0x | 949 (22.9%) | 89,370 (2,602.5%) |
| 2.0x to 2.9x | 511 (12.3%) | 1,044 (30.4%) |
| 3.0x to 3.9x | 545 (13.2%) | 537 (15.6%) |
| 4.0x or more | 2,093 (50.5%) | 459 (13.4%) |
| Total | 4,145 (100.0%) | 3,434 (100.0%) |
Real Estate Taxes by Mortgage Status in Llano County

| Property Taxes | Without Mortgage | With Mortgage |
| Less than $800 | 839 (20.2%) | 3 (0.1%) |
| $800 to $1,499 | 524 (12.6%) | 386 (11.2%) |
| $800 to $1,499 | 2,645 (63.8%) | 679 (19.8%) |
| Total | 4,145 (100.0%) | 3,434 (100.0%) |
Health & Disability in Llano County
Health Insurance Coverage by Age in Llano County
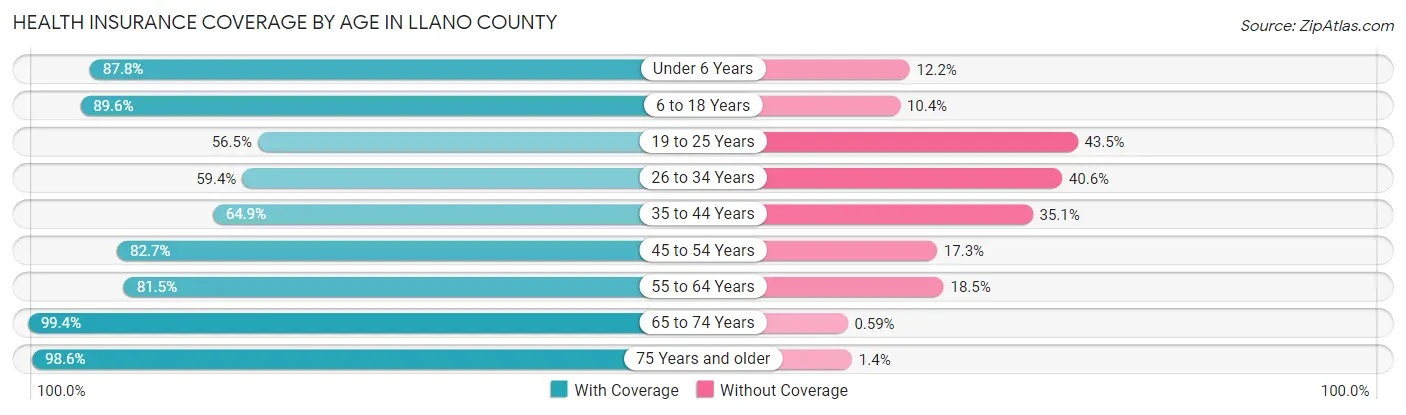
| Age Bracket | With Coverage | Without Coverage |
| Under 6 Years | 735 (87.8%) | 102 (12.2%) |
| 6 to 18 Years | 2,451 (89.6%) | 284 (10.4%) |
| 19 to 25 Years | 698 (56.5%) | 537 (43.5%) |
| 26 to 34 Years | 874 (59.4%) | 597 (40.6%) |
| 35 to 44 Years | 1,030 (64.9%) | 557 (35.1%) |
| 45 to 54 Years | 1,815 (82.7%) | 379 (17.3%) |
| 55 to 64 Years | 2,839 (81.5%) | 645 (18.5%) |
| 65 to 74 Years | 4,412 (99.4%) | 26 (0.6%) |
| 75 Years and older | 3,400 (98.6%) | 49 (1.4%) |
| Total | 18,254 (85.2%) | 3,176 (14.8%) |
Health Insurance Coverage by Citizenship Status in Llano County

| Citizenship Status | With Coverage | Without Coverage |
| Native Born | 735 (87.8%) | 102 (12.2%) |
| Foreign Born, Citizen | 2,451 (89.6%) | 284 (10.4%) |
| Foreign Born, not a Citizen | 698 (56.5%) | 537 (43.5%) |
Health Insurance Coverage by Household Income in Llano County
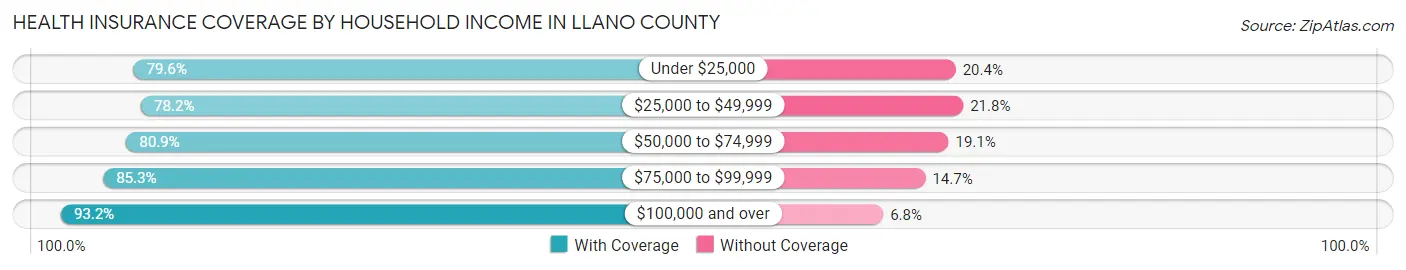
| Household Income | With Coverage | Without Coverage |
| Under $25,000 | 1,728 (79.6%) | 443 (20.4%) |
| $25,000 to $49,999 | 3,630 (78.2%) | 1,013 (21.8%) |
| $50,000 to $74,999 | 3,307 (80.9%) | 779 (19.1%) |
| $75,000 to $99,999 | 2,355 (85.3%) | 407 (14.7%) |
| $100,000 and over | 7,217 (93.2%) | 528 (6.8%) |
Public vs Private Health Insurance Coverage by Age in Llano County
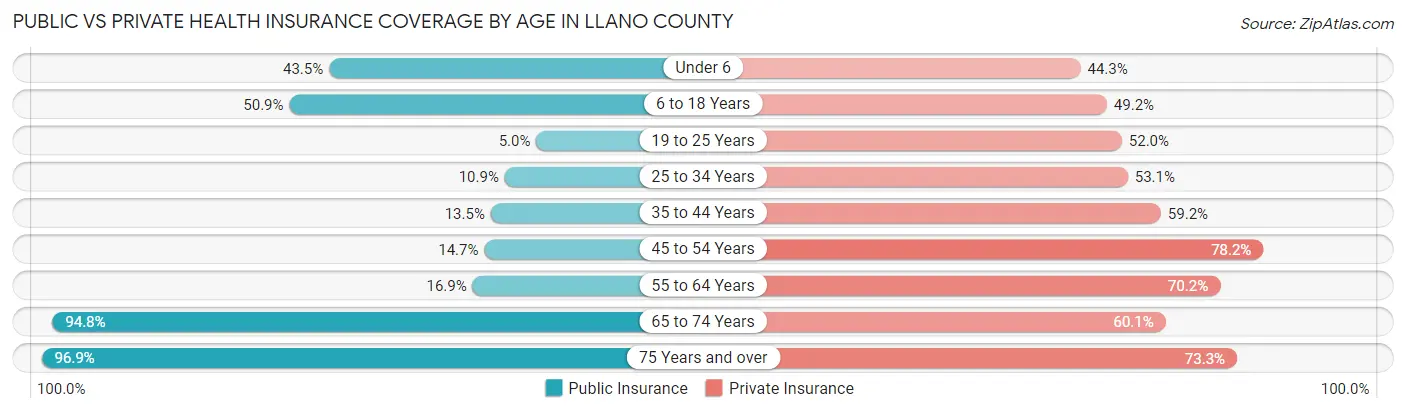
| Age Bracket | Public Insurance | Private Insurance |
| Under 6 | 364 (43.5%) | 371 (44.3%) |
| 6 to 18 Years | 1,391 (50.9%) | 1,346 (49.2%) |
| 19 to 25 Years | 62 (5.0%) | 642 (52.0%) |
| 25 to 34 Years | 160 (10.9%) | 781 (53.1%) |
| 35 to 44 Years | 214 (13.5%) | 940 (59.2%) |
| 45 to 54 Years | 322 (14.7%) | 1,716 (78.2%) |
| 55 to 64 Years | 587 (16.9%) | 2,446 (70.2%) |
| 65 to 74 Years | 4,209 (94.8%) | 2,667 (60.1%) |
| 75 Years and over | 3,341 (96.9%) | 2,529 (73.3%) |
| Total | 10,650 (49.7%) | 13,438 (62.7%) |
Disability Status by Sex by Age in Llano County
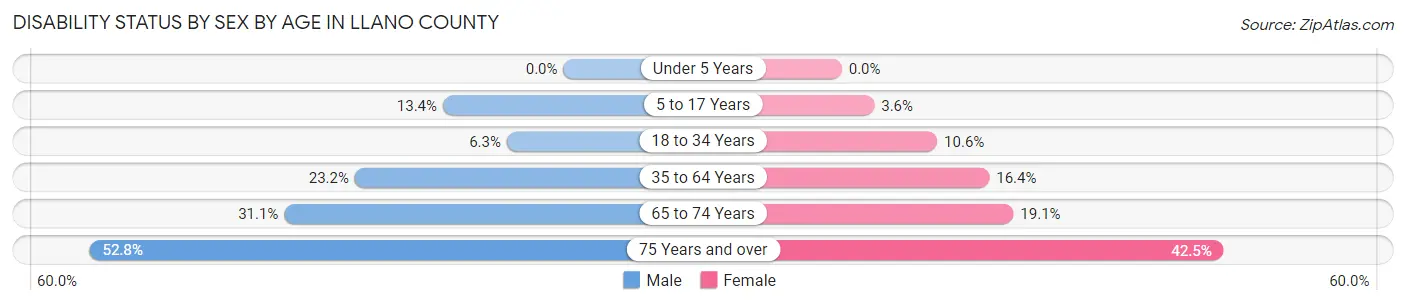
| Age Bracket | Male | Female |
| Under 5 Years | 0 (0.0%) | 0 (0.0%) |
| 5 to 17 Years | 187 (13.4%) | 47 (3.6%) |
| 18 to 34 Years | 85 (6.3%) | 157 (10.6%) |
| 35 to 64 Years | 828 (23.2%) | 608 (16.4%) |
| 65 to 74 Years | 643 (31.1%) | 453 (19.1%) |
| 75 Years and over | 889 (52.8%) | 750 (42.5%) |
Disability Class by Sex by Age in Llano County
Disability Class: Hearing Difficulty
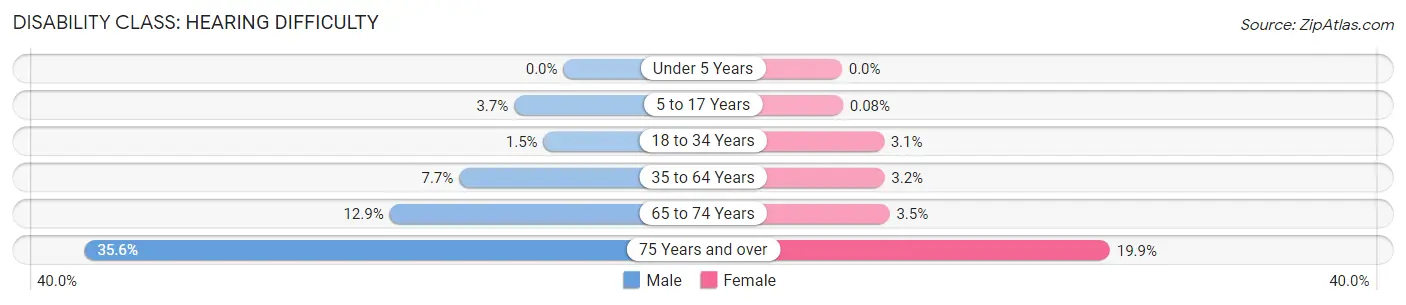
| Age Bracket | Male | Female |
| Under 5 Years | 0 (0.0%) | 0 (0.0%) |
| 5 to 17 Years | 51 (3.7%) | 1 (0.1%) |
| 18 to 34 Years | 20 (1.5%) | 46 (3.1%) |
| 35 to 64 Years | 276 (7.7%) | 117 (3.2%) |
| 65 to 74 Years | 267 (12.9%) | 84 (3.5%) |
| 75 Years and over | 599 (35.5%) | 351 (19.9%) |
Disability Class: Vision Difficulty
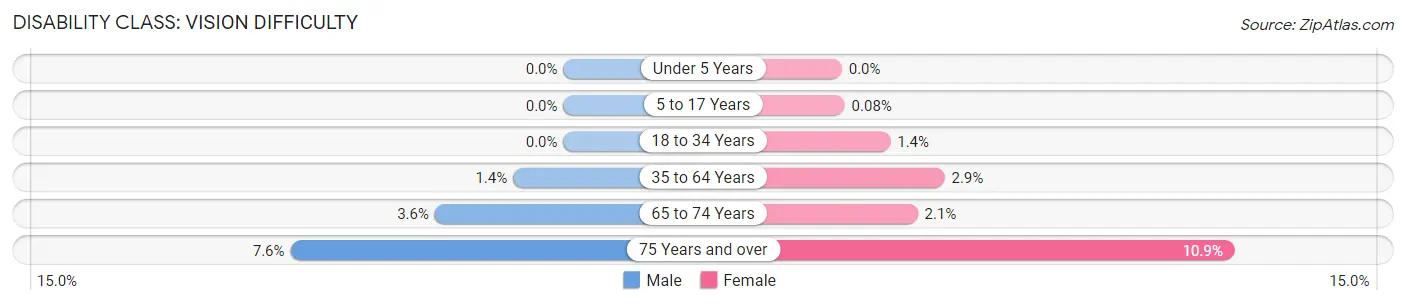
| Age Bracket | Male | Female |
| Under 5 Years | 0 (0.0%) | 0 (0.0%) |
| 5 to 17 Years | 0 (0.0%) | 1 (0.1%) |
| 18 to 34 Years | 0 (0.0%) | 20 (1.3%) |
| 35 to 64 Years | 50 (1.4%) | 106 (2.9%) |
| 65 to 74 Years | 74 (3.6%) | 50 (2.1%) |
| 75 Years and over | 128 (7.6%) | 193 (10.9%) |
Disability Class: Cognitive Difficulty
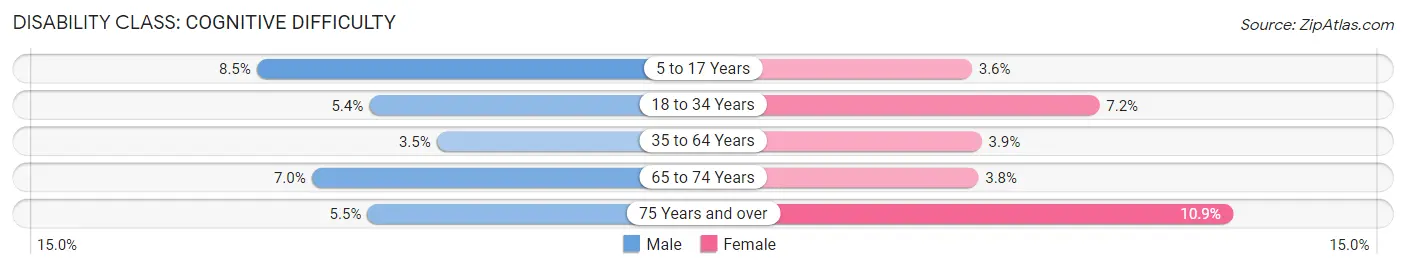
| Age Bracket | Male | Female |
| 5 to 17 Years | 119 (8.5%) | 47 (3.6%) |
| 18 to 34 Years | 73 (5.4%) | 106 (7.2%) |
| 35 to 64 Years | 126 (3.5%) | 144 (3.9%) |
| 65 to 74 Years | 145 (7.0%) | 90 (3.8%) |
| 75 Years and over | 92 (5.5%) | 192 (10.9%) |
Disability Class: Ambulatory Difficulty
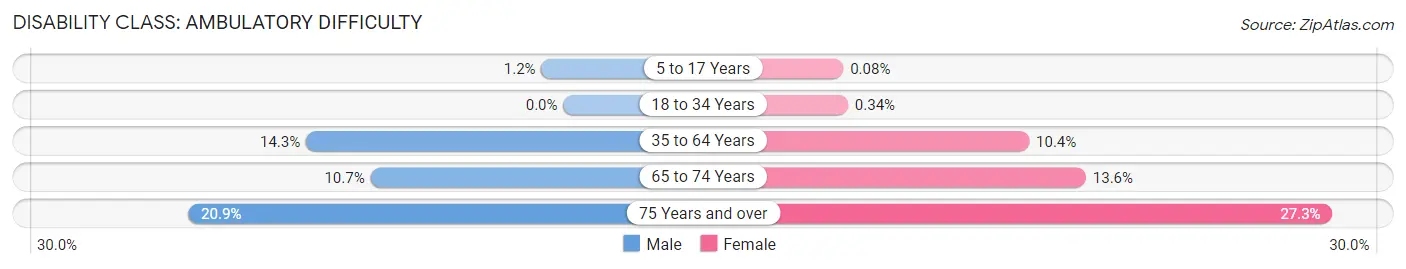
| Age Bracket | Male | Female |
| 5 to 17 Years | 17 (1.2%) | 1 (0.1%) |
| 18 to 34 Years | 0 (0.0%) | 5 (0.3%) |
| 35 to 64 Years | 511 (14.3%) | 386 (10.4%) |
| 65 to 74 Years | 222 (10.7%) | 322 (13.6%) |
| 75 Years and over | 352 (20.9%) | 482 (27.3%) |
Disability Class: Self-Care Difficulty
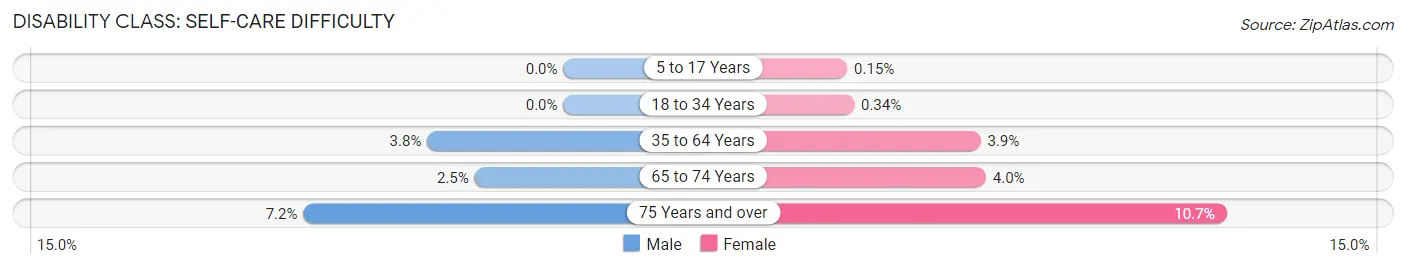
| Age Bracket | Male | Female |
| 5 to 17 Years | 0 (0.0%) | 2 (0.2%) |
| 18 to 34 Years | 0 (0.0%) | 5 (0.3%) |
| 35 to 64 Years | 135 (3.8%) | 143 (3.9%) |
| 65 to 74 Years | 51 (2.5%) | 95 (4.0%) |
| 75 Years and over | 122 (7.2%) | 189 (10.7%) |
Technology Access in Llano County
Computing Device Access in Llano County
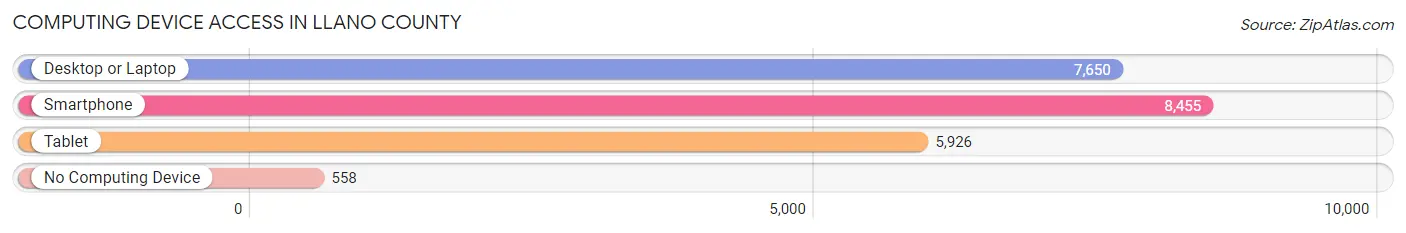
| Device Type | # Households | % Households |
| Desktop or Laptop | 7,650 | 79.6% |
| Smartphone | 8,455 | 88.0% |
| Tablet | 5,926 | 61.7% |
| No Computing Device | 558 | 5.8% |
| Total | 9,612 | 100.0% |
Internet Access in Llano County
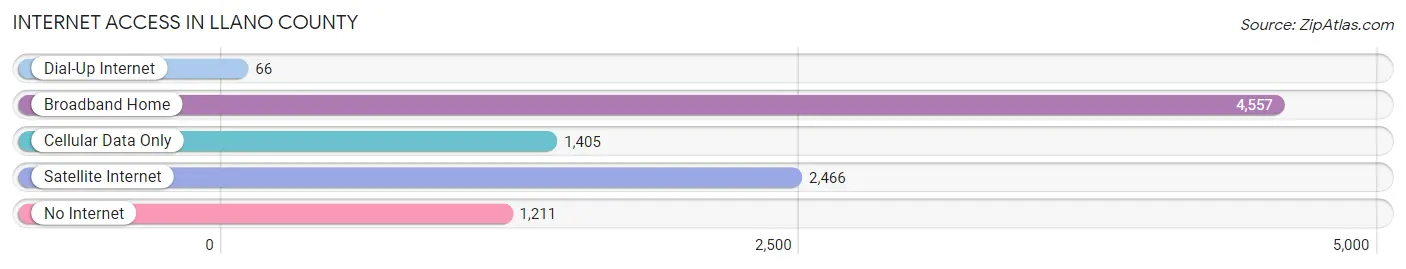
| Internet Type | # Households | % Households |
| Dial-Up Internet | 66 | 0.7% |
| Broadband Home | 4,557 | 47.4% |
| Cellular Data Only | 1,405 | 14.6% |
| Satellite Internet | 2,466 | 25.7% |
| No Internet | 1,211 | 12.6% |
| Total | 9,612 | 100.0% |
Llano County Summary
Llano County is located in the central part of the state of Texas, in the Hill Country region of the state. It is bordered by Burnet County to the north, Blanco County to the east, Mason County to the south, and San Saba County to the west. The county seat is Llano, and the county has a total area of 937 square miles.
History
Llano County was established in 1856 from portions of Burnet and Gillespie counties. It was named for the Llano River, which runs through the county. The county was originally populated by Native American tribes, including the Tonkawa, Comanche, and Apache. The first Anglo-American settlers arrived in the area in the 1840s, and the county was officially organized in 1856.
The county was home to several early settlements, including Kingsland, Buchanan Dam, and Llano. The county was also home to several ranches, including the 6666 Ranch, which is still in operation today.
Geography
Llano County is located in the Hill Country region of Texas, and is characterized by rolling hills and rugged terrain. The county is home to several rivers, including the Llano, Colorado, and San Saba Rivers. The county is also home to several lakes, including Lake Buchanan, Inks Lake, and Lake LBJ.
The county has a total area of 937 square miles, and is home to several state parks, including Enchanted Rock State Natural Area, Inks Lake State Park, and Longhorn Cavern State Park.
Economy
Llano County has a diverse economy, with a mix of agriculture, manufacturing, and tourism. The county is home to several large ranches, including the 6666 Ranch, which is one of the largest ranches in the United States. The county is also home to several manufacturing companies, including a large steel mill in Kingsland.
Tourism is an important part of the county’s economy, with several state parks and recreational areas drawing visitors from around the state. The county is also home to several wineries, and is a popular destination for hunting and fishing.
Demographics
As of the 2010 census, the population of Llano County was 19,301. The population is predominantly white (90.2%), with small percentages of African American (3.2%), Hispanic (4.2%), and Native American (0.7%) residents. The median household income in the county is $41,945, and the median home value is $133,400.
The county is home to several small towns, including Llano, Kingsland, and Buchanan Dam. The county seat is Llano, which is home to the Llano County Courthouse and several other government buildings. The county is also home to several small unincorporated communities, including Tow, Bluffton, and Castell.
Common Questions
What is Per Capita Income in Llano County?
Per Capita income in Llano County is $48,116.
What is the Median Family Income in Llano County?
Median Family Income in Llano County is $78,092.
What is the Median Household income in Llano County?
Median Household Income in Llano County is $64,241.
What is Income or Wage Gap in Llano County?
Income or Wage Gap in Llano County is 41.6%.
Women in Llano County earn 58.4 cents for every dollar earned by a man.
What is Inequality or Gini Index in Llano County?
Inequality or Gini Index in Llano County is 0.53.
What is the Total Population of Llano County?
Total Population of Llano County is 21,637.
What is the Total Male Population of Llano County?
Total Male Population of Llano County is 10,332.
What is the Total Female Population of Llano County?
Total Female Population of Llano County is 11,305.
What is the Ratio of Males per 100 Females in Llano County?
There are 91.39 Males per 100 Females in Llano County.
What is the Ratio of Females per 100 Males in Llano County?
There are 109.42 Females per 100 Males in Llano County.
What is the Median Population Age in Llano County?
Median Population Age in Llano County is 57.4 Years.
What is the Average Family Size in Llano County
Average Family Size in Llano County is 2.7 People.
What is the Average Household Size in Llano County
Average Household Size in Llano County is 2.2 People.
How Large is the Labor Force in Llano County?
There are 8,749 People in the Labor Forcein in Llano County.
What is the Percentage of People in the Labor Force in Llano County?
47.2% of People are in the Labor Force in Llano County.
What is the Unemployment Rate in Llano County?
Unemployment Rate in Llano County is 6.0%.