Live Oak County, TX Map & Demographics
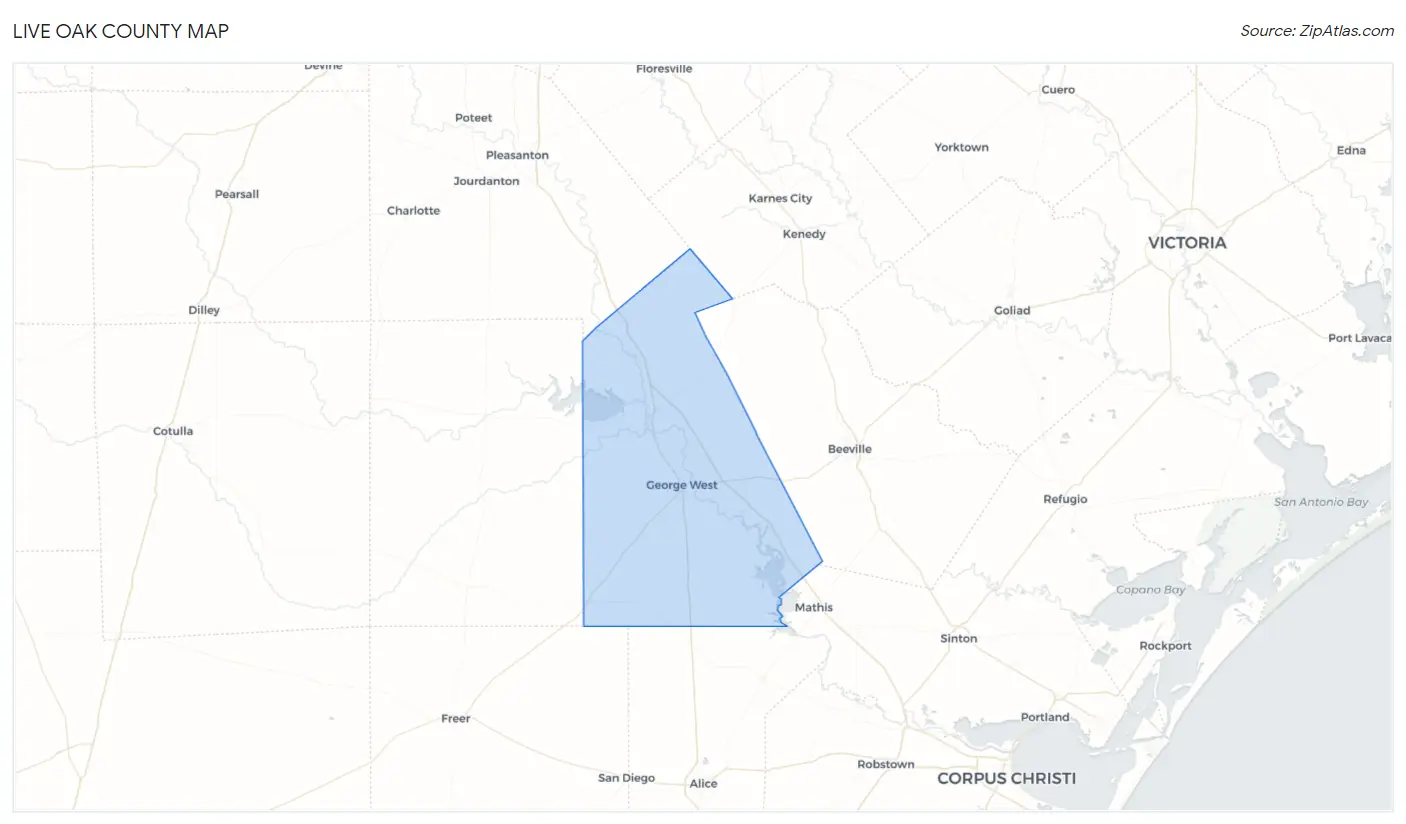
Live Oak County Map
Live Oak County Overview
$27,951
PER CAPITA INCOME
$68,357
AVG FAMILY INCOME
$55,949
AVG HOUSEHOLD INCOME
51.9%
WAGE / INCOME GAP [ % ]
48.1¢/ $1
WAGE / INCOME GAP [ $ ]
0.47
INEQUALITY / GINI INDEX
11,374
TOTAL POPULATION
6,118
MALE POPULATION
5,256
FEMALE POPULATION
116.40
MALES / 100 FEMALES
85.91
FEMALES / 100 MALES
40.8
MEDIAN AGE
3.0
AVG FAMILY SIZE
2.4
AVG HOUSEHOLD SIZE
4,215
LABOR FORCE [ PEOPLE ]
44.9%
PERCENT IN LABOR FORCE
3.6%
UNEMPLOYMENT RATE
Income in Live Oak County
Income Overview in Live Oak County
Per Capita Income in Live Oak County is $27,951, while median incomes of families and households are $68,357 and $55,949 respectively.
| Characteristic | Number | Measure |
| Per Capita Income | 11,374 | $27,951 |
| Median Family Income | 2,690 | $68,357 |
| Mean Family Income | 2,690 | $83,467 |
| Median Household Income | 4,153 | $55,949 |
| Mean Household Income | 4,153 | $75,029 |
| Income Deficit | 2,690 | $0 |
| Wage / Income Gap (%) | 11,374 | 51.88% |
| Wage / Income Gap ($) | 11,374 | 48.12¢ per $1 |
| Gini / Inequality Index | 11,374 | 0.47 |
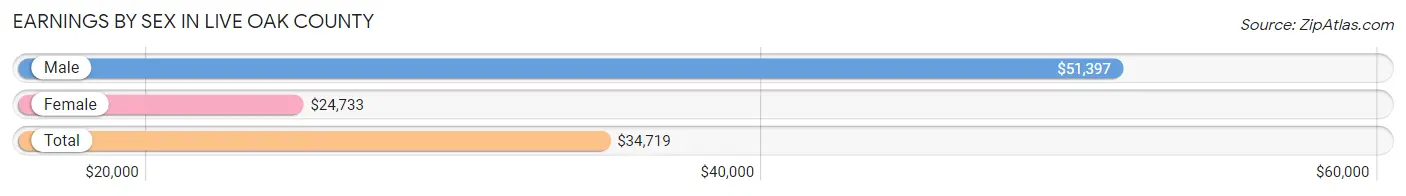
Earnings by Sex in Live Oak County
Average Earnings in Live Oak County are $34,719, $51,397 for men and $24,733 for women, a difference of 51.9%.
| Sex | Number | Average Earnings |
| Male | 2,796 (61.0%) | $51,397 |
| Female | 1,787 (39.0%) | $24,733 |
| Total | 4,583 (100.0%) | $34,719 |
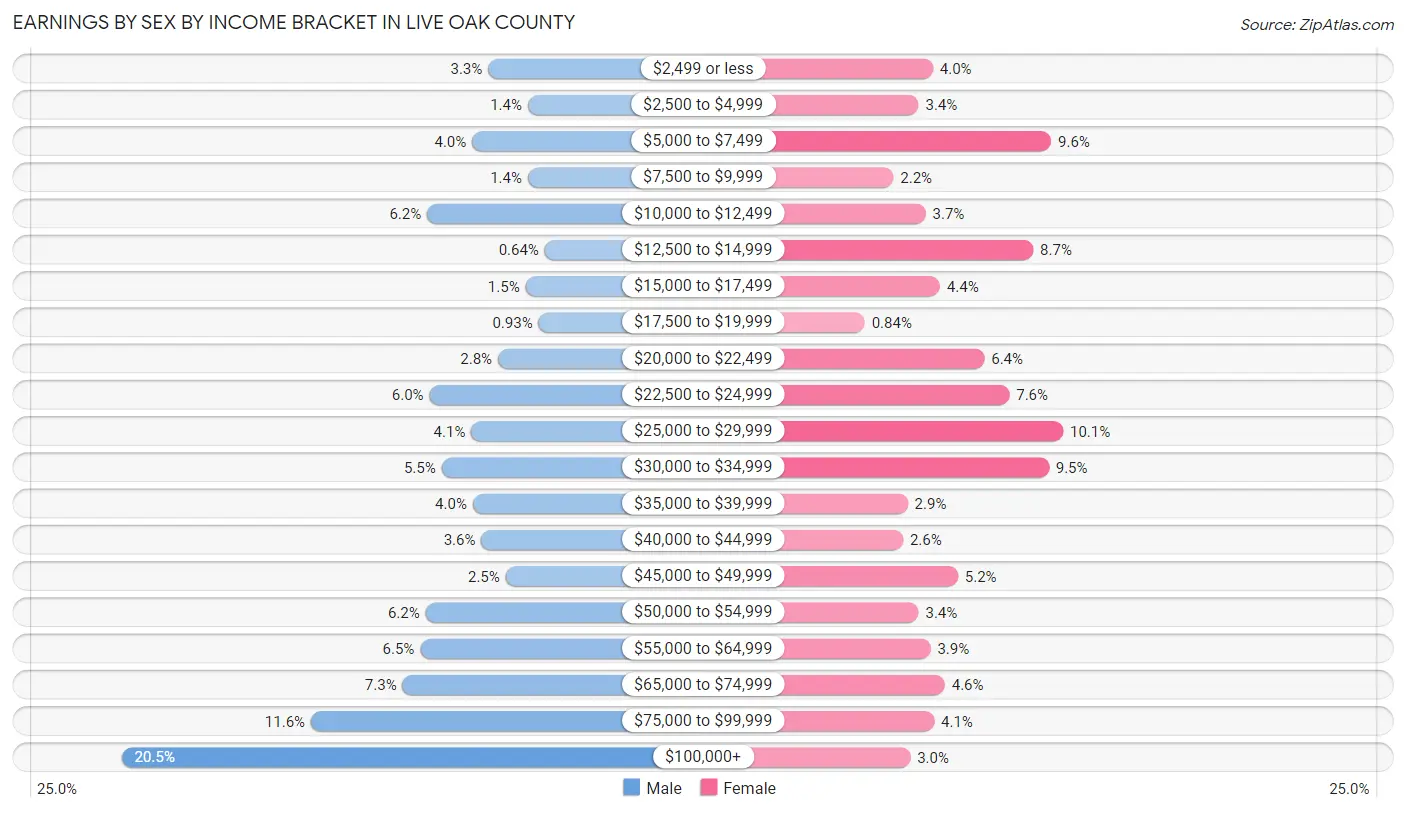
Earnings by Sex by Income Bracket in Live Oak County
The most common earnings brackets in Live Oak County are $100,000+ for men (572 | 20.5%) and $25,000 to $29,999 for women (181 | 10.1%).
| Income | Male | Female |
| $2,499 or less | 92 (3.3%) | 72 (4.0%) |
| $2,500 to $4,999 | 40 (1.4%) | 60 (3.4%) |
| $5,000 to $7,499 | 113 (4.0%) | 171 (9.6%) |
| $7,500 to $9,999 | 40 (1.4%) | 39 (2.2%) |
| $10,000 to $12,499 | 172 (6.1%) | 66 (3.7%) |
| $12,500 to $14,999 | 18 (0.6%) | 156 (8.7%) |
| $15,000 to $17,499 | 43 (1.5%) | 78 (4.4%) |
| $17,500 to $19,999 | 26 (0.9%) | 15 (0.8%) |
| $20,000 to $22,499 | 79 (2.8%) | 115 (6.4%) |
| $22,500 to $24,999 | 169 (6.0%) | 136 (7.6%) |
| $25,000 to $29,999 | 114 (4.1%) | 181 (10.1%) |
| $30,000 to $34,999 | 153 (5.5%) | 169 (9.5%) |
| $35,000 to $39,999 | 112 (4.0%) | 51 (2.9%) |
| $40,000 to $44,999 | 101 (3.6%) | 47 (2.6%) |
| $45,000 to $49,999 | 69 (2.5%) | 93 (5.2%) |
| $50,000 to $54,999 | 174 (6.2%) | 60 (3.4%) |
| $55,000 to $64,999 | 181 (6.5%) | 70 (3.9%) |
| $65,000 to $74,999 | 204 (7.3%) | 82 (4.6%) |
| $75,000 to $99,999 | 324 (11.6%) | 73 (4.1%) |
| $100,000+ | 572 (20.5%) | 53 (3.0%) |
| Total | 2,796 (100.0%) | 1,787 (100.0%) |
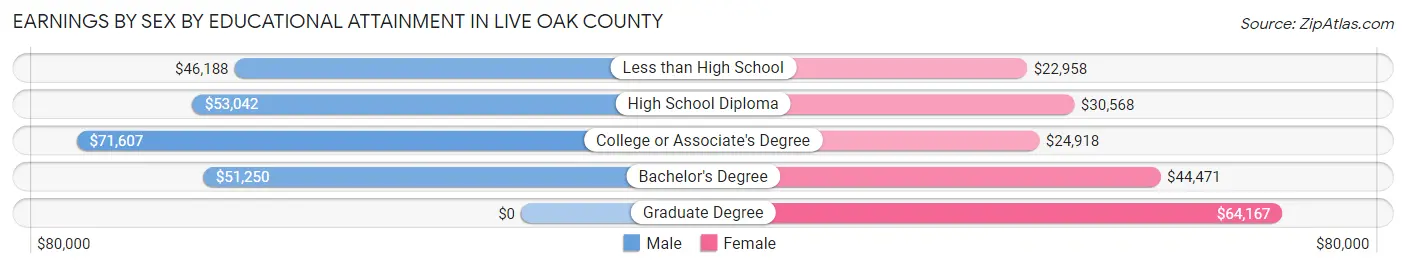
Earnings by Sex by Educational Attainment in Live Oak County
Average earnings in Live Oak County are $54,549 for men and $28,521 for women, a difference of 47.7%. Men with an educational attainment of college or associate's degree enjoy the highest average annual earnings of $71,607, while those with less than high school education earn the least with $46,188. Women with an educational attainment of graduate degree earn the most with the average annual earnings of $64,167, while those with less than high school education have the smallest earnings of $22,958.
| Educational Attainment | Male Income | Female Income |
| Less than High School | $46,188 | $22,958 |
| High School Diploma | $53,042 | $30,568 |
| College or Associate's Degree | $71,607 | $24,918 |
| Bachelor's Degree | $51,250 | $44,471 |
| Graduate Degree | - | - |
| Total | $54,549 | $28,521 |
Family Income in Live Oak County
Family Income Brackets in Live Oak County
According to the Live Oak County family income data, there are 533 families falling into the $100,000 to $149,999 income range, which is the most common income bracket and makes up 19.8% of all families. Conversely, the $10,000 to $14,999 income bracket is the least frequent group with only 75 families (2.8%) belonging to this category.
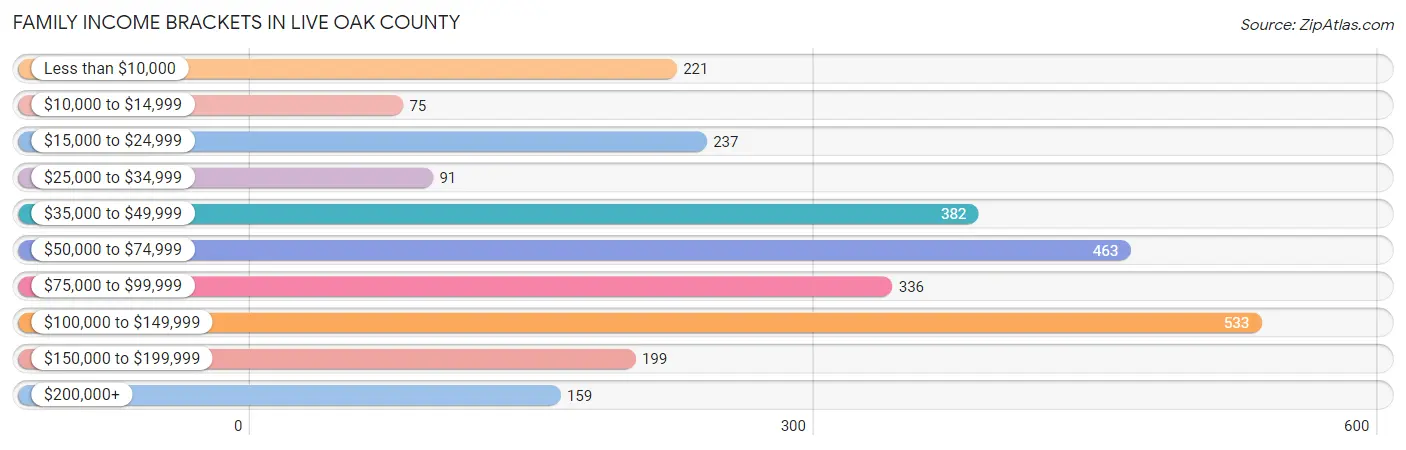
| Income Bracket | # Families | % Families |
| Less than $10,000 | 221 | 8.2% |
| $10,000 to $14,999 | 75 | 2.8% |
| $15,000 to $24,999 | 237 | 8.8% |
| $25,000 to $34,999 | 91 | 3.4% |
| $35,000 to $49,999 | 382 | 14.2% |
| $50,000 to $74,999 | 463 | 17.2% |
| $75,000 to $99,999 | 336 | 12.5% |
| $100,000 to $149,999 | 533 | 19.8% |
| $150,000 to $199,999 | 199 | 7.4% |
| $200,000+ | 159 | 5.9% |
Family Income by Famaliy Size in Live Oak County
5-person families (195 | 7.2%) account for the highest median family income in Live Oak County with $115,060 per family, while 2-person families (1,641 | 61.0%) have the highest median income of $32,238 per family member.
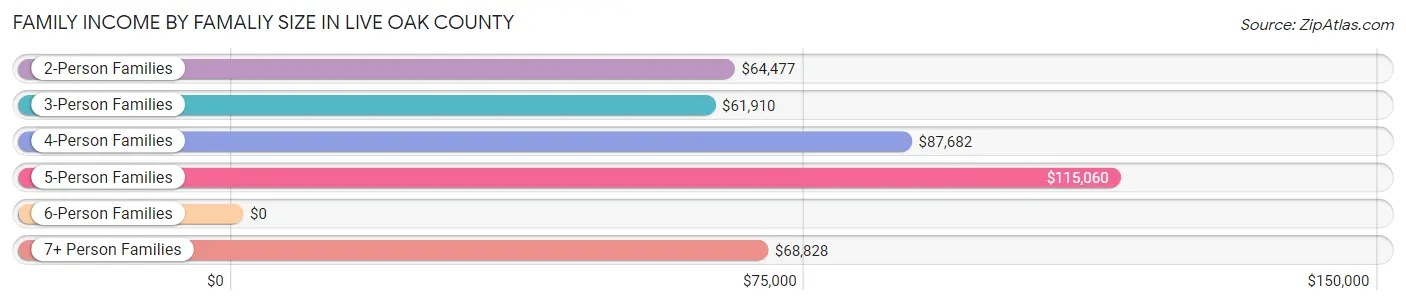
| Income Bracket | # Families | Median Income |
| 2-Person Families | 1,641 (61.0%) | $64,477 |
| 3-Person Families | 423 (15.7%) | $61,910 |
| 4-Person Families | 339 (12.6%) | $87,682 |
| 5-Person Families | 195 (7.2%) | $115,060 |
| 6-Person Families | 30 (1.1%) | $0 |
| 7+ Person Families | 62 (2.3%) | $68,828 |
| Total | 2,690 (100.0%) | $68,357 |
Family Income by Number of Earners in Live Oak County
The median family income in Live Oak County is $68,357, with families comprising 3+ earners (219) having the highest median family income of $122,664, while families with no earners (606) have the lowest median family income of $35,543, accounting for 8.1% and 22.5% of families, respectively.
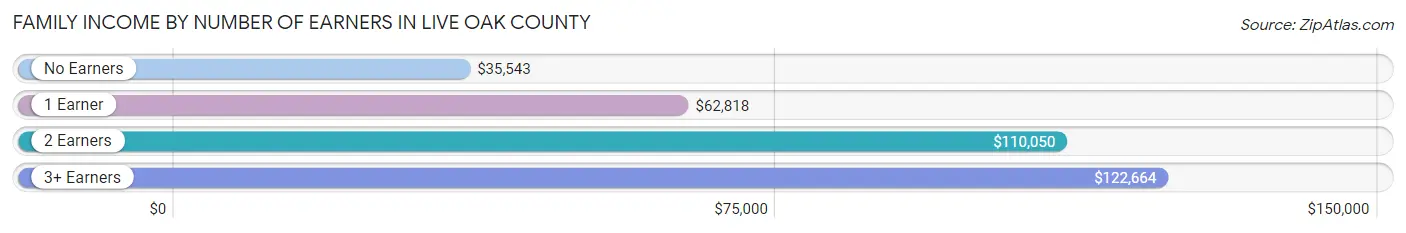
| Number of Earners | # Families | Median Income |
| No Earners | 606 (22.5%) | $35,543 |
| 1 Earner | 1,080 (40.2%) | $62,818 |
| 2 Earners | 785 (29.2%) | $110,050 |
| 3+ Earners | 219 (8.1%) | $122,664 |
| Total | 2,690 (100.0%) | $68,357 |
Household Income in Live Oak County
Household Income Brackets in Live Oak County
With 752 households falling in the category, the $50,000 to $74,999 income range is the most frequent in Live Oak County, accounting for 18.1% of all households. In contrast, only 212 households (5.1%) fall into the $150,000 to $199,999 income bracket, making it the least populous group.
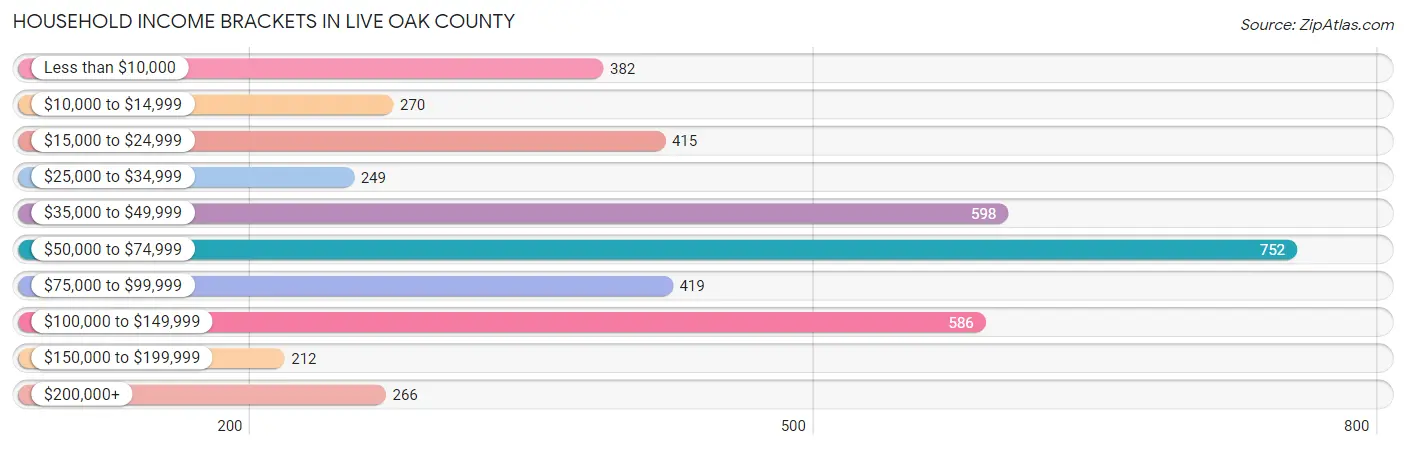
| Income Bracket | # Households | % Households |
| Less than $10,000 | 382 | 9.2% |
| $10,000 to $14,999 | 270 | 6.5% |
| $15,000 to $24,999 | 415 | 10.0% |
| $25,000 to $34,999 | 249 | 6.0% |
| $35,000 to $49,999 | 598 | 14.4% |
| $50,000 to $74,999 | 752 | 18.1% |
| $75,000 to $99,999 | 419 | 10.1% |
| $100,000 to $149,999 | 586 | 14.1% |
| $150,000 to $199,999 | 212 | 5.1% |
| $200,000+ | 266 | 6.4% |
Household Income by Householder Age in Live Oak County
The median household income in Live Oak County is $55,949, with the highest median household income of $78,906 found in the 25 to 44 years age bracket for the primary householder. A total of 1,003 households (24.1%) fall into this category. Meanwhile, the 15 to 24 years age bracket for the primary householder has the lowest median household income of $0, with 193 households (4.6%) in this group.
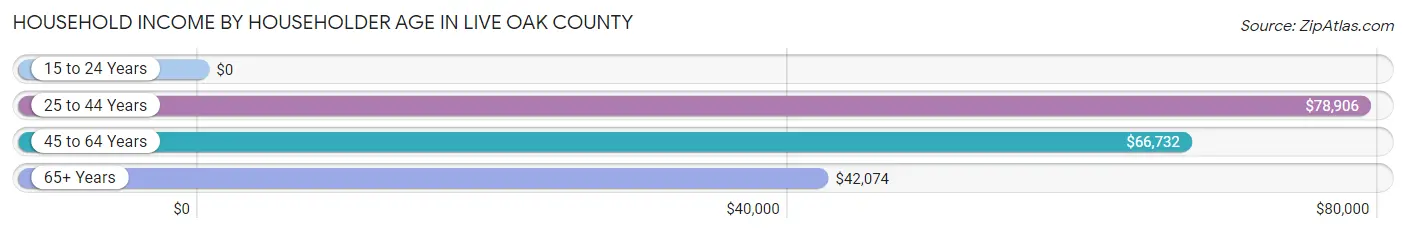
| Income Bracket | # Households | Median Income |
| 15 to 24 Years | 193 (4.6%) | $0 |
| 25 to 44 Years | 1,003 (24.1%) | $78,906 |
| 45 to 64 Years | 1,540 (37.1%) | $66,732 |
| 65+ Years | 1,417 (34.1%) | $42,074 |
| Total | 4,153 (100.0%) | $55,949 |
Poverty in Live Oak County
Income Below Poverty by Sex and Age in Live Oak County
With 16.0% poverty level for males and 25.7% for females among the residents of Live Oak County, 16 and 17 year old males and under 5 year old females are the most vulnerable to poverty, with 51 males (79.7%) and 162 females (47.2%) in their respective age groups living below the poverty level.
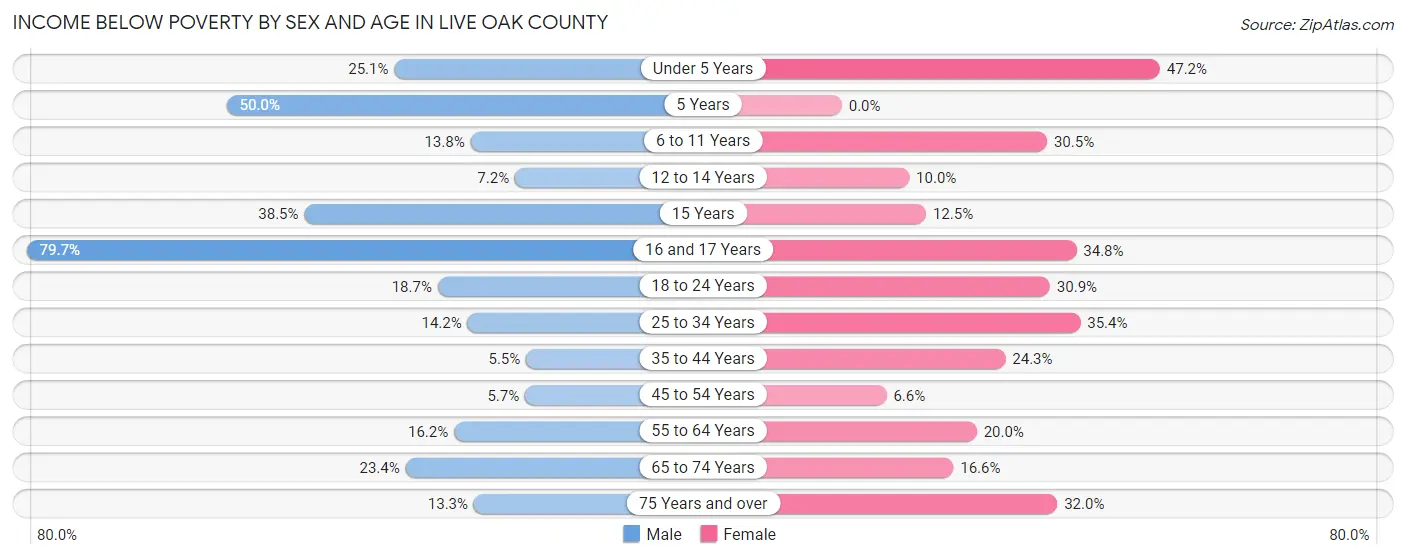
| Age Bracket | Male | Female |
| Under 5 Years | 66 (25.1%) | 162 (47.2%) |
| 5 Years | 14 (50.0%) | 0 (0.0%) |
| 6 to 11 Years | 44 (13.8%) | 174 (30.5%) |
| 12 to 14 Years | 15 (7.2%) | 11 (10.0%) |
| 15 Years | 10 (38.5%) | 5 (12.5%) |
| 16 and 17 Years | 51 (79.7%) | 62 (34.8%) |
| 18 to 24 Years | 72 (18.6%) | 110 (30.9%) |
| 25 to 34 Years | 99 (14.2%) | 283 (35.4%) |
| 35 to 44 Years | 22 (5.5%) | 68 (24.3%) |
| 45 to 54 Years | 24 (5.7%) | 39 (6.6%) |
| 55 to 64 Years | 130 (16.2%) | 148 (20.0%) |
| 65 to 74 Years | 146 (23.4%) | 100 (16.6%) |
| 75 Years and over | 67 (13.3%) | 159 (32.0%) |
| Total | 760 (16.0%) | 1,321 (25.7%) |
Income Above Poverty by Sex and Age in Live Oak County
According to the poverty statistics in Live Oak County, males aged 35 to 44 years and females aged 5 years are the age groups that are most secure financially, with 94.5% of males and 100.0% of females in these age groups living above the poverty line.
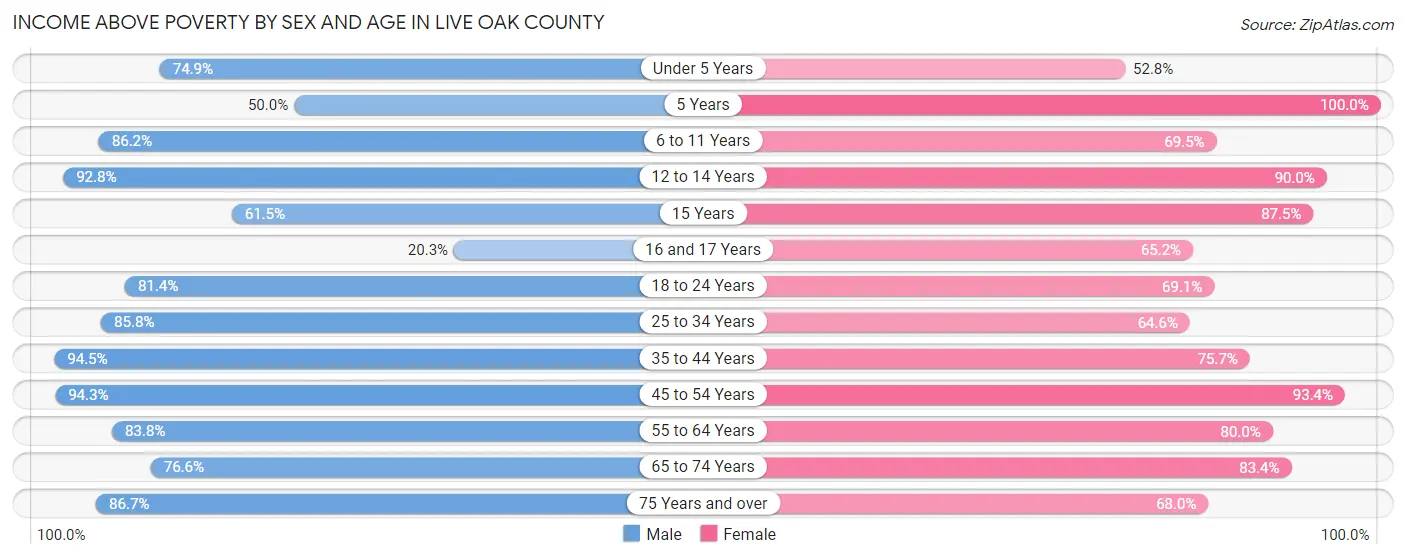
| Age Bracket | Male | Female |
| Under 5 Years | 197 (74.9%) | 181 (52.8%) |
| 5 Years | 14 (50.0%) | 46 (100.0%) |
| 6 to 11 Years | 275 (86.2%) | 397 (69.5%) |
| 12 to 14 Years | 194 (92.8%) | 99 (90.0%) |
| 15 Years | 16 (61.5%) | 35 (87.5%) |
| 16 and 17 Years | 13 (20.3%) | 116 (65.2%) |
| 18 to 24 Years | 314 (81.4%) | 246 (69.1%) |
| 25 to 34 Years | 597 (85.8%) | 516 (64.6%) |
| 35 to 44 Years | 376 (94.5%) | 212 (75.7%) |
| 45 to 54 Years | 398 (94.3%) | 549 (93.4%) |
| 55 to 64 Years | 671 (83.8%) | 591 (80.0%) |
| 65 to 74 Years | 477 (76.6%) | 504 (83.4%) |
| 75 Years and over | 437 (86.7%) | 338 (68.0%) |
| Total | 3,979 (84.0%) | 3,830 (74.4%) |
Income Below Poverty Among Married-Couple Families in Live Oak County
The poverty statistics for married-couple families in Live Oak County show that 12.1% or 264 of the total 2,172 families live below the poverty line. Families with 1 or 2 children have the highest poverty rate of 17.3%, comprising of 79 families. On the other hand, families with 5 or more children have the lowest poverty rate of 0.0%, which includes 0 families.
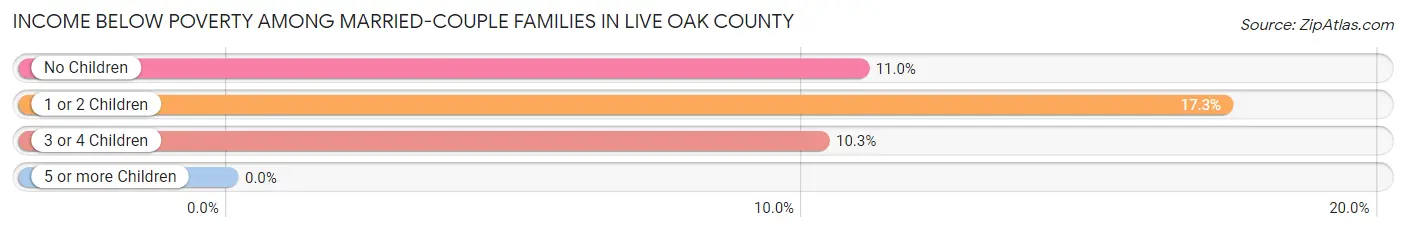
| Children | Above Poverty | Below Poverty |
| No Children | 1,386 (89.0%) | 171 (11.0%) |
| 1 or 2 Children | 377 (82.7%) | 79 (17.3%) |
| 3 or 4 Children | 122 (89.7%) | 14 (10.3%) |
| 5 or more Children | 23 (100.0%) | 0 (0.0%) |
| Total | 1,908 (87.8%) | 264 (12.1%) |
Income Below Poverty Among Single-Parent Households in Live Oak County
According to the poverty data in Live Oak County, 11.6% or 17 single-father households and 65.0% or 242 single-mother households are living below the poverty line. Among single-father households, those with 3 or 4 children have the highest poverty rate, with 17 households (54.8%) experiencing poverty. Likewise, among single-mother households, those with 3 or 4 children have the highest poverty rate, with 20 households (100.0%) falling below the poverty line.
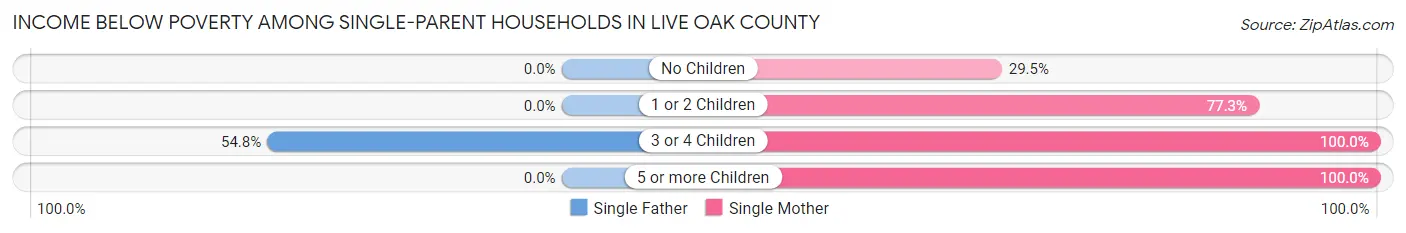
| Children | Single Father | Single Mother |
| No Children | 0 (0.0%) | 33 (29.5%) |
| 1 or 2 Children | 0 (0.0%) | 174 (77.3%) |
| 3 or 4 Children | 17 (54.8%) | 20 (100.0%) |
| 5 or more Children | 0 (0.0%) | 15 (100.0%) |
| Total | 17 (11.6%) | 242 (65.0%) |
Income Below Poverty Among Married-Couple vs Single-Parent Households in Live Oak County
The poverty data for Live Oak County shows that 264 of the married-couple family households (12.1%) and 259 of the single-parent households (50.0%) are living below the poverty level. Within the married-couple family households, those with 1 or 2 children have the highest poverty rate, with 79 households (17.3%) falling below the poverty line. Among the single-parent households, those with 5 or more children have the highest poverty rate, with 15 household (100.0%) living below poverty.
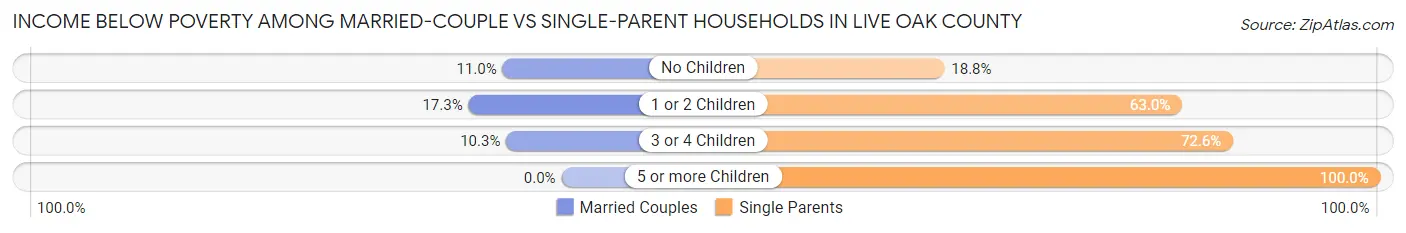
| Children | Married-Couple Families | Single-Parent Households |
| No Children | 171 (11.0%) | 33 (18.8%) |
| 1 or 2 Children | 79 (17.3%) | 174 (63.0%) |
| 3 or 4 Children | 14 (10.3%) | 37 (72.6%) |
| 5 or more Children | 0 (0.0%) | 15 (100.0%) |
| Total | 264 (12.1%) | 259 (50.0%) |
Race in Live Oak County
The most populous races in Live Oak County are White / Caucasian (9,478 | 83.3%), Hispanic or Latino (4,634 | 40.7%), and Two or more Races (1,024 | 9.0%).
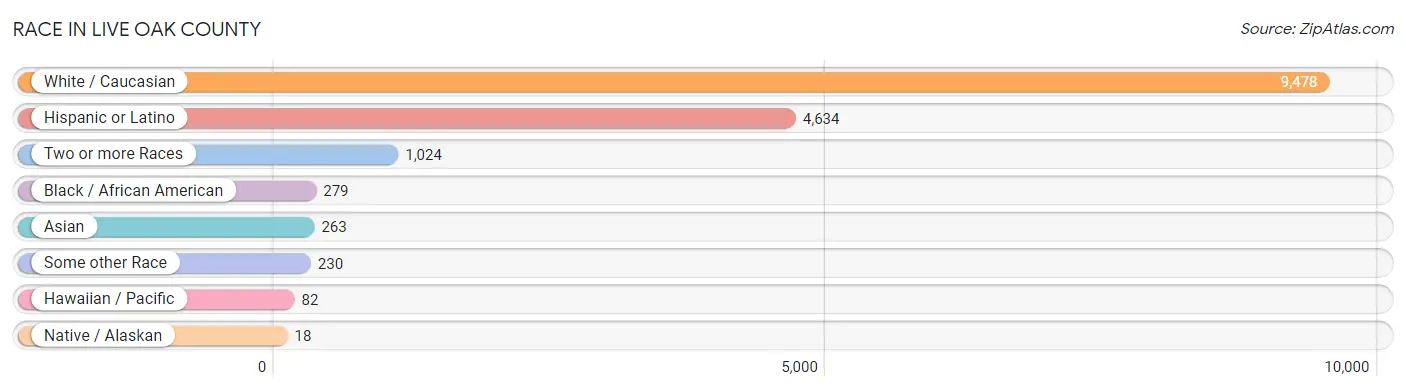
| Race | # Population | % Population |
| Asian | 263 | 2.3% |
| Black / African American | 279 | 2.5% |
| Hawaiian / Pacific | 82 | 0.7% |
| Hispanic or Latino | 4,634 | 40.7% |
| Native / Alaskan | 18 | 0.2% |
| White / Caucasian | 9,478 | 83.3% |
| Two or more Races | 1,024 | 9.0% |
| Some other Race | 230 | 2.0% |
| Total | 11,374 | 100.0% |
Ancestry in Live Oak County
The most populous ancestries reported in Live Oak County are Mexican (3,958 | 34.8%), German (1,915 | 16.8%), English (1,022 | 9.0%), Irish (962 | 8.5%), and American (618 | 5.4%), together accounting for 74.5% of all Live Oak County residents.
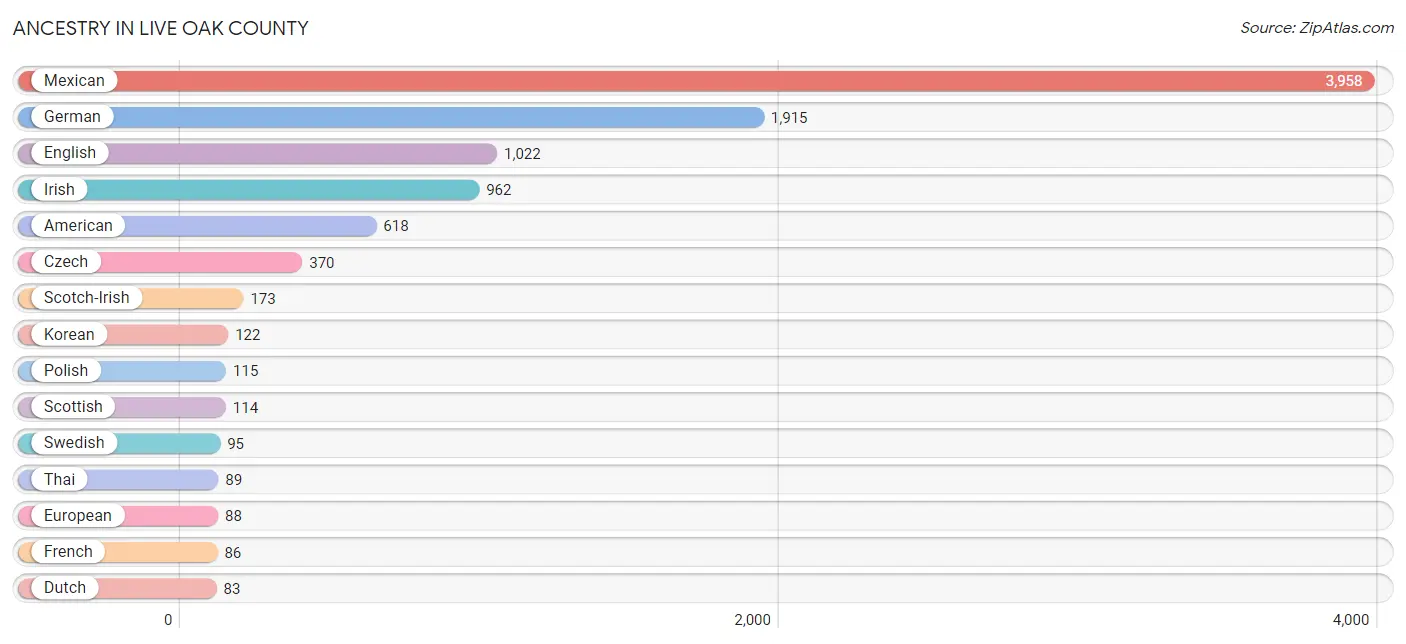
| Ancestry | # Population | % Population |
| African | 26 | 0.2% |
| American | 618 | 5.4% |
| Arab | 28 | 0.3% |
| British | 5 | 0.0% |
| Central American | 12 | 0.1% |
| Cherokee | 53 | 0.5% |
| Choctaw | 53 | 0.5% |
| Czech | 370 | 3.3% |
| Dutch | 83 | 0.7% |
| Egyptian | 28 | 0.3% |
| English | 1,022 | 9.0% |
| European | 88 | 0.8% |
| Finnish | 9 | 0.1% |
| French | 86 | 0.8% |
| French Canadian | 12 | 0.1% |
| German | 1,915 | 16.8% |
| Guatemalan | 3 | 0.0% |
| Indian (Asian) | 42 | 0.4% |
| Irish | 962 | 8.5% |
| Italian | 56 | 0.5% |
| Korean | 122 | 1.1% |
| Lithuanian | 15 | 0.1% |
| Mexican | 3,958 | 34.8% |
| Northern European | 10 | 0.1% |
| Norwegian | 19 | 0.2% |
| Polish | 115 | 1.0% |
| Puerto Rican | 4 | 0.0% |
| Salvadoran | 9 | 0.1% |
| Samoan | 82 | 0.7% |
| Scandinavian | 18 | 0.2% |
| Scotch-Irish | 173 | 1.5% |
| Scottish | 114 | 1.0% |
| Sioux | 13 | 0.1% |
| Spanish | 10 | 0.1% |
| Sri Lankan | 10 | 0.1% |
| Subsaharan African | 26 | 0.2% |
| Swedish | 95 | 0.8% |
| Swiss | 12 | 0.1% |
| Thai | 89 | 0.8% |
| Tohono O'Odham | 9 | 0.1% |
| Welsh | 22 | 0.2% | View All 41 Rows |
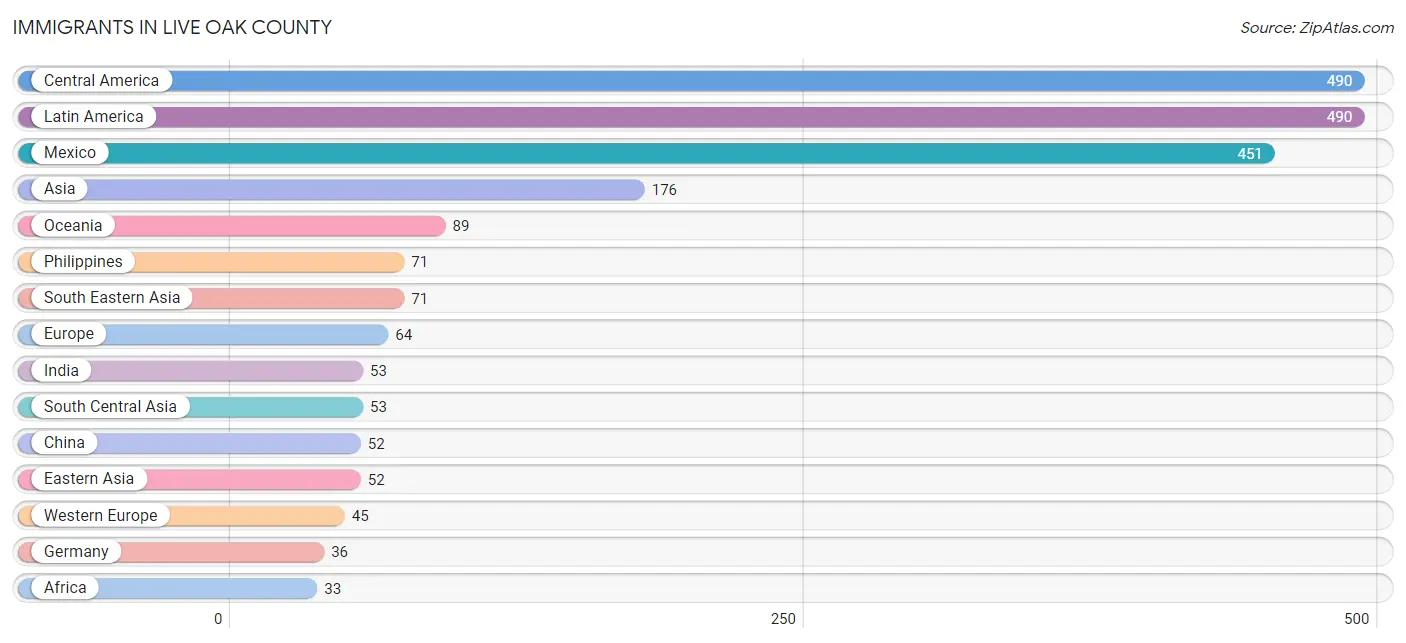
Immigrants in Live Oak County
The most numerous immigrant groups reported in Live Oak County came from Central America (490 | 4.3%), Latin America (490 | 4.3%), Mexico (451 | 4.0%), Asia (176 | 1.5%), and Oceania (89 | 0.8%), together accounting for 14.9% of all Live Oak County residents.
| Immigration Origin | # Population | % Population |
| Africa | 33 | 0.3% |
| Asia | 176 | 1.5% |
| Australia | 7 | 0.1% |
| Central America | 490 | 4.3% |
| China | 52 | 0.5% |
| Eastern Africa | 5 | 0.0% |
| Eastern Asia | 52 | 0.5% |
| Eastern Europe | 5 | 0.0% |
| Egypt | 28 | 0.3% |
| El Salvador | 10 | 0.1% |
| Europe | 64 | 0.6% |
| France | 9 | 0.1% |
| Germany | 36 | 0.3% |
| Guatemala | 19 | 0.2% |
| Honduras | 10 | 0.1% |
| India | 53 | 0.5% |
| Latin America | 490 | 4.3% |
| Mexico | 451 | 4.0% |
| Northern Africa | 28 | 0.3% |
| Northern Europe | 14 | 0.1% |
| Oceania | 89 | 0.8% |
| Philippines | 71 | 0.6% |
| Serbia | 5 | 0.0% |
| South Central Asia | 53 | 0.5% |
| South Eastern Asia | 71 | 0.6% |
| Western Europe | 45 | 0.4% | View All 26 Rows |
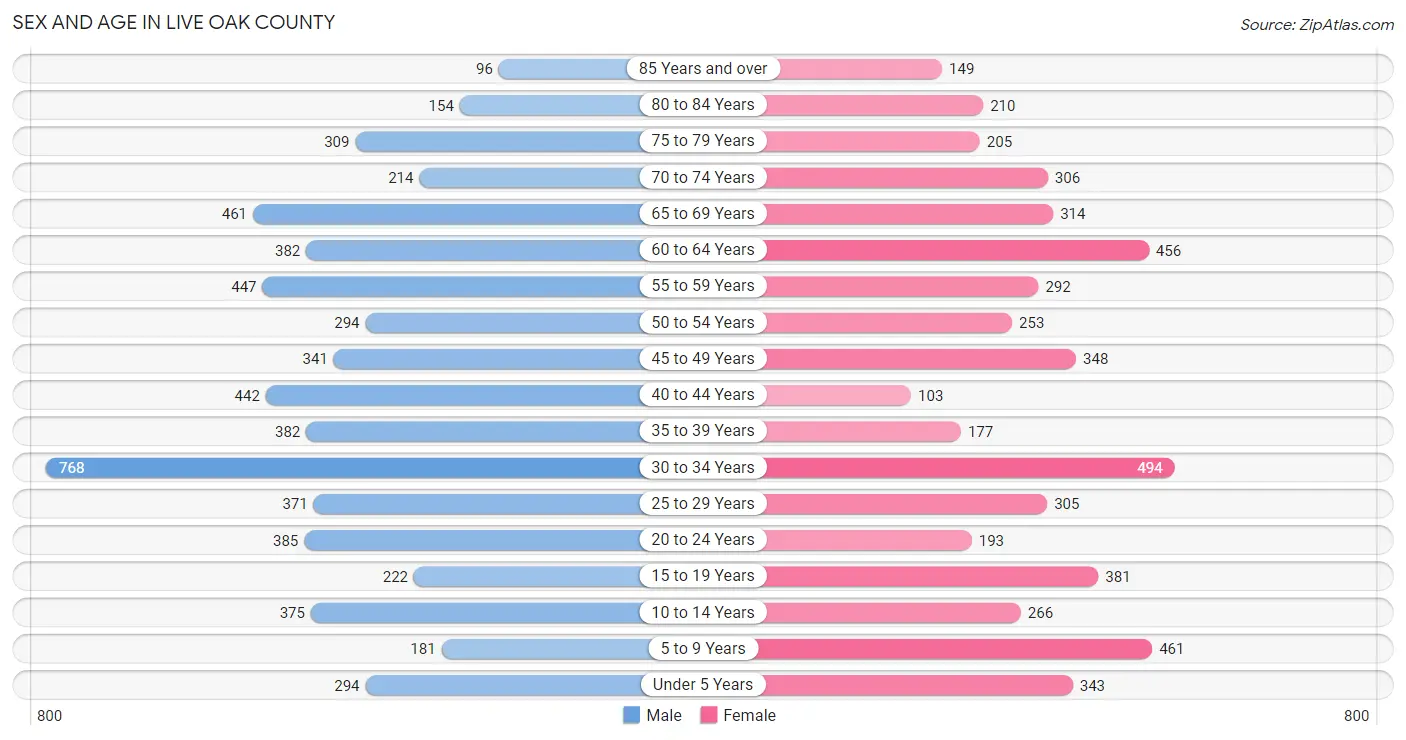
Sex and Age in Live Oak County
Sex and Age in Live Oak County
The most populous age groups in Live Oak County are 30 to 34 Years (768 | 12.6%) for men and 30 to 34 Years (494 | 9.4%) for women.
| Age Bracket | Male | Female |
| Under 5 Years | 294 (4.8%) | 343 (6.5%) |
| 5 to 9 Years | 181 (3.0%) | 461 (8.8%) |
| 10 to 14 Years | 375 (6.1%) | 266 (5.1%) |
| 15 to 19 Years | 222 (3.6%) | 381 (7.2%) |
| 20 to 24 Years | 385 (6.3%) | 193 (3.7%) |
| 25 to 29 Years | 371 (6.1%) | 305 (5.8%) |
| 30 to 34 Years | 768 (12.6%) | 494 (9.4%) |
| 35 to 39 Years | 382 (6.2%) | 177 (3.4%) |
| 40 to 44 Years | 442 (7.2%) | 103 (2.0%) |
| 45 to 49 Years | 341 (5.6%) | 348 (6.6%) |
| 50 to 54 Years | 294 (4.8%) | 253 (4.8%) |
| 55 to 59 Years | 447 (7.3%) | 292 (5.6%) |
| 60 to 64 Years | 382 (6.2%) | 456 (8.7%) |
| 65 to 69 Years | 461 (7.5%) | 314 (6.0%) |
| 70 to 74 Years | 214 (3.5%) | 306 (5.8%) |
| 75 to 79 Years | 309 (5.1%) | 205 (3.9%) |
| 80 to 84 Years | 154 (2.5%) | 210 (4.0%) |
| 85 Years and over | 96 (1.6%) | 149 (2.8%) |
| Total | 6,118 (100.0%) | 5,256 (100.0%) |
Families and Households in Live Oak County
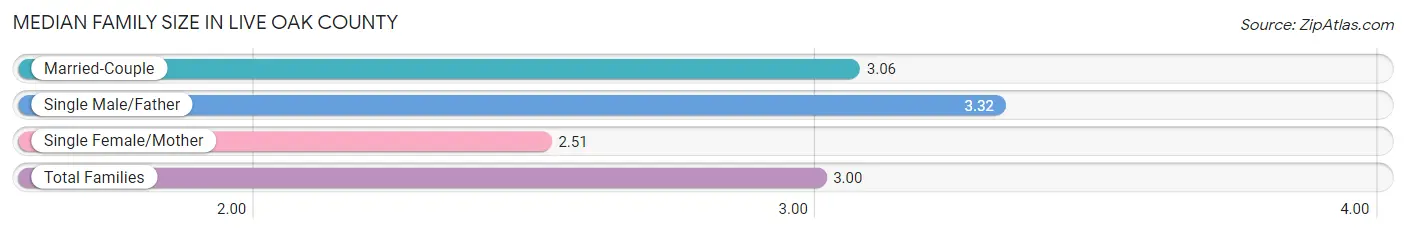
Median Family Size in Live Oak County
The median family size in Live Oak County is 3.00 persons per family, with single male/father families (146 | 5.4%) accounting for the largest median family size of 3.32 persons per family. On the other hand, single female/mother families (372 | 13.8%) represent the smallest median family size with 2.51 persons per family.
| Family Type | # Families | Family Size |
| Married-Couple | 2,172 (80.7%) | 3.06 |
| Single Male/Father | 146 (5.4%) | 3.32 |
| Single Female/Mother | 372 (13.8%) | 2.51 |
| Total Families | 2,690 (100.0%) | 3.00 |
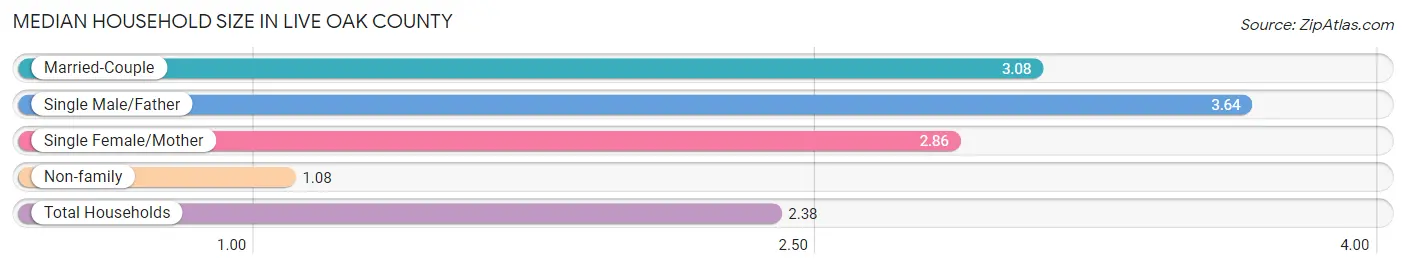
Median Household Size in Live Oak County
The median household size in Live Oak County is 2.38 persons per household, with single male/father households (146 | 3.5%) accounting for the largest median household size of 3.64 persons per household. non-family households (1,463 | 35.2%) represent the smallest median household size with 1.08 persons per household.
| Household Type | # Households | Household Size |
| Married-Couple | 2,172 (52.3%) | 3.08 |
| Single Male/Father | 146 (3.5%) | 3.64 |
| Single Female/Mother | 372 (9.0%) | 2.86 |
| Non-family | 1,463 (35.2%) | 1.08 |
| Total Households | 4,153 (100.0%) | 2.38 |
Household Size by Marriage Status in Live Oak County
Out of a total of 4,153 households in Live Oak County, 2,690 (64.8%) are family households, while 1,463 (35.2%) are nonfamily households. The most numerous type of family households are 2-person households, comprising 1,599, and the most common type of nonfamily households are 1-person households, comprising 1,282.
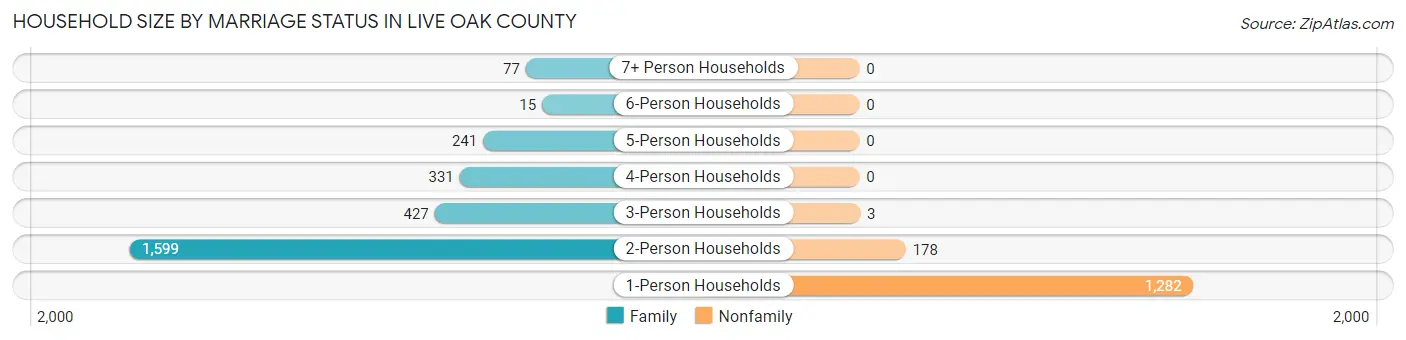
| Household Size | Family Households | Nonfamily Households |
| 1-Person Households | - | 1,282 (30.9%) |
| 2-Person Households | 1,599 (38.5%) | 178 (4.3%) |
| 3-Person Households | 427 (10.3%) | 3 (0.1%) |
| 4-Person Households | 331 (8.0%) | 0 (0.0%) |
| 5-Person Households | 241 (5.8%) | 0 (0.0%) |
| 6-Person Households | 15 (0.4%) | 0 (0.0%) |
| 7+ Person Households | 77 (1.8%) | 0 (0.0%) |
| Total | 2,690 (64.8%) | 1,463 (35.2%) |
Female Fertility in Live Oak County
Fertility by Age in Live Oak County
Average fertility rate in Live Oak County is 86.0 births per 1,000 women. Women in the age bracket of 15 to 19 years have the highest fertility rate with 134.0 births per 1,000 women. Women in the age bracket of 20 to 34 years acount for 70.5% of all women with births.
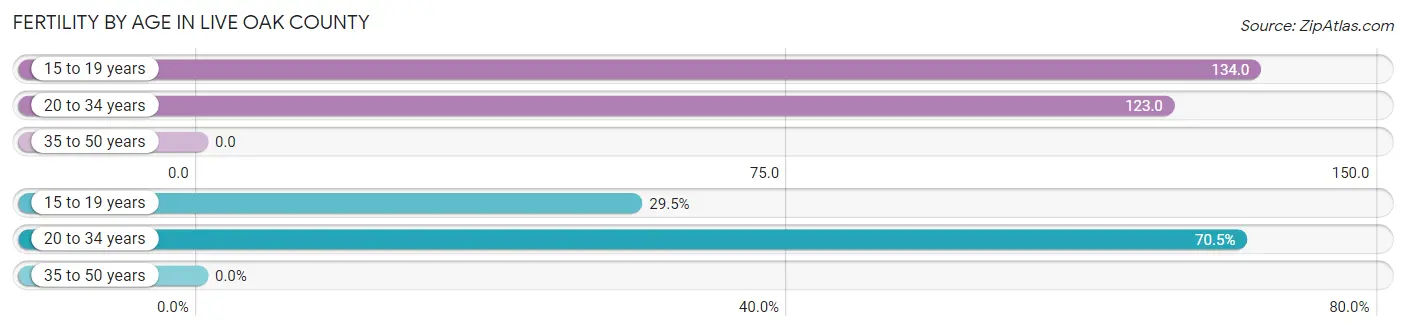
| Age Bracket | Women with Births | Births / 1,000 Women |
| 15 to 19 years | 51 (29.5%) | 134.0 |
| 20 to 34 years | 122 (70.5%) | 123.0 |
| 35 to 50 years | 0 (0.0%) | 0.0 |
| Total | 173 (100.0%) | 86.0 |
Fertility by Age by Marriage Status in Live Oak County
60.1% of women with births (173) in Live Oak County are married. The highest percentage of unmarried women with births falls into 15 to 19 years age bracket with 100.0% of them unmarried at the time of birth, while the lowest percentage of unmarried women with births belong to 20 to 34 years age bracket with 14.7% of them unmarried.
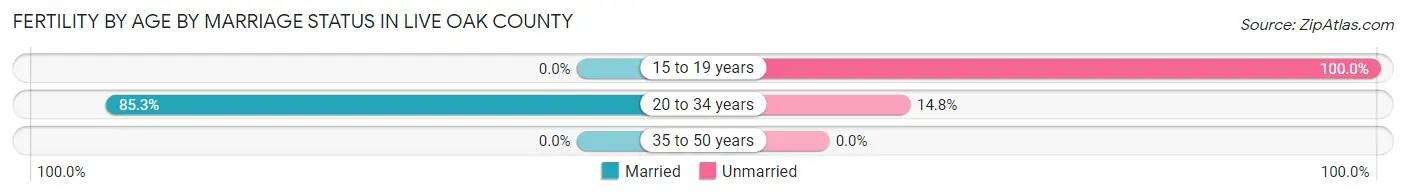
| Age Bracket | Married | Unmarried |
| 15 to 19 years | 0 (0.0%) | 51 (100.0%) |
| 20 to 34 years | 104 (85.3%) | 18 (14.7%) |
| 35 to 50 years | 0 (0.0%) | 0 (0.0%) |
| Total | 104 (60.1%) | 69 (39.9%) |
Fertility by Education in Live Oak County
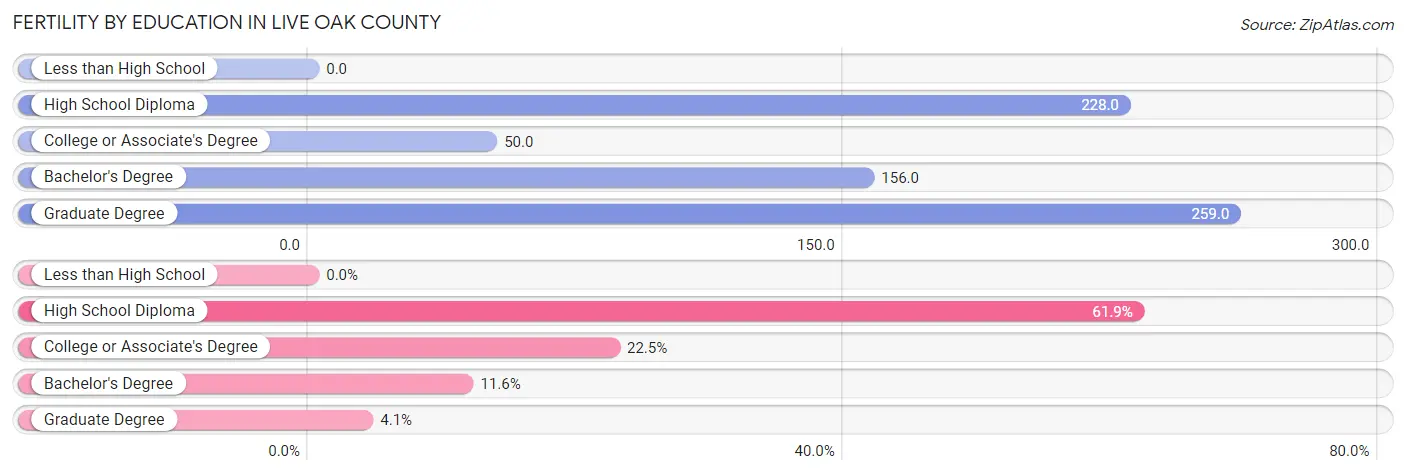
| Educational Attainment | Women with Births | Births / 1,000 Women |
| Less than High School | 0 (0.0%) | 0.0 |
| High School Diploma | 107 (61.9%) | 228.0 |
| College or Associate's Degree | 39 (22.5%) | 50.0 |
| Bachelor's Degree | 20 (11.6%) | 156.0 |
| Graduate Degree | 7 (4.1%) | 259.0 |
| Total | 173 (100.0%) | 86.0 |
Fertility by Education by Marriage Status in Live Oak County
39.9% of women with births in Live Oak County are unmarried. Women with the educational attainment of college or associate's degree are most likely to be married with 100.0% of them married at childbirth, while women with the educational attainment of high school diploma are least likely to be married with 64.5% of them unmarried at childbirth.
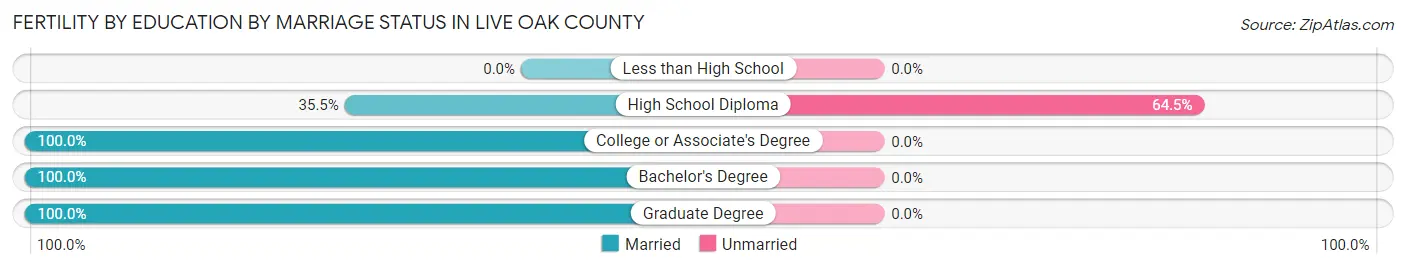
| Educational Attainment | Married | Unmarried |
| Less than High School | 0 (0.0%) | 0 (0.0%) |
| High School Diploma | 38 (35.5%) | 69 (64.5%) |
| College or Associate's Degree | 39 (100.0%) | 0 (0.0%) |
| Bachelor's Degree | 20 (100.0%) | 0 (0.0%) |
| Graduate Degree | 7 (100.0%) | 0 (0.0%) |
| Total | 104 (60.1%) | 69 (39.9%) |
Employment Characteristics in Live Oak County
Employment by Class of Employer in Live Oak County
Among the 4,000 employed individuals in Live Oak County, private company employees (2,621 | 65.5%), local government employees (439 | 11.0%), and self-employed (not incorporated) (364 | 9.1%) make up the most common classes of employment.
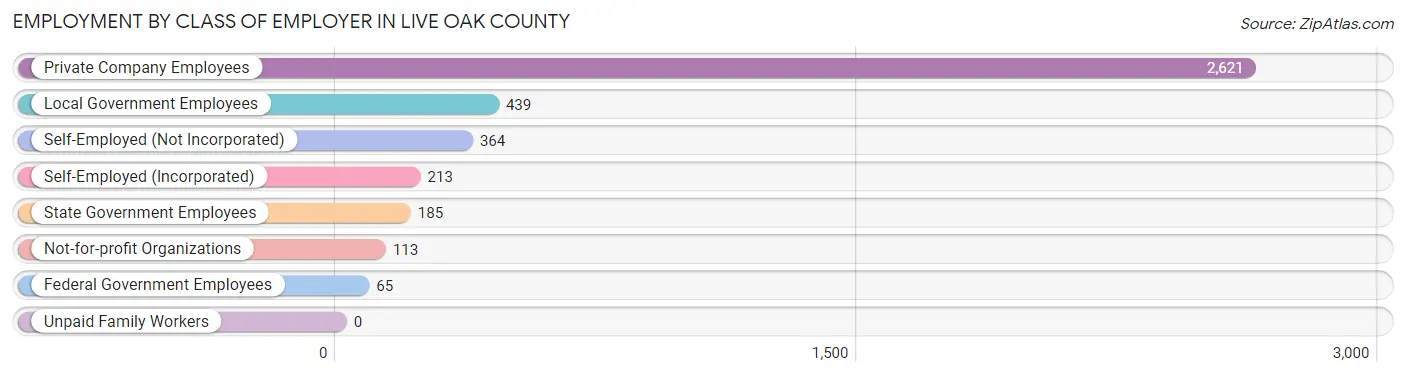
| Employer Class | # Employees | % Employees |
| Private Company Employees | 2,621 | 65.5% |
| Self-Employed (Incorporated) | 213 | 5.3% |
| Self-Employed (Not Incorporated) | 364 | 9.1% |
| Not-for-profit Organizations | 113 | 2.8% |
| Local Government Employees | 439 | 11.0% |
| State Government Employees | 185 | 4.6% |
| Federal Government Employees | 65 | 1.6% |
| Unpaid Family Workers | 0 | 0.0% |
| Total | 4,000 | 100.0% |
Employment Status by Age in Live Oak County
According to the labor force statistics for Live Oak County, out of the total population over 16 years of age (9,388), 44.9% or 4,215 individuals are in the labor force, with 3.6% or 152 of them unemployed. The age group with the highest labor force participation rate is 20 to 24 years, with 67.0% or 387 individuals in the labor force. Within the labor force, the 16 to 19 years age range has the highest percentage of unemployed individuals, with 18.7% or 36 of them being unemployed.
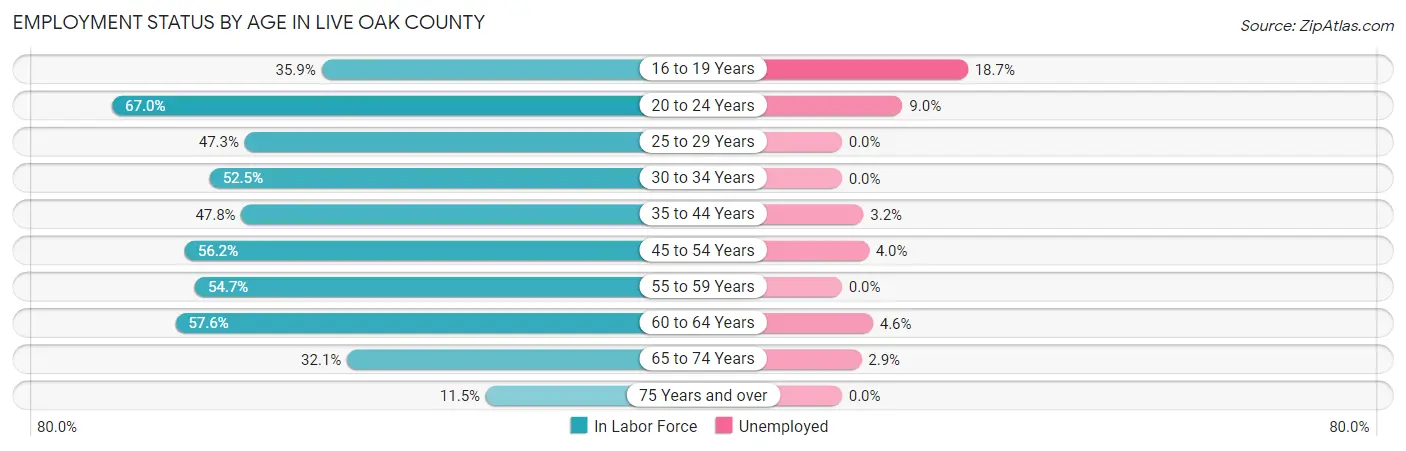
| Age Bracket | In Labor Force | Unemployed |
| 16 to 19 Years | 193 (35.9%) | 36 (18.7%) |
| 20 to 24 Years | 387 (67.0%) | 35 (9.0%) |
| 25 to 29 Years | 320 (47.3%) | 0 (0.0%) |
| 30 to 34 Years | 663 (52.5%) | 0 (0.0%) |
| 35 to 44 Years | 528 (47.8%) | 17 (3.2%) |
| 45 to 54 Years | 695 (56.2%) | 28 (4.0%) |
| 55 to 59 Years | 404 (54.7%) | 0 (0.0%) |
| 60 to 64 Years | 483 (57.6%) | 22 (4.6%) |
| 65 to 74 Years | 416 (32.1%) | 12 (2.9%) |
| 75 Years and over | 129 (11.5%) | 0 (0.0%) |
| Total | 4,215 (44.9%) | 152 (3.6%) |
Employment Status by Educational Attainment in Live Oak County
According to labor force statistics for Live Oak County, 52.8% of individuals (3,091) out of the total population between 25 and 64 years of age (5,855) are in the labor force, with 2.2% or 68 of them being unemployed. The group with the highest labor force participation rate are those with the educational attainment of bachelor's degree or higher, with 81.5% or 590 individuals in the labor force. Within the labor force, individuals with high school diploma education have the highest percentage of unemployment, with 5.5% or 51 of them being unemployed.
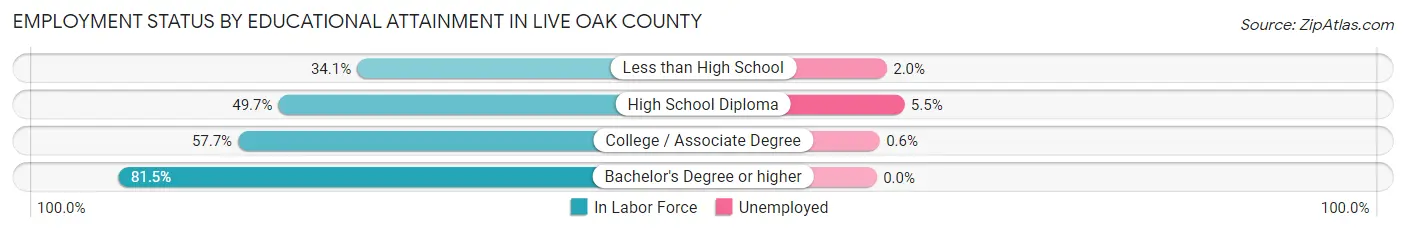
| Educational Attainment | In Labor Force | Unemployed |
| Less than High School | 444 (34.1%) | 26 (2.0%) |
| High School Diploma | 933 (49.7%) | 103 (5.5%) |
| College / Associate Degree | 1,127 (57.7%) | 12 (0.6%) |
| Bachelor's Degree or higher | 590 (81.5%) | 0 (0.0%) |
| Total | 3,091 (52.8%) | 129 (2.2%) |
Employment Occupations by Sex in Live Oak County
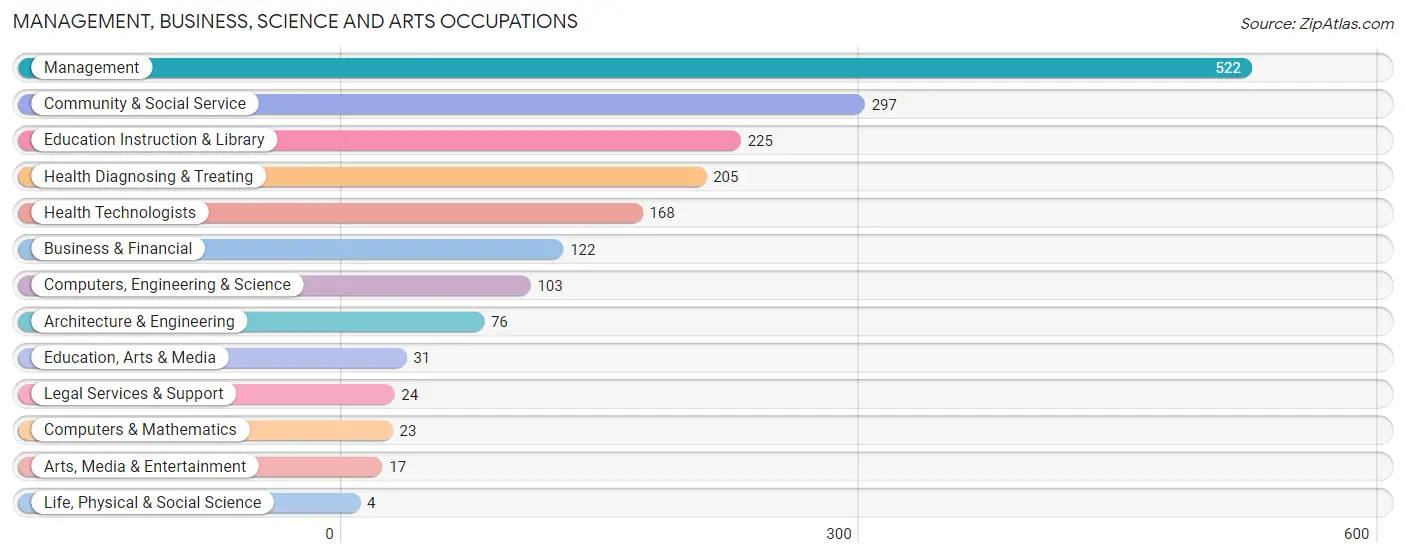
Management, Business, Science and Arts Occupations
The most common Management, Business, Science and Arts occupations in Live Oak County are Management (522 | 12.8%), Community & Social Service (297 | 7.3%), Education Instruction & Library (225 | 5.5%), Health Diagnosing & Treating (205 | 5.0%), and Health Technologists (168 | 4.1%).
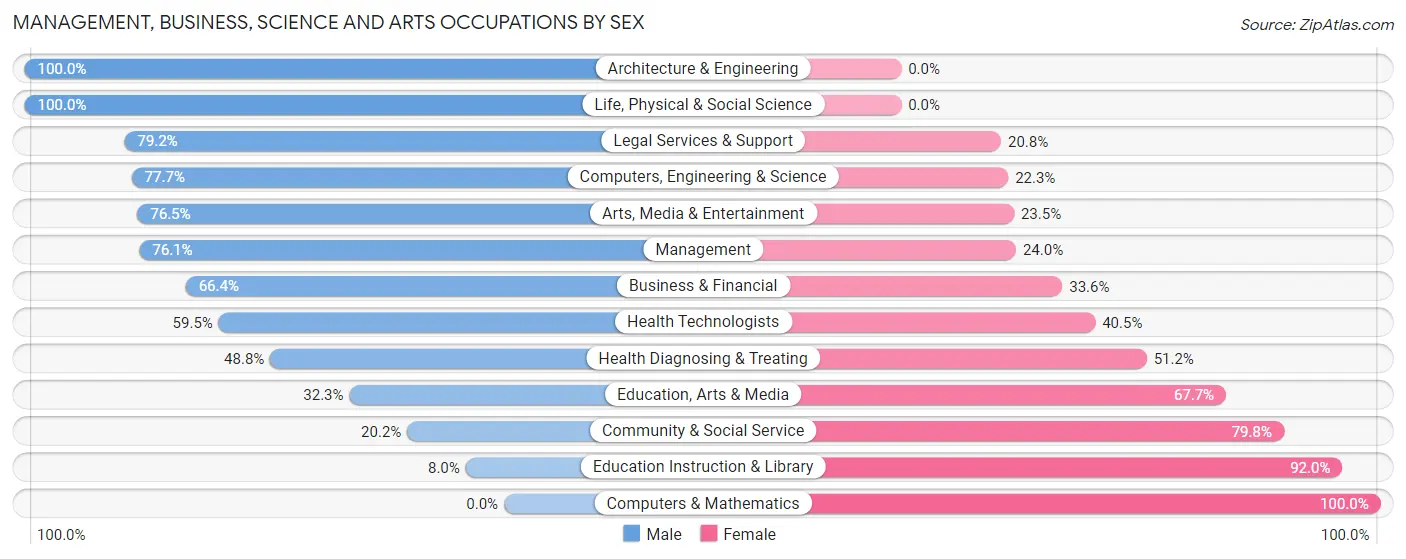
Management, Business, Science and Arts Occupations by Sex
Within the Management, Business, Science and Arts occupations in Live Oak County, the most male-oriented occupations are Architecture & Engineering (100.0%), Life, Physical & Social Science (100.0%), and Legal Services & Support (79.2%), while the most female-oriented occupations are Computers & Mathematics (100.0%), Education Instruction & Library (92.0%), and Community & Social Service (79.8%).
| Occupation | Male | Female |
| Management | 397 (76.0%) | 125 (23.9%) |
| Business & Financial | 81 (66.4%) | 41 (33.6%) |
| Computers, Engineering & Science | 80 (77.7%) | 23 (22.3%) |
| Computers & Mathematics | 0 (0.0%) | 23 (100.0%) |
| Architecture & Engineering | 76 (100.0%) | 0 (0.0%) |
| Life, Physical & Social Science | 4 (100.0%) | 0 (0.0%) |
| Community & Social Service | 60 (20.2%) | 237 (79.8%) |
| Education, Arts & Media | 10 (32.3%) | 21 (67.7%) |
| Legal Services & Support | 19 (79.2%) | 5 (20.8%) |
| Education Instruction & Library | 18 (8.0%) | 207 (92.0%) |
| Arts, Media & Entertainment | 13 (76.5%) | 4 (23.5%) |
| Health Diagnosing & Treating | 100 (48.8%) | 105 (51.2%) |
| Health Technologists | 100 (59.5%) | 68 (40.5%) |
| Total (Category) | 718 (57.5%) | 531 (42.5%) |
| Total (Overall) | 2,465 (60.6%) | 1,602 (39.4%) |
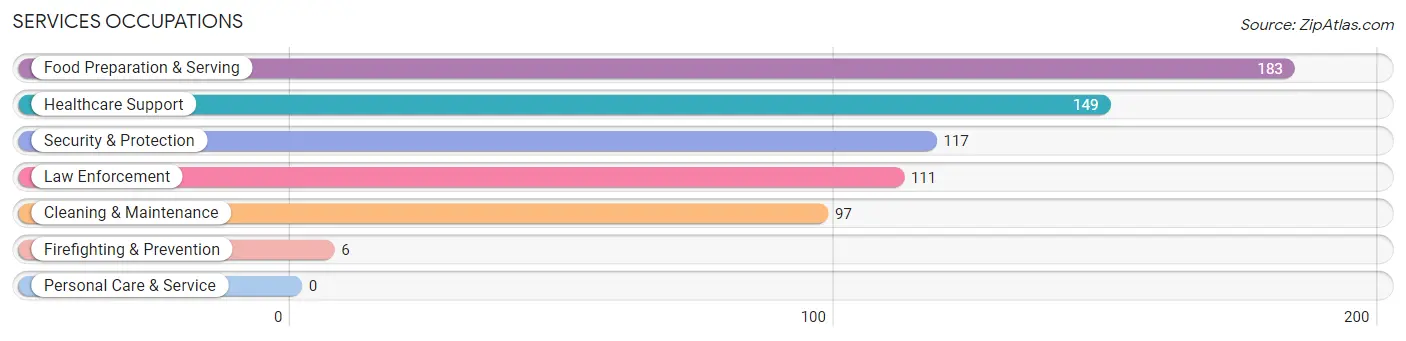
Services Occupations
The most common Services occupations in Live Oak County are Food Preparation & Serving (183 | 4.5%), Healthcare Support (149 | 3.7%), Security & Protection (117 | 2.9%), Law Enforcement (111 | 2.7%), and Cleaning & Maintenance (97 | 2.4%).
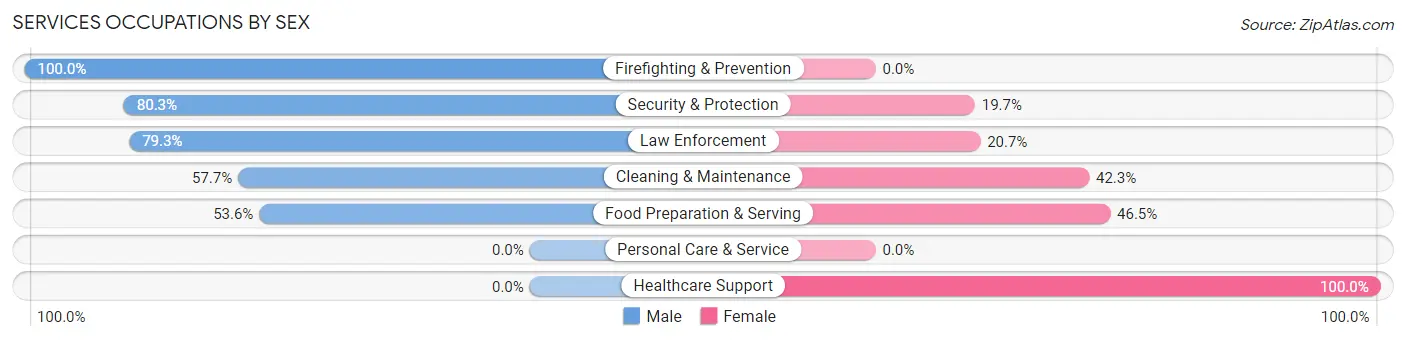
Services Occupations by Sex
Within the Services occupations in Live Oak County, the most male-oriented occupations are Firefighting & Prevention (100.0%), Security & Protection (80.3%), and Law Enforcement (79.3%), while the most female-oriented occupations are Healthcare Support (100.0%), Food Preparation & Serving (46.5%), and Cleaning & Maintenance (42.3%).
| Occupation | Male | Female |
| Healthcare Support | 0 (0.0%) | 149 (100.0%) |
| Security & Protection | 94 (80.3%) | 23 (19.7%) |
| Firefighting & Prevention | 6 (100.0%) | 0 (0.0%) |
| Law Enforcement | 88 (79.3%) | 23 (20.7%) |
| Food Preparation & Serving | 98 (53.5%) | 85 (46.5%) |
| Cleaning & Maintenance | 56 (57.7%) | 41 (42.3%) |
| Personal Care & Service | 0 (0.0%) | 0 (0.0%) |
| Total (Category) | 248 (45.4%) | 298 (54.6%) |
| Total (Overall) | 2,465 (60.6%) | 1,602 (39.4%) |
Sales and Office Occupations
The most common Sales and Office occupations in Live Oak County are Sales & Related (477 | 11.7%), and Office & Administration (426 | 10.5%).

Sales and Office Occupations by Sex
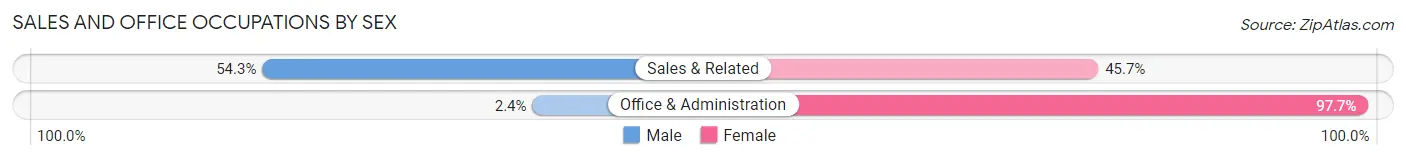
| Occupation | Male | Female |
| Sales & Related | 259 (54.3%) | 218 (45.7%) |
| Office & Administration | 10 (2.4%) | 416 (97.7%) |
| Total (Category) | 269 (29.8%) | 634 (70.2%) |
| Total (Overall) | 2,465 (60.6%) | 1,602 (39.4%) |
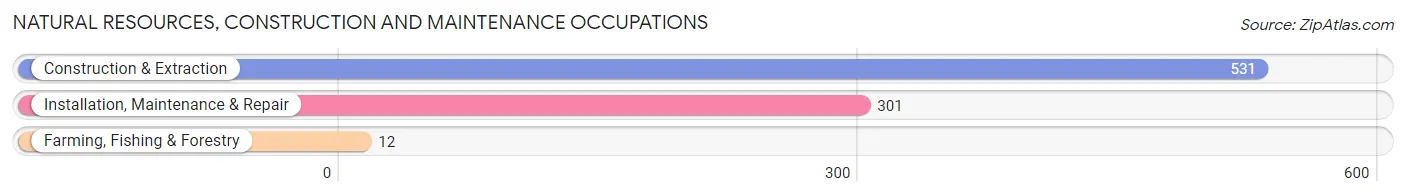
Natural Resources, Construction and Maintenance Occupations
The most common Natural Resources, Construction and Maintenance occupations in Live Oak County are Construction & Extraction (531 | 13.1%), Installation, Maintenance & Repair (301 | 7.4%), and Farming, Fishing & Forestry (12 | 0.3%).
Natural Resources, Construction and Maintenance Occupations by Sex
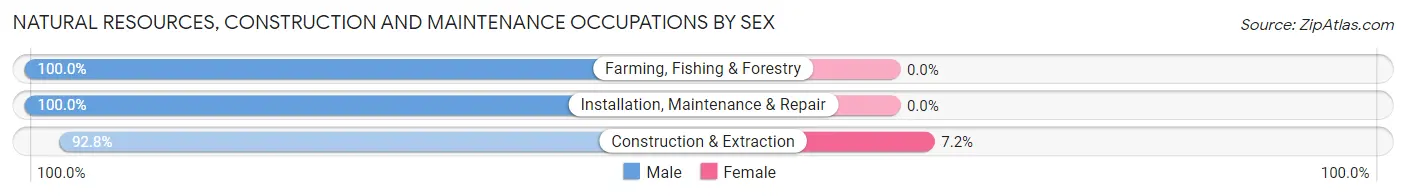
| Occupation | Male | Female |
| Farming, Fishing & Forestry | 12 (100.0%) | 0 (0.0%) |
| Construction & Extraction | 493 (92.8%) | 38 (7.2%) |
| Installation, Maintenance & Repair | 301 (100.0%) | 0 (0.0%) |
| Total (Category) | 806 (95.5%) | 38 (4.5%) |
| Total (Overall) | 2,465 (60.6%) | 1,602 (39.4%) |
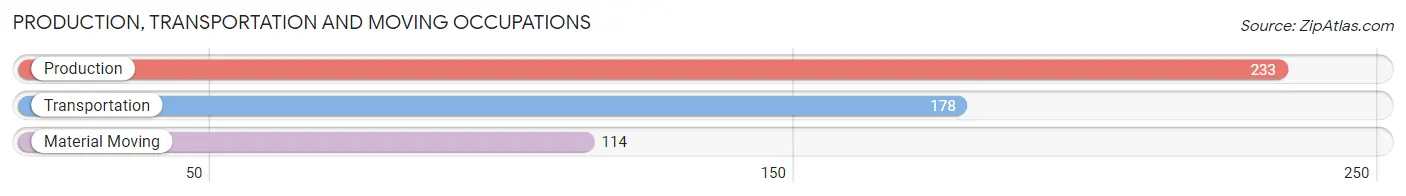
Production, Transportation and Moving Occupations
The most common Production, Transportation and Moving occupations in Live Oak County are Production (233 | 5.7%), Transportation (178 | 4.4%), and Material Moving (114 | 2.8%).
Production, Transportation and Moving Occupations by Sex
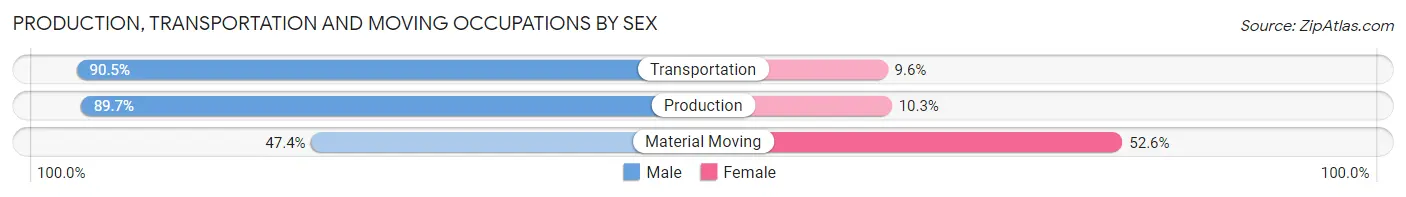
| Occupation | Male | Female |
| Production | 209 (89.7%) | 24 (10.3%) |
| Transportation | 161 (90.4%) | 17 (9.6%) |
| Material Moving | 54 (47.4%) | 60 (52.6%) |
| Total (Category) | 424 (80.8%) | 101 (19.2%) |
| Total (Overall) | 2,465 (60.6%) | 1,602 (39.4%) |
Employment Industries by Sex in Live Oak County
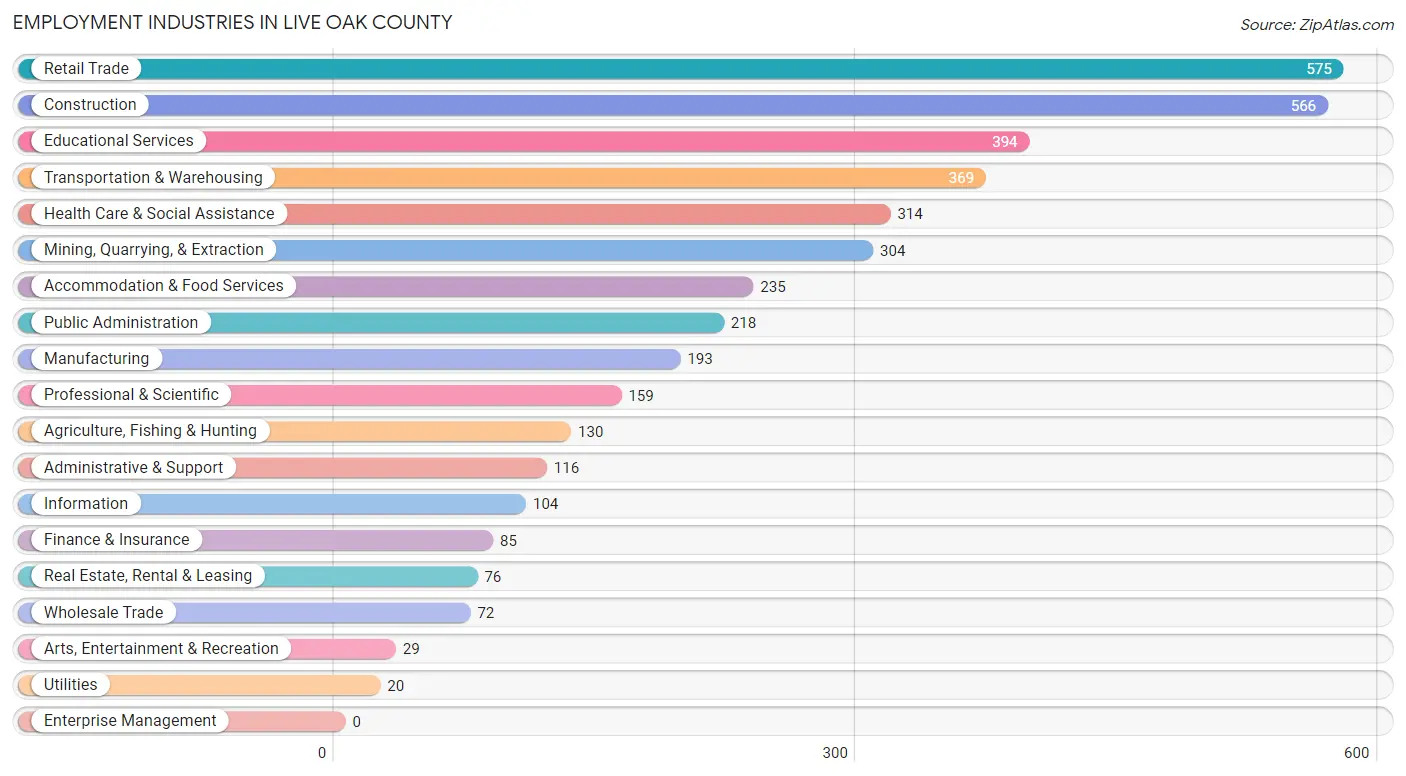
Employment Industries in Live Oak County
The major employment industries in Live Oak County include Retail Trade (575 | 14.1%), Construction (566 | 13.9%), Educational Services (394 | 9.7%), Transportation & Warehousing (369 | 9.1%), and Health Care & Social Assistance (314 | 7.7%).
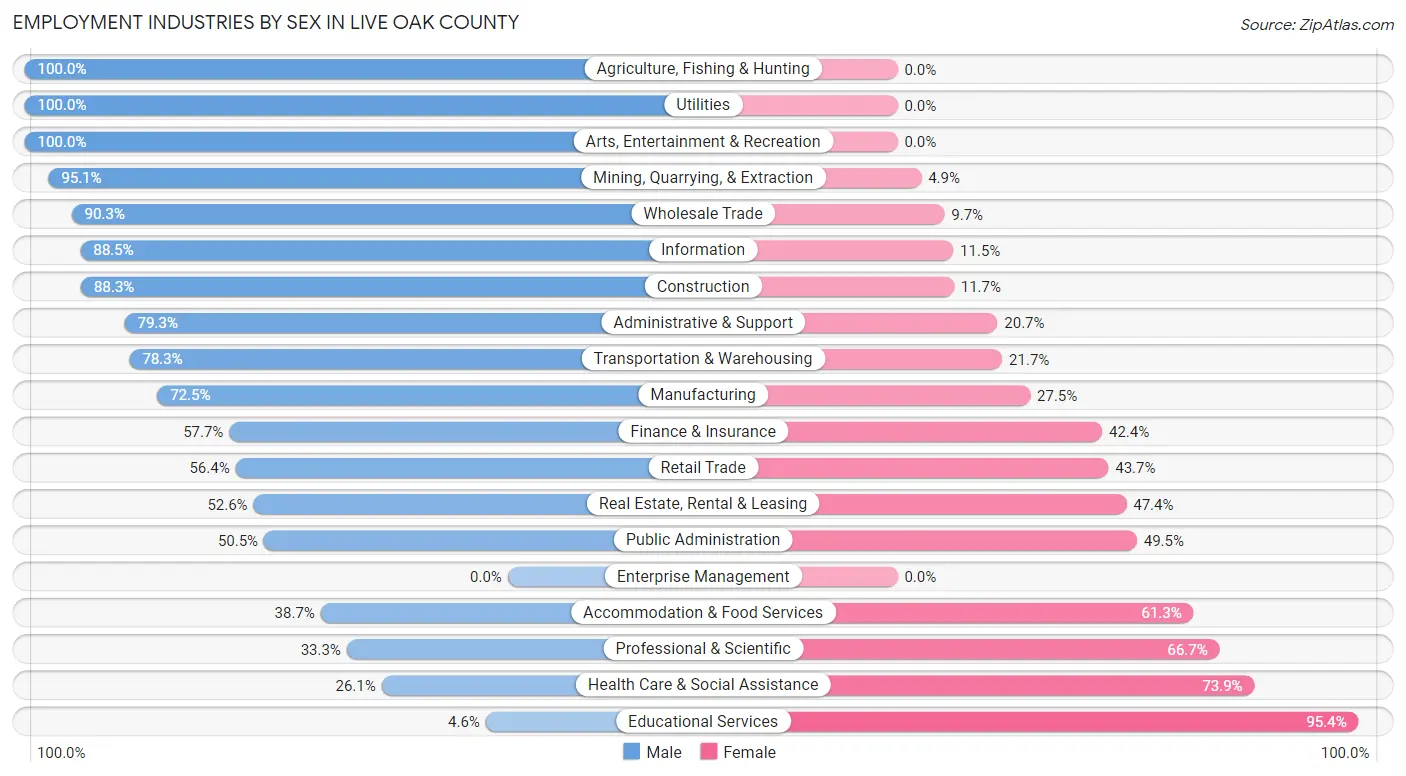
Employment Industries by Sex in Live Oak County
The Live Oak County industries that see more men than women are Agriculture, Fishing & Hunting (100.0%), Utilities (100.0%), and Arts, Entertainment & Recreation (100.0%), whereas the industries that tend to have a higher number of women are Educational Services (95.4%), Health Care & Social Assistance (73.9%), and Professional & Scientific (66.7%).
| Industry | Male | Female |
| Agriculture, Fishing & Hunting | 130 (100.0%) | 0 (0.0%) |
| Mining, Quarrying, & Extraction | 289 (95.1%) | 15 (4.9%) |
| Construction | 500 (88.3%) | 66 (11.7%) |
| Manufacturing | 140 (72.5%) | 53 (27.5%) |
| Wholesale Trade | 65 (90.3%) | 7 (9.7%) |
| Retail Trade | 324 (56.4%) | 251 (43.6%) |
| Transportation & Warehousing | 289 (78.3%) | 80 (21.7%) |
| Utilities | 20 (100.0%) | 0 (0.0%) |
| Information | 92 (88.5%) | 12 (11.5%) |
| Finance & Insurance | 49 (57.7%) | 36 (42.3%) |
| Real Estate, Rental & Leasing | 40 (52.6%) | 36 (47.4%) |
| Professional & Scientific | 53 (33.3%) | 106 (66.7%) |
| Enterprise Management | 0 (0.0%) | 0 (0.0%) |
| Administrative & Support | 92 (79.3%) | 24 (20.7%) |
| Educational Services | 18 (4.6%) | 376 (95.4%) |
| Health Care & Social Assistance | 82 (26.1%) | 232 (73.9%) |
| Arts, Entertainment & Recreation | 29 (100.0%) | 0 (0.0%) |
| Accommodation & Food Services | 91 (38.7%) | 144 (61.3%) |
| Public Administration | 110 (50.5%) | 108 (49.5%) |
| Total | 2,465 (60.6%) | 1,602 (39.4%) |
Education in Live Oak County
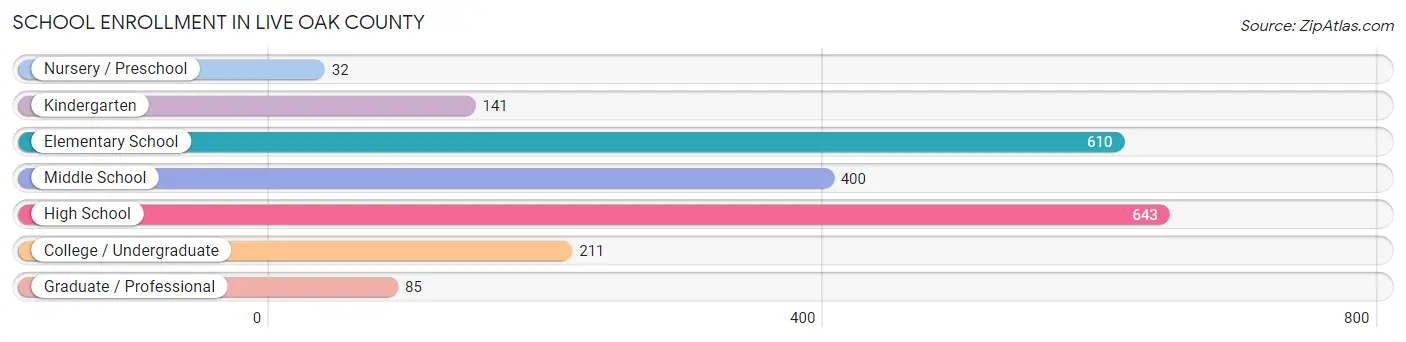
School Enrollment in Live Oak County
The most common levels of schooling among the 2,122 students in Live Oak County are high school (643 | 30.3%), elementary school (610 | 28.7%), and middle school (400 | 18.9%).
| School Level | # Students | % Students |
| Nursery / Preschool | 32 | 1.5% |
| Kindergarten | 141 | 6.6% |
| Elementary School | 610 | 28.7% |
| Middle School | 400 | 18.9% |
| High School | 643 | 30.3% |
| College / Undergraduate | 211 | 9.9% |
| Graduate / Professional | 85 | 4.0% |
| Total | 2,122 | 100.0% |
School Enrollment by Age by Funding Source in Live Oak County
Out of a total of 2,122 students who are enrolled in schools in Live Oak County, 115 (5.4%) attend a private institution, while the remaining 2,007 (94.6%) are enrolled in public schools. The age group of 35 years and over has the highest likelihood of being enrolled in private schools, with 52 (55.9% in the age bracket) enrolled. Conversely, the age group of 3 to 4 year olds has the lowest likelihood of being enrolled in a private school, with 32 (100.0% in the age bracket) attending a public institution.
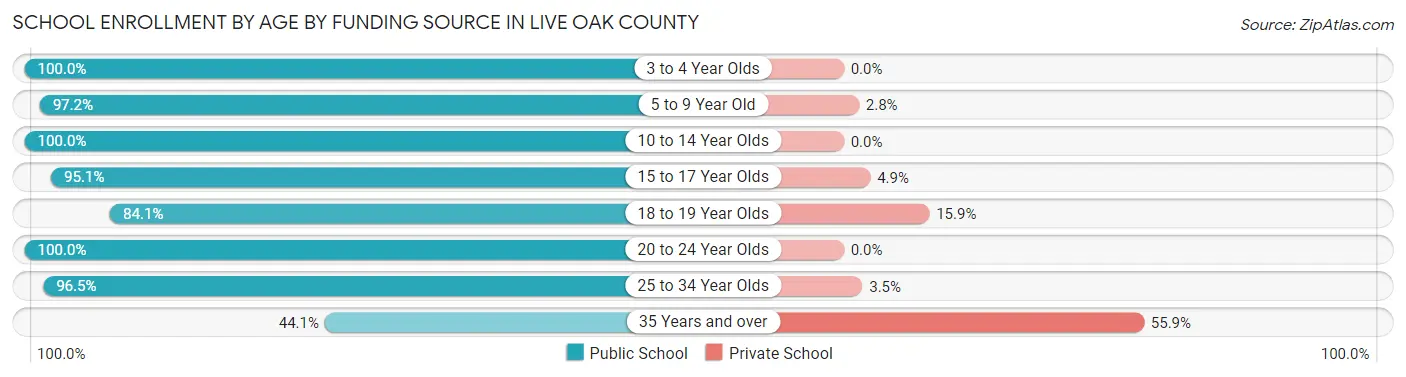
| Age Bracket | Public School | Private School |
| 3 to 4 Year Olds | 32 (100.0%) | 0 (0.0%) |
| 5 to 9 Year Old | 618 (97.2%) | 18 (2.8%) |
| 10 to 14 Year Olds | 576 (100.0%) | 0 (0.0%) |
| 15 to 17 Year Olds | 250 (95.1%) | 13 (4.9%) |
| 18 to 19 Year Olds | 116 (84.1%) | 22 (15.9%) |
| 20 to 24 Year Olds | 96 (100.0%) | 0 (0.0%) |
| 25 to 34 Year Olds | 278 (96.5%) | 10 (3.5%) |
| 35 Years and over | 41 (44.1%) | 52 (55.9%) |
| Total | 2,007 (94.6%) | 115 (5.4%) |
Educational Attainment by Field of Study in Live Oak County
Education (254 | 21.6%), business (211 | 17.9%), physical & health sciences (193 | 16.4%), liberal arts & history (122 | 10.4%), and bio, nature & agricultural (100 | 8.5%) are the most common fields of study among 1,178 individuals in Live Oak County who have obtained a bachelor's degree or higher.
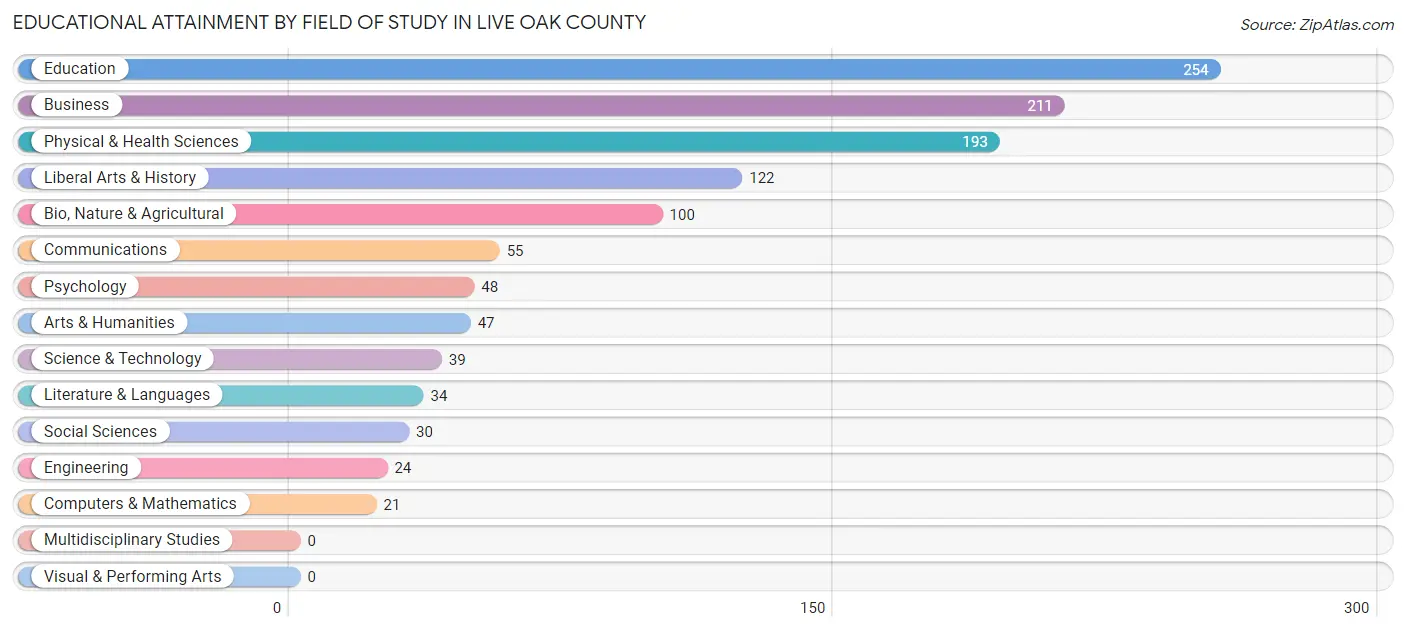
| Field of Study | # Graduates | % Graduates |
| Computers & Mathematics | 21 | 1.8% |
| Bio, Nature & Agricultural | 100 | 8.5% |
| Physical & Health Sciences | 193 | 16.4% |
| Psychology | 48 | 4.1% |
| Social Sciences | 30 | 2.5% |
| Engineering | 24 | 2.0% |
| Multidisciplinary Studies | 0 | 0.0% |
| Science & Technology | 39 | 3.3% |
| Business | 211 | 17.9% |
| Education | 254 | 21.6% |
| Literature & Languages | 34 | 2.9% |
| Liberal Arts & History | 122 | 10.4% |
| Visual & Performing Arts | 0 | 0.0% |
| Communications | 55 | 4.7% |
| Arts & Humanities | 47 | 4.0% |
| Total | 1,178 | 100.0% |
Transportation & Commute in Live Oak County
Vehicle Availability by Sex in Live Oak County
The most prevalent vehicle ownership categories in Live Oak County are males with 2 vehicles (1,027, accounting for 42.6%) and females with 2 vehicles (641, making up 66.2%).
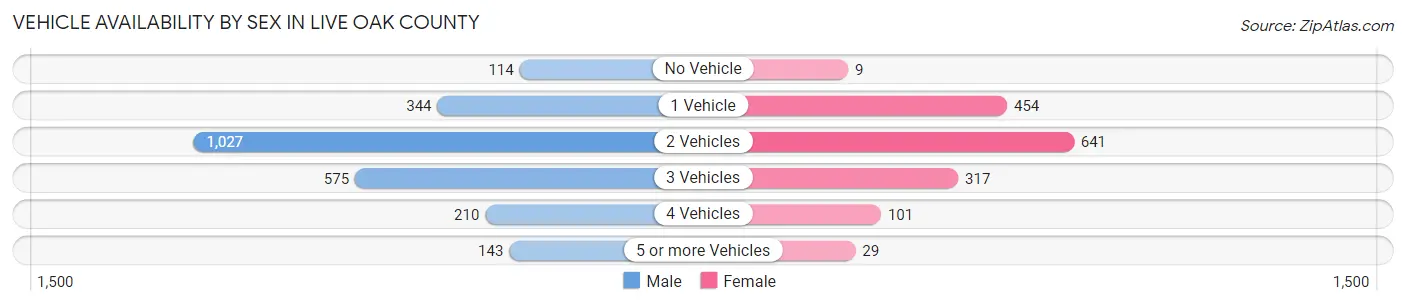
| Vehicles Available | Male | Female |
| No Vehicle | 114 (4.7%) | 9 (0.6%) |
| 1 Vehicle | 344 (14.3%) | 454 (29.3%) |
| 2 Vehicles | 1,027 (42.6%) | 641 (41.3%) |
| 3 Vehicles | 575 (23.8%) | 317 (20.4%) |
| 4 Vehicles | 210 (8.7%) | 101 (6.5%) |
| 5 or more Vehicles | 143 (5.9%) | 29 (1.9%) |
| Total | 2,413 (100.0%) | 1,551 (100.0%) |
Commute Time in Live Oak County
The most frequently occuring commute durations in Live Oak County are 10 to 14 minutes (619 commuters, 17.0%), 5 to 9 minutes (595 commuters, 16.3%), and 15 to 19 minutes (509 commuters, 13.9%).
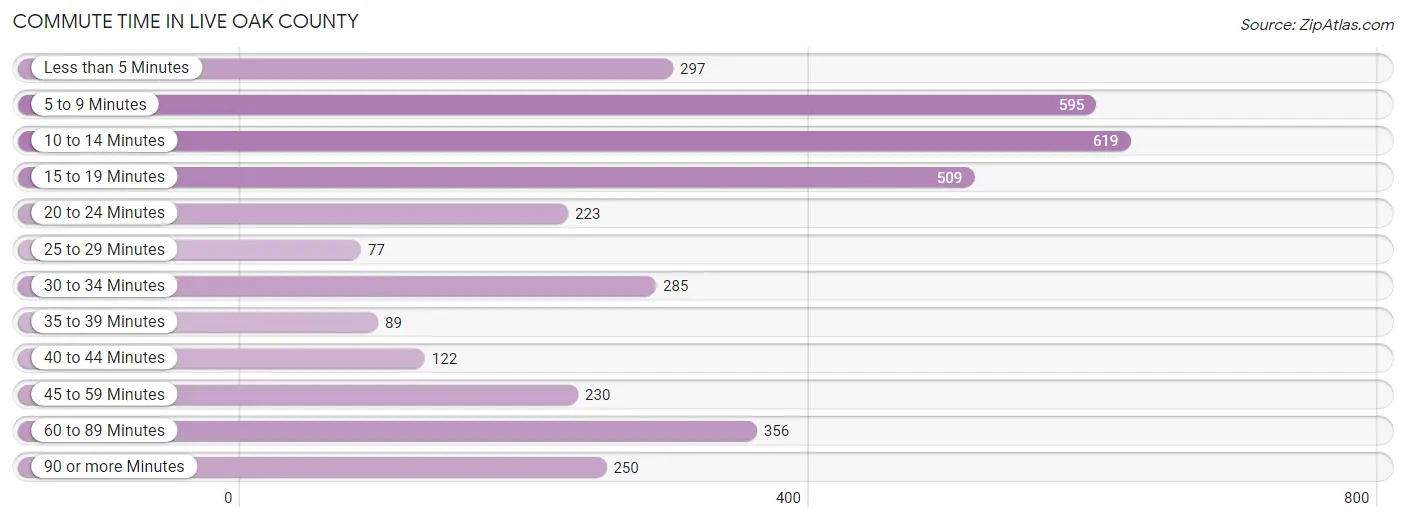
| Commute Time | # Commuters | % Commuters |
| Less than 5 Minutes | 297 | 8.1% |
| 5 to 9 Minutes | 595 | 16.3% |
| 10 to 14 Minutes | 619 | 17.0% |
| 15 to 19 Minutes | 509 | 13.9% |
| 20 to 24 Minutes | 223 | 6.1% |
| 25 to 29 Minutes | 77 | 2.1% |
| 30 to 34 Minutes | 285 | 7.8% |
| 35 to 39 Minutes | 89 | 2.4% |
| 40 to 44 Minutes | 122 | 3.3% |
| 45 to 59 Minutes | 230 | 6.3% |
| 60 to 89 Minutes | 356 | 9.8% |
| 90 or more Minutes | 250 | 6.9% |
Commute Time by Sex in Live Oak County
The most common commute times in Live Oak County are 10 to 14 minutes (424 commuters, 18.4%) for males and 5 to 9 minutes (251 commuters, 18.5%) for females.
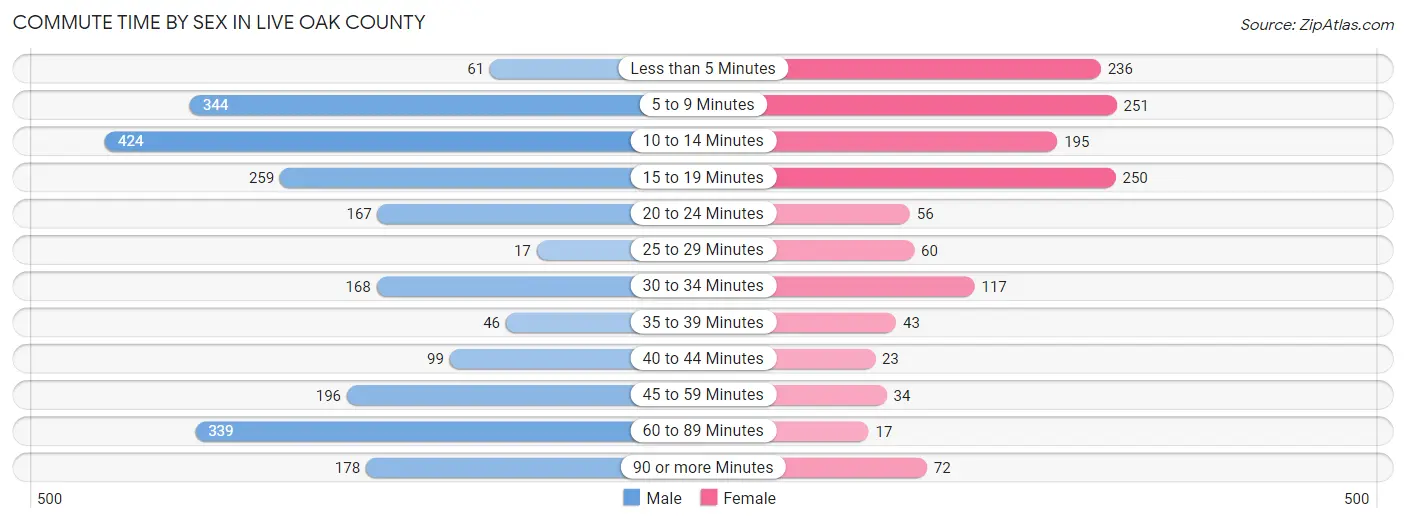
| Commute Time | Male | Female |
| Less than 5 Minutes | 61 (2.6%) | 236 (17.4%) |
| 5 to 9 Minutes | 344 (15.0%) | 251 (18.5%) |
| 10 to 14 Minutes | 424 (18.4%) | 195 (14.4%) |
| 15 to 19 Minutes | 259 (11.3%) | 250 (18.5%) |
| 20 to 24 Minutes | 167 (7.3%) | 56 (4.1%) |
| 25 to 29 Minutes | 17 (0.7%) | 60 (4.4%) |
| 30 to 34 Minutes | 168 (7.3%) | 117 (8.6%) |
| 35 to 39 Minutes | 46 (2.0%) | 43 (3.2%) |
| 40 to 44 Minutes | 99 (4.3%) | 23 (1.7%) |
| 45 to 59 Minutes | 196 (8.5%) | 34 (2.5%) |
| 60 to 89 Minutes | 339 (14.7%) | 17 (1.3%) |
| 90 or more Minutes | 178 (7.7%) | 72 (5.3%) |
Time of Departure to Work by Sex in Live Oak County
The most frequent times of departure to work in Live Oak County are 6:30 AM to 6:59 AM (475, 20.7%) for males and 7:30 AM to 7:59 AM (307, 22.7%) for females.
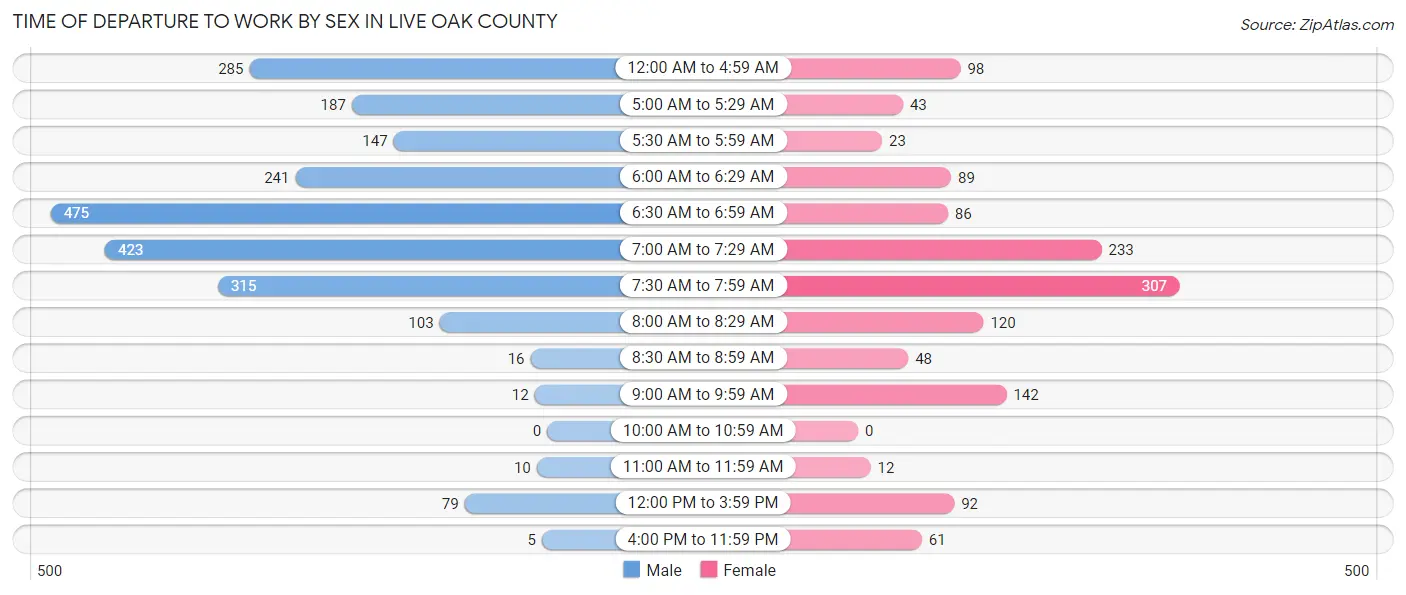
| Time of Departure | Male | Female |
| 12:00 AM to 4:59 AM | 285 (12.4%) | 98 (7.2%) |
| 5:00 AM to 5:29 AM | 187 (8.1%) | 43 (3.2%) |
| 5:30 AM to 5:59 AM | 147 (6.4%) | 23 (1.7%) |
| 6:00 AM to 6:29 AM | 241 (10.5%) | 89 (6.6%) |
| 6:30 AM to 6:59 AM | 475 (20.7%) | 86 (6.4%) |
| 7:00 AM to 7:29 AM | 423 (18.4%) | 233 (17.2%) |
| 7:30 AM to 7:59 AM | 315 (13.7%) | 307 (22.7%) |
| 8:00 AM to 8:29 AM | 103 (4.5%) | 120 (8.9%) |
| 8:30 AM to 8:59 AM | 16 (0.7%) | 48 (3.5%) |
| 9:00 AM to 9:59 AM | 12 (0.5%) | 142 (10.5%) |
| 10:00 AM to 10:59 AM | 0 (0.0%) | 0 (0.0%) |
| 11:00 AM to 11:59 AM | 10 (0.4%) | 12 (0.9%) |
| 12:00 PM to 3:59 PM | 79 (3.4%) | 92 (6.8%) |
| 4:00 PM to 11:59 PM | 5 (0.2%) | 61 (4.5%) |
| Total | 2,298 (100.0%) | 1,354 (100.0%) |
Housing Occupancy in Live Oak County
Occupancy by Ownership in Live Oak County
Of the total 4,153 dwellings in Live Oak County, owner-occupied units account for 3,108 (74.8%), while renter-occupied units make up 1,045 (25.2%).
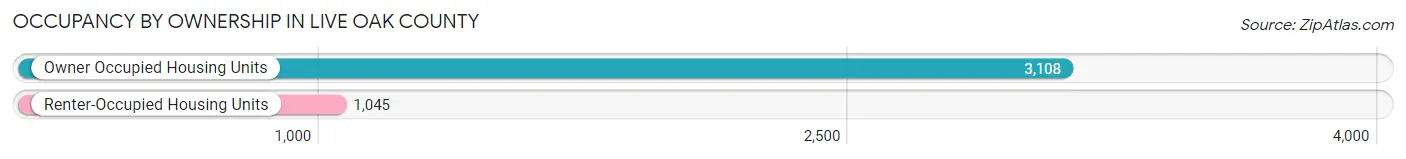
| Occupancy | # Housing Units | % Housing Units |
| Owner Occupied Housing Units | 3,108 | 74.8% |
| Renter-Occupied Housing Units | 1,045 | 25.2% |
| Total Occupied Housing Units | 4,153 | 100.0% |
Occupancy by Household Size in Live Oak County
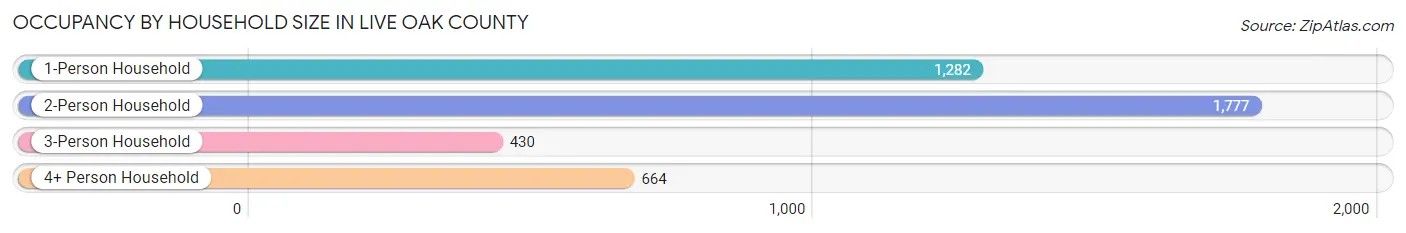
| Household Size | # Housing Units | % Housing Units |
| 1-Person Household | 1,282 | 30.9% |
| 2-Person Household | 1,777 | 42.8% |
| 3-Person Household | 430 | 10.3% |
| 4+ Person Household | 664 | 16.0% |
| Total Housing Units | 4,153 | 100.0% |
Occupancy by Ownership by Household Size in Live Oak County
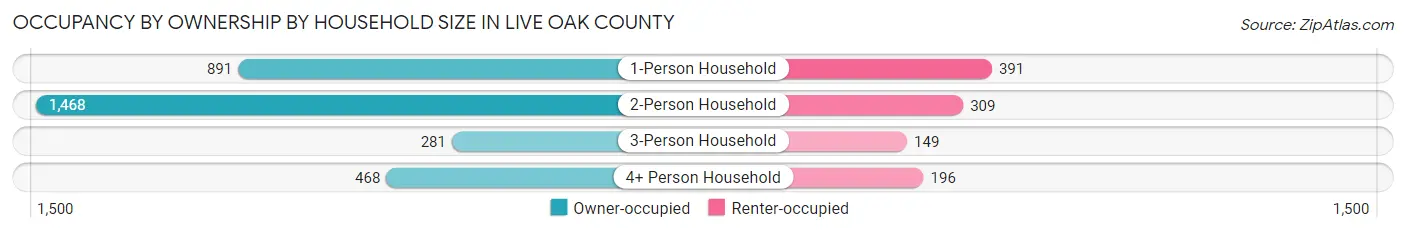
| Household Size | Owner-occupied | Renter-occupied |
| 1-Person Household | 891 (69.5%) | 391 (30.5%) |
| 2-Person Household | 1,468 (82.6%) | 309 (17.4%) |
| 3-Person Household | 281 (65.3%) | 149 (34.6%) |
| 4+ Person Household | 468 (70.5%) | 196 (29.5%) |
| Total Housing Units | 3,108 (74.8%) | 1,045 (25.2%) |
Occupancy by Educational Attainment in Live Oak County
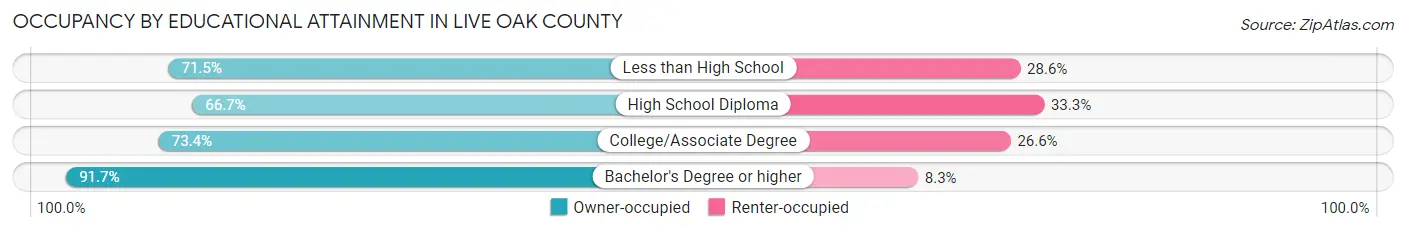
| Household Size | Owner-occupied | Renter-occupied |
| Less than High School | 543 (71.5%) | 217 (28.5%) |
| High School Diploma | 696 (66.7%) | 347 (33.3%) |
| College/Associate Degree | 1,147 (73.4%) | 416 (26.6%) |
| Bachelor's Degree or higher | 722 (91.7%) | 65 (8.3%) |
Occupancy by Age of Householder in Live Oak County
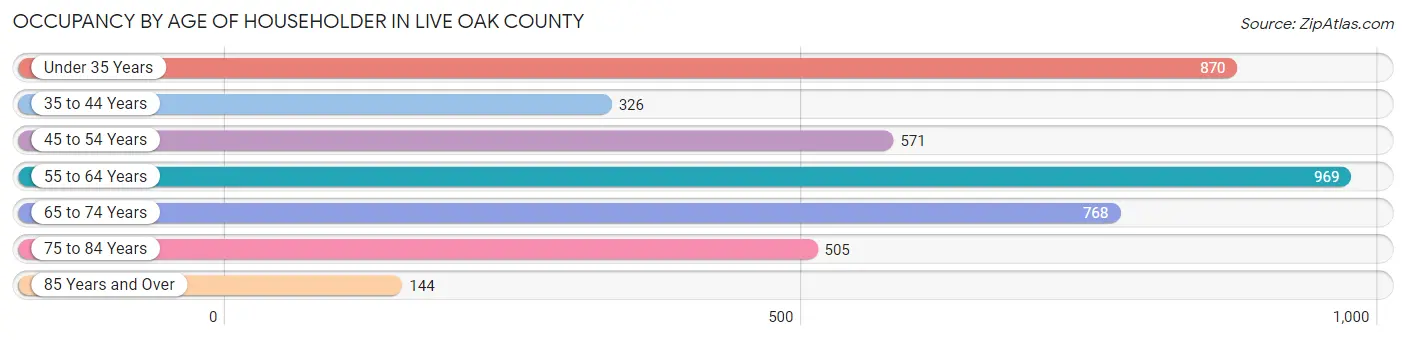
| Age Bracket | # Households | % Households |
| Under 35 Years | 870 | 20.9% |
| 35 to 44 Years | 326 | 7.9% |
| 45 to 54 Years | 571 | 13.8% |
| 55 to 64 Years | 969 | 23.3% |
| 65 to 74 Years | 768 | 18.5% |
| 75 to 84 Years | 505 | 12.2% |
| 85 Years and Over | 144 | 3.5% |
| Total | 4,153 | 100.0% |
Housing Finances in Live Oak County
Median Income by Occupancy in Live Oak County
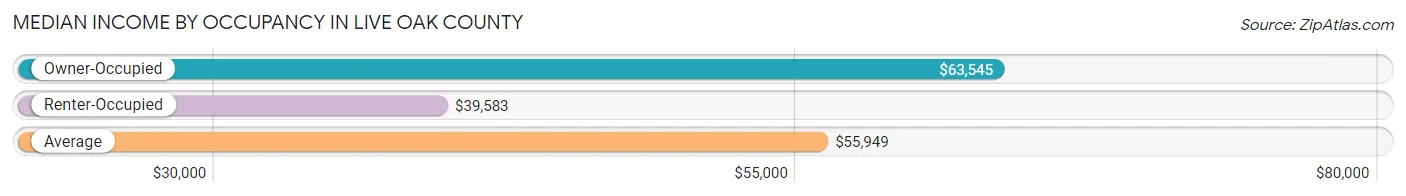
| Occupancy Type | # Households | Median Income |
| Owner-Occupied | 3,108 (74.8%) | $63,545 |
| Renter-Occupied | 1,045 (25.2%) | $39,583 |
| Average | 4,153 (100.0%) | $55,949 |
Occupancy by Householder Income Bracket in Live Oak County
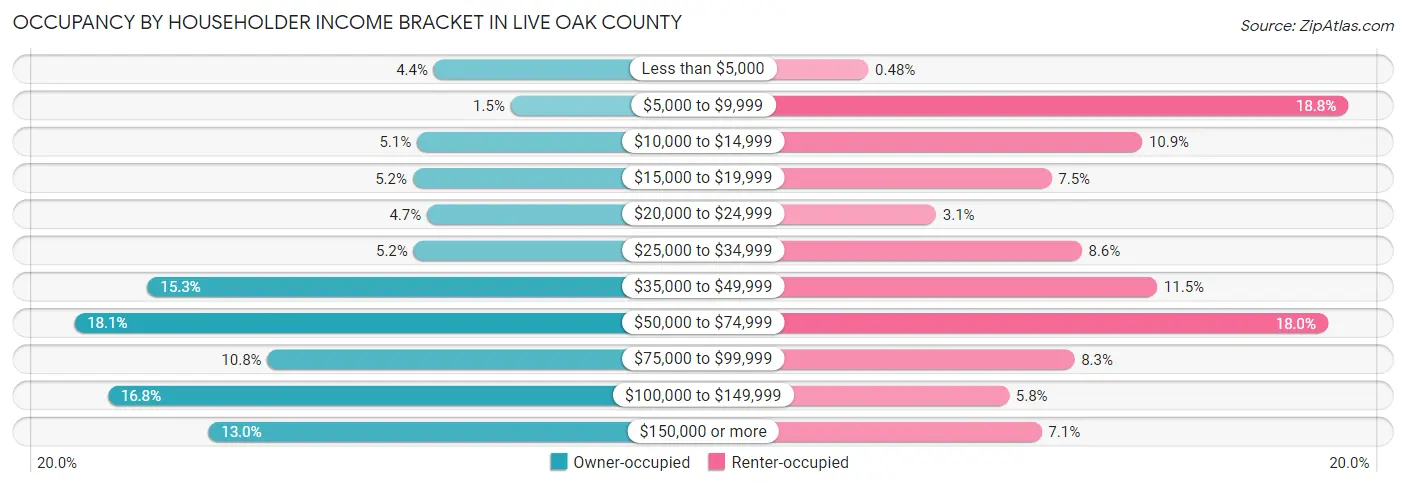
| Income Bracket | Owner-occupied | Renter-occupied |
| Less than $5,000 | 137 (4.4%) | 5 (0.5%) |
| $5,000 to $9,999 | 46 (1.5%) | 196 (18.8%) |
| $10,000 to $14,999 | 157 (5.1%) | 114 (10.9%) |
| $15,000 to $19,999 | 162 (5.2%) | 78 (7.5%) |
| $20,000 to $24,999 | 145 (4.7%) | 32 (3.1%) |
| $25,000 to $34,999 | 161 (5.2%) | 90 (8.6%) |
| $35,000 to $49,999 | 476 (15.3%) | 120 (11.5%) |
| $50,000 to $74,999 | 563 (18.1%) | 188 (18.0%) |
| $75,000 to $99,999 | 334 (10.7%) | 87 (8.3%) |
| $100,000 to $149,999 | 523 (16.8%) | 61 (5.8%) |
| $150,000 or more | 404 (13.0%) | 74 (7.1%) |
| Total | 3,108 (100.0%) | 1,045 (100.0%) |
Monthly Housing Cost Tiers in Live Oak County
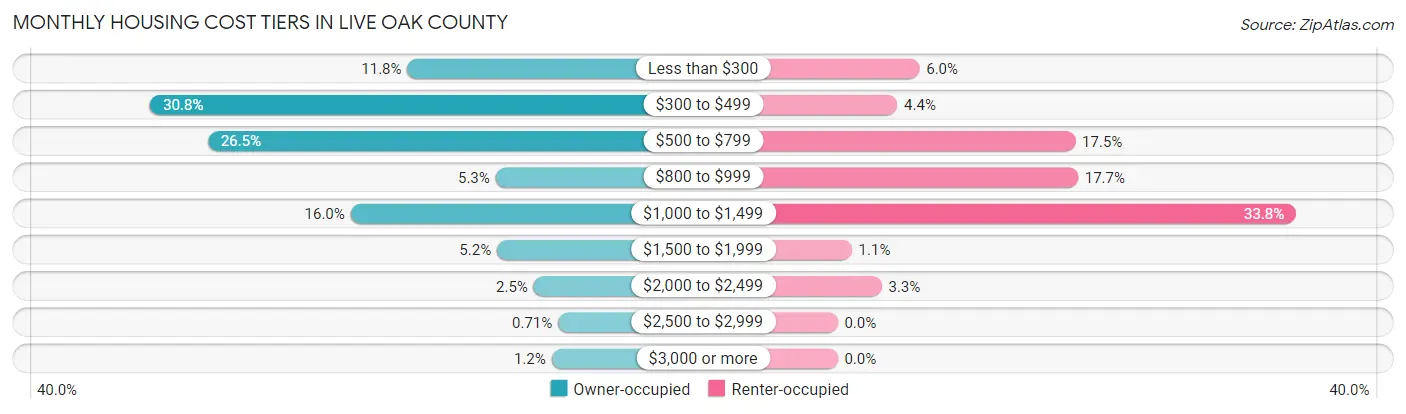
| Monthly Cost | Owner-occupied | Renter-occupied |
| Less than $300 | 367 (11.8%) | 63 (6.0%) |
| $300 to $499 | 956 (30.8%) | 46 (4.4%) |
| $500 to $799 | 824 (26.5%) | 183 (17.5%) |
| $800 to $999 | 165 (5.3%) | 185 (17.7%) |
| $1,000 to $1,499 | 497 (16.0%) | 353 (33.8%) |
| $1,500 to $1,999 | 162 (5.2%) | 11 (1.1%) |
| $2,000 to $2,499 | 78 (2.5%) | 34 (3.3%) |
| $2,500 to $2,999 | 22 (0.7%) | 0 (0.0%) |
| $3,000 or more | 37 (1.2%) | 0 (0.0%) |
| Total | 3,108 (100.0%) | 1,045 (100.0%) |
Physical Housing Characteristics in Live Oak County
Housing Structures in Live Oak County
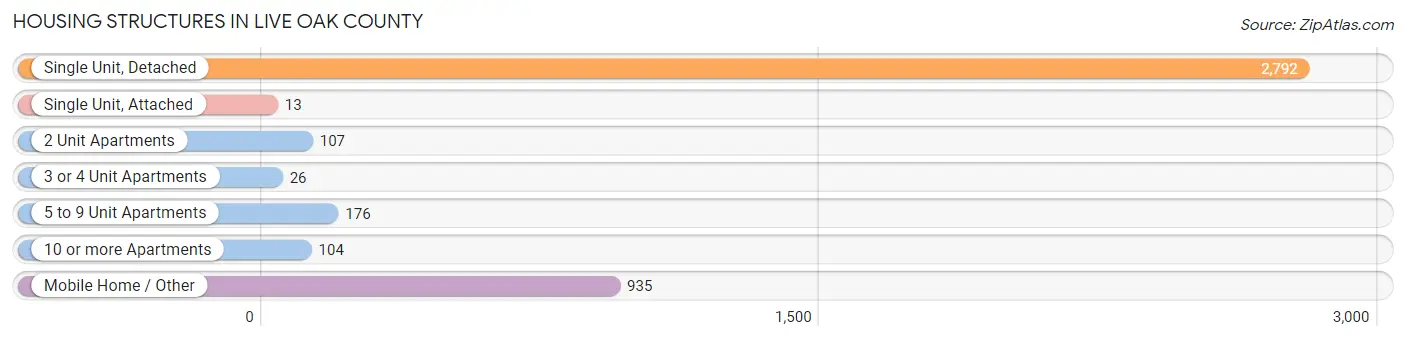
| Structure Type | # Housing Units | % Housing Units |
| Single Unit, Detached | 2,792 | 67.2% |
| Single Unit, Attached | 13 | 0.3% |
| 2 Unit Apartments | 107 | 2.6% |
| 3 or 4 Unit Apartments | 26 | 0.6% |
| 5 to 9 Unit Apartments | 176 | 4.2% |
| 10 or more Apartments | 104 | 2.5% |
| Mobile Home / Other | 935 | 22.5% |
| Total | 4,153 | 100.0% |
Housing Structures by Occupancy in Live Oak County
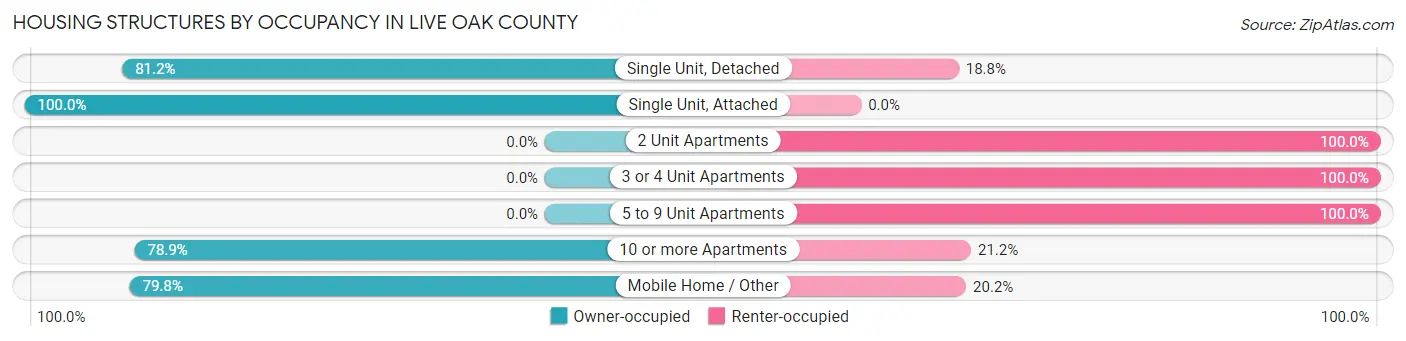
| Structure Type | Owner-occupied | Renter-occupied |
| Single Unit, Detached | 2,267 (81.2%) | 525 (18.8%) |
| Single Unit, Attached | 13 (100.0%) | 0 (0.0%) |
| 2 Unit Apartments | 0 (0.0%) | 107 (100.0%) |
| 3 or 4 Unit Apartments | 0 (0.0%) | 26 (100.0%) |
| 5 to 9 Unit Apartments | 0 (0.0%) | 176 (100.0%) |
| 10 or more Apartments | 82 (78.8%) | 22 (21.1%) |
| Mobile Home / Other | 746 (79.8%) | 189 (20.2%) |
| Total | 3,108 (74.8%) | 1,045 (25.2%) |
Housing Structures by Number of Rooms in Live Oak County
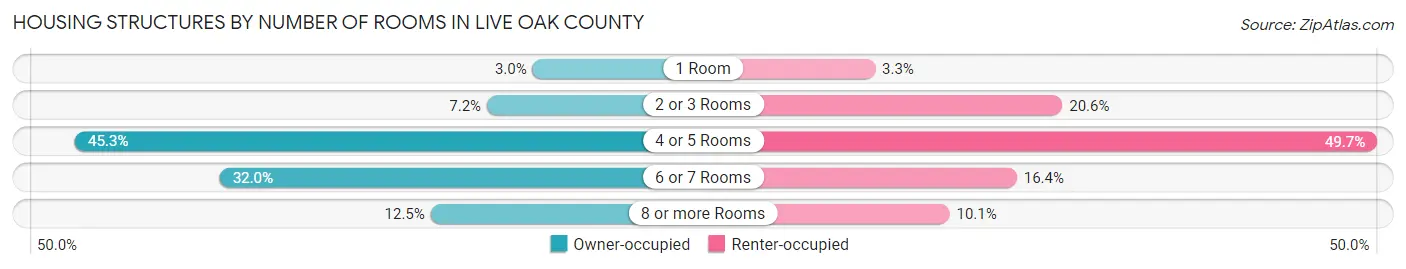
| Number of Rooms | Owner-occupied | Renter-occupied |
| 1 Room | 94 (3.0%) | 34 (3.3%) |
| 2 or 3 Rooms | 225 (7.2%) | 215 (20.6%) |
| 4 or 5 Rooms | 1,409 (45.3%) | 519 (49.7%) |
| 6 or 7 Rooms | 993 (32.0%) | 171 (16.4%) |
| 8 or more Rooms | 387 (12.4%) | 106 (10.1%) |
| Total | 3,108 (100.0%) | 1,045 (100.0%) |
Housing Structure by Heating Type in Live Oak County
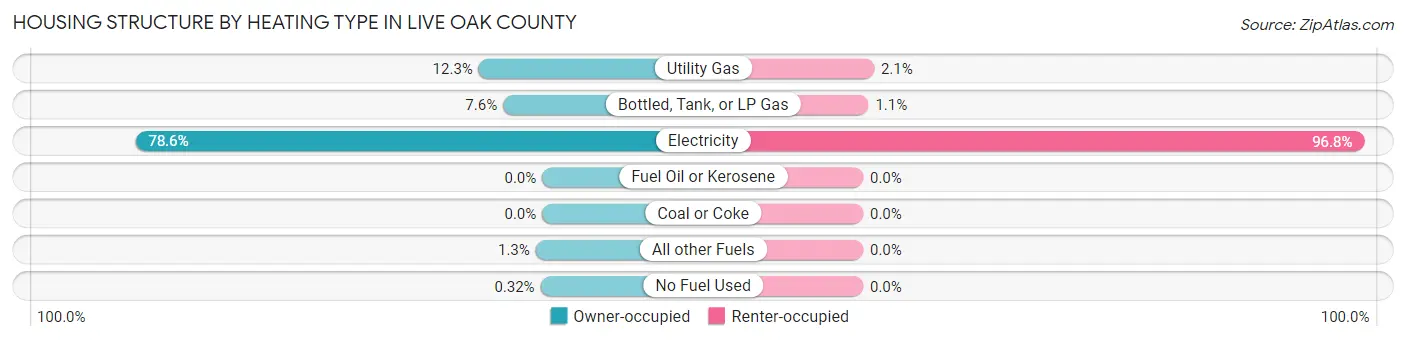
| Heating Type | Owner-occupied | Renter-occupied |
| Utility Gas | 381 (12.3%) | 22 (2.1%) |
| Bottled, Tank, or LP Gas | 235 (7.6%) | 11 (1.1%) |
| Electricity | 2,443 (78.6%) | 1,012 (96.8%) |
| Fuel Oil or Kerosene | 0 (0.0%) | 0 (0.0%) |
| Coal or Coke | 0 (0.0%) | 0 (0.0%) |
| All other Fuels | 39 (1.3%) | 0 (0.0%) |
| No Fuel Used | 10 (0.3%) | 0 (0.0%) |
| Total | 3,108 (100.0%) | 1,045 (100.0%) |
Household Vehicle Usage in Live Oak County
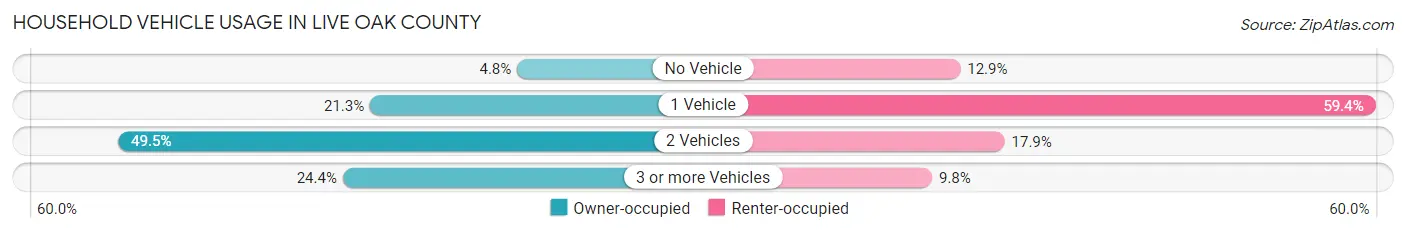
| Vehicles per Household | Owner-occupied | Renter-occupied |
| No Vehicle | 150 (4.8%) | 135 (12.9%) |
| 1 Vehicle | 662 (21.3%) | 621 (59.4%) |
| 2 Vehicles | 1,539 (49.5%) | 187 (17.9%) |
| 3 or more Vehicles | 757 (24.4%) | 102 (9.8%) |
| Total | 3,108 (100.0%) | 1,045 (100.0%) |
Real Estate & Mortgages in Live Oak County
Real Estate and Mortgage Overview in Live Oak County
| Characteristic | Without Mortgage | With Mortgage |
| Housing Units | 2,281 | 827 |
| Median Property Value | $133,200 | $166,800 |
| Median Household Income | $50,120 | $194 |
| Monthly Housing Costs | $446 | $37 |
| Real Estate Taxes | $1,222 | $74 |
Property Value by Mortgage Status in Live Oak County
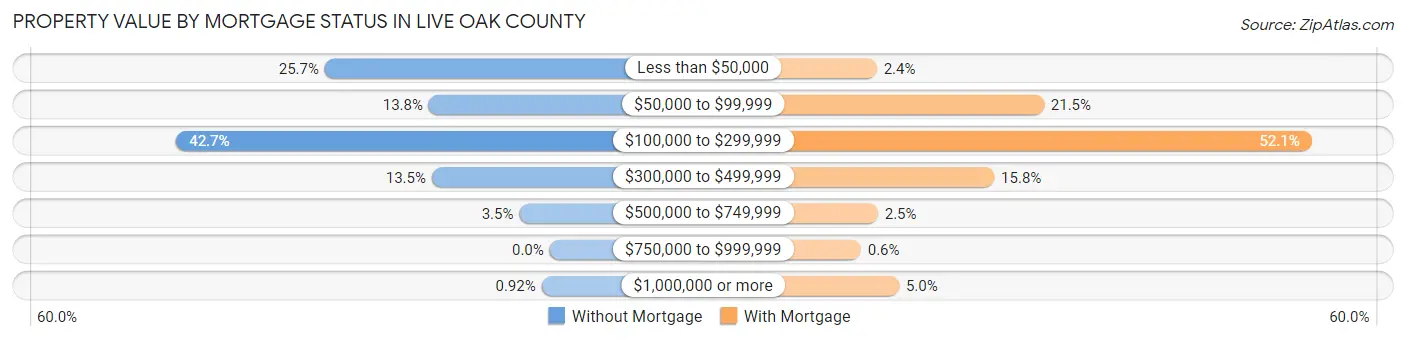
| Property Value | Without Mortgage | With Mortgage |
| Less than $50,000 | 586 (25.7%) | 20 (2.4%) |
| $50,000 to $99,999 | 315 (13.8%) | 178 (21.5%) |
| $100,000 to $299,999 | 973 (42.7%) | 431 (52.1%) |
| $300,000 to $499,999 | 307 (13.5%) | 131 (15.8%) |
| $500,000 to $749,999 | 79 (3.5%) | 21 (2.5%) |
| $750,000 to $999,999 | 0 (0.0%) | 5 (0.6%) |
| $1,000,000 or more | 21 (0.9%) | 41 (5.0%) |
| Total | 2,281 (100.0%) | 827 (100.0%) |
Household Income by Mortgage Status in Live Oak County
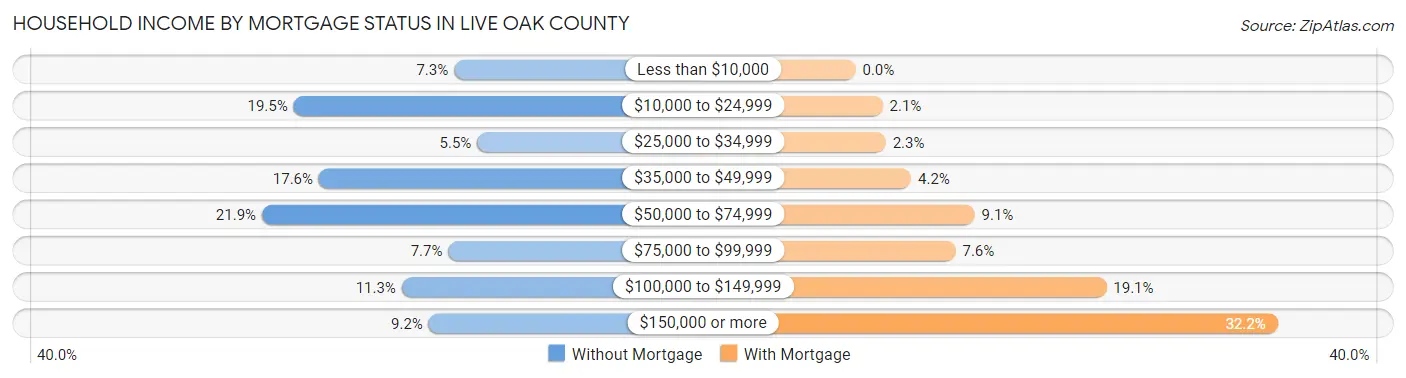
| Household Income | Without Mortgage | With Mortgage |
| Less than $10,000 | 166 (7.3%) | 0 (0.0%) |
| $10,000 to $24,999 | 445 (19.5%) | 17 (2.1%) |
| $25,000 to $34,999 | 126 (5.5%) | 19 (2.3%) |
| $35,000 to $49,999 | 401 (17.6%) | 35 (4.2%) |
| $50,000 to $74,999 | 500 (21.9%) | 75 (9.1%) |
| $75,000 to $99,999 | 176 (7.7%) | 63 (7.6%) |
| $100,000 to $149,999 | 257 (11.3%) | 158 (19.1%) |
| $150,000 or more | 210 (9.2%) | 266 (32.2%) |
| Total | 2,281 (100.0%) | 827 (100.0%) |
Property Value to Household Income Ratio in Live Oak County
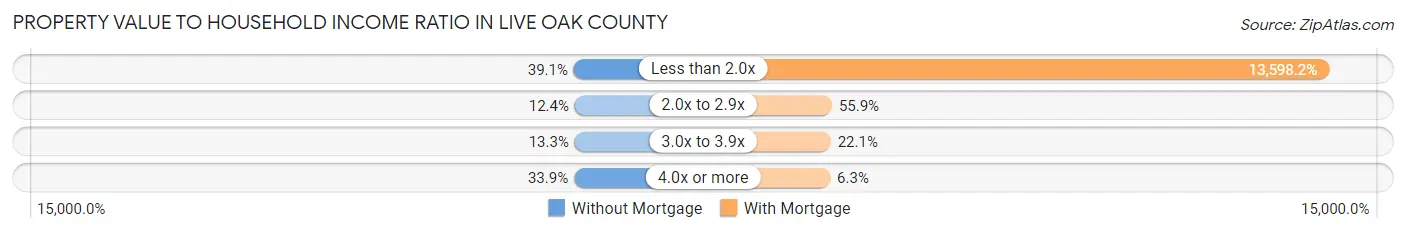
| Value-to-Income Ratio | Without Mortgage | With Mortgage |
| Less than 2.0x | 892 (39.1%) | 112,457 (13,598.2%) |
| 2.0x to 2.9x | 282 (12.4%) | 462 (55.9%) |
| 3.0x to 3.9x | 303 (13.3%) | 183 (22.1%) |
| 4.0x or more | 773 (33.9%) | 52 (6.3%) |
| Total | 2,281 (100.0%) | 827 (100.0%) |
Real Estate Taxes by Mortgage Status in Live Oak County
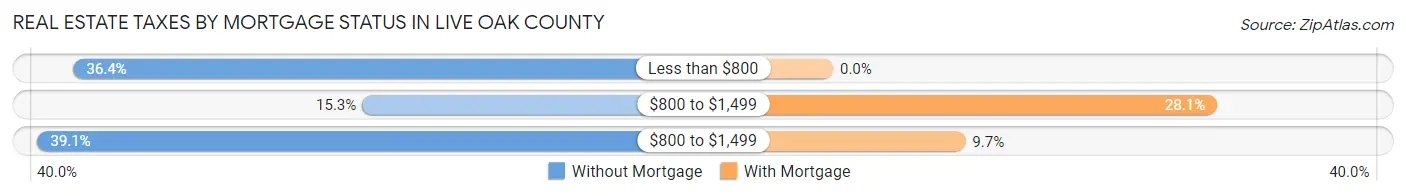
| Property Taxes | Without Mortgage | With Mortgage |
| Less than $800 | 831 (36.4%) | 0 (0.0%) |
| $800 to $1,499 | 350 (15.3%) | 232 (28.1%) |
| $800 to $1,499 | 891 (39.1%) | 80 (9.7%) |
| Total | 2,281 (100.0%) | 827 (100.0%) |
Health & Disability in Live Oak County
Health Insurance Coverage by Age in Live Oak County
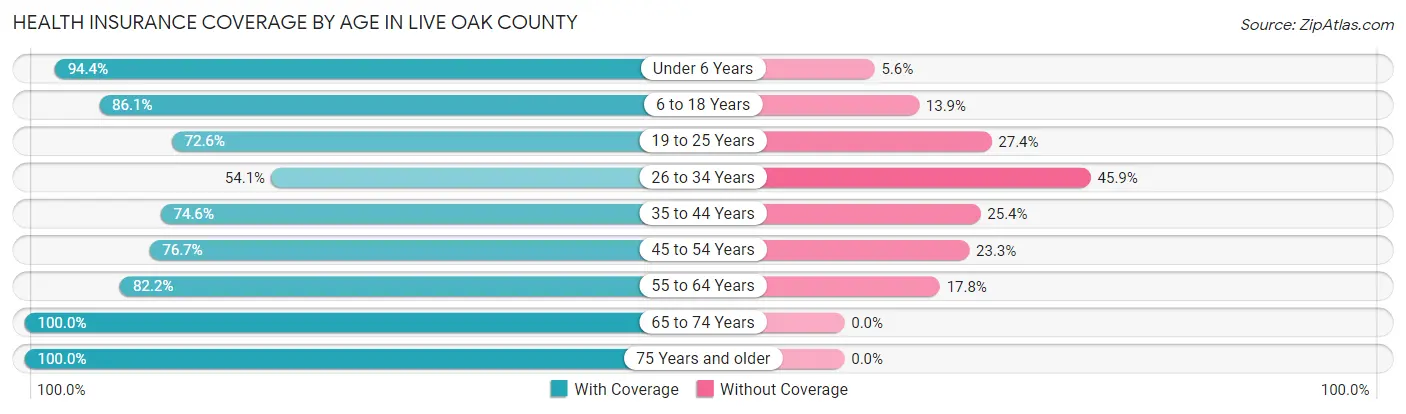
| Age Bracket | With Coverage | Without Coverage |
| Under 6 Years | 671 (94.4%) | 40 (5.6%) |
| 6 to 18 Years | 1,419 (86.1%) | 229 (13.9%) |
| 19 to 25 Years | 503 (72.6%) | 190 (27.4%) |
| 26 to 34 Years | 764 (54.1%) | 649 (45.9%) |
| 35 to 44 Years | 506 (74.6%) | 172 (25.4%) |
| 45 to 54 Years | 775 (76.7%) | 235 (23.3%) |
| 55 to 64 Years | 1,266 (82.2%) | 274 (17.8%) |
| 65 to 74 Years | 1,227 (100.0%) | 0 (0.0%) |
| 75 Years and older | 1,001 (100.0%) | 0 (0.0%) |
| Total | 8,132 (82.0%) | 1,789 (18.0%) |
Health Insurance Coverage by Citizenship Status in Live Oak County
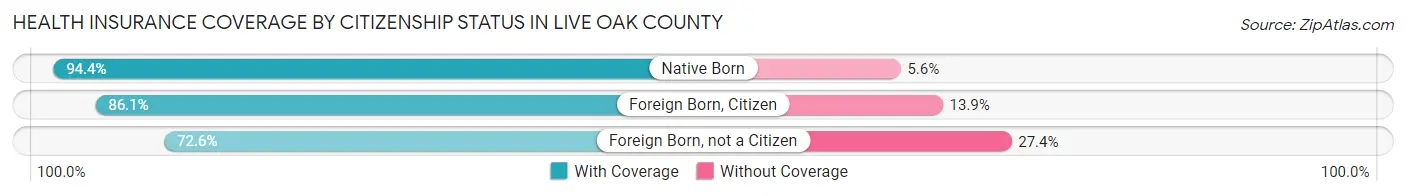
| Citizenship Status | With Coverage | Without Coverage |
| Native Born | 671 (94.4%) | 40 (5.6%) |
| Foreign Born, Citizen | 1,419 (86.1%) | 229 (13.9%) |
| Foreign Born, not a Citizen | 503 (72.6%) | 190 (27.4%) |
Health Insurance Coverage by Household Income in Live Oak County
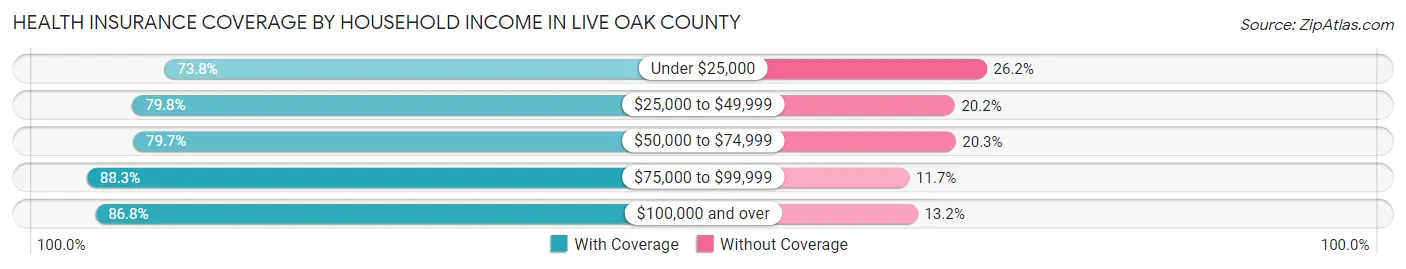
| Household Income | With Coverage | Without Coverage |
| Under $25,000 | 1,256 (73.8%) | 446 (26.2%) |
| $25,000 to $49,999 | 1,511 (79.8%) | 382 (20.2%) |
| $50,000 to $74,999 | 1,637 (79.7%) | 418 (20.3%) |
| $75,000 to $99,999 | 1,097 (88.3%) | 145 (11.7%) |
| $100,000 and over | 2,581 (86.8%) | 394 (13.2%) |
Public vs Private Health Insurance Coverage by Age in Live Oak County
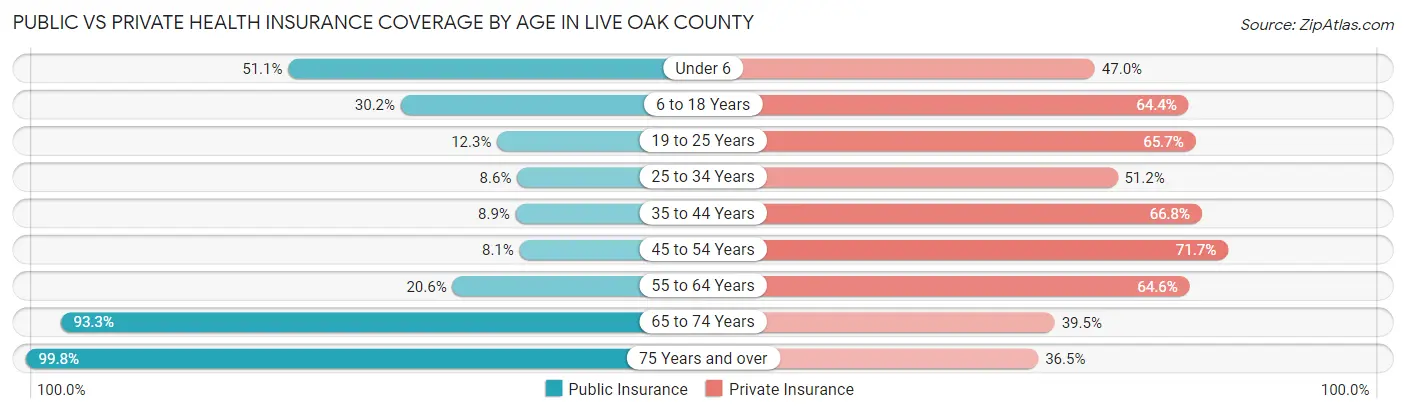
| Age Bracket | Public Insurance | Private Insurance |
| Under 6 | 363 (51.0%) | 334 (47.0%) |
| 6 to 18 Years | 497 (30.2%) | 1,061 (64.4%) |
| 19 to 25 Years | 85 (12.3%) | 455 (65.7%) |
| 25 to 34 Years | 121 (8.6%) | 723 (51.2%) |
| 35 to 44 Years | 60 (8.8%) | 453 (66.8%) |
| 45 to 54 Years | 82 (8.1%) | 724 (71.7%) |
| 55 to 64 Years | 317 (20.6%) | 994 (64.5%) |
| 65 to 74 Years | 1,145 (93.3%) | 485 (39.5%) |
| 75 Years and over | 999 (99.8%) | 365 (36.5%) |
| Total | 3,669 (37.0%) | 5,594 (56.4%) |
Disability Status by Sex by Age in Live Oak County
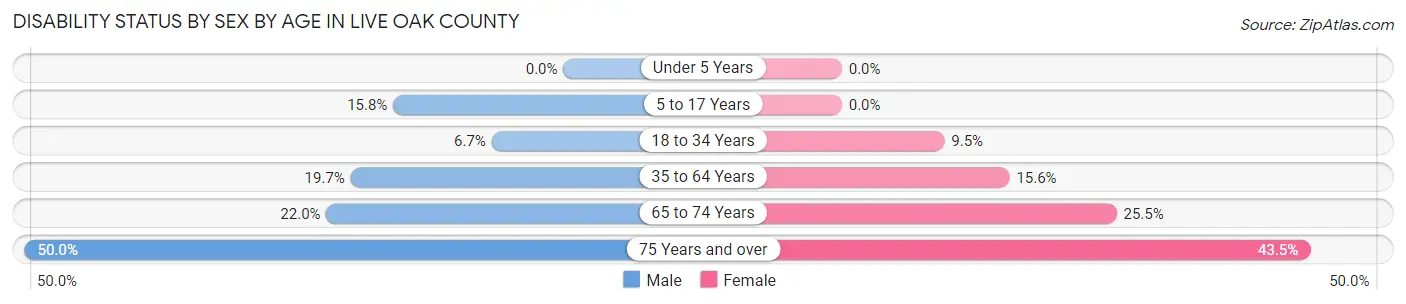
| Age Bracket | Male | Female |
| Under 5 Years | 0 (0.0%) | 0 (0.0%) |
| 5 to 17 Years | 102 (15.8%) | 0 (0.0%) |
| 18 to 34 Years | 72 (6.7%) | 110 (9.5%) |
| 35 to 64 Years | 320 (19.7%) | 250 (15.6%) |
| 65 to 74 Years | 137 (22.0%) | 154 (25.5%) |
| 75 Years and over | 252 (50.0%) | 216 (43.5%) |
Disability Class by Sex by Age in Live Oak County
Disability Class: Hearing Difficulty
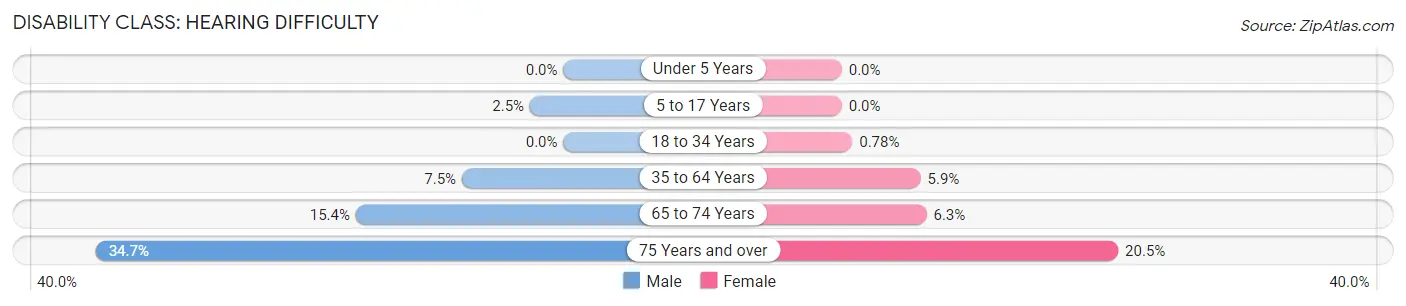
| Age Bracket | Male | Female |
| Under 5 Years | 0 (0.0%) | 0 (0.0%) |
| 5 to 17 Years | 16 (2.5%) | 0 (0.0%) |
| 18 to 34 Years | 0 (0.0%) | 9 (0.8%) |
| 35 to 64 Years | 122 (7.5%) | 94 (5.9%) |
| 65 to 74 Years | 96 (15.4%) | 38 (6.3%) |
| 75 Years and over | 175 (34.7%) | 102 (20.5%) |
Disability Class: Vision Difficulty
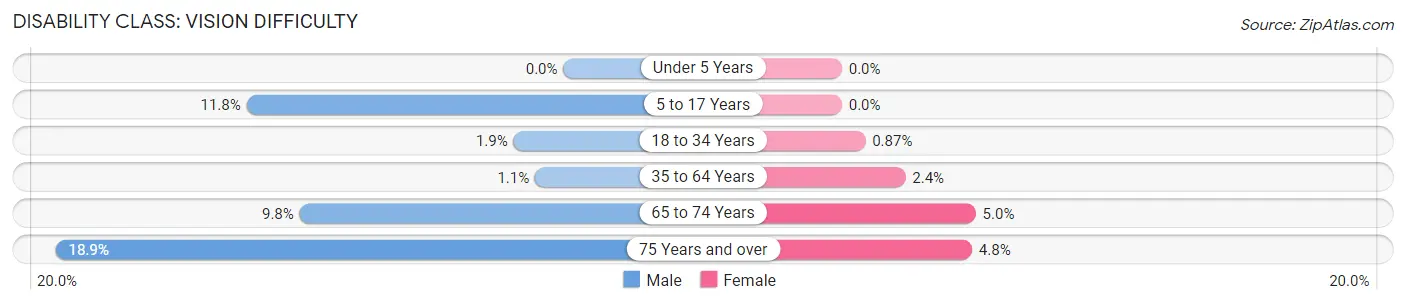
| Age Bracket | Male | Female |
| Under 5 Years | 0 (0.0%) | 0 (0.0%) |
| 5 to 17 Years | 76 (11.8%) | 0 (0.0%) |
| 18 to 34 Years | 20 (1.8%) | 10 (0.9%) |
| 35 to 64 Years | 17 (1.1%) | 38 (2.4%) |
| 65 to 74 Years | 61 (9.8%) | 30 (5.0%) |
| 75 Years and over | 95 (18.9%) | 24 (4.8%) |
Disability Class: Cognitive Difficulty
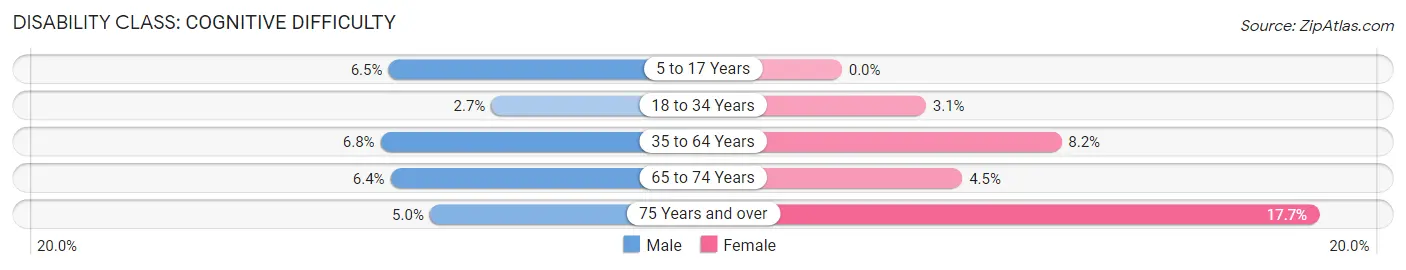
| Age Bracket | Male | Female |
| 5 to 17 Years | 42 (6.5%) | 0 (0.0%) |
| 18 to 34 Years | 29 (2.7%) | 36 (3.1%) |
| 35 to 64 Years | 110 (6.8%) | 131 (8.2%) |
| 65 to 74 Years | 40 (6.4%) | 27 (4.5%) |
| 75 Years and over | 25 (5.0%) | 88 (17.7%) |
Disability Class: Ambulatory Difficulty
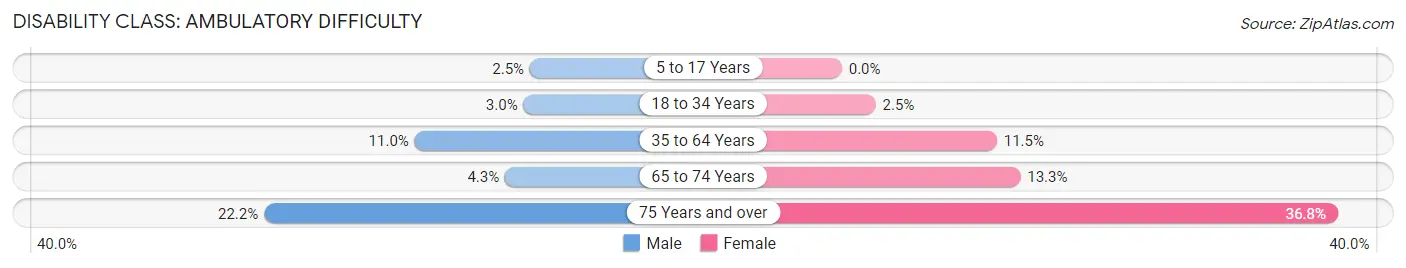
| Age Bracket | Male | Female |
| 5 to 17 Years | 16 (2.5%) | 0 (0.0%) |
| 18 to 34 Years | 32 (3.0%) | 29 (2.5%) |
| 35 to 64 Years | 179 (11.0%) | 185 (11.5%) |
| 65 to 74 Years | 27 (4.3%) | 80 (13.3%) |
| 75 Years and over | 112 (22.2%) | 183 (36.8%) |
Disability Class: Self-Care Difficulty
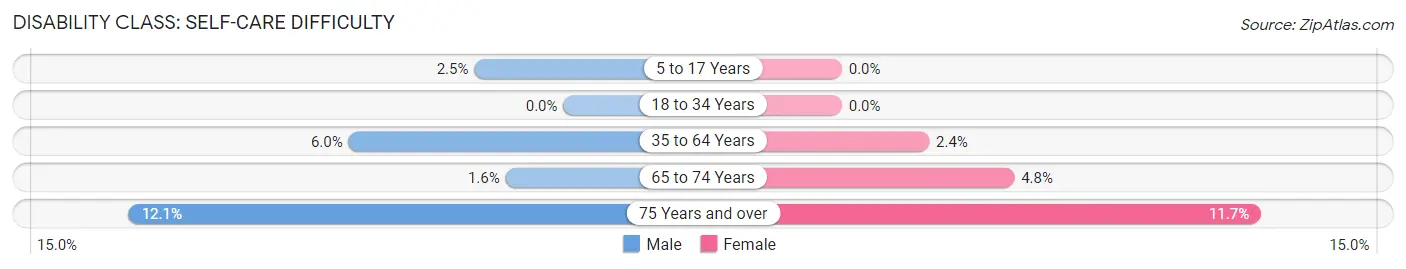
| Age Bracket | Male | Female |
| 5 to 17 Years | 16 (2.5%) | 0 (0.0%) |
| 18 to 34 Years | 0 (0.0%) | 0 (0.0%) |
| 35 to 64 Years | 97 (6.0%) | 39 (2.4%) |
| 65 to 74 Years | 10 (1.6%) | 29 (4.8%) |
| 75 Years and over | 61 (12.1%) | 58 (11.7%) |
Technology Access in Live Oak County
Computing Device Access in Live Oak County
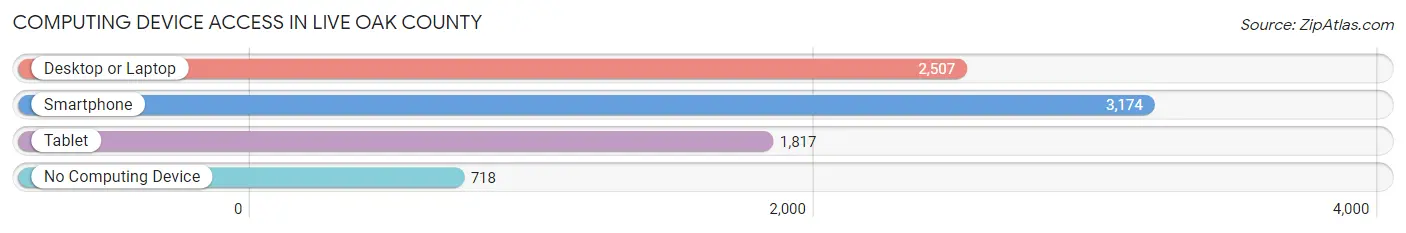
| Device Type | # Households | % Households |
| Desktop or Laptop | 2,507 | 60.4% |
| Smartphone | 3,174 | 76.4% |
| Tablet | 1,817 | 43.8% |
| No Computing Device | 718 | 17.3% |
| Total | 4,153 | 100.0% |
Internet Access in Live Oak County
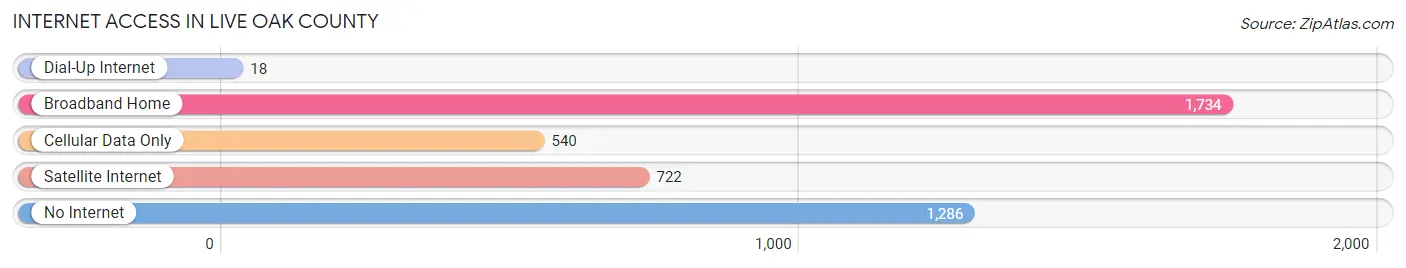
| Internet Type | # Households | % Households |
| Dial-Up Internet | 18 | 0.4% |
| Broadband Home | 1,734 | 41.7% |
| Cellular Data Only | 540 | 13.0% |
| Satellite Internet | 722 | 17.4% |
| No Internet | 1,286 | 31.0% |
| Total | 4,153 | 100.0% |
Live Oak County Summary
Introduction
Live Oak County is located in the south-central region of Texas, and is part of the Corpus Christi Metropolitan Statistical Area. The county is bordered by McMullen County to the north, Bee County to the east, San Patricio County to the south, and Jim Wells County to the west. The county seat is George West, and the county has a population of 11,539 as of the 2020 census.
History
Live Oak County was established in 1856 from parts of San Patricio and Bee Counties. The county was named for the abundance of live oak trees in the area. The county seat was originally located in Oakville, but was moved to George West in 1912.
The county has a rich history of ranching and farming. The first settlers in the area were ranchers, and the county was home to several large ranches, including the King Ranch, which was founded in 1853. The county also had a thriving cotton industry, and the town of Three Rivers was once the largest cotton-producing town in the state.
Geography
Live Oak County is located in the south-central region of Texas, and is part of the Corpus Christi Metropolitan Statistical Area. The county is bordered by McMullen County to the north, Bee County to the east, San Patricio County to the south, and Jim Wells County to the west. The county has a total area of 890 square miles, of which 887 square miles is land and 3 square miles is water.
The county is mostly flat, with some rolling hills in the western part of the county. The county is drained by the Nueces River, which flows through the county from north to south. The county also contains several small lakes, including Lake Corpus Christi, Lake Mathis, and Lake O'Neill.
Economy
Live Oak County has a diverse economy, with a mix of agriculture, manufacturing, and services. The county is home to several large ranches, and the agricultural sector is the largest employer in the county. The county is also home to several manufacturing companies, including a large oil refinery in Three Rivers.
The county also has a thriving tourism industry, with several popular attractions, including the King Ranch, the Three Rivers Museum, and the Live Oak County Historical Museum.
Demographics
As of the 2020 census, Live Oak County had a population of 11,539. The population is predominantly white (83.3%), with a small Hispanic population (14.2%). The median household income is $45,945, and the median home value is $117,400.
Conclusion
Live Oak County is a rural county located in the south-central region of Texas. The county has a rich history of ranching and farming, and is home to several large ranches. The county also has a diverse economy, with a mix of agriculture, manufacturing, and services. The population is predominantly white, with a small Hispanic population. The county has a median household income of $45,945, and a median home value of $117,400.
Common Questions
What is Per Capita Income in Live Oak County?
Per Capita income in Live Oak County is $27,951.
What is the Median Family Income in Live Oak County?
Median Family Income in Live Oak County is $68,357.
What is the Median Household income in Live Oak County?
Median Household Income in Live Oak County is $55,949.
What is Income or Wage Gap in Live Oak County?
Income or Wage Gap in Live Oak County is 51.9%.
Women in Live Oak County earn 48.1 cents for every dollar earned by a man.
What is Inequality or Gini Index in Live Oak County?
Inequality or Gini Index in Live Oak County is 0.47.
What is the Total Population of Live Oak County?
Total Population of Live Oak County is 11,374.
What is the Total Male Population of Live Oak County?
Total Male Population of Live Oak County is 6,118.
What is the Total Female Population of Live Oak County?
Total Female Population of Live Oak County is 5,256.
What is the Ratio of Males per 100 Females in Live Oak County?
There are 116.40 Males per 100 Females in Live Oak County.
What is the Ratio of Females per 100 Males in Live Oak County?
There are 85.91 Females per 100 Males in Live Oak County.
What is the Median Population Age in Live Oak County?
Median Population Age in Live Oak County is 40.8 Years.
What is the Average Family Size in Live Oak County
Average Family Size in Live Oak County is 3.0 People.
What is the Average Household Size in Live Oak County
Average Household Size in Live Oak County is 2.4 People.
How Large is the Labor Force in Live Oak County?
There are 4,215 People in the Labor Forcein in Live Oak County.
What is the Percentage of People in the Labor Force in Live Oak County?
44.9% of People are in the Labor Force in Live Oak County.
What is the Unemployment Rate in Live Oak County?
Unemployment Rate in Live Oak County is 3.6%.