Lipscomb County, TX Map & Demographics
Lipscomb County Map
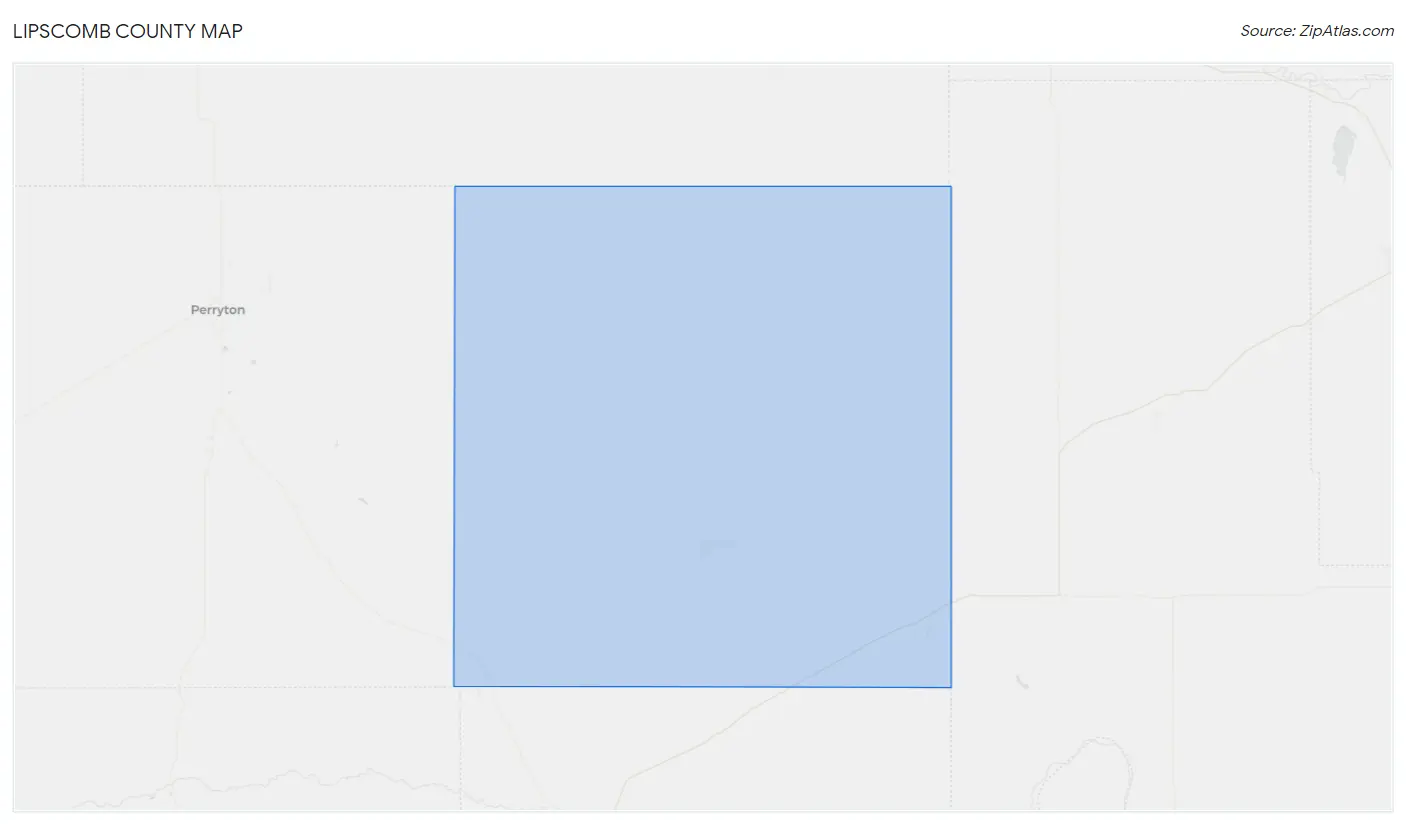
Lipscomb County Overview
$33,236
PER CAPITA INCOME
$76,750
AVG FAMILY INCOME
$71,625
AVG HOUSEHOLD INCOME
44.6%
WAGE / INCOME GAP [ % ]
55.4¢/ $1
WAGE / INCOME GAP [ $ ]
0.44
INEQUALITY / GINI INDEX
3,038
TOTAL POPULATION
1,386
MALE POPULATION
1,652
FEMALE POPULATION
83.90
MALES / 100 FEMALES
119.19
FEMALES / 100 MALES
35.9
MEDIAN AGE
3.0
AVG FAMILY SIZE
2.6
AVG HOUSEHOLD SIZE
1,457
LABOR FORCE [ PEOPLE ]
64.2%
PERCENT IN LABOR FORCE
5.9%
UNEMPLOYMENT RATE
Lipscomb County Area Codes
Income in Lipscomb County
Income Overview in Lipscomb County
Per Capita Income in Lipscomb County is $33,236, while median incomes of families and households are $76,750 and $71,625 respectively.
| Characteristic | Number | Measure |
| Per Capita Income | 3,038 | $33,236 |
| Median Family Income | 858 | $76,750 |
| Mean Family Income | 858 | $96,772 |
| Median Household Income | 1,135 | $71,625 |
| Mean Household Income | 1,135 | $89,221 |
| Income Deficit | 858 | $0 |
| Wage / Income Gap (%) | 3,038 | 44.56% |
| Wage / Income Gap ($) | 3,038 | 55.44¢ per $1 |
| Gini / Inequality Index | 3,038 | 0.44 |
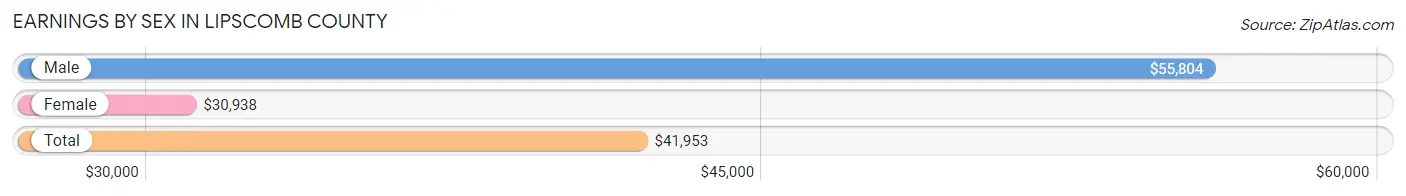
Earnings by Sex in Lipscomb County
Average Earnings in Lipscomb County are $41,953, $55,804 for men and $30,938 for women, a difference of 44.6%.
| Sex | Number | Average Earnings |
| Male | 806 (54.0%) | $55,804 |
| Female | 686 (46.0%) | $30,938 |
| Total | 1,492 (100.0%) | $41,953 |
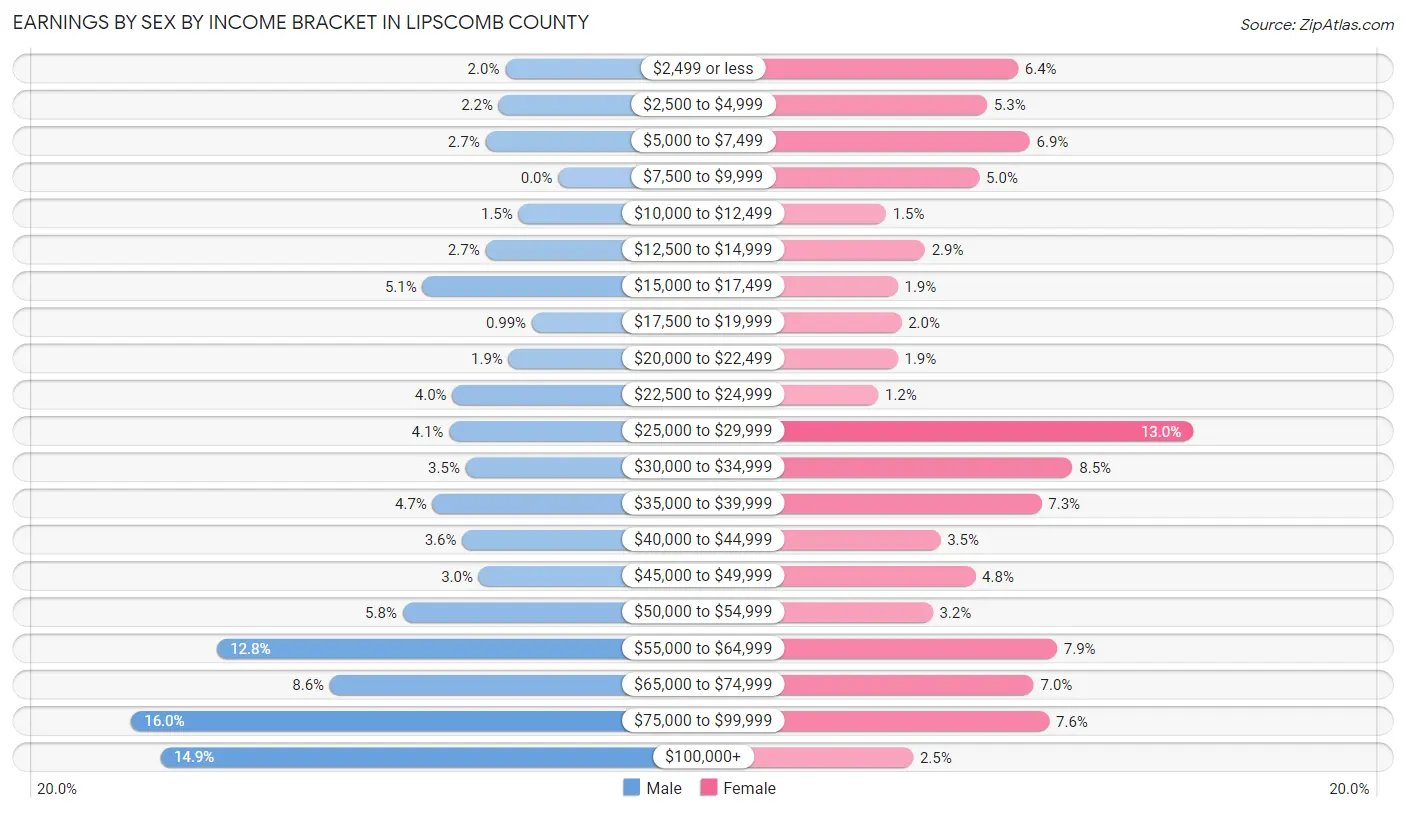
Earnings by Sex by Income Bracket in Lipscomb County
The most common earnings brackets in Lipscomb County are $75,000 to $99,999 for men (129 | 16.0%) and $25,000 to $29,999 for women (89 | 13.0%).
| Income | Male | Female |
| $2,499 or less | 16 (2.0%) | 44 (6.4%) |
| $2,500 to $4,999 | 18 (2.2%) | 36 (5.2%) |
| $5,000 to $7,499 | 22 (2.7%) | 47 (6.9%) |
| $7,500 to $9,999 | 0 (0.0%) | 34 (5.0%) |
| $10,000 to $12,499 | 12 (1.5%) | 10 (1.5%) |
| $12,500 to $14,999 | 22 (2.7%) | 20 (2.9%) |
| $15,000 to $17,499 | 41 (5.1%) | 13 (1.9%) |
| $17,500 to $19,999 | 8 (1.0%) | 14 (2.0%) |
| $20,000 to $22,499 | 15 (1.9%) | 13 (1.9%) |
| $22,500 to $24,999 | 32 (4.0%) | 8 (1.2%) |
| $25,000 to $29,999 | 33 (4.1%) | 89 (13.0%) |
| $30,000 to $34,999 | 28 (3.5%) | 58 (8.5%) |
| $35,000 to $39,999 | 38 (4.7%) | 50 (7.3%) |
| $40,000 to $44,999 | 29 (3.6%) | 24 (3.5%) |
| $45,000 to $49,999 | 24 (3.0%) | 33 (4.8%) |
| $50,000 to $54,999 | 47 (5.8%) | 22 (3.2%) |
| $55,000 to $64,999 | 103 (12.8%) | 54 (7.9%) |
| $65,000 to $74,999 | 69 (8.6%) | 48 (7.0%) |
| $75,000 to $99,999 | 129 (16.0%) | 52 (7.6%) |
| $100,000+ | 120 (14.9%) | 17 (2.5%) |
| Total | 806 (100.0%) | 686 (100.0%) |
Earnings by Sex by Educational Attainment in Lipscomb County
Average earnings in Lipscomb County are $56,987 for men and $37,381 for women, a difference of 34.4%. Men with an educational attainment of bachelor's degree enjoy the highest average annual earnings of $81,146, while those with less than high school education earn the least with $32,708. Women with an educational attainment of graduate degree earn the most with the average annual earnings of $61,094, while those with high school diploma education have the smallest earnings of $29,375.

| Educational Attainment | Male Income | Female Income |
| Less than High School | $32,708 | $0 |
| High School Diploma | $59,091 | $29,375 |
| College or Associate's Degree | $54,519 | $46,094 |
| Bachelor's Degree | $81,146 | $45,682 |
| Graduate Degree | - | - |
| Total | $56,987 | $37,381 |
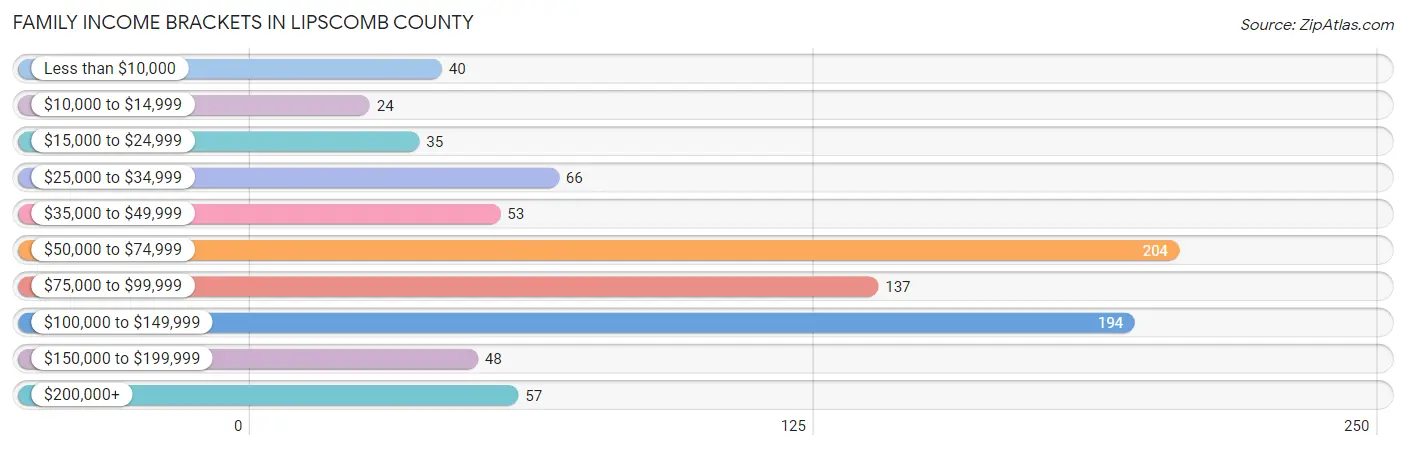
Family Income in Lipscomb County
Family Income Brackets in Lipscomb County
According to the Lipscomb County family income data, there are 204 families falling into the $50,000 to $74,999 income range, which is the most common income bracket and makes up 23.8% of all families. Conversely, the $10,000 to $14,999 income bracket is the least frequent group with only 24 families (2.8%) belonging to this category.
| Income Bracket | # Families | % Families |
| Less than $10,000 | 40 | 4.7% |
| $10,000 to $14,999 | 24 | 2.8% |
| $15,000 to $24,999 | 35 | 4.1% |
| $25,000 to $34,999 | 66 | 7.7% |
| $35,000 to $49,999 | 53 | 6.2% |
| $50,000 to $74,999 | 204 | 23.8% |
| $75,000 to $99,999 | 137 | 16.0% |
| $100,000 to $149,999 | 194 | 22.6% |
| $150,000 to $199,999 | 48 | 5.6% |
| $200,000+ | 57 | 6.6% |
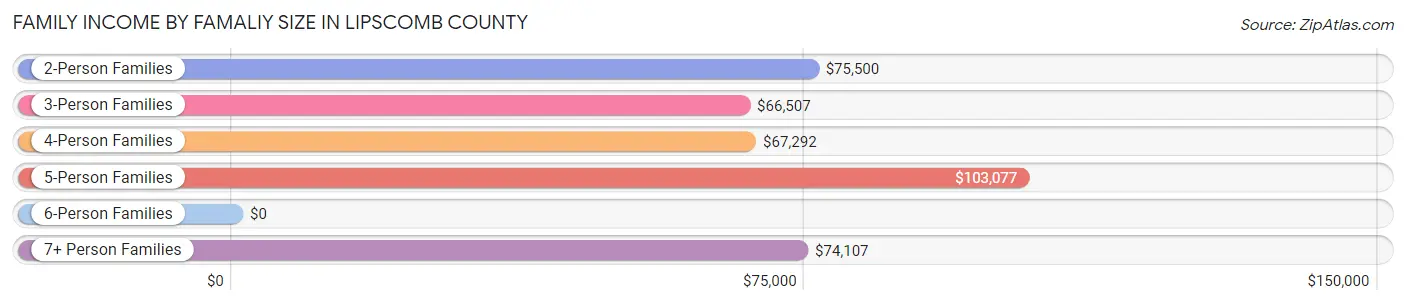
Family Income by Famaliy Size in Lipscomb County
5-person families (146 | 17.0%) account for the highest median family income in Lipscomb County with $103,077 per family, while 2-person families (354 | 41.3%) have the highest median income of $37,750 per family member.
| Income Bracket | # Families | Median Income |
| 2-Person Families | 354 (41.3%) | $75,500 |
| 3-Person Families | 177 (20.6%) | $66,507 |
| 4-Person Families | 147 (17.1%) | $67,292 |
| 5-Person Families | 146 (17.0%) | $103,077 |
| 6-Person Families | 19 (2.2%) | $0 |
| 7+ Person Families | 15 (1.8%) | $74,107 |
| Total | 858 (100.0%) | $76,750 |
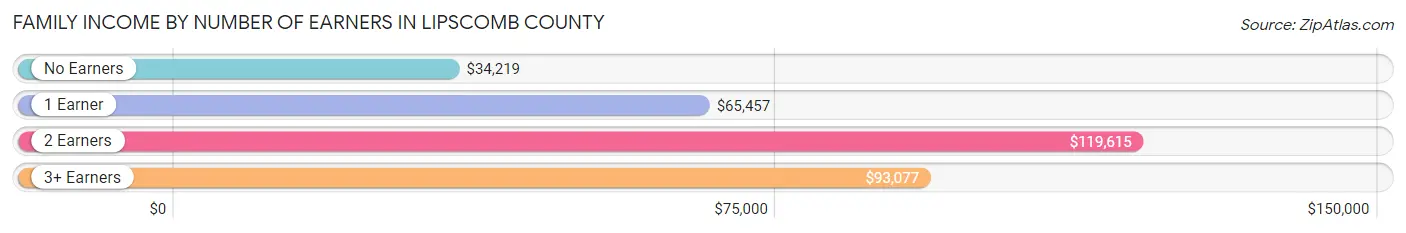
Family Income by Number of Earners in Lipscomb County
The median family income in Lipscomb County is $76,750, with families comprising 2 earners (344) having the highest median family income of $119,615, while families with no earners (109) have the lowest median family income of $34,219, accounting for 40.1% and 12.7% of families, respectively.
| Number of Earners | # Families | Median Income |
| No Earners | 109 (12.7%) | $34,219 |
| 1 Earner | 307 (35.8%) | $65,457 |
| 2 Earners | 344 (40.1%) | $119,615 |
| 3+ Earners | 98 (11.4%) | $93,077 |
| Total | 858 (100.0%) | $76,750 |
Household Income in Lipscomb County
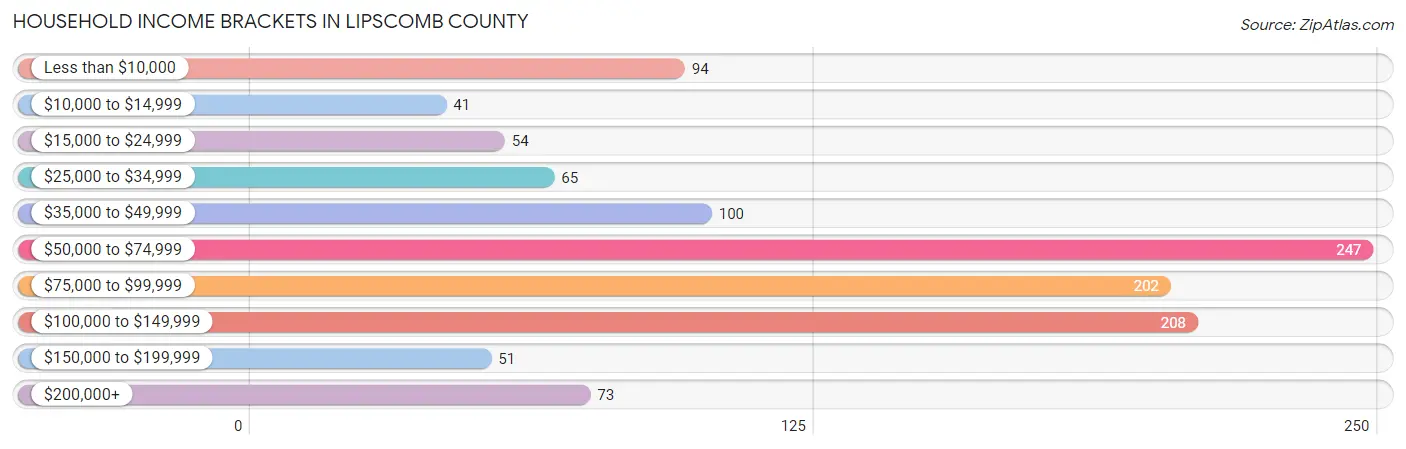
Household Income Brackets in Lipscomb County
With 247 households falling in the category, the $50,000 to $74,999 income range is the most frequent in Lipscomb County, accounting for 21.8% of all households. In contrast, only 41 households (3.6%) fall into the $10,000 to $14,999 income bracket, making it the least populous group.
| Income Bracket | # Households | % Households |
| Less than $10,000 | 94 | 8.3% |
| $10,000 to $14,999 | 41 | 3.6% |
| $15,000 to $24,999 | 54 | 4.8% |
| $25,000 to $34,999 | 65 | 5.7% |
| $35,000 to $49,999 | 100 | 8.8% |
| $50,000 to $74,999 | 247 | 21.8% |
| $75,000 to $99,999 | 202 | 17.8% |
| $100,000 to $149,999 | 208 | 18.3% |
| $150,000 to $199,999 | 51 | 4.5% |
| $200,000+ | 73 | 6.4% |
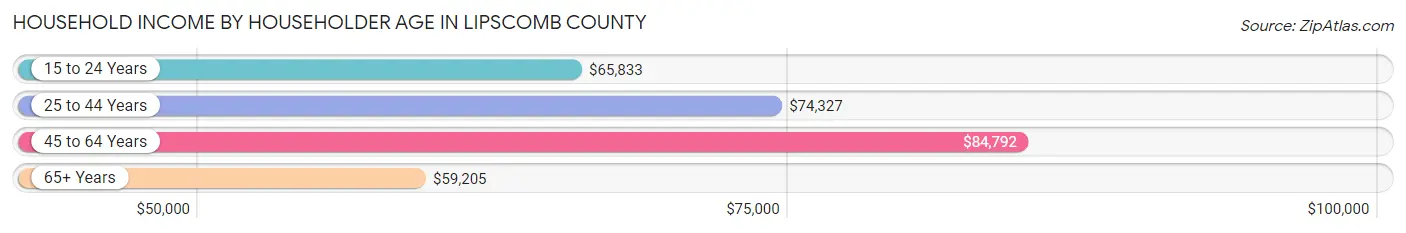
Household Income by Householder Age in Lipscomb County
The median household income in Lipscomb County is $71,625, with the highest median household income of $84,792 found in the 45 to 64 years age bracket for the primary householder. A total of 371 households (32.7%) fall into this category. Meanwhile, the 65+ years age bracket for the primary householder has the lowest median household income of $59,205, with 315 households (27.8%) in this group.
| Income Bracket | # Households | Median Income |
| 15 to 24 Years | 58 (5.1%) | $65,833 |
| 25 to 44 Years | 391 (34.4%) | $74,327 |
| 45 to 64 Years | 371 (32.7%) | $84,792 |
| 65+ Years | 315 (27.8%) | $59,205 |
| Total | 1,135 (100.0%) | $71,625 |
Poverty in Lipscomb County
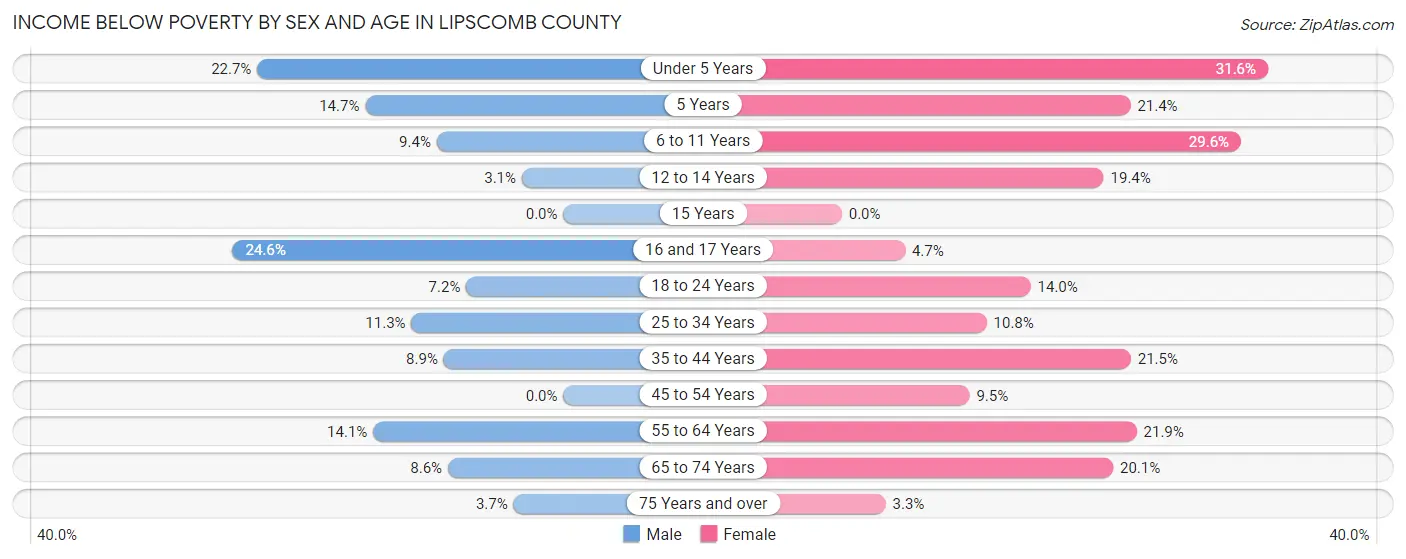
Income Below Poverty by Sex and Age in Lipscomb County
With 9.9% poverty level for males and 17.1% for females among the residents of Lipscomb County, 16 and 17 year old males and under 5 year old females are the most vulnerable to poverty, with 14 males (24.6%) and 31 females (31.6%) in their respective age groups living below the poverty level.
| Age Bracket | Male | Female |
| Under 5 Years | 25 (22.7%) | 31 (31.6%) |
| 5 Years | 5 (14.7%) | 6 (21.4%) |
| 6 to 11 Years | 11 (9.4%) | 40 (29.6%) |
| 12 to 14 Years | 2 (3.1%) | 21 (19.4%) |
| 15 Years | 0 (0.0%) | 0 (0.0%) |
| 16 and 17 Years | 14 (24.6%) | 3 (4.7%) |
| 18 to 24 Years | 8 (7.2%) | 23 (14.0%) |
| 25 to 34 Years | 15 (11.3%) | 20 (10.7%) |
| 35 to 44 Years | 15 (8.9%) | 44 (21.5%) |
| 45 to 54 Years | 0 (0.0%) | 11 (9.5%) |
| 55 to 64 Years | 24 (14.1%) | 44 (21.9%) |
| 65 to 74 Years | 12 (8.6%) | 28 (20.1%) |
| 75 Years and over | 3 (3.7%) | 4 (3.3%) |
| Total | 134 (9.9%) | 275 (17.1%) |
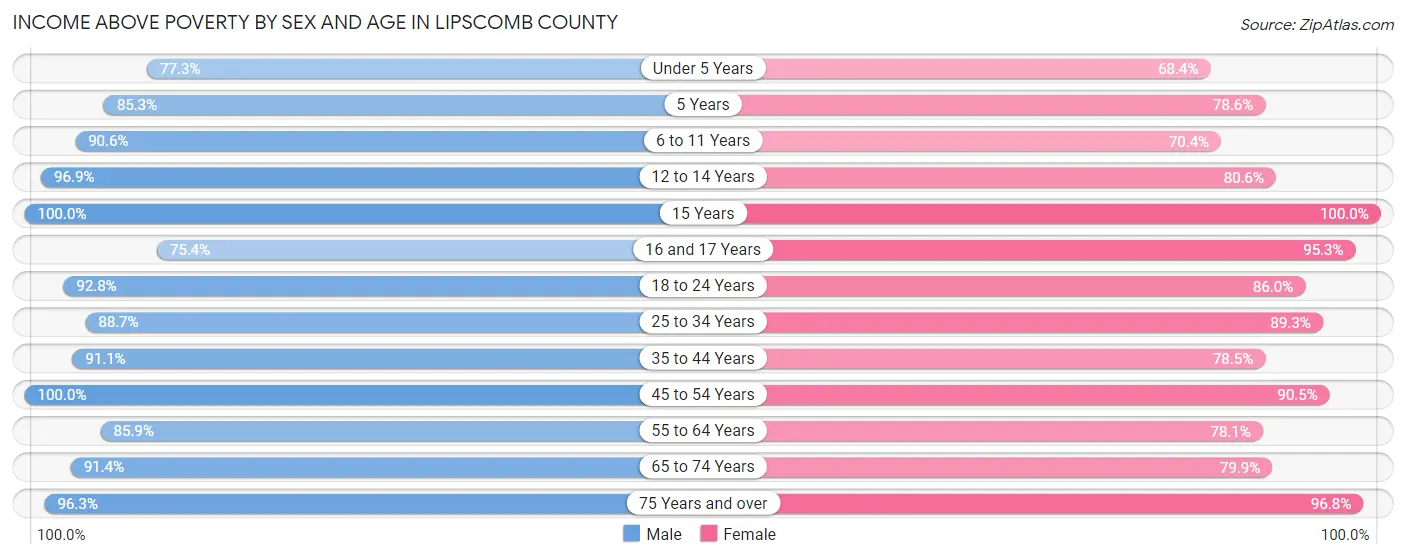
Income Above Poverty by Sex and Age in Lipscomb County
According to the poverty statistics in Lipscomb County, males aged 15 years and females aged 15 years are the age groups that are most secure financially, with 100.0% of males and 100.0% of females in these age groups living above the poverty line.
| Age Bracket | Male | Female |
| Under 5 Years | 85 (77.3%) | 67 (68.4%) |
| 5 Years | 29 (85.3%) | 22 (78.6%) |
| 6 to 11 Years | 106 (90.6%) | 95 (70.4%) |
| 12 to 14 Years | 63 (96.9%) | 87 (80.6%) |
| 15 Years | 9 (100.0%) | 42 (100.0%) |
| 16 and 17 Years | 43 (75.4%) | 61 (95.3%) |
| 18 to 24 Years | 103 (92.8%) | 141 (86.0%) |
| 25 to 34 Years | 118 (88.7%) | 166 (89.2%) |
| 35 to 44 Years | 154 (91.1%) | 161 (78.5%) |
| 45 to 54 Years | 161 (100.0%) | 105 (90.5%) |
| 55 to 64 Years | 146 (85.9%) | 157 (78.1%) |
| 65 to 74 Years | 128 (91.4%) | 111 (79.9%) |
| 75 Years and over | 78 (96.3%) | 119 (96.8%) |
| Total | 1,223 (90.1%) | 1,334 (82.9%) |
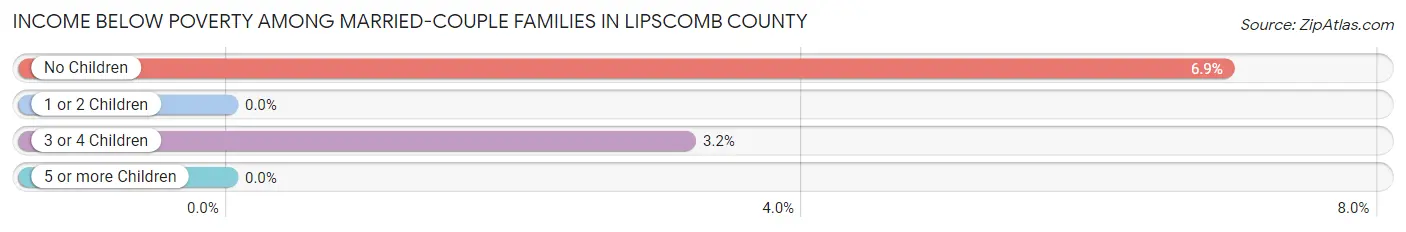
Income Below Poverty Among Married-Couple Families in Lipscomb County
The poverty statistics for married-couple families in Lipscomb County show that 4.3% or 27 of the total 629 families live below the poverty line. Families with no children have the highest poverty rate of 6.9%, comprising of 24 families. On the other hand, families with 1 or 2 children have the lowest poverty rate of 0.0%, which includes 0 families.
| Children | Above Poverty | Below Poverty |
| No Children | 322 (93.1%) | 24 (6.9%) |
| 1 or 2 Children | 184 (100.0%) | 0 (0.0%) |
| 3 or 4 Children | 91 (96.8%) | 3 (3.2%) |
| 5 or more Children | 5 (100.0%) | 0 (0.0%) |
| Total | 602 (95.7%) | 27 (4.3%) |
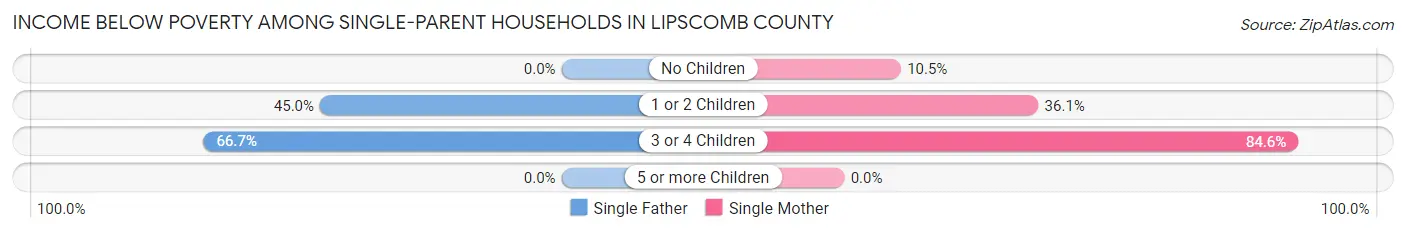
Income Below Poverty Among Single-Parent Households in Lipscomb County
According to the poverty data in Lipscomb County, 26.2% or 17 single-father households and 40.8% or 67 single-mother households are living below the poverty line. Among single-father households, those with 3 or 4 children have the highest poverty rate, with 8 households (66.7%) experiencing poverty. Likewise, among single-mother households, those with 3 or 4 children have the highest poverty rate, with 22 households (84.6%) falling below the poverty line.
| Children | Single Father | Single Mother |
| No Children | 0 (0.0%) | 2 (10.5%) |
| 1 or 2 Children | 9 (45.0%) | 43 (36.1%) |
| 3 or 4 Children | 8 (66.7%) | 22 (84.6%) |
| 5 or more Children | 0 (0.0%) | 0 (0.0%) |
| Total | 17 (26.2%) | 67 (40.8%) |
Income Below Poverty Among Married-Couple vs Single-Parent Households in Lipscomb County
The poverty data for Lipscomb County shows that 27 of the married-couple family households (4.3%) and 84 of the single-parent households (36.7%) are living below the poverty level. Within the married-couple family households, those with no children have the highest poverty rate, with 24 households (6.9%) falling below the poverty line. Among the single-parent households, those with 3 or 4 children have the highest poverty rate, with 30 household (78.9%) living below poverty.
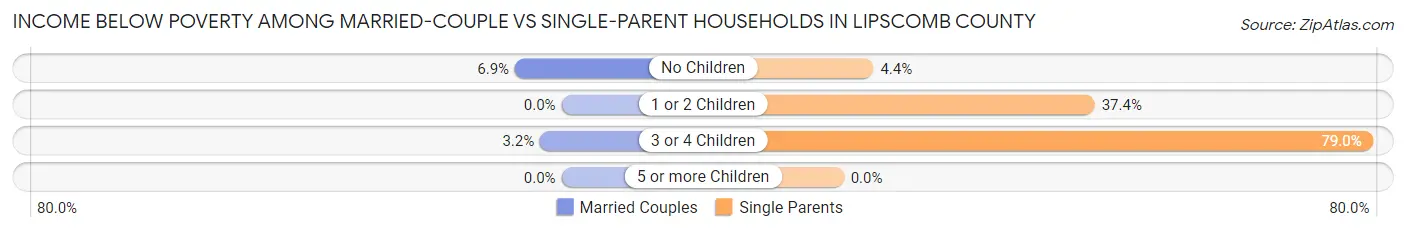
| Children | Married-Couple Families | Single-Parent Households |
| No Children | 24 (6.9%) | 2 (4.4%) |
| 1 or 2 Children | 0 (0.0%) | 52 (37.4%) |
| 3 or 4 Children | 3 (3.2%) | 30 (78.9%) |
| 5 or more Children | 0 (0.0%) | 0 (0.0%) |
| Total | 27 (4.3%) | 84 (36.7%) |
Race in Lipscomb County
The most populous races in Lipscomb County are White / Caucasian (2,196 | 72.3%), Hispanic or Latino (1,041 | 34.3%), and Some other Race (410 | 13.5%).
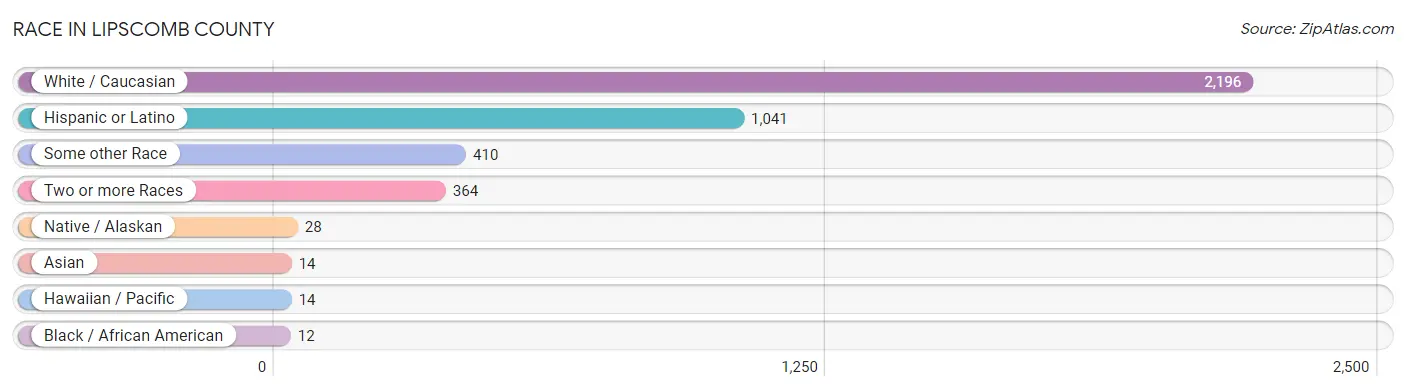
| Race | # Population | % Population |
| Asian | 14 | 0.5% |
| Black / African American | 12 | 0.4% |
| Hawaiian / Pacific | 14 | 0.5% |
| Hispanic or Latino | 1,041 | 34.3% |
| Native / Alaskan | 28 | 0.9% |
| White / Caucasian | 2,196 | 72.3% |
| Two or more Races | 364 | 12.0% |
| Some other Race | 410 | 13.5% |
| Total | 3,038 | 100.0% |
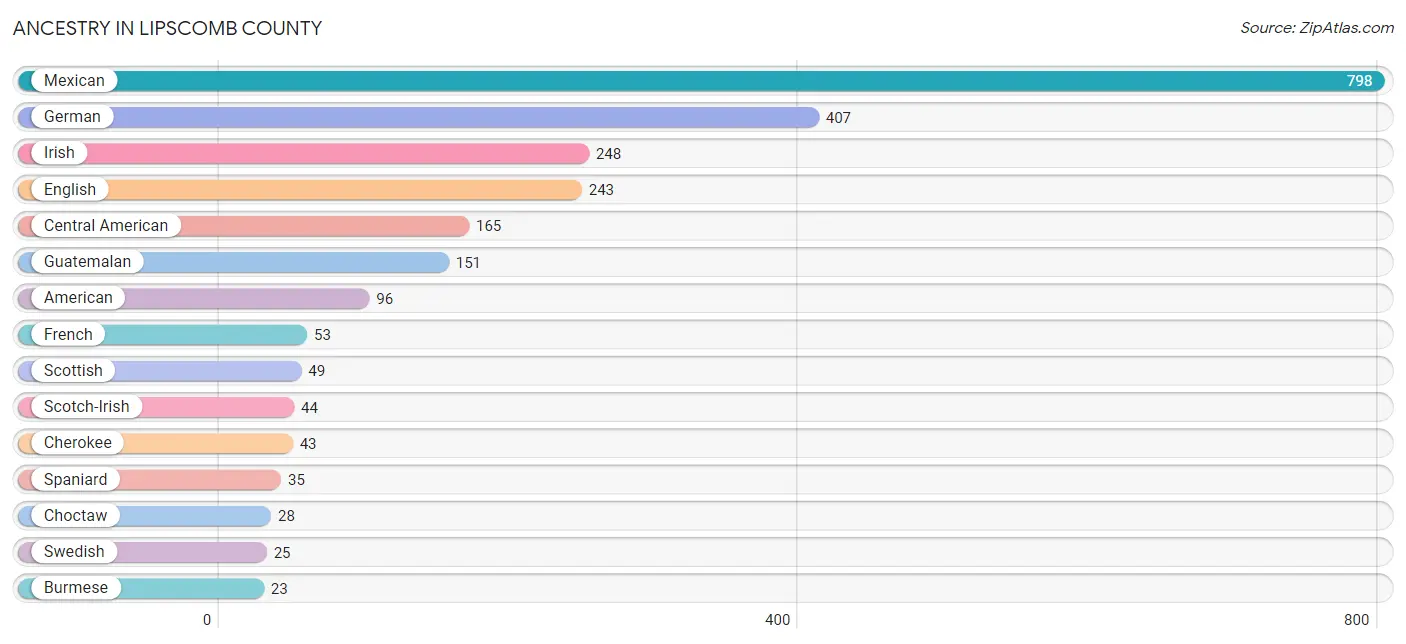
Ancestry in Lipscomb County
The most populous ancestries reported in Lipscomb County are Mexican (798 | 26.3%), German (407 | 13.4%), Irish (248 | 8.2%), English (243 | 8.0%), and Central American (165 | 5.4%), together accounting for 61.3% of all Lipscomb County residents.
| Ancestry | # Population | % Population |
| American | 96 | 3.2% |
| Apache | 22 | 0.7% |
| Arab | 10 | 0.3% |
| Arapaho | 19 | 0.6% |
| Austrian | 6 | 0.2% |
| British | 4 | 0.1% |
| Burmese | 23 | 0.8% |
| Central American | 165 | 5.4% |
| Cherokee | 43 | 1.4% |
| Chickasaw | 6 | 0.2% |
| Choctaw | 28 | 0.9% |
| Colombian | 6 | 0.2% |
| Comanche | 7 | 0.2% |
| Czech | 5 | 0.2% |
| Danish | 1 | 0.0% |
| Dutch | 20 | 0.7% |
| English | 243 | 8.0% |
| European | 13 | 0.4% |
| French | 53 | 1.7% |
| German | 407 | 13.4% |
| German Russian | 3 | 0.1% |
| Guatemalan | 151 | 5.0% |
| Irish | 248 | 8.2% |
| Italian | 13 | 0.4% |
| Korean | 17 | 0.6% |
| Lebanese | 10 | 0.3% |
| Luxembourger | 5 | 0.2% |
| Mexican | 798 | 26.3% |
| Northern European | 7 | 0.2% |
| Norwegian | 3 | 0.1% |
| Peruvian | 1 | 0.0% |
| Polish | 5 | 0.2% |
| Puerto Rican | 19 | 0.6% |
| Russian | 11 | 0.4% |
| Salvadoran | 14 | 0.5% |
| Scandinavian | 4 | 0.1% |
| Scotch-Irish | 44 | 1.5% |
| Scottish | 49 | 1.6% |
| Sioux | 13 | 0.4% |
| South American | 7 | 0.2% |
| Spaniard | 35 | 1.1% |
| Swedish | 25 | 0.8% |
| Welsh | 4 | 0.1% | View All 43 Rows |
Immigrants in Lipscomb County
The most numerous immigrant groups reported in Lipscomb County came from Central America (441 | 14.5%), Latin America (441 | 14.5%), Mexico (346 | 11.4%), Guatemala (95 | 3.1%), and Asia (6 | 0.2%), together accounting for 43.8% of all Lipscomb County residents.
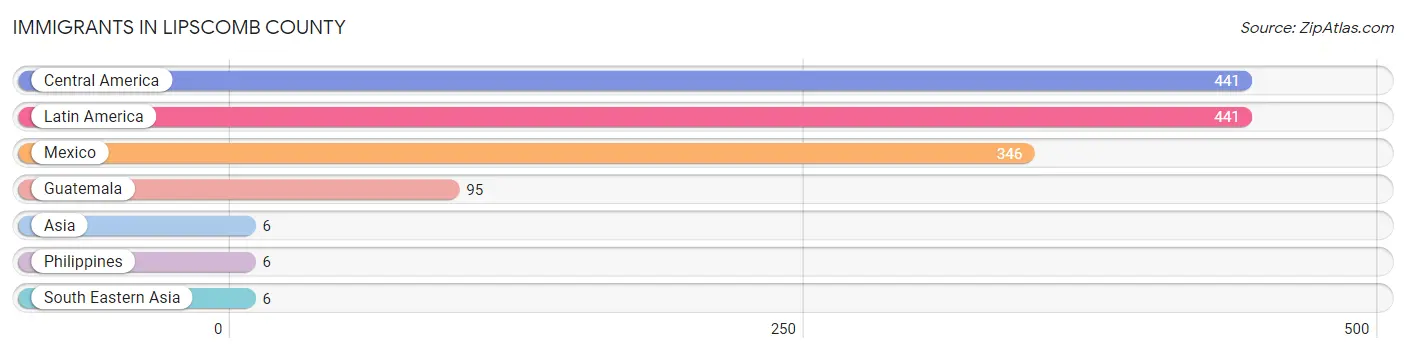
| Immigration Origin | # Population | % Population |
| Asia | 6 | 0.2% |
| Central America | 441 | 14.5% |
| Guatemala | 95 | 3.1% |
| Latin America | 441 | 14.5% |
| Mexico | 346 | 11.4% |
| Philippines | 6 | 0.2% |
| South Eastern Asia | 6 | 0.2% | View All 7 Rows |
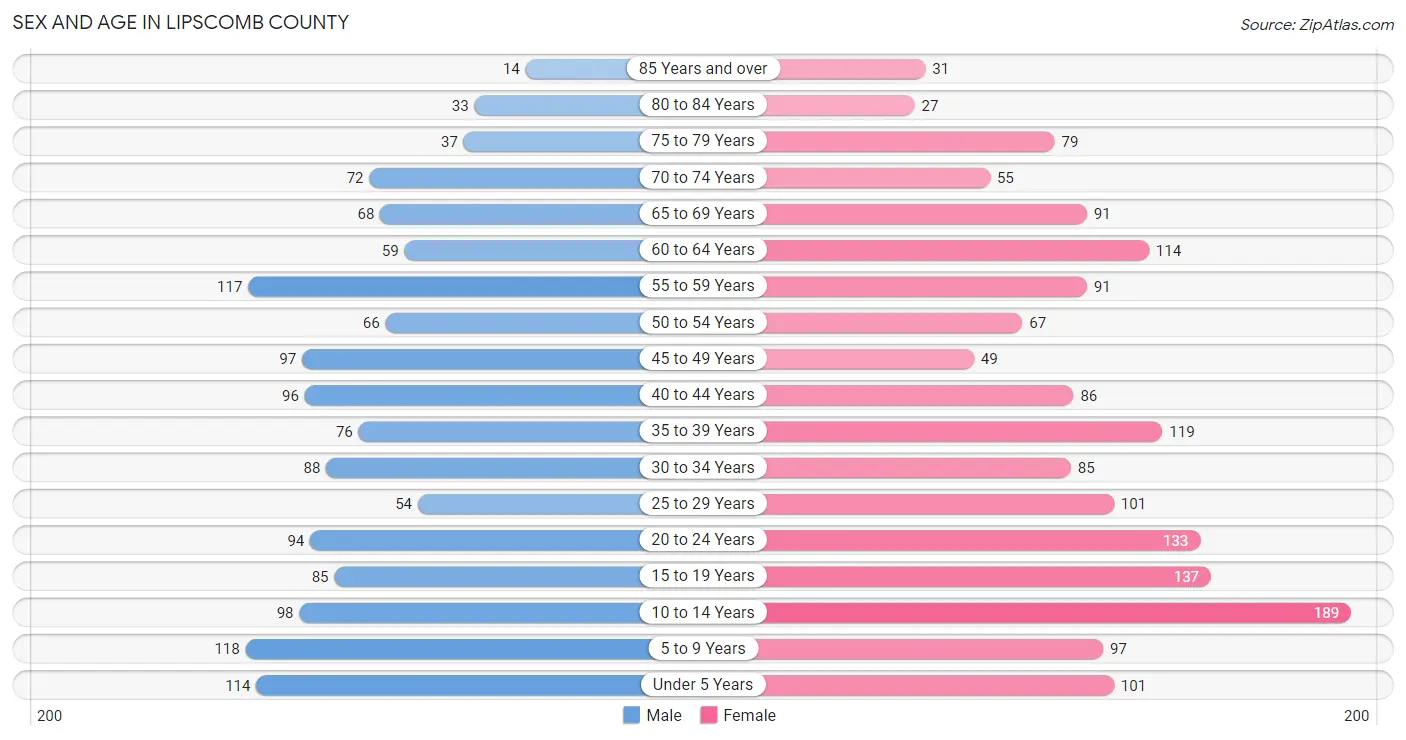
Sex and Age in Lipscomb County
Sex and Age in Lipscomb County
The most populous age groups in Lipscomb County are 5 to 9 Years (118 | 8.5%) for men and 10 to 14 Years (189 | 11.4%) for women.
| Age Bracket | Male | Female |
| Under 5 Years | 114 (8.2%) | 101 (6.1%) |
| 5 to 9 Years | 118 (8.5%) | 97 (5.9%) |
| 10 to 14 Years | 98 (7.1%) | 189 (11.4%) |
| 15 to 19 Years | 85 (6.1%) | 137 (8.3%) |
| 20 to 24 Years | 94 (6.8%) | 133 (8.1%) |
| 25 to 29 Years | 54 (3.9%) | 101 (6.1%) |
| 30 to 34 Years | 88 (6.4%) | 85 (5.1%) |
| 35 to 39 Years | 76 (5.5%) | 119 (7.2%) |
| 40 to 44 Years | 96 (6.9%) | 86 (5.2%) |
| 45 to 49 Years | 97 (7.0%) | 49 (3.0%) |
| 50 to 54 Years | 66 (4.8%) | 67 (4.1%) |
| 55 to 59 Years | 117 (8.4%) | 91 (5.5%) |
| 60 to 64 Years | 59 (4.3%) | 114 (6.9%) |
| 65 to 69 Years | 68 (4.9%) | 91 (5.5%) |
| 70 to 74 Years | 72 (5.2%) | 55 (3.3%) |
| 75 to 79 Years | 37 (2.7%) | 79 (4.8%) |
| 80 to 84 Years | 33 (2.4%) | 27 (1.6%) |
| 85 Years and over | 14 (1.0%) | 31 (1.9%) |
| Total | 1,386 (100.0%) | 1,652 (100.0%) |
Families and Households in Lipscomb County
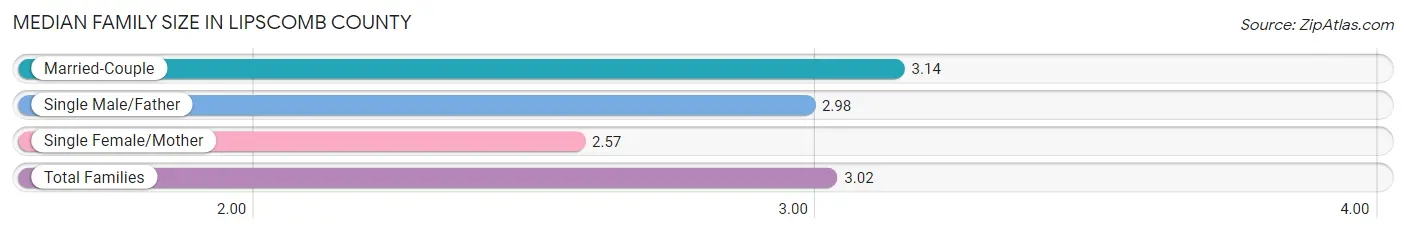
Median Family Size in Lipscomb County
The median family size in Lipscomb County is 3.02 persons per family, with married-couple families (629 | 73.3%) accounting for the largest median family size of 3.14 persons per family. On the other hand, single female/mother families (164 | 19.1%) represent the smallest median family size with 2.57 persons per family.
| Family Type | # Families | Family Size |
| Married-Couple | 629 (73.3%) | 3.14 |
| Single Male/Father | 65 (7.6%) | 2.98 |
| Single Female/Mother | 164 (19.1%) | 2.57 |
| Total Families | 858 (100.0%) | 3.02 |
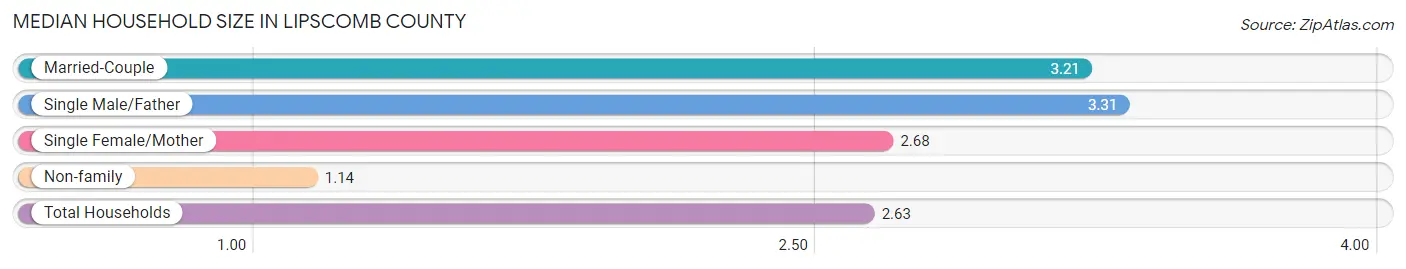
Median Household Size in Lipscomb County
The median household size in Lipscomb County is 2.63 persons per household, with single male/father households (65 | 5.7%) accounting for the largest median household size of 3.31 persons per household. non-family households (277 | 24.4%) represent the smallest median household size with 1.14 persons per household.
| Household Type | # Households | Household Size |
| Married-Couple | 629 (55.4%) | 3.21 |
| Single Male/Father | 65 (5.7%) | 3.31 |
| Single Female/Mother | 164 (14.4%) | 2.68 |
| Non-family | 277 (24.4%) | 1.14 |
| Total Households | 1,135 (100.0%) | 2.63 |
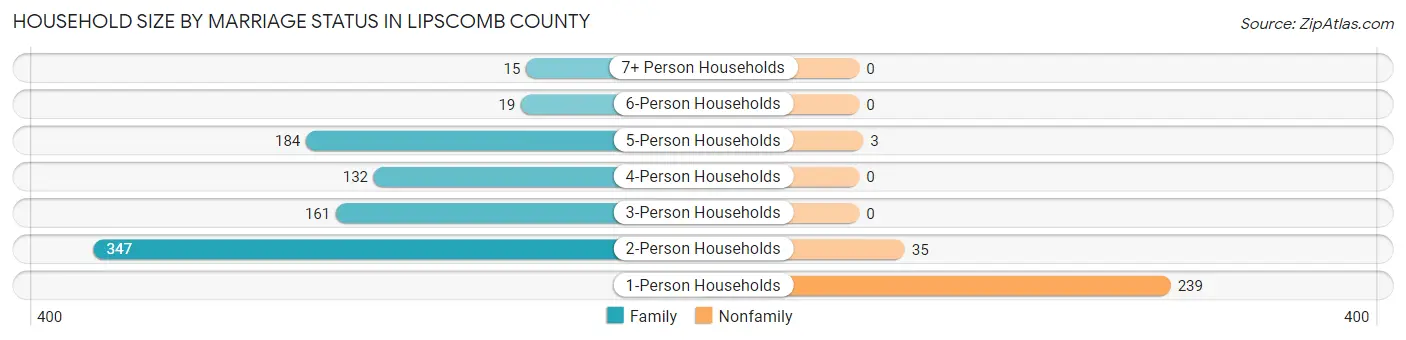
Household Size by Marriage Status in Lipscomb County
Out of a total of 1,135 households in Lipscomb County, 858 (75.6%) are family households, while 277 (24.4%) are nonfamily households. The most numerous type of family households are 2-person households, comprising 347, and the most common type of nonfamily households are 1-person households, comprising 239.
| Household Size | Family Households | Nonfamily Households |
| 1-Person Households | - | 239 (21.1%) |
| 2-Person Households | 347 (30.6%) | 35 (3.1%) |
| 3-Person Households | 161 (14.2%) | 0 (0.0%) |
| 4-Person Households | 132 (11.6%) | 0 (0.0%) |
| 5-Person Households | 184 (16.2%) | 3 (0.3%) |
| 6-Person Households | 19 (1.7%) | 0 (0.0%) |
| 7+ Person Households | 15 (1.3%) | 0 (0.0%) |
| Total | 858 (75.6%) | 277 (24.4%) |
Female Fertility in Lipscomb County
Fertility by Age in Lipscomb County
Average fertility rate in Lipscomb County is 82.0 births per 1,000 women. Women in the age bracket of 20 to 34 years have the highest fertility rate with 179.0 births per 1,000 women. Women in the age bracket of 20 to 34 years acount for 96.6% of all women with births.
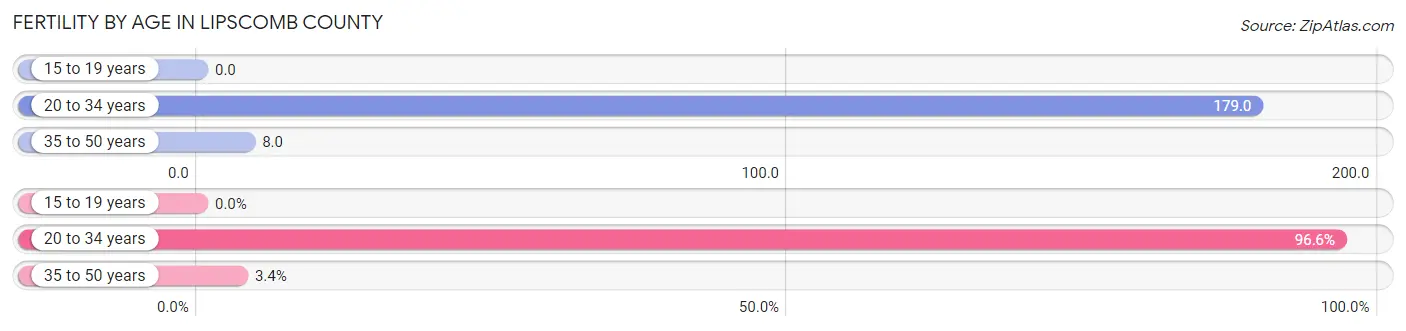
| Age Bracket | Women with Births | Births / 1,000 Women |
| 15 to 19 years | 0 (0.0%) | 0.0 |
| 20 to 34 years | 57 (96.6%) | 179.0 |
| 35 to 50 years | 2 (3.4%) | 8.0 |
| Total | 59 (100.0%) | 82.0 |
Fertility by Age by Marriage Status in Lipscomb County
33.9% of women with births (59) in Lipscomb County are married. The highest percentage of unmarried women with births falls into 20 to 34 years age bracket with 68.4% of them unmarried at the time of birth, while the lowest percentage of unmarried women with births belong to 35 to 50 years age bracket with 0.0% of them unmarried.
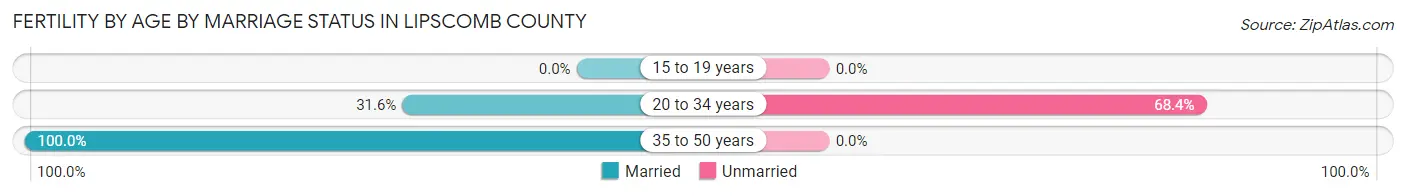
| Age Bracket | Married | Unmarried |
| 15 to 19 years | 0 (0.0%) | 0 (0.0%) |
| 20 to 34 years | 18 (31.6%) | 39 (68.4%) |
| 35 to 50 years | 2 (100.0%) | 0 (0.0%) |
| Total | 20 (33.9%) | 39 (66.1%) |
Fertility by Education in Lipscomb County
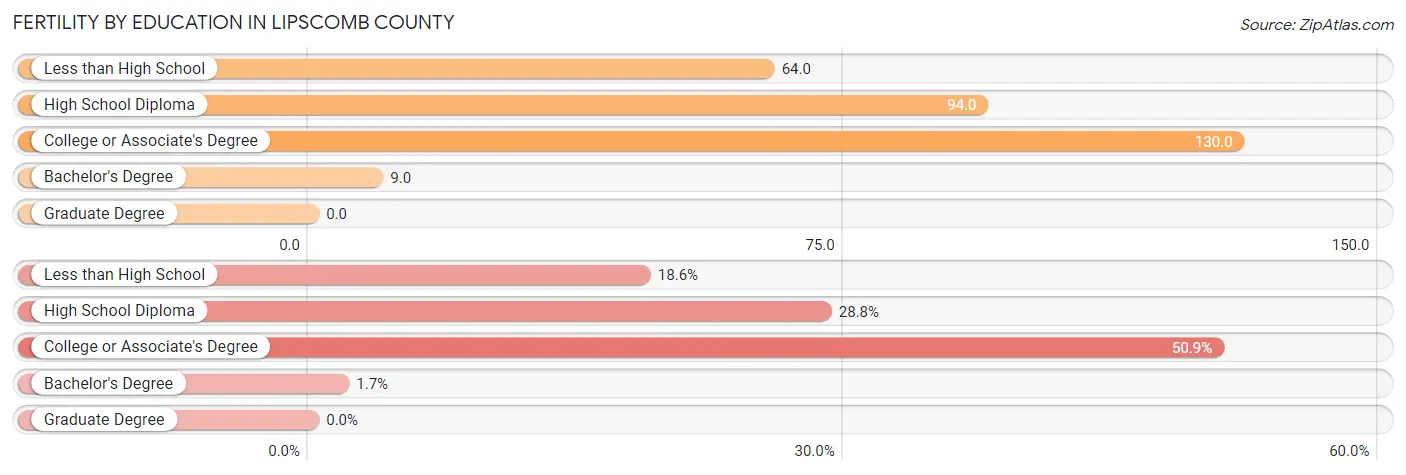
| Educational Attainment | Women with Births | Births / 1,000 Women |
| Less than High School | 11 (18.6%) | 64.0 |
| High School Diploma | 17 (28.8%) | 94.0 |
| College or Associate's Degree | 30 (50.8%) | 130.0 |
| Bachelor's Degree | 1 (1.7%) | 9.0 |
| Graduate Degree | 0 (0.0%) | 0.0 |
| Total | 59 (100.0%) | 82.0 |
Fertility by Education by Marriage Status in Lipscomb County
66.1% of women with births in Lipscomb County are unmarried. Women with the educational attainment of less than high school are most likely to be married with 100.0% of them married at childbirth, while women with the educational attainment of college or associate's degree are least likely to be married with 96.7% of them unmarried at childbirth.
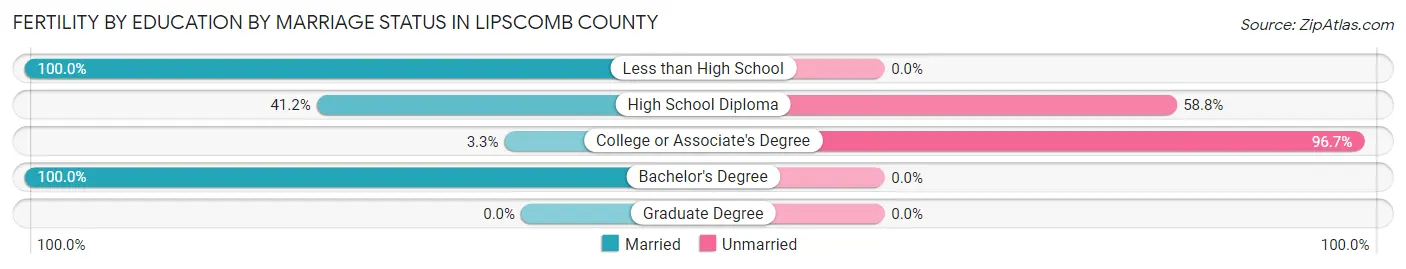
| Educational Attainment | Married | Unmarried |
| Less than High School | 11 (100.0%) | 0 (0.0%) |
| High School Diploma | 7 (41.2%) | 10 (58.8%) |
| College or Associate's Degree | 1 (3.3%) | 29 (96.7%) |
| Bachelor's Degree | 1 (100.0%) | 0 (0.0%) |
| Graduate Degree | 0 (0.0%) | 0 (0.0%) |
| Total | 20 (33.9%) | 39 (66.1%) |
Employment Characteristics in Lipscomb County
Employment by Class of Employer in Lipscomb County
Among the 1,344 employed individuals in Lipscomb County, private company employees (807 | 60.0%), local government employees (238 | 17.7%), and self-employed (not incorporated) (117 | 8.7%) make up the most common classes of employment.
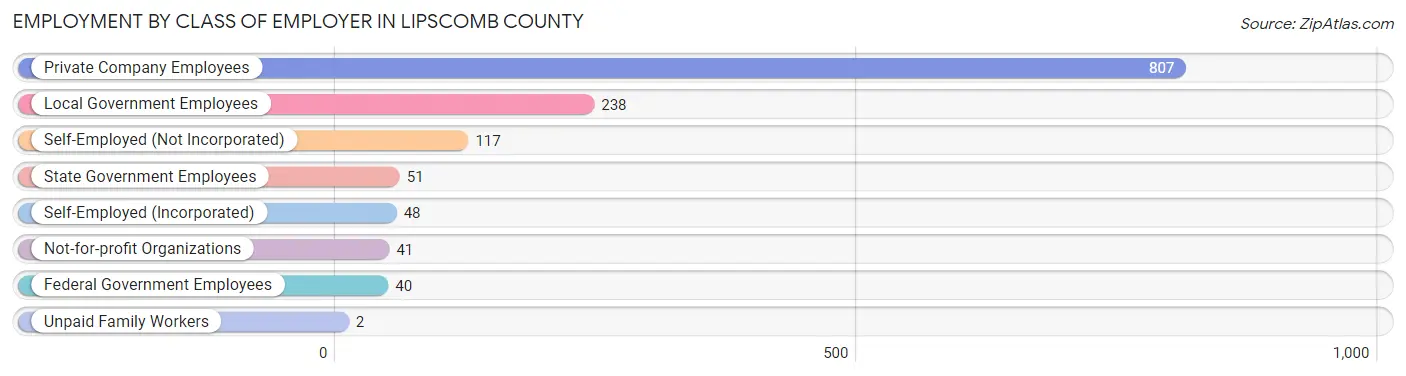
| Employer Class | # Employees | % Employees |
| Private Company Employees | 807 | 60.0% |
| Self-Employed (Incorporated) | 48 | 3.6% |
| Self-Employed (Not Incorporated) | 117 | 8.7% |
| Not-for-profit Organizations | 41 | 3.0% |
| Local Government Employees | 238 | 17.7% |
| State Government Employees | 51 | 3.8% |
| Federal Government Employees | 40 | 3.0% |
| Unpaid Family Workers | 2 | 0.2% |
| Total | 1,344 | 100.0% |
Employment Status by Age in Lipscomb County
According to the labor force statistics for Lipscomb County, out of the total population over 16 years of age (2,270), 64.2% or 1,457 individuals are in the labor force, with 5.9% or 86 of them unemployed. The age group with the highest labor force participation rate is 45 to 54 years, with 83.9% or 234 individuals in the labor force. Within the labor force, the 16 to 19 years age range has the highest percentage of unemployed individuals, with 52.1% or 37 of them being unemployed.
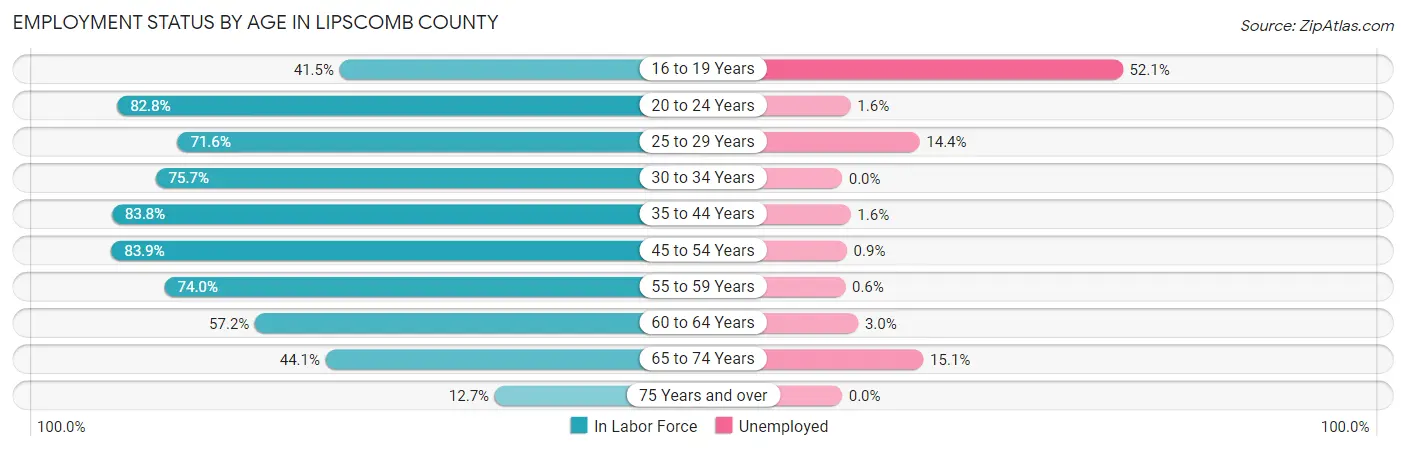
| Age Bracket | In Labor Force | Unemployed |
| 16 to 19 Years | 71 (41.5%) | 37 (52.1%) |
| 20 to 24 Years | 188 (82.8%) | 3 (1.6%) |
| 25 to 29 Years | 111 (71.6%) | 16 (14.4%) |
| 30 to 34 Years | 131 (75.7%) | 0 (0.0%) |
| 35 to 44 Years | 316 (83.8%) | 5 (1.6%) |
| 45 to 54 Years | 234 (83.9%) | 2 (0.9%) |
| 55 to 59 Years | 154 (74.0%) | 1 (0.6%) |
| 60 to 64 Years | 99 (57.2%) | 3 (3.0%) |
| 65 to 74 Years | 126 (44.1%) | 19 (15.1%) |
| 75 Years and over | 28 (12.7%) | 0 (0.0%) |
| Total | 1,457 (64.2%) | 86 (5.9%) |
Employment Status by Educational Attainment in Lipscomb County
According to labor force statistics for Lipscomb County, 76.6% of individuals (1,046) out of the total population between 25 and 64 years of age (1,365) are in the labor force, with 2.6% or 27 of them being unemployed. The group with the highest labor force participation rate are those with the educational attainment of bachelor's degree or higher, with 89.9% or 266 individuals in the labor force. Within the labor force, individuals with college / associate degree education have the highest percentage of unemployment, with 4.9% or 16 of them being unemployed.
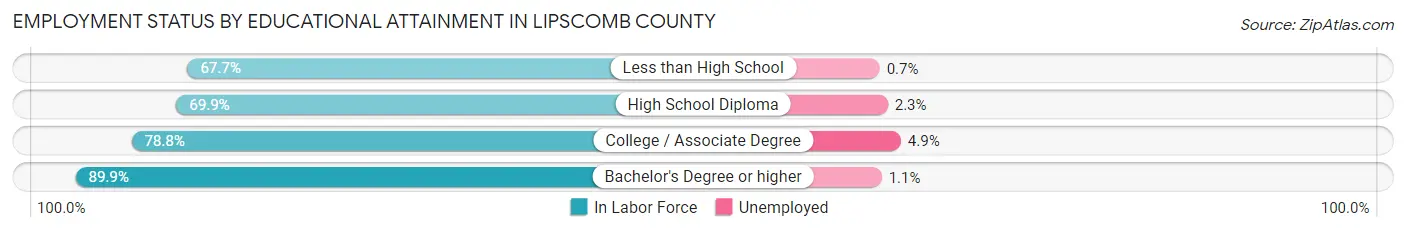
| Educational Attainment | In Labor Force | Unemployed |
| Less than High School | 149 (67.7%) | 2 (0.7%) |
| High School Diploma | 306 (69.9%) | 10 (2.3%) |
| College / Associate Degree | 324 (78.8%) | 20 (4.9%) |
| Bachelor's Degree or higher | 266 (89.9%) | 3 (1.1%) |
| Total | 1,046 (76.6%) | 35 (2.6%) |
Employment Occupations by Sex in Lipscomb County
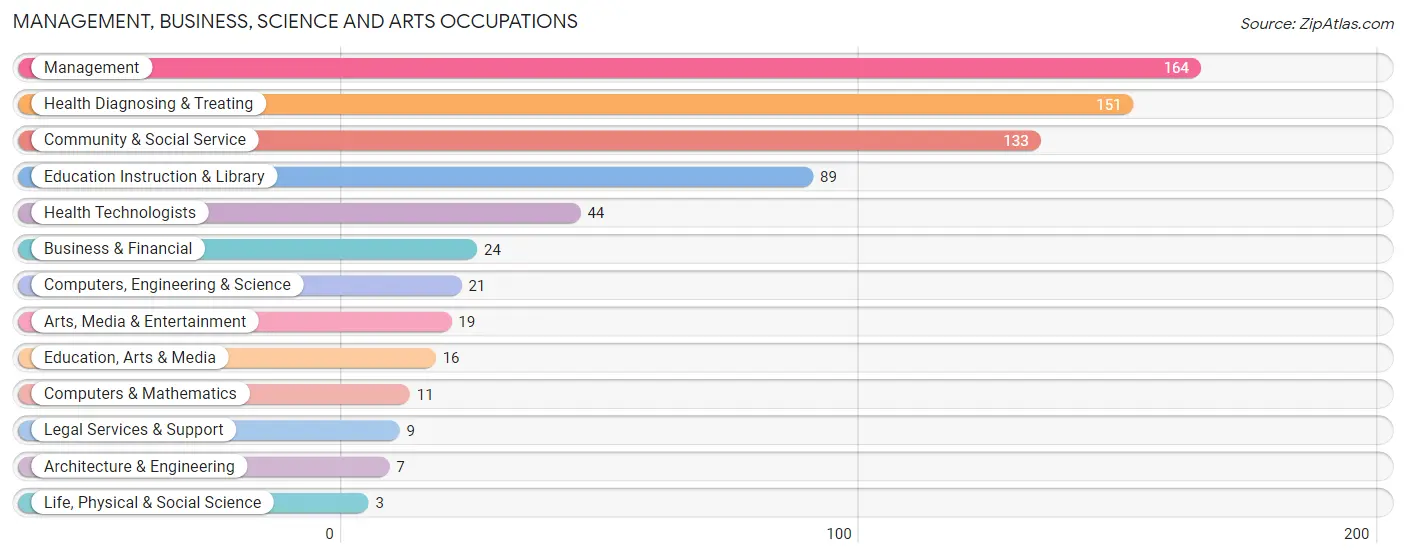
Management, Business, Science and Arts Occupations
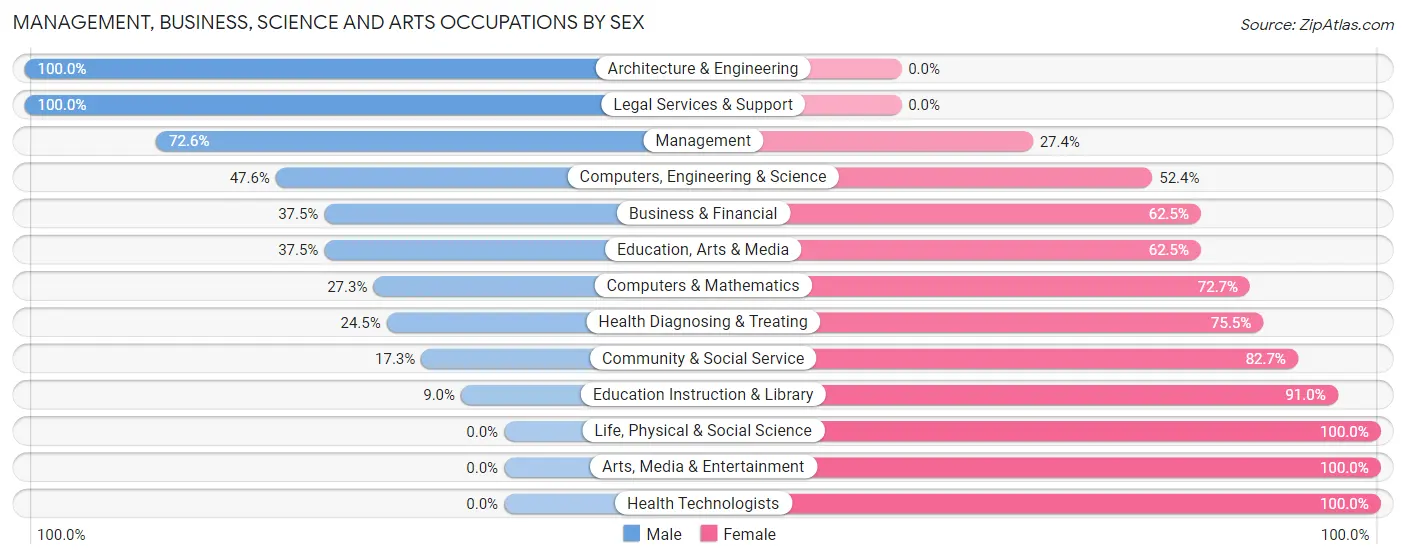
The most common Management, Business, Science and Arts occupations in Lipscomb County are Management (164 | 11.9%), Health Diagnosing & Treating (151 | 11.0%), Community & Social Service (133 | 9.7%), Education Instruction & Library (89 | 6.5%), and Health Technologists (44 | 3.2%).
Management, Business, Science and Arts Occupations by Sex
Within the Management, Business, Science and Arts occupations in Lipscomb County, the most male-oriented occupations are Architecture & Engineering (100.0%), Legal Services & Support (100.0%), and Management (72.6%), while the most female-oriented occupations are Life, Physical & Social Science (100.0%), Arts, Media & Entertainment (100.0%), and Health Technologists (100.0%).
| Occupation | Male | Female |
| Management | 119 (72.6%) | 45 (27.4%) |
| Business & Financial | 9 (37.5%) | 15 (62.5%) |
| Computers, Engineering & Science | 10 (47.6%) | 11 (52.4%) |
| Computers & Mathematics | 3 (27.3%) | 8 (72.7%) |
| Architecture & Engineering | 7 (100.0%) | 0 (0.0%) |
| Life, Physical & Social Science | 0 (0.0%) | 3 (100.0%) |
| Community & Social Service | 23 (17.3%) | 110 (82.7%) |
| Education, Arts & Media | 6 (37.5%) | 10 (62.5%) |
| Legal Services & Support | 9 (100.0%) | 0 (0.0%) |
| Education Instruction & Library | 8 (9.0%) | 81 (91.0%) |
| Arts, Media & Entertainment | 0 (0.0%) | 19 (100.0%) |
| Health Diagnosing & Treating | 37 (24.5%) | 114 (75.5%) |
| Health Technologists | 0 (0.0%) | 44 (100.0%) |
| Total (Category) | 198 (40.2%) | 295 (59.8%) |
| Total (Overall) | 745 (54.3%) | 627 (45.7%) |
Services Occupations
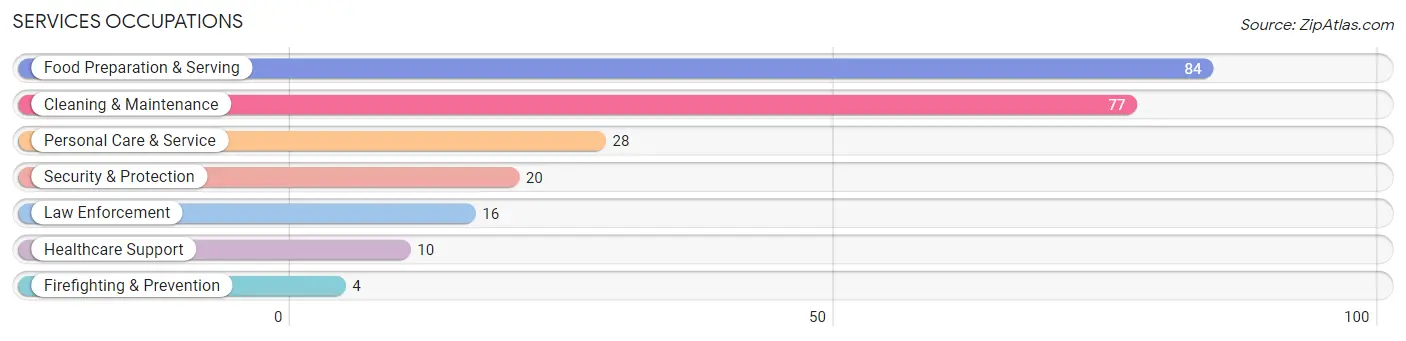
The most common Services occupations in Lipscomb County are Food Preparation & Serving (84 | 6.1%), Cleaning & Maintenance (77 | 5.6%), Personal Care & Service (28 | 2.0%), Security & Protection (20 | 1.5%), and Law Enforcement (16 | 1.2%).
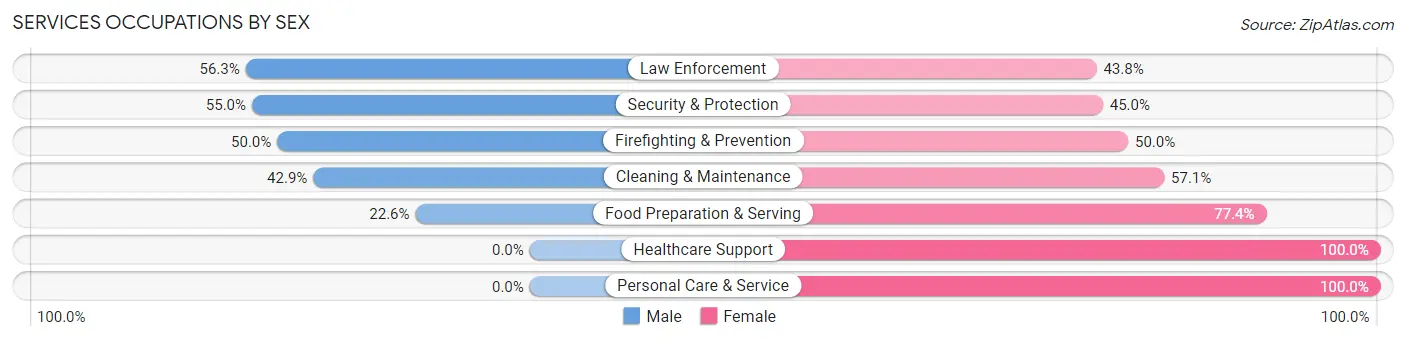
Services Occupations by Sex
Within the Services occupations in Lipscomb County, the most male-oriented occupations are Law Enforcement (56.2%), Security & Protection (55.0%), and Firefighting & Prevention (50.0%), while the most female-oriented occupations are Healthcare Support (100.0%), Personal Care & Service (100.0%), and Food Preparation & Serving (77.4%).
| Occupation | Male | Female |
| Healthcare Support | 0 (0.0%) | 10 (100.0%) |
| Security & Protection | 11 (55.0%) | 9 (45.0%) |
| Firefighting & Prevention | 2 (50.0%) | 2 (50.0%) |
| Law Enforcement | 9 (56.2%) | 7 (43.8%) |
| Food Preparation & Serving | 19 (22.6%) | 65 (77.4%) |
| Cleaning & Maintenance | 33 (42.9%) | 44 (57.1%) |
| Personal Care & Service | 0 (0.0%) | 28 (100.0%) |
| Total (Category) | 63 (28.8%) | 156 (71.2%) |
| Total (Overall) | 745 (54.3%) | 627 (45.7%) |
Sales and Office Occupations
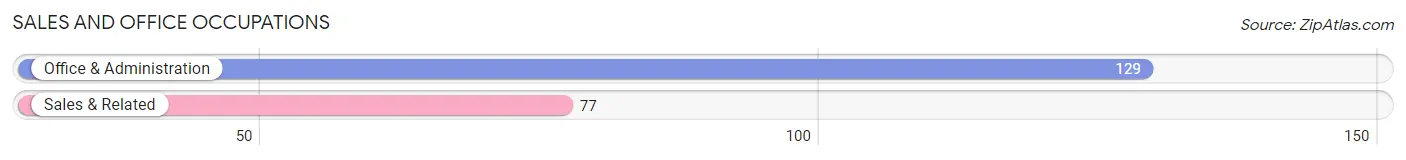
The most common Sales and Office occupations in Lipscomb County are Office & Administration (129 | 9.4%), and Sales & Related (77 | 5.6%).
Sales and Office Occupations by Sex
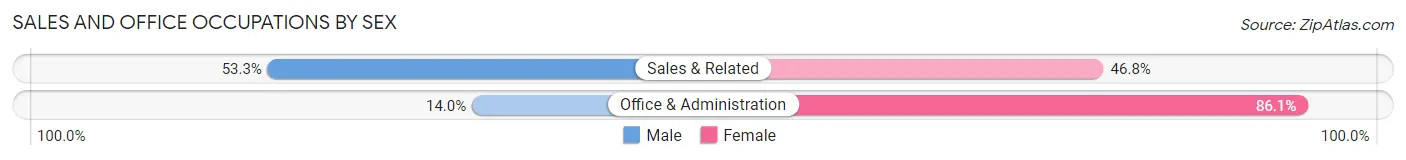
| Occupation | Male | Female |
| Sales & Related | 41 (53.2%) | 36 (46.8%) |
| Office & Administration | 18 (14.0%) | 111 (86.1%) |
| Total (Category) | 59 (28.6%) | 147 (71.4%) |
| Total (Overall) | 745 (54.3%) | 627 (45.7%) |
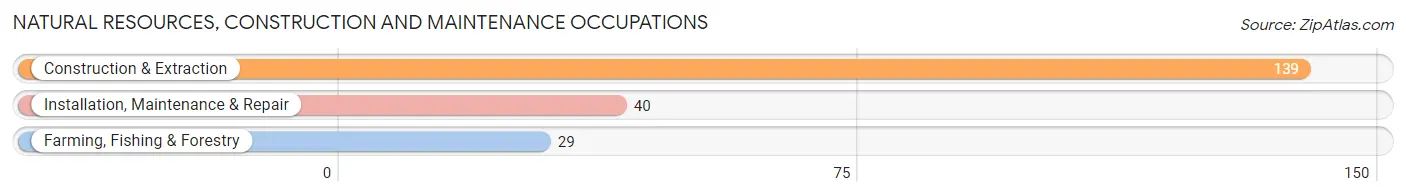
Natural Resources, Construction and Maintenance Occupations
The most common Natural Resources, Construction and Maintenance occupations in Lipscomb County are Construction & Extraction (139 | 10.1%), Installation, Maintenance & Repair (40 | 2.9%), and Farming, Fishing & Forestry (29 | 2.1%).
Natural Resources, Construction and Maintenance Occupations by Sex
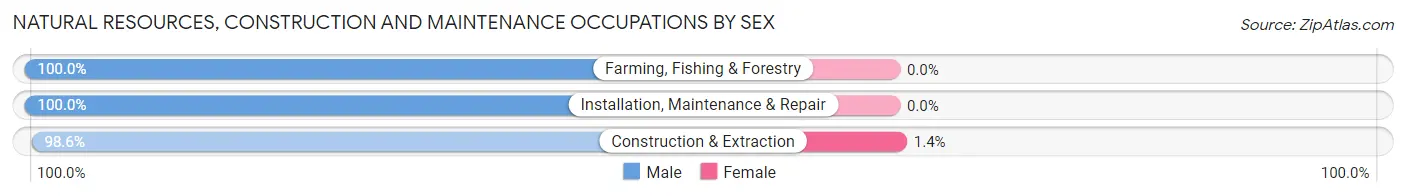
| Occupation | Male | Female |
| Farming, Fishing & Forestry | 29 (100.0%) | 0 (0.0%) |
| Construction & Extraction | 137 (98.6%) | 2 (1.4%) |
| Installation, Maintenance & Repair | 40 (100.0%) | 0 (0.0%) |
| Total (Category) | 206 (99.0%) | 2 (1.0%) |
| Total (Overall) | 745 (54.3%) | 627 (45.7%) |
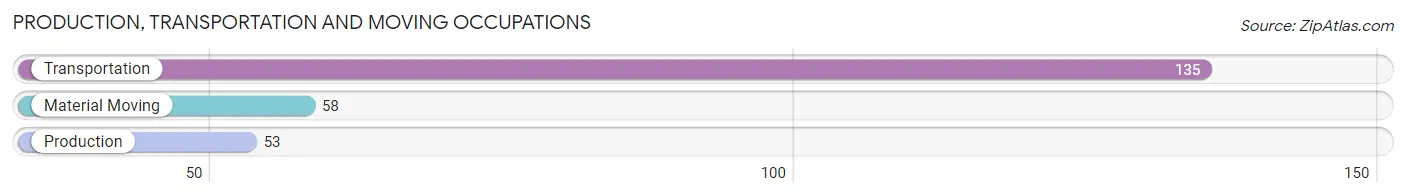
Production, Transportation and Moving Occupations
The most common Production, Transportation and Moving occupations in Lipscomb County are Transportation (135 | 9.8%), Material Moving (58 | 4.2%), and Production (53 | 3.9%).
Production, Transportation and Moving Occupations by Sex
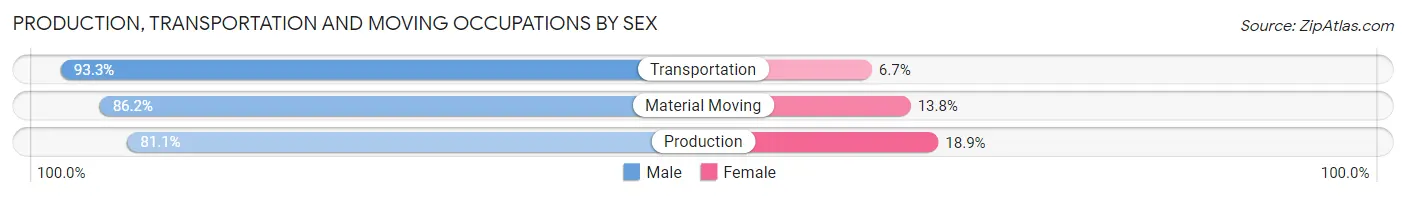
| Occupation | Male | Female |
| Production | 43 (81.1%) | 10 (18.9%) |
| Transportation | 126 (93.3%) | 9 (6.7%) |
| Material Moving | 50 (86.2%) | 8 (13.8%) |
| Total (Category) | 219 (89.0%) | 27 (11.0%) |
| Total (Overall) | 745 (54.3%) | 627 (45.7%) |
Employment Industries by Sex in Lipscomb County
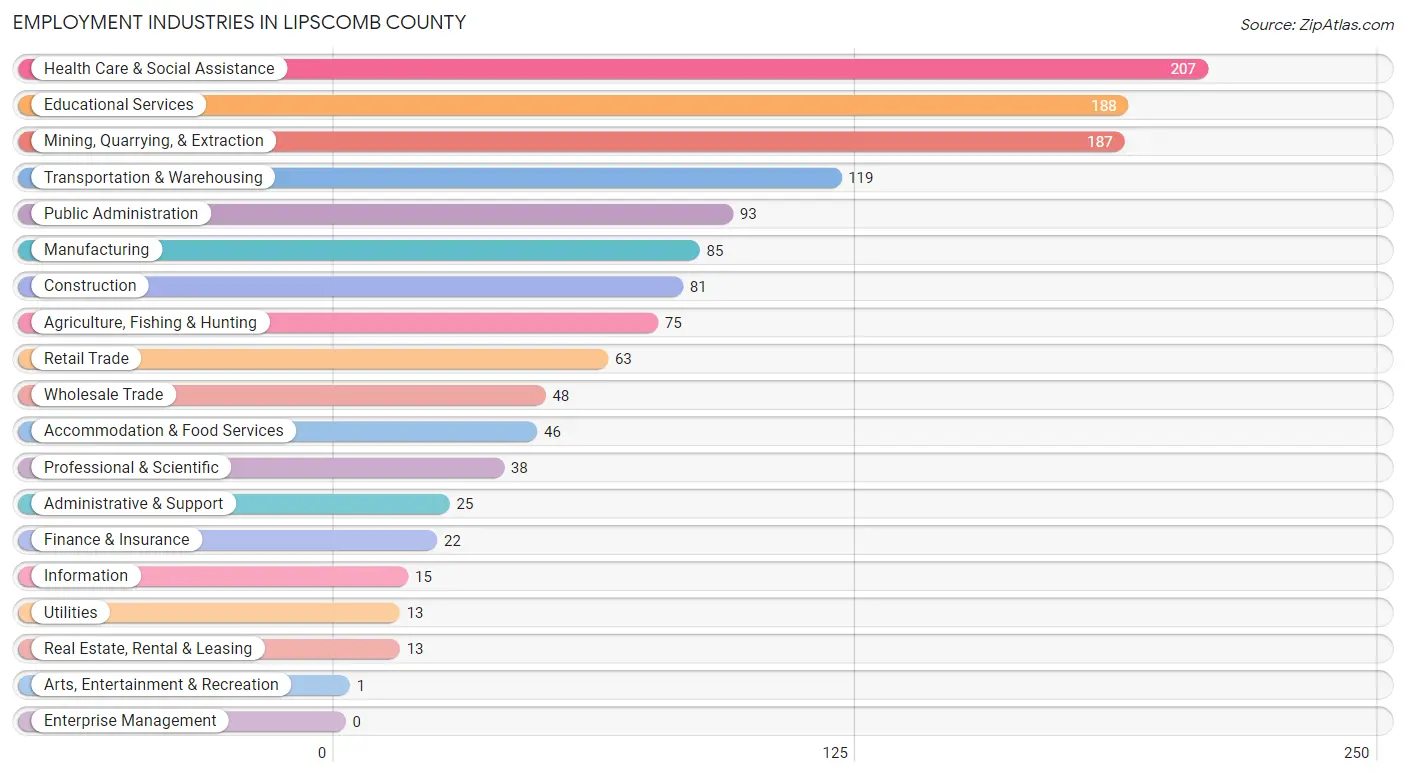
Employment Industries in Lipscomb County
The major employment industries in Lipscomb County include Health Care & Social Assistance (207 | 15.1%), Educational Services (188 | 13.7%), Mining, Quarrying, & Extraction (187 | 13.6%), Transportation & Warehousing (119 | 8.7%), and Public Administration (93 | 6.8%).
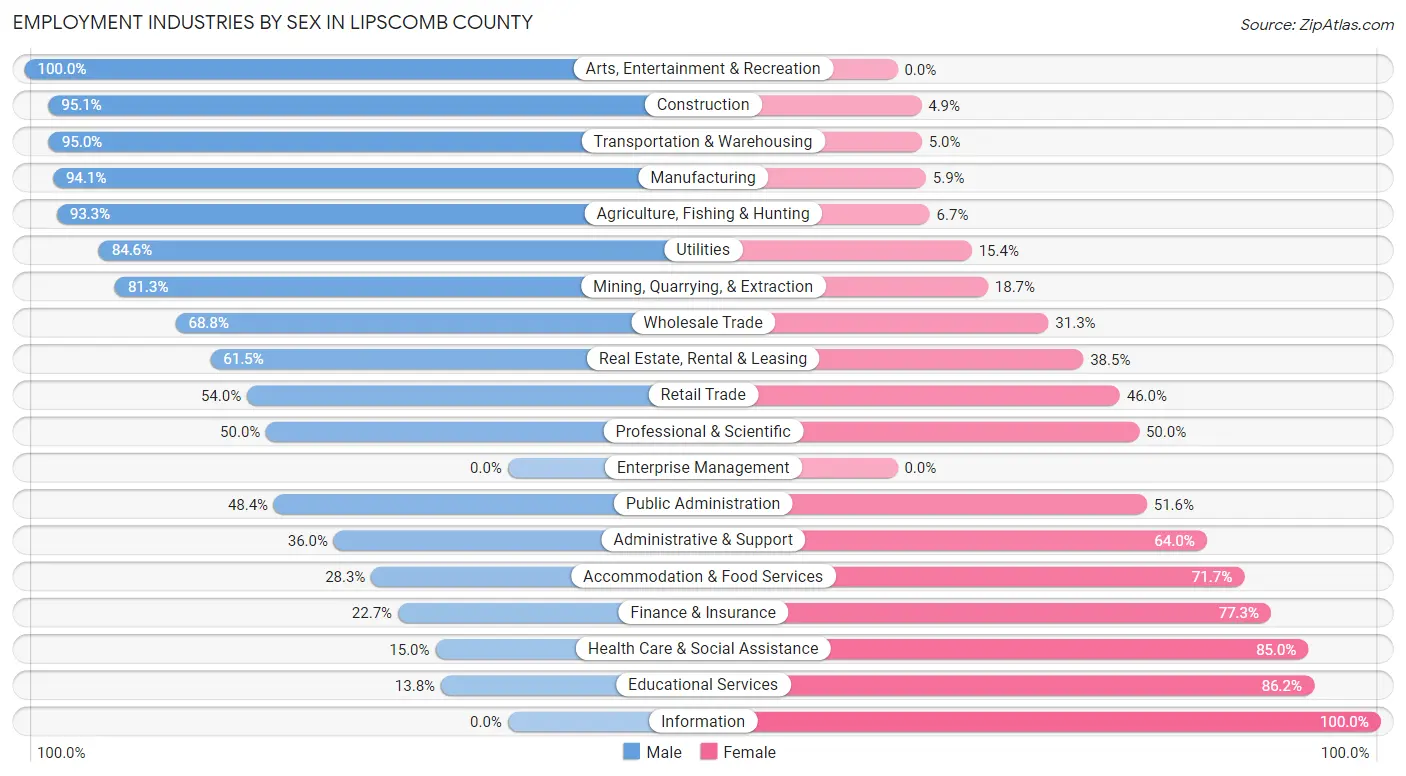
Employment Industries by Sex in Lipscomb County
The Lipscomb County industries that see more men than women are Arts, Entertainment & Recreation (100.0%), Construction (95.1%), and Transportation & Warehousing (95.0%), whereas the industries that tend to have a higher number of women are Information (100.0%), Educational Services (86.2%), and Health Care & Social Assistance (85.0%).
| Industry | Male | Female |
| Agriculture, Fishing & Hunting | 70 (93.3%) | 5 (6.7%) |
| Mining, Quarrying, & Extraction | 152 (81.3%) | 35 (18.7%) |
| Construction | 77 (95.1%) | 4 (4.9%) |
| Manufacturing | 80 (94.1%) | 5 (5.9%) |
| Wholesale Trade | 33 (68.8%) | 15 (31.2%) |
| Retail Trade | 34 (54.0%) | 29 (46.0%) |
| Transportation & Warehousing | 113 (95.0%) | 6 (5.0%) |
| Utilities | 11 (84.6%) | 2 (15.4%) |
| Information | 0 (0.0%) | 15 (100.0%) |
| Finance & Insurance | 5 (22.7%) | 17 (77.3%) |
| Real Estate, Rental & Leasing | 8 (61.5%) | 5 (38.5%) |
| Professional & Scientific | 19 (50.0%) | 19 (50.0%) |
| Enterprise Management | 0 (0.0%) | 0 (0.0%) |
| Administrative & Support | 9 (36.0%) | 16 (64.0%) |
| Educational Services | 26 (13.8%) | 162 (86.2%) |
| Health Care & Social Assistance | 31 (15.0%) | 176 (85.0%) |
| Arts, Entertainment & Recreation | 1 (100.0%) | 0 (0.0%) |
| Accommodation & Food Services | 13 (28.3%) | 33 (71.7%) |
| Public Administration | 45 (48.4%) | 48 (51.6%) |
| Total | 745 (54.3%) | 627 (45.7%) |
Education in Lipscomb County
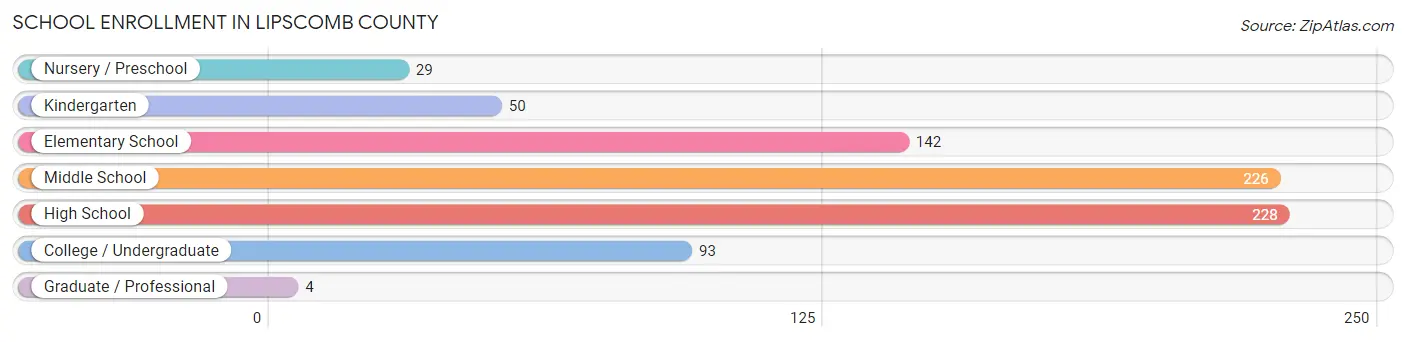
School Enrollment in Lipscomb County
The most common levels of schooling among the 772 students in Lipscomb County are high school (228 | 29.5%), middle school (226 | 29.3%), and elementary school (142 | 18.4%).
| School Level | # Students | % Students |
| Nursery / Preschool | 29 | 3.8% |
| Kindergarten | 50 | 6.5% |
| Elementary School | 142 | 18.4% |
| Middle School | 226 | 29.3% |
| High School | 228 | 29.5% |
| College / Undergraduate | 93 | 12.0% |
| Graduate / Professional | 4 | 0.5% |
| Total | 772 | 100.0% |
School Enrollment by Age by Funding Source in Lipscomb County
Out of a total of 772 students who are enrolled in schools in Lipscomb County, 31 (4.0%) attend a private institution, while the remaining 741 (96.0%) are enrolled in public schools. The age group of 20 to 24 year olds has the highest likelihood of being enrolled in private schools, with 4 (12.9% in the age bracket) enrolled. Conversely, the age group of 3 to 4 year olds has the lowest likelihood of being enrolled in a private school, with 19 (100.0% in the age bracket) attending a public institution.
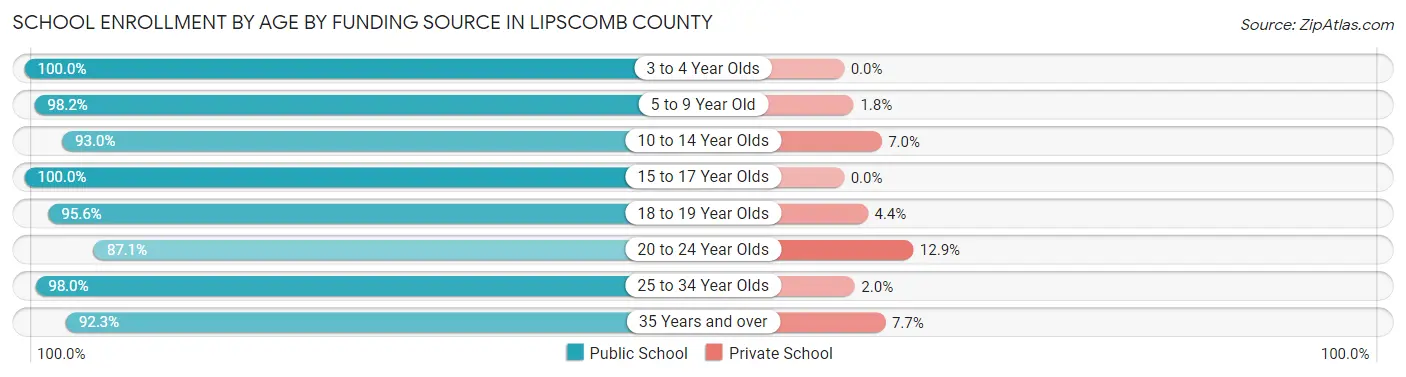
| Age Bracket | Public School | Private School |
| 3 to 4 Year Olds | 19 (100.0%) | 0 (0.0%) |
| 5 to 9 Year Old | 161 (98.2%) | 3 (1.8%) |
| 10 to 14 Year Olds | 266 (93.0%) | 20 (7.0%) |
| 15 to 17 Year Olds | 164 (100.0%) | 0 (0.0%) |
| 18 to 19 Year Olds | 43 (95.6%) | 2 (4.4%) |
| 20 to 24 Year Olds | 27 (87.1%) | 4 (12.9%) |
| 25 to 34 Year Olds | 49 (98.0%) | 1 (2.0%) |
| 35 Years and over | 12 (92.3%) | 1 (7.7%) |
| Total | 741 (96.0%) | 31 (4.0%) |
Educational Attainment by Field of Study in Lipscomb County
Education (150 | 31.1%), business (99 | 20.5%), bio, nature & agricultural (91 | 18.8%), science & technology (33 | 6.8%), and arts & humanities (25 | 5.2%) are the most common fields of study among 483 individuals in Lipscomb County who have obtained a bachelor's degree or higher.
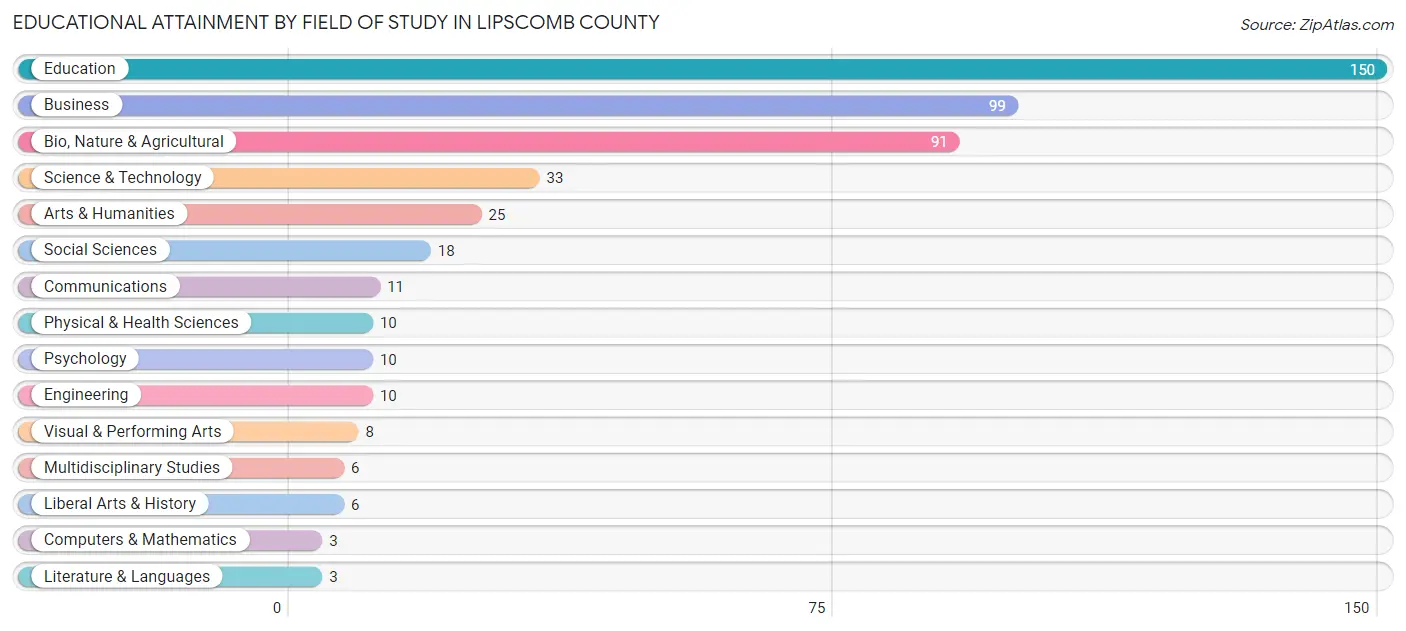
| Field of Study | # Graduates | % Graduates |
| Computers & Mathematics | 3 | 0.6% |
| Bio, Nature & Agricultural | 91 | 18.8% |
| Physical & Health Sciences | 10 | 2.1% |
| Psychology | 10 | 2.1% |
| Social Sciences | 18 | 3.7% |
| Engineering | 10 | 2.1% |
| Multidisciplinary Studies | 6 | 1.2% |
| Science & Technology | 33 | 6.8% |
| Business | 99 | 20.5% |
| Education | 150 | 31.1% |
| Literature & Languages | 3 | 0.6% |
| Liberal Arts & History | 6 | 1.2% |
| Visual & Performing Arts | 8 | 1.7% |
| Communications | 11 | 2.3% |
| Arts & Humanities | 25 | 5.2% |
| Total | 483 | 100.0% |
Transportation & Commute in Lipscomb County
Vehicle Availability by Sex in Lipscomb County
The most prevalent vehicle ownership categories in Lipscomb County are males with 2 vehicles (276, accounting for 37.4%) and females with 2 vehicles (240, making up 45.5%).
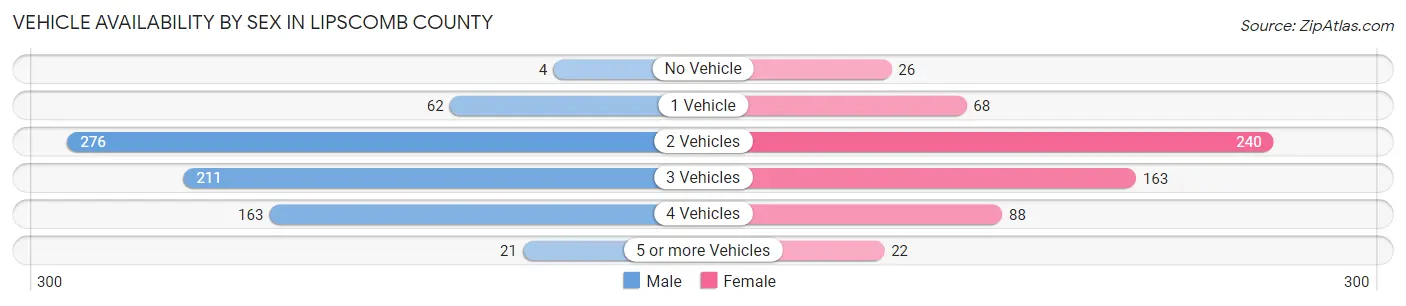
| Vehicles Available | Male | Female |
| No Vehicle | 4 (0.5%) | 26 (4.3%) |
| 1 Vehicle | 62 (8.4%) | 68 (11.2%) |
| 2 Vehicles | 276 (37.4%) | 240 (39.5%) |
| 3 Vehicles | 211 (28.6%) | 163 (26.9%) |
| 4 Vehicles | 163 (22.1%) | 88 (14.5%) |
| 5 or more Vehicles | 21 (2.9%) | 22 (3.6%) |
| Total | 737 (100.0%) | 607 (100.0%) |
Commute Time in Lipscomb County
The most frequently occuring commute durations in Lipscomb County are less than 5 minutes (317 commuters, 23.9%), 10 to 14 minutes (211 commuters, 15.9%), and 20 to 24 minutes (199 commuters, 15.0%).
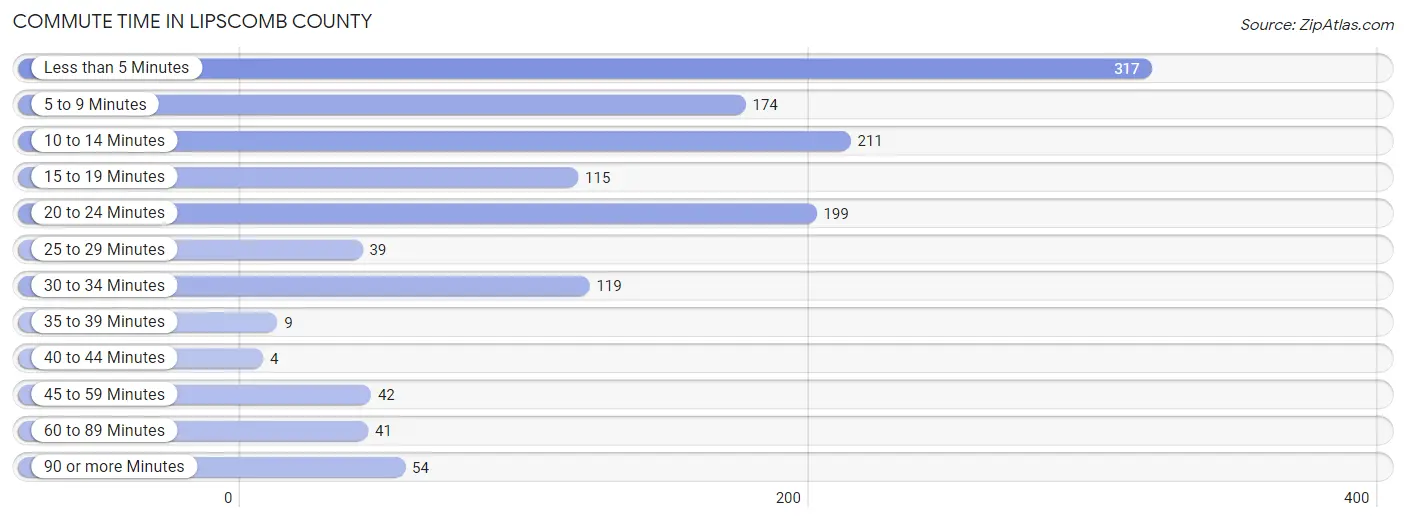
| Commute Time | # Commuters | % Commuters |
| Less than 5 Minutes | 317 | 23.9% |
| 5 to 9 Minutes | 174 | 13.1% |
| 10 to 14 Minutes | 211 | 15.9% |
| 15 to 19 Minutes | 115 | 8.7% |
| 20 to 24 Minutes | 199 | 15.0% |
| 25 to 29 Minutes | 39 | 2.9% |
| 30 to 34 Minutes | 119 | 9.0% |
| 35 to 39 Minutes | 9 | 0.7% |
| 40 to 44 Minutes | 4 | 0.3% |
| 45 to 59 Minutes | 42 | 3.2% |
| 60 to 89 Minutes | 41 | 3.1% |
| 90 or more Minutes | 54 | 4.1% |
Commute Time by Sex in Lipscomb County
The most common commute times in Lipscomb County are less than 5 minutes (162 commuters, 22.1%) for males and less than 5 minutes (155 commuters, 26.3%) for females.
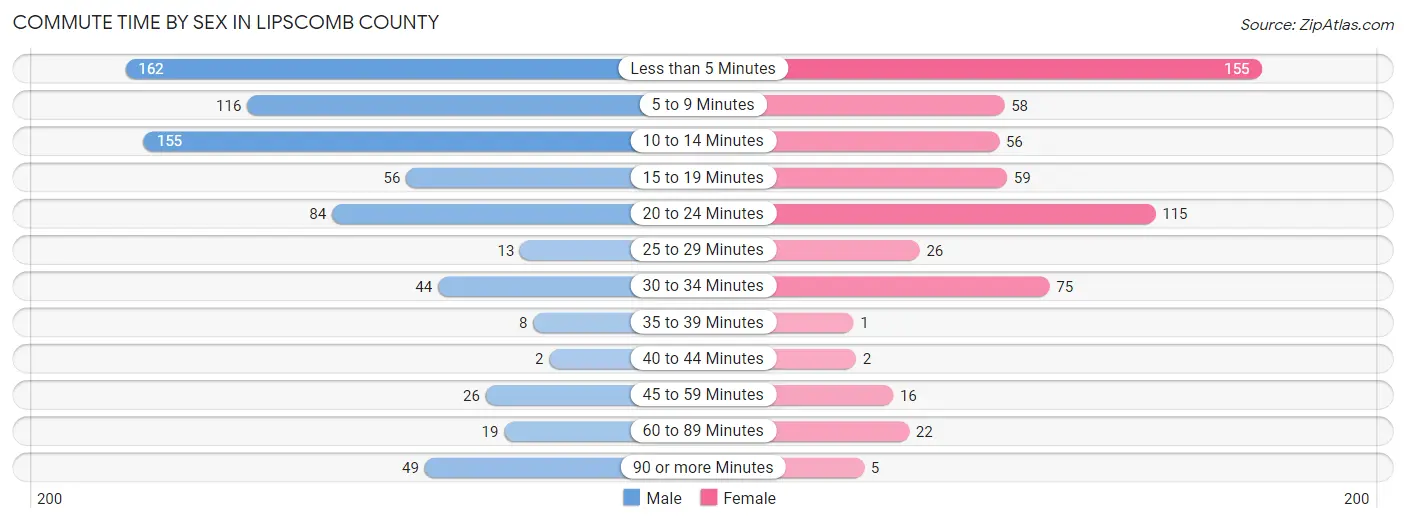
| Commute Time | Male | Female |
| Less than 5 Minutes | 162 (22.1%) | 155 (26.3%) |
| 5 to 9 Minutes | 116 (15.8%) | 58 (9.8%) |
| 10 to 14 Minutes | 155 (21.1%) | 56 (9.5%) |
| 15 to 19 Minutes | 56 (7.6%) | 59 (10.0%) |
| 20 to 24 Minutes | 84 (11.4%) | 115 (19.5%) |
| 25 to 29 Minutes | 13 (1.8%) | 26 (4.4%) |
| 30 to 34 Minutes | 44 (6.0%) | 75 (12.7%) |
| 35 to 39 Minutes | 8 (1.1%) | 1 (0.2%) |
| 40 to 44 Minutes | 2 (0.3%) | 2 (0.3%) |
| 45 to 59 Minutes | 26 (3.5%) | 16 (2.7%) |
| 60 to 89 Minutes | 19 (2.6%) | 22 (3.7%) |
| 90 or more Minutes | 49 (6.7%) | 5 (0.9%) |
Time of Departure to Work by Sex in Lipscomb County
The most frequent times of departure to work in Lipscomb County are 6:30 AM to 6:59 AM (144, 19.6%) for males and 7:00 AM to 7:29 AM (98, 16.6%) for females.
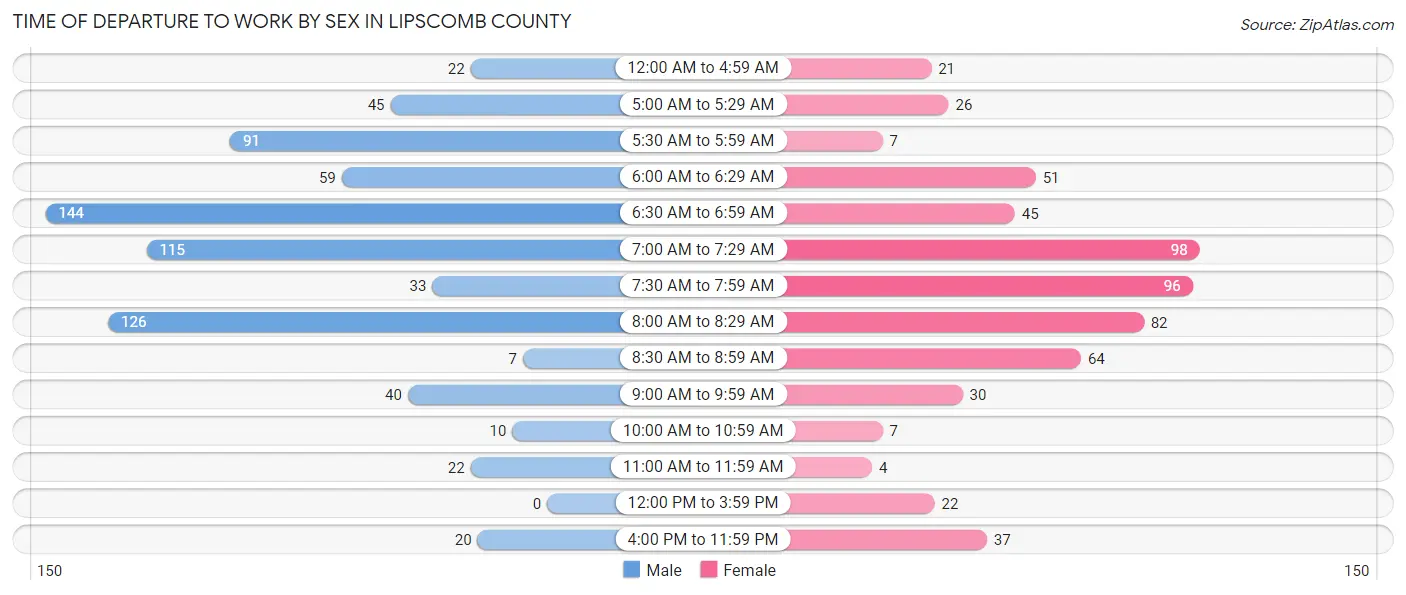
| Time of Departure | Male | Female |
| 12:00 AM to 4:59 AM | 22 (3.0%) | 21 (3.6%) |
| 5:00 AM to 5:29 AM | 45 (6.1%) | 26 (4.4%) |
| 5:30 AM to 5:59 AM | 91 (12.4%) | 7 (1.2%) |
| 6:00 AM to 6:29 AM | 59 (8.0%) | 51 (8.6%) |
| 6:30 AM to 6:59 AM | 144 (19.6%) | 45 (7.6%) |
| 7:00 AM to 7:29 AM | 115 (15.7%) | 98 (16.6%) |
| 7:30 AM to 7:59 AM | 33 (4.5%) | 96 (16.3%) |
| 8:00 AM to 8:29 AM | 126 (17.2%) | 82 (13.9%) |
| 8:30 AM to 8:59 AM | 7 (0.9%) | 64 (10.8%) |
| 9:00 AM to 9:59 AM | 40 (5.4%) | 30 (5.1%) |
| 10:00 AM to 10:59 AM | 10 (1.4%) | 7 (1.2%) |
| 11:00 AM to 11:59 AM | 22 (3.0%) | 4 (0.7%) |
| 12:00 PM to 3:59 PM | 0 (0.0%) | 22 (3.7%) |
| 4:00 PM to 11:59 PM | 20 (2.7%) | 37 (6.3%) |
| Total | 734 (100.0%) | 590 (100.0%) |
Housing Occupancy in Lipscomb County
Occupancy by Ownership in Lipscomb County
Of the total 1,135 dwellings in Lipscomb County, owner-occupied units account for 885 (78.0%), while renter-occupied units make up 250 (22.0%).
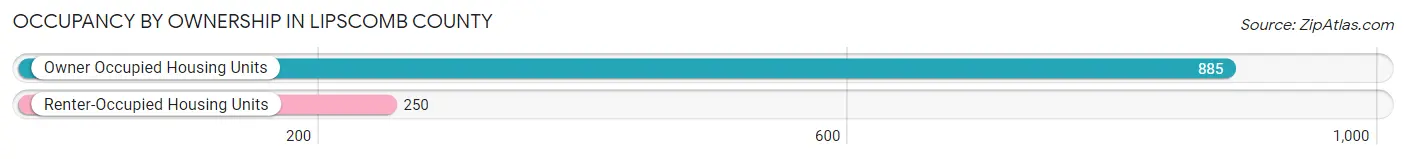
| Occupancy | # Housing Units | % Housing Units |
| Owner Occupied Housing Units | 885 | 78.0% |
| Renter-Occupied Housing Units | 250 | 22.0% |
| Total Occupied Housing Units | 1,135 | 100.0% |
Occupancy by Household Size in Lipscomb County
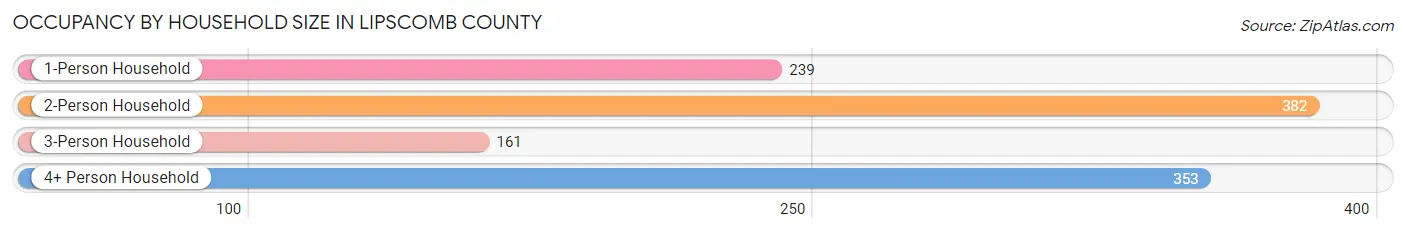
| Household Size | # Housing Units | % Housing Units |
| 1-Person Household | 239 | 21.1% |
| 2-Person Household | 382 | 33.7% |
| 3-Person Household | 161 | 14.2% |
| 4+ Person Household | 353 | 31.1% |
| Total Housing Units | 1,135 | 100.0% |
Occupancy by Ownership by Household Size in Lipscomb County
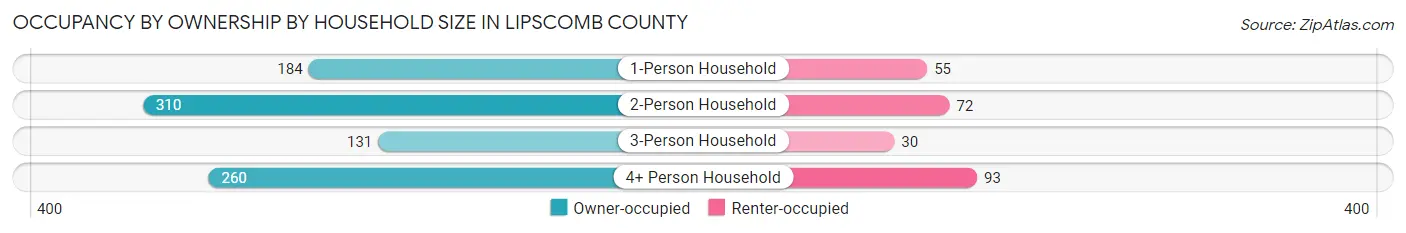
| Household Size | Owner-occupied | Renter-occupied |
| 1-Person Household | 184 (77.0%) | 55 (23.0%) |
| 2-Person Household | 310 (81.1%) | 72 (18.9%) |
| 3-Person Household | 131 (81.4%) | 30 (18.6%) |
| 4+ Person Household | 260 (73.7%) | 93 (26.4%) |
| Total Housing Units | 885 (78.0%) | 250 (22.0%) |
Occupancy by Educational Attainment in Lipscomb County
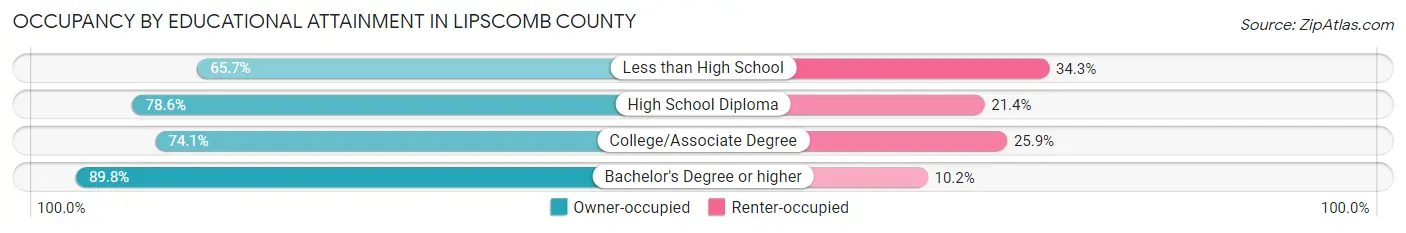
| Household Size | Owner-occupied | Renter-occupied |
| Less than High School | 94 (65.7%) | 49 (34.3%) |
| High School Diploma | 253 (78.6%) | 69 (21.4%) |
| College/Associate Degree | 300 (74.1%) | 105 (25.9%) |
| Bachelor's Degree or higher | 238 (89.8%) | 27 (10.2%) |
Occupancy by Age of Householder in Lipscomb County
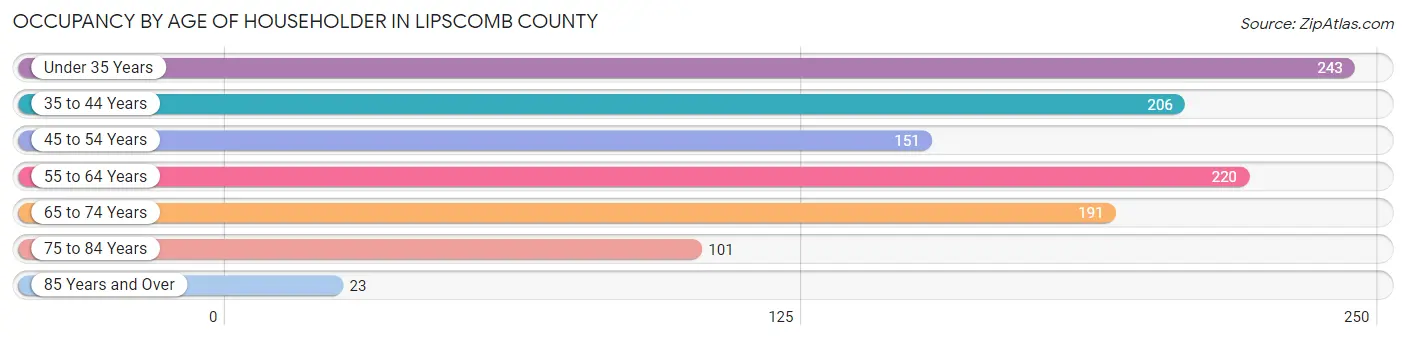
| Age Bracket | # Households | % Households |
| Under 35 Years | 243 | 21.4% |
| 35 to 44 Years | 206 | 18.1% |
| 45 to 54 Years | 151 | 13.3% |
| 55 to 64 Years | 220 | 19.4% |
| 65 to 74 Years | 191 | 16.8% |
| 75 to 84 Years | 101 | 8.9% |
| 85 Years and Over | 23 | 2.0% |
| Total | 1,135 | 100.0% |
Housing Finances in Lipscomb County
Median Income by Occupancy in Lipscomb County
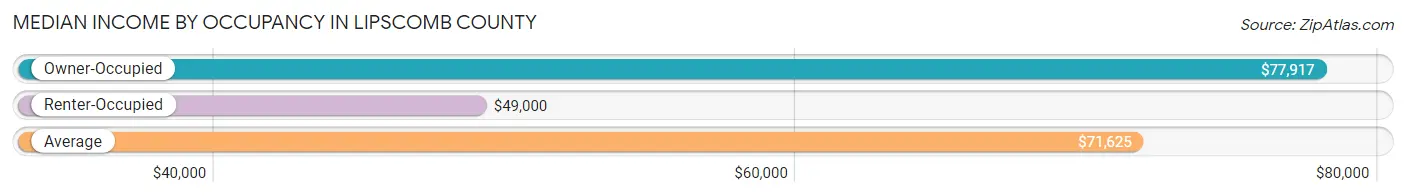
| Occupancy Type | # Households | Median Income |
| Owner-Occupied | 885 (78.0%) | $77,917 |
| Renter-Occupied | 250 (22.0%) | $49,000 |
| Average | 1,135 (100.0%) | $71,625 |
Occupancy by Householder Income Bracket in Lipscomb County
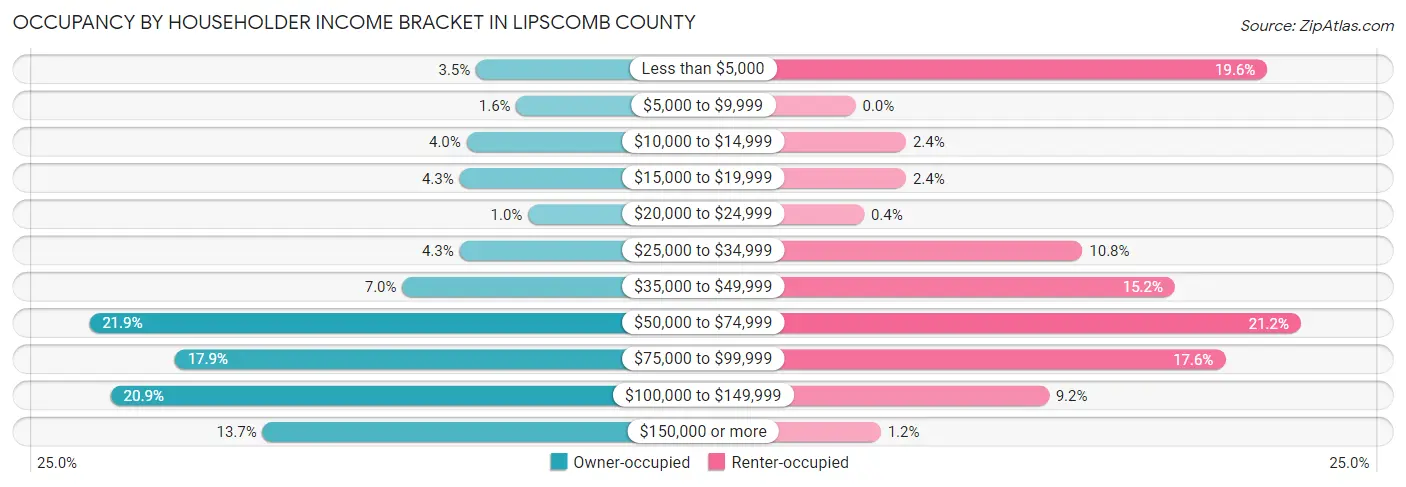
| Income Bracket | Owner-occupied | Renter-occupied |
| Less than $5,000 | 31 (3.5%) | 49 (19.6%) |
| $5,000 to $9,999 | 14 (1.6%) | 0 (0.0%) |
| $10,000 to $14,999 | 35 (4.0%) | 6 (2.4%) |
| $15,000 to $19,999 | 38 (4.3%) | 6 (2.4%) |
| $20,000 to $24,999 | 9 (1.0%) | 1 (0.4%) |
| $25,000 to $34,999 | 38 (4.3%) | 27 (10.8%) |
| $35,000 to $49,999 | 62 (7.0%) | 38 (15.2%) |
| $50,000 to $74,999 | 194 (21.9%) | 53 (21.2%) |
| $75,000 to $99,999 | 158 (17.8%) | 44 (17.6%) |
| $100,000 to $149,999 | 185 (20.9%) | 23 (9.2%) |
| $150,000 or more | 121 (13.7%) | 3 (1.2%) |
| Total | 885 (100.0%) | 250 (100.0%) |
Monthly Housing Cost Tiers in Lipscomb County
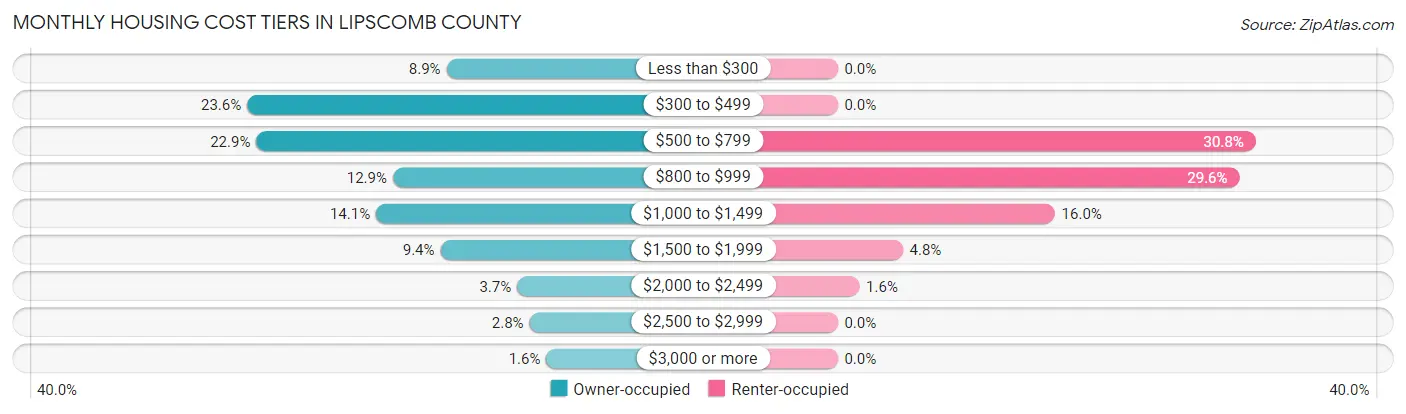
| Monthly Cost | Owner-occupied | Renter-occupied |
| Less than $300 | 79 (8.9%) | 0 (0.0%) |
| $300 to $499 | 209 (23.6%) | 0 (0.0%) |
| $500 to $799 | 203 (22.9%) | 77 (30.8%) |
| $800 to $999 | 114 (12.9%) | 74 (29.6%) |
| $1,000 to $1,499 | 125 (14.1%) | 40 (16.0%) |
| $1,500 to $1,999 | 83 (9.4%) | 12 (4.8%) |
| $2,000 to $2,499 | 33 (3.7%) | 4 (1.6%) |
| $2,500 to $2,999 | 25 (2.8%) | 0 (0.0%) |
| $3,000 or more | 14 (1.6%) | 0 (0.0%) |
| Total | 885 (100.0%) | 250 (100.0%) |
Physical Housing Characteristics in Lipscomb County
Housing Structures in Lipscomb County
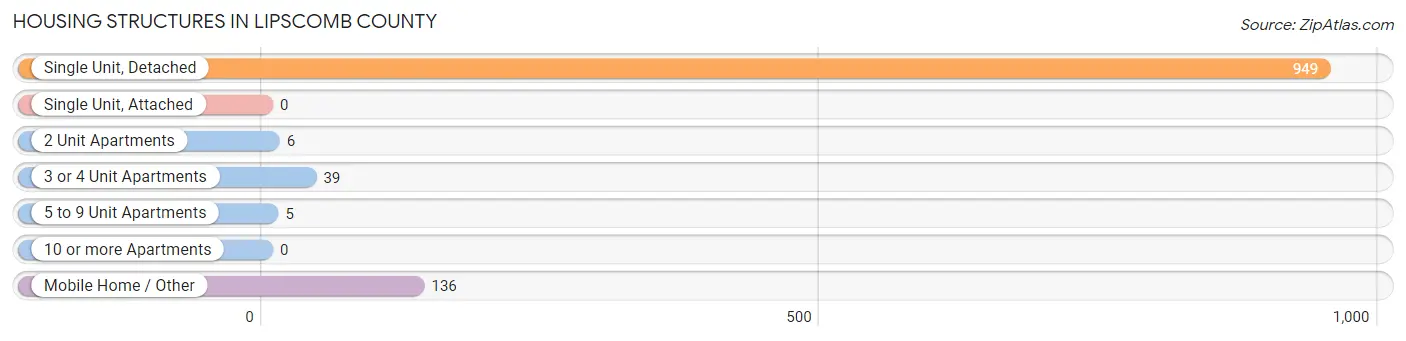
| Structure Type | # Housing Units | % Housing Units |
| Single Unit, Detached | 949 | 83.6% |
| Single Unit, Attached | 0 | 0.0% |
| 2 Unit Apartments | 6 | 0.5% |
| 3 or 4 Unit Apartments | 39 | 3.4% |
| 5 to 9 Unit Apartments | 5 | 0.4% |
| 10 or more Apartments | 0 | 0.0% |
| Mobile Home / Other | 136 | 12.0% |
| Total | 1,135 | 100.0% |
Housing Structures by Occupancy in Lipscomb County
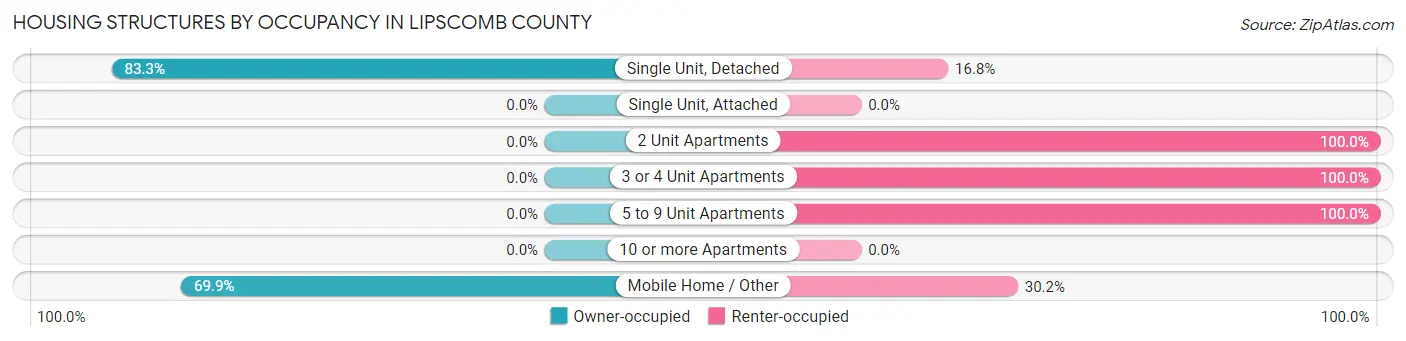
| Structure Type | Owner-occupied | Renter-occupied |
| Single Unit, Detached | 790 (83.3%) | 159 (16.8%) |
| Single Unit, Attached | 0 (0.0%) | 0 (0.0%) |
| 2 Unit Apartments | 0 (0.0%) | 6 (100.0%) |
| 3 or 4 Unit Apartments | 0 (0.0%) | 39 (100.0%) |
| 5 to 9 Unit Apartments | 0 (0.0%) | 5 (100.0%) |
| 10 or more Apartments | 0 (0.0%) | 0 (0.0%) |
| Mobile Home / Other | 95 (69.9%) | 41 (30.1%) |
| Total | 885 (78.0%) | 250 (22.0%) |
Housing Structures by Number of Rooms in Lipscomb County
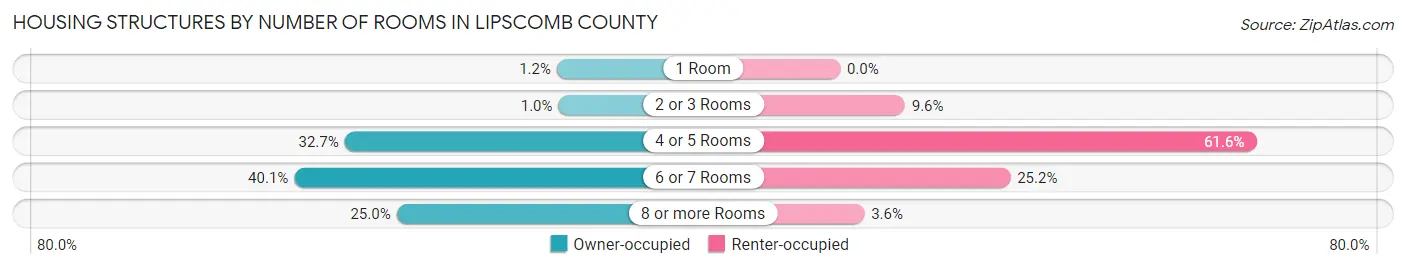
| Number of Rooms | Owner-occupied | Renter-occupied |
| 1 Room | 11 (1.2%) | 0 (0.0%) |
| 2 or 3 Rooms | 9 (1.0%) | 24 (9.6%) |
| 4 or 5 Rooms | 289 (32.7%) | 154 (61.6%) |
| 6 or 7 Rooms | 355 (40.1%) | 63 (25.2%) |
| 8 or more Rooms | 221 (25.0%) | 9 (3.6%) |
| Total | 885 (100.0%) | 250 (100.0%) |
Housing Structure by Heating Type in Lipscomb County
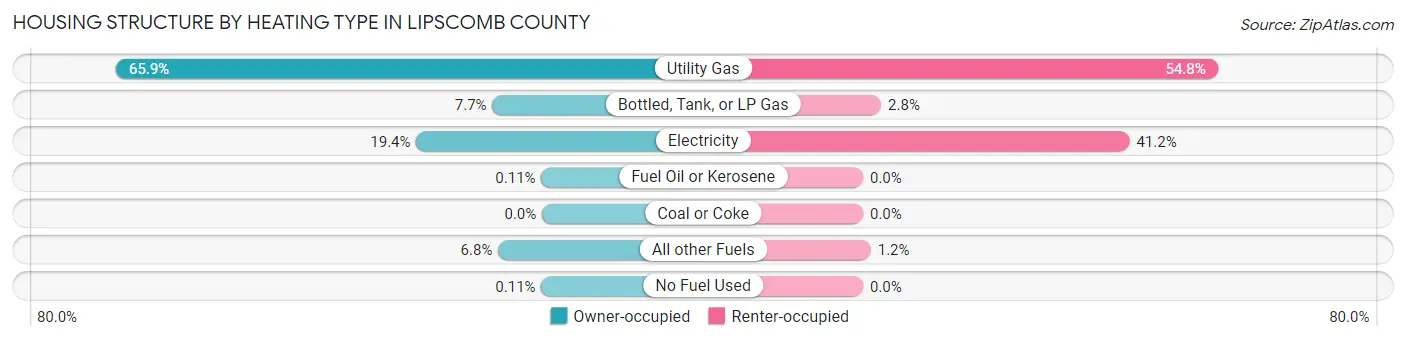
| Heating Type | Owner-occupied | Renter-occupied |
| Utility Gas | 583 (65.9%) | 137 (54.8%) |
| Bottled, Tank, or LP Gas | 68 (7.7%) | 7 (2.8%) |
| Electricity | 172 (19.4%) | 103 (41.2%) |
| Fuel Oil or Kerosene | 1 (0.1%) | 0 (0.0%) |
| Coal or Coke | 0 (0.0%) | 0 (0.0%) |
| All other Fuels | 60 (6.8%) | 3 (1.2%) |
| No Fuel Used | 1 (0.1%) | 0 (0.0%) |
| Total | 885 (100.0%) | 250 (100.0%) |
Household Vehicle Usage in Lipscomb County
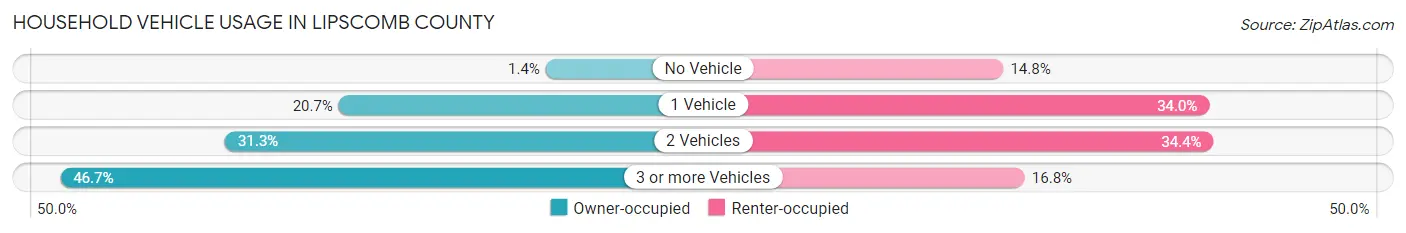
| Vehicles per Household | Owner-occupied | Renter-occupied |
| No Vehicle | 12 (1.4%) | 37 (14.8%) |
| 1 Vehicle | 183 (20.7%) | 85 (34.0%) |
| 2 Vehicles | 277 (31.3%) | 86 (34.4%) |
| 3 or more Vehicles | 413 (46.7%) | 42 (16.8%) |
| Total | 885 (100.0%) | 250 (100.0%) |
Real Estate & Mortgages in Lipscomb County
Real Estate and Mortgage Overview in Lipscomb County
| Characteristic | Without Mortgage | With Mortgage |
| Housing Units | 564 | 321 |
| Median Property Value | $109,000 | $130,700 |
| Median Household Income | $73,913 | $55 |
| Monthly Housing Costs | $495 | $4 |
| Real Estate Taxes | $1,429 | $14 |
Property Value by Mortgage Status in Lipscomb County
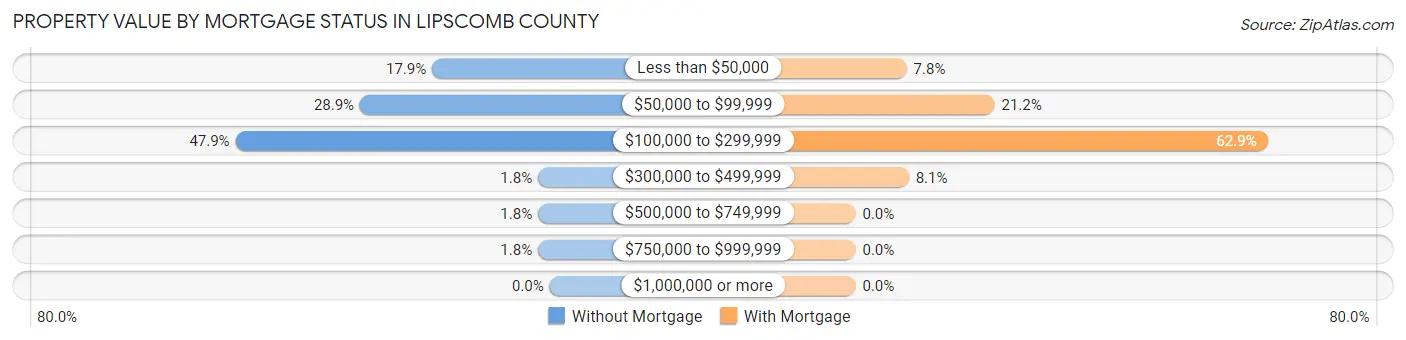
| Property Value | Without Mortgage | With Mortgage |
| Less than $50,000 | 101 (17.9%) | 25 (7.8%) |
| $50,000 to $99,999 | 163 (28.9%) | 68 (21.2%) |
| $100,000 to $299,999 | 270 (47.9%) | 202 (62.9%) |
| $300,000 to $499,999 | 10 (1.8%) | 26 (8.1%) |
| $500,000 to $749,999 | 10 (1.8%) | 0 (0.0%) |
| $750,000 to $999,999 | 10 (1.8%) | 0 (0.0%) |
| $1,000,000 or more | 0 (0.0%) | 0 (0.0%) |
| Total | 564 (100.0%) | 321 (100.0%) |
Household Income by Mortgage Status in Lipscomb County
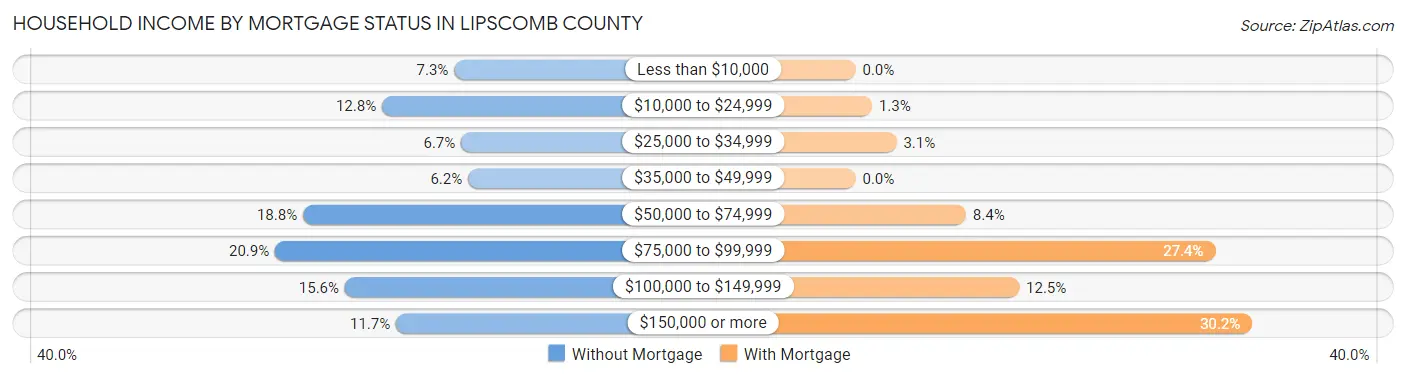
| Household Income | Without Mortgage | With Mortgage |
| Less than $10,000 | 41 (7.3%) | 0 (0.0%) |
| $10,000 to $24,999 | 72 (12.8%) | 4 (1.3%) |
| $25,000 to $34,999 | 38 (6.7%) | 10 (3.1%) |
| $35,000 to $49,999 | 35 (6.2%) | 0 (0.0%) |
| $50,000 to $74,999 | 106 (18.8%) | 27 (8.4%) |
| $75,000 to $99,999 | 118 (20.9%) | 88 (27.4%) |
| $100,000 to $149,999 | 88 (15.6%) | 40 (12.5%) |
| $150,000 or more | 66 (11.7%) | 97 (30.2%) |
| Total | 564 (100.0%) | 321 (100.0%) |
Property Value to Household Income Ratio in Lipscomb County
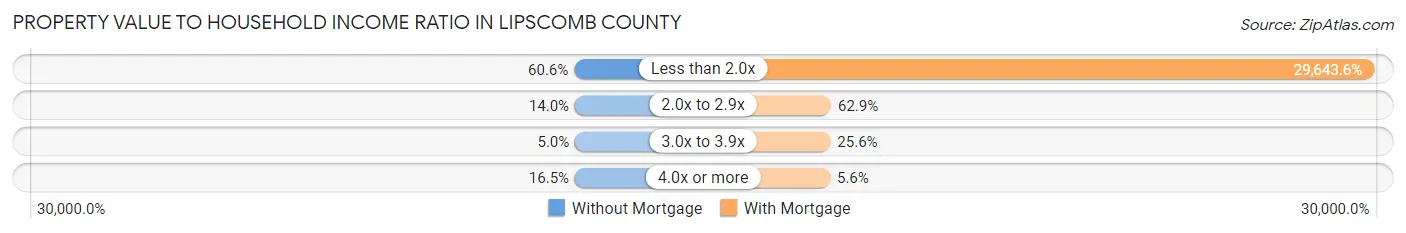
| Value-to-Income Ratio | Without Mortgage | With Mortgage |
| Less than 2.0x | 342 (60.6%) | 95,156 (29,643.6%) |
| 2.0x to 2.9x | 79 (14.0%) | 202 (62.9%) |
| 3.0x to 3.9x | 28 (5.0%) | 82 (25.6%) |
| 4.0x or more | 93 (16.5%) | 18 (5.6%) |
| Total | 564 (100.0%) | 321 (100.0%) |
Real Estate Taxes by Mortgage Status in Lipscomb County
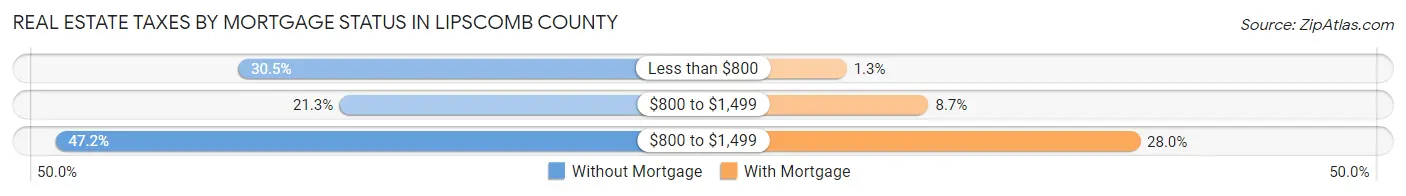
| Property Taxes | Without Mortgage | With Mortgage |
| Less than $800 | 172 (30.5%) | 4 (1.3%) |
| $800 to $1,499 | 120 (21.3%) | 28 (8.7%) |
| $800 to $1,499 | 266 (47.2%) | 90 (28.0%) |
| Total | 564 (100.0%) | 321 (100.0%) |
Health & Disability in Lipscomb County
Health Insurance Coverage by Age in Lipscomb County
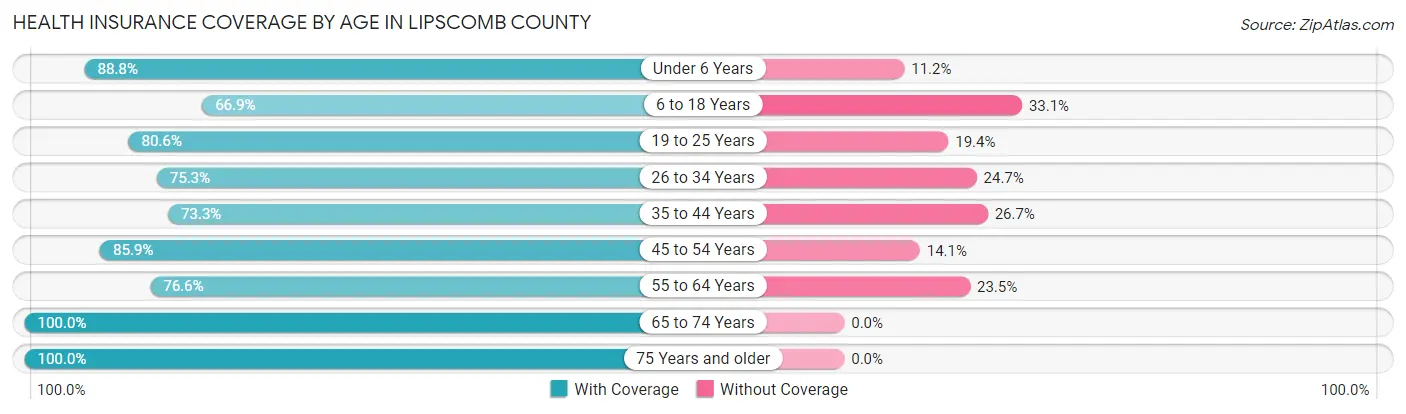
| Age Bracket | With Coverage | Without Coverage |
| Under 6 Years | 246 (88.8%) | 31 (11.2%) |
| 6 to 18 Years | 430 (66.9%) | 213 (33.1%) |
| 19 to 25 Years | 212 (80.6%) | 51 (19.4%) |
| 26 to 34 Years | 226 (75.3%) | 74 (24.7%) |
| 35 to 44 Years | 274 (73.3%) | 100 (26.7%) |
| 45 to 54 Years | 238 (85.9%) | 39 (14.1%) |
| 55 to 64 Years | 284 (76.5%) | 87 (23.4%) |
| 65 to 74 Years | 279 (100.0%) | 0 (0.0%) |
| 75 Years and older | 204 (100.0%) | 0 (0.0%) |
| Total | 2,393 (80.1%) | 595 (19.9%) |
Health Insurance Coverage by Citizenship Status in Lipscomb County
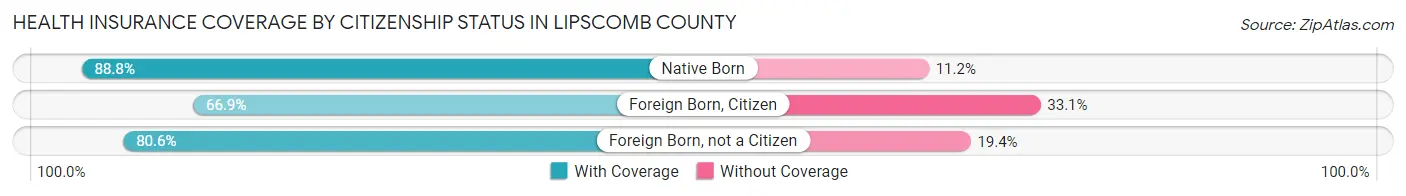
| Citizenship Status | With Coverage | Without Coverage |
| Native Born | 246 (88.8%) | 31 (11.2%) |
| Foreign Born, Citizen | 430 (66.9%) | 213 (33.1%) |
| Foreign Born, not a Citizen | 212 (80.6%) | 51 (19.4%) |
Health Insurance Coverage by Household Income in Lipscomb County
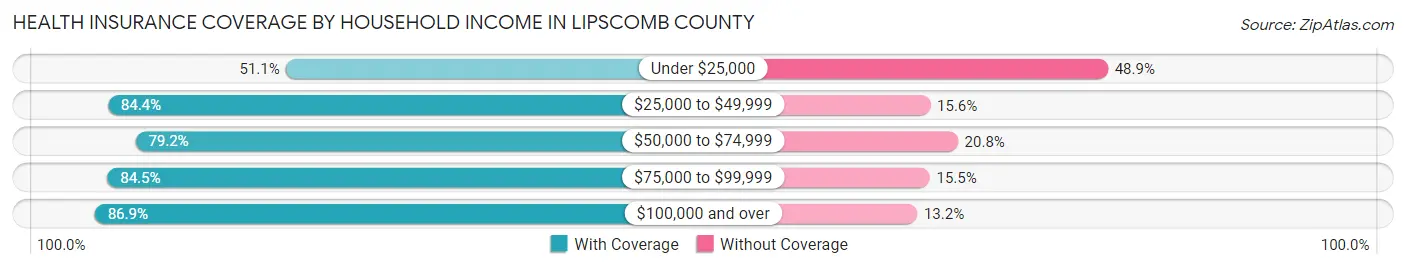
| Household Income | With Coverage | Without Coverage |
| Under $25,000 | 184 (51.1%) | 176 (48.9%) |
| $25,000 to $49,999 | 319 (84.4%) | 59 (15.6%) |
| $50,000 to $74,999 | 538 (79.2%) | 141 (20.8%) |
| $75,000 to $99,999 | 447 (84.5%) | 82 (15.5%) |
| $100,000 and over | 905 (86.9%) | 137 (13.2%) |
Public vs Private Health Insurance Coverage by Age in Lipscomb County
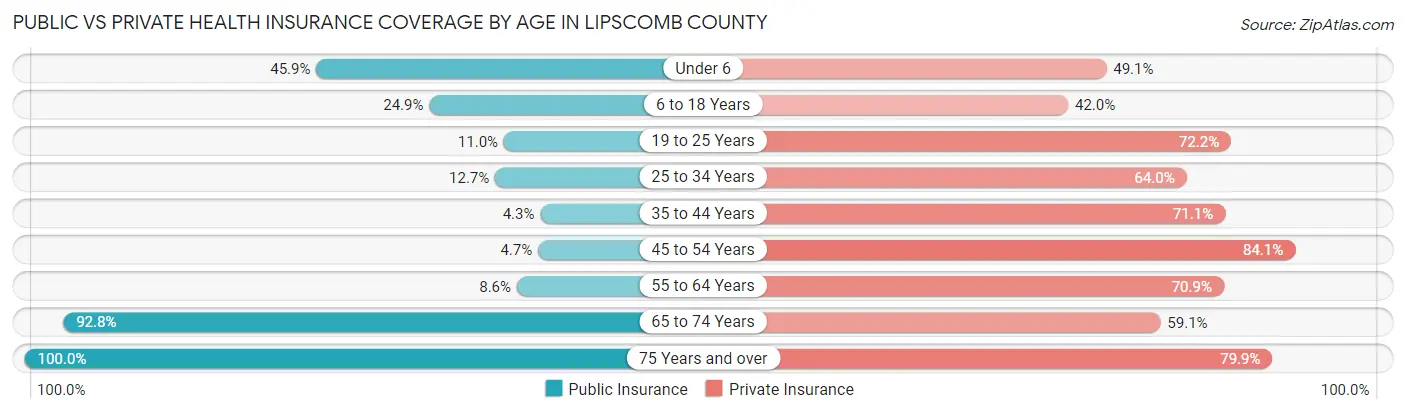
| Age Bracket | Public Insurance | Private Insurance |
| Under 6 | 127 (45.9%) | 136 (49.1%) |
| 6 to 18 Years | 160 (24.9%) | 270 (42.0%) |
| 19 to 25 Years | 29 (11.0%) | 190 (72.2%) |
| 25 to 34 Years | 38 (12.7%) | 192 (64.0%) |
| 35 to 44 Years | 16 (4.3%) | 266 (71.1%) |
| 45 to 54 Years | 13 (4.7%) | 233 (84.1%) |
| 55 to 64 Years | 32 (8.6%) | 263 (70.9%) |
| 65 to 74 Years | 259 (92.8%) | 165 (59.1%) |
| 75 Years and over | 204 (100.0%) | 163 (79.9%) |
| Total | 878 (29.4%) | 1,878 (62.8%) |
Disability Status by Sex by Age in Lipscomb County
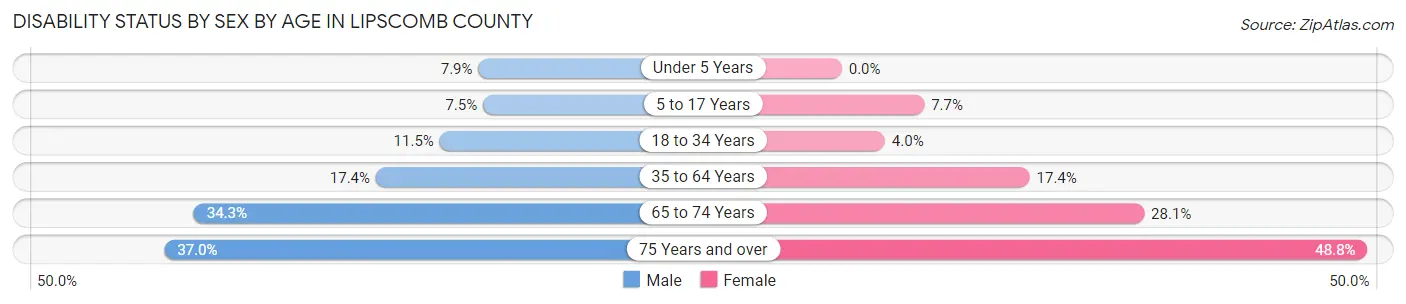
| Age Bracket | Male | Female |
| Under 5 Years | 9 (7.9%) | 0 (0.0%) |
| 5 to 17 Years | 21 (7.4%) | 30 (7.6%) |
| 18 to 34 Years | 28 (11.5%) | 14 (4.0%) |
| 35 to 64 Years | 87 (17.4%) | 91 (17.4%) |
| 65 to 74 Years | 48 (34.3%) | 39 (28.1%) |
| 75 Years and over | 30 (37.0%) | 60 (48.8%) |
Disability Class by Sex by Age in Lipscomb County
Disability Class: Hearing Difficulty
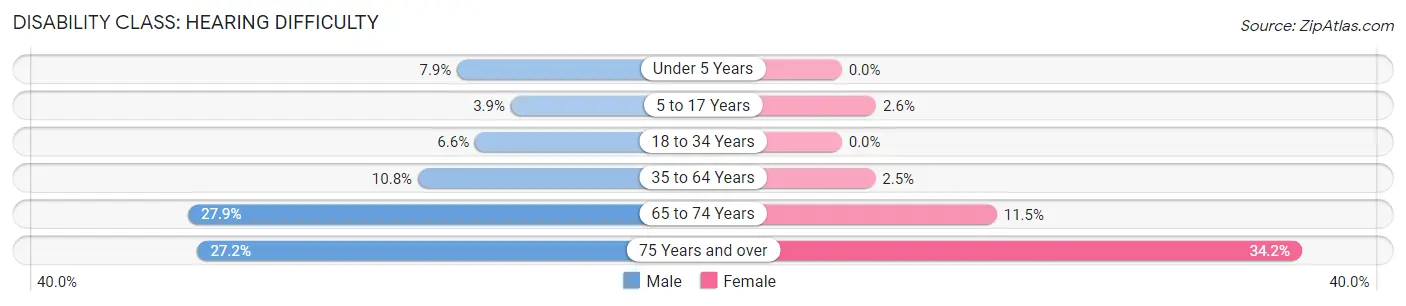
| Age Bracket | Male | Female |
| Under 5 Years | 9 (7.9%) | 0 (0.0%) |
| 5 to 17 Years | 11 (3.9%) | 10 (2.5%) |
| 18 to 34 Years | 16 (6.6%) | 0 (0.0%) |
| 35 to 64 Years | 54 (10.8%) | 13 (2.5%) |
| 65 to 74 Years | 39 (27.9%) | 16 (11.5%) |
| 75 Years and over | 22 (27.2%) | 42 (34.2%) |
Disability Class: Vision Difficulty

| Age Bracket | Male | Female |
| Under 5 Years | 9 (7.9%) | 0 (0.0%) |
| 5 to 17 Years | 6 (2.1%) | 11 (2.8%) |
| 18 to 34 Years | 10 (4.1%) | 0 (0.0%) |
| 35 to 64 Years | 24 (4.8%) | 45 (8.6%) |
| 65 to 74 Years | 3 (2.1%) | 0 (0.0%) |
| 75 Years and over | 7 (8.6%) | 9 (7.3%) |
Disability Class: Cognitive Difficulty
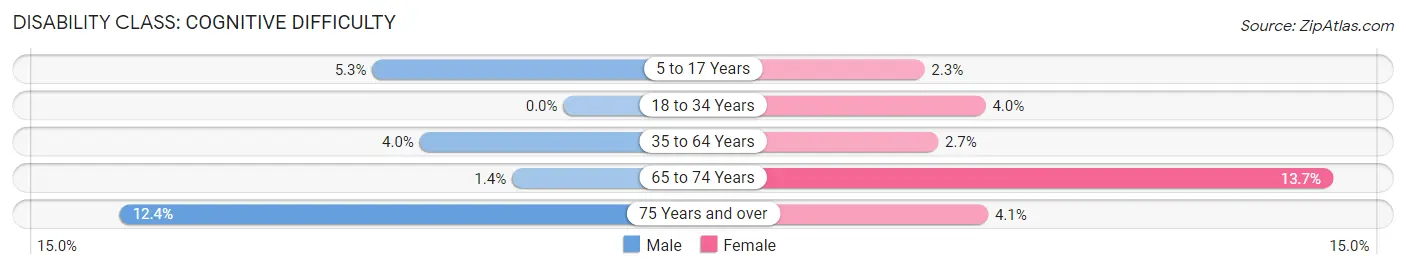
| Age Bracket | Male | Female |
| 5 to 17 Years | 15 (5.3%) | 9 (2.3%) |
| 18 to 34 Years | 0 (0.0%) | 14 (4.0%) |
| 35 to 64 Years | 20 (4.0%) | 14 (2.7%) |
| 65 to 74 Years | 2 (1.4%) | 19 (13.7%) |
| 75 Years and over | 10 (12.3%) | 5 (4.1%) |
Disability Class: Ambulatory Difficulty
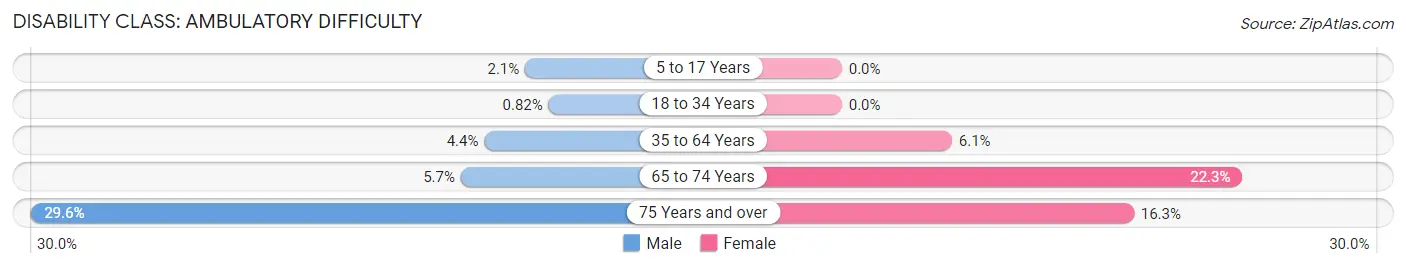
| Age Bracket | Male | Female |
| 5 to 17 Years | 6 (2.1%) | 0 (0.0%) |
| 18 to 34 Years | 2 (0.8%) | 0 (0.0%) |
| 35 to 64 Years | 22 (4.4%) | 32 (6.1%) |
| 65 to 74 Years | 8 (5.7%) | 31 (22.3%) |
| 75 Years and over | 24 (29.6%) | 20 (16.3%) |
Disability Class: Self-Care Difficulty
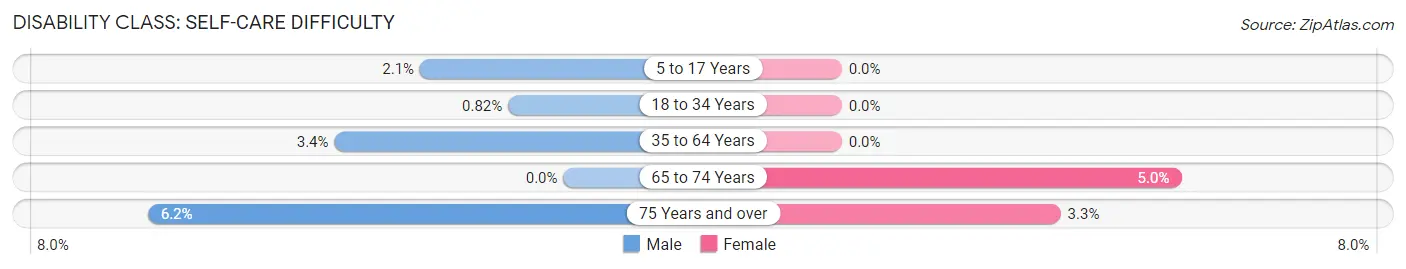
| Age Bracket | Male | Female |
| 5 to 17 Years | 6 (2.1%) | 0 (0.0%) |
| 18 to 34 Years | 2 (0.8%) | 0 (0.0%) |
| 35 to 64 Years | 17 (3.4%) | 0 (0.0%) |
| 65 to 74 Years | 0 (0.0%) | 7 (5.0%) |
| 75 Years and over | 5 (6.2%) | 4 (3.3%) |
Technology Access in Lipscomb County
Computing Device Access in Lipscomb County
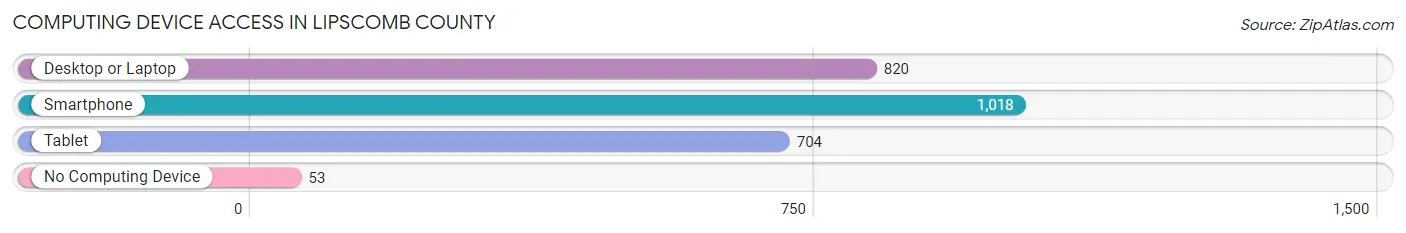
| Device Type | # Households | % Households |
| Desktop or Laptop | 820 | 72.3% |
| Smartphone | 1,018 | 89.7% |
| Tablet | 704 | 62.0% |
| No Computing Device | 53 | 4.7% |
| Total | 1,135 | 100.0% |
Internet Access in Lipscomb County
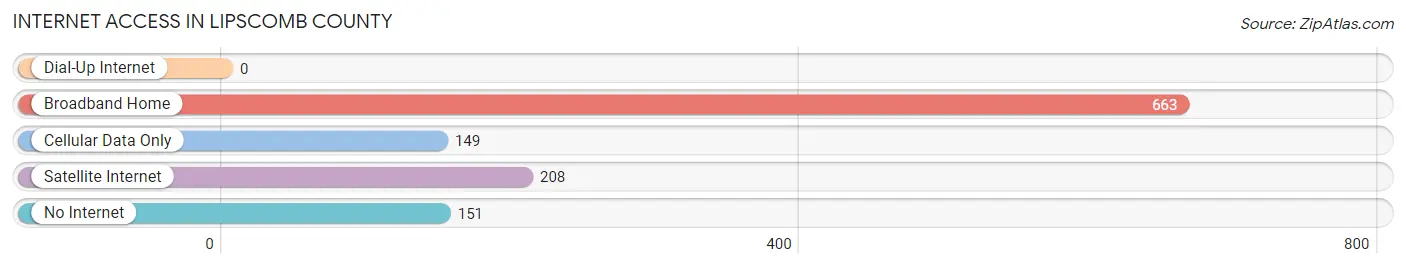
| Internet Type | # Households | % Households |
| Dial-Up Internet | 0 | 0.0% |
| Broadband Home | 663 | 58.4% |
| Cellular Data Only | 149 | 13.1% |
| Satellite Internet | 208 | 18.3% |
| No Internet | 151 | 13.3% |
| Total | 1,135 | 100.0% |
Lipscomb County Summary
Lipscomb County is located in the northern part of the Texas Panhandle, in the United States. It is bordered by Ochiltree County to the north, Roberts County to the east, Hemphill County to the south, and Beaver County, Oklahoma to the west. The county seat is Lipscomb, and the largest city is Booker. The county was created in 1876 and organized in 1887. As of the 2010 census, the population was 3,302, making it the second-least populous county in Texas.
Geography
Lipscomb County covers an area of 902 square miles, of which 899 square miles is land and 3 square miles (0.3%) is water. The terrain is generally flat, with some rolling hills in the western part of the county. The county is drained by the North Canadian River and its tributaries. The county is part of the High Plains region of the Great Plains.
The county is home to several wildlife management areas, including the Lipscomb County Wildlife Management Area, the North Canadian River Wildlife Management Area, and the Ochiltree County Wildlife Management Area.
Demographics
As of the 2010 census, there were 3,302 people, 1,310 households, and 890 families living in the county. The population density was 4 people per square mile. The racial makeup of the county was 88.3% White, 0.2% Black or African American, 0.7% Native American, 0.2% Asian, 0.1% Pacific Islander, 9.3% from other races, and 1.3% from two or more races. 19.3% of the population were Hispanic or Latino of any race.
The median income for a household in the county was $31,944, and the median income for a family was $37,917. The per capita income for the county was $15,845. About 16.2% of families and 20.2% of the population were below the poverty line, including 28.2% of those under age 18 and 14.2% of those age 65 or over.
Economy
The economy of Lipscomb County is largely based on agriculture. The county is home to several large farms, which produce wheat, sorghum, corn, and hay. Cattle ranching is also an important part of the local economy.
The county is also home to several oil and gas fields, which produce natural gas and crude oil. The county is served by several major highways, including US Highway 83, US Highway 60, and State Highway 15.
History
Lipscomb County was created in 1876 from parts of Bexar and Young counties. It was named for Abner Lipscomb, a Texas Supreme Court justice. The county was organized in 1887, and the town of Lipscomb was established as the county seat.
In the early 1900s, the county was home to several large ranches, which raised cattle and sheep. The county also had several small towns, including Booker, Darrouzett, and Higgins.
In the 1920s, oil and gas were discovered in the county, and the economy shifted to focus on oil and gas production. The county continued to be an important producer of oil and gas until the late 1970s, when production began to decline.
Today, the county is still largely rural, with a population of just over 3,000. Agriculture remains an important part of the local economy, and the county is home to several large farms. Oil and gas production is still an important part of the local economy, although it is not as significant as it once was.
Common Questions
What is Per Capita Income in Lipscomb County?
Per Capita income in Lipscomb County is $33,236.
What is the Median Family Income in Lipscomb County?
Median Family Income in Lipscomb County is $76,750.
What is the Median Household income in Lipscomb County?
Median Household Income in Lipscomb County is $71,625.
What is Income or Wage Gap in Lipscomb County?
Income or Wage Gap in Lipscomb County is 44.6%.
Women in Lipscomb County earn 55.4 cents for every dollar earned by a man.
What is Inequality or Gini Index in Lipscomb County?
Inequality or Gini Index in Lipscomb County is 0.44.
What is the Total Population of Lipscomb County?
Total Population of Lipscomb County is 3,038.
What is the Total Male Population of Lipscomb County?
Total Male Population of Lipscomb County is 1,386.
What is the Total Female Population of Lipscomb County?
Total Female Population of Lipscomb County is 1,652.
What is the Ratio of Males per 100 Females in Lipscomb County?
There are 83.90 Males per 100 Females in Lipscomb County.
What is the Ratio of Females per 100 Males in Lipscomb County?
There are 119.19 Females per 100 Males in Lipscomb County.
What is the Median Population Age in Lipscomb County?
Median Population Age in Lipscomb County is 35.9 Years.
What is the Average Family Size in Lipscomb County
Average Family Size in Lipscomb County is 3.0 People.
What is the Average Household Size in Lipscomb County
Average Household Size in Lipscomb County is 2.6 People.
How Large is the Labor Force in Lipscomb County?
There are 1,457 People in the Labor Forcein in Lipscomb County.
What is the Percentage of People in the Labor Force in Lipscomb County?
64.2% of People are in the Labor Force in Lipscomb County.
What is the Unemployment Rate in Lipscomb County?
Unemployment Rate in Lipscomb County is 5.9%.