Limestone County, TX Map & Demographics
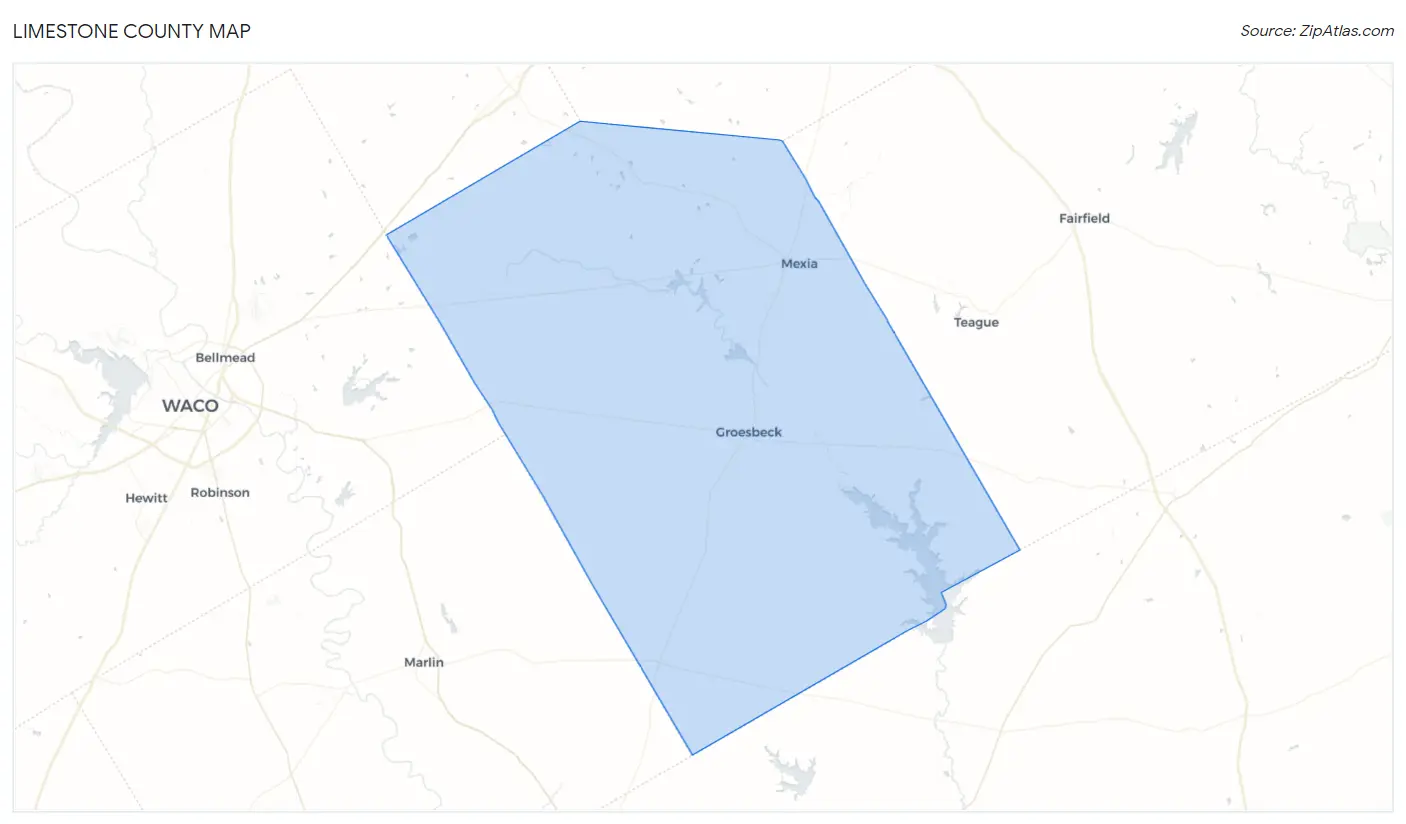
Limestone County Map
Limestone County Overview
$26,479
PER CAPITA INCOME
$63,788
AVG FAMILY INCOME
$53,102
AVG HOUSEHOLD INCOME
24.1%
WAGE / INCOME GAP [ % ]
75.9¢/ $1
WAGE / INCOME GAP [ $ ]
$8,451
FAMILY INCOME DEFICIT
0.44
INEQUALITY / GINI INDEX
22,222
TOTAL POPULATION
11,315
MALE POPULATION
10,907
FEMALE POPULATION
103.74
MALES / 100 FEMALES
96.39
FEMALES / 100 MALES
42.0
MEDIAN AGE
3.2
AVG FAMILY SIZE
2.6
AVG HOUSEHOLD SIZE
8,450
LABOR FORCE [ PEOPLE ]
47.5%
PERCENT IN LABOR FORCE
3.6%
UNEMPLOYMENT RATE
Limestone County Area Codes
Income in Limestone County
Income Overview in Limestone County
Per Capita Income in Limestone County is $26,479, while median incomes of families and households are $63,788 and $53,102 respectively.
| Characteristic | Number | Measure |
| Per Capita Income | 22,222 | $26,479 |
| Median Family Income | 5,574 | $63,788 |
| Mean Family Income | 5,574 | $80,734 |
| Median Household Income | 8,195 | $53,102 |
| Mean Household Income | 8,195 | $68,452 |
| Income Deficit | 5,574 | $8,451 |
| Wage / Income Gap (%) | 22,222 | 24.13% |
| Wage / Income Gap ($) | 22,222 | 75.87¢ per $1 |
| Gini / Inequality Index | 22,222 | 0.44 |
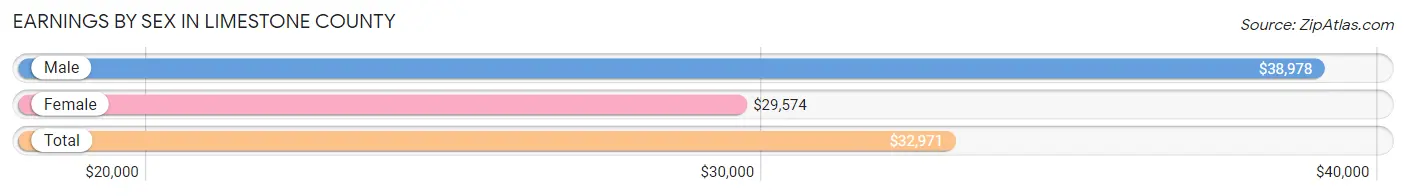
Earnings by Sex in Limestone County
Average Earnings in Limestone County are $32,971, $38,978 for men and $29,574 for women, a difference of 24.1%.
| Sex | Number | Average Earnings |
| Male | 4,993 (55.2%) | $38,978 |
| Female | 4,055 (44.8%) | $29,574 |
| Total | 9,048 (100.0%) | $32,971 |
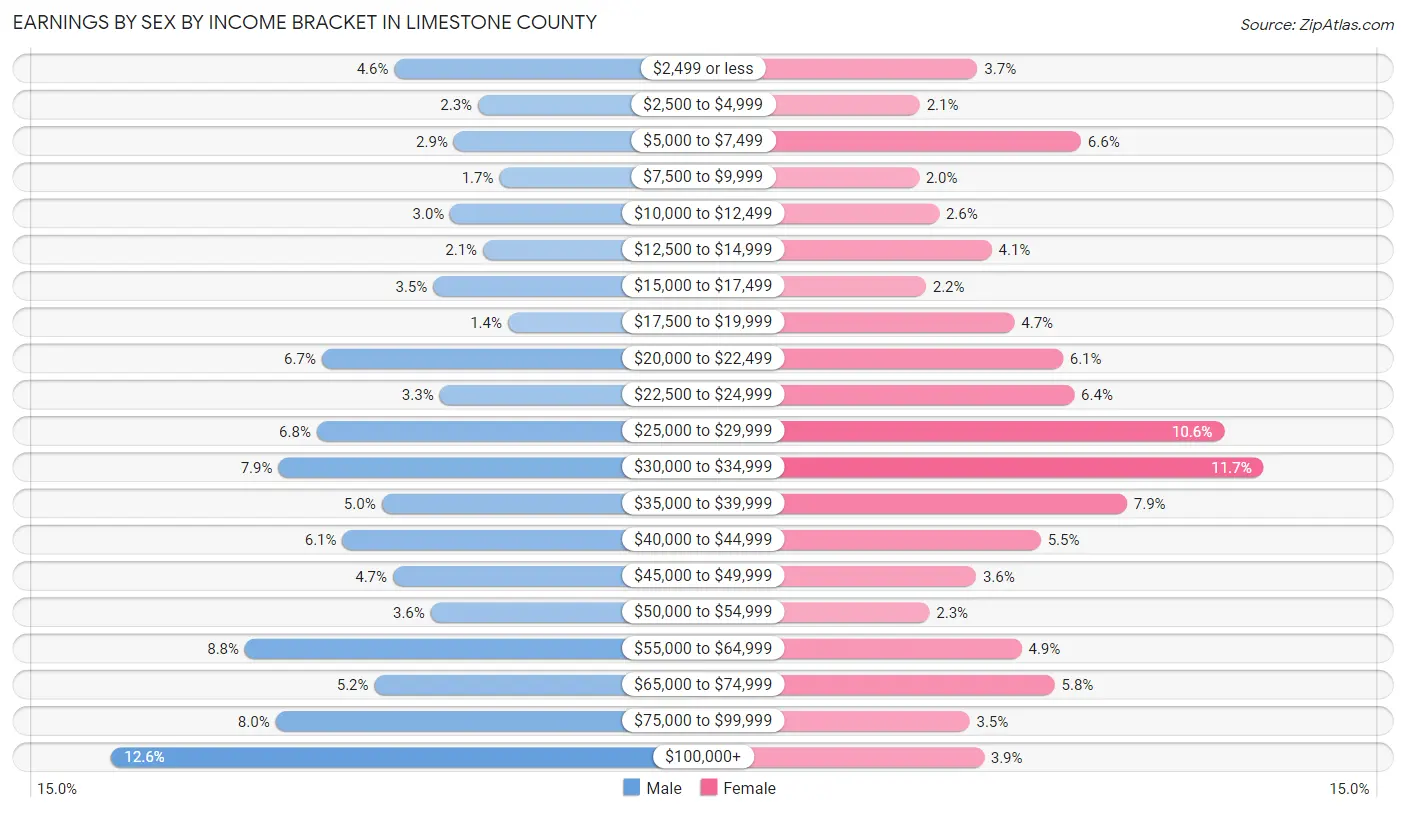
Earnings by Sex by Income Bracket in Limestone County
The most common earnings brackets in Limestone County are $100,000+ for men (627 | 12.6%) and $30,000 to $34,999 for women (475 | 11.7%).
| Income | Male | Female |
| $2,499 or less | 230 (4.6%) | 149 (3.7%) |
| $2,500 to $4,999 | 113 (2.3%) | 83 (2.1%) |
| $5,000 to $7,499 | 147 (2.9%) | 267 (6.6%) |
| $7,500 to $9,999 | 83 (1.7%) | 82 (2.0%) |
| $10,000 to $12,499 | 152 (3.0%) | 105 (2.6%) |
| $12,500 to $14,999 | 106 (2.1%) | 165 (4.1%) |
| $15,000 to $17,499 | 176 (3.5%) | 90 (2.2%) |
| $17,500 to $19,999 | 71 (1.4%) | 191 (4.7%) |
| $20,000 to $22,499 | 332 (6.7%) | 246 (6.1%) |
| $22,500 to $24,999 | 167 (3.3%) | 259 (6.4%) |
| $25,000 to $29,999 | 339 (6.8%) | 430 (10.6%) |
| $30,000 to $34,999 | 393 (7.9%) | 475 (11.7%) |
| $35,000 to $39,999 | 248 (5.0%) | 319 (7.9%) |
| $40,000 to $44,999 | 303 (6.1%) | 221 (5.4%) |
| $45,000 to $49,999 | 232 (4.6%) | 147 (3.6%) |
| $50,000 to $54,999 | 179 (3.6%) | 94 (2.3%) |
| $55,000 to $64,999 | 440 (8.8%) | 199 (4.9%) |
| $65,000 to $74,999 | 258 (5.2%) | 237 (5.8%) |
| $75,000 to $99,999 | 397 (8.0%) | 140 (3.5%) |
| $100,000+ | 627 (12.6%) | 156 (3.8%) |
| Total | 4,993 (100.0%) | 4,055 (100.0%) |
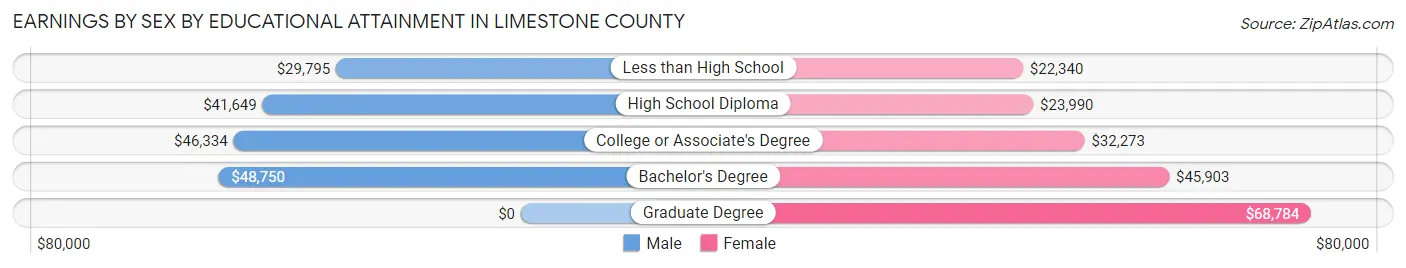
Earnings by Sex by Educational Attainment in Limestone County
Average earnings in Limestone County are $43,872 for men and $30,938 for women, a difference of 29.5%. Men with an educational attainment of bachelor's degree enjoy the highest average annual earnings of $48,750, while those with less than high school education earn the least with $29,795. Women with an educational attainment of graduate degree earn the most with the average annual earnings of $68,784, while those with less than high school education have the smallest earnings of $22,340.
| Educational Attainment | Male Income | Female Income |
| Less than High School | $29,795 | $22,340 |
| High School Diploma | $41,649 | $23,990 |
| College or Associate's Degree | $46,334 | $32,273 |
| Bachelor's Degree | $48,750 | $45,903 |
| Graduate Degree | - | - |
| Total | $43,872 | $30,938 |
Family Income in Limestone County
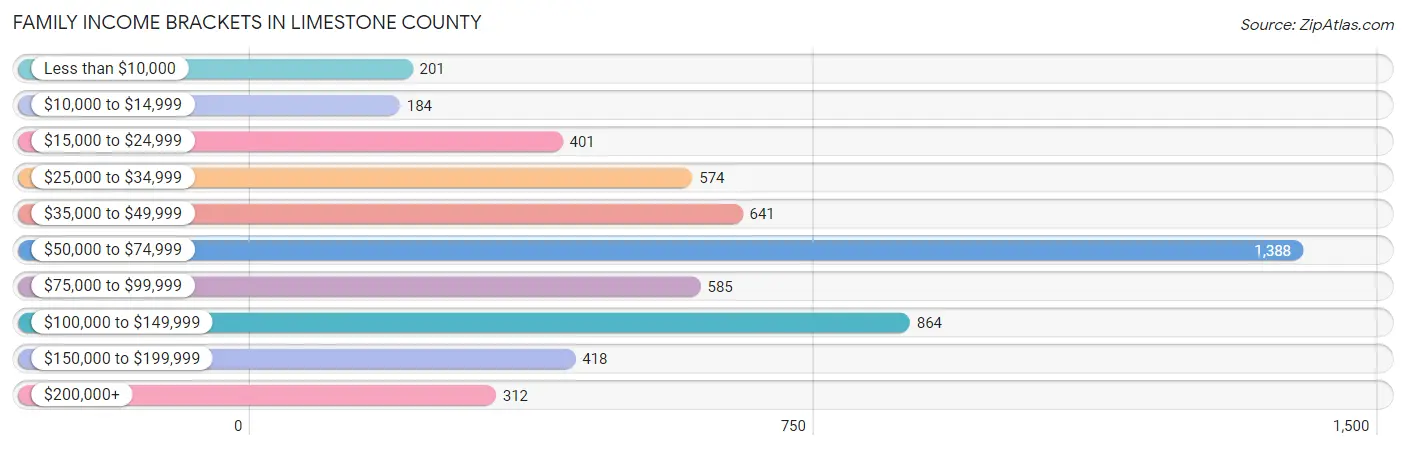
Family Income Brackets in Limestone County
According to the Limestone County family income data, there are 1,388 families falling into the $50,000 to $74,999 income range, which is the most common income bracket and makes up 24.9% of all families. Conversely, the $10,000 to $14,999 income bracket is the least frequent group with only 184 families (3.3%) belonging to this category.
| Income Bracket | # Families | % Families |
| Less than $10,000 | 201 | 3.6% |
| $10,000 to $14,999 | 184 | 3.3% |
| $15,000 to $24,999 | 401 | 7.2% |
| $25,000 to $34,999 | 574 | 10.3% |
| $35,000 to $49,999 | 641 | 11.5% |
| $50,000 to $74,999 | 1,388 | 24.9% |
| $75,000 to $99,999 | 585 | 10.5% |
| $100,000 to $149,999 | 864 | 15.5% |
| $150,000 to $199,999 | 418 | 7.5% |
| $200,000+ | 312 | 5.6% |
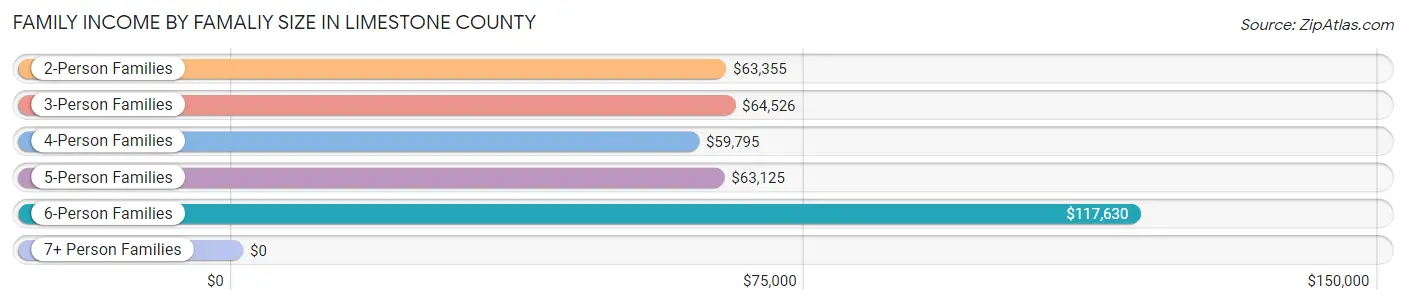
Family Income by Famaliy Size in Limestone County
6-person families (380 | 6.8%) account for the highest median family income in Limestone County with $117,630 per family, while 2-person families (2,614 | 46.9%) have the highest median income of $31,678 per family member.
| Income Bracket | # Families | Median Income |
| 2-Person Families | 2,614 (46.9%) | $63,355 |
| 3-Person Families | 1,221 (21.9%) | $64,526 |
| 4-Person Families | 707 (12.7%) | $59,795 |
| 5-Person Families | 486 (8.7%) | $63,125 |
| 6-Person Families | 380 (6.8%) | $117,630 |
| 7+ Person Families | 166 (3.0%) | $0 |
| Total | 5,574 (100.0%) | $63,788 |
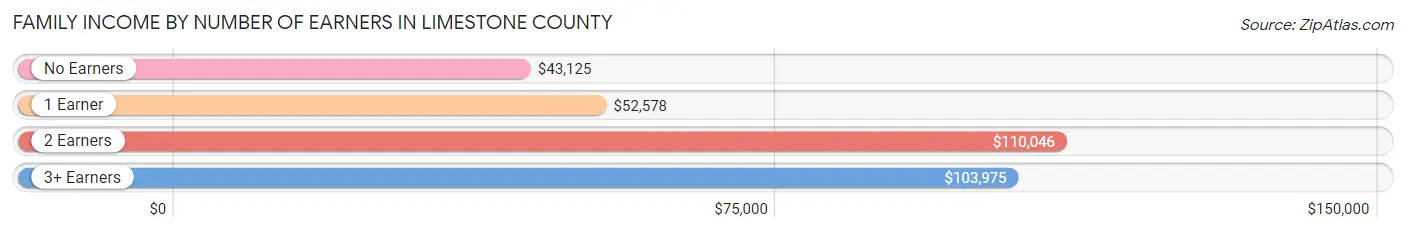
Family Income by Number of Earners in Limestone County
The median family income in Limestone County is $63,788, with families comprising 2 earners (1,441) having the highest median family income of $110,046, while families with no earners (1,285) have the lowest median family income of $43,125, accounting for 25.9% and 23.1% of families, respectively.
| Number of Earners | # Families | Median Income |
| No Earners | 1,285 (23.1%) | $43,125 |
| 1 Earner | 2,357 (42.3%) | $52,578 |
| 2 Earners | 1,441 (25.9%) | $110,046 |
| 3+ Earners | 491 (8.8%) | $103,975 |
| Total | 5,574 (100.0%) | $63,788 |
Household Income in Limestone County
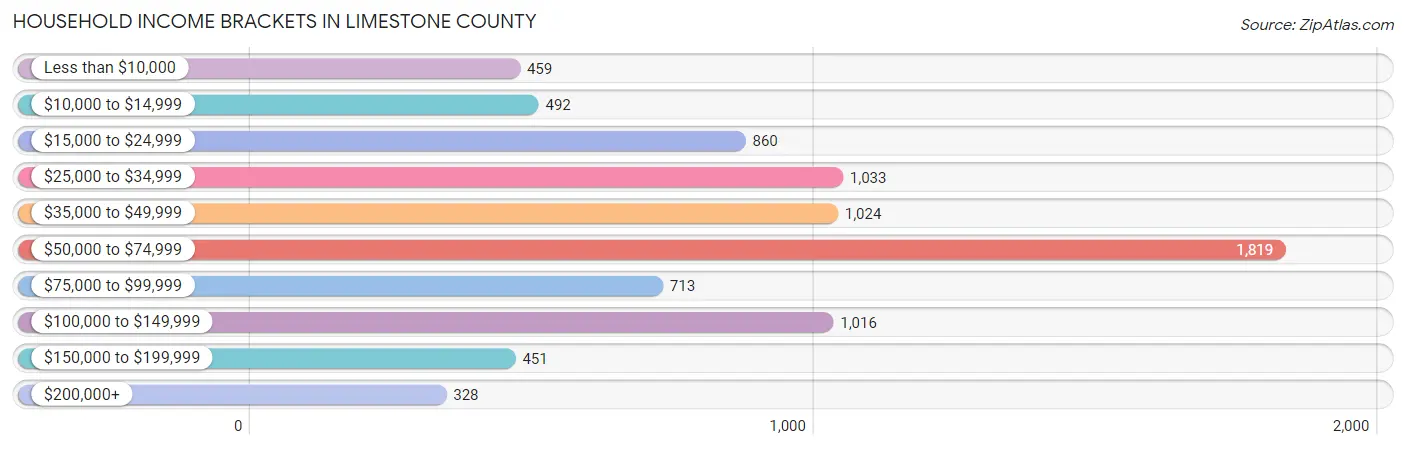
Household Income Brackets in Limestone County
With 1,819 households falling in the category, the $50,000 to $74,999 income range is the most frequent in Limestone County, accounting for 22.2% of all households. In contrast, only 328 households (4.0%) fall into the $200,000+ income bracket, making it the least populous group.
| Income Bracket | # Households | % Households |
| Less than $10,000 | 459 | 5.6% |
| $10,000 to $14,999 | 492 | 6.0% |
| $15,000 to $24,999 | 860 | 10.5% |
| $25,000 to $34,999 | 1,033 | 12.6% |
| $35,000 to $49,999 | 1,024 | 12.5% |
| $50,000 to $74,999 | 1,819 | 22.2% |
| $75,000 to $99,999 | 713 | 8.7% |
| $100,000 to $149,999 | 1,016 | 12.4% |
| $150,000 to $199,999 | 451 | 5.5% |
| $200,000+ | 328 | 4.0% |
Household Income by Householder Age in Limestone County
The median household income in Limestone County is $53,102, with the highest median household income of $60,384 found in the 45 to 64 years age bracket for the primary householder. A total of 3,039 households (37.1%) fall into this category. Meanwhile, the 15 to 24 years age bracket for the primary householder has the lowest median household income of $42,102, with 169 households (2.1%) in this group.
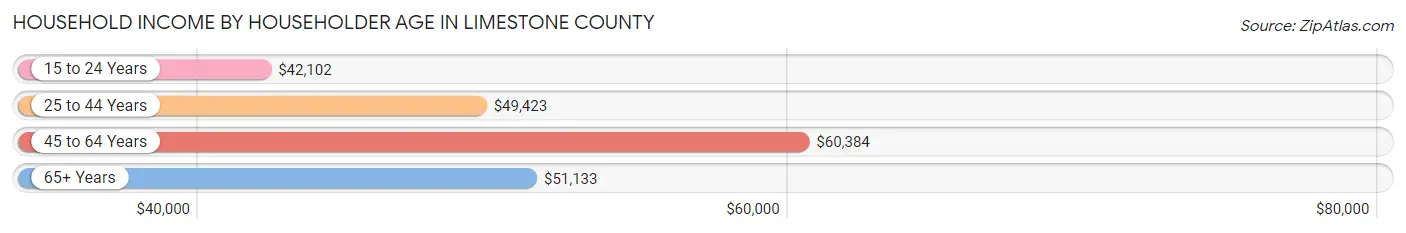
| Income Bracket | # Households | Median Income |
| 15 to 24 Years | 169 (2.1%) | $42,102 |
| 25 to 44 Years | 2,146 (26.2%) | $49,423 |
| 45 to 64 Years | 3,039 (37.1%) | $60,384 |
| 65+ Years | 2,841 (34.7%) | $51,133 |
| Total | 8,195 (100.0%) | $53,102 |
Poverty in Limestone County
Income Below Poverty by Sex and Age in Limestone County
With 21.0% poverty level for males and 22.0% for females among the residents of Limestone County, 15 year old males and 5 year old females are the most vulnerable to poverty, with 74 males (46.3%) and 80 females (55.9%) in their respective age groups living below the poverty level.
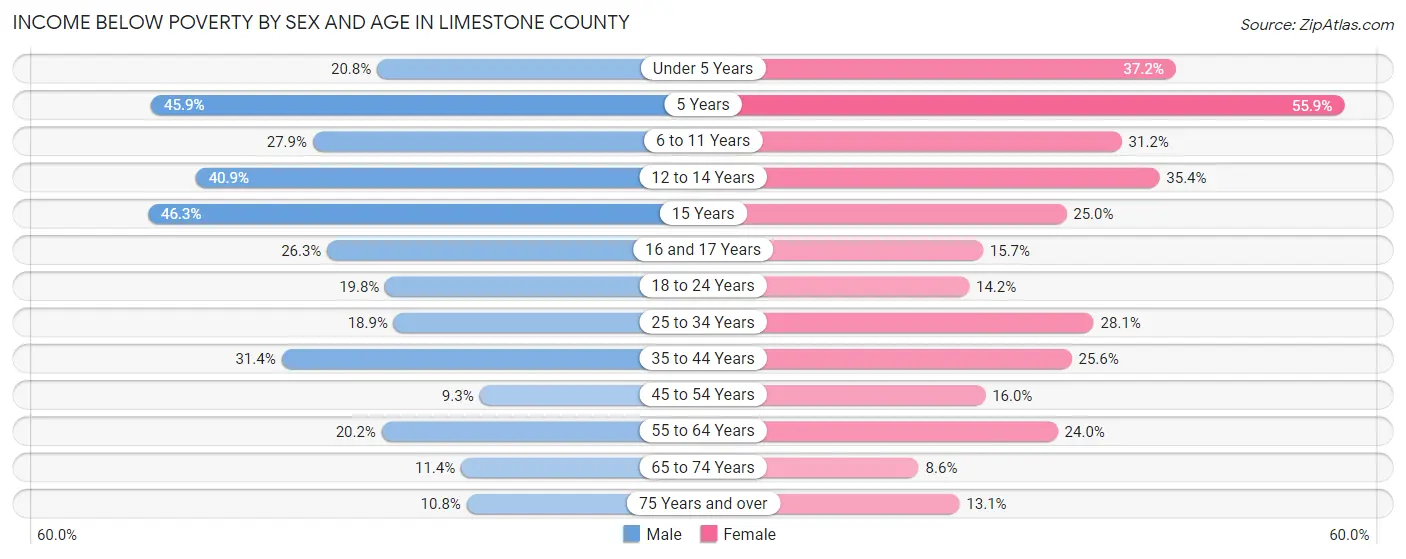
| Age Bracket | Male | Female |
| Under 5 Years | 138 (20.7%) | 235 (37.2%) |
| 5 Years | 123 (45.9%) | 80 (55.9%) |
| 6 to 11 Years | 195 (27.9%) | 230 (31.2%) |
| 12 to 14 Years | 183 (40.9%) | 162 (35.4%) |
| 15 Years | 74 (46.3%) | 34 (25.0%) |
| 16 and 17 Years | 81 (26.3%) | 33 (15.7%) |
| 18 to 24 Years | 178 (19.8%) | 103 (14.2%) |
| 25 to 34 Years | 252 (18.9%) | 356 (28.1%) |
| 35 to 44 Years | 388 (31.4%) | 291 (25.6%) |
| 45 to 54 Years | 122 (9.3%) | 223 (16.0%) |
| 55 to 64 Years | 310 (20.2%) | 355 (24.0%) |
| 65 to 74 Years | 139 (11.4%) | 118 (8.6%) |
| 75 Years and over | 74 (10.8%) | 123 (13.1%) |
| Total | 2,257 (21.0%) | 2,343 (22.0%) |
Income Above Poverty by Sex and Age in Limestone County
According to the poverty statistics in Limestone County, males aged 45 to 54 years and females aged 65 to 74 years are the age groups that are most secure financially, with 90.7% of males and 91.4% of females in these age groups living above the poverty line.
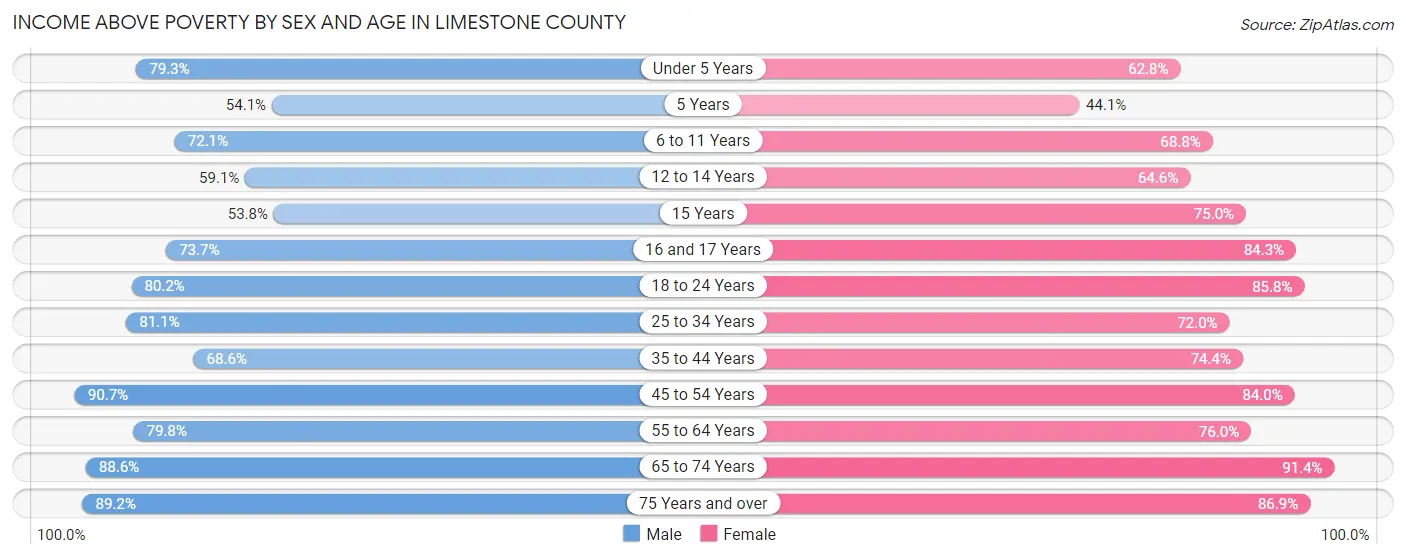
| Age Bracket | Male | Female |
| Under 5 Years | 527 (79.2%) | 397 (62.8%) |
| 5 Years | 145 (54.1%) | 63 (44.1%) |
| 6 to 11 Years | 504 (72.1%) | 508 (68.8%) |
| 12 to 14 Years | 264 (59.1%) | 296 (64.6%) |
| 15 Years | 86 (53.7%) | 102 (75.0%) |
| 16 and 17 Years | 227 (73.7%) | 177 (84.3%) |
| 18 to 24 Years | 719 (80.2%) | 624 (85.8%) |
| 25 to 34 Years | 1,082 (81.1%) | 913 (72.0%) |
| 35 to 44 Years | 848 (68.6%) | 846 (74.4%) |
| 45 to 54 Years | 1,184 (90.7%) | 1,173 (84.0%) |
| 55 to 64 Years | 1,222 (79.8%) | 1,122 (76.0%) |
| 65 to 74 Years | 1,081 (88.6%) | 1,261 (91.4%) |
| 75 Years and over | 613 (89.2%) | 816 (86.9%) |
| Total | 8,502 (79.0%) | 8,298 (78.0%) |
Income Below Poverty Among Married-Couple Families in Limestone County
The poverty statistics for married-couple families in Limestone County show that 10.5% or 391 of the total 3,713 families live below the poverty line. Families with 5 or more children have the highest poverty rate of 84.3%, comprising of 70 families. On the other hand, families with no children have the lowest poverty rate of 4.1%, which includes 97 families.
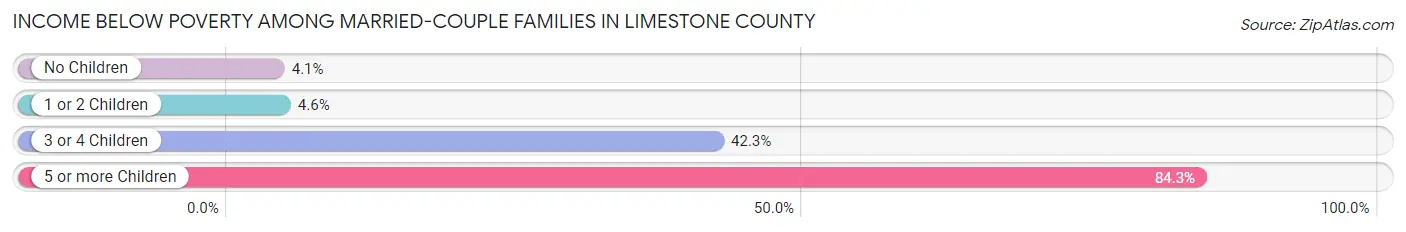
| Children | Above Poverty | Below Poverty |
| No Children | 2,287 (95.9%) | 97 (4.1%) |
| 1 or 2 Children | 767 (95.4%) | 37 (4.6%) |
| 3 or 4 Children | 255 (57.7%) | 187 (42.3%) |
| 5 or more Children | 13 (15.7%) | 70 (84.3%) |
| Total | 3,322 (89.5%) | 391 (10.5%) |
Income Below Poverty Among Single-Parent Households in Limestone County
According to the poverty data in Limestone County, 20.0% or 94 single-father households and 31.7% or 441 single-mother households are living below the poverty line. Among single-father households, those with 1 or 2 children have the highest poverty rate, with 79 households (25.1%) experiencing poverty. Likewise, among single-mother households, those with 1 or 2 children have the highest poverty rate, with 311 households (45.4%) falling below the poverty line.
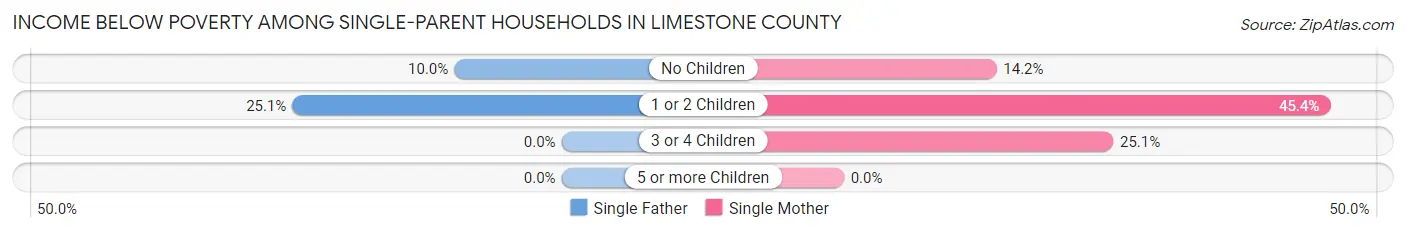
| Children | Single Father | Single Mother |
| No Children | 15 (10.0%) | 62 (14.2%) |
| 1 or 2 Children | 79 (25.1%) | 311 (45.4%) |
| 3 or 4 Children | 0 (0.0%) | 68 (25.1%) |
| 5 or more Children | 0 (0.0%) | 0 (0.0%) |
| Total | 94 (20.0%) | 441 (31.7%) |
Income Below Poverty Among Married-Couple vs Single-Parent Households in Limestone County
The poverty data for Limestone County shows that 391 of the married-couple family households (10.5%) and 535 of the single-parent households (28.7%) are living below the poverty level. Within the married-couple family households, those with 5 or more children have the highest poverty rate, with 70 households (84.3%) falling below the poverty line. Among the single-parent households, those with 1 or 2 children have the highest poverty rate, with 390 household (39.0%) living below poverty.
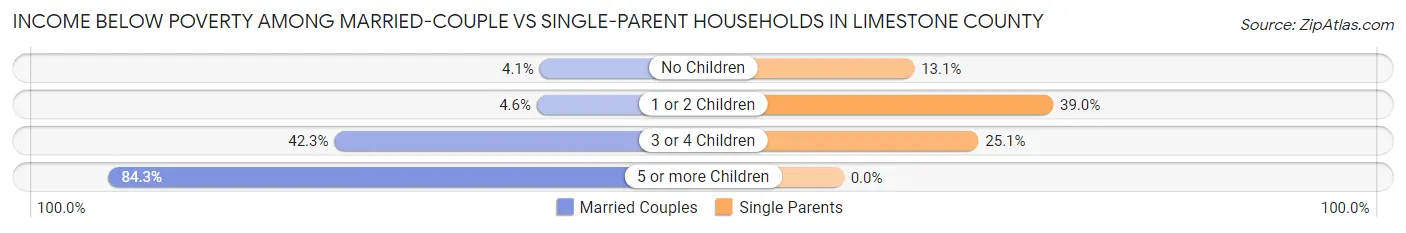
| Children | Married-Couple Families | Single-Parent Households |
| No Children | 97 (4.1%) | 77 (13.1%) |
| 1 or 2 Children | 37 (4.6%) | 390 (39.0%) |
| 3 or 4 Children | 187 (42.3%) | 68 (25.1%) |
| 5 or more Children | 70 (84.3%) | 0 (0.0%) |
| Total | 391 (10.5%) | 535 (28.7%) |
Race in Limestone County
The most populous races in Limestone County are White / Caucasian (14,335 | 64.5%), Hispanic or Latino (5,093 | 22.9%), and Black / African American (3,780 | 17.0%).
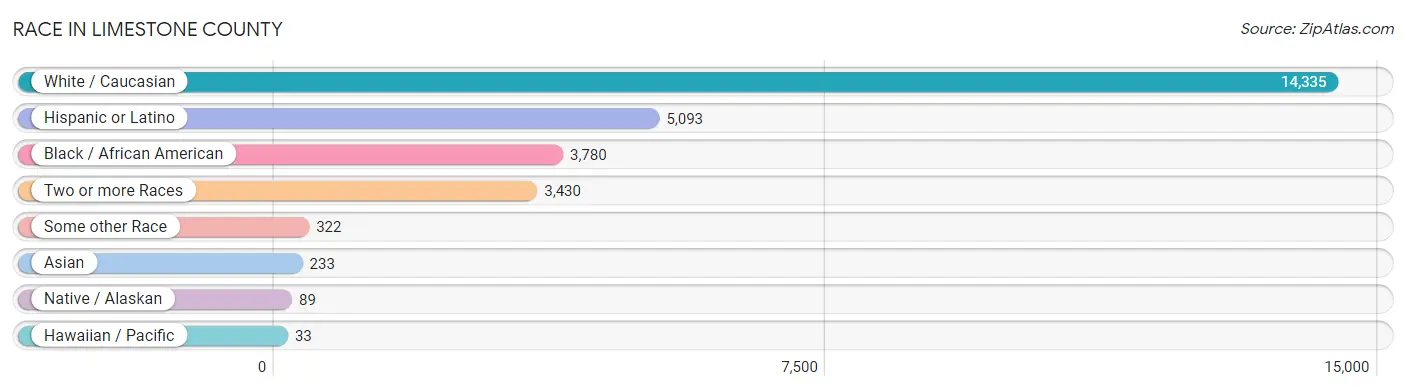
| Race | # Population | % Population |
| Asian | 233 | 1.1% |
| Black / African American | 3,780 | 17.0% |
| Hawaiian / Pacific | 33 | 0.2% |
| Hispanic or Latino | 5,093 | 22.9% |
| Native / Alaskan | 89 | 0.4% |
| White / Caucasian | 14,335 | 64.5% |
| Two or more Races | 3,430 | 15.4% |
| Some other Race | 322 | 1.5% |
| Total | 22,222 | 100.0% |
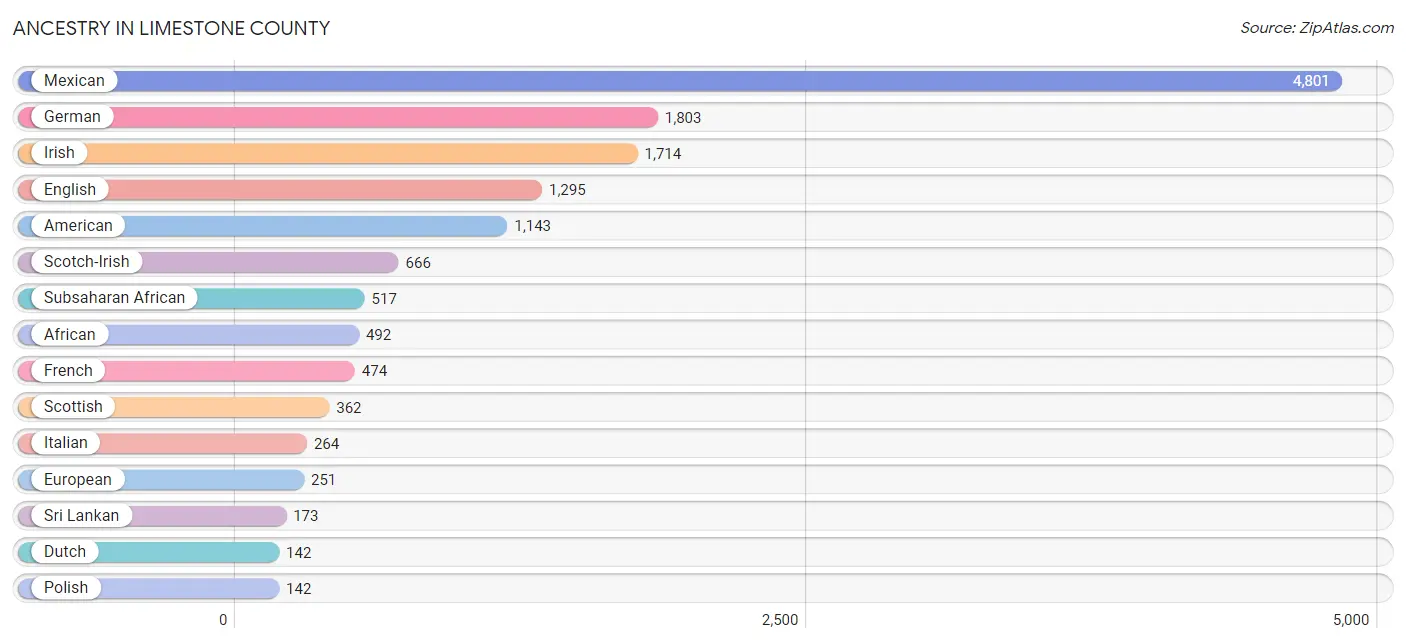
Ancestry in Limestone County
The most populous ancestries reported in Limestone County are Mexican (4,801 | 21.6%), German (1,803 | 8.1%), Irish (1,714 | 7.7%), English (1,295 | 5.8%), and American (1,143 | 5.1%), together accounting for 48.4% of all Limestone County residents.
| Ancestry | # Population | % Population |
| African | 492 | 2.2% |
| Alaska Native | 20 | 0.1% |
| American | 1,143 | 5.1% |
| Arab | 5 | 0.0% |
| Belgian | 7 | 0.0% |
| Blackfeet | 4 | 0.0% |
| British | 39 | 0.2% |
| Burmese | 60 | 0.3% |
| Central American | 72 | 0.3% |
| Cherokee | 83 | 0.4% |
| Chickasaw | 11 | 0.1% |
| Choctaw | 5 | 0.0% |
| Colombian | 12 | 0.1% |
| Comanche | 9 | 0.0% |
| Cuban | 10 | 0.1% |
| Czech | 56 | 0.3% |
| Czechoslovakian | 16 | 0.1% |
| Danish | 39 | 0.2% |
| Dutch | 142 | 0.6% |
| Dutch West Indian | 4 | 0.0% |
| Eastern European | 36 | 0.2% |
| English | 1,295 | 5.8% |
| European | 251 | 1.1% |
| French | 474 | 2.1% |
| French Canadian | 27 | 0.1% |
| German | 1,803 | 8.1% |
| Greek | 79 | 0.4% |
| Guamanian / Chamorro | 20 | 0.1% |
| Guatemalan | 39 | 0.2% |
| Honduran | 3 | 0.0% |
| Hungarian | 6 | 0.0% |
| Irish | 1,714 | 7.7% |
| Italian | 264 | 1.2% |
| Korean | 4 | 0.0% |
| Lebanese | 5 | 0.0% |
| Mexican | 4,801 | 21.6% |
| Mexican American Indian | 32 | 0.1% |
| Native Hawaiian | 22 | 0.1% |
| Nigerian | 39 | 0.2% |
| Norwegian | 8 | 0.0% |
| Osage | 13 | 0.1% |
| Panamanian | 17 | 0.1% |
| Polish | 142 | 0.6% |
| Puerto Rican | 42 | 0.2% |
| Romanian | 5 | 0.0% |
| Salvadoran | 13 | 0.1% |
| Samoan | 5 | 0.0% |
| Scandinavian | 18 | 0.1% |
| Scotch-Irish | 666 | 3.0% |
| Scottish | 362 | 1.6% |
| Slovak | 12 | 0.1% |
| South American | 39 | 0.2% |
| Spaniard | 45 | 0.2% |
| Sri Lankan | 173 | 0.8% |
| Subsaharan African | 517 | 2.3% |
| Swedish | 108 | 0.5% |
| Venezuelan | 27 | 0.1% |
| Welsh | 24 | 0.1% |
| West Indian | 24 | 0.1% | View All 59 Rows |
Immigrants in Limestone County
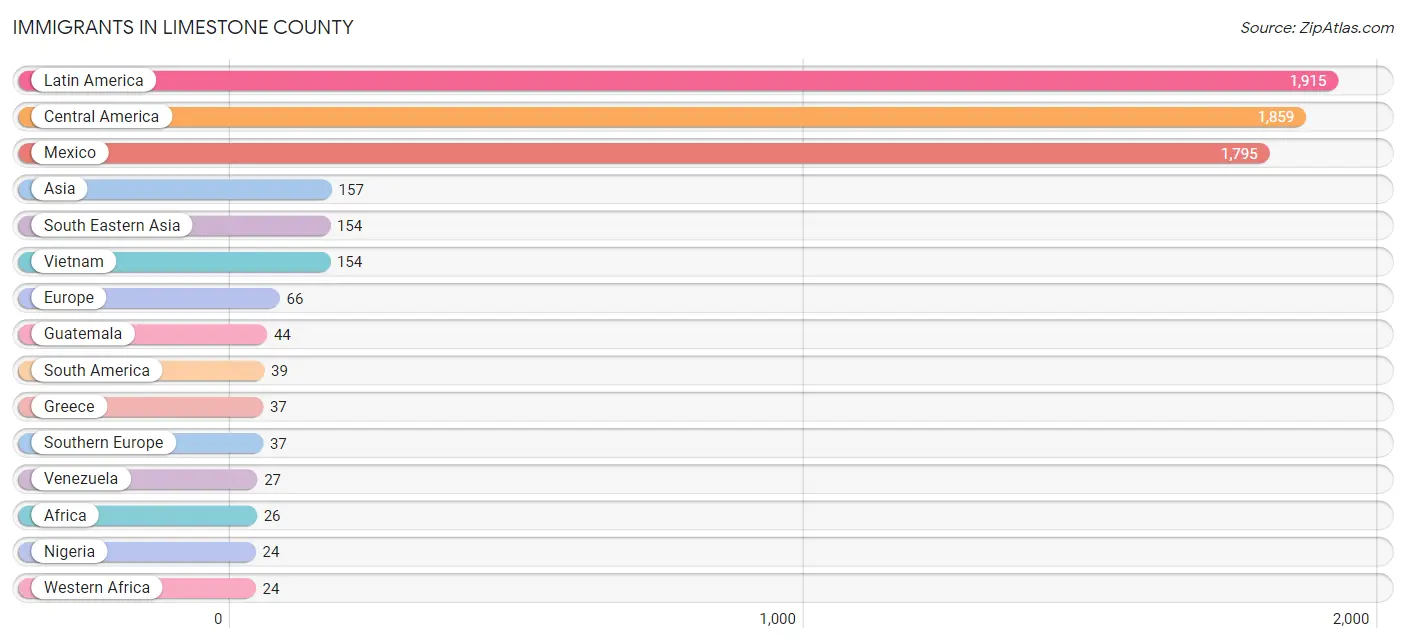
The most numerous immigrant groups reported in Limestone County came from Latin America (1,915 | 8.6%), Central America (1,859 | 8.4%), Mexico (1,795 | 8.1%), Asia (157 | 0.7%), and South Eastern Asia (154 | 0.7%), together accounting for 26.5% of all Limestone County residents.
| Immigration Origin | # Population | % Population |
| Africa | 26 | 0.1% |
| Asia | 157 | 0.7% |
| Caribbean | 17 | 0.1% |
| Central America | 1,859 | 8.4% |
| Colombia | 12 | 0.1% |
| Cuba | 4 | 0.0% |
| Eastern Africa | 2 | 0.0% |
| Eastern Asia | 3 | 0.0% |
| Eastern Europe | 19 | 0.1% |
| Ethiopia | 2 | 0.0% |
| Europe | 66 | 0.3% |
| Greece | 37 | 0.2% |
| Guatemala | 44 | 0.2% |
| Honduras | 3 | 0.0% |
| Japan | 3 | 0.0% |
| Latin America | 1,915 | 8.6% |
| Mexico | 1,795 | 8.1% |
| Nigeria | 24 | 0.1% |
| Northern Europe | 10 | 0.1% |
| Panama | 17 | 0.1% |
| Romania | 5 | 0.0% |
| Serbia | 14 | 0.1% |
| South America | 39 | 0.2% |
| South Eastern Asia | 154 | 0.7% |
| Southern Europe | 37 | 0.2% |
| St. Vincent and the Grenadines | 13 | 0.1% |
| Venezuela | 27 | 0.1% |
| Vietnam | 154 | 0.7% |
| Western Africa | 24 | 0.1% | View All 29 Rows |
Sex and Age in Limestone County
Sex and Age in Limestone County
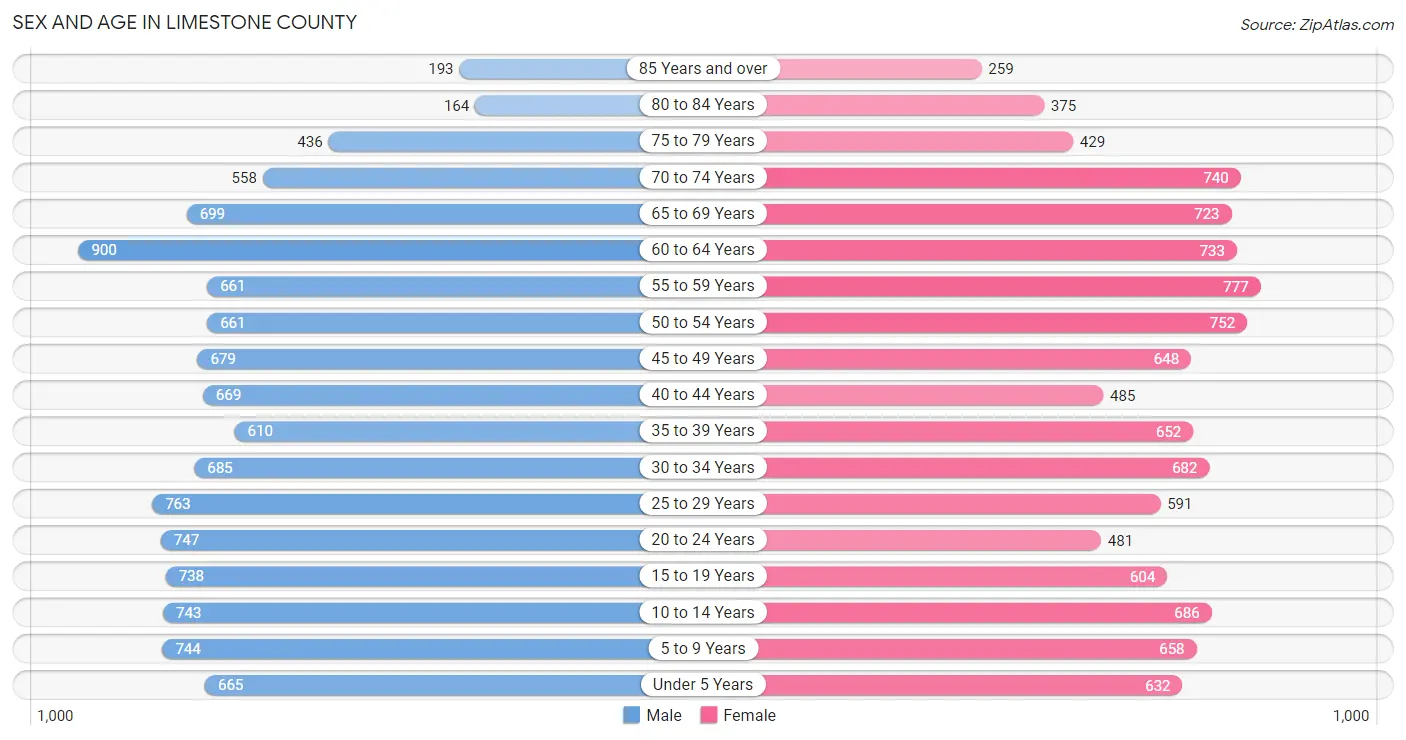
The most populous age groups in Limestone County are 60 to 64 Years (900 | 8.0%) for men and 55 to 59 Years (777 | 7.1%) for women.
| Age Bracket | Male | Female |
| Under 5 Years | 665 (5.9%) | 632 (5.8%) |
| 5 to 9 Years | 744 (6.6%) | 658 (6.0%) |
| 10 to 14 Years | 743 (6.6%) | 686 (6.3%) |
| 15 to 19 Years | 738 (6.5%) | 604 (5.5%) |
| 20 to 24 Years | 747 (6.6%) | 481 (4.4%) |
| 25 to 29 Years | 763 (6.7%) | 591 (5.4%) |
| 30 to 34 Years | 685 (6.0%) | 682 (6.2%) |
| 35 to 39 Years | 610 (5.4%) | 652 (6.0%) |
| 40 to 44 Years | 669 (5.9%) | 485 (4.4%) |
| 45 to 49 Years | 679 (6.0%) | 648 (5.9%) |
| 50 to 54 Years | 661 (5.8%) | 752 (6.9%) |
| 55 to 59 Years | 661 (5.8%) | 777 (7.1%) |
| 60 to 64 Years | 900 (8.0%) | 733 (6.7%) |
| 65 to 69 Years | 699 (6.2%) | 723 (6.6%) |
| 70 to 74 Years | 558 (4.9%) | 740 (6.8%) |
| 75 to 79 Years | 436 (3.8%) | 429 (3.9%) |
| 80 to 84 Years | 164 (1.5%) | 375 (3.4%) |
| 85 Years and over | 193 (1.7%) | 259 (2.4%) |
| Total | 11,315 (100.0%) | 10,907 (100.0%) |
Families and Households in Limestone County
Median Family Size in Limestone County
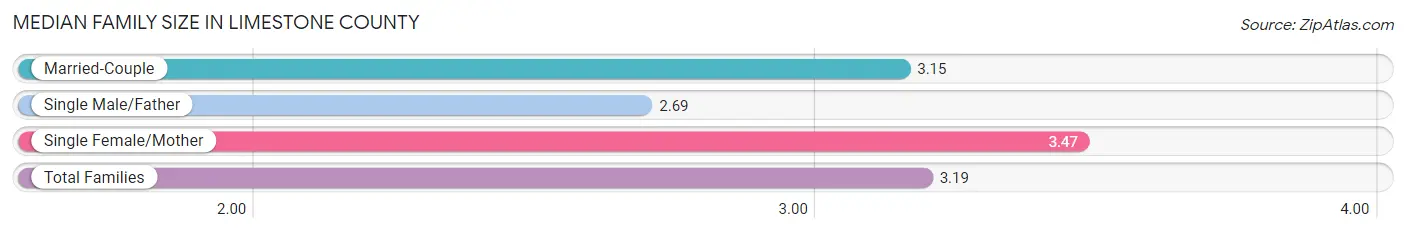
The median family size in Limestone County is 3.19 persons per family, with single female/mother families (1,392 | 25.0%) accounting for the largest median family size of 3.47 persons per family. On the other hand, single male/father families (469 | 8.4%) represent the smallest median family size with 2.69 persons per family.
| Family Type | # Families | Family Size |
| Married-Couple | 3,713 (66.6%) | 3.15 |
| Single Male/Father | 469 (8.4%) | 2.69 |
| Single Female/Mother | 1,392 (25.0%) | 3.47 |
| Total Families | 5,574 (100.0%) | 3.19 |
Median Household Size in Limestone County
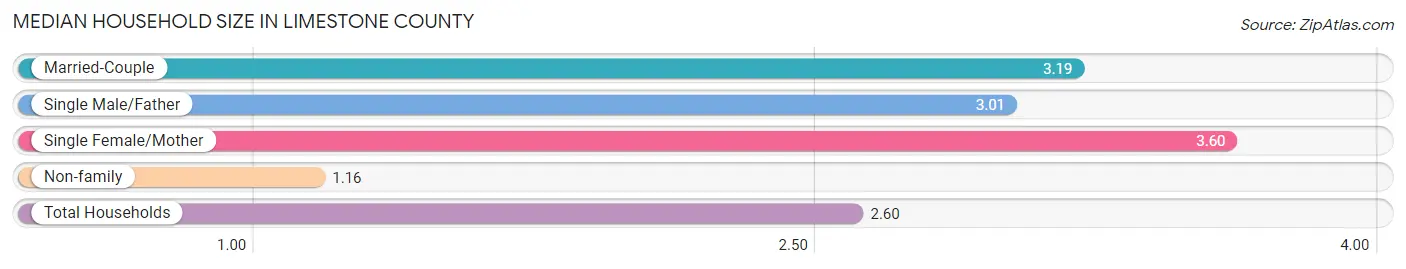
The median household size in Limestone County is 2.60 persons per household, with single female/mother households (1,392 | 17.0%) accounting for the largest median household size of 3.6 persons per household. non-family households (2,621 | 32.0%) represent the smallest median household size with 1.16 persons per household.
| Household Type | # Households | Household Size |
| Married-Couple | 3,713 (45.3%) | 3.19 |
| Single Male/Father | 469 (5.7%) | 3.01 |
| Single Female/Mother | 1,392 (17.0%) | 3.60 |
| Non-family | 2,621 (32.0%) | 1.16 |
| Total Households | 8,195 (100.0%) | 2.60 |
Household Size by Marriage Status in Limestone County
Out of a total of 8,195 households in Limestone County, 5,574 (68.0%) are family households, while 2,621 (32.0%) are nonfamily households. The most numerous type of family households are 2-person households, comprising 2,441, and the most common type of nonfamily households are 1-person households, comprising 2,378.
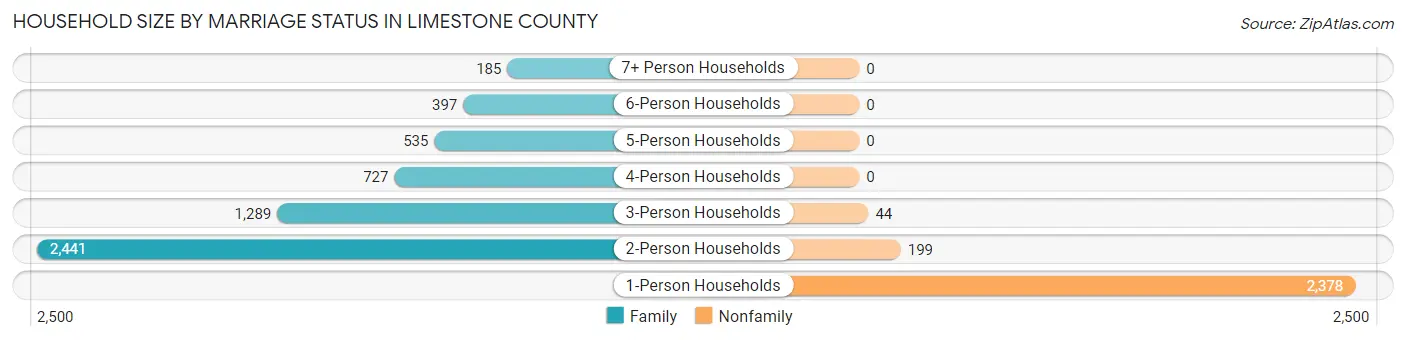
| Household Size | Family Households | Nonfamily Households |
| 1-Person Households | - | 2,378 (29.0%) |
| 2-Person Households | 2,441 (29.8%) | 199 (2.4%) |
| 3-Person Households | 1,289 (15.7%) | 44 (0.5%) |
| 4-Person Households | 727 (8.9%) | 0 (0.0%) |
| 5-Person Households | 535 (6.5%) | 0 (0.0%) |
| 6-Person Households | 397 (4.8%) | 0 (0.0%) |
| 7+ Person Households | 185 (2.3%) | 0 (0.0%) |
| Total | 5,574 (68.0%) | 2,621 (32.0%) |
Female Fertility in Limestone County
Fertility by Age in Limestone County
Average fertility rate in Limestone County is 90.0 births per 1,000 women. Women in the age bracket of 20 to 34 years have the highest fertility rate with 147.0 births per 1,000 women. Women in the age bracket of 20 to 34 years acount for 67.4% of all women with births.
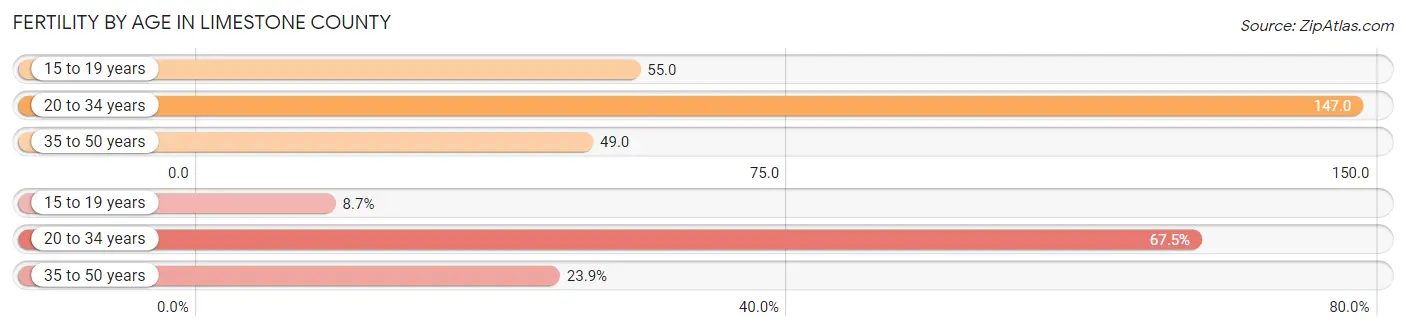
| Age Bracket | Women with Births | Births / 1,000 Women |
| 15 to 19 years | 33 (8.7%) | 55.0 |
| 20 to 34 years | 257 (67.4%) | 147.0 |
| 35 to 50 years | 91 (23.9%) | 49.0 |
| Total | 381 (100.0%) | 90.0 |
Fertility by Age by Marriage Status in Limestone County
29.1% of women with births (381) in Limestone County are married. The highest percentage of unmarried women with births falls into 15 to 19 years age bracket with 100.0% of them unmarried at the time of birth, while the lowest percentage of unmarried women with births belong to 35 to 50 years age bracket with 25.3% of them unmarried.
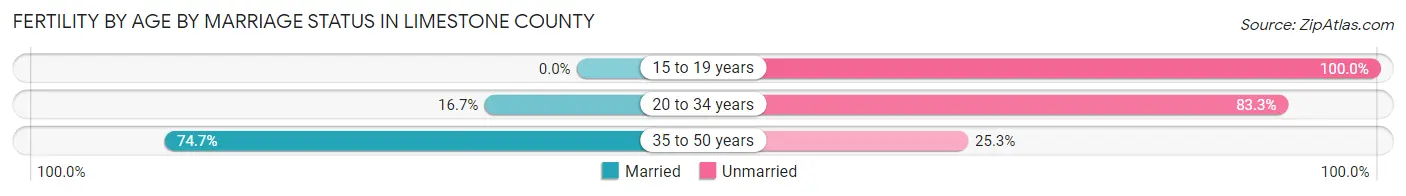
| Age Bracket | Married | Unmarried |
| 15 to 19 years | 0 (0.0%) | 33 (100.0%) |
| 20 to 34 years | 43 (16.7%) | 214 (83.3%) |
| 35 to 50 years | 68 (74.7%) | 23 (25.3%) |
| Total | 111 (29.1%) | 270 (70.9%) |
Fertility by Education in Limestone County
Average fertility rate in Limestone County is 90.0 births per 1,000 women. Women with the education attainment of graduate degree have the highest fertility rate of 591.0 births per 1,000 women, while women with the education attainment of bachelor's degree have the lowest fertility at 36.0 births per 1,000 women. Women with the education attainment of college or associate's degree represent 36.0% of all women with births.
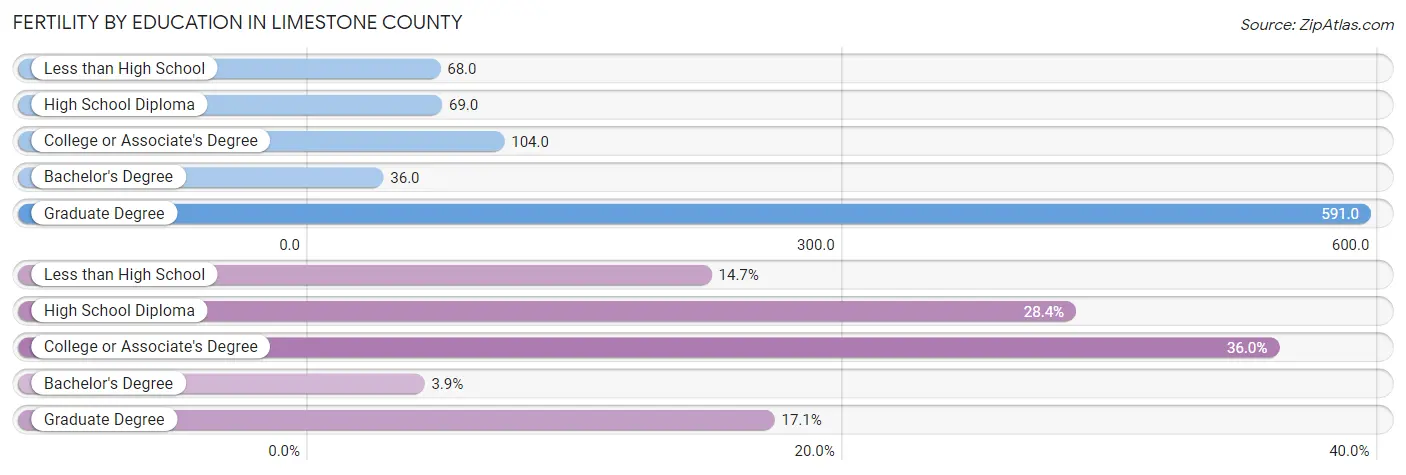
| Educational Attainment | Women with Births | Births / 1,000 Women |
| Less than High School | 56 (14.7%) | 68.0 |
| High School Diploma | 108 (28.3%) | 69.0 |
| College or Associate's Degree | 137 (36.0%) | 104.0 |
| Bachelor's Degree | 15 (3.9%) | 36.0 |
| Graduate Degree | 65 (17.1%) | 591.0 |
| Total | 381 (100.0%) | 90.0 |
Fertility by Education by Marriage Status in Limestone County
70.9% of women with births in Limestone County are unmarried. Women with the educational attainment of bachelor's degree are most likely to be married with 100.0% of them married at childbirth, while women with the educational attainment of high school diploma are least likely to be married with 95.4% of them unmarried at childbirth.
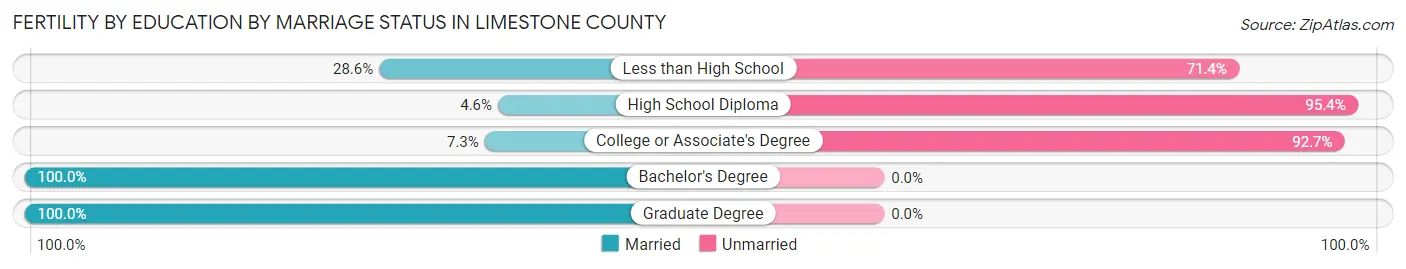
| Educational Attainment | Married | Unmarried |
| Less than High School | 16 (28.6%) | 40 (71.4%) |
| High School Diploma | 5 (4.6%) | 103 (95.4%) |
| College or Associate's Degree | 10 (7.3%) | 127 (92.7%) |
| Bachelor's Degree | 15 (100.0%) | 0 (0.0%) |
| Graduate Degree | 65 (100.0%) | 0 (0.0%) |
| Total | 111 (29.1%) | 270 (70.9%) |
Employment Characteristics in Limestone County
Employment by Class of Employer in Limestone County
Among the 8,100 employed individuals in Limestone County, private company employees (5,091 | 62.8%), state government employees (916 | 11.3%), and local government employees (750 | 9.3%) make up the most common classes of employment.
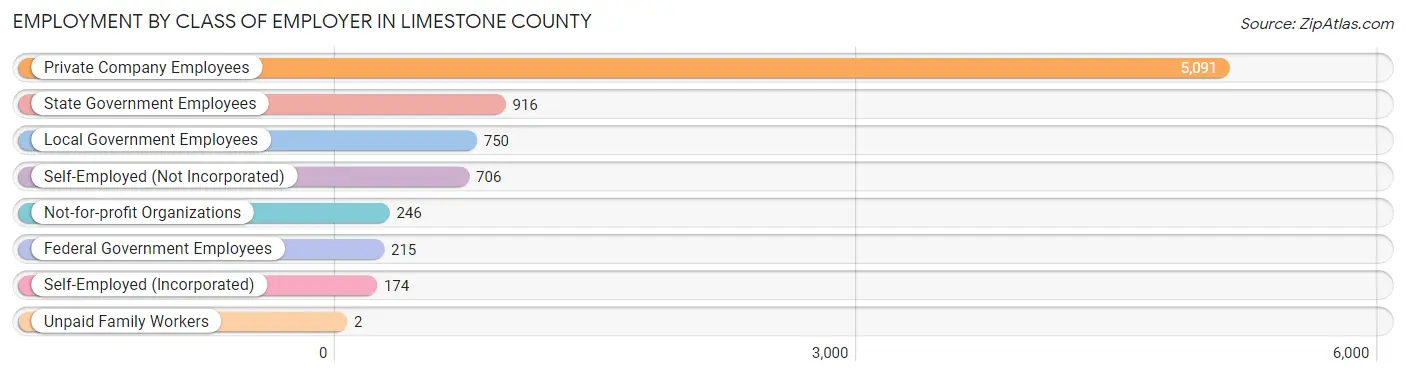
| Employer Class | # Employees | % Employees |
| Private Company Employees | 5,091 | 62.8% |
| Self-Employed (Incorporated) | 174 | 2.1% |
| Self-Employed (Not Incorporated) | 706 | 8.7% |
| Not-for-profit Organizations | 246 | 3.0% |
| Local Government Employees | 750 | 9.3% |
| State Government Employees | 916 | 11.3% |
| Federal Government Employees | 215 | 2.6% |
| Unpaid Family Workers | 2 | 0.0% |
| Total | 8,100 | 100.0% |
Employment Status by Age in Limestone County
According to the labor force statistics for Limestone County, out of the total population over 16 years of age (17,790), 47.5% or 8,450 individuals are in the labor force, with 3.6% or 304 of them unemployed. The age group with the highest labor force participation rate is 45 to 54 years, with 75.0% or 2,055 individuals in the labor force. Within the labor force, the 16 to 19 years age range has the highest percentage of unemployed individuals, with 12.7% or 42 of them being unemployed.
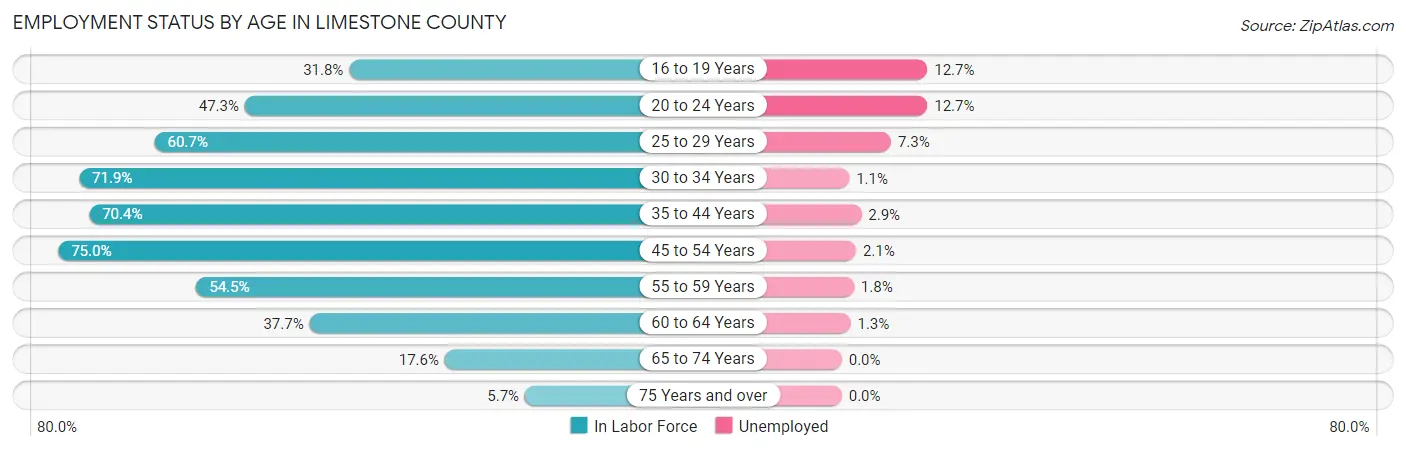
| Age Bracket | In Labor Force | Unemployed |
| 16 to 19 Years | 330 (31.8%) | 42 (12.7%) |
| 20 to 24 Years | 581 (47.3%) | 74 (12.7%) |
| 25 to 29 Years | 822 (60.7%) | 60 (7.3%) |
| 30 to 34 Years | 983 (71.9%) | 11 (1.1%) |
| 35 to 44 Years | 1,701 (70.4%) | 49 (2.9%) |
| 45 to 54 Years | 2,055 (75.0%) | 43 (2.1%) |
| 55 to 59 Years | 784 (54.5%) | 14 (1.8%) |
| 60 to 64 Years | 616 (37.7%) | 8 (1.3%) |
| 65 to 74 Years | 479 (17.6%) | 0 (0.0%) |
| 75 Years and over | 106 (5.7%) | 0 (0.0%) |
| Total | 8,450 (47.5%) | 304 (3.6%) |
Employment Status by Educational Attainment in Limestone County
According to labor force statistics for Limestone County, 63.6% of individuals (6,963) out of the total population between 25 and 64 years of age (10,948) are in the labor force, with 2.7% or 188 of them being unemployed. The group with the highest labor force participation rate are those with the educational attainment of bachelor's degree or higher, with 75.4% or 1,164 individuals in the labor force. Within the labor force, individuals with less than high school education have the highest percentage of unemployment, with 3.7% or 37 of them being unemployed.
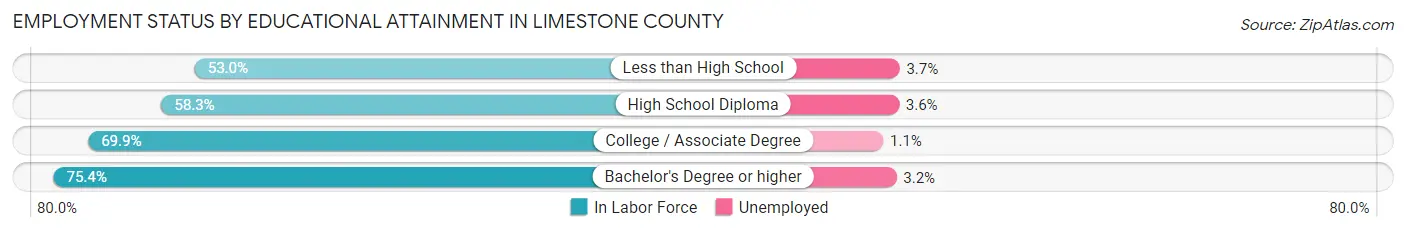
| Educational Attainment | In Labor Force | Unemployed |
| Less than High School | 988 (53.0%) | 69 (3.7%) |
| High School Diploma | 2,324 (58.3%) | 144 (3.6%) |
| College / Associate Degree | 2,484 (69.9%) | 39 (1.1%) |
| Bachelor's Degree or higher | 1,164 (75.4%) | 49 (3.2%) |
| Total | 6,963 (63.6%) | 296 (2.7%) |
Employment Occupations by Sex in Limestone County
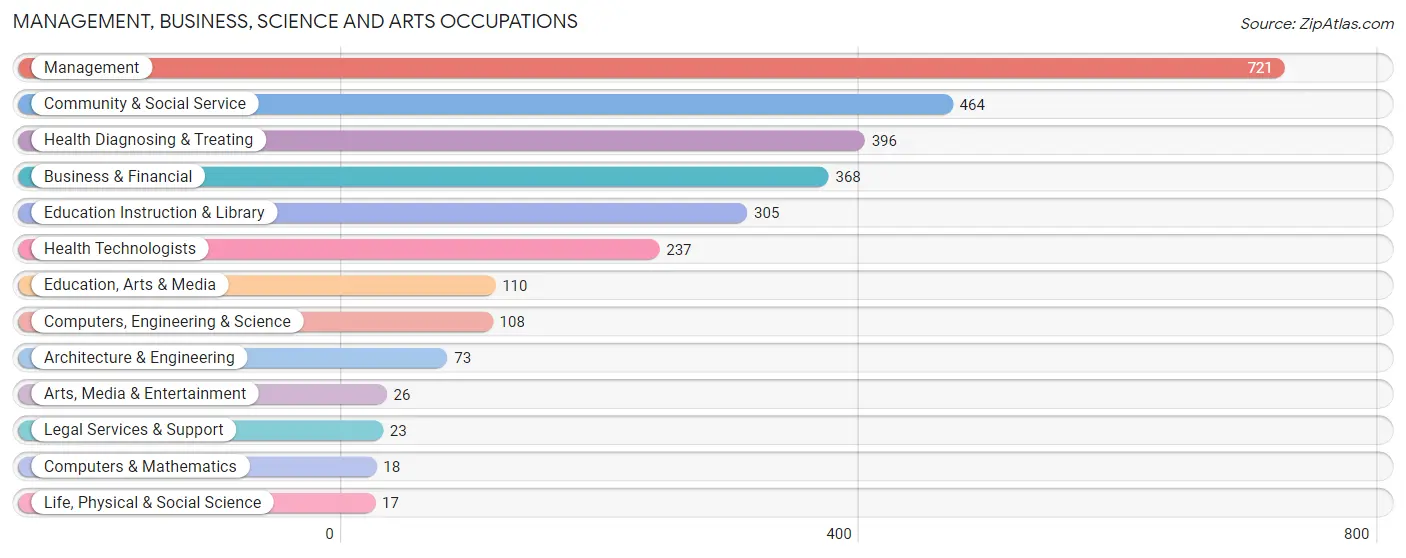
Management, Business, Science and Arts Occupations
The most common Management, Business, Science and Arts occupations in Limestone County are Management (721 | 8.8%), Community & Social Service (464 | 5.7%), Health Diagnosing & Treating (396 | 4.9%), Business & Financial (368 | 4.5%), and Education Instruction & Library (305 | 3.7%).
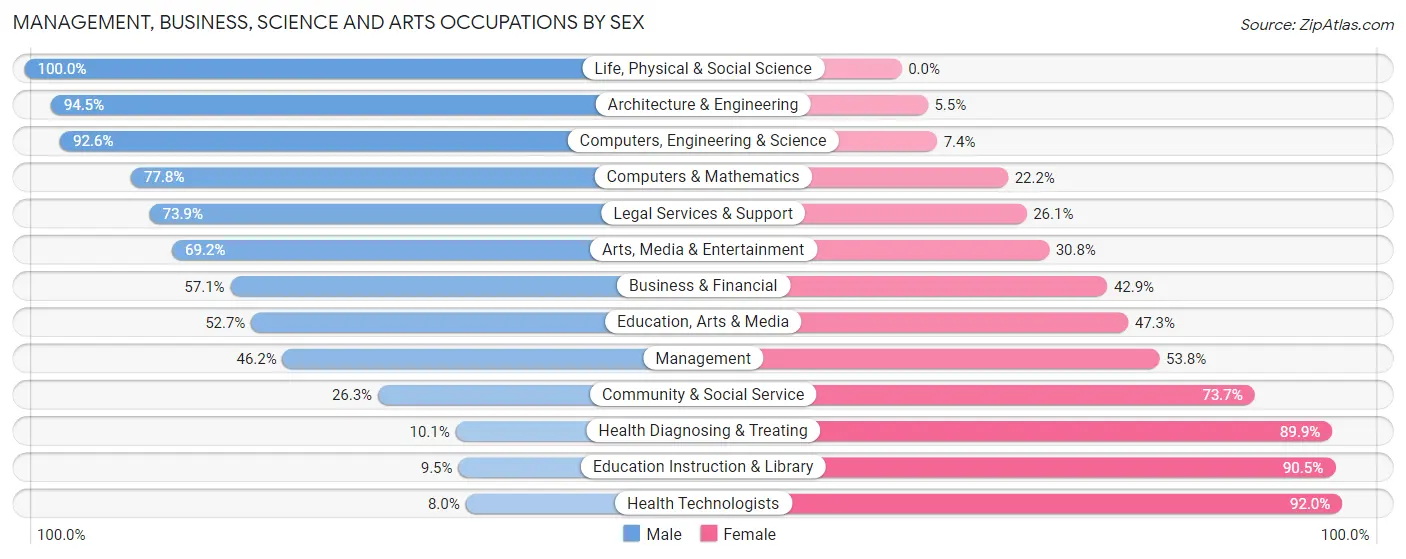
Management, Business, Science and Arts Occupations by Sex
Within the Management, Business, Science and Arts occupations in Limestone County, the most male-oriented occupations are Life, Physical & Social Science (100.0%), Architecture & Engineering (94.5%), and Computers, Engineering & Science (92.6%), while the most female-oriented occupations are Health Technologists (92.0%), Education Instruction & Library (90.5%), and Health Diagnosing & Treating (89.9%).
| Occupation | Male | Female |
| Management | 333 (46.2%) | 388 (53.8%) |
| Business & Financial | 210 (57.1%) | 158 (42.9%) |
| Computers, Engineering & Science | 100 (92.6%) | 8 (7.4%) |
| Computers & Mathematics | 14 (77.8%) | 4 (22.2%) |
| Architecture & Engineering | 69 (94.5%) | 4 (5.5%) |
| Life, Physical & Social Science | 17 (100.0%) | 0 (0.0%) |
| Community & Social Service | 122 (26.3%) | 342 (73.7%) |
| Education, Arts & Media | 58 (52.7%) | 52 (47.3%) |
| Legal Services & Support | 17 (73.9%) | 6 (26.1%) |
| Education Instruction & Library | 29 (9.5%) | 276 (90.5%) |
| Arts, Media & Entertainment | 18 (69.2%) | 8 (30.8%) |
| Health Diagnosing & Treating | 40 (10.1%) | 356 (89.9%) |
| Health Technologists | 19 (8.0%) | 218 (92.0%) |
| Total (Category) | 805 (39.1%) | 1,252 (60.9%) |
| Total (Overall) | 4,508 (55.3%) | 3,645 (44.7%) |
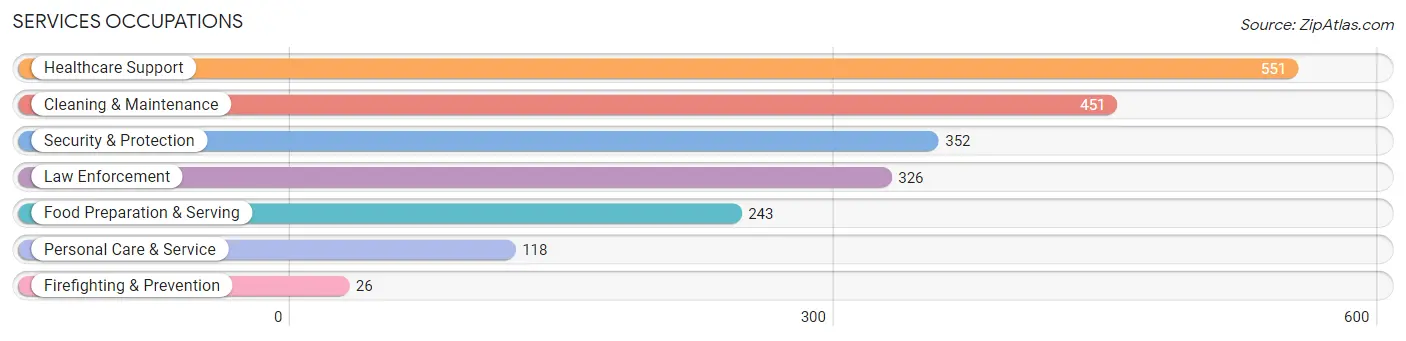
Services Occupations
The most common Services occupations in Limestone County are Healthcare Support (551 | 6.8%), Cleaning & Maintenance (451 | 5.5%), Security & Protection (352 | 4.3%), Law Enforcement (326 | 4.0%), and Food Preparation & Serving (243 | 3.0%).
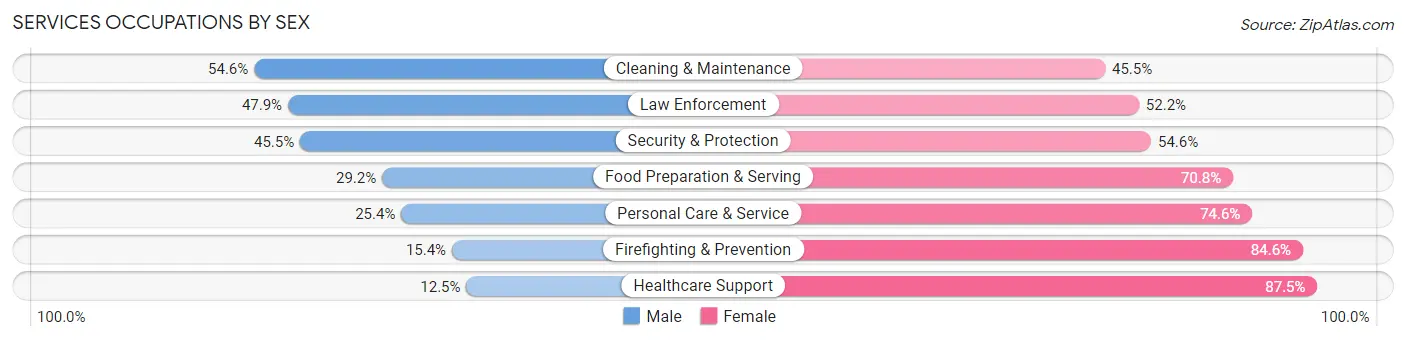
Services Occupations by Sex
Within the Services occupations in Limestone County, the most male-oriented occupations are Cleaning & Maintenance (54.5%), Law Enforcement (47.8%), and Security & Protection (45.5%), while the most female-oriented occupations are Healthcare Support (87.5%), Firefighting & Prevention (84.6%), and Personal Care & Service (74.6%).
| Occupation | Male | Female |
| Healthcare Support | 69 (12.5%) | 482 (87.5%) |
| Security & Protection | 160 (45.5%) | 192 (54.5%) |
| Firefighting & Prevention | 4 (15.4%) | 22 (84.6%) |
| Law Enforcement | 156 (47.8%) | 170 (52.1%) |
| Food Preparation & Serving | 71 (29.2%) | 172 (70.8%) |
| Cleaning & Maintenance | 246 (54.5%) | 205 (45.5%) |
| Personal Care & Service | 30 (25.4%) | 88 (74.6%) |
| Total (Category) | 576 (33.6%) | 1,139 (66.4%) |
| Total (Overall) | 4,508 (55.3%) | 3,645 (44.7%) |
Sales and Office Occupations
The most common Sales and Office occupations in Limestone County are Office & Administration (836 | 10.2%), and Sales & Related (540 | 6.6%).
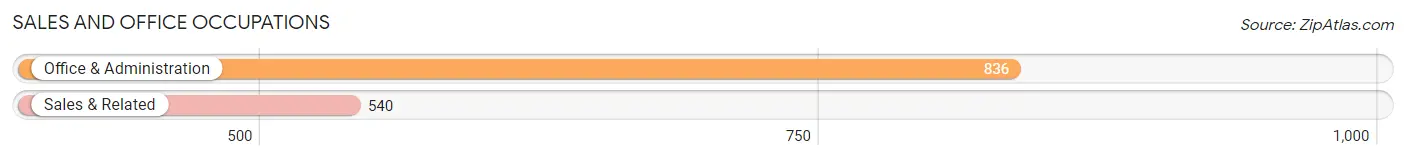
Sales and Office Occupations by Sex
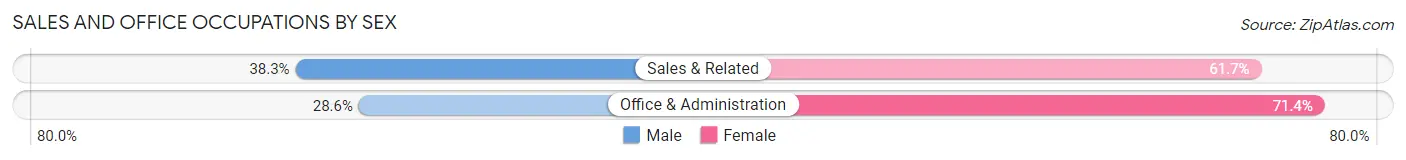
| Occupation | Male | Female |
| Sales & Related | 207 (38.3%) | 333 (61.7%) |
| Office & Administration | 239 (28.6%) | 597 (71.4%) |
| Total (Category) | 446 (32.4%) | 930 (67.6%) |
| Total (Overall) | 4,508 (55.3%) | 3,645 (44.7%) |
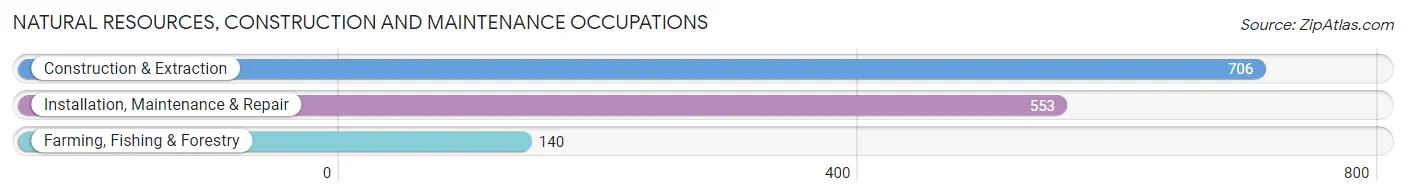
Natural Resources, Construction and Maintenance Occupations
The most common Natural Resources, Construction and Maintenance occupations in Limestone County are Construction & Extraction (706 | 8.7%), Installation, Maintenance & Repair (553 | 6.8%), and Farming, Fishing & Forestry (140 | 1.7%).
Natural Resources, Construction and Maintenance Occupations by Sex
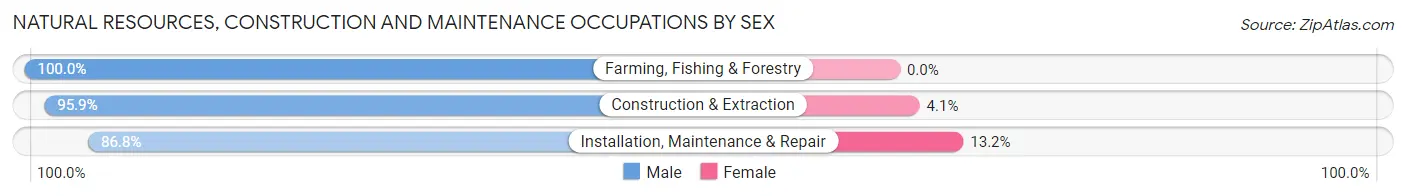
| Occupation | Male | Female |
| Farming, Fishing & Forestry | 140 (100.0%) | 0 (0.0%) |
| Construction & Extraction | 677 (95.9%) | 29 (4.1%) |
| Installation, Maintenance & Repair | 480 (86.8%) | 73 (13.2%) |
| Total (Category) | 1,297 (92.7%) | 102 (7.3%) |
| Total (Overall) | 4,508 (55.3%) | 3,645 (44.7%) |
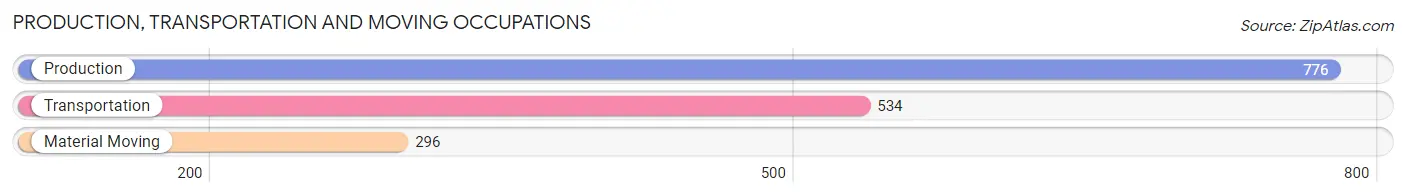
Production, Transportation and Moving Occupations
The most common Production, Transportation and Moving occupations in Limestone County are Production (776 | 9.5%), Transportation (534 | 6.6%), and Material Moving (296 | 3.6%).
Production, Transportation and Moving Occupations by Sex
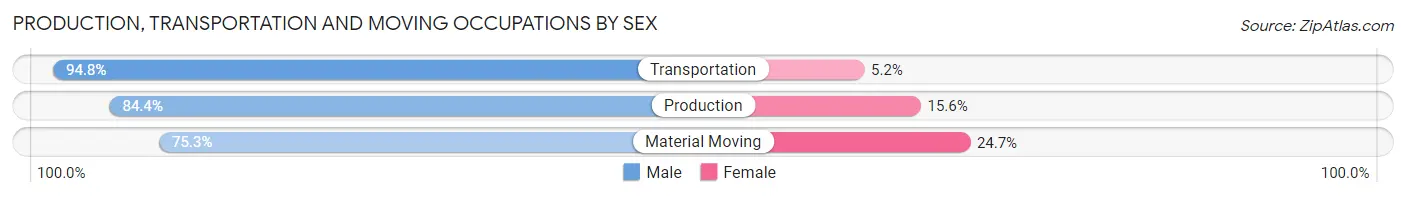
| Occupation | Male | Female |
| Production | 655 (84.4%) | 121 (15.6%) |
| Transportation | 506 (94.8%) | 28 (5.2%) |
| Material Moving | 223 (75.3%) | 73 (24.7%) |
| Total (Category) | 1,384 (86.2%) | 222 (13.8%) |
| Total (Overall) | 4,508 (55.3%) | 3,645 (44.7%) |
Employment Industries by Sex in Limestone County
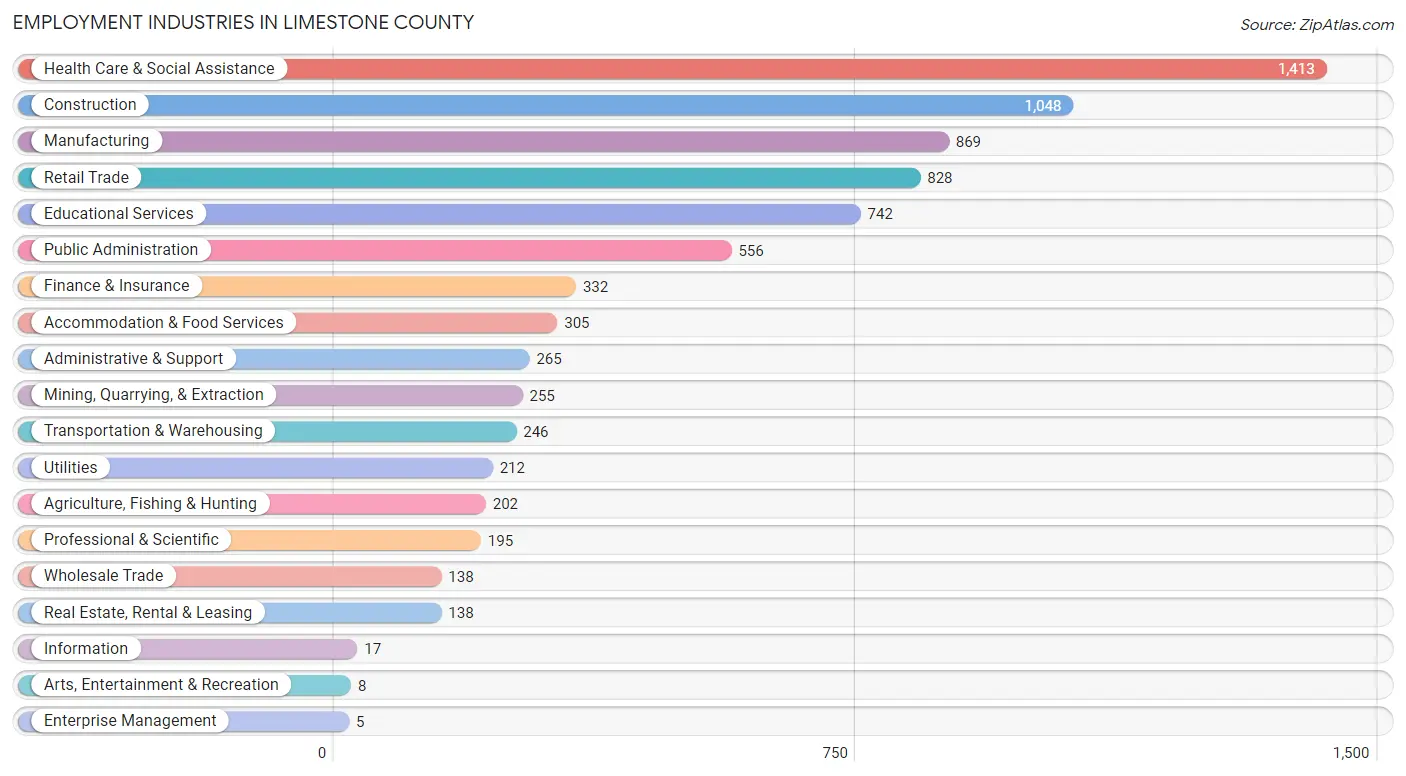
Employment Industries in Limestone County
The major employment industries in Limestone County include Health Care & Social Assistance (1,413 | 17.3%), Construction (1,048 | 12.9%), Manufacturing (869 | 10.7%), Retail Trade (828 | 10.2%), and Educational Services (742 | 9.1%).
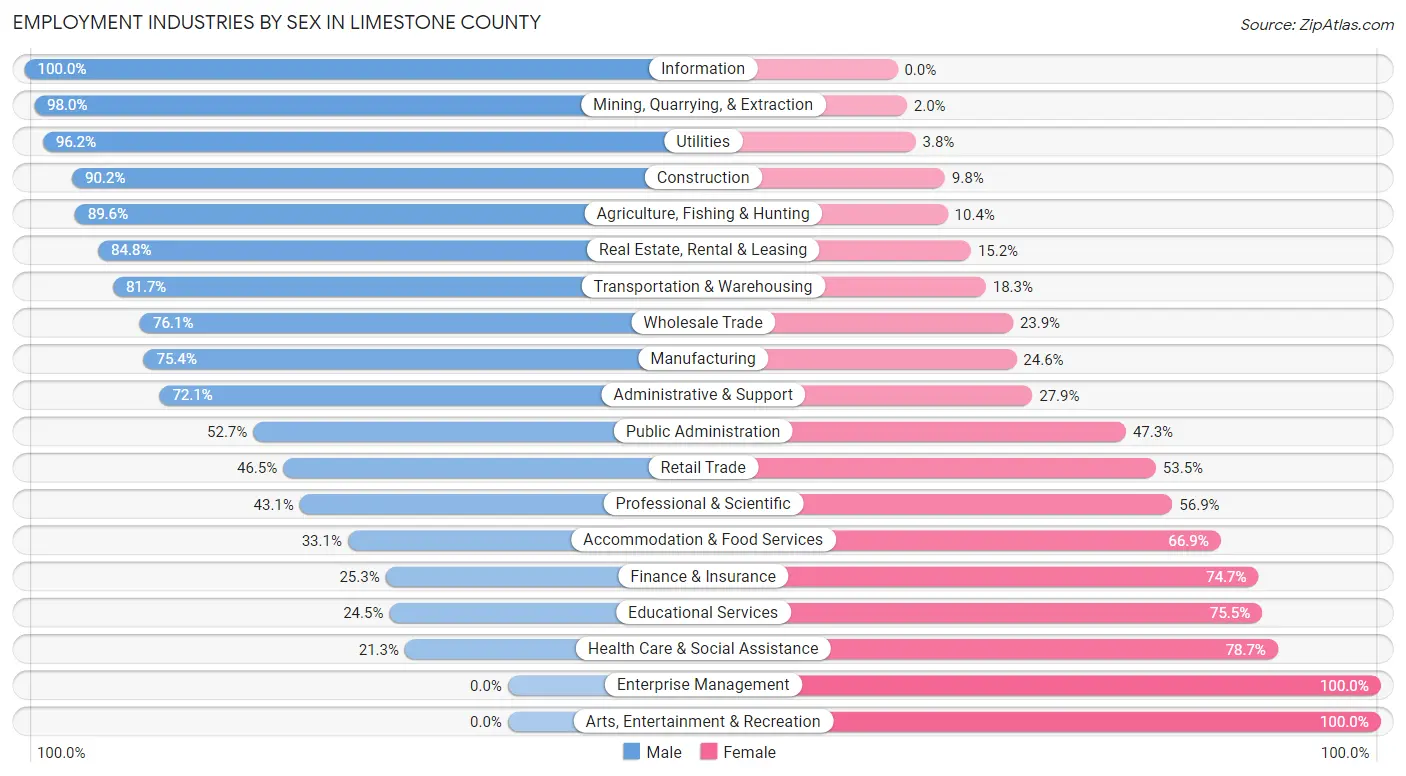
Employment Industries by Sex in Limestone County
The Limestone County industries that see more men than women are Information (100.0%), Mining, Quarrying, & Extraction (98.0%), and Utilities (96.2%), whereas the industries that tend to have a higher number of women are Enterprise Management (100.0%), Arts, Entertainment & Recreation (100.0%), and Health Care & Social Assistance (78.7%).
| Industry | Male | Female |
| Agriculture, Fishing & Hunting | 181 (89.6%) | 21 (10.4%) |
| Mining, Quarrying, & Extraction | 250 (98.0%) | 5 (2.0%) |
| Construction | 945 (90.2%) | 103 (9.8%) |
| Manufacturing | 655 (75.4%) | 214 (24.6%) |
| Wholesale Trade | 105 (76.1%) | 33 (23.9%) |
| Retail Trade | 385 (46.5%) | 443 (53.5%) |
| Transportation & Warehousing | 201 (81.7%) | 45 (18.3%) |
| Utilities | 204 (96.2%) | 8 (3.8%) |
| Information | 17 (100.0%) | 0 (0.0%) |
| Finance & Insurance | 84 (25.3%) | 248 (74.7%) |
| Real Estate, Rental & Leasing | 117 (84.8%) | 21 (15.2%) |
| Professional & Scientific | 84 (43.1%) | 111 (56.9%) |
| Enterprise Management | 0 (0.0%) | 5 (100.0%) |
| Administrative & Support | 191 (72.1%) | 74 (27.9%) |
| Educational Services | 182 (24.5%) | 560 (75.5%) |
| Health Care & Social Assistance | 301 (21.3%) | 1,112 (78.7%) |
| Arts, Entertainment & Recreation | 0 (0.0%) | 8 (100.0%) |
| Accommodation & Food Services | 101 (33.1%) | 204 (66.9%) |
| Public Administration | 293 (52.7%) | 263 (47.3%) |
| Total | 4,508 (55.3%) | 3,645 (44.7%) |
Education in Limestone County
School Enrollment in Limestone County
The most common levels of schooling among the 4,485 students in Limestone County are high school (1,258 | 28.1%), middle school (1,064 | 23.7%), and elementary school (980 | 21.8%).
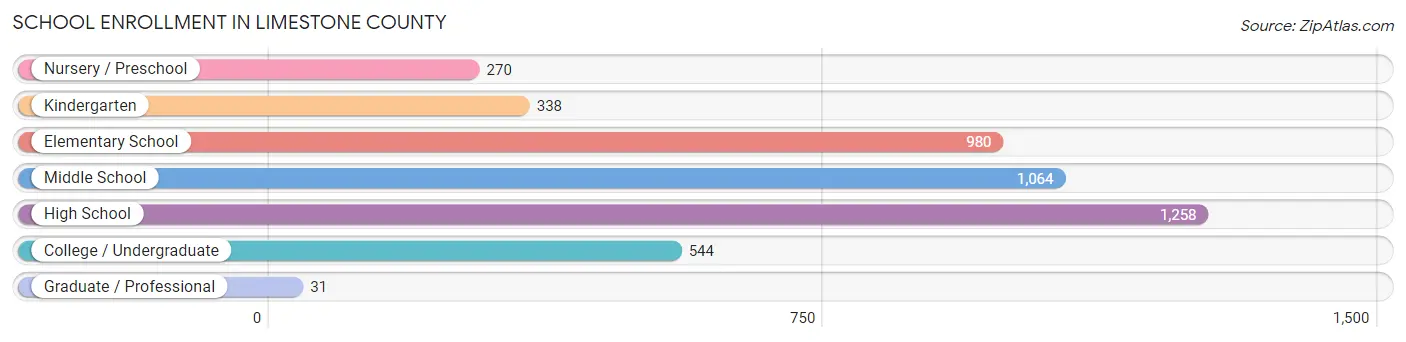
| School Level | # Students | % Students |
| Nursery / Preschool | 270 | 6.0% |
| Kindergarten | 338 | 7.5% |
| Elementary School | 980 | 21.8% |
| Middle School | 1,064 | 23.7% |
| High School | 1,258 | 28.1% |
| College / Undergraduate | 544 | 12.1% |
| Graduate / Professional | 31 | 0.7% |
| Total | 4,485 | 100.0% |
School Enrollment by Age by Funding Source in Limestone County
Out of a total of 4,485 students who are enrolled in schools in Limestone County, 296 (6.6%) attend a private institution, while the remaining 4,189 (93.4%) are enrolled in public schools. The age group of 35 years and over has the highest likelihood of being enrolled in private schools, with 71 (40.3% in the age bracket) enrolled. Conversely, the age group of 5 to 9 year old has the lowest likelihood of being enrolled in a private school, with 1,192 (96.8% in the age bracket) attending a public institution.
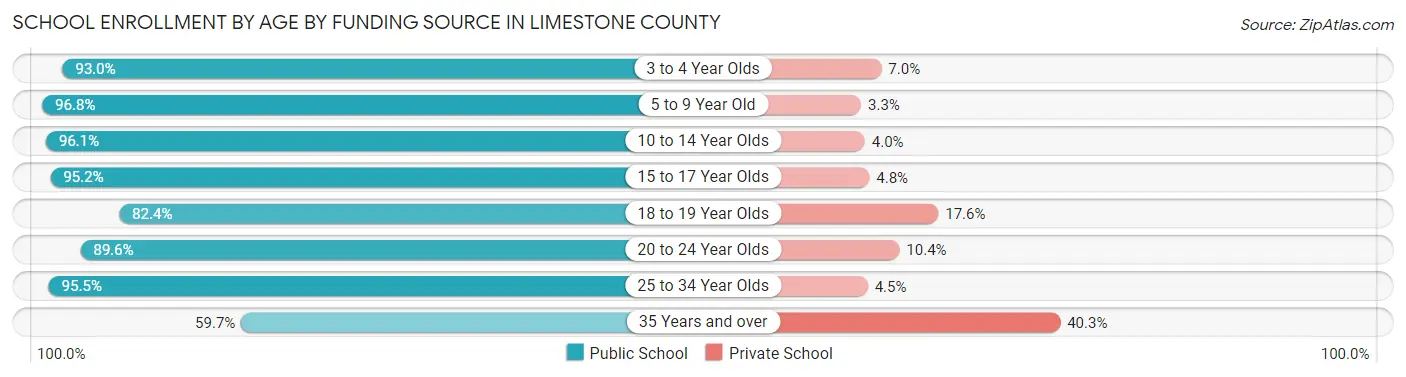
| Age Bracket | Public School | Private School |
| 3 to 4 Year Olds | 238 (93.0%) | 18 (7.0%) |
| 5 to 9 Year Old | 1,192 (96.8%) | 40 (3.3%) |
| 10 to 14 Year Olds | 1,339 (96.1%) | 55 (4.0%) |
| 15 to 17 Year Olds | 797 (95.2%) | 40 (4.8%) |
| 18 to 19 Year Olds | 201 (82.4%) | 43 (17.6%) |
| 20 to 24 Year Olds | 190 (89.6%) | 22 (10.4%) |
| 25 to 34 Year Olds | 128 (95.5%) | 6 (4.5%) |
| 35 Years and over | 105 (59.7%) | 71 (40.3%) |
| Total | 4,189 (93.4%) | 296 (6.6%) |
Educational Attainment by Field of Study in Limestone County
Education (847 | 29.9%), business (404 | 14.2%), arts & humanities (292 | 10.3%), science & technology (247 | 8.7%), and bio, nature & agricultural (204 | 7.2%) are the most common fields of study among 2,835 individuals in Limestone County who have obtained a bachelor's degree or higher.
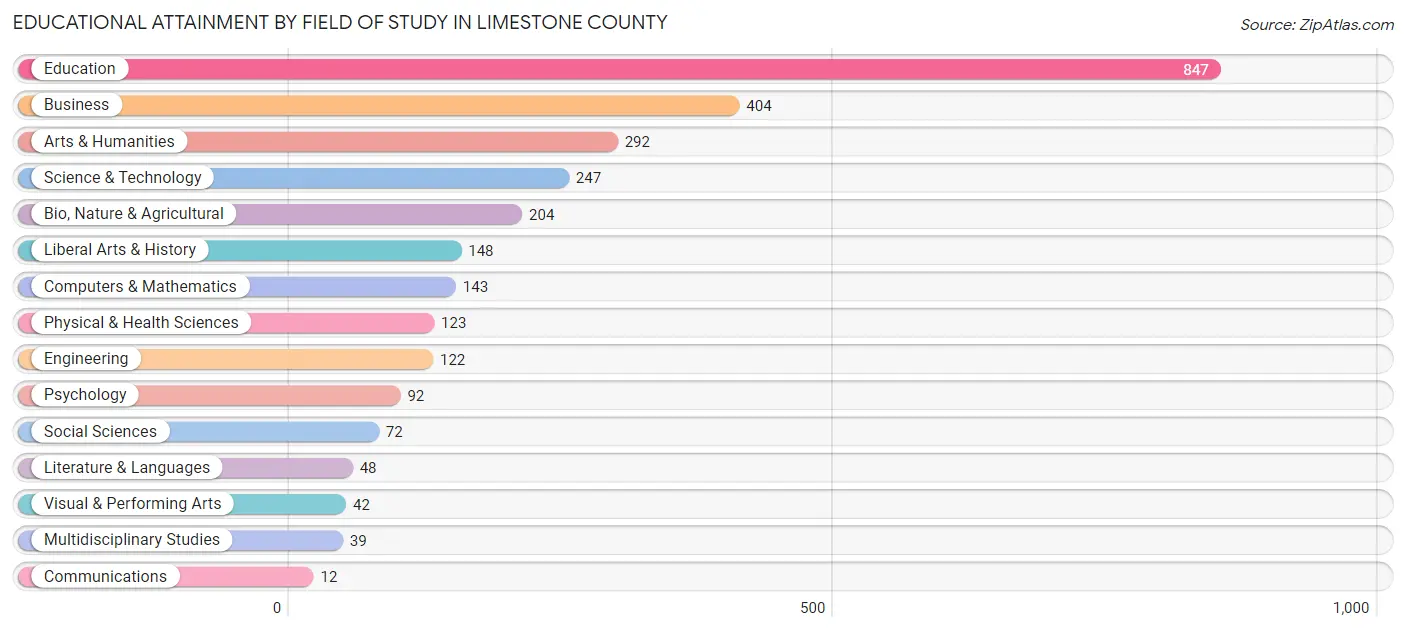
| Field of Study | # Graduates | % Graduates |
| Computers & Mathematics | 143 | 5.0% |
| Bio, Nature & Agricultural | 204 | 7.2% |
| Physical & Health Sciences | 123 | 4.3% |
| Psychology | 92 | 3.3% |
| Social Sciences | 72 | 2.5% |
| Engineering | 122 | 4.3% |
| Multidisciplinary Studies | 39 | 1.4% |
| Science & Technology | 247 | 8.7% |
| Business | 404 | 14.2% |
| Education | 847 | 29.9% |
| Literature & Languages | 48 | 1.7% |
| Liberal Arts & History | 148 | 5.2% |
| Visual & Performing Arts | 42 | 1.5% |
| Communications | 12 | 0.4% |
| Arts & Humanities | 292 | 10.3% |
| Total | 2,835 | 100.0% |
Transportation & Commute in Limestone County
Vehicle Availability by Sex in Limestone County
The most prevalent vehicle ownership categories in Limestone County are males with 2 vehicles (1,702, accounting for 38.5%) and females with 2 vehicles (1,397, making up 46.9%).
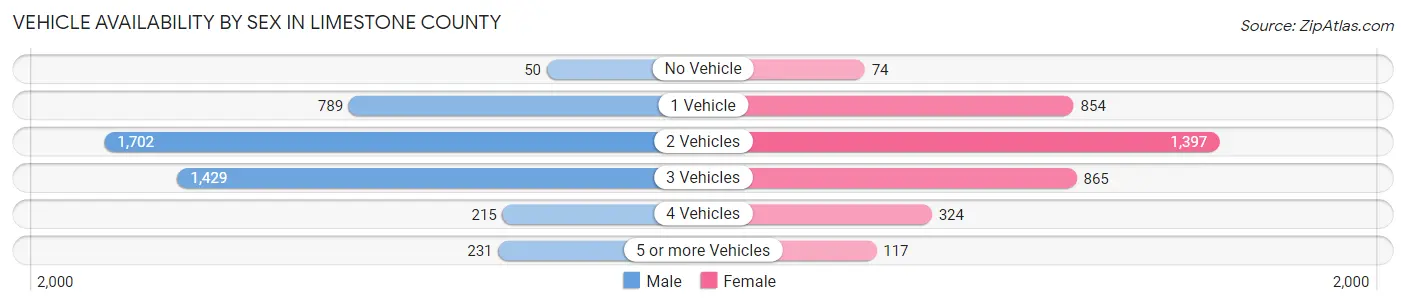
| Vehicles Available | Male | Female |
| No Vehicle | 50 (1.1%) | 74 (2.0%) |
| 1 Vehicle | 789 (17.9%) | 854 (23.5%) |
| 2 Vehicles | 1,702 (38.5%) | 1,397 (38.5%) |
| 3 Vehicles | 1,429 (32.4%) | 865 (23.8%) |
| 4 Vehicles | 215 (4.9%) | 324 (8.9%) |
| 5 or more Vehicles | 231 (5.2%) | 117 (3.2%) |
| Total | 4,416 (100.0%) | 3,631 (100.0%) |
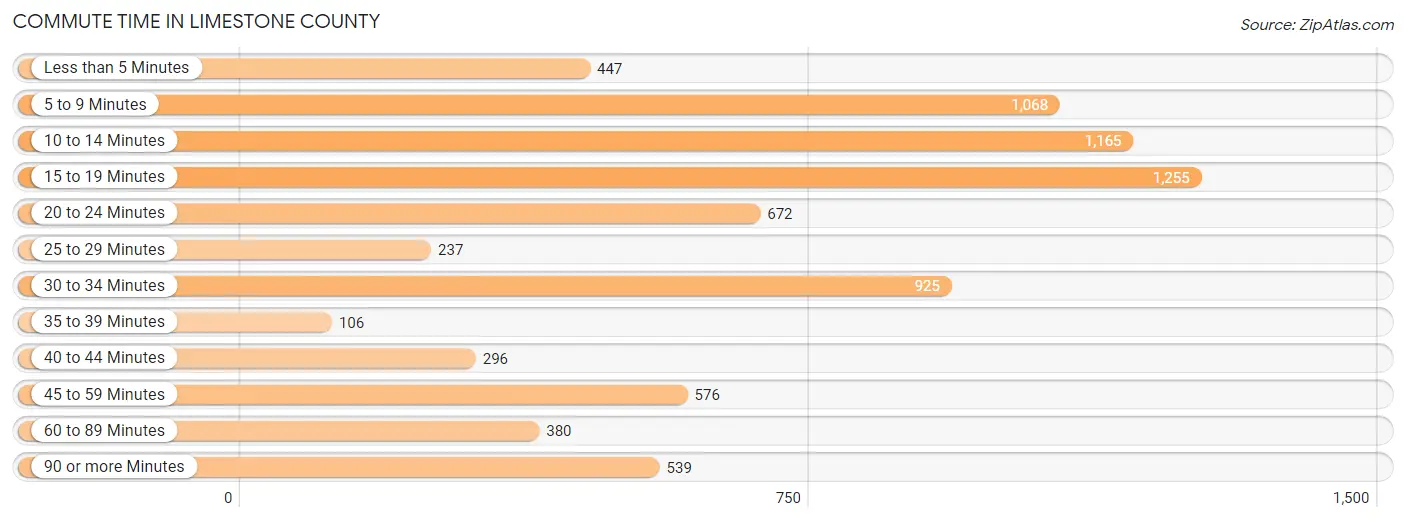
Commute Time in Limestone County
The most frequently occuring commute durations in Limestone County are 15 to 19 minutes (1,255 commuters, 16.4%), 10 to 14 minutes (1,165 commuters, 15.2%), and 5 to 9 minutes (1,068 commuters, 13.9%).
| Commute Time | # Commuters | % Commuters |
| Less than 5 Minutes | 447 | 5.8% |
| 5 to 9 Minutes | 1,068 | 13.9% |
| 10 to 14 Minutes | 1,165 | 15.2% |
| 15 to 19 Minutes | 1,255 | 16.4% |
| 20 to 24 Minutes | 672 | 8.8% |
| 25 to 29 Minutes | 237 | 3.1% |
| 30 to 34 Minutes | 925 | 12.1% |
| 35 to 39 Minutes | 106 | 1.4% |
| 40 to 44 Minutes | 296 | 3.9% |
| 45 to 59 Minutes | 576 | 7.5% |
| 60 to 89 Minutes | 380 | 5.0% |
| 90 or more Minutes | 539 | 7.0% |
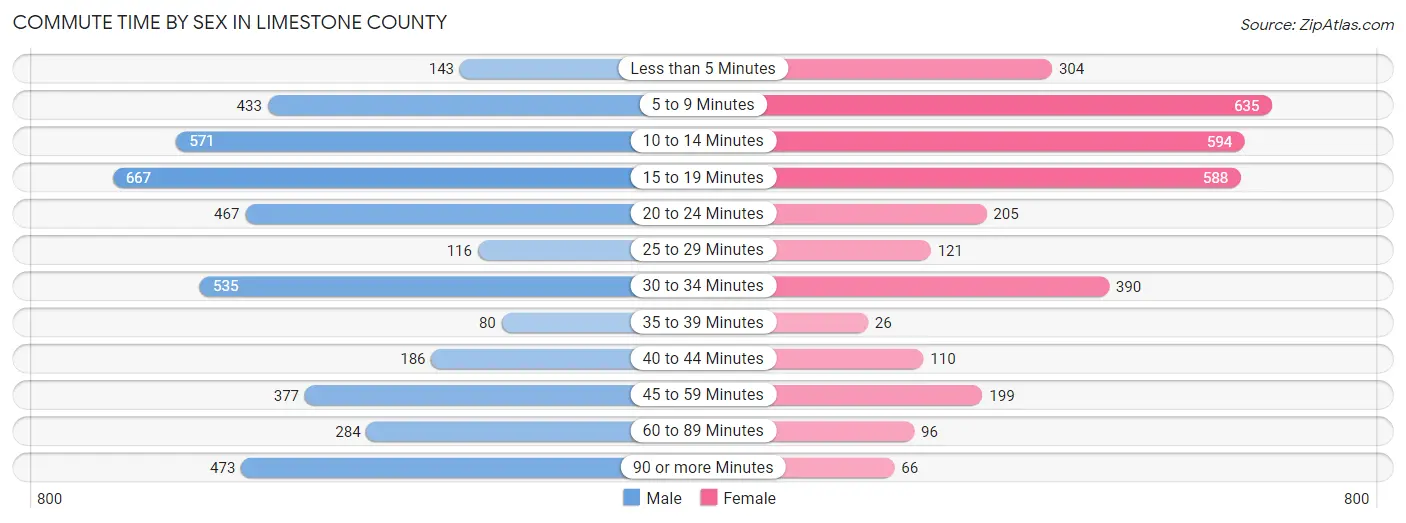
Commute Time by Sex in Limestone County
The most common commute times in Limestone County are 15 to 19 minutes (667 commuters, 15.4%) for males and 5 to 9 minutes (635 commuters, 19.1%) for females.
| Commute Time | Male | Female |
| Less than 5 Minutes | 143 (3.3%) | 304 (9.1%) |
| 5 to 9 Minutes | 433 (10.0%) | 635 (19.1%) |
| 10 to 14 Minutes | 571 (13.2%) | 594 (17.8%) |
| 15 to 19 Minutes | 667 (15.4%) | 588 (17.6%) |
| 20 to 24 Minutes | 467 (10.8%) | 205 (6.1%) |
| 25 to 29 Minutes | 116 (2.7%) | 121 (3.6%) |
| 30 to 34 Minutes | 535 (12.3%) | 390 (11.7%) |
| 35 to 39 Minutes | 80 (1.8%) | 26 (0.8%) |
| 40 to 44 Minutes | 186 (4.3%) | 110 (3.3%) |
| 45 to 59 Minutes | 377 (8.7%) | 199 (6.0%) |
| 60 to 89 Minutes | 284 (6.6%) | 96 (2.9%) |
| 90 or more Minutes | 473 (10.9%) | 66 (2.0%) |
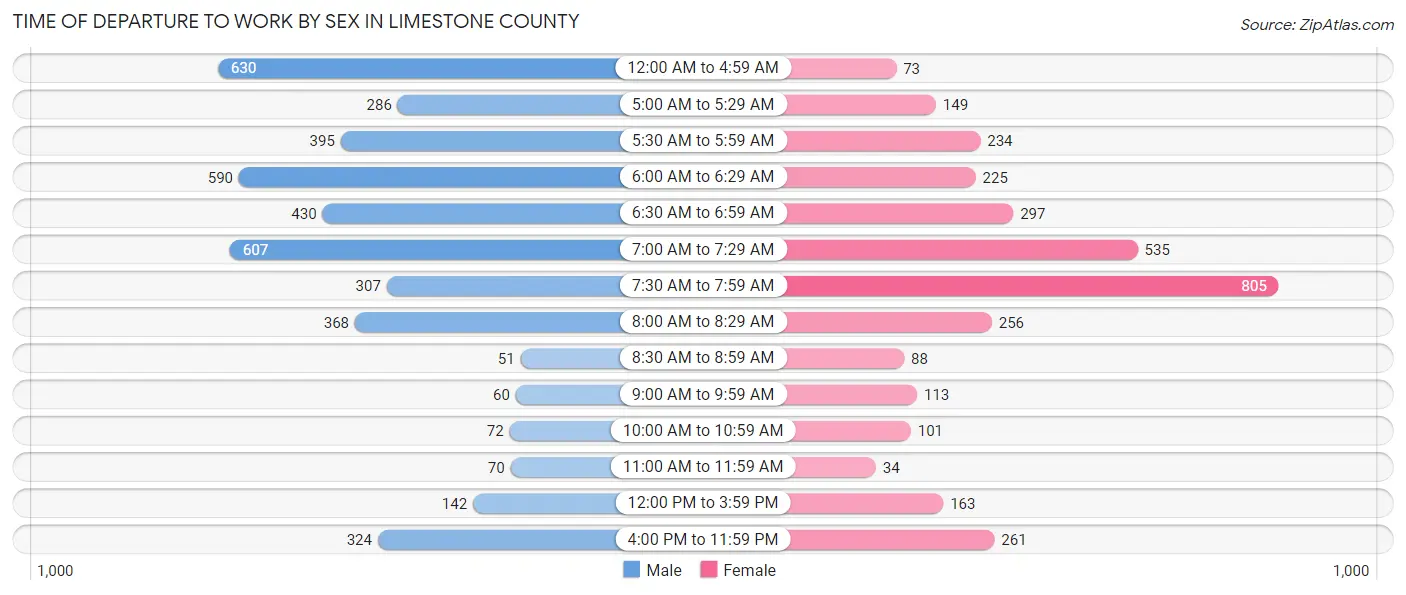
Time of Departure to Work by Sex in Limestone County
The most frequent times of departure to work in Limestone County are 12:00 AM to 4:59 AM (630, 14.5%) for males and 7:30 AM to 7:59 AM (805, 24.1%) for females.
| Time of Departure | Male | Female |
| 12:00 AM to 4:59 AM | 630 (14.5%) | 73 (2.2%) |
| 5:00 AM to 5:29 AM | 286 (6.6%) | 149 (4.5%) |
| 5:30 AM to 5:59 AM | 395 (9.1%) | 234 (7.0%) |
| 6:00 AM to 6:29 AM | 590 (13.6%) | 225 (6.8%) |
| 6:30 AM to 6:59 AM | 430 (9.9%) | 297 (8.9%) |
| 7:00 AM to 7:29 AM | 607 (14.0%) | 535 (16.1%) |
| 7:30 AM to 7:59 AM | 307 (7.1%) | 805 (24.1%) |
| 8:00 AM to 8:29 AM | 368 (8.5%) | 256 (7.7%) |
| 8:30 AM to 8:59 AM | 51 (1.2%) | 88 (2.6%) |
| 9:00 AM to 9:59 AM | 60 (1.4%) | 113 (3.4%) |
| 10:00 AM to 10:59 AM | 72 (1.7%) | 101 (3.0%) |
| 11:00 AM to 11:59 AM | 70 (1.6%) | 34 (1.0%) |
| 12:00 PM to 3:59 PM | 142 (3.3%) | 163 (4.9%) |
| 4:00 PM to 11:59 PM | 324 (7.5%) | 261 (7.8%) |
| Total | 4,332 (100.0%) | 3,334 (100.0%) |
Housing Occupancy in Limestone County
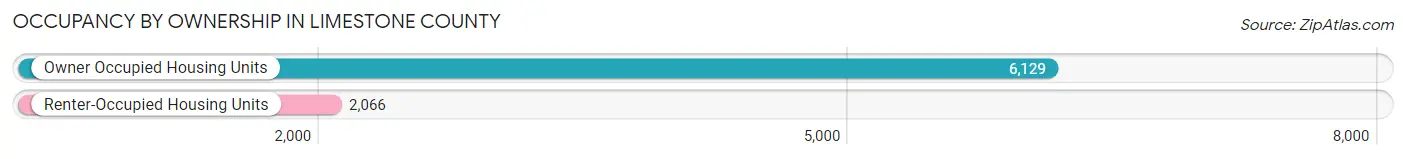
Occupancy by Ownership in Limestone County
Of the total 8,195 dwellings in Limestone County, owner-occupied units account for 6,129 (74.8%), while renter-occupied units make up 2,066 (25.2%).
| Occupancy | # Housing Units | % Housing Units |
| Owner Occupied Housing Units | 6,129 | 74.8% |
| Renter-Occupied Housing Units | 2,066 | 25.2% |
| Total Occupied Housing Units | 8,195 | 100.0% |
Occupancy by Household Size in Limestone County
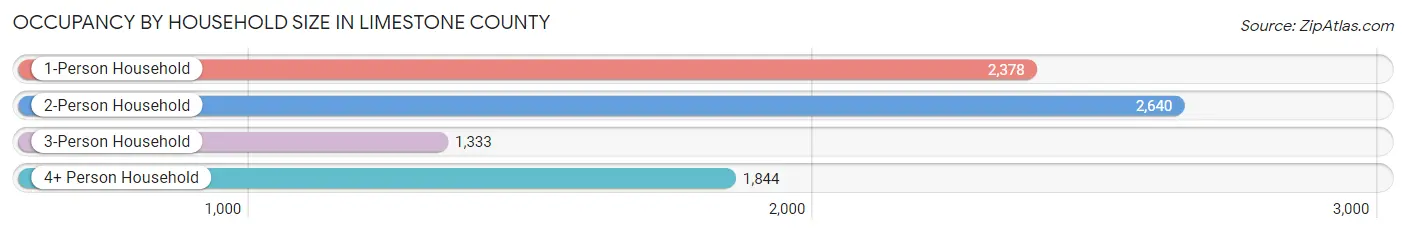
| Household Size | # Housing Units | % Housing Units |
| 1-Person Household | 2,378 | 29.0% |
| 2-Person Household | 2,640 | 32.2% |
| 3-Person Household | 1,333 | 16.3% |
| 4+ Person Household | 1,844 | 22.5% |
| Total Housing Units | 8,195 | 100.0% |
Occupancy by Ownership by Household Size in Limestone County
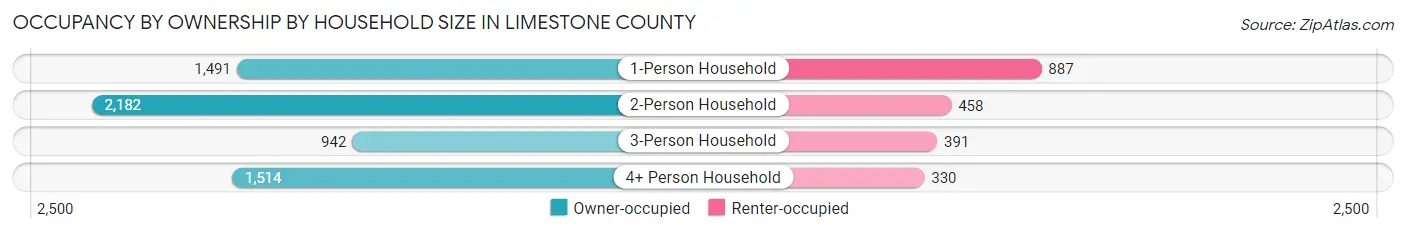
| Household Size | Owner-occupied | Renter-occupied |
| 1-Person Household | 1,491 (62.7%) | 887 (37.3%) |
| 2-Person Household | 2,182 (82.7%) | 458 (17.3%) |
| 3-Person Household | 942 (70.7%) | 391 (29.3%) |
| 4+ Person Household | 1,514 (82.1%) | 330 (17.9%) |
| Total Housing Units | 6,129 (74.8%) | 2,066 (25.2%) |
Occupancy by Educational Attainment in Limestone County
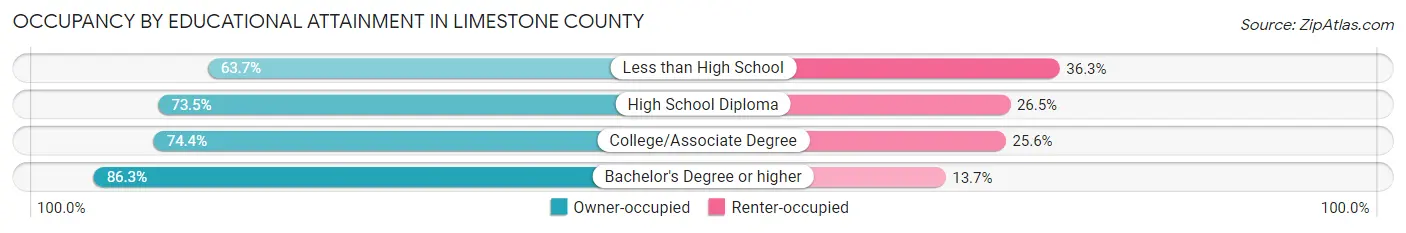
| Household Size | Owner-occupied | Renter-occupied |
| Less than High School | 733 (63.7%) | 418 (36.3%) |
| High School Diploma | 1,951 (73.5%) | 704 (26.5%) |
| College/Associate Degree | 2,136 (74.4%) | 736 (25.6%) |
| Bachelor's Degree or higher | 1,309 (86.3%) | 208 (13.7%) |
Occupancy by Age of Householder in Limestone County
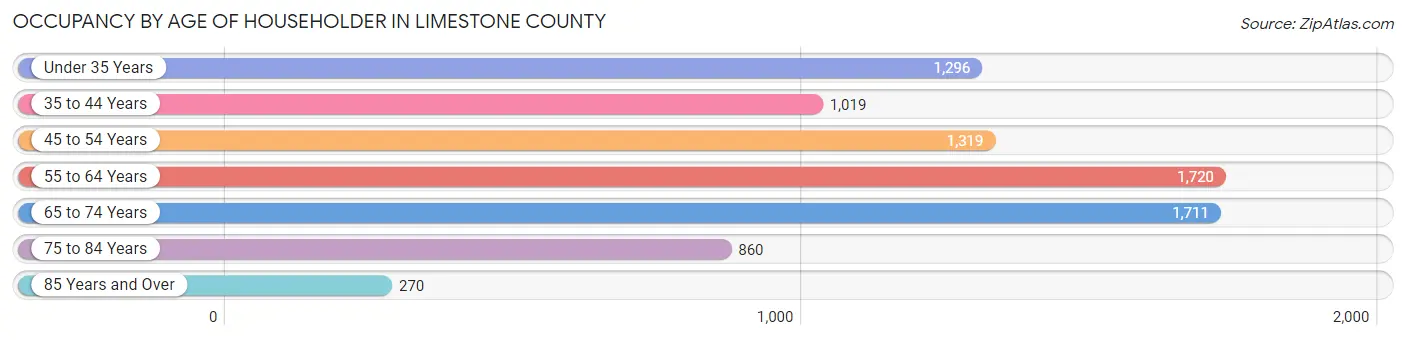
| Age Bracket | # Households | % Households |
| Under 35 Years | 1,296 | 15.8% |
| 35 to 44 Years | 1,019 | 12.4% |
| 45 to 54 Years | 1,319 | 16.1% |
| 55 to 64 Years | 1,720 | 21.0% |
| 65 to 74 Years | 1,711 | 20.9% |
| 75 to 84 Years | 860 | 10.5% |
| 85 Years and Over | 270 | 3.3% |
| Total | 8,195 | 100.0% |
Housing Finances in Limestone County
Median Income by Occupancy in Limestone County
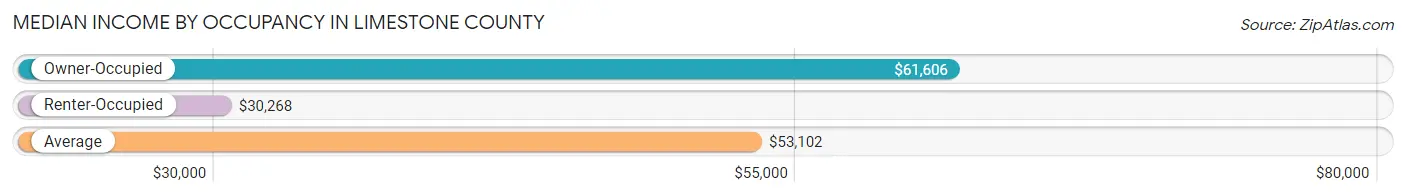
| Occupancy Type | # Households | Median Income |
| Owner-Occupied | 6,129 (74.8%) | $61,606 |
| Renter-Occupied | 2,066 (25.2%) | $30,268 |
| Average | 8,195 (100.0%) | $53,102 |
Occupancy by Householder Income Bracket in Limestone County
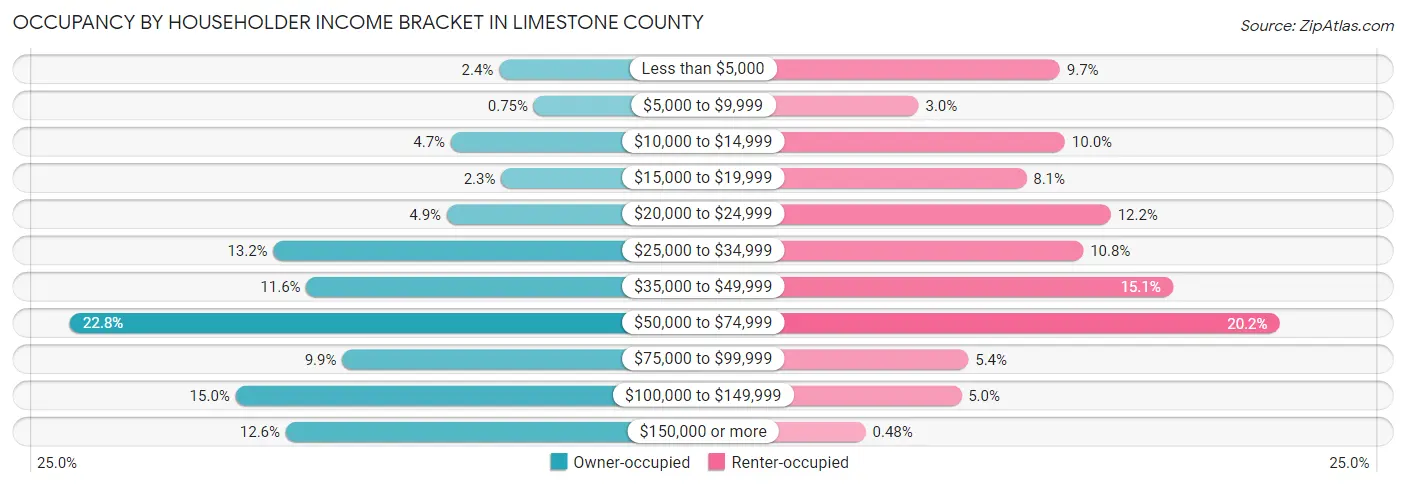
| Income Bracket | Owner-occupied | Renter-occupied |
| Less than $5,000 | 147 (2.4%) | 201 (9.7%) |
| $5,000 to $9,999 | 46 (0.7%) | 62 (3.0%) |
| $10,000 to $14,999 | 288 (4.7%) | 206 (10.0%) |
| $15,000 to $19,999 | 141 (2.3%) | 168 (8.1%) |
| $20,000 to $24,999 | 300 (4.9%) | 251 (12.1%) |
| $25,000 to $34,999 | 806 (13.2%) | 224 (10.8%) |
| $35,000 to $49,999 | 710 (11.6%) | 312 (15.1%) |
| $50,000 to $74,999 | 1,400 (22.8%) | 417 (20.2%) |
| $75,000 to $99,999 | 605 (9.9%) | 111 (5.4%) |
| $100,000 to $149,999 | 916 (14.9%) | 104 (5.0%) |
| $150,000 or more | 770 (12.6%) | 10 (0.5%) |
| Total | 6,129 (100.0%) | 2,066 (100.0%) |
Monthly Housing Cost Tiers in Limestone County
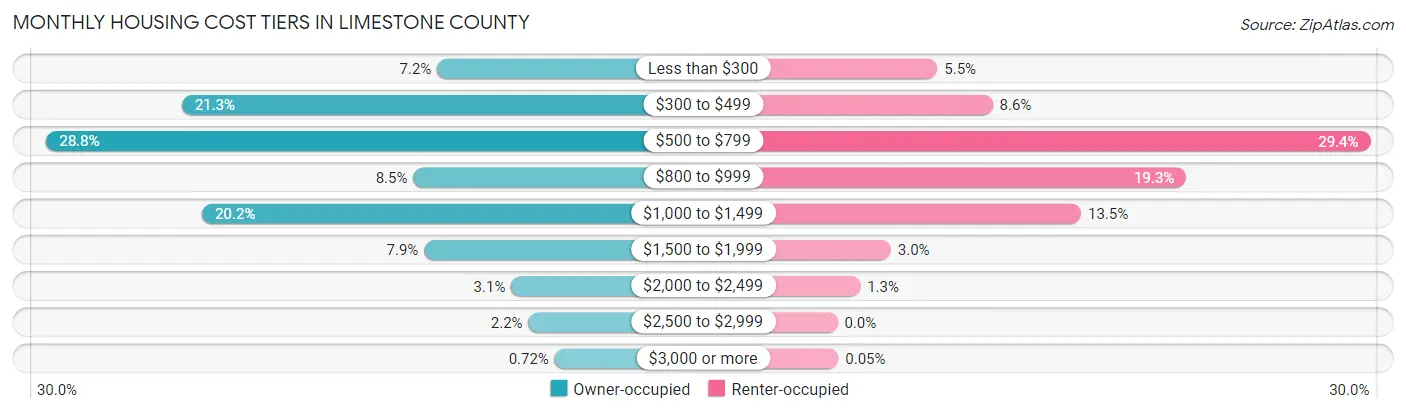
| Monthly Cost | Owner-occupied | Renter-occupied |
| Less than $300 | 442 (7.2%) | 114 (5.5%) |
| $300 to $499 | 1,307 (21.3%) | 177 (8.6%) |
| $500 to $799 | 1,765 (28.8%) | 608 (29.4%) |
| $800 to $999 | 523 (8.5%) | 398 (19.3%) |
| $1,000 to $1,499 | 1,238 (20.2%) | 278 (13.5%) |
| $1,500 to $1,999 | 486 (7.9%) | 61 (2.9%) |
| $2,000 to $2,499 | 191 (3.1%) | 26 (1.3%) |
| $2,500 to $2,999 | 133 (2.2%) | 0 (0.0%) |
| $3,000 or more | 44 (0.7%) | 1 (0.1%) |
| Total | 6,129 (100.0%) | 2,066 (100.0%) |
Physical Housing Characteristics in Limestone County
Housing Structures in Limestone County
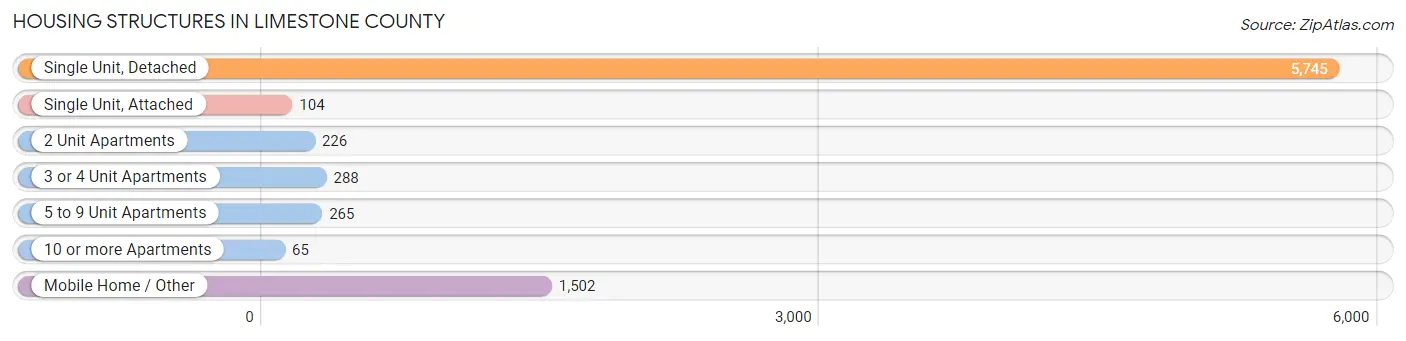
| Structure Type | # Housing Units | % Housing Units |
| Single Unit, Detached | 5,745 | 70.1% |
| Single Unit, Attached | 104 | 1.3% |
| 2 Unit Apartments | 226 | 2.8% |
| 3 or 4 Unit Apartments | 288 | 3.5% |
| 5 to 9 Unit Apartments | 265 | 3.2% |
| 10 or more Apartments | 65 | 0.8% |
| Mobile Home / Other | 1,502 | 18.3% |
| Total | 8,195 | 100.0% |
Housing Structures by Occupancy in Limestone County
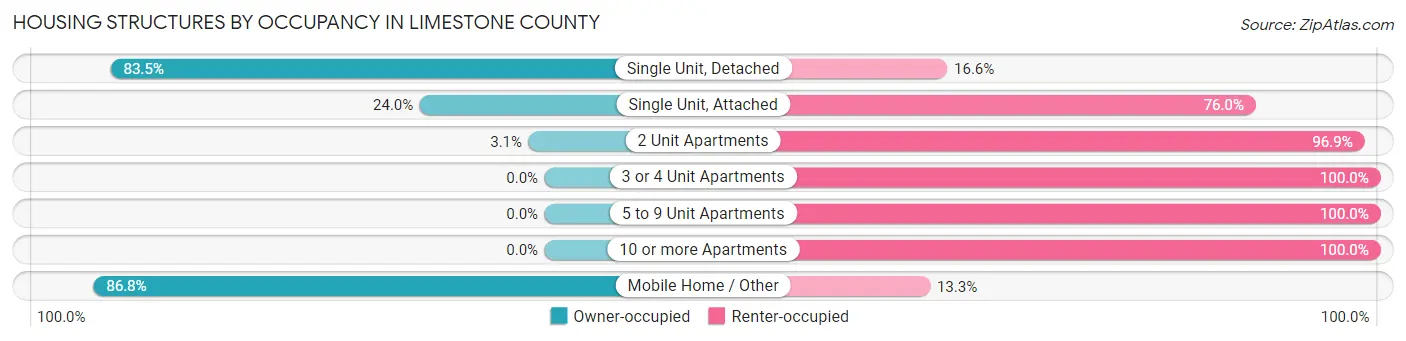
| Structure Type | Owner-occupied | Renter-occupied |
| Single Unit, Detached | 4,794 (83.5%) | 951 (16.6%) |
| Single Unit, Attached | 25 (24.0%) | 79 (76.0%) |
| 2 Unit Apartments | 7 (3.1%) | 219 (96.9%) |
| 3 or 4 Unit Apartments | 0 (0.0%) | 288 (100.0%) |
| 5 to 9 Unit Apartments | 0 (0.0%) | 265 (100.0%) |
| 10 or more Apartments | 0 (0.0%) | 65 (100.0%) |
| Mobile Home / Other | 1,303 (86.8%) | 199 (13.3%) |
| Total | 6,129 (74.8%) | 2,066 (25.2%) |
Housing Structures by Number of Rooms in Limestone County
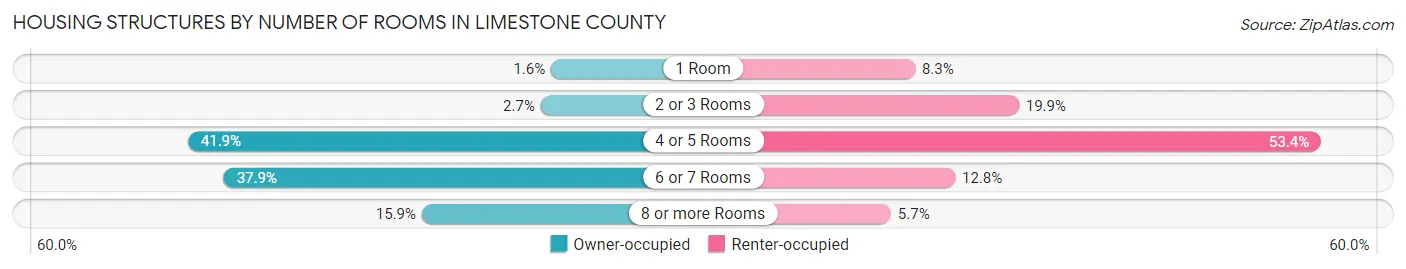
| Number of Rooms | Owner-occupied | Renter-occupied |
| 1 Room | 96 (1.6%) | 172 (8.3%) |
| 2 or 3 Rooms | 167 (2.7%) | 410 (19.9%) |
| 4 or 5 Rooms | 2,567 (41.9%) | 1,103 (53.4%) |
| 6 or 7 Rooms | 2,323 (37.9%) | 264 (12.8%) |
| 8 or more Rooms | 976 (15.9%) | 117 (5.7%) |
| Total | 6,129 (100.0%) | 2,066 (100.0%) |
Housing Structure by Heating Type in Limestone County
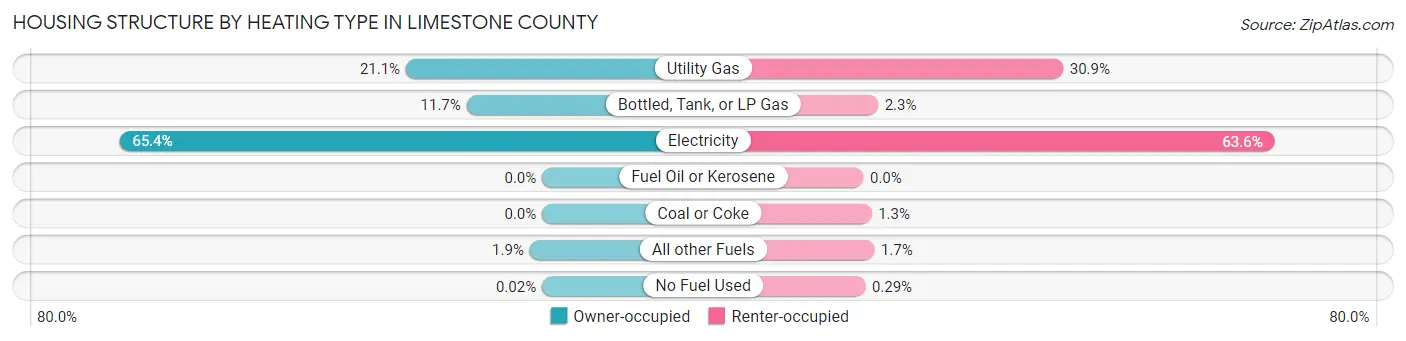
| Heating Type | Owner-occupied | Renter-occupied |
| Utility Gas | 1,290 (21.0%) | 638 (30.9%) |
| Bottled, Tank, or LP Gas | 715 (11.7%) | 47 (2.3%) |
| Electricity | 4,006 (65.4%) | 1,314 (63.6%) |
| Fuel Oil or Kerosene | 0 (0.0%) | 0 (0.0%) |
| Coal or Coke | 0 (0.0%) | 26 (1.3%) |
| All other Fuels | 117 (1.9%) | 35 (1.7%) |
| No Fuel Used | 1 (0.0%) | 6 (0.3%) |
| Total | 6,129 (100.0%) | 2,066 (100.0%) |
Household Vehicle Usage in Limestone County
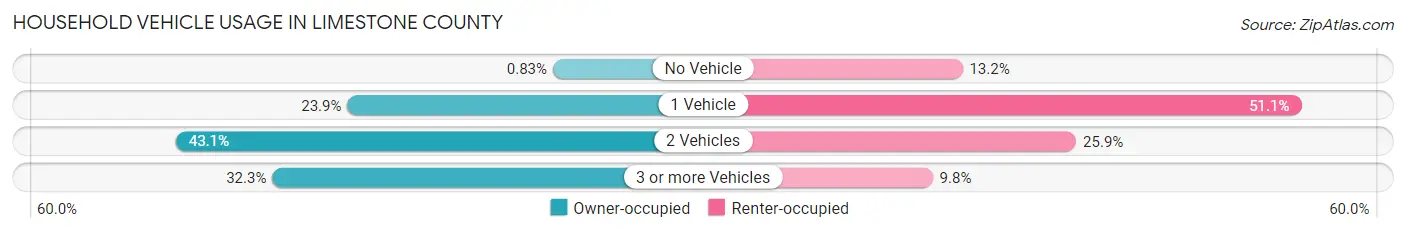
| Vehicles per Household | Owner-occupied | Renter-occupied |
| No Vehicle | 51 (0.8%) | 272 (13.2%) |
| 1 Vehicle | 1,462 (23.8%) | 1,056 (51.1%) |
| 2 Vehicles | 2,639 (43.1%) | 535 (25.9%) |
| 3 or more Vehicles | 1,977 (32.3%) | 203 (9.8%) |
| Total | 6,129 (100.0%) | 2,066 (100.0%) |
Real Estate & Mortgages in Limestone County
Real Estate and Mortgage Overview in Limestone County
| Characteristic | Without Mortgage | With Mortgage |
| Housing Units | 3,992 | 2,137 |
| Median Property Value | $122,000 | $149,500 |
| Median Household Income | $55,115 | $399 |
| Monthly Housing Costs | $546 | $29 |
| Real Estate Taxes | $1,649 | $142 |
Property Value by Mortgage Status in Limestone County
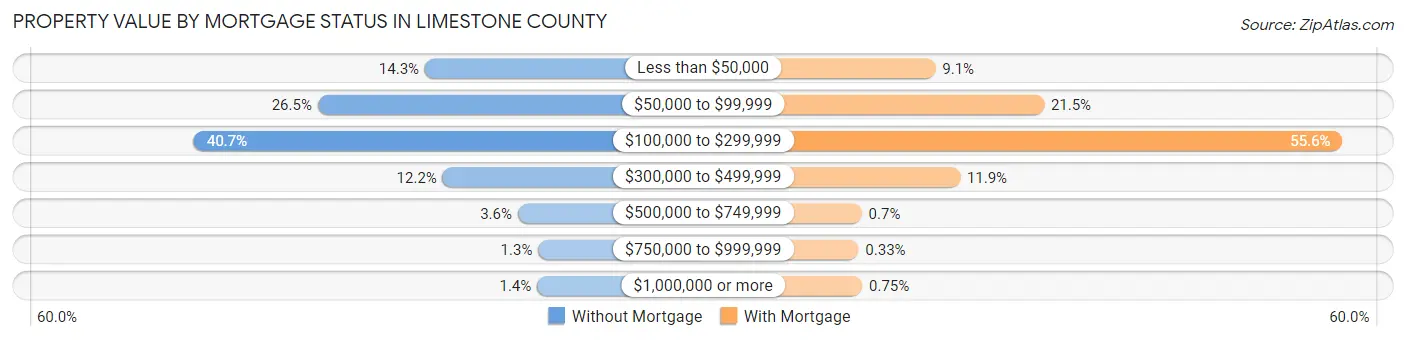
| Property Value | Without Mortgage | With Mortgage |
| Less than $50,000 | 569 (14.2%) | 195 (9.1%) |
| $50,000 to $99,999 | 1,058 (26.5%) | 460 (21.5%) |
| $100,000 to $299,999 | 1,623 (40.7%) | 1,189 (55.6%) |
| $300,000 to $499,999 | 488 (12.2%) | 255 (11.9%) |
| $500,000 to $749,999 | 145 (3.6%) | 15 (0.7%) |
| $750,000 to $999,999 | 52 (1.3%) | 7 (0.3%) |
| $1,000,000 or more | 57 (1.4%) | 16 (0.7%) |
| Total | 3,992 (100.0%) | 2,137 (100.0%) |
Household Income by Mortgage Status in Limestone County
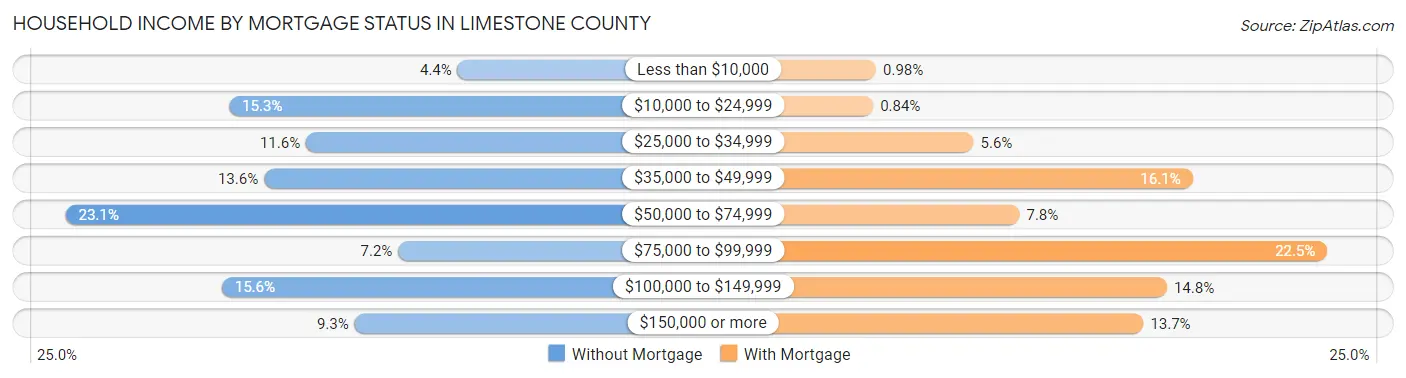
| Household Income | Without Mortgage | With Mortgage |
| Less than $10,000 | 175 (4.4%) | 21 (1.0%) |
| $10,000 to $24,999 | 609 (15.3%) | 18 (0.8%) |
| $25,000 to $34,999 | 463 (11.6%) | 120 (5.6%) |
| $35,000 to $49,999 | 543 (13.6%) | 343 (16.1%) |
| $50,000 to $74,999 | 920 (23.1%) | 167 (7.8%) |
| $75,000 to $99,999 | 288 (7.2%) | 480 (22.5%) |
| $100,000 to $149,999 | 623 (15.6%) | 317 (14.8%) |
| $150,000 or more | 371 (9.3%) | 293 (13.7%) |
| Total | 3,992 (100.0%) | 2,137 (100.0%) |
Property Value to Household Income Ratio in Limestone County
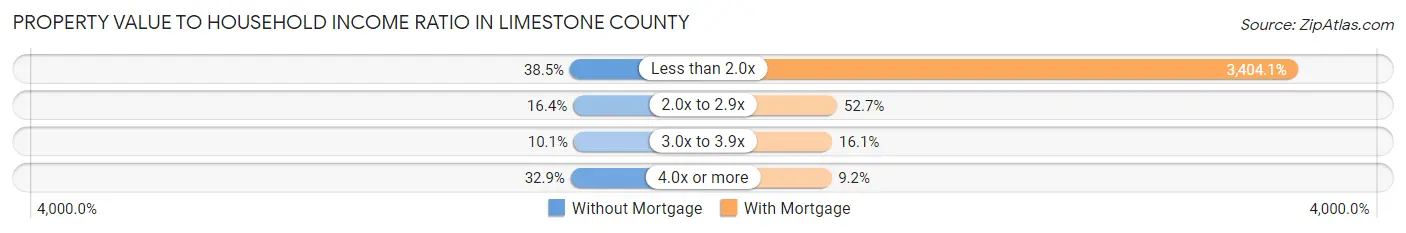
| Value-to-Income Ratio | Without Mortgage | With Mortgage |
| Less than 2.0x | 1,535 (38.5%) | 72,746 (3,404.1%) |
| 2.0x to 2.9x | 653 (16.4%) | 1,127 (52.7%) |
| 3.0x to 3.9x | 403 (10.1%) | 345 (16.1%) |
| 4.0x or more | 1,314 (32.9%) | 197 (9.2%) |
| Total | 3,992 (100.0%) | 2,137 (100.0%) |
Real Estate Taxes by Mortgage Status in Limestone County
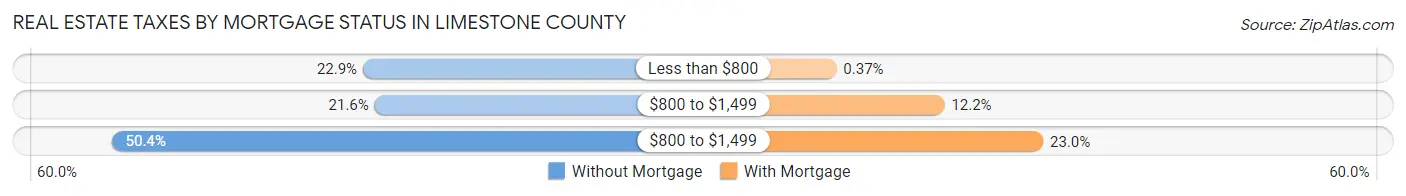
| Property Taxes | Without Mortgage | With Mortgage |
| Less than $800 | 915 (22.9%) | 8 (0.4%) |
| $800 to $1,499 | 864 (21.6%) | 261 (12.2%) |
| $800 to $1,499 | 2,010 (50.3%) | 492 (23.0%) |
| Total | 3,992 (100.0%) | 2,137 (100.0%) |
Health & Disability in Limestone County
Health Insurance Coverage by Age in Limestone County
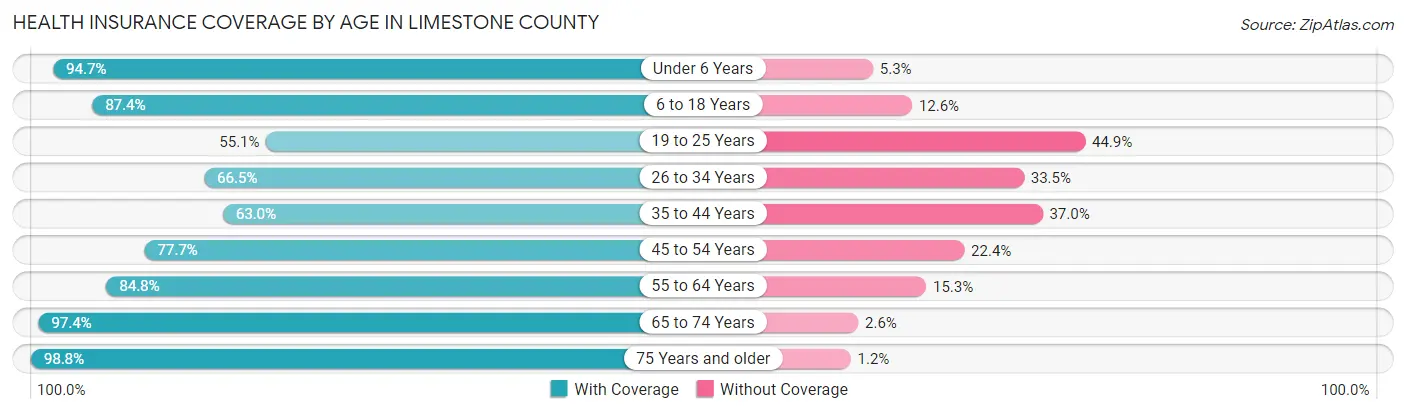
| Age Bracket | With Coverage | Without Coverage |
| Under 6 Years | 1,617 (94.7%) | 91 (5.3%) |
| 6 to 18 Years | 2,998 (87.4%) | 433 (12.6%) |
| 19 to 25 Years | 1,010 (55.1%) | 823 (44.9%) |
| 26 to 34 Years | 1,475 (66.5%) | 742 (33.5%) |
| 35 to 44 Years | 1,496 (63.0%) | 877 (37.0%) |
| 45 to 54 Years | 2,098 (77.6%) | 604 (22.4%) |
| 55 to 64 Years | 2,550 (84.8%) | 459 (15.2%) |
| 65 to 74 Years | 2,532 (97.4%) | 67 (2.6%) |
| 75 Years and older | 1,607 (98.8%) | 19 (1.2%) |
| Total | 17,383 (80.9%) | 4,115 (19.1%) |
Health Insurance Coverage by Citizenship Status in Limestone County
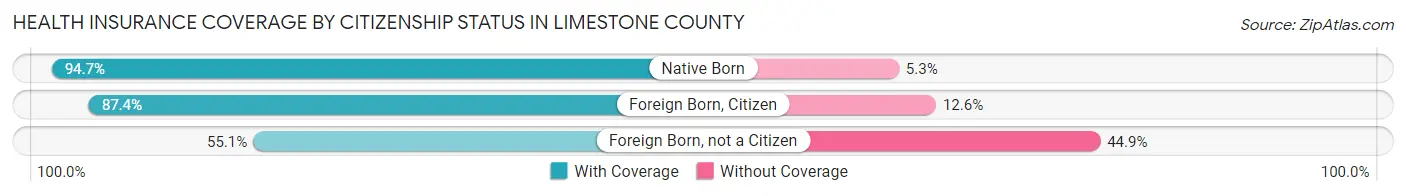
| Citizenship Status | With Coverage | Without Coverage |
| Native Born | 1,617 (94.7%) | 91 (5.3%) |
| Foreign Born, Citizen | 2,998 (87.4%) | 433 (12.6%) |
| Foreign Born, not a Citizen | 1,010 (55.1%) | 823 (44.9%) |
Health Insurance Coverage by Household Income in Limestone County
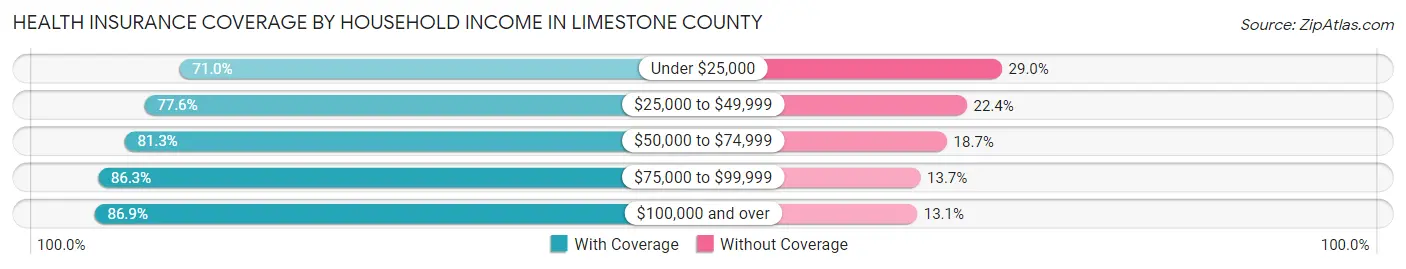
| Household Income | With Coverage | Without Coverage |
| Under $25,000 | 2,402 (71.0%) | 981 (29.0%) |
| $25,000 to $49,999 | 3,836 (77.6%) | 1,110 (22.4%) |
| $50,000 to $74,999 | 3,859 (81.3%) | 888 (18.7%) |
| $75,000 to $99,999 | 1,860 (86.3%) | 296 (13.7%) |
| $100,000 and over | 5,267 (86.9%) | 795 (13.1%) |
Public vs Private Health Insurance Coverage by Age in Limestone County
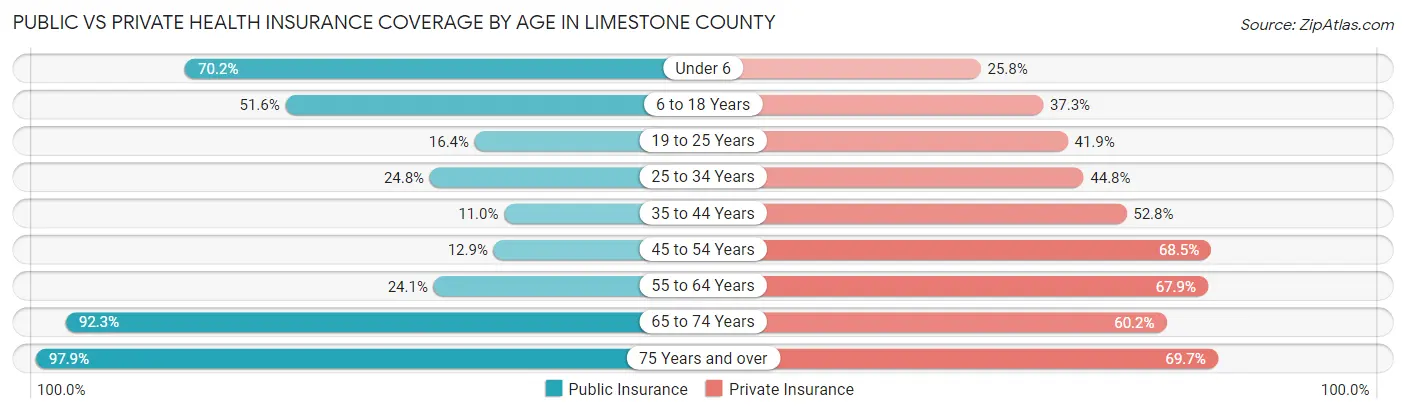
| Age Bracket | Public Insurance | Private Insurance |
| Under 6 | 1,199 (70.2%) | 440 (25.8%) |
| 6 to 18 Years | 1,769 (51.6%) | 1,281 (37.3%) |
| 19 to 25 Years | 301 (16.4%) | 768 (41.9%) |
| 25 to 34 Years | 549 (24.8%) | 994 (44.8%) |
| 35 to 44 Years | 260 (11.0%) | 1,253 (52.8%) |
| 45 to 54 Years | 349 (12.9%) | 1,852 (68.5%) |
| 55 to 64 Years | 724 (24.1%) | 2,044 (67.9%) |
| 65 to 74 Years | 2,400 (92.3%) | 1,565 (60.2%) |
| 75 Years and over | 1,592 (97.9%) | 1,134 (69.7%) |
| Total | 9,143 (42.5%) | 11,331 (52.7%) |
Disability Status by Sex by Age in Limestone County
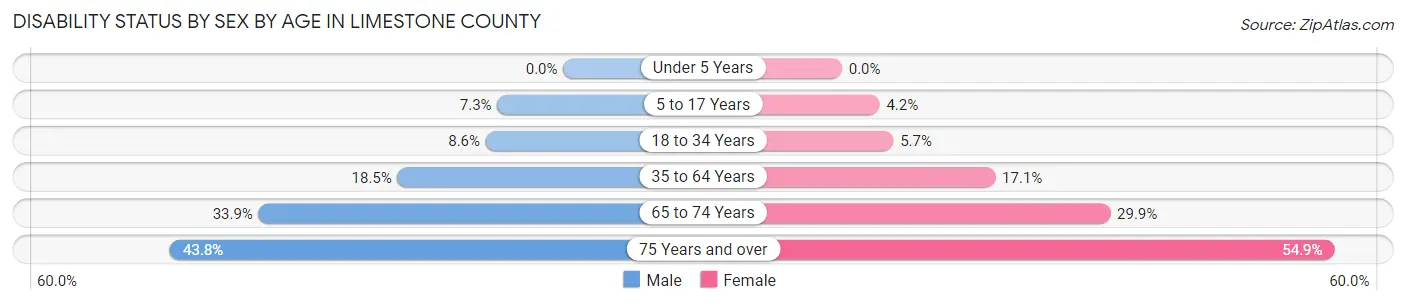
| Age Bracket | Male | Female |
| Under 5 Years | 0 (0.0%) | 0 (0.0%) |
| 5 to 17 Years | 143 (7.3%) | 71 (4.2%) |
| 18 to 34 Years | 194 (8.6%) | 115 (5.7%) |
| 35 to 64 Years | 752 (18.5%) | 685 (17.1%) |
| 65 to 74 Years | 414 (33.9%) | 412 (29.9%) |
| 75 Years and over | 301 (43.8%) | 515 (54.8%) |
Disability Class by Sex by Age in Limestone County
Disability Class: Hearing Difficulty
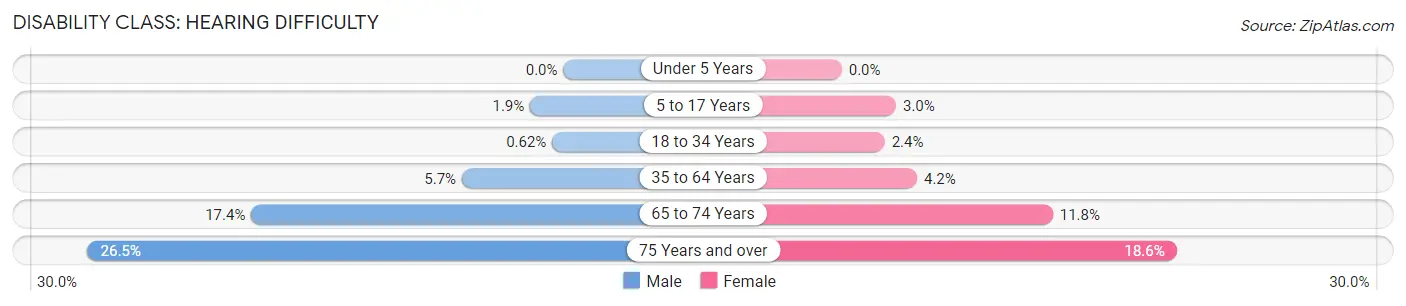
| Age Bracket | Male | Female |
| Under 5 Years | 0 (0.0%) | 0 (0.0%) |
| 5 to 17 Years | 36 (1.8%) | 51 (3.0%) |
| 18 to 34 Years | 14 (0.6%) | 48 (2.4%) |
| 35 to 64 Years | 230 (5.7%) | 168 (4.2%) |
| 65 to 74 Years | 212 (17.4%) | 162 (11.7%) |
| 75 Years and over | 182 (26.5%) | 175 (18.6%) |
Disability Class: Vision Difficulty
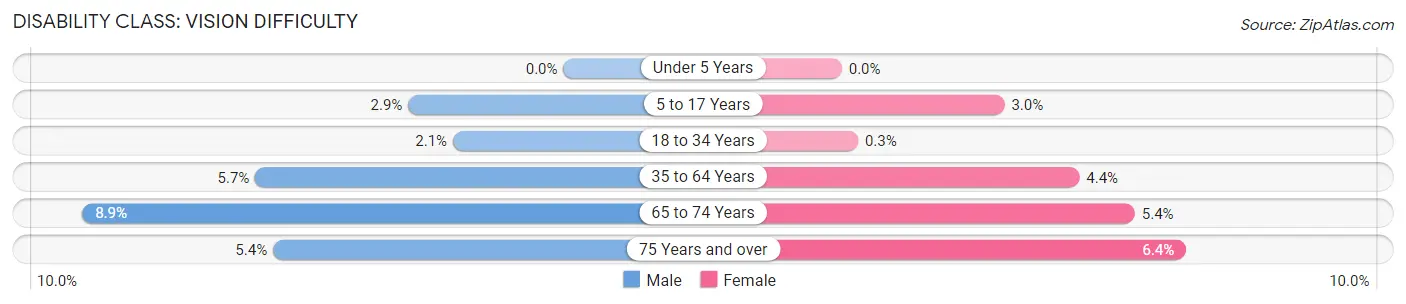
| Age Bracket | Male | Female |
| Under 5 Years | 0 (0.0%) | 0 (0.0%) |
| 5 to 17 Years | 56 (2.9%) | 51 (3.0%) |
| 18 to 34 Years | 46 (2.1%) | 6 (0.3%) |
| 35 to 64 Years | 233 (5.7%) | 177 (4.4%) |
| 65 to 74 Years | 109 (8.9%) | 75 (5.4%) |
| 75 Years and over | 37 (5.4%) | 60 (6.4%) |
Disability Class: Cognitive Difficulty
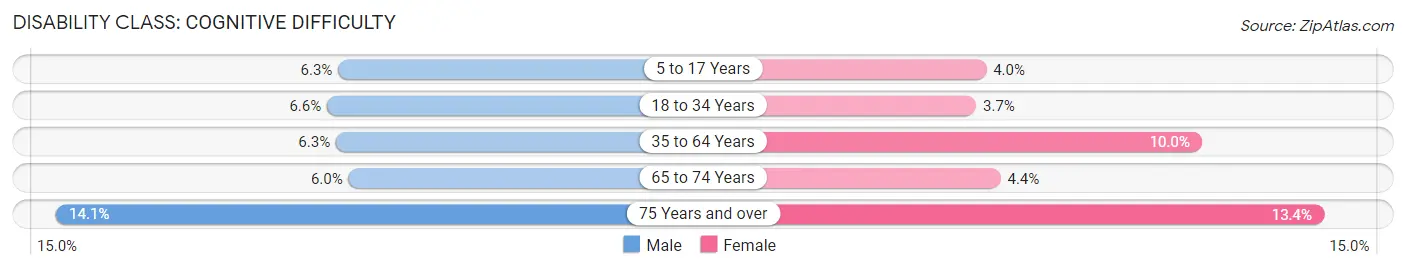
| Age Bracket | Male | Female |
| 5 to 17 Years | 122 (6.3%) | 68 (4.0%) |
| 18 to 34 Years | 148 (6.6%) | 75 (3.7%) |
| 35 to 64 Years | 258 (6.3%) | 402 (10.0%) |
| 65 to 74 Years | 73 (6.0%) | 61 (4.4%) |
| 75 Years and over | 97 (14.1%) | 126 (13.4%) |
Disability Class: Ambulatory Difficulty
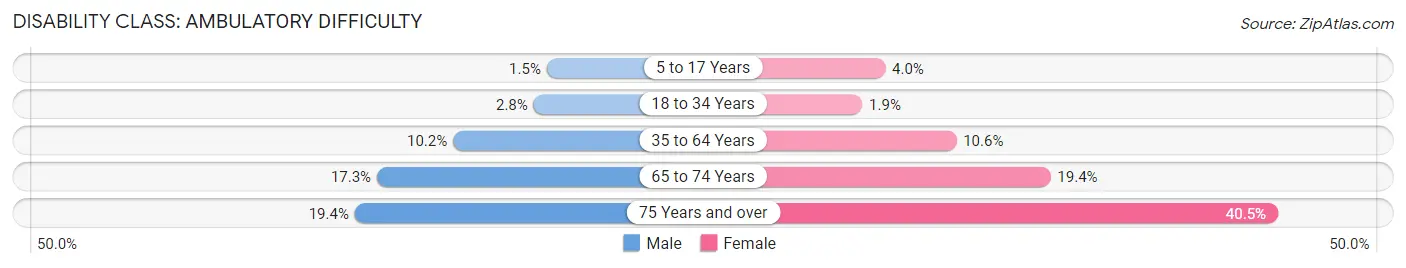
| Age Bracket | Male | Female |
| 5 to 17 Years | 30 (1.5%) | 68 (4.0%) |
| 18 to 34 Years | 62 (2.8%) | 38 (1.9%) |
| 35 to 64 Years | 417 (10.2%) | 426 (10.6%) |
| 65 to 74 Years | 211 (17.3%) | 267 (19.4%) |
| 75 Years and over | 133 (19.4%) | 380 (40.5%) |
Disability Class: Self-Care Difficulty
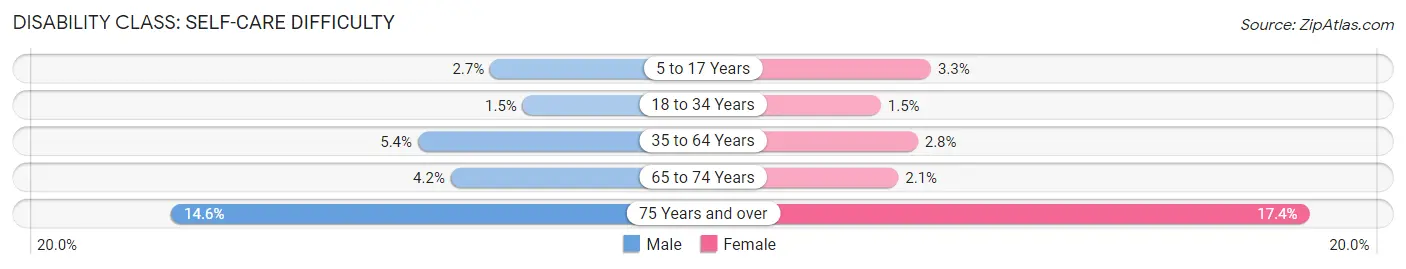
| Age Bracket | Male | Female |
| 5 to 17 Years | 53 (2.7%) | 56 (3.3%) |
| 18 to 34 Years | 34 (1.5%) | 29 (1.5%) |
| 35 to 64 Years | 220 (5.4%) | 113 (2.8%) |
| 65 to 74 Years | 51 (4.2%) | 29 (2.1%) |
| 75 Years and over | 100 (14.6%) | 163 (17.4%) |
Technology Access in Limestone County
Computing Device Access in Limestone County
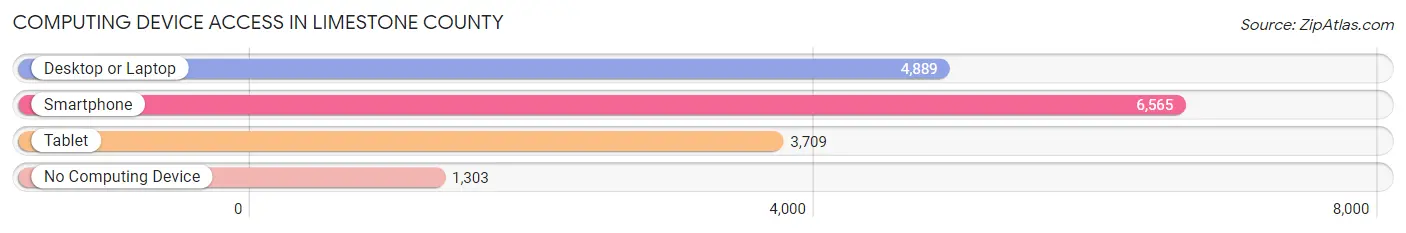
| Device Type | # Households | % Households |
| Desktop or Laptop | 4,889 | 59.7% |
| Smartphone | 6,565 | 80.1% |
| Tablet | 3,709 | 45.3% |
| No Computing Device | 1,303 | 15.9% |
| Total | 8,195 | 100.0% |
Internet Access in Limestone County
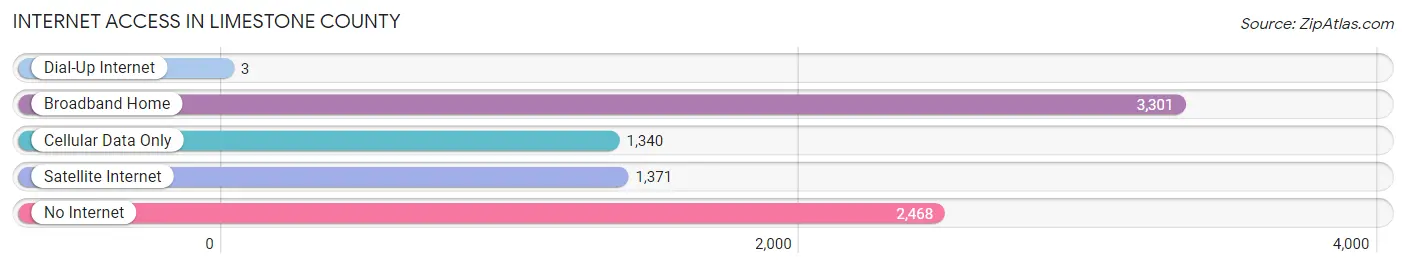
| Internet Type | # Households | % Households |
| Dial-Up Internet | 3 | 0.0% |
| Broadband Home | 3,301 | 40.3% |
| Cellular Data Only | 1,340 | 16.4% |
| Satellite Internet | 1,371 | 16.7% |
| No Internet | 2,468 | 30.1% |
| Total | 8,195 | 100.0% |
Limestone County Summary
Limestone County is located in the east-central part of Texas, and is part of the Waco Metropolitan Statistical Area. The county is bordered by Freestone County to the north, Leon County to the east, Madison County to the south, and McLennan County to the west. The county seat is Groesbeck, and the largest city is Mexia.
History
Limestone County was established in 1846, and was named for the limestone formations in the area. The county was originally part of Robertson County, and was later divided into Limestone and Freestone counties. The first settlers in the area were primarily of German and Irish descent.
The county was home to several Native American tribes, including the Tonkawa, Comanche, and Caddo. The first European settlers arrived in the area in the early 1800s, and the county was officially organized in 1846.
The county was home to several Civil War battles, including the Battle of Limestone Station in 1862. The county was also home to several Confederate camps, including Camp Groesbeck and Camp Mexia.
Geography
Limestone County covers an area of 890 square miles, and is located in the east-central part of Texas. The county is bordered by Freestone County to the north, Leon County to the east, Madison County to the south, and McLennan County to the west.
The county is mostly flat, with some rolling hills in the western part of the county. The county is drained by the Navasota River, which flows through the county from north to south. The county is also home to several small lakes, including Lake Mexia and Lake Limestone.
Economy
The economy of Limestone County is largely based on agriculture and oil and gas production. The county is home to several large farms, and is a major producer of cotton, corn, and hay. The county is also home to several oil and gas fields, and is a major producer of natural gas.
The county is also home to several manufacturing companies, including a paper mill and a steel mill. The county is also home to several retail stores, restaurants, and other businesses.
Demographics
As of the 2010 census, the population of Limestone County was 23,384. The population is largely white (83.3%), with small percentages of African American (10.2%), Hispanic (4.2%), and Asian (1.2%) residents.
The median household income in the county is $41,945, and the median family income is $50,945. The per capita income in the county is $20,845. The unemployment rate in the county is 4.2%.
Conclusion
Limestone County is located in the east-central part of Texas, and is part of the Waco Metropolitan Statistical Area. The county was established in 1846, and was named for the limestone formations in the area. The economy of the county is largely based on agriculture and oil and gas production, and the population is largely white. The county is home to several large farms, manufacturing companies, and retail stores, and the median household income is $41,945.
Common Questions
What is Per Capita Income in Limestone County?
Per Capita income in Limestone County is $26,479.
What is the Median Family Income in Limestone County?
Median Family Income in Limestone County is $63,788.
What is the Median Household income in Limestone County?
Median Household Income in Limestone County is $53,102.
What is Income or Wage Gap in Limestone County?
Income or Wage Gap in Limestone County is 24.1%.
Women in Limestone County earn 75.9 cents for every dollar earned by a man.
What is Family Income Deficit in Limestone County?
Family Income Deficit in Limestone County is $8,451.
Families that are below poverty line in Limestone County earn $8,451 less on average than the poverty threshold level.
What is Inequality or Gini Index in Limestone County?
Inequality or Gini Index in Limestone County is 0.44.
What is the Total Population of Limestone County?
Total Population of Limestone County is 22,222.
What is the Total Male Population of Limestone County?
Total Male Population of Limestone County is 11,315.
What is the Total Female Population of Limestone County?
Total Female Population of Limestone County is 10,907.
What is the Ratio of Males per 100 Females in Limestone County?
There are 103.74 Males per 100 Females in Limestone County.
What is the Ratio of Females per 100 Males in Limestone County?
There are 96.39 Females per 100 Males in Limestone County.
What is the Median Population Age in Limestone County?
Median Population Age in Limestone County is 42.0 Years.
What is the Average Family Size in Limestone County
Average Family Size in Limestone County is 3.2 People.
What is the Average Household Size in Limestone County
Average Household Size in Limestone County is 2.6 People.
How Large is the Labor Force in Limestone County?
There are 8,450 People in the Labor Forcein in Limestone County.
What is the Percentage of People in the Labor Force in Limestone County?
47.5% of People are in the Labor Force in Limestone County.
What is the Unemployment Rate in Limestone County?
Unemployment Rate in Limestone County is 3.6%.