Liberty County, TX Map & Demographics
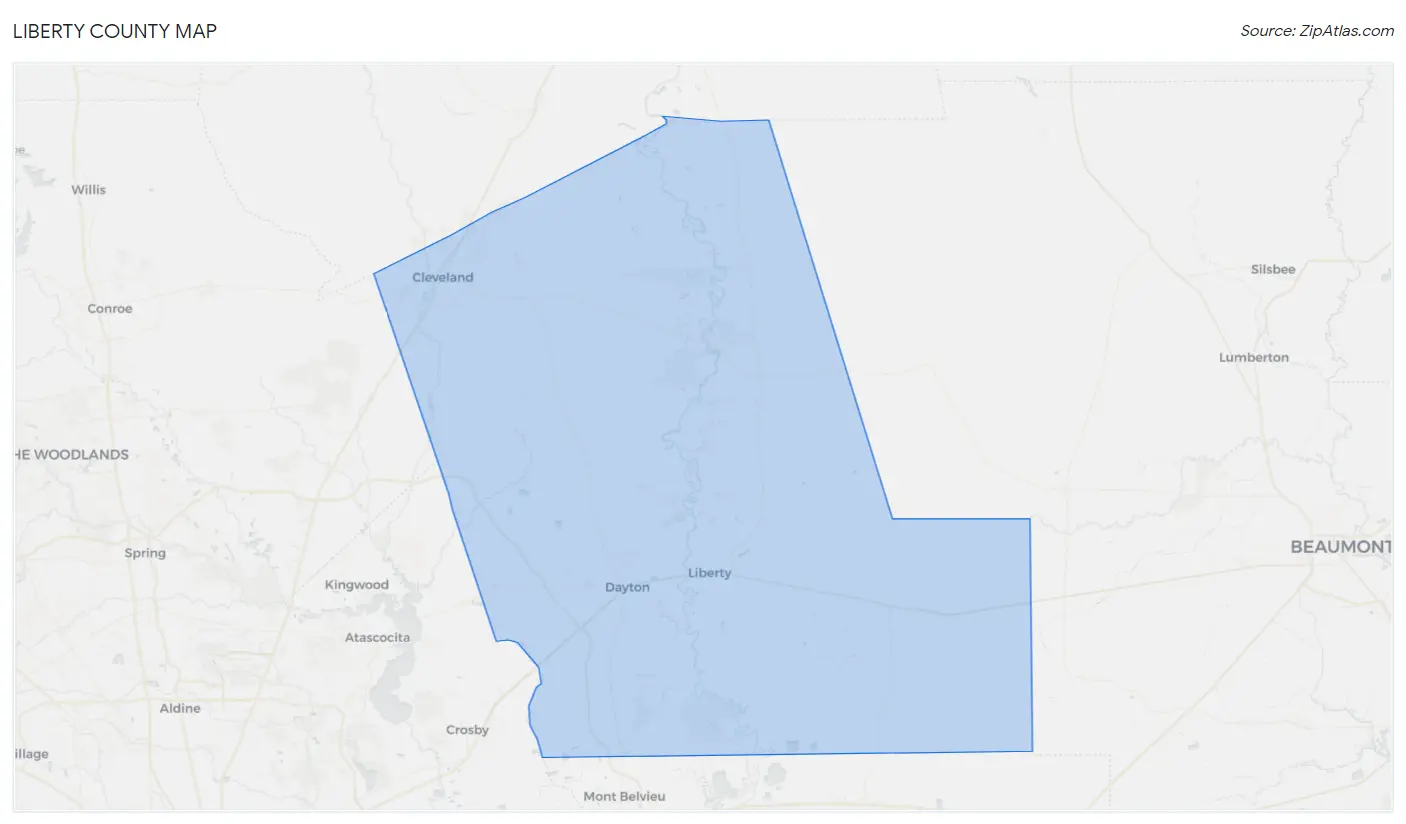
Liberty County Map
Liberty County Overview
$25,667
PER CAPITA INCOME
$71,529
AVG FAMILY INCOME
$59,605
AVG HOUSEHOLD INCOME
41.1%
WAGE / INCOME GAP [ % ]
58.9¢/ $1
WAGE / INCOME GAP [ $ ]
$10,625
FAMILY INCOME DEFICIT
0.45
INEQUALITY / GINI INDEX
93,523
TOTAL POPULATION
46,504
MALE POPULATION
47,019
FEMALE POPULATION
98.90
MALES / 100 FEMALES
101.11
FEMALES / 100 MALES
34.1
MEDIAN AGE
3.6
AVG FAMILY SIZE
3.0
AVG HOUSEHOLD SIZE
36,255
LABOR FORCE [ PEOPLE ]
51.6%
PERCENT IN LABOR FORCE
6.9%
UNEMPLOYMENT RATE
Income in Liberty County
Income Overview in Liberty County
Per Capita Income in Liberty County is $25,667, while median incomes of families and households are $71,529 and $59,605 respectively.
| Characteristic | Number | Measure |
| Per Capita Income | 93,523 | $25,667 |
| Median Family Income | 20,648 | $71,529 |
| Mean Family Income | 20,648 | $91,132 |
| Median Household Income | 28,921 | $59,605 |
| Mean Household Income | 28,921 | $80,392 |
| Income Deficit | 20,648 | $10,625 |
| Wage / Income Gap (%) | 93,523 | 41.07% |
| Wage / Income Gap ($) | 93,523 | 58.93¢ per $1 |
| Gini / Inequality Index | 93,523 | 0.45 |
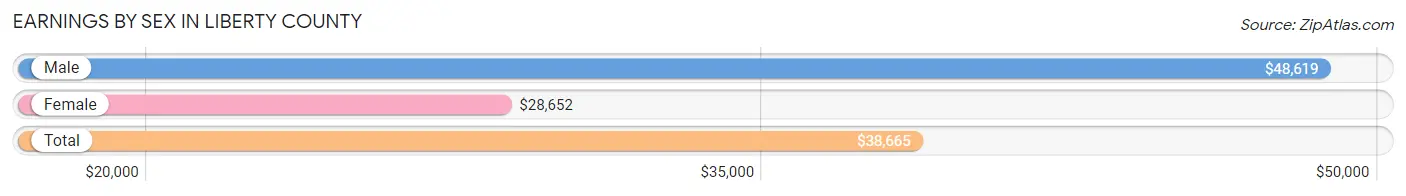
Earnings by Sex in Liberty County
Average Earnings in Liberty County are $38,665, $48,619 for men and $28,652 for women, a difference of 41.1%.
| Sex | Number | Average Earnings |
| Male | 22,729 (58.8%) | $48,619 |
| Female | 15,935 (41.2%) | $28,652 |
| Total | 38,664 (100.0%) | $38,665 |
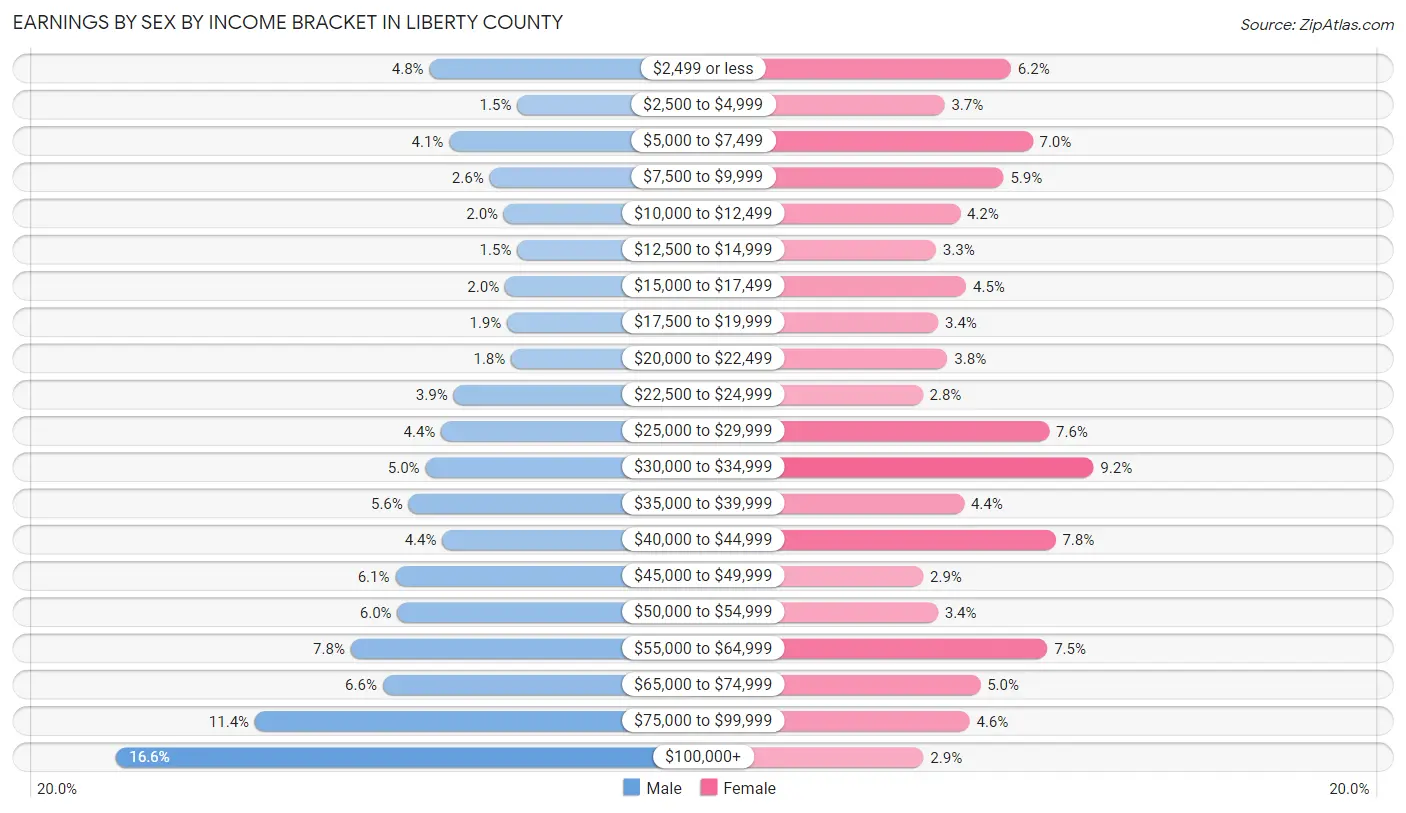
Earnings by Sex by Income Bracket in Liberty County
The most common earnings brackets in Liberty County are $100,000+ for men (3,765 | 16.6%) and $30,000 to $34,999 for women (1,473 | 9.2%).
| Income | Male | Female |
| $2,499 or less | 1,098 (4.8%) | 980 (6.1%) |
| $2,500 to $4,999 | 349 (1.5%) | 584 (3.7%) |
| $5,000 to $7,499 | 929 (4.1%) | 1,109 (7.0%) |
| $7,500 to $9,999 | 587 (2.6%) | 936 (5.9%) |
| $10,000 to $12,499 | 464 (2.0%) | 675 (4.2%) |
| $12,500 to $14,999 | 350 (1.5%) | 532 (3.3%) |
| $15,000 to $17,499 | 454 (2.0%) | 712 (4.5%) |
| $17,500 to $19,999 | 437 (1.9%) | 545 (3.4%) |
| $20,000 to $22,499 | 403 (1.8%) | 600 (3.8%) |
| $22,500 to $24,999 | 894 (3.9%) | 452 (2.8%) |
| $25,000 to $29,999 | 998 (4.4%) | 1,208 (7.6%) |
| $30,000 to $34,999 | 1,132 (5.0%) | 1,473 (9.2%) |
| $35,000 to $39,999 | 1,274 (5.6%) | 700 (4.4%) |
| $40,000 to $44,999 | 988 (4.3%) | 1,246 (7.8%) |
| $45,000 to $49,999 | 1,388 (6.1%) | 456 (2.9%) |
| $50,000 to $54,999 | 1,370 (6.0%) | 544 (3.4%) |
| $55,000 to $64,999 | 1,769 (7.8%) | 1,197 (7.5%) |
| $65,000 to $74,999 | 1,495 (6.6%) | 796 (5.0%) |
| $75,000 to $99,999 | 2,585 (11.4%) | 733 (4.6%) |
| $100,000+ | 3,765 (16.6%) | 457 (2.9%) |
| Total | 22,729 (100.0%) | 15,935 (100.0%) |
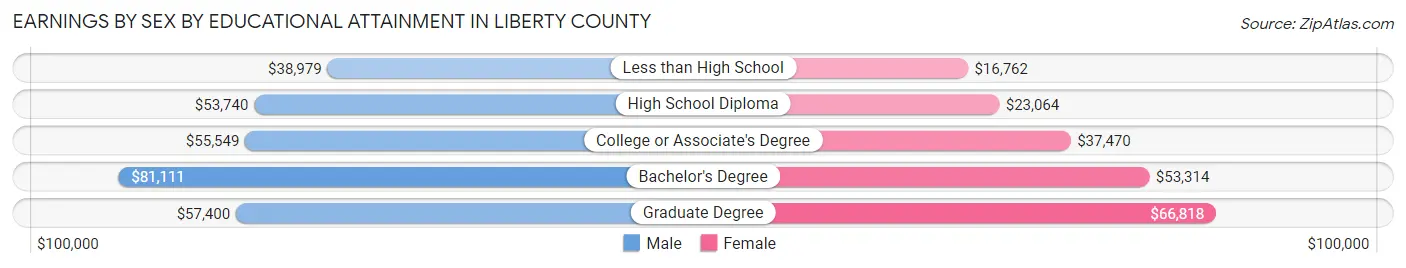
Earnings by Sex by Educational Attainment in Liberty County
Average earnings in Liberty County are $52,602 for men and $30,336 for women, a difference of 42.3%. Men with an educational attainment of bachelor's degree enjoy the highest average annual earnings of $81,111, while those with less than high school education earn the least with $38,979. Women with an educational attainment of graduate degree earn the most with the average annual earnings of $66,818, while those with less than high school education have the smallest earnings of $16,762.
| Educational Attainment | Male Income | Female Income |
| Less than High School | $38,979 | $16,762 |
| High School Diploma | $53,740 | $23,064 |
| College or Associate's Degree | $55,549 | $37,470 |
| Bachelor's Degree | $81,111 | $53,314 |
| Graduate Degree | $57,400 | $66,818 |
| Total | $52,602 | $30,336 |
Family Income in Liberty County
Family Income Brackets in Liberty County
According to the Liberty County family income data, there are 4,377 families falling into the $50,000 to $74,999 income range, which is the most common income bracket and makes up 21.2% of all families. Conversely, the $10,000 to $14,999 income bracket is the least frequent group with only 619 families (3.0%) belonging to this category.
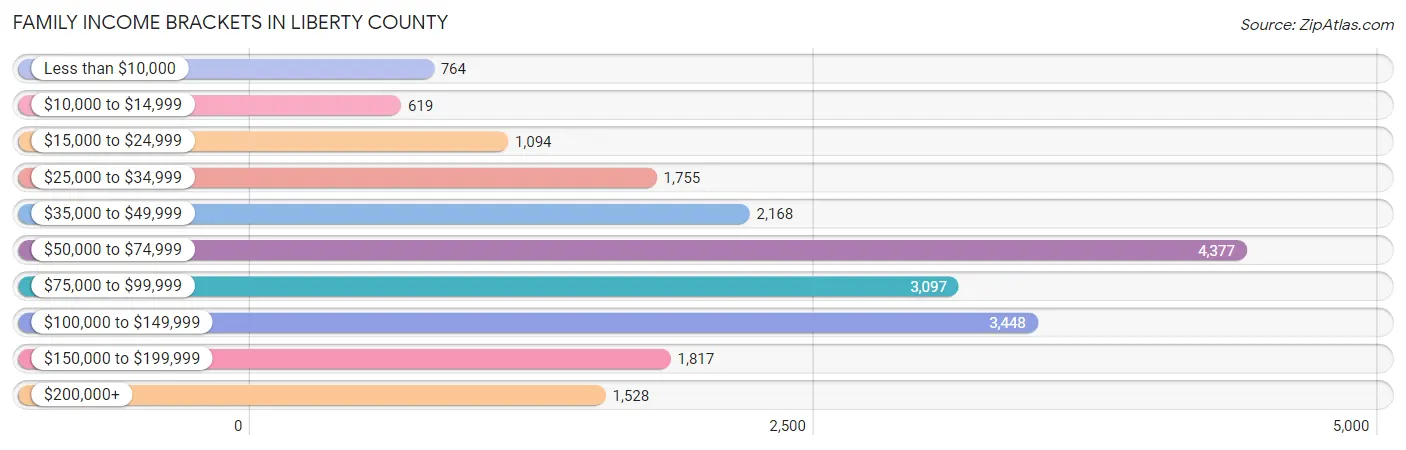
| Income Bracket | # Families | % Families |
| Less than $10,000 | 764 | 3.7% |
| $10,000 to $14,999 | 619 | 3.0% |
| $15,000 to $24,999 | 1,094 | 5.3% |
| $25,000 to $34,999 | 1,755 | 8.5% |
| $35,000 to $49,999 | 2,168 | 10.5% |
| $50,000 to $74,999 | 4,377 | 21.2% |
| $75,000 to $99,999 | 3,097 | 15.0% |
| $100,000 to $149,999 | 3,448 | 16.7% |
| $150,000 to $199,999 | 1,817 | 8.8% |
| $200,000+ | 1,528 | 7.4% |
Family Income by Famaliy Size in Liberty County
7+ person families (617 | 3.0%) account for the highest median family income in Liberty County with $132,019 per family, while 2-person families (8,787 | 42.6%) have the highest median income of $31,848 per family member.
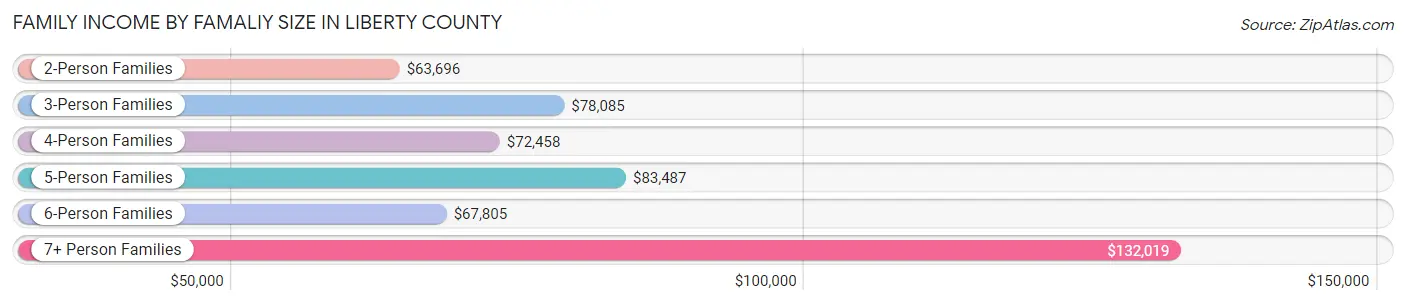
| Income Bracket | # Families | Median Income |
| 2-Person Families | 8,787 (42.6%) | $63,696 |
| 3-Person Families | 4,293 (20.8%) | $78,085 |
| 4-Person Families | 3,646 (17.7%) | $72,458 |
| 5-Person Families | 2,247 (10.9%) | $83,487 |
| 6-Person Families | 1,058 (5.1%) | $67,805 |
| 7+ Person Families | 617 (3.0%) | $132,019 |
| Total | 20,648 (100.0%) | $71,529 |
Family Income by Number of Earners in Liberty County
The median family income in Liberty County is $71,529, with families comprising 3+ earners (1,914) having the highest median family income of $129,857, while families with no earners (3,182) have the lowest median family income of $39,267, accounting for 9.3% and 15.4% of families, respectively.
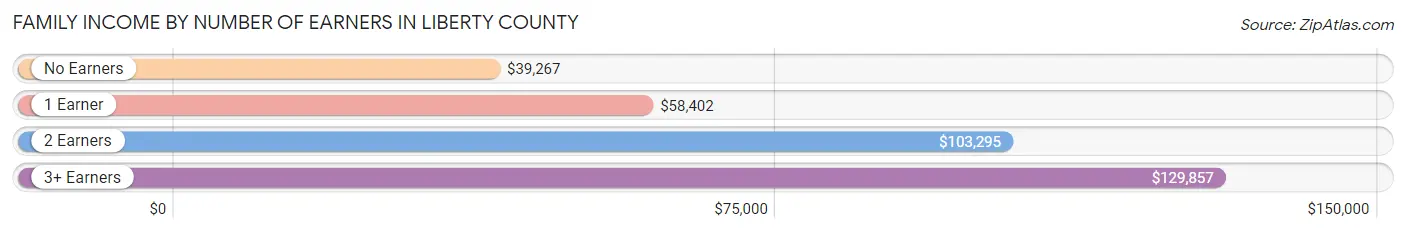
| Number of Earners | # Families | Median Income |
| No Earners | 3,182 (15.4%) | $39,267 |
| 1 Earner | 8,862 (42.9%) | $58,402 |
| 2 Earners | 6,690 (32.4%) | $103,295 |
| 3+ Earners | 1,914 (9.3%) | $129,857 |
| Total | 20,648 (100.0%) | $71,529 |
Household Income in Liberty County
Household Income Brackets in Liberty County
With 5,495 households falling in the category, the $50,000 to $74,999 income range is the most frequent in Liberty County, accounting for 19.0% of all households. In contrast, only 1,330 households (4.6%) fall into the $10,000 to $14,999 income bracket, making it the least populous group.
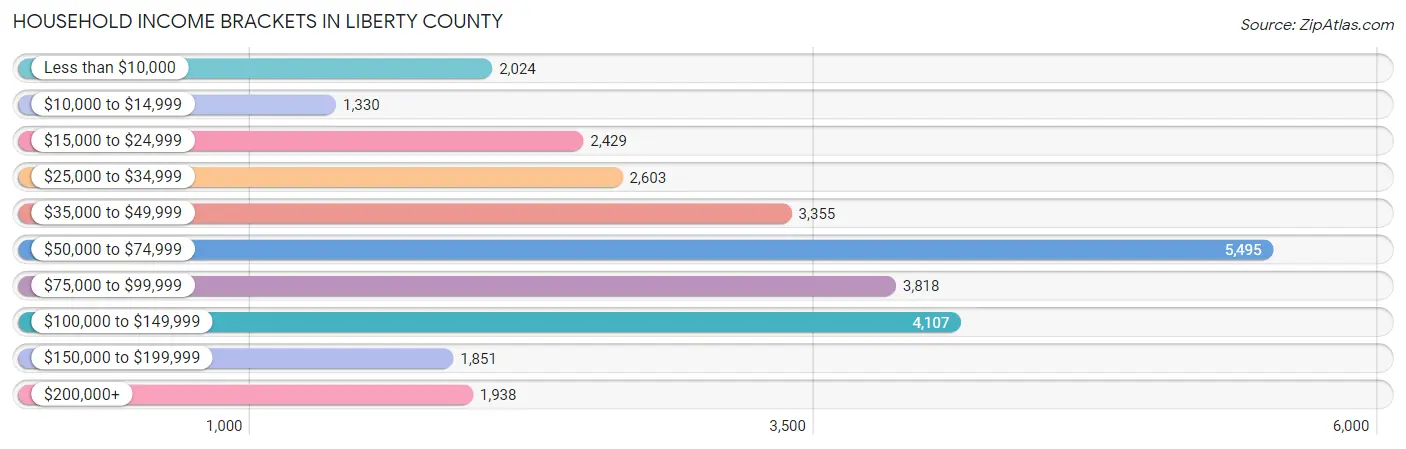
| Income Bracket | # Households | % Households |
| Less than $10,000 | 2,024 | 7.0% |
| $10,000 to $14,999 | 1,330 | 4.6% |
| $15,000 to $24,999 | 2,429 | 8.4% |
| $25,000 to $34,999 | 2,603 | 9.0% |
| $35,000 to $49,999 | 3,355 | 11.6% |
| $50,000 to $74,999 | 5,495 | 19.0% |
| $75,000 to $99,999 | 3,818 | 13.2% |
| $100,000 to $149,999 | 4,107 | 14.2% |
| $150,000 to $199,999 | 1,851 | 6.4% |
| $200,000+ | 1,938 | 6.7% |
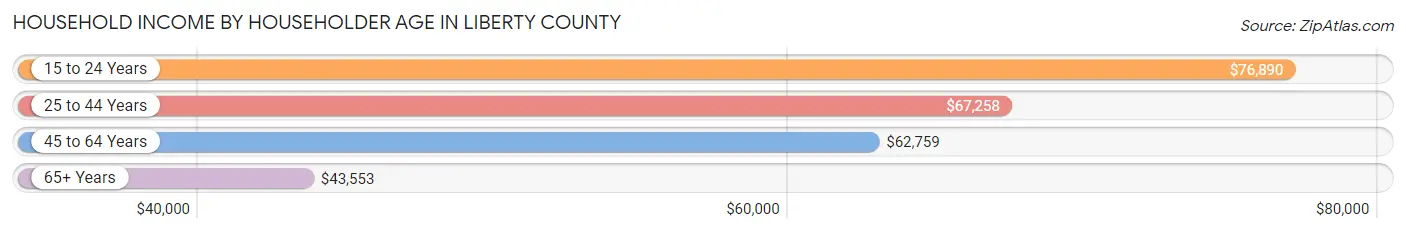
Household Income by Householder Age in Liberty County
The median household income in Liberty County is $59,605, with the highest median household income of $76,890 found in the 15 to 24 years age bracket for the primary householder. A total of 911 households (3.2%) fall into this category. Meanwhile, the 65+ years age bracket for the primary householder has the lowest median household income of $43,553, with 7,086 households (24.5%) in this group.
| Income Bracket | # Households | Median Income |
| 15 to 24 Years | 911 (3.2%) | $76,890 |
| 25 to 44 Years | 9,114 (31.5%) | $67,258 |
| 45 to 64 Years | 11,810 (40.8%) | $62,759 |
| 65+ Years | 7,086 (24.5%) | $43,553 |
| Total | 28,921 (100.0%) | $59,605 |
Poverty in Liberty County
Income Below Poverty by Sex and Age in Liberty County
With 17.2% poverty level for males and 18.2% for females among the residents of Liberty County, 16 and 17 year old males and under 5 year old females are the most vulnerable to poverty, with 661 males (38.9%) and 1,091 females (31.9%) in their respective age groups living below the poverty level.
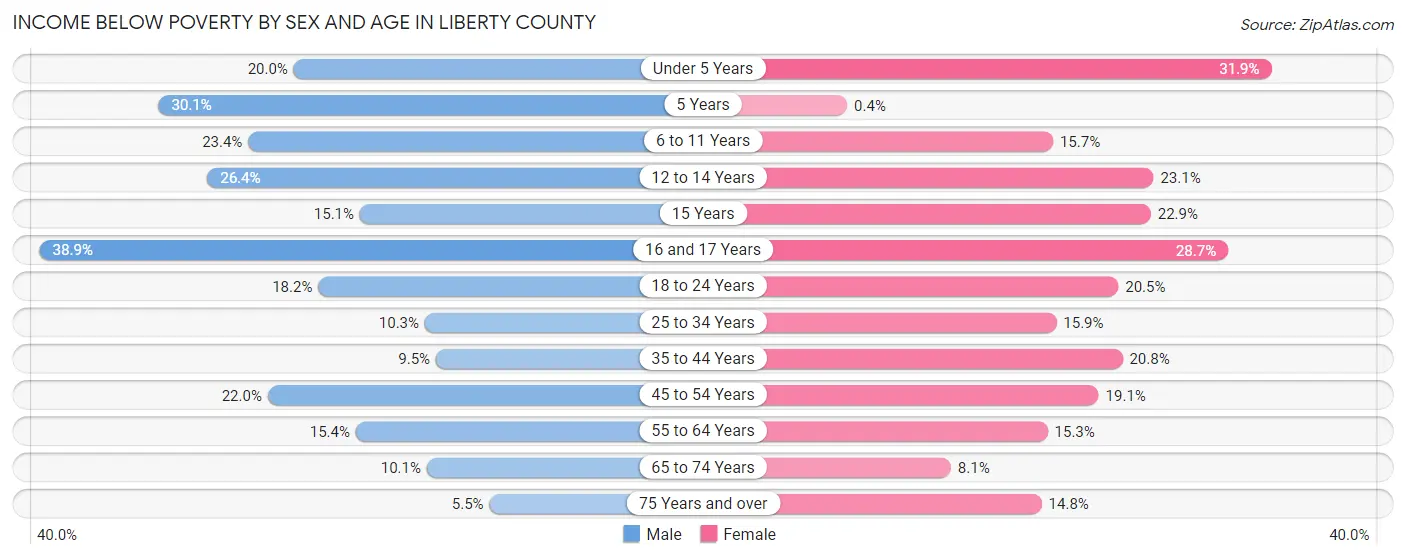
| Age Bracket | Male | Female |
| Under 5 Years | 668 (20.0%) | 1,091 (31.9%) |
| 5 Years | 233 (30.1%) | 3 (0.4%) |
| 6 to 11 Years | 1,009 (23.4%) | 650 (15.7%) |
| 12 to 14 Years | 648 (26.4%) | 498 (23.1%) |
| 15 Years | 89 (15.1%) | 198 (22.9%) |
| 16 and 17 Years | 661 (38.9%) | 326 (28.7%) |
| 18 to 24 Years | 761 (18.2%) | 761 (20.5%) |
| 25 to 34 Years | 549 (10.3%) | 965 (15.9%) |
| 35 to 44 Years | 492 (9.5%) | 1,036 (20.8%) |
| 45 to 54 Years | 1,141 (22.0%) | 956 (19.1%) |
| 55 to 64 Years | 788 (15.4%) | 775 (15.3%) |
| 65 to 74 Years | 358 (10.1%) | 303 (8.1%) |
| 75 Years and over | 102 (5.5%) | 349 (14.8%) |
| Total | 7,499 (17.2%) | 7,911 (18.2%) |
Income Above Poverty by Sex and Age in Liberty County
According to the poverty statistics in Liberty County, males aged 75 years and over and females aged 5 years are the age groups that are most secure financially, with 94.5% of males and 99.6% of females in these age groups living above the poverty line.
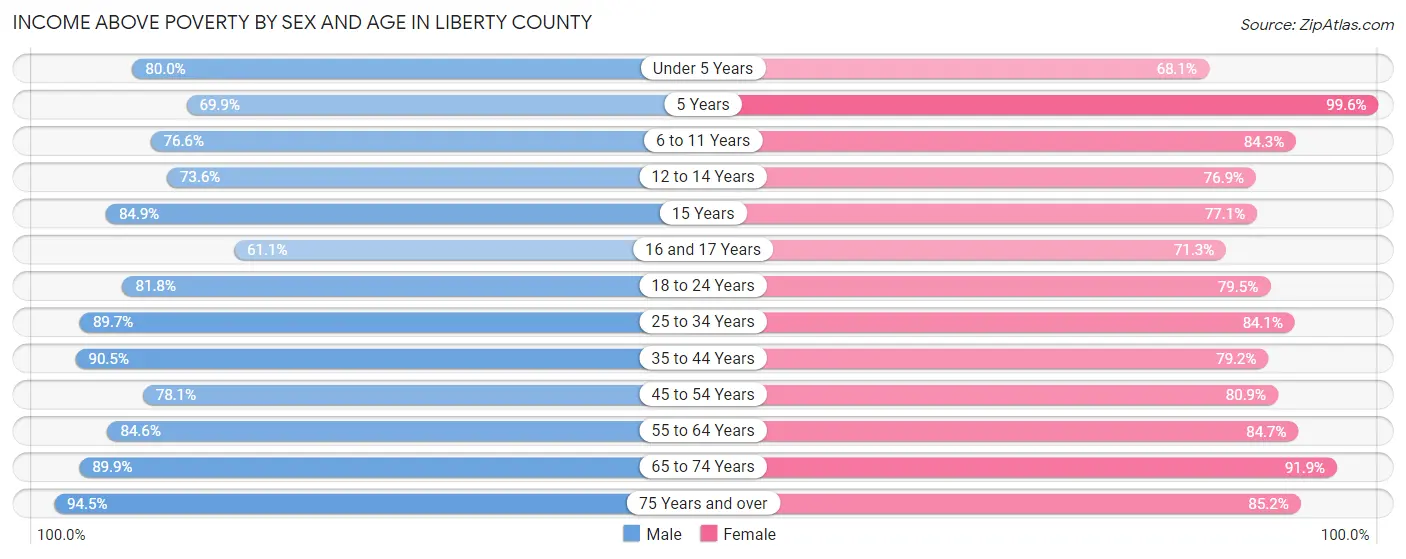
| Age Bracket | Male | Female |
| Under 5 Years | 2,668 (80.0%) | 2,330 (68.1%) |
| 5 Years | 542 (69.9%) | 741 (99.6%) |
| 6 to 11 Years | 3,303 (76.6%) | 3,495 (84.3%) |
| 12 to 14 Years | 1,804 (73.6%) | 1,654 (76.9%) |
| 15 Years | 500 (84.9%) | 665 (77.1%) |
| 16 and 17 Years | 1,039 (61.1%) | 811 (71.3%) |
| 18 to 24 Years | 3,420 (81.8%) | 2,945 (79.5%) |
| 25 to 34 Years | 4,789 (89.7%) | 5,092 (84.1%) |
| 35 to 44 Years | 4,710 (90.5%) | 3,936 (79.2%) |
| 45 to 54 Years | 4,058 (78.0%) | 4,057 (80.9%) |
| 55 to 64 Years | 4,327 (84.6%) | 4,298 (84.7%) |
| 65 to 74 Years | 3,172 (89.9%) | 3,438 (91.9%) |
| 75 Years and over | 1,755 (94.5%) | 2,003 (85.2%) |
| Total | 36,087 (82.8%) | 35,465 (81.8%) |
Income Below Poverty Among Married-Couple Families in Liberty County
The poverty statistics for married-couple families in Liberty County show that 7.5% or 1,169 of the total 15,626 families live below the poverty line. Families with 5 or more children have the highest poverty rate of 32.6%, comprising of 47 families. On the other hand, families with no children have the lowest poverty rate of 2.7%, which includes 218 families.
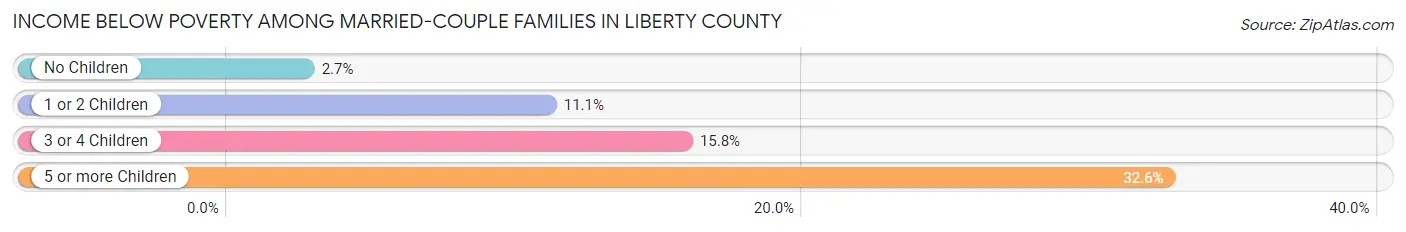
| Children | Above Poverty | Below Poverty |
| No Children | 7,936 (97.3%) | 218 (2.7%) |
| 1 or 2 Children | 4,814 (88.9%) | 601 (11.1%) |
| 3 or 4 Children | 1,610 (84.2%) | 303 (15.8%) |
| 5 or more Children | 97 (67.4%) | 47 (32.6%) |
| Total | 14,457 (92.5%) | 1,169 (7.5%) |
Income Below Poverty Among Single-Parent Households in Liberty County
According to the poverty data in Liberty County, 10.9% or 168 single-father households and 40.7% or 1,417 single-mother households are living below the poverty line. Among single-father households, those with no children have the highest poverty rate, with 72 households (12.1%) experiencing poverty. Likewise, among single-mother households, those with 3 or 4 children have the highest poverty rate, with 416 households (68.3%) falling below the poverty line.
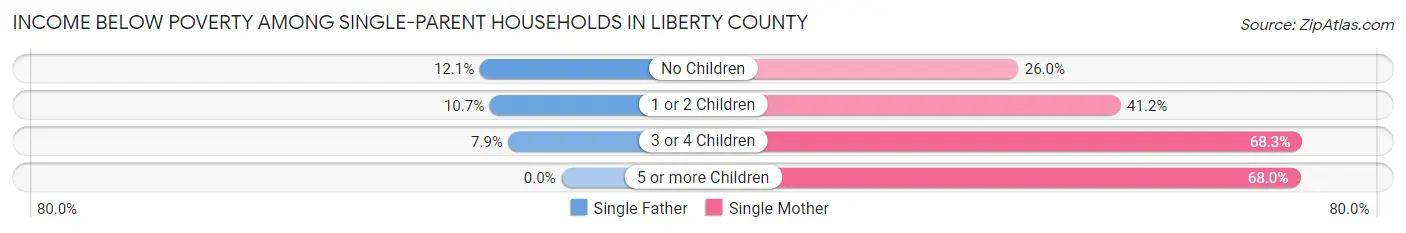
| Children | Single Father | Single Mother |
| No Children | 72 (12.1%) | 333 (26.0%) |
| 1 or 2 Children | 82 (10.6%) | 634 (41.2%) |
| 3 or 4 Children | 14 (7.9%) | 416 (68.3%) |
| 5 or more Children | 0 (0.0%) | 34 (68.0%) |
| Total | 168 (10.9%) | 1,417 (40.7%) |
Income Below Poverty Among Married-Couple vs Single-Parent Households in Liberty County
The poverty data for Liberty County shows that 1,169 of the married-couple family households (7.5%) and 1,585 of the single-parent households (31.6%) are living below the poverty level. Within the married-couple family households, those with 5 or more children have the highest poverty rate, with 47 households (32.6%) falling below the poverty line. Among the single-parent households, those with 5 or more children have the highest poverty rate, with 34 household (68.0%) living below poverty.
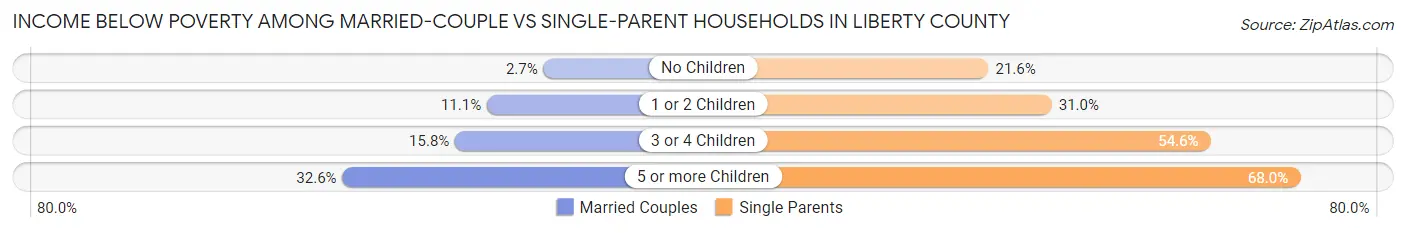
| Children | Married-Couple Families | Single-Parent Households |
| No Children | 218 (2.7%) | 405 (21.6%) |
| 1 or 2 Children | 601 (11.1%) | 716 (31.0%) |
| 3 or 4 Children | 303 (15.8%) | 430 (54.6%) |
| 5 or more Children | 47 (32.6%) | 34 (68.0%) |
| Total | 1,169 (7.5%) | 1,585 (31.6%) |
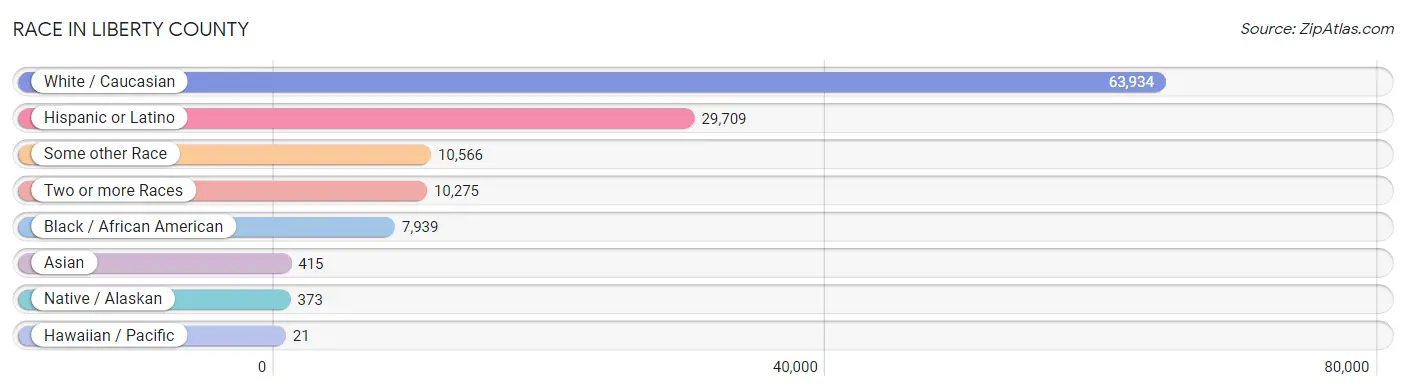
Race in Liberty County
The most populous races in Liberty County are White / Caucasian (63,934 | 68.4%), Hispanic or Latino (29,709 | 31.8%), and Some other Race (10,566 | 11.3%).
| Race | # Population | % Population |
| Asian | 415 | 0.4% |
| Black / African American | 7,939 | 8.5% |
| Hawaiian / Pacific | 21 | 0.0% |
| Hispanic or Latino | 29,709 | 31.8% |
| Native / Alaskan | 373 | 0.4% |
| White / Caucasian | 63,934 | 68.4% |
| Two or more Races | 10,275 | 11.0% |
| Some other Race | 10,566 | 11.3% |
| Total | 93,523 | 100.0% |
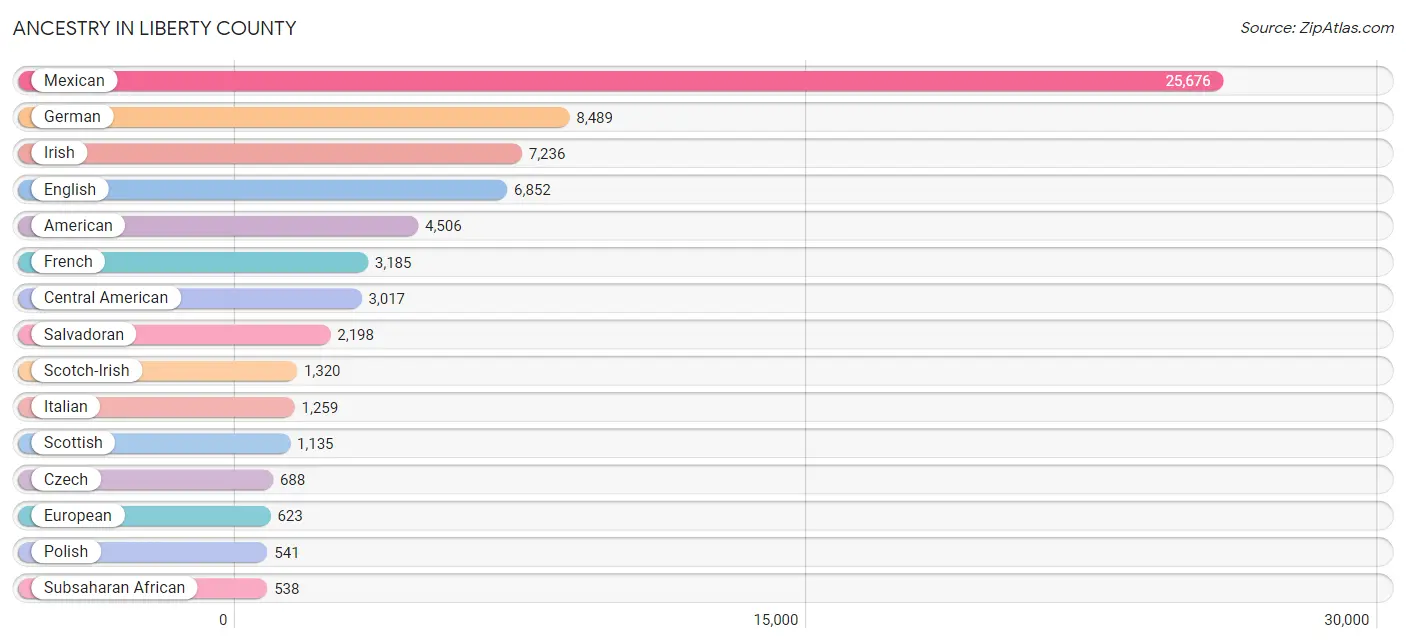
Ancestry in Liberty County
The most populous ancestries reported in Liberty County are Mexican (25,676 | 27.5%), German (8,489 | 9.1%), Irish (7,236 | 7.7%), English (6,852 | 7.3%), and American (4,506 | 4.8%), together accounting for 56.4% of all Liberty County residents.
| Ancestry | # Population | % Population |
| African | 443 | 0.5% |
| American | 4,506 | 4.8% |
| Apache | 20 | 0.0% |
| Arab | 62 | 0.1% |
| Belgian | 277 | 0.3% |
| Bhutanese | 37 | 0.0% |
| Brazilian | 23 | 0.0% |
| British | 226 | 0.2% |
| British West Indian | 11 | 0.0% |
| Cajun | 106 | 0.1% |
| Canadian | 56 | 0.1% |
| Central American | 3,017 | 3.2% |
| Central American Indian | 108 | 0.1% |
| Cherokee | 353 | 0.4% |
| Choctaw | 104 | 0.1% |
| Colombian | 61 | 0.1% |
| Comanche | 23 | 0.0% |
| Creek | 27 | 0.0% |
| Croatian | 5 | 0.0% |
| Cuban | 126 | 0.1% |
| Czech | 688 | 0.7% |
| Czechoslovakian | 41 | 0.0% |
| Danish | 103 | 0.1% |
| Dutch | 364 | 0.4% |
| Dutch West Indian | 19 | 0.0% |
| Eastern European | 86 | 0.1% |
| Egyptian | 27 | 0.0% |
| English | 6,852 | 7.3% |
| European | 623 | 0.7% |
| Finnish | 71 | 0.1% |
| French | 3,185 | 3.4% |
| French Canadian | 72 | 0.1% |
| German | 8,489 | 9.1% |
| Greek | 92 | 0.1% |
| Guamanian / Chamorro | 4 | 0.0% |
| Guatemalan | 269 | 0.3% |
| Haitian | 25 | 0.0% |
| Honduran | 329 | 0.4% |
| Hungarian | 48 | 0.1% |
| Indian (Asian) | 33 | 0.0% |
| Iranian | 1 | 0.0% |
| Irish | 7,236 | 7.7% |
| Italian | 1,259 | 1.3% |
| Jamaican | 63 | 0.1% |
| Japanese | 20 | 0.0% |
| Korean | 383 | 0.4% |
| Lebanese | 35 | 0.0% |
| Lithuanian | 61 | 0.1% |
| Maltese | 23 | 0.0% |
| Mexican | 25,676 | 27.5% |
| Mexican American Indian | 109 | 0.1% |
| Navajo | 12 | 0.0% |
| Nicaraguan | 221 | 0.2% |
| Nigerian | 29 | 0.0% |
| Northern European | 31 | 0.0% |
| Norwegian | 161 | 0.2% |
| Peruvian | 5 | 0.0% |
| Polish | 541 | 0.6% |
| Portuguese | 43 | 0.1% |
| Potawatomi | 18 | 0.0% |
| Pueblo | 9 | 0.0% |
| Puerto Rican | 172 | 0.2% |
| Romanian | 9 | 0.0% |
| Russian | 54 | 0.1% |
| Salvadoran | 2,198 | 2.4% |
| Scandinavian | 104 | 0.1% |
| Scotch-Irish | 1,320 | 1.4% |
| Scottish | 1,135 | 1.2% |
| South African | 49 | 0.1% |
| South American | 66 | 0.1% |
| Spaniard | 56 | 0.1% |
| Spanish | 110 | 0.1% |
| Sri Lankan | 126 | 0.1% |
| Subsaharan African | 538 | 0.6% |
| Swedish | 350 | 0.4% |
| Swiss | 17 | 0.0% |
| Thai | 135 | 0.1% |
| Tongan | 15 | 0.0% |
| Ute | 6 | 0.0% |
| Welsh | 148 | 0.2% | View All 80 Rows |
Immigrants in Liberty County
The most numerous immigrant groups reported in Liberty County came from Latin America (10,306 | 11.0%), Central America (10,094 | 10.8%), Mexico (8,370 | 8.9%), El Salvador (1,215 | 1.3%), and Asia (399 | 0.4%), together accounting for 32.5% of all Liberty County residents.
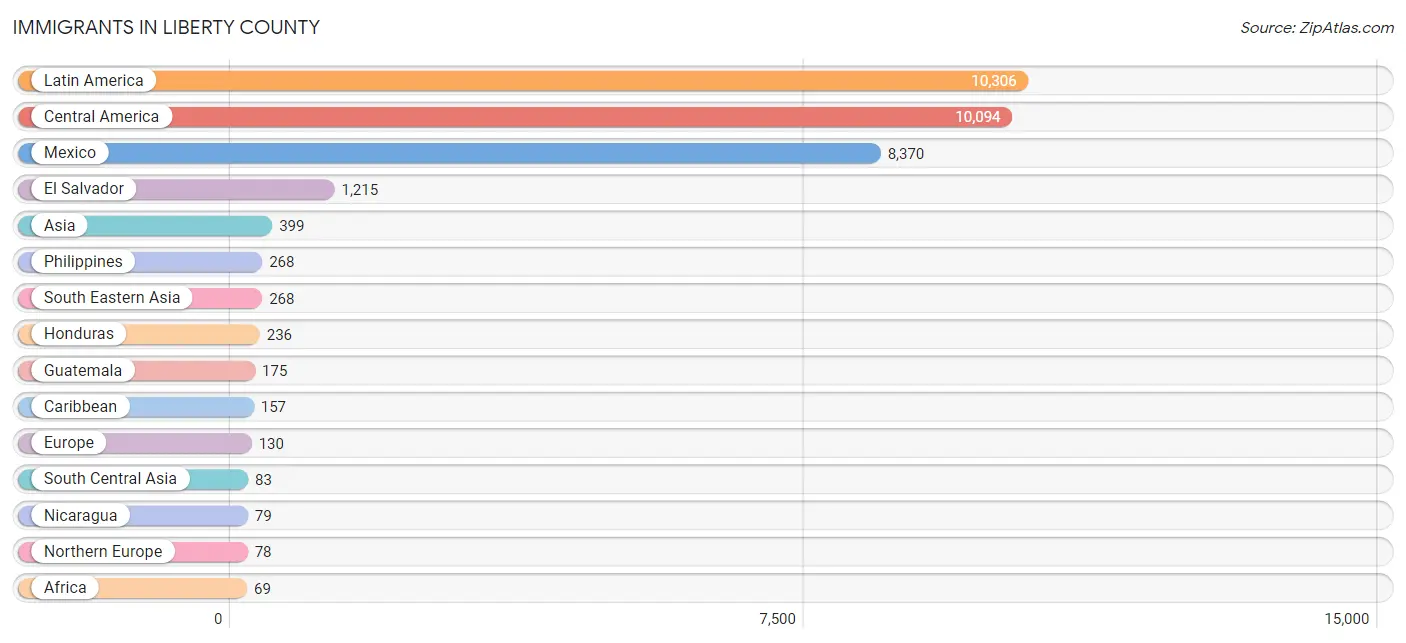
| Immigration Origin | # Population | % Population |
| Africa | 69 | 0.1% |
| Asia | 399 | 0.4% |
| Brazil | 3 | 0.0% |
| Canada | 12 | 0.0% |
| Caribbean | 157 | 0.2% |
| Central America | 10,094 | 10.8% |
| China | 33 | 0.0% |
| Colombia | 47 | 0.1% |
| Costa Rica | 19 | 0.0% |
| Cuba | 59 | 0.1% |
| Denmark | 13 | 0.0% |
| Dominica | 5 | 0.0% |
| Eastern Africa | 7 | 0.0% |
| Eastern Asia | 48 | 0.1% |
| Eastern Europe | 6 | 0.0% |
| Egypt | 13 | 0.0% |
| El Salvador | 1,215 | 1.3% |
| England | 61 | 0.1% |
| Europe | 130 | 0.1% |
| Germany | 46 | 0.1% |
| Guatemala | 175 | 0.2% |
| Honduras | 236 | 0.3% |
| India | 69 | 0.1% |
| Iran | 14 | 0.0% |
| Jamaica | 63 | 0.1% |
| Japan | 15 | 0.0% |
| Latin America | 10,306 | 11.0% |
| Mexico | 8,370 | 8.9% |
| Nicaragua | 79 | 0.1% |
| Northern Africa | 13 | 0.0% |
| Northern Europe | 78 | 0.1% |
| Peru | 5 | 0.0% |
| Philippines | 268 | 0.3% |
| South Africa | 49 | 0.1% |
| South America | 55 | 0.1% |
| South Central Asia | 83 | 0.1% |
| South Eastern Asia | 268 | 0.3% |
| Trinidad and Tobago | 30 | 0.0% |
| Ukraine | 6 | 0.0% |
| Western Europe | 46 | 0.1% | View All 40 Rows |
Sex and Age in Liberty County
Sex and Age in Liberty County
The most populous age groups in Liberty County are 10 to 14 Years (4,499 | 9.7%) for men and 5 to 9 Years (3,767 | 8.0%) for women.
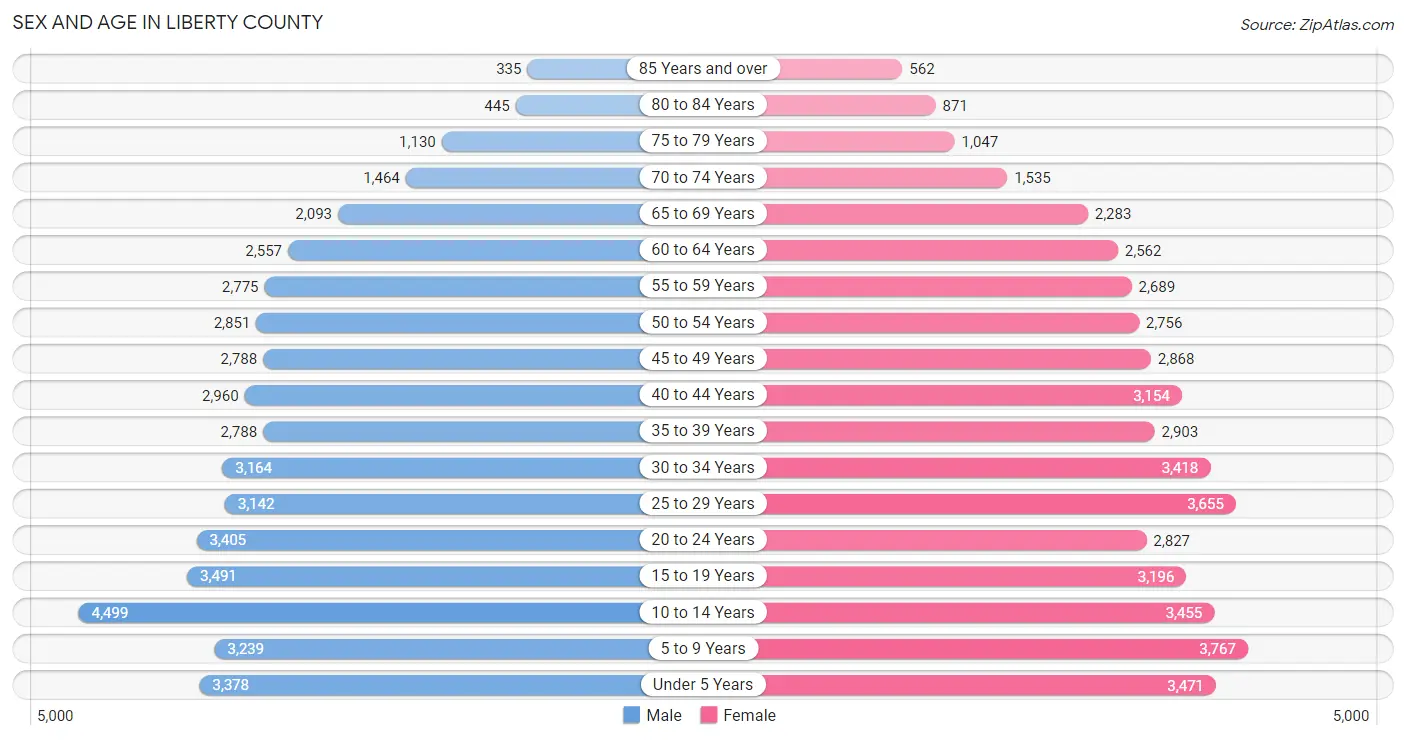
| Age Bracket | Male | Female |
| Under 5 Years | 3,378 (7.3%) | 3,471 (7.4%) |
| 5 to 9 Years | 3,239 (7.0%) | 3,767 (8.0%) |
| 10 to 14 Years | 4,499 (9.7%) | 3,455 (7.3%) |
| 15 to 19 Years | 3,491 (7.5%) | 3,196 (6.8%) |
| 20 to 24 Years | 3,405 (7.3%) | 2,827 (6.0%) |
| 25 to 29 Years | 3,142 (6.8%) | 3,655 (7.8%) |
| 30 to 34 Years | 3,164 (6.8%) | 3,418 (7.3%) |
| 35 to 39 Years | 2,788 (6.0%) | 2,903 (6.2%) |
| 40 to 44 Years | 2,960 (6.4%) | 3,154 (6.7%) |
| 45 to 49 Years | 2,788 (6.0%) | 2,868 (6.1%) |
| 50 to 54 Years | 2,851 (6.1%) | 2,756 (5.9%) |
| 55 to 59 Years | 2,775 (6.0%) | 2,689 (5.7%) |
| 60 to 64 Years | 2,557 (5.5%) | 2,562 (5.4%) |
| 65 to 69 Years | 2,093 (4.5%) | 2,283 (4.9%) |
| 70 to 74 Years | 1,464 (3.2%) | 1,535 (3.3%) |
| 75 to 79 Years | 1,130 (2.4%) | 1,047 (2.2%) |
| 80 to 84 Years | 445 (1.0%) | 871 (1.8%) |
| 85 Years and over | 335 (0.7%) | 562 (1.2%) |
| Total | 46,504 (100.0%) | 47,019 (100.0%) |
Families and Households in Liberty County
Median Family Size in Liberty County
The median family size in Liberty County is 3.63 persons per family, with single female/mother families (3,481 | 16.9%) accounting for the largest median family size of 3.71 persons per family. On the other hand, single male/father families (1,541 | 7.5%) represent the smallest median family size with 2.98 persons per family.
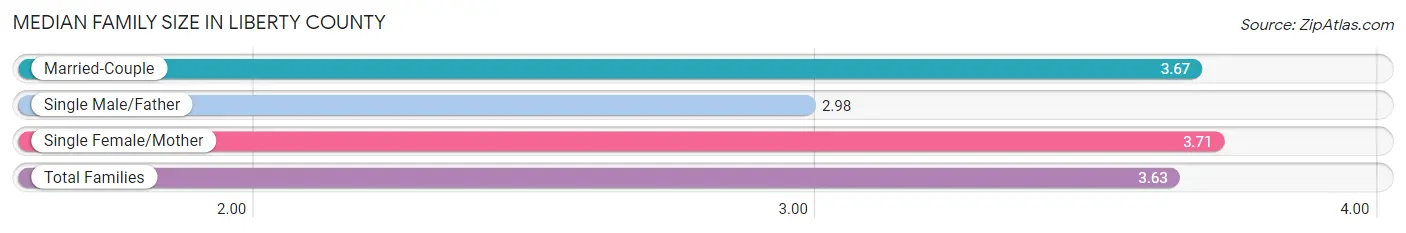
| Family Type | # Families | Family Size |
| Married-Couple | 15,626 (75.7%) | 3.67 |
| Single Male/Father | 1,541 (7.5%) | 2.98 |
| Single Female/Mother | 3,481 (16.9%) | 3.71 |
| Total Families | 20,648 (100.0%) | 3.63 |
Median Household Size in Liberty County
The median household size in Liberty County is 3.02 persons per household, with single female/mother households (3,481 | 12.0%) accounting for the largest median household size of 3.91 persons per household. non-family households (8,273 | 28.6%) represent the smallest median household size with 1.21 persons per household.
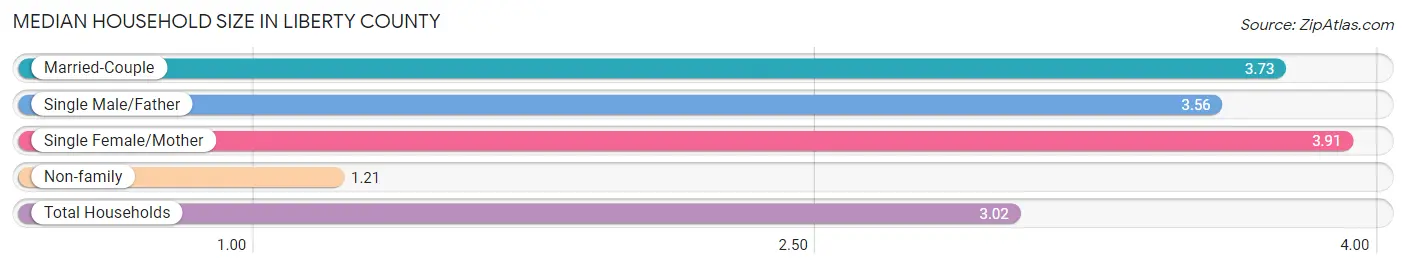
| Household Type | # Households | Household Size |
| Married-Couple | 15,626 (54.0%) | 3.73 |
| Single Male/Father | 1,541 (5.3%) | 3.56 |
| Single Female/Mother | 3,481 (12.0%) | 3.91 |
| Non-family | 8,273 (28.6%) | 1.21 |
| Total Households | 28,921 (100.0%) | 3.02 |
Household Size by Marriage Status in Liberty County
Out of a total of 28,921 households in Liberty County, 20,648 (71.4%) are family households, while 8,273 (28.6%) are nonfamily households. The most numerous type of family households are 2-person households, comprising 8,147, and the most common type of nonfamily households are 1-person households, comprising 7,018.
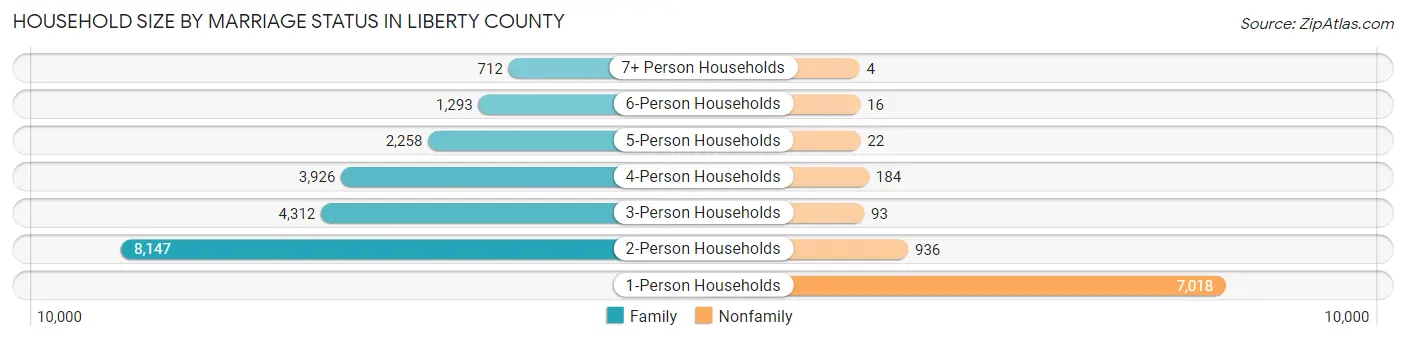
| Household Size | Family Households | Nonfamily Households |
| 1-Person Households | - | 7,018 (24.3%) |
| 2-Person Households | 8,147 (28.2%) | 936 (3.2%) |
| 3-Person Households | 4,312 (14.9%) | 93 (0.3%) |
| 4-Person Households | 3,926 (13.6%) | 184 (0.6%) |
| 5-Person Households | 2,258 (7.8%) | 22 (0.1%) |
| 6-Person Households | 1,293 (4.5%) | 16 (0.1%) |
| 7+ Person Households | 712 (2.5%) | 4 (0.0%) |
| Total | 20,648 (71.4%) | 8,273 (28.6%) |
Female Fertility in Liberty County
Fertility by Age in Liberty County
Average fertility rate in Liberty County is 63.0 births per 1,000 women. Women in the age bracket of 20 to 34 years have the highest fertility rate with 110.0 births per 1,000 women. Women in the age bracket of 20 to 34 years acount for 76.1% of all women with births.
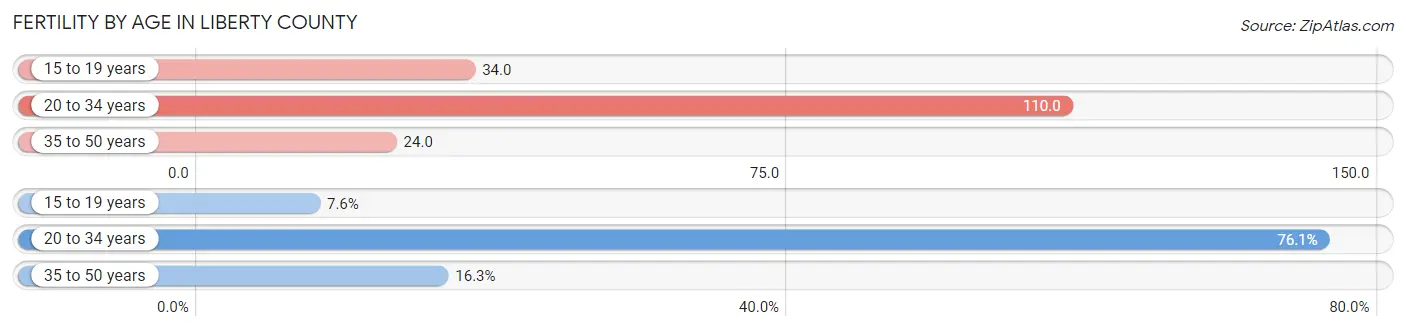
| Age Bracket | Women with Births | Births / 1,000 Women |
| 15 to 19 years | 109 (7.6%) | 34.0 |
| 20 to 34 years | 1,092 (76.1%) | 110.0 |
| 35 to 50 years | 234 (16.3%) | 24.0 |
| Total | 1,435 (100.0%) | 63.0 |
Fertility by Age by Marriage Status in Liberty County
62.6% of women with births (1,435) in Liberty County are married. The highest percentage of unmarried women with births falls into 15 to 19 years age bracket with 100.0% of them unmarried at the time of birth, while the lowest percentage of unmarried women with births belong to 35 to 50 years age bracket with 28.2% of them unmarried.
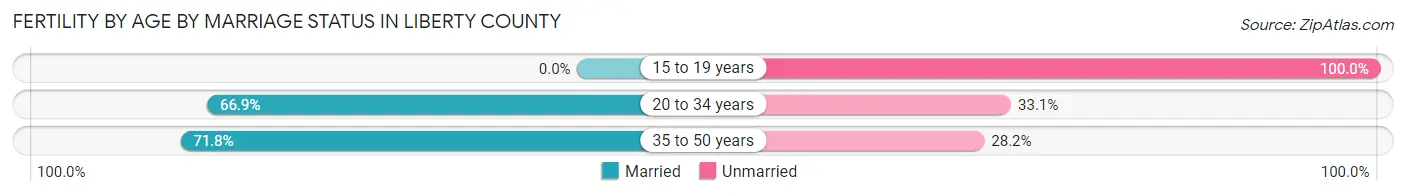
| Age Bracket | Married | Unmarried |
| 15 to 19 years | 0 (0.0%) | 109 (100.0%) |
| 20 to 34 years | 731 (66.9%) | 361 (33.1%) |
| 35 to 50 years | 168 (71.8%) | 66 (28.2%) |
| Total | 898 (62.6%) | 537 (37.4%) |
Fertility by Education in Liberty County
Average fertility rate in Liberty County is 63.0 births per 1,000 women. Women with the education attainment of graduate degree have the highest fertility rate of 174.0 births per 1,000 women, while women with the education attainment of less than high school have the lowest fertility at 39.0 births per 1,000 women. Women with the education attainment of high school diploma represent 45.4% of all women with births.
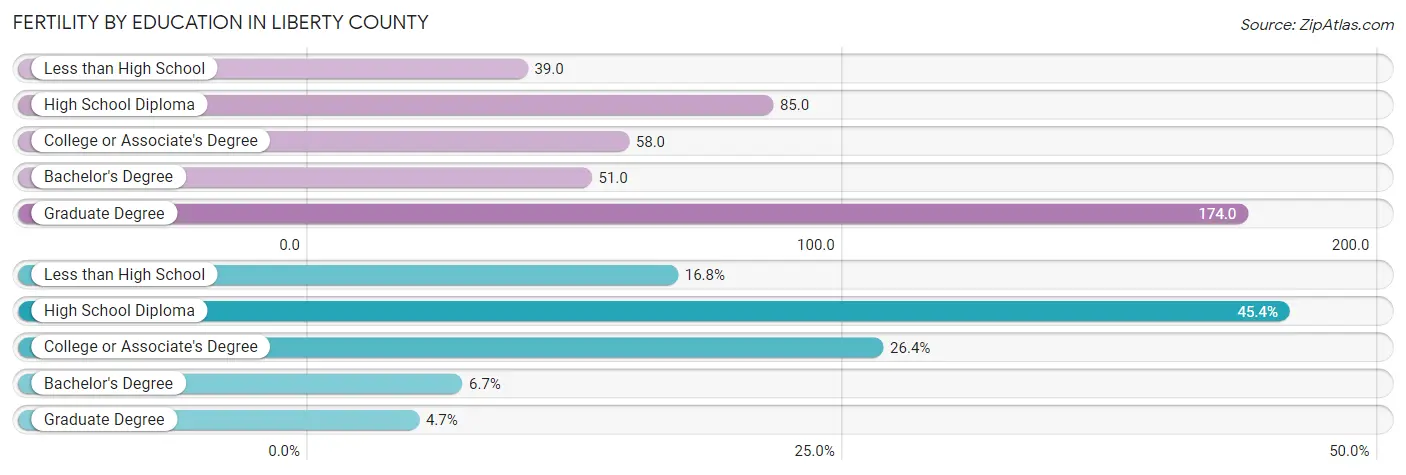
| Educational Attainment | Women with Births | Births / 1,000 Women |
| Less than High School | 241 (16.8%) | 39.0 |
| High School Diploma | 652 (45.4%) | 85.0 |
| College or Associate's Degree | 379 (26.4%) | 58.0 |
| Bachelor's Degree | 96 (6.7%) | 51.0 |
| Graduate Degree | 67 (4.7%) | 174.0 |
| Total | 1,435 (100.0%) | 63.0 |
Fertility by Education by Marriage Status in Liberty County
37.4% of women with births in Liberty County are unmarried. Women with the educational attainment of bachelor's degree are most likely to be married with 100.0% of them married at childbirth, while women with the educational attainment of less than high school are least likely to be married with 71.8% of them unmarried at childbirth.
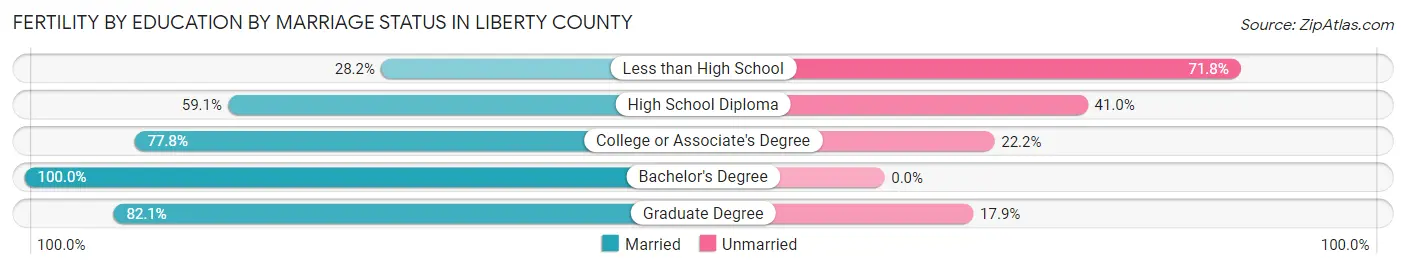
| Educational Attainment | Married | Unmarried |
| Less than High School | 68 (28.2%) | 173 (71.8%) |
| High School Diploma | 385 (59.1%) | 267 (40.9%) |
| College or Associate's Degree | 295 (77.8%) | 84 (22.2%) |
| Bachelor's Degree | 96 (100.0%) | 0 (0.0%) |
| Graduate Degree | 55 (82.1%) | 12 (17.9%) |
| Total | 898 (62.6%) | 537 (37.4%) |
Employment Characteristics in Liberty County
Employment by Class of Employer in Liberty County
Among the 32,970 employed individuals in Liberty County, private company employees (24,284 | 73.7%), local government employees (2,571 | 7.8%), and self-employed (not incorporated) (2,507 | 7.6%) make up the most common classes of employment.
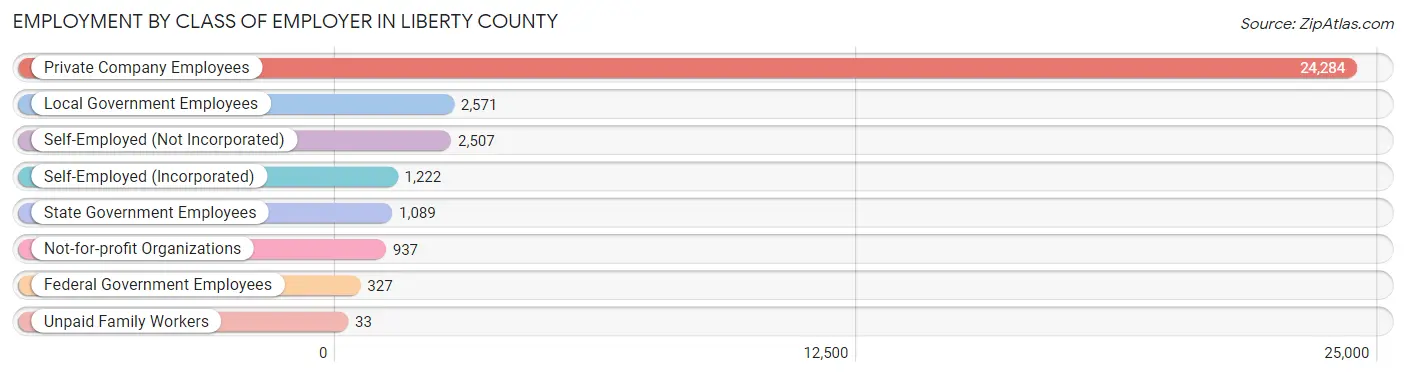
| Employer Class | # Employees | % Employees |
| Private Company Employees | 24,284 | 73.7% |
| Self-Employed (Incorporated) | 1,222 | 3.7% |
| Self-Employed (Not Incorporated) | 2,507 | 7.6% |
| Not-for-profit Organizations | 937 | 2.8% |
| Local Government Employees | 2,571 | 7.8% |
| State Government Employees | 1,089 | 3.3% |
| Federal Government Employees | 327 | 1.0% |
| Unpaid Family Workers | 33 | 0.1% |
| Total | 32,970 | 100.0% |
Employment Status by Age in Liberty County
According to the labor force statistics for Liberty County, out of the total population over 16 years of age (70,261), 51.6% or 36,255 individuals are in the labor force, with 6.9% or 2,502 of them unemployed. The age group with the highest labor force participation rate is 45 to 54 years, with 66.2% or 7,456 individuals in the labor force. Within the labor force, the 16 to 19 years age range has the highest percentage of unemployed individuals, with 21.4% or 271 of them being unemployed.
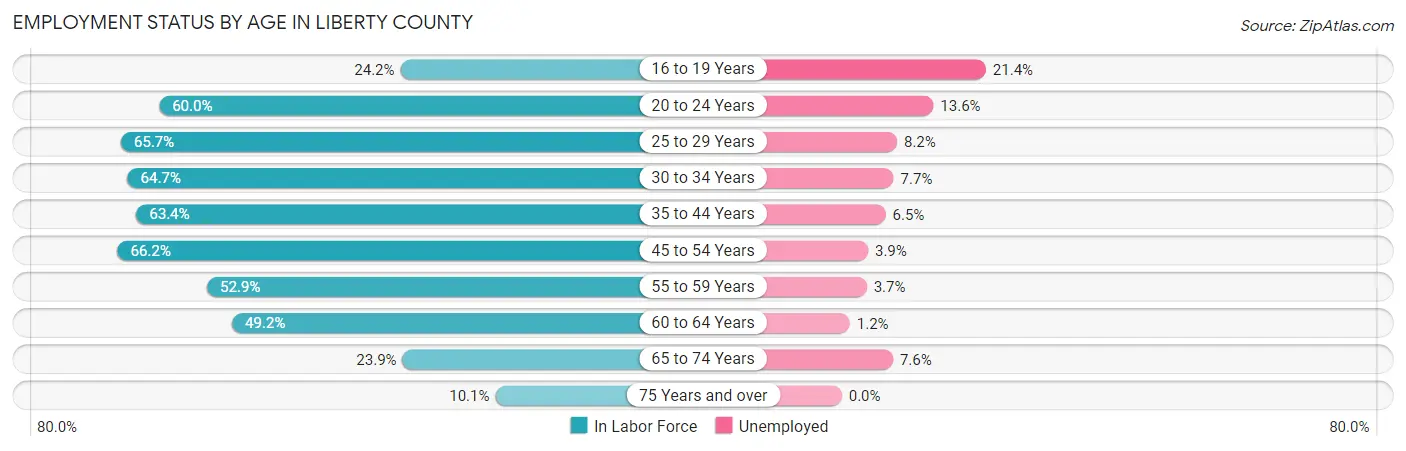
| Age Bracket | In Labor Force | Unemployed |
| 16 to 19 Years | 1,267 (24.2%) | 271 (21.4%) |
| 20 to 24 Years | 3,739 (60.0%) | 509 (13.6%) |
| 25 to 29 Years | 4,466 (65.7%) | 366 (8.2%) |
| 30 to 34 Years | 4,259 (64.7%) | 328 (7.7%) |
| 35 to 44 Years | 7,484 (63.4%) | 486 (6.5%) |
| 45 to 54 Years | 7,456 (66.2%) | 291 (3.9%) |
| 55 to 59 Years | 2,890 (52.9%) | 107 (3.7%) |
| 60 to 64 Years | 2,519 (49.2%) | 30 (1.2%) |
| 65 to 74 Years | 1,763 (23.9%) | 134 (7.6%) |
| 75 Years and over | 443 (10.1%) | 0 (0.0%) |
| Total | 36,255 (51.6%) | 2,502 (6.9%) |
Employment Status by Educational Attainment in Liberty County
According to labor force statistics for Liberty County, 61.8% of individuals (29,065) out of the total population between 25 and 64 years of age (47,030) are in the labor force, with 5.5% or 1,599 of them being unemployed. The group with the highest labor force participation rate are those with the educational attainment of bachelor's degree or higher, with 75.9% or 3,708 individuals in the labor force. Within the labor force, individuals with less than high school education have the highest percentage of unemployment, with 7.9% or 429 of them being unemployed.
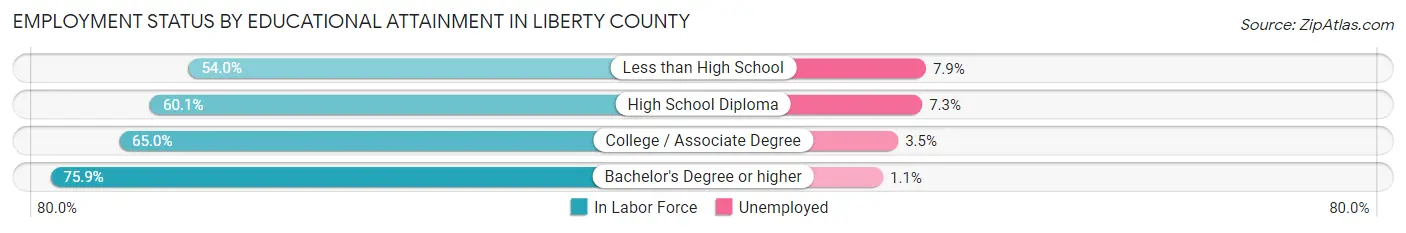
| Educational Attainment | In Labor Force | Unemployed |
| Less than High School | 5,432 (54.0%) | 795 (7.9%) |
| High School Diploma | 11,371 (60.1%) | 1,381 (7.3%) |
| College / Associate Degree | 8,557 (65.0%) | 461 (3.5%) |
| Bachelor's Degree or higher | 3,708 (75.9%) | 54 (1.1%) |
| Total | 29,065 (61.8%) | 2,587 (5.5%) |
Employment Occupations by Sex in Liberty County
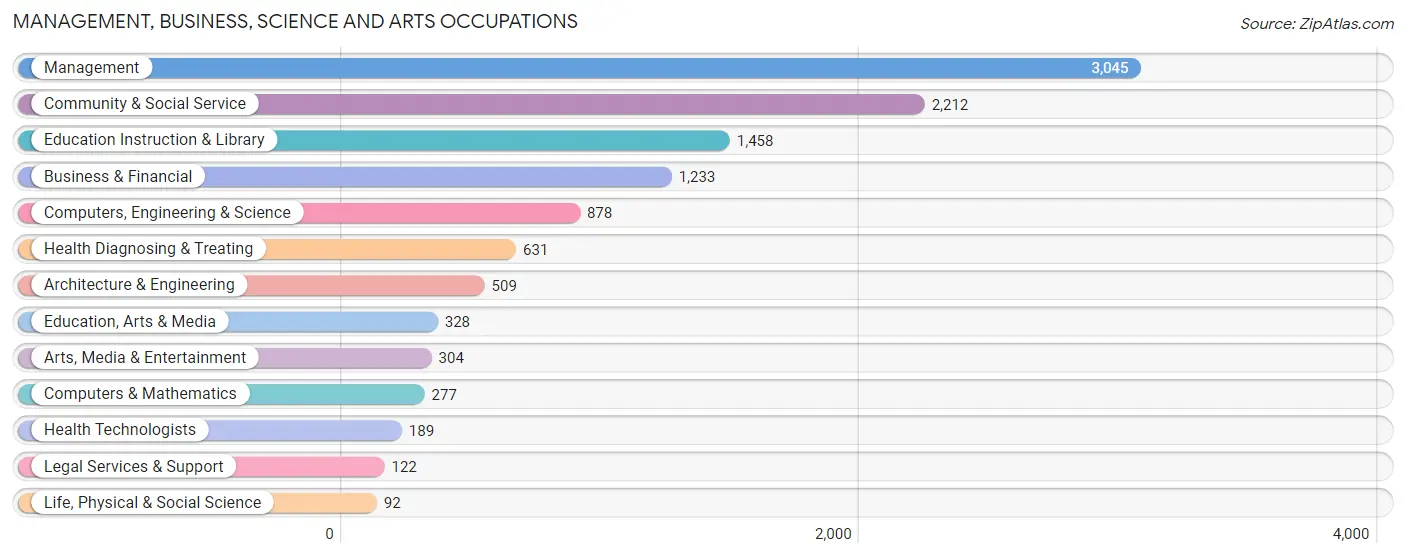
Management, Business, Science and Arts Occupations
The most common Management, Business, Science and Arts occupations in Liberty County are Management (3,045 | 9.0%), Community & Social Service (2,212 | 6.6%), Education Instruction & Library (1,458 | 4.3%), Business & Financial (1,233 | 3.7%), and Computers, Engineering & Science (878 | 2.6%).
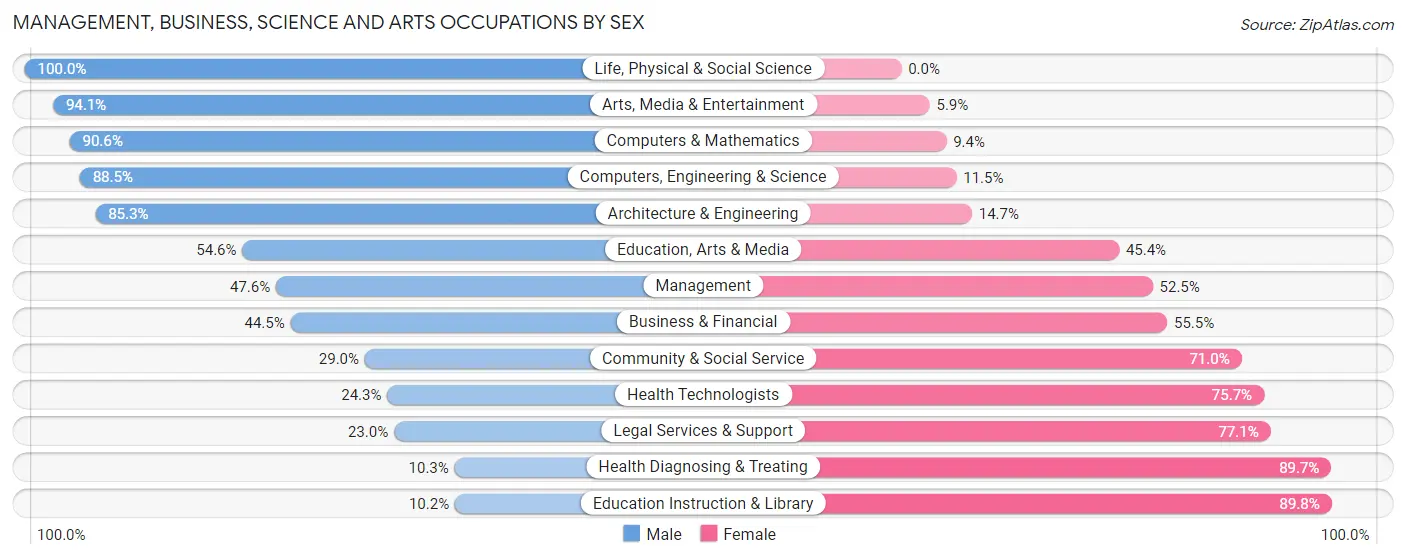
Management, Business, Science and Arts Occupations by Sex
Within the Management, Business, Science and Arts occupations in Liberty County, the most male-oriented occupations are Life, Physical & Social Science (100.0%), Arts, Media & Entertainment (94.1%), and Computers & Mathematics (90.6%), while the most female-oriented occupations are Education Instruction & Library (89.8%), Health Diagnosing & Treating (89.7%), and Legal Services & Support (77.0%).
| Occupation | Male | Female |
| Management | 1,448 (47.5%) | 1,597 (52.4%) |
| Business & Financial | 549 (44.5%) | 684 (55.5%) |
| Computers, Engineering & Science | 777 (88.5%) | 101 (11.5%) |
| Computers & Mathematics | 251 (90.6%) | 26 (9.4%) |
| Architecture & Engineering | 434 (85.3%) | 75 (14.7%) |
| Life, Physical & Social Science | 92 (100.0%) | 0 (0.0%) |
| Community & Social Service | 642 (29.0%) | 1,570 (71.0%) |
| Education, Arts & Media | 179 (54.6%) | 149 (45.4%) |
| Legal Services & Support | 28 (23.0%) | 94 (77.0%) |
| Education Instruction & Library | 149 (10.2%) | 1,309 (89.8%) |
| Arts, Media & Entertainment | 286 (94.1%) | 18 (5.9%) |
| Health Diagnosing & Treating | 65 (10.3%) | 566 (89.7%) |
| Health Technologists | 46 (24.3%) | 143 (75.7%) |
| Total (Category) | 3,481 (43.5%) | 4,518 (56.5%) |
| Total (Overall) | 20,369 (60.4%) | 13,339 (39.6%) |
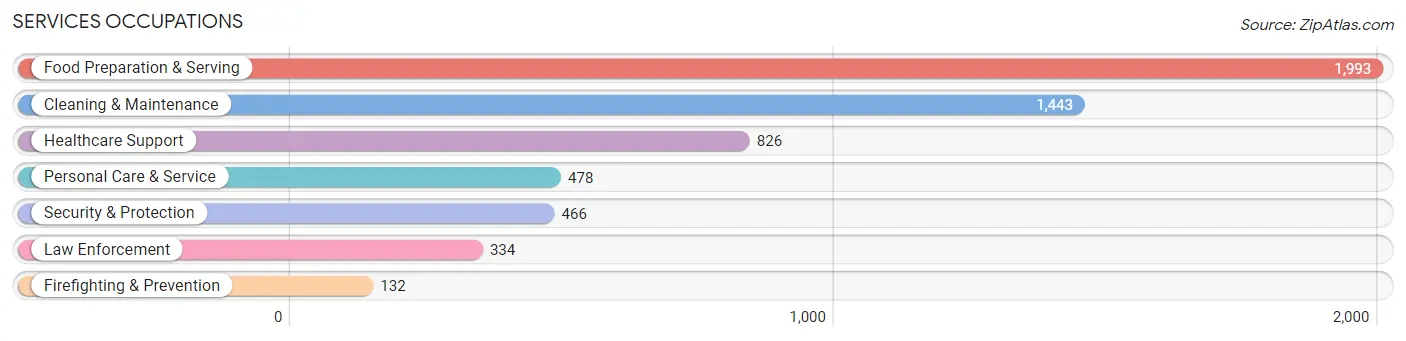
Services Occupations
The most common Services occupations in Liberty County are Food Preparation & Serving (1,993 | 5.9%), Cleaning & Maintenance (1,443 | 4.3%), Healthcare Support (826 | 2.5%), Personal Care & Service (478 | 1.4%), and Security & Protection (466 | 1.4%).
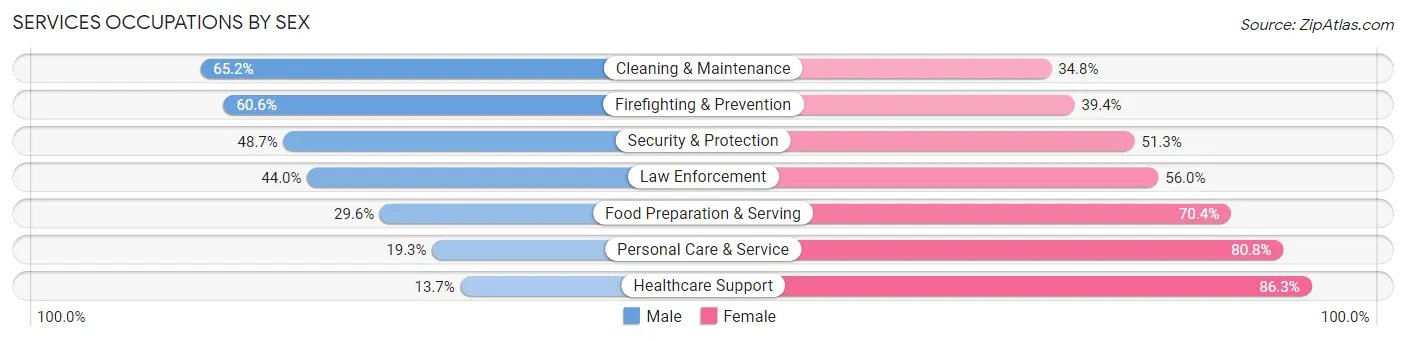
Services Occupations by Sex
Within the Services occupations in Liberty County, the most male-oriented occupations are Cleaning & Maintenance (65.2%), Firefighting & Prevention (60.6%), and Security & Protection (48.7%), while the most female-oriented occupations are Healthcare Support (86.3%), Personal Care & Service (80.7%), and Food Preparation & Serving (70.4%).
| Occupation | Male | Female |
| Healthcare Support | 113 (13.7%) | 713 (86.3%) |
| Security & Protection | 227 (48.7%) | 239 (51.3%) |
| Firefighting & Prevention | 80 (60.6%) | 52 (39.4%) |
| Law Enforcement | 147 (44.0%) | 187 (56.0%) |
| Food Preparation & Serving | 590 (29.6%) | 1,403 (70.4%) |
| Cleaning & Maintenance | 941 (65.2%) | 502 (34.8%) |
| Personal Care & Service | 92 (19.3%) | 386 (80.7%) |
| Total (Category) | 1,963 (37.7%) | 3,243 (62.3%) |
| Total (Overall) | 20,369 (60.4%) | 13,339 (39.6%) |
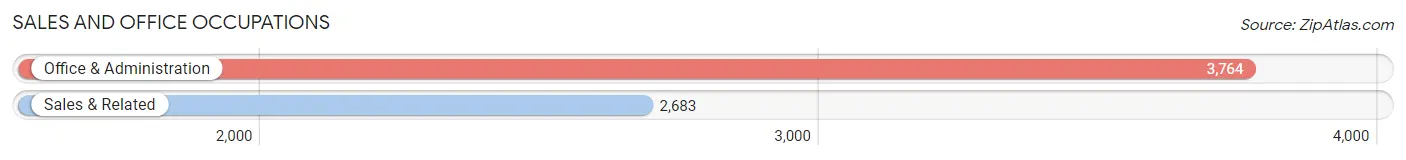
Sales and Office Occupations
The most common Sales and Office occupations in Liberty County are Office & Administration (3,764 | 11.2%), and Sales & Related (2,683 | 8.0%).
Sales and Office Occupations by Sex
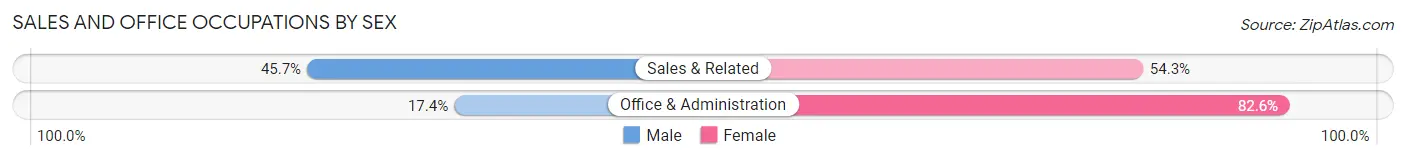
| Occupation | Male | Female |
| Sales & Related | 1,226 (45.7%) | 1,457 (54.3%) |
| Office & Administration | 656 (17.4%) | 3,108 (82.6%) |
| Total (Category) | 1,882 (29.2%) | 4,565 (70.8%) |
| Total (Overall) | 20,369 (60.4%) | 13,339 (39.6%) |
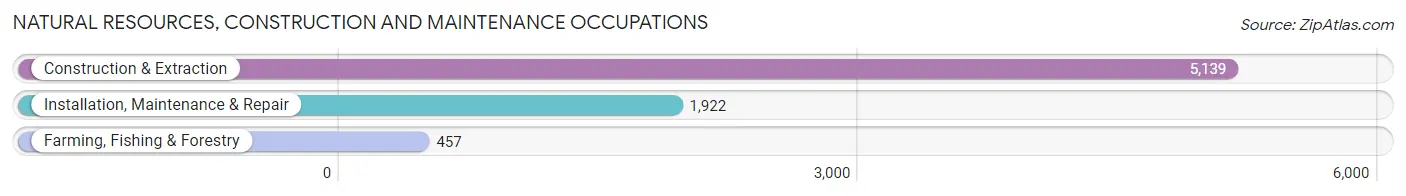
Natural Resources, Construction and Maintenance Occupations
The most common Natural Resources, Construction and Maintenance occupations in Liberty County are Construction & Extraction (5,139 | 15.2%), Installation, Maintenance & Repair (1,922 | 5.7%), and Farming, Fishing & Forestry (457 | 1.4%).
Natural Resources, Construction and Maintenance Occupations by Sex
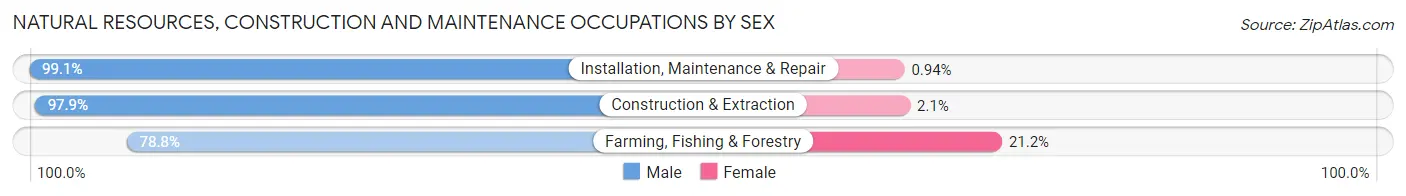
| Occupation | Male | Female |
| Farming, Fishing & Forestry | 360 (78.8%) | 97 (21.2%) |
| Construction & Extraction | 5,030 (97.9%) | 109 (2.1%) |
| Installation, Maintenance & Repair | 1,904 (99.1%) | 18 (0.9%) |
| Total (Category) | 7,294 (97.0%) | 224 (3.0%) |
| Total (Overall) | 20,369 (60.4%) | 13,339 (39.6%) |
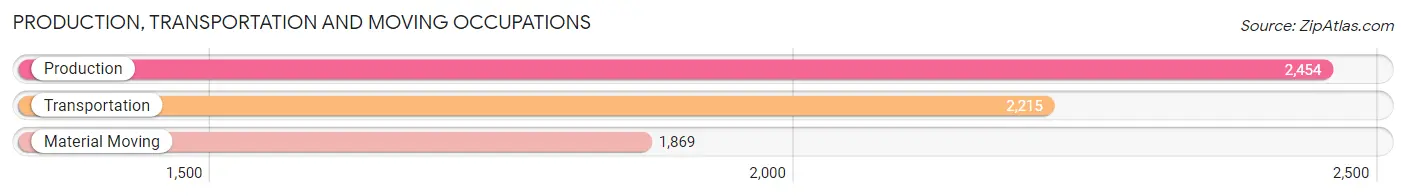
Production, Transportation and Moving Occupations
The most common Production, Transportation and Moving occupations in Liberty County are Production (2,454 | 7.3%), Transportation (2,215 | 6.6%), and Material Moving (1,869 | 5.5%).
Production, Transportation and Moving Occupations by Sex
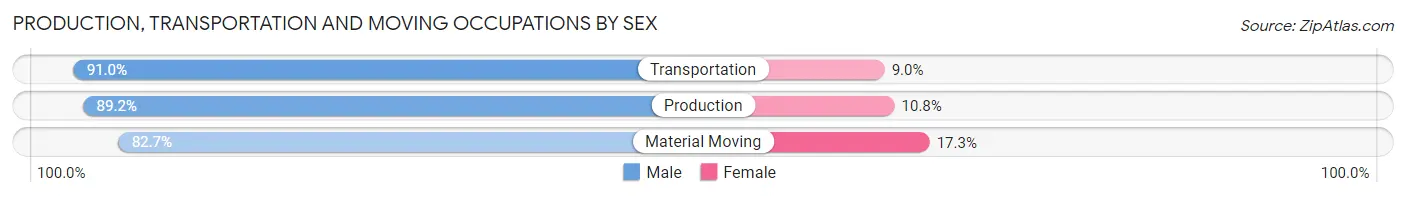
| Occupation | Male | Female |
| Production | 2,188 (89.2%) | 266 (10.8%) |
| Transportation | 2,015 (91.0%) | 200 (9.0%) |
| Material Moving | 1,546 (82.7%) | 323 (17.3%) |
| Total (Category) | 5,749 (87.9%) | 789 (12.1%) |
| Total (Overall) | 20,369 (60.4%) | 13,339 (39.6%) |
Employment Industries by Sex in Liberty County
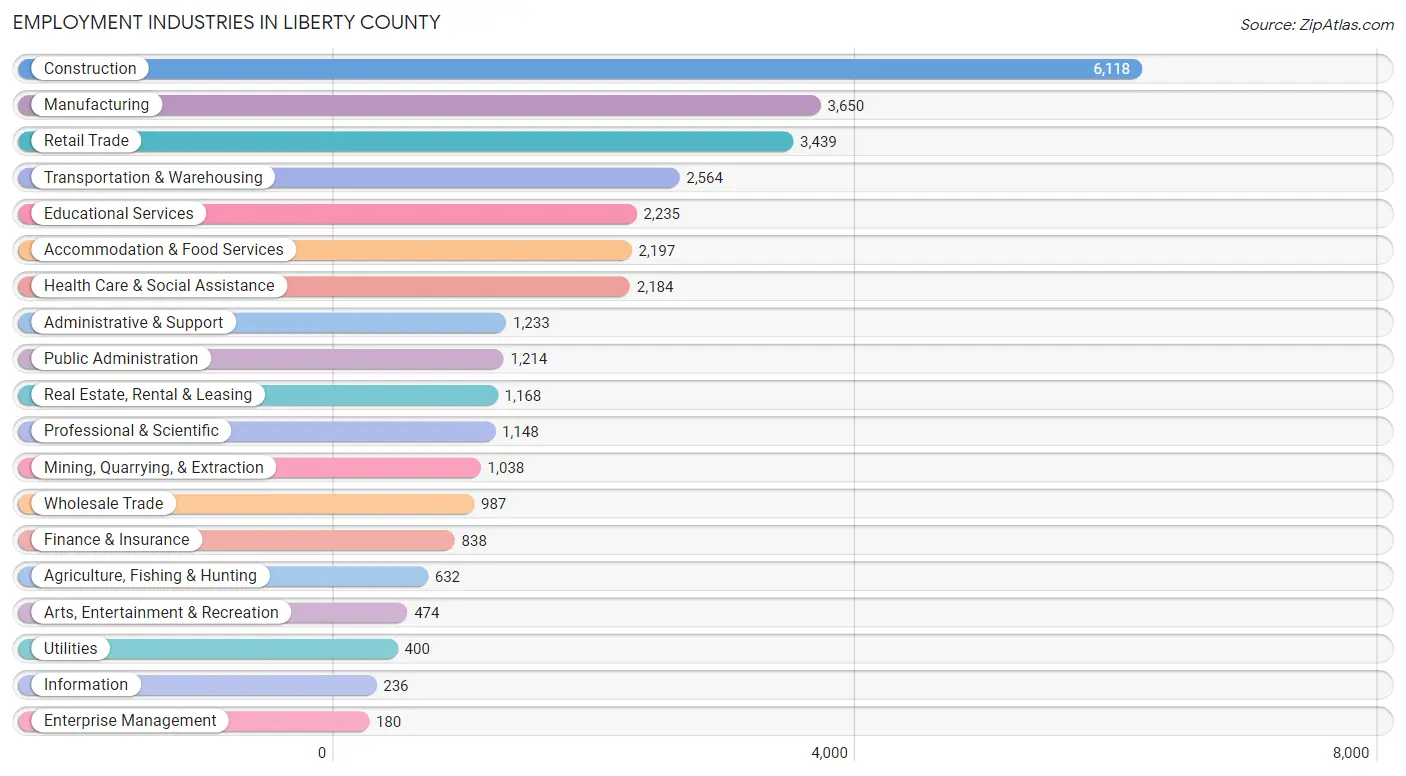
Employment Industries in Liberty County
The major employment industries in Liberty County include Construction (6,118 | 18.1%), Manufacturing (3,650 | 10.8%), Retail Trade (3,439 | 10.2%), Transportation & Warehousing (2,564 | 7.6%), and Educational Services (2,235 | 6.6%).
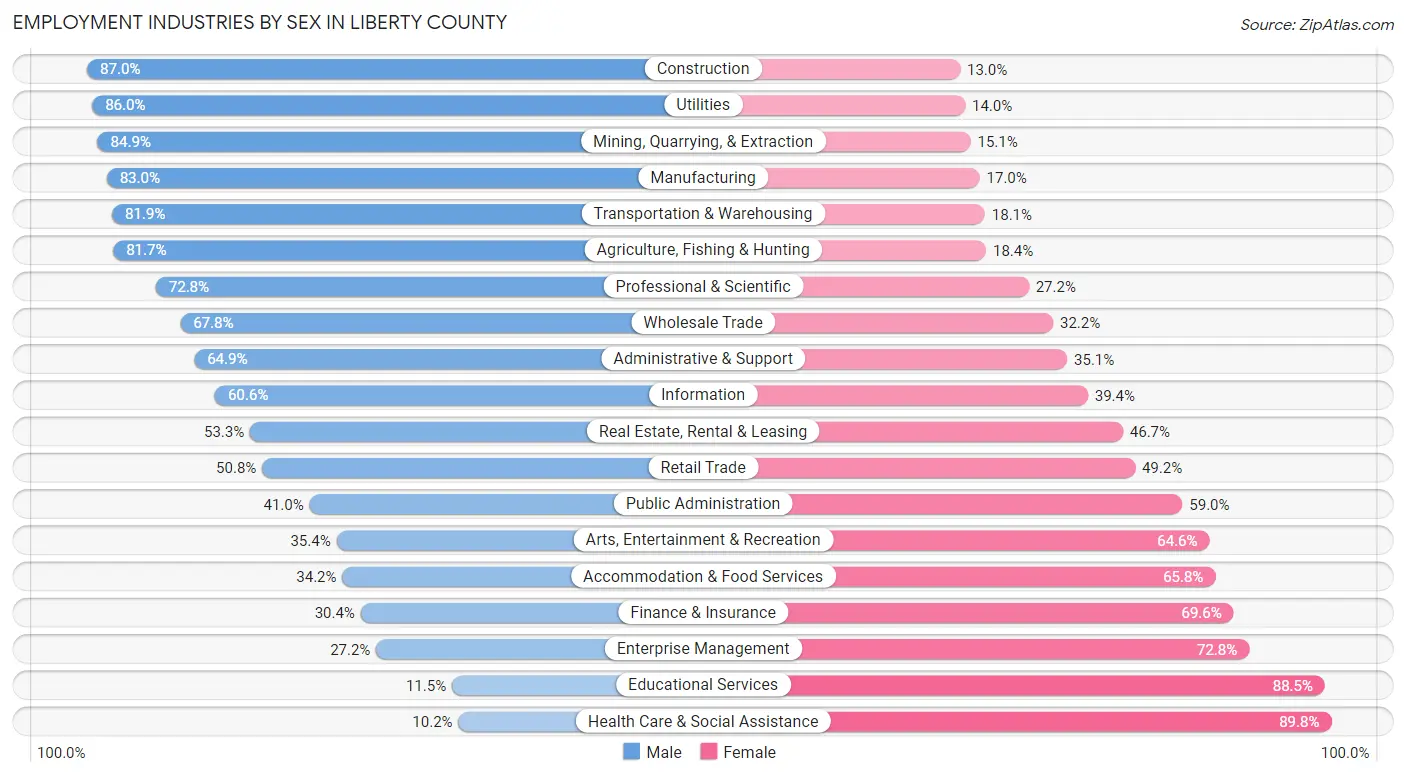
Employment Industries by Sex in Liberty County
The Liberty County industries that see more men than women are Construction (87.0%), Utilities (86.0%), and Mining, Quarrying, & Extraction (84.9%), whereas the industries that tend to have a higher number of women are Health Care & Social Assistance (89.8%), Educational Services (88.5%), and Enterprise Management (72.8%).
| Industry | Male | Female |
| Agriculture, Fishing & Hunting | 516 (81.7%) | 116 (18.3%) |
| Mining, Quarrying, & Extraction | 881 (84.9%) | 157 (15.1%) |
| Construction | 5,325 (87.0%) | 793 (13.0%) |
| Manufacturing | 3,029 (83.0%) | 621 (17.0%) |
| Wholesale Trade | 669 (67.8%) | 318 (32.2%) |
| Retail Trade | 1,748 (50.8%) | 1,691 (49.2%) |
| Transportation & Warehousing | 2,100 (81.9%) | 464 (18.1%) |
| Utilities | 344 (86.0%) | 56 (14.0%) |
| Information | 143 (60.6%) | 93 (39.4%) |
| Finance & Insurance | 255 (30.4%) | 583 (69.6%) |
| Real Estate, Rental & Leasing | 623 (53.3%) | 545 (46.7%) |
| Professional & Scientific | 836 (72.8%) | 312 (27.2%) |
| Enterprise Management | 49 (27.2%) | 131 (72.8%) |
| Administrative & Support | 800 (64.9%) | 433 (35.1%) |
| Educational Services | 258 (11.5%) | 1,977 (88.5%) |
| Health Care & Social Assistance | 223 (10.2%) | 1,961 (89.8%) |
| Arts, Entertainment & Recreation | 168 (35.4%) | 306 (64.6%) |
| Accommodation & Food Services | 752 (34.2%) | 1,445 (65.8%) |
| Public Administration | 498 (41.0%) | 716 (59.0%) |
| Total | 20,369 (60.4%) | 13,339 (39.6%) |
Education in Liberty County
School Enrollment in Liberty County
The most common levels of schooling among the 22,325 students in Liberty County are middle school (6,642 | 29.7%), high school (5,421 | 24.3%), and elementary school (5,383 | 24.1%).
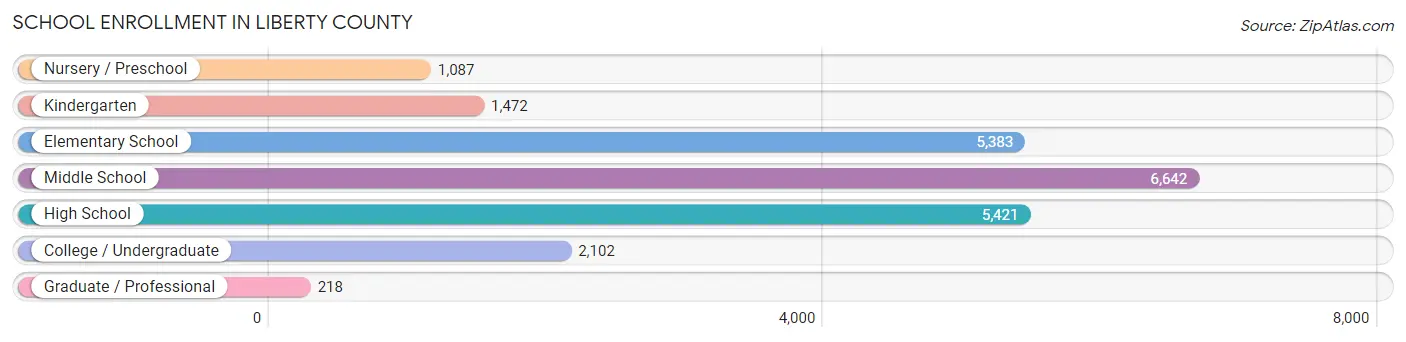
| School Level | # Students | % Students |
| Nursery / Preschool | 1,087 | 4.9% |
| Kindergarten | 1,472 | 6.6% |
| Elementary School | 5,383 | 24.1% |
| Middle School | 6,642 | 29.7% |
| High School | 5,421 | 24.3% |
| College / Undergraduate | 2,102 | 9.4% |
| Graduate / Professional | 218 | 1.0% |
| Total | 22,325 | 100.0% |
School Enrollment by Age by Funding Source in Liberty County
Out of a total of 22,325 students who are enrolled in schools in Liberty County, 2,411 (10.8%) attend a private institution, while the remaining 19,914 (89.2%) are enrolled in public schools. The age group of 35 years and over has the highest likelihood of being enrolled in private schools, with 104 (37.7% in the age bracket) enrolled. Conversely, the age group of 10 to 14 year olds has the lowest likelihood of being enrolled in a private school, with 7,495 (96.0% in the age bracket) attending a public institution.
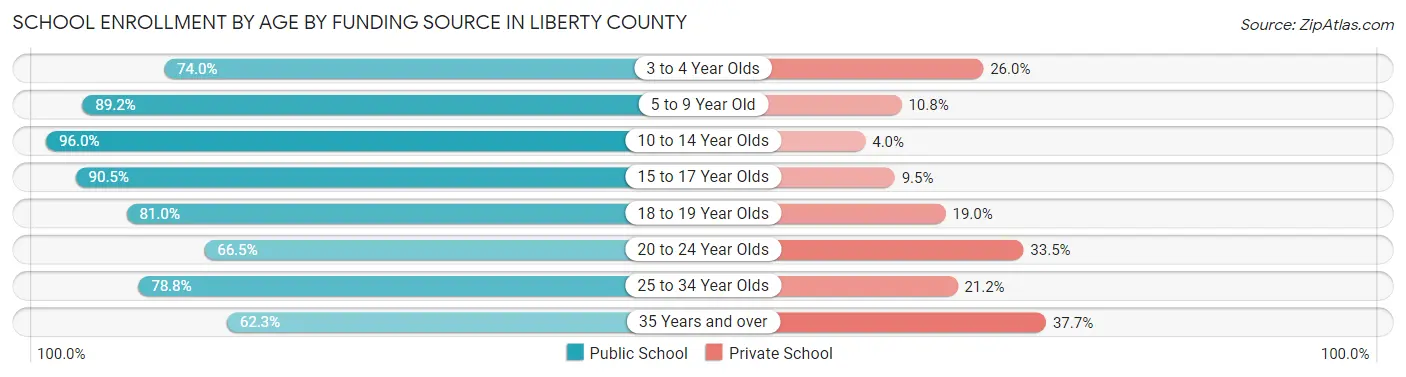
| Age Bracket | Public School | Private School |
| 3 to 4 Year Olds | 572 (74.0%) | 201 (26.0%) |
| 5 to 9 Year Old | 5,692 (89.2%) | 687 (10.8%) |
| 10 to 14 Year Olds | 7,495 (96.0%) | 314 (4.0%) |
| 15 to 17 Year Olds | 3,664 (90.5%) | 385 (9.5%) |
| 18 to 19 Year Olds | 1,187 (81.0%) | 278 (19.0%) |
| 20 to 24 Year Olds | 598 (66.5%) | 301 (33.5%) |
| 25 to 34 Year Olds | 532 (78.8%) | 143 (21.2%) |
| 35 Years and over | 172 (62.3%) | 104 (37.7%) |
| Total | 19,914 (89.2%) | 2,411 (10.8%) |
Educational Attainment by Field of Study in Liberty County
Business (1,459 | 22.1%), education (1,278 | 19.4%), social sciences (579 | 8.8%), science & technology (573 | 8.7%), and arts & humanities (489 | 7.4%) are the most common fields of study among 6,600 individuals in Liberty County who have obtained a bachelor's degree or higher.
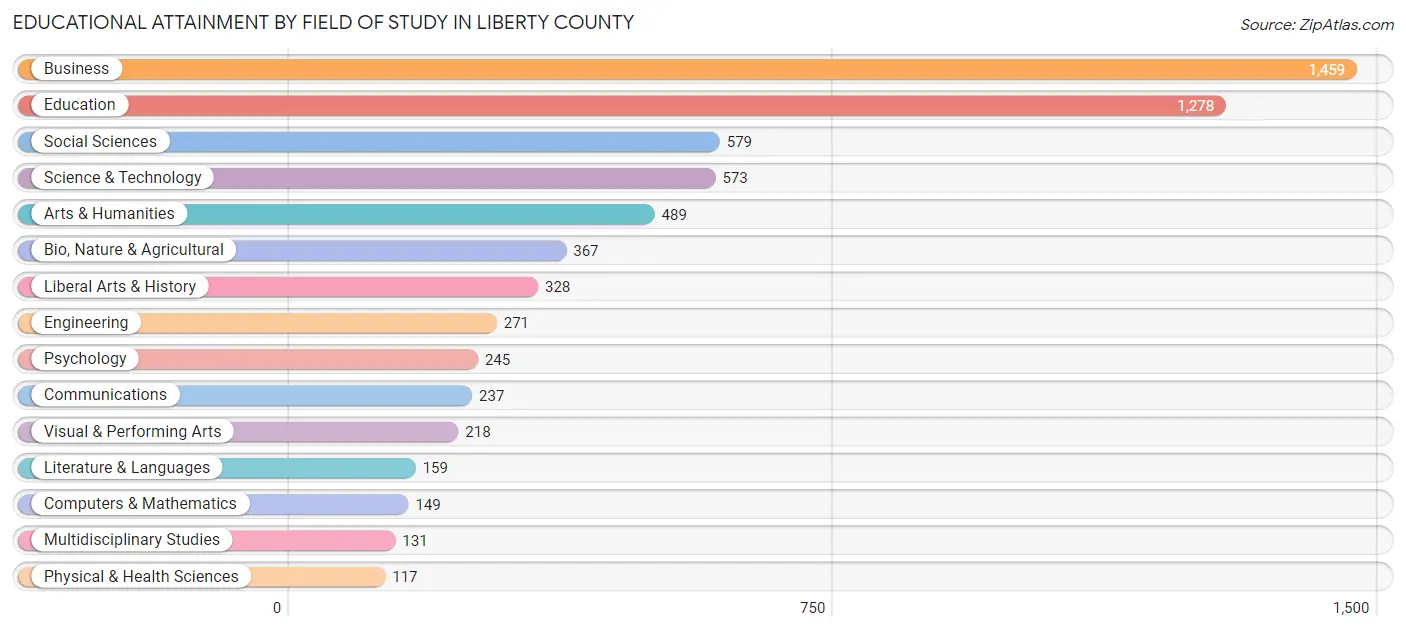
| Field of Study | # Graduates | % Graduates |
| Computers & Mathematics | 149 | 2.3% |
| Bio, Nature & Agricultural | 367 | 5.6% |
| Physical & Health Sciences | 117 | 1.8% |
| Psychology | 245 | 3.7% |
| Social Sciences | 579 | 8.8% |
| Engineering | 271 | 4.1% |
| Multidisciplinary Studies | 131 | 2.0% |
| Science & Technology | 573 | 8.7% |
| Business | 1,459 | 22.1% |
| Education | 1,278 | 19.4% |
| Literature & Languages | 159 | 2.4% |
| Liberal Arts & History | 328 | 5.0% |
| Visual & Performing Arts | 218 | 3.3% |
| Communications | 237 | 3.6% |
| Arts & Humanities | 489 | 7.4% |
| Total | 6,600 | 100.0% |
Transportation & Commute in Liberty County
Vehicle Availability by Sex in Liberty County
The most prevalent vehicle ownership categories in Liberty County are males with 2 vehicles (8,631, accounting for 43.3%) and females with 2 vehicles (5,553, making up 66.3%).
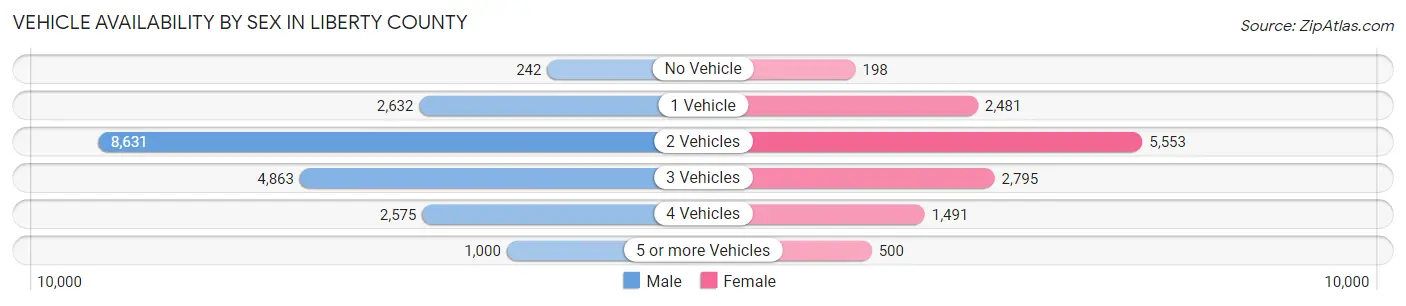
| Vehicles Available | Male | Female |
| No Vehicle | 242 (1.2%) | 198 (1.5%) |
| 1 Vehicle | 2,632 (13.2%) | 2,481 (19.1%) |
| 2 Vehicles | 8,631 (43.3%) | 5,553 (42.7%) |
| 3 Vehicles | 4,863 (24.4%) | 2,795 (21.5%) |
| 4 Vehicles | 2,575 (12.9%) | 1,491 (11.5%) |
| 5 or more Vehicles | 1,000 (5.0%) | 500 (3.8%) |
| Total | 19,943 (100.0%) | 13,018 (100.0%) |
Commute Time in Liberty County
The most frequently occuring commute durations in Liberty County are 60 to 89 minutes (5,910 commuters, 19.2%), 30 to 34 minutes (4,846 commuters, 15.7%), and 45 to 59 minutes (4,239 commuters, 13.8%).
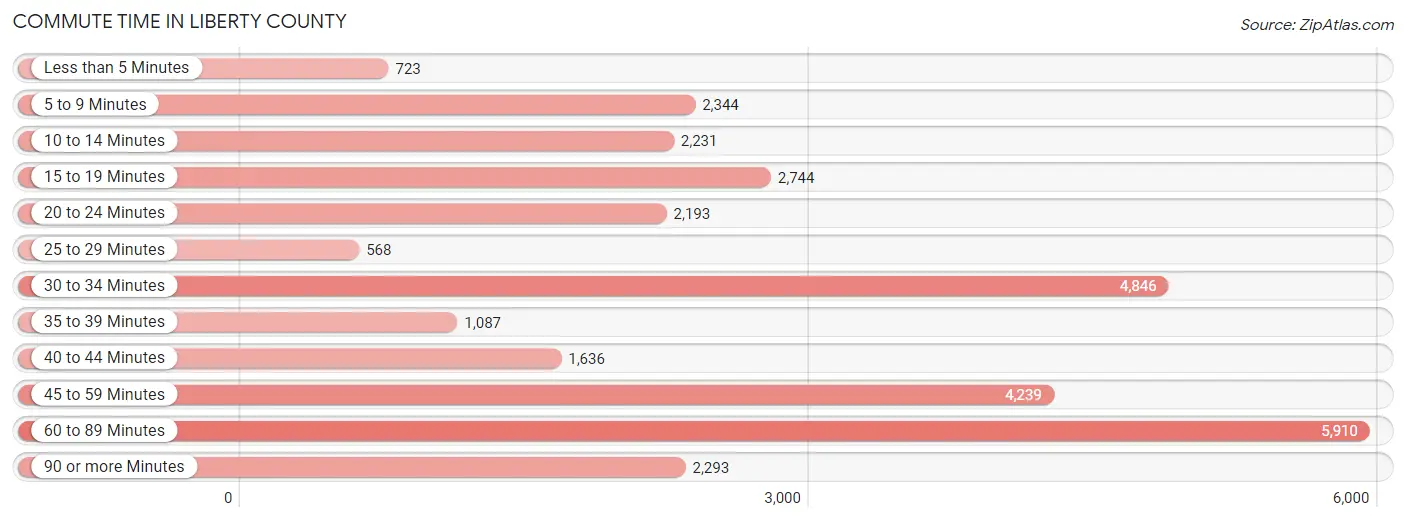
| Commute Time | # Commuters | % Commuters |
| Less than 5 Minutes | 723 | 2.4% |
| 5 to 9 Minutes | 2,344 | 7.6% |
| 10 to 14 Minutes | 2,231 | 7.2% |
| 15 to 19 Minutes | 2,744 | 8.9% |
| 20 to 24 Minutes | 2,193 | 7.1% |
| 25 to 29 Minutes | 568 | 1.8% |
| 30 to 34 Minutes | 4,846 | 15.7% |
| 35 to 39 Minutes | 1,087 | 3.5% |
| 40 to 44 Minutes | 1,636 | 5.3% |
| 45 to 59 Minutes | 4,239 | 13.8% |
| 60 to 89 Minutes | 5,910 | 19.2% |
| 90 or more Minutes | 2,293 | 7.4% |
Commute Time by Sex in Liberty County
The most common commute times in Liberty County are 60 to 89 minutes (4,777 commuters, 25.1%) for males and 15 to 19 minutes (1,895 commuters, 16.1%) for females.
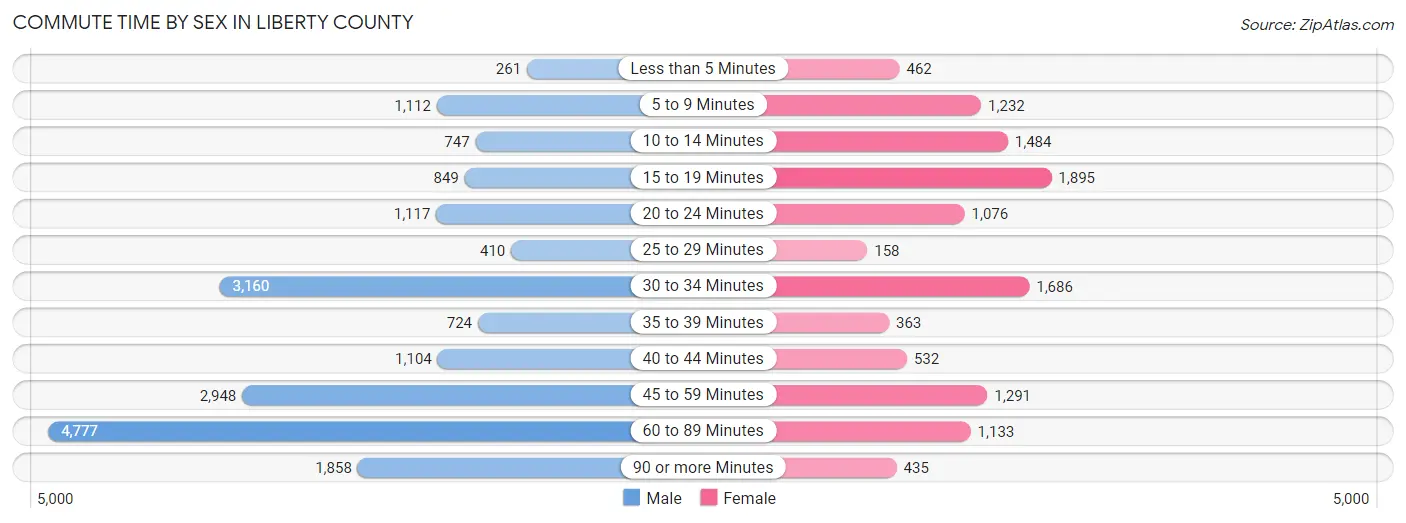
| Commute Time | Male | Female |
| Less than 5 Minutes | 261 (1.4%) | 462 (3.9%) |
| 5 to 9 Minutes | 1,112 (5.8%) | 1,232 (10.5%) |
| 10 to 14 Minutes | 747 (3.9%) | 1,484 (12.6%) |
| 15 to 19 Minutes | 849 (4.4%) | 1,895 (16.1%) |
| 20 to 24 Minutes | 1,117 (5.9%) | 1,076 (9.2%) |
| 25 to 29 Minutes | 410 (2.1%) | 158 (1.3%) |
| 30 to 34 Minutes | 3,160 (16.6%) | 1,686 (14.3%) |
| 35 to 39 Minutes | 724 (3.8%) | 363 (3.1%) |
| 40 to 44 Minutes | 1,104 (5.8%) | 532 (4.5%) |
| 45 to 59 Minutes | 2,948 (15.5%) | 1,291 (11.0%) |
| 60 to 89 Minutes | 4,777 (25.1%) | 1,133 (9.7%) |
| 90 or more Minutes | 1,858 (9.7%) | 435 (3.7%) |
Time of Departure to Work by Sex in Liberty County
The most frequent times of departure to work in Liberty County are 12:00 AM to 4:59 AM (3,809, 20.0%) for males and 7:00 AM to 7:29 AM (2,093, 17.8%) for females.
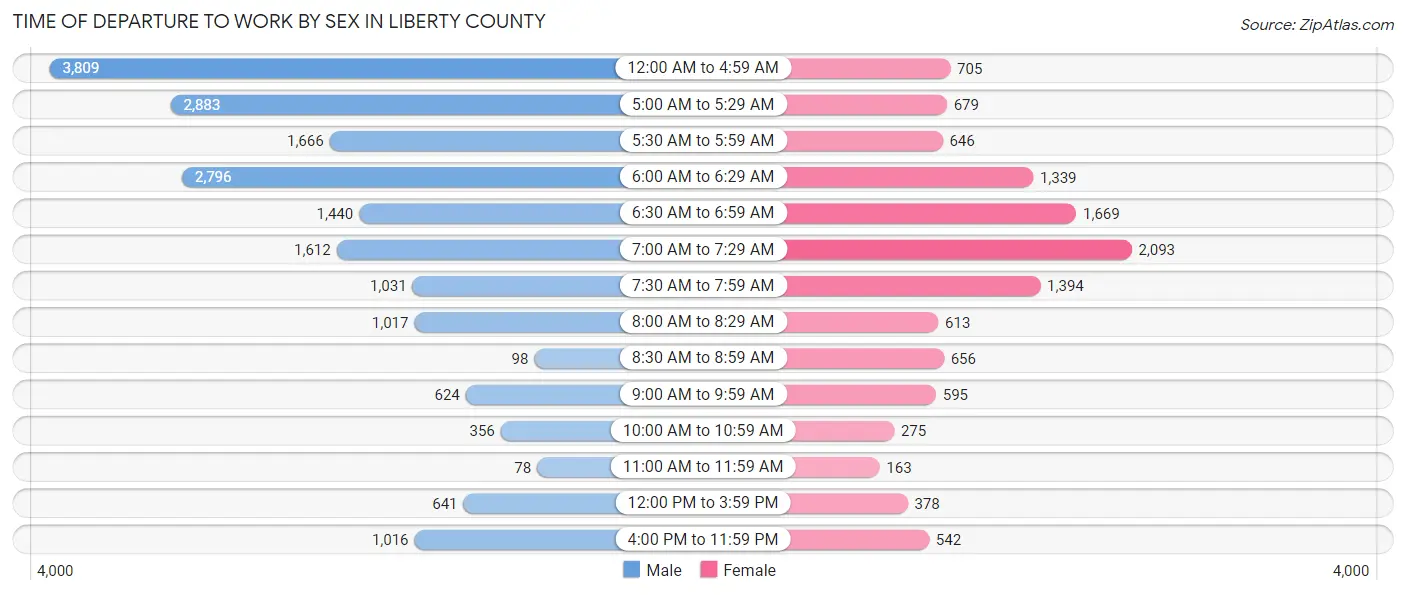
| Time of Departure | Male | Female |
| 12:00 AM to 4:59 AM | 3,809 (20.0%) | 705 (6.0%) |
| 5:00 AM to 5:29 AM | 2,883 (15.1%) | 679 (5.8%) |
| 5:30 AM to 5:59 AM | 1,666 (8.7%) | 646 (5.5%) |
| 6:00 AM to 6:29 AM | 2,796 (14.7%) | 1,339 (11.4%) |
| 6:30 AM to 6:59 AM | 1,440 (7.5%) | 1,669 (14.2%) |
| 7:00 AM to 7:29 AM | 1,612 (8.5%) | 2,093 (17.8%) |
| 7:30 AM to 7:59 AM | 1,031 (5.4%) | 1,394 (11.9%) |
| 8:00 AM to 8:29 AM | 1,017 (5.3%) | 613 (5.2%) |
| 8:30 AM to 8:59 AM | 98 (0.5%) | 656 (5.6%) |
| 9:00 AM to 9:59 AM | 624 (3.3%) | 595 (5.1%) |
| 10:00 AM to 10:59 AM | 356 (1.9%) | 275 (2.3%) |
| 11:00 AM to 11:59 AM | 78 (0.4%) | 163 (1.4%) |
| 12:00 PM to 3:59 PM | 641 (3.4%) | 378 (3.2%) |
| 4:00 PM to 11:59 PM | 1,016 (5.3%) | 542 (4.6%) |
| Total | 19,067 (100.0%) | 11,747 (100.0%) |
Housing Occupancy in Liberty County
Occupancy by Ownership in Liberty County
Of the total 28,921 dwellings in Liberty County, owner-occupied units account for 23,359 (80.8%), while renter-occupied units make up 5,562 (19.2%).
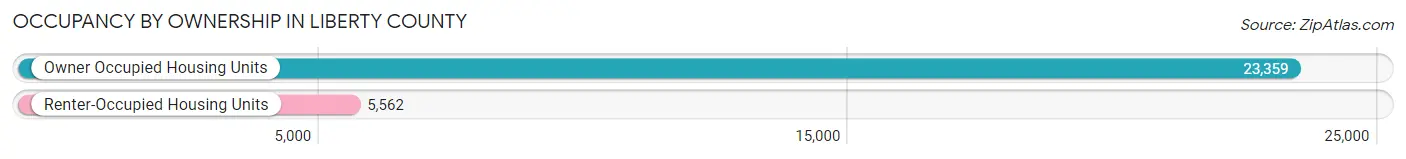
| Occupancy | # Housing Units | % Housing Units |
| Owner Occupied Housing Units | 23,359 | 80.8% |
| Renter-Occupied Housing Units | 5,562 | 19.2% |
| Total Occupied Housing Units | 28,921 | 100.0% |
Occupancy by Household Size in Liberty County
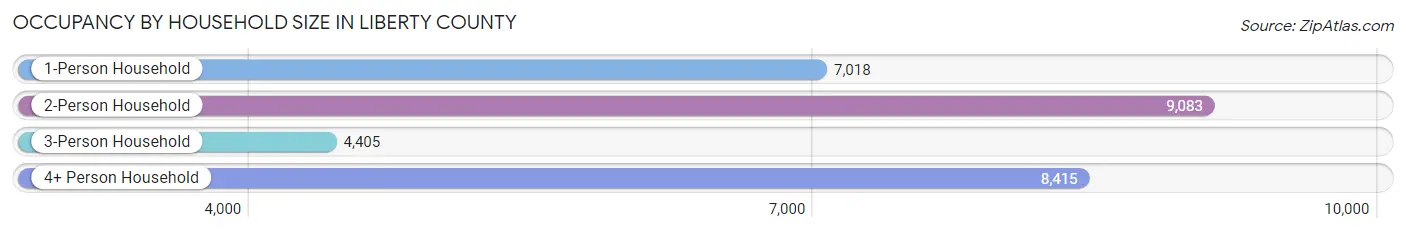
| Household Size | # Housing Units | % Housing Units |
| 1-Person Household | 7,018 | 24.3% |
| 2-Person Household | 9,083 | 31.4% |
| 3-Person Household | 4,405 | 15.2% |
| 4+ Person Household | 8,415 | 29.1% |
| Total Housing Units | 28,921 | 100.0% |
Occupancy by Ownership by Household Size in Liberty County
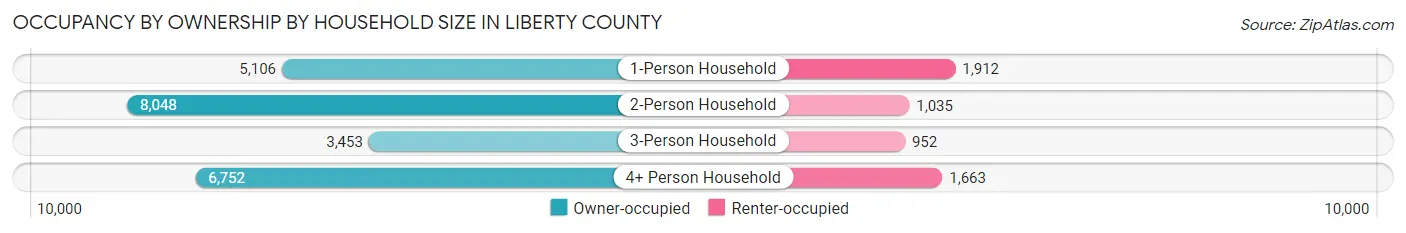
| Household Size | Owner-occupied | Renter-occupied |
| 1-Person Household | 5,106 (72.8%) | 1,912 (27.2%) |
| 2-Person Household | 8,048 (88.6%) | 1,035 (11.4%) |
| 3-Person Household | 3,453 (78.4%) | 952 (21.6%) |
| 4+ Person Household | 6,752 (80.2%) | 1,663 (19.8%) |
| Total Housing Units | 23,359 (80.8%) | 5,562 (19.2%) |
Occupancy by Educational Attainment in Liberty County
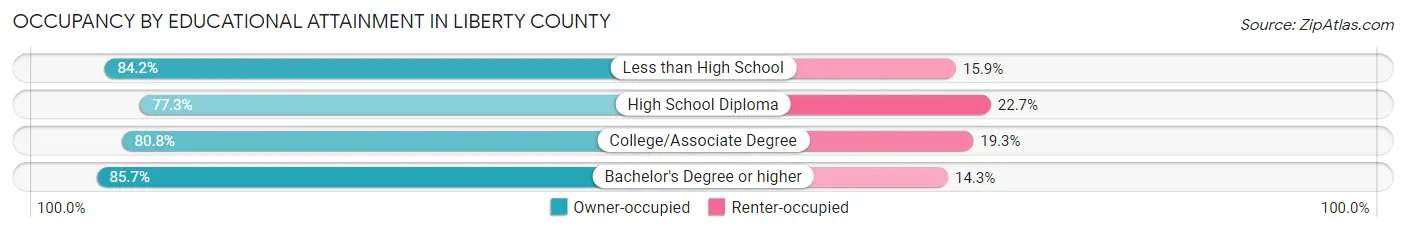
| Household Size | Owner-occupied | Renter-occupied |
| Less than High School | 4,720 (84.2%) | 889 (15.9%) |
| High School Diploma | 8,247 (77.3%) | 2,428 (22.7%) |
| College/Associate Degree | 7,163 (80.7%) | 1,708 (19.3%) |
| Bachelor's Degree or higher | 3,229 (85.7%) | 537 (14.3%) |
Occupancy by Age of Householder in Liberty County
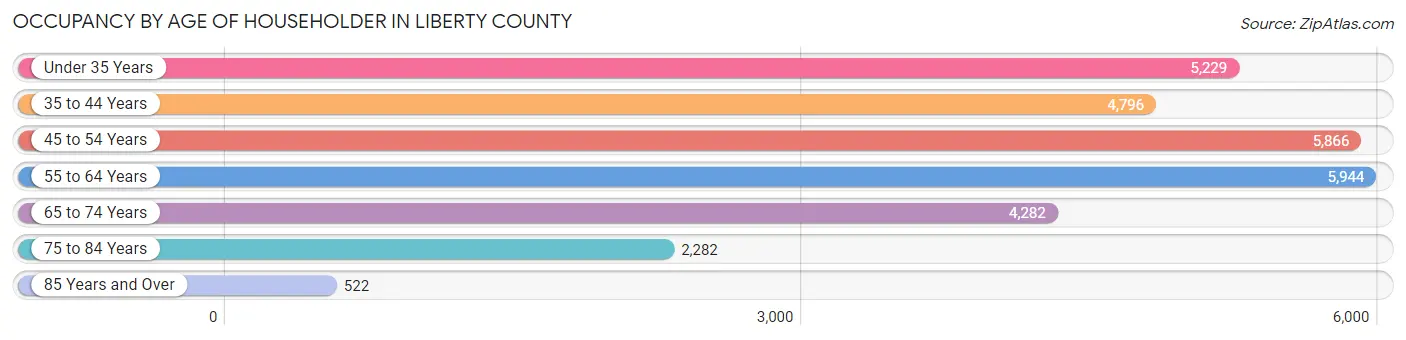
| Age Bracket | # Households | % Households |
| Under 35 Years | 5,229 | 18.1% |
| 35 to 44 Years | 4,796 | 16.6% |
| 45 to 54 Years | 5,866 | 20.3% |
| 55 to 64 Years | 5,944 | 20.5% |
| 65 to 74 Years | 4,282 | 14.8% |
| 75 to 84 Years | 2,282 | 7.9% |
| 85 Years and Over | 522 | 1.8% |
| Total | 28,921 | 100.0% |
Housing Finances in Liberty County
Median Income by Occupancy in Liberty County
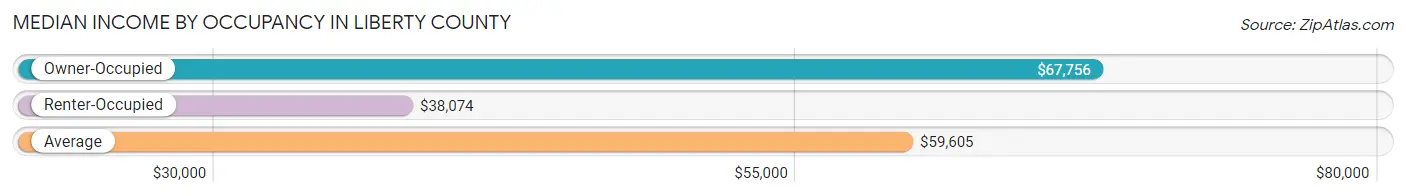
| Occupancy Type | # Households | Median Income |
| Owner-Occupied | 23,359 (80.8%) | $67,756 |
| Renter-Occupied | 5,562 (19.2%) | $38,074 |
| Average | 28,921 (100.0%) | $59,605 |
Occupancy by Householder Income Bracket in Liberty County
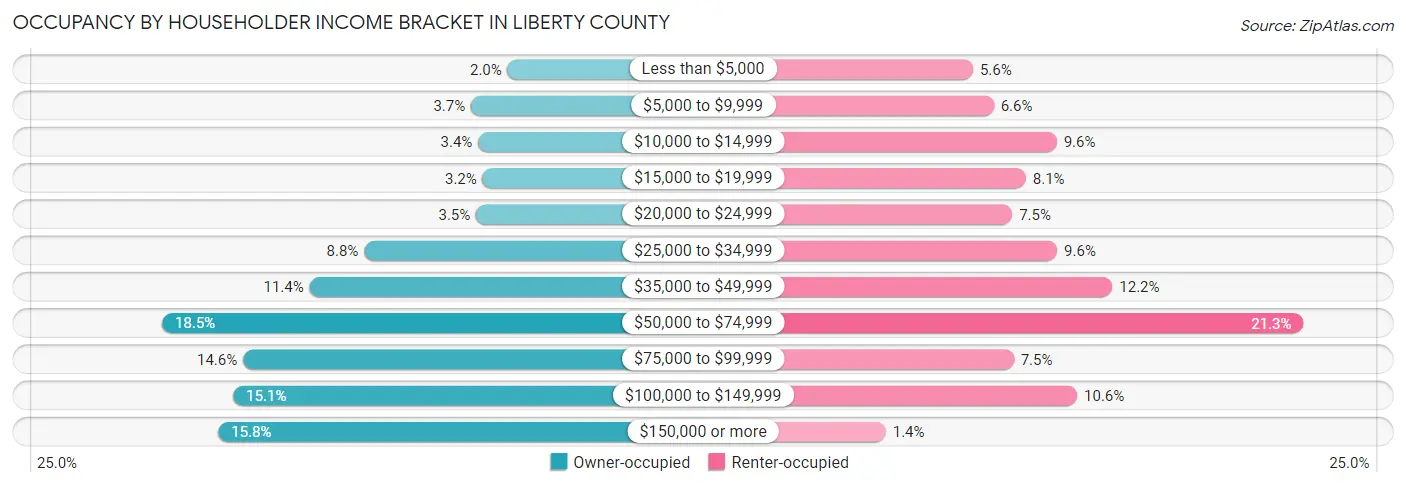
| Income Bracket | Owner-occupied | Renter-occupied |
| Less than $5,000 | 467 (2.0%) | 311 (5.6%) |
| $5,000 to $9,999 | 873 (3.7%) | 366 (6.6%) |
| $10,000 to $14,999 | 795 (3.4%) | 533 (9.6%) |
| $15,000 to $19,999 | 746 (3.2%) | 451 (8.1%) |
| $20,000 to $24,999 | 817 (3.5%) | 415 (7.5%) |
| $25,000 to $34,999 | 2,062 (8.8%) | 534 (9.6%) |
| $35,000 to $49,999 | 2,671 (11.4%) | 680 (12.2%) |
| $50,000 to $74,999 | 4,311 (18.5%) | 1,186 (21.3%) |
| $75,000 to $99,999 | 3,411 (14.6%) | 419 (7.5%) |
| $100,000 to $149,999 | 3,520 (15.1%) | 587 (10.5%) |
| $150,000 or more | 3,686 (15.8%) | 80 (1.4%) |
| Total | 23,359 (100.0%) | 5,562 (100.0%) |
Monthly Housing Cost Tiers in Liberty County
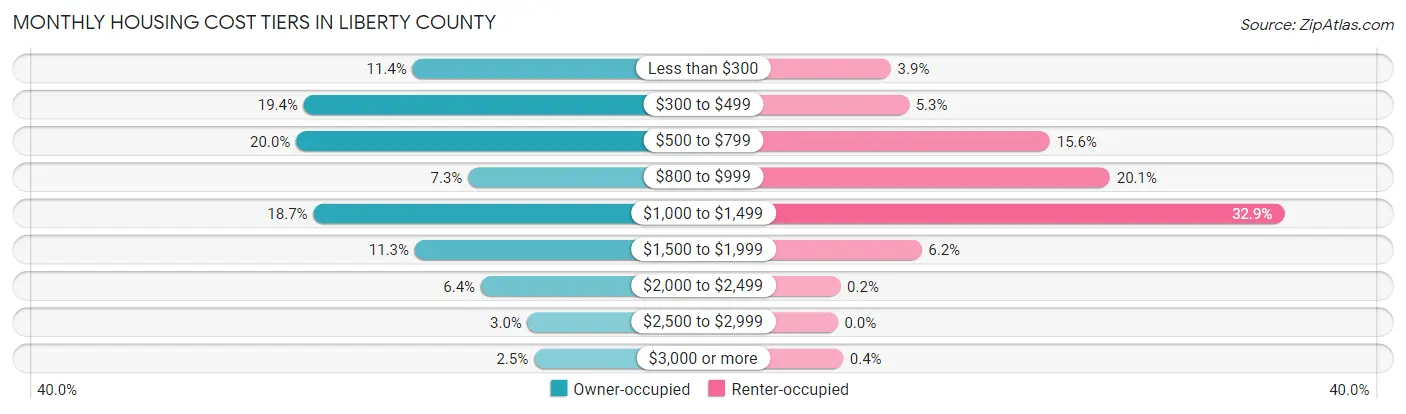
| Monthly Cost | Owner-occupied | Renter-occupied |
| Less than $300 | 2,669 (11.4%) | 218 (3.9%) |
| $300 to $499 | 4,541 (19.4%) | 292 (5.2%) |
| $500 to $799 | 4,672 (20.0%) | 870 (15.6%) |
| $800 to $999 | 1,712 (7.3%) | 1,116 (20.1%) |
| $1,000 to $1,499 | 4,374 (18.7%) | 1,830 (32.9%) |
| $1,500 to $1,999 | 2,630 (11.3%) | 344 (6.2%) |
| $2,000 to $2,499 | 1,492 (6.4%) | 11 (0.2%) |
| $2,500 to $2,999 | 689 (2.9%) | 0 (0.0%) |
| $3,000 or more | 580 (2.5%) | 22 (0.4%) |
| Total | 23,359 (100.0%) | 5,562 (100.0%) |
Physical Housing Characteristics in Liberty County
Housing Structures in Liberty County
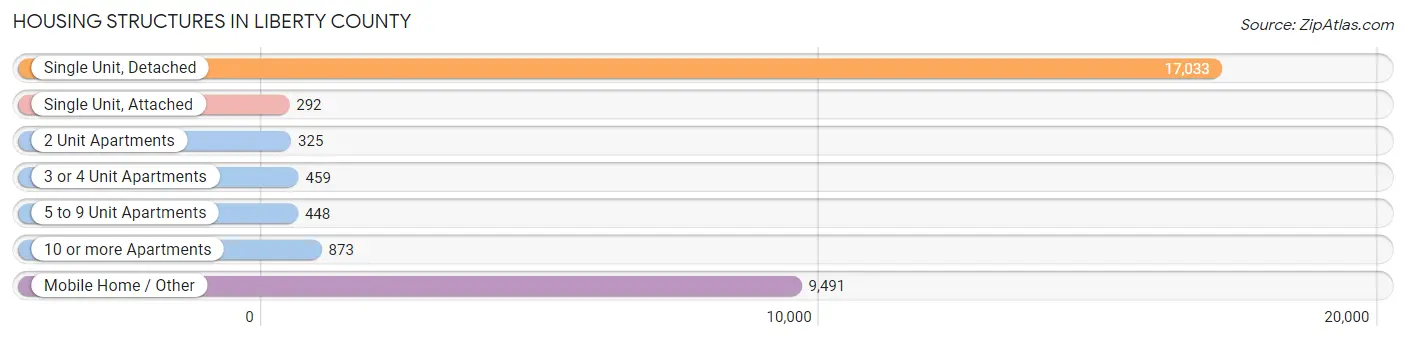
| Structure Type | # Housing Units | % Housing Units |
| Single Unit, Detached | 17,033 | 58.9% |
| Single Unit, Attached | 292 | 1.0% |
| 2 Unit Apartments | 325 | 1.1% |
| 3 or 4 Unit Apartments | 459 | 1.6% |
| 5 to 9 Unit Apartments | 448 | 1.5% |
| 10 or more Apartments | 873 | 3.0% |
| Mobile Home / Other | 9,491 | 32.8% |
| Total | 28,921 | 100.0% |
Housing Structures by Occupancy in Liberty County
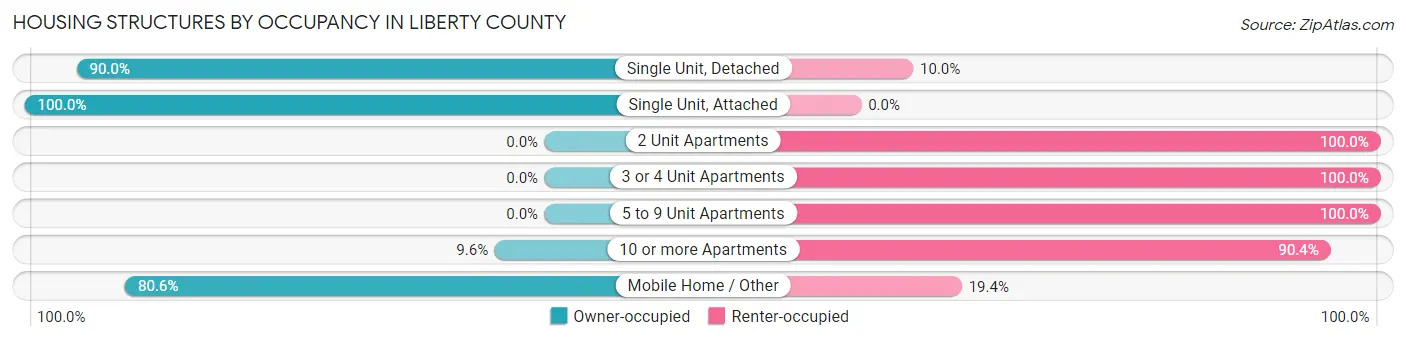
| Structure Type | Owner-occupied | Renter-occupied |
| Single Unit, Detached | 15,329 (90.0%) | 1,704 (10.0%) |
| Single Unit, Attached | 292 (100.0%) | 0 (0.0%) |
| 2 Unit Apartments | 0 (0.0%) | 325 (100.0%) |
| 3 or 4 Unit Apartments | 0 (0.0%) | 459 (100.0%) |
| 5 to 9 Unit Apartments | 0 (0.0%) | 448 (100.0%) |
| 10 or more Apartments | 84 (9.6%) | 789 (90.4%) |
| Mobile Home / Other | 7,654 (80.6%) | 1,837 (19.4%) |
| Total | 23,359 (80.8%) | 5,562 (19.2%) |
Housing Structures by Number of Rooms in Liberty County
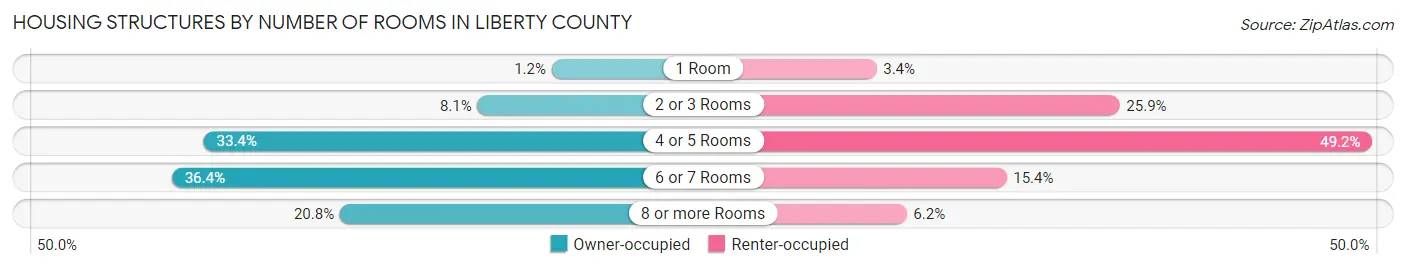
| Number of Rooms | Owner-occupied | Renter-occupied |
| 1 Room | 290 (1.2%) | 187 (3.4%) |
| 2 or 3 Rooms | 1,893 (8.1%) | 1,438 (25.9%) |
| 4 or 5 Rooms | 7,811 (33.4%) | 2,739 (49.2%) |
| 6 or 7 Rooms | 8,500 (36.4%) | 856 (15.4%) |
| 8 or more Rooms | 4,865 (20.8%) | 342 (6.1%) |
| Total | 23,359 (100.0%) | 5,562 (100.0%) |
Housing Structure by Heating Type in Liberty County
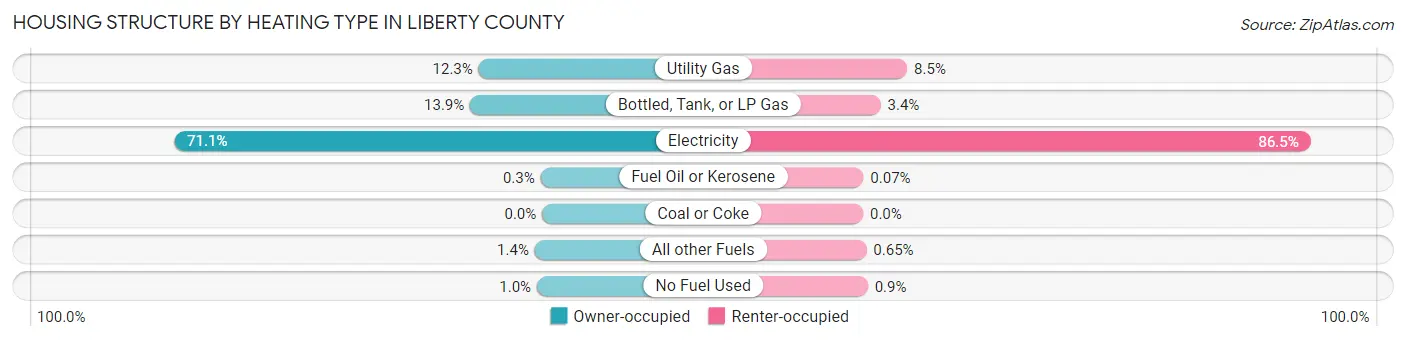
| Heating Type | Owner-occupied | Renter-occupied |
| Utility Gas | 2,867 (12.3%) | 474 (8.5%) |
| Bottled, Tank, or LP Gas | 3,249 (13.9%) | 189 (3.4%) |
| Electricity | 16,607 (71.1%) | 4,809 (86.5%) |
| Fuel Oil or Kerosene | 71 (0.3%) | 4 (0.1%) |
| Coal or Coke | 0 (0.0%) | 0 (0.0%) |
| All other Fuels | 331 (1.4%) | 36 (0.6%) |
| No Fuel Used | 234 (1.0%) | 50 (0.9%) |
| Total | 23,359 (100.0%) | 5,562 (100.0%) |
Household Vehicle Usage in Liberty County
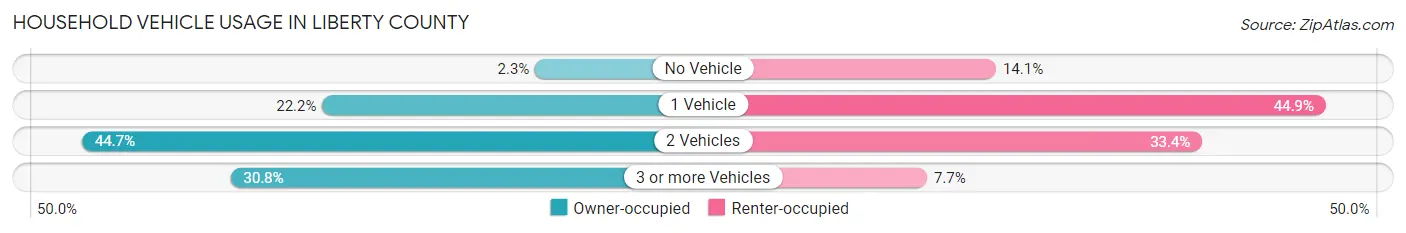
| Vehicles per Household | Owner-occupied | Renter-occupied |
| No Vehicle | 546 (2.3%) | 784 (14.1%) |
| 1 Vehicle | 5,188 (22.2%) | 2,497 (44.9%) |
| 2 Vehicles | 10,433 (44.7%) | 1,855 (33.4%) |
| 3 or more Vehicles | 7,192 (30.8%) | 426 (7.7%) |
| Total | 23,359 (100.0%) | 5,562 (100.0%) |
Real Estate & Mortgages in Liberty County
Real Estate and Mortgage Overview in Liberty County
| Characteristic | Without Mortgage | With Mortgage |
| Housing Units | 13,540 | 9,819 |
| Median Property Value | $117,800 | $198,200 |
| Median Household Income | $52,350 | $2,346 |
| Monthly Housing Costs | $486 | $548 |
| Real Estate Taxes | $1,621 | $531 |
Property Value by Mortgage Status in Liberty County
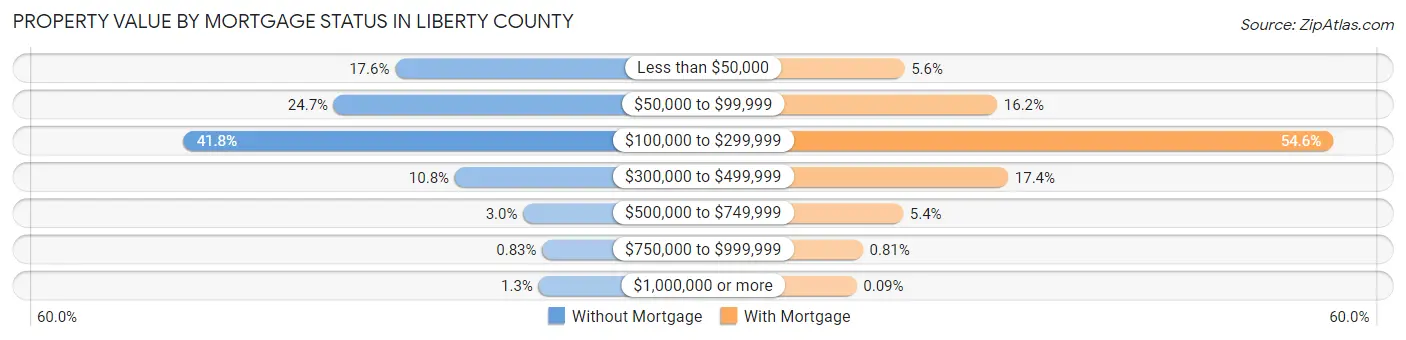
| Property Value | Without Mortgage | With Mortgage |
| Less than $50,000 | 2,388 (17.6%) | 546 (5.6%) |
| $50,000 to $99,999 | 3,337 (24.6%) | 1,586 (16.2%) |
| $100,000 to $299,999 | 5,661 (41.8%) | 5,358 (54.6%) |
| $300,000 to $499,999 | 1,465 (10.8%) | 1,709 (17.4%) |
| $500,000 to $749,999 | 408 (3.0%) | 531 (5.4%) |
| $750,000 to $999,999 | 112 (0.8%) | 80 (0.8%) |
| $1,000,000 or more | 169 (1.3%) | 9 (0.1%) |
| Total | 13,540 (100.0%) | 9,819 (100.0%) |
Household Income by Mortgage Status in Liberty County
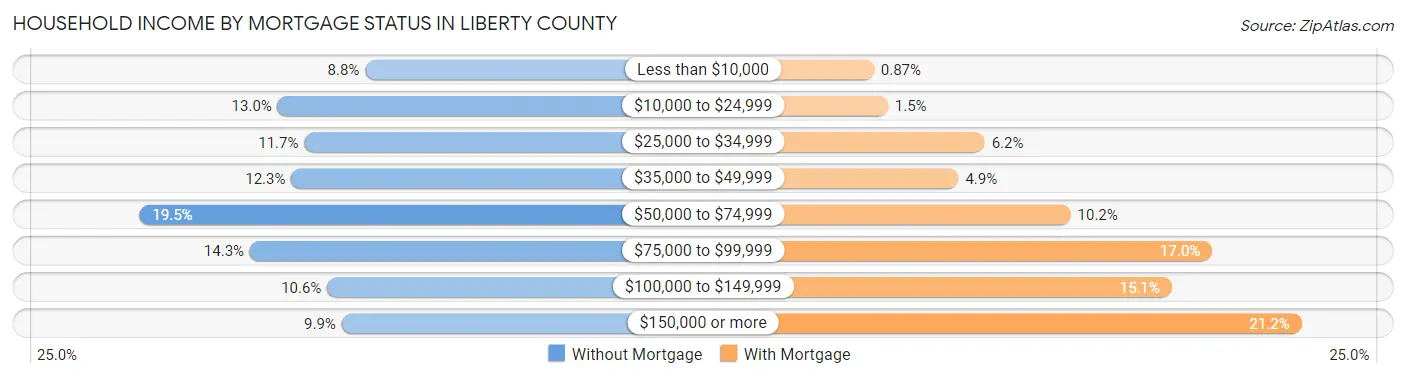
| Household Income | Without Mortgage | With Mortgage |
| Less than $10,000 | 1,189 (8.8%) | 85 (0.9%) |
| $10,000 to $24,999 | 1,754 (13.0%) | 151 (1.5%) |
| $25,000 to $34,999 | 1,581 (11.7%) | 604 (6.1%) |
| $35,000 to $49,999 | 1,666 (12.3%) | 481 (4.9%) |
| $50,000 to $74,999 | 2,644 (19.5%) | 1,005 (10.2%) |
| $75,000 to $99,999 | 1,932 (14.3%) | 1,667 (17.0%) |
| $100,000 to $149,999 | 1,434 (10.6%) | 1,479 (15.1%) |
| $150,000 or more | 1,340 (9.9%) | 2,086 (21.2%) |
| Total | 13,540 (100.0%) | 9,819 (100.0%) |
Property Value to Household Income Ratio in Liberty County
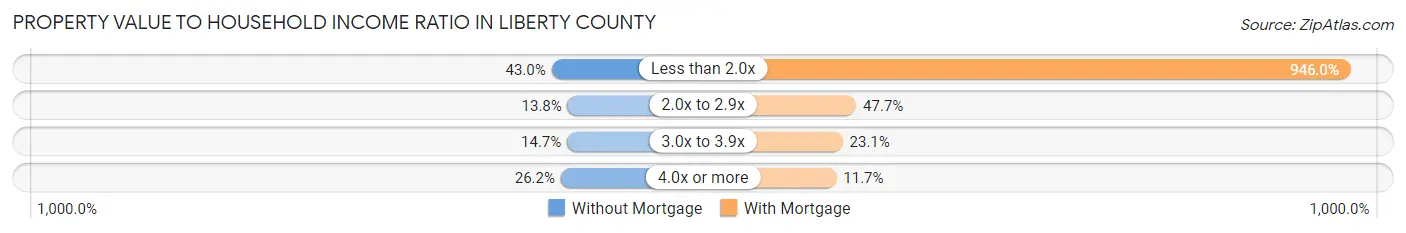
| Value-to-Income Ratio | Without Mortgage | With Mortgage |
| Less than 2.0x | 5,820 (43.0%) | 92,884 (946.0%) |
| 2.0x to 2.9x | 1,873 (13.8%) | 4,681 (47.7%) |
| 3.0x to 3.9x | 1,993 (14.7%) | 2,267 (23.1%) |
| 4.0x or more | 3,544 (26.2%) | 1,145 (11.7%) |
| Total | 13,540 (100.0%) | 9,819 (100.0%) |
Real Estate Taxes by Mortgage Status in Liberty County
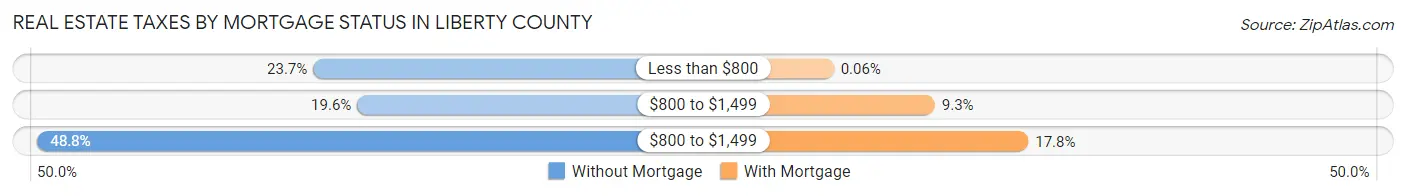
| Property Taxes | Without Mortgage | With Mortgage |
| Less than $800 | 3,202 (23.6%) | 6 (0.1%) |
| $800 to $1,499 | 2,658 (19.6%) | 913 (9.3%) |
| $800 to $1,499 | 6,612 (48.8%) | 1,751 (17.8%) |
| Total | 13,540 (100.0%) | 9,819 (100.0%) |
Health & Disability in Liberty County
Health Insurance Coverage by Age in Liberty County
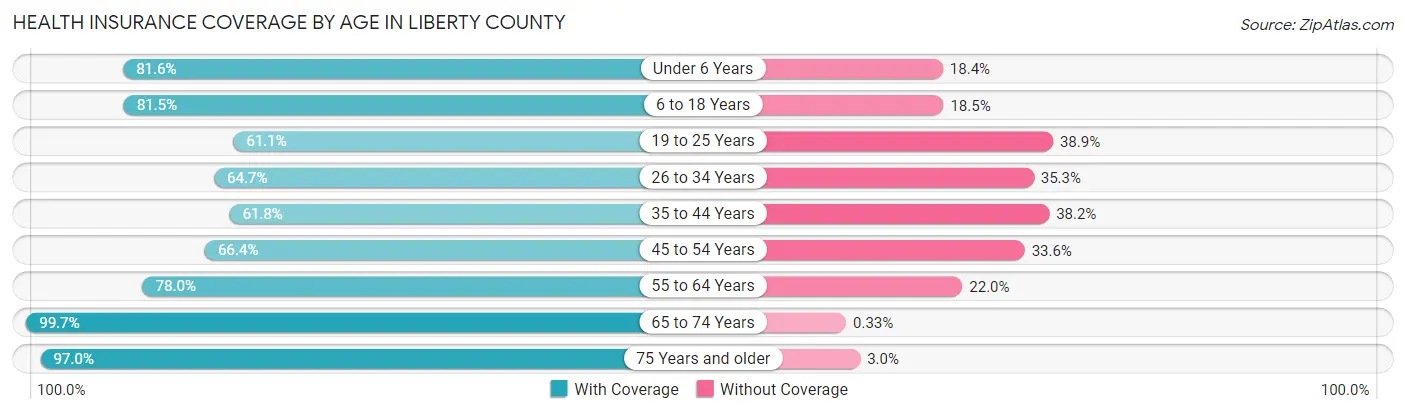
| Age Bracket | With Coverage | Without Coverage |
| Under 6 Years | 6,894 (81.6%) | 1,553 (18.4%) |
| 6 to 18 Years | 15,341 (81.5%) | 3,482 (18.5%) |
| 19 to 25 Years | 4,892 (61.1%) | 3,117 (38.9%) |
| 26 to 34 Years | 6,496 (64.7%) | 3,551 (35.3%) |
| 35 to 44 Years | 6,287 (61.8%) | 3,887 (38.2%) |
| 45 to 54 Years | 6,777 (66.4%) | 3,435 (33.6%) |
| 55 to 64 Years | 7,945 (78.0%) | 2,243 (22.0%) |
| 65 to 74 Years | 7,247 (99.7%) | 24 (0.3%) |
| 75 Years and older | 4,084 (97.0%) | 125 (3.0%) |
| Total | 65,963 (75.5%) | 21,417 (24.5%) |
Health Insurance Coverage by Citizenship Status in Liberty County
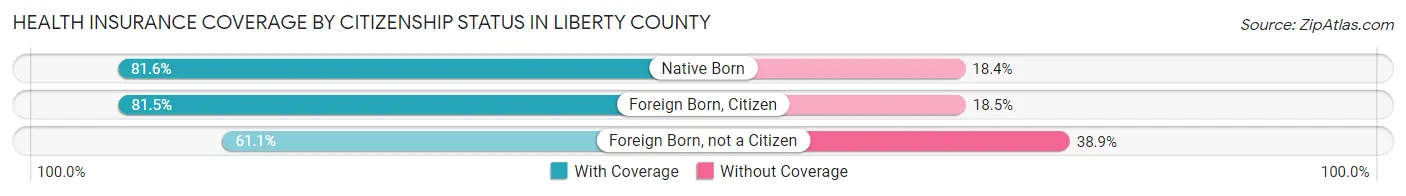
| Citizenship Status | With Coverage | Without Coverage |
| Native Born | 6,894 (81.6%) | 1,553 (18.4%) |
| Foreign Born, Citizen | 15,341 (81.5%) | 3,482 (18.5%) |
| Foreign Born, not a Citizen | 4,892 (61.1%) | 3,117 (38.9%) |
Health Insurance Coverage by Household Income in Liberty County
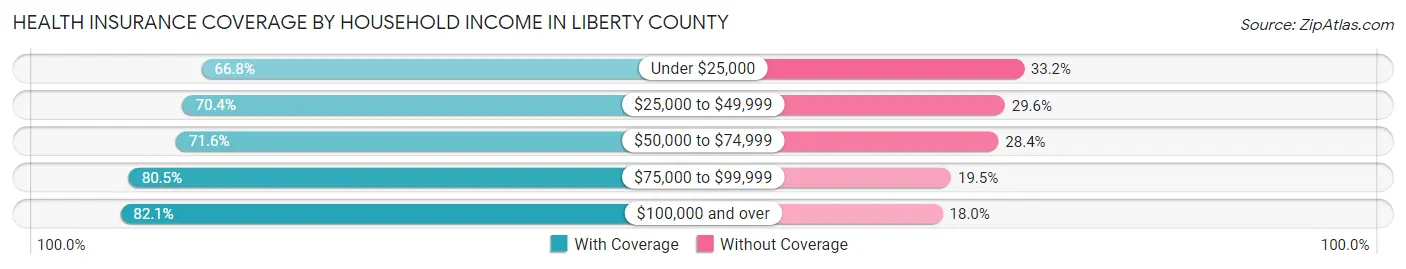
| Household Income | With Coverage | Without Coverage |
| Under $25,000 | 7,465 (66.8%) | 3,705 (33.2%) |
| $25,000 to $49,999 | 11,749 (70.4%) | 4,942 (29.6%) |
| $50,000 to $74,999 | 13,013 (71.6%) | 5,161 (28.4%) |
| $75,000 to $99,999 | 9,405 (80.5%) | 2,282 (19.5%) |
| $100,000 and over | 24,293 (82.1%) | 5,314 (17.9%) |
Public vs Private Health Insurance Coverage by Age in Liberty County
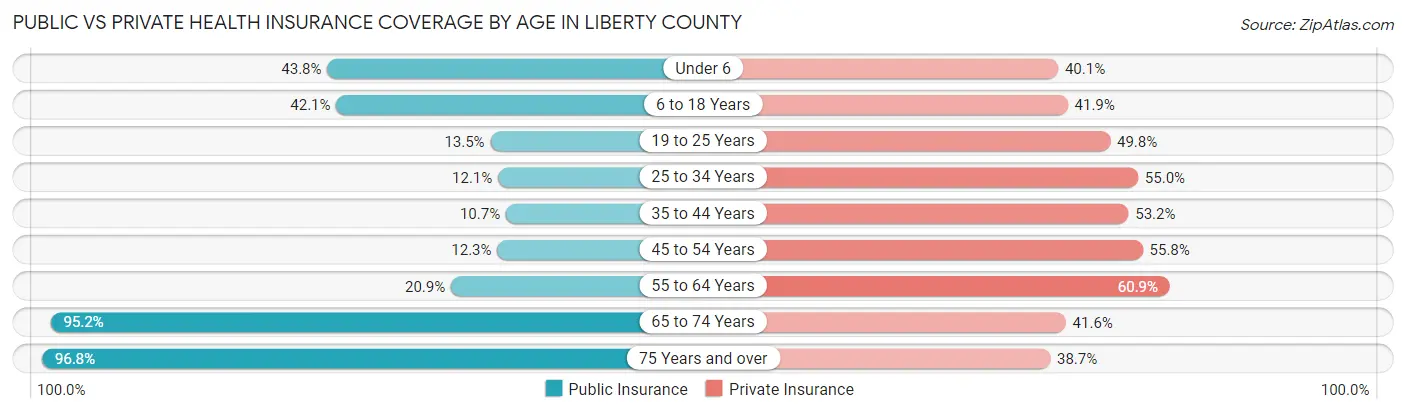
| Age Bracket | Public Insurance | Private Insurance |
| Under 6 | 3,700 (43.8%) | 3,390 (40.1%) |
| 6 to 18 Years | 7,930 (42.1%) | 7,888 (41.9%) |
| 19 to 25 Years | 1,084 (13.5%) | 3,988 (49.8%) |
| 25 to 34 Years | 1,217 (12.1%) | 5,522 (55.0%) |
| 35 to 44 Years | 1,084 (10.6%) | 5,411 (53.2%) |
| 45 to 54 Years | 1,251 (12.2%) | 5,702 (55.8%) |
| 55 to 64 Years | 2,124 (20.8%) | 6,203 (60.9%) |
| 65 to 74 Years | 6,922 (95.2%) | 3,021 (41.5%) |
| 75 Years and over | 4,074 (96.8%) | 1,627 (38.7%) |
| Total | 29,386 (33.6%) | 42,752 (48.9%) |
Disability Status by Sex by Age in Liberty County
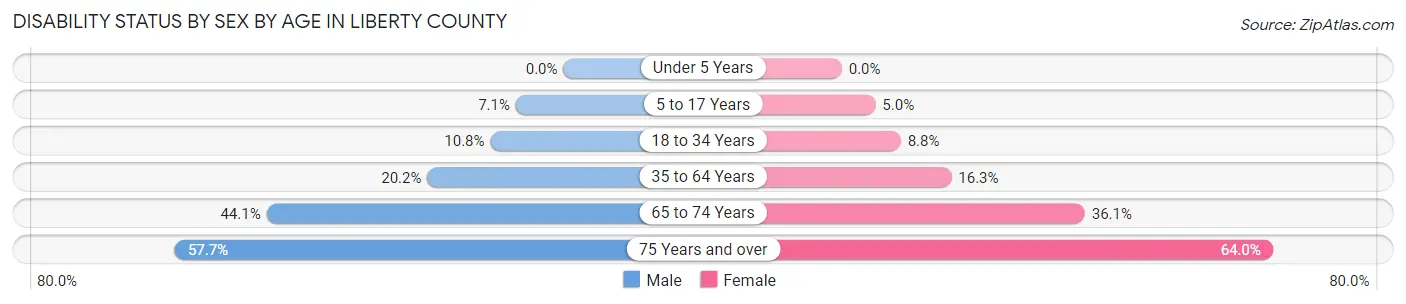
| Age Bracket | Male | Female |
| Under 5 Years | 0 (0.0%) | 0 (0.0%) |
| 5 to 17 Years | 708 (7.1%) | 460 (5.0%) |
| 18 to 34 Years | 1,026 (10.8%) | 854 (8.7%) |
| 35 to 64 Years | 3,135 (20.2%) | 2,450 (16.3%) |
| 65 to 74 Years | 1,556 (44.1%) | 1,350 (36.1%) |
| 75 Years and over | 1,071 (57.7%) | 1,505 (64.0%) |
Disability Class by Sex by Age in Liberty County
Disability Class: Hearing Difficulty
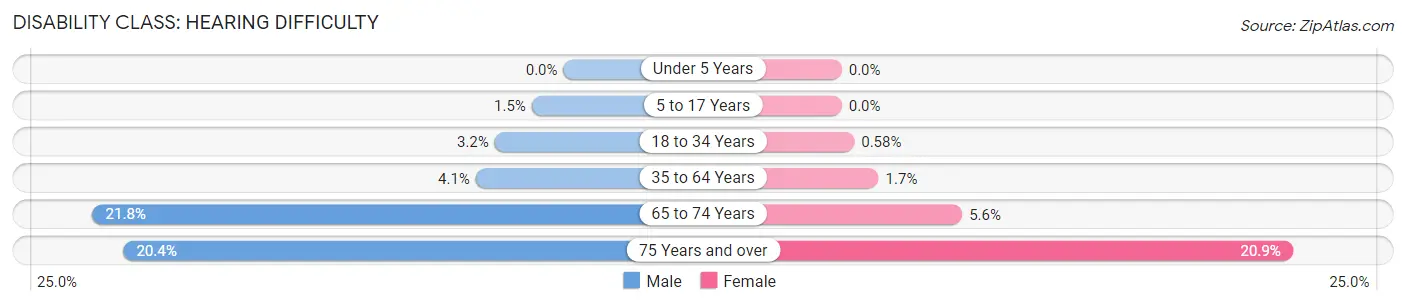
| Age Bracket | Male | Female |
| Under 5 Years | 0 (0.0%) | 0 (0.0%) |
| 5 to 17 Years | 147 (1.5%) | 0 (0.0%) |
| 18 to 34 Years | 302 (3.2%) | 57 (0.6%) |
| 35 to 64 Years | 632 (4.1%) | 258 (1.7%) |
| 65 to 74 Years | 771 (21.8%) | 209 (5.6%) |
| 75 Years and over | 379 (20.4%) | 492 (20.9%) |
Disability Class: Vision Difficulty
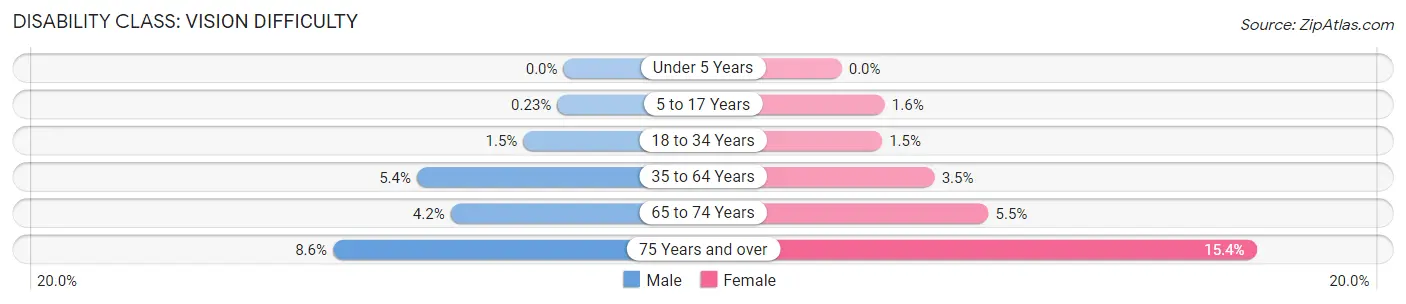
| Age Bracket | Male | Female |
| Under 5 Years | 0 (0.0%) | 0 (0.0%) |
| 5 to 17 Years | 23 (0.2%) | 148 (1.6%) |
| 18 to 34 Years | 141 (1.5%) | 146 (1.5%) |
| 35 to 64 Years | 844 (5.4%) | 519 (3.5%) |
| 65 to 74 Years | 148 (4.2%) | 204 (5.4%) |
| 75 Years and over | 159 (8.6%) | 362 (15.4%) |
Disability Class: Cognitive Difficulty
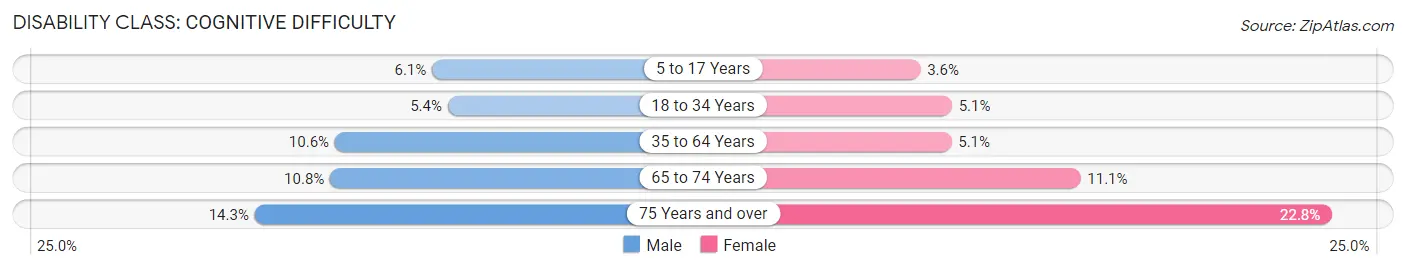
| Age Bracket | Male | Female |
| 5 to 17 Years | 611 (6.1%) | 336 (3.6%) |
| 18 to 34 Years | 507 (5.4%) | 498 (5.1%) |
| 35 to 64 Years | 1,644 (10.6%) | 765 (5.1%) |
| 65 to 74 Years | 382 (10.8%) | 414 (11.1%) |
| 75 Years and over | 266 (14.3%) | 535 (22.8%) |
Disability Class: Ambulatory Difficulty
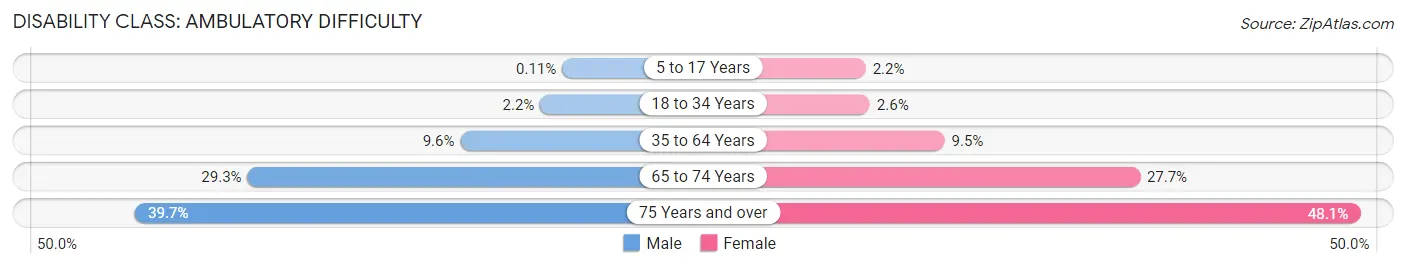
| Age Bracket | Male | Female |
| 5 to 17 Years | 11 (0.1%) | 205 (2.2%) |
| 18 to 34 Years | 204 (2.1%) | 255 (2.6%) |
| 35 to 64 Years | 1,484 (9.6%) | 1,436 (9.5%) |
| 65 to 74 Years | 1,035 (29.3%) | 1,035 (27.7%) |
| 75 Years and over | 738 (39.7%) | 1,131 (48.1%) |
Disability Class: Self-Care Difficulty
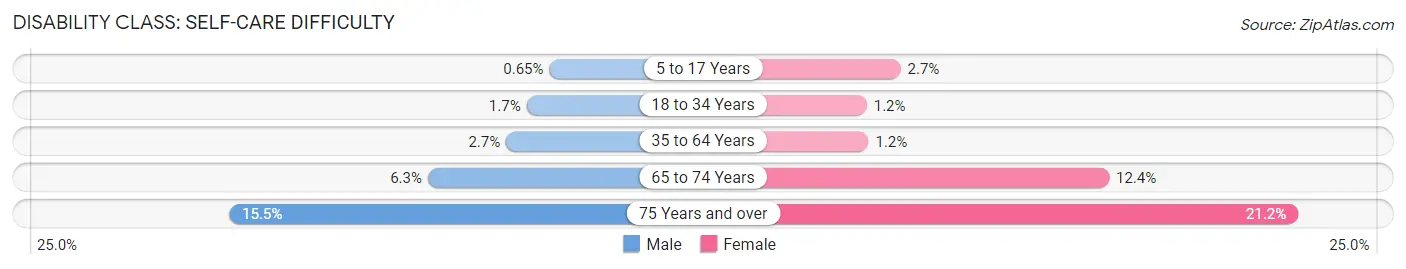
| Age Bracket | Male | Female |
| 5 to 17 Years | 65 (0.6%) | 252 (2.7%) |
| 18 to 34 Years | 162 (1.7%) | 113 (1.2%) |
| 35 to 64 Years | 412 (2.7%) | 186 (1.2%) |
| 65 to 74 Years | 222 (6.3%) | 464 (12.4%) |
| 75 Years and over | 288 (15.5%) | 498 (21.2%) |
Technology Access in Liberty County
Computing Device Access in Liberty County
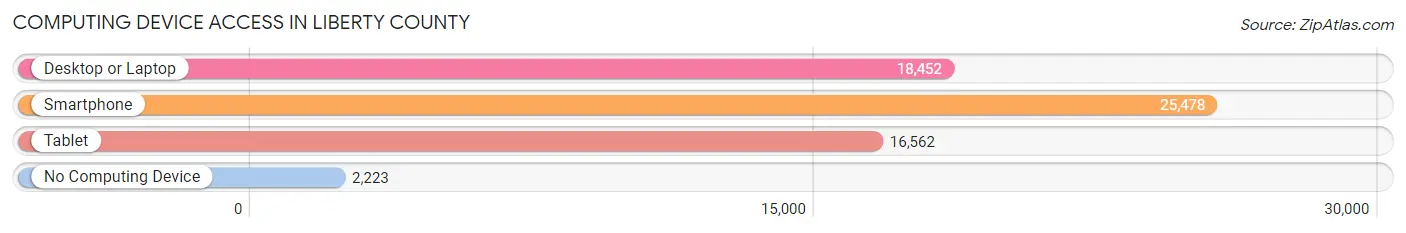
| Device Type | # Households | % Households |
| Desktop or Laptop | 18,452 | 63.8% |
| Smartphone | 25,478 | 88.1% |
| Tablet | 16,562 | 57.3% |
| No Computing Device | 2,223 | 7.7% |
| Total | 28,921 | 100.0% |
Internet Access in Liberty County
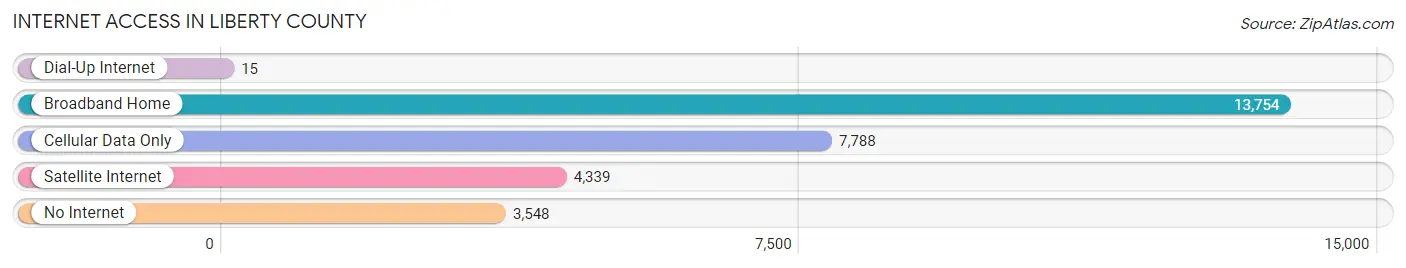
| Internet Type | # Households | % Households |
| Dial-Up Internet | 15 | 0.1% |
| Broadband Home | 13,754 | 47.6% |
| Cellular Data Only | 7,788 | 26.9% |
| Satellite Internet | 4,339 | 15.0% |
| No Internet | 3,548 | 12.3% |
| Total | 28,921 | 100.0% |
Liberty County Summary
Liberty County is located in the southeastern part of Texas, and is part of the Houston-The Woodlands-Sugar Land metropolitan area. The county is bordered by San Jacinto County to the north, Chambers County to the east, Harris County to the south, and Polk County to the west. The county seat is Liberty, and the largest city is Cleveland.
History
The area that is now Liberty County was originally inhabited by the Atakapan Indians, who were later displaced by the Karankawa Indians. The first European settlers arrived in the area in the early 1800s, and the county was officially established in 1831. The county was named after the concept of liberty, and the county seat was named after the American patriot, General George Washington.
The county was largely agricultural in the 19th century, with cotton and sugar cane being the main crops. The economy was further diversified in the early 20th century with the discovery of oil and natural gas in the area. The county also became a major center for timber production.
Geography
Liberty County covers an area of 1,176 square miles, and is mostly flat with some rolling hills. The Trinity River forms the northern boundary of the county, and the San Jacinto River forms the eastern boundary. The county is home to several lakes, including Lake Livingston, Lake Anahuac, and Lake Houston.
The climate of Liberty County is humid subtropical, with hot summers and mild winters. The average annual temperature is 68°F, and the average annual precipitation is 48 inches.
Economy
The economy of Liberty County is largely based on agriculture, oil and gas production, and timber production. The county is also home to several manufacturing companies, including a paper mill and a chemical plant.
The county is home to several large employers, including the Liberty County School District, the Liberty County Sheriff's Office, and the Liberty County Hospital. The county is also home to several retail stores, restaurants, and other businesses.
Demographics
As of the 2010 census, the population of Liberty County was 75,643. The population is mostly white (76.3%), followed by African American (17.2%), Hispanic (4.2%), and Asian (1.3%). The median household income is $45,845, and the median home value is $117,400.
The county is served by several school districts, including the Liberty County School District, the Cleveland Independent School District, and the Hardin Independent School District. The county is also home to several higher education institutions, including the University of Houston-Liberty County, the Liberty County Community College, and the Liberty County Technical Institute.
Conclusion
Liberty County is a diverse and vibrant county located in the southeastern part of Texas. The county is home to a variety of industries, including agriculture, oil and gas production, timber production, and manufacturing. The county is also home to several large employers, and is served by several school districts and higher education institutions. The population of the county is mostly white, with African American, Hispanic, and Asian populations making up the remainder. The median household income is $45,845, and the median home value is $117,400.
Common Questions
What is Per Capita Income in Liberty County?
Per Capita income in Liberty County is $25,667.
What is the Median Family Income in Liberty County?
Median Family Income in Liberty County is $71,529.
What is the Median Household income in Liberty County?
Median Household Income in Liberty County is $59,605.
What is Income or Wage Gap in Liberty County?
Income or Wage Gap in Liberty County is 41.1%.
Women in Liberty County earn 58.9 cents for every dollar earned by a man.
What is Family Income Deficit in Liberty County?
Family Income Deficit in Liberty County is $10,625.
Families that are below poverty line in Liberty County earn $10,625 less on average than the poverty threshold level.
What is Inequality or Gini Index in Liberty County?
Inequality or Gini Index in Liberty County is 0.45.
What is the Total Population of Liberty County?
Total Population of Liberty County is 93,523.
What is the Total Male Population of Liberty County?
Total Male Population of Liberty County is 46,504.
What is the Total Female Population of Liberty County?
Total Female Population of Liberty County is 47,019.
What is the Ratio of Males per 100 Females in Liberty County?
There are 98.90 Males per 100 Females in Liberty County.
What is the Ratio of Females per 100 Males in Liberty County?
There are 101.11 Females per 100 Males in Liberty County.
What is the Median Population Age in Liberty County?
Median Population Age in Liberty County is 34.1 Years.
What is the Average Family Size in Liberty County
Average Family Size in Liberty County is 3.6 People.
What is the Average Household Size in Liberty County
Average Household Size in Liberty County is 3.0 People.
How Large is the Labor Force in Liberty County?
There are 36,255 People in the Labor Forcein in Liberty County.
What is the Percentage of People in the Labor Force in Liberty County?
51.6% of People are in the Labor Force in Liberty County.
What is the Unemployment Rate in Liberty County?
Unemployment Rate in Liberty County is 6.9%.