Leon County, TX Map & Demographics
Leon County Map
Leon County Overview
$34,519
PER CAPITA INCOME
$69,737
AVG FAMILY INCOME
$57,363
AVG HOUSEHOLD INCOME
54.1%
WAGE / INCOME GAP [ % ]
45.9¢/ $1
WAGE / INCOME GAP [ $ ]
$7,869
FAMILY INCOME DEFICIT
0.49
INEQUALITY / GINI INDEX
15,928
TOTAL POPULATION
7,918
MALE POPULATION
8,010
FEMALE POPULATION
98.85
MALES / 100 FEMALES
101.16
FEMALES / 100 MALES
44.7
MEDIAN AGE
3.0
AVG FAMILY SIZE
2.5
AVG HOUSEHOLD SIZE
6,574
LABOR FORCE [ PEOPLE ]
50.9%
PERCENT IN LABOR FORCE
5.1%
UNEMPLOYMENT RATE
Income in Leon County
Income Overview in Leon County
Per Capita Income in Leon County is $34,519, while median incomes of families and households are $69,737 and $57,363 respectively.
| Characteristic | Number | Measure |
| Per Capita Income | 15,928 | $34,519 |
| Median Family Income | 4,512 | $69,737 |
| Mean Family Income | 4,512 | $90,296 |
| Median Household Income | 6,397 | $57,363 |
| Mean Household Income | 6,397 | $83,691 |
| Income Deficit | 4,512 | $7,869 |
| Wage / Income Gap (%) | 15,928 | 54.10% |
| Wage / Income Gap ($) | 15,928 | 45.90¢ per $1 |
| Gini / Inequality Index | 15,928 | 0.49 |
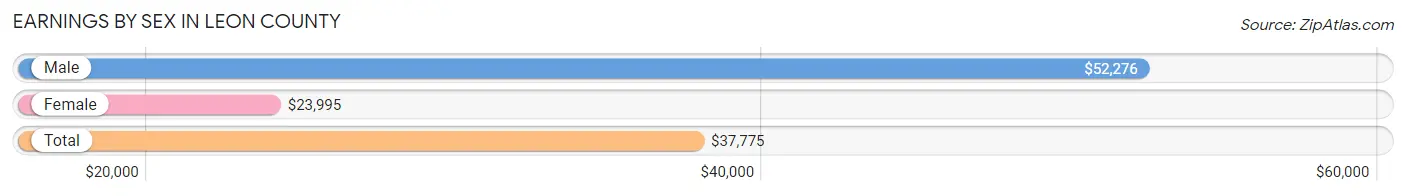
Earnings by Sex in Leon County
Average Earnings in Leon County are $37,775, $52,276 for men and $23,995 for women, a difference of 54.1%.
| Sex | Number | Average Earnings |
| Male | 3,826 (54.9%) | $52,276 |
| Female | 3,148 (45.1%) | $23,995 |
| Total | 6,974 (100.0%) | $37,775 |
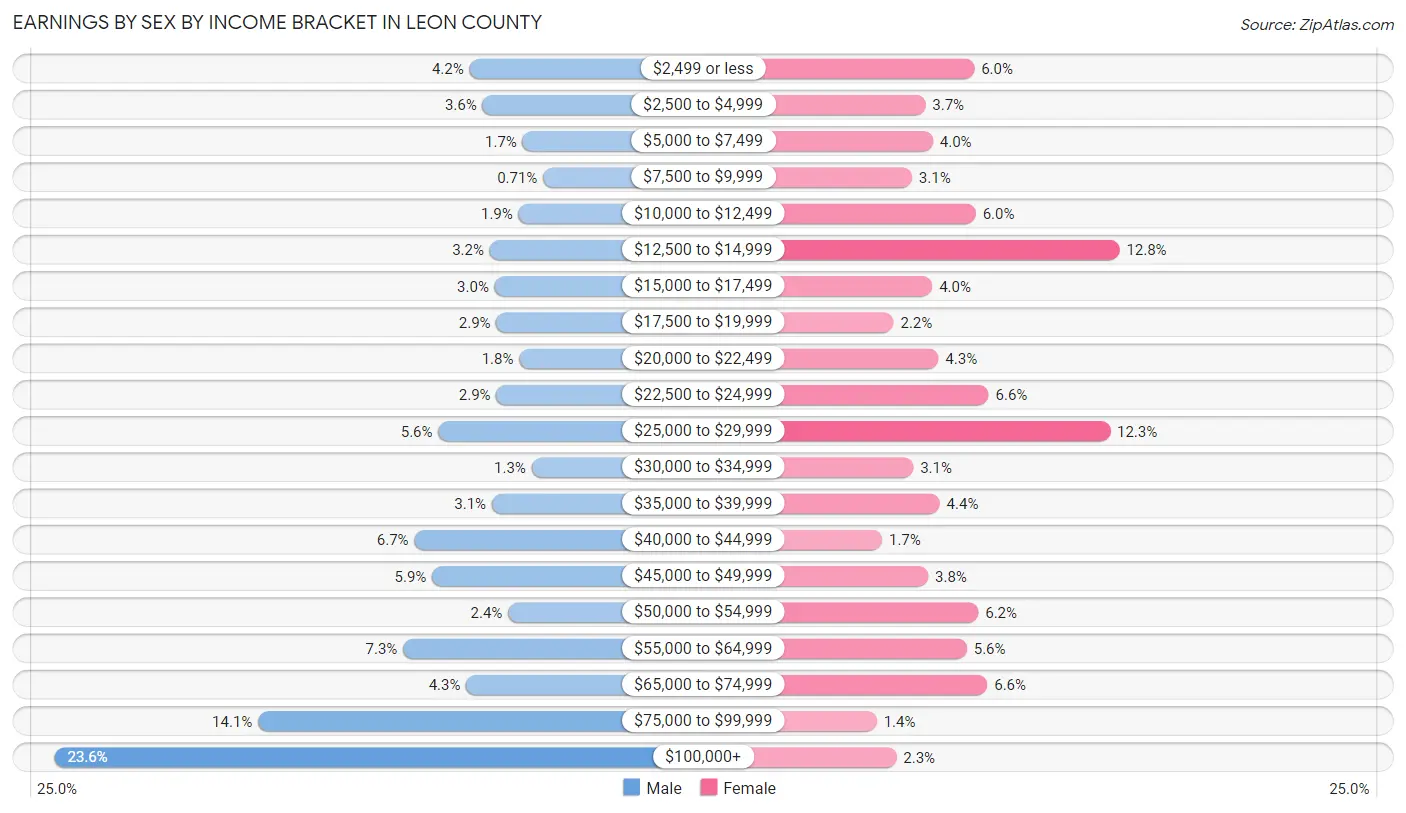
Earnings by Sex by Income Bracket in Leon County
The most common earnings brackets in Leon County are $100,000+ for men (903 | 23.6%) and $12,500 to $14,999 for women (402 | 12.8%).
| Income | Male | Female |
| $2,499 or less | 159 (4.2%) | 188 (6.0%) |
| $2,500 to $4,999 | 136 (3.5%) | 116 (3.7%) |
| $5,000 to $7,499 | 64 (1.7%) | 127 (4.0%) |
| $7,500 to $9,999 | 27 (0.7%) | 96 (3.0%) |
| $10,000 to $12,499 | 71 (1.9%) | 190 (6.0%) |
| $12,500 to $14,999 | 123 (3.2%) | 402 (12.8%) |
| $15,000 to $17,499 | 114 (3.0%) | 126 (4.0%) |
| $17,500 to $19,999 | 111 (2.9%) | 69 (2.2%) |
| $20,000 to $22,499 | 70 (1.8%) | 135 (4.3%) |
| $22,500 to $24,999 | 111 (2.9%) | 209 (6.6%) |
| $25,000 to $29,999 | 215 (5.6%) | 388 (12.3%) |
| $30,000 to $34,999 | 48 (1.3%) | 98 (3.1%) |
| $35,000 to $39,999 | 119 (3.1%) | 137 (4.3%) |
| $40,000 to $44,999 | 258 (6.7%) | 52 (1.7%) |
| $45,000 to $49,999 | 226 (5.9%) | 120 (3.8%) |
| $50,000 to $54,999 | 90 (2.4%) | 194 (6.2%) |
| $55,000 to $64,999 | 278 (7.3%) | 177 (5.6%) |
| $65,000 to $74,999 | 165 (4.3%) | 207 (6.6%) |
| $75,000 to $99,999 | 538 (14.1%) | 44 (1.4%) |
| $100,000+ | 903 (23.6%) | 73 (2.3%) |
| Total | 3,826 (100.0%) | 3,148 (100.0%) |
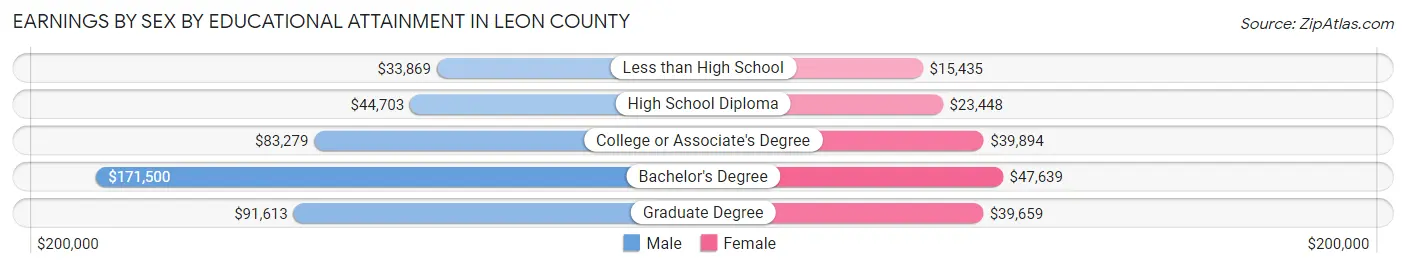
Earnings by Sex by Educational Attainment in Leon County
Average earnings in Leon County are $60,139 for men and $26,360 for women, a difference of 56.2%. Men with an educational attainment of bachelor's degree enjoy the highest average annual earnings of $171,500, while those with less than high school education earn the least with $33,869. Women with an educational attainment of bachelor's degree earn the most with the average annual earnings of $47,639, while those with less than high school education have the smallest earnings of $15,435.
| Educational Attainment | Male Income | Female Income |
| Less than High School | $33,869 | $15,435 |
| High School Diploma | $44,703 | $23,448 |
| College or Associate's Degree | $83,279 | $39,894 |
| Bachelor's Degree | $171,500 | $47,639 |
| Graduate Degree | $91,613 | $39,659 |
| Total | $60,139 | $26,360 |
Family Income in Leon County
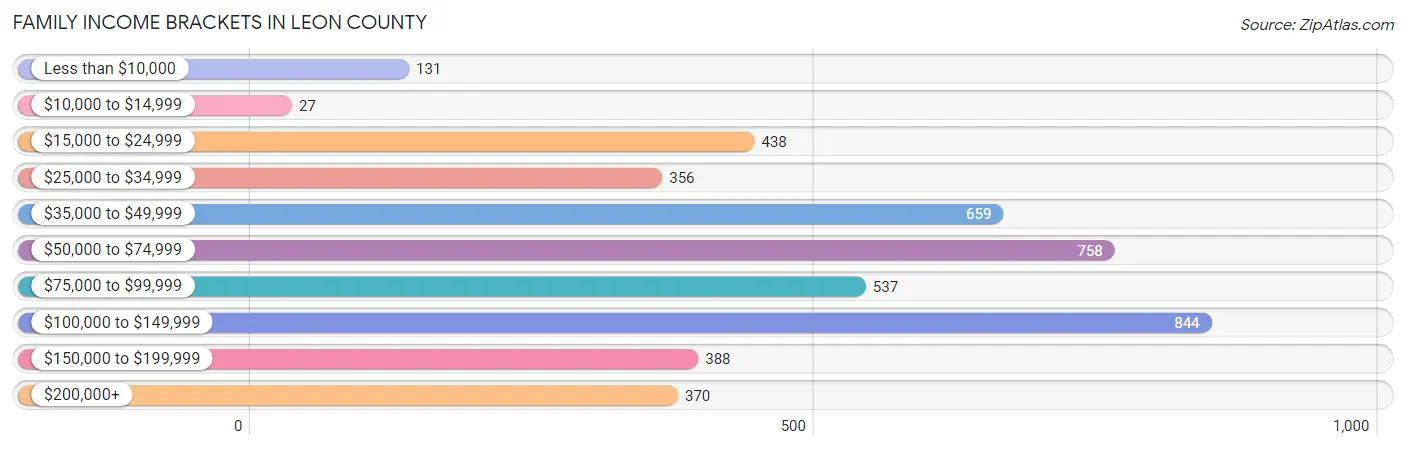
Family Income Brackets in Leon County
According to the Leon County family income data, there are 844 families falling into the $100,000 to $149,999 income range, which is the most common income bracket and makes up 18.7% of all families. Conversely, the $10,000 to $14,999 income bracket is the least frequent group with only 27 families (0.6%) belonging to this category.
| Income Bracket | # Families | % Families |
| Less than $10,000 | 131 | 2.9% |
| $10,000 to $14,999 | 27 | 0.6% |
| $15,000 to $24,999 | 438 | 9.7% |
| $25,000 to $34,999 | 356 | 7.9% |
| $35,000 to $49,999 | 659 | 14.6% |
| $50,000 to $74,999 | 758 | 16.8% |
| $75,000 to $99,999 | 537 | 11.9% |
| $100,000 to $149,999 | 844 | 18.7% |
| $150,000 to $199,999 | 388 | 8.6% |
| $200,000+ | 370 | 8.2% |
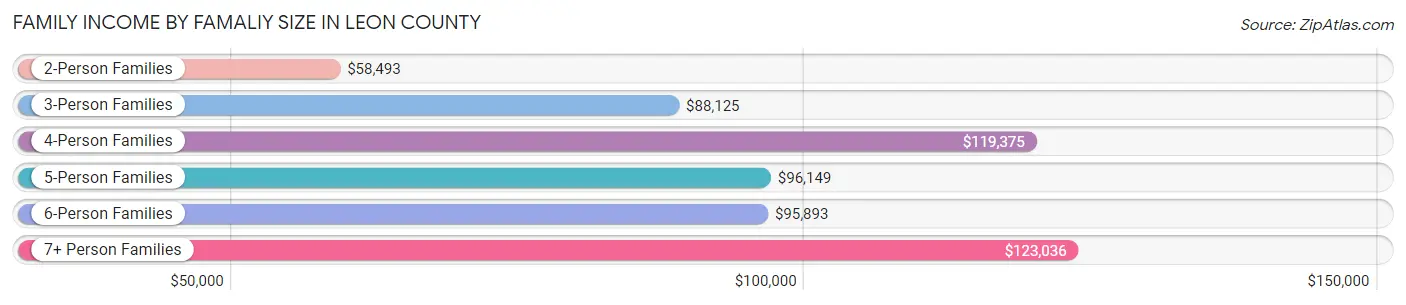
Family Income by Famaliy Size in Leon County
7+ person families (80 | 1.8%) account for the highest median family income in Leon County with $123,036 per family, while 4-person families (603 | 13.4%) have the highest median income of $29,844 per family member.
| Income Bracket | # Families | Median Income |
| 2-Person Families | 2,475 (54.8%) | $58,493 |
| 3-Person Families | 901 (20.0%) | $88,125 |
| 4-Person Families | 603 (13.4%) | $119,375 |
| 5-Person Families | 364 (8.1%) | $96,149 |
| 6-Person Families | 89 (2.0%) | $95,893 |
| 7+ Person Families | 80 (1.8%) | $123,036 |
| Total | 4,512 (100.0%) | $69,737 |
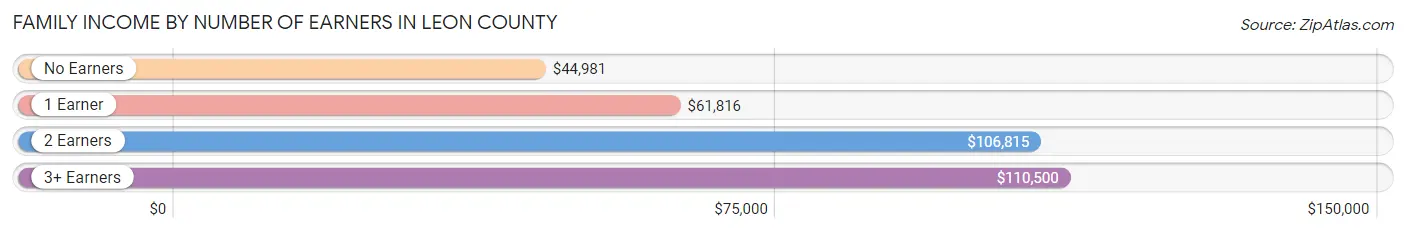
Family Income by Number of Earners in Leon County
The median family income in Leon County is $69,737, with families comprising 3+ earners (346) having the highest median family income of $110,500, while families with no earners (1,119) have the lowest median family income of $44,981, accounting for 7.7% and 24.8% of families, respectively.
| Number of Earners | # Families | Median Income |
| No Earners | 1,119 (24.8%) | $44,981 |
| 1 Earner | 1,660 (36.8%) | $61,816 |
| 2 Earners | 1,387 (30.7%) | $106,815 |
| 3+ Earners | 346 (7.7%) | $110,500 |
| Total | 4,512 (100.0%) | $69,737 |
Household Income in Leon County
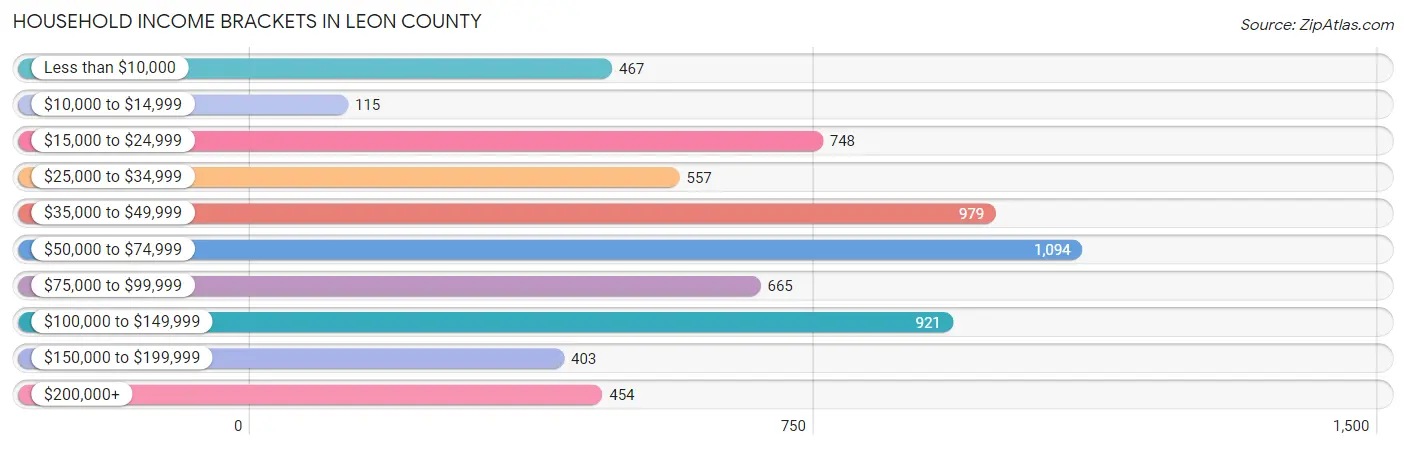
Household Income Brackets in Leon County
With 1,094 households falling in the category, the $50,000 to $74,999 income range is the most frequent in Leon County, accounting for 17.1% of all households. In contrast, only 115 households (1.8%) fall into the $10,000 to $14,999 income bracket, making it the least populous group.
| Income Bracket | # Households | % Households |
| Less than $10,000 | 467 | 7.3% |
| $10,000 to $14,999 | 115 | 1.8% |
| $15,000 to $24,999 | 748 | 11.7% |
| $25,000 to $34,999 | 557 | 8.7% |
| $35,000 to $49,999 | 979 | 15.3% |
| $50,000 to $74,999 | 1,094 | 17.1% |
| $75,000 to $99,999 | 665 | 10.4% |
| $100,000 to $149,999 | 921 | 14.4% |
| $150,000 to $199,999 | 403 | 6.3% |
| $200,000+ | 454 | 7.1% |
Household Income by Householder Age in Leon County
The median household income in Leon County is $57,363, with the highest median household income of $95,270 found in the 25 to 44 years age bracket for the primary householder. A total of 1,624 households (25.4%) fall into this category. Meanwhile, the 15 to 24 years age bracket for the primary householder has the lowest median household income of $40,650, with 285 households (4.5%) in this group.
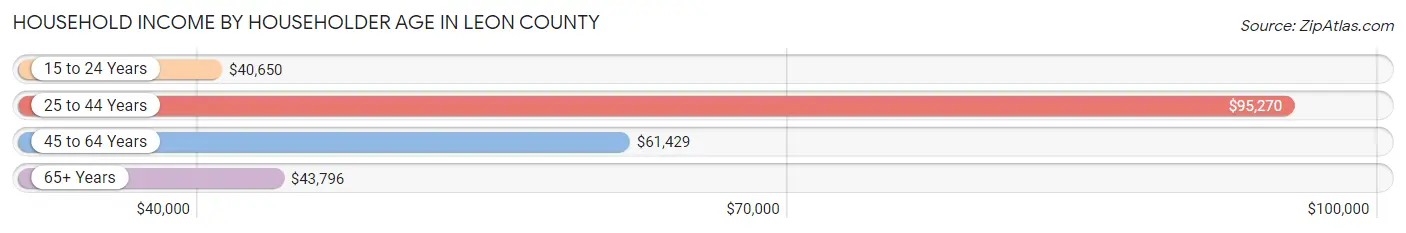
| Income Bracket | # Households | Median Income |
| 15 to 24 Years | 285 (4.5%) | $40,650 |
| 25 to 44 Years | 1,624 (25.4%) | $95,270 |
| 45 to 64 Years | 2,224 (34.8%) | $61,429 |
| 65+ Years | 2,264 (35.4%) | $43,796 |
| Total | 6,397 (100.0%) | $57,363 |
Poverty in Leon County
Income Below Poverty by Sex and Age in Leon County
With 12.9% poverty level for males and 15.8% for females among the residents of Leon County, 15 year old males and 5 year old females are the most vulnerable to poverty, with 27 males (39.7%) and 15 females (42.9%) in their respective age groups living below the poverty level.
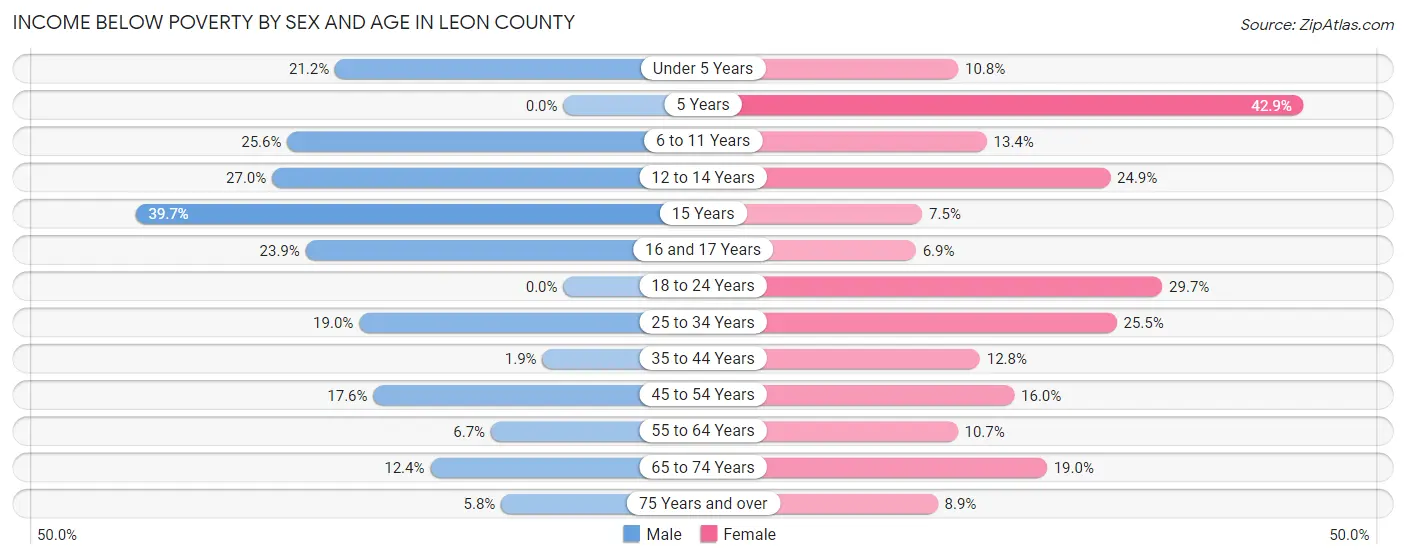
| Age Bracket | Male | Female |
| Under 5 Years | 96 (21.2%) | 41 (10.8%) |
| 5 Years | 0 (0.0%) | 15 (42.9%) |
| 6 to 11 Years | 144 (25.6%) | 89 (13.4%) |
| 12 to 14 Years | 123 (27.0%) | 60 (24.9%) |
| 15 Years | 27 (39.7%) | 10 (7.5%) |
| 16 and 17 Years | 61 (23.9%) | 21 (6.9%) |
| 18 to 24 Years | 0 (0.0%) | 173 (29.7%) |
| 25 to 34 Years | 141 (19.0%) | 193 (25.5%) |
| 35 to 44 Years | 18 (1.9%) | 110 (12.8%) |
| 45 to 54 Years | 147 (17.6%) | 133 (16.0%) |
| 55 to 64 Years | 79 (6.7%) | 138 (10.7%) |
| 65 to 74 Years | 138 (12.3%) | 206 (19.0%) |
| 75 Years and over | 41 (5.8%) | 73 (8.9%) |
| Total | 1,015 (12.9%) | 1,262 (15.8%) |
Income Above Poverty by Sex and Age in Leon County
According to the poverty statistics in Leon County, males aged 5 years and females aged 16 and 17 years are the age groups that are most secure financially, with 100.0% of males and 93.1% of females in these age groups living above the poverty line.
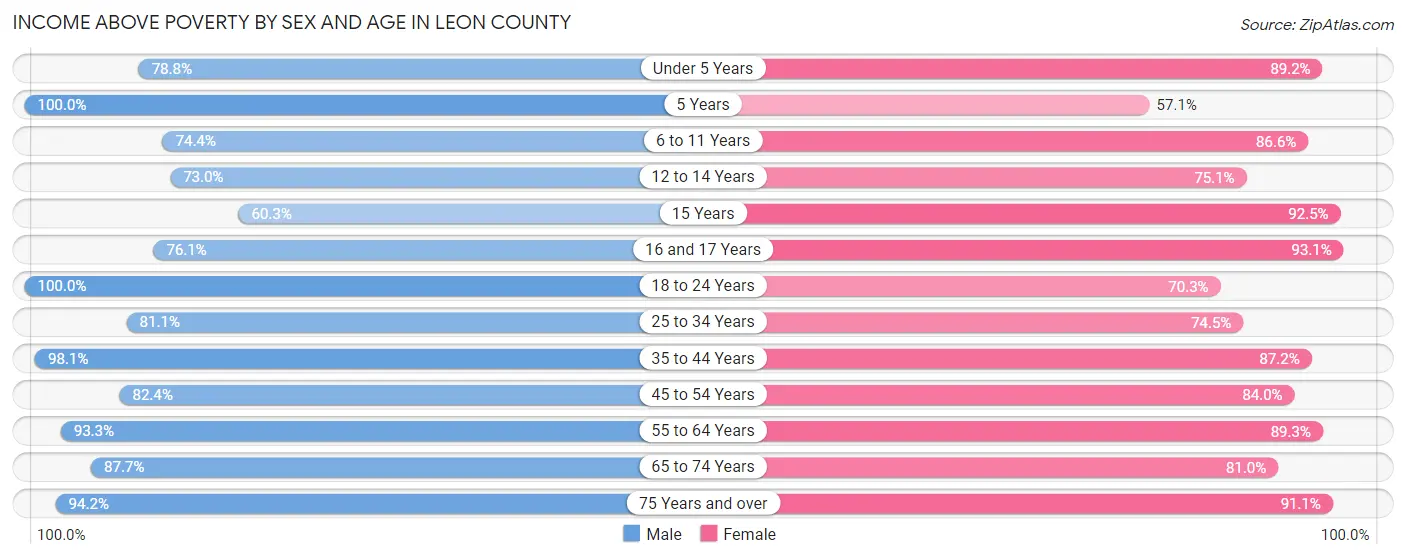
| Age Bracket | Male | Female |
| Under 5 Years | 357 (78.8%) | 339 (89.2%) |
| 5 Years | 13 (100.0%) | 20 (57.1%) |
| 6 to 11 Years | 418 (74.4%) | 573 (86.6%) |
| 12 to 14 Years | 332 (73.0%) | 181 (75.1%) |
| 15 Years | 41 (60.3%) | 124 (92.5%) |
| 16 and 17 Years | 194 (76.1%) | 285 (93.1%) |
| 18 to 24 Years | 553 (100.0%) | 409 (70.3%) |
| 25 to 34 Years | 603 (81.0%) | 564 (74.5%) |
| 35 to 44 Years | 911 (98.1%) | 749 (87.2%) |
| 45 to 54 Years | 687 (82.4%) | 699 (84.0%) |
| 55 to 64 Years | 1,097 (93.3%) | 1,147 (89.3%) |
| 65 to 74 Years | 979 (87.6%) | 877 (81.0%) |
| 75 Years and over | 669 (94.2%) | 748 (91.1%) |
| Total | 6,854 (87.1%) | 6,715 (84.2%) |
Income Below Poverty Among Married-Couple Families in Leon County
The poverty statistics for married-couple families in Leon County show that 9.2% or 354 of the total 3,836 families live below the poverty line. Families with 5 or more children have the highest poverty rate of 53.3%, comprising of 16 families. On the other hand, families with 3 or 4 children have the lowest poverty rate of 1.0%, which includes 3 families.
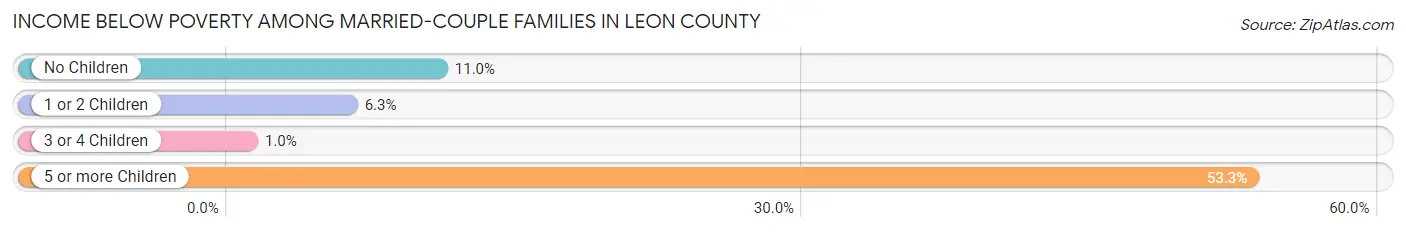
| Children | Above Poverty | Below Poverty |
| No Children | 2,178 (89.0%) | 268 (11.0%) |
| 1 or 2 Children | 1,005 (93.8%) | 67 (6.2%) |
| 3 or 4 Children | 285 (99.0%) | 3 (1.0%) |
| 5 or more Children | 14 (46.7%) | 16 (53.3%) |
| Total | 3,482 (90.8%) | 354 (9.2%) |
Income Below Poverty Among Single-Parent Households in Leon County
According to the poverty data in Leon County, 12.4% or 15 single-father households and 22.3% or 124 single-mother households are living below the poverty line. Among single-father households, those with 1 or 2 children have the highest poverty rate, with 11 households (37.9%) experiencing poverty. Likewise, among single-mother households, those with 5 or more children have the highest poverty rate, with 8 households (100.0%) falling below the poverty line.
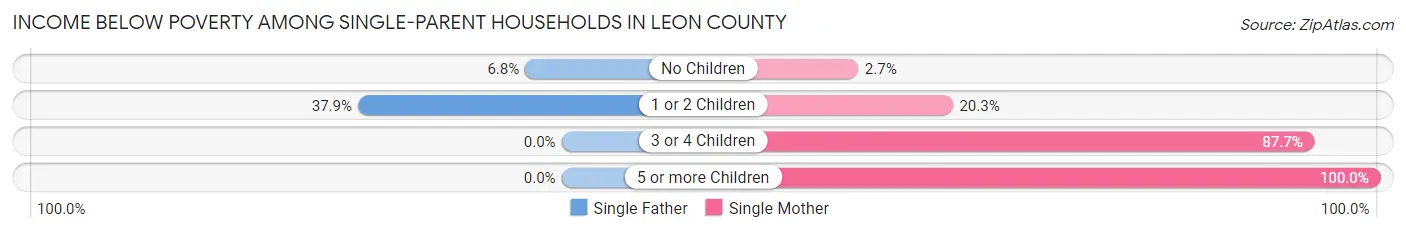
| Children | Single Father | Single Mother |
| No Children | 4 (6.8%) | 5 (2.6%) |
| 1 or 2 Children | 11 (37.9%) | 61 (20.3%) |
| 3 or 4 Children | 0 (0.0%) | 50 (87.7%) |
| 5 or more Children | 0 (0.0%) | 8 (100.0%) |
| Total | 15 (12.4%) | 124 (22.3%) |
Income Below Poverty Among Married-Couple vs Single-Parent Households in Leon County
The poverty data for Leon County shows that 354 of the married-couple family households (9.2%) and 139 of the single-parent households (20.6%) are living below the poverty level. Within the married-couple family households, those with 5 or more children have the highest poverty rate, with 16 households (53.3%) falling below the poverty line. Among the single-parent households, those with 5 or more children have the highest poverty rate, with 8 household (66.7%) living below poverty.
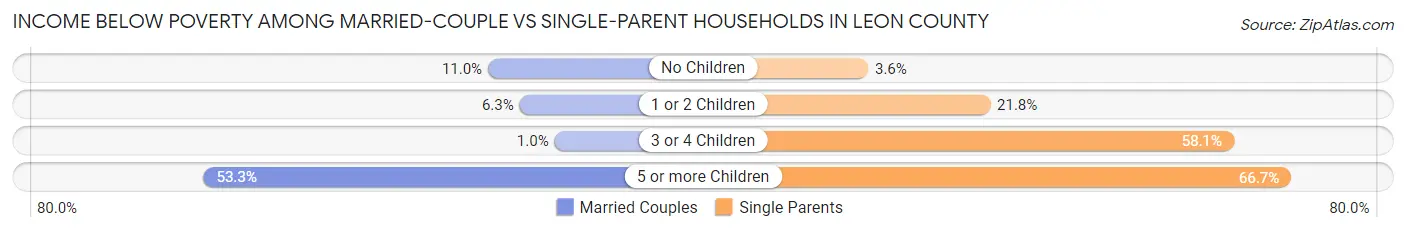
| Children | Married-Couple Families | Single-Parent Households |
| No Children | 268 (11.0%) | 9 (3.6%) |
| 1 or 2 Children | 67 (6.2%) | 72 (21.8%) |
| 3 or 4 Children | 3 (1.0%) | 50 (58.1%) |
| 5 or more Children | 16 (53.3%) | 8 (66.7%) |
| Total | 354 (9.2%) | 139 (20.6%) |
Race in Leon County
The most populous races in Leon County are White / Caucasian (13,215 | 83.0%), Hispanic or Latino (2,493 | 15.7%), and Black / African American (1,199 | 7.5%).
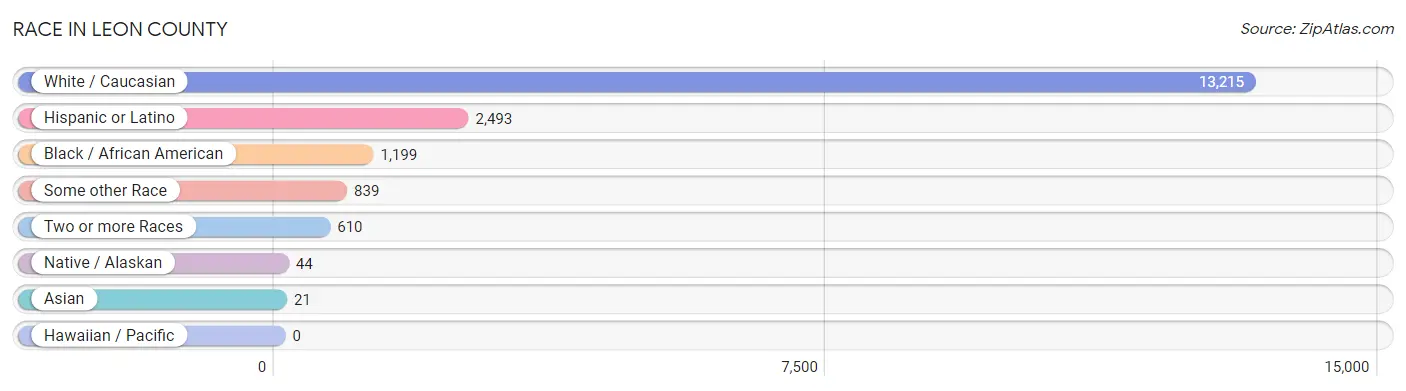
| Race | # Population | % Population |
| Asian | 21 | 0.1% |
| Black / African American | 1,199 | 7.5% |
| Hawaiian / Pacific | 0 | 0.0% |
| Hispanic or Latino | 2,493 | 15.7% |
| Native / Alaskan | 44 | 0.3% |
| White / Caucasian | 13,215 | 83.0% |
| Two or more Races | 610 | 3.8% |
| Some other Race | 839 | 5.3% |
| Total | 15,928 | 100.0% |
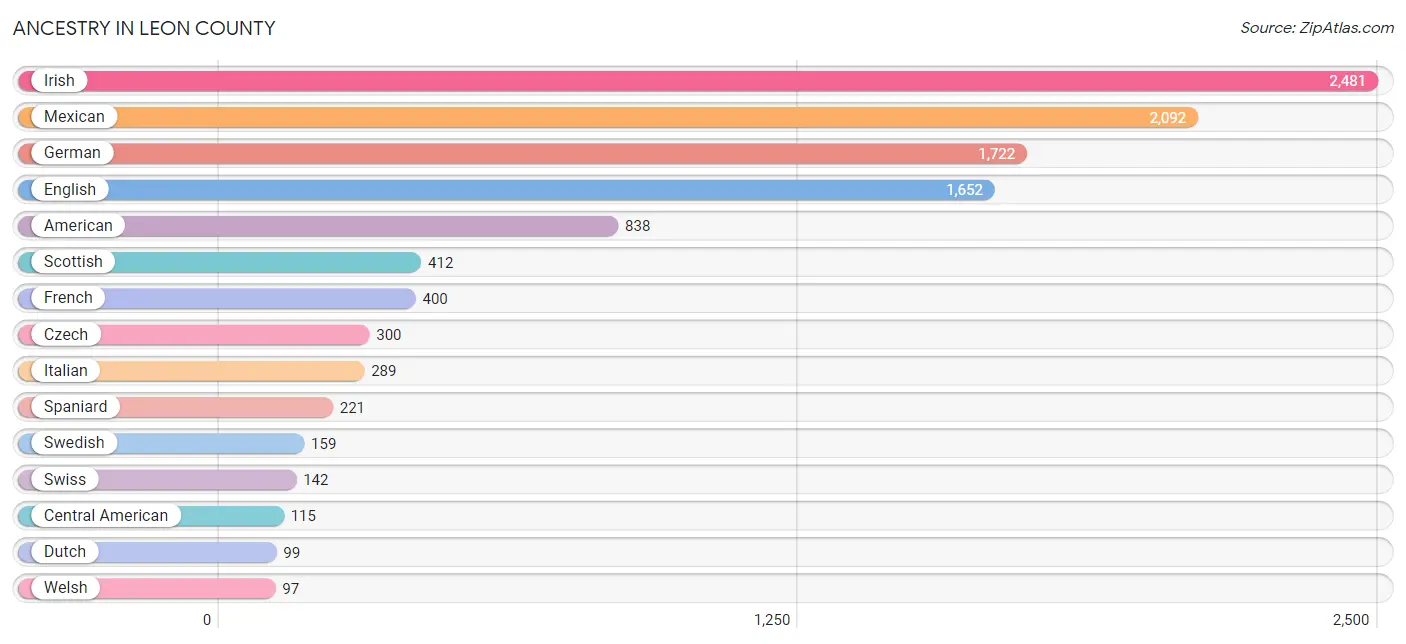
Ancestry in Leon County
The most populous ancestries reported in Leon County are Irish (2,481 | 15.6%), Mexican (2,092 | 13.1%), German (1,722 | 10.8%), English (1,652 | 10.4%), and American (838 | 5.3%), together accounting for 55.1% of all Leon County residents.
| Ancestry | # Population | % Population |
| African | 83 | 0.5% |
| American | 838 | 5.3% |
| Armenian | 2 | 0.0% |
| Bhutanese | 12 | 0.1% |
| British | 28 | 0.2% |
| Burmese | 8 | 0.1% |
| Cajun | 14 | 0.1% |
| Celtic | 11 | 0.1% |
| Central American | 115 | 0.7% |
| Cherokee | 30 | 0.2% |
| Choctaw | 39 | 0.2% |
| Czech | 300 | 1.9% |
| Czechoslovakian | 15 | 0.1% |
| Danish | 11 | 0.1% |
| Dutch | 99 | 0.6% |
| Dutch West Indian | 14 | 0.1% |
| Eastern European | 7 | 0.0% |
| English | 1,652 | 10.4% |
| European | 64 | 0.4% |
| French | 400 | 2.5% |
| French Canadian | 2 | 0.0% |
| German | 1,722 | 10.8% |
| Greek | 18 | 0.1% |
| Guatemalan | 4 | 0.0% |
| Honduran | 36 | 0.2% |
| Indian (Asian) | 2 | 0.0% |
| Irish | 2,481 | 15.6% |
| Italian | 289 | 1.8% |
| Korean | 1 | 0.0% |
| Laotian | 3 | 0.0% |
| Lithuanian | 70 | 0.4% |
| Mexican | 2,092 | 13.1% |
| Mexican American Indian | 15 | 0.1% |
| Navajo | 2 | 0.0% |
| Northern European | 7 | 0.0% |
| Norwegian | 48 | 0.3% |
| Polish | 49 | 0.3% |
| Puerto Rican | 4 | 0.0% |
| Russian | 50 | 0.3% |
| Salvadoran | 75 | 0.5% |
| Scandinavian | 11 | 0.1% |
| Scotch-Irish | 54 | 0.3% |
| Scottish | 412 | 2.6% |
| Slavic | 15 | 0.1% |
| Slovak | 3 | 0.0% |
| South American | 3 | 0.0% |
| Spaniard | 221 | 1.4% |
| Subsaharan African | 83 | 0.5% |
| Swedish | 159 | 1.0% |
| Swiss | 142 | 0.9% |
| Thai | 6 | 0.0% |
| Uruguayan | 3 | 0.0% |
| Welsh | 97 | 0.6% | View All 53 Rows |
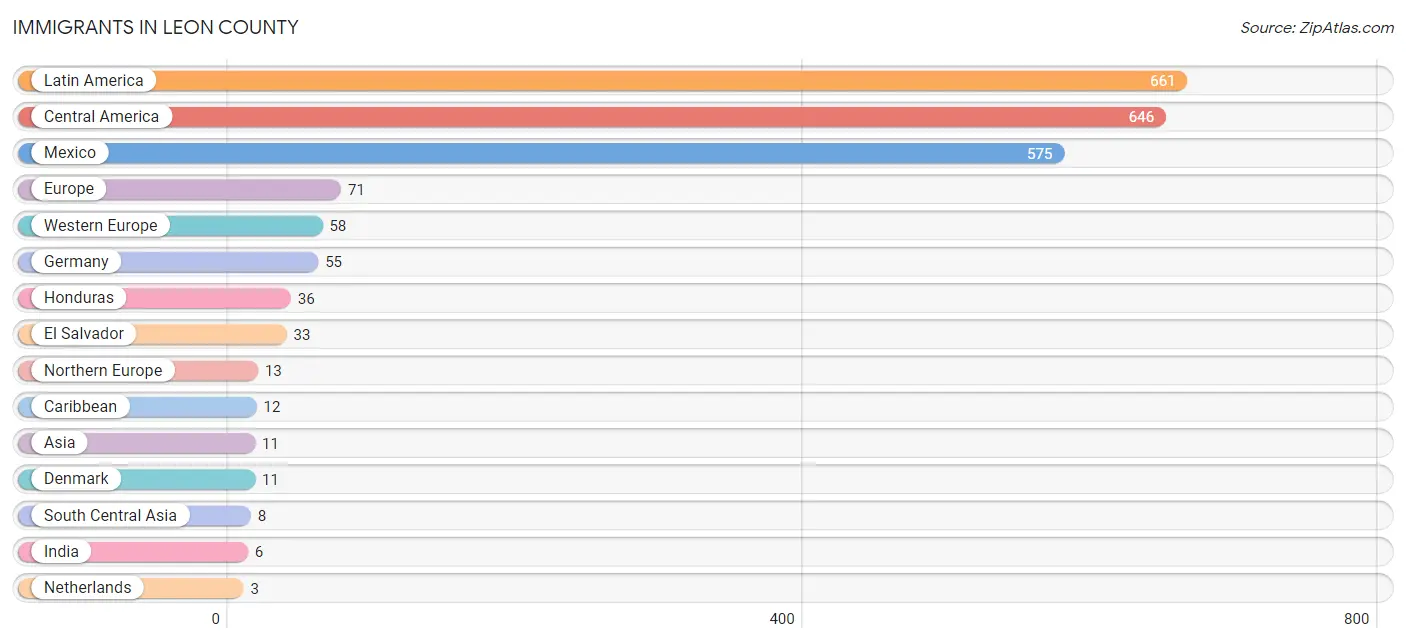
Immigrants in Leon County
The most numerous immigrant groups reported in Leon County came from Latin America (661 | 4.2%), Central America (646 | 4.1%), Mexico (575 | 3.6%), Europe (71 | 0.4%), and Western Europe (58 | 0.4%), together accounting for 12.6% of all Leon County residents.
| Immigration Origin | # Population | % Population |
| Asia | 11 | 0.1% |
| Belize | 2 | 0.0% |
| Caribbean | 12 | 0.1% |
| Central America | 646 | 4.1% |
| China | 2 | 0.0% |
| Denmark | 11 | 0.1% |
| Eastern Asia | 2 | 0.0% |
| El Salvador | 33 | 0.2% |
| Europe | 71 | 0.4% |
| Germany | 55 | 0.4% |
| Honduras | 36 | 0.2% |
| India | 6 | 0.0% |
| Iran | 2 | 0.0% |
| Latin America | 661 | 4.2% |
| Mexico | 575 | 3.6% |
| Netherlands | 3 | 0.0% |
| Northern Europe | 13 | 0.1% |
| Norway | 2 | 0.0% |
| Philippines | 1 | 0.0% |
| South America | 3 | 0.0% |
| South Central Asia | 8 | 0.1% |
| South Eastern Asia | 1 | 0.0% |
| Uruguay | 3 | 0.0% |
| Western Europe | 58 | 0.4% | View All 24 Rows |
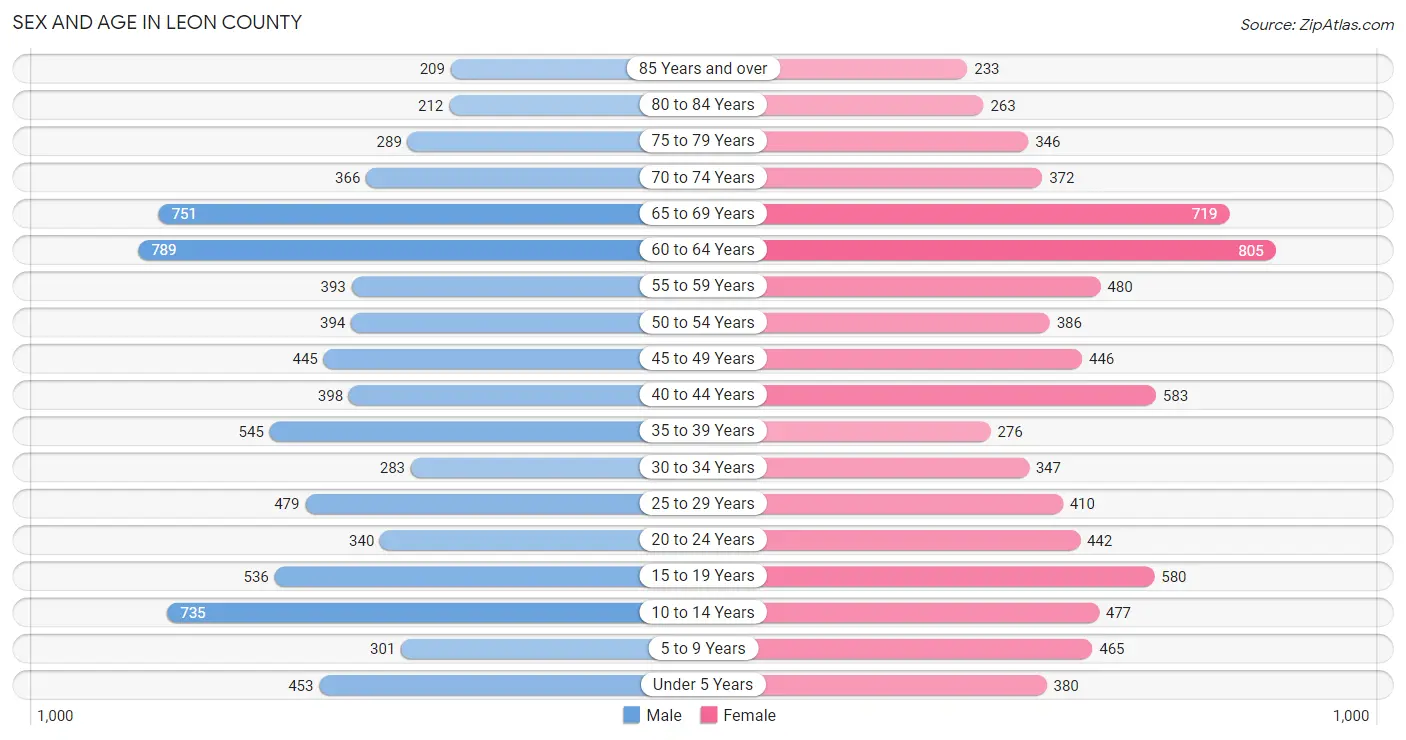
Sex and Age in Leon County
Sex and Age in Leon County
The most populous age groups in Leon County are 60 to 64 Years (789 | 10.0%) for men and 60 to 64 Years (805 | 10.1%) for women.
| Age Bracket | Male | Female |
| Under 5 Years | 453 (5.7%) | 380 (4.7%) |
| 5 to 9 Years | 301 (3.8%) | 465 (5.8%) |
| 10 to 14 Years | 735 (9.3%) | 477 (6.0%) |
| 15 to 19 Years | 536 (6.8%) | 580 (7.2%) |
| 20 to 24 Years | 340 (4.3%) | 442 (5.5%) |
| 25 to 29 Years | 479 (6.0%) | 410 (5.1%) |
| 30 to 34 Years | 283 (3.6%) | 347 (4.3%) |
| 35 to 39 Years | 545 (6.9%) | 276 (3.5%) |
| 40 to 44 Years | 398 (5.0%) | 583 (7.3%) |
| 45 to 49 Years | 445 (5.6%) | 446 (5.6%) |
| 50 to 54 Years | 394 (5.0%) | 386 (4.8%) |
| 55 to 59 Years | 393 (5.0%) | 480 (6.0%) |
| 60 to 64 Years | 789 (10.0%) | 805 (10.1%) |
| 65 to 69 Years | 751 (9.5%) | 719 (9.0%) |
| 70 to 74 Years | 366 (4.6%) | 372 (4.6%) |
| 75 to 79 Years | 289 (3.6%) | 346 (4.3%) |
| 80 to 84 Years | 212 (2.7%) | 263 (3.3%) |
| 85 Years and over | 209 (2.6%) | 233 (2.9%) |
| Total | 7,918 (100.0%) | 8,010 (100.0%) |
Families and Households in Leon County
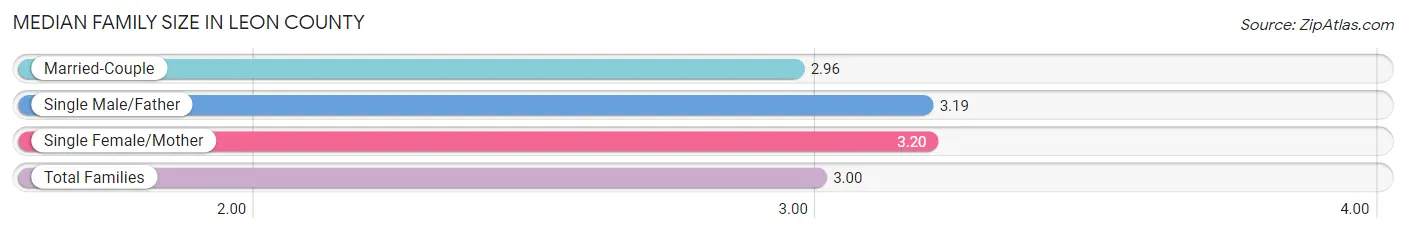
Median Family Size in Leon County
The median family size in Leon County is 3.00 persons per family, with single female/mother families (555 | 12.3%) accounting for the largest median family size of 3.2 persons per family. On the other hand, married-couple families (3,836 | 85.0%) represent the smallest median family size with 2.96 persons per family.
| Family Type | # Families | Family Size |
| Married-Couple | 3,836 (85.0%) | 2.96 |
| Single Male/Father | 121 (2.7%) | 3.19 |
| Single Female/Mother | 555 (12.3%) | 3.20 |
| Total Families | 4,512 (100.0%) | 3.00 |
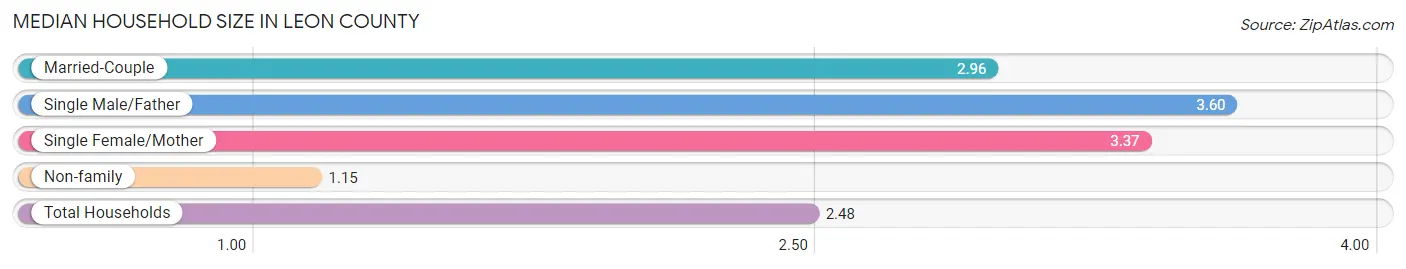
Median Household Size in Leon County
The median household size in Leon County is 2.48 persons per household, with single male/father households (121 | 1.9%) accounting for the largest median household size of 3.6 persons per household. non-family households (1,885 | 29.5%) represent the smallest median household size with 1.15 persons per household.
| Household Type | # Households | Household Size |
| Married-Couple | 3,836 (60.0%) | 2.96 |
| Single Male/Father | 121 (1.9%) | 3.60 |
| Single Female/Mother | 555 (8.7%) | 3.37 |
| Non-family | 1,885 (29.5%) | 1.15 |
| Total Households | 6,397 (100.0%) | 2.48 |
Household Size by Marriage Status in Leon County
Out of a total of 6,397 households in Leon County, 4,512 (70.5%) are family households, while 1,885 (29.5%) are nonfamily households. The most numerous type of family households are 2-person households, comprising 2,429, and the most common type of nonfamily households are 1-person households, comprising 1,661.
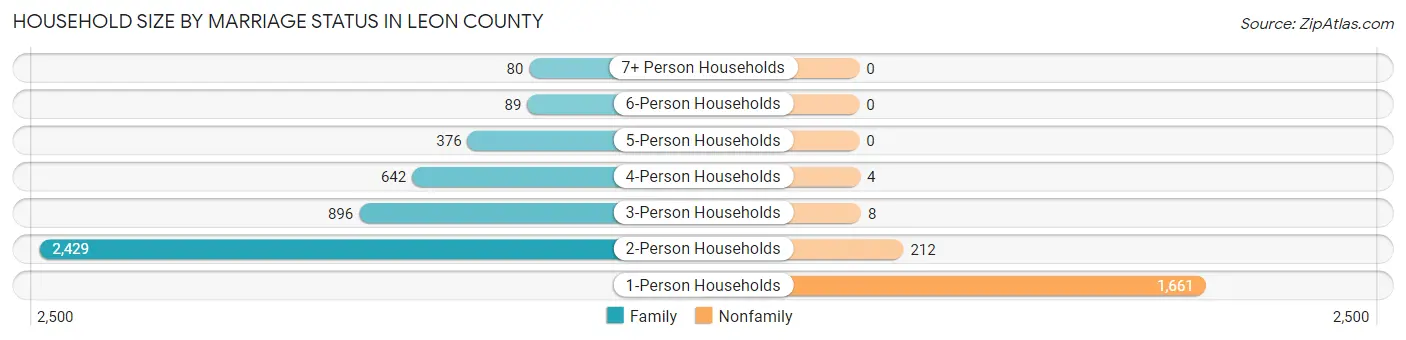
| Household Size | Family Households | Nonfamily Households |
| 1-Person Households | - | 1,661 (26.0%) |
| 2-Person Households | 2,429 (38.0%) | 212 (3.3%) |
| 3-Person Households | 896 (14.0%) | 8 (0.1%) |
| 4-Person Households | 642 (10.0%) | 4 (0.1%) |
| 5-Person Households | 376 (5.9%) | 0 (0.0%) |
| 6-Person Households | 89 (1.4%) | 0 (0.0%) |
| 7+ Person Households | 80 (1.3%) | 0 (0.0%) |
| Total | 4,512 (70.5%) | 1,885 (29.5%) |
Female Fertility in Leon County
Fertility by Age in Leon County
Average fertility rate in Leon County is 41.0 births per 1,000 women. Women in the age bracket of 20 to 34 years have the highest fertility rate with 63.0 births per 1,000 women. Women in the age bracket of 20 to 34 years acount for 58.1% of all women with births.
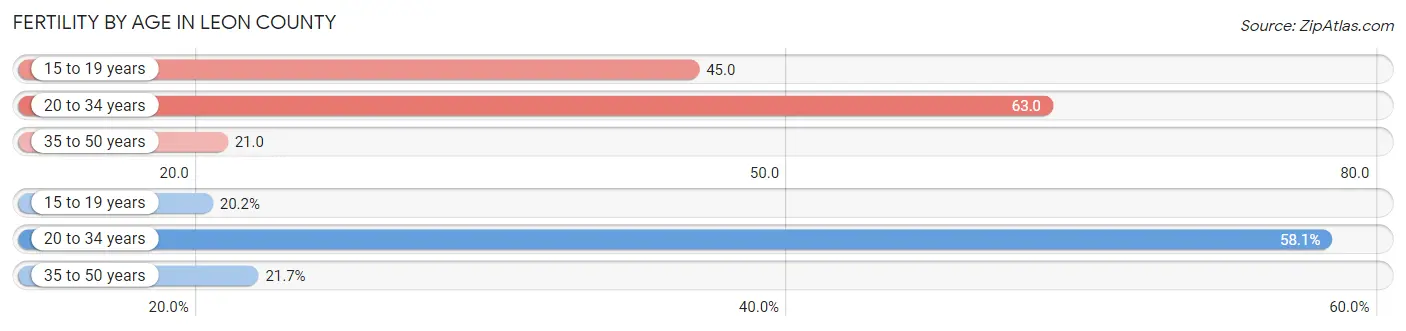
| Age Bracket | Women with Births | Births / 1,000 Women |
| 15 to 19 years | 26 (20.2%) | 45.0 |
| 20 to 34 years | 75 (58.1%) | 63.0 |
| 35 to 50 years | 28 (21.7%) | 21.0 |
| Total | 129 (100.0%) | 41.0 |
Fertility by Age by Marriage Status in Leon County
85.3% of women with births (129) in Leon County are married. The highest percentage of unmarried women with births falls into 20 to 34 years age bracket with 25.3% of them unmarried at the time of birth, while the lowest percentage of unmarried women with births belong to 15 to 19 years age bracket with 0.0% of them unmarried.
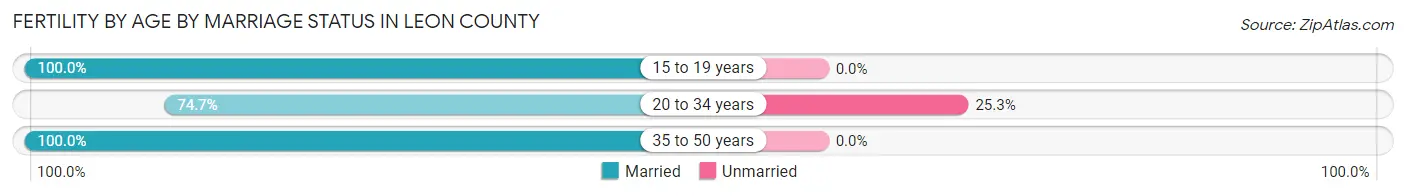
| Age Bracket | Married | Unmarried |
| 15 to 19 years | 26 (100.0%) | 0 (0.0%) |
| 20 to 34 years | 56 (74.7%) | 19 (25.3%) |
| 35 to 50 years | 28 (100.0%) | 0 (0.0%) |
| Total | 110 (85.3%) | 19 (14.7%) |
Fertility by Education in Leon County
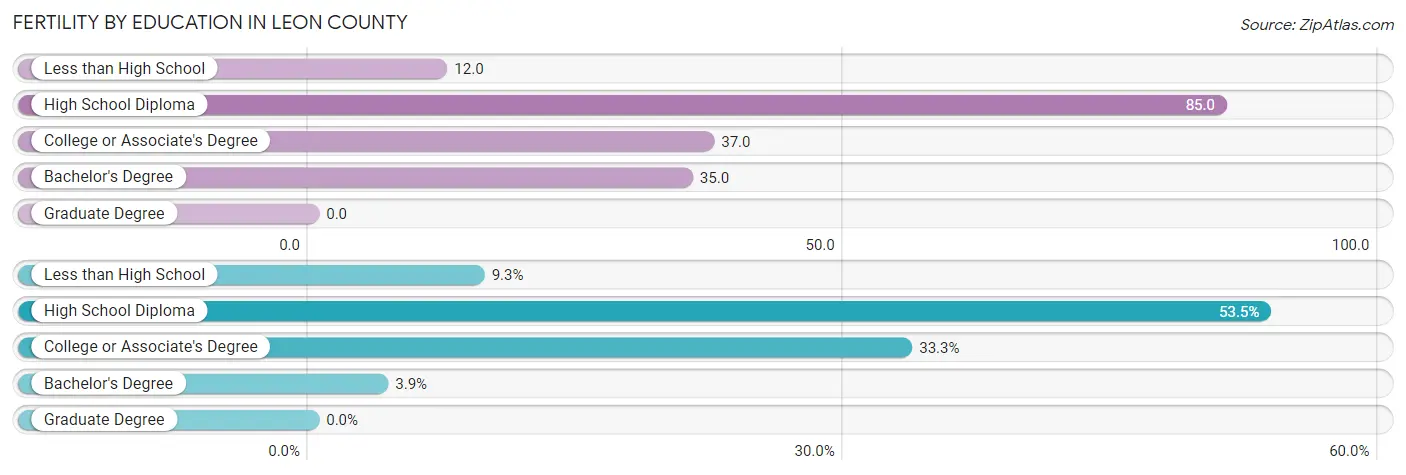
| Educational Attainment | Women with Births | Births / 1,000 Women |
| Less than High School | 12 (9.3%) | 12.0 |
| High School Diploma | 69 (53.5%) | 85.0 |
| College or Associate's Degree | 43 (33.3%) | 37.0 |
| Bachelor's Degree | 5 (3.9%) | 35.0 |
| Graduate Degree | 0 (0.0%) | 0.0 |
| Total | 129 (100.0%) | 41.0 |
Fertility by Education by Marriage Status in Leon County
14.7% of women with births in Leon County are unmarried. Women with the educational attainment of less than high school are most likely to be married with 100.0% of them married at childbirth, while women with the educational attainment of high school diploma are least likely to be married with 27.5% of them unmarried at childbirth.
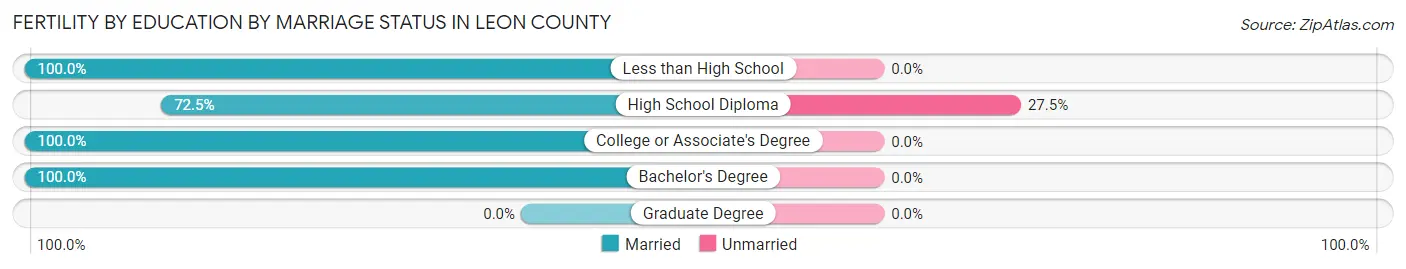
| Educational Attainment | Married | Unmarried |
| Less than High School | 12 (100.0%) | 0 (0.0%) |
| High School Diploma | 50 (72.5%) | 19 (27.5%) |
| College or Associate's Degree | 43 (100.0%) | 0 (0.0%) |
| Bachelor's Degree | 5 (100.0%) | 0 (0.0%) |
| Graduate Degree | 0 (0.0%) | 0 (0.0%) |
| Total | 110 (85.3%) | 19 (14.7%) |
Employment Characteristics in Leon County
Employment by Class of Employer in Leon County
Among the 6,183 employed individuals in Leon County, private company employees (4,130 | 66.8%), self-employed (not incorporated) (674 | 10.9%), and state government employees (456 | 7.4%) make up the most common classes of employment.
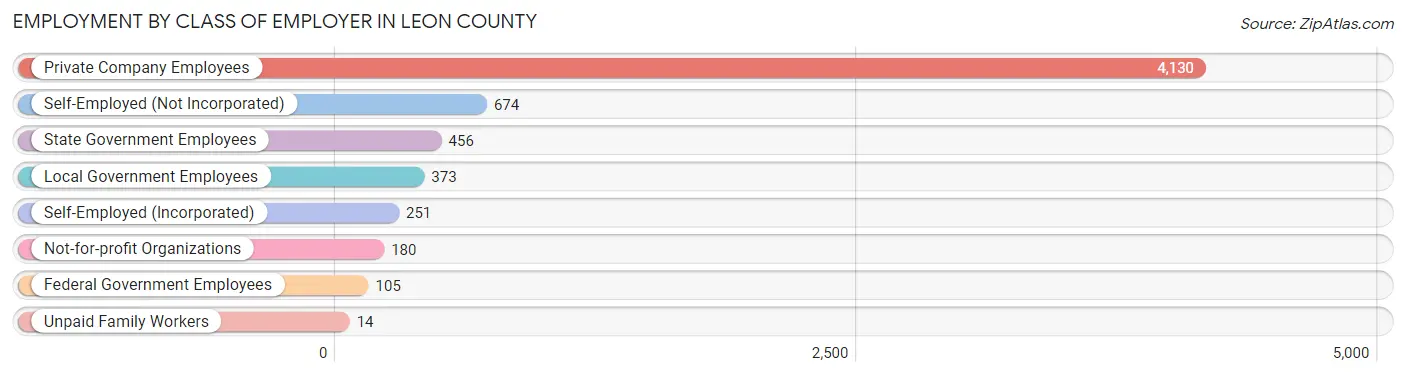
| Employer Class | # Employees | % Employees |
| Private Company Employees | 4,130 | 66.8% |
| Self-Employed (Incorporated) | 251 | 4.1% |
| Self-Employed (Not Incorporated) | 674 | 10.9% |
| Not-for-profit Organizations | 180 | 2.9% |
| Local Government Employees | 373 | 6.0% |
| State Government Employees | 456 | 7.4% |
| Federal Government Employees | 105 | 1.7% |
| Unpaid Family Workers | 14 | 0.2% |
| Total | 6,183 | 100.0% |
Employment Status by Age in Leon County
According to the labor force statistics for Leon County, out of the total population over 16 years of age (12,915), 50.9% or 6,574 individuals are in the labor force, with 5.1% or 335 of them unemployed. The age group with the highest labor force participation rate is 45 to 54 years, with 81.8% or 1,367 individuals in the labor force. Within the labor force, the 20 to 24 years age range has the highest percentage of unemployed individuals, with 13.4% or 72 of them being unemployed.
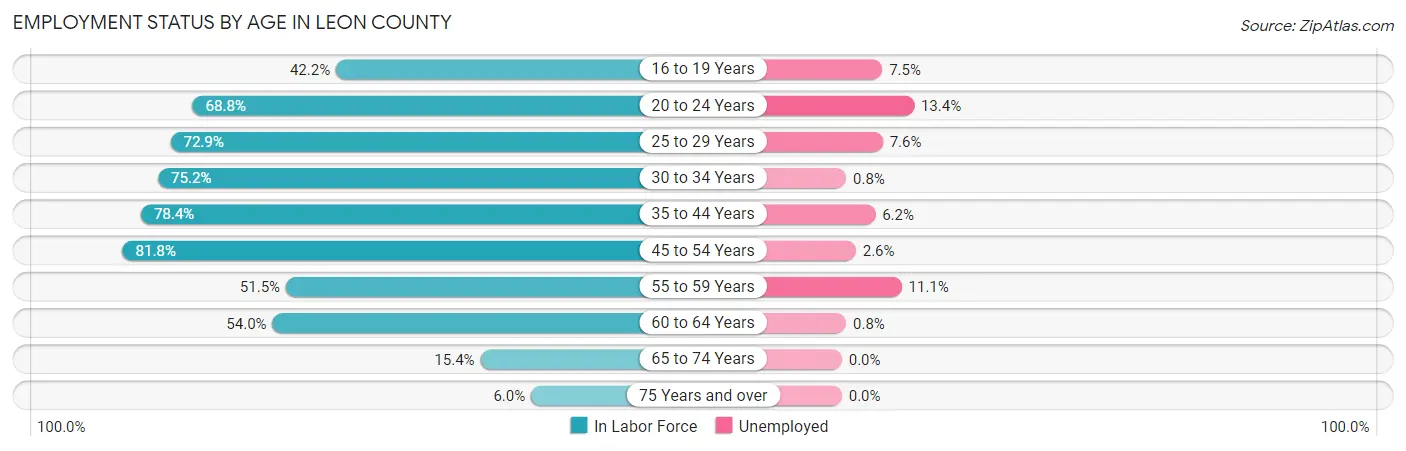
| Age Bracket | In Labor Force | Unemployed |
| 16 to 19 Years | 386 (42.2%) | 29 (7.5%) |
| 20 to 24 Years | 538 (68.8%) | 72 (13.4%) |
| 25 to 29 Years | 648 (72.9%) | 49 (7.6%) |
| 30 to 34 Years | 474 (75.2%) | 4 (0.8%) |
| 35 to 44 Years | 1,413 (78.4%) | 88 (6.2%) |
| 45 to 54 Years | 1,367 (81.8%) | 36 (2.6%) |
| 55 to 59 Years | 450 (51.5%) | 50 (11.1%) |
| 60 to 64 Years | 861 (54.0%) | 7 (0.8%) |
| 65 to 74 Years | 340 (15.4%) | 0 (0.0%) |
| 75 Years and over | 93 (6.0%) | 0 (0.0%) |
| Total | 6,574 (50.9%) | 335 (5.1%) |
Employment Status by Educational Attainment in Leon County
According to labor force statistics for Leon County, 69.9% of individuals (5,214) out of the total population between 25 and 64 years of age (7,459) are in the labor force, with 4.5% or 235 of them being unemployed. The group with the highest labor force participation rate are those with the educational attainment of college / associate degree, with 77.4% or 1,801 individuals in the labor force. Within the labor force, individuals with less than high school education have the highest percentage of unemployment, with 7.8% or 48 of them being unemployed.
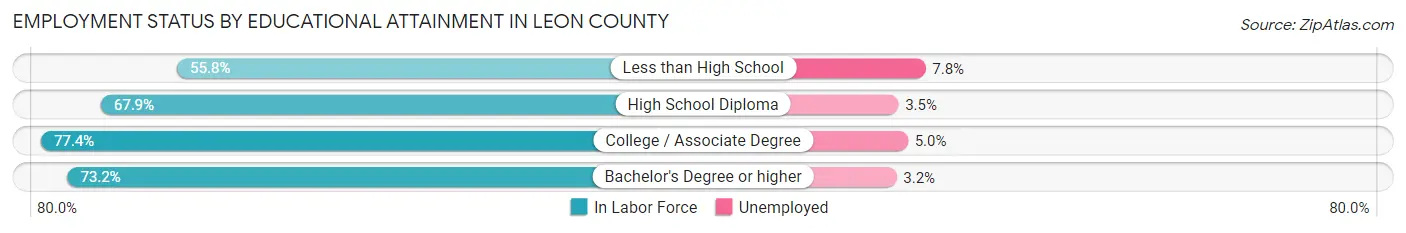
| Educational Attainment | In Labor Force | Unemployed |
| Less than High School | 618 (55.8%) | 86 (7.8%) |
| High School Diploma | 1,981 (67.9%) | 102 (3.5%) |
| College / Associate Degree | 1,801 (77.4%) | 116 (5.0%) |
| Bachelor's Degree or higher | 811 (73.2%) | 35 (3.2%) |
| Total | 5,214 (69.9%) | 336 (4.5%) |
Employment Occupations by Sex in Leon County
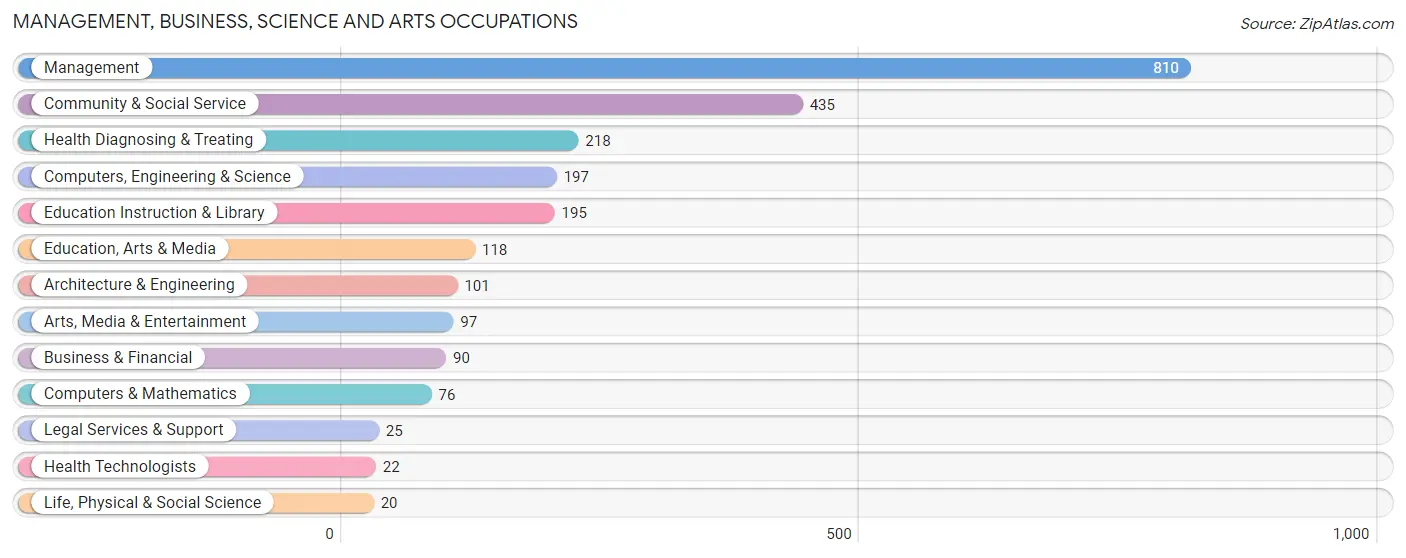
Management, Business, Science and Arts Occupations
The most common Management, Business, Science and Arts occupations in Leon County are Management (810 | 13.0%), Community & Social Service (435 | 7.0%), Health Diagnosing & Treating (218 | 3.5%), Computers, Engineering & Science (197 | 3.2%), and Education Instruction & Library (195 | 3.1%).
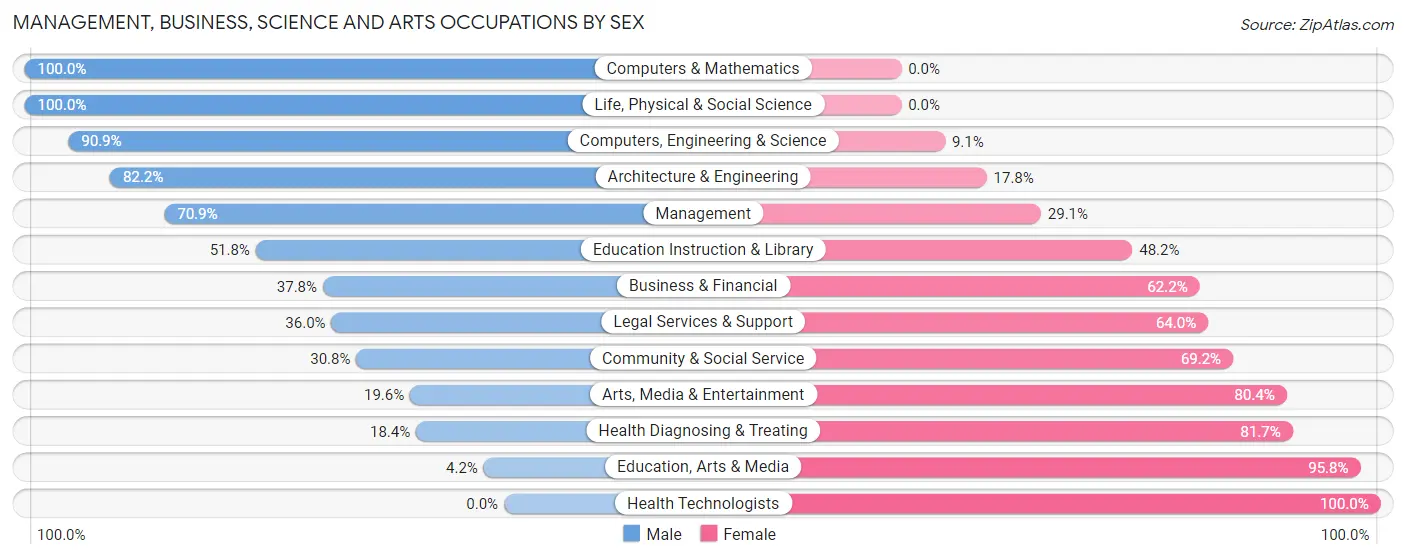
Management, Business, Science and Arts Occupations by Sex
Within the Management, Business, Science and Arts occupations in Leon County, the most male-oriented occupations are Computers & Mathematics (100.0%), Life, Physical & Social Science (100.0%), and Computers, Engineering & Science (90.9%), while the most female-oriented occupations are Health Technologists (100.0%), Education, Arts & Media (95.8%), and Health Diagnosing & Treating (81.7%).
| Occupation | Male | Female |
| Management | 574 (70.9%) | 236 (29.1%) |
| Business & Financial | 34 (37.8%) | 56 (62.2%) |
| Computers, Engineering & Science | 179 (90.9%) | 18 (9.1%) |
| Computers & Mathematics | 76 (100.0%) | 0 (0.0%) |
| Architecture & Engineering | 83 (82.2%) | 18 (17.8%) |
| Life, Physical & Social Science | 20 (100.0%) | 0 (0.0%) |
| Community & Social Service | 134 (30.8%) | 301 (69.2%) |
| Education, Arts & Media | 5 (4.2%) | 113 (95.8%) |
| Legal Services & Support | 9 (36.0%) | 16 (64.0%) |
| Education Instruction & Library | 101 (51.8%) | 94 (48.2%) |
| Arts, Media & Entertainment | 19 (19.6%) | 78 (80.4%) |
| Health Diagnosing & Treating | 40 (18.3%) | 178 (81.7%) |
| Health Technologists | 0 (0.0%) | 22 (100.0%) |
| Total (Category) | 961 (54.9%) | 789 (45.1%) |
| Total (Overall) | 3,425 (54.9%) | 2,809 (45.1%) |
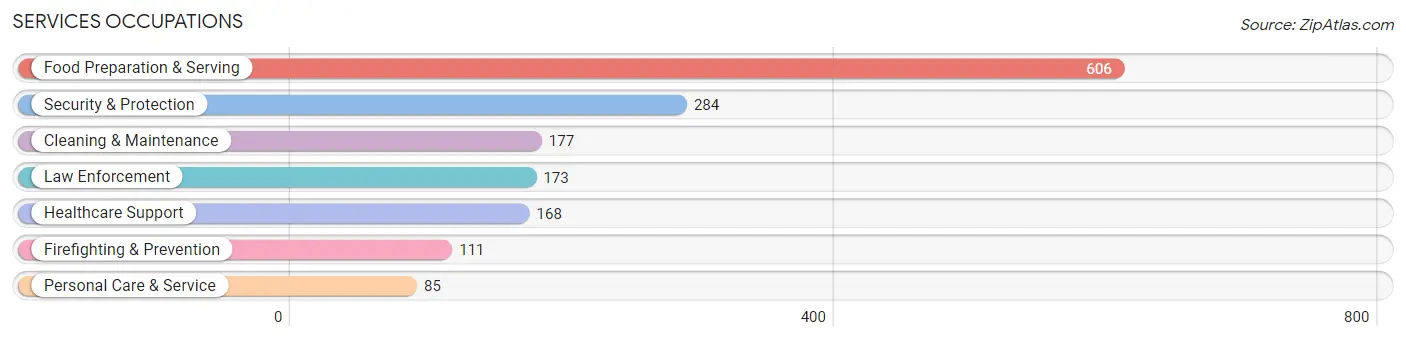
Services Occupations
The most common Services occupations in Leon County are Food Preparation & Serving (606 | 9.7%), Security & Protection (284 | 4.6%), Cleaning & Maintenance (177 | 2.8%), Law Enforcement (173 | 2.8%), and Healthcare Support (168 | 2.7%).
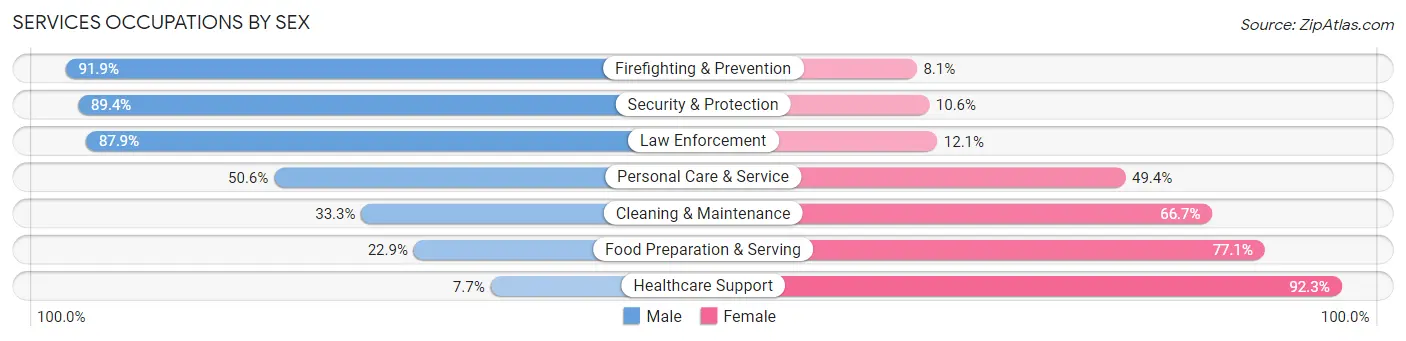
Services Occupations by Sex
Within the Services occupations in Leon County, the most male-oriented occupations are Firefighting & Prevention (91.9%), Security & Protection (89.4%), and Law Enforcement (87.9%), while the most female-oriented occupations are Healthcare Support (92.3%), Food Preparation & Serving (77.1%), and Cleaning & Maintenance (66.7%).
| Occupation | Male | Female |
| Healthcare Support | 13 (7.7%) | 155 (92.3%) |
| Security & Protection | 254 (89.4%) | 30 (10.6%) |
| Firefighting & Prevention | 102 (91.9%) | 9 (8.1%) |
| Law Enforcement | 152 (87.9%) | 21 (12.1%) |
| Food Preparation & Serving | 139 (22.9%) | 467 (77.1%) |
| Cleaning & Maintenance | 59 (33.3%) | 118 (66.7%) |
| Personal Care & Service | 43 (50.6%) | 42 (49.4%) |
| Total (Category) | 508 (38.5%) | 812 (61.5%) |
| Total (Overall) | 3,425 (54.9%) | 2,809 (45.1%) |
Sales and Office Occupations
The most common Sales and Office occupations in Leon County are Sales & Related (719 | 11.5%), and Office & Administration (648 | 10.4%).
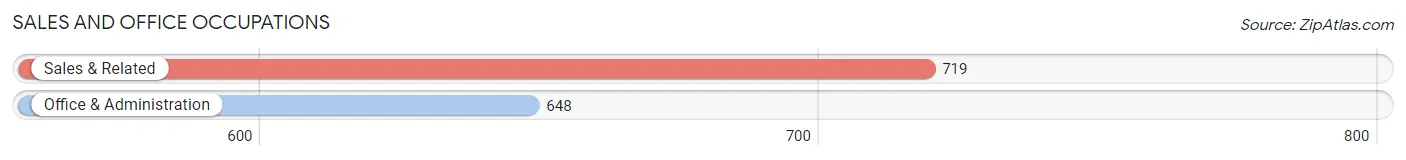
Sales and Office Occupations by Sex
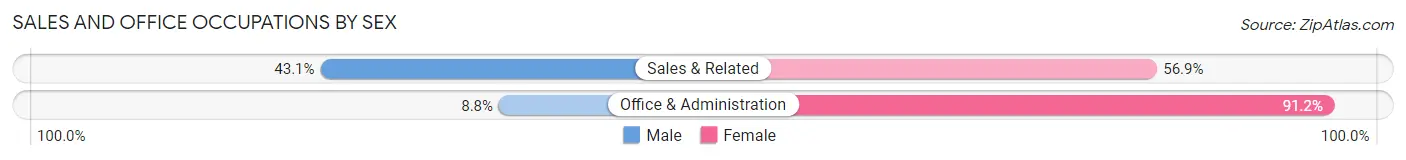
| Occupation | Male | Female |
| Sales & Related | 310 (43.1%) | 409 (56.9%) |
| Office & Administration | 57 (8.8%) | 591 (91.2%) |
| Total (Category) | 367 (26.9%) | 1,000 (73.2%) |
| Total (Overall) | 3,425 (54.9%) | 2,809 (45.1%) |
Natural Resources, Construction and Maintenance Occupations
The most common Natural Resources, Construction and Maintenance occupations in Leon County are Construction & Extraction (575 | 9.2%), Installation, Maintenance & Repair (222 | 3.6%), and Farming, Fishing & Forestry (168 | 2.7%).
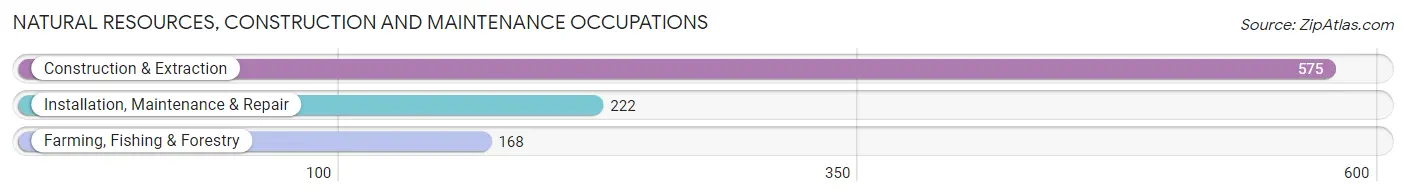
Natural Resources, Construction and Maintenance Occupations by Sex
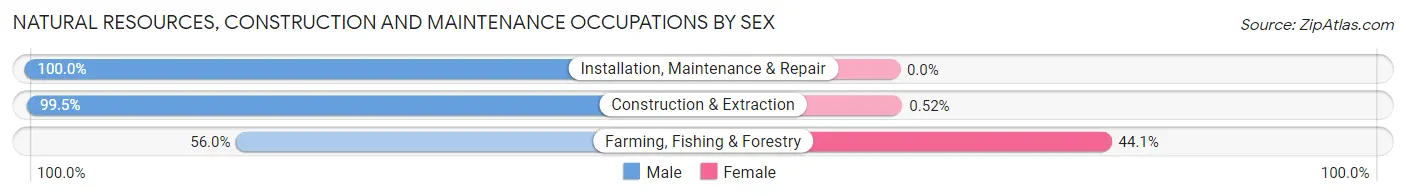
| Occupation | Male | Female |
| Farming, Fishing & Forestry | 94 (55.9%) | 74 (44.1%) |
| Construction & Extraction | 572 (99.5%) | 3 (0.5%) |
| Installation, Maintenance & Repair | 222 (100.0%) | 0 (0.0%) |
| Total (Category) | 888 (92.0%) | 77 (8.0%) |
| Total (Overall) | 3,425 (54.9%) | 2,809 (45.1%) |
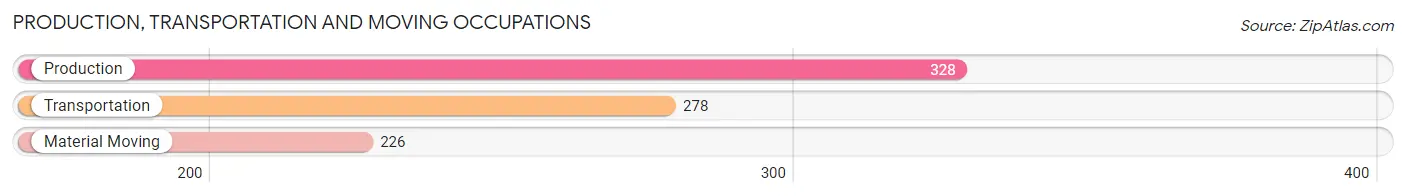
Production, Transportation and Moving Occupations
The most common Production, Transportation and Moving occupations in Leon County are Production (328 | 5.3%), Transportation (278 | 4.5%), and Material Moving (226 | 3.6%).
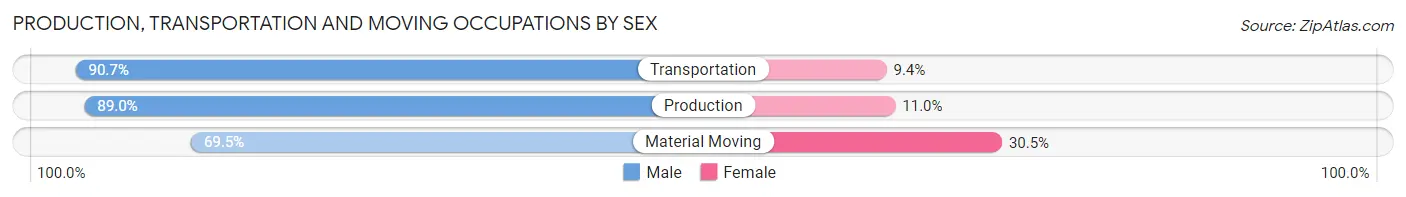
Production, Transportation and Moving Occupations by Sex
| Occupation | Male | Female |
| Production | 292 (89.0%) | 36 (11.0%) |
| Transportation | 252 (90.6%) | 26 (9.3%) |
| Material Moving | 157 (69.5%) | 69 (30.5%) |
| Total (Category) | 701 (84.3%) | 131 (15.8%) |
| Total (Overall) | 3,425 (54.9%) | 2,809 (45.1%) |
Employment Industries by Sex in Leon County
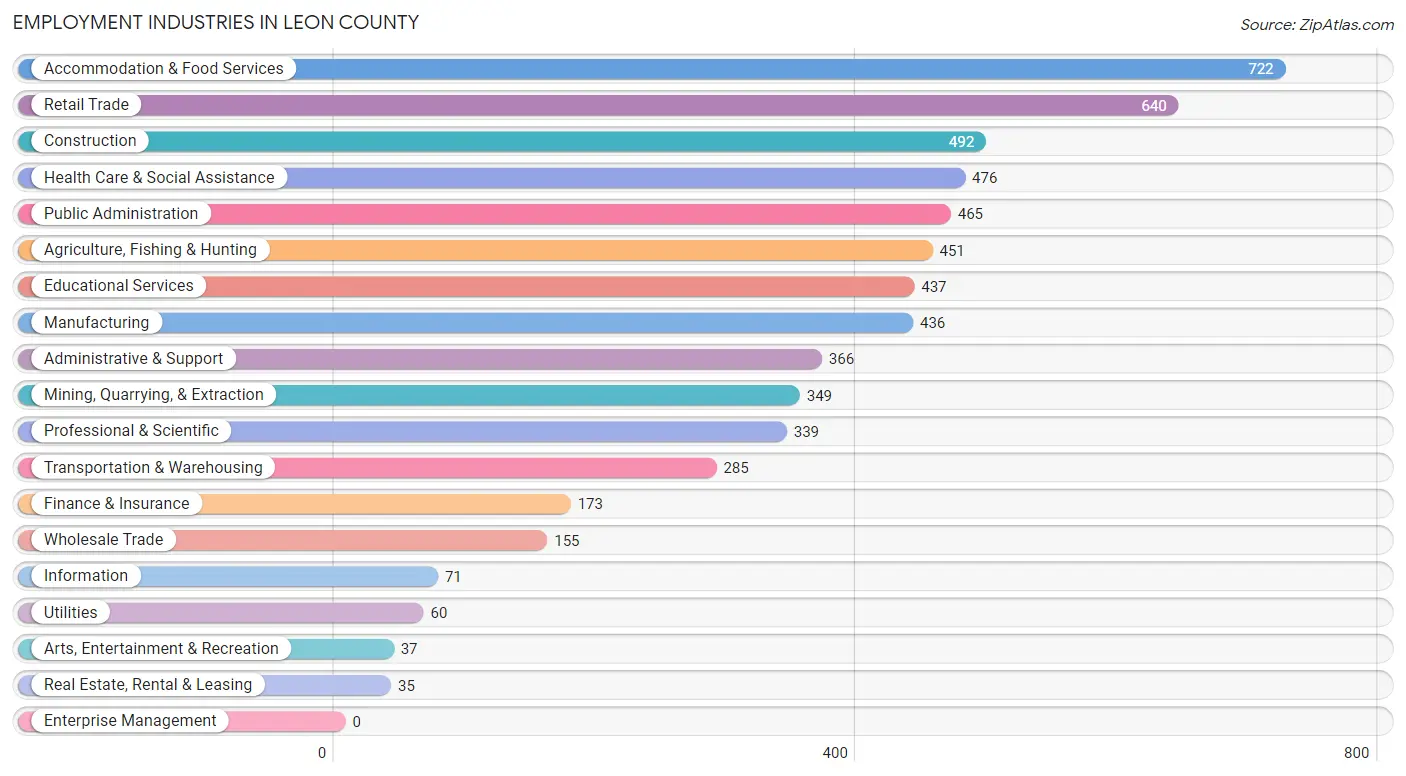
Employment Industries in Leon County
The major employment industries in Leon County include Accommodation & Food Services (722 | 11.6%), Retail Trade (640 | 10.3%), Construction (492 | 7.9%), Health Care & Social Assistance (476 | 7.6%), and Public Administration (465 | 7.5%).
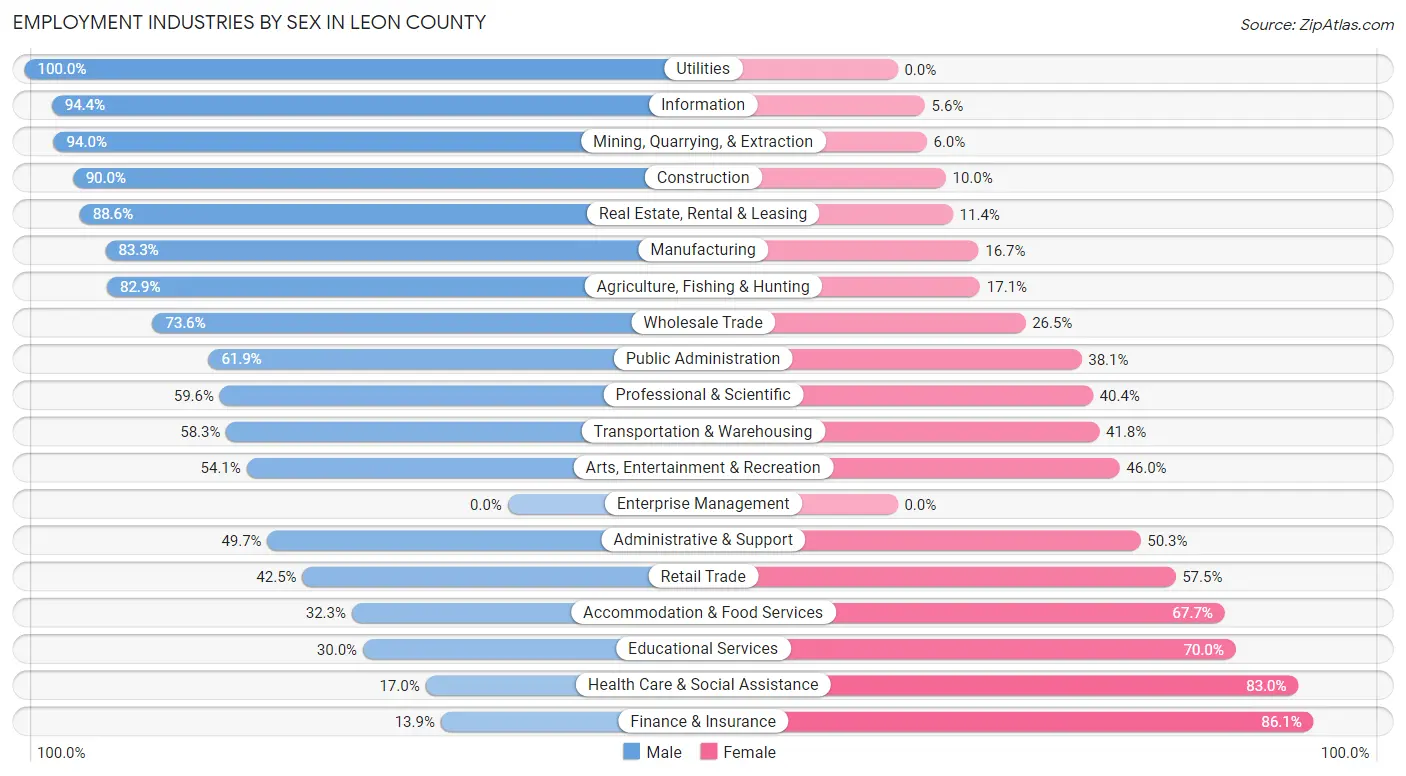
Employment Industries by Sex in Leon County
The Leon County industries that see more men than women are Utilities (100.0%), Information (94.4%), and Mining, Quarrying, & Extraction (94.0%), whereas the industries that tend to have a higher number of women are Finance & Insurance (86.1%), Health Care & Social Assistance (83.0%), and Educational Services (70.0%).
| Industry | Male | Female |
| Agriculture, Fishing & Hunting | 374 (82.9%) | 77 (17.1%) |
| Mining, Quarrying, & Extraction | 328 (94.0%) | 21 (6.0%) |
| Construction | 443 (90.0%) | 49 (10.0%) |
| Manufacturing | 363 (83.3%) | 73 (16.7%) |
| Wholesale Trade | 114 (73.6%) | 41 (26.5%) |
| Retail Trade | 272 (42.5%) | 368 (57.5%) |
| Transportation & Warehousing | 166 (58.3%) | 119 (41.7%) |
| Utilities | 60 (100.0%) | 0 (0.0%) |
| Information | 67 (94.4%) | 4 (5.6%) |
| Finance & Insurance | 24 (13.9%) | 149 (86.1%) |
| Real Estate, Rental & Leasing | 31 (88.6%) | 4 (11.4%) |
| Professional & Scientific | 202 (59.6%) | 137 (40.4%) |
| Enterprise Management | 0 (0.0%) | 0 (0.0%) |
| Administrative & Support | 182 (49.7%) | 184 (50.3%) |
| Educational Services | 131 (30.0%) | 306 (70.0%) |
| Health Care & Social Assistance | 81 (17.0%) | 395 (83.0%) |
| Arts, Entertainment & Recreation | 20 (54.0%) | 17 (46.0%) |
| Accommodation & Food Services | 233 (32.3%) | 489 (67.7%) |
| Public Administration | 288 (61.9%) | 177 (38.1%) |
| Total | 3,425 (54.9%) | 2,809 (45.1%) |
Education in Leon County
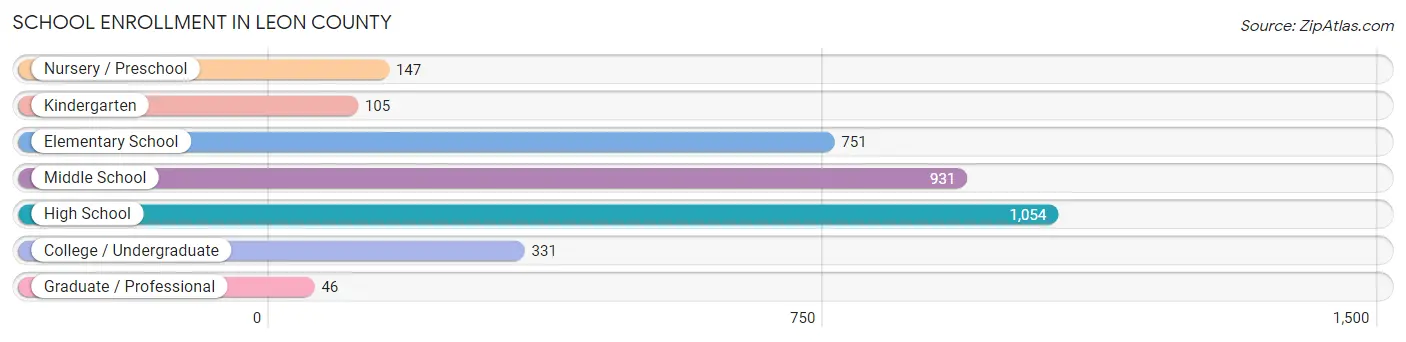
School Enrollment in Leon County
The most common levels of schooling among the 3,365 students in Leon County are high school (1,054 | 31.3%), middle school (931 | 27.7%), and elementary school (751 | 22.3%).
| School Level | # Students | % Students |
| Nursery / Preschool | 147 | 4.4% |
| Kindergarten | 105 | 3.1% |
| Elementary School | 751 | 22.3% |
| Middle School | 931 | 27.7% |
| High School | 1,054 | 31.3% |
| College / Undergraduate | 331 | 9.8% |
| Graduate / Professional | 46 | 1.4% |
| Total | 3,365 | 100.0% |
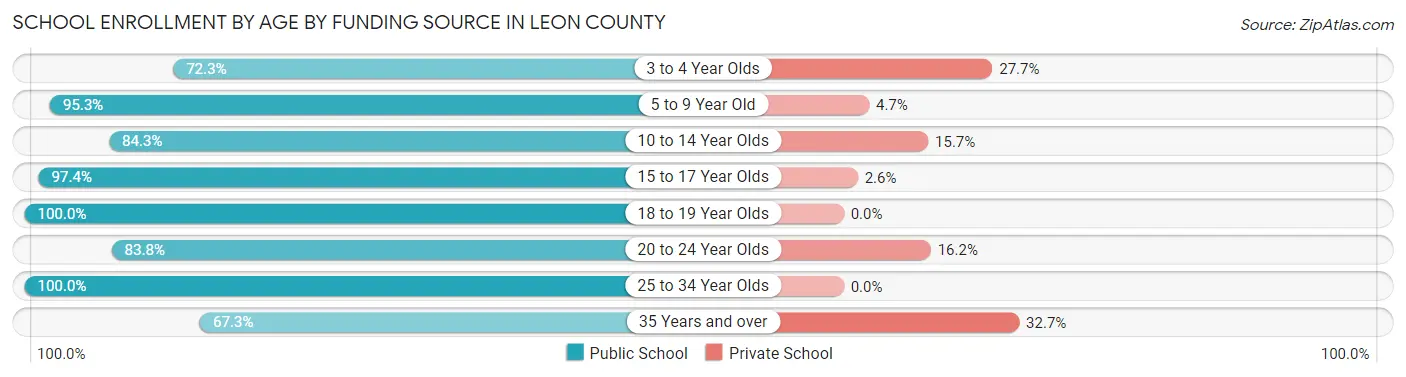
School Enrollment by Age by Funding Source in Leon County
Out of a total of 3,365 students who are enrolled in schools in Leon County, 316 (9.4%) attend a private institution, while the remaining 3,049 (90.6%) are enrolled in public schools. The age group of 35 years and over has the highest likelihood of being enrolled in private schools, with 17 (32.7% in the age bracket) enrolled. Conversely, the age group of 18 to 19 year olds has the lowest likelihood of being enrolled in a private school, with 203 (100.0% in the age bracket) attending a public institution.
| Age Bracket | Public School | Private School |
| 3 to 4 Year Olds | 94 (72.3%) | 36 (27.7%) |
| 5 to 9 Year Old | 706 (95.3%) | 35 (4.7%) |
| 10 to 14 Year Olds | 1,018 (84.3%) | 190 (15.7%) |
| 15 to 17 Year Olds | 743 (97.4%) | 20 (2.6%) |
| 18 to 19 Year Olds | 203 (100.0%) | 0 (0.0%) |
| 20 to 24 Year Olds | 93 (83.8%) | 18 (16.2%) |
| 25 to 34 Year Olds | 157 (100.0%) | 0 (0.0%) |
| 35 Years and over | 35 (67.3%) | 17 (32.7%) |
| Total | 3,049 (90.6%) | 316 (9.4%) |
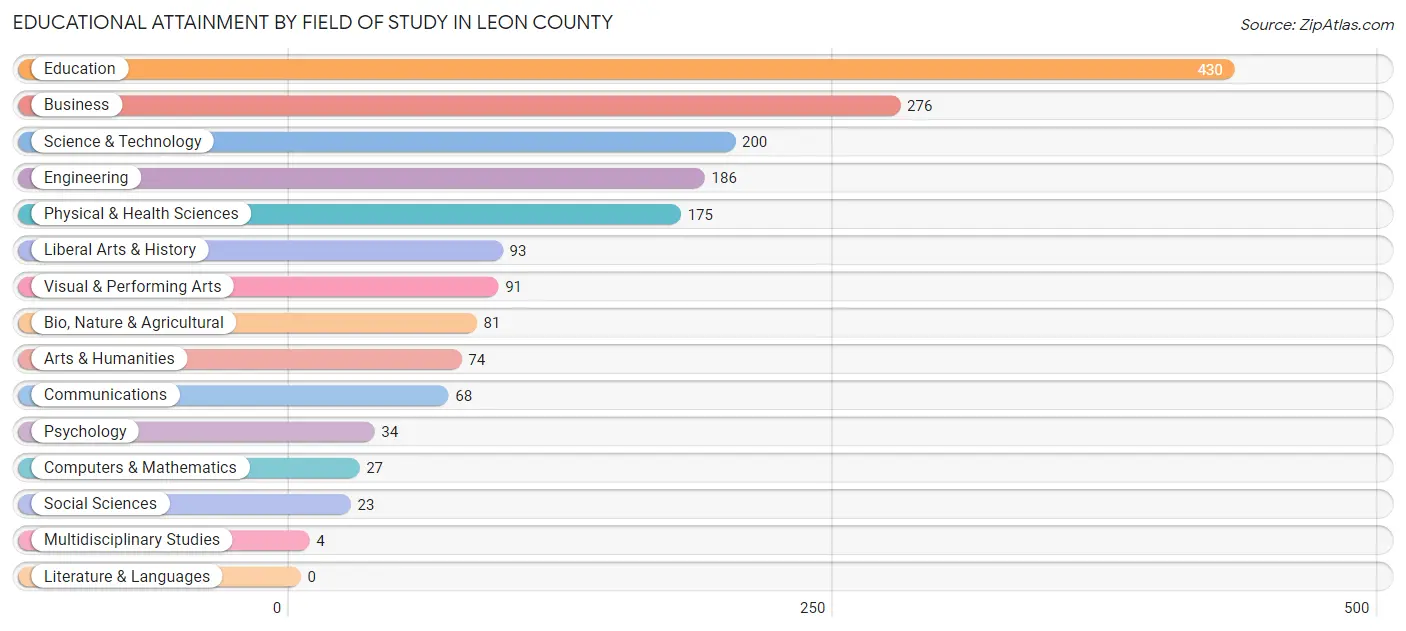
Educational Attainment by Field of Study in Leon County
Education (430 | 24.4%), business (276 | 15.7%), science & technology (200 | 11.4%), engineering (186 | 10.6%), and physical & health sciences (175 | 9.9%) are the most common fields of study among 1,762 individuals in Leon County who have obtained a bachelor's degree or higher.
| Field of Study | # Graduates | % Graduates |
| Computers & Mathematics | 27 | 1.5% |
| Bio, Nature & Agricultural | 81 | 4.6% |
| Physical & Health Sciences | 175 | 9.9% |
| Psychology | 34 | 1.9% |
| Social Sciences | 23 | 1.3% |
| Engineering | 186 | 10.6% |
| Multidisciplinary Studies | 4 | 0.2% |
| Science & Technology | 200 | 11.4% |
| Business | 276 | 15.7% |
| Education | 430 | 24.4% |
| Literature & Languages | 0 | 0.0% |
| Liberal Arts & History | 93 | 5.3% |
| Visual & Performing Arts | 91 | 5.2% |
| Communications | 68 | 3.9% |
| Arts & Humanities | 74 | 4.2% |
| Total | 1,762 | 100.0% |
Transportation & Commute in Leon County
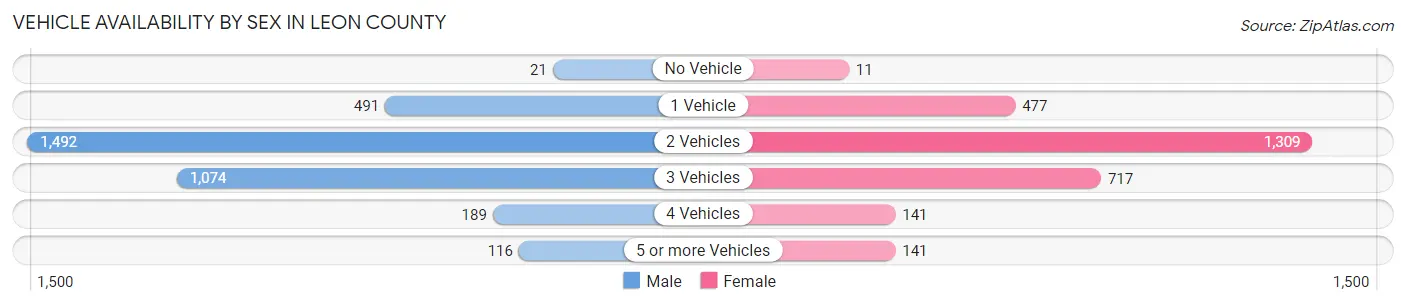
Vehicle Availability by Sex in Leon County
The most prevalent vehicle ownership categories in Leon County are males with 2 vehicles (1,492, accounting for 44.1%) and females with 2 vehicles (1,309, making up 53.4%).
| Vehicles Available | Male | Female |
| No Vehicle | 21 (0.6%) | 11 (0.4%) |
| 1 Vehicle | 491 (14.5%) | 477 (17.1%) |
| 2 Vehicles | 1,492 (44.1%) | 1,309 (46.8%) |
| 3 Vehicles | 1,074 (31.8%) | 717 (25.6%) |
| 4 Vehicles | 189 (5.6%) | 141 (5.0%) |
| 5 or more Vehicles | 116 (3.4%) | 141 (5.0%) |
| Total | 3,383 (100.0%) | 2,796 (100.0%) |
Commute Time in Leon County
The most frequently occuring commute durations in Leon County are 10 to 14 minutes (1,089 commuters, 18.3%), 15 to 19 minutes (822 commuters, 13.9%), and 30 to 34 minutes (744 commuters, 12.5%).
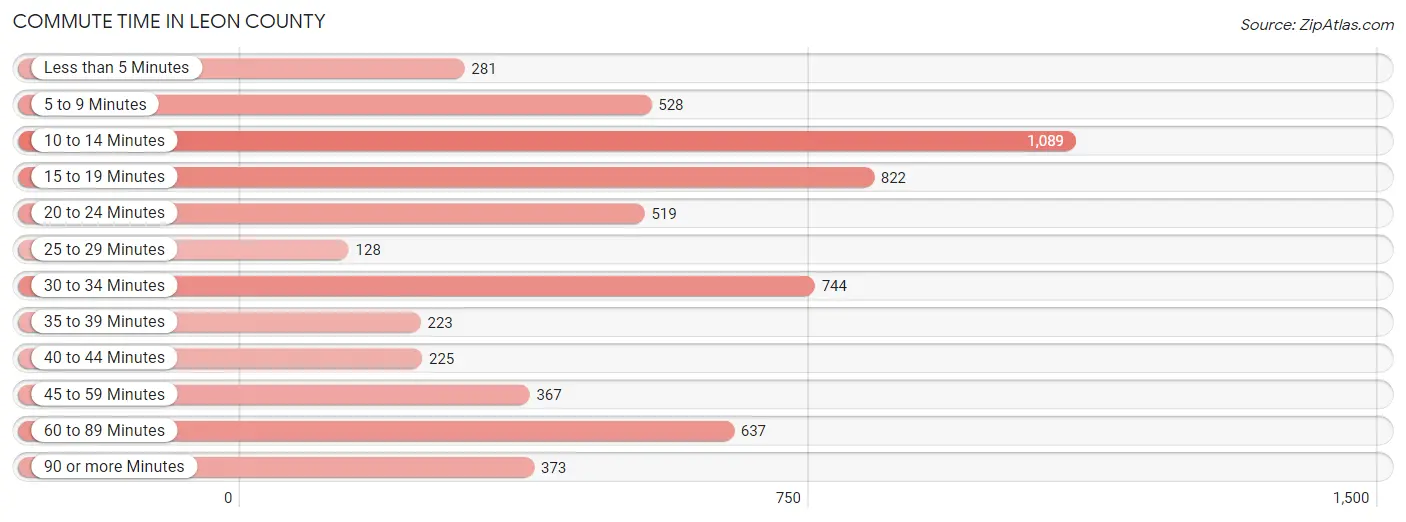
| Commute Time | # Commuters | % Commuters |
| Less than 5 Minutes | 281 | 4.7% |
| 5 to 9 Minutes | 528 | 8.9% |
| 10 to 14 Minutes | 1,089 | 18.3% |
| 15 to 19 Minutes | 822 | 13.9% |
| 20 to 24 Minutes | 519 | 8.7% |
| 25 to 29 Minutes | 128 | 2.2% |
| 30 to 34 Minutes | 744 | 12.5% |
| 35 to 39 Minutes | 223 | 3.8% |
| 40 to 44 Minutes | 225 | 3.8% |
| 45 to 59 Minutes | 367 | 6.2% |
| 60 to 89 Minutes | 637 | 10.7% |
| 90 or more Minutes | 373 | 6.3% |
Commute Time by Sex in Leon County
The most common commute times in Leon County are 10 to 14 minutes (560 commuters, 17.2%) for males and 15 to 19 minutes (547 commuters, 20.5%) for females.
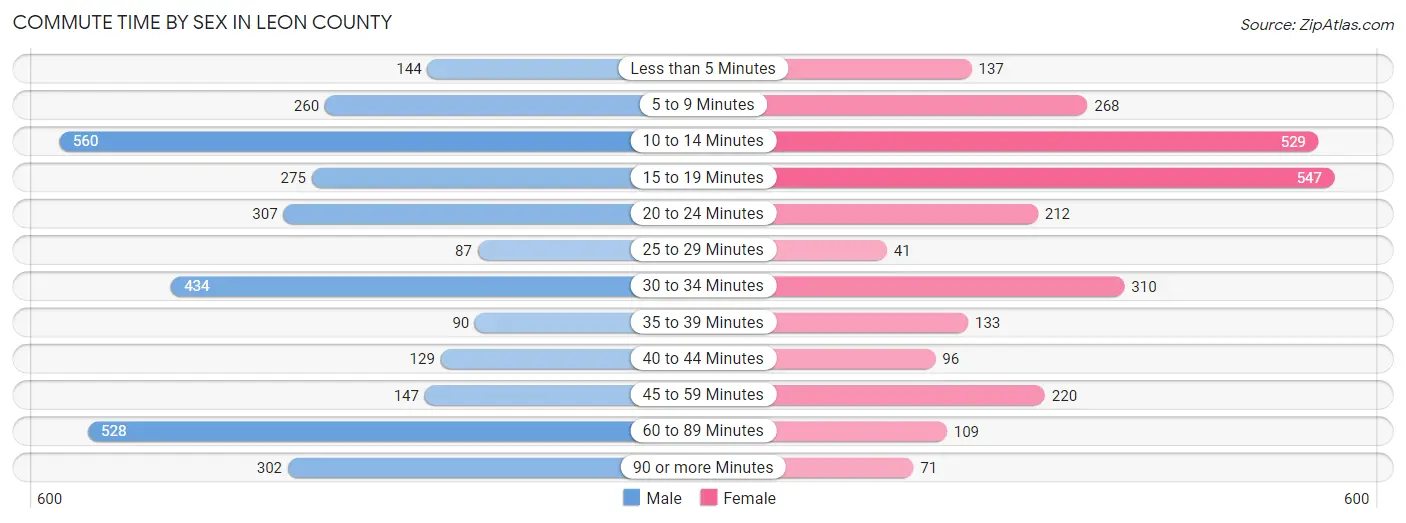
| Commute Time | Male | Female |
| Less than 5 Minutes | 144 (4.4%) | 137 (5.1%) |
| 5 to 9 Minutes | 260 (8.0%) | 268 (10.0%) |
| 10 to 14 Minutes | 560 (17.2%) | 529 (19.8%) |
| 15 to 19 Minutes | 275 (8.4%) | 547 (20.5%) |
| 20 to 24 Minutes | 307 (9.4%) | 212 (7.9%) |
| 25 to 29 Minutes | 87 (2.7%) | 41 (1.5%) |
| 30 to 34 Minutes | 434 (13.3%) | 310 (11.6%) |
| 35 to 39 Minutes | 90 (2.8%) | 133 (5.0%) |
| 40 to 44 Minutes | 129 (4.0%) | 96 (3.6%) |
| 45 to 59 Minutes | 147 (4.5%) | 220 (8.2%) |
| 60 to 89 Minutes | 528 (16.2%) | 109 (4.1%) |
| 90 or more Minutes | 302 (9.3%) | 71 (2.7%) |
Time of Departure to Work by Sex in Leon County
The most frequent times of departure to work in Leon County are 12:00 AM to 4:59 AM (451, 13.8%) for males and 7:00 AM to 7:29 AM (500, 18.7%) for females.
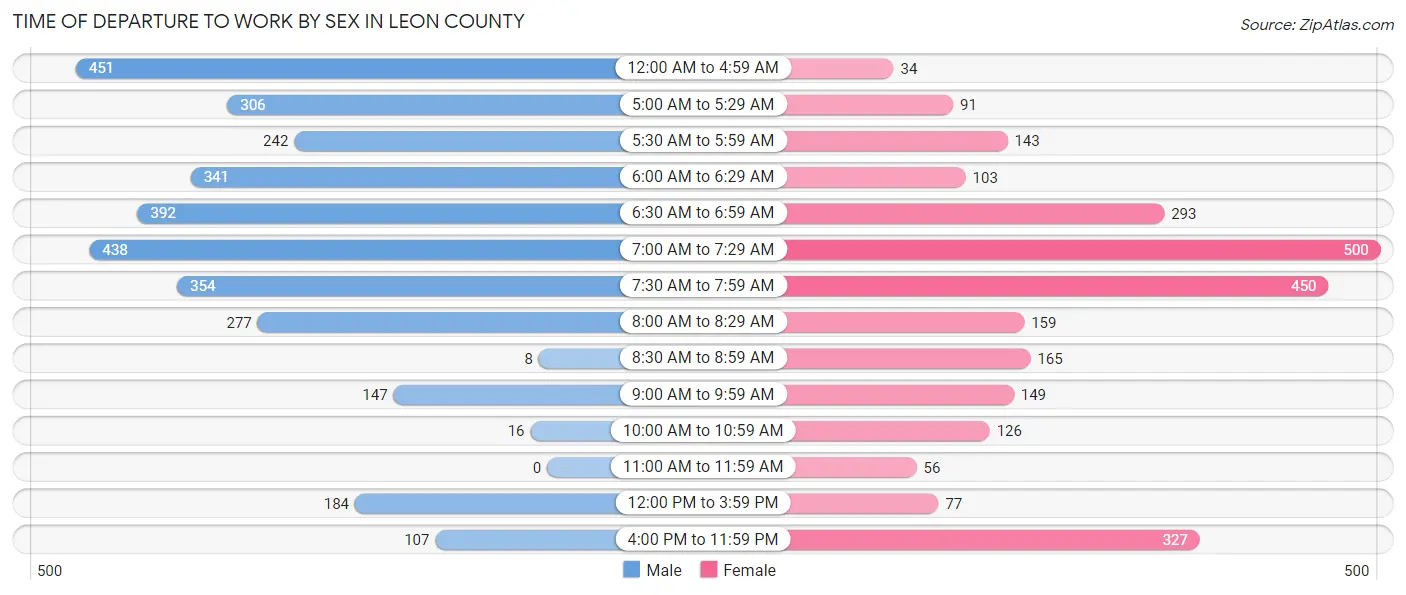
| Time of Departure | Male | Female |
| 12:00 AM to 4:59 AM | 451 (13.8%) | 34 (1.3%) |
| 5:00 AM to 5:29 AM | 306 (9.4%) | 91 (3.4%) |
| 5:30 AM to 5:59 AM | 242 (7.4%) | 143 (5.3%) |
| 6:00 AM to 6:29 AM | 341 (10.4%) | 103 (3.8%) |
| 6:30 AM to 6:59 AM | 392 (12.0%) | 293 (11.0%) |
| 7:00 AM to 7:29 AM | 438 (13.4%) | 500 (18.7%) |
| 7:30 AM to 7:59 AM | 354 (10.8%) | 450 (16.8%) |
| 8:00 AM to 8:29 AM | 277 (8.5%) | 159 (5.9%) |
| 8:30 AM to 8:59 AM | 8 (0.3%) | 165 (6.2%) |
| 9:00 AM to 9:59 AM | 147 (4.5%) | 149 (5.6%) |
| 10:00 AM to 10:59 AM | 16 (0.5%) | 126 (4.7%) |
| 11:00 AM to 11:59 AM | 0 (0.0%) | 56 (2.1%) |
| 12:00 PM to 3:59 PM | 184 (5.6%) | 77 (2.9%) |
| 4:00 PM to 11:59 PM | 107 (3.3%) | 327 (12.2%) |
| Total | 3,263 (100.0%) | 2,673 (100.0%) |
Housing Occupancy in Leon County
Occupancy by Ownership in Leon County
Of the total 6,397 dwellings in Leon County, owner-occupied units account for 5,010 (78.3%), while renter-occupied units make up 1,387 (21.7%).
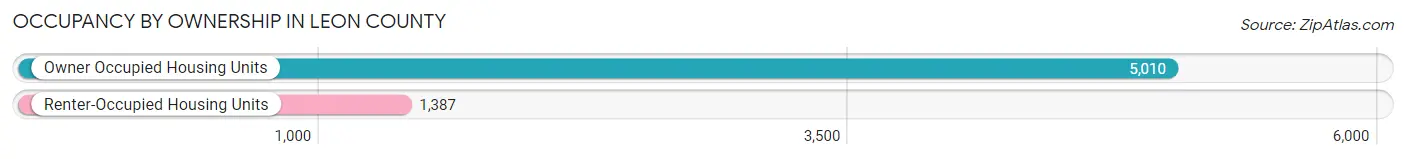
| Occupancy | # Housing Units | % Housing Units |
| Owner Occupied Housing Units | 5,010 | 78.3% |
| Renter-Occupied Housing Units | 1,387 | 21.7% |
| Total Occupied Housing Units | 6,397 | 100.0% |
Occupancy by Household Size in Leon County
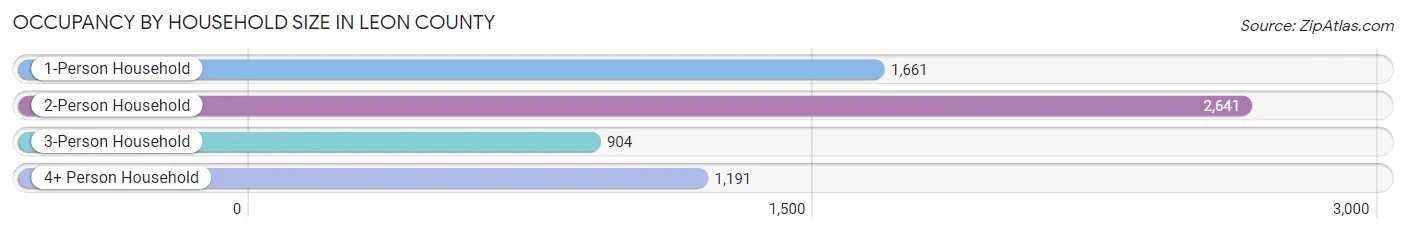
| Household Size | # Housing Units | % Housing Units |
| 1-Person Household | 1,661 | 26.0% |
| 2-Person Household | 2,641 | 41.3% |
| 3-Person Household | 904 | 14.1% |
| 4+ Person Household | 1,191 | 18.6% |
| Total Housing Units | 6,397 | 100.0% |
Occupancy by Ownership by Household Size in Leon County
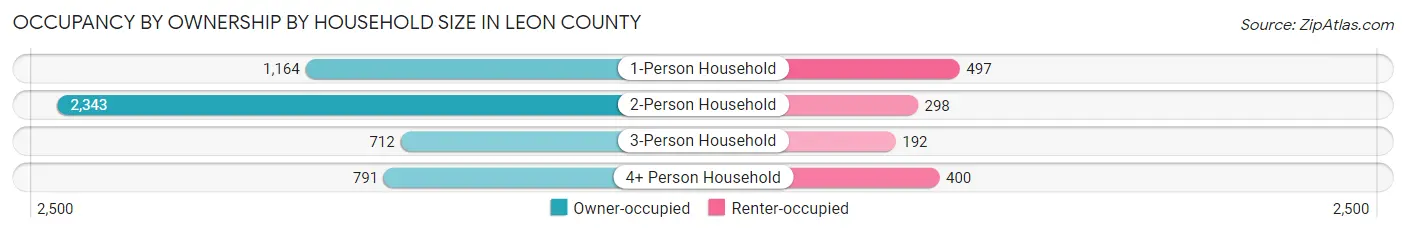
| Household Size | Owner-occupied | Renter-occupied |
| 1-Person Household | 1,164 (70.1%) | 497 (29.9%) |
| 2-Person Household | 2,343 (88.7%) | 298 (11.3%) |
| 3-Person Household | 712 (78.8%) | 192 (21.2%) |
| 4+ Person Household | 791 (66.4%) | 400 (33.6%) |
| Total Housing Units | 5,010 (78.3%) | 1,387 (21.7%) |
Occupancy by Educational Attainment in Leon County
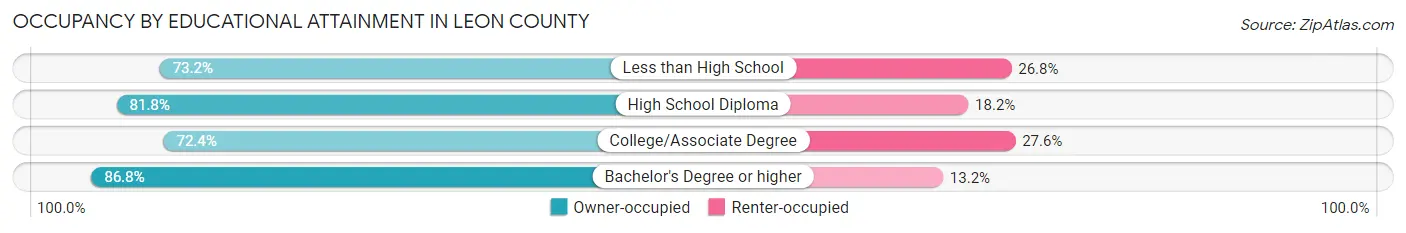
| Household Size | Owner-occupied | Renter-occupied |
| Less than High School | 522 (73.2%) | 191 (26.8%) |
| High School Diploma | 1,910 (81.8%) | 426 (18.2%) |
| College/Associate Degree | 1,653 (72.4%) | 629 (27.6%) |
| Bachelor's Degree or higher | 925 (86.8%) | 141 (13.2%) |
Occupancy by Age of Householder in Leon County
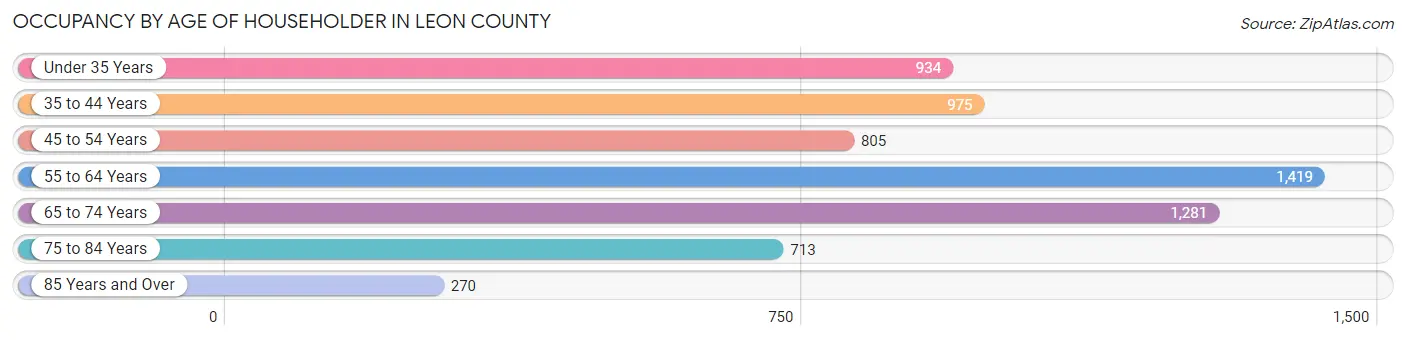
| Age Bracket | # Households | % Households |
| Under 35 Years | 934 | 14.6% |
| 35 to 44 Years | 975 | 15.2% |
| 45 to 54 Years | 805 | 12.6% |
| 55 to 64 Years | 1,419 | 22.2% |
| 65 to 74 Years | 1,281 | 20.0% |
| 75 to 84 Years | 713 | 11.2% |
| 85 Years and Over | 270 | 4.2% |
| Total | 6,397 | 100.0% |
Housing Finances in Leon County
Median Income by Occupancy in Leon County
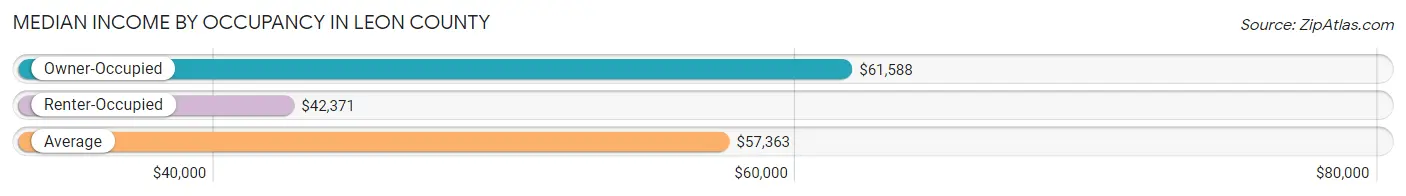
| Occupancy Type | # Households | Median Income |
| Owner-Occupied | 5,010 (78.3%) | $61,588 |
| Renter-Occupied | 1,387 (21.7%) | $42,371 |
| Average | 6,397 (100.0%) | $57,363 |
Occupancy by Householder Income Bracket in Leon County
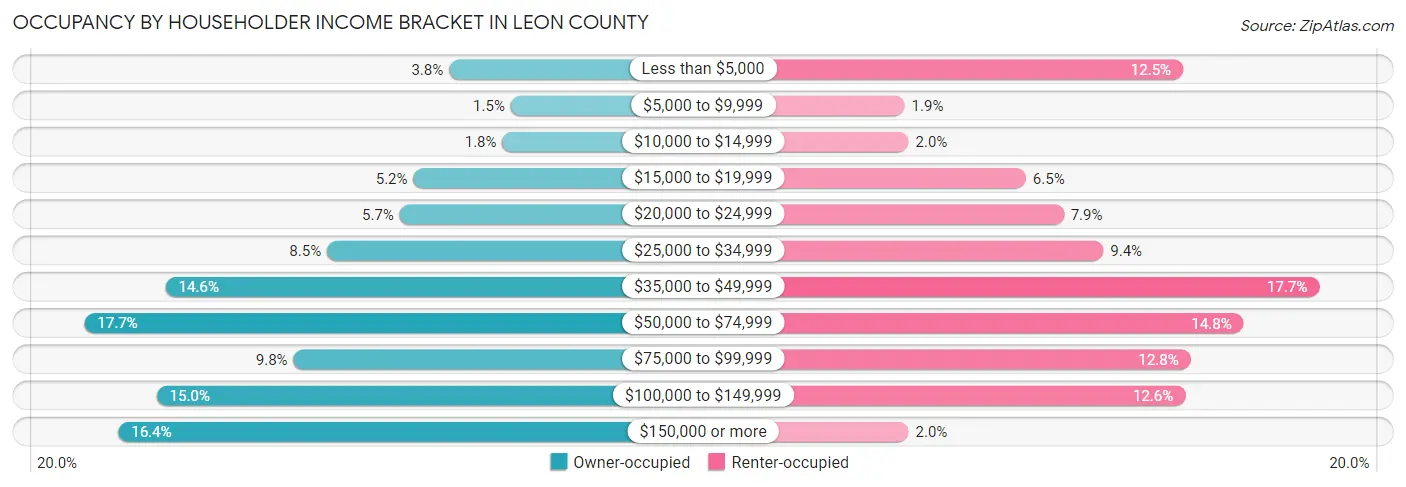
| Income Bracket | Owner-occupied | Renter-occupied |
| Less than $5,000 | 192 (3.8%) | 173 (12.5%) |
| $5,000 to $9,999 | 74 (1.5%) | 26 (1.9%) |
| $10,000 to $14,999 | 90 (1.8%) | 28 (2.0%) |
| $15,000 to $19,999 | 260 (5.2%) | 90 (6.5%) |
| $20,000 to $24,999 | 286 (5.7%) | 110 (7.9%) |
| $25,000 to $34,999 | 425 (8.5%) | 131 (9.4%) |
| $35,000 to $49,999 | 733 (14.6%) | 245 (17.7%) |
| $50,000 to $74,999 | 888 (17.7%) | 205 (14.8%) |
| $75,000 to $99,999 | 489 (9.8%) | 177 (12.8%) |
| $100,000 to $149,999 | 750 (15.0%) | 174 (12.6%) |
| $150,000 or more | 823 (16.4%) | 28 (2.0%) |
| Total | 5,010 (100.0%) | 1,387 (100.0%) |
Monthly Housing Cost Tiers in Leon County
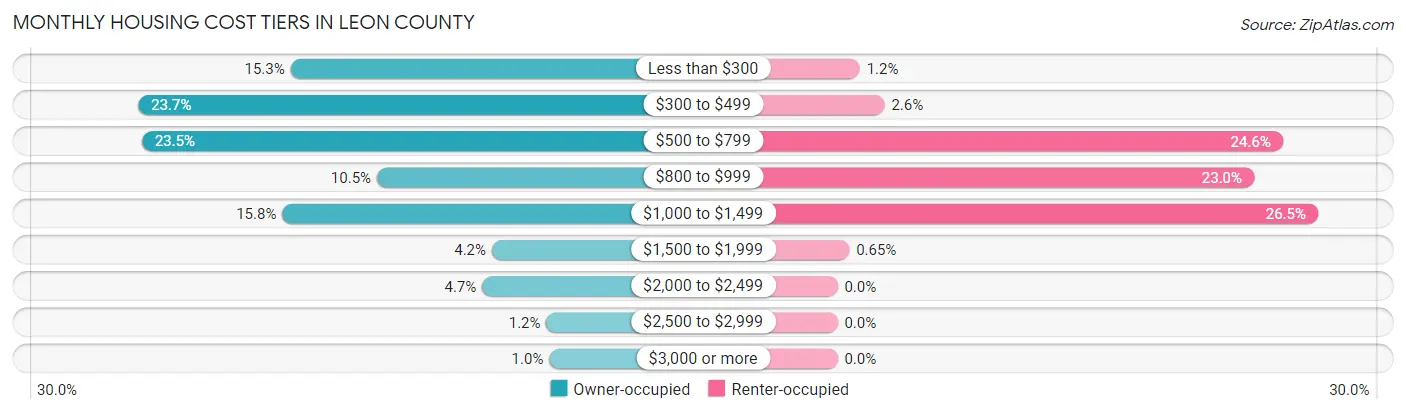
| Monthly Cost | Owner-occupied | Renter-occupied |
| Less than $300 | 767 (15.3%) | 17 (1.2%) |
| $300 to $499 | 1,189 (23.7%) | 36 (2.6%) |
| $500 to $799 | 1,179 (23.5%) | 341 (24.6%) |
| $800 to $999 | 528 (10.5%) | 319 (23.0%) |
| $1,000 to $1,499 | 790 (15.8%) | 368 (26.5%) |
| $1,500 to $1,999 | 210 (4.2%) | 9 (0.6%) |
| $2,000 to $2,499 | 237 (4.7%) | 0 (0.0%) |
| $2,500 to $2,999 | 59 (1.2%) | 0 (0.0%) |
| $3,000 or more | 51 (1.0%) | 0 (0.0%) |
| Total | 5,010 (100.0%) | 1,387 (100.0%) |
Physical Housing Characteristics in Leon County
Housing Structures in Leon County
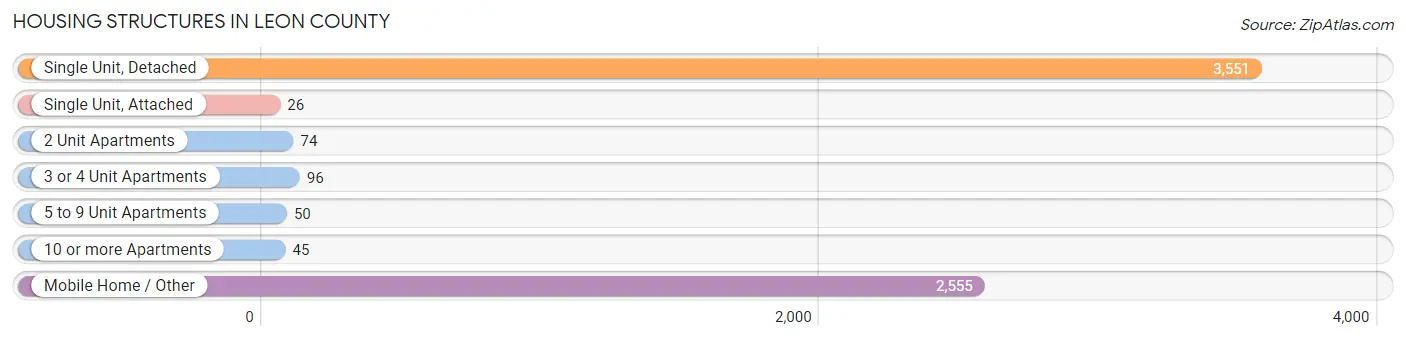
| Structure Type | # Housing Units | % Housing Units |
| Single Unit, Detached | 3,551 | 55.5% |
| Single Unit, Attached | 26 | 0.4% |
| 2 Unit Apartments | 74 | 1.2% |
| 3 or 4 Unit Apartments | 96 | 1.5% |
| 5 to 9 Unit Apartments | 50 | 0.8% |
| 10 or more Apartments | 45 | 0.7% |
| Mobile Home / Other | 2,555 | 39.9% |
| Total | 6,397 | 100.0% |
Housing Structures by Occupancy in Leon County
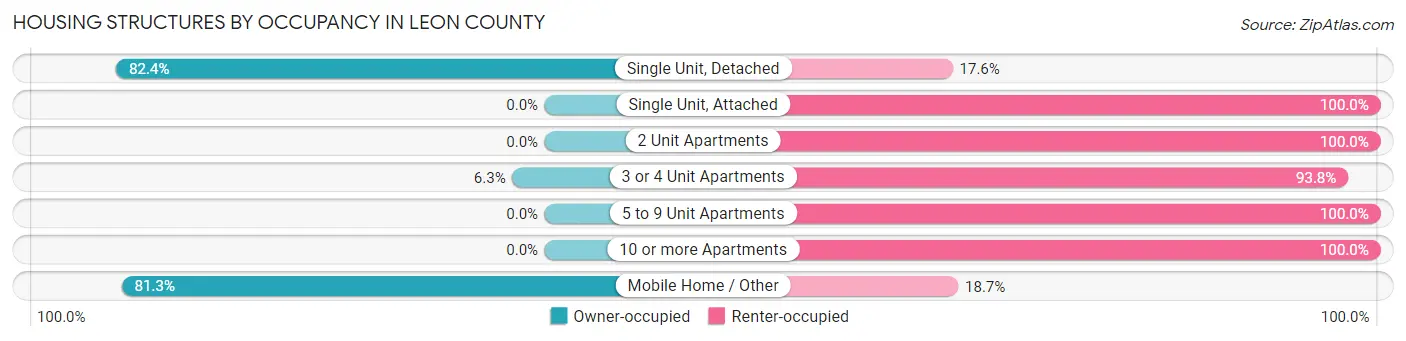
| Structure Type | Owner-occupied | Renter-occupied |
| Single Unit, Detached | 2,926 (82.4%) | 625 (17.6%) |
| Single Unit, Attached | 0 (0.0%) | 26 (100.0%) |
| 2 Unit Apartments | 0 (0.0%) | 74 (100.0%) |
| 3 or 4 Unit Apartments | 6 (6.2%) | 90 (93.8%) |
| 5 to 9 Unit Apartments | 0 (0.0%) | 50 (100.0%) |
| 10 or more Apartments | 0 (0.0%) | 45 (100.0%) |
| Mobile Home / Other | 2,078 (81.3%) | 477 (18.7%) |
| Total | 5,010 (78.3%) | 1,387 (21.7%) |
Housing Structures by Number of Rooms in Leon County
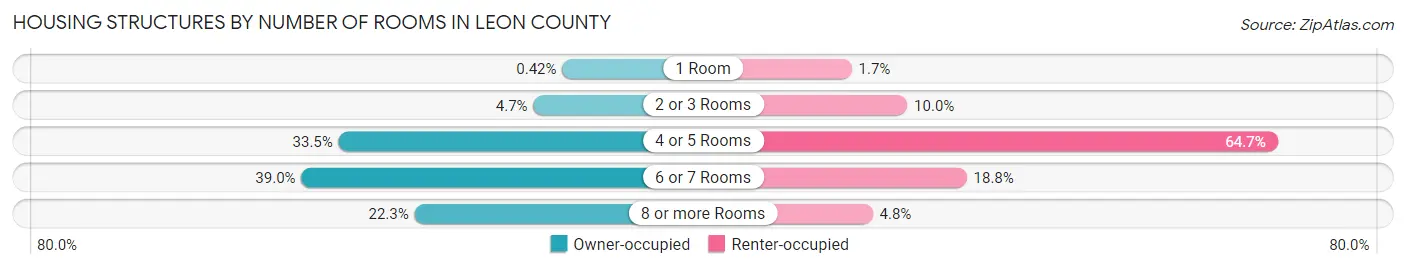
| Number of Rooms | Owner-occupied | Renter-occupied |
| 1 Room | 21 (0.4%) | 24 (1.7%) |
| 2 or 3 Rooms | 236 (4.7%) | 138 (10.0%) |
| 4 or 5 Rooms | 1,680 (33.5%) | 898 (64.7%) |
| 6 or 7 Rooms | 1,956 (39.0%) | 260 (18.8%) |
| 8 or more Rooms | 1,117 (22.3%) | 67 (4.8%) |
| Total | 5,010 (100.0%) | 1,387 (100.0%) |
Housing Structure by Heating Type in Leon County
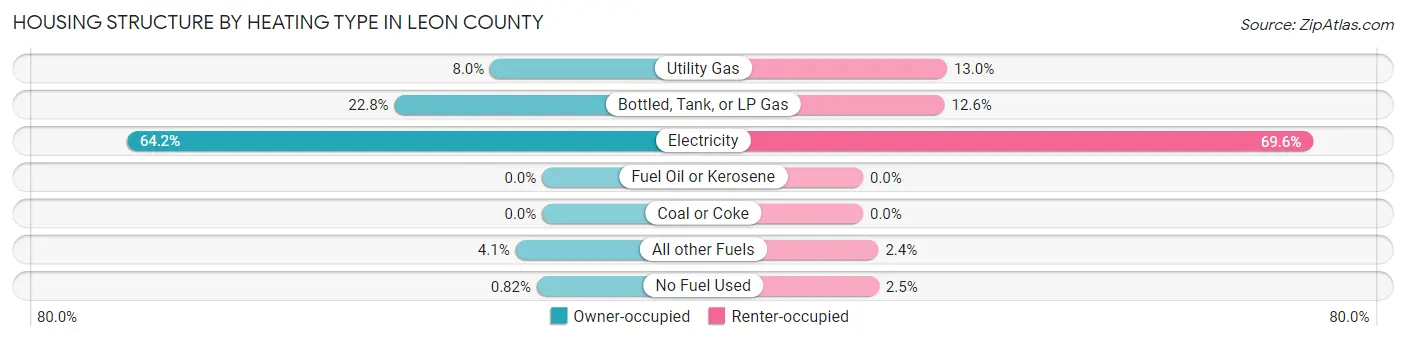
| Heating Type | Owner-occupied | Renter-occupied |
| Utility Gas | 403 (8.0%) | 180 (13.0%) |
| Bottled, Tank, or LP Gas | 1,144 (22.8%) | 175 (12.6%) |
| Electricity | 3,216 (64.2%) | 965 (69.6%) |
| Fuel Oil or Kerosene | 0 (0.0%) | 0 (0.0%) |
| Coal or Coke | 0 (0.0%) | 0 (0.0%) |
| All other Fuels | 206 (4.1%) | 33 (2.4%) |
| No Fuel Used | 41 (0.8%) | 34 (2.5%) |
| Total | 5,010 (100.0%) | 1,387 (100.0%) |
Household Vehicle Usage in Leon County
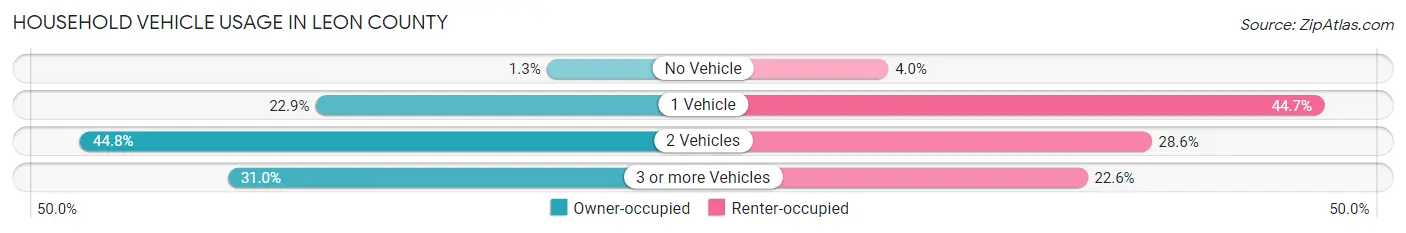
| Vehicles per Household | Owner-occupied | Renter-occupied |
| No Vehicle | 64 (1.3%) | 56 (4.0%) |
| 1 Vehicle | 1,146 (22.9%) | 620 (44.7%) |
| 2 Vehicles | 2,245 (44.8%) | 397 (28.6%) |
| 3 or more Vehicles | 1,555 (31.0%) | 314 (22.6%) |
| Total | 5,010 (100.0%) | 1,387 (100.0%) |
Real Estate & Mortgages in Leon County
Real Estate and Mortgage Overview in Leon County
| Characteristic | Without Mortgage | With Mortgage |
| Housing Units | 3,405 | 1,605 |
| Median Property Value | $151,600 | $172,100 |
| Median Household Income | $44,791 | $607 |
| Monthly Housing Costs | $457 | $51 |
| Real Estate Taxes | $854 | $103 |
Property Value by Mortgage Status in Leon County
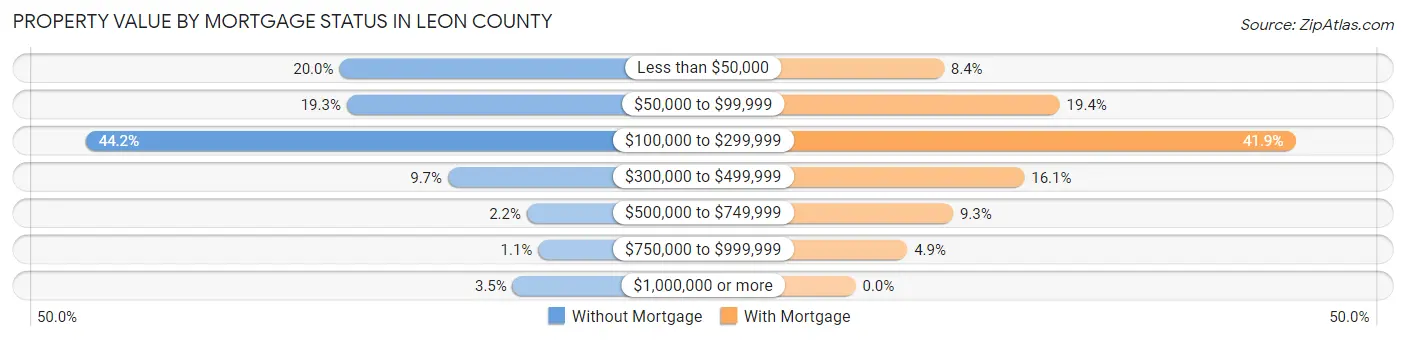
| Property Value | Without Mortgage | With Mortgage |
| Less than $50,000 | 682 (20.0%) | 135 (8.4%) |
| $50,000 to $99,999 | 658 (19.3%) | 312 (19.4%) |
| $100,000 to $299,999 | 1,504 (44.2%) | 672 (41.9%) |
| $300,000 to $499,999 | 330 (9.7%) | 258 (16.1%) |
| $500,000 to $749,999 | 74 (2.2%) | 149 (9.3%) |
| $750,000 to $999,999 | 37 (1.1%) | 79 (4.9%) |
| $1,000,000 or more | 120 (3.5%) | 0 (0.0%) |
| Total | 3,405 (100.0%) | 1,605 (100.0%) |
Household Income by Mortgage Status in Leon County
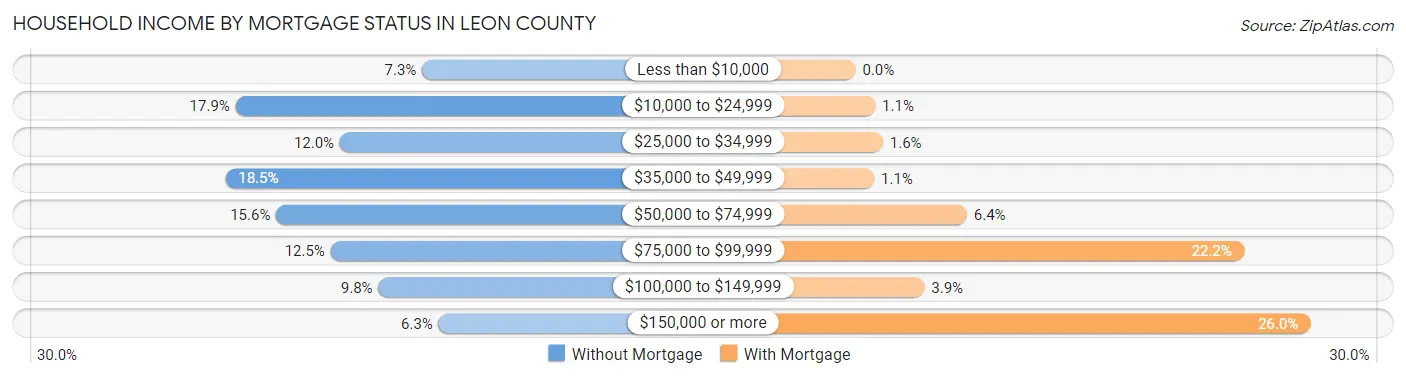
| Household Income | Without Mortgage | With Mortgage |
| Less than $10,000 | 248 (7.3%) | 0 (0.0%) |
| $10,000 to $24,999 | 611 (17.9%) | 18 (1.1%) |
| $25,000 to $34,999 | 408 (12.0%) | 25 (1.6%) |
| $35,000 to $49,999 | 631 (18.5%) | 17 (1.1%) |
| $50,000 to $74,999 | 532 (15.6%) | 102 (6.4%) |
| $75,000 to $99,999 | 426 (12.5%) | 356 (22.2%) |
| $100,000 to $149,999 | 333 (9.8%) | 63 (3.9%) |
| $150,000 or more | 216 (6.3%) | 417 (26.0%) |
| Total | 3,405 (100.0%) | 1,605 (100.0%) |
Property Value to Household Income Ratio in Leon County
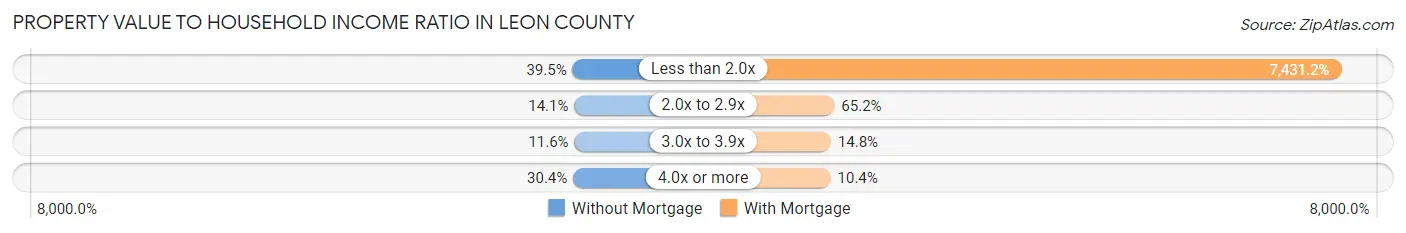
| Value-to-Income Ratio | Without Mortgage | With Mortgage |
| Less than 2.0x | 1,344 (39.5%) | 119,271 (7,431.2%) |
| 2.0x to 2.9x | 479 (14.1%) | 1,046 (65.2%) |
| 3.0x to 3.9x | 395 (11.6%) | 237 (14.8%) |
| 4.0x or more | 1,035 (30.4%) | 167 (10.4%) |
| Total | 3,405 (100.0%) | 1,605 (100.0%) |
Real Estate Taxes by Mortgage Status in Leon County
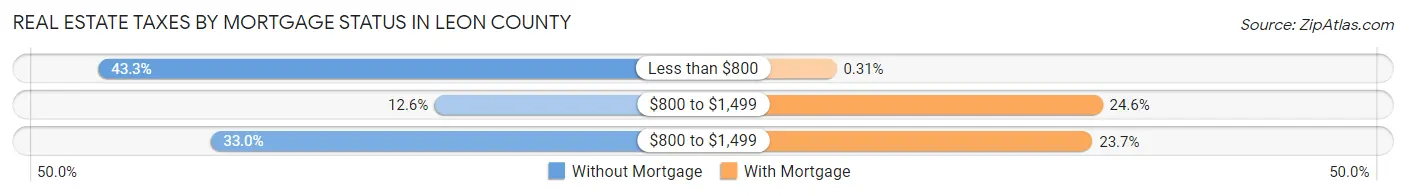
| Property Taxes | Without Mortgage | With Mortgage |
| Less than $800 | 1,473 (43.3%) | 5 (0.3%) |
| $800 to $1,499 | 429 (12.6%) | 395 (24.6%) |
| $800 to $1,499 | 1,125 (33.0%) | 380 (23.7%) |
| Total | 3,405 (100.0%) | 1,605 (100.0%) |
Health & Disability in Leon County
Health Insurance Coverage by Age in Leon County
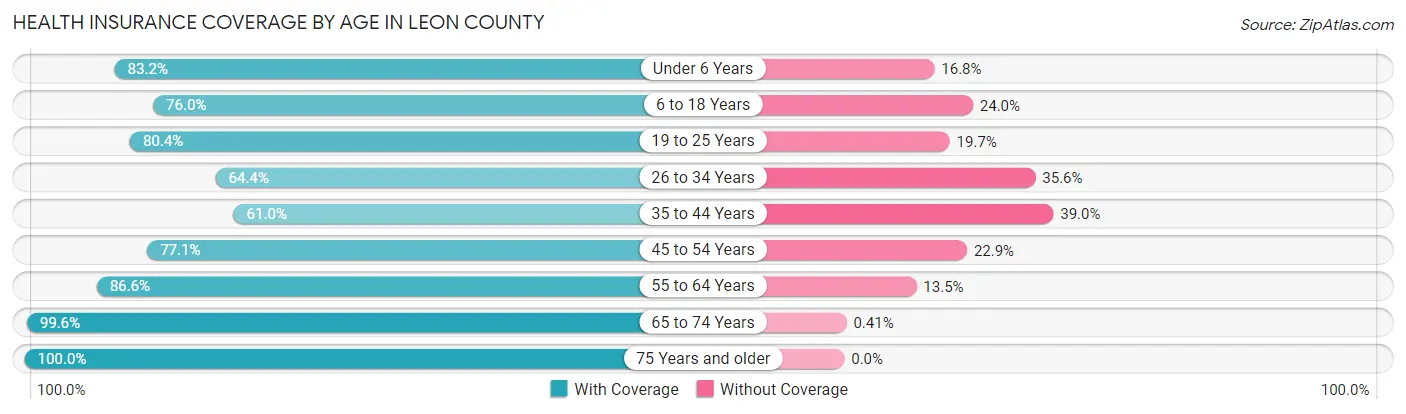
| Age Bracket | With Coverage | Without Coverage |
| Under 6 Years | 733 (83.2%) | 148 (16.8%) |
| 6 to 18 Years | 2,102 (76.0%) | 663 (24.0%) |
| 19 to 25 Years | 998 (80.3%) | 244 (19.7%) |
| 26 to 34 Years | 851 (64.4%) | 471 (35.6%) |
| 35 to 44 Years | 1,091 (61.0%) | 697 (39.0%) |
| 45 to 54 Years | 1,285 (77.1%) | 381 (22.9%) |
| 55 to 64 Years | 2,130 (86.6%) | 331 (13.5%) |
| 65 to 74 Years | 2,191 (99.6%) | 9 (0.4%) |
| 75 Years and older | 1,531 (100.0%) | 0 (0.0%) |
| Total | 12,912 (81.4%) | 2,944 (18.6%) |
Health Insurance Coverage by Citizenship Status in Leon County
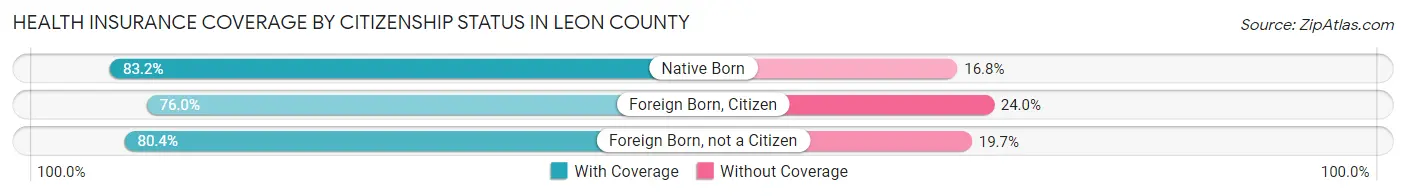
| Citizenship Status | With Coverage | Without Coverage |
| Native Born | 733 (83.2%) | 148 (16.8%) |
| Foreign Born, Citizen | 2,102 (76.0%) | 663 (24.0%) |
| Foreign Born, not a Citizen | 998 (80.3%) | 244 (19.7%) |
Health Insurance Coverage by Household Income in Leon County
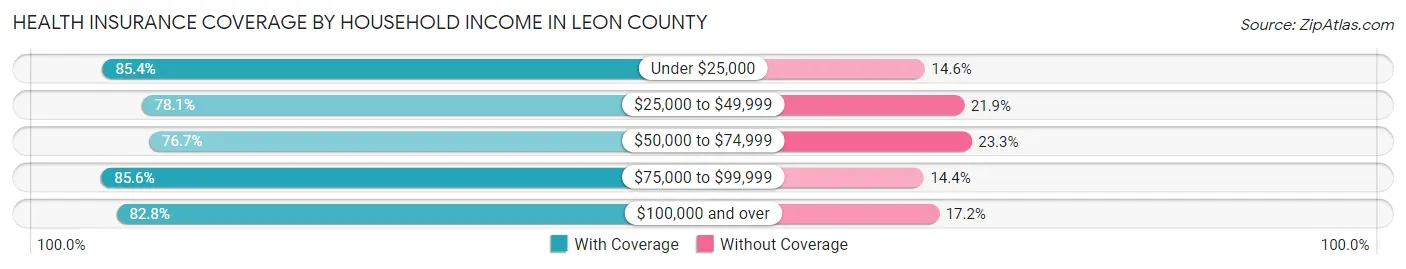
| Household Income | With Coverage | Without Coverage |
| Under $25,000 | 1,937 (85.4%) | 331 (14.6%) |
| $25,000 to $49,999 | 2,674 (78.1%) | 751 (21.9%) |
| $50,000 to $74,999 | 2,095 (76.7%) | 637 (23.3%) |
| $75,000 to $99,999 | 1,669 (85.6%) | 280 (14.4%) |
| $100,000 and over | 4,524 (82.8%) | 941 (17.2%) |
Public vs Private Health Insurance Coverage by Age in Leon County
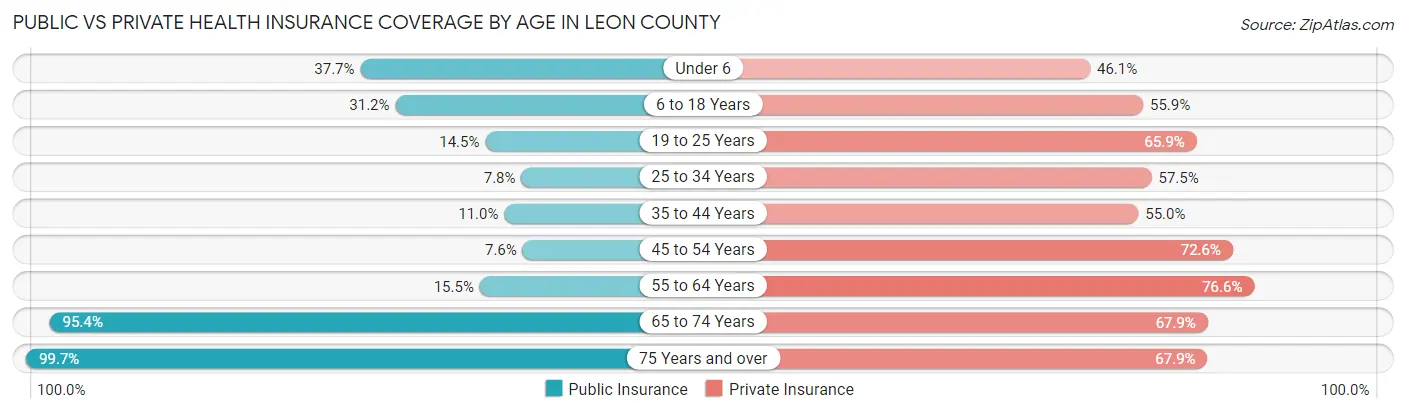
| Age Bracket | Public Insurance | Private Insurance |
| Under 6 | 332 (37.7%) | 406 (46.1%) |
| 6 to 18 Years | 862 (31.2%) | 1,546 (55.9%) |
| 19 to 25 Years | 180 (14.5%) | 818 (65.9%) |
| 25 to 34 Years | 103 (7.8%) | 760 (57.5%) |
| 35 to 44 Years | 196 (11.0%) | 984 (55.0%) |
| 45 to 54 Years | 126 (7.6%) | 1,209 (72.6%) |
| 55 to 64 Years | 382 (15.5%) | 1,884 (76.5%) |
| 65 to 74 Years | 2,098 (95.4%) | 1,494 (67.9%) |
| 75 Years and over | 1,527 (99.7%) | 1,039 (67.9%) |
| Total | 5,806 (36.6%) | 10,140 (63.9%) |
Disability Status by Sex by Age in Leon County
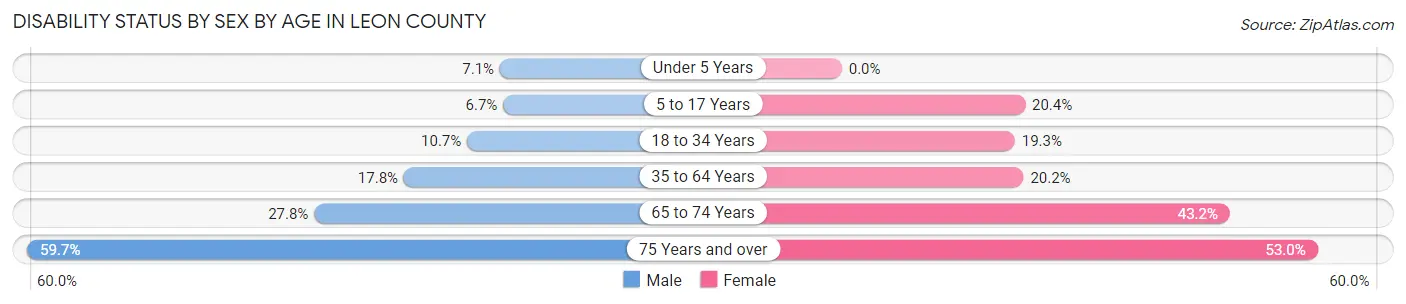
| Age Bracket | Male | Female |
| Under 5 Years | 32 (7.1%) | 0 (0.0%) |
| 5 to 17 Years | 91 (6.7%) | 282 (20.4%) |
| 18 to 34 Years | 139 (10.7%) | 258 (19.3%) |
| 35 to 64 Years | 522 (17.8%) | 602 (20.2%) |
| 65 to 74 Years | 310 (27.8%) | 468 (43.2%) |
| 75 Years and over | 424 (59.7%) | 435 (53.0%) |
Disability Class by Sex by Age in Leon County
Disability Class: Hearing Difficulty
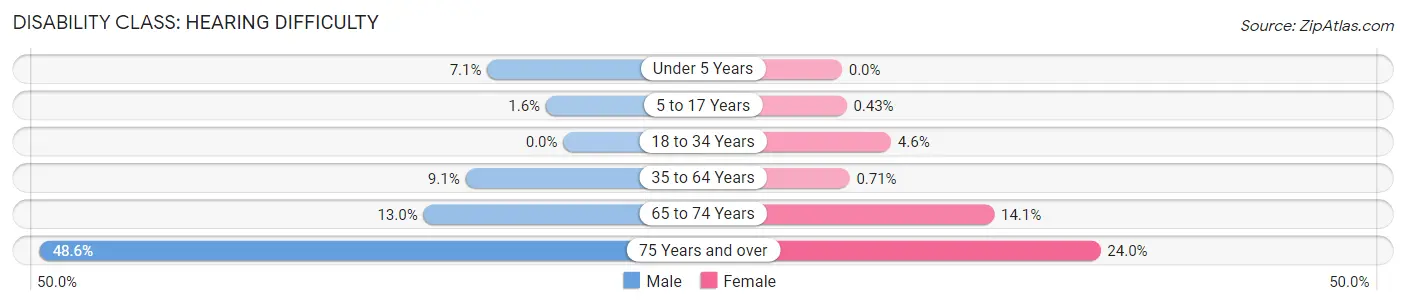
| Age Bracket | Male | Female |
| Under 5 Years | 32 (7.1%) | 0 (0.0%) |
| 5 to 17 Years | 22 (1.6%) | 6 (0.4%) |
| 18 to 34 Years | 0 (0.0%) | 61 (4.6%) |
| 35 to 64 Years | 267 (9.1%) | 21 (0.7%) |
| 65 to 74 Years | 145 (13.0%) | 153 (14.1%) |
| 75 Years and over | 345 (48.6%) | 197 (24.0%) |
Disability Class: Vision Difficulty
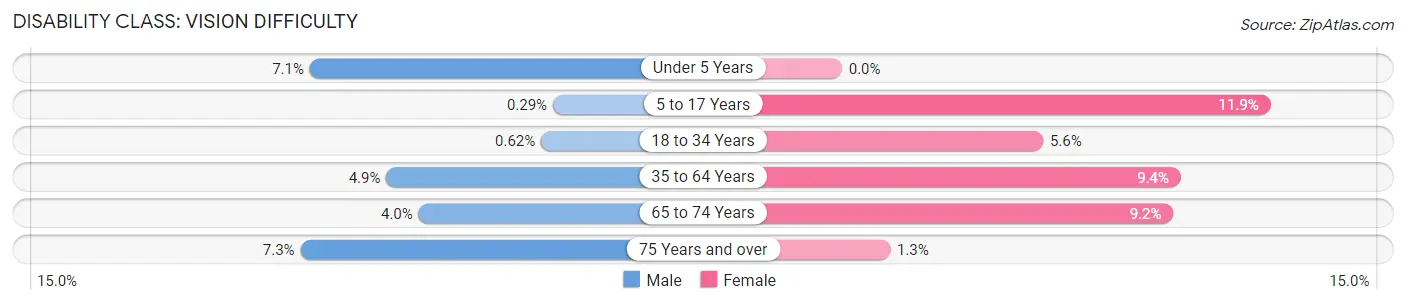
| Age Bracket | Male | Female |
| Under 5 Years | 32 (7.1%) | 0 (0.0%) |
| 5 to 17 Years | 4 (0.3%) | 165 (11.9%) |
| 18 to 34 Years | 8 (0.6%) | 75 (5.6%) |
| 35 to 64 Years | 145 (4.9%) | 281 (9.4%) |
| 65 to 74 Years | 45 (4.0%) | 100 (9.2%) |
| 75 Years and over | 52 (7.3%) | 11 (1.3%) |
Disability Class: Cognitive Difficulty
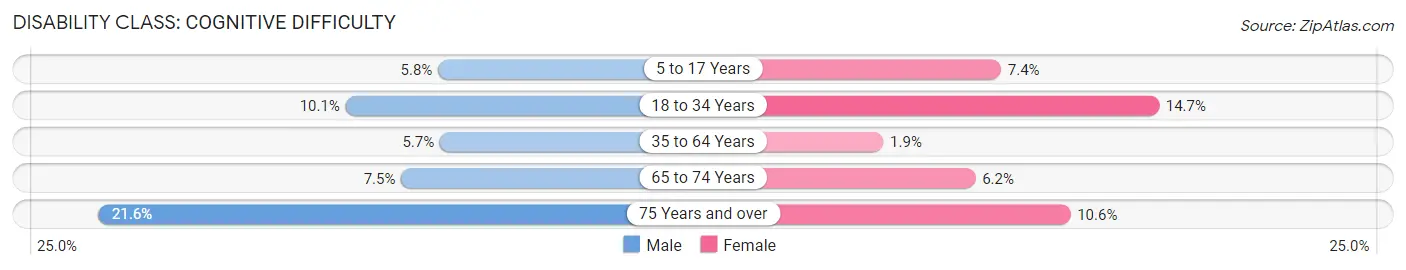
| Age Bracket | Male | Female |
| 5 to 17 Years | 79 (5.8%) | 102 (7.4%) |
| 18 to 34 Years | 131 (10.1%) | 197 (14.7%) |
| 35 to 64 Years | 168 (5.7%) | 57 (1.9%) |
| 65 to 74 Years | 84 (7.5%) | 67 (6.2%) |
| 75 Years and over | 153 (21.5%) | 87 (10.6%) |
Disability Class: Ambulatory Difficulty
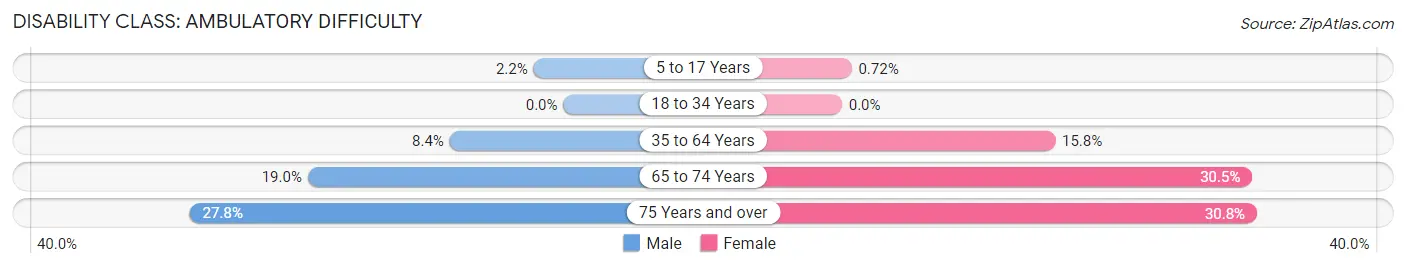
| Age Bracket | Male | Female |
| 5 to 17 Years | 30 (2.2%) | 10 (0.7%) |
| 18 to 34 Years | 0 (0.0%) | 0 (0.0%) |
| 35 to 64 Years | 248 (8.4%) | 471 (15.8%) |
| 65 to 74 Years | 212 (19.0%) | 330 (30.5%) |
| 75 Years and over | 197 (27.8%) | 253 (30.8%) |
Disability Class: Self-Care Difficulty
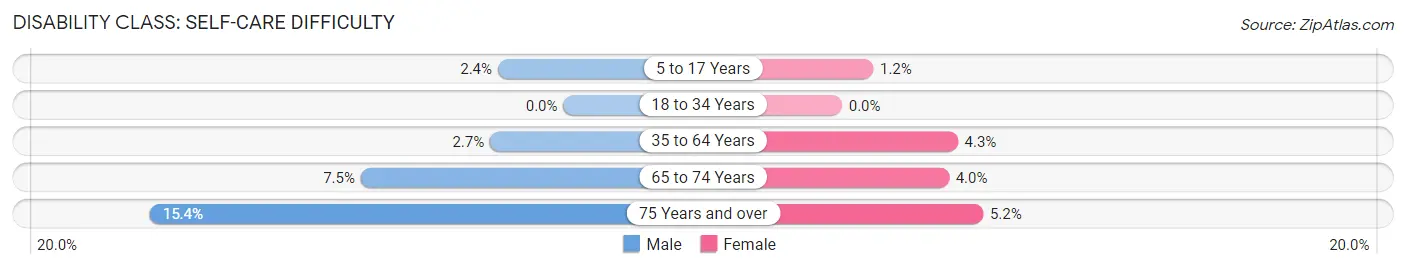
| Age Bracket | Male | Female |
| 5 to 17 Years | 33 (2.4%) | 16 (1.2%) |
| 18 to 34 Years | 0 (0.0%) | 0 (0.0%) |
| 35 to 64 Years | 80 (2.7%) | 128 (4.3%) |
| 65 to 74 Years | 84 (7.5%) | 43 (4.0%) |
| 75 Years and over | 109 (15.3%) | 43 (5.2%) |
Technology Access in Leon County
Computing Device Access in Leon County
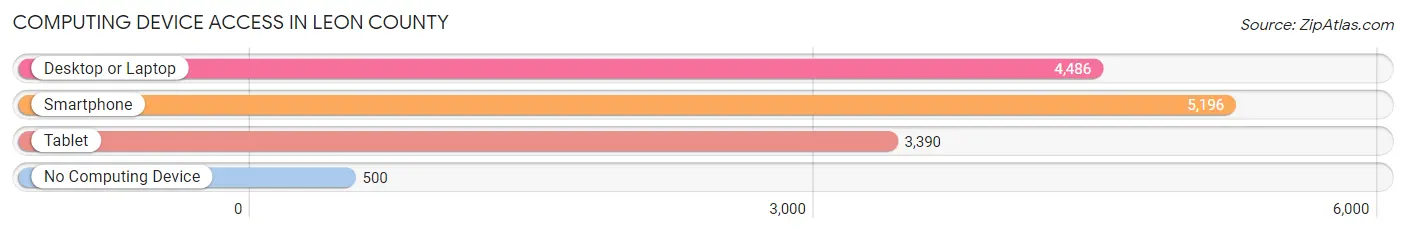
| Device Type | # Households | % Households |
| Desktop or Laptop | 4,486 | 70.1% |
| Smartphone | 5,196 | 81.2% |
| Tablet | 3,390 | 53.0% |
| No Computing Device | 500 | 7.8% |
| Total | 6,397 | 100.0% |
Internet Access in Leon County
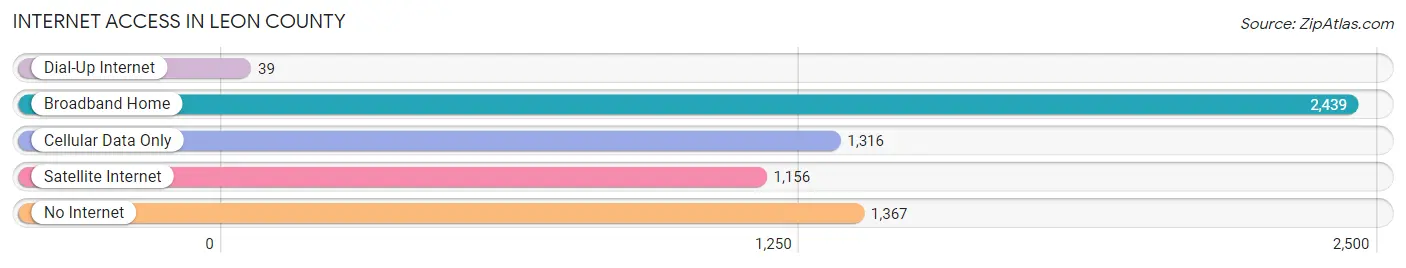
| Internet Type | # Households | % Households |
| Dial-Up Internet | 39 | 0.6% |
| Broadband Home | 2,439 | 38.1% |
| Cellular Data Only | 1,316 | 20.6% |
| Satellite Internet | 1,156 | 18.1% |
| No Internet | 1,367 | 21.4% |
| Total | 6,397 | 100.0% |
Leon County Summary
Leon County is located in the east-central part of Texas, and is part of the Bryan-College Station metropolitan area. The county is bordered by Madison County to the north, Robertson County to the east, Brazos County to the south, and Freestone County to the west. The county seat is Centerville, and the largest city is Buffalo.
History
Leon County was established in 1846, and was named for the Spanish explorer Martín de León. The county was originally part of Robertson County, but was later divided into its own county. The first settlers in the area were primarily of German and Czech descent, and the county was largely agricultural.
In the late 19th century, the county began to experience an economic boom due to the discovery of oil and natural gas. This led to the development of several towns, including Buffalo, Jewett, and Normangee.
Geography
Leon County covers an area of 945 square miles, and is mostly flat with some rolling hills. The county is located in the East Central Plains region of Texas, and is part of the Blackland Prairie. The county is drained by the Navasota River, which flows through the county from north to south.
The county is home to several state parks, including Lake Leon State Park, which is located on the shores of Lake Leon. The lake is a popular destination for fishing, boating, and swimming.
Economy
Leon County has a diverse economy, with the largest industries being agriculture, oil and gas, and manufacturing. The county is home to several large agricultural operations, including cattle ranches, cotton farms, and grain farms.
The county is also home to several oil and gas companies, including Chevron, ExxonMobil, and Shell. These companies are responsible for much of the county’s economic growth.
Manufacturing is also an important part of the county’s economy, with several companies producing a variety of products, including furniture, clothing, and electronics.
Demographics
As of the 2010 census, Leon County had a population of 16,921. The population is largely white (77.3%), with smaller percentages of African Americans (14.2%), Hispanics (6.2%), and Asians (1.3%).
The median household income in the county is $45,945, and the median home value is $117,400. The unemployment rate is 4.2%, which is lower than the national average.
Conclusion
Leon County is a diverse and vibrant county located in the East Central Plains region of Texas. The county has a strong economy, with the largest industries being agriculture, oil and gas, and manufacturing. The county is also home to several state parks, and is a popular destination for outdoor recreation. The population is largely white, with smaller percentages of African Americans, Hispanics, and Asians. The median household income is $45,945, and the median home value is $117,400. The unemployment rate is 4.2%, which is lower than the national average.
Common Questions
What is Per Capita Income in Leon County?
Per Capita income in Leon County is $34,519.
What is the Median Family Income in Leon County?
Median Family Income in Leon County is $69,737.
What is the Median Household income in Leon County?
Median Household Income in Leon County is $57,363.
What is Income or Wage Gap in Leon County?
Income or Wage Gap in Leon County is 54.1%.
Women in Leon County earn 45.9 cents for every dollar earned by a man.
What is Family Income Deficit in Leon County?
Family Income Deficit in Leon County is $7,869.
Families that are below poverty line in Leon County earn $7,869 less on average than the poverty threshold level.
What is Inequality or Gini Index in Leon County?
Inequality or Gini Index in Leon County is 0.49.
What is the Total Population of Leon County?
Total Population of Leon County is 15,928.
What is the Total Male Population of Leon County?
Total Male Population of Leon County is 7,918.
What is the Total Female Population of Leon County?
Total Female Population of Leon County is 8,010.
What is the Ratio of Males per 100 Females in Leon County?
There are 98.85 Males per 100 Females in Leon County.
What is the Ratio of Females per 100 Males in Leon County?
There are 101.16 Females per 100 Males in Leon County.
What is the Median Population Age in Leon County?
Median Population Age in Leon County is 44.7 Years.
What is the Average Family Size in Leon County
Average Family Size in Leon County is 3.0 People.
What is the Average Household Size in Leon County
Average Household Size in Leon County is 2.5 People.
How Large is the Labor Force in Leon County?
There are 6,574 People in the Labor Forcein in Leon County.
What is the Percentage of People in the Labor Force in Leon County?
50.9% of People are in the Labor Force in Leon County.
What is the Unemployment Rate in Leon County?
Unemployment Rate in Leon County is 5.1%.