Lee County, TX Map & Demographics
Lee County Map
Lee County Overview
$31,001
PER CAPITA INCOME
$71,999
AVG FAMILY INCOME
$66,448
AVG HOUSEHOLD INCOME
38.0%
WAGE / INCOME GAP [ % ]
62.0¢/ $1
WAGE / INCOME GAP [ $ ]
$8,669
FAMILY INCOME DEFICIT
0.41
INEQUALITY / GINI INDEX
17,543
TOTAL POPULATION
8,665
MALE POPULATION
8,878
FEMALE POPULATION
97.60
MALES / 100 FEMALES
102.46
FEMALES / 100 MALES
41.9
MEDIAN AGE
3.2
AVG FAMILY SIZE
2.7
AVG HOUSEHOLD SIZE
8,283
LABOR FORCE [ PEOPLE ]
58.3%
PERCENT IN LABOR FORCE
2.8%
UNEMPLOYMENT RATE
Income in Lee County
Income Overview in Lee County
Per Capita Income in Lee County is $31,001, while median incomes of families and households are $71,999 and $66,448 respectively.
| Characteristic | Number | Measure |
| Per Capita Income | 17,543 | $31,001 |
| Median Family Income | 4,601 | $71,999 |
| Mean Family Income | 4,601 | $86,642 |
| Median Household Income | 6,313 | $66,448 |
| Mean Household Income | 6,313 | $76,825 |
| Income Deficit | 4,601 | $8,669 |
| Wage / Income Gap (%) | 17,543 | 38.03% |
| Wage / Income Gap ($) | 17,543 | 61.97¢ per $1 |
| Gini / Inequality Index | 17,543 | 0.41 |
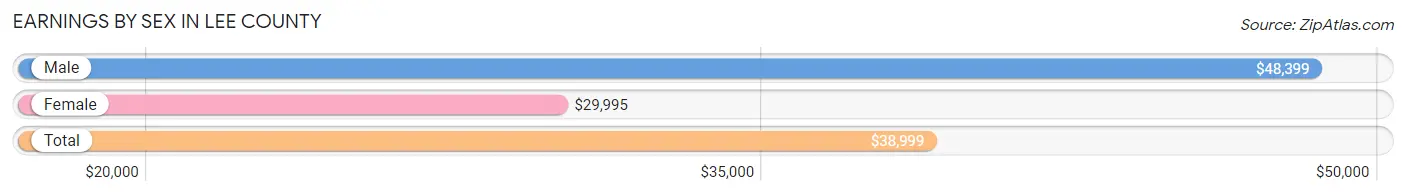
Earnings by Sex in Lee County
Average Earnings in Lee County are $38,999, $48,399 for men and $29,995 for women, a difference of 38.0%.
| Sex | Number | Average Earnings |
| Male | 4,924 (56.5%) | $48,399 |
| Female | 3,787 (43.5%) | $29,995 |
| Total | 8,711 (100.0%) | $38,999 |
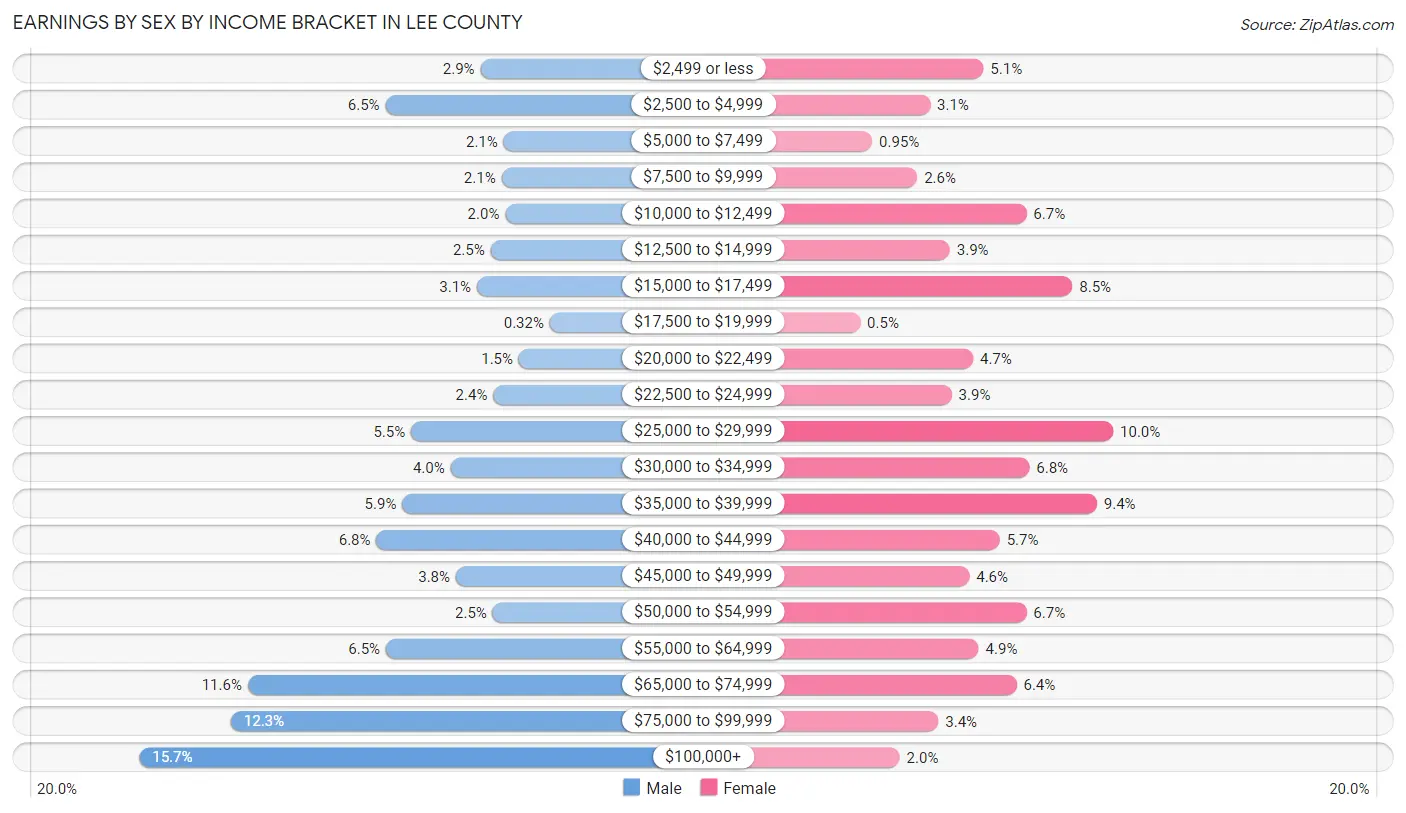
Earnings by Sex by Income Bracket in Lee County
The most common earnings brackets in Lee County are $100,000+ for men (773 | 15.7%) and $25,000 to $29,999 for women (378 | 10.0%).
| Income | Male | Female |
| $2,499 or less | 144 (2.9%) | 194 (5.1%) |
| $2,500 to $4,999 | 319 (6.5%) | 118 (3.1%) |
| $5,000 to $7,499 | 101 (2.1%) | 36 (0.9%) |
| $7,500 to $9,999 | 105 (2.1%) | 100 (2.6%) |
| $10,000 to $12,499 | 98 (2.0%) | 255 (6.7%) |
| $12,500 to $14,999 | 125 (2.5%) | 146 (3.9%) |
| $15,000 to $17,499 | 150 (3.0%) | 320 (8.5%) |
| $17,500 to $19,999 | 16 (0.3%) | 19 (0.5%) |
| $20,000 to $22,499 | 73 (1.5%) | 179 (4.7%) |
| $22,500 to $24,999 | 120 (2.4%) | 149 (3.9%) |
| $25,000 to $29,999 | 272 (5.5%) | 378 (10.0%) |
| $30,000 to $34,999 | 199 (4.0%) | 259 (6.8%) |
| $35,000 to $39,999 | 288 (5.9%) | 355 (9.4%) |
| $40,000 to $44,999 | 336 (6.8%) | 217 (5.7%) |
| $45,000 to $49,999 | 189 (3.8%) | 174 (4.6%) |
| $50,000 to $54,999 | 121 (2.5%) | 255 (6.7%) |
| $55,000 to $64,999 | 318 (6.5%) | 187 (4.9%) |
| $65,000 to $74,999 | 573 (11.6%) | 241 (6.4%) |
| $75,000 to $99,999 | 604 (12.3%) | 130 (3.4%) |
| $100,000+ | 773 (15.7%) | 75 (2.0%) |
| Total | 4,924 (100.0%) | 3,787 (100.0%) |
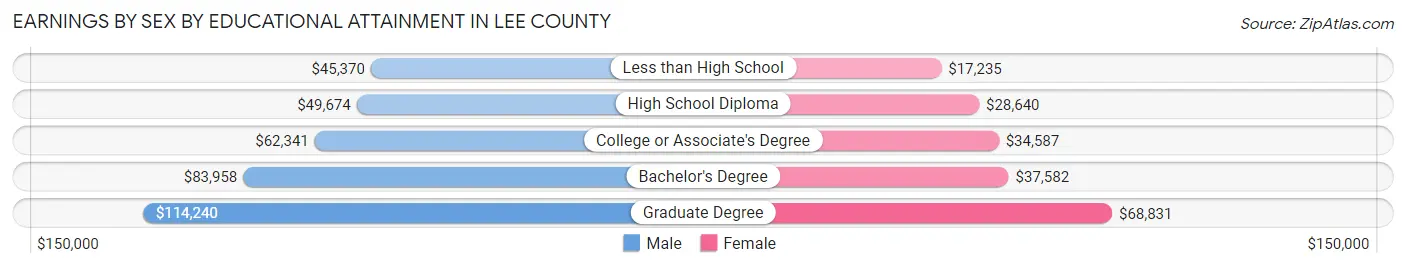
Earnings by Sex by Educational Attainment in Lee County
Average earnings in Lee County are $61,015 for men and $33,665 for women, a difference of 44.8%. Men with an educational attainment of graduate degree enjoy the highest average annual earnings of $114,240, while those with less than high school education earn the least with $45,370. Women with an educational attainment of graduate degree earn the most with the average annual earnings of $68,831, while those with less than high school education have the smallest earnings of $17,235.
| Educational Attainment | Male Income | Female Income |
| Less than High School | $45,370 | $17,235 |
| High School Diploma | $49,674 | $28,640 |
| College or Associate's Degree | $62,341 | $34,587 |
| Bachelor's Degree | $83,958 | $37,582 |
| Graduate Degree | $114,240 | $68,831 |
| Total | $61,015 | $33,665 |
Family Income in Lee County
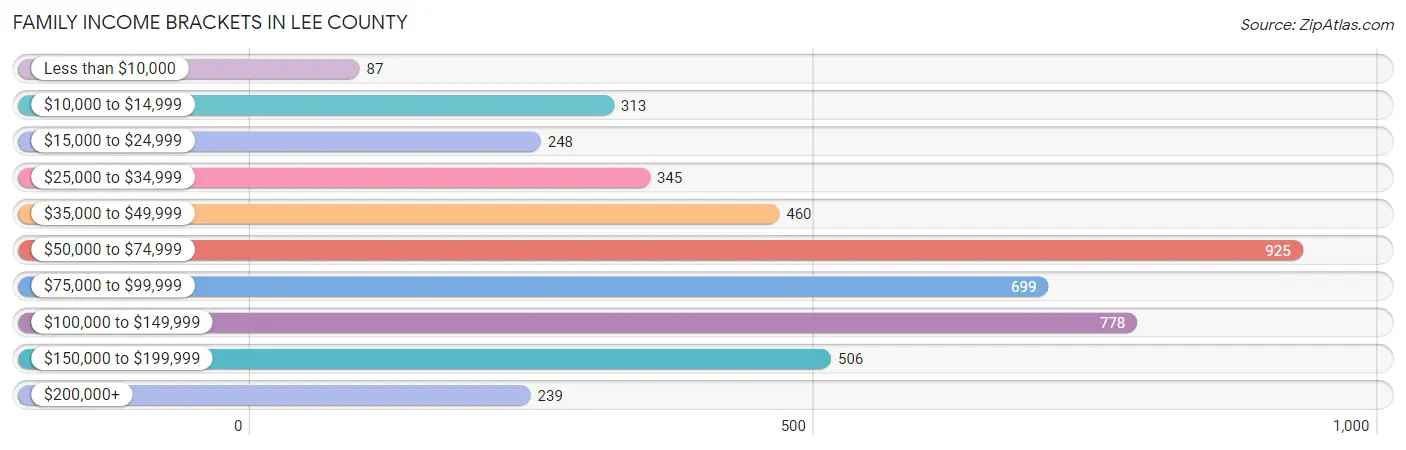
Family Income Brackets in Lee County
According to the Lee County family income data, there are 925 families falling into the $50,000 to $74,999 income range, which is the most common income bracket and makes up 20.1% of all families. Conversely, the less than $10,000 income bracket is the least frequent group with only 87 families (1.9%) belonging to this category.
| Income Bracket | # Families | % Families |
| Less than $10,000 | 87 | 1.9% |
| $10,000 to $14,999 | 313 | 6.8% |
| $15,000 to $24,999 | 248 | 5.4% |
| $25,000 to $34,999 | 345 | 7.5% |
| $35,000 to $49,999 | 460 | 10.0% |
| $50,000 to $74,999 | 925 | 20.1% |
| $75,000 to $99,999 | 699 | 15.2% |
| $100,000 to $149,999 | 778 | 16.9% |
| $150,000 to $199,999 | 506 | 11.0% |
| $200,000+ | 239 | 5.2% |
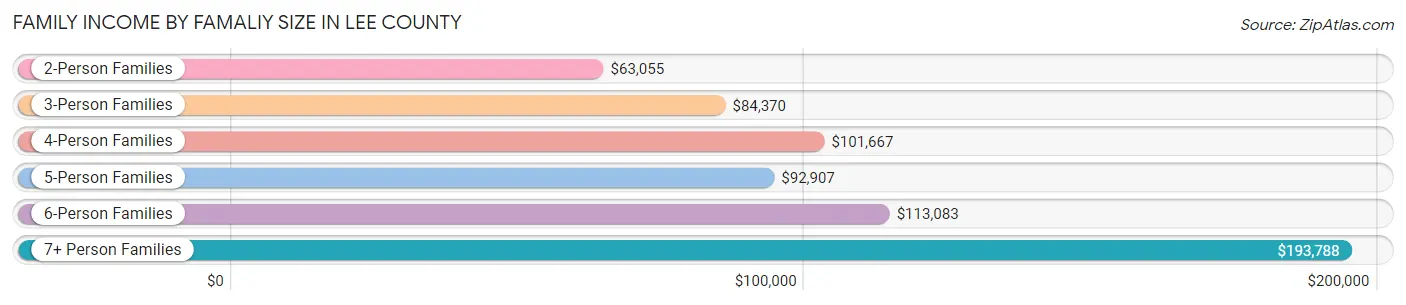
Family Income by Famaliy Size in Lee County
7+ person families (84 | 1.8%) account for the highest median family income in Lee County with $193,788 per family, while 2-person families (2,529 | 55.0%) have the highest median income of $31,528 per family member.
| Income Bracket | # Families | Median Income |
| 2-Person Families | 2,529 (55.0%) | $63,055 |
| 3-Person Families | 700 (15.2%) | $84,370 |
| 4-Person Families | 872 (19.0%) | $101,667 |
| 5-Person Families | 322 (7.0%) | $92,907 |
| 6-Person Families | 94 (2.0%) | $113,083 |
| 7+ Person Families | 84 (1.8%) | $193,788 |
| Total | 4,601 (100.0%) | $71,999 |
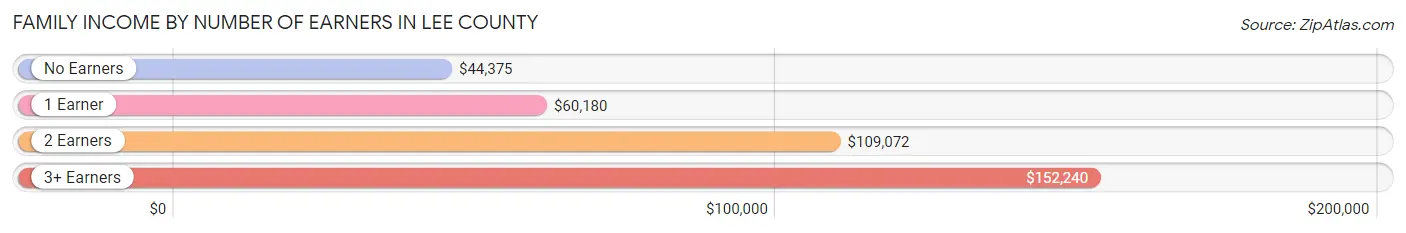
Family Income by Number of Earners in Lee County
The median family income in Lee County is $71,999, with families comprising 3+ earners (361) having the highest median family income of $152,240, while families with no earners (714) have the lowest median family income of $44,375, accounting for 7.9% and 15.5% of families, respectively.
| Number of Earners | # Families | Median Income |
| No Earners | 714 (15.5%) | $44,375 |
| 1 Earner | 2,087 (45.4%) | $60,180 |
| 2 Earners | 1,439 (31.3%) | $109,072 |
| 3+ Earners | 361 (7.9%) | $152,240 |
| Total | 4,601 (100.0%) | $71,999 |
Household Income in Lee County
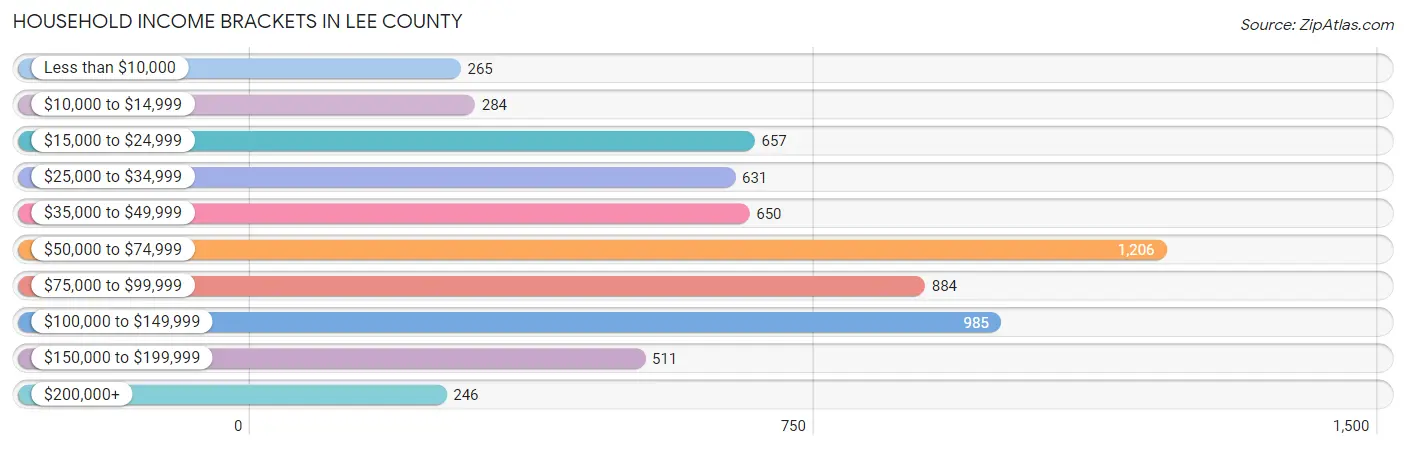
Household Income Brackets in Lee County
With 1,206 households falling in the category, the $50,000 to $74,999 income range is the most frequent in Lee County, accounting for 19.1% of all households. In contrast, only 246 households (3.9%) fall into the $200,000+ income bracket, making it the least populous group.
| Income Bracket | # Households | % Households |
| Less than $10,000 | 265 | 4.2% |
| $10,000 to $14,999 | 284 | 4.5% |
| $15,000 to $24,999 | 657 | 10.4% |
| $25,000 to $34,999 | 631 | 10.0% |
| $35,000 to $49,999 | 650 | 10.3% |
| $50,000 to $74,999 | 1,206 | 19.1% |
| $75,000 to $99,999 | 884 | 14.0% |
| $100,000 to $149,999 | 985 | 15.6% |
| $150,000 to $199,999 | 511 | 8.1% |
| $200,000+ | 246 | 3.9% |
Household Income by Householder Age in Lee County
The median household income in Lee County is $66,448, with the highest median household income of $84,146 found in the 25 to 44 years age bracket for the primary householder. A total of 1,510 households (23.9%) fall into this category. Meanwhile, the 15 to 24 years age bracket for the primary householder has the lowest median household income of $25,920, with 217 households (3.4%) in this group.
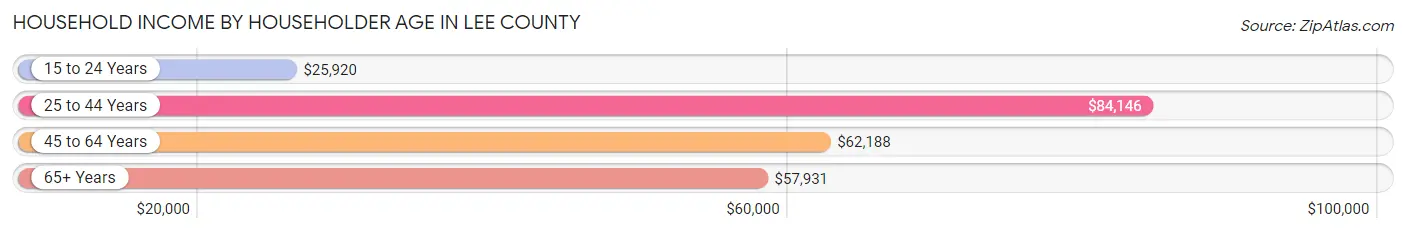
| Income Bracket | # Households | Median Income |
| 15 to 24 Years | 217 (3.4%) | $25,920 |
| 25 to 44 Years | 1,510 (23.9%) | $84,146 |
| 45 to 64 Years | 2,396 (38.0%) | $62,188 |
| 65+ Years | 2,190 (34.7%) | $57,931 |
| Total | 6,313 (100.0%) | $66,448 |
Poverty in Lee County
Income Below Poverty by Sex and Age in Lee County
With 12.9% poverty level for males and 13.5% for females among the residents of Lee County, 18 to 24 year old males and under 5 year old females are the most vulnerable to poverty, with 385 males (48.1%) and 241 females (33.9%) in their respective age groups living below the poverty level.
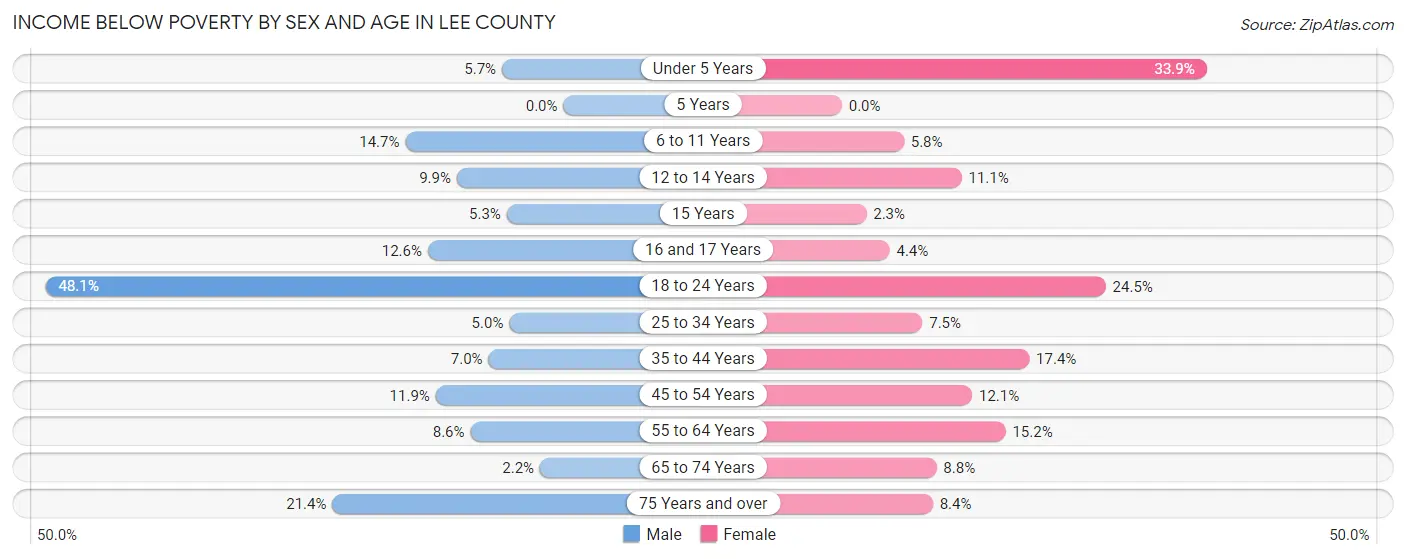
| Age Bracket | Male | Female |
| Under 5 Years | 22 (5.7%) | 241 (33.9%) |
| 5 Years | 0 (0.0%) | 0 (0.0%) |
| 6 to 11 Years | 93 (14.7%) | 35 (5.8%) |
| 12 to 14 Years | 28 (9.9%) | 39 (11.1%) |
| 15 Years | 3 (5.3%) | 3 (2.3%) |
| 16 and 17 Years | 20 (12.6%) | 7 (4.4%) |
| 18 to 24 Years | 385 (48.1%) | 133 (24.5%) |
| 25 to 34 Years | 32 (5.0%) | 86 (7.5%) |
| 35 to 44 Years | 94 (7.0%) | 168 (17.4%) |
| 45 to 54 Years | 121 (11.8%) | 128 (12.1%) |
| 55 to 64 Years | 113 (8.6%) | 185 (15.2%) |
| 65 to 74 Years | 22 (2.2%) | 100 (8.8%) |
| 75 Years and over | 143 (21.4%) | 57 (8.4%) |
| Total | 1,076 (12.9%) | 1,182 (13.5%) |
Income Above Poverty by Sex and Age in Lee County
According to the poverty statistics in Lee County, males aged 5 years and females aged 5 years are the age groups that are most secure financially, with 100.0% of males and 100.0% of females in these age groups living above the poverty line.
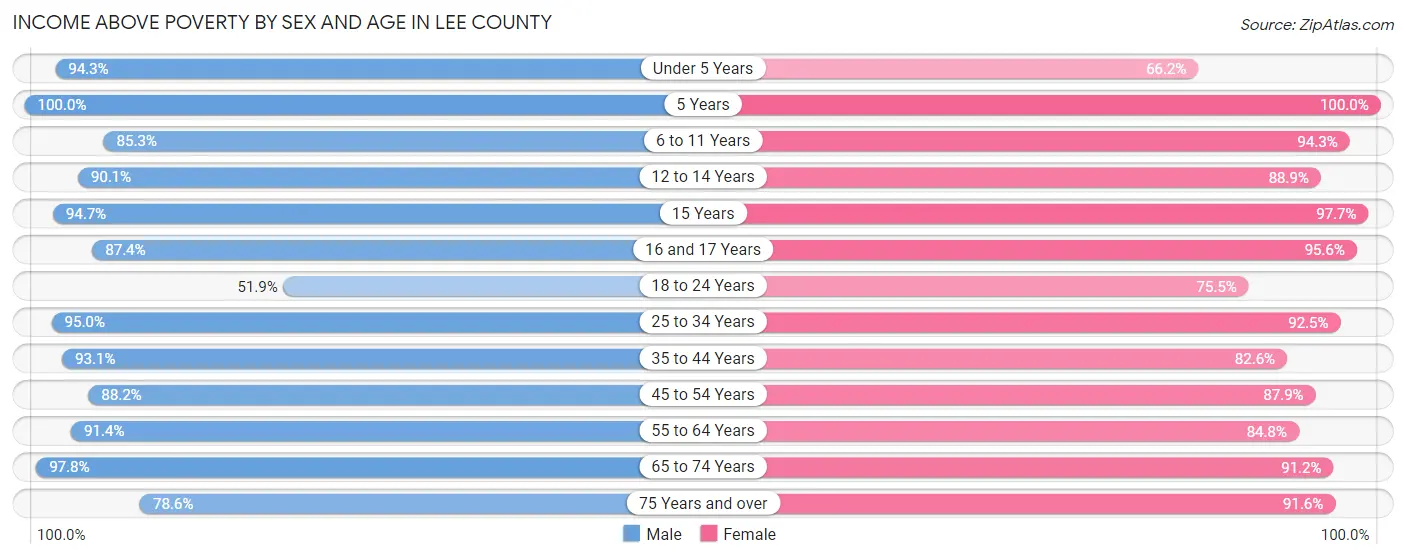
| Age Bracket | Male | Female |
| Under 5 Years | 364 (94.3%) | 471 (66.1%) |
| 5 Years | 41 (100.0%) | 76 (100.0%) |
| 6 to 11 Years | 541 (85.3%) | 574 (94.3%) |
| 12 to 14 Years | 255 (90.1%) | 312 (88.9%) |
| 15 Years | 54 (94.7%) | 129 (97.7%) |
| 16 and 17 Years | 139 (87.4%) | 151 (95.6%) |
| 18 to 24 Years | 416 (51.9%) | 410 (75.5%) |
| 25 to 34 Years | 605 (95.0%) | 1,066 (92.5%) |
| 35 to 44 Years | 1,259 (93.0%) | 798 (82.6%) |
| 45 to 54 Years | 900 (88.1%) | 931 (87.9%) |
| 55 to 64 Years | 1,196 (91.4%) | 1,033 (84.8%) |
| 65 to 74 Years | 992 (97.8%) | 1,039 (91.2%) |
| 75 Years and over | 524 (78.6%) | 618 (91.6%) |
| Total | 7,286 (87.1%) | 7,608 (86.6%) |
Income Below Poverty Among Married-Couple Families in Lee County
The poverty statistics for married-couple families in Lee County show that 5.2% or 173 of the total 3,350 families live below the poverty line. Families with 1 or 2 children have the highest poverty rate of 7.3%, comprising of 68 families. On the other hand, families with 3 or 4 children have the lowest poverty rate of 0.0%, which includes 0 families.
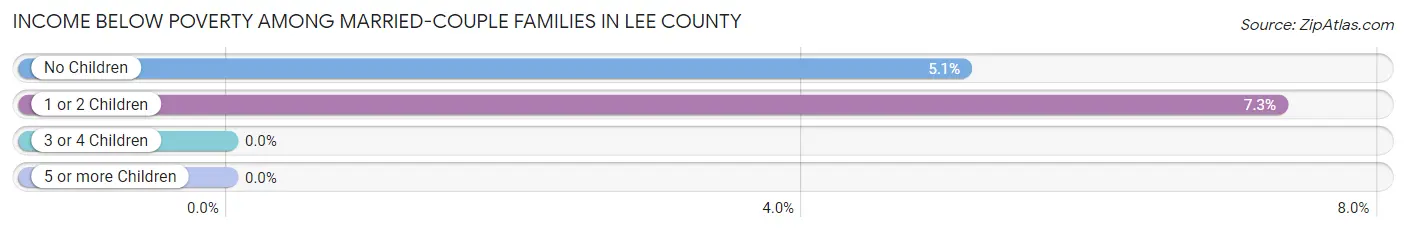
| Children | Above Poverty | Below Poverty |
| No Children | 1,949 (94.9%) | 105 (5.1%) |
| 1 or 2 Children | 862 (92.7%) | 68 (7.3%) |
| 3 or 4 Children | 290 (100.0%) | 0 (0.0%) |
| 5 or more Children | 76 (100.0%) | 0 (0.0%) |
| Total | 3,177 (94.8%) | 173 (5.2%) |
Income Below Poverty Among Single-Parent Households in Lee County
According to the poverty data in Lee County, 25.8% or 112 single-father households and 30.0% or 245 single-mother households are living below the poverty line. Among single-father households, those with no children have the highest poverty rate, with 57 households (51.8%) experiencing poverty. Likewise, among single-mother households, those with 1 or 2 children have the highest poverty rate, with 176 households (35.8%) falling below the poverty line.
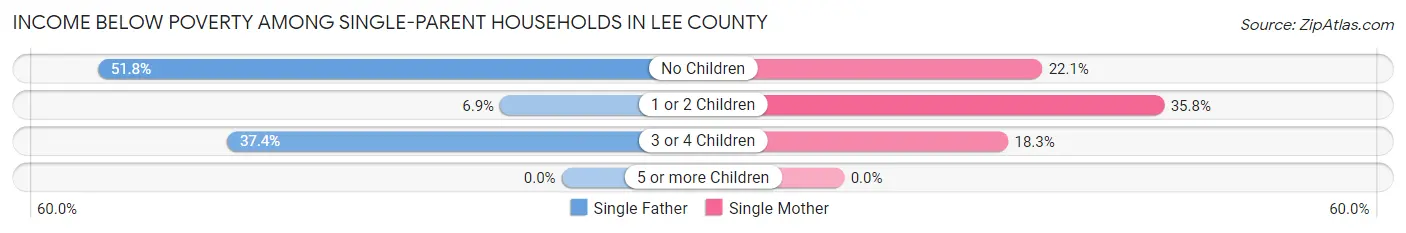
| Children | Single Father | Single Mother |
| No Children | 57 (51.8%) | 56 (22.1%) |
| 1 or 2 Children | 15 (6.9%) | 176 (35.8%) |
| 3 or 4 Children | 40 (37.4%) | 13 (18.3%) |
| 5 or more Children | 0 (0.0%) | 0 (0.0%) |
| Total | 112 (25.8%) | 245 (30.0%) |
Income Below Poverty Among Married-Couple vs Single-Parent Households in Lee County
The poverty data for Lee County shows that 173 of the married-couple family households (5.2%) and 357 of the single-parent households (28.5%) are living below the poverty level. Within the married-couple family households, those with 1 or 2 children have the highest poverty rate, with 68 households (7.3%) falling below the poverty line. Among the single-parent households, those with no children have the highest poverty rate, with 113 household (31.1%) living below poverty.
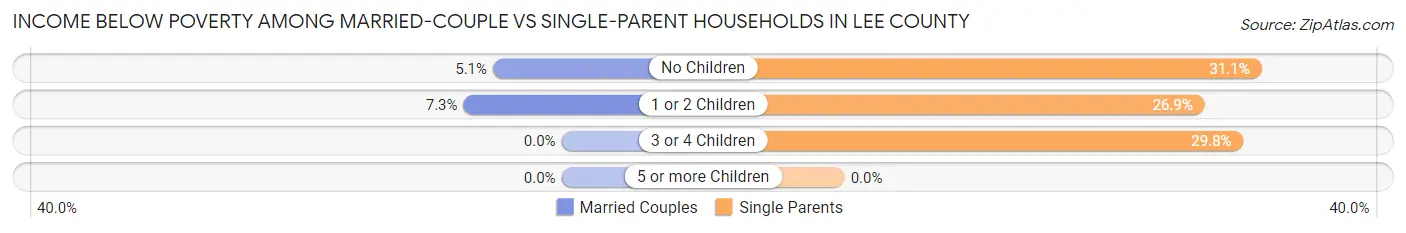
| Children | Married-Couple Families | Single-Parent Households |
| No Children | 105 (5.1%) | 113 (31.1%) |
| 1 or 2 Children | 68 (7.3%) | 191 (26.9%) |
| 3 or 4 Children | 0 (0.0%) | 53 (29.8%) |
| 5 or more Children | 0 (0.0%) | 0 (0.0%) |
| Total | 173 (5.2%) | 357 (28.5%) |
Race in Lee County
The most populous races in Lee County are White / Caucasian (13,507 | 77.0%), Hispanic or Latino (4,346 | 24.8%), and Black / African American (1,847 | 10.5%).
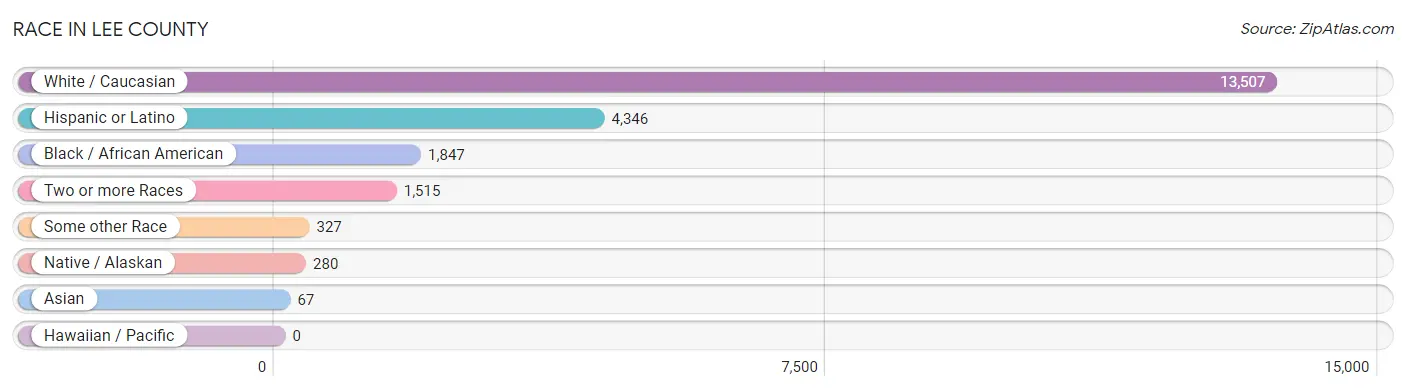
| Race | # Population | % Population |
| Asian | 67 | 0.4% |
| Black / African American | 1,847 | 10.5% |
| Hawaiian / Pacific | 0 | 0.0% |
| Hispanic or Latino | 4,346 | 24.8% |
| Native / Alaskan | 280 | 1.6% |
| White / Caucasian | 13,507 | 77.0% |
| Two or more Races | 1,515 | 8.6% |
| Some other Race | 327 | 1.9% |
| Total | 17,543 | 100.0% |
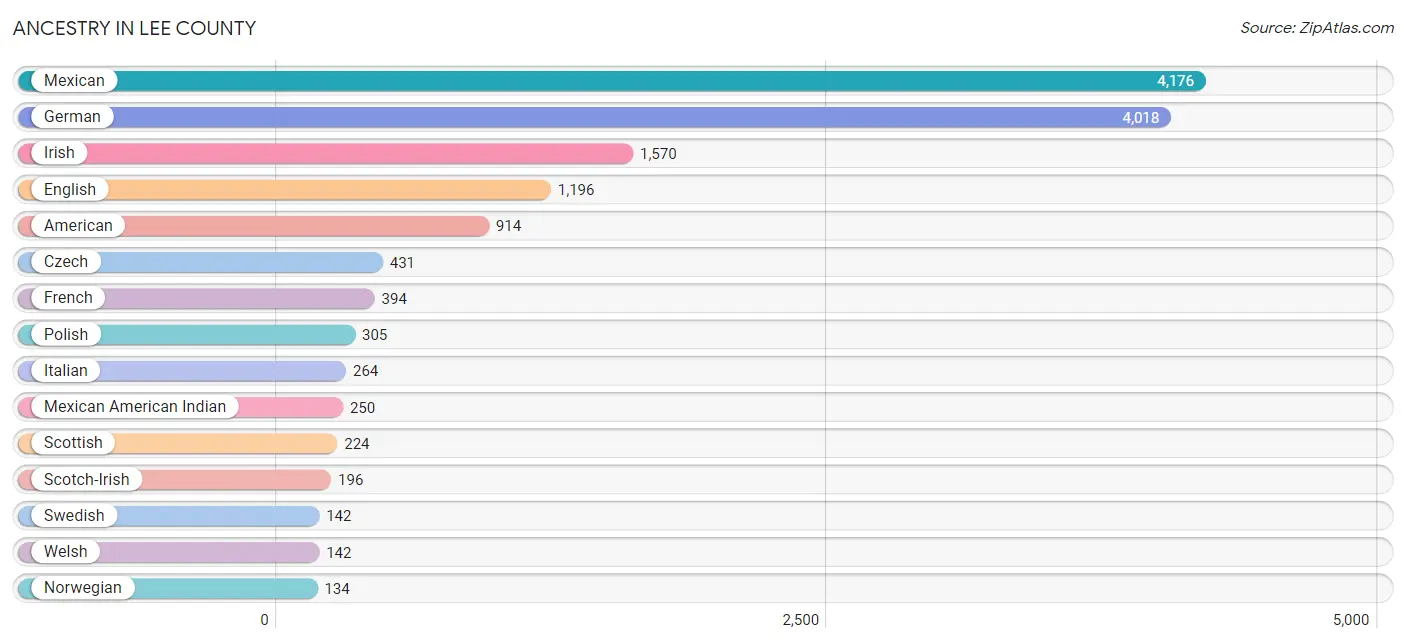
Ancestry in Lee County
The most populous ancestries reported in Lee County are Mexican (4,176 | 23.8%), German (4,018 | 22.9%), Irish (1,570 | 8.9%), English (1,196 | 6.8%), and American (914 | 5.2%), together accounting for 67.7% of all Lee County residents.
| Ancestry | # Population | % Population |
| African | 101 | 0.6% |
| American | 914 | 5.2% |
| Austrian | 9 | 0.1% |
| Bhutanese | 13 | 0.1% |
| Blackfeet | 6 | 0.0% |
| British | 35 | 0.2% |
| Central American | 58 | 0.3% |
| Cherokee | 108 | 0.6% |
| Creek | 2 | 0.0% |
| Czech | 431 | 2.5% |
| Czechoslovakian | 8 | 0.1% |
| Dutch | 48 | 0.3% |
| Eastern European | 2 | 0.0% |
| English | 1,196 | 6.8% |
| European | 80 | 0.5% |
| Filipino | 62 | 0.4% |
| Finnish | 16 | 0.1% |
| French | 394 | 2.2% |
| German | 4,018 | 22.9% |
| Greek | 26 | 0.2% |
| Honduran | 23 | 0.1% |
| Hungarian | 16 | 0.1% |
| Irish | 1,570 | 8.9% |
| Italian | 264 | 1.5% |
| Lithuanian | 66 | 0.4% |
| Mexican | 4,176 | 23.8% |
| Mexican American Indian | 250 | 1.4% |
| Nicaraguan | 17 | 0.1% |
| Northern European | 3 | 0.0% |
| Norwegian | 134 | 0.8% |
| Pakistani | 5 | 0.0% |
| Polish | 305 | 1.7% |
| Portuguese | 14 | 0.1% |
| Salvadoran | 18 | 0.1% |
| Scandinavian | 36 | 0.2% |
| Scotch-Irish | 196 | 1.1% |
| Scottish | 224 | 1.3% |
| Slovene | 96 | 0.5% |
| Spaniard | 61 | 0.4% |
| Spanish | 10 | 0.1% |
| Subsaharan African | 101 | 0.6% |
| Swedish | 142 | 0.8% |
| Welsh | 142 | 0.8% | View All 43 Rows |
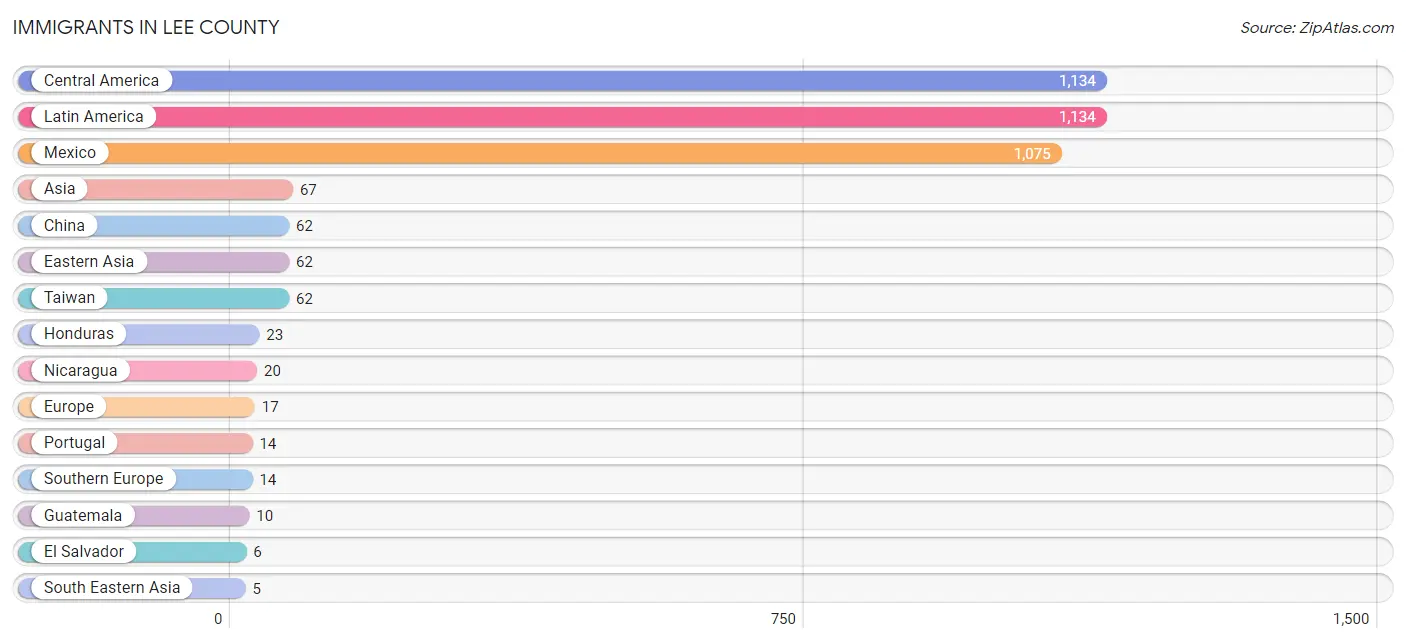
Immigrants in Lee County
The most numerous immigrant groups reported in Lee County came from Central America (1,134 | 6.5%), Latin America (1,134 | 6.5%), Mexico (1,075 | 6.1%), Asia (67 | 0.4%), and China (62 | 0.4%), together accounting for 19.8% of all Lee County residents.
| Immigration Origin | # Population | % Population |
| Africa | 3 | 0.0% |
| Asia | 67 | 0.4% |
| Central America | 1,134 | 6.5% |
| China | 62 | 0.4% |
| Eastern Africa | 3 | 0.0% |
| Eastern Asia | 62 | 0.4% |
| El Salvador | 6 | 0.0% |
| Europe | 17 | 0.1% |
| Germany | 3 | 0.0% |
| Guatemala | 10 | 0.1% |
| Honduras | 23 | 0.1% |
| Latin America | 1,134 | 6.5% |
| Mexico | 1,075 | 6.1% |
| Nicaragua | 20 | 0.1% |
| Portugal | 14 | 0.1% |
| South Eastern Asia | 5 | 0.0% |
| Southern Europe | 14 | 0.1% |
| Taiwan | 62 | 0.4% |
| Thailand | 5 | 0.0% |
| Western Europe | 3 | 0.0% | View All 20 Rows |
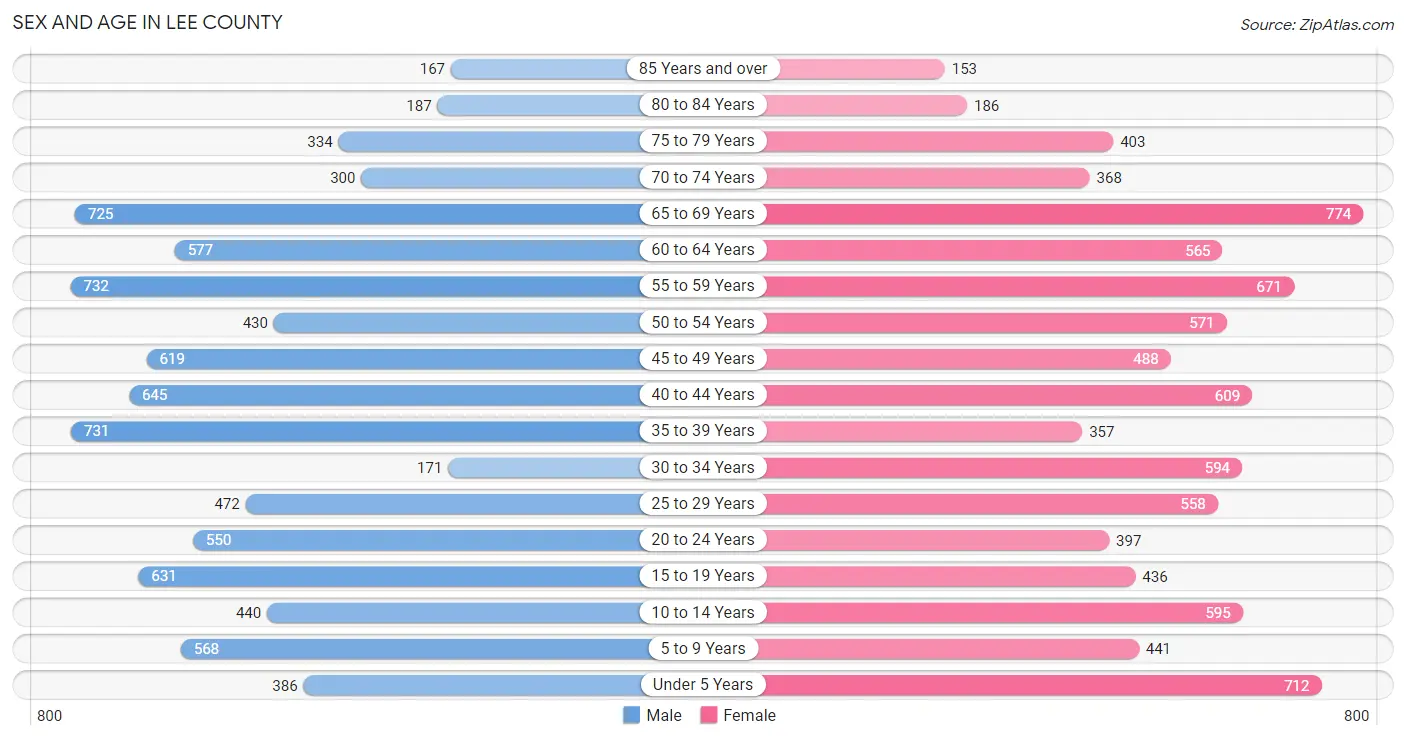
Sex and Age in Lee County
Sex and Age in Lee County
The most populous age groups in Lee County are 55 to 59 Years (732 | 8.5%) for men and 65 to 69 Years (774 | 8.7%) for women.
| Age Bracket | Male | Female |
| Under 5 Years | 386 (4.4%) | 712 (8.0%) |
| 5 to 9 Years | 568 (6.6%) | 441 (5.0%) |
| 10 to 14 Years | 440 (5.1%) | 595 (6.7%) |
| 15 to 19 Years | 631 (7.3%) | 436 (4.9%) |
| 20 to 24 Years | 550 (6.4%) | 397 (4.5%) |
| 25 to 29 Years | 472 (5.4%) | 558 (6.3%) |
| 30 to 34 Years | 171 (2.0%) | 594 (6.7%) |
| 35 to 39 Years | 731 (8.4%) | 357 (4.0%) |
| 40 to 44 Years | 645 (7.4%) | 609 (6.9%) |
| 45 to 49 Years | 619 (7.1%) | 488 (5.5%) |
| 50 to 54 Years | 430 (5.0%) | 571 (6.4%) |
| 55 to 59 Years | 732 (8.5%) | 671 (7.6%) |
| 60 to 64 Years | 577 (6.7%) | 565 (6.4%) |
| 65 to 69 Years | 725 (8.4%) | 774 (8.7%) |
| 70 to 74 Years | 300 (3.5%) | 368 (4.2%) |
| 75 to 79 Years | 334 (3.8%) | 403 (4.5%) |
| 80 to 84 Years | 187 (2.2%) | 186 (2.1%) |
| 85 Years and over | 167 (1.9%) | 153 (1.7%) |
| Total | 8,665 (100.0%) | 8,878 (100.0%) |
Families and Households in Lee County
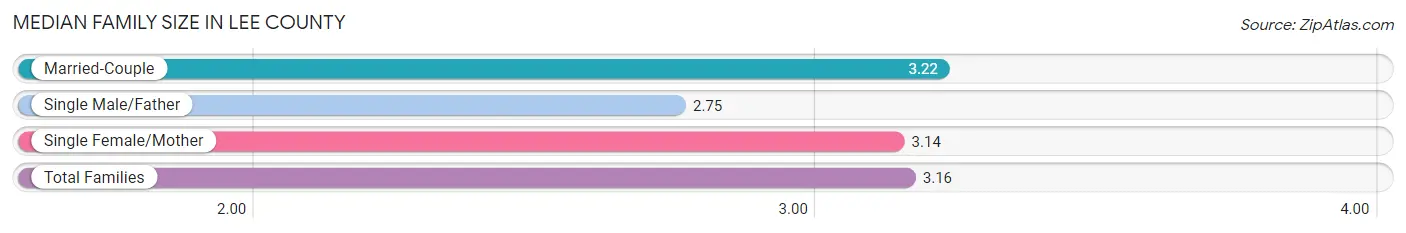
Median Family Size in Lee County
The median family size in Lee County is 3.16 persons per family, with married-couple families (3,350 | 72.8%) accounting for the largest median family size of 3.22 persons per family. On the other hand, single male/father families (435 | 9.5%) represent the smallest median family size with 2.75 persons per family.
| Family Type | # Families | Family Size |
| Married-Couple | 3,350 (72.8%) | 3.22 |
| Single Male/Father | 435 (9.5%) | 2.75 |
| Single Female/Mother | 816 (17.7%) | 3.14 |
| Total Families | 4,601 (100.0%) | 3.16 |
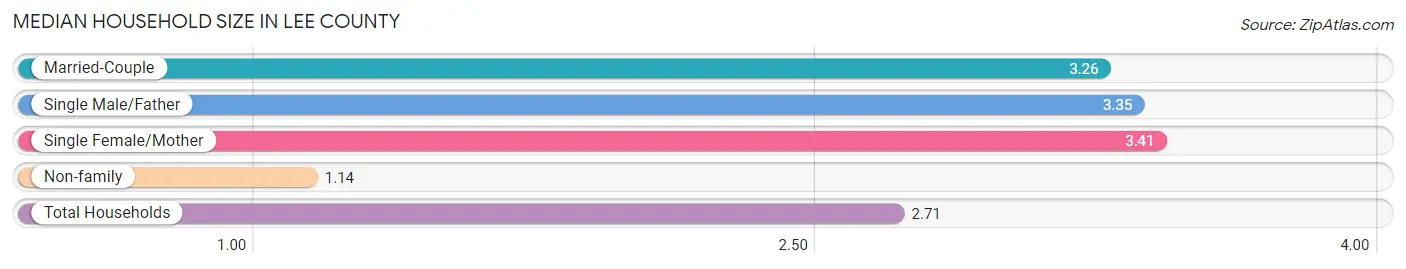
Median Household Size in Lee County
The median household size in Lee County is 2.71 persons per household, with single female/mother households (816 | 12.9%) accounting for the largest median household size of 3.41 persons per household. non-family households (1,712 | 27.1%) represent the smallest median household size with 1.14 persons per household.
| Household Type | # Households | Household Size |
| Married-Couple | 3,350 (53.1%) | 3.26 |
| Single Male/Father | 435 (6.9%) | 3.35 |
| Single Female/Mother | 816 (12.9%) | 3.41 |
| Non-family | 1,712 (27.1%) | 1.14 |
| Total Households | 6,313 (100.0%) | 2.71 |
Household Size by Marriage Status in Lee County
Out of a total of 6,313 households in Lee County, 4,601 (72.9%) are family households, while 1,712 (27.1%) are nonfamily households. The most numerous type of family households are 2-person households, comprising 2,048, and the most common type of nonfamily households are 1-person households, comprising 1,603.
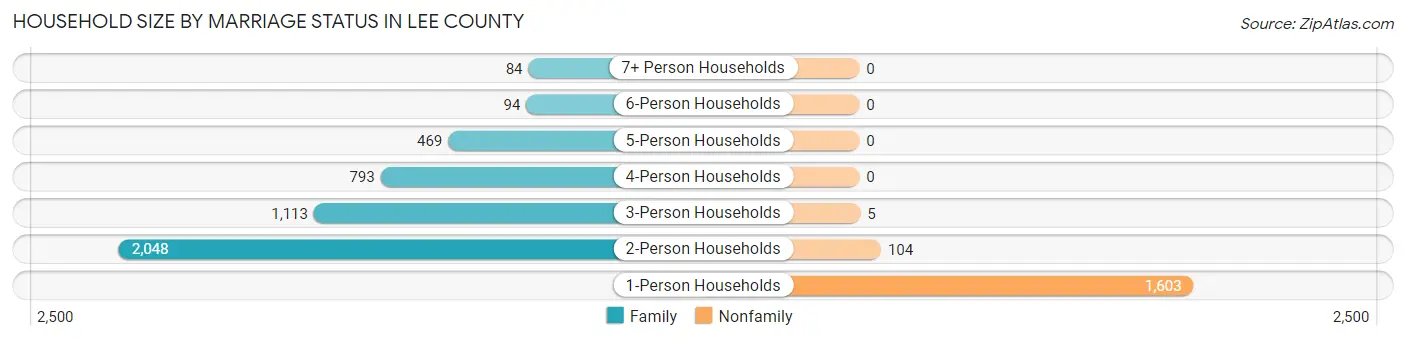
| Household Size | Family Households | Nonfamily Households |
| 1-Person Households | - | 1,603 (25.4%) |
| 2-Person Households | 2,048 (32.4%) | 104 (1.7%) |
| 3-Person Households | 1,113 (17.6%) | 5 (0.1%) |
| 4-Person Households | 793 (12.6%) | 0 (0.0%) |
| 5-Person Households | 469 (7.4%) | 0 (0.0%) |
| 6-Person Households | 94 (1.5%) | 0 (0.0%) |
| 7+ Person Households | 84 (1.3%) | 0 (0.0%) |
| Total | 4,601 (72.9%) | 1,712 (27.1%) |
Female Fertility in Lee County
Fertility by Age in Lee County
Average fertility rate in Lee County is 93.0 births per 1,000 women. Women in the age bracket of 20 to 34 years have the highest fertility rate with 148.0 births per 1,000 women. Women in the age bracket of 20 to 34 years acount for 71.7% of all women with births.
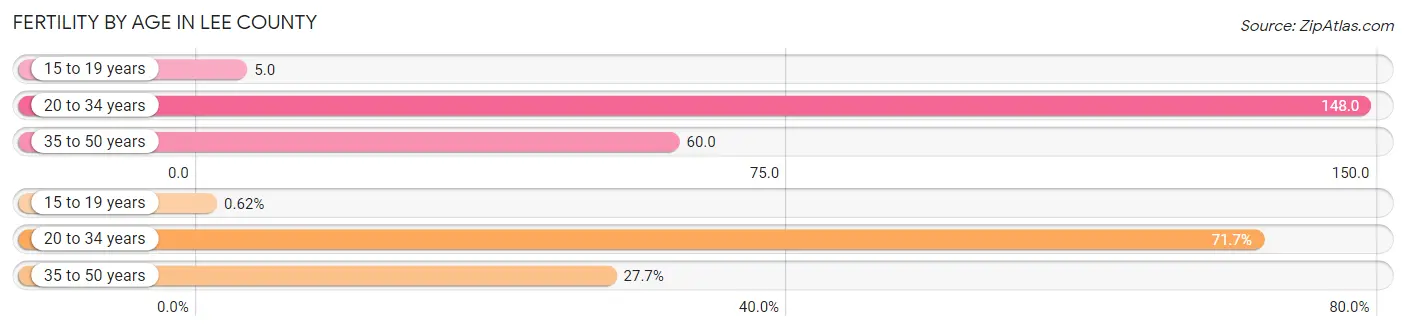
| Age Bracket | Women with Births | Births / 1,000 Women |
| 15 to 19 years | 2 (0.6%) | 5.0 |
| 20 to 34 years | 230 (71.7%) | 148.0 |
| 35 to 50 years | 89 (27.7%) | 60.0 |
| Total | 321 (100.0%) | 93.0 |
Fertility by Age by Marriage Status in Lee County
48.6% of women with births (321) in Lee County are married. The highest percentage of unmarried women with births falls into 20 to 34 years age bracket with 53.0% of them unmarried at the time of birth, while the lowest percentage of unmarried women with births belong to 15 to 19 years age bracket with 0.0% of them unmarried.
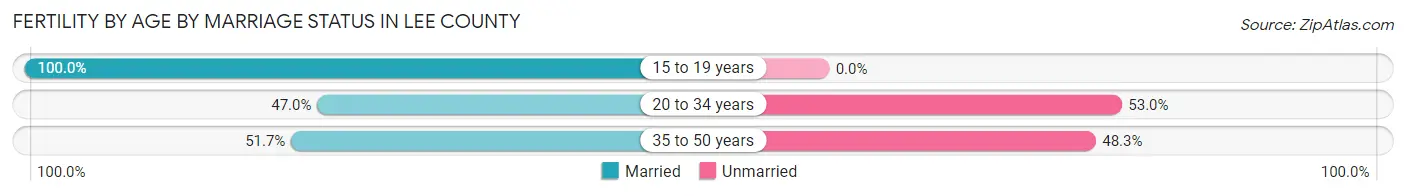
| Age Bracket | Married | Unmarried |
| 15 to 19 years | 2 (100.0%) | 0 (0.0%) |
| 20 to 34 years | 108 (47.0%) | 122 (53.0%) |
| 35 to 50 years | 46 (51.7%) | 43 (48.3%) |
| Total | 156 (48.6%) | 165 (51.4%) |
Fertility by Education in Lee County
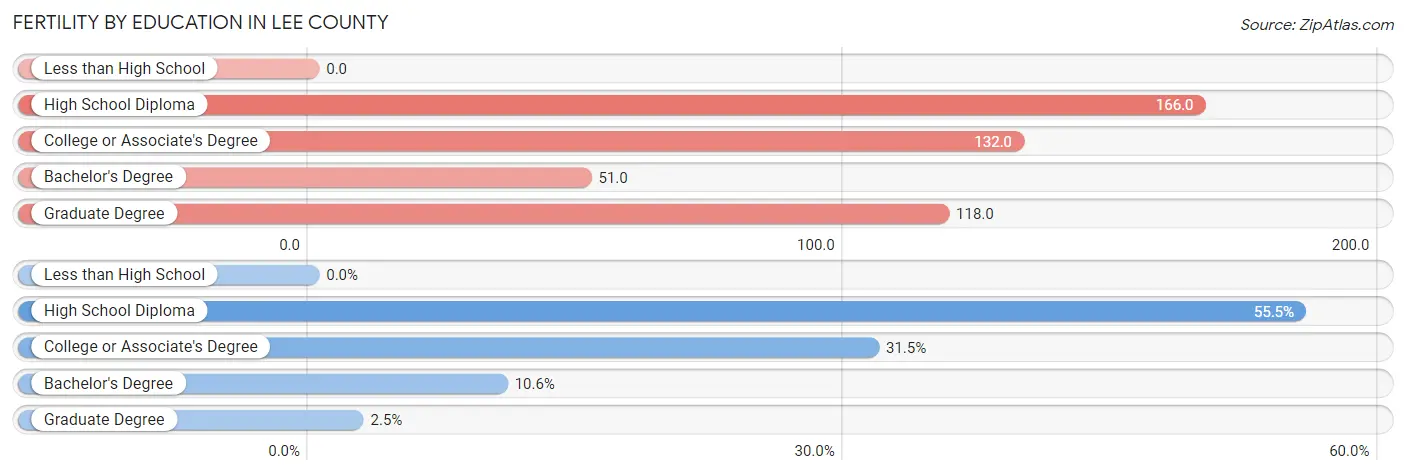
| Educational Attainment | Women with Births | Births / 1,000 Women |
| Less than High School | 0 (0.0%) | 0.0 |
| High School Diploma | 178 (55.4%) | 166.0 |
| College or Associate's Degree | 101 (31.5%) | 132.0 |
| Bachelor's Degree | 34 (10.6%) | 51.0 |
| Graduate Degree | 8 (2.5%) | 118.0 |
| Total | 321 (100.0%) | 93.0 |
Fertility by Education by Marriage Status in Lee County
51.4% of women with births in Lee County are unmarried. Women with the educational attainment of bachelor's degree are most likely to be married with 100.0% of them married at childbirth, while women with the educational attainment of high school diploma are least likely to be married with 61.8% of them unmarried at childbirth.
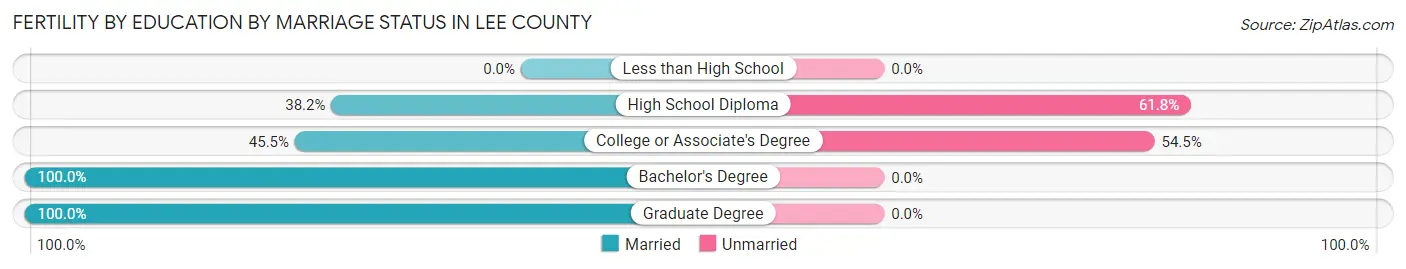
| Educational Attainment | Married | Unmarried |
| Less than High School | 0 (0.0%) | 0 (0.0%) |
| High School Diploma | 68 (38.2%) | 110 (61.8%) |
| College or Associate's Degree | 46 (45.5%) | 55 (54.5%) |
| Bachelor's Degree | 34 (100.0%) | 0 (0.0%) |
| Graduate Degree | 8 (100.0%) | 0 (0.0%) |
| Total | 156 (48.6%) | 165 (51.4%) |
Employment Characteristics in Lee County
Employment by Class of Employer in Lee County
Among the 7,672 employed individuals in Lee County, private company employees (4,667 | 60.8%), local government employees (744 | 9.7%), and self-employed (not incorporated) (703 | 9.2%) make up the most common classes of employment.
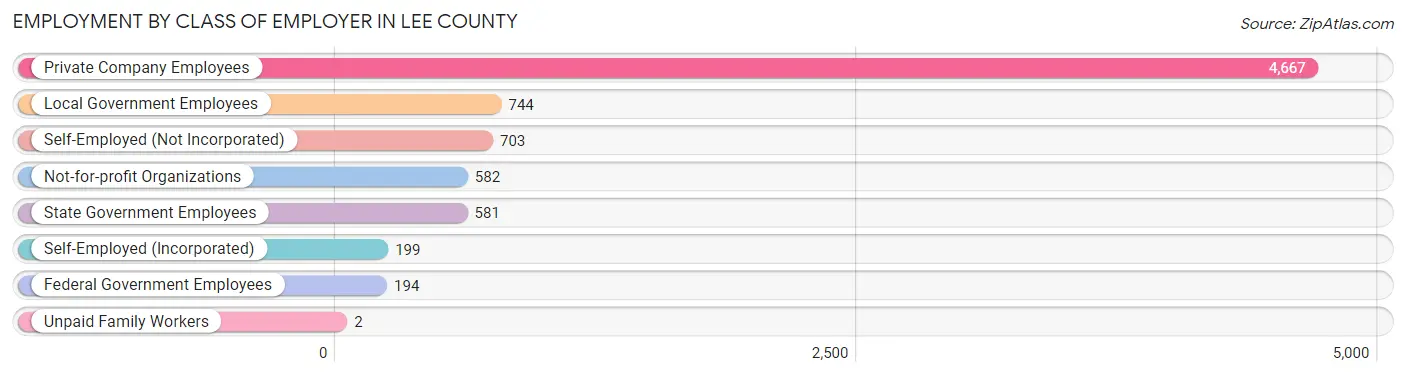
| Employer Class | # Employees | % Employees |
| Private Company Employees | 4,667 | 60.8% |
| Self-Employed (Incorporated) | 199 | 2.6% |
| Self-Employed (Not Incorporated) | 703 | 9.2% |
| Not-for-profit Organizations | 582 | 7.6% |
| Local Government Employees | 744 | 9.7% |
| State Government Employees | 581 | 7.6% |
| Federal Government Employees | 194 | 2.5% |
| Unpaid Family Workers | 2 | 0.0% |
| Total | 7,672 | 100.0% |
Employment Status by Age in Lee County
According to the labor force statistics for Lee County, out of the total population over 16 years of age (14,207), 58.3% or 8,283 individuals are in the labor force, with 2.8% or 232 of them unemployed. The age group with the highest labor force participation rate is 25 to 29 years, with 94.2% or 970 individuals in the labor force. Within the labor force, the 16 to 19 years age range has the highest percentage of unemployed individuals, with 13.1% or 48 of them being unemployed.
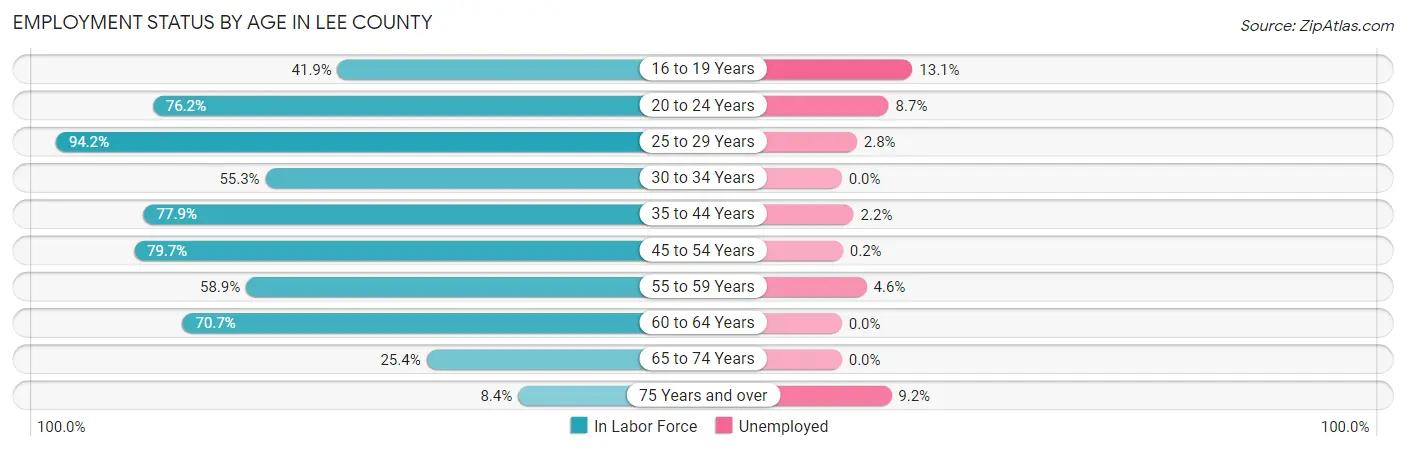
| Age Bracket | In Labor Force | Unemployed |
| 16 to 19 Years | 366 (41.9%) | 48 (13.1%) |
| 20 to 24 Years | 722 (76.2%) | 63 (8.7%) |
| 25 to 29 Years | 970 (94.2%) | 27 (2.8%) |
| 30 to 34 Years | 423 (55.3%) | 0 (0.0%) |
| 35 to 44 Years | 1,824 (77.9%) | 40 (2.2%) |
| 45 to 54 Years | 1,680 (79.7%) | 3 (0.2%) |
| 55 to 59 Years | 826 (58.9%) | 38 (4.6%) |
| 60 to 64 Years | 807 (70.7%) | 0 (0.0%) |
| 65 to 74 Years | 550 (25.4%) | 0 (0.0%) |
| 75 Years and over | 120 (8.4%) | 11 (9.2%) |
| Total | 8,283 (58.3%) | 232 (2.8%) |
Employment Status by Educational Attainment in Lee County
According to labor force statistics for Lee County, 74.3% of individuals (6,531) out of the total population between 25 and 64 years of age (8,790) are in the labor force, with 1.7% or 111 of them being unemployed. The group with the highest labor force participation rate are those with the educational attainment of bachelor's degree or higher, with 89.4% or 1,371 individuals in the labor force. Within the labor force, individuals with less than high school education have the highest percentage of unemployment, with 3.7% or 22 of them being unemployed.
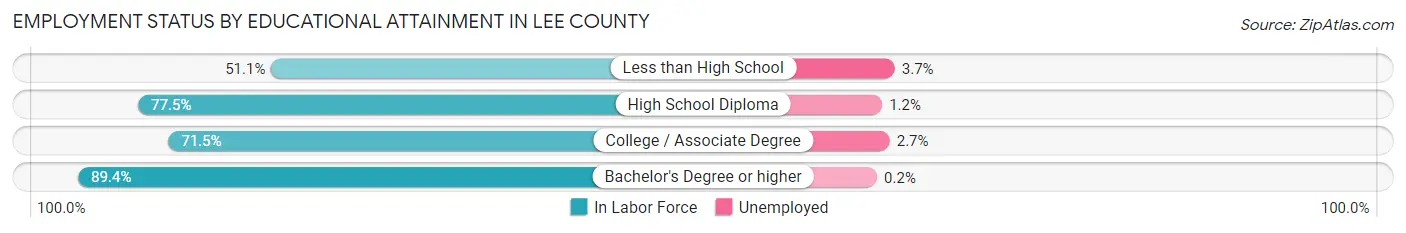
| Educational Attainment | In Labor Force | Unemployed |
| Less than High School | 597 (51.1%) | 43 (3.7%) |
| High School Diploma | 2,737 (77.5%) | 42 (1.2%) |
| College / Associate Degree | 1,829 (71.5%) | 69 (2.7%) |
| Bachelor's Degree or higher | 1,371 (89.4%) | 3 (0.2%) |
| Total | 6,531 (74.3%) | 149 (1.7%) |
Employment Occupations by Sex in Lee County
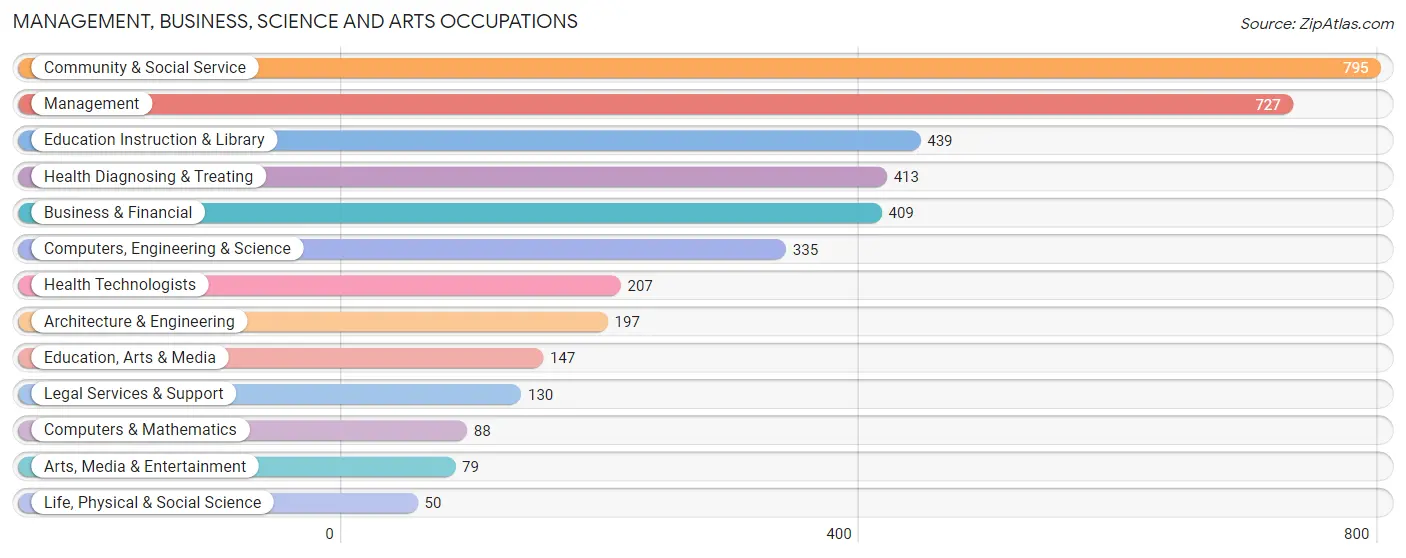
Management, Business, Science and Arts Occupations
The most common Management, Business, Science and Arts occupations in Lee County are Community & Social Service (795 | 9.9%), Management (727 | 9.0%), Education Instruction & Library (439 | 5.4%), Health Diagnosing & Treating (413 | 5.1%), and Business & Financial (409 | 5.1%).
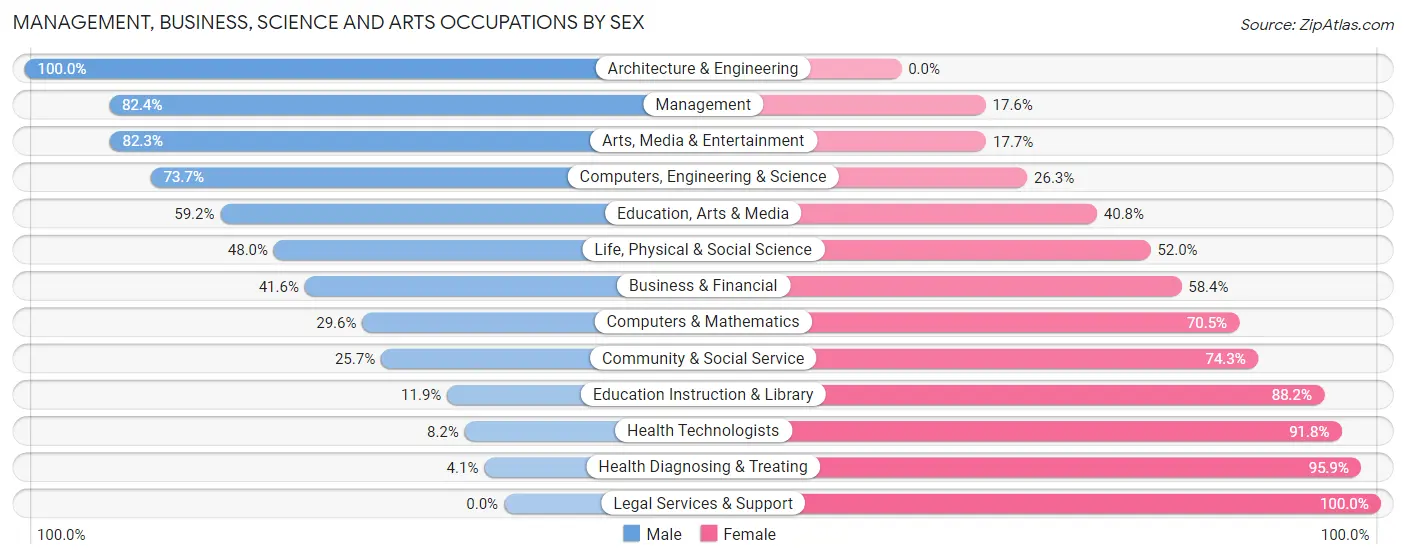
Management, Business, Science and Arts Occupations by Sex
Within the Management, Business, Science and Arts occupations in Lee County, the most male-oriented occupations are Architecture & Engineering (100.0%), Management (82.4%), and Arts, Media & Entertainment (82.3%), while the most female-oriented occupations are Legal Services & Support (100.0%), Health Diagnosing & Treating (95.9%), and Health Technologists (91.8%).
| Occupation | Male | Female |
| Management | 599 (82.4%) | 128 (17.6%) |
| Business & Financial | 170 (41.6%) | 239 (58.4%) |
| Computers, Engineering & Science | 247 (73.7%) | 88 (26.3%) |
| Computers & Mathematics | 26 (29.5%) | 62 (70.5%) |
| Architecture & Engineering | 197 (100.0%) | 0 (0.0%) |
| Life, Physical & Social Science | 24 (48.0%) | 26 (52.0%) |
| Community & Social Service | 204 (25.7%) | 591 (74.3%) |
| Education, Arts & Media | 87 (59.2%) | 60 (40.8%) |
| Legal Services & Support | 0 (0.0%) | 130 (100.0%) |
| Education Instruction & Library | 52 (11.8%) | 387 (88.1%) |
| Arts, Media & Entertainment | 65 (82.3%) | 14 (17.7%) |
| Health Diagnosing & Treating | 17 (4.1%) | 396 (95.9%) |
| Health Technologists | 17 (8.2%) | 190 (91.8%) |
| Total (Category) | 1,237 (46.2%) | 1,442 (53.8%) |
| Total (Overall) | 4,620 (57.3%) | 3,438 (42.7%) |
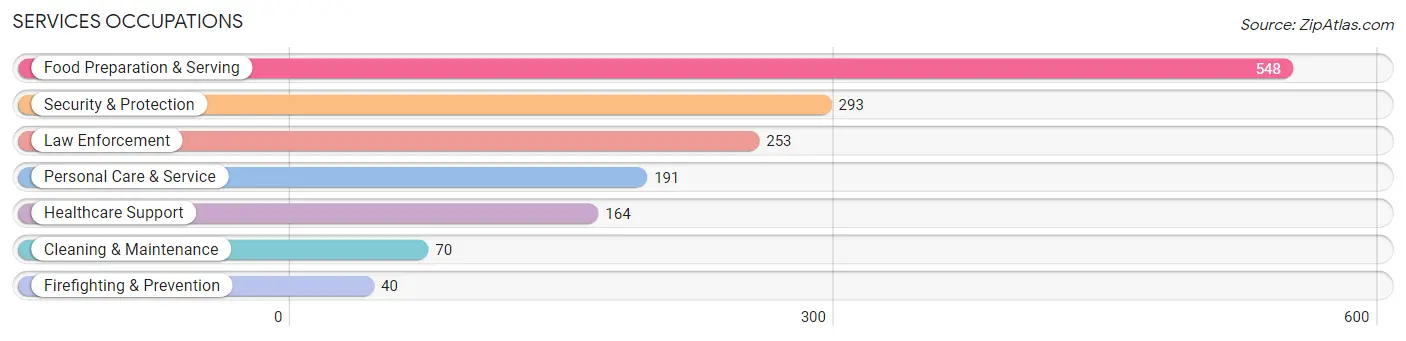
Services Occupations
The most common Services occupations in Lee County are Food Preparation & Serving (548 | 6.8%), Security & Protection (293 | 3.6%), Law Enforcement (253 | 3.1%), Personal Care & Service (191 | 2.4%), and Healthcare Support (164 | 2.0%).
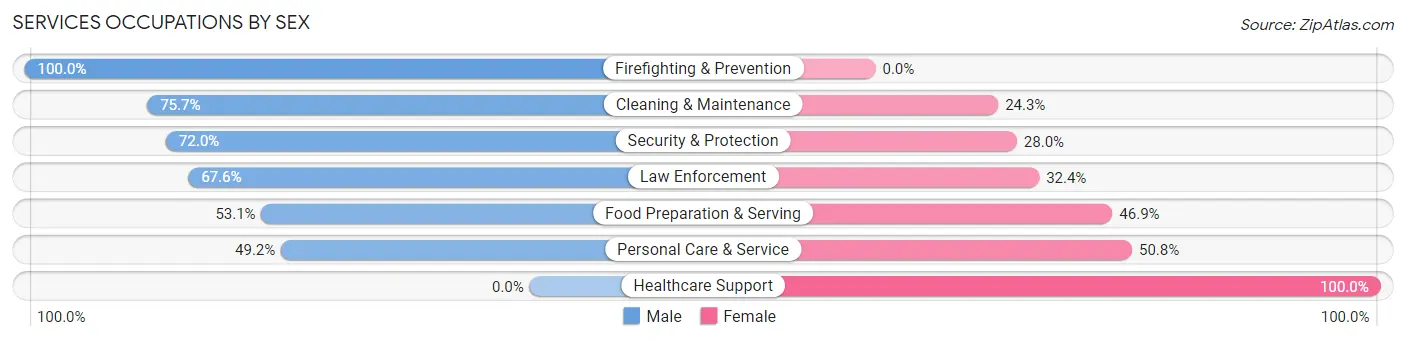
Services Occupations by Sex
Within the Services occupations in Lee County, the most male-oriented occupations are Firefighting & Prevention (100.0%), Cleaning & Maintenance (75.7%), and Security & Protection (72.0%), while the most female-oriented occupations are Healthcare Support (100.0%), Personal Care & Service (50.8%), and Food Preparation & Serving (46.9%).
| Occupation | Male | Female |
| Healthcare Support | 0 (0.0%) | 164 (100.0%) |
| Security & Protection | 211 (72.0%) | 82 (28.0%) |
| Firefighting & Prevention | 40 (100.0%) | 0 (0.0%) |
| Law Enforcement | 171 (67.6%) | 82 (32.4%) |
| Food Preparation & Serving | 291 (53.1%) | 257 (46.9%) |
| Cleaning & Maintenance | 53 (75.7%) | 17 (24.3%) |
| Personal Care & Service | 94 (49.2%) | 97 (50.8%) |
| Total (Category) | 649 (51.3%) | 617 (48.7%) |
| Total (Overall) | 4,620 (57.3%) | 3,438 (42.7%) |
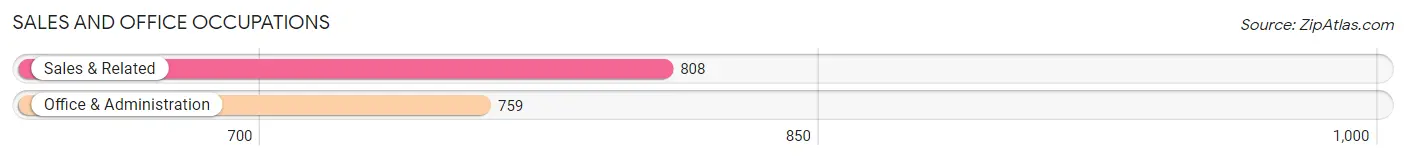
Sales and Office Occupations
The most common Sales and Office occupations in Lee County are Sales & Related (808 | 10.0%), and Office & Administration (759 | 9.4%).
Sales and Office Occupations by Sex
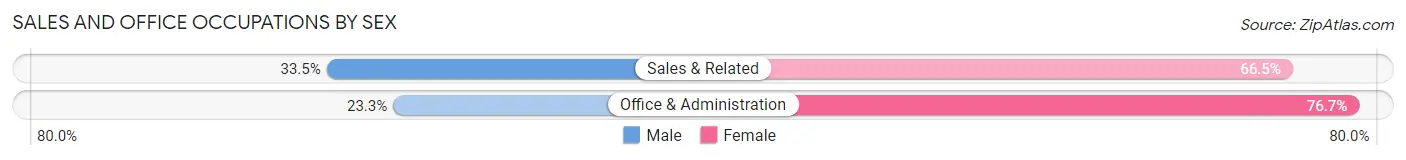
| Occupation | Male | Female |
| Sales & Related | 271 (33.5%) | 537 (66.5%) |
| Office & Administration | 177 (23.3%) | 582 (76.7%) |
| Total (Category) | 448 (28.6%) | 1,119 (71.4%) |
| Total (Overall) | 4,620 (57.3%) | 3,438 (42.7%) |
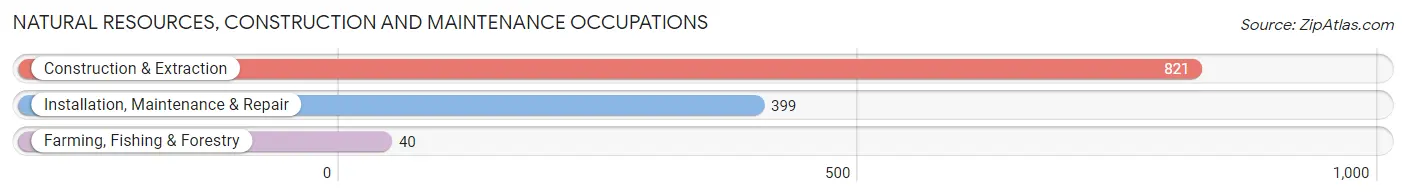
Natural Resources, Construction and Maintenance Occupations
The most common Natural Resources, Construction and Maintenance occupations in Lee County are Construction & Extraction (821 | 10.2%), Installation, Maintenance & Repair (399 | 5.0%), and Farming, Fishing & Forestry (40 | 0.5%).
Natural Resources, Construction and Maintenance Occupations by Sex
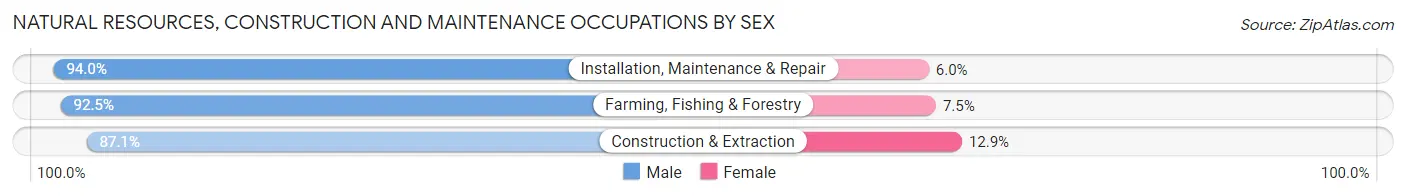
| Occupation | Male | Female |
| Farming, Fishing & Forestry | 37 (92.5%) | 3 (7.5%) |
| Construction & Extraction | 715 (87.1%) | 106 (12.9%) |
| Installation, Maintenance & Repair | 375 (94.0%) | 24 (6.0%) |
| Total (Category) | 1,127 (89.4%) | 133 (10.6%) |
| Total (Overall) | 4,620 (57.3%) | 3,438 (42.7%) |
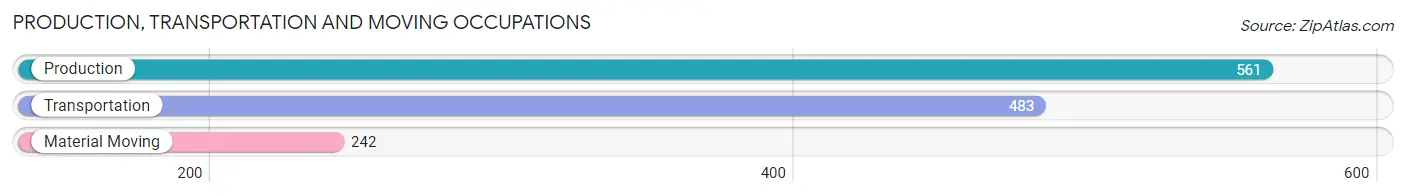
Production, Transportation and Moving Occupations
The most common Production, Transportation and Moving occupations in Lee County are Production (561 | 7.0%), Transportation (483 | 6.0%), and Material Moving (242 | 3.0%).
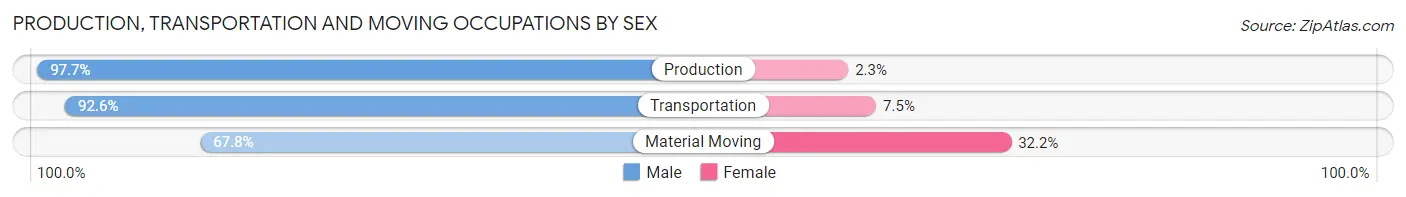
Production, Transportation and Moving Occupations by Sex
| Occupation | Male | Female |
| Production | 548 (97.7%) | 13 (2.3%) |
| Transportation | 447 (92.5%) | 36 (7.4%) |
| Material Moving | 164 (67.8%) | 78 (32.2%) |
| Total (Category) | 1,159 (90.1%) | 127 (9.9%) |
| Total (Overall) | 4,620 (57.3%) | 3,438 (42.7%) |
Employment Industries by Sex in Lee County
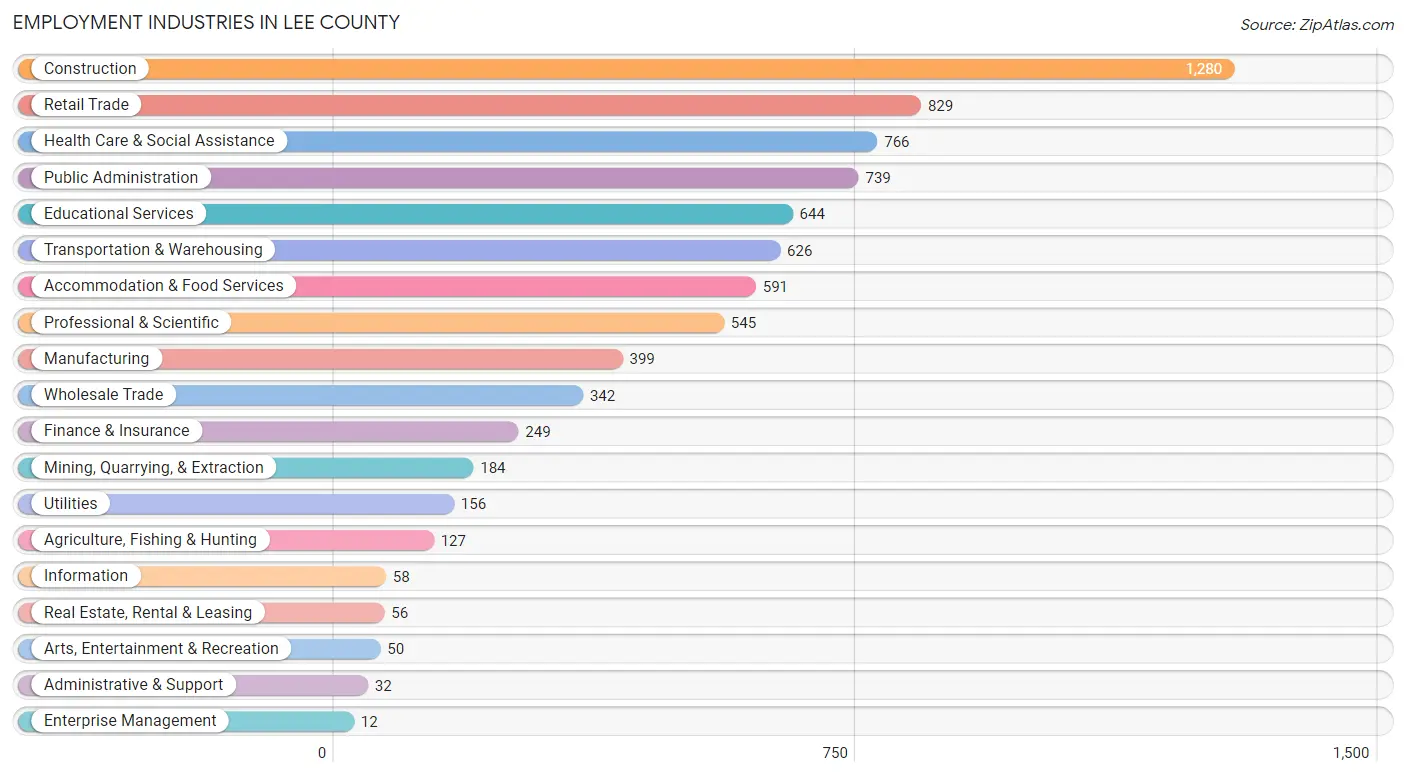
Employment Industries in Lee County
The major employment industries in Lee County include Construction (1,280 | 15.9%), Retail Trade (829 | 10.3%), Health Care & Social Assistance (766 | 9.5%), Public Administration (739 | 9.2%), and Educational Services (644 | 8.0%).
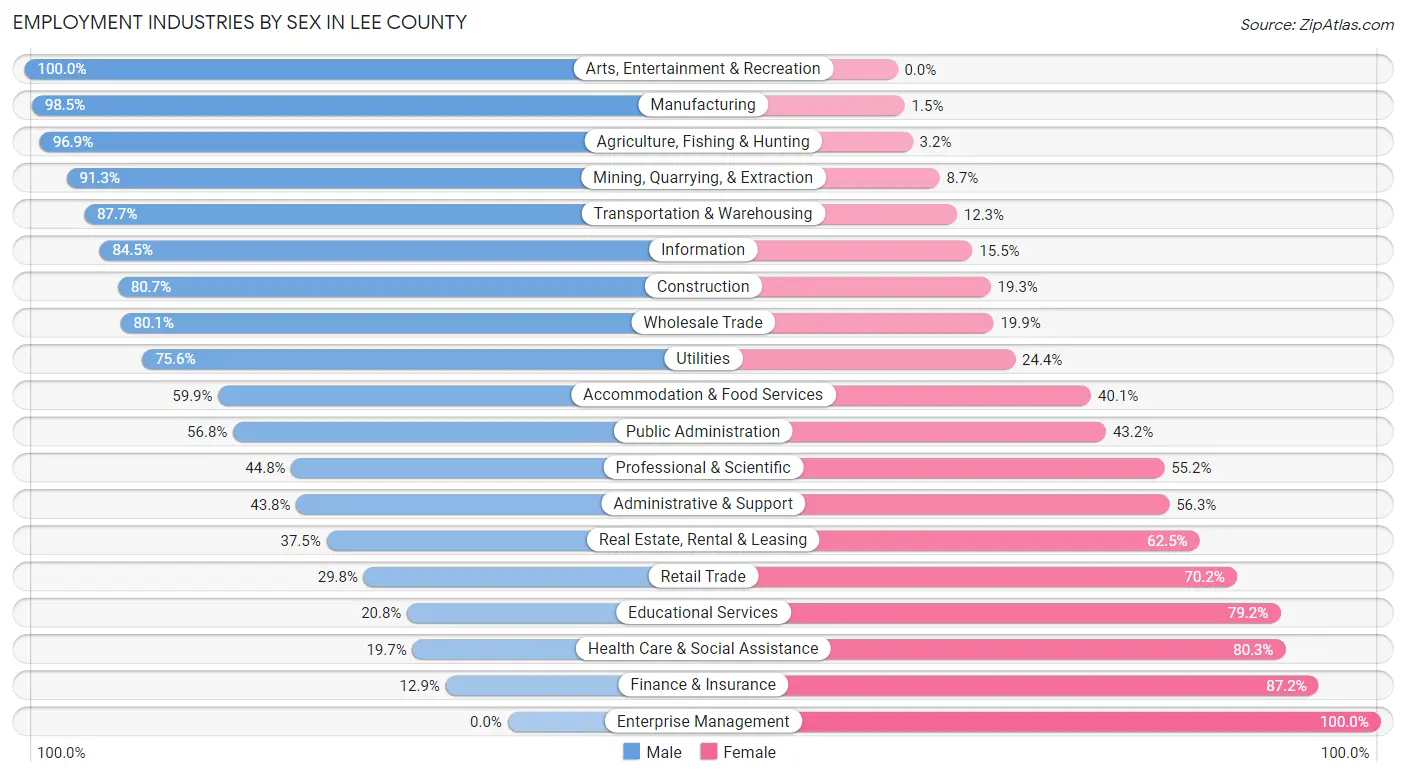
Employment Industries by Sex in Lee County
The Lee County industries that see more men than women are Arts, Entertainment & Recreation (100.0%), Manufacturing (98.5%), and Agriculture, Fishing & Hunting (96.9%), whereas the industries that tend to have a higher number of women are Enterprise Management (100.0%), Finance & Insurance (87.2%), and Health Care & Social Assistance (80.3%).
| Industry | Male | Female |
| Agriculture, Fishing & Hunting | 123 (96.9%) | 4 (3.2%) |
| Mining, Quarrying, & Extraction | 168 (91.3%) | 16 (8.7%) |
| Construction | 1,033 (80.7%) | 247 (19.3%) |
| Manufacturing | 393 (98.5%) | 6 (1.5%) |
| Wholesale Trade | 274 (80.1%) | 68 (19.9%) |
| Retail Trade | 247 (29.8%) | 582 (70.2%) |
| Transportation & Warehousing | 549 (87.7%) | 77 (12.3%) |
| Utilities | 118 (75.6%) | 38 (24.4%) |
| Information | 49 (84.5%) | 9 (15.5%) |
| Finance & Insurance | 32 (12.9%) | 217 (87.2%) |
| Real Estate, Rental & Leasing | 21 (37.5%) | 35 (62.5%) |
| Professional & Scientific | 244 (44.8%) | 301 (55.2%) |
| Enterprise Management | 0 (0.0%) | 12 (100.0%) |
| Administrative & Support | 14 (43.8%) | 18 (56.2%) |
| Educational Services | 134 (20.8%) | 510 (79.2%) |
| Health Care & Social Assistance | 151 (19.7%) | 615 (80.3%) |
| Arts, Entertainment & Recreation | 50 (100.0%) | 0 (0.0%) |
| Accommodation & Food Services | 354 (59.9%) | 237 (40.1%) |
| Public Administration | 420 (56.8%) | 319 (43.2%) |
| Total | 4,620 (57.3%) | 3,438 (42.7%) |
Education in Lee County
School Enrollment in Lee County
The most common levels of schooling among the 3,854 students in Lee County are high school (1,042 | 27.0%), elementary school (816 | 21.2%), and middle school (812 | 21.1%).
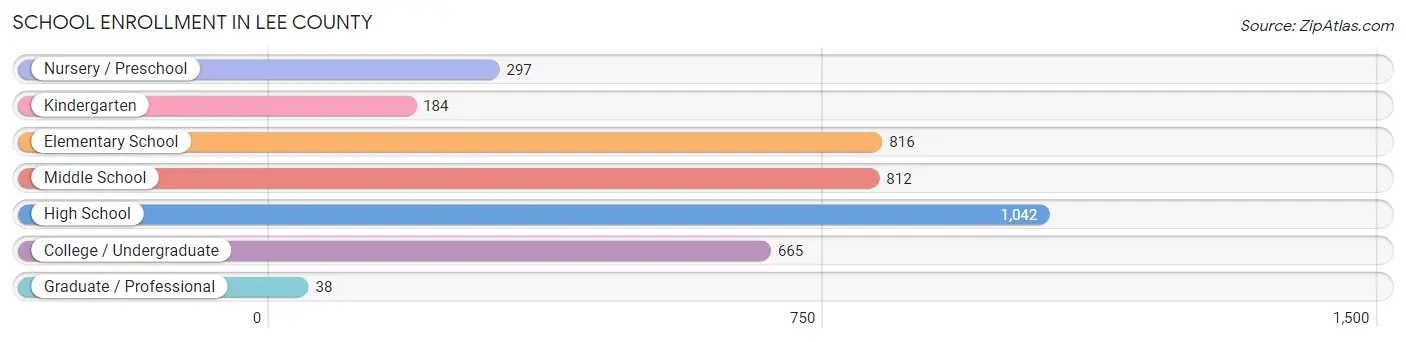
| School Level | # Students | % Students |
| Nursery / Preschool | 297 | 7.7% |
| Kindergarten | 184 | 4.8% |
| Elementary School | 816 | 21.2% |
| Middle School | 812 | 21.1% |
| High School | 1,042 | 27.0% |
| College / Undergraduate | 665 | 17.2% |
| Graduate / Professional | 38 | 1.0% |
| Total | 3,854 | 100.0% |
School Enrollment by Age by Funding Source in Lee County
Out of a total of 3,854 students who are enrolled in schools in Lee County, 524 (13.6%) attend a private institution, while the remaining 3,330 (86.4%) are enrolled in public schools. The age group of 3 to 4 year olds has the highest likelihood of being enrolled in private schools, with 107 (42.8% in the age bracket) enrolled. Conversely, the age group of 20 to 24 year olds has the lowest likelihood of being enrolled in a private school, with 361 (100.0% in the age bracket) attending a public institution.
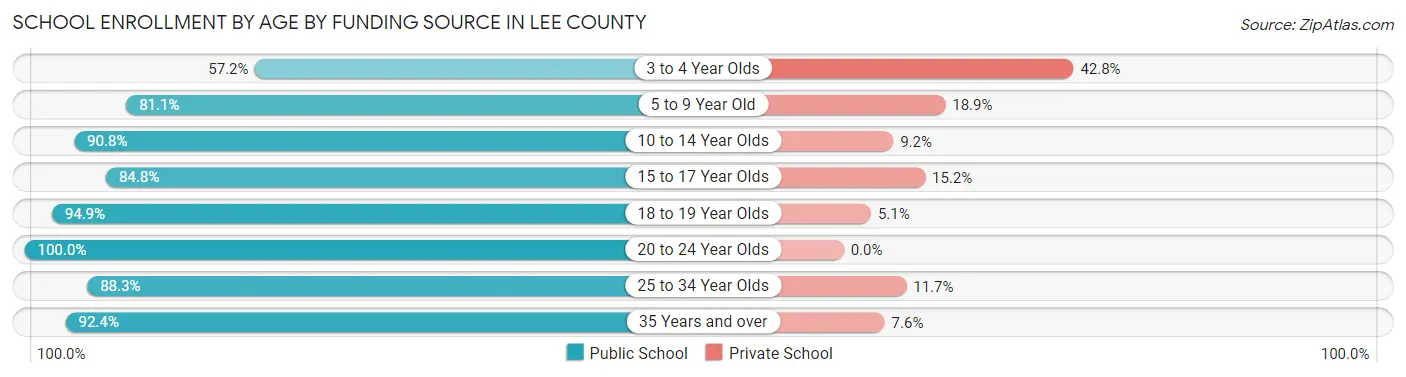
| Age Bracket | Public School | Private School |
| 3 to 4 Year Olds | 143 (57.2%) | 107 (42.8%) |
| 5 to 9 Year Old | 818 (81.1%) | 191 (18.9%) |
| 10 to 14 Year Olds | 934 (90.8%) | 95 (9.2%) |
| 15 to 17 Year Olds | 509 (84.8%) | 91 (15.2%) |
| 18 to 19 Year Olds | 336 (94.9%) | 18 (5.1%) |
| 20 to 24 Year Olds | 361 (100.0%) | 0 (0.0%) |
| 25 to 34 Year Olds | 106 (88.3%) | 14 (11.7%) |
| 35 Years and over | 121 (92.4%) | 10 (7.6%) |
| Total | 3,330 (86.4%) | 524 (13.6%) |
Educational Attainment by Field of Study in Lee County
Business (502 | 23.3%), education (373 | 17.3%), bio, nature & agricultural (263 | 12.2%), arts & humanities (219 | 10.2%), and communications (188 | 8.7%) are the most common fields of study among 2,157 individuals in Lee County who have obtained a bachelor's degree or higher.
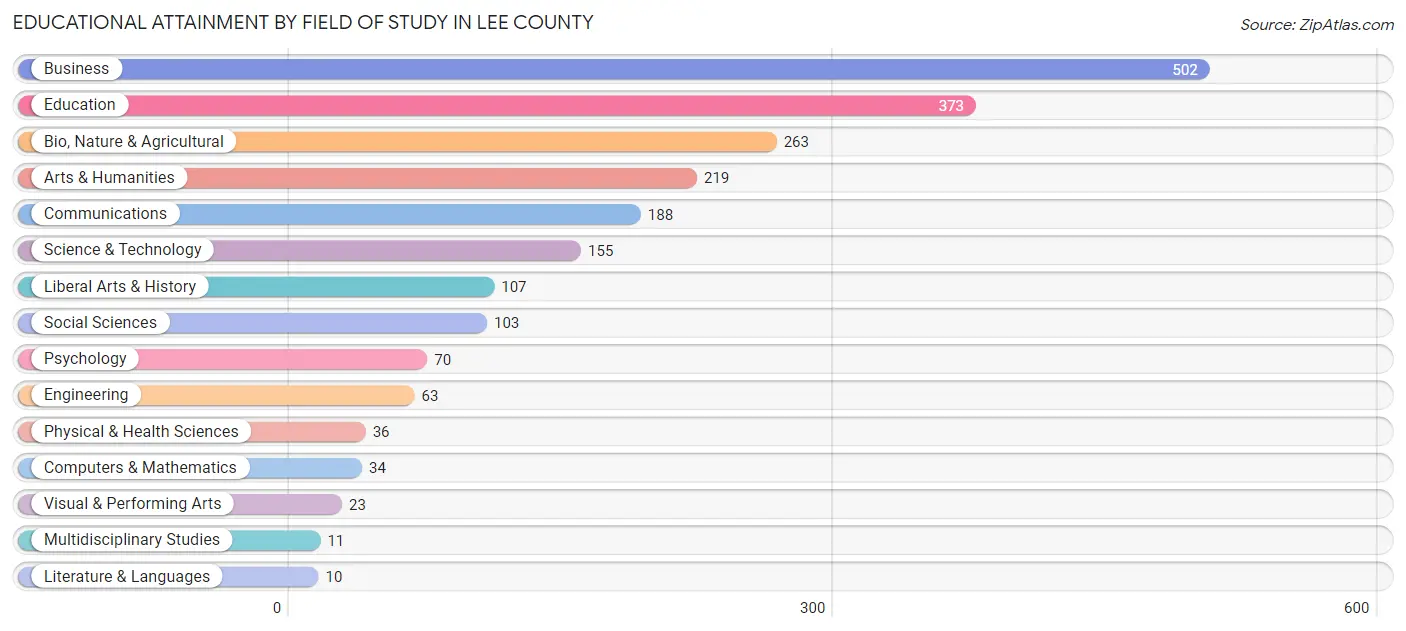
| Field of Study | # Graduates | % Graduates |
| Computers & Mathematics | 34 | 1.6% |
| Bio, Nature & Agricultural | 263 | 12.2% |
| Physical & Health Sciences | 36 | 1.7% |
| Psychology | 70 | 3.3% |
| Social Sciences | 103 | 4.8% |
| Engineering | 63 | 2.9% |
| Multidisciplinary Studies | 11 | 0.5% |
| Science & Technology | 155 | 7.2% |
| Business | 502 | 23.3% |
| Education | 373 | 17.3% |
| Literature & Languages | 10 | 0.5% |
| Liberal Arts & History | 107 | 5.0% |
| Visual & Performing Arts | 23 | 1.1% |
| Communications | 188 | 8.7% |
| Arts & Humanities | 219 | 10.2% |
| Total | 2,157 | 100.0% |
Transportation & Commute in Lee County
Vehicle Availability by Sex in Lee County
The most prevalent vehicle ownership categories in Lee County are males with 2 vehicles (1,709, accounting for 37.9%) and females with 2 vehicles (1,052, making up 54.0%).
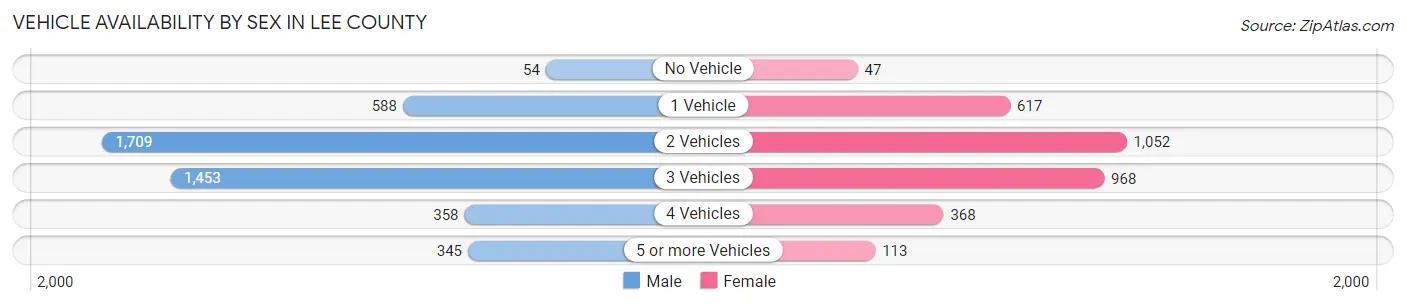
| Vehicles Available | Male | Female |
| No Vehicle | 54 (1.2%) | 47 (1.5%) |
| 1 Vehicle | 588 (13.1%) | 617 (19.5%) |
| 2 Vehicles | 1,709 (37.9%) | 1,052 (33.2%) |
| 3 Vehicles | 1,453 (32.2%) | 968 (30.6%) |
| 4 Vehicles | 358 (7.9%) | 368 (11.6%) |
| 5 or more Vehicles | 345 (7.6%) | 113 (3.6%) |
| Total | 4,507 (100.0%) | 3,165 (100.0%) |
Commute Time in Lee County
The most frequently occuring commute durations in Lee County are 5 to 9 minutes (1,147 commuters, 16.3%), 15 to 19 minutes (947 commuters, 13.5%), and 10 to 14 minutes (933 commuters, 13.3%).
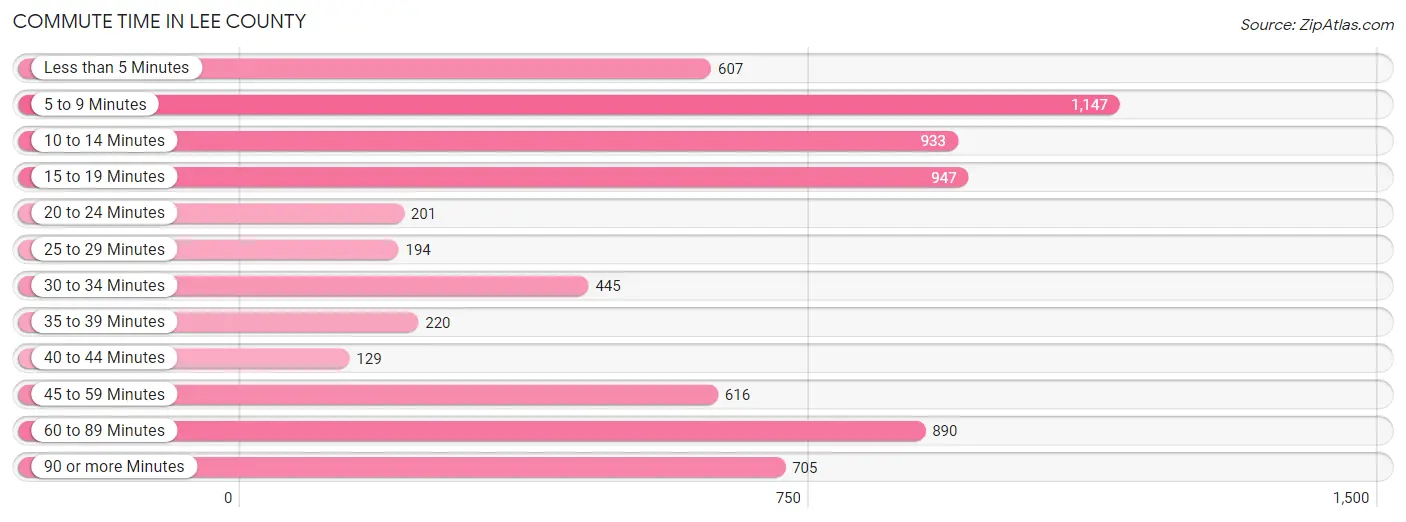
| Commute Time | # Commuters | % Commuters |
| Less than 5 Minutes | 607 | 8.6% |
| 5 to 9 Minutes | 1,147 | 16.3% |
| 10 to 14 Minutes | 933 | 13.3% |
| 15 to 19 Minutes | 947 | 13.5% |
| 20 to 24 Minutes | 201 | 2.9% |
| 25 to 29 Minutes | 194 | 2.8% |
| 30 to 34 Minutes | 445 | 6.3% |
| 35 to 39 Minutes | 220 | 3.1% |
| 40 to 44 Minutes | 129 | 1.8% |
| 45 to 59 Minutes | 616 | 8.8% |
| 60 to 89 Minutes | 890 | 12.7% |
| 90 or more Minutes | 705 | 10.0% |
Commute Time by Sex in Lee County
The most common commute times in Lee County are 60 to 89 minutes (699 commuters, 16.7%) for males and 5 to 9 minutes (593 commuters, 20.9%) for females.
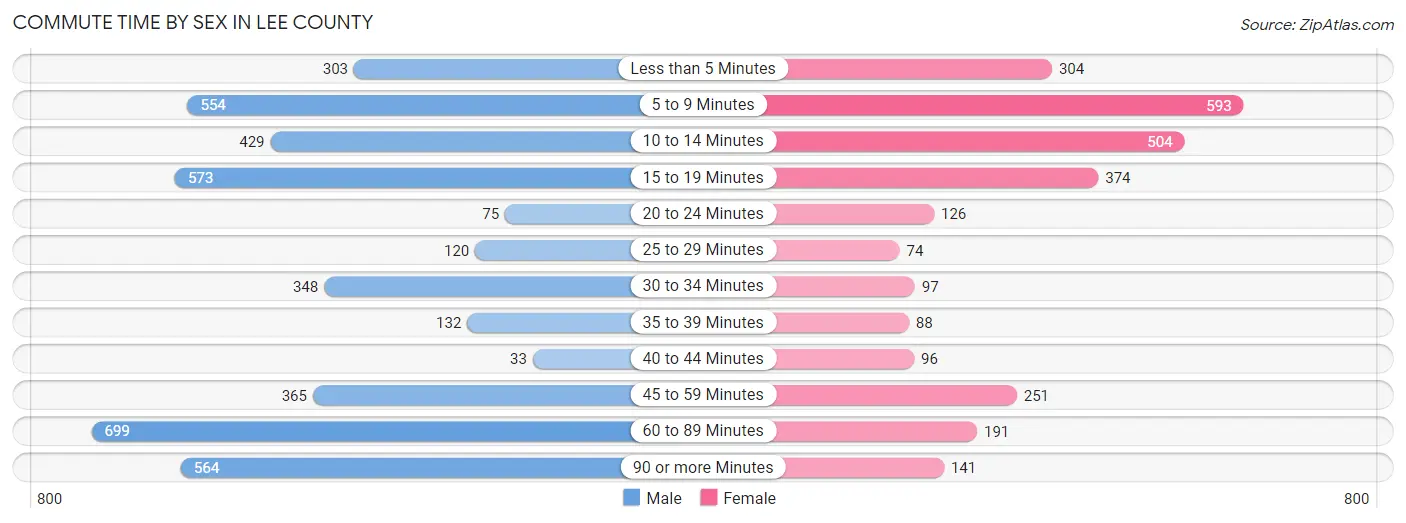
| Commute Time | Male | Female |
| Less than 5 Minutes | 303 (7.2%) | 304 (10.7%) |
| 5 to 9 Minutes | 554 (13.2%) | 593 (20.9%) |
| 10 to 14 Minutes | 429 (10.2%) | 504 (17.7%) |
| 15 to 19 Minutes | 573 (13.7%) | 374 (13.2%) |
| 20 to 24 Minutes | 75 (1.8%) | 126 (4.4%) |
| 25 to 29 Minutes | 120 (2.9%) | 74 (2.6%) |
| 30 to 34 Minutes | 348 (8.3%) | 97 (3.4%) |
| 35 to 39 Minutes | 132 (3.2%) | 88 (3.1%) |
| 40 to 44 Minutes | 33 (0.8%) | 96 (3.4%) |
| 45 to 59 Minutes | 365 (8.7%) | 251 (8.8%) |
| 60 to 89 Minutes | 699 (16.7%) | 191 (6.7%) |
| 90 or more Minutes | 564 (13.4%) | 141 (5.0%) |
Time of Departure to Work by Sex in Lee County
The most frequent times of departure to work in Lee County are 7:00 AM to 7:29 AM (624, 14.9%) for males and 7:00 AM to 7:29 AM (671, 23.6%) for females.
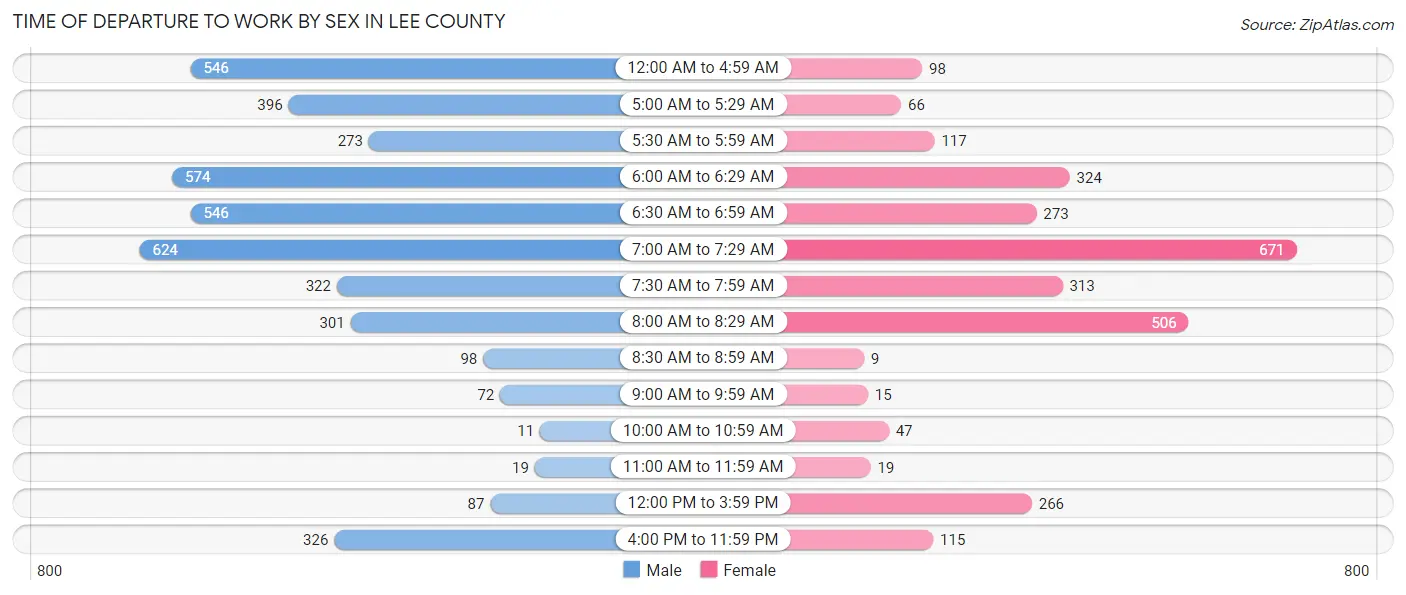
| Time of Departure | Male | Female |
| 12:00 AM to 4:59 AM | 546 (13.0%) | 98 (3.5%) |
| 5:00 AM to 5:29 AM | 396 (9.4%) | 66 (2.3%) |
| 5:30 AM to 5:59 AM | 273 (6.5%) | 117 (4.1%) |
| 6:00 AM to 6:29 AM | 574 (13.7%) | 324 (11.4%) |
| 6:30 AM to 6:59 AM | 546 (13.0%) | 273 (9.6%) |
| 7:00 AM to 7:29 AM | 624 (14.9%) | 671 (23.6%) |
| 7:30 AM to 7:59 AM | 322 (7.7%) | 313 (11.0%) |
| 8:00 AM to 8:29 AM | 301 (7.2%) | 506 (17.8%) |
| 8:30 AM to 8:59 AM | 98 (2.3%) | 9 (0.3%) |
| 9:00 AM to 9:59 AM | 72 (1.7%) | 15 (0.5%) |
| 10:00 AM to 10:59 AM | 11 (0.3%) | 47 (1.7%) |
| 11:00 AM to 11:59 AM | 19 (0.4%) | 19 (0.7%) |
| 12:00 PM to 3:59 PM | 87 (2.1%) | 266 (9.4%) |
| 4:00 PM to 11:59 PM | 326 (7.8%) | 115 (4.1%) |
| Total | 4,195 (100.0%) | 2,839 (100.0%) |
Housing Occupancy in Lee County
Occupancy by Ownership in Lee County
Of the total 6,313 dwellings in Lee County, owner-occupied units account for 4,930 (78.1%), while renter-occupied units make up 1,383 (21.9%).
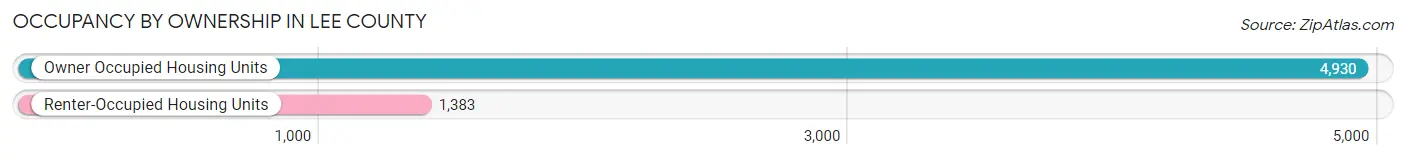
| Occupancy | # Housing Units | % Housing Units |
| Owner Occupied Housing Units | 4,930 | 78.1% |
| Renter-Occupied Housing Units | 1,383 | 21.9% |
| Total Occupied Housing Units | 6,313 | 100.0% |
Occupancy by Household Size in Lee County
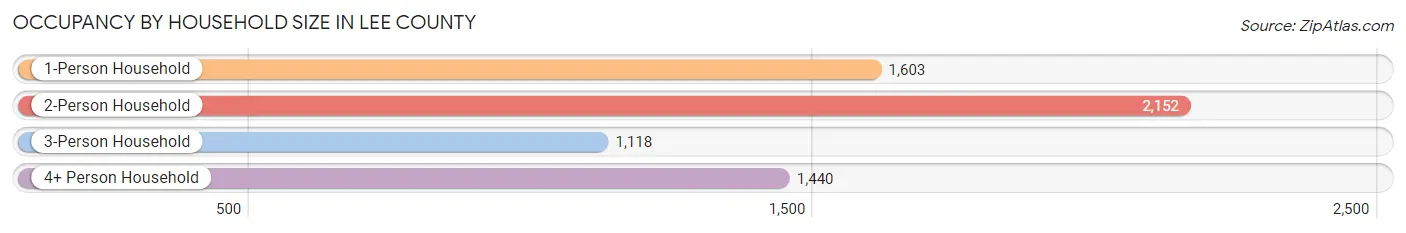
| Household Size | # Housing Units | % Housing Units |
| 1-Person Household | 1,603 | 25.4% |
| 2-Person Household | 2,152 | 34.1% |
| 3-Person Household | 1,118 | 17.7% |
| 4+ Person Household | 1,440 | 22.8% |
| Total Housing Units | 6,313 | 100.0% |
Occupancy by Ownership by Household Size in Lee County
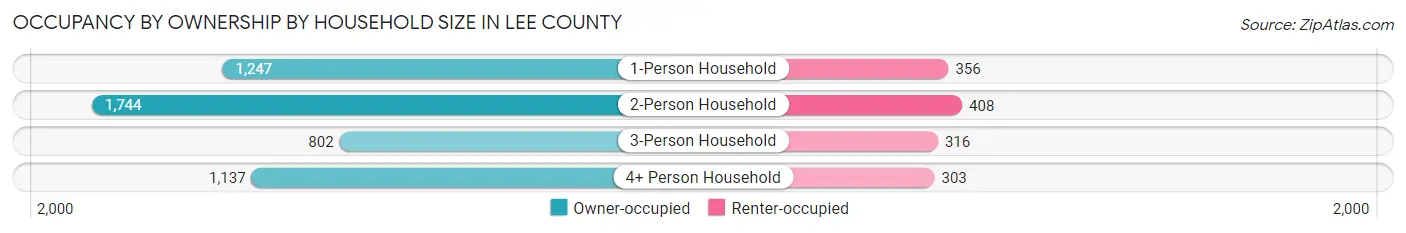
| Household Size | Owner-occupied | Renter-occupied |
| 1-Person Household | 1,247 (77.8%) | 356 (22.2%) |
| 2-Person Household | 1,744 (81.0%) | 408 (19.0%) |
| 3-Person Household | 802 (71.7%) | 316 (28.3%) |
| 4+ Person Household | 1,137 (79.0%) | 303 (21.0%) |
| Total Housing Units | 4,930 (78.1%) | 1,383 (21.9%) |
Occupancy by Educational Attainment in Lee County
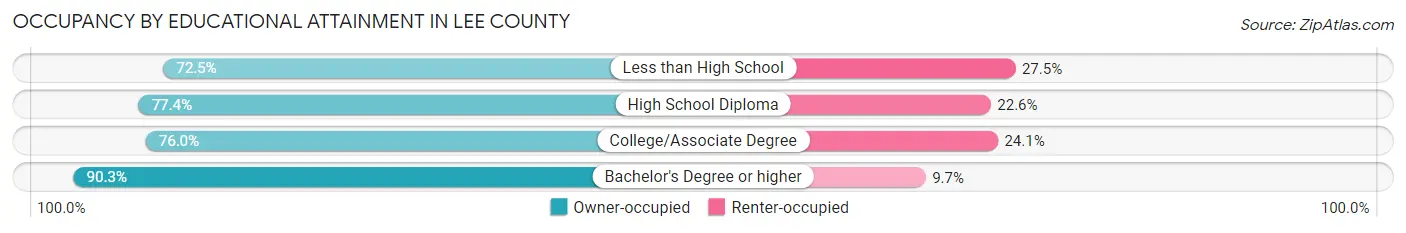
| Household Size | Owner-occupied | Renter-occupied |
| Less than High School | 732 (72.5%) | 278 (27.5%) |
| High School Diploma | 1,661 (77.4%) | 486 (22.6%) |
| College/Associate Degree | 1,655 (75.9%) | 524 (24.0%) |
| Bachelor's Degree or higher | 882 (90.3%) | 95 (9.7%) |
Occupancy by Age of Householder in Lee County
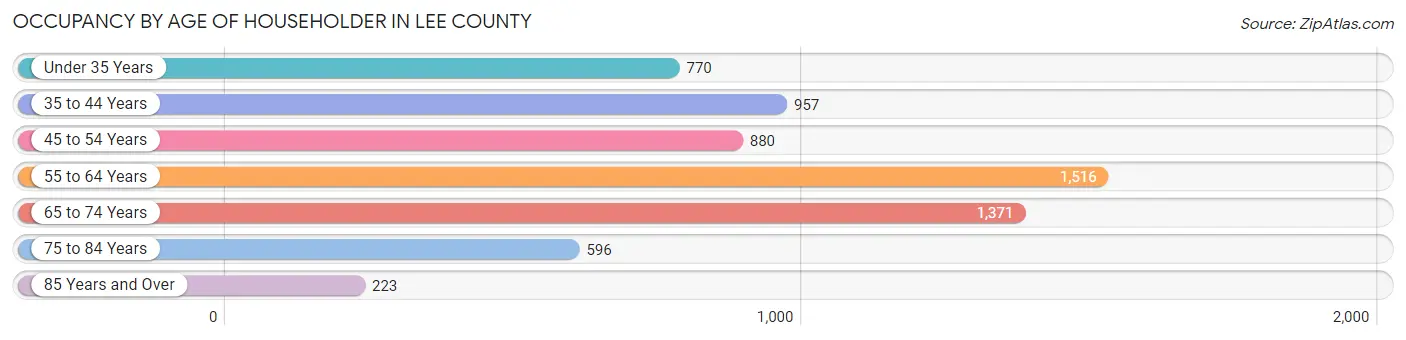
| Age Bracket | # Households | % Households |
| Under 35 Years | 770 | 12.2% |
| 35 to 44 Years | 957 | 15.2% |
| 45 to 54 Years | 880 | 13.9% |
| 55 to 64 Years | 1,516 | 24.0% |
| 65 to 74 Years | 1,371 | 21.7% |
| 75 to 84 Years | 596 | 9.4% |
| 85 Years and Over | 223 | 3.5% |
| Total | 6,313 | 100.0% |
Housing Finances in Lee County
Median Income by Occupancy in Lee County
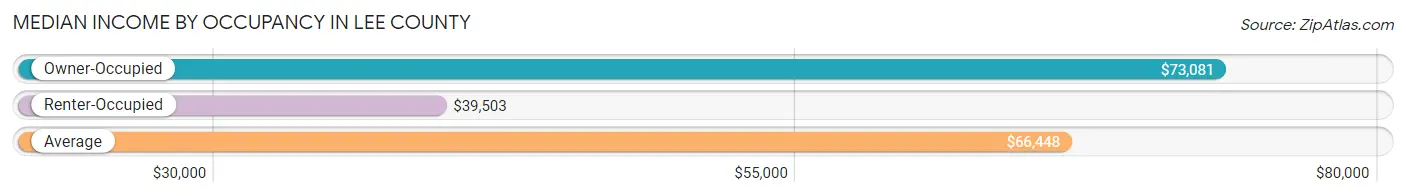
| Occupancy Type | # Households | Median Income |
| Owner-Occupied | 4,930 (78.1%) | $73,081 |
| Renter-Occupied | 1,383 (21.9%) | $39,503 |
| Average | 6,313 (100.0%) | $66,448 |
Occupancy by Householder Income Bracket in Lee County
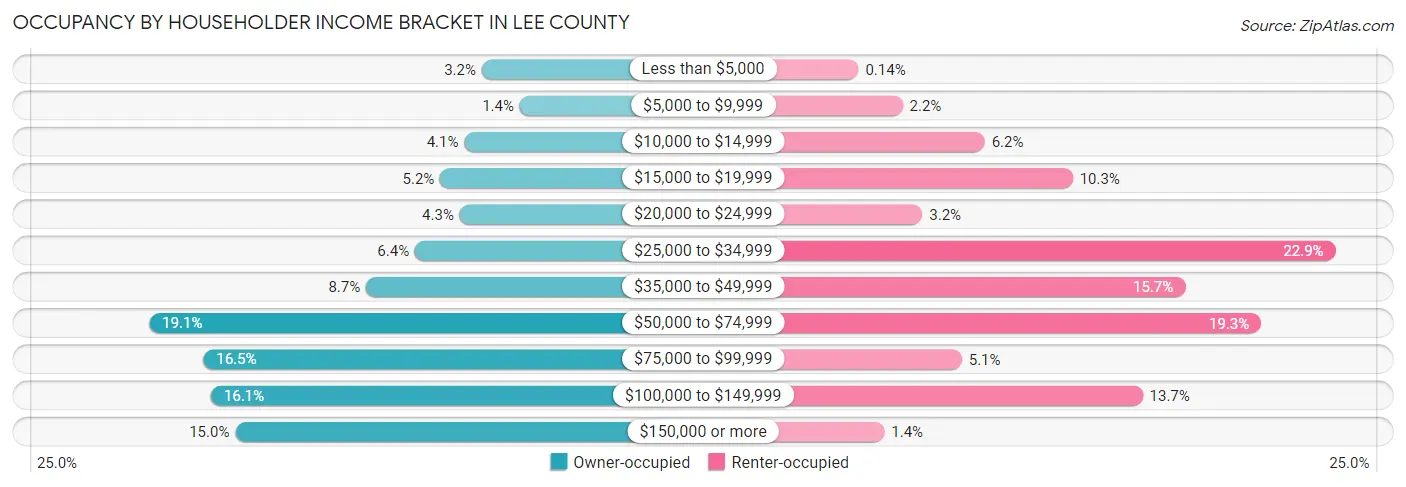
| Income Bracket | Owner-occupied | Renter-occupied |
| Less than $5,000 | 159 (3.2%) | 2 (0.1%) |
| $5,000 to $9,999 | 70 (1.4%) | 31 (2.2%) |
| $10,000 to $14,999 | 200 (4.1%) | 85 (6.1%) |
| $15,000 to $19,999 | 257 (5.2%) | 143 (10.3%) |
| $20,000 to $24,999 | 211 (4.3%) | 44 (3.2%) |
| $25,000 to $34,999 | 316 (6.4%) | 316 (22.9%) |
| $35,000 to $49,999 | 431 (8.7%) | 217 (15.7%) |
| $50,000 to $74,999 | 940 (19.1%) | 267 (19.3%) |
| $75,000 to $99,999 | 813 (16.5%) | 70 (5.1%) |
| $100,000 to $149,999 | 795 (16.1%) | 189 (13.7%) |
| $150,000 or more | 738 (15.0%) | 19 (1.4%) |
| Total | 4,930 (100.0%) | 1,383 (100.0%) |
Monthly Housing Cost Tiers in Lee County
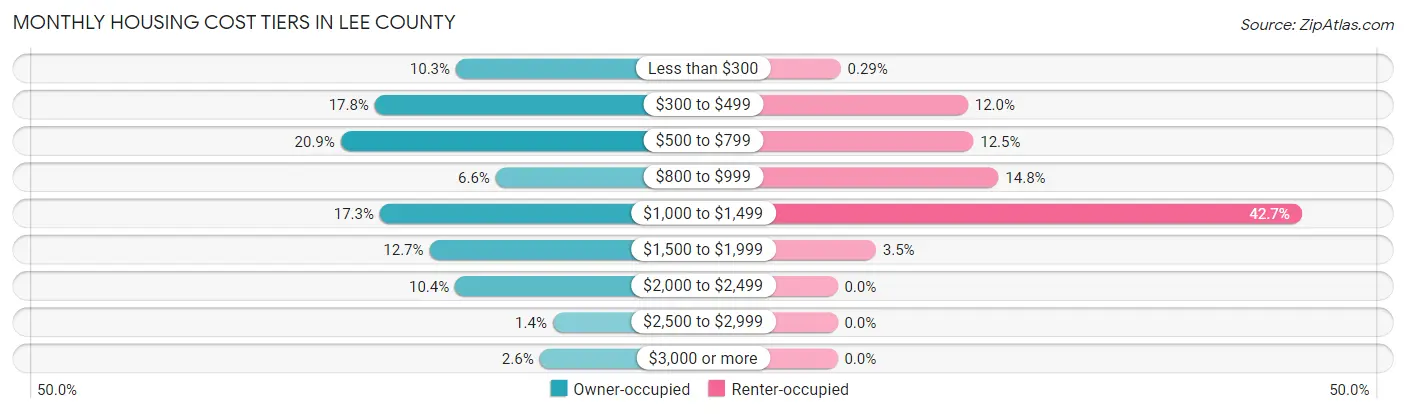
| Monthly Cost | Owner-occupied | Renter-occupied |
| Less than $300 | 508 (10.3%) | 4 (0.3%) |
| $300 to $499 | 876 (17.8%) | 166 (12.0%) |
| $500 to $799 | 1,031 (20.9%) | 173 (12.5%) |
| $800 to $999 | 327 (6.6%) | 205 (14.8%) |
| $1,000 to $1,499 | 853 (17.3%) | 591 (42.7%) |
| $1,500 to $1,999 | 628 (12.7%) | 49 (3.5%) |
| $2,000 to $2,499 | 511 (10.4%) | 0 (0.0%) |
| $2,500 to $2,999 | 68 (1.4%) | 0 (0.0%) |
| $3,000 or more | 128 (2.6%) | 0 (0.0%) |
| Total | 4,930 (100.0%) | 1,383 (100.0%) |
Physical Housing Characteristics in Lee County
Housing Structures in Lee County
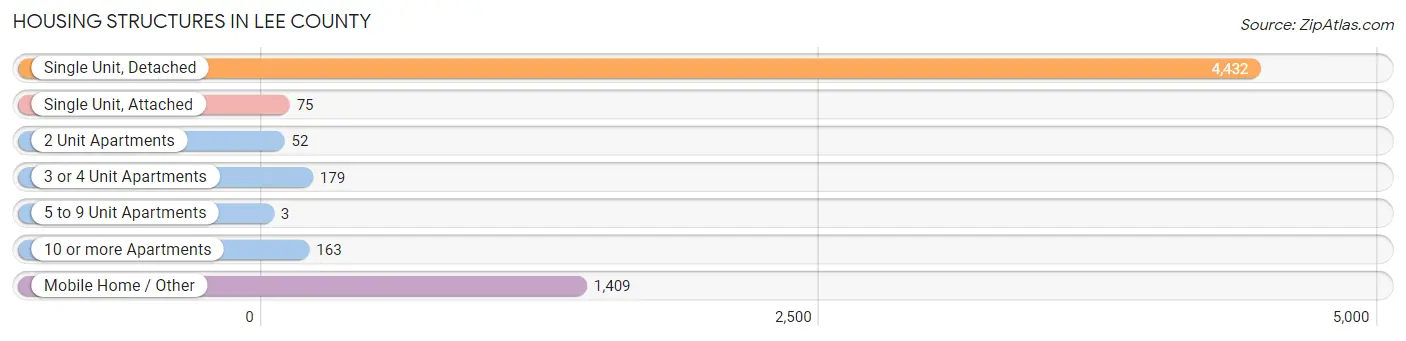
| Structure Type | # Housing Units | % Housing Units |
| Single Unit, Detached | 4,432 | 70.2% |
| Single Unit, Attached | 75 | 1.2% |
| 2 Unit Apartments | 52 | 0.8% |
| 3 or 4 Unit Apartments | 179 | 2.8% |
| 5 to 9 Unit Apartments | 3 | 0.1% |
| 10 or more Apartments | 163 | 2.6% |
| Mobile Home / Other | 1,409 | 22.3% |
| Total | 6,313 | 100.0% |
Housing Structures by Occupancy in Lee County
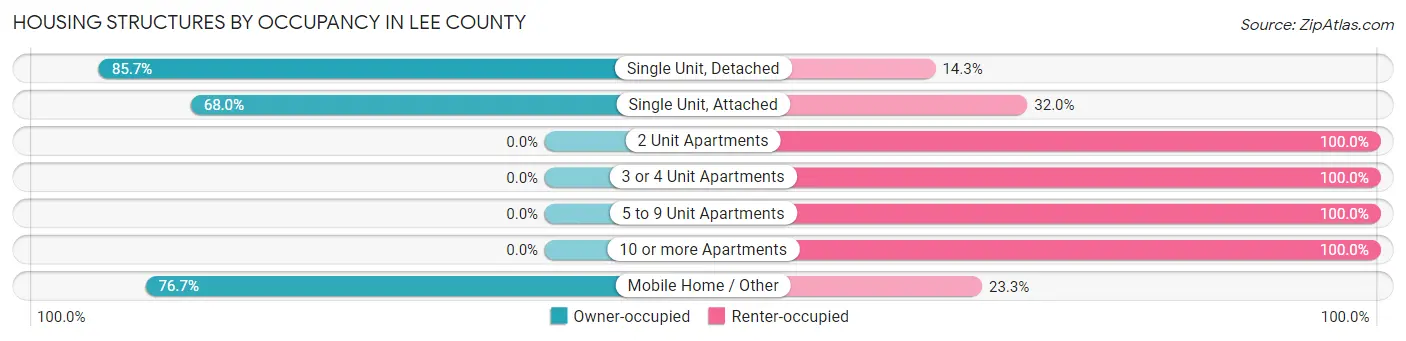
| Structure Type | Owner-occupied | Renter-occupied |
| Single Unit, Detached | 3,798 (85.7%) | 634 (14.3%) |
| Single Unit, Attached | 51 (68.0%) | 24 (32.0%) |
| 2 Unit Apartments | 0 (0.0%) | 52 (100.0%) |
| 3 or 4 Unit Apartments | 0 (0.0%) | 179 (100.0%) |
| 5 to 9 Unit Apartments | 0 (0.0%) | 3 (100.0%) |
| 10 or more Apartments | 0 (0.0%) | 163 (100.0%) |
| Mobile Home / Other | 1,081 (76.7%) | 328 (23.3%) |
| Total | 4,930 (78.1%) | 1,383 (21.9%) |
Housing Structures by Number of Rooms in Lee County
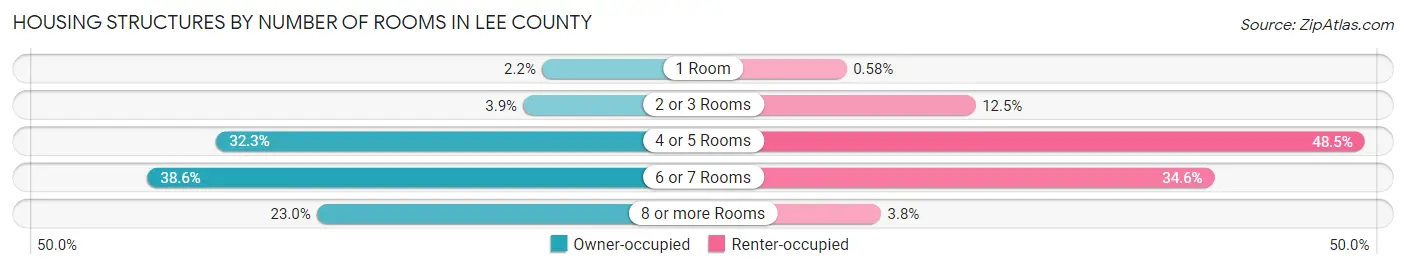
| Number of Rooms | Owner-occupied | Renter-occupied |
| 1 Room | 107 (2.2%) | 8 (0.6%) |
| 2 or 3 Rooms | 193 (3.9%) | 173 (12.5%) |
| 4 or 5 Rooms | 1,591 (32.3%) | 671 (48.5%) |
| 6 or 7 Rooms | 1,905 (38.6%) | 479 (34.6%) |
| 8 or more Rooms | 1,134 (23.0%) | 52 (3.8%) |
| Total | 4,930 (100.0%) | 1,383 (100.0%) |
Housing Structure by Heating Type in Lee County
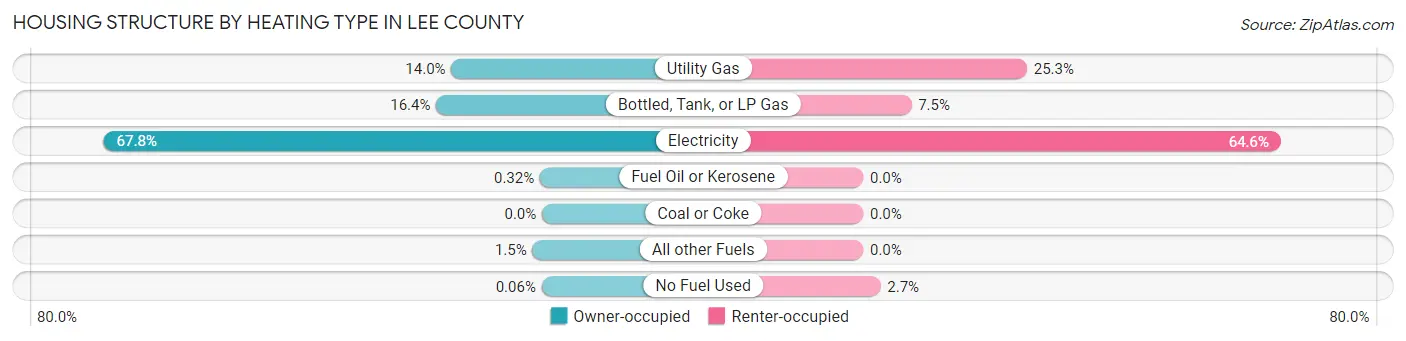
| Heating Type | Owner-occupied | Renter-occupied |
| Utility Gas | 691 (14.0%) | 350 (25.3%) |
| Bottled, Tank, or LP Gas | 806 (16.4%) | 103 (7.4%) |
| Electricity | 3,341 (67.8%) | 893 (64.6%) |
| Fuel Oil or Kerosene | 16 (0.3%) | 0 (0.0%) |
| Coal or Coke | 0 (0.0%) | 0 (0.0%) |
| All other Fuels | 73 (1.5%) | 0 (0.0%) |
| No Fuel Used | 3 (0.1%) | 37 (2.7%) |
| Total | 4,930 (100.0%) | 1,383 (100.0%) |
Household Vehicle Usage in Lee County
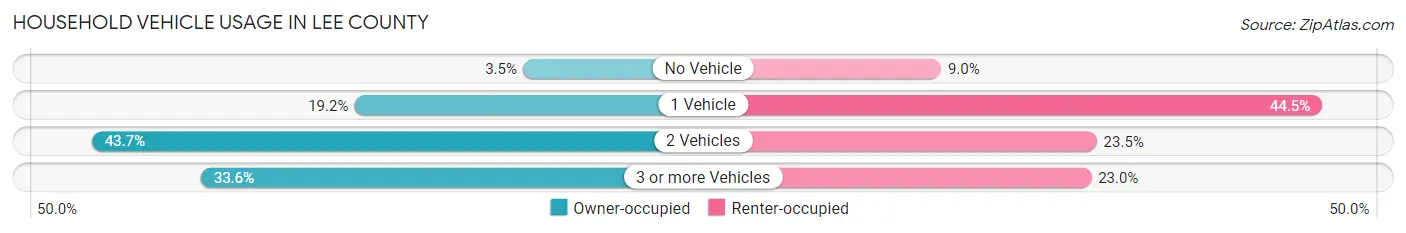
| Vehicles per Household | Owner-occupied | Renter-occupied |
| No Vehicle | 172 (3.5%) | 124 (9.0%) |
| 1 Vehicle | 948 (19.2%) | 616 (44.5%) |
| 2 Vehicles | 2,156 (43.7%) | 325 (23.5%) |
| 3 or more Vehicles | 1,654 (33.6%) | 318 (23.0%) |
| Total | 4,930 (100.0%) | 1,383 (100.0%) |
Real Estate & Mortgages in Lee County
Real Estate and Mortgage Overview in Lee County
| Characteristic | Without Mortgage | With Mortgage |
| Housing Units | 2,787 | 2,143 |
| Median Property Value | $143,800 | $262,100 |
| Median Household Income | $61,330 | $493 |
| Monthly Housing Costs | $503 | $120 |
| Real Estate Taxes | $1,489 | $18 |
Property Value by Mortgage Status in Lee County
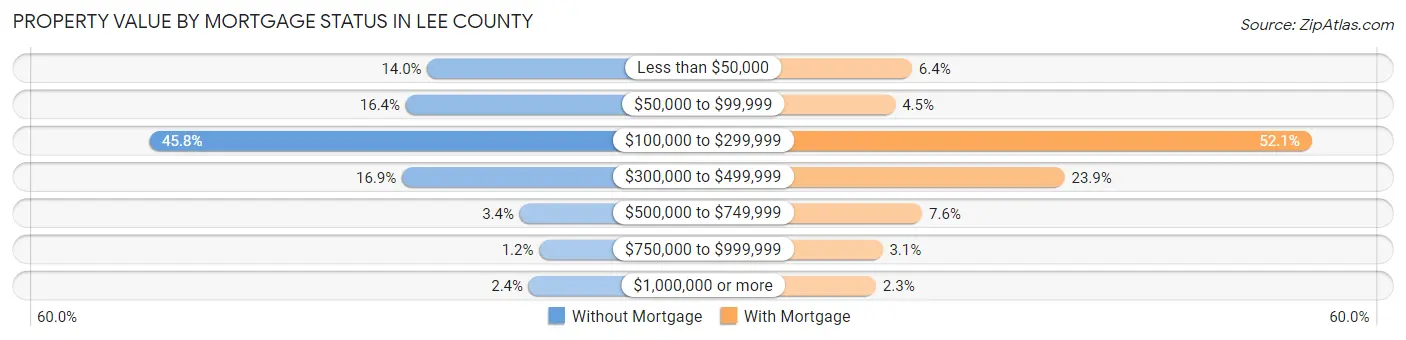
| Property Value | Without Mortgage | With Mortgage |
| Less than $50,000 | 389 (14.0%) | 138 (6.4%) |
| $50,000 to $99,999 | 458 (16.4%) | 97 (4.5%) |
| $100,000 to $299,999 | 1,276 (45.8%) | 1,117 (52.1%) |
| $300,000 to $499,999 | 470 (16.9%) | 512 (23.9%) |
| $500,000 to $749,999 | 95 (3.4%) | 163 (7.6%) |
| $750,000 to $999,999 | 33 (1.2%) | 66 (3.1%) |
| $1,000,000 or more | 66 (2.4%) | 50 (2.3%) |
| Total | 2,787 (100.0%) | 2,143 (100.0%) |
Household Income by Mortgage Status in Lee County
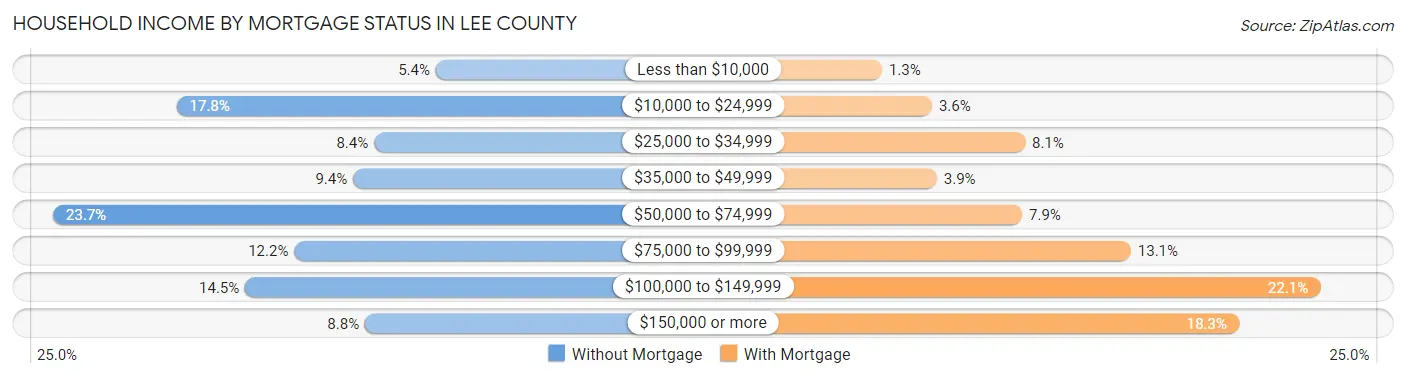
| Household Income | Without Mortgage | With Mortgage |
| Less than $10,000 | 151 (5.4%) | 27 (1.3%) |
| $10,000 to $24,999 | 495 (17.8%) | 78 (3.6%) |
| $25,000 to $34,999 | 233 (8.4%) | 173 (8.1%) |
| $35,000 to $49,999 | 261 (9.4%) | 83 (3.9%) |
| $50,000 to $74,999 | 659 (23.6%) | 170 (7.9%) |
| $75,000 to $99,999 | 339 (12.2%) | 281 (13.1%) |
| $100,000 to $149,999 | 404 (14.5%) | 474 (22.1%) |
| $150,000 or more | 245 (8.8%) | 391 (18.2%) |
| Total | 2,787 (100.0%) | 2,143 (100.0%) |
Property Value to Household Income Ratio in Lee County
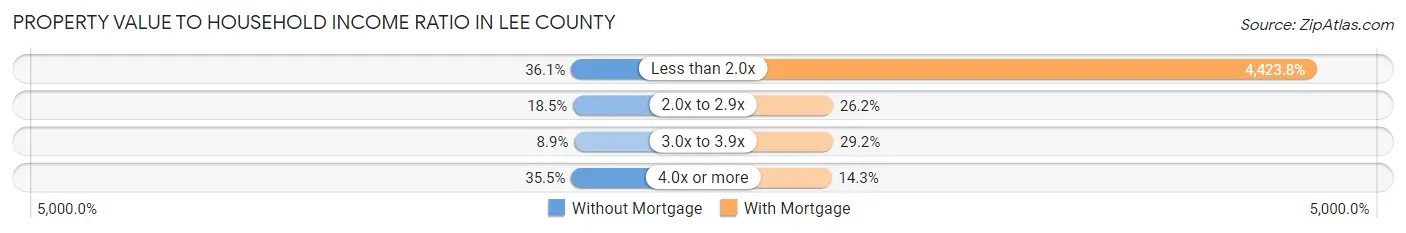
| Value-to-Income Ratio | Without Mortgage | With Mortgage |
| Less than 2.0x | 1,007 (36.1%) | 94,801 (4,423.7%) |
| 2.0x to 2.9x | 516 (18.5%) | 562 (26.2%) |
| 3.0x to 3.9x | 249 (8.9%) | 625 (29.2%) |
| 4.0x or more | 988 (35.4%) | 306 (14.3%) |
| Total | 2,787 (100.0%) | 2,143 (100.0%) |
Real Estate Taxes by Mortgage Status in Lee County
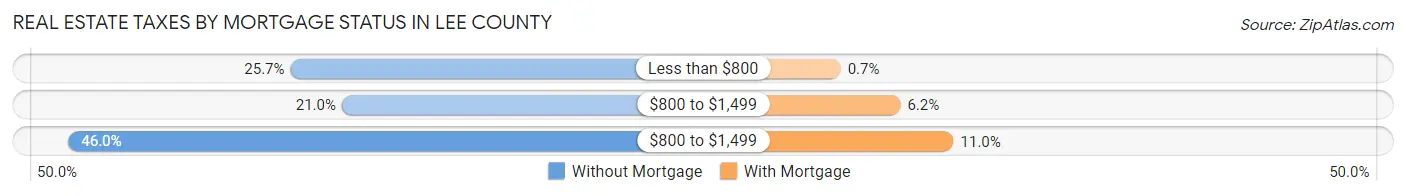
| Property Taxes | Without Mortgage | With Mortgage |
| Less than $800 | 717 (25.7%) | 15 (0.7%) |
| $800 to $1,499 | 586 (21.0%) | 132 (6.2%) |
| $800 to $1,499 | 1,282 (46.0%) | 236 (11.0%) |
| Total | 2,787 (100.0%) | 2,143 (100.0%) |
Health & Disability in Lee County
Health Insurance Coverage by Age in Lee County
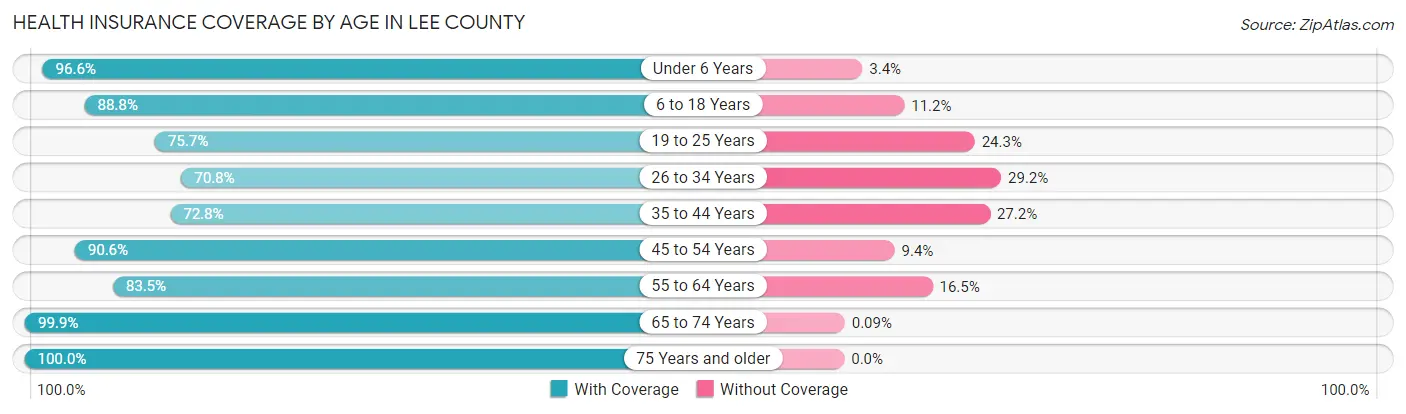
| Age Bracket | With Coverage | Without Coverage |
| Under 6 Years | 1,174 (96.6%) | 41 (3.4%) |
| 6 to 18 Years | 2,269 (88.8%) | 286 (11.2%) |
| 19 to 25 Years | 1,120 (75.7%) | 360 (24.3%) |
| 26 to 34 Years | 1,048 (70.8%) | 433 (29.2%) |
| 35 to 44 Years | 1,689 (72.8%) | 630 (27.2%) |
| 45 to 54 Years | 1,885 (90.6%) | 195 (9.4%) |
| 55 to 64 Years | 2,111 (83.5%) | 416 (16.5%) |
| 65 to 74 Years | 2,151 (99.9%) | 2 (0.1%) |
| 75 Years and older | 1,342 (100.0%) | 0 (0.0%) |
| Total | 14,789 (86.2%) | 2,363 (13.8%) |
Health Insurance Coverage by Citizenship Status in Lee County
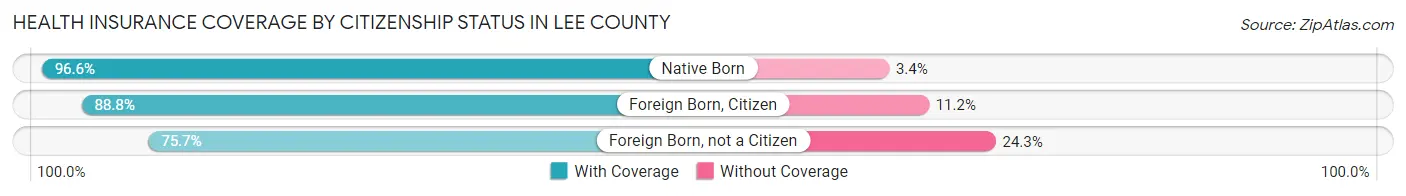
| Citizenship Status | With Coverage | Without Coverage |
| Native Born | 1,174 (96.6%) | 41 (3.4%) |
| Foreign Born, Citizen | 2,269 (88.8%) | 286 (11.2%) |
| Foreign Born, not a Citizen | 1,120 (75.7%) | 360 (24.3%) |
Health Insurance Coverage by Household Income in Lee County
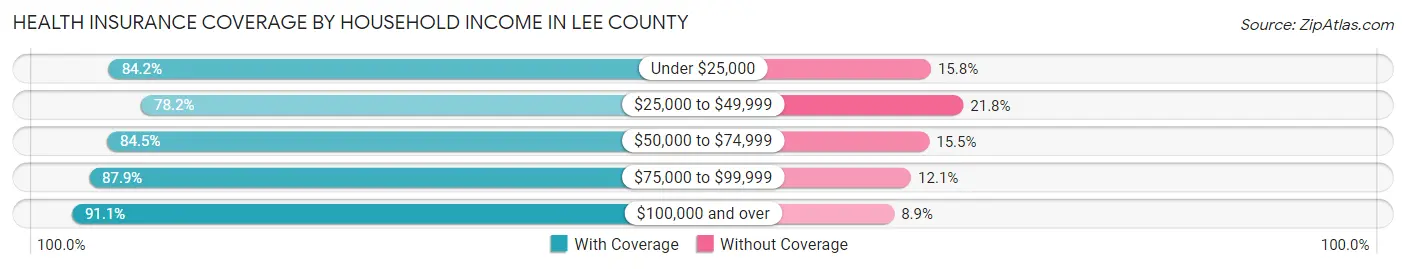
| Household Income | With Coverage | Without Coverage |
| Under $25,000 | 1,832 (84.2%) | 343 (15.8%) |
| $25,000 to $49,999 | 2,570 (78.2%) | 718 (21.8%) |
| $50,000 to $74,999 | 2,264 (84.5%) | 414 (15.5%) |
| $75,000 to $99,999 | 2,530 (87.9%) | 347 (12.1%) |
| $100,000 and over | 5,550 (91.1%) | 541 (8.9%) |
Public vs Private Health Insurance Coverage by Age in Lee County
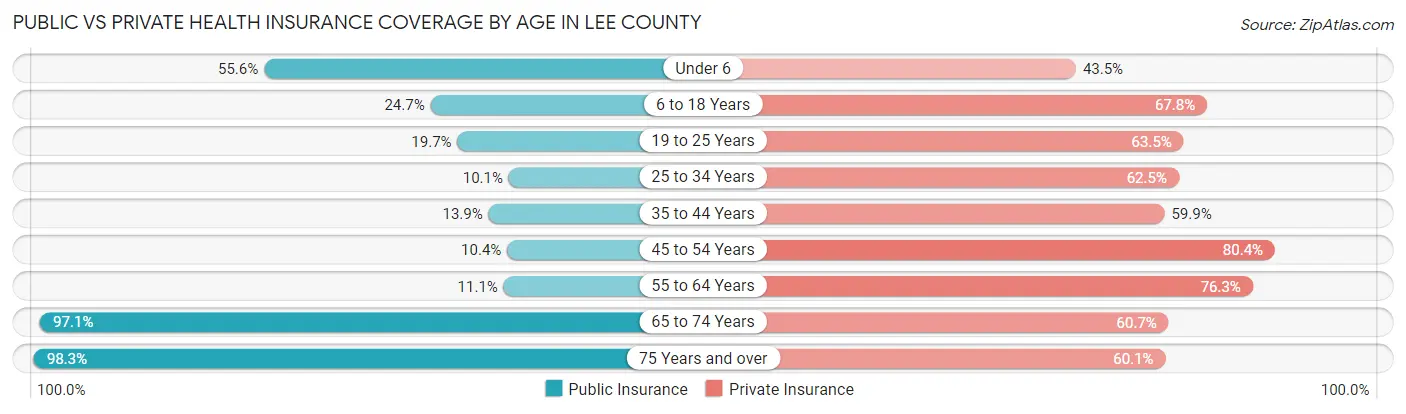
| Age Bracket | Public Insurance | Private Insurance |
| Under 6 | 675 (55.6%) | 528 (43.5%) |
| 6 to 18 Years | 630 (24.7%) | 1,732 (67.8%) |
| 19 to 25 Years | 291 (19.7%) | 939 (63.4%) |
| 25 to 34 Years | 150 (10.1%) | 926 (62.5%) |
| 35 to 44 Years | 322 (13.9%) | 1,389 (59.9%) |
| 45 to 54 Years | 217 (10.4%) | 1,672 (80.4%) |
| 55 to 64 Years | 280 (11.1%) | 1,927 (76.3%) |
| 65 to 74 Years | 2,091 (97.1%) | 1,306 (60.7%) |
| 75 Years and over | 1,319 (98.3%) | 806 (60.1%) |
| Total | 5,975 (34.8%) | 11,225 (65.4%) |
Disability Status by Sex by Age in Lee County
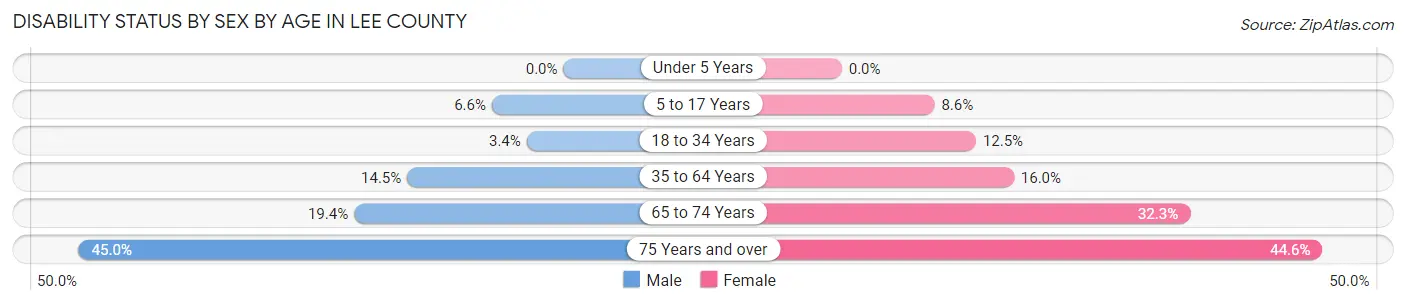
| Age Bracket | Male | Female |
| Under 5 Years | 0 (0.0%) | 0 (0.0%) |
| 5 to 17 Years | 78 (6.6%) | 114 (8.6%) |
| 18 to 34 Years | 49 (3.4%) | 211 (12.4%) |
| 35 to 64 Years | 534 (14.5%) | 518 (16.0%) |
| 65 to 74 Years | 197 (19.4%) | 368 (32.3%) |
| 75 Years and over | 300 (45.0%) | 301 (44.6%) |
Disability Class by Sex by Age in Lee County
Disability Class: Hearing Difficulty
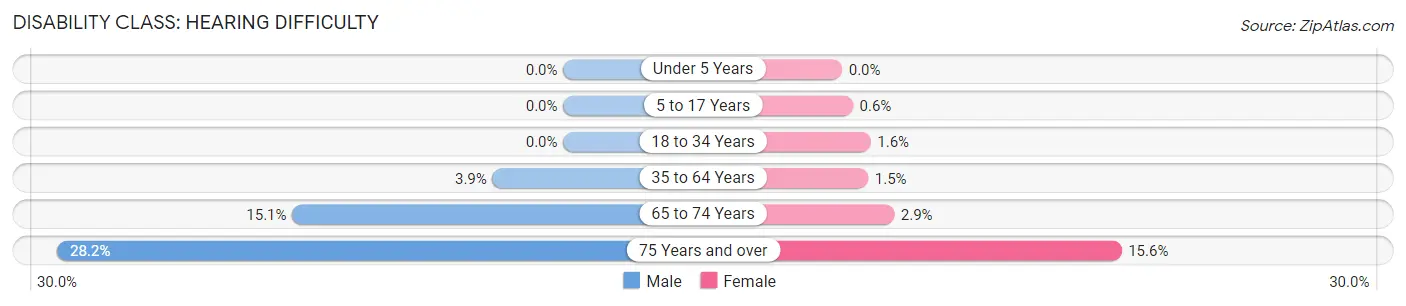
| Age Bracket | Male | Female |
| Under 5 Years | 0 (0.0%) | 0 (0.0%) |
| 5 to 17 Years | 0 (0.0%) | 8 (0.6%) |
| 18 to 34 Years | 0 (0.0%) | 27 (1.6%) |
| 35 to 64 Years | 145 (3.9%) | 47 (1.5%) |
| 65 to 74 Years | 153 (15.1%) | 33 (2.9%) |
| 75 Years and over | 188 (28.2%) | 105 (15.6%) |
Disability Class: Vision Difficulty
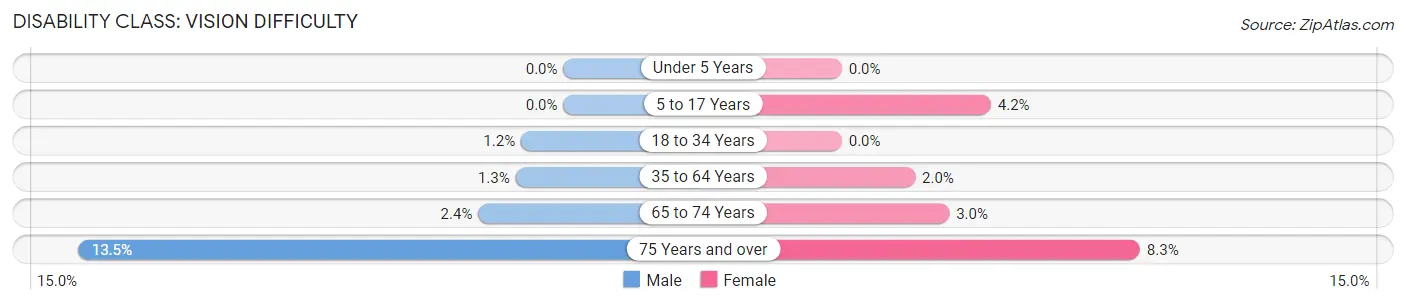
| Age Bracket | Male | Female |
| Under 5 Years | 0 (0.0%) | 0 (0.0%) |
| 5 to 17 Years | 0 (0.0%) | 55 (4.2%) |
| 18 to 34 Years | 17 (1.2%) | 0 (0.0%) |
| 35 to 64 Years | 49 (1.3%) | 66 (2.0%) |
| 65 to 74 Years | 24 (2.4%) | 34 (3.0%) |
| 75 Years and over | 90 (13.5%) | 56 (8.3%) |
Disability Class: Cognitive Difficulty
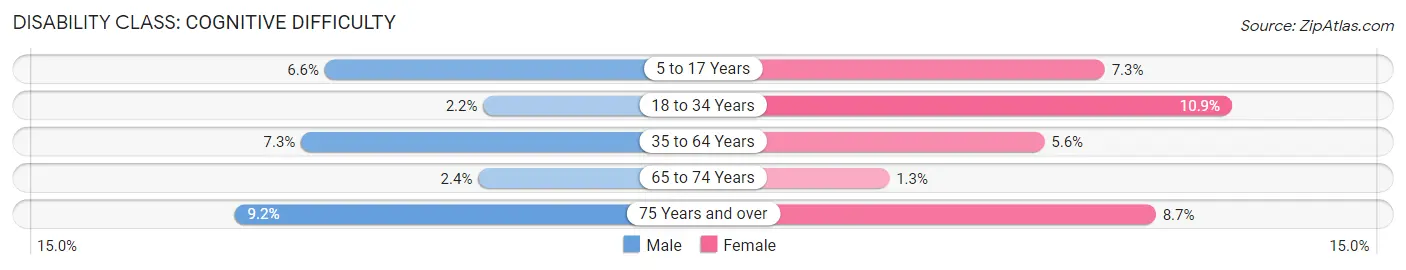
| Age Bracket | Male | Female |
| 5 to 17 Years | 78 (6.6%) | 97 (7.3%) |
| 18 to 34 Years | 32 (2.2%) | 184 (10.9%) |
| 35 to 64 Years | 269 (7.3%) | 183 (5.6%) |
| 65 to 74 Years | 24 (2.4%) | 15 (1.3%) |
| 75 Years and over | 61 (9.1%) | 59 (8.7%) |
Disability Class: Ambulatory Difficulty
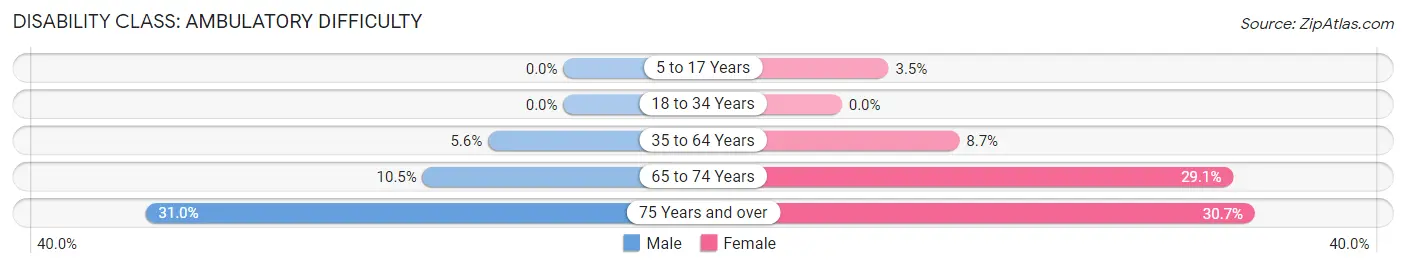
| Age Bracket | Male | Female |
| 5 to 17 Years | 0 (0.0%) | 46 (3.5%) |
| 18 to 34 Years | 0 (0.0%) | 0 (0.0%) |
| 35 to 64 Years | 206 (5.6%) | 283 (8.7%) |
| 65 to 74 Years | 106 (10.4%) | 331 (29.1%) |
| 75 Years and over | 207 (31.0%) | 207 (30.7%) |
Disability Class: Self-Care Difficulty
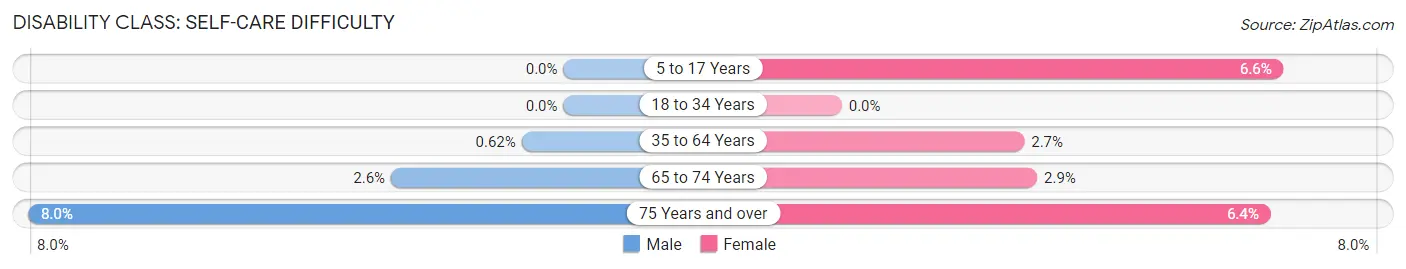
| Age Bracket | Male | Female |
| 5 to 17 Years | 0 (0.0%) | 87 (6.6%) |
| 18 to 34 Years | 0 (0.0%) | 0 (0.0%) |
| 35 to 64 Years | 23 (0.6%) | 88 (2.7%) |
| 65 to 74 Years | 26 (2.6%) | 33 (2.9%) |
| 75 Years and over | 53 (8.0%) | 43 (6.4%) |
Technology Access in Lee County
Computing Device Access in Lee County
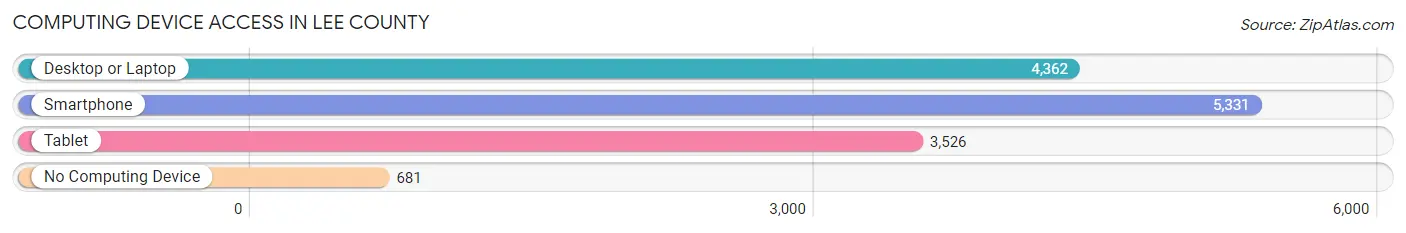
| Device Type | # Households | % Households |
| Desktop or Laptop | 4,362 | 69.1% |
| Smartphone | 5,331 | 84.4% |
| Tablet | 3,526 | 55.8% |
| No Computing Device | 681 | 10.8% |
| Total | 6,313 | 100.0% |
Internet Access in Lee County
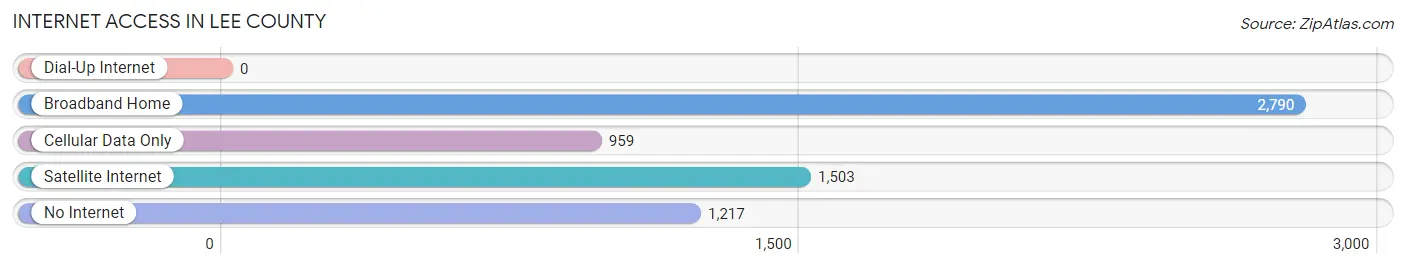
| Internet Type | # Households | % Households |
| Dial-Up Internet | 0 | 0.0% |
| Broadband Home | 2,790 | 44.2% |
| Cellular Data Only | 959 | 15.2% |
| Satellite Internet | 1,503 | 23.8% |
| No Internet | 1,217 | 19.3% |
| Total | 6,313 | 100.0% |
Lee County Summary
Lee County is located in the state of Texas, in the United States of America. It is part of the Central Texas region and is bordered by Bastrop, Williamson, Milam, and Fayette counties. The county seat is Giddings, and the largest city is Lexington. As of the 2010 census, the population of Lee County was 16,612.
Geography
Lee County is located in the southeastern part of Texas, and is part of the Central Texas region. It is bordered by Bastrop, Williamson, Milam, and Fayette counties. The county has a total area of 645 square miles, of which 644 square miles is land and 1 square mile is water. The terrain is mostly flat, with some rolling hills in the western part of the county. The highest point in the county is located in the northwest corner, at an elevation of 830 feet. The county is drained by the Colorado River, which forms its eastern boundary.
History
Lee County was established in 1874, and was named for Robert E. Lee, the Confederate general. The county was originally part of Bastrop County, but was later divided into its own county. The first settlers in the area were German immigrants, who began arriving in the 1840s. The county was largely agricultural, with cotton and corn being the main crops. The county seat was originally located in Dime Box, but was moved to Giddings in 1876.
Economy
Lee County has a diverse economy, with a mix of agriculture, manufacturing, and services. The county is home to several large employers, including the Giddings State School, the Giddings Machine Shop, and the Giddings-Lee County Hospital. Agriculture is still an important part of the economy, with cotton, corn, and hay being the main crops. The county also has a thriving tourism industry, with several popular attractions, including the Lee County Historical Museum and the Giddings Public Library.
Demographics
As of the 2010 census, the population of Lee County was 16,612. The population is spread out, with 49.3% male and 50.7% female. The median age is 38.7 years, and the median household income is $45,845. The racial makeup of the county is 79.2% White, 15.3% Hispanic or Latino, 2.7% African American, 0.7% Native American, 0.3% Asian, and 2.1% other.
Lee County is a rural county, with a population density of 26 people per square mile. The county is served by several school districts, including the Giddings Independent School District, the Lexington Independent School District, and the Dime Box Independent School District. The county is also home to several higher education institutions, including the University of Texas at Austin, Texas A&M University, and Texas State University.
Common Questions
What is Per Capita Income in Lee County?
Per Capita income in Lee County is $31,001.
What is the Median Family Income in Lee County?
Median Family Income in Lee County is $71,999.
What is the Median Household income in Lee County?
Median Household Income in Lee County is $66,448.
What is Income or Wage Gap in Lee County?
Income or Wage Gap in Lee County is 38.0%.
Women in Lee County earn 62.0 cents for every dollar earned by a man.
What is Family Income Deficit in Lee County?
Family Income Deficit in Lee County is $8,669.
Families that are below poverty line in Lee County earn $8,669 less on average than the poverty threshold level.
What is Inequality or Gini Index in Lee County?
Inequality or Gini Index in Lee County is 0.41.
What is the Total Population of Lee County?
Total Population of Lee County is 17,543.
What is the Total Male Population of Lee County?
Total Male Population of Lee County is 8,665.
What is the Total Female Population of Lee County?
Total Female Population of Lee County is 8,878.
What is the Ratio of Males per 100 Females in Lee County?
There are 97.60 Males per 100 Females in Lee County.
What is the Ratio of Females per 100 Males in Lee County?
There are 102.46 Females per 100 Males in Lee County.
What is the Median Population Age in Lee County?
Median Population Age in Lee County is 41.9 Years.
What is the Average Family Size in Lee County
Average Family Size in Lee County is 3.2 People.
What is the Average Household Size in Lee County
Average Household Size in Lee County is 2.7 People.
How Large is the Labor Force in Lee County?
There are 8,283 People in the Labor Forcein in Lee County.
What is the Percentage of People in the Labor Force in Lee County?
58.3% of People are in the Labor Force in Lee County.
What is the Unemployment Rate in Lee County?
Unemployment Rate in Lee County is 2.8%.