Lavaca County, TX Map & Demographics
Lavaca County Map
Lavaca County Overview
$34,591
PER CAPITA INCOME
$80,907
AVG FAMILY INCOME
$58,530
AVG HOUSEHOLD INCOME
30.7%
WAGE / INCOME GAP [ % ]
69.3¢/ $1
WAGE / INCOME GAP [ $ ]
$10,347
FAMILY INCOME DEFICIT
0.45
INEQUALITY / GINI INDEX
20,379
TOTAL POPULATION
10,068
MALE POPULATION
10,311
FEMALE POPULATION
97.64
MALES / 100 FEMALES
102.41
FEMALES / 100 MALES
43.4
MEDIAN AGE
3.0
AVG FAMILY SIZE
2.4
AVG HOUSEHOLD SIZE
9,661
LABOR FORCE [ PEOPLE ]
60.0%
PERCENT IN LABOR FORCE
3.0%
UNEMPLOYMENT RATE
Income in Lavaca County
Income Overview in Lavaca County
Per Capita Income in Lavaca County is $34,591, while median incomes of families and households are $80,907 and $58,530 respectively.
| Characteristic | Number | Measure |
| Per Capita Income | 20,379 | $34,591 |
| Median Family Income | 5,525 | $80,907 |
| Mean Family Income | 5,525 | $102,312 |
| Median Household Income | 8,206 | $58,530 |
| Mean Household Income | 8,206 | $83,239 |
| Income Deficit | 5,525 | $10,347 |
| Wage / Income Gap (%) | 20,379 | 30.72% |
| Wage / Income Gap ($) | 20,379 | 69.28¢ per $1 |
| Gini / Inequality Index | 20,379 | 0.45 |
Earnings by Sex in Lavaca County
Average Earnings in Lavaca County are $38,914, $45,895 for men and $31,797 for women, a difference of 30.7%.
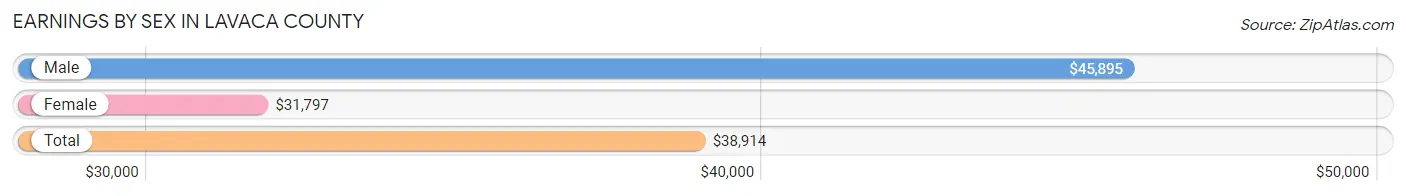
| Sex | Number | Average Earnings |
| Male | 5,319 (53.2%) | $45,895 |
| Female | 4,682 (46.8%) | $31,797 |
| Total | 10,001 (100.0%) | $38,914 |
Earnings by Sex by Income Bracket in Lavaca County
The most common earnings brackets in Lavaca County are $75,000 to $99,999 for men (715 | 13.4%) and $55,000 to $64,999 for women (454 | 9.7%).
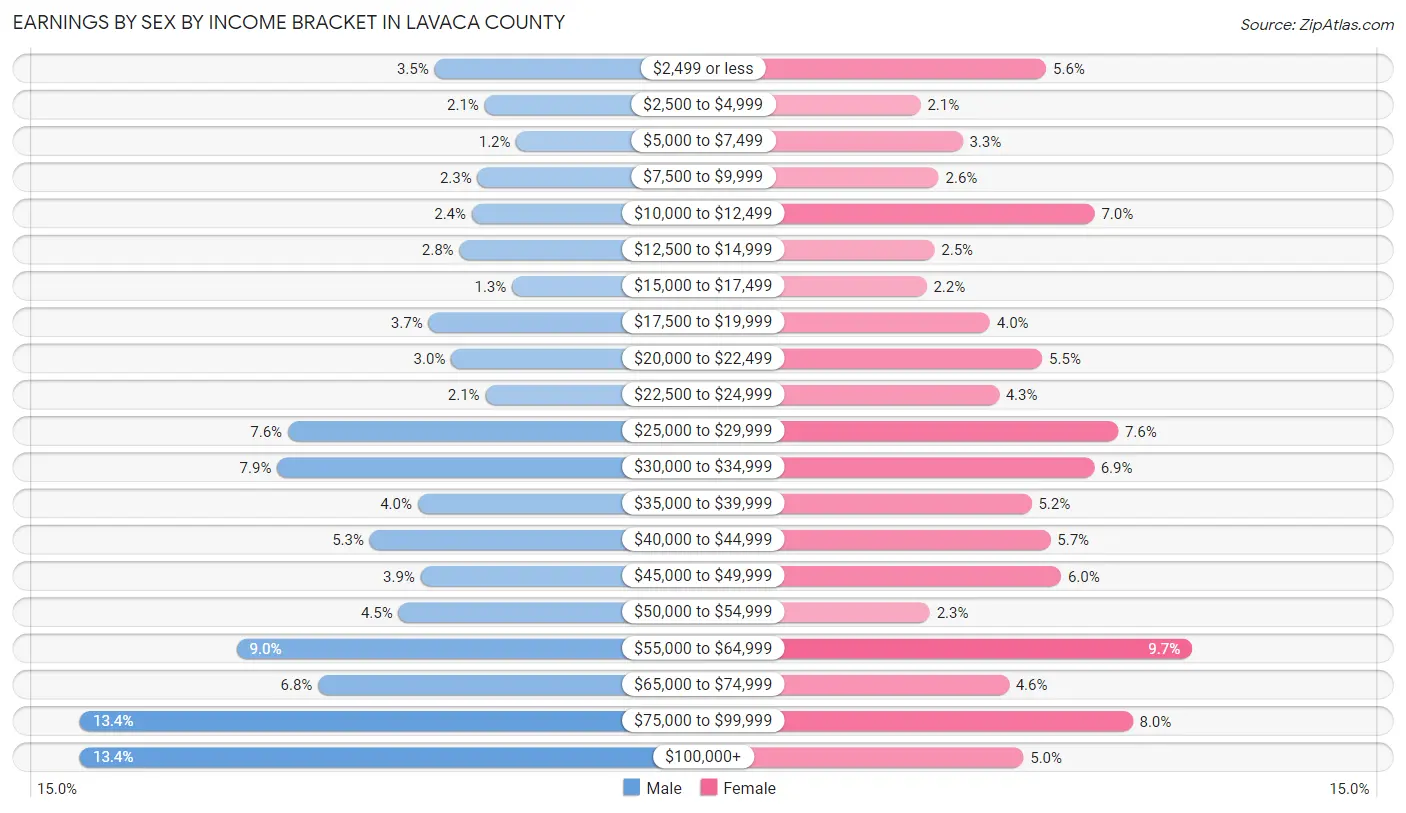
| Income | Male | Female |
| $2,499 or less | 185 (3.5%) | 262 (5.6%) |
| $2,500 to $4,999 | 110 (2.1%) | 97 (2.1%) |
| $5,000 to $7,499 | 63 (1.2%) | 152 (3.3%) |
| $7,500 to $9,999 | 121 (2.3%) | 121 (2.6%) |
| $10,000 to $12,499 | 129 (2.4%) | 326 (7.0%) |
| $12,500 to $14,999 | 148 (2.8%) | 115 (2.5%) |
| $15,000 to $17,499 | 69 (1.3%) | 105 (2.2%) |
| $17,500 to $19,999 | 194 (3.6%) | 188 (4.0%) |
| $20,000 to $22,499 | 160 (3.0%) | 257 (5.5%) |
| $22,500 to $24,999 | 109 (2.1%) | 200 (4.3%) |
| $25,000 to $29,999 | 404 (7.6%) | 357 (7.6%) |
| $30,000 to $34,999 | 420 (7.9%) | 325 (6.9%) |
| $35,000 to $39,999 | 210 (4.0%) | 243 (5.2%) |
| $40,000 to $44,999 | 282 (5.3%) | 268 (5.7%) |
| $45,000 to $49,999 | 206 (3.9%) | 282 (6.0%) |
| $50,000 to $54,999 | 239 (4.5%) | 109 (2.3%) |
| $55,000 to $64,999 | 481 (9.0%) | 454 (9.7%) |
| $65,000 to $74,999 | 359 (6.8%) | 213 (4.5%) |
| $75,000 to $99,999 | 715 (13.4%) | 376 (8.0%) |
| $100,000+ | 715 (13.4%) | 232 (5.0%) |
| Total | 5,319 (100.0%) | 4,682 (100.0%) |
Earnings by Sex by Educational Attainment in Lavaca County
Average earnings in Lavaca County are $52,321 for men and $37,416 for women, a difference of 28.5%. Men with an educational attainment of graduate degree enjoy the highest average annual earnings of $77,917, while those with less than high school education earn the least with $32,917. Women with an educational attainment of graduate degree earn the most with the average annual earnings of $67,500, while those with high school diploma education have the smallest earnings of $30,478.
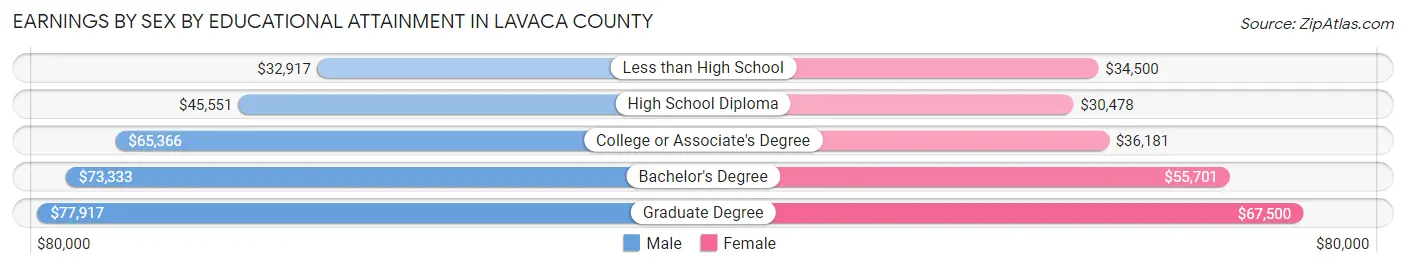
| Educational Attainment | Male Income | Female Income |
| Less than High School | $32,917 | $34,500 |
| High School Diploma | $45,551 | $30,478 |
| College or Associate's Degree | $65,366 | $36,181 |
| Bachelor's Degree | $73,333 | $55,701 |
| Graduate Degree | $77,917 | $67,500 |
| Total | $52,321 | $37,416 |
Family Income in Lavaca County
Family Income Brackets in Lavaca County
According to the Lavaca County family income data, there are 1,133 families falling into the $100,000 to $149,999 income range, which is the most common income bracket and makes up 20.5% of all families. Conversely, the $10,000 to $14,999 income bracket is the least frequent group with only 99 families (1.8%) belonging to this category.
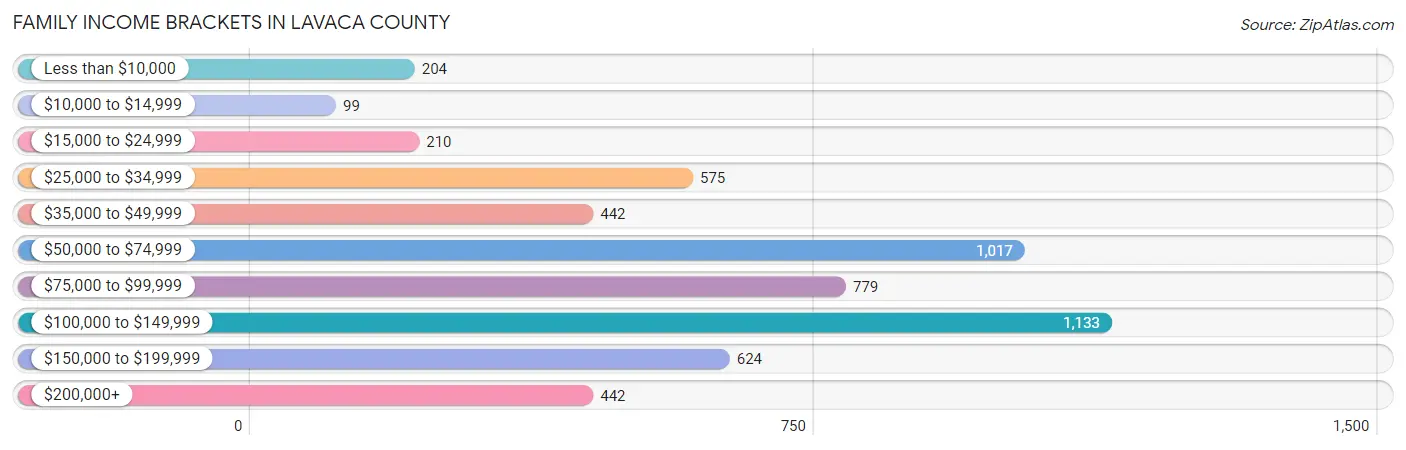
| Income Bracket | # Families | % Families |
| Less than $10,000 | 204 | 3.7% |
| $10,000 to $14,999 | 99 | 1.8% |
| $15,000 to $24,999 | 210 | 3.8% |
| $25,000 to $34,999 | 575 | 10.4% |
| $35,000 to $49,999 | 442 | 8.0% |
| $50,000 to $74,999 | 1,017 | 18.4% |
| $75,000 to $99,999 | 779 | 14.1% |
| $100,000 to $149,999 | 1,133 | 20.5% |
| $150,000 to $199,999 | 624 | 11.3% |
| $200,000+ | 442 | 8.0% |
Family Income by Famaliy Size in Lavaca County
6-person families (67 | 1.2%) account for the highest median family income in Lavaca County with $148,250 per family, while 2-person families (2,995 | 54.2%) have the highest median income of $36,424 per family member.
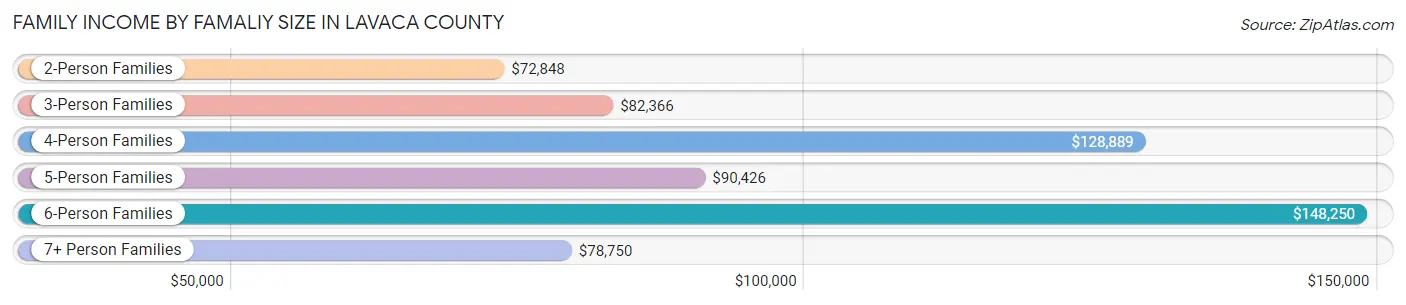
| Income Bracket | # Families | Median Income |
| 2-Person Families | 2,995 (54.2%) | $72,848 |
| 3-Person Families | 1,131 (20.5%) | $82,366 |
| 4-Person Families | 808 (14.6%) | $128,889 |
| 5-Person Families | 470 (8.5%) | $90,426 |
| 6-Person Families | 67 (1.2%) | $148,250 |
| 7+ Person Families | 54 (1.0%) | $78,750 |
| Total | 5,525 (100.0%) | $80,907 |
Family Income by Number of Earners in Lavaca County
The median family income in Lavaca County is $80,907, with families comprising 3+ earners (461) having the highest median family income of $150,221, while families with no earners (1,024) have the lowest median family income of $50,300, accounting for 8.3% and 18.5% of families, respectively.
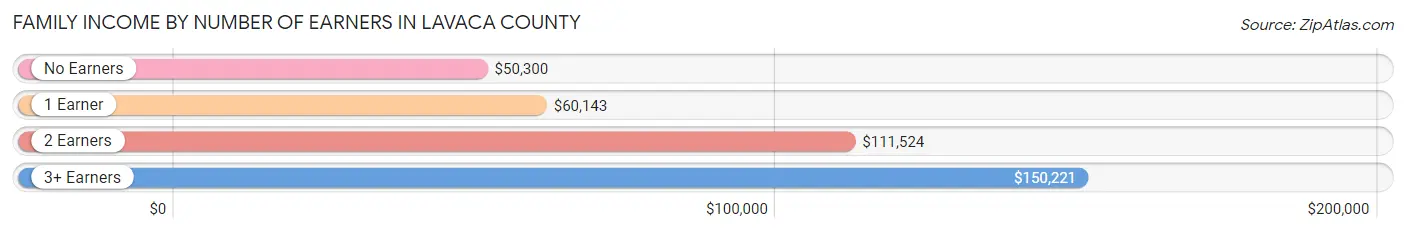
| Number of Earners | # Families | Median Income |
| No Earners | 1,024 (18.5%) | $50,300 |
| 1 Earner | 1,726 (31.2%) | $60,143 |
| 2 Earners | 2,314 (41.9%) | $111,524 |
| 3+ Earners | 461 (8.3%) | $150,221 |
| Total | 5,525 (100.0%) | $80,907 |
Household Income in Lavaca County
Household Income Brackets in Lavaca County
With 1,395 households falling in the category, the $50,000 to $74,999 income range is the most frequent in Lavaca County, accounting for 17.0% of all households. In contrast, only 304 households (3.7%) fall into the less than $10,000 income bracket, making it the least populous group.
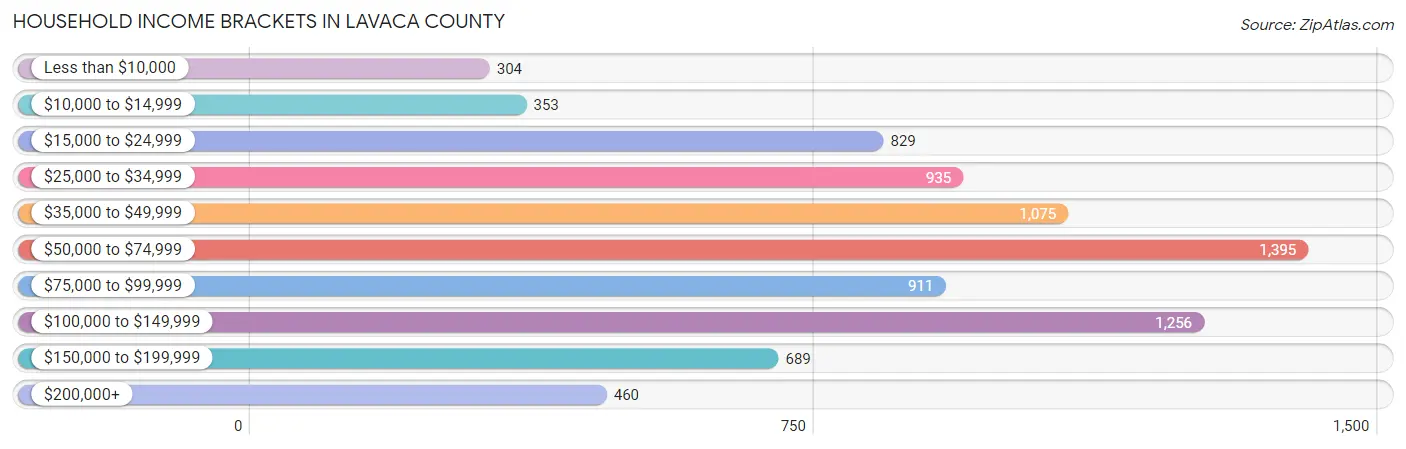
| Income Bracket | # Households | % Households |
| Less than $10,000 | 304 | 3.7% |
| $10,000 to $14,999 | 353 | 4.3% |
| $15,000 to $24,999 | 829 | 10.1% |
| $25,000 to $34,999 | 935 | 11.4% |
| $35,000 to $49,999 | 1,075 | 13.1% |
| $50,000 to $74,999 | 1,395 | 17.0% |
| $75,000 to $99,999 | 911 | 11.1% |
| $100,000 to $149,999 | 1,256 | 15.3% |
| $150,000 to $199,999 | 689 | 8.4% |
| $200,000+ | 460 | 5.6% |
Household Income by Householder Age in Lavaca County
The median household income in Lavaca County is $58,530, with the highest median household income of $81,250 found in the 45 to 64 years age bracket for the primary householder. A total of 2,716 households (33.1%) fall into this category. Meanwhile, the 65+ years age bracket for the primary householder has the lowest median household income of $42,024, with 2,944 households (35.9%) in this group.
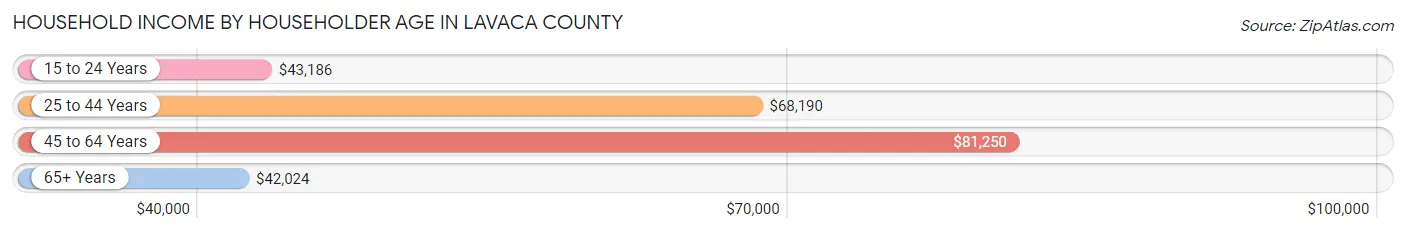
| Income Bracket | # Households | Median Income |
| 15 to 24 Years | 366 (4.5%) | $43,186 |
| 25 to 44 Years | 2,180 (26.6%) | $68,190 |
| 45 to 64 Years | 2,716 (33.1%) | $81,250 |
| 65+ Years | 2,944 (35.9%) | $42,024 |
| Total | 8,206 (100.0%) | $58,530 |
Poverty in Lavaca County
Income Below Poverty by Sex and Age in Lavaca County
With 9.9% poverty level for males and 10.5% for females among the residents of Lavaca County, under 5 year old males and under 5 year old females are the most vulnerable to poverty, with 208 males (32.5%) and 95 females (18.1%) in their respective age groups living below the poverty level.
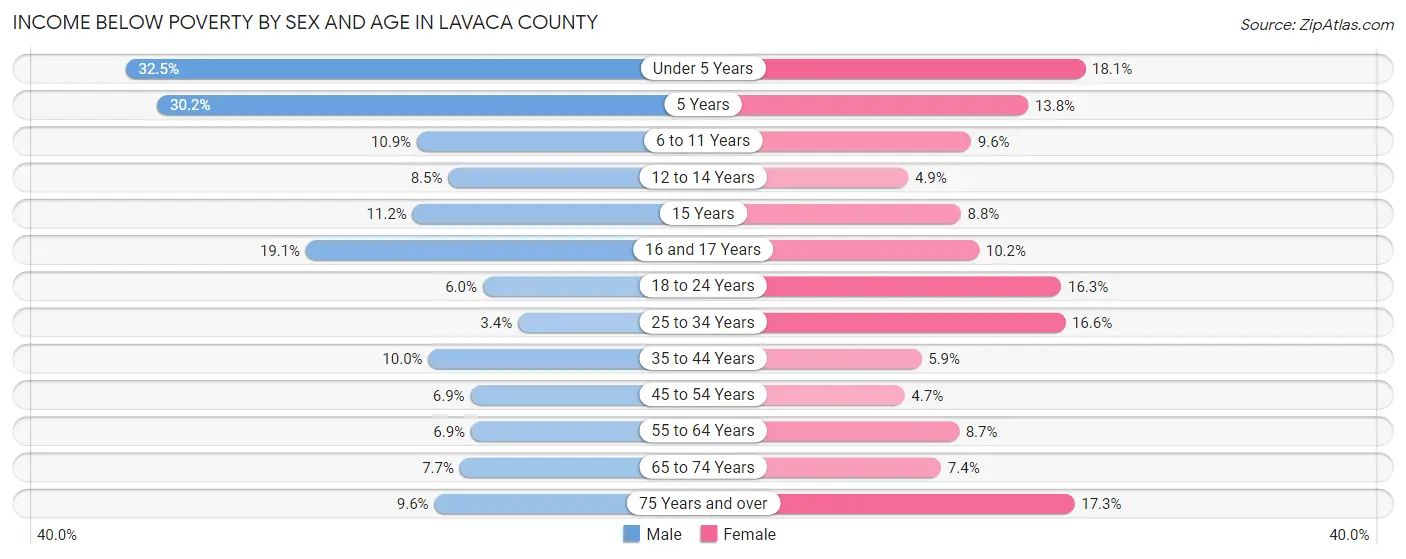
| Age Bracket | Male | Female |
| Under 5 Years | 208 (32.5%) | 95 (18.1%) |
| 5 Years | 38 (30.2%) | 21 (13.8%) |
| 6 to 11 Years | 92 (10.9%) | 71 (9.6%) |
| 12 to 14 Years | 38 (8.5%) | 21 (4.9%) |
| 15 Years | 16 (11.2%) | 15 (8.8%) |
| 16 and 17 Years | 56 (19.1%) | 24 (10.2%) |
| 18 to 24 Years | 44 (6.0%) | 127 (16.3%) |
| 25 to 34 Years | 35 (3.4%) | 165 (16.6%) |
| 35 to 44 Years | 121 (10.0%) | 64 (5.9%) |
| 45 to 54 Years | 70 (6.9%) | 52 (4.6%) |
| 55 to 64 Years | 94 (6.9%) | 115 (8.7%) |
| 65 to 74 Years | 94 (7.7%) | 103 (7.4%) |
| 75 Years and over | 76 (9.6%) | 180 (17.3%) |
| Total | 982 (9.9%) | 1,053 (10.5%) |
Income Above Poverty by Sex and Age in Lavaca County
According to the poverty statistics in Lavaca County, males aged 25 to 34 years and females aged 45 to 54 years are the age groups that are most secure financially, with 96.6% of males and 95.4% of females in these age groups living above the poverty line.
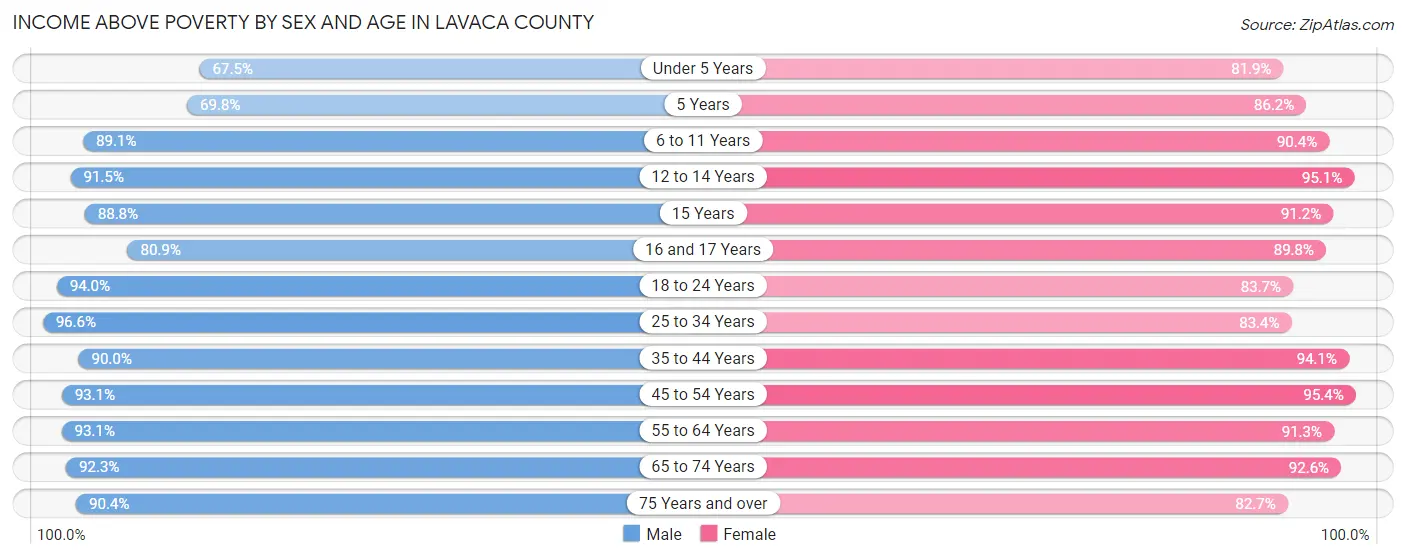
| Age Bracket | Male | Female |
| Under 5 Years | 432 (67.5%) | 431 (81.9%) |
| 5 Years | 88 (69.8%) | 131 (86.2%) |
| 6 to 11 Years | 754 (89.1%) | 670 (90.4%) |
| 12 to 14 Years | 407 (91.5%) | 406 (95.1%) |
| 15 Years | 127 (88.8%) | 155 (91.2%) |
| 16 and 17 Years | 237 (80.9%) | 212 (89.8%) |
| 18 to 24 Years | 692 (94.0%) | 653 (83.7%) |
| 25 to 34 Years | 1,004 (96.6%) | 831 (83.4%) |
| 35 to 44 Years | 1,086 (90.0%) | 1,020 (94.1%) |
| 45 to 54 Years | 945 (93.1%) | 1,067 (95.4%) |
| 55 to 64 Years | 1,276 (93.1%) | 1,210 (91.3%) |
| 65 to 74 Years | 1,129 (92.3%) | 1,297 (92.6%) |
| 75 Years and over | 718 (90.4%) | 863 (82.7%) |
| Total | 8,895 (90.1%) | 8,946 (89.5%) |
Income Below Poverty Among Married-Couple Families in Lavaca County
The poverty statistics for married-couple families in Lavaca County show that 4.5% or 198 of the total 4,396 families live below the poverty line. Families with 3 or 4 children have the highest poverty rate of 12.1%, comprising of 42 families. On the other hand, families with 5 or more children have the lowest poverty rate of 0.0%, which includes 0 families.
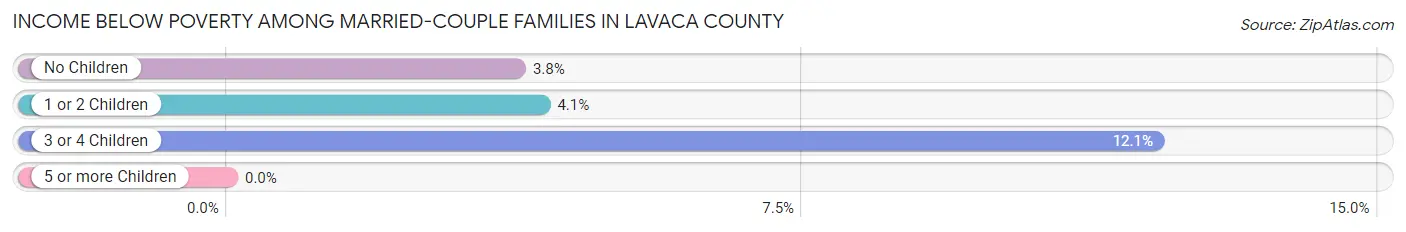
| Children | Above Poverty | Below Poverty |
| No Children | 2,610 (96.2%) | 102 (3.8%) |
| 1 or 2 Children | 1,271 (95.9%) | 54 (4.1%) |
| 3 or 4 Children | 305 (87.9%) | 42 (12.1%) |
| 5 or more Children | 12 (100.0%) | 0 (0.0%) |
| Total | 4,198 (95.5%) | 198 (4.5%) |
Income Below Poverty Among Single-Parent Households in Lavaca County
According to the poverty data in Lavaca County, 28.5% or 83 single-father households and 24.7% or 207 single-mother households are living below the poverty line. Among single-father households, those with 1 or 2 children have the highest poverty rate, with 60 households (32.3%) experiencing poverty. Likewise, among single-mother households, those with 3 or 4 children have the highest poverty rate, with 45 households (53.6%) falling below the poverty line.
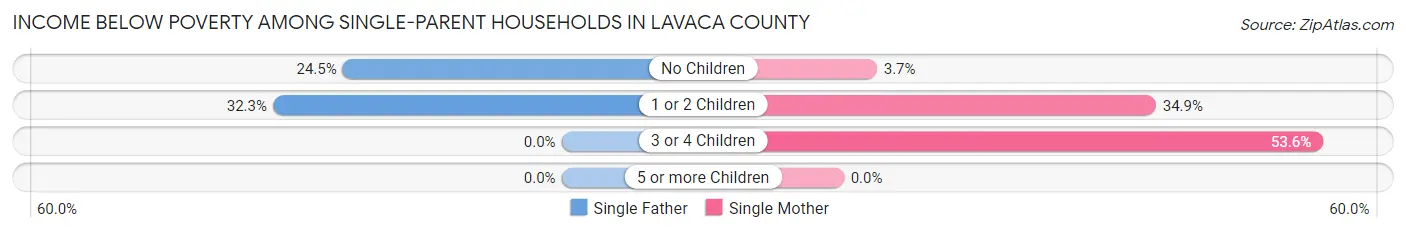
| Children | Single Father | Single Mother |
| No Children | 23 (24.5%) | 12 (3.7%) |
| 1 or 2 Children | 60 (32.3%) | 150 (34.9%) |
| 3 or 4 Children | 0 (0.0%) | 45 (53.6%) |
| 5 or more Children | 0 (0.0%) | 0 (0.0%) |
| Total | 83 (28.5%) | 207 (24.7%) |
Income Below Poverty Among Married-Couple vs Single-Parent Households in Lavaca County
The poverty data for Lavaca County shows that 198 of the married-couple family households (4.5%) and 290 of the single-parent households (25.7%) are living below the poverty level. Within the married-couple family households, those with 3 or 4 children have the highest poverty rate, with 42 households (12.1%) falling below the poverty line. Among the single-parent households, those with 3 or 4 children have the highest poverty rate, with 45 household (47.4%) living below poverty.
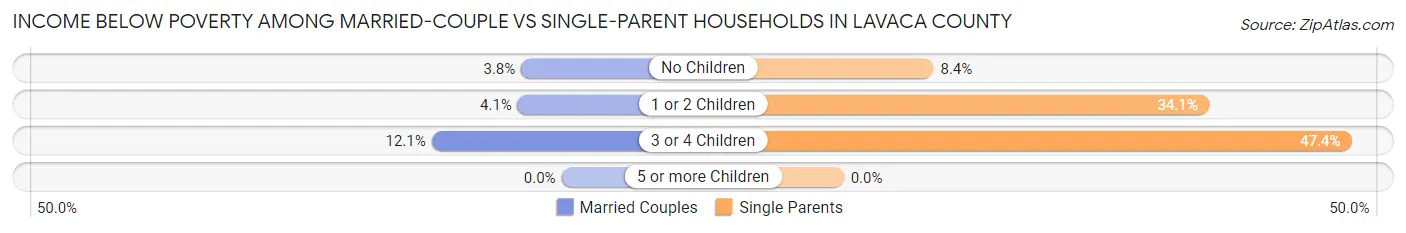
| Children | Married-Couple Families | Single-Parent Households |
| No Children | 102 (3.8%) | 35 (8.4%) |
| 1 or 2 Children | 54 (4.1%) | 210 (34.1%) |
| 3 or 4 Children | 42 (12.1%) | 45 (47.4%) |
| 5 or more Children | 0 (0.0%) | 0 (0.0%) |
| Total | 198 (4.5%) | 290 (25.7%) |
Race in Lavaca County
The most populous races in Lavaca County are White / Caucasian (15,746 | 77.3%), Hispanic or Latino (4,067 | 20.0%), and Some other Race (2,021 | 9.9%).
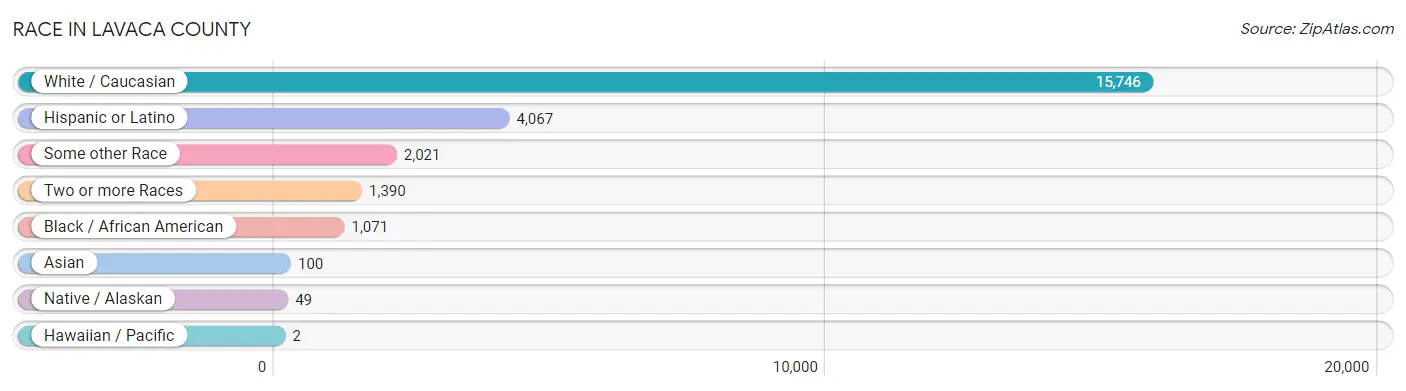
| Race | # Population | % Population |
| Asian | 100 | 0.5% |
| Black / African American | 1,071 | 5.3% |
| Hawaiian / Pacific | 2 | 0.0% |
| Hispanic or Latino | 4,067 | 20.0% |
| Native / Alaskan | 49 | 0.2% |
| White / Caucasian | 15,746 | 77.3% |
| Two or more Races | 1,390 | 6.8% |
| Some other Race | 2,021 | 9.9% |
| Total | 20,379 | 100.0% |
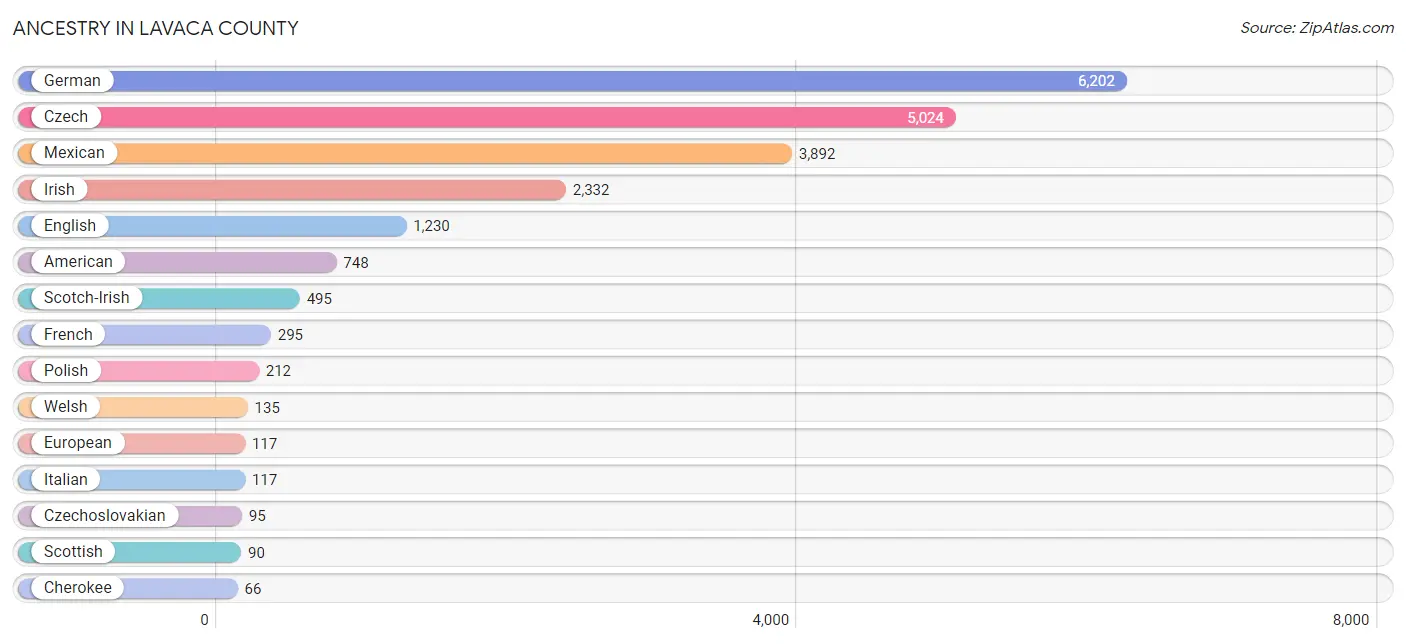
Ancestry in Lavaca County
The most populous ancestries reported in Lavaca County are German (6,202 | 30.4%), Czech (5,024 | 24.6%), Mexican (3,892 | 19.1%), Irish (2,332 | 11.4%), and English (1,230 | 6.0%), together accounting for 91.7% of all Lavaca County residents.
| Ancestry | # Population | % Population |
| Afghan | 9 | 0.0% |
| African | 9 | 0.0% |
| American | 748 | 3.7% |
| Arab | 6 | 0.0% |
| Austrian | 29 | 0.1% |
| Bhutanese | 22 | 0.1% |
| Blackfeet | 51 | 0.3% |
| British | 31 | 0.2% |
| Canadian | 29 | 0.1% |
| Celtic | 5 | 0.0% |
| Central American | 22 | 0.1% |
| Cherokee | 66 | 0.3% |
| Cheyenne | 1 | 0.0% |
| Choctaw | 2 | 0.0% |
| Comanche | 2 | 0.0% |
| Croatian | 7 | 0.0% |
| Cuban | 53 | 0.3% |
| Czech | 5,024 | 24.6% |
| Czechoslovakian | 95 | 0.5% |
| Danish | 30 | 0.2% |
| Dutch | 45 | 0.2% |
| Eastern European | 13 | 0.1% |
| English | 1,230 | 6.0% |
| European | 117 | 0.6% |
| Filipino | 5 | 0.0% |
| French | 295 | 1.5% |
| French Canadian | 50 | 0.3% |
| German | 6,202 | 30.4% |
| Greek | 4 | 0.0% |
| Guatemalan | 7 | 0.0% |
| Honduran | 15 | 0.1% |
| Indian (Asian) | 1 | 0.0% |
| Irish | 2,332 | 11.4% |
| Italian | 117 | 0.6% |
| Japanese | 40 | 0.2% |
| Korean | 45 | 0.2% |
| Lebanese | 6 | 0.0% |
| Mexican | 3,892 | 19.1% |
| Mexican American Indian | 41 | 0.2% |
| Northern European | 3 | 0.0% |
| Norwegian | 57 | 0.3% |
| Polish | 212 | 1.0% |
| Puerto Rican | 11 | 0.1% |
| Romanian | 19 | 0.1% |
| Russian | 27 | 0.1% |
| Samoan | 65 | 0.3% |
| Scandinavian | 8 | 0.0% |
| Scotch-Irish | 495 | 2.4% |
| Scottish | 90 | 0.4% |
| Seminole | 2 | 0.0% |
| Slovak | 8 | 0.0% |
| Spaniard | 6 | 0.0% |
| Spanish | 18 | 0.1% |
| Spanish American | 12 | 0.1% |
| Subsaharan African | 9 | 0.0% |
| Swedish | 38 | 0.2% |
| Swiss | 27 | 0.1% |
| Thai | 4 | 0.0% |
| Ukrainian | 8 | 0.0% |
| Welsh | 135 | 0.7% | View All 60 Rows |
Immigrants in Lavaca County
The most numerous immigrant groups reported in Lavaca County came from Latin America (955 | 4.7%), Central America (951 | 4.7%), Mexico (936 | 4.6%), Asia (81 | 0.4%), and South Eastern Asia (59 | 0.3%), together accounting for 14.6% of all Lavaca County residents.
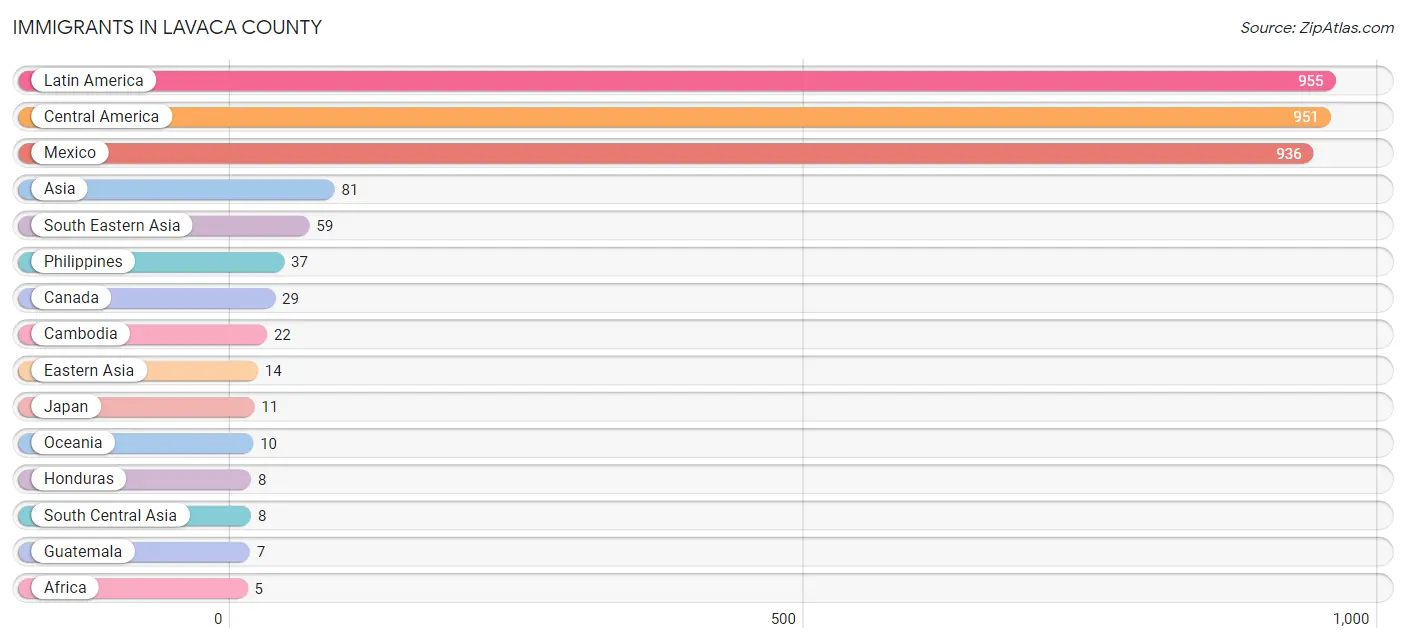
| Immigration Origin | # Population | % Population |
| Afghanistan | 4 | 0.0% |
| Africa | 5 | 0.0% |
| Asia | 81 | 0.4% |
| Cambodia | 22 | 0.1% |
| Canada | 29 | 0.1% |
| Central America | 951 | 4.7% |
| China | 3 | 0.0% |
| Eastern Africa | 5 | 0.0% |
| Eastern Asia | 14 | 0.1% |
| England | 2 | 0.0% |
| Europe | 5 | 0.0% |
| Guatemala | 7 | 0.0% |
| Honduras | 8 | 0.0% |
| India | 4 | 0.0% |
| Ireland | 1 | 0.0% |
| Japan | 11 | 0.1% |
| Latin America | 955 | 4.7% |
| Mexico | 936 | 4.6% |
| Northern Europe | 5 | 0.0% |
| Oceania | 10 | 0.1% |
| Peru | 4 | 0.0% |
| Philippines | 37 | 0.2% |
| South America | 4 | 0.0% |
| South Central Asia | 8 | 0.0% |
| South Eastern Asia | 59 | 0.3% |
| Taiwan | 3 | 0.0% | View All 26 Rows |
Sex and Age in Lavaca County
Sex and Age in Lavaca County
The most populous age groups in Lavaca County are 10 to 14 Years (721 | 7.2%) for men and 70 to 74 Years (762 | 7.4%) for women.
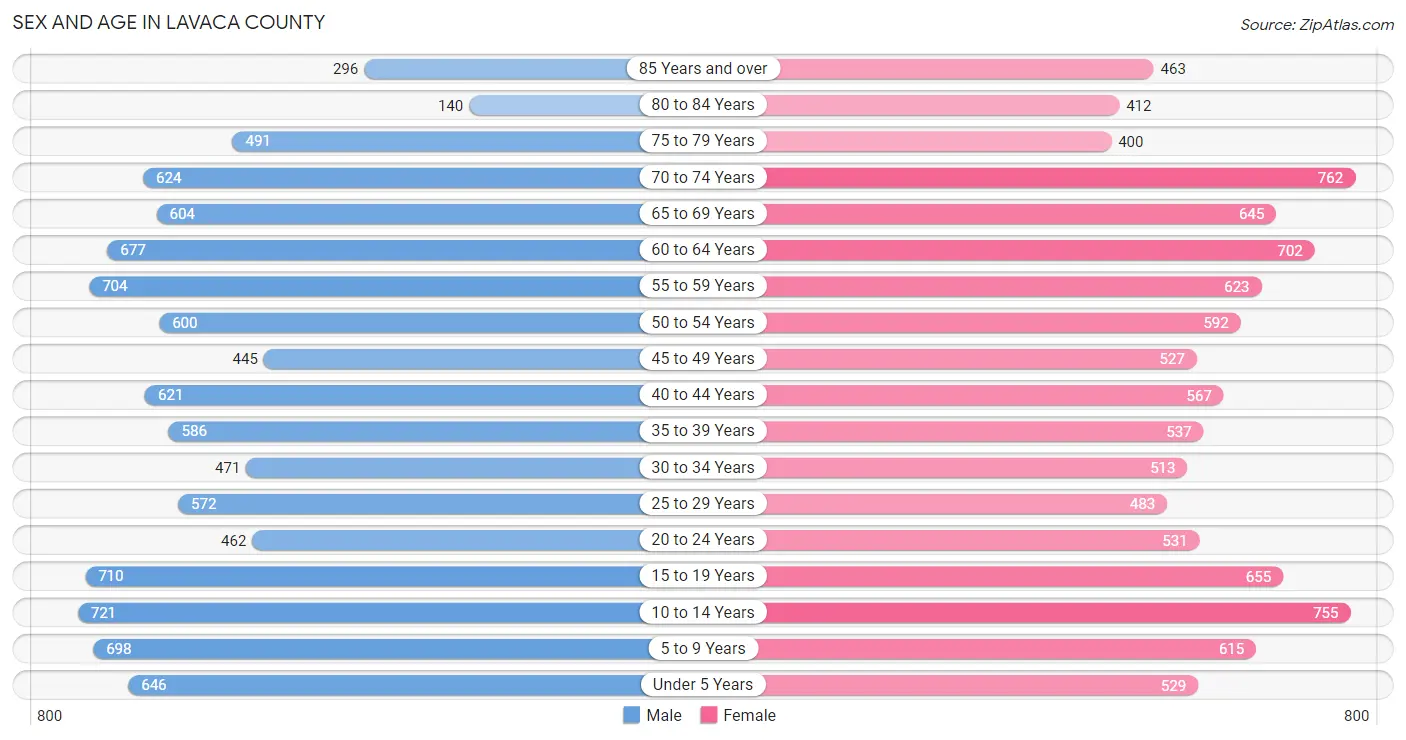
| Age Bracket | Male | Female |
| Under 5 Years | 646 (6.4%) | 529 (5.1%) |
| 5 to 9 Years | 698 (6.9%) | 615 (6.0%) |
| 10 to 14 Years | 721 (7.2%) | 755 (7.3%) |
| 15 to 19 Years | 710 (7.0%) | 655 (6.4%) |
| 20 to 24 Years | 462 (4.6%) | 531 (5.1%) |
| 25 to 29 Years | 572 (5.7%) | 483 (4.7%) |
| 30 to 34 Years | 471 (4.7%) | 513 (5.0%) |
| 35 to 39 Years | 586 (5.8%) | 537 (5.2%) |
| 40 to 44 Years | 621 (6.2%) | 567 (5.5%) |
| 45 to 49 Years | 445 (4.4%) | 527 (5.1%) |
| 50 to 54 Years | 600 (6.0%) | 592 (5.7%) |
| 55 to 59 Years | 704 (7.0%) | 623 (6.0%) |
| 60 to 64 Years | 677 (6.7%) | 702 (6.8%) |
| 65 to 69 Years | 604 (6.0%) | 645 (6.3%) |
| 70 to 74 Years | 624 (6.2%) | 762 (7.4%) |
| 75 to 79 Years | 491 (4.9%) | 400 (3.9%) |
| 80 to 84 Years | 140 (1.4%) | 412 (4.0%) |
| 85 Years and over | 296 (2.9%) | 463 (4.5%) |
| Total | 10,068 (100.0%) | 10,311 (100.0%) |
Families and Households in Lavaca County
Median Family Size in Lavaca County
The median family size in Lavaca County is 3.02 persons per family, with single female/mother families (838 | 15.2%) accounting for the largest median family size of 3.13 persons per family. On the other hand, single male/father families (291 | 5.3%) represent the smallest median family size with 2.40 persons per family.
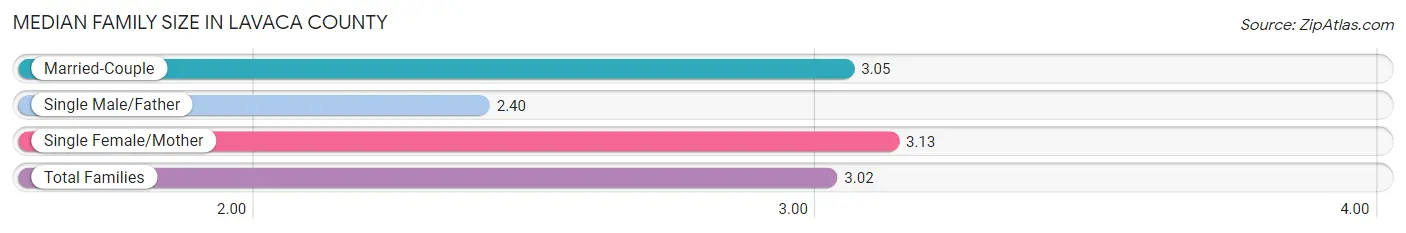
| Family Type | # Families | Family Size |
| Married-Couple | 4,396 (79.6%) | 3.05 |
| Single Male/Father | 291 (5.3%) | 2.40 |
| Single Female/Mother | 838 (15.2%) | 3.13 |
| Total Families | 5,525 (100.0%) | 3.02 |
Median Household Size in Lavaca County
The median household size in Lavaca County is 2.43 persons per household, with single female/mother households (838 | 10.2%) accounting for the largest median household size of 3.39 persons per household. non-family households (2,681 | 32.7%) represent the smallest median household size with 1.08 persons per household.
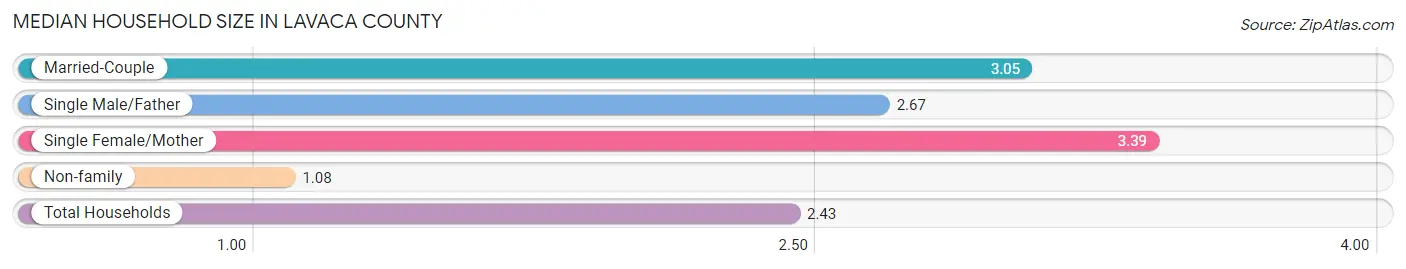
| Household Type | # Households | Household Size |
| Married-Couple | 4,396 (53.6%) | 3.05 |
| Single Male/Father | 291 (3.5%) | 2.67 |
| Single Female/Mother | 838 (10.2%) | 3.39 |
| Non-family | 2,681 (32.7%) | 1.08 |
| Total Households | 8,206 (100.0%) | 2.43 |
Household Size by Marriage Status in Lavaca County
Out of a total of 8,206 households in Lavaca County, 5,525 (67.3%) are family households, while 2,681 (32.7%) are nonfamily households. The most numerous type of family households are 2-person households, comprising 2,871, and the most common type of nonfamily households are 1-person households, comprising 2,491.
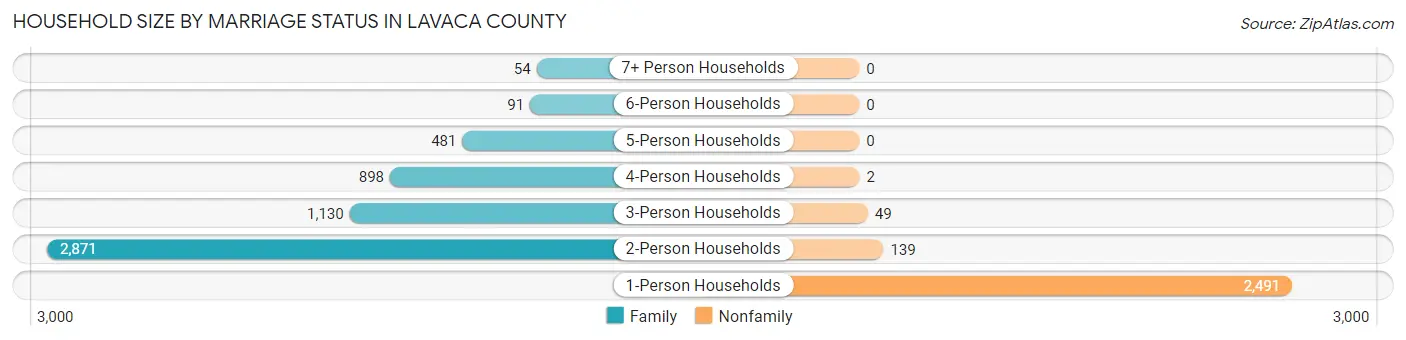
| Household Size | Family Households | Nonfamily Households |
| 1-Person Households | - | 2,491 (30.4%) |
| 2-Person Households | 2,871 (35.0%) | 139 (1.7%) |
| 3-Person Households | 1,130 (13.8%) | 49 (0.6%) |
| 4-Person Households | 898 (10.9%) | 2 (0.0%) |
| 5-Person Households | 481 (5.9%) | 0 (0.0%) |
| 6-Person Households | 91 (1.1%) | 0 (0.0%) |
| 7+ Person Households | 54 (0.7%) | 0 (0.0%) |
| Total | 5,525 (67.3%) | 2,681 (32.7%) |
Female Fertility in Lavaca County
Fertility by Age in Lavaca County
Average fertility rate in Lavaca County is 41.0 births per 1,000 women. Women in the age bracket of 20 to 34 years have the highest fertility rate with 91.0 births per 1,000 women. Women in the age bracket of 20 to 34 years acount for 85.8% of all women with births.
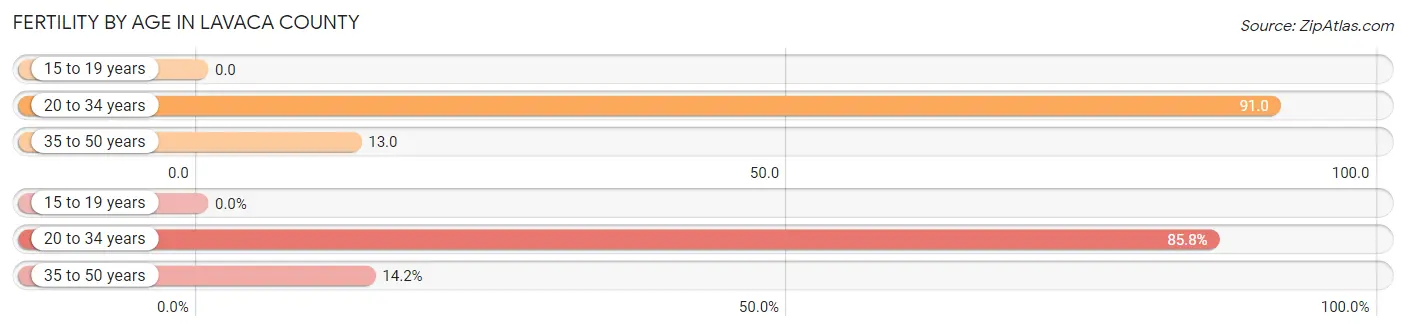
| Age Bracket | Women with Births | Births / 1,000 Women |
| 15 to 19 years | 0 (0.0%) | 0.0 |
| 20 to 34 years | 139 (85.8%) | 91.0 |
| 35 to 50 years | 23 (14.2%) | 13.0 |
| Total | 162 (100.0%) | 41.0 |
Fertility by Age by Marriage Status in Lavaca County
61.7% of women with births (162) in Lavaca County are married. The highest percentage of unmarried women with births falls into 35 to 50 years age bracket with 39.1% of them unmarried at the time of birth, while the lowest percentage of unmarried women with births belong to 20 to 34 years age bracket with 38.1% of them unmarried.
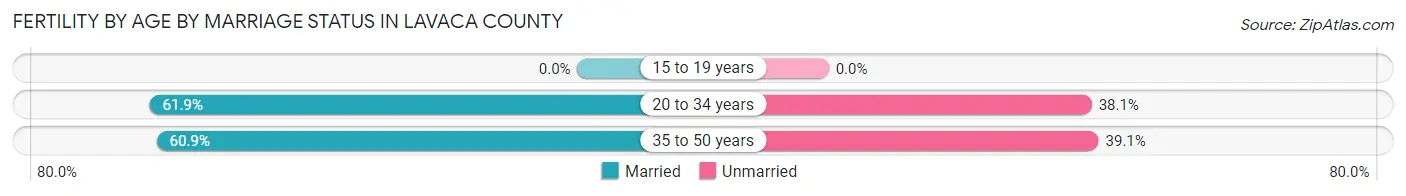
| Age Bracket | Married | Unmarried |
| 15 to 19 years | 0 (0.0%) | 0 (0.0%) |
| 20 to 34 years | 86 (61.9%) | 53 (38.1%) |
| 35 to 50 years | 14 (60.9%) | 9 (39.1%) |
| Total | 100 (61.7%) | 62 (38.3%) |
Fertility by Education in Lavaca County
Average fertility rate in Lavaca County is 41.0 births per 1,000 women. Women with the education attainment of bachelor's degree have the highest fertility rate of 63.0 births per 1,000 women, while women with the education attainment of graduate degree have the lowest fertility at 9.0 births per 1,000 women. Women with the education attainment of college or associate's degree represent 48.1% of all women with births.
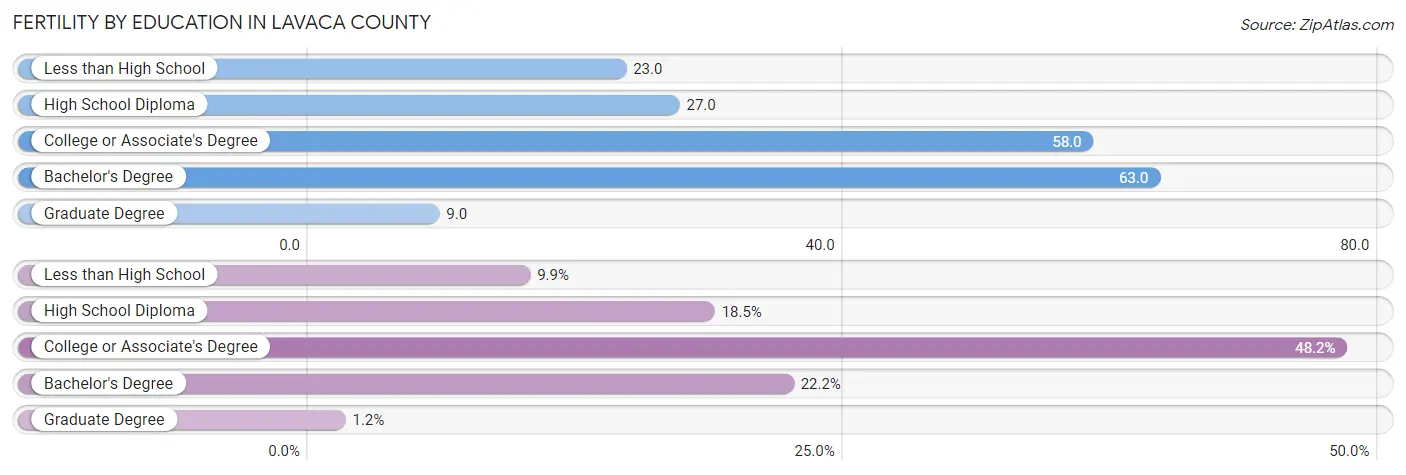
| Educational Attainment | Women with Births | Births / 1,000 Women |
| Less than High School | 16 (9.9%) | 23.0 |
| High School Diploma | 30 (18.5%) | 27.0 |
| College or Associate's Degree | 78 (48.1%) | 58.0 |
| Bachelor's Degree | 36 (22.2%) | 63.0 |
| Graduate Degree | 2 (1.2%) | 9.0 |
| Total | 162 (100.0%) | 41.0 |
Fertility by Education by Marriage Status in Lavaca County
38.3% of women with births in Lavaca County are unmarried. Women with the educational attainment of bachelor's degree are most likely to be married with 100.0% of them married at childbirth, while women with the educational attainment of high school diploma are least likely to be married with 83.3% of them unmarried at childbirth.
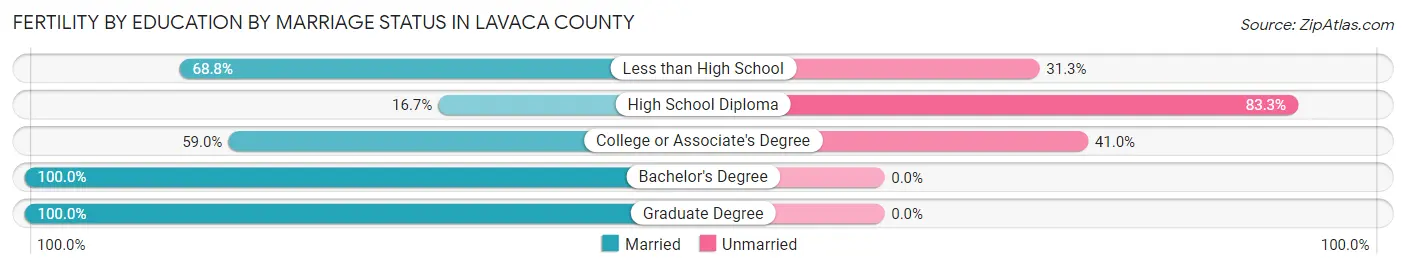
| Educational Attainment | Married | Unmarried |
| Less than High School | 11 (68.8%) | 5 (31.2%) |
| High School Diploma | 5 (16.7%) | 25 (83.3%) |
| College or Associate's Degree | 46 (59.0%) | 32 (41.0%) |
| Bachelor's Degree | 36 (100.0%) | 0 (0.0%) |
| Graduate Degree | 2 (100.0%) | 0 (0.0%) |
| Total | 100 (61.7%) | 62 (38.3%) |
Employment Characteristics in Lavaca County
Employment by Class of Employer in Lavaca County
Among the 9,147 employed individuals in Lavaca County, private company employees (6,232 | 68.1%), self-employed (not incorporated) (984 | 10.8%), and local government employees (871 | 9.5%) make up the most common classes of employment.
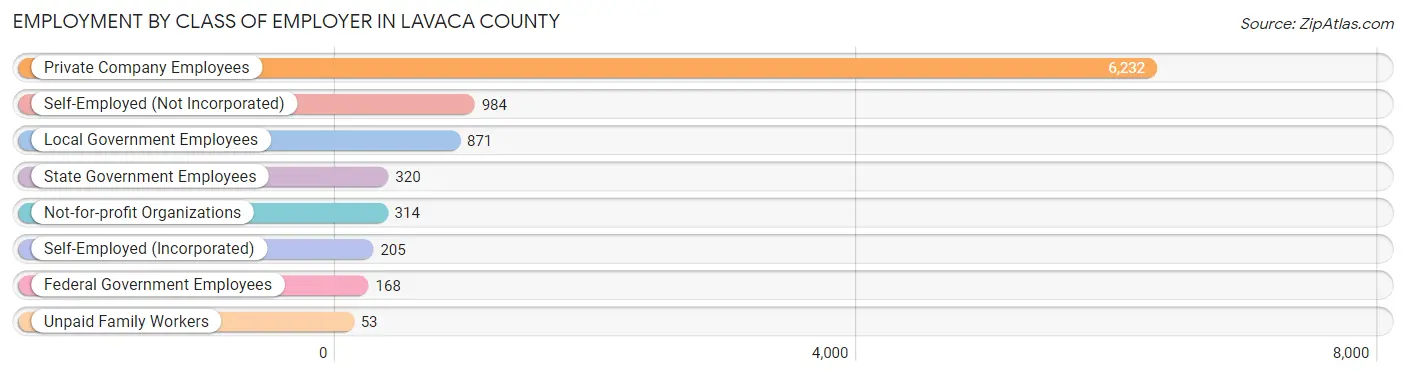
| Employer Class | # Employees | % Employees |
| Private Company Employees | 6,232 | 68.1% |
| Self-Employed (Incorporated) | 205 | 2.2% |
| Self-Employed (Not Incorporated) | 984 | 10.8% |
| Not-for-profit Organizations | 314 | 3.4% |
| Local Government Employees | 871 | 9.5% |
| State Government Employees | 320 | 3.5% |
| Federal Government Employees | 168 | 1.8% |
| Unpaid Family Workers | 53 | 0.6% |
| Total | 9,147 | 100.0% |
Employment Status by Age in Lavaca County
According to the labor force statistics for Lavaca County, out of the total population over 16 years of age (16,102), 60.0% or 9,661 individuals are in the labor force, with 3.0% or 290 of them unemployed. The age group with the highest labor force participation rate is 45 to 54 years, with 87.3% or 1,889 individuals in the labor force. Within the labor force, the 16 to 19 years age range has the highest percentage of unemployed individuals, with 9.8% or 49 of them being unemployed.
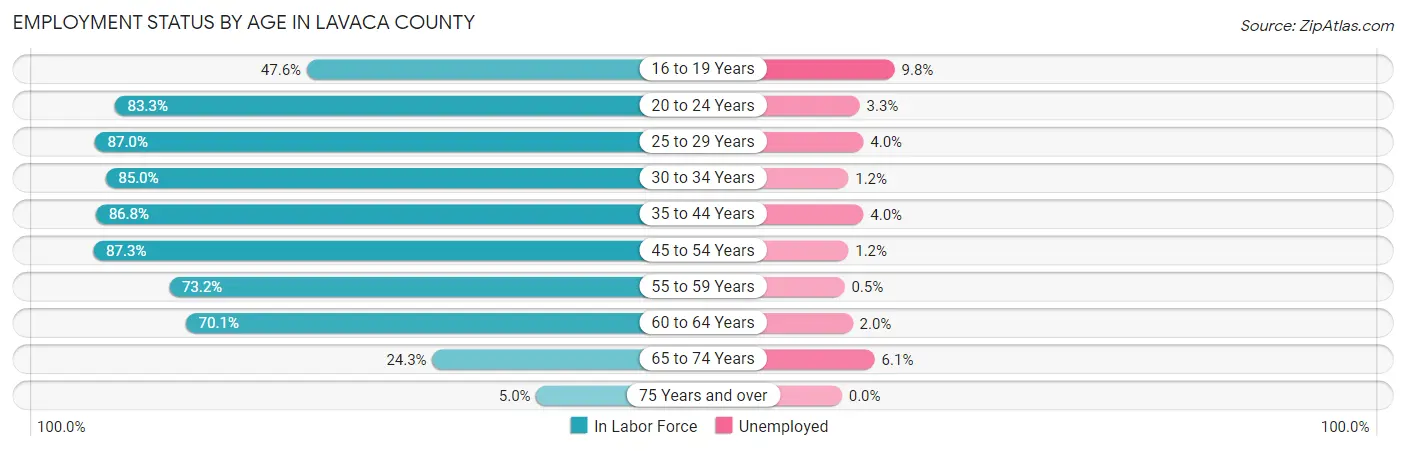
| Age Bracket | In Labor Force | Unemployed |
| 16 to 19 Years | 501 (47.6%) | 49 (9.8%) |
| 20 to 24 Years | 827 (83.3%) | 27 (3.3%) |
| 25 to 29 Years | 918 (87.0%) | 37 (4.0%) |
| 30 to 34 Years | 836 (85.0%) | 10 (1.2%) |
| 35 to 44 Years | 2,006 (86.8%) | 80 (4.0%) |
| 45 to 54 Years | 1,889 (87.3%) | 23 (1.2%) |
| 55 to 59 Years | 971 (73.2%) | 5 (0.5%) |
| 60 to 64 Years | 967 (70.1%) | 19 (2.0%) |
| 65 to 74 Years | 640 (24.3%) | 39 (6.1%) |
| 75 Years and over | 110 (5.0%) | 0 (0.0%) |
| Total | 9,661 (60.0%) | 290 (3.0%) |
Employment Status by Educational Attainment in Lavaca County
According to labor force statistics for Lavaca County, 82.3% of individuals (7,588) out of the total population between 25 and 64 years of age (9,220) are in the labor force, with 2.3% or 175 of them being unemployed. The group with the highest labor force participation rate are those with the educational attainment of college / associate degree, with 86.2% or 2,436 individuals in the labor force. Within the labor force, individuals with high school diploma education have the highest percentage of unemployment, with 4.1% or 101 of them being unemployed.
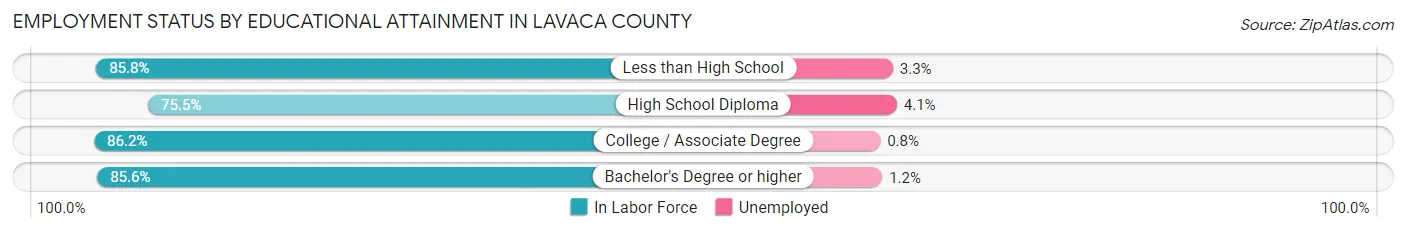
| Educational Attainment | In Labor Force | Unemployed |
| Less than High School | 960 (85.8%) | 37 (3.3%) |
| High School Diploma | 2,463 (75.5%) | 134 (4.1%) |
| College / Associate Degree | 2,436 (86.2%) | 23 (0.8%) |
| Bachelor's Degree or higher | 1,723 (85.6%) | 24 (1.2%) |
| Total | 7,588 (82.3%) | 212 (2.3%) |
Employment Occupations by Sex in Lavaca County
Management, Business, Science and Arts Occupations
The most common Management, Business, Science and Arts occupations in Lavaca County are Management (991 | 10.6%), Health Diagnosing & Treating (890 | 9.5%), Community & Social Service (721 | 7.7%), Education Instruction & Library (576 | 6.1%), and Health Technologists (498 | 5.3%).
Management, Business, Science and Arts Occupations by Sex
Within the Management, Business, Science and Arts occupations in Lavaca County, the most male-oriented occupations are Architecture & Engineering (93.5%), Management (71.5%), and Computers, Engineering & Science (70.6%), while the most female-oriented occupations are Health Technologists (93.0%), Arts, Media & Entertainment (92.4%), and Health Diagnosing & Treating (88.0%).
| Occupation | Male | Female |
| Management | 709 (71.5%) | 282 (28.5%) |
| Business & Financial | 181 (42.5%) | 245 (57.5%) |
| Computers, Engineering & Science | 187 (70.6%) | 78 (29.4%) |
| Computers & Mathematics | 50 (49.5%) | 51 (50.5%) |
| Architecture & Engineering | 116 (93.5%) | 8 (6.5%) |
| Life, Physical & Social Science | 21 (52.5%) | 19 (47.5%) |
| Community & Social Service | 179 (24.8%) | 542 (75.2%) |
| Education, Arts & Media | 16 (38.1%) | 26 (61.9%) |
| Legal Services & Support | 26 (52.0%) | 24 (48.0%) |
| Education Instruction & Library | 133 (23.1%) | 443 (76.9%) |
| Arts, Media & Entertainment | 4 (7.5%) | 49 (92.4%) |
| Health Diagnosing & Treating | 107 (12.0%) | 783 (88.0%) |
| Health Technologists | 35 (7.0%) | 463 (93.0%) |
| Total (Category) | 1,363 (41.4%) | 1,930 (58.6%) |
| Total (Overall) | 4,949 (52.8%) | 4,427 (47.2%) |
Services Occupations
The most common Services occupations in Lavaca County are Healthcare Support (338 | 3.6%), Food Preparation & Serving (329 | 3.5%), Security & Protection (278 | 3.0%), Firefighting & Prevention (187 | 2.0%), and Personal Care & Service (176 | 1.9%).
Services Occupations by Sex
Within the Services occupations in Lavaca County, the most male-oriented occupations are Law Enforcement (67.0%), Security & Protection (66.2%), and Firefighting & Prevention (65.8%), while the most female-oriented occupations are Food Preparation & Serving (85.7%), Personal Care & Service (84.7%), and Healthcare Support (76.0%).
| Occupation | Male | Female |
| Healthcare Support | 81 (24.0%) | 257 (76.0%) |
| Security & Protection | 184 (66.2%) | 94 (33.8%) |
| Firefighting & Prevention | 123 (65.8%) | 64 (34.2%) |
| Law Enforcement | 61 (67.0%) | 30 (33.0%) |
| Food Preparation & Serving | 47 (14.3%) | 282 (85.7%) |
| Cleaning & Maintenance | 73 (44.0%) | 93 (56.0%) |
| Personal Care & Service | 27 (15.3%) | 149 (84.7%) |
| Total (Category) | 412 (32.0%) | 875 (68.0%) |
| Total (Overall) | 4,949 (52.8%) | 4,427 (47.2%) |
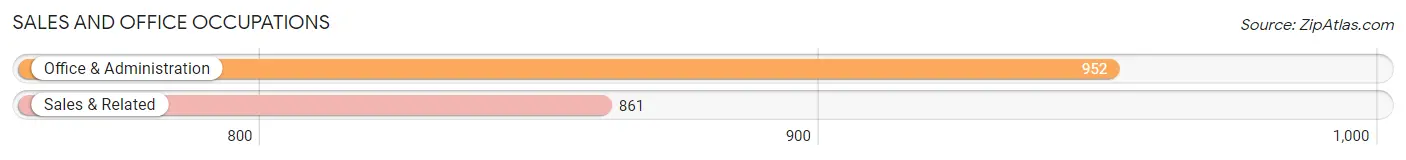
Sales and Office Occupations
The most common Sales and Office occupations in Lavaca County are Office & Administration (952 | 10.2%), and Sales & Related (861 | 9.2%).
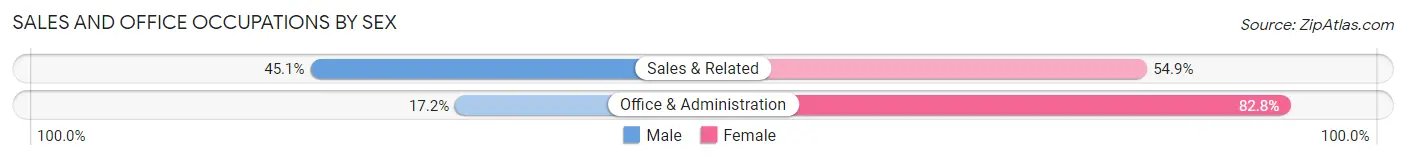
Sales and Office Occupations by Sex
| Occupation | Male | Female |
| Sales & Related | 388 (45.1%) | 473 (54.9%) |
| Office & Administration | 164 (17.2%) | 788 (82.8%) |
| Total (Category) | 552 (30.4%) | 1,261 (69.6%) |
| Total (Overall) | 4,949 (52.8%) | 4,427 (47.2%) |
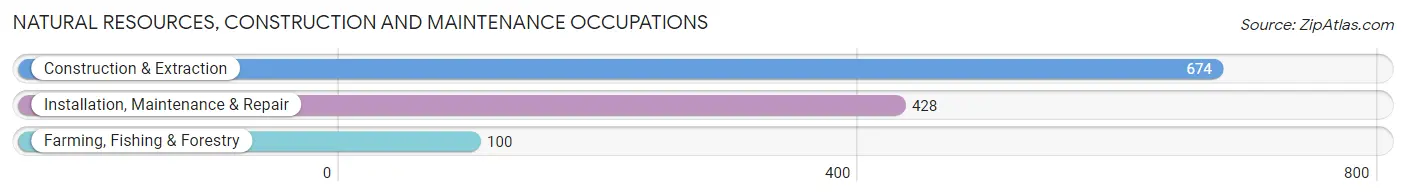
Natural Resources, Construction and Maintenance Occupations
The most common Natural Resources, Construction and Maintenance occupations in Lavaca County are Construction & Extraction (674 | 7.2%), Installation, Maintenance & Repair (428 | 4.6%), and Farming, Fishing & Forestry (100 | 1.1%).
Natural Resources, Construction and Maintenance Occupations by Sex
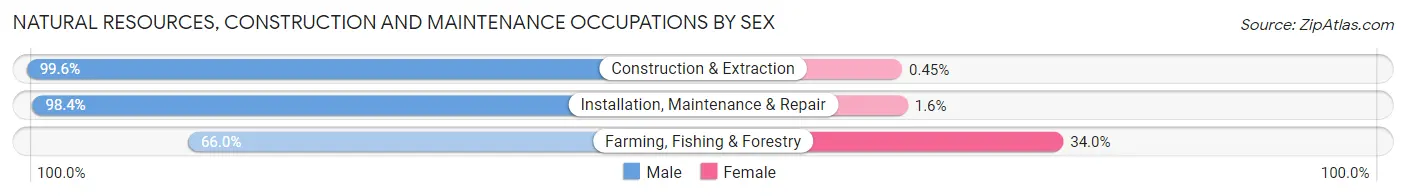
| Occupation | Male | Female |
| Farming, Fishing & Forestry | 66 (66.0%) | 34 (34.0%) |
| Construction & Extraction | 671 (99.6%) | 3 (0.4%) |
| Installation, Maintenance & Repair | 421 (98.4%) | 7 (1.6%) |
| Total (Category) | 1,158 (96.3%) | 44 (3.7%) |
| Total (Overall) | 4,949 (52.8%) | 4,427 (47.2%) |
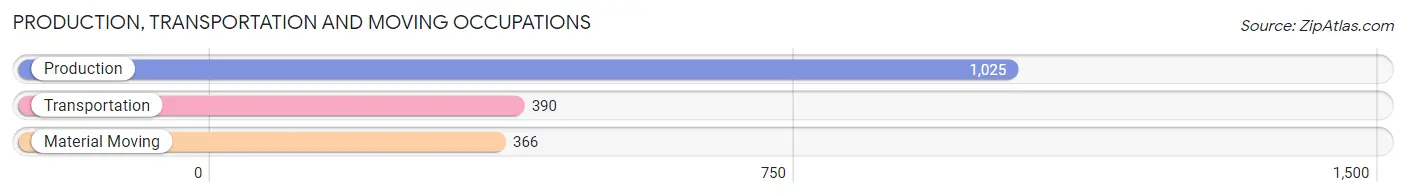
Production, Transportation and Moving Occupations
The most common Production, Transportation and Moving occupations in Lavaca County are Production (1,025 | 10.9%), Transportation (390 | 4.2%), and Material Moving (366 | 3.9%).
Production, Transportation and Moving Occupations by Sex
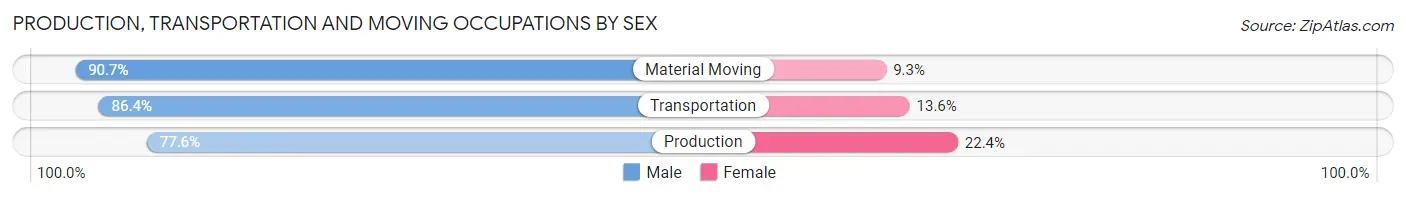
| Occupation | Male | Female |
| Production | 795 (77.6%) | 230 (22.4%) |
| Transportation | 337 (86.4%) | 53 (13.6%) |
| Material Moving | 332 (90.7%) | 34 (9.3%) |
| Total (Category) | 1,464 (82.2%) | 317 (17.8%) |
| Total (Overall) | 4,949 (52.8%) | 4,427 (47.2%) |
Employment Industries by Sex in Lavaca County
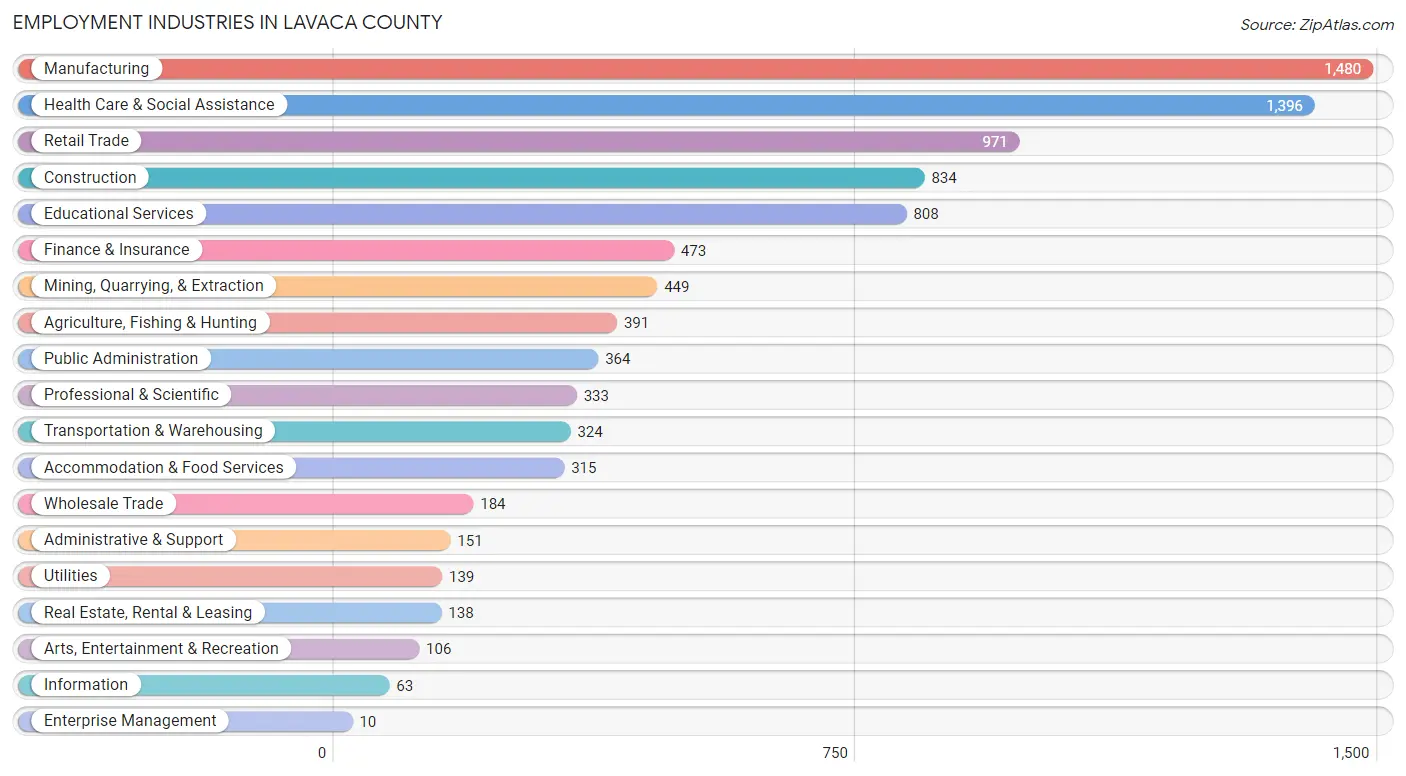
Employment Industries in Lavaca County
The major employment industries in Lavaca County include Manufacturing (1,480 | 15.8%), Health Care & Social Assistance (1,396 | 14.9%), Retail Trade (971 | 10.4%), Construction (834 | 8.9%), and Educational Services (808 | 8.6%).
Employment Industries by Sex in Lavaca County
The Lavaca County industries that see more men than women are Mining, Quarrying, & Extraction (96.9%), Construction (93.8%), and Agriculture, Fishing & Hunting (85.9%), whereas the industries that tend to have a higher number of women are Enterprise Management (100.0%), Health Care & Social Assistance (90.3%), and Accommodation & Food Services (83.5%).
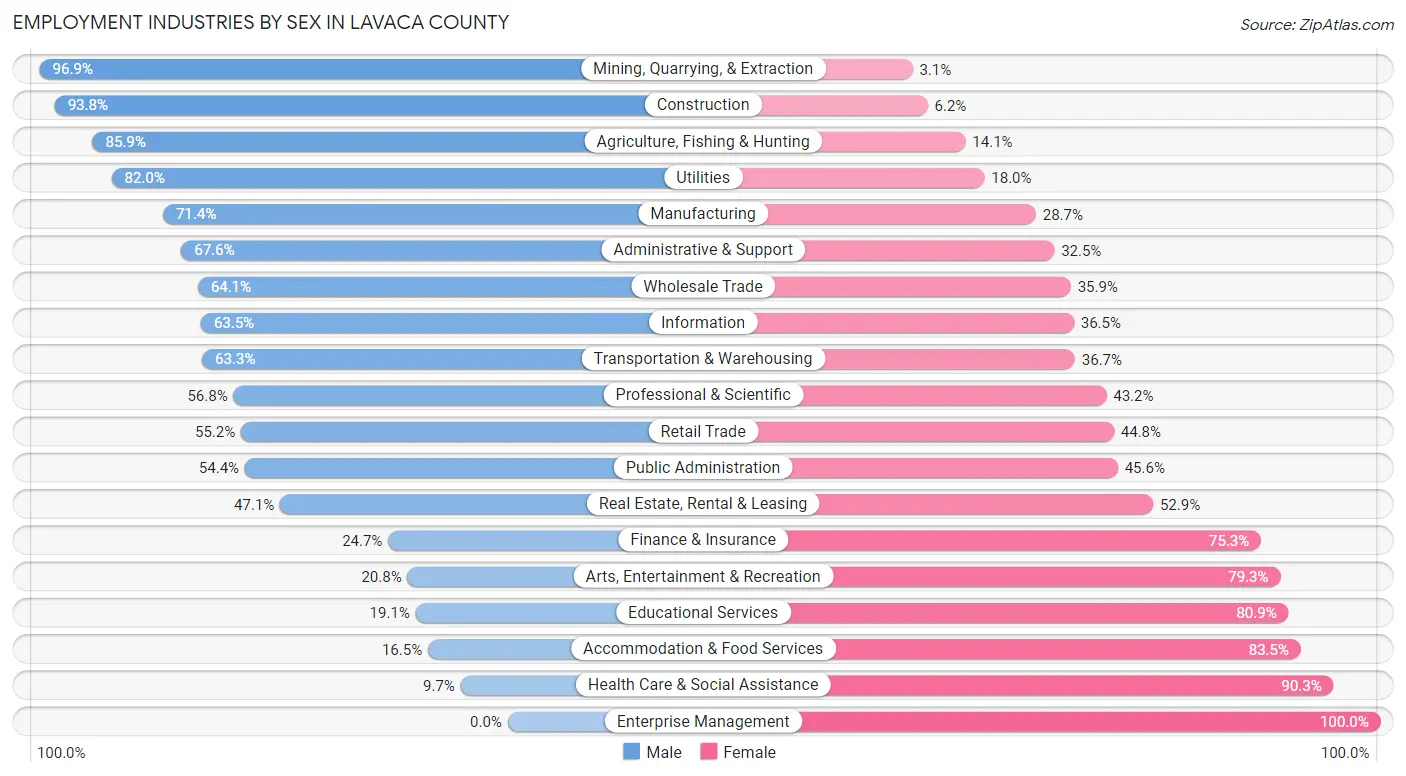
| Industry | Male | Female |
| Agriculture, Fishing & Hunting | 336 (85.9%) | 55 (14.1%) |
| Mining, Quarrying, & Extraction | 435 (96.9%) | 14 (3.1%) |
| Construction | 782 (93.8%) | 52 (6.2%) |
| Manufacturing | 1,056 (71.4%) | 424 (28.6%) |
| Wholesale Trade | 118 (64.1%) | 66 (35.9%) |
| Retail Trade | 536 (55.2%) | 435 (44.8%) |
| Transportation & Warehousing | 205 (63.3%) | 119 (36.7%) |
| Utilities | 114 (82.0%) | 25 (18.0%) |
| Information | 40 (63.5%) | 23 (36.5%) |
| Finance & Insurance | 117 (24.7%) | 356 (75.3%) |
| Real Estate, Rental & Leasing | 65 (47.1%) | 73 (52.9%) |
| Professional & Scientific | 189 (56.8%) | 144 (43.2%) |
| Enterprise Management | 0 (0.0%) | 10 (100.0%) |
| Administrative & Support | 102 (67.5%) | 49 (32.5%) |
| Educational Services | 154 (19.1%) | 654 (80.9%) |
| Health Care & Social Assistance | 136 (9.7%) | 1,260 (90.3%) |
| Arts, Entertainment & Recreation | 22 (20.7%) | 84 (79.2%) |
| Accommodation & Food Services | 52 (16.5%) | 263 (83.5%) |
| Public Administration | 198 (54.4%) | 166 (45.6%) |
| Total | 4,949 (52.8%) | 4,427 (47.2%) |
Education in Lavaca County
School Enrollment in Lavaca County
The most common levels of schooling among the 4,463 students in Lavaca County are high school (1,261 | 28.2%), middle school (1,118 | 25.1%), and elementary school (851 | 19.1%).
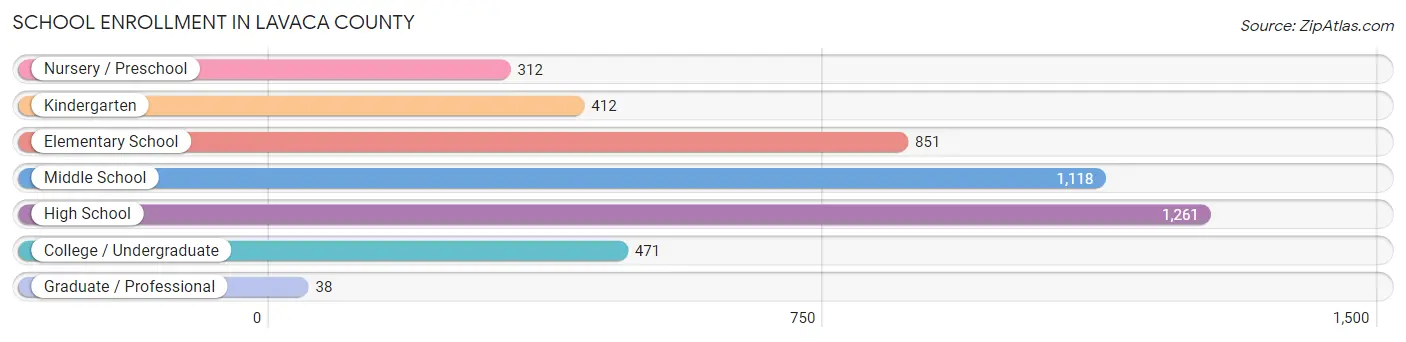
| School Level | # Students | % Students |
| Nursery / Preschool | 312 | 7.0% |
| Kindergarten | 412 | 9.2% |
| Elementary School | 851 | 19.1% |
| Middle School | 1,118 | 25.1% |
| High School | 1,261 | 28.2% |
| College / Undergraduate | 471 | 10.5% |
| Graduate / Professional | 38 | 0.9% |
| Total | 4,463 | 100.0% |
School Enrollment by Age by Funding Source in Lavaca County
Out of a total of 4,463 students who are enrolled in schools in Lavaca County, 839 (18.8%) attend a private institution, while the remaining 3,624 (81.2%) are enrolled in public schools. The age group of 3 to 4 year olds has the highest likelihood of being enrolled in private schools, with 85 (38.3% in the age bracket) enrolled. Conversely, the age group of 25 to 34 year olds has the lowest likelihood of being enrolled in a private school, with 116 (98.3% in the age bracket) attending a public institution.
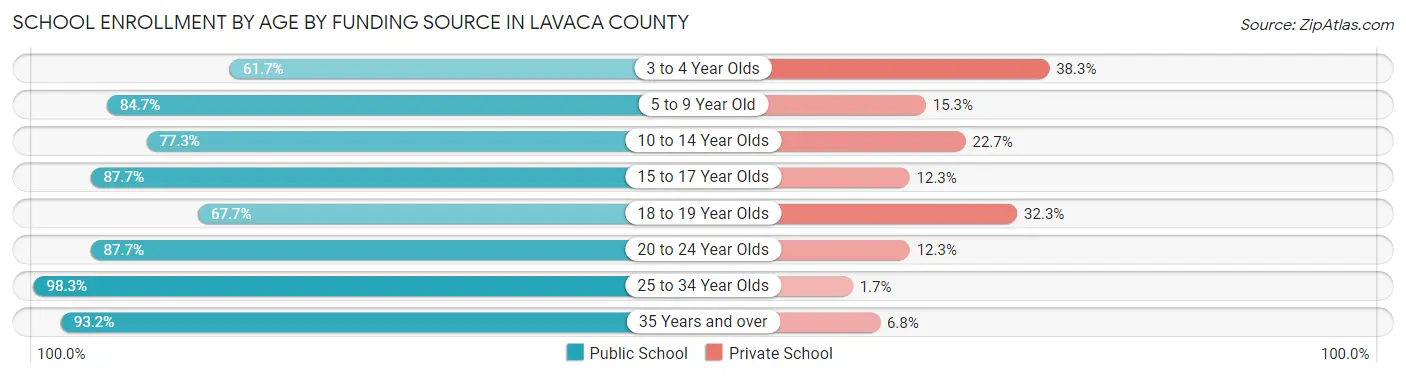
| Age Bracket | Public School | Private School |
| 3 to 4 Year Olds | 137 (61.7%) | 85 (38.3%) |
| 5 to 9 Year Old | 1,040 (84.7%) | 188 (15.3%) |
| 10 to 14 Year Olds | 1,117 (77.3%) | 328 (22.7%) |
| 15 to 17 Year Olds | 686 (87.7%) | 96 (12.3%) |
| 18 to 19 Year Olds | 220 (67.7%) | 105 (32.3%) |
| 20 to 24 Year Olds | 171 (87.7%) | 24 (12.3%) |
| 25 to 34 Year Olds | 116 (98.3%) | 2 (1.7%) |
| 35 Years and over | 138 (93.2%) | 10 (6.8%) |
| Total | 3,624 (81.2%) | 839 (18.8%) |
Educational Attainment by Field of Study in Lavaca County
Education (757 | 25.7%), business (600 | 20.3%), science & technology (381 | 12.9%), bio, nature & agricultural (248 | 8.4%), and arts & humanities (190 | 6.4%) are the most common fields of study among 2,950 individuals in Lavaca County who have obtained a bachelor's degree or higher.
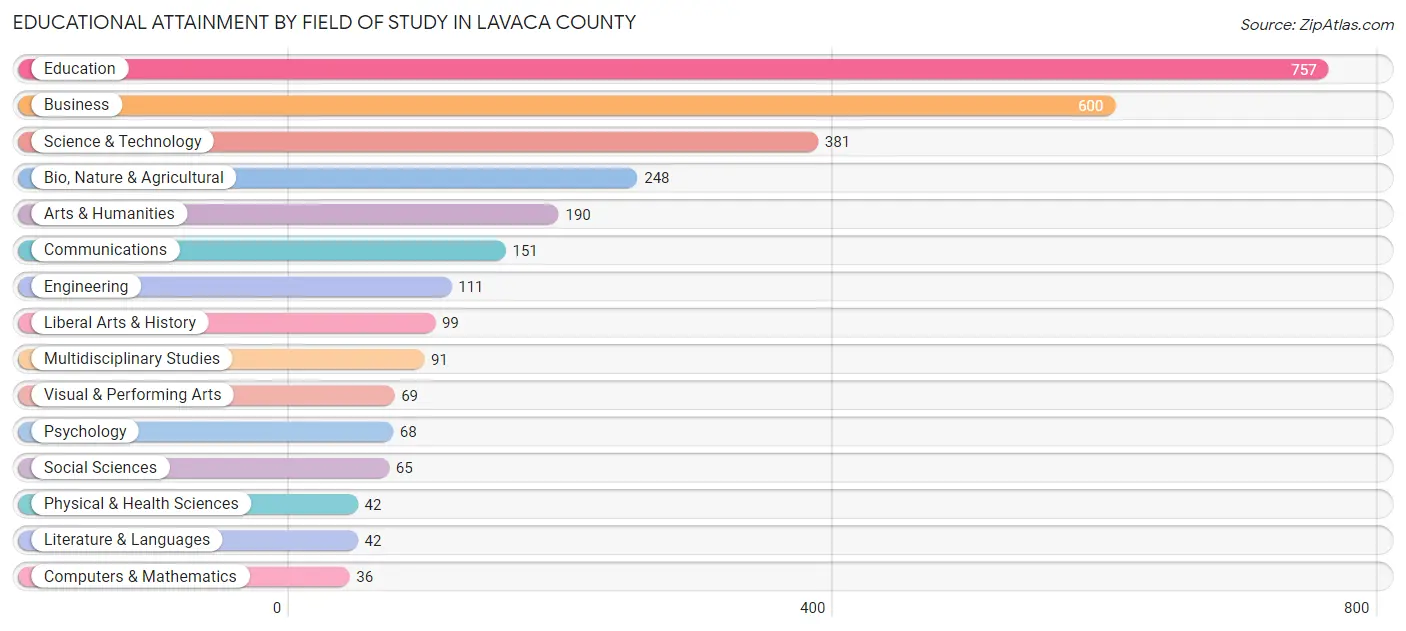
| Field of Study | # Graduates | % Graduates |
| Computers & Mathematics | 36 | 1.2% |
| Bio, Nature & Agricultural | 248 | 8.4% |
| Physical & Health Sciences | 42 | 1.4% |
| Psychology | 68 | 2.3% |
| Social Sciences | 65 | 2.2% |
| Engineering | 111 | 3.8% |
| Multidisciplinary Studies | 91 | 3.1% |
| Science & Technology | 381 | 12.9% |
| Business | 600 | 20.3% |
| Education | 757 | 25.7% |
| Literature & Languages | 42 | 1.4% |
| Liberal Arts & History | 99 | 3.4% |
| Visual & Performing Arts | 69 | 2.3% |
| Communications | 151 | 5.1% |
| Arts & Humanities | 190 | 6.4% |
| Total | 2,950 | 100.0% |
Transportation & Commute in Lavaca County
Vehicle Availability by Sex in Lavaca County
The most prevalent vehicle ownership categories in Lavaca County are males with 2 vehicles (1,948, accounting for 39.7%) and females with 2 vehicles (1,622, making up 46.0%).
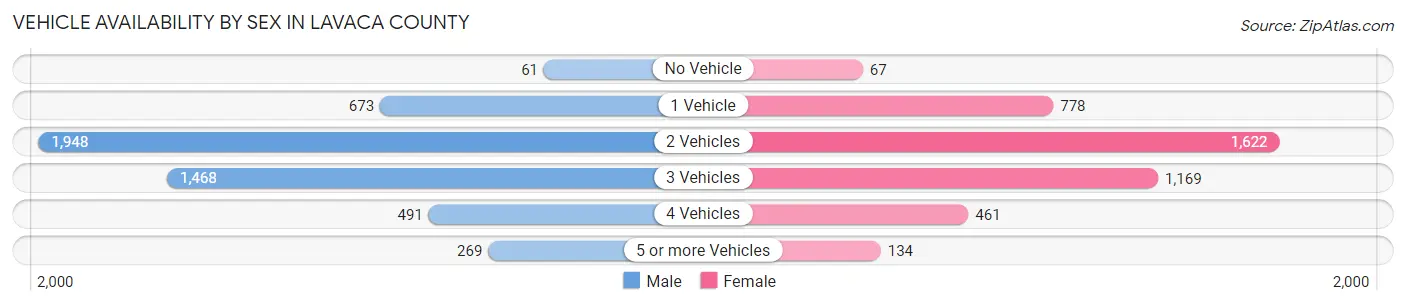
| Vehicles Available | Male | Female |
| No Vehicle | 61 (1.2%) | 67 (1.6%) |
| 1 Vehicle | 673 (13.7%) | 778 (18.4%) |
| 2 Vehicles | 1,948 (39.7%) | 1,622 (38.3%) |
| 3 Vehicles | 1,468 (29.9%) | 1,169 (27.6%) |
| 4 Vehicles | 491 (10.0%) | 461 (10.9%) |
| 5 or more Vehicles | 269 (5.5%) | 134 (3.2%) |
| Total | 4,910 (100.0%) | 4,231 (100.0%) |
Commute Time in Lavaca County
The most frequently occuring commute durations in Lavaca County are 5 to 9 minutes (1,770 commuters, 21.3%), 10 to 14 minutes (1,070 commuters, 12.9%), and 20 to 24 minutes (995 commuters, 11.9%).
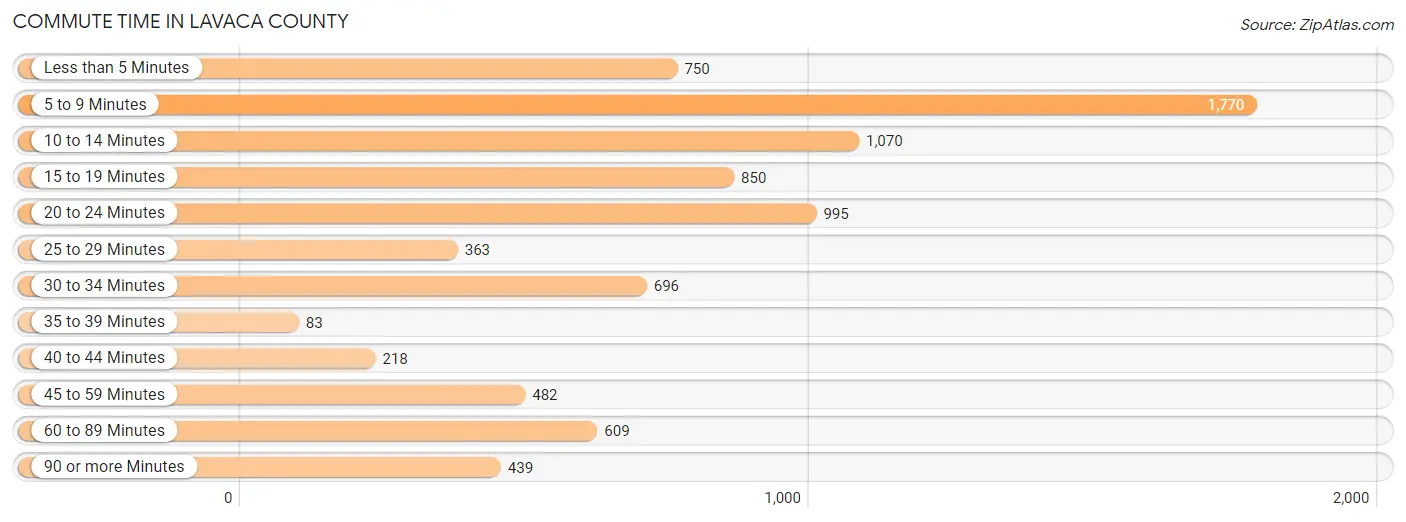
| Commute Time | # Commuters | % Commuters |
| Less than 5 Minutes | 750 | 9.0% |
| 5 to 9 Minutes | 1,770 | 21.3% |
| 10 to 14 Minutes | 1,070 | 12.9% |
| 15 to 19 Minutes | 850 | 10.2% |
| 20 to 24 Minutes | 995 | 11.9% |
| 25 to 29 Minutes | 363 | 4.4% |
| 30 to 34 Minutes | 696 | 8.4% |
| 35 to 39 Minutes | 83 | 1.0% |
| 40 to 44 Minutes | 218 | 2.6% |
| 45 to 59 Minutes | 482 | 5.8% |
| 60 to 89 Minutes | 609 | 7.3% |
| 90 or more Minutes | 439 | 5.3% |
Commute Time by Sex in Lavaca County
The most common commute times in Lavaca County are 5 to 9 minutes (792 commuters, 17.8%) for males and 5 to 9 minutes (978 commuters, 25.2%) for females.
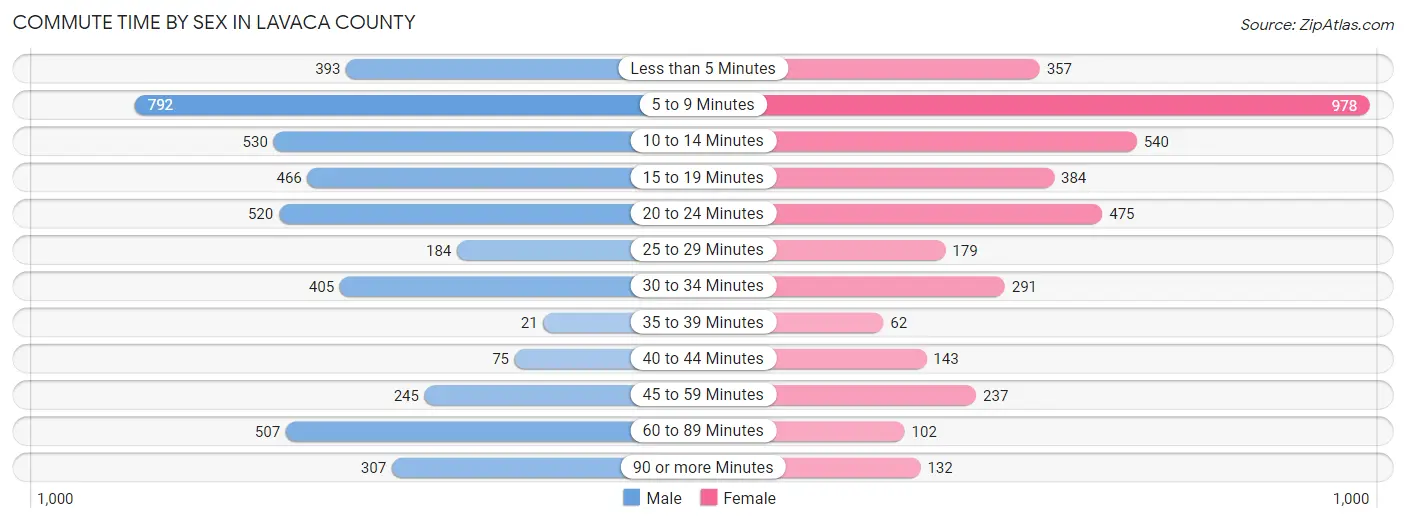
| Commute Time | Male | Female |
| Less than 5 Minutes | 393 (8.8%) | 357 (9.2%) |
| 5 to 9 Minutes | 792 (17.8%) | 978 (25.2%) |
| 10 to 14 Minutes | 530 (11.9%) | 540 (13.9%) |
| 15 to 19 Minutes | 466 (10.5%) | 384 (9.9%) |
| 20 to 24 Minutes | 520 (11.7%) | 475 (12.2%) |
| 25 to 29 Minutes | 184 (4.1%) | 179 (4.6%) |
| 30 to 34 Minutes | 405 (9.1%) | 291 (7.5%) |
| 35 to 39 Minutes | 21 (0.5%) | 62 (1.6%) |
| 40 to 44 Minutes | 75 (1.7%) | 143 (3.7%) |
| 45 to 59 Minutes | 245 (5.5%) | 237 (6.1%) |
| 60 to 89 Minutes | 507 (11.4%) | 102 (2.6%) |
| 90 or more Minutes | 307 (6.9%) | 132 (3.4%) |
Time of Departure to Work by Sex in Lavaca County
The most frequent times of departure to work in Lavaca County are 7:00 AM to 7:29 AM (884, 19.9%) for males and 7:30 AM to 7:59 AM (1,031, 26.6%) for females.
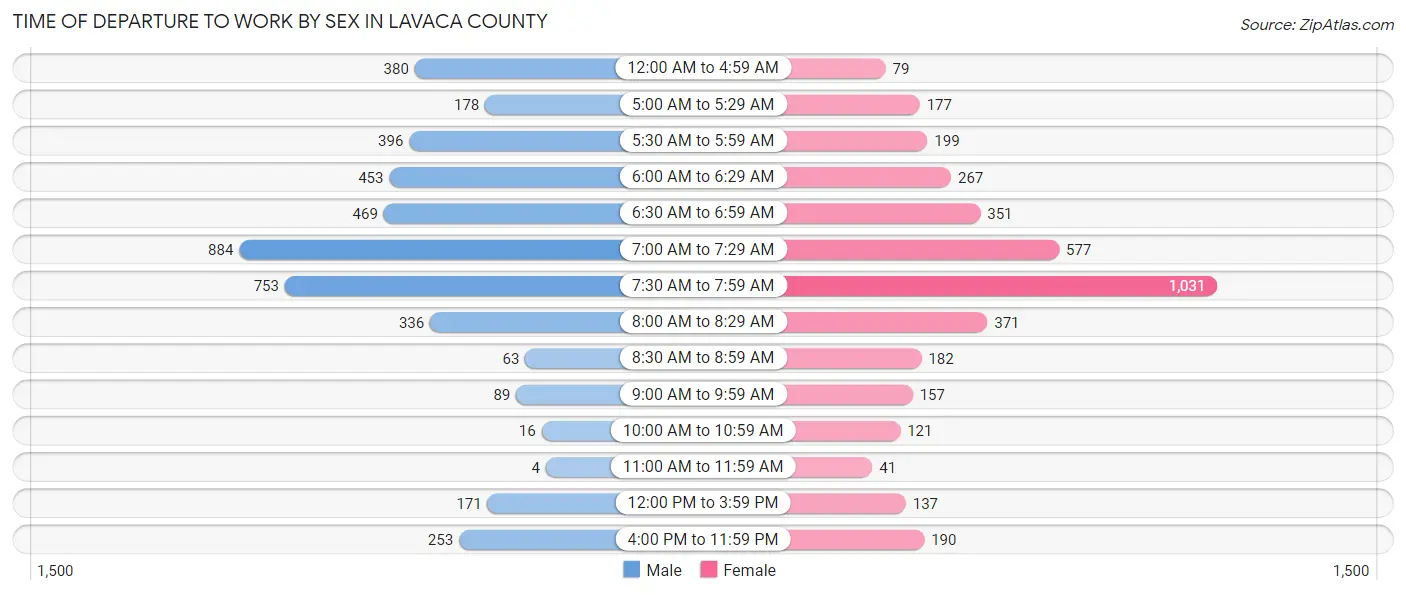
| Time of Departure | Male | Female |
| 12:00 AM to 4:59 AM | 380 (8.6%) | 79 (2.0%) |
| 5:00 AM to 5:29 AM | 178 (4.0%) | 177 (4.6%) |
| 5:30 AM to 5:59 AM | 396 (8.9%) | 199 (5.1%) |
| 6:00 AM to 6:29 AM | 453 (10.2%) | 267 (6.9%) |
| 6:30 AM to 6:59 AM | 469 (10.5%) | 351 (9.0%) |
| 7:00 AM to 7:29 AM | 884 (19.9%) | 577 (14.9%) |
| 7:30 AM to 7:59 AM | 753 (16.9%) | 1,031 (26.6%) |
| 8:00 AM to 8:29 AM | 336 (7.6%) | 371 (9.6%) |
| 8:30 AM to 8:59 AM | 63 (1.4%) | 182 (4.7%) |
| 9:00 AM to 9:59 AM | 89 (2.0%) | 157 (4.1%) |
| 10:00 AM to 10:59 AM | 16 (0.4%) | 121 (3.1%) |
| 11:00 AM to 11:59 AM | 4 (0.1%) | 41 (1.1%) |
| 12:00 PM to 3:59 PM | 171 (3.8%) | 137 (3.5%) |
| 4:00 PM to 11:59 PM | 253 (5.7%) | 190 (4.9%) |
| Total | 4,445 (100.0%) | 3,880 (100.0%) |
Housing Occupancy in Lavaca County
Occupancy by Ownership in Lavaca County
Of the total 8,206 dwellings in Lavaca County, owner-occupied units account for 6,261 (76.3%), while renter-occupied units make up 1,945 (23.7%).
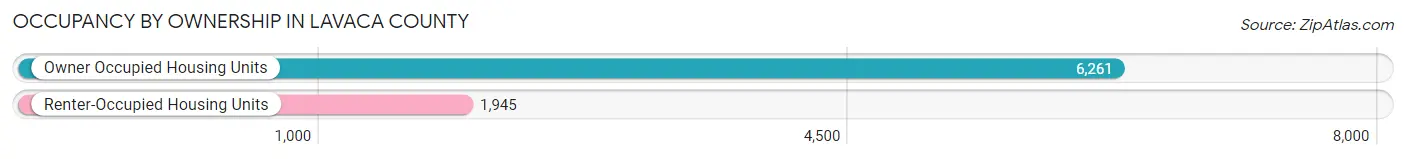
| Occupancy | # Housing Units | % Housing Units |
| Owner Occupied Housing Units | 6,261 | 76.3% |
| Renter-Occupied Housing Units | 1,945 | 23.7% |
| Total Occupied Housing Units | 8,206 | 100.0% |
Occupancy by Household Size in Lavaca County
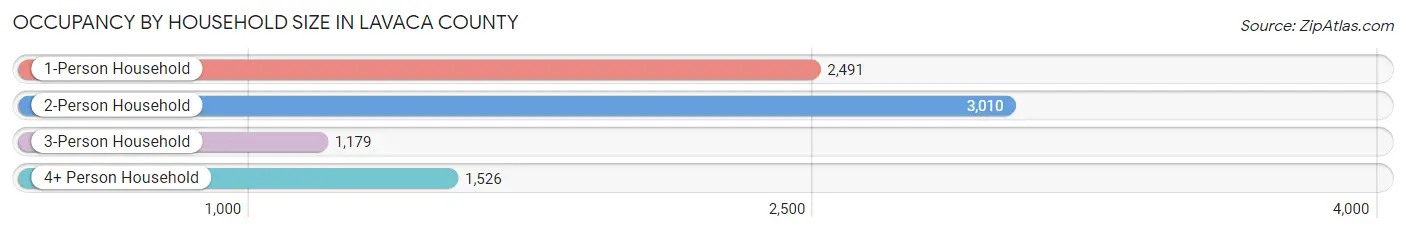
| Household Size | # Housing Units | % Housing Units |
| 1-Person Household | 2,491 | 30.4% |
| 2-Person Household | 3,010 | 36.7% |
| 3-Person Household | 1,179 | 14.4% |
| 4+ Person Household | 1,526 | 18.6% |
| Total Housing Units | 8,206 | 100.0% |
Occupancy by Ownership by Household Size in Lavaca County
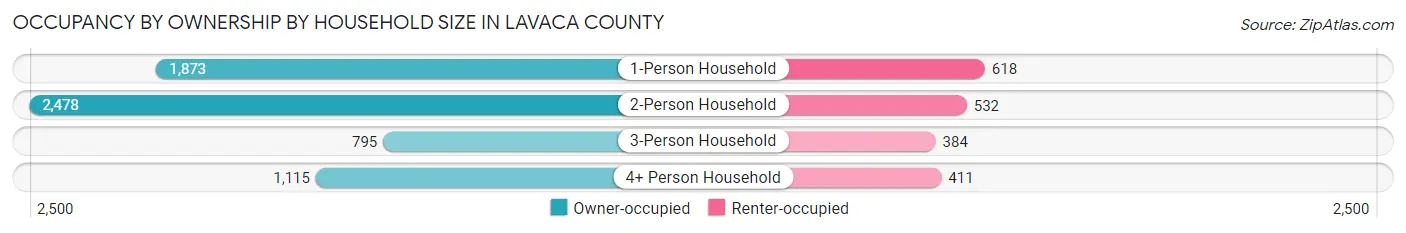
| Household Size | Owner-occupied | Renter-occupied |
| 1-Person Household | 1,873 (75.2%) | 618 (24.8%) |
| 2-Person Household | 2,478 (82.3%) | 532 (17.7%) |
| 3-Person Household | 795 (67.4%) | 384 (32.6%) |
| 4+ Person Household | 1,115 (73.1%) | 411 (26.9%) |
| Total Housing Units | 6,261 (76.3%) | 1,945 (23.7%) |
Occupancy by Educational Attainment in Lavaca County
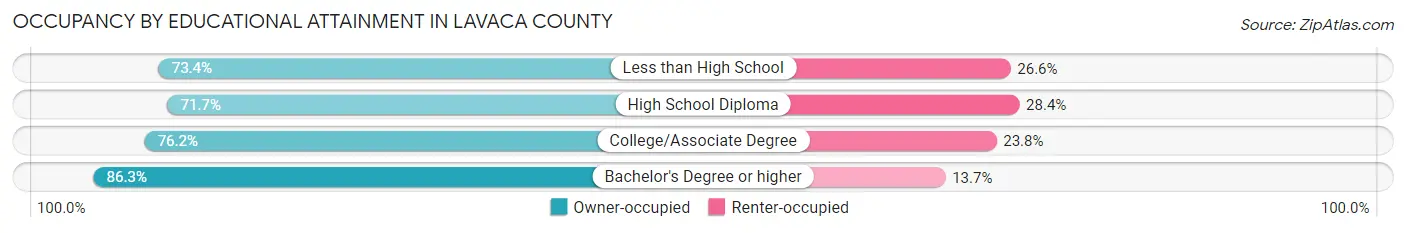
| Household Size | Owner-occupied | Renter-occupied |
| Less than High School | 764 (73.4%) | 277 (26.6%) |
| High School Diploma | 2,158 (71.7%) | 854 (28.3%) |
| College/Associate Degree | 1,845 (76.2%) | 577 (23.8%) |
| Bachelor's Degree or higher | 1,494 (86.3%) | 237 (13.7%) |
Occupancy by Age of Householder in Lavaca County
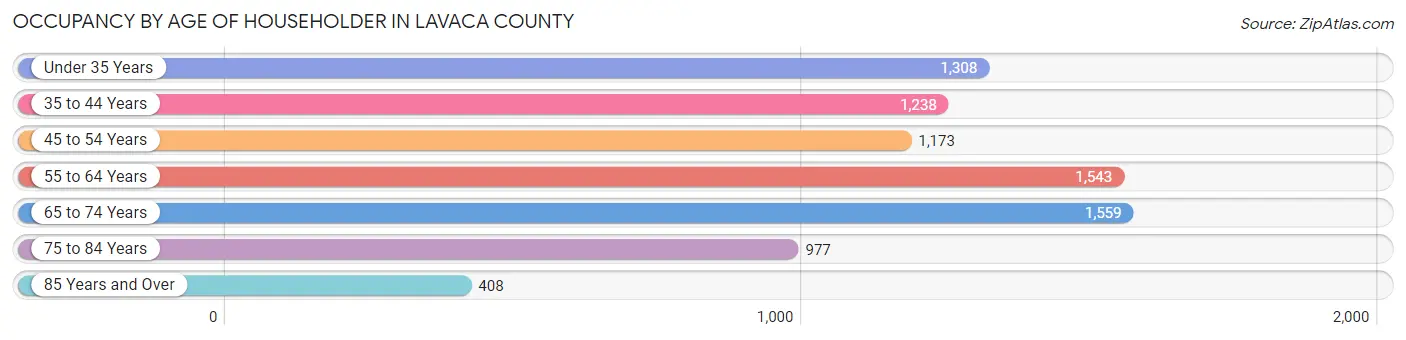
| Age Bracket | # Households | % Households |
| Under 35 Years | 1,308 | 15.9% |
| 35 to 44 Years | 1,238 | 15.1% |
| 45 to 54 Years | 1,173 | 14.3% |
| 55 to 64 Years | 1,543 | 18.8% |
| 65 to 74 Years | 1,559 | 19.0% |
| 75 to 84 Years | 977 | 11.9% |
| 85 Years and Over | 408 | 5.0% |
| Total | 8,206 | 100.0% |
Housing Finances in Lavaca County
Median Income by Occupancy in Lavaca County

| Occupancy Type | # Households | Median Income |
| Owner-Occupied | 6,261 (76.3%) | $65,410 |
| Renter-Occupied | 1,945 (23.7%) | $42,826 |
| Average | 8,206 (100.0%) | $58,530 |
Occupancy by Householder Income Bracket in Lavaca County
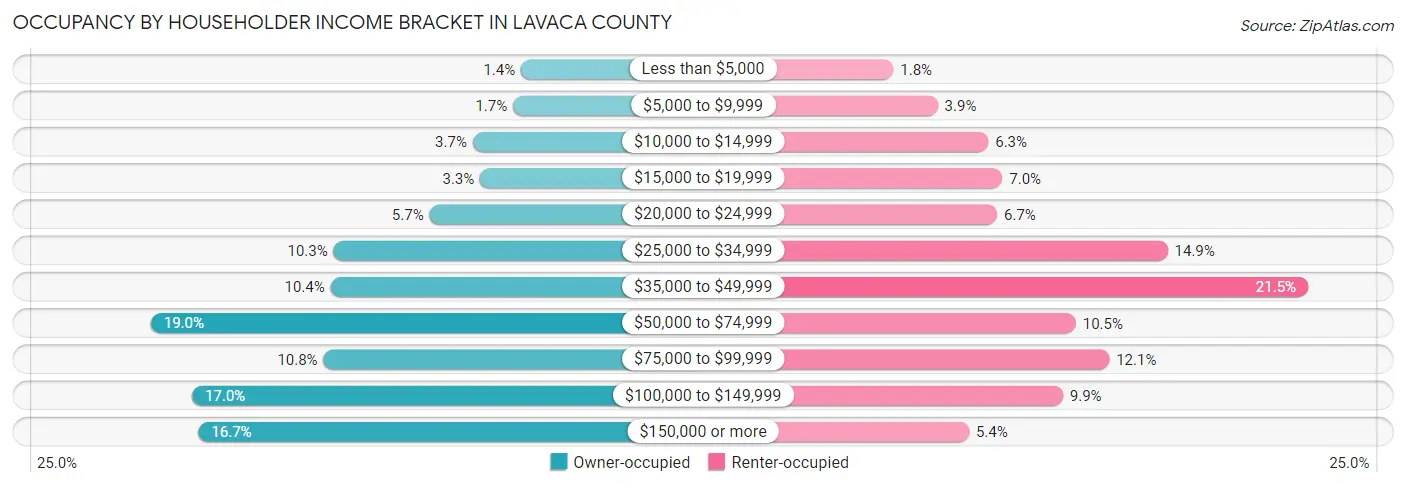
| Income Bracket | Owner-occupied | Renter-occupied |
| Less than $5,000 | 85 (1.4%) | 35 (1.8%) |
| $5,000 to $9,999 | 109 (1.7%) | 76 (3.9%) |
| $10,000 to $14,999 | 229 (3.7%) | 123 (6.3%) |
| $15,000 to $19,999 | 207 (3.3%) | 136 (7.0%) |
| $20,000 to $24,999 | 358 (5.7%) | 131 (6.7%) |
| $25,000 to $34,999 | 644 (10.3%) | 289 (14.9%) |
| $35,000 to $49,999 | 653 (10.4%) | 419 (21.5%) |
| $50,000 to $74,999 | 1,189 (19.0%) | 204 (10.5%) |
| $75,000 to $99,999 | 674 (10.8%) | 235 (12.1%) |
| $100,000 to $149,999 | 1,066 (17.0%) | 192 (9.9%) |
| $150,000 or more | 1,047 (16.7%) | 105 (5.4%) |
| Total | 6,261 (100.0%) | 1,945 (100.0%) |
Monthly Housing Cost Tiers in Lavaca County
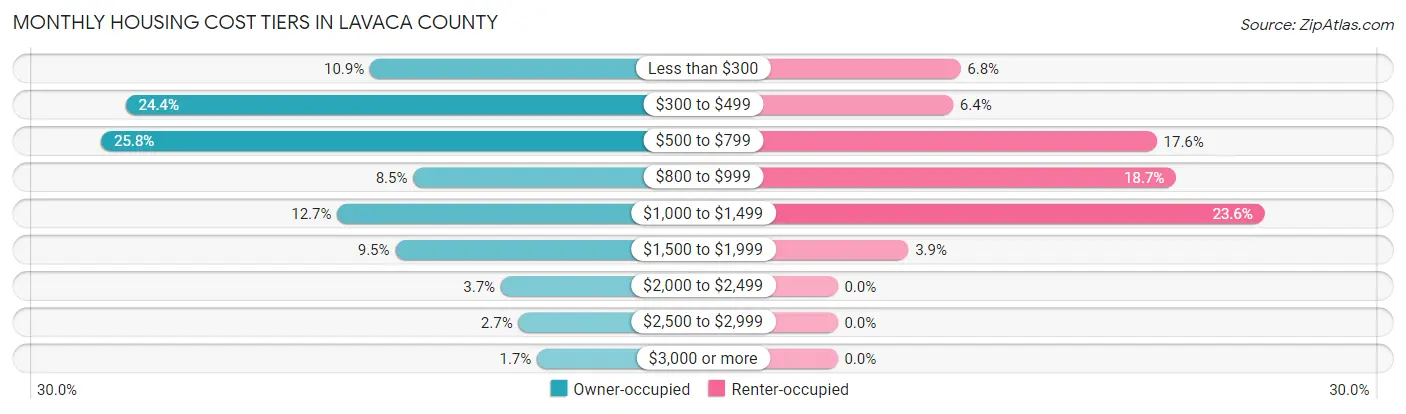
| Monthly Cost | Owner-occupied | Renter-occupied |
| Less than $300 | 684 (10.9%) | 132 (6.8%) |
| $300 to $499 | 1,529 (24.4%) | 124 (6.4%) |
| $500 to $799 | 1,614 (25.8%) | 343 (17.6%) |
| $800 to $999 | 534 (8.5%) | 364 (18.7%) |
| $1,000 to $1,499 | 797 (12.7%) | 459 (23.6%) |
| $1,500 to $1,999 | 596 (9.5%) | 76 (3.9%) |
| $2,000 to $2,499 | 231 (3.7%) | 0 (0.0%) |
| $2,500 to $2,999 | 170 (2.7%) | 0 (0.0%) |
| $3,000 or more | 106 (1.7%) | 0 (0.0%) |
| Total | 6,261 (100.0%) | 1,945 (100.0%) |
Physical Housing Characteristics in Lavaca County
Housing Structures in Lavaca County
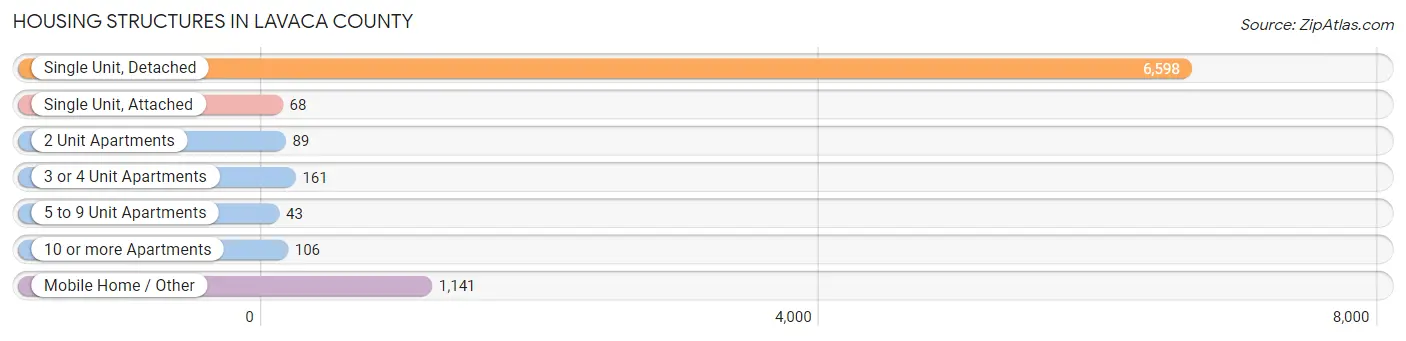
| Structure Type | # Housing Units | % Housing Units |
| Single Unit, Detached | 6,598 | 80.4% |
| Single Unit, Attached | 68 | 0.8% |
| 2 Unit Apartments | 89 | 1.1% |
| 3 or 4 Unit Apartments | 161 | 2.0% |
| 5 to 9 Unit Apartments | 43 | 0.5% |
| 10 or more Apartments | 106 | 1.3% |
| Mobile Home / Other | 1,141 | 13.9% |
| Total | 8,206 | 100.0% |
Housing Structures by Occupancy in Lavaca County
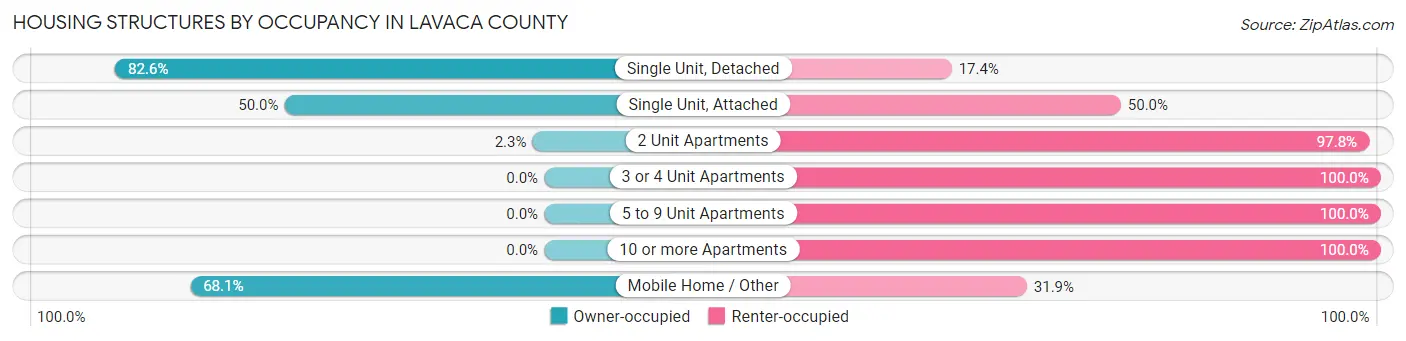
| Structure Type | Owner-occupied | Renter-occupied |
| Single Unit, Detached | 5,448 (82.6%) | 1,150 (17.4%) |
| Single Unit, Attached | 34 (50.0%) | 34 (50.0%) |
| 2 Unit Apartments | 2 (2.2%) | 87 (97.8%) |
| 3 or 4 Unit Apartments | 0 (0.0%) | 161 (100.0%) |
| 5 to 9 Unit Apartments | 0 (0.0%) | 43 (100.0%) |
| 10 or more Apartments | 0 (0.0%) | 106 (100.0%) |
| Mobile Home / Other | 777 (68.1%) | 364 (31.9%) |
| Total | 6,261 (76.3%) | 1,945 (23.7%) |
Housing Structures by Number of Rooms in Lavaca County
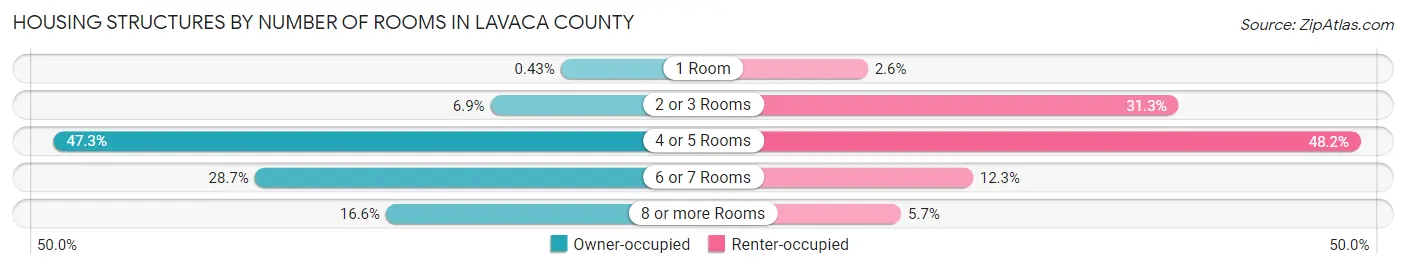
| Number of Rooms | Owner-occupied | Renter-occupied |
| 1 Room | 27 (0.4%) | 50 (2.6%) |
| 2 or 3 Rooms | 433 (6.9%) | 609 (31.3%) |
| 4 or 5 Rooms | 2,963 (47.3%) | 937 (48.2%) |
| 6 or 7 Rooms | 1,799 (28.7%) | 239 (12.3%) |
| 8 or more Rooms | 1,039 (16.6%) | 110 (5.7%) |
| Total | 6,261 (100.0%) | 1,945 (100.0%) |
Housing Structure by Heating Type in Lavaca County
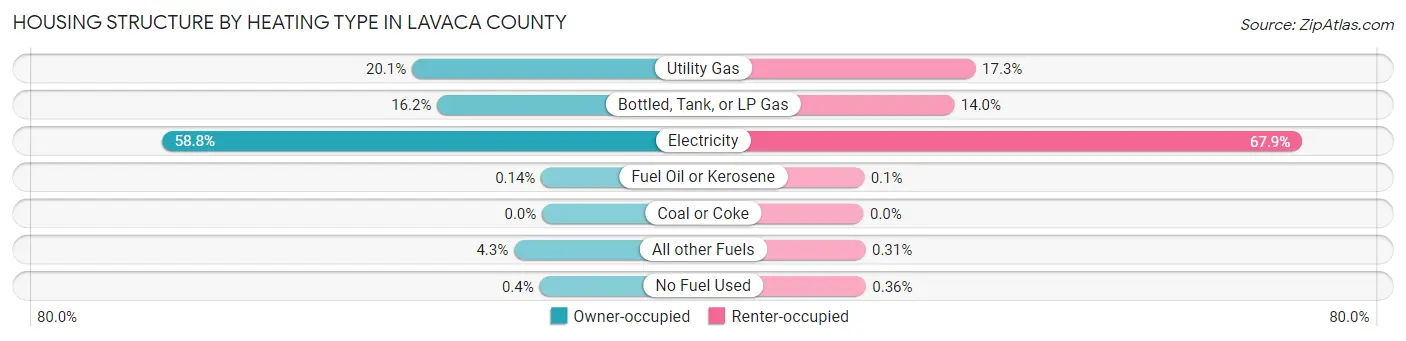
| Heating Type | Owner-occupied | Renter-occupied |
| Utility Gas | 1,259 (20.1%) | 337 (17.3%) |
| Bottled, Tank, or LP Gas | 1,015 (16.2%) | 273 (14.0%) |
| Electricity | 3,682 (58.8%) | 1,320 (67.9%) |
| Fuel Oil or Kerosene | 9 (0.1%) | 2 (0.1%) |
| Coal or Coke | 0 (0.0%) | 0 (0.0%) |
| All other Fuels | 271 (4.3%) | 6 (0.3%) |
| No Fuel Used | 25 (0.4%) | 7 (0.4%) |
| Total | 6,261 (100.0%) | 1,945 (100.0%) |
Household Vehicle Usage in Lavaca County
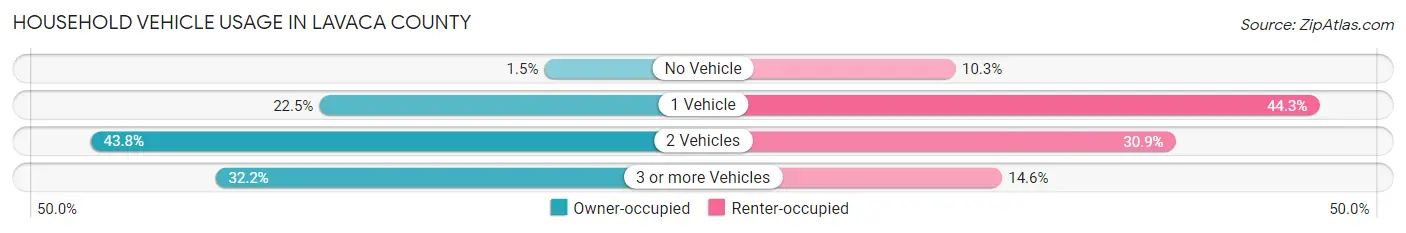
| Vehicles per Household | Owner-occupied | Renter-occupied |
| No Vehicle | 93 (1.5%) | 200 (10.3%) |
| 1 Vehicle | 1,409 (22.5%) | 861 (44.3%) |
| 2 Vehicles | 2,744 (43.8%) | 600 (30.8%) |
| 3 or more Vehicles | 2,015 (32.2%) | 284 (14.6%) |
| Total | 6,261 (100.0%) | 1,945 (100.0%) |
Real Estate & Mortgages in Lavaca County
Real Estate and Mortgage Overview in Lavaca County
| Characteristic | Without Mortgage | With Mortgage |
| Housing Units | 4,114 | 2,147 |
| Median Property Value | $196,100 | $234,100 |
| Median Household Income | $55,020 | $574 |
| Monthly Housing Costs | $482 | $106 |
| Real Estate Taxes | $1,669 | $103 |
Property Value by Mortgage Status in Lavaca County
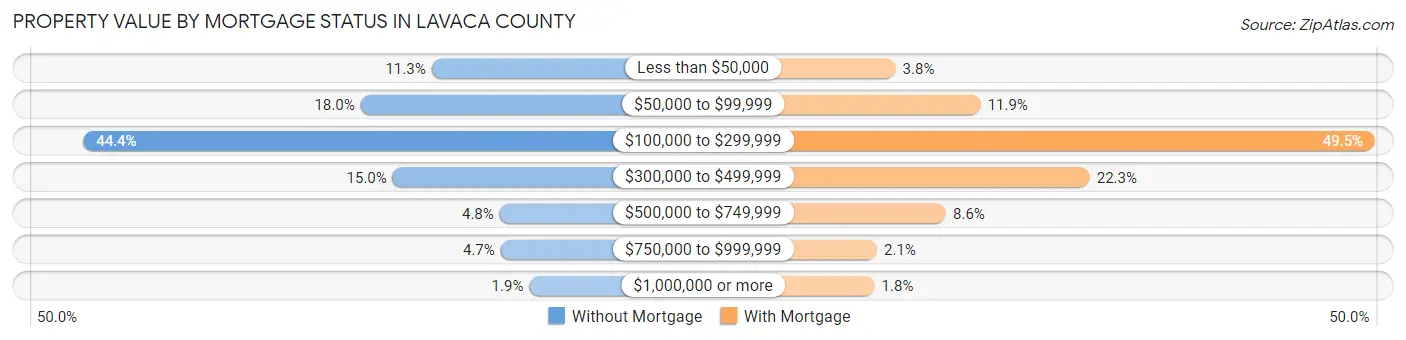
| Property Value | Without Mortgage | With Mortgage |
| Less than $50,000 | 463 (11.3%) | 82 (3.8%) |
| $50,000 to $99,999 | 741 (18.0%) | 256 (11.9%) |
| $100,000 to $299,999 | 1,827 (44.4%) | 1,062 (49.5%) |
| $300,000 to $499,999 | 615 (14.9%) | 479 (22.3%) |
| $500,000 to $749,999 | 196 (4.8%) | 185 (8.6%) |
| $750,000 to $999,999 | 192 (4.7%) | 44 (2.1%) |
| $1,000,000 or more | 80 (1.9%) | 39 (1.8%) |
| Total | 4,114 (100.0%) | 2,147 (100.0%) |
Household Income by Mortgage Status in Lavaca County
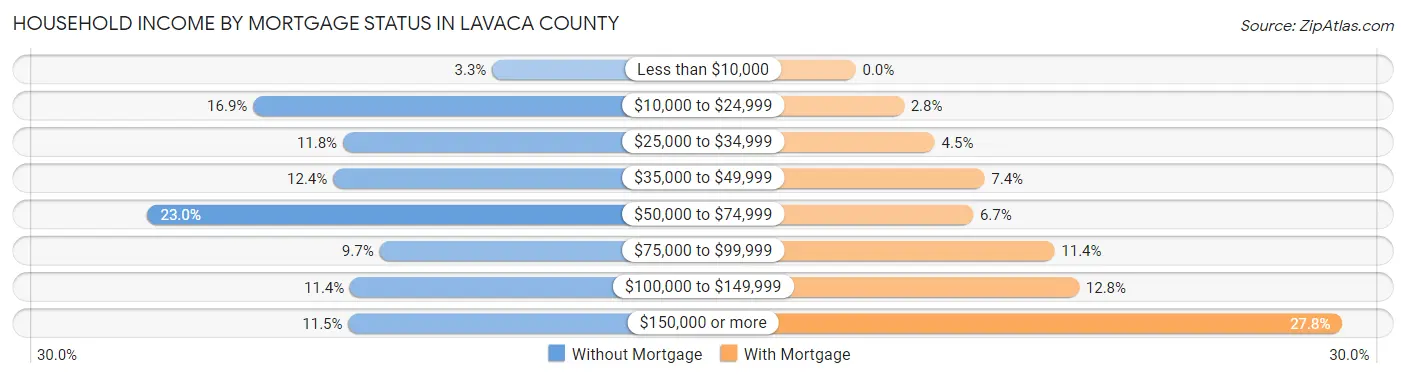
| Household Income | Without Mortgage | With Mortgage |
| Less than $10,000 | 135 (3.3%) | 0 (0.0%) |
| $10,000 to $24,999 | 697 (16.9%) | 59 (2.8%) |
| $25,000 to $34,999 | 486 (11.8%) | 97 (4.5%) |
| $35,000 to $49,999 | 509 (12.4%) | 158 (7.4%) |
| $50,000 to $74,999 | 945 (23.0%) | 144 (6.7%) |
| $75,000 to $99,999 | 400 (9.7%) | 244 (11.4%) |
| $100,000 to $149,999 | 469 (11.4%) | 274 (12.8%) |
| $150,000 or more | 473 (11.5%) | 597 (27.8%) |
| Total | 4,114 (100.0%) | 2,147 (100.0%) |
Property Value to Household Income Ratio in Lavaca County
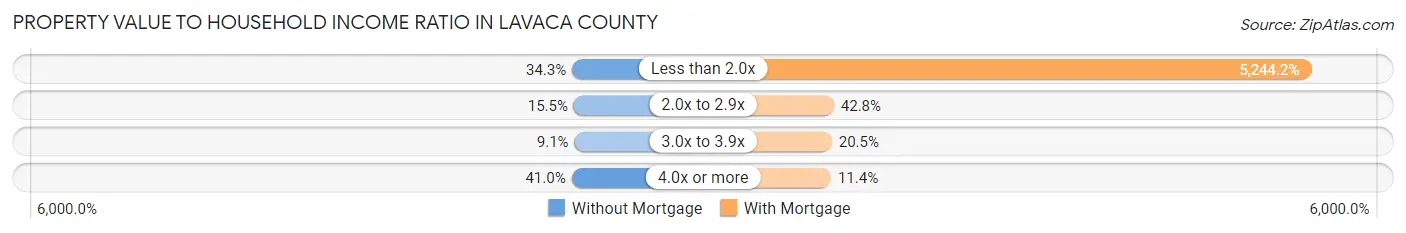
| Value-to-Income Ratio | Without Mortgage | With Mortgage |
| Less than 2.0x | 1,410 (34.3%) | 112,593 (5,244.2%) |
| 2.0x to 2.9x | 637 (15.5%) | 919 (42.8%) |
| 3.0x to 3.9x | 374 (9.1%) | 440 (20.5%) |
| 4.0x or more | 1,686 (41.0%) | 244 (11.4%) |
| Total | 4,114 (100.0%) | 2,147 (100.0%) |
Real Estate Taxes by Mortgage Status in Lavaca County
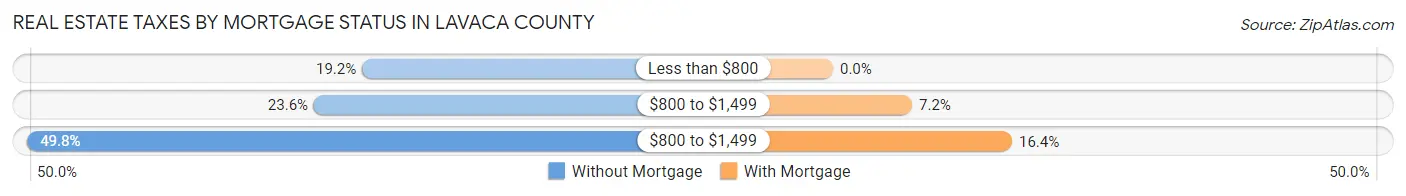
| Property Taxes | Without Mortgage | With Mortgage |
| Less than $800 | 789 (19.2%) | 0 (0.0%) |
| $800 to $1,499 | 970 (23.6%) | 155 (7.2%) |
| $800 to $1,499 | 2,047 (49.8%) | 351 (16.4%) |
| Total | 4,114 (100.0%) | 2,147 (100.0%) |
Health & Disability in Lavaca County
Health Insurance Coverage by Age in Lavaca County
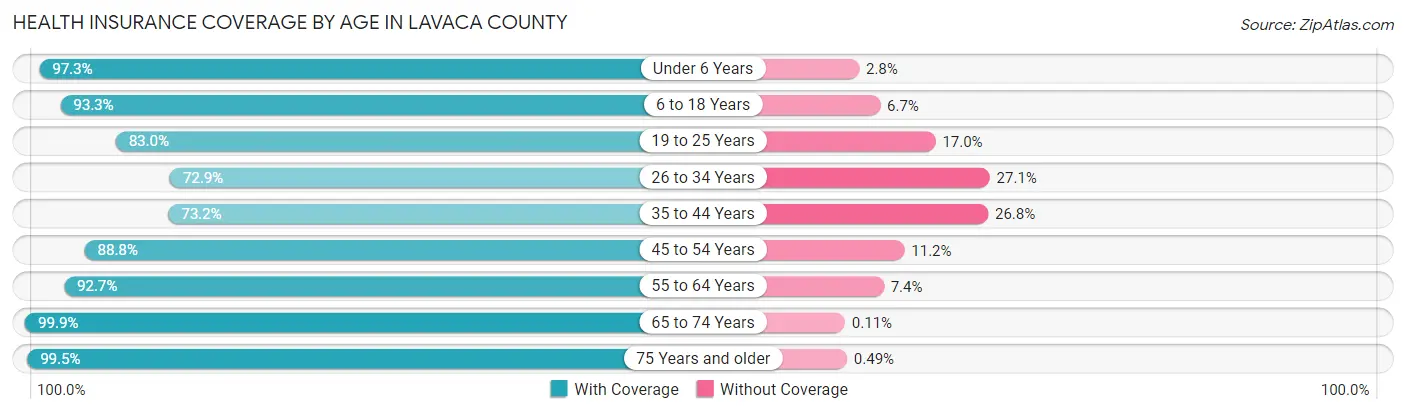
| Age Bracket | With Coverage | Without Coverage |
| Under 6 Years | 1,413 (97.3%) | 40 (2.8%) |
| 6 to 18 Years | 3,386 (93.3%) | 242 (6.7%) |
| 19 to 25 Years | 1,133 (83.0%) | 232 (17.0%) |
| 26 to 34 Years | 1,393 (72.9%) | 518 (27.1%) |
| 35 to 44 Years | 1,677 (73.2%) | 614 (26.8%) |
| 45 to 54 Years | 1,895 (88.8%) | 239 (11.2%) |
| 55 to 64 Years | 2,497 (92.6%) | 198 (7.3%) |
| 65 to 74 Years | 2,620 (99.9%) | 3 (0.1%) |
| 75 Years and older | 1,828 (99.5%) | 9 (0.5%) |
| Total | 17,842 (89.5%) | 2,095 (10.5%) |
Health Insurance Coverage by Citizenship Status in Lavaca County
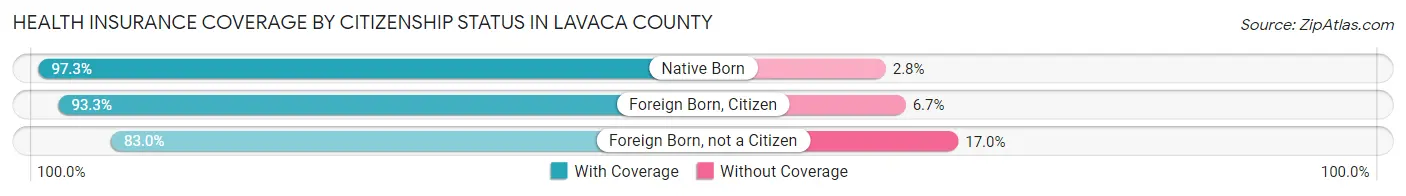
| Citizenship Status | With Coverage | Without Coverage |
| Native Born | 1,413 (97.3%) | 40 (2.8%) |
| Foreign Born, Citizen | 3,386 (93.3%) | 242 (6.7%) |
| Foreign Born, not a Citizen | 1,133 (83.0%) | 232 (17.0%) |
Health Insurance Coverage by Household Income in Lavaca County
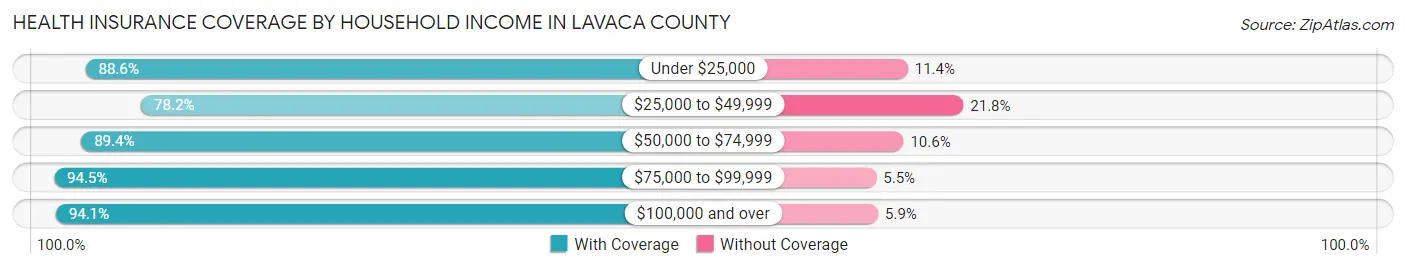
| Household Income | With Coverage | Without Coverage |
| Under $25,000 | 2,015 (88.6%) | 260 (11.4%) |
| $25,000 to $49,999 | 3,182 (78.2%) | 889 (21.8%) |
| $50,000 to $74,999 | 2,962 (89.4%) | 352 (10.6%) |
| $75,000 to $99,999 | 2,300 (94.5%) | 135 (5.5%) |
| $100,000 and over | 7,375 (94.1%) | 459 (5.9%) |
Public vs Private Health Insurance Coverage by Age in Lavaca County
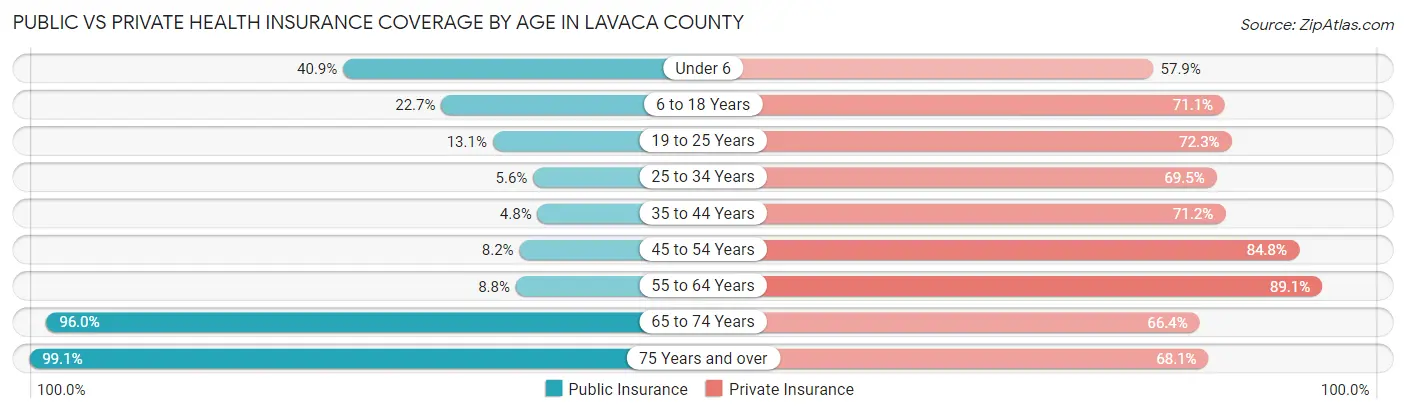
| Age Bracket | Public Insurance | Private Insurance |
| Under 6 | 594 (40.9%) | 841 (57.9%) |
| 6 to 18 Years | 822 (22.7%) | 2,580 (71.1%) |
| 19 to 25 Years | 179 (13.1%) | 987 (72.3%) |
| 25 to 34 Years | 107 (5.6%) | 1,329 (69.5%) |
| 35 to 44 Years | 110 (4.8%) | 1,630 (71.2%) |
| 45 to 54 Years | 174 (8.2%) | 1,810 (84.8%) |
| 55 to 64 Years | 238 (8.8%) | 2,402 (89.1%) |
| 65 to 74 Years | 2,517 (96.0%) | 1,742 (66.4%) |
| 75 Years and over | 1,821 (99.1%) | 1,250 (68.0%) |
| Total | 6,562 (32.9%) | 14,571 (73.1%) |
Disability Status by Sex by Age in Lavaca County
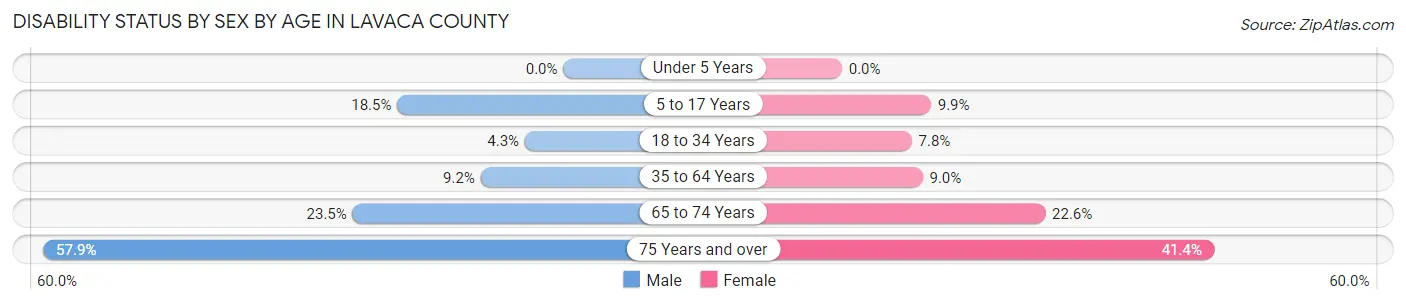
| Age Bracket | Male | Female |
| Under 5 Years | 0 (0.0%) | 0 (0.0%) |
| 5 to 17 Years | 343 (18.5%) | 176 (9.9%) |
| 18 to 34 Years | 76 (4.3%) | 138 (7.8%) |
| 35 to 64 Years | 331 (9.2%) | 317 (9.0%) |
| 65 to 74 Years | 287 (23.5%) | 317 (22.6%) |
| 75 Years and over | 460 (57.9%) | 432 (41.4%) |
Disability Class by Sex by Age in Lavaca County
Disability Class: Hearing Difficulty
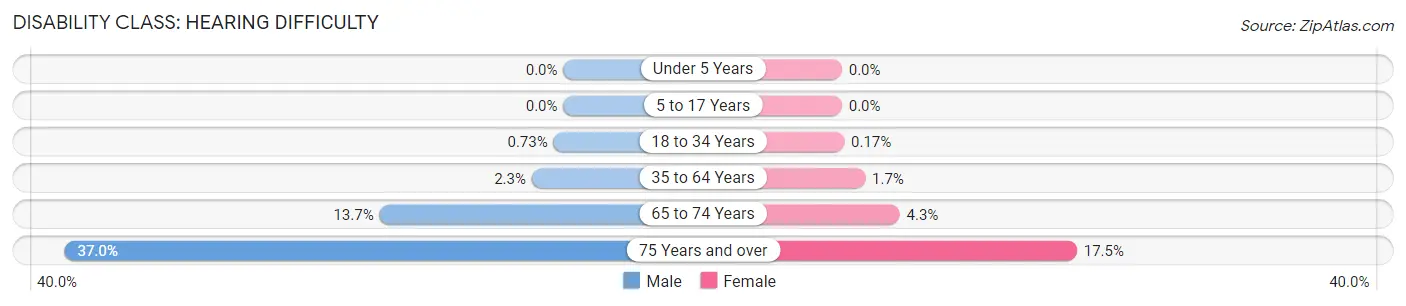
| Age Bracket | Male | Female |
| Under 5 Years | 0 (0.0%) | 0 (0.0%) |
| 5 to 17 Years | 0 (0.0%) | 0 (0.0%) |
| 18 to 34 Years | 13 (0.7%) | 3 (0.2%) |
| 35 to 64 Years | 84 (2.3%) | 61 (1.7%) |
| 65 to 74 Years | 167 (13.7%) | 60 (4.3%) |
| 75 Years and over | 294 (37.0%) | 182 (17.4%) |
Disability Class: Vision Difficulty
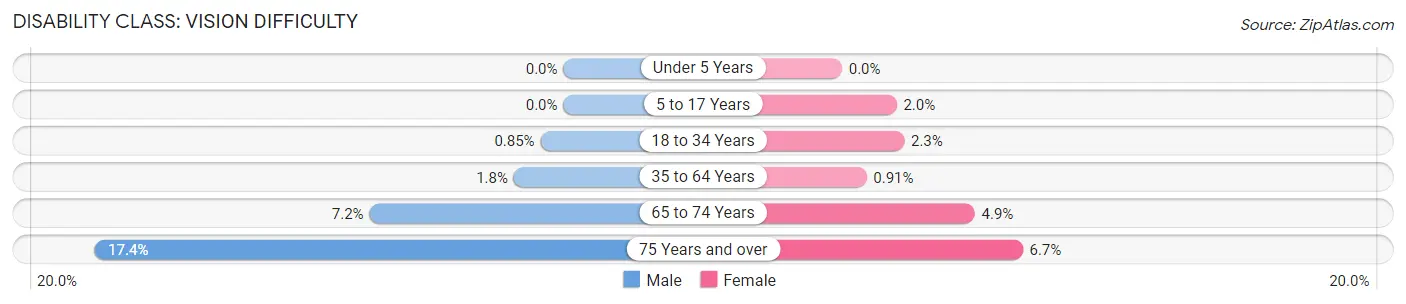
| Age Bracket | Male | Female |
| Under 5 Years | 0 (0.0%) | 0 (0.0%) |
| 5 to 17 Years | 0 (0.0%) | 36 (2.0%) |
| 18 to 34 Years | 15 (0.9%) | 41 (2.3%) |
| 35 to 64 Years | 66 (1.8%) | 32 (0.9%) |
| 65 to 74 Years | 88 (7.2%) | 69 (4.9%) |
| 75 Years and over | 138 (17.4%) | 70 (6.7%) |
Disability Class: Cognitive Difficulty
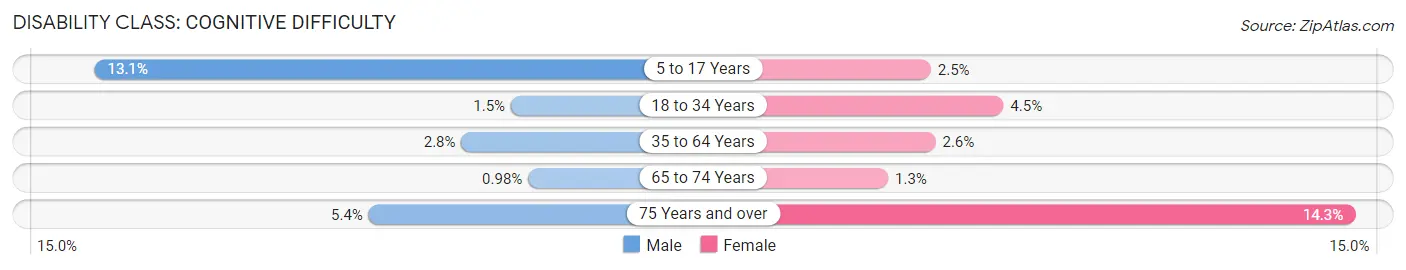
| Age Bracket | Male | Female |
| 5 to 17 Years | 242 (13.1%) | 44 (2.5%) |
| 18 to 34 Years | 26 (1.5%) | 80 (4.5%) |
| 35 to 64 Years | 102 (2.8%) | 92 (2.6%) |
| 65 to 74 Years | 12 (1.0%) | 18 (1.3%) |
| 75 Years and over | 43 (5.4%) | 149 (14.3%) |
Disability Class: Ambulatory Difficulty
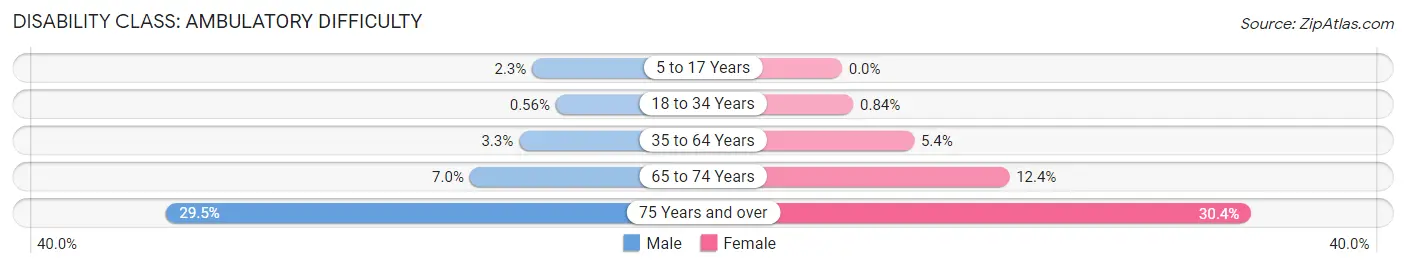
| Age Bracket | Male | Female |
| 5 to 17 Years | 43 (2.3%) | 0 (0.0%) |
| 18 to 34 Years | 10 (0.6%) | 15 (0.8%) |
| 35 to 64 Years | 118 (3.3%) | 189 (5.4%) |
| 65 to 74 Years | 85 (7.0%) | 174 (12.4%) |
| 75 Years and over | 234 (29.5%) | 317 (30.4%) |
Disability Class: Self-Care Difficulty
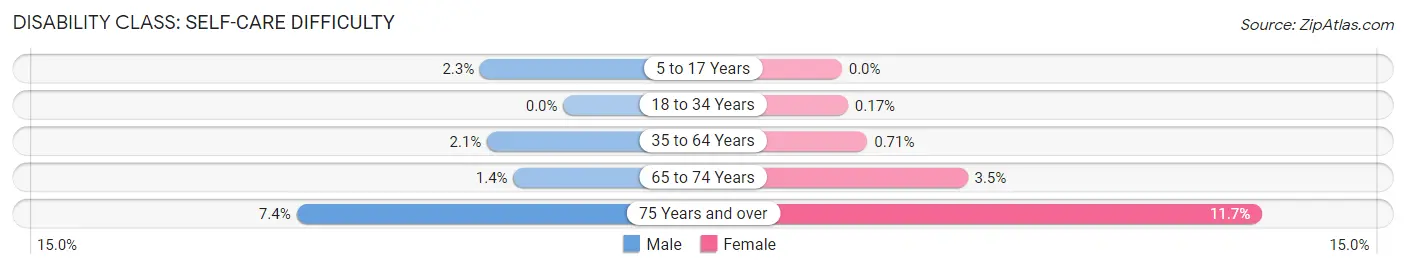
| Age Bracket | Male | Female |
| 5 to 17 Years | 43 (2.3%) | 0 (0.0%) |
| 18 to 34 Years | 0 (0.0%) | 3 (0.2%) |
| 35 to 64 Years | 76 (2.1%) | 25 (0.7%) |
| 65 to 74 Years | 17 (1.4%) | 49 (3.5%) |
| 75 Years and over | 59 (7.4%) | 122 (11.7%) |
Technology Access in Lavaca County
Computing Device Access in Lavaca County
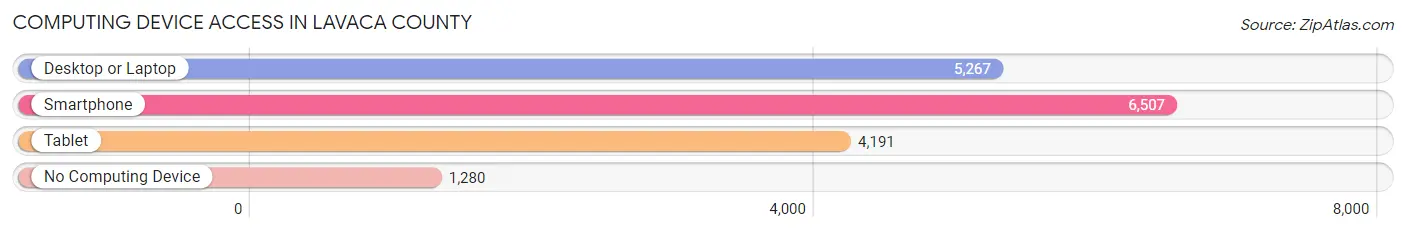
| Device Type | # Households | % Households |
| Desktop or Laptop | 5,267 | 64.2% |
| Smartphone | 6,507 | 79.3% |
| Tablet | 4,191 | 51.1% |
| No Computing Device | 1,280 | 15.6% |
| Total | 8,206 | 100.0% |
Internet Access in Lavaca County
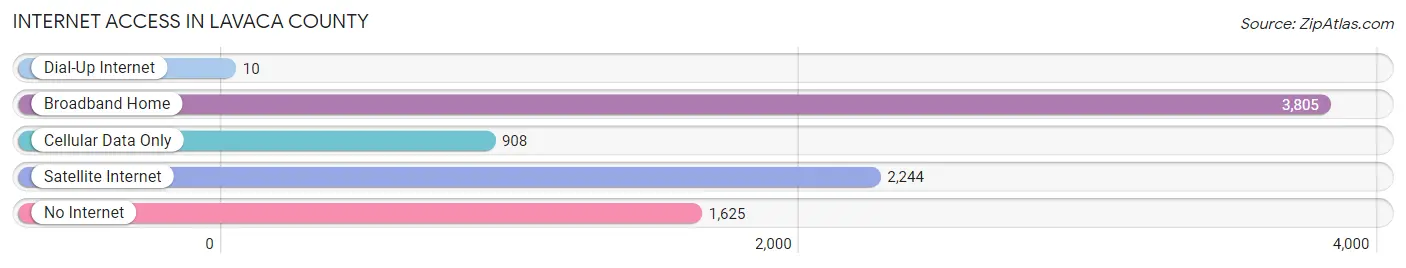
| Internet Type | # Households | % Households |
| Dial-Up Internet | 10 | 0.1% |
| Broadband Home | 3,805 | 46.4% |
| Cellular Data Only | 908 | 11.1% |
| Satellite Internet | 2,244 | 27.4% |
| No Internet | 1,625 | 19.8% |
| Total | 8,206 | 100.0% |
Lavaca County Summary
Lavaca County is located in the southeastern part of Texas, in the United States. It is part of the Victoria, Texas Metropolitan Statistical Area. The county seat is Hallettsville. The county was created in 1846 and named after the Lavaca River, which runs through the county.
Geography
Lavaca County is located in the southeastern part of Texas, in the United States. It is bordered by Jackson County to the north, Victoria County to the east, Calhoun County to the south, and Fayette County to the west. The county covers an area of 1,072 square miles, of which 1,062 square miles is land and 10 square miles is water. The terrain is mostly flat, with some rolling hills in the western part of the county. The Lavaca River runs through the county, and there are several creeks and streams in the area.
Demographics
As of the 2010 census, Lavaca County had a population of 19,263. The racial makeup of the county was 81.3% White, 11.7% Hispanic or Latino, 6.2% African American, 0.5% Native American, 0.3% Asian, 0.1% Pacific Islander, and 0.4% from other races. The median household income was $41,945, and the median family income was $50,945.
Economy
Lavaca County's economy is largely based on agriculture. The county is home to several large farms, which produce cotton, corn, sorghum, hay, and other crops. Livestock production is also important to the local economy, with cattle, hogs, and poultry being raised in the area. The county is also home to several oil and gas fields, which provide jobs and revenue for the local economy.
In addition to agriculture and oil and gas, Lavaca County is home to several manufacturing companies. The county is home to several food processing plants, as well as a number of metal fabrication and machine shops. The county is also home to several retail stores, restaurants, and other businesses.
History
Lavaca County was created in 1846 from parts of Jackson, Victoria, and Fayette counties. The county was named after the Lavaca River, which runs through the county. The county seat was originally located in Hallettsville, which was founded in 1846.
In the late 19th century, the county was home to several large ranches, which raised cattle and other livestock. The county was also home to several oil and gas fields, which provided jobs and revenue for the local economy.
In the early 20th century, the county was home to several large farms, which produced cotton, corn, sorghum, hay, and other crops. The county was also home to several manufacturing companies, which produced food products, metal products, and other goods.
Today, Lavaca County is still largely agricultural, with several large farms and ranches in the area. The county is also home to several oil and gas fields, as well as several manufacturing companies. The county is also home to several retail stores, restaurants, and other businesses.
Common Questions
What is Per Capita Income in Lavaca County?
Per Capita income in Lavaca County is $34,591.
What is the Median Family Income in Lavaca County?
Median Family Income in Lavaca County is $80,907.
What is the Median Household income in Lavaca County?
Median Household Income in Lavaca County is $58,530.
What is Income or Wage Gap in Lavaca County?
Income or Wage Gap in Lavaca County is 30.7%.
Women in Lavaca County earn 69.3 cents for every dollar earned by a man.
What is Family Income Deficit in Lavaca County?
Family Income Deficit in Lavaca County is $10,347.
Families that are below poverty line in Lavaca County earn $10,347 less on average than the poverty threshold level.
What is Inequality or Gini Index in Lavaca County?
Inequality or Gini Index in Lavaca County is 0.45.
What is the Total Population of Lavaca County?
Total Population of Lavaca County is 20,379.
What is the Total Male Population of Lavaca County?
Total Male Population of Lavaca County is 10,068.
What is the Total Female Population of Lavaca County?
Total Female Population of Lavaca County is 10,311.
What is the Ratio of Males per 100 Females in Lavaca County?
There are 97.64 Males per 100 Females in Lavaca County.
What is the Ratio of Females per 100 Males in Lavaca County?
There are 102.41 Females per 100 Males in Lavaca County.
What is the Median Population Age in Lavaca County?
Median Population Age in Lavaca County is 43.4 Years.
What is the Average Family Size in Lavaca County
Average Family Size in Lavaca County is 3.0 People.
What is the Average Household Size in Lavaca County
Average Household Size in Lavaca County is 2.4 People.
How Large is the Labor Force in Lavaca County?
There are 9,661 People in the Labor Forcein in Lavaca County.
What is the Percentage of People in the Labor Force in Lavaca County?
60.0% of People are in the Labor Force in Lavaca County.
What is the Unemployment Rate in Lavaca County?
Unemployment Rate in Lavaca County is 3.0%.