Lampasas County, TX Map & Demographics
Lampasas County Map
Lampasas County Overview
$33,787
PER CAPITA INCOME
$88,527
AVG FAMILY INCOME
$73,269
AVG HOUSEHOLD INCOME
37.0%
WAGE / INCOME GAP [ % ]
63.0¢/ $1
WAGE / INCOME GAP [ $ ]
0.41
INEQUALITY / GINI INDEX
21,829
TOTAL POPULATION
11,019
MALE POPULATION
10,810
FEMALE POPULATION
101.93
MALES / 100 FEMALES
98.10
FEMALES / 100 MALES
43.8
MEDIAN AGE
3.2
AVG FAMILY SIZE
2.7
AVG HOUSEHOLD SIZE
9,457
LABOR FORCE [ PEOPLE ]
53.4%
PERCENT IN LABOR FORCE
5.3%
UNEMPLOYMENT RATE
Income in Lampasas County
Income Overview in Lampasas County
Per Capita Income in Lampasas County is $33,787, while median incomes of families and households are $88,527 and $73,269 respectively.
| Characteristic | Number | Measure |
| Per Capita Income | 21,829 | $33,787 |
| Median Family Income | 5,750 | $88,527 |
| Mean Family Income | 5,750 | $103,666 |
| Median Household Income | 7,934 | $73,269 |
| Mean Household Income | 7,934 | $89,550 |
| Income Deficit | 5,750 | $0 |
| Wage / Income Gap (%) | 21,829 | 37.03% |
| Wage / Income Gap ($) | 21,829 | 62.97¢ per $1 |
| Gini / Inequality Index | 21,829 | 0.41 |
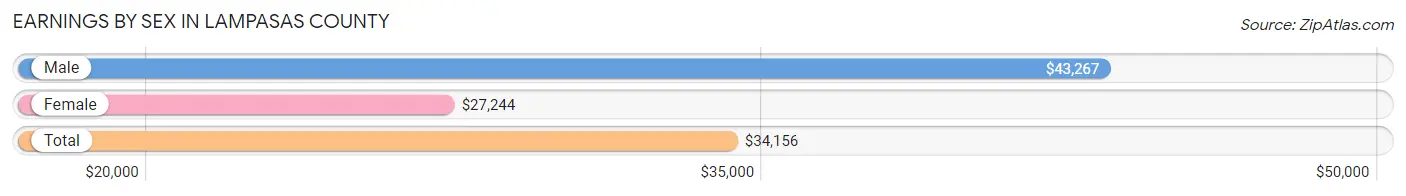
Earnings by Sex in Lampasas County
Average Earnings in Lampasas County are $34,156, $43,267 for men and $27,244 for women, a difference of 37.0%.
| Sex | Number | Average Earnings |
| Male | 5,804 (55.8%) | $43,267 |
| Female | 4,597 (44.2%) | $27,244 |
| Total | 10,401 (100.0%) | $34,156 |
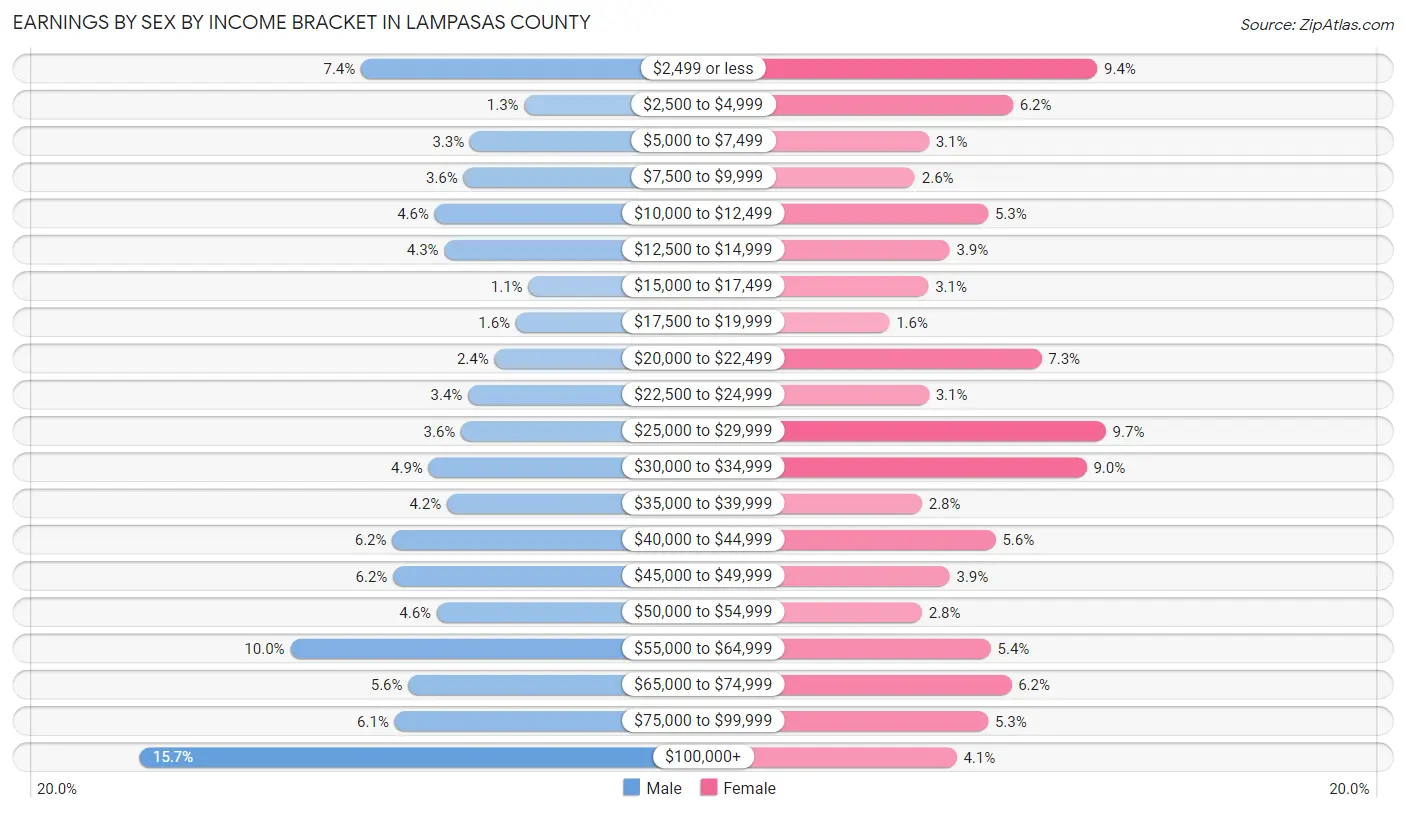
Earnings by Sex by Income Bracket in Lampasas County
The most common earnings brackets in Lampasas County are $100,000+ for men (910 | 15.7%) and $25,000 to $29,999 for women (446 | 9.7%).
| Income | Male | Female |
| $2,499 or less | 429 (7.4%) | 431 (9.4%) |
| $2,500 to $4,999 | 74 (1.3%) | 286 (6.2%) |
| $5,000 to $7,499 | 192 (3.3%) | 141 (3.1%) |
| $7,500 to $9,999 | 206 (3.5%) | 117 (2.5%) |
| $10,000 to $12,499 | 269 (4.6%) | 243 (5.3%) |
| $12,500 to $14,999 | 248 (4.3%) | 177 (3.8%) |
| $15,000 to $17,499 | 65 (1.1%) | 140 (3.0%) |
| $17,500 to $19,999 | 92 (1.6%) | 73 (1.6%) |
| $20,000 to $22,499 | 139 (2.4%) | 335 (7.3%) |
| $22,500 to $24,999 | 196 (3.4%) | 141 (3.1%) |
| $25,000 to $29,999 | 211 (3.6%) | 446 (9.7%) |
| $30,000 to $34,999 | 282 (4.9%) | 413 (9.0%) |
| $35,000 to $39,999 | 242 (4.2%) | 129 (2.8%) |
| $40,000 to $44,999 | 361 (6.2%) | 256 (5.6%) |
| $45,000 to $49,999 | 359 (6.2%) | 177 (3.8%) |
| $50,000 to $54,999 | 264 (4.5%) | 129 (2.8%) |
| $55,000 to $64,999 | 583 (10.0%) | 248 (5.4%) |
| $65,000 to $74,999 | 326 (5.6%) | 283 (6.2%) |
| $75,000 to $99,999 | 356 (6.1%) | 243 (5.3%) |
| $100,000+ | 910 (15.7%) | 189 (4.1%) |
| Total | 5,804 (100.0%) | 4,597 (100.0%) |
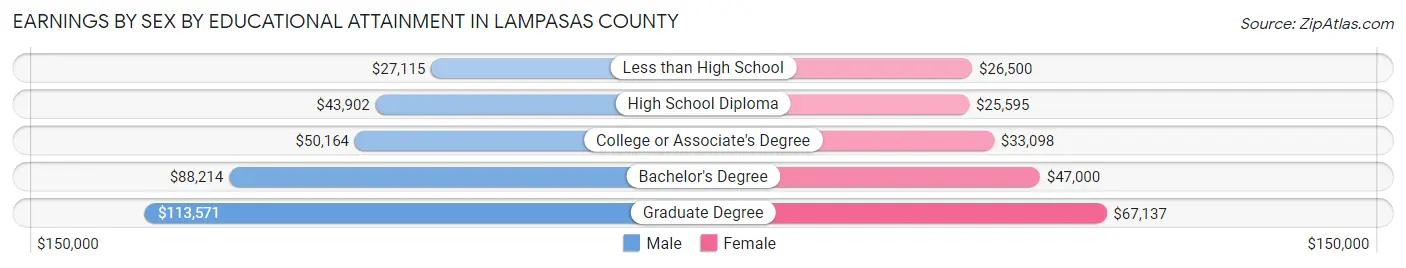
Earnings by Sex by Educational Attainment in Lampasas County
Average earnings in Lampasas County are $47,878 for men and $31,931 for women, a difference of 33.3%. Men with an educational attainment of graduate degree enjoy the highest average annual earnings of $113,571, while those with less than high school education earn the least with $27,115. Women with an educational attainment of graduate degree earn the most with the average annual earnings of $67,137, while those with high school diploma education have the smallest earnings of $25,595.
| Educational Attainment | Male Income | Female Income |
| Less than High School | $27,115 | $26,500 |
| High School Diploma | $43,902 | $25,595 |
| College or Associate's Degree | $50,164 | $33,098 |
| Bachelor's Degree | $88,214 | $47,000 |
| Graduate Degree | $113,571 | $67,137 |
| Total | $47,878 | $31,931 |
Family Income in Lampasas County
Family Income Brackets in Lampasas County
According to the Lampasas County family income data, there are 1,219 families falling into the $100,000 to $149,999 income range, which is the most common income bracket and makes up 21.2% of all families. Conversely, the $10,000 to $14,999 income bracket is the least frequent group with only 52 families (0.9%) belonging to this category.
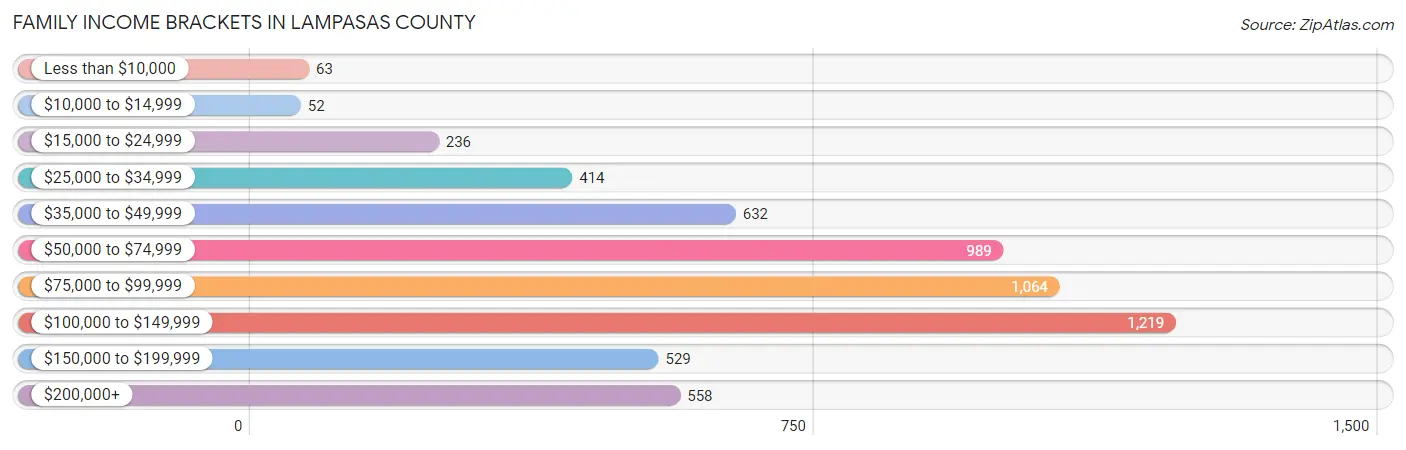
| Income Bracket | # Families | % Families |
| Less than $10,000 | 63 | 1.1% |
| $10,000 to $14,999 | 52 | 0.9% |
| $15,000 to $24,999 | 236 | 4.1% |
| $25,000 to $34,999 | 414 | 7.2% |
| $35,000 to $49,999 | 632 | 11.0% |
| $50,000 to $74,999 | 989 | 17.2% |
| $75,000 to $99,999 | 1,064 | 18.5% |
| $100,000 to $149,999 | 1,219 | 21.2% |
| $150,000 to $199,999 | 529 | 9.2% |
| $200,000+ | 558 | 9.7% |
Family Income by Famaliy Size in Lampasas County
5-person families (625 | 10.9%) account for the highest median family income in Lampasas County with $124,010 per family, while 2-person families (2,625 | 45.7%) have the highest median income of $42,218 per family member.
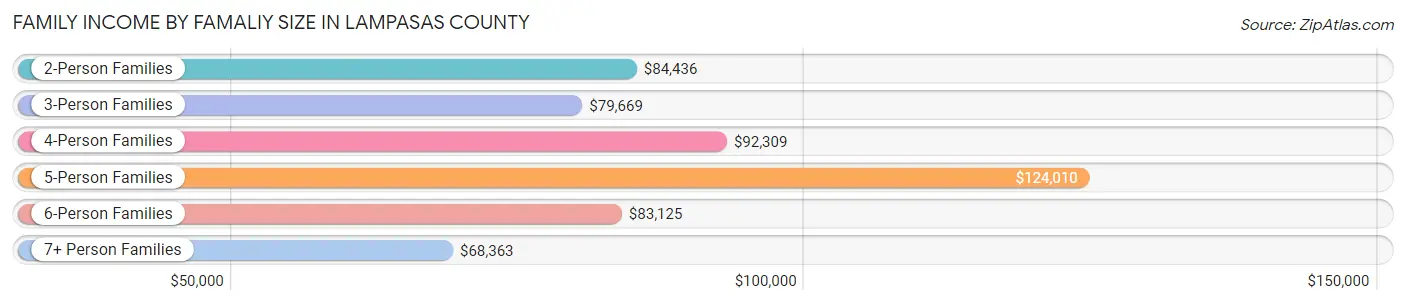
| Income Bracket | # Families | Median Income |
| 2-Person Families | 2,625 (45.7%) | $84,436 |
| 3-Person Families | 1,489 (25.9%) | $79,669 |
| 4-Person Families | 817 (14.2%) | $92,309 |
| 5-Person Families | 625 (10.9%) | $124,010 |
| 6-Person Families | 117 (2.0%) | $83,125 |
| 7+ Person Families | 77 (1.3%) | $68,363 |
| Total | 5,750 (100.0%) | $88,527 |
Family Income by Number of Earners in Lampasas County
The median family income in Lampasas County is $88,527, with families comprising 3+ earners (541) having the highest median family income of $121,023, while families with no earners (1,098) have the lowest median family income of $67,566, accounting for 9.4% and 19.1% of families, respectively.
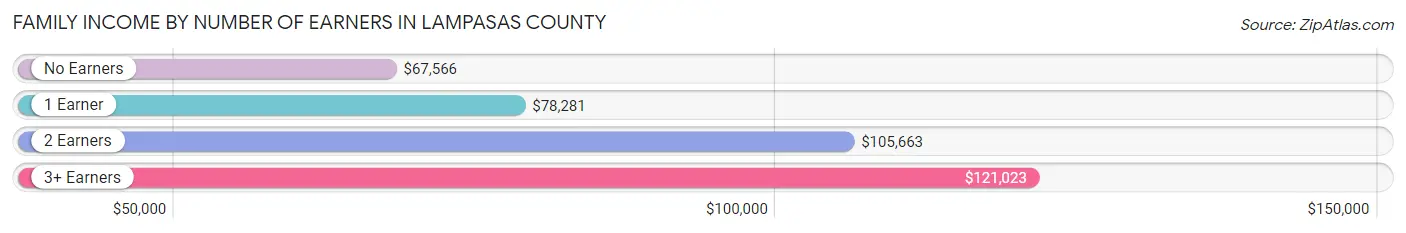
| Number of Earners | # Families | Median Income |
| No Earners | 1,098 (19.1%) | $67,566 |
| 1 Earner | 2,071 (36.0%) | $78,281 |
| 2 Earners | 2,040 (35.5%) | $105,663 |
| 3+ Earners | 541 (9.4%) | $121,023 |
| Total | 5,750 (100.0%) | $88,527 |
Household Income in Lampasas County
Household Income Brackets in Lampasas County
With 1,420 households falling in the category, the $100,000 to $149,999 income range is the most frequent in Lampasas County, accounting for 17.9% of all households. In contrast, only 206 households (2.6%) fall into the less than $10,000 income bracket, making it the least populous group.
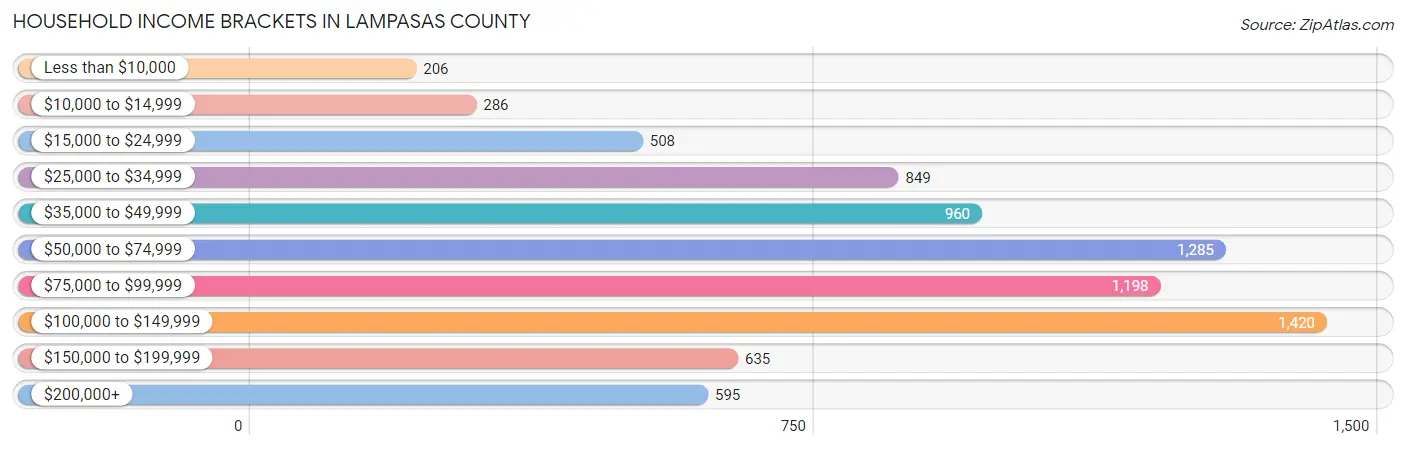
| Income Bracket | # Households | % Households |
| Less than $10,000 | 206 | 2.6% |
| $10,000 to $14,999 | 286 | 3.6% |
| $15,000 to $24,999 | 508 | 6.4% |
| $25,000 to $34,999 | 849 | 10.7% |
| $35,000 to $49,999 | 960 | 12.1% |
| $50,000 to $74,999 | 1,285 | 16.2% |
| $75,000 to $99,999 | 1,198 | 15.1% |
| $100,000 to $149,999 | 1,420 | 17.9% |
| $150,000 to $199,999 | 635 | 8.0% |
| $200,000+ | 595 | 7.5% |
Household Income by Householder Age in Lampasas County
The median household income in Lampasas County is $73,269, with the highest median household income of $86,250 found in the 25 to 44 years age bracket for the primary householder. A total of 2,185 households (27.5%) fall into this category. Meanwhile, the 15 to 24 years age bracket for the primary householder has the lowest median household income of $42,734, with 141 households (1.8%) in this group.
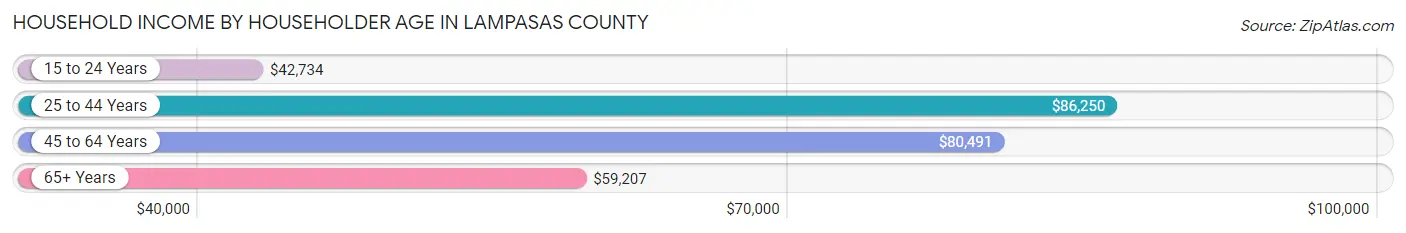
| Income Bracket | # Households | Median Income |
| 15 to 24 Years | 141 (1.8%) | $42,734 |
| 25 to 44 Years | 2,185 (27.5%) | $86,250 |
| 45 to 64 Years | 3,114 (39.3%) | $80,491 |
| 65+ Years | 2,494 (31.4%) | $59,207 |
| Total | 7,934 (100.0%) | $73,269 |
Poverty in Lampasas County
Income Below Poverty by Sex and Age in Lampasas County
With 7.4% poverty level for males and 11.7% for females among the residents of Lampasas County, 25 to 34 year old males and 16 and 17 year old females are the most vulnerable to poverty, with 168 males (16.7%) and 117 females (35.7%) in their respective age groups living below the poverty level.
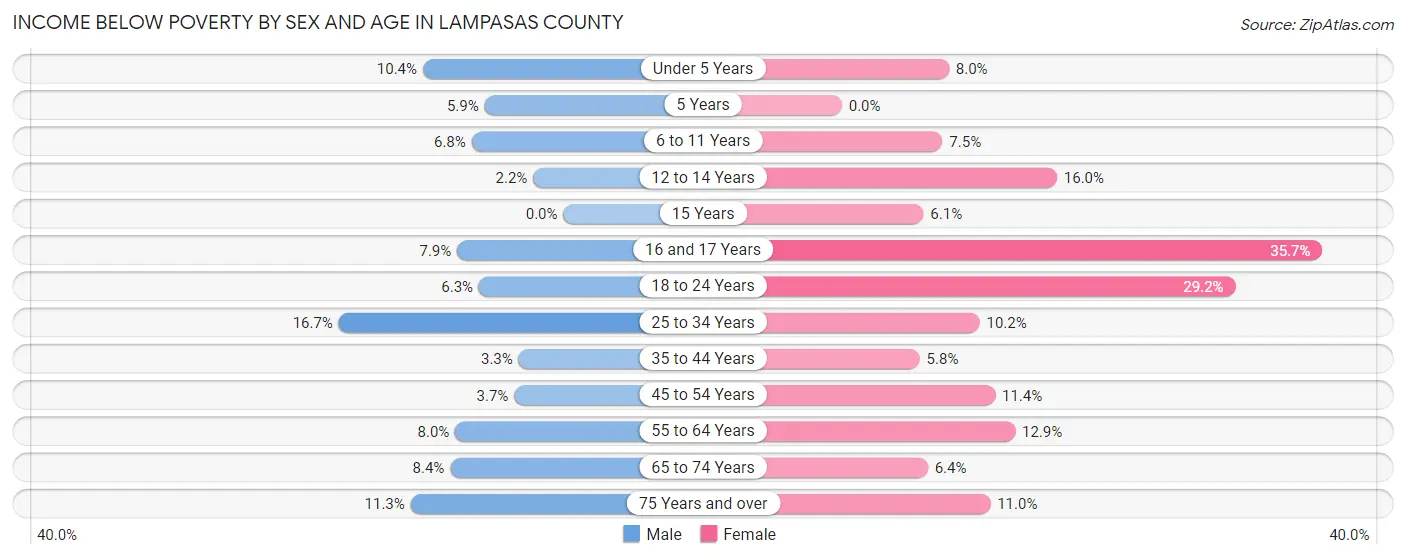
| Age Bracket | Male | Female |
| Under 5 Years | 61 (10.4%) | 38 (8.0%) |
| 5 Years | 10 (5.9%) | 0 (0.0%) |
| 6 to 11 Years | 46 (6.8%) | 51 (7.5%) |
| 12 to 14 Years | 11 (2.2%) | 84 (16.0%) |
| 15 Years | 0 (0.0%) | 6 (6.1%) |
| 16 and 17 Years | 15 (7.9%) | 117 (35.7%) |
| 18 to 24 Years | 62 (6.3%) | 218 (29.2%) |
| 25 to 34 Years | 168 (16.7%) | 103 (10.2%) |
| 35 to 44 Years | 49 (3.3%) | 79 (5.8%) |
| 45 to 54 Years | 50 (3.6%) | 153 (11.4%) |
| 55 to 64 Years | 136 (8.0%) | 211 (12.9%) |
| 65 to 74 Years | 104 (8.4%) | 91 (6.4%) |
| 75 Years and over | 90 (11.3%) | 99 (11.0%) |
| Total | 802 (7.4%) | 1,250 (11.7%) |
Income Above Poverty by Sex and Age in Lampasas County
According to the poverty statistics in Lampasas County, males aged 15 years and females aged 5 years are the age groups that are most secure financially, with 100.0% of males and 100.0% of females in these age groups living above the poverty line.
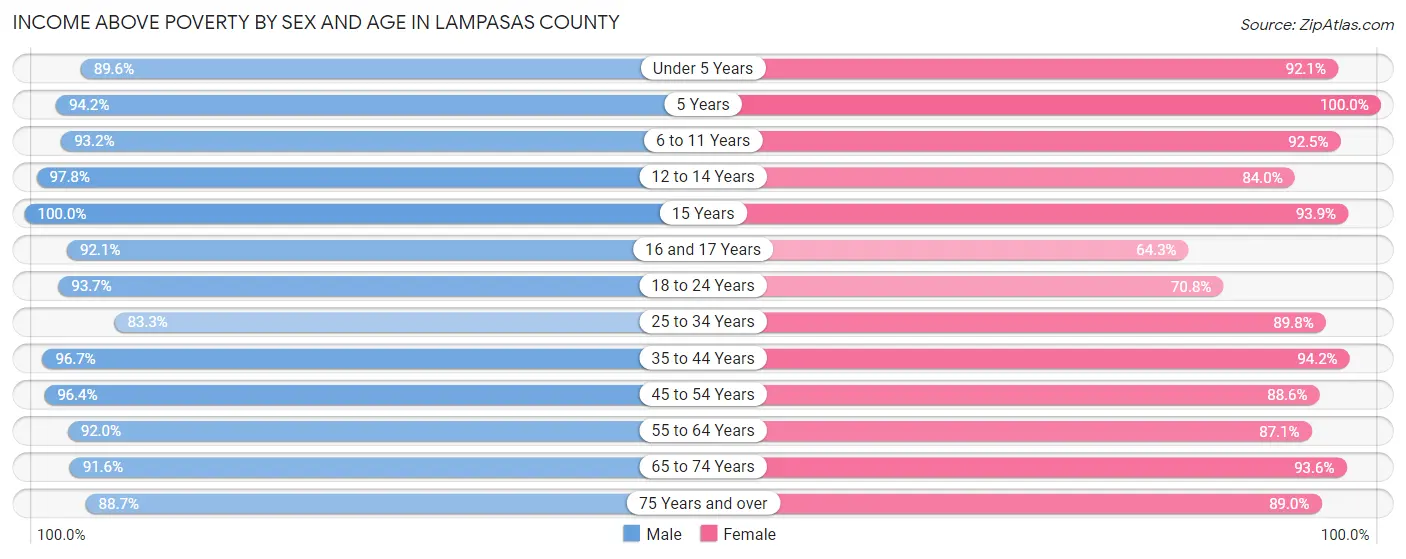
| Age Bracket | Male | Female |
| Under 5 Years | 524 (89.6%) | 440 (92.0%) |
| 5 Years | 161 (94.2%) | 184 (100.0%) |
| 6 to 11 Years | 629 (93.2%) | 632 (92.5%) |
| 12 to 14 Years | 480 (97.8%) | 442 (84.0%) |
| 15 Years | 213 (100.0%) | 93 (93.9%) |
| 16 and 17 Years | 175 (92.1%) | 211 (64.3%) |
| 18 to 24 Years | 927 (93.7%) | 528 (70.8%) |
| 25 to 34 Years | 839 (83.3%) | 904 (89.8%) |
| 35 to 44 Years | 1,429 (96.7%) | 1,287 (94.2%) |
| 45 to 54 Years | 1,320 (96.4%) | 1,191 (88.6%) |
| 55 to 64 Years | 1,558 (92.0%) | 1,430 (87.1%) |
| 65 to 74 Years | 1,134 (91.6%) | 1,336 (93.6%) |
| 75 Years and over | 704 (88.7%) | 799 (89.0%) |
| Total | 10,093 (92.6%) | 9,477 (88.3%) |
Income Below Poverty Among Married-Couple Families in Lampasas County
The poverty statistics for married-couple families in Lampasas County show that 3.8% or 174 of the total 4,608 families live below the poverty line. Families with 3 or 4 children have the highest poverty rate of 5.5%, comprising of 24 families. On the other hand, families with 1 or 2 children have the lowest poverty rate of 2.7%, which includes 39 families.
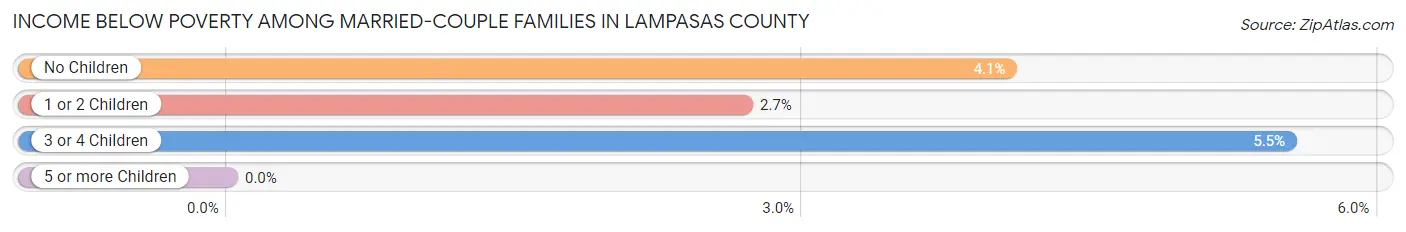
| Children | Above Poverty | Below Poverty |
| No Children | 2,614 (95.9%) | 111 (4.1%) |
| 1 or 2 Children | 1,410 (97.3%) | 39 (2.7%) |
| 3 or 4 Children | 410 (94.5%) | 24 (5.5%) |
| 5 or more Children | 0 (0.0%) | 0 (0.0%) |
| Total | 4,434 (96.2%) | 174 (3.8%) |
Income Below Poverty Among Single-Parent Households in Lampasas County
According to the poverty data in Lampasas County, 3.1% or 10 single-father households and 20.4% or 168 single-mother households are living below the poverty line. Among single-father households, those with no children have the highest poverty rate, with 6 households (4.3%) experiencing poverty. Likewise, among single-mother households, those with 3 or 4 children have the highest poverty rate, with 34 households (23.8%) falling below the poverty line.
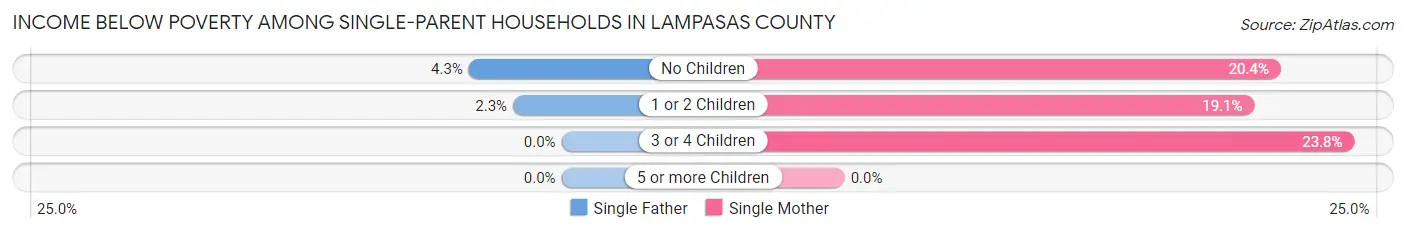
| Children | Single Father | Single Mother |
| No Children | 6 (4.3%) | 69 (20.3%) |
| 1 or 2 Children | 4 (2.3%) | 65 (19.1%) |
| 3 or 4 Children | 0 (0.0%) | 34 (23.8%) |
| 5 or more Children | 0 (0.0%) | 0 (0.0%) |
| Total | 10 (3.1%) | 168 (20.4%) |
Income Below Poverty Among Married-Couple vs Single-Parent Households in Lampasas County
The poverty data for Lampasas County shows that 174 of the married-couple family households (3.8%) and 178 of the single-parent households (15.6%) are living below the poverty level. Within the married-couple family households, those with 3 or 4 children have the highest poverty rate, with 24 households (5.5%) falling below the poverty line. Among the single-parent households, those with 3 or 4 children have the highest poverty rate, with 34 household (23.1%) living below poverty.
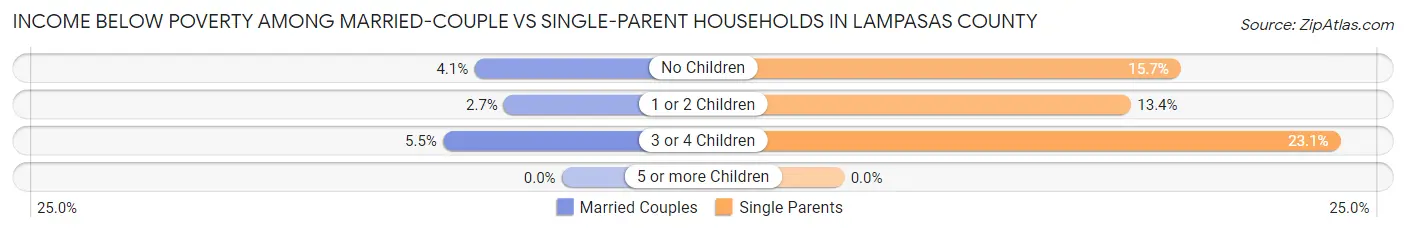
| Children | Married-Couple Families | Single-Parent Households |
| No Children | 111 (4.1%) | 75 (15.7%) |
| 1 or 2 Children | 39 (2.7%) | 69 (13.4%) |
| 3 or 4 Children | 24 (5.5%) | 34 (23.1%) |
| 5 or more Children | 0 (0.0%) | 0 (0.0%) |
| Total | 174 (3.8%) | 178 (15.6%) |
Race in Lampasas County
The most populous races in Lampasas County are White / Caucasian (17,429 | 79.8%), Hispanic or Latino (4,401 | 20.2%), and Two or more Races (2,435 | 11.2%).
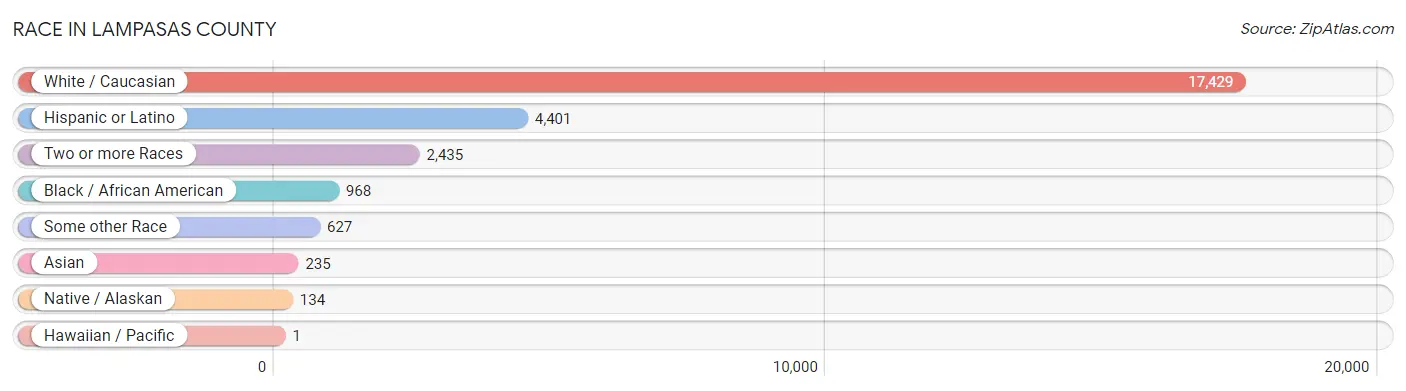
| Race | # Population | % Population |
| Asian | 235 | 1.1% |
| Black / African American | 968 | 4.4% |
| Hawaiian / Pacific | 1 | 0.0% |
| Hispanic or Latino | 4,401 | 20.2% |
| Native / Alaskan | 134 | 0.6% |
| White / Caucasian | 17,429 | 79.8% |
| Two or more Races | 2,435 | 11.2% |
| Some other Race | 627 | 2.9% |
| Total | 21,829 | 100.0% |
Ancestry in Lampasas County
The most populous ancestries reported in Lampasas County are German (4,131 | 18.9%), Mexican (2,930 | 13.4%), English (2,739 | 12.6%), Irish (2,379 | 10.9%), and American (1,239 | 5.7%), together accounting for 61.5% of all Lampasas County residents.
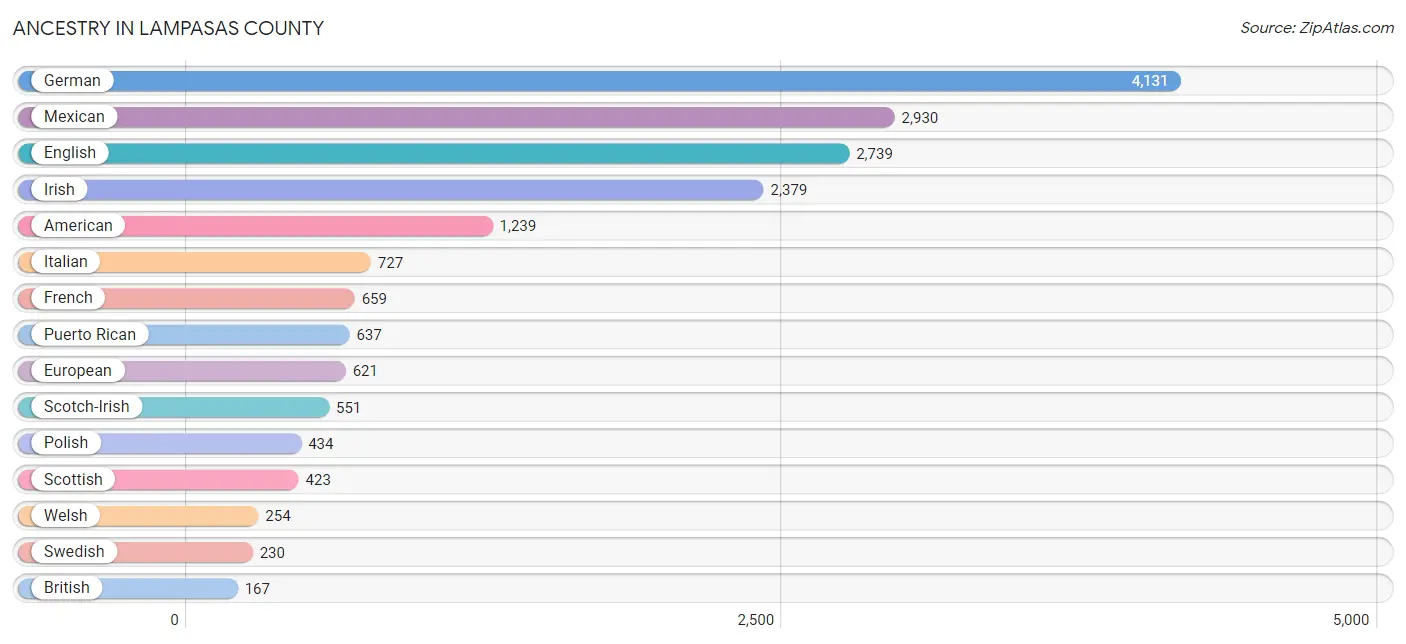
| Ancestry | # Population | % Population |
| African | 45 | 0.2% |
| American | 1,239 | 5.7% |
| Apache | 29 | 0.1% |
| Arab | 21 | 0.1% |
| Austrian | 33 | 0.2% |
| Basque | 40 | 0.2% |
| Bhutanese | 41 | 0.2% |
| British | 167 | 0.8% |
| Burmese | 123 | 0.6% |
| Canadian | 3 | 0.0% |
| Central American | 128 | 0.6% |
| Central American Indian | 84 | 0.4% |
| Cherokee | 86 | 0.4% |
| Choctaw | 55 | 0.3% |
| Colombian | 23 | 0.1% |
| Comanche | 124 | 0.6% |
| Costa Rican | 3 | 0.0% |
| Croatian | 7 | 0.0% |
| Cuban | 101 | 0.5% |
| Czech | 90 | 0.4% |
| Czechoslovakian | 10 | 0.1% |
| Danish | 17 | 0.1% |
| Dutch | 91 | 0.4% |
| Dutch West Indian | 4 | 0.0% |
| Eastern European | 75 | 0.3% |
| Ecuadorian | 34 | 0.2% |
| English | 2,739 | 12.6% |
| European | 621 | 2.8% |
| French | 659 | 3.0% |
| French Canadian | 164 | 0.7% |
| German | 4,131 | 18.9% |
| Greek | 90 | 0.4% |
| Guatemalan | 52 | 0.2% |
| Honduran | 6 | 0.0% |
| Hungarian | 2 | 0.0% |
| Indian (Asian) | 88 | 0.4% |
| Irish | 2,379 | 10.9% |
| Italian | 727 | 3.3% |
| Japanese | 57 | 0.3% |
| Korean | 63 | 0.3% |
| Lebanese | 4 | 0.0% |
| Lithuanian | 11 | 0.1% |
| Mexican | 2,930 | 13.4% |
| Mexican American Indian | 16 | 0.1% |
| Native Hawaiian | 47 | 0.2% |
| Navajo | 8 | 0.0% |
| Northern European | 35 | 0.2% |
| Norwegian | 75 | 0.3% |
| Pakistani | 47 | 0.2% |
| Panamanian | 36 | 0.2% |
| Polish | 434 | 2.0% |
| Portuguese | 18 | 0.1% |
| Puerto Rican | 637 | 2.9% |
| Russian | 86 | 0.4% |
| Salvadoran | 31 | 0.1% |
| Scandinavian | 63 | 0.3% |
| Scotch-Irish | 551 | 2.5% |
| Scottish | 423 | 1.9% |
| Slovene | 4 | 0.0% |
| South African | 43 | 0.2% |
| South American | 57 | 0.3% |
| Spaniard | 57 | 0.3% |
| Spanish | 28 | 0.1% |
| Subsaharan African | 88 | 0.4% |
| Swedish | 230 | 1.1% |
| Swiss | 83 | 0.4% |
| Thai | 47 | 0.2% |
| Trinidadian and Tobagonian | 24 | 0.1% |
| Ukrainian | 125 | 0.6% |
| Welsh | 254 | 1.2% | View All 70 Rows |
Immigrants in Lampasas County
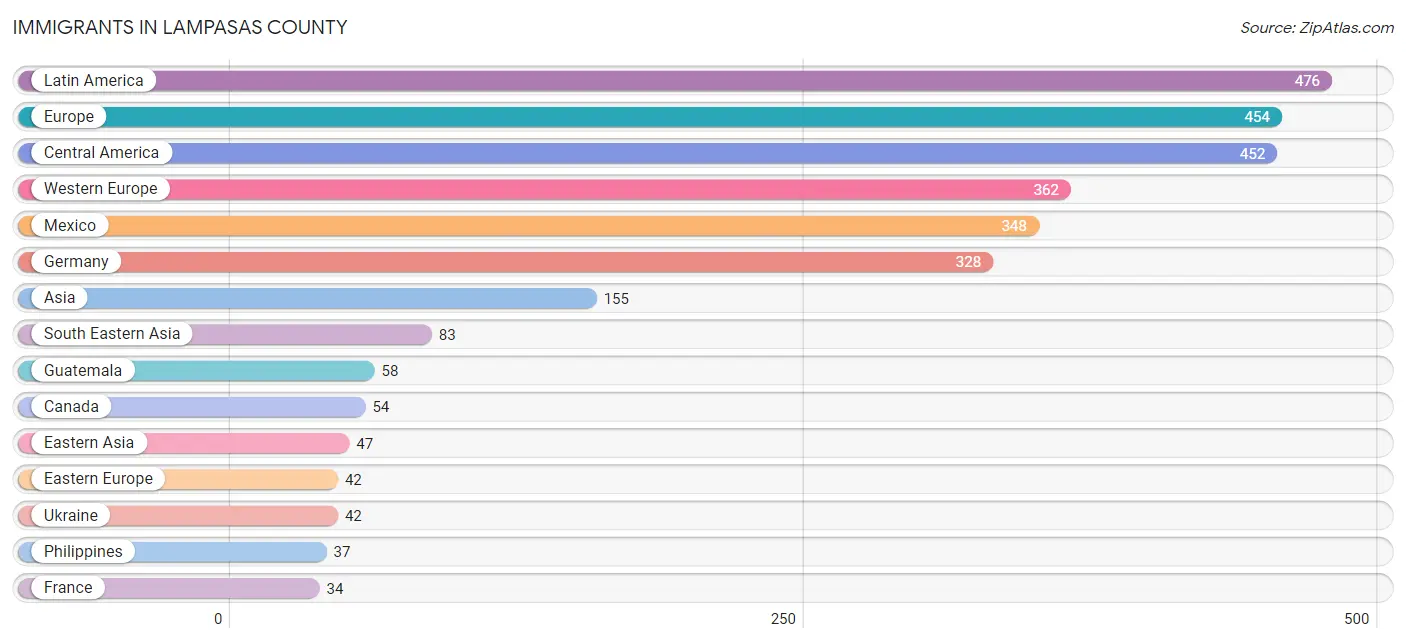
The most numerous immigrant groups reported in Lampasas County came from Latin America (476 | 2.2%), Europe (454 | 2.1%), Central America (452 | 2.1%), Western Europe (362 | 1.7%), and Mexico (348 | 1.6%), together accounting for 9.6% of all Lampasas County residents.
| Immigration Origin | # Population | % Population |
| Asia | 155 | 0.7% |
| Belize | 28 | 0.1% |
| Cambodia | 26 | 0.1% |
| Canada | 54 | 0.3% |
| Caribbean | 24 | 0.1% |
| Central America | 452 | 2.1% |
| China | 13 | 0.1% |
| Costa Rica | 3 | 0.0% |
| Eastern Asia | 47 | 0.2% |
| Eastern Europe | 42 | 0.2% |
| Europe | 454 | 2.1% |
| France | 34 | 0.2% |
| Germany | 328 | 1.5% |
| Guatemala | 58 | 0.3% |
| Honduras | 6 | 0.0% |
| India | 25 | 0.1% |
| Ireland | 16 | 0.1% |
| Italy | 34 | 0.2% |
| Japan | 9 | 0.0% |
| Korea | 25 | 0.1% |
| Latin America | 476 | 2.2% |
| Mexico | 348 | 1.6% |
| Nicaragua | 5 | 0.0% |
| Northern Europe | 16 | 0.1% |
| Panama | 4 | 0.0% |
| Philippines | 37 | 0.2% |
| South Central Asia | 25 | 0.1% |
| South Eastern Asia | 83 | 0.4% |
| Southern Europe | 34 | 0.2% |
| Thailand | 20 | 0.1% |
| Trinidad and Tobago | 24 | 0.1% |
| Ukraine | 42 | 0.2% |
| Western Europe | 362 | 1.7% | View All 33 Rows |
Sex and Age in Lampasas County
Sex and Age in Lampasas County
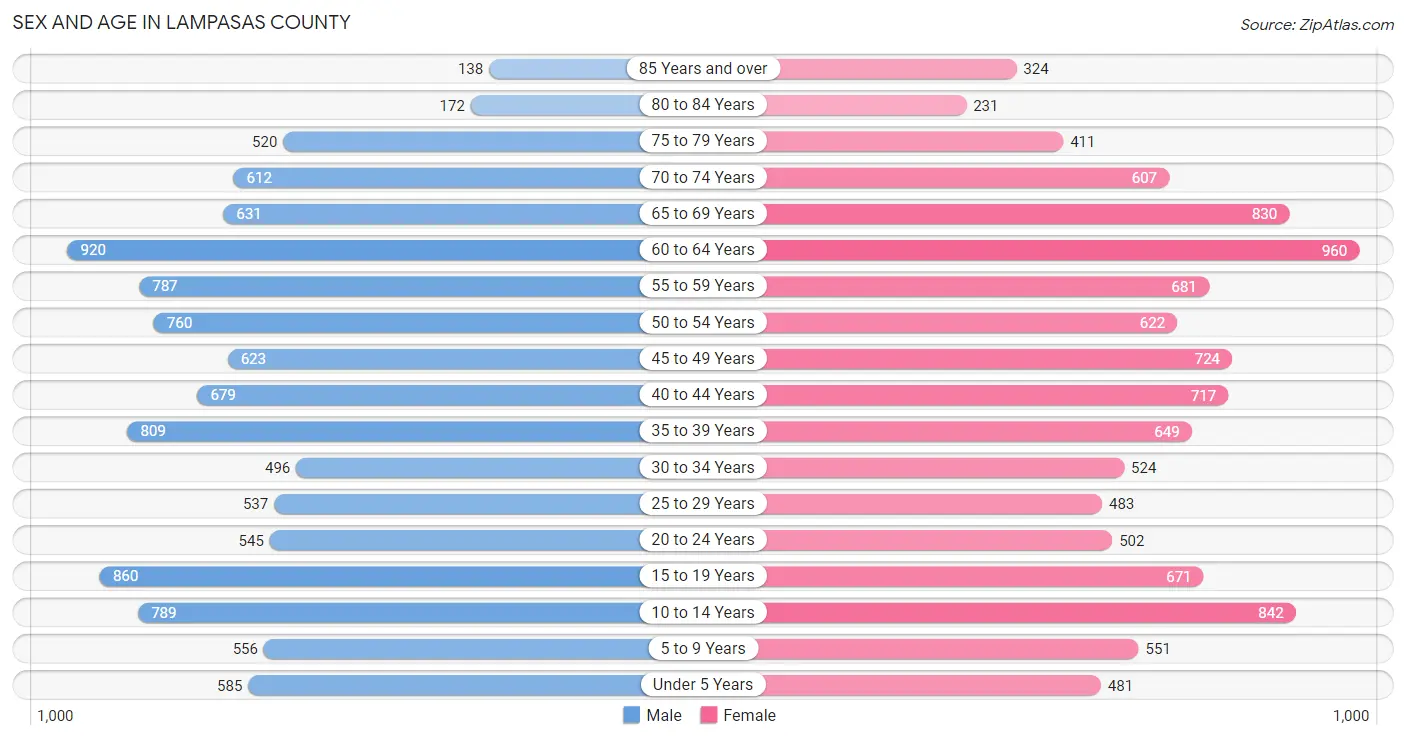
The most populous age groups in Lampasas County are 60 to 64 Years (920 | 8.4%) for men and 60 to 64 Years (960 | 8.9%) for women.
| Age Bracket | Male | Female |
| Under 5 Years | 585 (5.3%) | 481 (4.4%) |
| 5 to 9 Years | 556 (5.1%) | 551 (5.1%) |
| 10 to 14 Years | 789 (7.2%) | 842 (7.8%) |
| 15 to 19 Years | 860 (7.8%) | 671 (6.2%) |
| 20 to 24 Years | 545 (5.0%) | 502 (4.6%) |
| 25 to 29 Years | 537 (4.9%) | 483 (4.5%) |
| 30 to 34 Years | 496 (4.5%) | 524 (4.9%) |
| 35 to 39 Years | 809 (7.3%) | 649 (6.0%) |
| 40 to 44 Years | 679 (6.2%) | 717 (6.6%) |
| 45 to 49 Years | 623 (5.7%) | 724 (6.7%) |
| 50 to 54 Years | 760 (6.9%) | 622 (5.8%) |
| 55 to 59 Years | 787 (7.1%) | 681 (6.3%) |
| 60 to 64 Years | 920 (8.4%) | 960 (8.9%) |
| 65 to 69 Years | 631 (5.7%) | 830 (7.7%) |
| 70 to 74 Years | 612 (5.6%) | 607 (5.6%) |
| 75 to 79 Years | 520 (4.7%) | 411 (3.8%) |
| 80 to 84 Years | 172 (1.6%) | 231 (2.1%) |
| 85 Years and over | 138 (1.3%) | 324 (3.0%) |
| Total | 11,019 (100.0%) | 10,810 (100.0%) |
Families and Households in Lampasas County
Median Family Size in Lampasas County
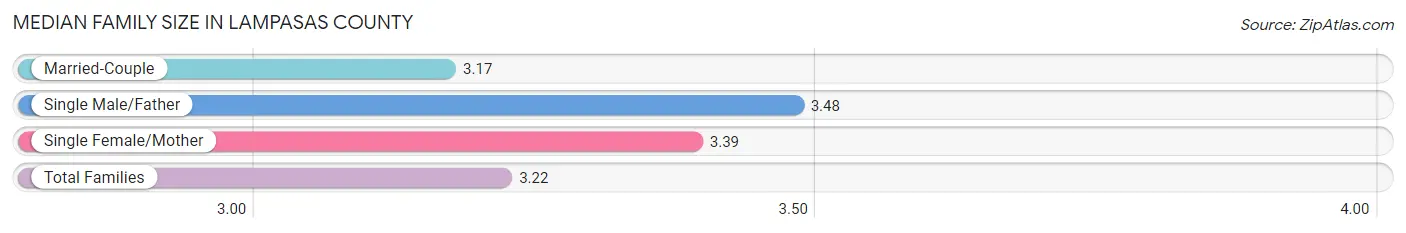
The median family size in Lampasas County is 3.22 persons per family, with single male/father families (320 | 5.6%) accounting for the largest median family size of 3.48 persons per family. On the other hand, married-couple families (4,608 | 80.1%) represent the smallest median family size with 3.17 persons per family.
| Family Type | # Families | Family Size |
| Married-Couple | 4,608 (80.1%) | 3.17 |
| Single Male/Father | 320 (5.6%) | 3.48 |
| Single Female/Mother | 822 (14.3%) | 3.39 |
| Total Families | 5,750 (100.0%) | 3.22 |
Median Household Size in Lampasas County
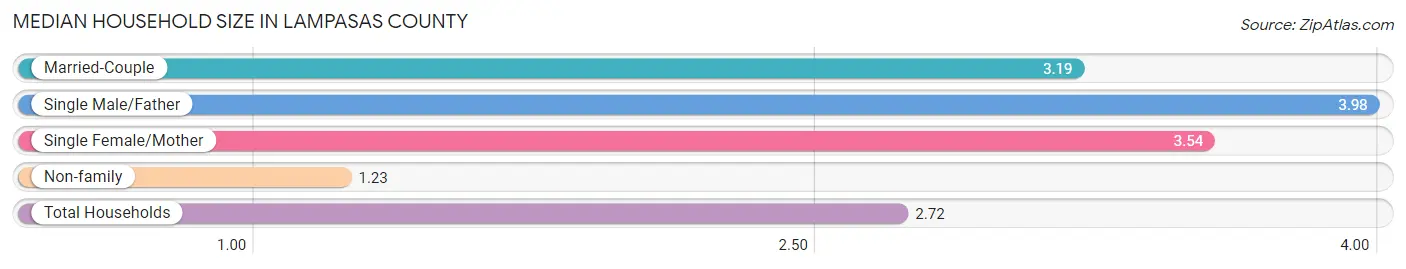
The median household size in Lampasas County is 2.72 persons per household, with single male/father households (320 | 4.0%) accounting for the largest median household size of 3.98 persons per household. non-family households (2,184 | 27.5%) represent the smallest median household size with 1.23 persons per household.
| Household Type | # Households | Household Size |
| Married-Couple | 4,608 (58.1%) | 3.19 |
| Single Male/Father | 320 (4.0%) | 3.98 |
| Single Female/Mother | 822 (10.4%) | 3.54 |
| Non-family | 2,184 (27.5%) | 1.23 |
| Total Households | 7,934 (100.0%) | 2.72 |
Household Size by Marriage Status in Lampasas County
Out of a total of 7,934 households in Lampasas County, 5,750 (72.5%) are family households, while 2,184 (27.5%) are nonfamily households. The most numerous type of family households are 2-person households, comprising 2,559, and the most common type of nonfamily households are 1-person households, comprising 1,742.
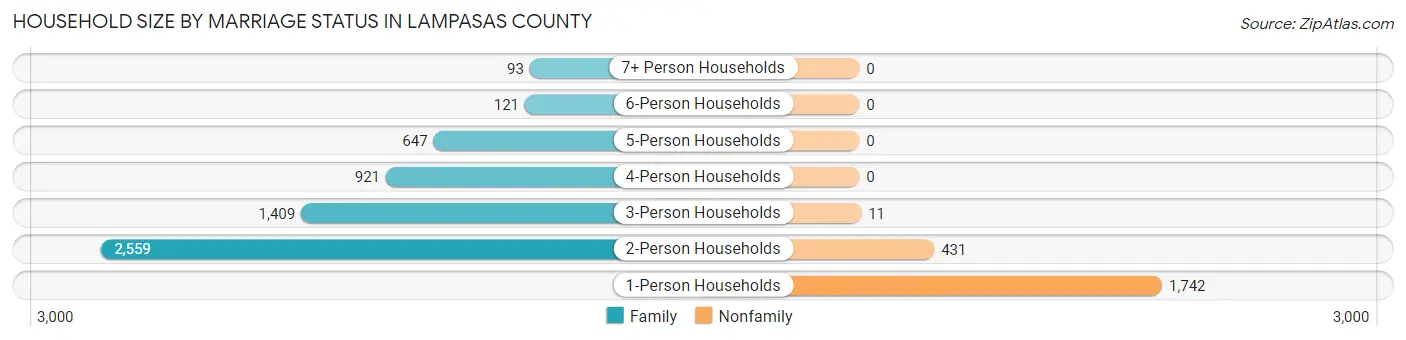
| Household Size | Family Households | Nonfamily Households |
| 1-Person Households | - | 1,742 (22.0%) |
| 2-Person Households | 2,559 (32.3%) | 431 (5.4%) |
| 3-Person Households | 1,409 (17.8%) | 11 (0.1%) |
| 4-Person Households | 921 (11.6%) | 0 (0.0%) |
| 5-Person Households | 647 (8.2%) | 0 (0.0%) |
| 6-Person Households | 121 (1.5%) | 0 (0.0%) |
| 7+ Person Households | 93 (1.2%) | 0 (0.0%) |
| Total | 5,750 (72.5%) | 2,184 (27.5%) |
Female Fertility in Lampasas County
Fertility by Age in Lampasas County
Average fertility rate in Lampasas County is 53.0 births per 1,000 women. Women in the age bracket of 20 to 34 years have the highest fertility rate with 130.0 births per 1,000 women. Women in the age bracket of 20 to 34 years acount for 85.2% of all women with births.
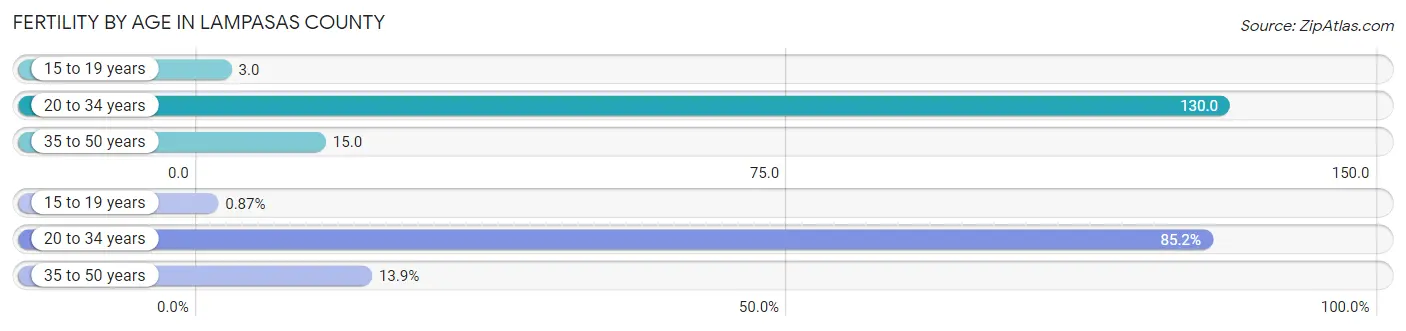
| Age Bracket | Women with Births | Births / 1,000 Women |
| 15 to 19 years | 2 (0.9%) | 3.0 |
| 20 to 34 years | 196 (85.2%) | 130.0 |
| 35 to 50 years | 32 (13.9%) | 15.0 |
| Total | 230 (100.0%) | 53.0 |
Fertility by Age by Marriage Status in Lampasas County
71.3% of women with births (230) in Lampasas County are married. The highest percentage of unmarried women with births falls into 15 to 19 years age bracket with 100.0% of them unmarried at the time of birth, while the lowest percentage of unmarried women with births belong to 35 to 50 years age bracket with 6.2% of them unmarried.
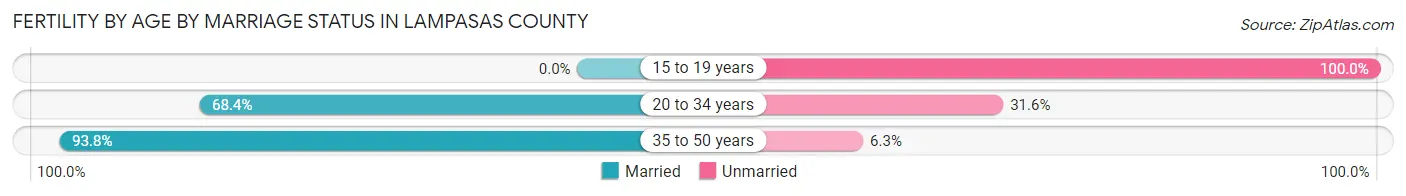
| Age Bracket | Married | Unmarried |
| 15 to 19 years | 0 (0.0%) | 2 (100.0%) |
| 20 to 34 years | 134 (68.4%) | 62 (31.6%) |
| 35 to 50 years | 30 (93.8%) | 2 (6.2%) |
| Total | 164 (71.3%) | 66 (28.7%) |
Fertility by Education in Lampasas County
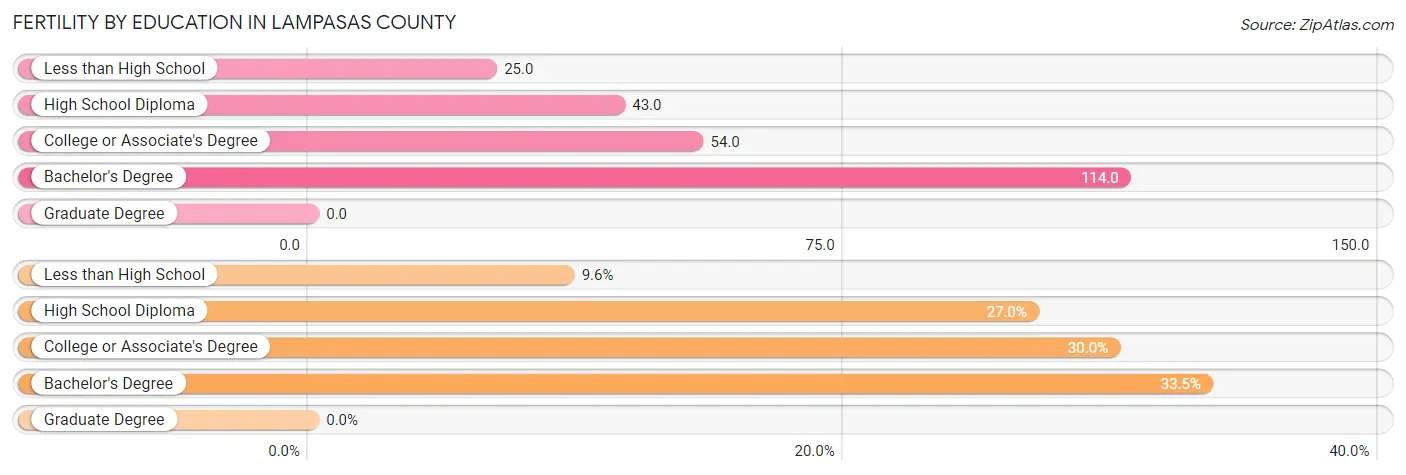
| Educational Attainment | Women with Births | Births / 1,000 Women |
| Less than High School | 22 (9.6%) | 25.0 |
| High School Diploma | 62 (27.0%) | 43.0 |
| College or Associate's Degree | 69 (30.0%) | 54.0 |
| Bachelor's Degree | 77 (33.5%) | 114.0 |
| Graduate Degree | 0 (0.0%) | 0.0 |
| Total | 230 (100.0%) | 53.0 |
Fertility by Education by Marriage Status in Lampasas County
28.7% of women with births in Lampasas County are unmarried. Women with the educational attainment of bachelor's degree are most likely to be married with 100.0% of them married at childbirth, while women with the educational attainment of less than high school are least likely to be married with 100.0% of them unmarried at childbirth.
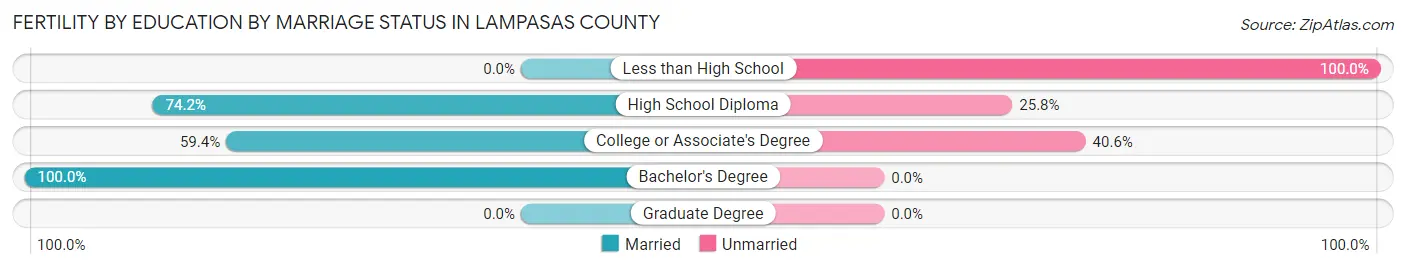
| Educational Attainment | Married | Unmarried |
| Less than High School | 0 (0.0%) | 22 (100.0%) |
| High School Diploma | 46 (74.2%) | 16 (25.8%) |
| College or Associate's Degree | 41 (59.4%) | 28 (40.6%) |
| Bachelor's Degree | 77 (100.0%) | 0 (0.0%) |
| Graduate Degree | 0 (0.0%) | 0 (0.0%) |
| Total | 164 (71.3%) | 66 (28.7%) |
Employment Characteristics in Lampasas County
Employment by Class of Employer in Lampasas County
Among the 8,762 employed individuals in Lampasas County, private company employees (5,529 | 63.1%), local government employees (762 | 8.7%), and self-employed (not incorporated) (719 | 8.2%) make up the most common classes of employment.
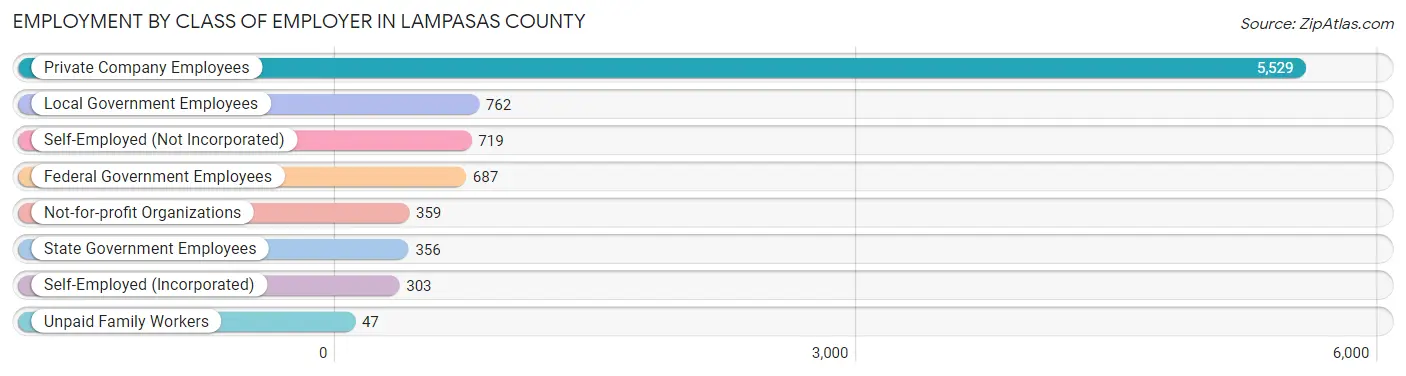
| Employer Class | # Employees | % Employees |
| Private Company Employees | 5,529 | 63.1% |
| Self-Employed (Incorporated) | 303 | 3.5% |
| Self-Employed (Not Incorporated) | 719 | 8.2% |
| Not-for-profit Organizations | 359 | 4.1% |
| Local Government Employees | 762 | 8.7% |
| State Government Employees | 356 | 4.1% |
| Federal Government Employees | 687 | 7.8% |
| Unpaid Family Workers | 47 | 0.5% |
| Total | 8,762 | 100.0% |
Employment Status by Age in Lampasas County
According to the labor force statistics for Lampasas County, out of the total population over 16 years of age (17,710), 53.4% or 9,457 individuals are in the labor force, with 5.3% or 501 of them unemployed. The age group with the highest labor force participation rate is 35 to 44 years, with 81.2% or 2,317 individuals in the labor force. Within the labor force, the 16 to 19 years age range has the highest percentage of unemployed individuals, with 11.6% or 75 of them being unemployed.
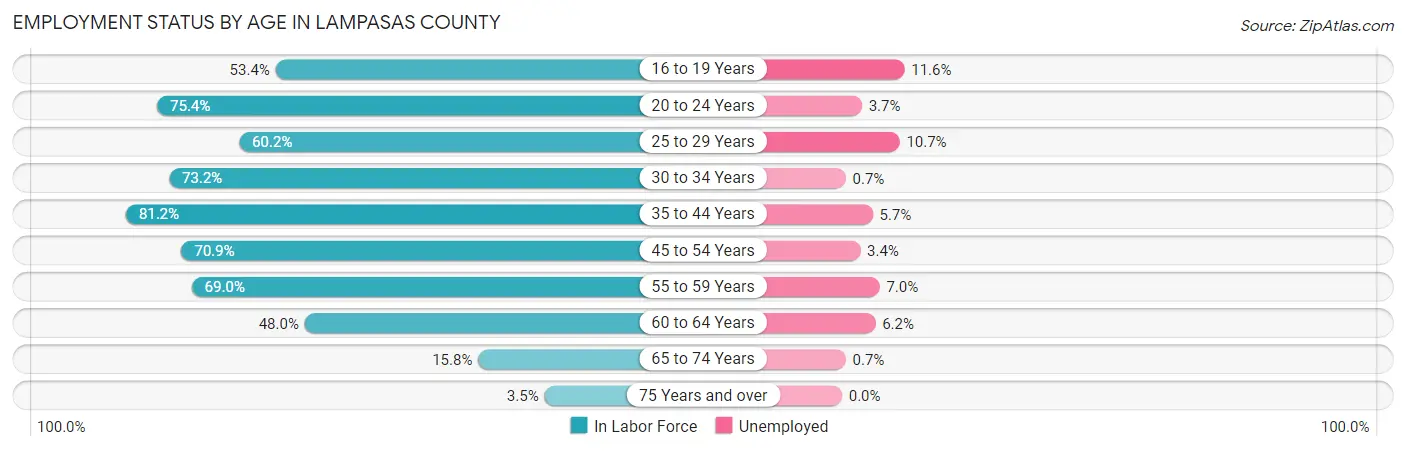
| Age Bracket | In Labor Force | Unemployed |
| 16 to 19 Years | 649 (53.4%) | 75 (11.6%) |
| 20 to 24 Years | 789 (75.4%) | 29 (3.7%) |
| 25 to 29 Years | 614 (60.2%) | 66 (10.7%) |
| 30 to 34 Years | 747 (73.2%) | 5 (0.7%) |
| 35 to 44 Years | 2,317 (81.2%) | 132 (5.7%) |
| 45 to 54 Years | 1,935 (70.9%) | 66 (3.4%) |
| 55 to 59 Years | 1,013 (69.0%) | 71 (7.0%) |
| 60 to 64 Years | 902 (48.0%) | 56 (6.2%) |
| 65 to 74 Years | 423 (15.8%) | 3 (0.7%) |
| 75 Years and over | 63 (3.5%) | 0 (0.0%) |
| Total | 9,457 (53.4%) | 501 (5.3%) |
Employment Status by Educational Attainment in Lampasas County
According to labor force statistics for Lampasas County, 68.6% of individuals (7,526) out of the total population between 25 and 64 years of age (10,971) are in the labor force, with 5.2% or 391 of them being unemployed. The group with the highest labor force participation rate are those with the educational attainment of bachelor's degree or higher, with 76.7% or 1,588 individuals in the labor force. Within the labor force, individuals with high school diploma education have the highest percentage of unemployment, with 7.2% or 177 of them being unemployed.
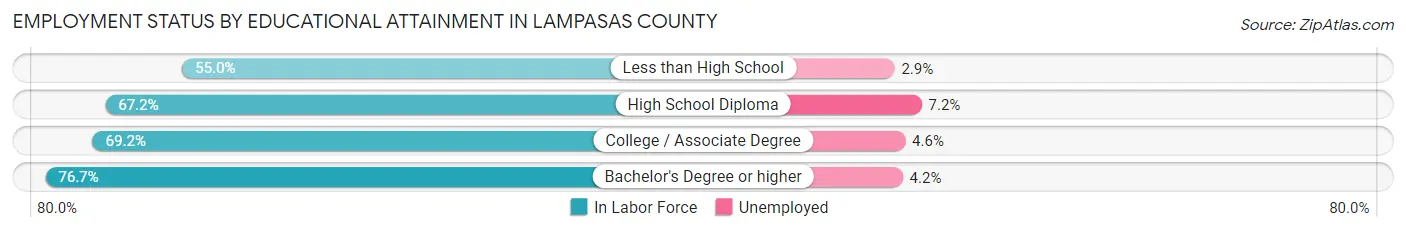
| Educational Attainment | In Labor Force | Unemployed |
| Less than High School | 560 (55.0%) | 30 (2.9%) |
| High School Diploma | 2,453 (67.2%) | 263 (7.2%) |
| College / Associate Degree | 2,927 (69.2%) | 195 (4.6%) |
| Bachelor's Degree or higher | 1,588 (76.7%) | 87 (4.2%) |
| Total | 7,526 (68.6%) | 570 (5.2%) |
Employment Occupations by Sex in Lampasas County
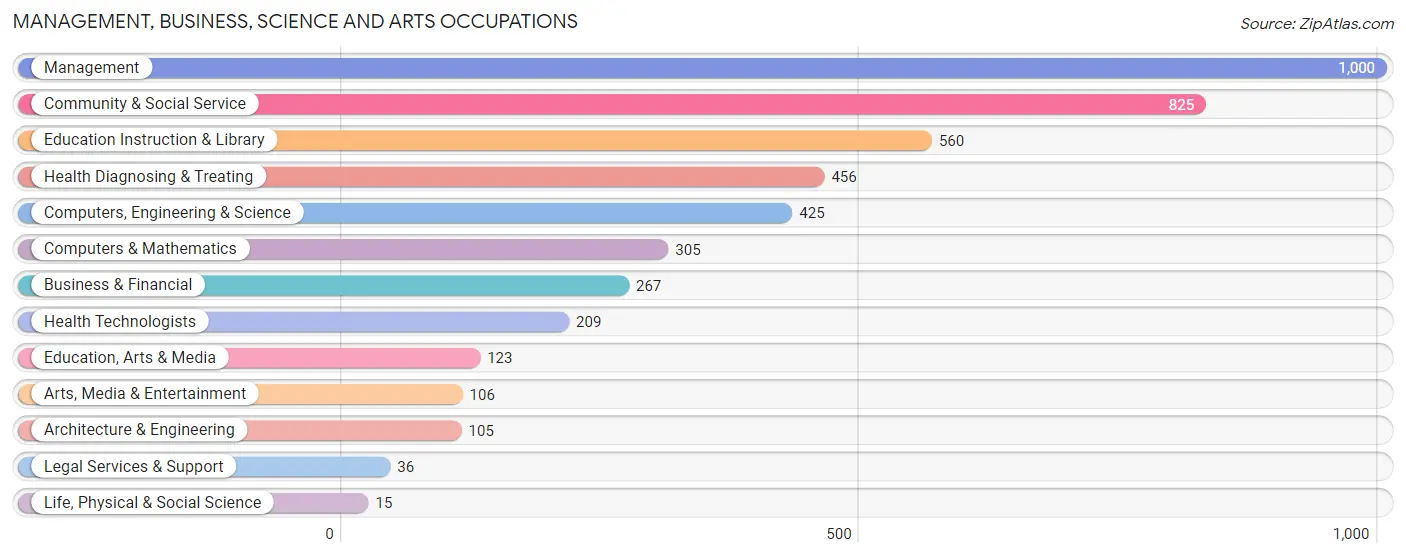
Management, Business, Science and Arts Occupations
The most common Management, Business, Science and Arts occupations in Lampasas County are Management (1,000 | 11.4%), Community & Social Service (825 | 9.4%), Education Instruction & Library (560 | 6.4%), Health Diagnosing & Treating (456 | 5.2%), and Computers, Engineering & Science (425 | 4.8%).
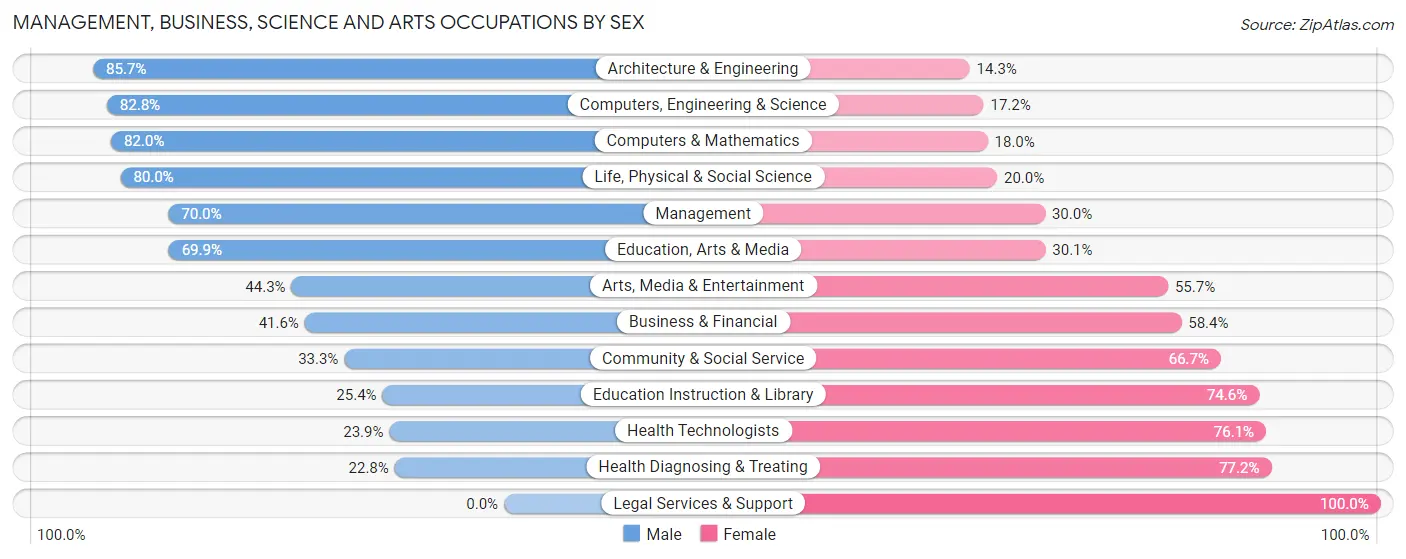
Management, Business, Science and Arts Occupations by Sex
Within the Management, Business, Science and Arts occupations in Lampasas County, the most male-oriented occupations are Architecture & Engineering (85.7%), Computers, Engineering & Science (82.8%), and Computers & Mathematics (82.0%), while the most female-oriented occupations are Legal Services & Support (100.0%), Health Diagnosing & Treating (77.2%), and Health Technologists (76.1%).
| Occupation | Male | Female |
| Management | 700 (70.0%) | 300 (30.0%) |
| Business & Financial | 111 (41.6%) | 156 (58.4%) |
| Computers, Engineering & Science | 352 (82.8%) | 73 (17.2%) |
| Computers & Mathematics | 250 (82.0%) | 55 (18.0%) |
| Architecture & Engineering | 90 (85.7%) | 15 (14.3%) |
| Life, Physical & Social Science | 12 (80.0%) | 3 (20.0%) |
| Community & Social Service | 275 (33.3%) | 550 (66.7%) |
| Education, Arts & Media | 86 (69.9%) | 37 (30.1%) |
| Legal Services & Support | 0 (0.0%) | 36 (100.0%) |
| Education Instruction & Library | 142 (25.4%) | 418 (74.6%) |
| Arts, Media & Entertainment | 47 (44.3%) | 59 (55.7%) |
| Health Diagnosing & Treating | 104 (22.8%) | 352 (77.2%) |
| Health Technologists | 50 (23.9%) | 159 (76.1%) |
| Total (Category) | 1,542 (51.9%) | 1,431 (48.1%) |
| Total (Overall) | 4,865 (55.3%) | 3,935 (44.7%) |
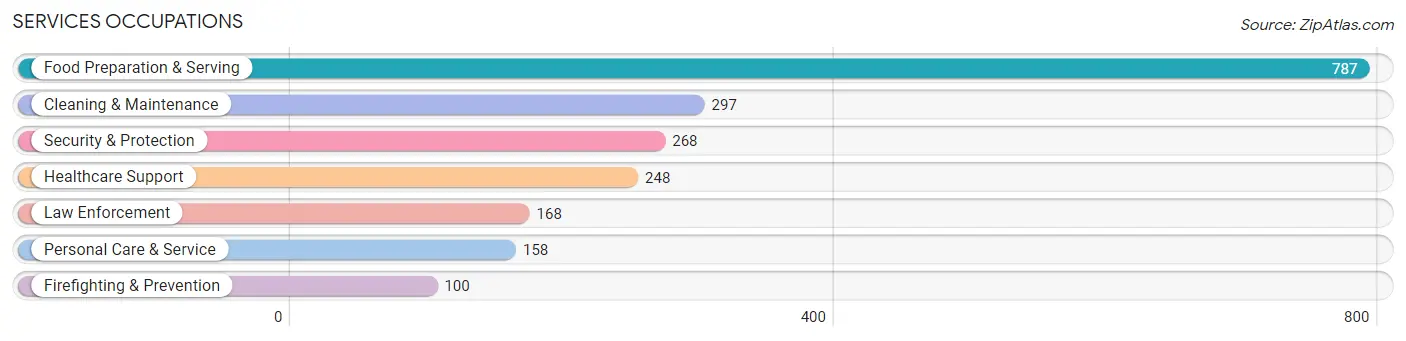
Services Occupations
The most common Services occupations in Lampasas County are Food Preparation & Serving (787 | 8.9%), Cleaning & Maintenance (297 | 3.4%), Security & Protection (268 | 3.0%), Healthcare Support (248 | 2.8%), and Law Enforcement (168 | 1.9%).
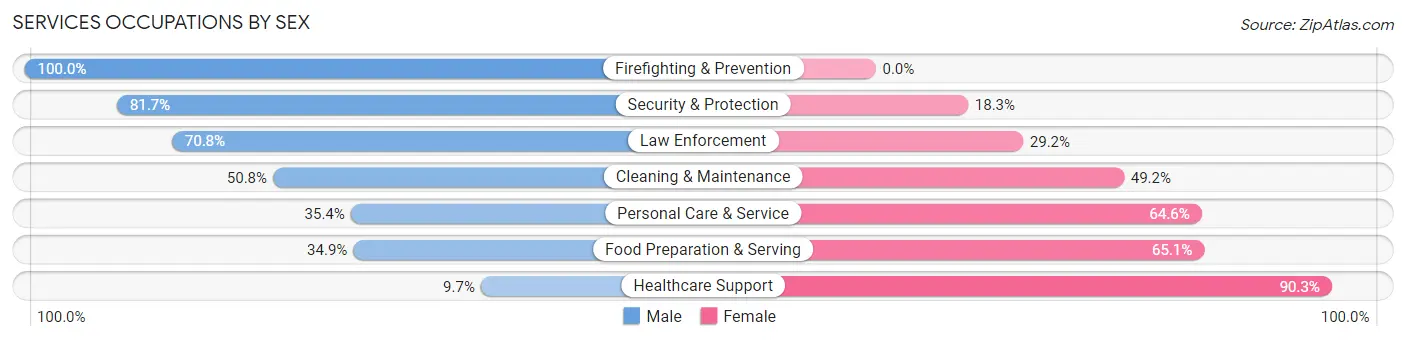
Services Occupations by Sex
Within the Services occupations in Lampasas County, the most male-oriented occupations are Firefighting & Prevention (100.0%), Security & Protection (81.7%), and Law Enforcement (70.8%), while the most female-oriented occupations are Healthcare Support (90.3%), Food Preparation & Serving (65.1%), and Personal Care & Service (64.6%).
| Occupation | Male | Female |
| Healthcare Support | 24 (9.7%) | 224 (90.3%) |
| Security & Protection | 219 (81.7%) | 49 (18.3%) |
| Firefighting & Prevention | 100 (100.0%) | 0 (0.0%) |
| Law Enforcement | 119 (70.8%) | 49 (29.2%) |
| Food Preparation & Serving | 275 (34.9%) | 512 (65.1%) |
| Cleaning & Maintenance | 151 (50.8%) | 146 (49.2%) |
| Personal Care & Service | 56 (35.4%) | 102 (64.6%) |
| Total (Category) | 725 (41.2%) | 1,033 (58.8%) |
| Total (Overall) | 4,865 (55.3%) | 3,935 (44.7%) |
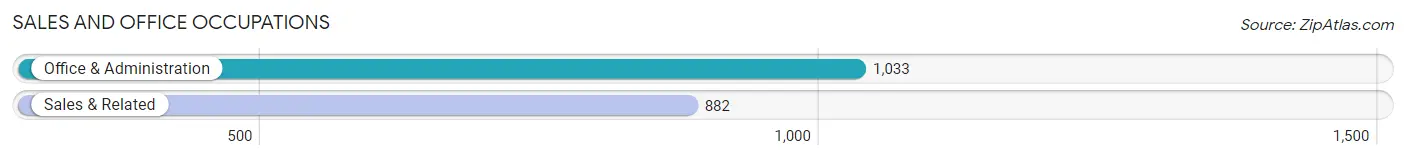
Sales and Office Occupations
The most common Sales and Office occupations in Lampasas County are Office & Administration (1,033 | 11.7%), and Sales & Related (882 | 10.0%).
Sales and Office Occupations by Sex
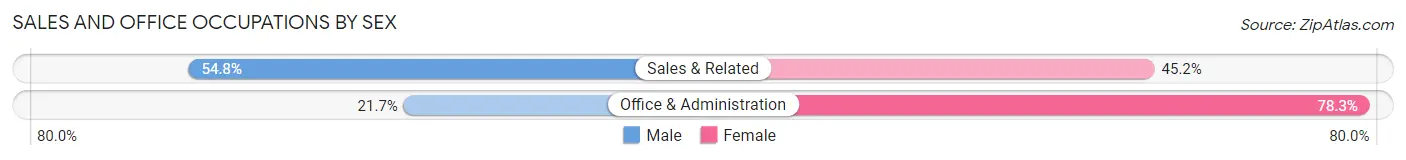
| Occupation | Male | Female |
| Sales & Related | 483 (54.8%) | 399 (45.2%) |
| Office & Administration | 224 (21.7%) | 809 (78.3%) |
| Total (Category) | 707 (36.9%) | 1,208 (63.1%) |
| Total (Overall) | 4,865 (55.3%) | 3,935 (44.7%) |
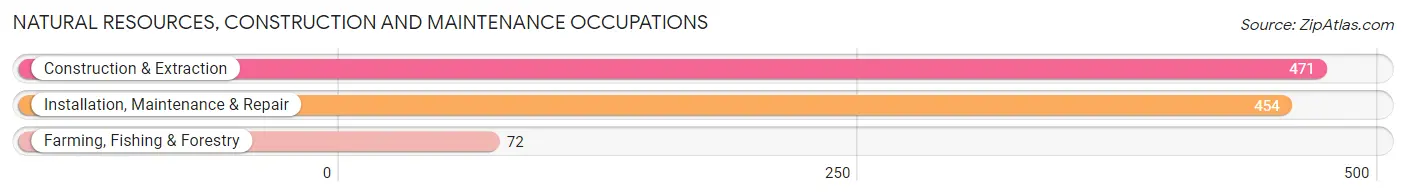
Natural Resources, Construction and Maintenance Occupations
The most common Natural Resources, Construction and Maintenance occupations in Lampasas County are Construction & Extraction (471 | 5.3%), Installation, Maintenance & Repair (454 | 5.2%), and Farming, Fishing & Forestry (72 | 0.8%).
Natural Resources, Construction and Maintenance Occupations by Sex
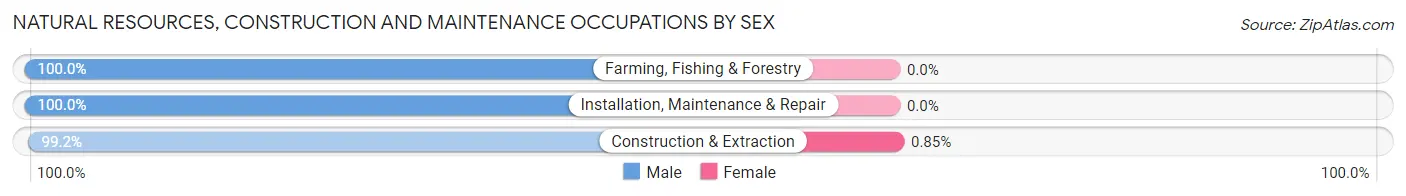
| Occupation | Male | Female |
| Farming, Fishing & Forestry | 72 (100.0%) | 0 (0.0%) |
| Construction & Extraction | 467 (99.2%) | 4 (0.9%) |
| Installation, Maintenance & Repair | 454 (100.0%) | 0 (0.0%) |
| Total (Category) | 993 (99.6%) | 4 (0.4%) |
| Total (Overall) | 4,865 (55.3%) | 3,935 (44.7%) |
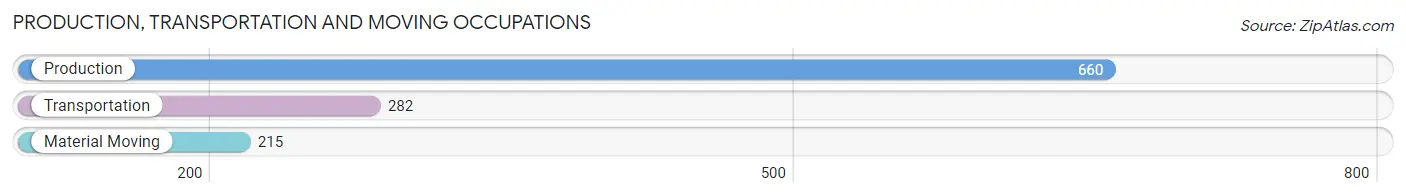
Production, Transportation and Moving Occupations
The most common Production, Transportation and Moving occupations in Lampasas County are Production (660 | 7.5%), Transportation (282 | 3.2%), and Material Moving (215 | 2.4%).
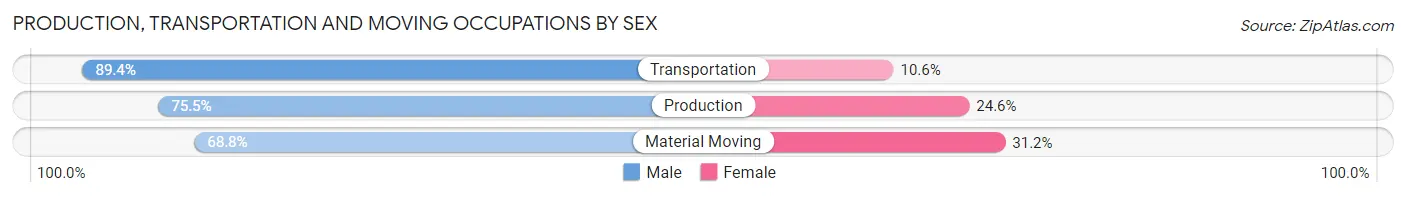
Production, Transportation and Moving Occupations by Sex
| Occupation | Male | Female |
| Production | 498 (75.4%) | 162 (24.5%) |
| Transportation | 252 (89.4%) | 30 (10.6%) |
| Material Moving | 148 (68.8%) | 67 (31.2%) |
| Total (Category) | 898 (77.6%) | 259 (22.4%) |
| Total (Overall) | 4,865 (55.3%) | 3,935 (44.7%) |
Employment Industries by Sex in Lampasas County
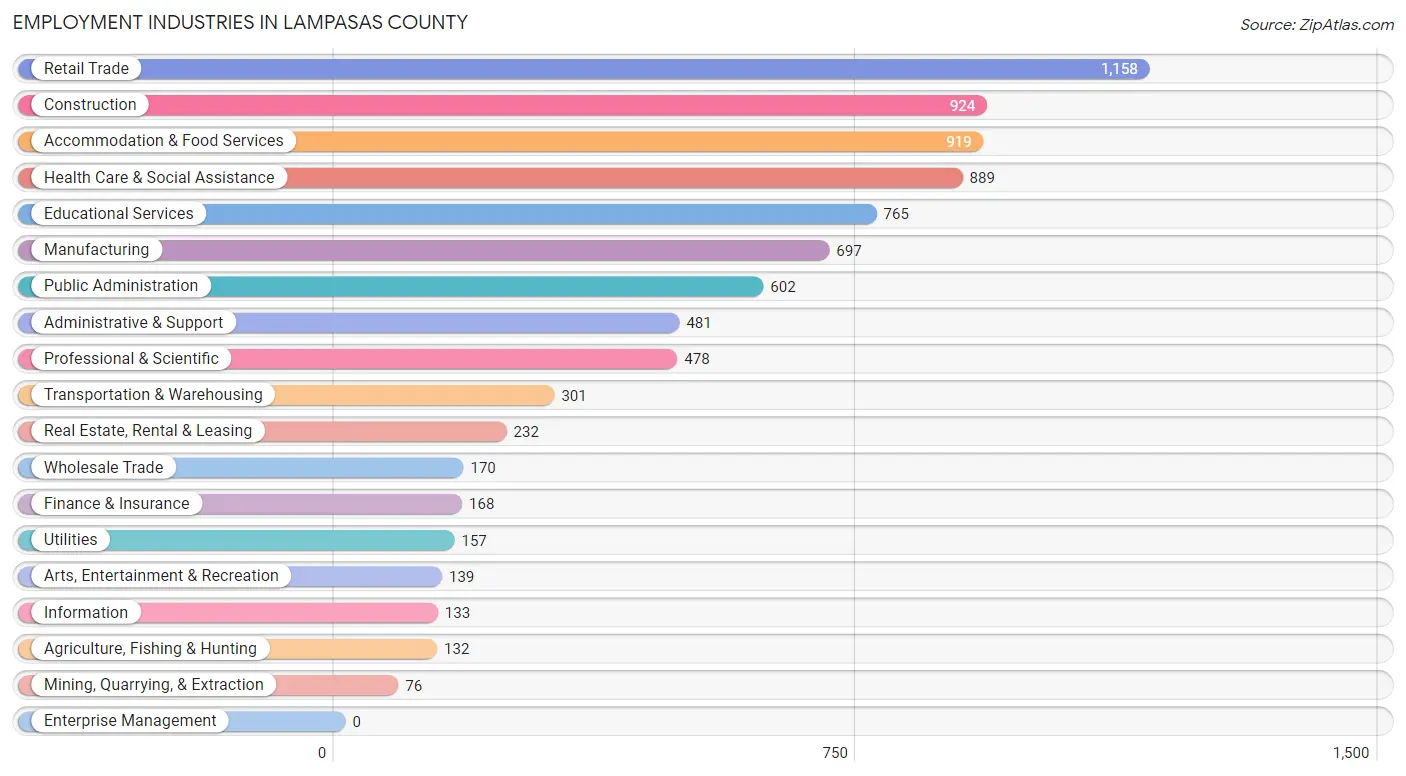
Employment Industries in Lampasas County
The major employment industries in Lampasas County include Retail Trade (1,158 | 13.2%), Construction (924 | 10.5%), Accommodation & Food Services (919 | 10.4%), Health Care & Social Assistance (889 | 10.1%), and Educational Services (765 | 8.7%).
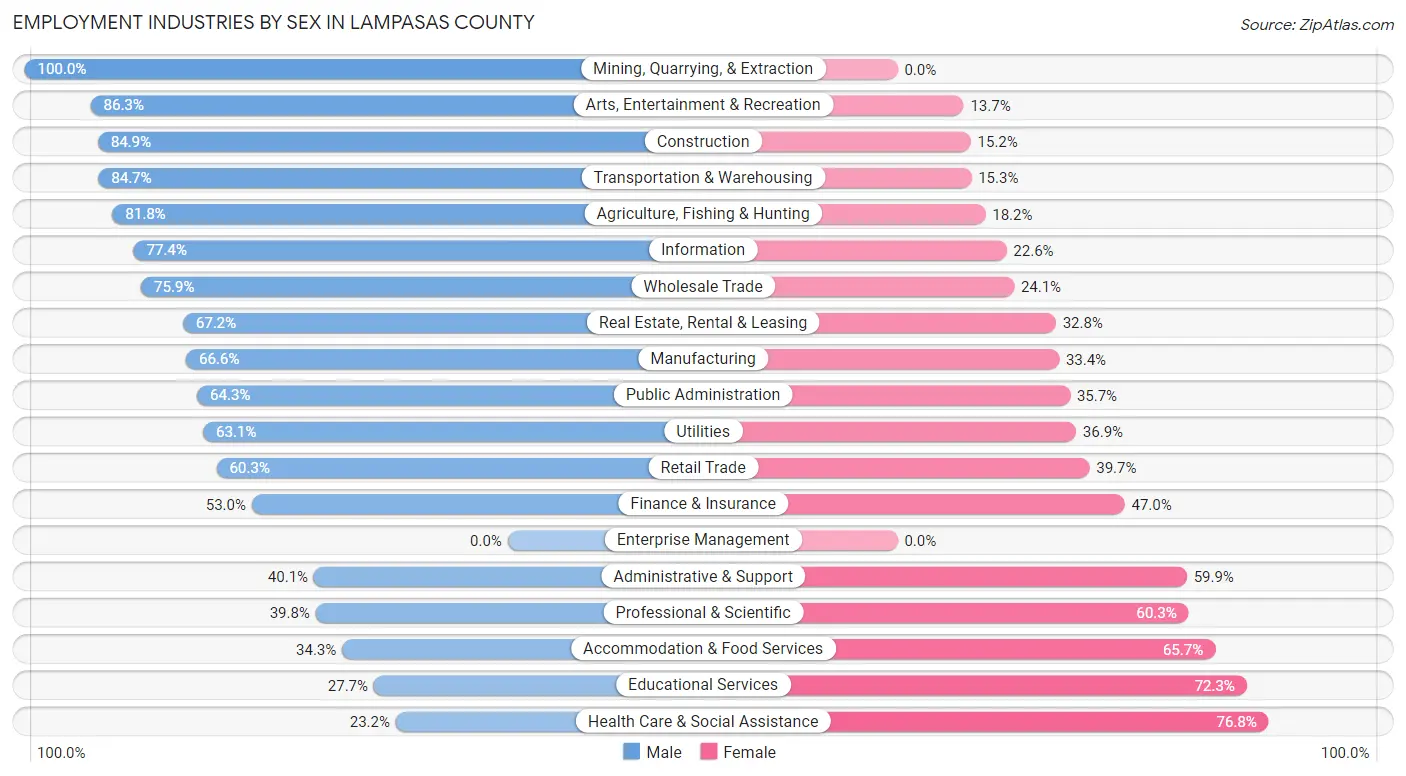
Employment Industries by Sex in Lampasas County
The Lampasas County industries that see more men than women are Mining, Quarrying, & Extraction (100.0%), Arts, Entertainment & Recreation (86.3%), and Construction (84.9%), whereas the industries that tend to have a higher number of women are Health Care & Social Assistance (76.8%), Educational Services (72.3%), and Accommodation & Food Services (65.7%).
| Industry | Male | Female |
| Agriculture, Fishing & Hunting | 108 (81.8%) | 24 (18.2%) |
| Mining, Quarrying, & Extraction | 76 (100.0%) | 0 (0.0%) |
| Construction | 784 (84.9%) | 140 (15.1%) |
| Manufacturing | 464 (66.6%) | 233 (33.4%) |
| Wholesale Trade | 129 (75.9%) | 41 (24.1%) |
| Retail Trade | 698 (60.3%) | 460 (39.7%) |
| Transportation & Warehousing | 255 (84.7%) | 46 (15.3%) |
| Utilities | 99 (63.1%) | 58 (36.9%) |
| Information | 103 (77.4%) | 30 (22.6%) |
| Finance & Insurance | 89 (53.0%) | 79 (47.0%) |
| Real Estate, Rental & Leasing | 156 (67.2%) | 76 (32.8%) |
| Professional & Scientific | 190 (39.8%) | 288 (60.3%) |
| Enterprise Management | 0 (0.0%) | 0 (0.0%) |
| Administrative & Support | 193 (40.1%) | 288 (59.9%) |
| Educational Services | 212 (27.7%) | 553 (72.3%) |
| Health Care & Social Assistance | 206 (23.2%) | 683 (76.8%) |
| Arts, Entertainment & Recreation | 120 (86.3%) | 19 (13.7%) |
| Accommodation & Food Services | 315 (34.3%) | 604 (65.7%) |
| Public Administration | 387 (64.3%) | 215 (35.7%) |
| Total | 4,865 (55.3%) | 3,935 (44.7%) |
Education in Lampasas County
School Enrollment in Lampasas County
The most common levels of schooling among the 4,932 students in Lampasas County are middle school (1,378 | 27.9%), high school (1,222 | 24.8%), and elementary school (812 | 16.5%).
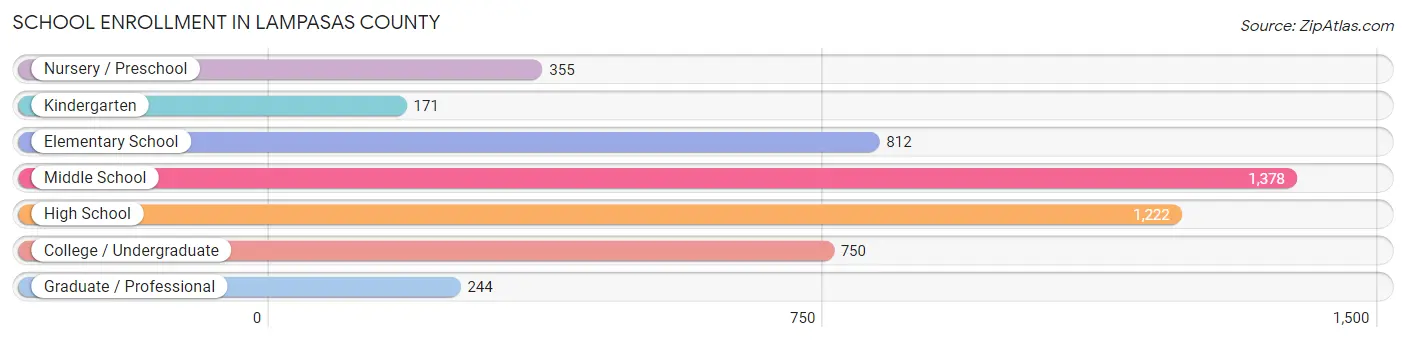
| School Level | # Students | % Students |
| Nursery / Preschool | 355 | 7.2% |
| Kindergarten | 171 | 3.5% |
| Elementary School | 812 | 16.5% |
| Middle School | 1,378 | 27.9% |
| High School | 1,222 | 24.8% |
| College / Undergraduate | 750 | 15.2% |
| Graduate / Professional | 244 | 5.0% |
| Total | 4,932 | 100.0% |
School Enrollment by Age by Funding Source in Lampasas County
Out of a total of 4,932 students who are enrolled in schools in Lampasas County, 538 (10.9%) attend a private institution, while the remaining 4,394 (89.1%) are enrolled in public schools. The age group of 35 years and over has the highest likelihood of being enrolled in private schools, with 148 (28.4% in the age bracket) enrolled. Conversely, the age group of 15 to 17 year olds has the lowest likelihood of being enrolled in a private school, with 786 (96.9% in the age bracket) attending a public institution.
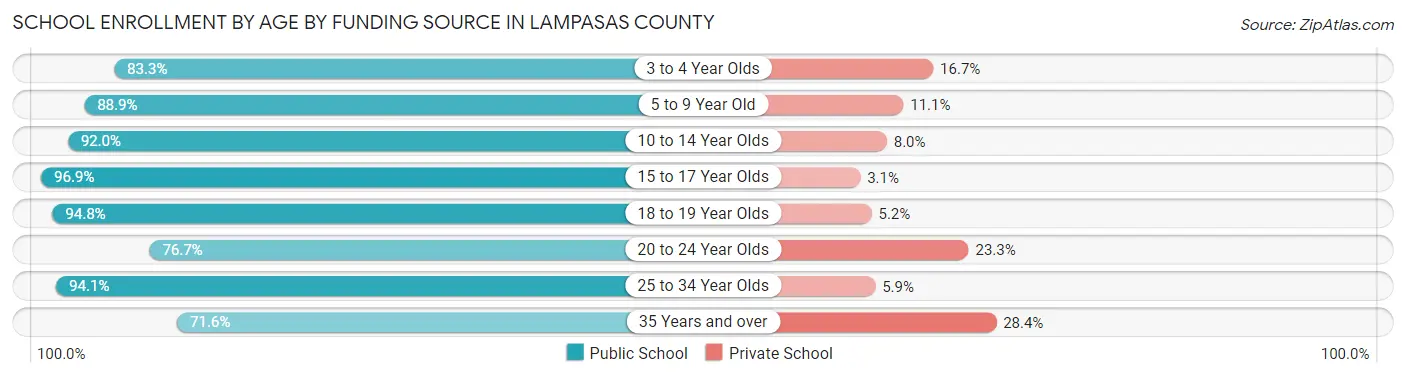
| Age Bracket | Public School | Private School |
| 3 to 4 Year Olds | 155 (83.3%) | 31 (16.7%) |
| 5 to 9 Year Old | 888 (88.9%) | 111 (11.1%) |
| 10 to 14 Year Olds | 1,488 (92.0%) | 130 (8.0%) |
| 15 to 17 Year Olds | 786 (96.9%) | 25 (3.1%) |
| 18 to 19 Year Olds | 402 (94.8%) | 22 (5.2%) |
| 20 to 24 Year Olds | 221 (76.7%) | 67 (23.3%) |
| 25 to 34 Year Olds | 80 (94.1%) | 5 (5.9%) |
| 35 Years and over | 373 (71.6%) | 148 (28.4%) |
| Total | 4,394 (89.1%) | 538 (10.9%) |
Educational Attainment by Field of Study in Lampasas County
Business (691 | 20.7%), education (660 | 19.8%), arts & humanities (362 | 10.9%), science & technology (288 | 8.6%), and bio, nature & agricultural (193 | 5.8%) are the most common fields of study among 3,332 individuals in Lampasas County who have obtained a bachelor's degree or higher.
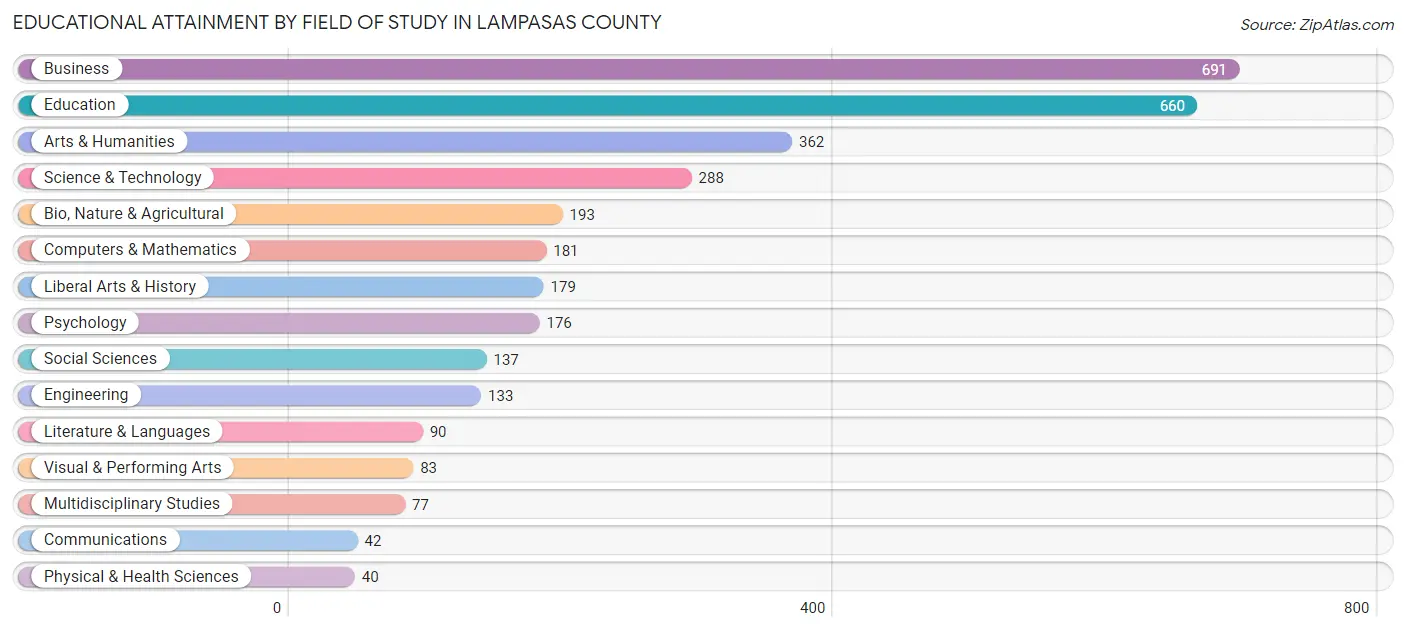
| Field of Study | # Graduates | % Graduates |
| Computers & Mathematics | 181 | 5.4% |
| Bio, Nature & Agricultural | 193 | 5.8% |
| Physical & Health Sciences | 40 | 1.2% |
| Psychology | 176 | 5.3% |
| Social Sciences | 137 | 4.1% |
| Engineering | 133 | 4.0% |
| Multidisciplinary Studies | 77 | 2.3% |
| Science & Technology | 288 | 8.6% |
| Business | 691 | 20.7% |
| Education | 660 | 19.8% |
| Literature & Languages | 90 | 2.7% |
| Liberal Arts & History | 179 | 5.4% |
| Visual & Performing Arts | 83 | 2.5% |
| Communications | 42 | 1.3% |
| Arts & Humanities | 362 | 10.9% |
| Total | 3,332 | 100.0% |
Transportation & Commute in Lampasas County
Vehicle Availability by Sex in Lampasas County
The most prevalent vehicle ownership categories in Lampasas County are males with 2 vehicles (2,198, accounting for 44.9%) and females with 2 vehicles (1,583, making up 57.0%).
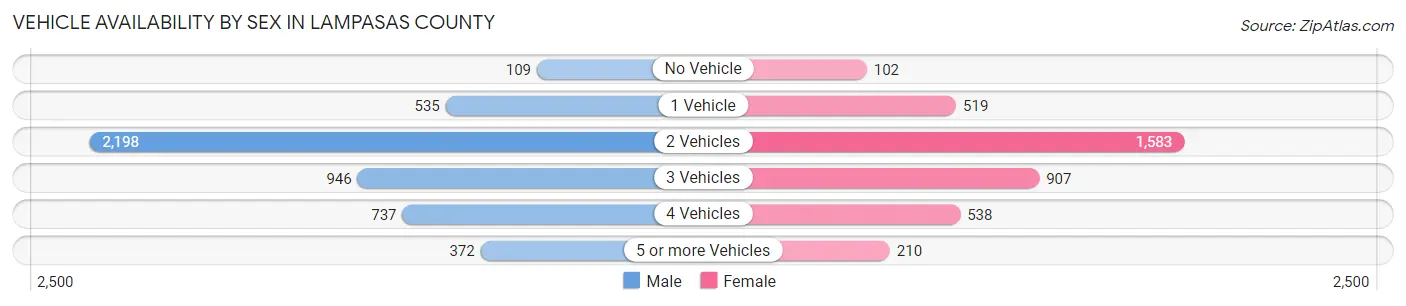
| Vehicles Available | Male | Female |
| No Vehicle | 109 (2.2%) | 102 (2.6%) |
| 1 Vehicle | 535 (10.9%) | 519 (13.5%) |
| 2 Vehicles | 2,198 (44.9%) | 1,583 (41.0%) |
| 3 Vehicles | 946 (19.3%) | 907 (23.5%) |
| 4 Vehicles | 737 (15.0%) | 538 (13.9%) |
| 5 or more Vehicles | 372 (7.6%) | 210 (5.4%) |
| Total | 4,897 (100.0%) | 3,859 (100.0%) |
Commute Time in Lampasas County
The most frequently occuring commute durations in Lampasas County are 5 to 9 minutes (1,144 commuters, 13.9%), 15 to 19 minutes (1,086 commuters, 13.2%), and 10 to 14 minutes (991 commuters, 12.0%).
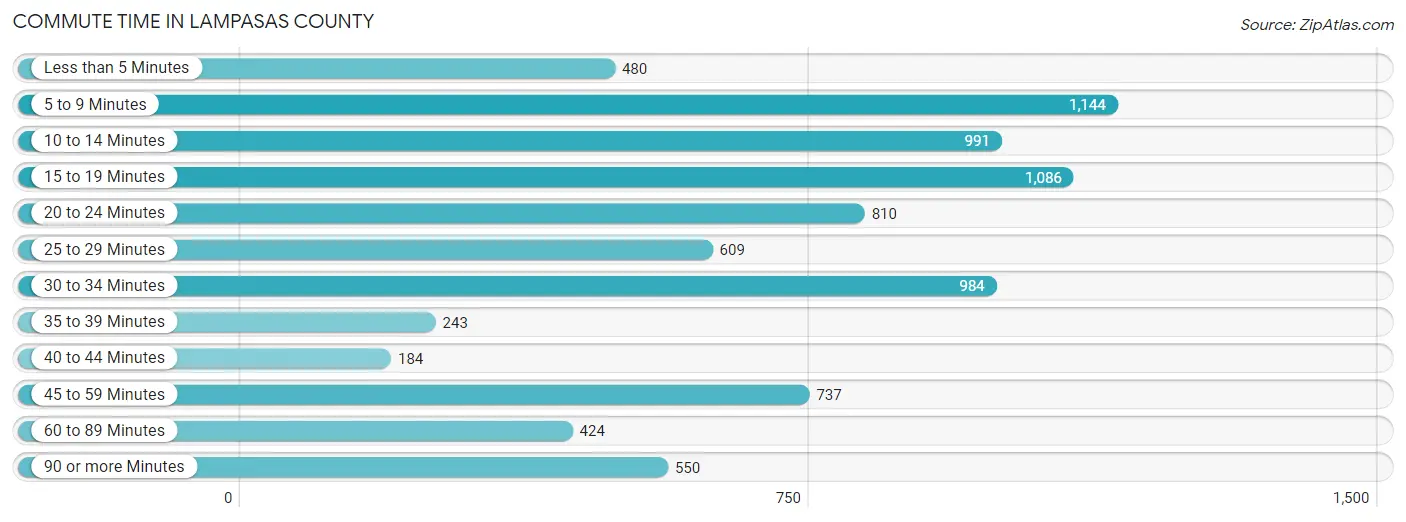
| Commute Time | # Commuters | % Commuters |
| Less than 5 Minutes | 480 | 5.8% |
| 5 to 9 Minutes | 1,144 | 13.9% |
| 10 to 14 Minutes | 991 | 12.0% |
| 15 to 19 Minutes | 1,086 | 13.2% |
| 20 to 24 Minutes | 810 | 9.8% |
| 25 to 29 Minutes | 609 | 7.4% |
| 30 to 34 Minutes | 984 | 11.9% |
| 35 to 39 Minutes | 243 | 2.9% |
| 40 to 44 Minutes | 184 | 2.2% |
| 45 to 59 Minutes | 737 | 8.9% |
| 60 to 89 Minutes | 424 | 5.1% |
| 90 or more Minutes | 550 | 6.7% |
Commute Time by Sex in Lampasas County
The most common commute times in Lampasas County are 5 to 9 minutes (682 commuters, 14.5%) for males and 10 to 14 minutes (550 commuters, 15.5%) for females.
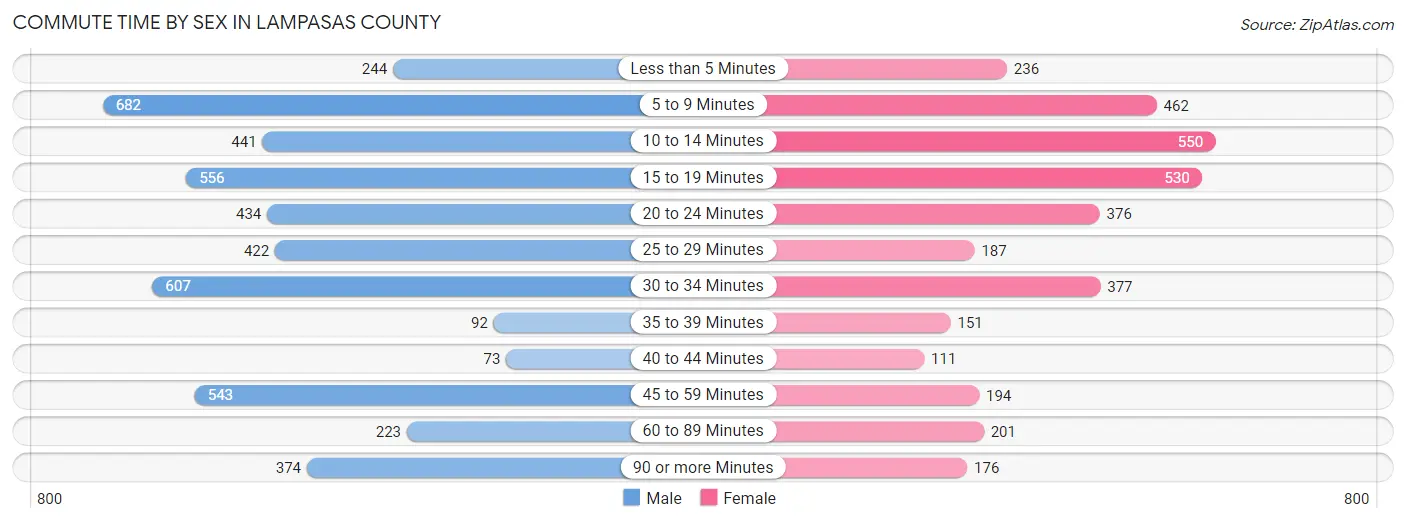
| Commute Time | Male | Female |
| Less than 5 Minutes | 244 (5.2%) | 236 (6.7%) |
| 5 to 9 Minutes | 682 (14.5%) | 462 (13.0%) |
| 10 to 14 Minutes | 441 (9.4%) | 550 (15.5%) |
| 15 to 19 Minutes | 556 (11.8%) | 530 (14.9%) |
| 20 to 24 Minutes | 434 (9.2%) | 376 (10.6%) |
| 25 to 29 Minutes | 422 (9.0%) | 187 (5.3%) |
| 30 to 34 Minutes | 607 (12.9%) | 377 (10.6%) |
| 35 to 39 Minutes | 92 (2.0%) | 151 (4.3%) |
| 40 to 44 Minutes | 73 (1.6%) | 111 (3.1%) |
| 45 to 59 Minutes | 543 (11.6%) | 194 (5.5%) |
| 60 to 89 Minutes | 223 (4.8%) | 201 (5.7%) |
| 90 or more Minutes | 374 (8.0%) | 176 (5.0%) |
Time of Departure to Work by Sex in Lampasas County
The most frequent times of departure to work in Lampasas County are 6:00 AM to 6:29 AM (696, 14.8%) for males and 7:00 AM to 7:29 AM (712, 20.1%) for females.
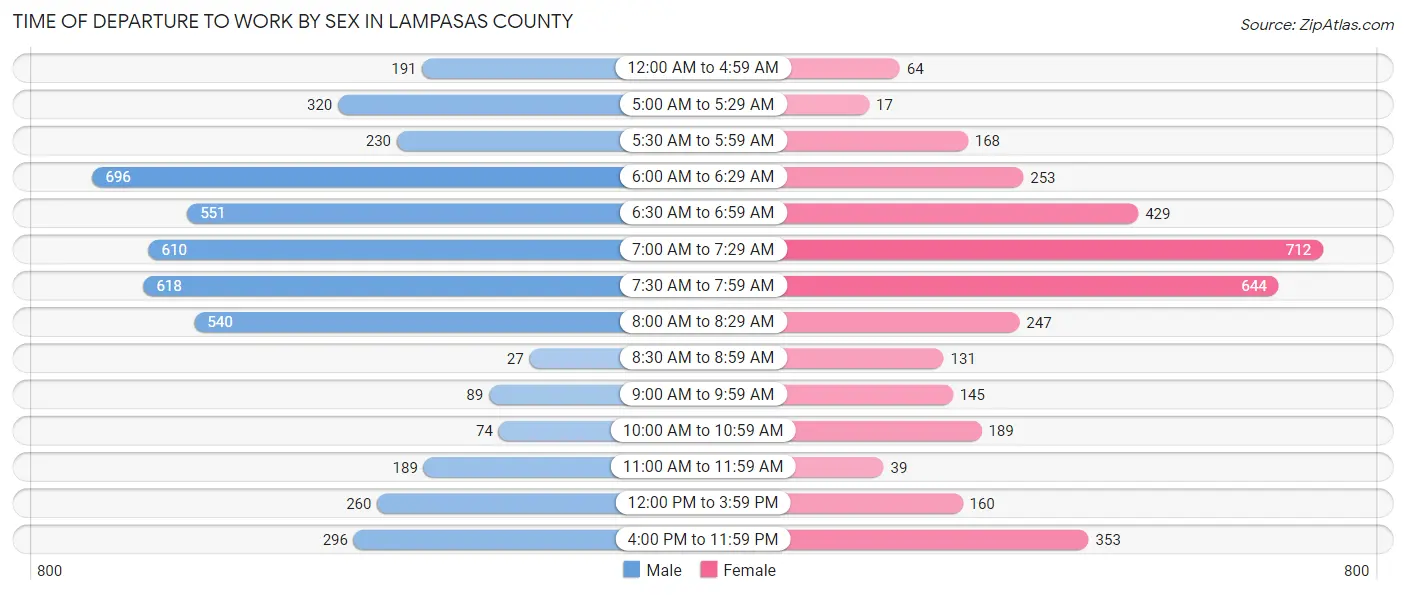
| Time of Departure | Male | Female |
| 12:00 AM to 4:59 AM | 191 (4.1%) | 64 (1.8%) |
| 5:00 AM to 5:29 AM | 320 (6.8%) | 17 (0.5%) |
| 5:30 AM to 5:59 AM | 230 (4.9%) | 168 (4.7%) |
| 6:00 AM to 6:29 AM | 696 (14.8%) | 253 (7.1%) |
| 6:30 AM to 6:59 AM | 551 (11.7%) | 429 (12.1%) |
| 7:00 AM to 7:29 AM | 610 (13.0%) | 712 (20.1%) |
| 7:30 AM to 7:59 AM | 618 (13.2%) | 644 (18.1%) |
| 8:00 AM to 8:29 AM | 540 (11.5%) | 247 (7.0%) |
| 8:30 AM to 8:59 AM | 27 (0.6%) | 131 (3.7%) |
| 9:00 AM to 9:59 AM | 89 (1.9%) | 145 (4.1%) |
| 10:00 AM to 10:59 AM | 74 (1.6%) | 189 (5.3%) |
| 11:00 AM to 11:59 AM | 189 (4.0%) | 39 (1.1%) |
| 12:00 PM to 3:59 PM | 260 (5.5%) | 160 (4.5%) |
| 4:00 PM to 11:59 PM | 296 (6.3%) | 353 (9.9%) |
| Total | 4,691 (100.0%) | 3,551 (100.0%) |
Housing Occupancy in Lampasas County
Occupancy by Ownership in Lampasas County
Of the total 7,934 dwellings in Lampasas County, owner-occupied units account for 6,388 (80.5%), while renter-occupied units make up 1,546 (19.5%).
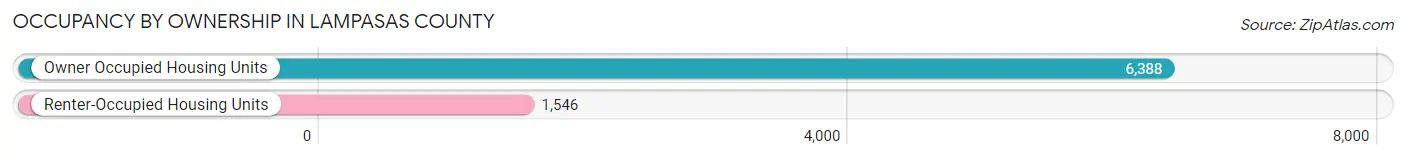
| Occupancy | # Housing Units | % Housing Units |
| Owner Occupied Housing Units | 6,388 | 80.5% |
| Renter-Occupied Housing Units | 1,546 | 19.5% |
| Total Occupied Housing Units | 7,934 | 100.0% |
Occupancy by Household Size in Lampasas County
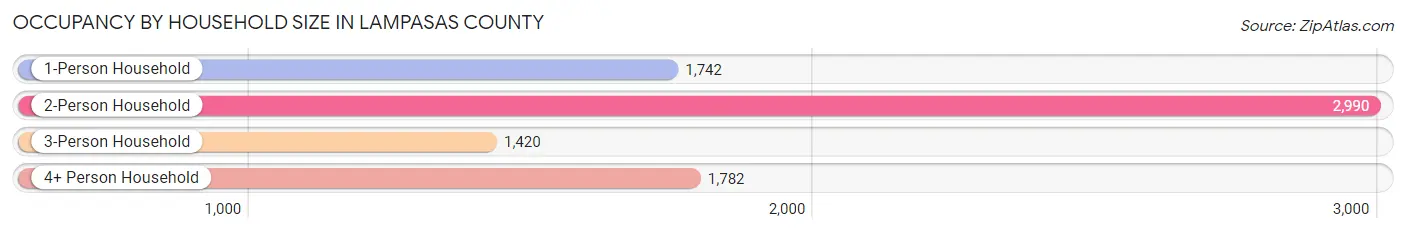
| Household Size | # Housing Units | % Housing Units |
| 1-Person Household | 1,742 | 22.0% |
| 2-Person Household | 2,990 | 37.7% |
| 3-Person Household | 1,420 | 17.9% |
| 4+ Person Household | 1,782 | 22.5% |
| Total Housing Units | 7,934 | 100.0% |
Occupancy by Ownership by Household Size in Lampasas County
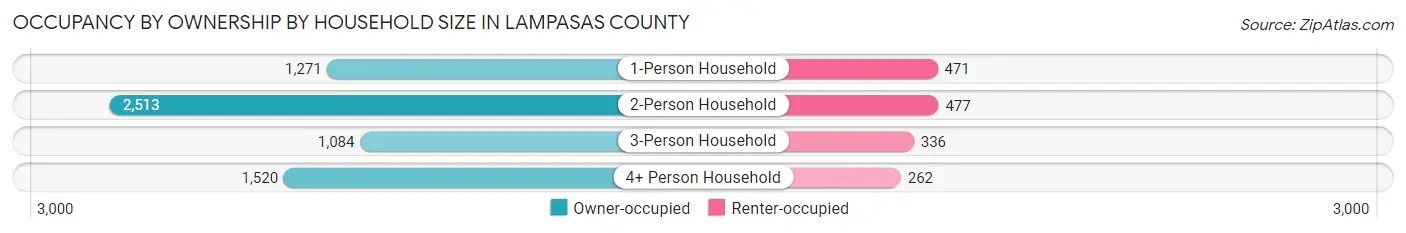
| Household Size | Owner-occupied | Renter-occupied |
| 1-Person Household | 1,271 (73.0%) | 471 (27.0%) |
| 2-Person Household | 2,513 (84.1%) | 477 (16.0%) |
| 3-Person Household | 1,084 (76.3%) | 336 (23.7%) |
| 4+ Person Household | 1,520 (85.3%) | 262 (14.7%) |
| Total Housing Units | 6,388 (80.5%) | 1,546 (19.5%) |
Occupancy by Educational Attainment in Lampasas County
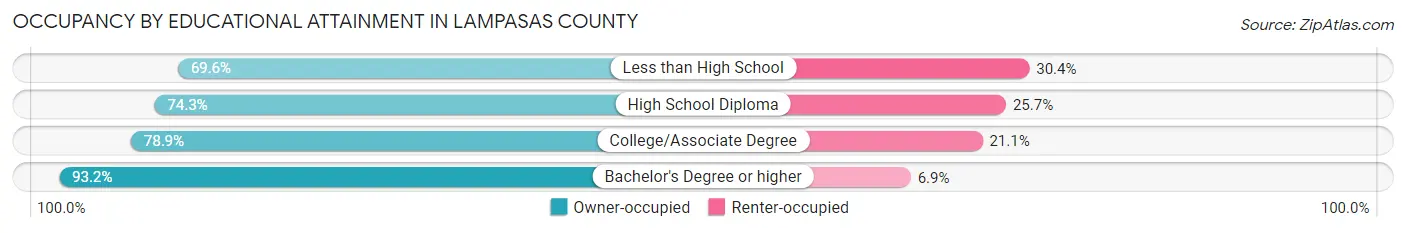
| Household Size | Owner-occupied | Renter-occupied |
| Less than High School | 429 (69.6%) | 187 (30.4%) |
| High School Diploma | 1,512 (74.3%) | 524 (25.7%) |
| College/Associate Degree | 2,624 (78.9%) | 701 (21.1%) |
| Bachelor's Degree or higher | 1,823 (93.1%) | 134 (6.9%) |
Occupancy by Age of Householder in Lampasas County
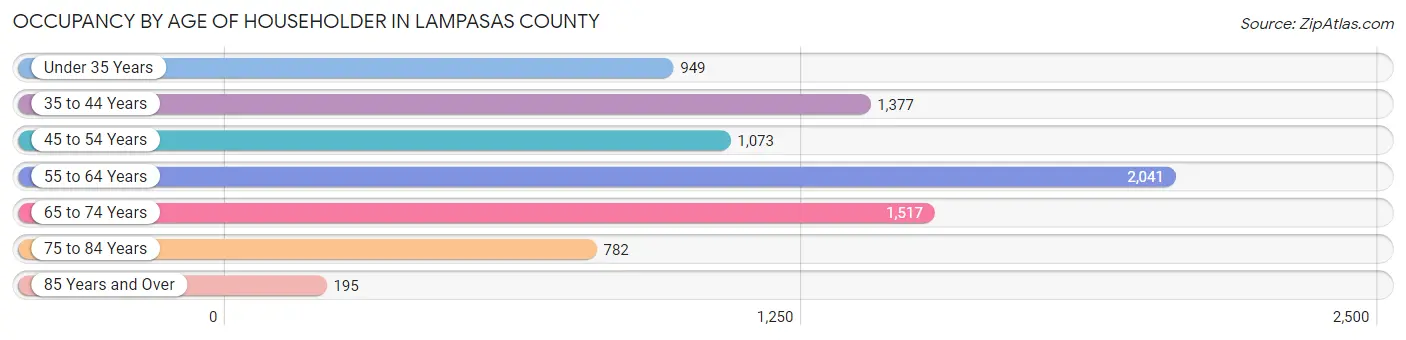
| Age Bracket | # Households | % Households |
| Under 35 Years | 949 | 12.0% |
| 35 to 44 Years | 1,377 | 17.4% |
| 45 to 54 Years | 1,073 | 13.5% |
| 55 to 64 Years | 2,041 | 25.7% |
| 65 to 74 Years | 1,517 | 19.1% |
| 75 to 84 Years | 782 | 9.9% |
| 85 Years and Over | 195 | 2.5% |
| Total | 7,934 | 100.0% |
Housing Finances in Lampasas County
Median Income by Occupancy in Lampasas County
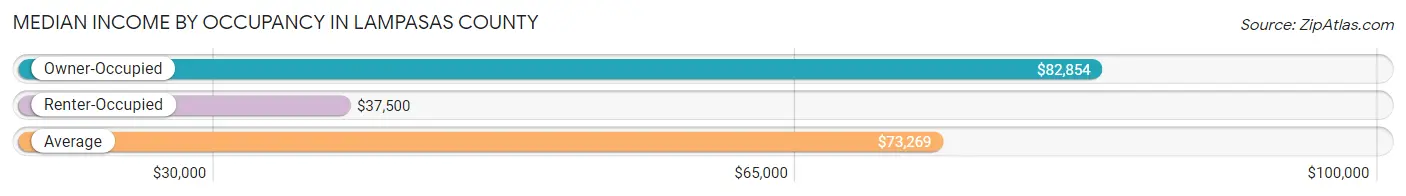
| Occupancy Type | # Households | Median Income |
| Owner-Occupied | 6,388 (80.5%) | $82,854 |
| Renter-Occupied | 1,546 (19.5%) | $37,500 |
| Average | 7,934 (100.0%) | $73,269 |
Occupancy by Householder Income Bracket in Lampasas County
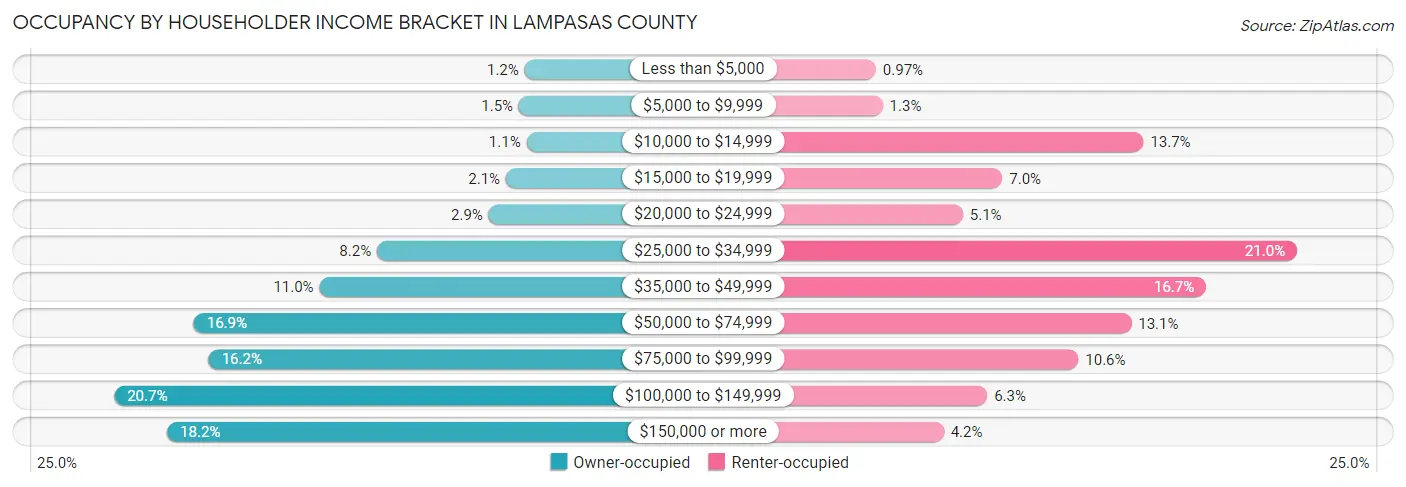
| Income Bracket | Owner-occupied | Renter-occupied |
| Less than $5,000 | 76 (1.2%) | 15 (1.0%) |
| $5,000 to $9,999 | 93 (1.5%) | 20 (1.3%) |
| $10,000 to $14,999 | 70 (1.1%) | 212 (13.7%) |
| $15,000 to $19,999 | 133 (2.1%) | 108 (7.0%) |
| $20,000 to $24,999 | 185 (2.9%) | 79 (5.1%) |
| $25,000 to $34,999 | 525 (8.2%) | 325 (21.0%) |
| $35,000 to $49,999 | 700 (11.0%) | 258 (16.7%) |
| $50,000 to $74,999 | 1,082 (16.9%) | 203 (13.1%) |
| $75,000 to $99,999 | 1,037 (16.2%) | 164 (10.6%) |
| $100,000 to $149,999 | 1,324 (20.7%) | 97 (6.3%) |
| $150,000 or more | 1,163 (18.2%) | 65 (4.2%) |
| Total | 6,388 (100.0%) | 1,546 (100.0%) |
Monthly Housing Cost Tiers in Lampasas County
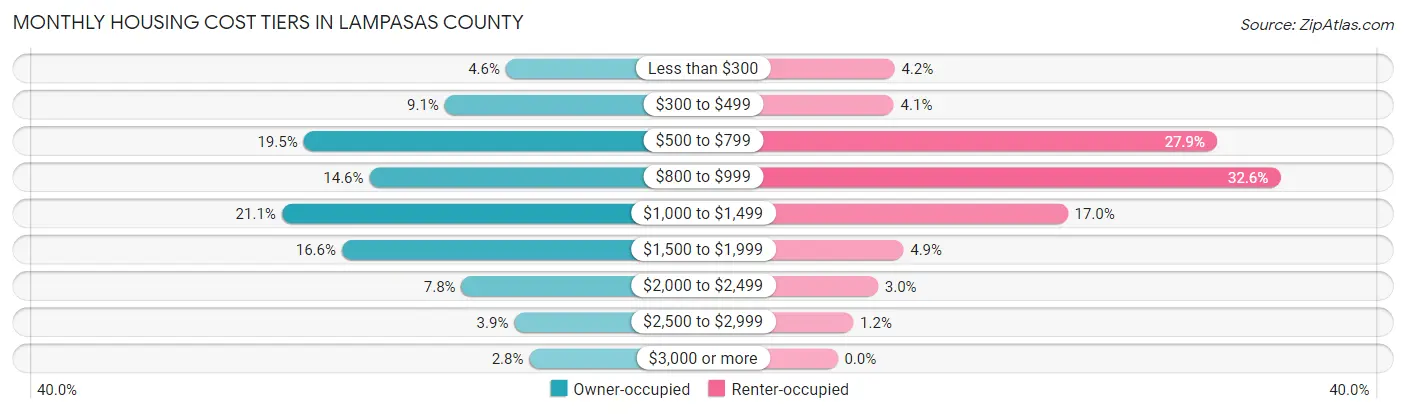
| Monthly Cost | Owner-occupied | Renter-occupied |
| Less than $300 | 291 (4.6%) | 65 (4.2%) |
| $300 to $499 | 579 (9.1%) | 64 (4.1%) |
| $500 to $799 | 1,243 (19.5%) | 432 (27.9%) |
| $800 to $999 | 933 (14.6%) | 504 (32.6%) |
| $1,000 to $1,499 | 1,346 (21.1%) | 262 (17.0%) |
| $1,500 to $1,999 | 1,063 (16.6%) | 75 (4.9%) |
| $2,000 to $2,499 | 500 (7.8%) | 46 (3.0%) |
| $2,500 to $2,999 | 252 (3.9%) | 18 (1.2%) |
| $3,000 or more | 181 (2.8%) | 0 (0.0%) |
| Total | 6,388 (100.0%) | 1,546 (100.0%) |
Physical Housing Characteristics in Lampasas County
Housing Structures in Lampasas County
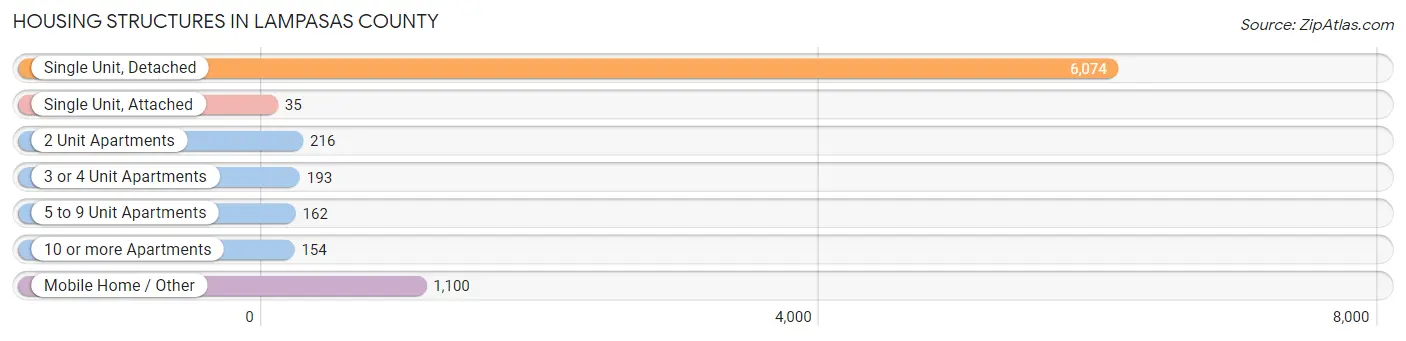
| Structure Type | # Housing Units | % Housing Units |
| Single Unit, Detached | 6,074 | 76.6% |
| Single Unit, Attached | 35 | 0.4% |
| 2 Unit Apartments | 216 | 2.7% |
| 3 or 4 Unit Apartments | 193 | 2.4% |
| 5 to 9 Unit Apartments | 162 | 2.0% |
| 10 or more Apartments | 154 | 1.9% |
| Mobile Home / Other | 1,100 | 13.9% |
| Total | 7,934 | 100.0% |
Housing Structures by Occupancy in Lampasas County
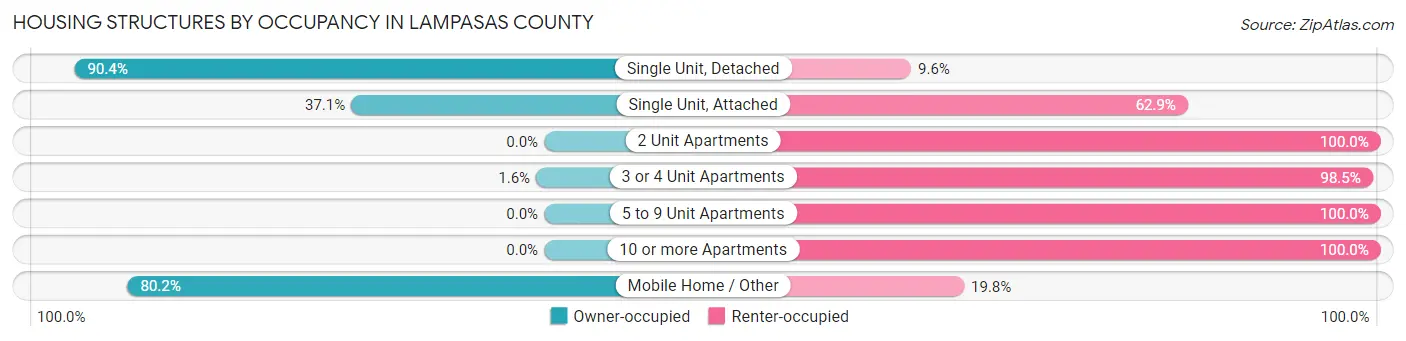
| Structure Type | Owner-occupied | Renter-occupied |
| Single Unit, Detached | 5,490 (90.4%) | 584 (9.6%) |
| Single Unit, Attached | 13 (37.1%) | 22 (62.9%) |
| 2 Unit Apartments | 0 (0.0%) | 216 (100.0%) |
| 3 or 4 Unit Apartments | 3 (1.5%) | 190 (98.5%) |
| 5 to 9 Unit Apartments | 0 (0.0%) | 162 (100.0%) |
| 10 or more Apartments | 0 (0.0%) | 154 (100.0%) |
| Mobile Home / Other | 882 (80.2%) | 218 (19.8%) |
| Total | 6,388 (80.5%) | 1,546 (19.5%) |
Housing Structures by Number of Rooms in Lampasas County
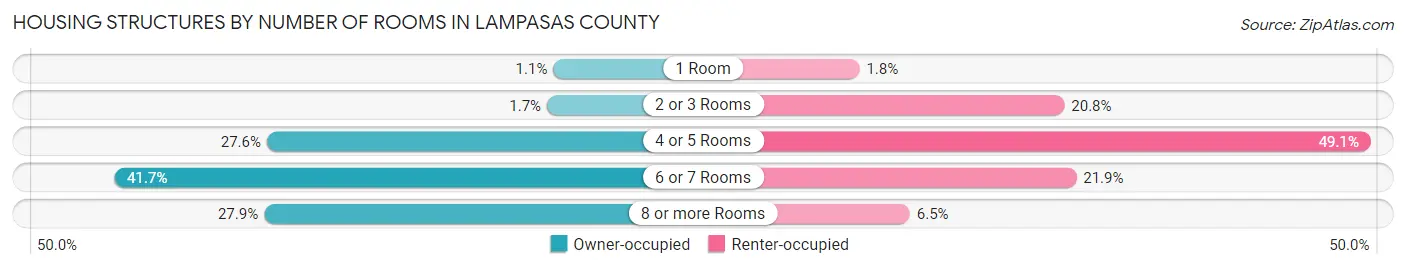
| Number of Rooms | Owner-occupied | Renter-occupied |
| 1 Room | 71 (1.1%) | 28 (1.8%) |
| 2 or 3 Rooms | 108 (1.7%) | 321 (20.8%) |
| 4 or 5 Rooms | 1,763 (27.6%) | 759 (49.1%) |
| 6 or 7 Rooms | 2,666 (41.7%) | 338 (21.9%) |
| 8 or more Rooms | 1,780 (27.9%) | 100 (6.5%) |
| Total | 6,388 (100.0%) | 1,546 (100.0%) |
Housing Structure by Heating Type in Lampasas County
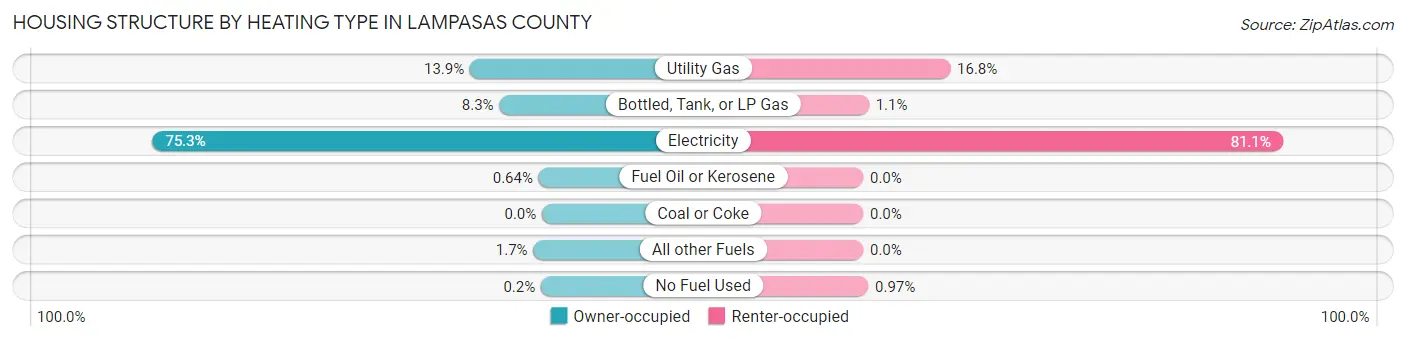
| Heating Type | Owner-occupied | Renter-occupied |
| Utility Gas | 889 (13.9%) | 260 (16.8%) |
| Bottled, Tank, or LP Gas | 527 (8.3%) | 17 (1.1%) |
| Electricity | 4,811 (75.3%) | 1,254 (81.1%) |
| Fuel Oil or Kerosene | 41 (0.6%) | 0 (0.0%) |
| Coal or Coke | 0 (0.0%) | 0 (0.0%) |
| All other Fuels | 107 (1.7%) | 0 (0.0%) |
| No Fuel Used | 13 (0.2%) | 15 (1.0%) |
| Total | 6,388 (100.0%) | 1,546 (100.0%) |
Household Vehicle Usage in Lampasas County
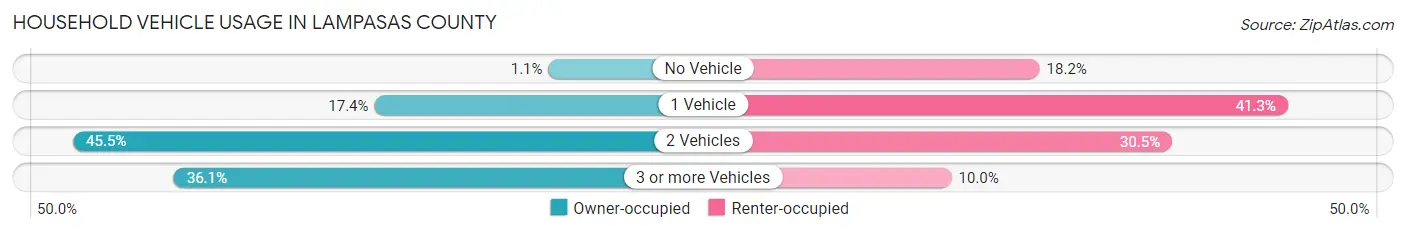
| Vehicles per Household | Owner-occupied | Renter-occupied |
| No Vehicle | 71 (1.1%) | 281 (18.2%) |
| 1 Vehicle | 1,108 (17.3%) | 639 (41.3%) |
| 2 Vehicles | 2,905 (45.5%) | 472 (30.5%) |
| 3 or more Vehicles | 2,304 (36.1%) | 154 (10.0%) |
| Total | 6,388 (100.0%) | 1,546 (100.0%) |
Real Estate & Mortgages in Lampasas County
Real Estate and Mortgage Overview in Lampasas County
| Characteristic | Without Mortgage | With Mortgage |
| Housing Units | 2,868 | 3,520 |
| Median Property Value | $201,900 | $228,800 |
| Median Household Income | $69,167 | $788 |
| Monthly Housing Costs | $651 | $181 |
| Real Estate Taxes | $2,423 | $613 |
Property Value by Mortgage Status in Lampasas County
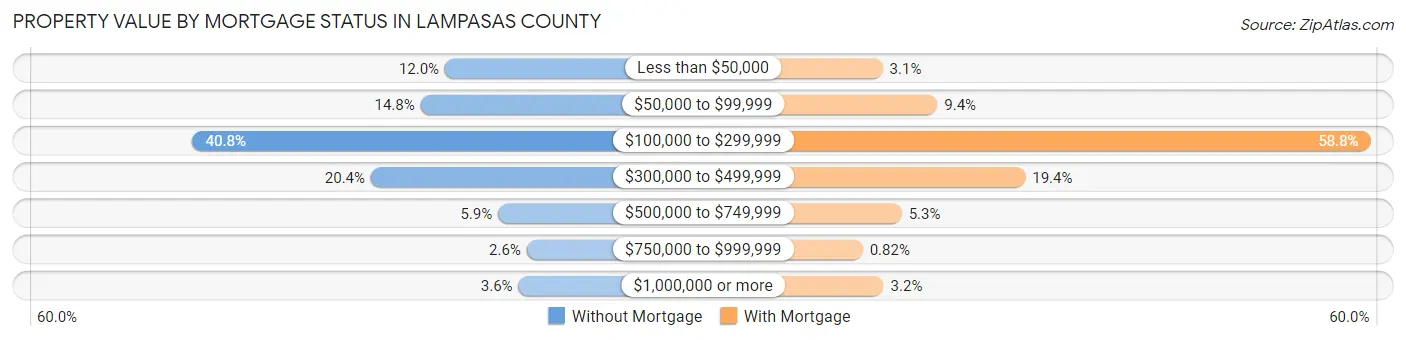
| Property Value | Without Mortgage | With Mortgage |
| Less than $50,000 | 343 (12.0%) | 109 (3.1%) |
| $50,000 to $99,999 | 423 (14.7%) | 329 (9.3%) |
| $100,000 to $299,999 | 1,170 (40.8%) | 2,071 (58.8%) |
| $300,000 to $499,999 | 586 (20.4%) | 683 (19.4%) |
| $500,000 to $749,999 | 169 (5.9%) | 186 (5.3%) |
| $750,000 to $999,999 | 75 (2.6%) | 29 (0.8%) |
| $1,000,000 or more | 102 (3.6%) | 113 (3.2%) |
| Total | 2,868 (100.0%) | 3,520 (100.0%) |
Household Income by Mortgage Status in Lampasas County
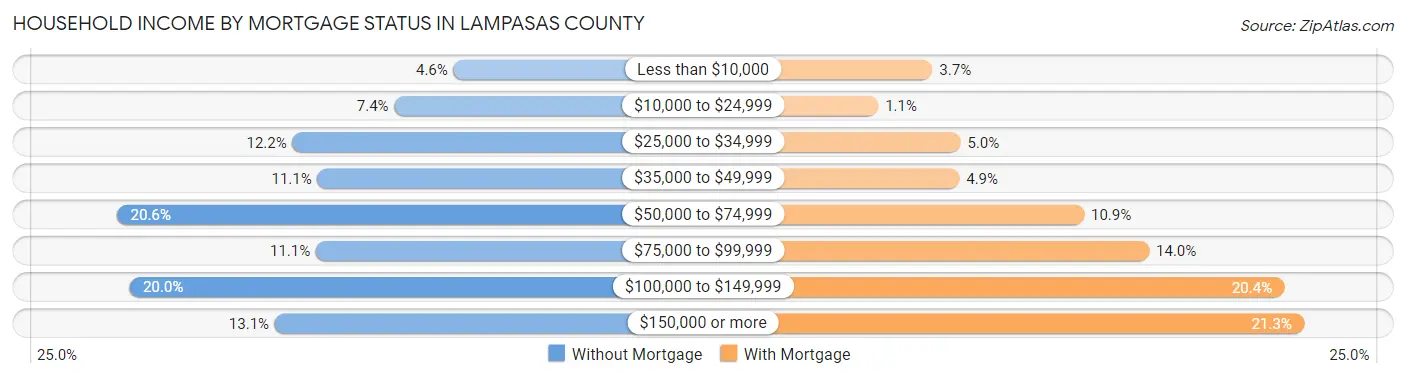
| Household Income | Without Mortgage | With Mortgage |
| Less than $10,000 | 131 (4.6%) | 129 (3.7%) |
| $10,000 to $24,999 | 212 (7.4%) | 38 (1.1%) |
| $25,000 to $34,999 | 351 (12.2%) | 176 (5.0%) |
| $35,000 to $49,999 | 317 (11.1%) | 174 (4.9%) |
| $50,000 to $74,999 | 590 (20.6%) | 383 (10.9%) |
| $75,000 to $99,999 | 319 (11.1%) | 492 (14.0%) |
| $100,000 to $149,999 | 573 (20.0%) | 718 (20.4%) |
| $150,000 or more | 375 (13.1%) | 751 (21.3%) |
| Total | 2,868 (100.0%) | 3,520 (100.0%) |
Property Value to Household Income Ratio in Lampasas County
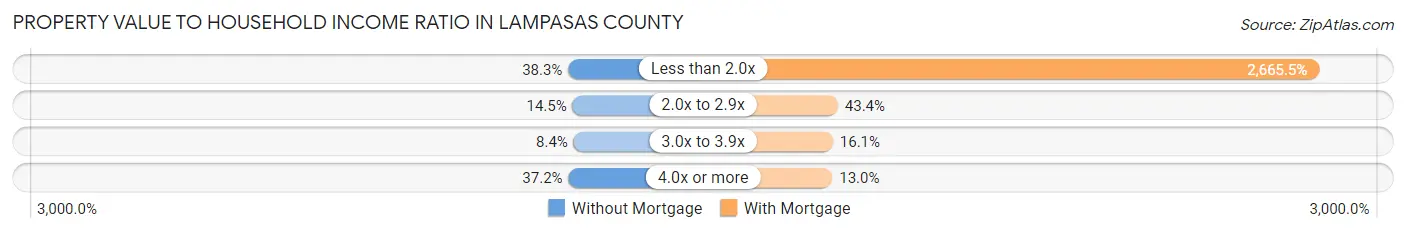
| Value-to-Income Ratio | Without Mortgage | With Mortgage |
| Less than 2.0x | 1,099 (38.3%) | 93,825 (2,665.5%) |
| 2.0x to 2.9x | 416 (14.5%) | 1,526 (43.3%) |
| 3.0x to 3.9x | 241 (8.4%) | 566 (16.1%) |
| 4.0x or more | 1,066 (37.2%) | 456 (13.0%) |
| Total | 2,868 (100.0%) | 3,520 (100.0%) |
Real Estate Taxes by Mortgage Status in Lampasas County

| Property Taxes | Without Mortgage | With Mortgage |
| Less than $800 | 496 (17.3%) | 0 (0.0%) |
| $800 to $1,499 | 325 (11.3%) | 317 (9.0%) |
| $800 to $1,499 | 1,869 (65.2%) | 228 (6.5%) |
| Total | 2,868 (100.0%) | 3,520 (100.0%) |
Health & Disability in Lampasas County
Health Insurance Coverage by Age in Lampasas County
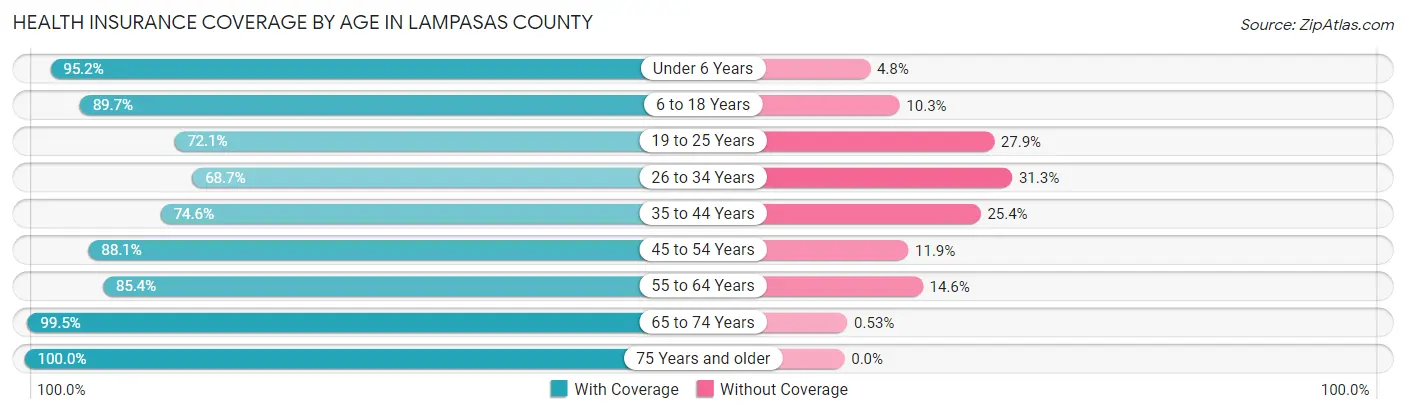
| Age Bracket | With Coverage | Without Coverage |
| Under 6 Years | 1,353 (95.2%) | 68 (4.8%) |
| 6 to 18 Years | 3,291 (89.7%) | 377 (10.3%) |
| 19 to 25 Years | 1,021 (72.1%) | 395 (27.9%) |
| 26 to 34 Years | 1,268 (68.7%) | 577 (31.3%) |
| 35 to 44 Years | 2,022 (74.6%) | 688 (25.4%) |
| 45 to 54 Years | 2,391 (88.1%) | 323 (11.9%) |
| 55 to 64 Years | 2,848 (85.4%) | 487 (14.6%) |
| 65 to 74 Years | 2,651 (99.5%) | 14 (0.5%) |
| 75 Years and older | 1,692 (100.0%) | 0 (0.0%) |
| Total | 18,537 (86.4%) | 2,929 (13.6%) |
Health Insurance Coverage by Citizenship Status in Lampasas County
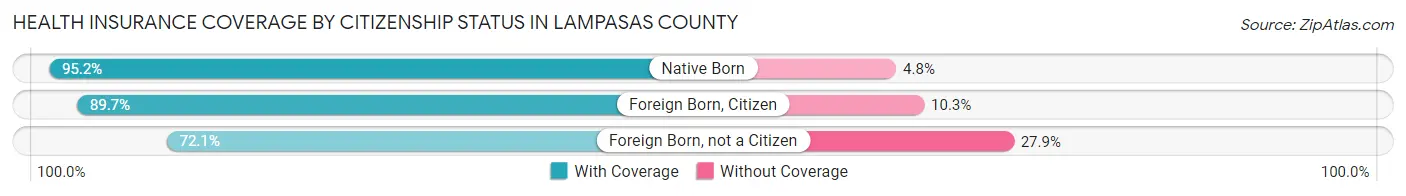
| Citizenship Status | With Coverage | Without Coverage |
| Native Born | 1,353 (95.2%) | 68 (4.8%) |
| Foreign Born, Citizen | 3,291 (89.7%) | 377 (10.3%) |
| Foreign Born, not a Citizen | 1,021 (72.1%) | 395 (27.9%) |
Health Insurance Coverage by Household Income in Lampasas County
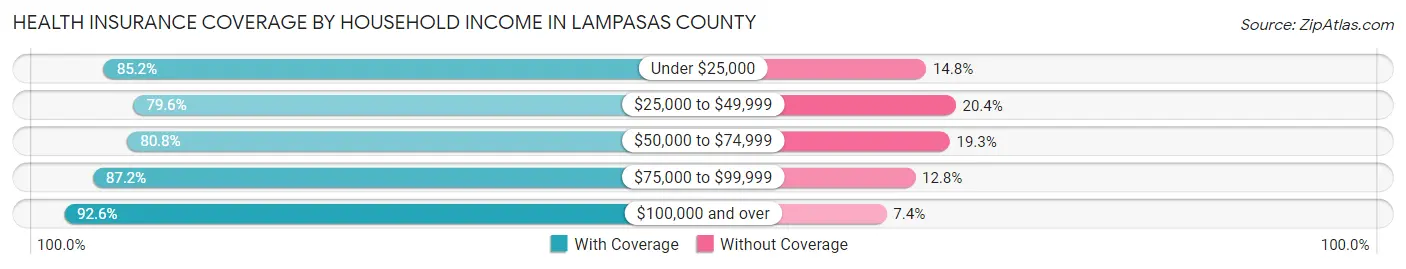
| Household Income | With Coverage | Without Coverage |
| Under $25,000 | 1,452 (85.2%) | 253 (14.8%) |
| $25,000 to $49,999 | 3,336 (79.6%) | 854 (20.4%) |
| $50,000 to $74,999 | 3,239 (80.7%) | 772 (19.3%) |
| $75,000 to $99,999 | 2,980 (87.2%) | 437 (12.8%) |
| $100,000 and over | 7,485 (92.6%) | 600 (7.4%) |
Public vs Private Health Insurance Coverage by Age in Lampasas County
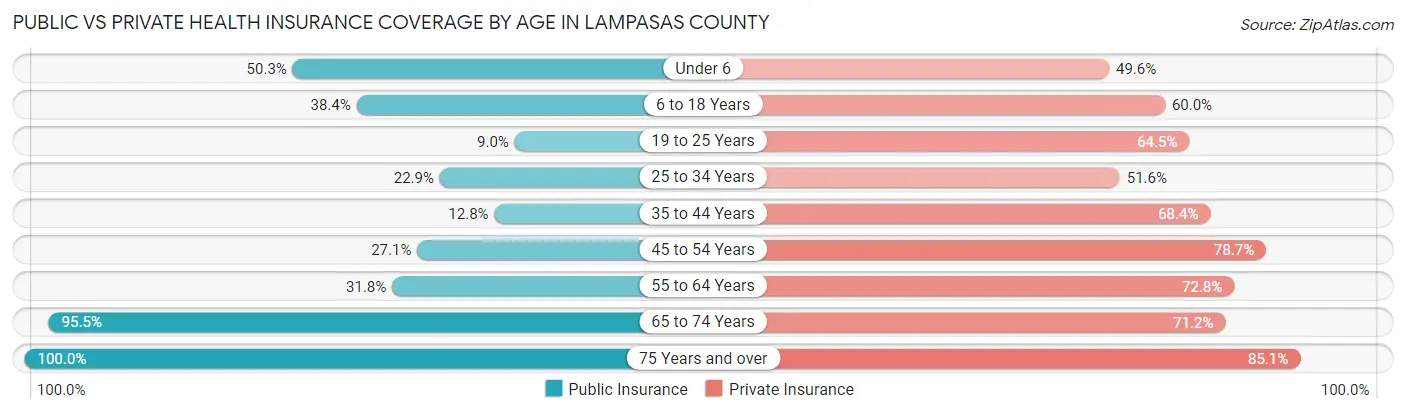
| Age Bracket | Public Insurance | Private Insurance |
| Under 6 | 714 (50.2%) | 705 (49.6%) |
| 6 to 18 Years | 1,408 (38.4%) | 2,200 (60.0%) |
| 19 to 25 Years | 128 (9.0%) | 913 (64.5%) |
| 25 to 34 Years | 423 (22.9%) | 952 (51.6%) |
| 35 to 44 Years | 347 (12.8%) | 1,853 (68.4%) |
| 45 to 54 Years | 736 (27.1%) | 2,137 (78.7%) |
| 55 to 64 Years | 1,060 (31.8%) | 2,428 (72.8%) |
| 65 to 74 Years | 2,546 (95.5%) | 1,897 (71.2%) |
| 75 Years and over | 1,692 (100.0%) | 1,439 (85.1%) |
| Total | 9,054 (42.2%) | 14,524 (67.7%) |
Disability Status by Sex by Age in Lampasas County
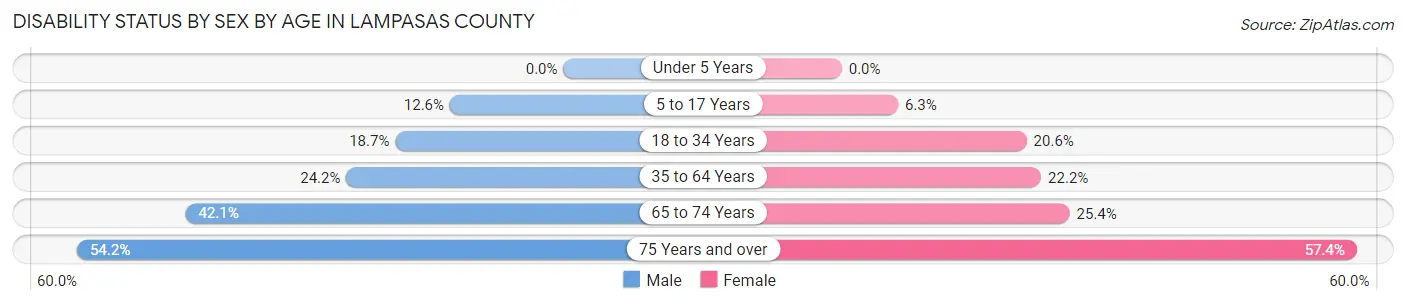
| Age Bracket | Male | Female |
| Under 5 Years | 0 (0.0%) | 0 (0.0%) |
| 5 to 17 Years | 220 (12.6%) | 114 (6.3%) |
| 18 to 34 Years | 369 (18.7%) | 361 (20.6%) |
| 35 to 64 Years | 1,074 (24.2%) | 958 (22.2%) |
| 65 to 74 Years | 521 (42.1%) | 362 (25.4%) |
| 75 Years and over | 430 (54.2%) | 515 (57.4%) |
Disability Class by Sex by Age in Lampasas County
Disability Class: Hearing Difficulty
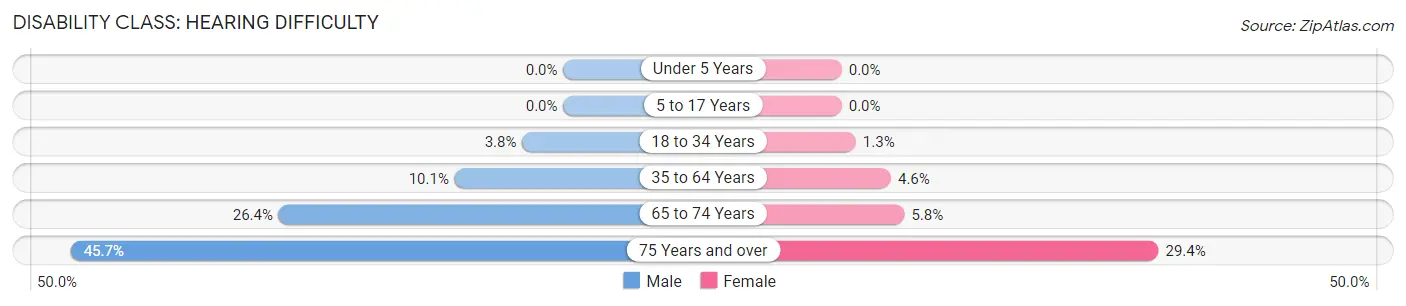
| Age Bracket | Male | Female |
| Under 5 Years | 0 (0.0%) | 0 (0.0%) |
| 5 to 17 Years | 0 (0.0%) | 0 (0.0%) |
| 18 to 34 Years | 75 (3.8%) | 23 (1.3%) |
| 35 to 64 Years | 448 (10.1%) | 197 (4.6%) |
| 65 to 74 Years | 327 (26.4%) | 83 (5.8%) |
| 75 Years and over | 363 (45.7%) | 264 (29.4%) |
Disability Class: Vision Difficulty
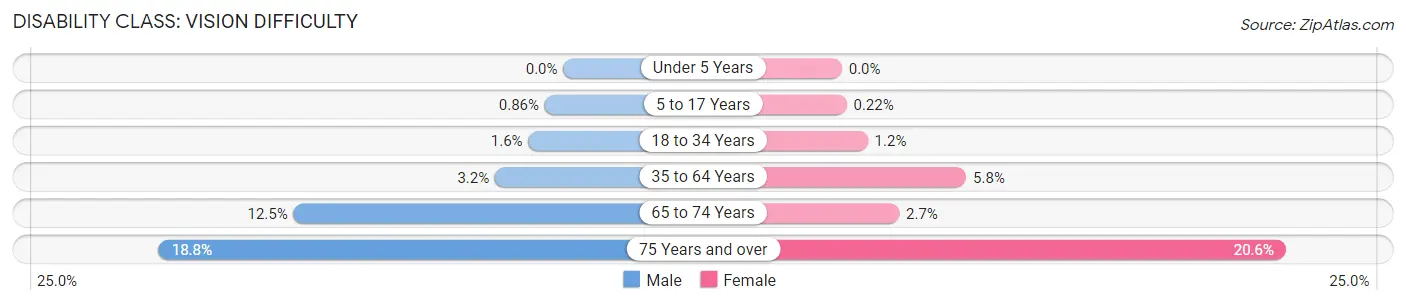
| Age Bracket | Male | Female |
| Under 5 Years | 0 (0.0%) | 0 (0.0%) |
| 5 to 17 Years | 15 (0.9%) | 4 (0.2%) |
| 18 to 34 Years | 32 (1.6%) | 21 (1.2%) |
| 35 to 64 Years | 141 (3.2%) | 249 (5.8%) |
| 65 to 74 Years | 155 (12.5%) | 38 (2.7%) |
| 75 Years and over | 149 (18.8%) | 185 (20.6%) |
Disability Class: Cognitive Difficulty
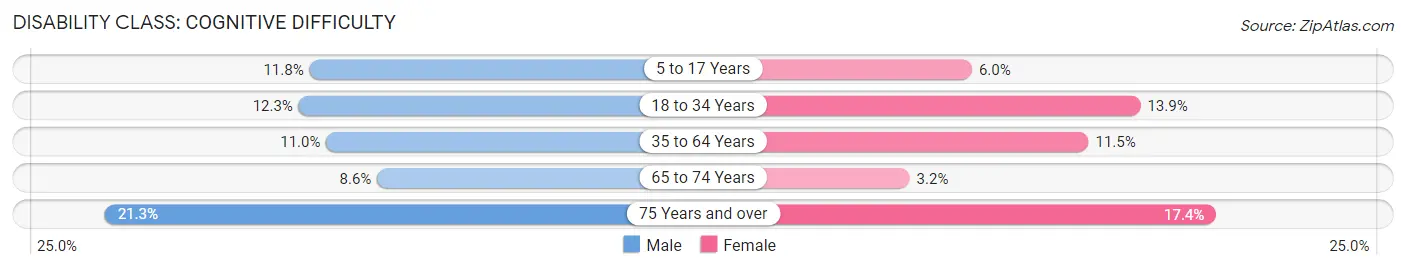
| Age Bracket | Male | Female |
| 5 to 17 Years | 205 (11.8%) | 110 (6.0%) |
| 18 to 34 Years | 242 (12.3%) | 243 (13.9%) |
| 35 to 64 Years | 489 (11.0%) | 494 (11.5%) |
| 65 to 74 Years | 107 (8.6%) | 45 (3.2%) |
| 75 Years and over | 169 (21.3%) | 156 (17.4%) |
Disability Class: Ambulatory Difficulty
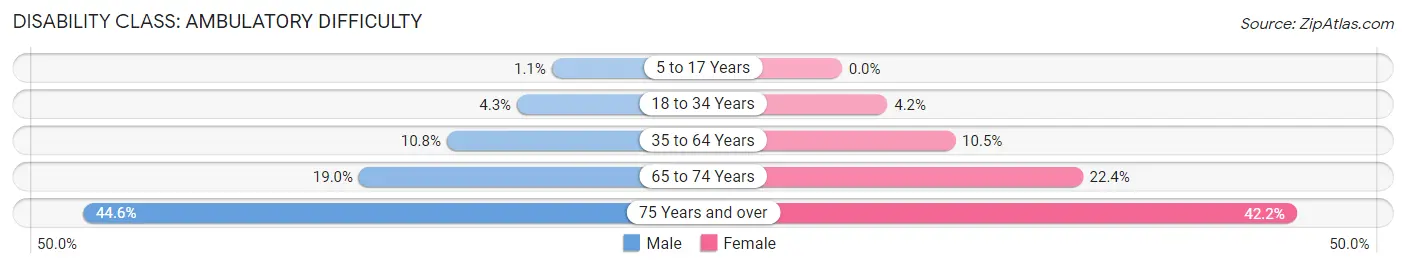
| Age Bracket | Male | Female |
| 5 to 17 Years | 19 (1.1%) | 0 (0.0%) |
| 18 to 34 Years | 85 (4.3%) | 74 (4.2%) |
| 35 to 64 Years | 481 (10.8%) | 454 (10.5%) |
| 65 to 74 Years | 235 (19.0%) | 319 (22.4%) |
| 75 Years and over | 354 (44.6%) | 379 (42.2%) |
Disability Class: Self-Care Difficulty
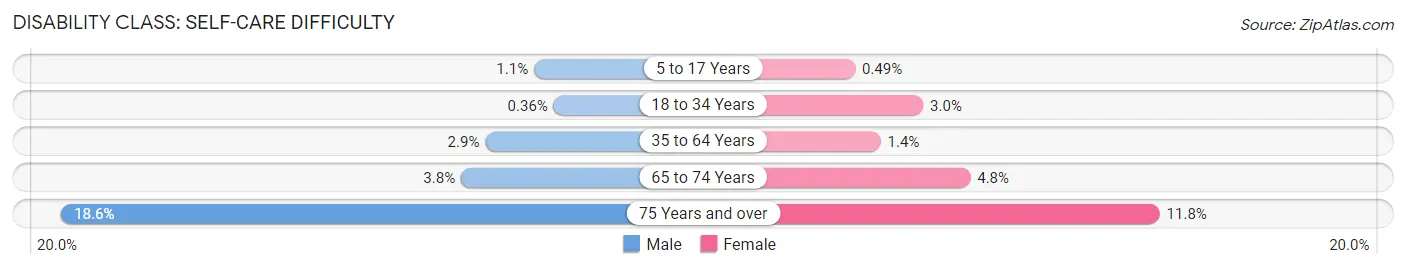
| Age Bracket | Male | Female |
| 5 to 17 Years | 19 (1.1%) | 9 (0.5%) |
| 18 to 34 Years | 7 (0.4%) | 53 (3.0%) |
| 35 to 64 Years | 129 (2.9%) | 62 (1.4%) |
| 65 to 74 Years | 47 (3.8%) | 68 (4.8%) |
| 75 Years and over | 148 (18.6%) | 106 (11.8%) |
Technology Access in Lampasas County
Computing Device Access in Lampasas County
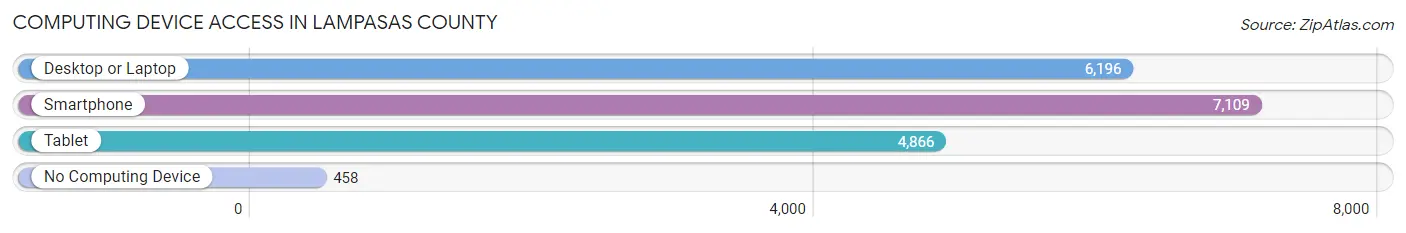
| Device Type | # Households | % Households |
| Desktop or Laptop | 6,196 | 78.1% |
| Smartphone | 7,109 | 89.6% |
| Tablet | 4,866 | 61.3% |
| No Computing Device | 458 | 5.8% |
| Total | 7,934 | 100.0% |
Internet Access in Lampasas County
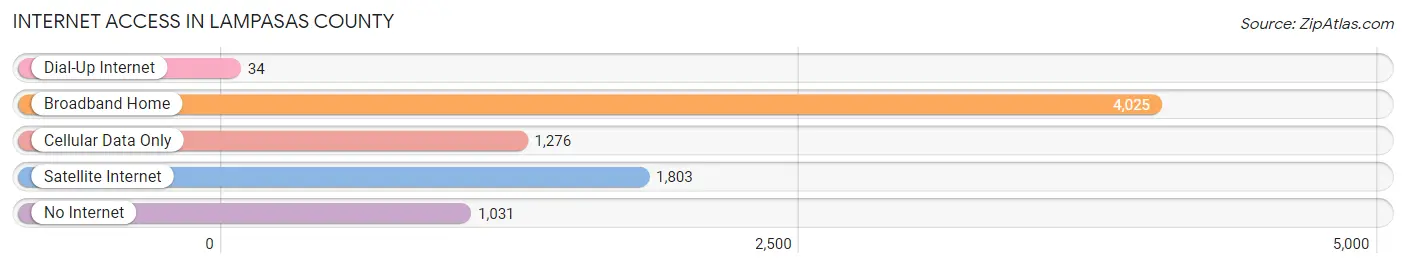
| Internet Type | # Households | % Households |
| Dial-Up Internet | 34 | 0.4% |
| Broadband Home | 4,025 | 50.7% |
| Cellular Data Only | 1,276 | 16.1% |
| Satellite Internet | 1,803 | 22.7% |
| No Internet | 1,031 | 13.0% |
| Total | 7,934 | 100.0% |
Lampasas County Summary
Lampasas County is located in the central part of Texas, in the Hill Country region of the state. It is bordered by Burnet, Bell, Coryell, Hamilton, and San Saba counties. The county seat is Lampasas, and the county is named for the Lampasas River, which runs through the county. The county has a total area of 890 square miles, with 887 square miles of land and 3 square miles of water.
History
The area that is now Lampasas County was first inhabited by Native Americans, including the Tonkawa, Comanche, and Apache tribes. The first Europeans to settle in the area were Spanish missionaries and explorers in the late 1700s. The first Anglo-American settlers arrived in the area in the early 1800s, and the county was officially established in 1856.
The county was named for the Lampasas River, which was named by Spanish explorers in the late 1700s. The river was named for the Lampasas Indians, a tribe of Native Americans who lived in the area.
The county was largely agricultural in the late 1800s and early 1900s, with cotton, corn, and wheat being the main crops. The county also had a thriving cattle industry. In the late 1800s, the county was home to several large ranches, including the 6666 Ranch, which is still in operation today.
In the early 1900s, the county began to develop its oil and gas industry. The first oil well was drilled in the county in 1921, and the industry has been a major part of the county's economy ever since.
Geography
Lampasas County is located in the Hill Country region of Texas. The county is mostly flat, with rolling hills and some rugged terrain in the western part of the county. The Lampasas River runs through the county, and there are several small lakes and reservoirs in the area.
The county has a total area of 890 square miles, with 887 square miles of land and 3 square miles of water. The county is bordered by Burnet, Bell, Coryell, Hamilton, and San Saba counties.
Economy
Lampasas County has a diverse economy, with a mix of agriculture, oil and gas, manufacturing, and tourism. The county is home to several large ranches, including the 6666 Ranch, which is one of the largest ranches in the United States.
Agriculture is a major part of the county's economy, with cotton, corn, and wheat being the main crops. The county also has a thriving cattle industry.
The oil and gas industry is also a major part of the county's economy. The first oil well was drilled in the county in 1921, and the industry has been a major part of the county's economy ever since.
Manufacturing is also an important part of the county's economy. The county is home to several manufacturing companies, including a large steel mill.
Tourism is also an important part of the county's economy. The county is home to several popular tourist attractions, including the 6666 Ranch, the Lampasas County Museum, and the Lampasas County Historical Society.
Demographics
As of the 2010 census, the population of Lampasas County was 19,677. The population is mostly white (83.3%), with small percentages of African American (7.2%), Hispanic (7.1%), and Native American (0.7%) residents.
The median household income in the county is $45,845, and the median family income is $51,945. The per capita income in the county is $21,845.
The county has a poverty rate of 16.3%, and the unemployment rate is 4.2%. The largest employers in the county are the Lampasas Independent School District, the Lampasas County Hospital, and the Lampasas County Sheriff's Office.
Common Questions
What is Per Capita Income in Lampasas County?
Per Capita income in Lampasas County is $33,787.
What is the Median Family Income in Lampasas County?
Median Family Income in Lampasas County is $88,527.
What is the Median Household income in Lampasas County?
Median Household Income in Lampasas County is $73,269.
What is Income or Wage Gap in Lampasas County?
Income or Wage Gap in Lampasas County is 37.0%.
Women in Lampasas County earn 63.0 cents for every dollar earned by a man.
What is Inequality or Gini Index in Lampasas County?
Inequality or Gini Index in Lampasas County is 0.41.
What is the Total Population of Lampasas County?
Total Population of Lampasas County is 21,829.
What is the Total Male Population of Lampasas County?
Total Male Population of Lampasas County is 11,019.
What is the Total Female Population of Lampasas County?
Total Female Population of Lampasas County is 10,810.
What is the Ratio of Males per 100 Females in Lampasas County?
There are 101.93 Males per 100 Females in Lampasas County.
What is the Ratio of Females per 100 Males in Lampasas County?
There are 98.10 Females per 100 Males in Lampasas County.
What is the Median Population Age in Lampasas County?
Median Population Age in Lampasas County is 43.8 Years.
What is the Average Family Size in Lampasas County
Average Family Size in Lampasas County is 3.2 People.
What is the Average Household Size in Lampasas County
Average Household Size in Lampasas County is 2.7 People.
How Large is the Labor Force in Lampasas County?
There are 9,457 People in the Labor Forcein in Lampasas County.
What is the Percentage of People in the Labor Force in Lampasas County?
53.4% of People are in the Labor Force in Lampasas County.
What is the Unemployment Rate in Lampasas County?
Unemployment Rate in Lampasas County is 5.3%.