Lamb County, TX Map & Demographics
Lamb County Map
Lamb County Overview
$26,687
PER CAPITA INCOME
$69,626
AVG FAMILY INCOME
$54,519
AVG HOUSEHOLD INCOME
42.9%
WAGE / INCOME GAP [ % ]
57.1¢/ $1
WAGE / INCOME GAP [ $ ]
$11,086
FAMILY INCOME DEFICIT
0.44
INEQUALITY / GINI INDEX
13,024
TOTAL POPULATION
6,523
MALE POPULATION
6,501
FEMALE POPULATION
100.34
MALES / 100 FEMALES
99.66
FEMALES / 100 MALES
36.8
MEDIAN AGE
3.5
AVG FAMILY SIZE
2.8
AVG HOUSEHOLD SIZE
5,719
LABOR FORCE [ PEOPLE ]
58.2%
PERCENT IN LABOR FORCE
2.8%
UNEMPLOYMENT RATE
Lamb County Area Codes
Income in Lamb County
Income Overview in Lamb County
Per Capita Income in Lamb County is $26,687, while median incomes of families and households are $69,626 and $54,519 respectively.
| Characteristic | Number | Measure |
| Per Capita Income | 13,024 | $26,687 |
| Median Family Income | 3,094 | $69,626 |
| Mean Family Income | 3,094 | $83,223 |
| Median Household Income | 4,632 | $54,519 |
| Mean Household Income | 4,632 | $70,219 |
| Income Deficit | 3,094 | $11,086 |
| Wage / Income Gap (%) | 13,024 | 42.90% |
| Wage / Income Gap ($) | 13,024 | 57.10¢ per $1 |
| Gini / Inequality Index | 13,024 | 0.44 |
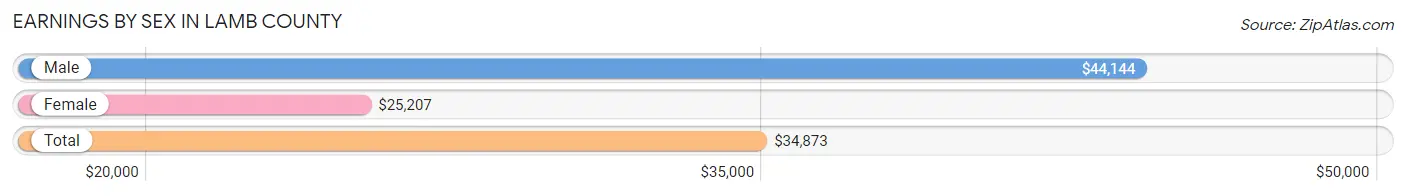
Earnings by Sex in Lamb County
Average Earnings in Lamb County are $34,873, $44,144 for men and $25,207 for women, a difference of 42.9%.
| Sex | Number | Average Earnings |
| Male | 3,364 (56.3%) | $44,144 |
| Female | 2,608 (43.7%) | $25,207 |
| Total | 5,972 (100.0%) | $34,873 |
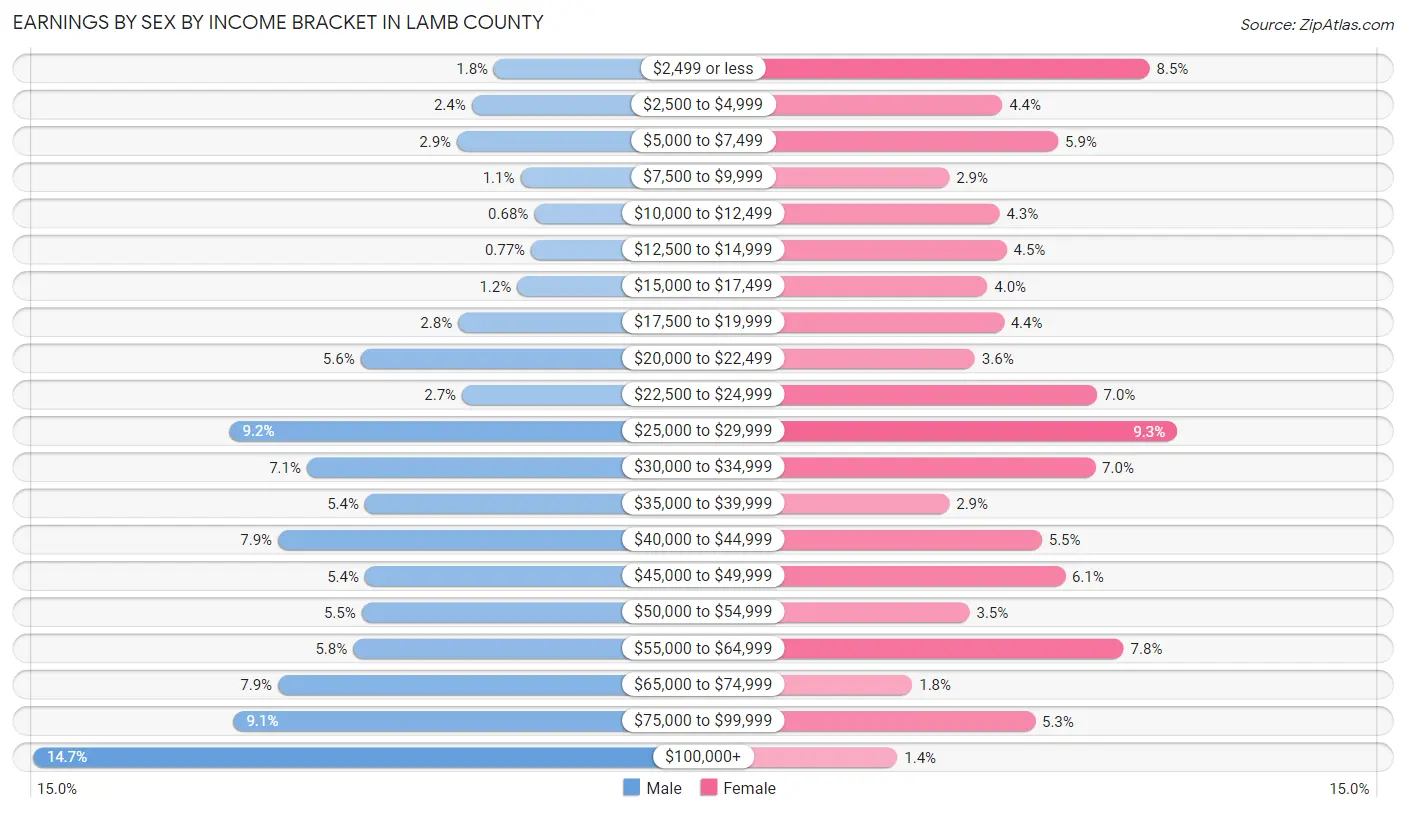
Earnings by Sex by Income Bracket in Lamb County
The most common earnings brackets in Lamb County are $100,000+ for men (496 | 14.7%) and $25,000 to $29,999 for women (242 | 9.3%).
| Income | Male | Female |
| $2,499 or less | 61 (1.8%) | 222 (8.5%) |
| $2,500 to $4,999 | 82 (2.4%) | 114 (4.4%) |
| $5,000 to $7,499 | 96 (2.9%) | 155 (5.9%) |
| $7,500 to $9,999 | 36 (1.1%) | 75 (2.9%) |
| $10,000 to $12,499 | 23 (0.7%) | 112 (4.3%) |
| $12,500 to $14,999 | 26 (0.8%) | 117 (4.5%) |
| $15,000 to $17,499 | 39 (1.2%) | 103 (4.0%) |
| $17,500 to $19,999 | 95 (2.8%) | 115 (4.4%) |
| $20,000 to $22,499 | 187 (5.6%) | 94 (3.6%) |
| $22,500 to $24,999 | 91 (2.7%) | 183 (7.0%) |
| $25,000 to $29,999 | 311 (9.2%) | 242 (9.3%) |
| $30,000 to $34,999 | 238 (7.1%) | 182 (7.0%) |
| $35,000 to $39,999 | 183 (5.4%) | 75 (2.9%) |
| $40,000 to $44,999 | 265 (7.9%) | 143 (5.5%) |
| $45,000 to $49,999 | 183 (5.4%) | 160 (6.1%) |
| $50,000 to $54,999 | 186 (5.5%) | 90 (3.5%) |
| $55,000 to $64,999 | 194 (5.8%) | 203 (7.8%) |
| $65,000 to $74,999 | 265 (7.9%) | 48 (1.8%) |
| $75,000 to $99,999 | 307 (9.1%) | 138 (5.3%) |
| $100,000+ | 496 (14.7%) | 37 (1.4%) |
| Total | 3,364 (100.0%) | 2,608 (100.0%) |
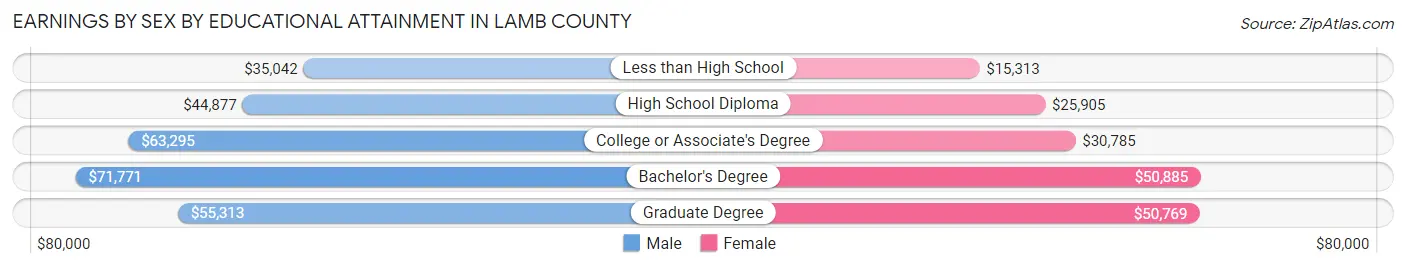
Earnings by Sex by Educational Attainment in Lamb County
Average earnings in Lamb County are $47,188 for men and $28,014 for women, a difference of 40.6%. Men with an educational attainment of bachelor's degree enjoy the highest average annual earnings of $71,771, while those with less than high school education earn the least with $35,042. Women with an educational attainment of bachelor's degree earn the most with the average annual earnings of $50,885, while those with less than high school education have the smallest earnings of $15,313.
| Educational Attainment | Male Income | Female Income |
| Less than High School | $35,042 | $15,313 |
| High School Diploma | $44,877 | $25,905 |
| College or Associate's Degree | $63,295 | $30,785 |
| Bachelor's Degree | $71,771 | $50,885 |
| Graduate Degree | $55,313 | $50,769 |
| Total | $47,188 | $28,014 |
Family Income in Lamb County
Family Income Brackets in Lamb County
According to the Lamb County family income data, there are 662 families falling into the $50,000 to $74,999 income range, which is the most common income bracket and makes up 21.4% of all families. Conversely, the less than $10,000 income bracket is the least frequent group with only 105 families (3.4%) belonging to this category.
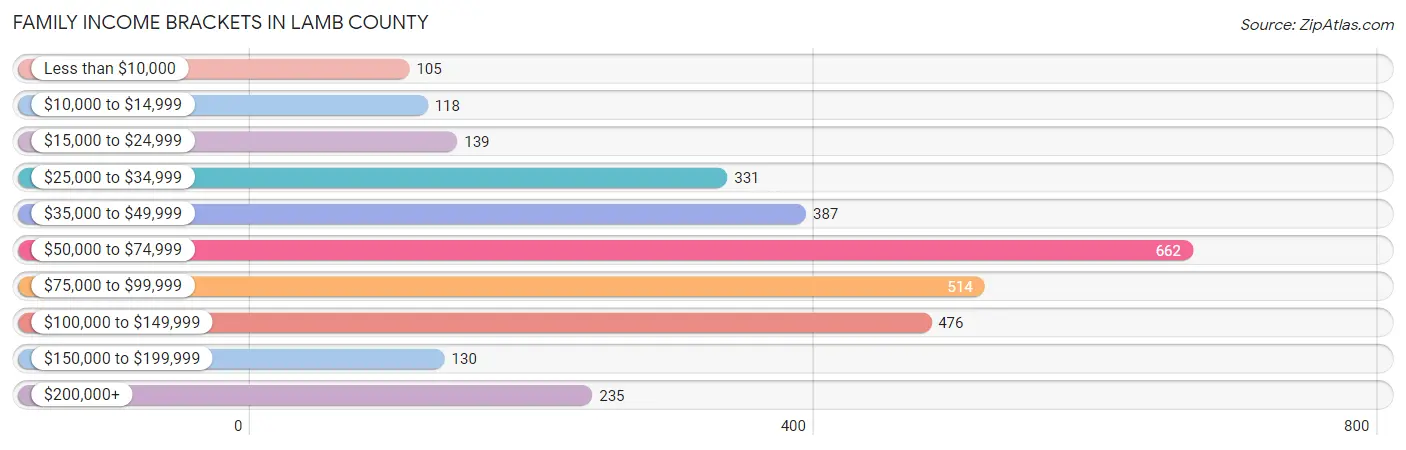
| Income Bracket | # Families | % Families |
| Less than $10,000 | 105 | 3.4% |
| $10,000 to $14,999 | 118 | 3.8% |
| $15,000 to $24,999 | 139 | 4.5% |
| $25,000 to $34,999 | 331 | 10.7% |
| $35,000 to $49,999 | 387 | 12.5% |
| $50,000 to $74,999 | 662 | 21.4% |
| $75,000 to $99,999 | 514 | 16.6% |
| $100,000 to $149,999 | 476 | 15.4% |
| $150,000 to $199,999 | 130 | 4.2% |
| $200,000+ | 235 | 7.6% |
Family Income by Famaliy Size in Lamb County
5-person families (292 | 9.4%) account for the highest median family income in Lamb County with $101,875 per family, while 2-person families (1,195 | 38.6%) have the highest median income of $32,240 per family member.
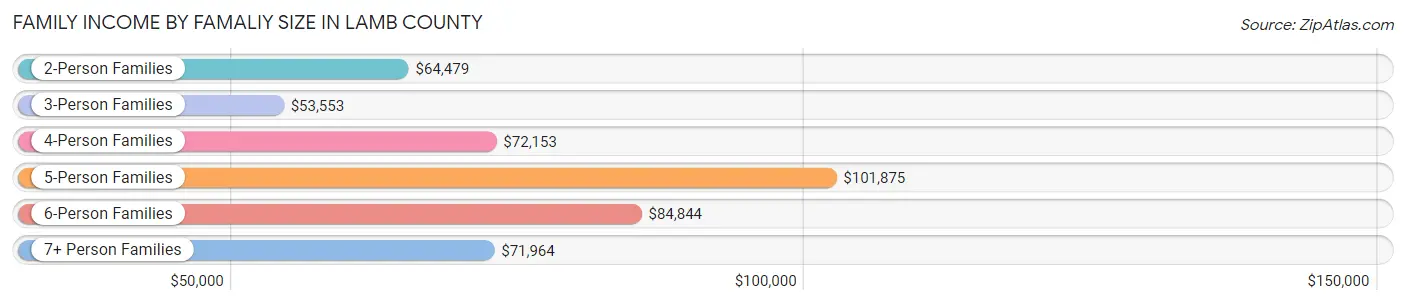
| Income Bracket | # Families | Median Income |
| 2-Person Families | 1,195 (38.6%) | $64,479 |
| 3-Person Families | 678 (21.9%) | $53,553 |
| 4-Person Families | 737 (23.8%) | $72,153 |
| 5-Person Families | 292 (9.4%) | $101,875 |
| 6-Person Families | 111 (3.6%) | $84,844 |
| 7+ Person Families | 81 (2.6%) | $71,964 |
| Total | 3,094 (100.0%) | $69,626 |
Family Income by Number of Earners in Lamb County
The median family income in Lamb County is $69,626, with families comprising 3+ earners (281) having the highest median family income of $100,156, while families with no earners (507) have the lowest median family income of $40,102, accounting for 9.1% and 16.4% of families, respectively.
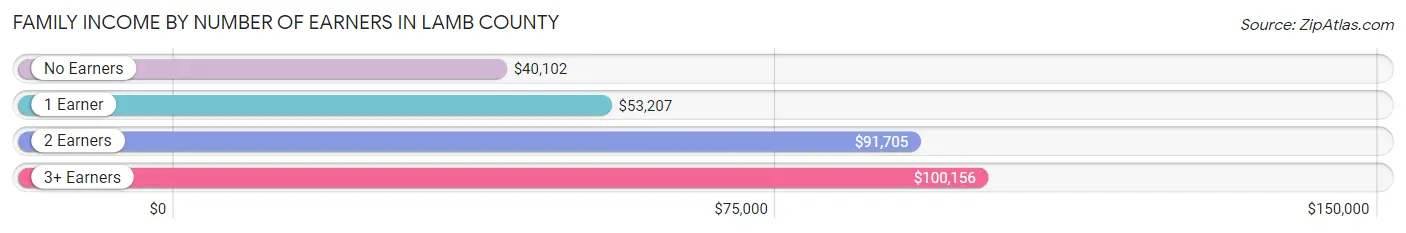
| Number of Earners | # Families | Median Income |
| No Earners | 507 (16.4%) | $40,102 |
| 1 Earner | 1,191 (38.5%) | $53,207 |
| 2 Earners | 1,115 (36.0%) | $91,705 |
| 3+ Earners | 281 (9.1%) | $100,156 |
| Total | 3,094 (100.0%) | $69,626 |
Household Income in Lamb County
Household Income Brackets in Lamb County
With 908 households falling in the category, the $50,000 to $74,999 income range is the most frequent in Lamb County, accounting for 19.6% of all households. In contrast, only 134 households (2.9%) fall into the $150,000 to $199,999 income bracket, making it the least populous group.
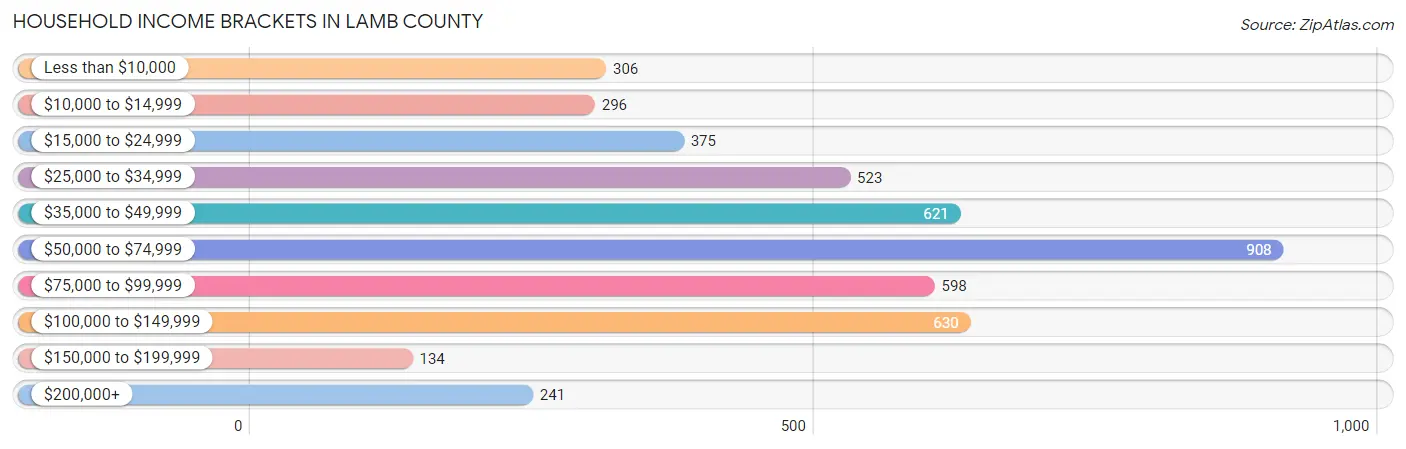
| Income Bracket | # Households | % Households |
| Less than $10,000 | 306 | 6.6% |
| $10,000 to $14,999 | 296 | 6.4% |
| $15,000 to $24,999 | 375 | 8.1% |
| $25,000 to $34,999 | 523 | 11.3% |
| $35,000 to $49,999 | 621 | 13.4% |
| $50,000 to $74,999 | 908 | 19.6% |
| $75,000 to $99,999 | 598 | 12.9% |
| $100,000 to $149,999 | 630 | 13.6% |
| $150,000 to $199,999 | 134 | 2.9% |
| $200,000+ | 241 | 5.2% |
Household Income by Householder Age in Lamb County
The median household income in Lamb County is $54,519, with the highest median household income of $70,403 found in the 25 to 44 years age bracket for the primary householder. A total of 1,354 households (29.2%) fall into this category. Meanwhile, the 65+ years age bracket for the primary householder has the lowest median household income of $38,621, with 1,266 households (27.3%) in this group.
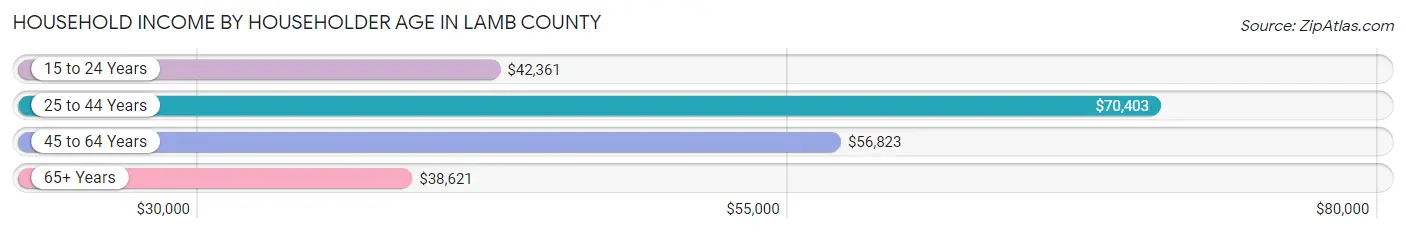
| Income Bracket | # Households | Median Income |
| 15 to 24 Years | 218 (4.7%) | $42,361 |
| 25 to 44 Years | 1,354 (29.2%) | $70,403 |
| 45 to 64 Years | 1,794 (38.7%) | $56,823 |
| 65+ Years | 1,266 (27.3%) | $38,621 |
| Total | 4,632 (100.0%) | $54,519 |
Poverty in Lamb County
Income Below Poverty by Sex and Age in Lamb County
With 13.1% poverty level for males and 21.9% for females among the residents of Lamb County, 12 to 14 year old males and 35 to 44 year old females are the most vulnerable to poverty, with 75 males (34.6%) and 279 females (35.2%) in their respective age groups living below the poverty level.
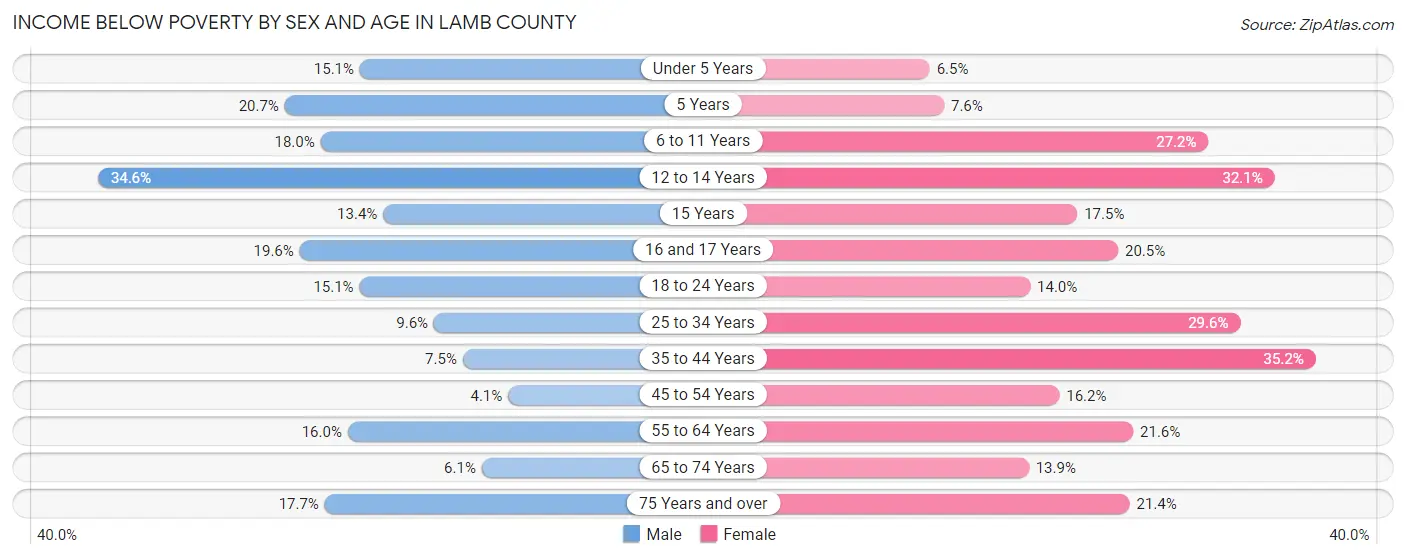
| Age Bracket | Male | Female |
| Under 5 Years | 73 (15.1%) | 25 (6.5%) |
| 5 Years | 12 (20.7%) | 6 (7.6%) |
| 6 to 11 Years | 141 (18.0%) | 160 (27.2%) |
| 12 to 14 Years | 75 (34.6%) | 107 (32.1%) |
| 15 Years | 19 (13.4%) | 18 (17.5%) |
| 16 and 17 Years | 28 (19.6%) | 48 (20.5%) |
| 18 to 24 Years | 94 (15.1%) | 84 (14.0%) |
| 25 to 34 Years | 73 (9.6%) | 192 (29.6%) |
| 35 to 44 Years | 56 (7.5%) | 279 (35.2%) |
| 45 to 54 Years | 28 (4.1%) | 119 (16.2%) |
| 55 to 64 Years | 131 (16.0%) | 167 (21.6%) |
| 65 to 74 Years | 33 (6.1%) | 83 (13.9%) |
| 75 Years and over | 76 (17.7%) | 106 (21.4%) |
| Total | 839 (13.1%) | 1,394 (21.9%) |
Income Above Poverty by Sex and Age in Lamb County
According to the poverty statistics in Lamb County, males aged 45 to 54 years and females aged under 5 years are the age groups that are most secure financially, with 95.9% of males and 93.5% of females in these age groups living above the poverty line.
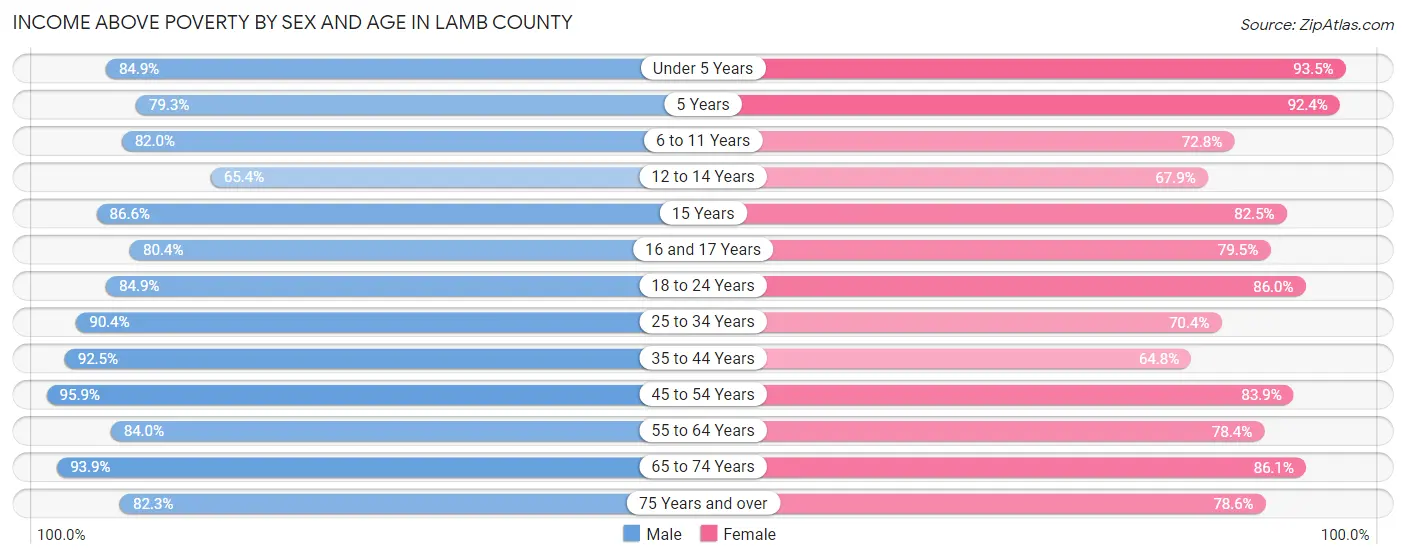
| Age Bracket | Male | Female |
| Under 5 Years | 410 (84.9%) | 358 (93.5%) |
| 5 Years | 46 (79.3%) | 73 (92.4%) |
| 6 to 11 Years | 641 (82.0%) | 428 (72.8%) |
| 12 to 14 Years | 142 (65.4%) | 226 (67.9%) |
| 15 Years | 123 (86.6%) | 85 (82.5%) |
| 16 and 17 Years | 115 (80.4%) | 186 (79.5%) |
| 18 to 24 Years | 527 (84.9%) | 517 (86.0%) |
| 25 to 34 Years | 687 (90.4%) | 457 (70.4%) |
| 35 to 44 Years | 694 (92.5%) | 514 (64.8%) |
| 45 to 54 Years | 655 (95.9%) | 618 (83.9%) |
| 55 to 64 Years | 687 (84.0%) | 605 (78.4%) |
| 65 to 74 Years | 512 (93.9%) | 515 (86.1%) |
| 75 Years and over | 353 (82.3%) | 390 (78.6%) |
| Total | 5,592 (87.0%) | 4,972 (78.1%) |
Income Below Poverty Among Married-Couple Families in Lamb County
The poverty statistics for married-couple families in Lamb County show that 5.6% or 120 of the total 2,148 families live below the poverty line. Families with 5 or more children have the highest poverty rate of 15.4%, comprising of 2 families. On the other hand, families with no children have the lowest poverty rate of 4.4%, which includes 54 families.
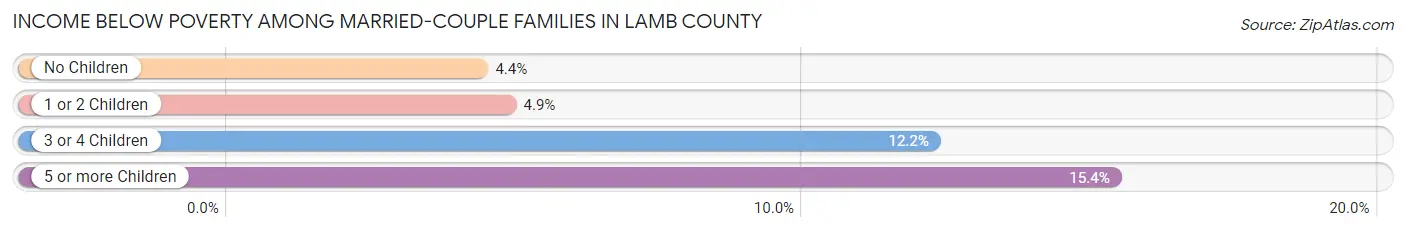
| Children | Above Poverty | Below Poverty |
| No Children | 1,185 (95.6%) | 54 (4.4%) |
| 1 or 2 Children | 588 (95.2%) | 30 (4.9%) |
| 3 or 4 Children | 244 (87.8%) | 34 (12.2%) |
| 5 or more Children | 11 (84.6%) | 2 (15.4%) |
| Total | 2,028 (94.4%) | 120 (5.6%) |
Income Below Poverty Among Single-Parent Households in Lamb County
According to the poverty data in Lamb County, 8.6% or 35 single-father households and 44.8% or 242 single-mother households are living below the poverty line. Among single-father households, those with no children have the highest poverty rate, with 12 households (30.8%) experiencing poverty. Likewise, among single-mother households, those with 3 or 4 children have the highest poverty rate, with 108 households (62.4%) falling below the poverty line.
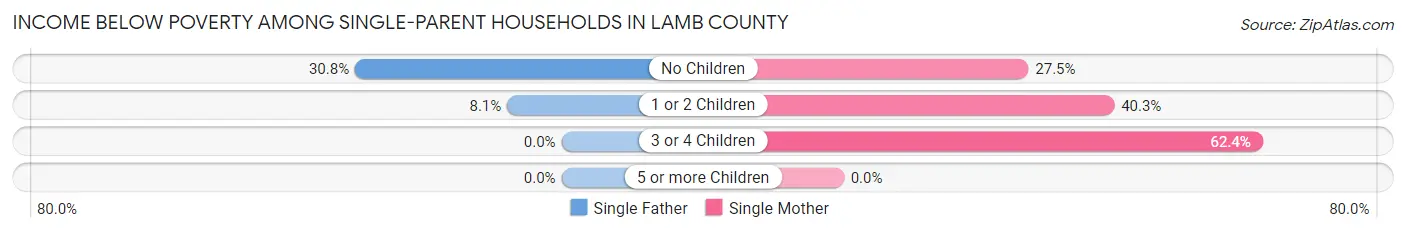
| Children | Single Father | Single Mother |
| No Children | 12 (30.8%) | 30 (27.5%) |
| 1 or 2 Children | 23 (8.1%) | 104 (40.3%) |
| 3 or 4 Children | 0 (0.0%) | 108 (62.4%) |
| 5 or more Children | 0 (0.0%) | 0 (0.0%) |
| Total | 35 (8.6%) | 242 (44.8%) |
Income Below Poverty Among Married-Couple vs Single-Parent Households in Lamb County
The poverty data for Lamb County shows that 120 of the married-couple family households (5.6%) and 277 of the single-parent households (29.3%) are living below the poverty level. Within the married-couple family households, those with 5 or more children have the highest poverty rate, with 2 households (15.4%) falling below the poverty line. Among the single-parent households, those with 3 or 4 children have the highest poverty rate, with 108 household (43.2%) living below poverty.
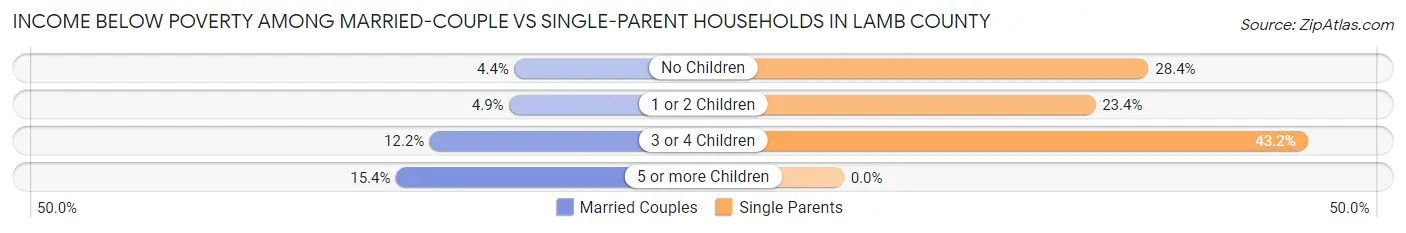
| Children | Married-Couple Families | Single-Parent Households |
| No Children | 54 (4.4%) | 42 (28.4%) |
| 1 or 2 Children | 30 (4.9%) | 127 (23.4%) |
| 3 or 4 Children | 34 (12.2%) | 108 (43.2%) |
| 5 or more Children | 2 (15.4%) | 0 (0.0%) |
| Total | 120 (5.6%) | 277 (29.3%) |
Race in Lamb County
The most populous races in Lamb County are White / Caucasian (10,188 | 78.2%), Hispanic or Latino (7,416 | 56.9%), and Two or more Races (1,847 | 14.2%).
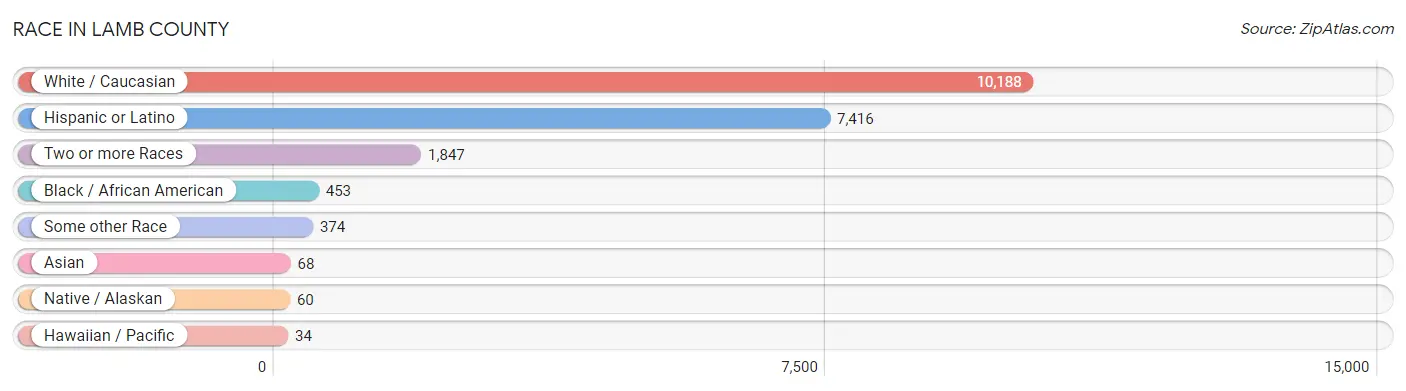
| Race | # Population | % Population |
| Asian | 68 | 0.5% |
| Black / African American | 453 | 3.5% |
| Hawaiian / Pacific | 34 | 0.3% |
| Hispanic or Latino | 7,416 | 56.9% |
| Native / Alaskan | 60 | 0.5% |
| White / Caucasian | 10,188 | 78.2% |
| Two or more Races | 1,847 | 14.2% |
| Some other Race | 374 | 2.9% |
| Total | 13,024 | 100.0% |
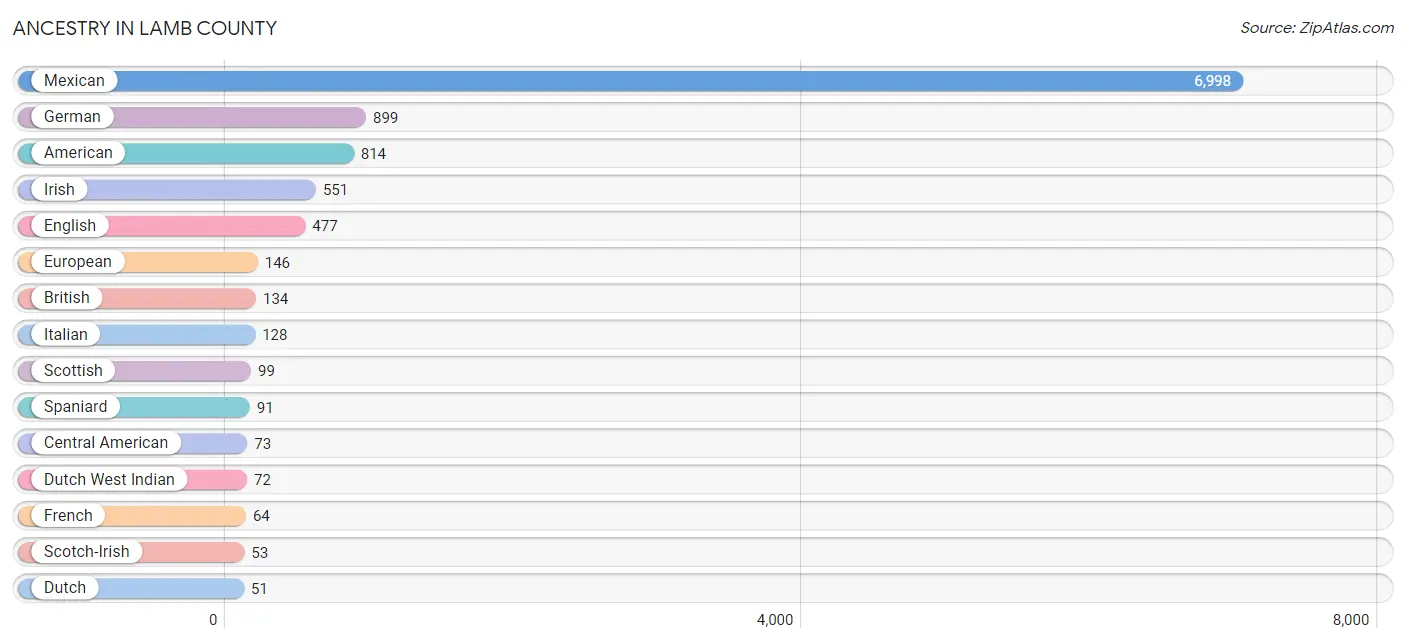
Ancestry in Lamb County
The most populous ancestries reported in Lamb County are Mexican (6,998 | 53.7%), German (899 | 6.9%), American (814 | 6.2%), Irish (551 | 4.2%), and English (477 | 3.7%), together accounting for 74.8% of all Lamb County residents.
| Ancestry | # Population | % Population |
| Afghan | 32 | 0.3% |
| American | 814 | 6.2% |
| Apache | 8 | 0.1% |
| British | 134 | 1.0% |
| Burmese | 4 | 0.0% |
| Canadian | 9 | 0.1% |
| Central American | 73 | 0.6% |
| Central American Indian | 43 | 0.3% |
| Cherokee | 3 | 0.0% |
| Chickasaw | 15 | 0.1% |
| Czech | 16 | 0.1% |
| Dutch | 51 | 0.4% |
| Dutch West Indian | 72 | 0.5% |
| English | 477 | 3.7% |
| European | 146 | 1.1% |
| French | 64 | 0.5% |
| German | 899 | 6.9% |
| Guamanian / Chamorro | 34 | 0.3% |
| Guatemalan | 14 | 0.1% |
| Honduran | 51 | 0.4% |
| Irish | 551 | 4.2% |
| Italian | 128 | 1.0% |
| Korean | 22 | 0.2% |
| Liberian | 19 | 0.2% |
| Lumbee | 3 | 0.0% |
| Mexican | 6,998 | 53.7% |
| Mexican American Indian | 8 | 0.1% |
| Norwegian | 9 | 0.1% |
| Polish | 20 | 0.2% |
| Portuguese | 2 | 0.0% |
| Puerto Rican | 4 | 0.0% |
| Salvadoran | 8 | 0.1% |
| Scandinavian | 21 | 0.2% |
| Scotch-Irish | 53 | 0.4% |
| Scottish | 99 | 0.8% |
| Slavic | 5 | 0.0% |
| Spaniard | 91 | 0.7% |
| Spanish | 10 | 0.1% |
| Sri Lankan | 8 | 0.1% |
| Subsaharan African | 19 | 0.2% |
| Swedish | 33 | 0.3% |
| Swiss | 19 | 0.2% |
| Welsh | 16 | 0.1% | View All 43 Rows |
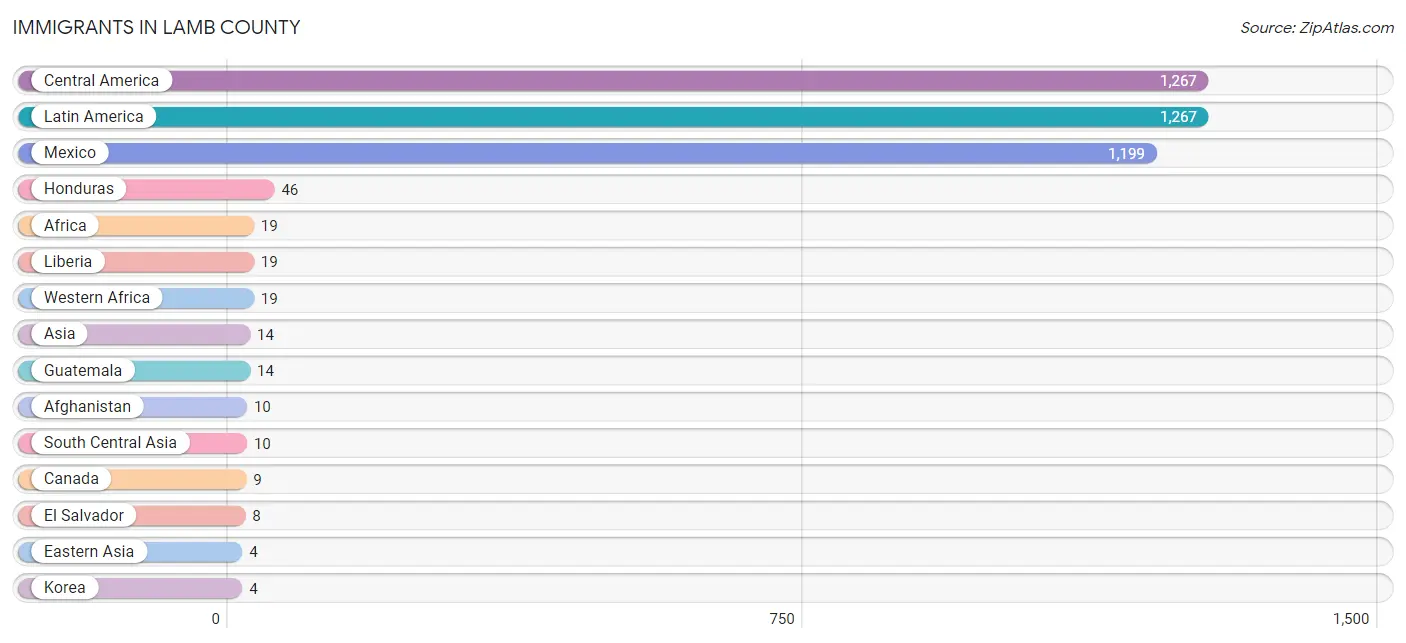
Immigrants in Lamb County
The most numerous immigrant groups reported in Lamb County came from Central America (1,267 | 9.7%), Latin America (1,267 | 9.7%), Mexico (1,199 | 9.2%), Honduras (46 | 0.4%), and Africa (19 | 0.2%), together accounting for 29.2% of all Lamb County residents.
| Immigration Origin | # Population | % Population |
| Afghanistan | 10 | 0.1% |
| Africa | 19 | 0.2% |
| Asia | 14 | 0.1% |
| Canada | 9 | 0.1% |
| Central America | 1,267 | 9.7% |
| Eastern Asia | 4 | 0.0% |
| El Salvador | 8 | 0.1% |
| Guatemala | 14 | 0.1% |
| Honduras | 46 | 0.4% |
| Korea | 4 | 0.0% |
| Latin America | 1,267 | 9.7% |
| Liberia | 19 | 0.2% |
| Mexico | 1,199 | 9.2% |
| South Central Asia | 10 | 0.1% |
| Western Africa | 19 | 0.2% | View All 15 Rows |
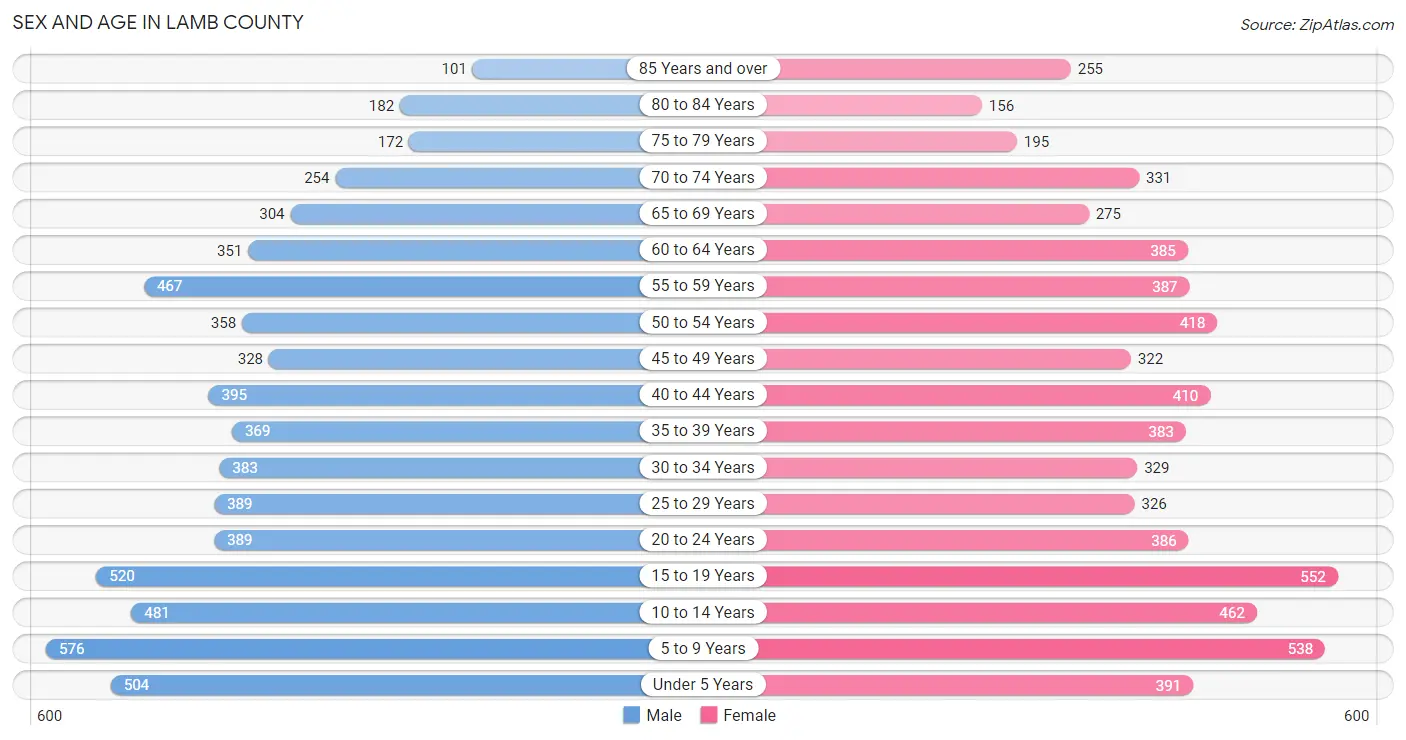
Sex and Age in Lamb County
Sex and Age in Lamb County
The most populous age groups in Lamb County are 5 to 9 Years (576 | 8.8%) for men and 15 to 19 Years (552 | 8.5%) for women.
| Age Bracket | Male | Female |
| Under 5 Years | 504 (7.7%) | 391 (6.0%) |
| 5 to 9 Years | 576 (8.8%) | 538 (8.3%) |
| 10 to 14 Years | 481 (7.4%) | 462 (7.1%) |
| 15 to 19 Years | 520 (8.0%) | 552 (8.5%) |
| 20 to 24 Years | 389 (6.0%) | 386 (5.9%) |
| 25 to 29 Years | 389 (6.0%) | 326 (5.0%) |
| 30 to 34 Years | 383 (5.9%) | 329 (5.1%) |
| 35 to 39 Years | 369 (5.7%) | 383 (5.9%) |
| 40 to 44 Years | 395 (6.1%) | 410 (6.3%) |
| 45 to 49 Years | 328 (5.0%) | 322 (5.0%) |
| 50 to 54 Years | 358 (5.5%) | 418 (6.4%) |
| 55 to 59 Years | 467 (7.2%) | 387 (5.9%) |
| 60 to 64 Years | 351 (5.4%) | 385 (5.9%) |
| 65 to 69 Years | 304 (4.7%) | 275 (4.2%) |
| 70 to 74 Years | 254 (3.9%) | 331 (5.1%) |
| 75 to 79 Years | 172 (2.6%) | 195 (3.0%) |
| 80 to 84 Years | 182 (2.8%) | 156 (2.4%) |
| 85 Years and over | 101 (1.5%) | 255 (3.9%) |
| Total | 6,523 (100.0%) | 6,501 (100.0%) |
Families and Households in Lamb County
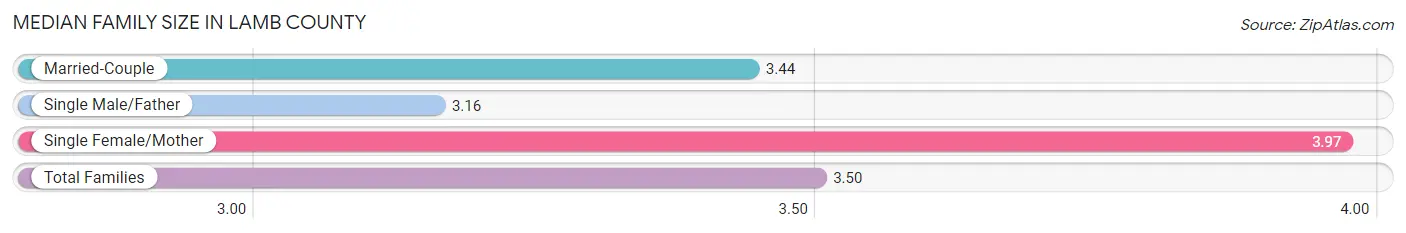
Median Family Size in Lamb County
The median family size in Lamb County is 3.50 persons per family, with single female/mother families (540 | 17.4%) accounting for the largest median family size of 3.97 persons per family. On the other hand, single male/father families (406 | 13.1%) represent the smallest median family size with 3.16 persons per family.
| Family Type | # Families | Family Size |
| Married-Couple | 2,148 (69.4%) | 3.44 |
| Single Male/Father | 406 (13.1%) | 3.16 |
| Single Female/Mother | 540 (17.4%) | 3.97 |
| Total Families | 3,094 (100.0%) | 3.50 |
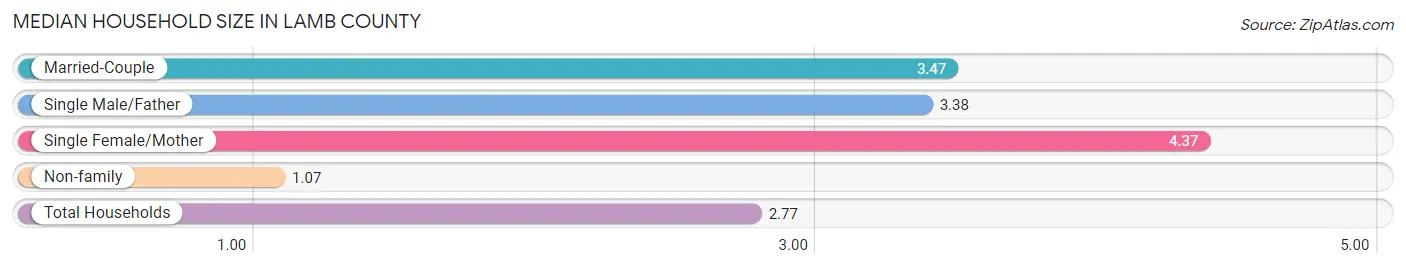
Median Household Size in Lamb County
The median household size in Lamb County is 2.77 persons per household, with single female/mother households (540 | 11.7%) accounting for the largest median household size of 4.37 persons per household. non-family households (1,538 | 33.2%) represent the smallest median household size with 1.07 persons per household.
| Household Type | # Households | Household Size |
| Married-Couple | 2,148 (46.4%) | 3.47 |
| Single Male/Father | 406 (8.8%) | 3.38 |
| Single Female/Mother | 540 (11.7%) | 4.37 |
| Non-family | 1,538 (33.2%) | 1.07 |
| Total Households | 4,632 (100.0%) | 2.77 |
Household Size by Marriage Status in Lamb County
Out of a total of 4,632 households in Lamb County, 3,094 (66.8%) are family households, while 1,538 (33.2%) are nonfamily households. The most numerous type of family households are 2-person households, comprising 1,155, and the most common type of nonfamily households are 1-person households, comprising 1,482.
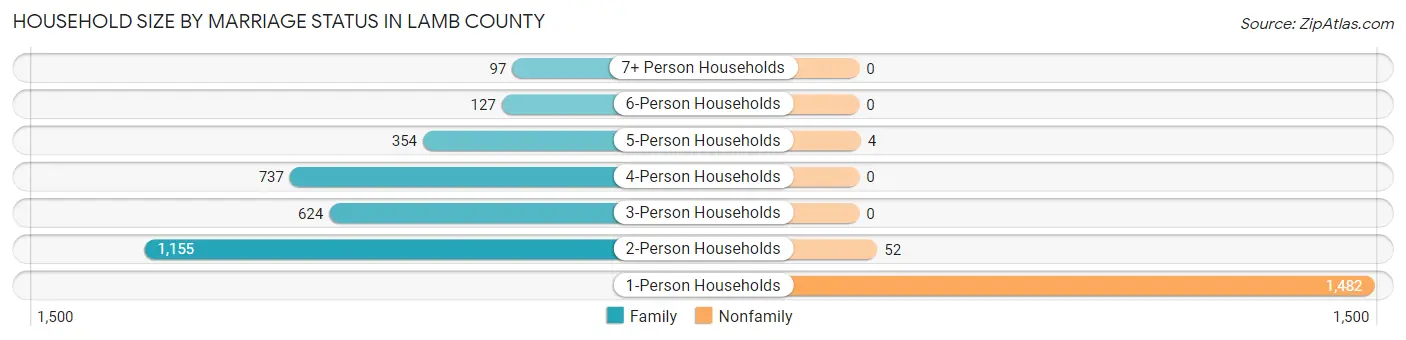
| Household Size | Family Households | Nonfamily Households |
| 1-Person Households | - | 1,482 (32.0%) |
| 2-Person Households | 1,155 (24.9%) | 52 (1.1%) |
| 3-Person Households | 624 (13.5%) | 0 (0.0%) |
| 4-Person Households | 737 (15.9%) | 0 (0.0%) |
| 5-Person Households | 354 (7.6%) | 4 (0.1%) |
| 6-Person Households | 127 (2.7%) | 0 (0.0%) |
| 7+ Person Households | 97 (2.1%) | 0 (0.0%) |
| Total | 3,094 (66.8%) | 1,538 (33.2%) |
Female Fertility in Lamb County
Fertility by Age in Lamb County
Average fertility rate in Lamb County is 43.0 births per 1,000 women. Women in the age bracket of 20 to 34 years have the highest fertility rate with 83.0 births per 1,000 women. Women in the age bracket of 20 to 34 years acount for 71.7% of all women with births.
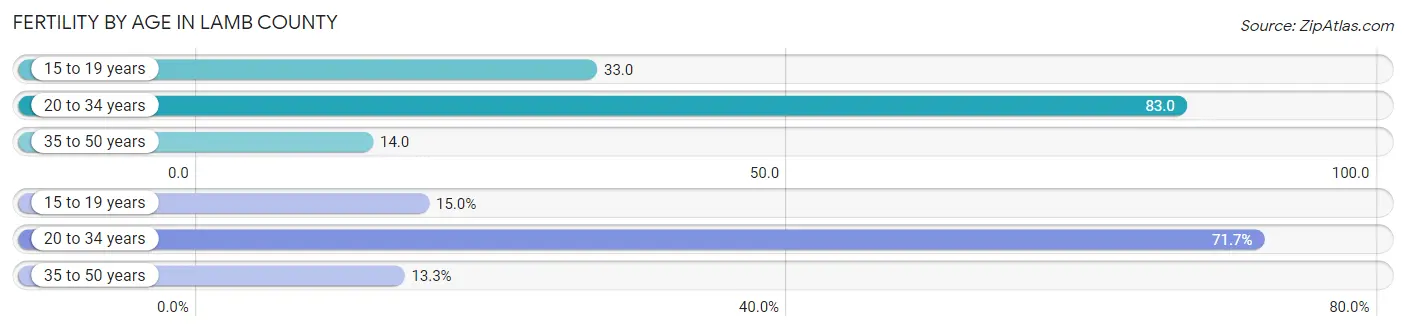
| Age Bracket | Women with Births | Births / 1,000 Women |
| 15 to 19 years | 18 (15.0%) | 33.0 |
| 20 to 34 years | 86 (71.7%) | 83.0 |
| 35 to 50 years | 16 (13.3%) | 14.0 |
| Total | 120 (100.0%) | 43.0 |
Fertility by Age by Marriage Status in Lamb County
46.7% of women with births (120) in Lamb County are married. The highest percentage of unmarried women with births falls into 15 to 19 years age bracket with 100.0% of them unmarried at the time of birth, while the lowest percentage of unmarried women with births belong to 20 to 34 years age bracket with 36.1% of them unmarried.
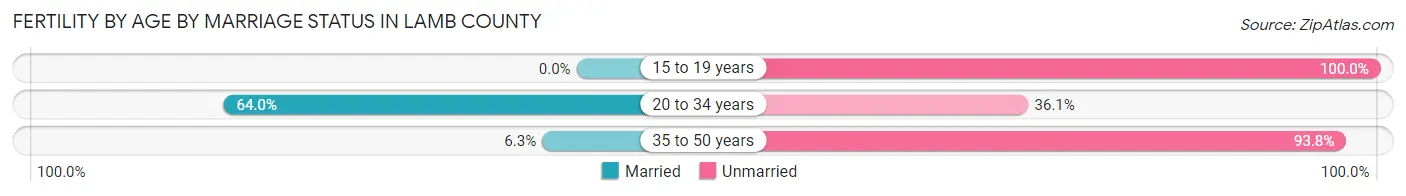
| Age Bracket | Married | Unmarried |
| 15 to 19 years | 0 (0.0%) | 18 (100.0%) |
| 20 to 34 years | 55 (63.9%) | 31 (36.0%) |
| 35 to 50 years | 1 (6.2%) | 15 (93.8%) |
| Total | 56 (46.7%) | 64 (53.3%) |
Fertility by Education in Lamb County
Average fertility rate in Lamb County is 43.0 births per 1,000 women. Women with the education attainment of bachelor's degree have the highest fertility rate of 93.0 births per 1,000 women, while women with the education attainment of college or associate's degree have the lowest fertility at 23.0 births per 1,000 women. Women with the education attainment of less than high school represent 56.7% of all women with births.
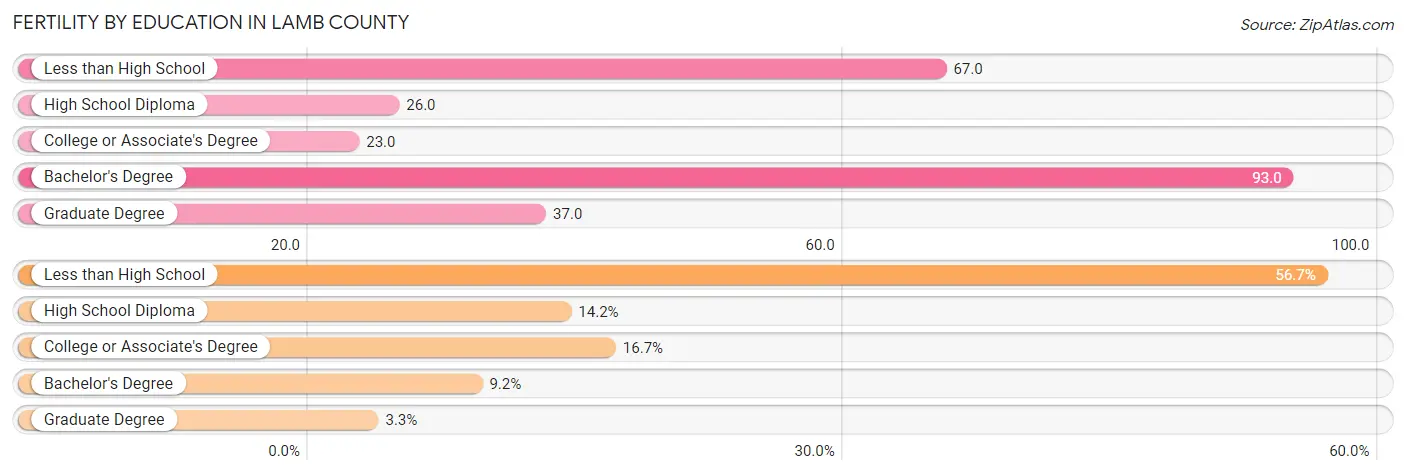
| Educational Attainment | Women with Births | Births / 1,000 Women |
| Less than High School | 68 (56.7%) | 67.0 |
| High School Diploma | 17 (14.2%) | 26.0 |
| College or Associate's Degree | 20 (16.7%) | 23.0 |
| Bachelor's Degree | 11 (9.2%) | 93.0 |
| Graduate Degree | 4 (3.3%) | 37.0 |
| Total | 120 (100.0%) | 43.0 |
Fertility by Education by Marriage Status in Lamb County
53.3% of women with births in Lamb County are unmarried. Women with the educational attainment of college or associate's degree are most likely to be married with 100.0% of them married at childbirth, while women with the educational attainment of high school diploma are least likely to be married with 88.2% of them unmarried at childbirth.
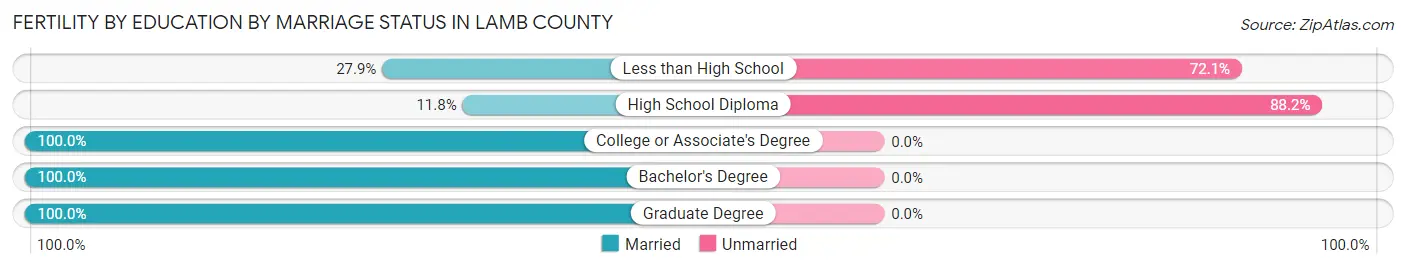
| Educational Attainment | Married | Unmarried |
| Less than High School | 19 (27.9%) | 49 (72.1%) |
| High School Diploma | 2 (11.8%) | 15 (88.2%) |
| College or Associate's Degree | 20 (100.0%) | 0 (0.0%) |
| Bachelor's Degree | 11 (100.0%) | 0 (0.0%) |
| Graduate Degree | 4 (100.0%) | 0 (0.0%) |
| Total | 56 (46.7%) | 64 (53.3%) |
Employment Characteristics in Lamb County
Employment by Class of Employer in Lamb County
Among the 5,456 employed individuals in Lamb County, private company employees (3,805 | 69.7%), local government employees (494 | 9.0%), and self-employed (not incorporated) (476 | 8.7%) make up the most common classes of employment.
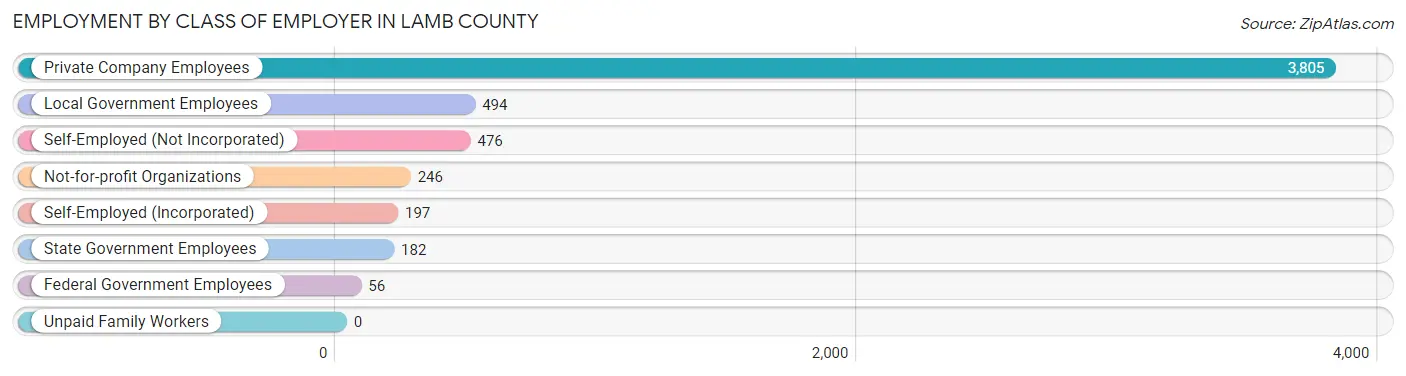
| Employer Class | # Employees | % Employees |
| Private Company Employees | 3,805 | 69.7% |
| Self-Employed (Incorporated) | 197 | 3.6% |
| Self-Employed (Not Incorporated) | 476 | 8.7% |
| Not-for-profit Organizations | 246 | 4.5% |
| Local Government Employees | 494 | 9.0% |
| State Government Employees | 182 | 3.3% |
| Federal Government Employees | 56 | 1.0% |
| Unpaid Family Workers | 0 | 0.0% |
| Total | 5,456 | 100.0% |
Employment Status by Age in Lamb County
According to the labor force statistics for Lamb County, out of the total population over 16 years of age (9,827), 58.2% or 5,719 individuals are in the labor force, with 2.8% or 160 of them unemployed. The age group with the highest labor force participation rate is 35 to 44 years, with 80.5% or 1,253 individuals in the labor force. Within the labor force, the 20 to 24 years age range has the highest percentage of unemployed individuals, with 13.3% or 82 of them being unemployed.
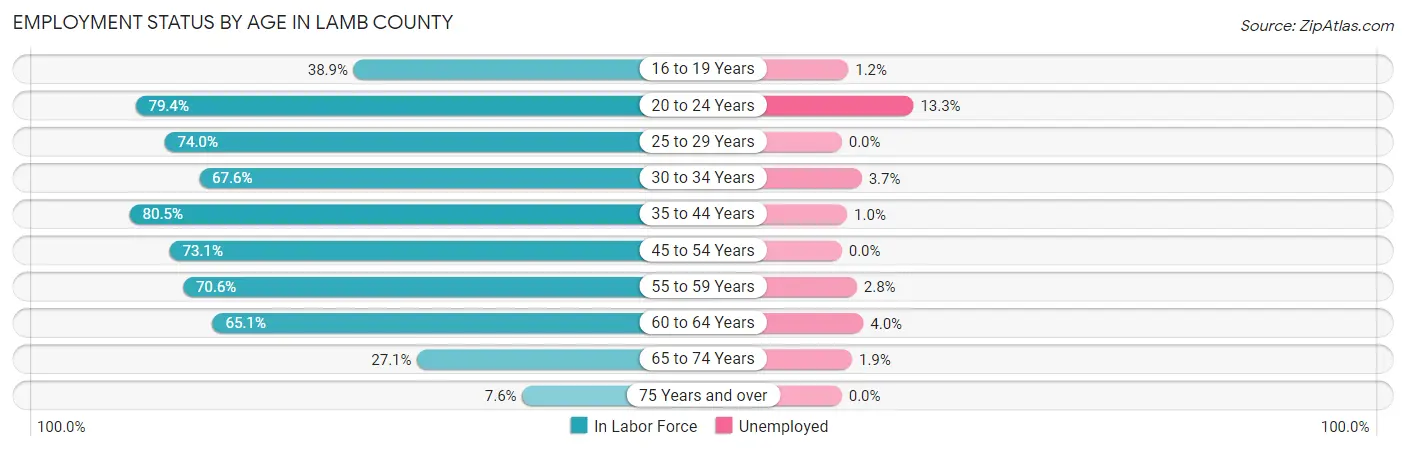
| Age Bracket | In Labor Force | Unemployed |
| 16 to 19 Years | 322 (38.9%) | 4 (1.2%) |
| 20 to 24 Years | 615 (79.4%) | 82 (13.3%) |
| 25 to 29 Years | 529 (74.0%) | 0 (0.0%) |
| 30 to 34 Years | 481 (67.6%) | 18 (3.7%) |
| 35 to 44 Years | 1,253 (80.5%) | 13 (1.0%) |
| 45 to 54 Years | 1,042 (73.1%) | 0 (0.0%) |
| 55 to 59 Years | 603 (70.6%) | 17 (2.8%) |
| 60 to 64 Years | 479 (65.1%) | 19 (4.0%) |
| 65 to 74 Years | 315 (27.1%) | 6 (1.9%) |
| 75 Years and over | 81 (7.6%) | 0 (0.0%) |
| Total | 5,719 (58.2%) | 160 (2.8%) |
Employment Status by Educational Attainment in Lamb County
According to labor force statistics for Lamb County, 73.1% of individuals (4,386) out of the total population between 25 and 64 years of age (6,000) are in the labor force, with 1.5% or 66 of them being unemployed. The group with the highest labor force participation rate are those with the educational attainment of bachelor's degree or higher, with 83.4% or 693 individuals in the labor force. Within the labor force, individuals with less than high school education have the highest percentage of unemployment, with 2.5% or 17 of them being unemployed.
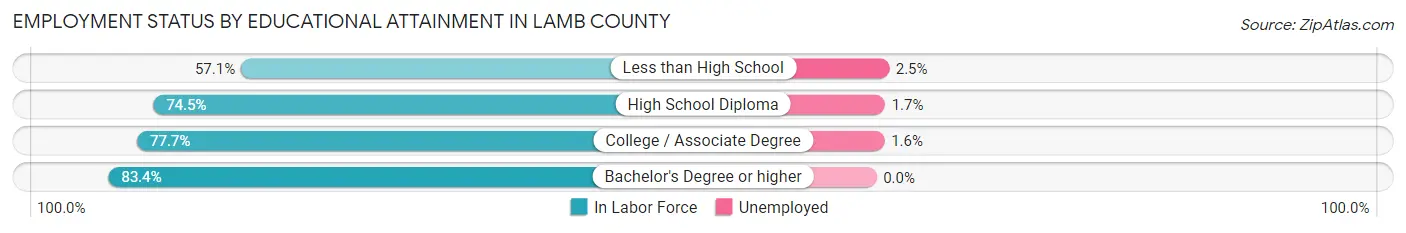
| Educational Attainment | In Labor Force | Unemployed |
| Less than High School | 691 (57.1%) | 30 (2.5%) |
| High School Diploma | 1,681 (74.5%) | 38 (1.7%) |
| College / Associate Degree | 1,322 (77.7%) | 27 (1.6%) |
| Bachelor's Degree or higher | 693 (83.4%) | 0 (0.0%) |
| Total | 4,386 (73.1%) | 90 (1.5%) |
Employment Occupations by Sex in Lamb County
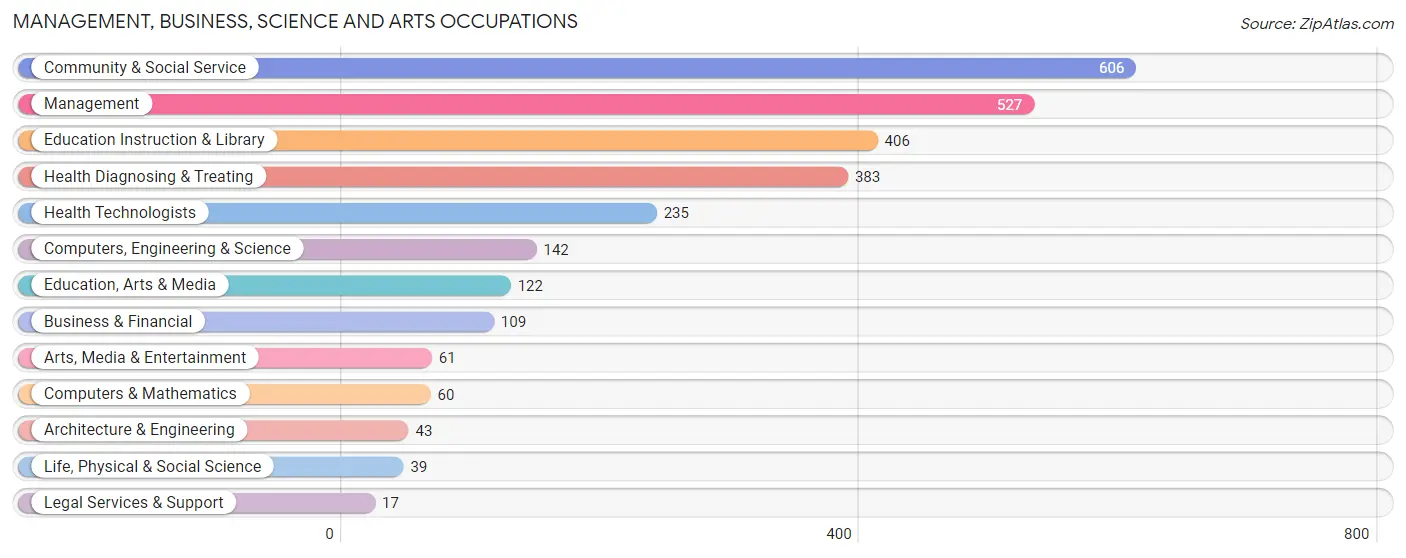
Management, Business, Science and Arts Occupations
The most common Management, Business, Science and Arts occupations in Lamb County are Community & Social Service (606 | 10.9%), Management (527 | 9.5%), Education Instruction & Library (406 | 7.3%), Health Diagnosing & Treating (383 | 6.9%), and Health Technologists (235 | 4.2%).
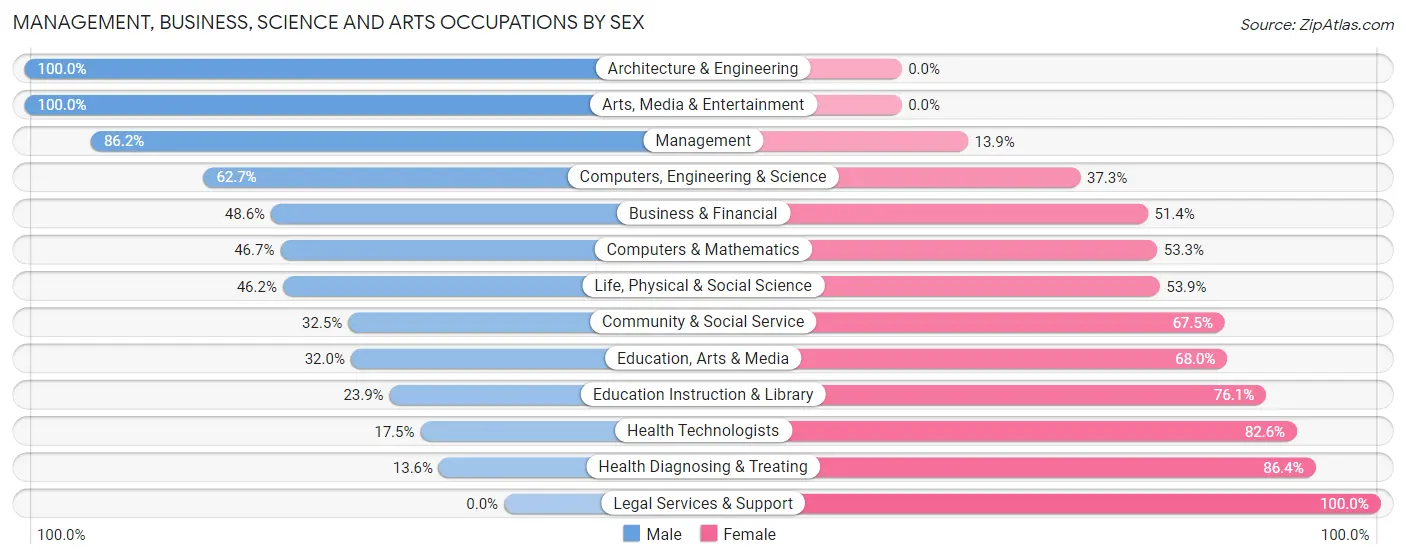
Management, Business, Science and Arts Occupations by Sex
Within the Management, Business, Science and Arts occupations in Lamb County, the most male-oriented occupations are Architecture & Engineering (100.0%), Arts, Media & Entertainment (100.0%), and Management (86.2%), while the most female-oriented occupations are Legal Services & Support (100.0%), Health Diagnosing & Treating (86.4%), and Health Technologists (82.6%).
| Occupation | Male | Female |
| Management | 454 (86.2%) | 73 (13.9%) |
| Business & Financial | 53 (48.6%) | 56 (51.4%) |
| Computers, Engineering & Science | 89 (62.7%) | 53 (37.3%) |
| Computers & Mathematics | 28 (46.7%) | 32 (53.3%) |
| Architecture & Engineering | 43 (100.0%) | 0 (0.0%) |
| Life, Physical & Social Science | 18 (46.2%) | 21 (53.8%) |
| Community & Social Service | 197 (32.5%) | 409 (67.5%) |
| Education, Arts & Media | 39 (32.0%) | 83 (68.0%) |
| Legal Services & Support | 0 (0.0%) | 17 (100.0%) |
| Education Instruction & Library | 97 (23.9%) | 309 (76.1%) |
| Arts, Media & Entertainment | 61 (100.0%) | 0 (0.0%) |
| Health Diagnosing & Treating | 52 (13.6%) | 331 (86.4%) |
| Health Technologists | 41 (17.4%) | 194 (82.6%) |
| Total (Category) | 845 (47.8%) | 922 (52.2%) |
| Total (Overall) | 3,139 (56.5%) | 2,417 (43.5%) |
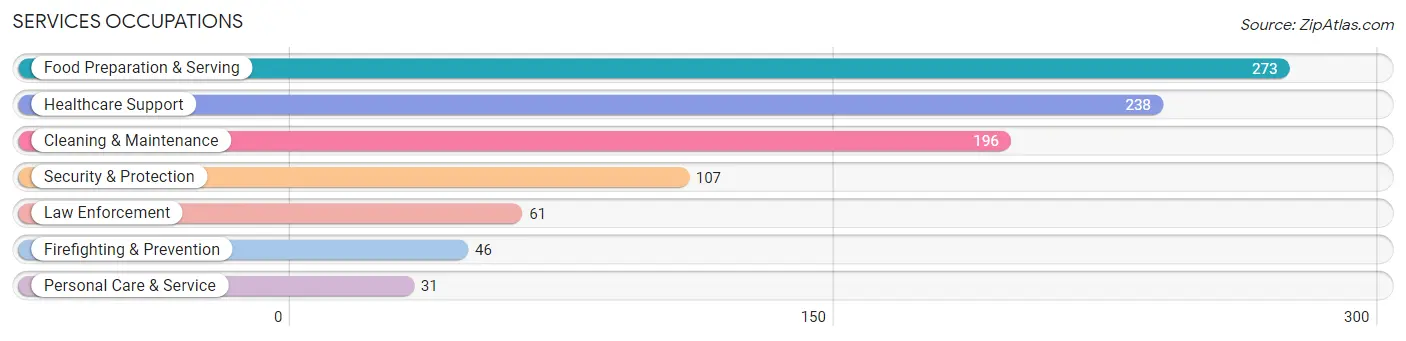
Services Occupations
The most common Services occupations in Lamb County are Food Preparation & Serving (273 | 4.9%), Healthcare Support (238 | 4.3%), Cleaning & Maintenance (196 | 3.5%), Security & Protection (107 | 1.9%), and Law Enforcement (61 | 1.1%).
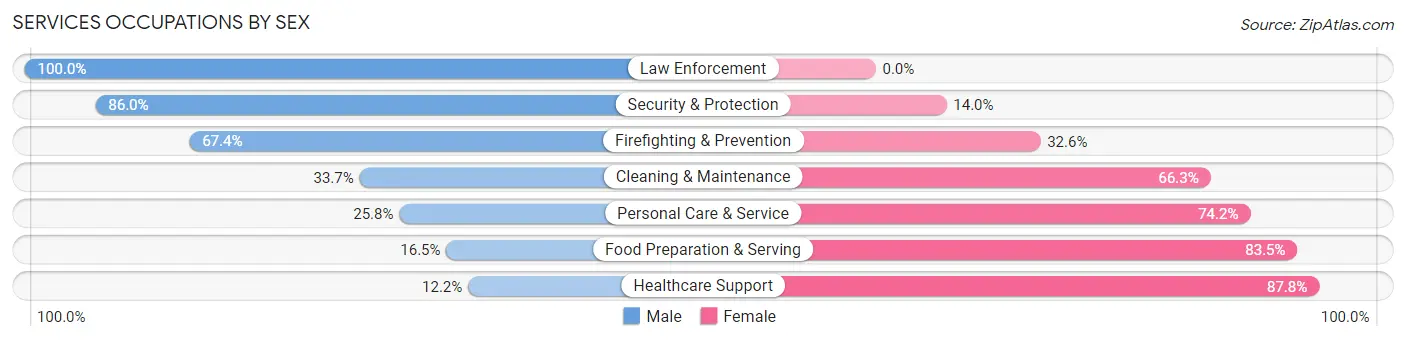
Services Occupations by Sex
Within the Services occupations in Lamb County, the most male-oriented occupations are Law Enforcement (100.0%), Security & Protection (86.0%), and Firefighting & Prevention (67.4%), while the most female-oriented occupations are Healthcare Support (87.8%), Food Preparation & Serving (83.5%), and Personal Care & Service (74.2%).
| Occupation | Male | Female |
| Healthcare Support | 29 (12.2%) | 209 (87.8%) |
| Security & Protection | 92 (86.0%) | 15 (14.0%) |
| Firefighting & Prevention | 31 (67.4%) | 15 (32.6%) |
| Law Enforcement | 61 (100.0%) | 0 (0.0%) |
| Food Preparation & Serving | 45 (16.5%) | 228 (83.5%) |
| Cleaning & Maintenance | 66 (33.7%) | 130 (66.3%) |
| Personal Care & Service | 8 (25.8%) | 23 (74.2%) |
| Total (Category) | 240 (28.4%) | 605 (71.6%) |
| Total (Overall) | 3,139 (56.5%) | 2,417 (43.5%) |
Sales and Office Occupations
The most common Sales and Office occupations in Lamb County are Sales & Related (488 | 8.8%), and Office & Administration (417 | 7.5%).
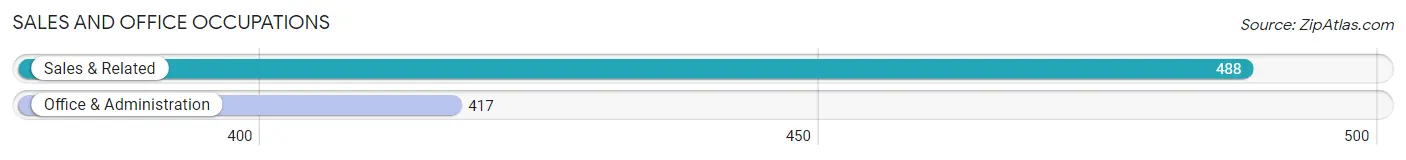
Sales and Office Occupations by Sex
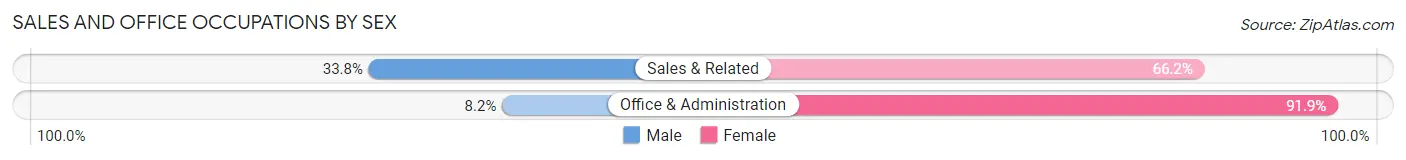
| Occupation | Male | Female |
| Sales & Related | 165 (33.8%) | 323 (66.2%) |
| Office & Administration | 34 (8.2%) | 383 (91.8%) |
| Total (Category) | 199 (22.0%) | 706 (78.0%) |
| Total (Overall) | 3,139 (56.5%) | 2,417 (43.5%) |
Natural Resources, Construction and Maintenance Occupations
The most common Natural Resources, Construction and Maintenance occupations in Lamb County are Installation, Maintenance & Repair (369 | 6.6%), Construction & Extraction (325 | 5.9%), and Farming, Fishing & Forestry (295 | 5.3%).
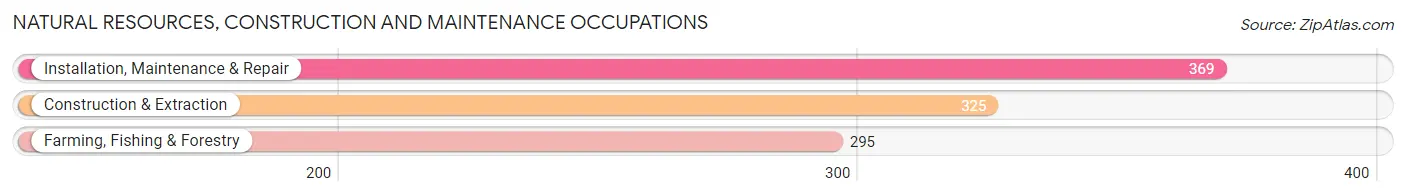
Natural Resources, Construction and Maintenance Occupations by Sex
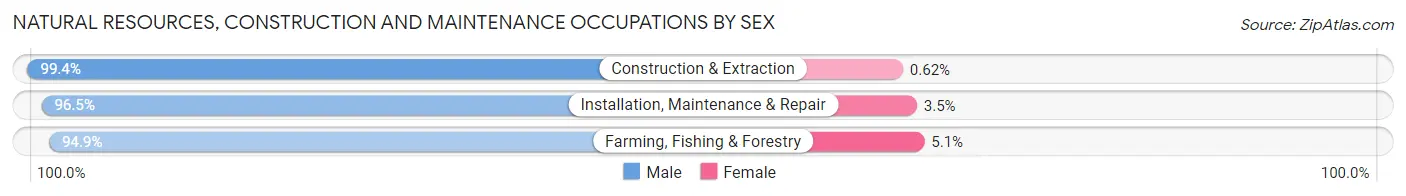
| Occupation | Male | Female |
| Farming, Fishing & Forestry | 280 (94.9%) | 15 (5.1%) |
| Construction & Extraction | 323 (99.4%) | 2 (0.6%) |
| Installation, Maintenance & Repair | 356 (96.5%) | 13 (3.5%) |
| Total (Category) | 959 (97.0%) | 30 (3.0%) |
| Total (Overall) | 3,139 (56.5%) | 2,417 (43.5%) |
Production, Transportation and Moving Occupations
The most common Production, Transportation and Moving occupations in Lamb County are Material Moving (359 | 6.5%), Production (357 | 6.4%), and Transportation (334 | 6.0%).
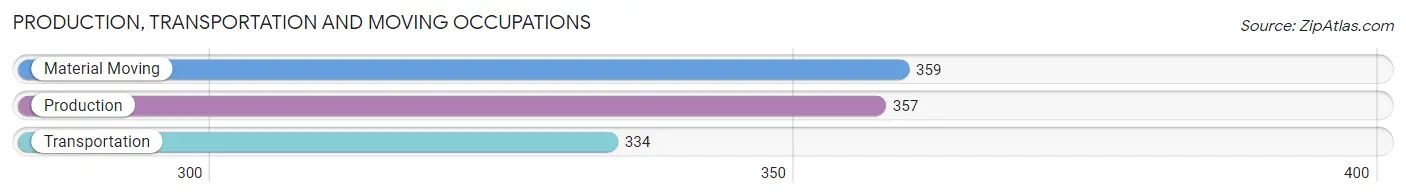
Production, Transportation and Moving Occupations by Sex
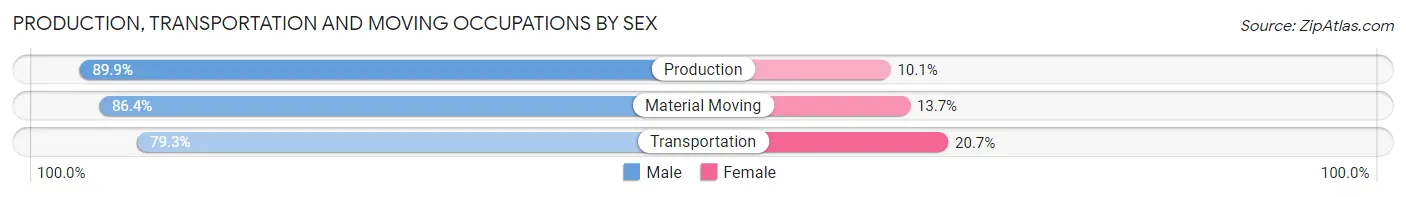
| Occupation | Male | Female |
| Production | 321 (89.9%) | 36 (10.1%) |
| Transportation | 265 (79.3%) | 69 (20.7%) |
| Material Moving | 310 (86.4%) | 49 (13.7%) |
| Total (Category) | 896 (85.3%) | 154 (14.7%) |
| Total (Overall) | 3,139 (56.5%) | 2,417 (43.5%) |
Employment Industries by Sex in Lamb County
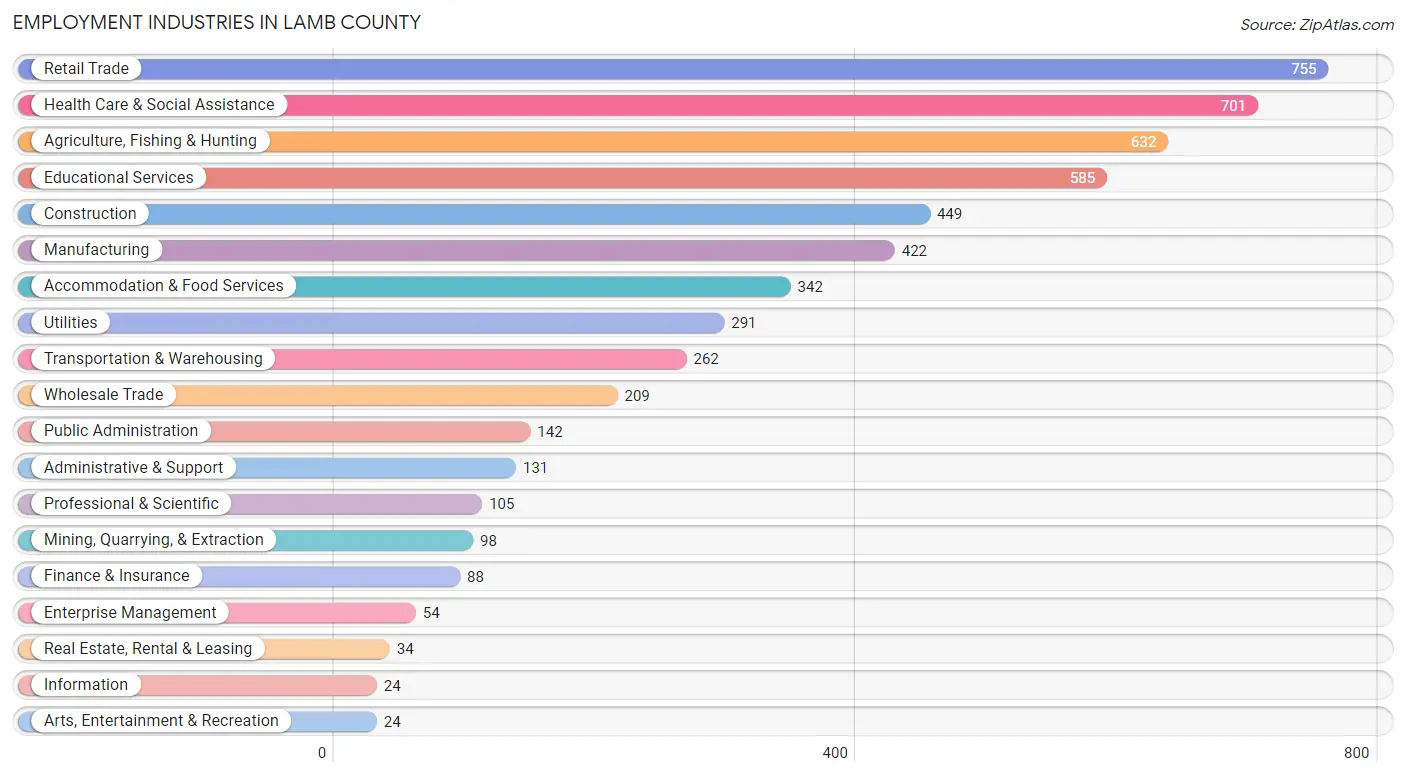
Employment Industries in Lamb County
The major employment industries in Lamb County include Retail Trade (755 | 13.6%), Health Care & Social Assistance (701 | 12.6%), Agriculture, Fishing & Hunting (632 | 11.4%), Educational Services (585 | 10.5%), and Construction (449 | 8.1%).
Employment Industries by Sex in Lamb County
The Lamb County industries that see more men than women are Construction (96.2%), Utilities (89.3%), and Agriculture, Fishing & Hunting (88.6%), whereas the industries that tend to have a higher number of women are Information (91.7%), Health Care & Social Assistance (86.2%), and Real Estate, Rental & Leasing (82.4%).
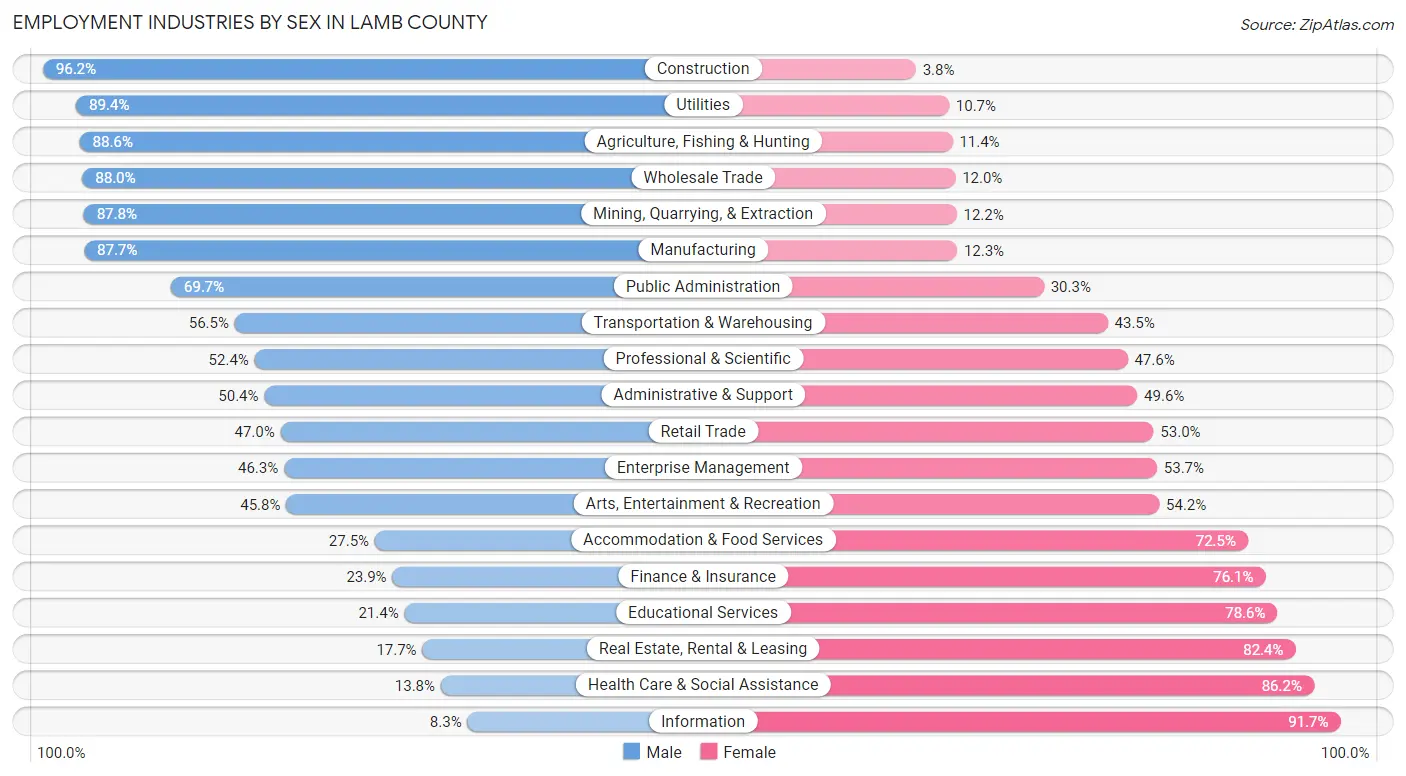
| Industry | Male | Female |
| Agriculture, Fishing & Hunting | 560 (88.6%) | 72 (11.4%) |
| Mining, Quarrying, & Extraction | 86 (87.8%) | 12 (12.2%) |
| Construction | 432 (96.2%) | 17 (3.8%) |
| Manufacturing | 370 (87.7%) | 52 (12.3%) |
| Wholesale Trade | 184 (88.0%) | 25 (12.0%) |
| Retail Trade | 355 (47.0%) | 400 (53.0%) |
| Transportation & Warehousing | 148 (56.5%) | 114 (43.5%) |
| Utilities | 260 (89.3%) | 31 (10.6%) |
| Information | 2 (8.3%) | 22 (91.7%) |
| Finance & Insurance | 21 (23.9%) | 67 (76.1%) |
| Real Estate, Rental & Leasing | 6 (17.6%) | 28 (82.4%) |
| Professional & Scientific | 55 (52.4%) | 50 (47.6%) |
| Enterprise Management | 25 (46.3%) | 29 (53.7%) |
| Administrative & Support | 66 (50.4%) | 65 (49.6%) |
| Educational Services | 125 (21.4%) | 460 (78.6%) |
| Health Care & Social Assistance | 97 (13.8%) | 604 (86.2%) |
| Arts, Entertainment & Recreation | 11 (45.8%) | 13 (54.2%) |
| Accommodation & Food Services | 94 (27.5%) | 248 (72.5%) |
| Public Administration | 99 (69.7%) | 43 (30.3%) |
| Total | 3,139 (56.5%) | 2,417 (43.5%) |
Education in Lamb County
School Enrollment in Lamb County
The most common levels of schooling among the 3,150 students in Lamb County are elementary school (965 | 30.6%), high school (810 | 25.7%), and middle school (773 | 24.5%).
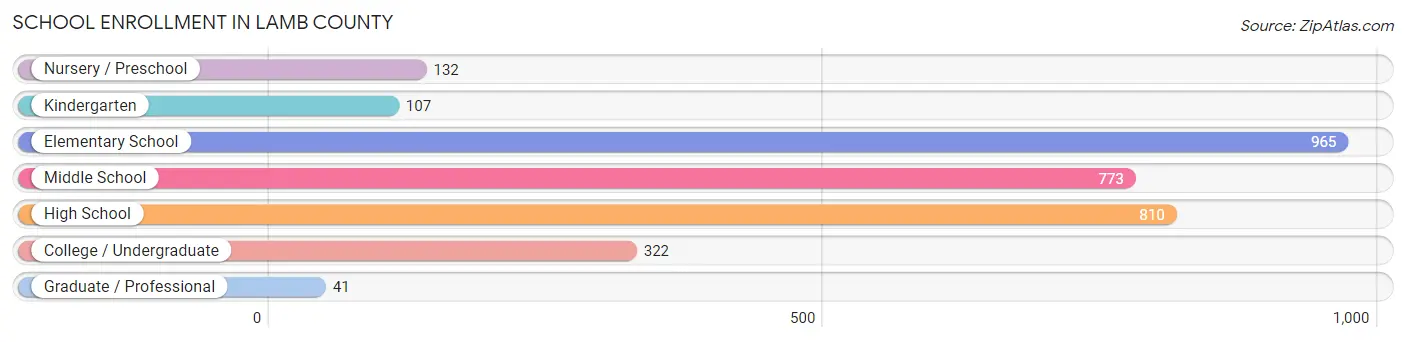
| School Level | # Students | % Students |
| Nursery / Preschool | 132 | 4.2% |
| Kindergarten | 107 | 3.4% |
| Elementary School | 965 | 30.6% |
| Middle School | 773 | 24.5% |
| High School | 810 | 25.7% |
| College / Undergraduate | 322 | 10.2% |
| Graduate / Professional | 41 | 1.3% |
| Total | 3,150 | 100.0% |
School Enrollment by Age by Funding Source in Lamb County
Out of a total of 3,150 students who are enrolled in schools in Lamb County, 186 (5.9%) attend a private institution, while the remaining 2,964 (94.1%) are enrolled in public schools. The age group of 35 years and over has the highest likelihood of being enrolled in private schools, with 15 (31.9% in the age bracket) enrolled. Conversely, the age group of 3 to 4 year olds has the lowest likelihood of being enrolled in a private school, with 65 (100.0% in the age bracket) attending a public institution.
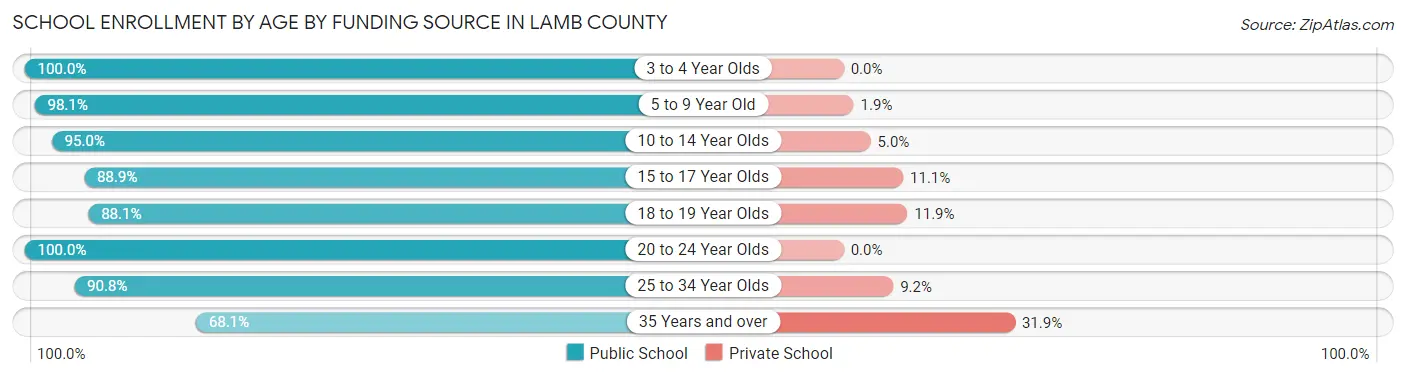
| Age Bracket | Public School | Private School |
| 3 to 4 Year Olds | 65 (100.0%) | 0 (0.0%) |
| 5 to 9 Year Old | 1,055 (98.1%) | 20 (1.9%) |
| 10 to 14 Year Olds | 833 (95.0%) | 44 (5.0%) |
| 15 to 17 Year Olds | 514 (88.9%) | 64 (11.1%) |
| 18 to 19 Year Olds | 275 (88.1%) | 37 (11.9%) |
| 20 to 24 Year Olds | 131 (100.0%) | 0 (0.0%) |
| 25 to 34 Year Olds | 59 (90.8%) | 6 (9.2%) |
| 35 Years and over | 32 (68.1%) | 15 (31.9%) |
| Total | 2,964 (94.1%) | 186 (5.9%) |
Educational Attainment by Field of Study in Lamb County
Education (285 | 26.1%), business (174 | 15.9%), bio, nature & agricultural (165 | 15.1%), science & technology (127 | 11.6%), and liberal arts & history (113 | 10.3%) are the most common fields of study among 1,092 individuals in Lamb County who have obtained a bachelor's degree or higher.
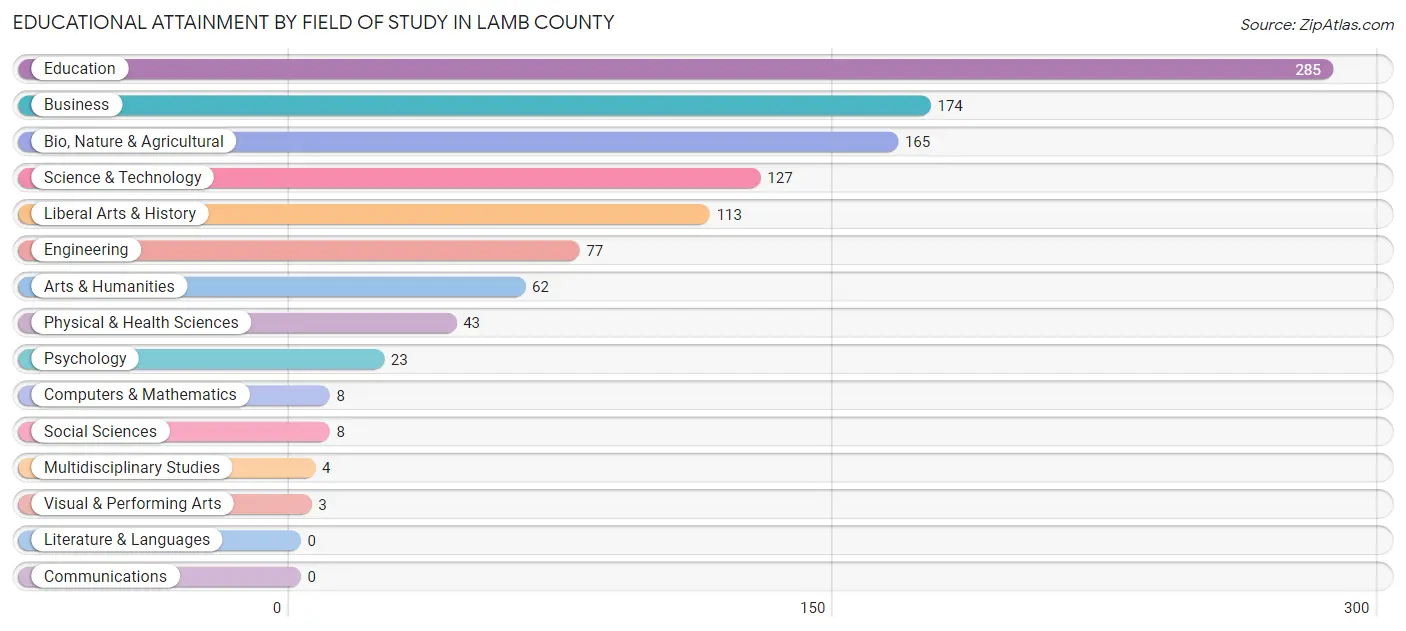
| Field of Study | # Graduates | % Graduates |
| Computers & Mathematics | 8 | 0.7% |
| Bio, Nature & Agricultural | 165 | 15.1% |
| Physical & Health Sciences | 43 | 3.9% |
| Psychology | 23 | 2.1% |
| Social Sciences | 8 | 0.7% |
| Engineering | 77 | 7.0% |
| Multidisciplinary Studies | 4 | 0.4% |
| Science & Technology | 127 | 11.6% |
| Business | 174 | 15.9% |
| Education | 285 | 26.1% |
| Literature & Languages | 0 | 0.0% |
| Liberal Arts & History | 113 | 10.3% |
| Visual & Performing Arts | 3 | 0.3% |
| Communications | 0 | 0.0% |
| Arts & Humanities | 62 | 5.7% |
| Total | 1,092 | 100.0% |
Transportation & Commute in Lamb County
Vehicle Availability by Sex in Lamb County
The most prevalent vehicle ownership categories in Lamb County are males with 2 vehicles (1,292, accounting for 41.8%) and females with 2 vehicles (927, making up 54.6%).
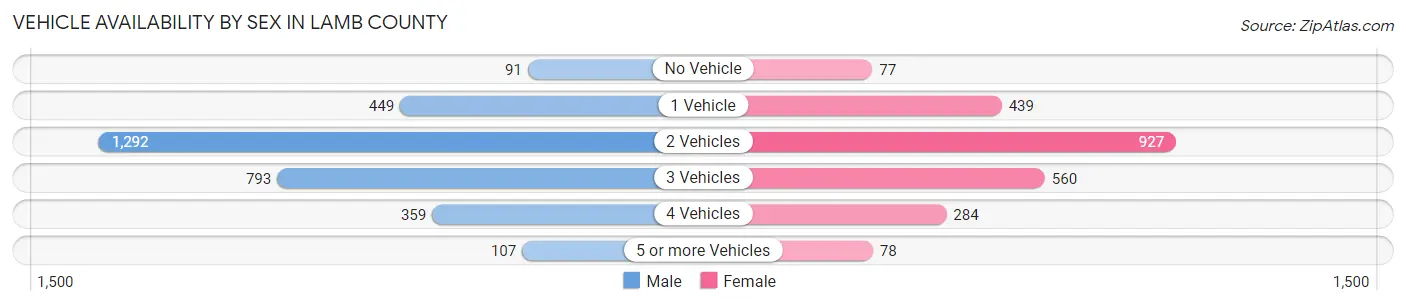
| Vehicles Available | Male | Female |
| No Vehicle | 91 (2.9%) | 77 (3.3%) |
| 1 Vehicle | 449 (14.5%) | 439 (18.6%) |
| 2 Vehicles | 1,292 (41.8%) | 927 (39.2%) |
| 3 Vehicles | 793 (25.7%) | 560 (23.7%) |
| 4 Vehicles | 359 (11.6%) | 284 (12.0%) |
| 5 or more Vehicles | 107 (3.5%) | 78 (3.3%) |
| Total | 3,091 (100.0%) | 2,365 (100.0%) |
Commute Time in Lamb County
The most frequently occuring commute durations in Lamb County are 5 to 9 minutes (1,410 commuters, 26.9%), less than 5 minutes (801 commuters, 15.3%), and 10 to 14 minutes (796 commuters, 15.2%).
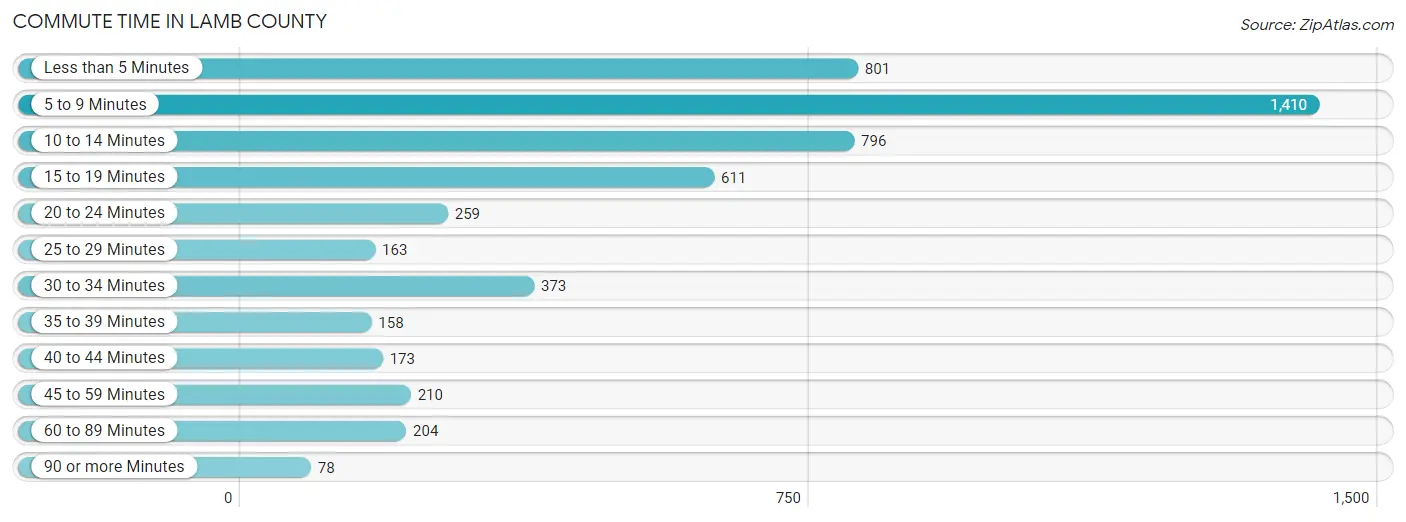
| Commute Time | # Commuters | % Commuters |
| Less than 5 Minutes | 801 | 15.3% |
| 5 to 9 Minutes | 1,410 | 26.9% |
| 10 to 14 Minutes | 796 | 15.2% |
| 15 to 19 Minutes | 611 | 11.7% |
| 20 to 24 Minutes | 259 | 5.0% |
| 25 to 29 Minutes | 163 | 3.1% |
| 30 to 34 Minutes | 373 | 7.1% |
| 35 to 39 Minutes | 158 | 3.0% |
| 40 to 44 Minutes | 173 | 3.3% |
| 45 to 59 Minutes | 210 | 4.0% |
| 60 to 89 Minutes | 204 | 3.9% |
| 90 or more Minutes | 78 | 1.5% |
Commute Time by Sex in Lamb County
The most common commute times in Lamb County are 5 to 9 minutes (850 commuters, 28.3%) for males and 5 to 9 minutes (560 commuters, 25.1%) for females.
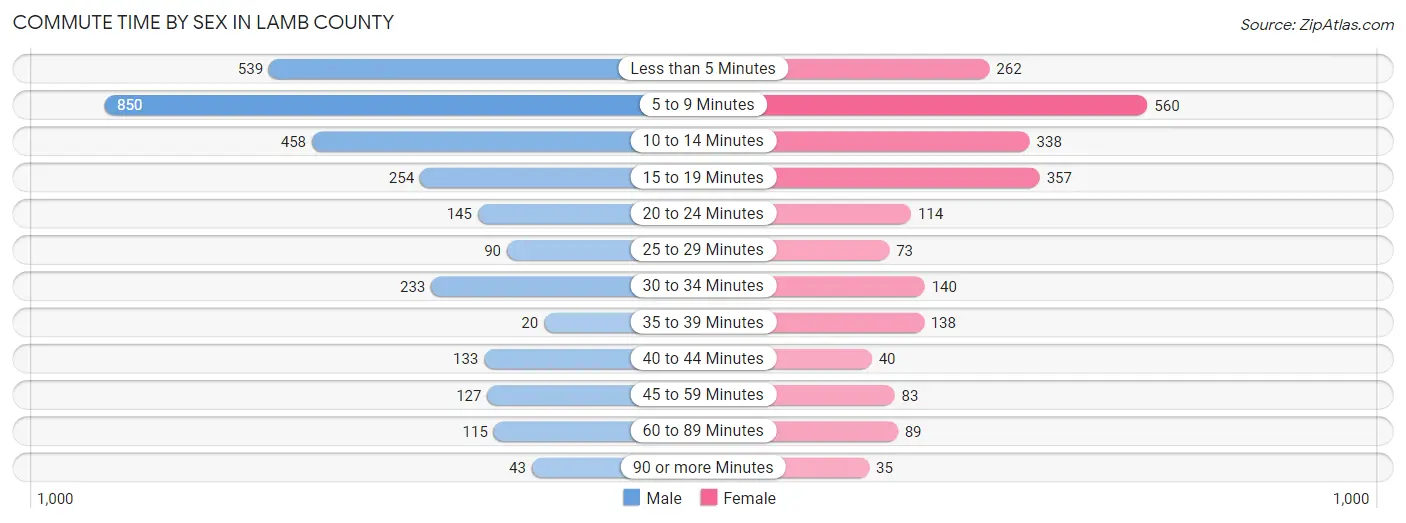
| Commute Time | Male | Female |
| Less than 5 Minutes | 539 (17.9%) | 262 (11.7%) |
| 5 to 9 Minutes | 850 (28.3%) | 560 (25.1%) |
| 10 to 14 Minutes | 458 (15.2%) | 338 (15.2%) |
| 15 to 19 Minutes | 254 (8.5%) | 357 (16.0%) |
| 20 to 24 Minutes | 145 (4.8%) | 114 (5.1%) |
| 25 to 29 Minutes | 90 (3.0%) | 73 (3.3%) |
| 30 to 34 Minutes | 233 (7.7%) | 140 (6.3%) |
| 35 to 39 Minutes | 20 (0.7%) | 138 (6.2%) |
| 40 to 44 Minutes | 133 (4.4%) | 40 (1.8%) |
| 45 to 59 Minutes | 127 (4.2%) | 83 (3.7%) |
| 60 to 89 Minutes | 115 (3.8%) | 89 (4.0%) |
| 90 or more Minutes | 43 (1.4%) | 35 (1.6%) |
Time of Departure to Work by Sex in Lamb County
The most frequent times of departure to work in Lamb County are 7:00 AM to 7:29 AM (467, 15.5%) for males and 7:00 AM to 7:29 AM (500, 22.4%) for females.
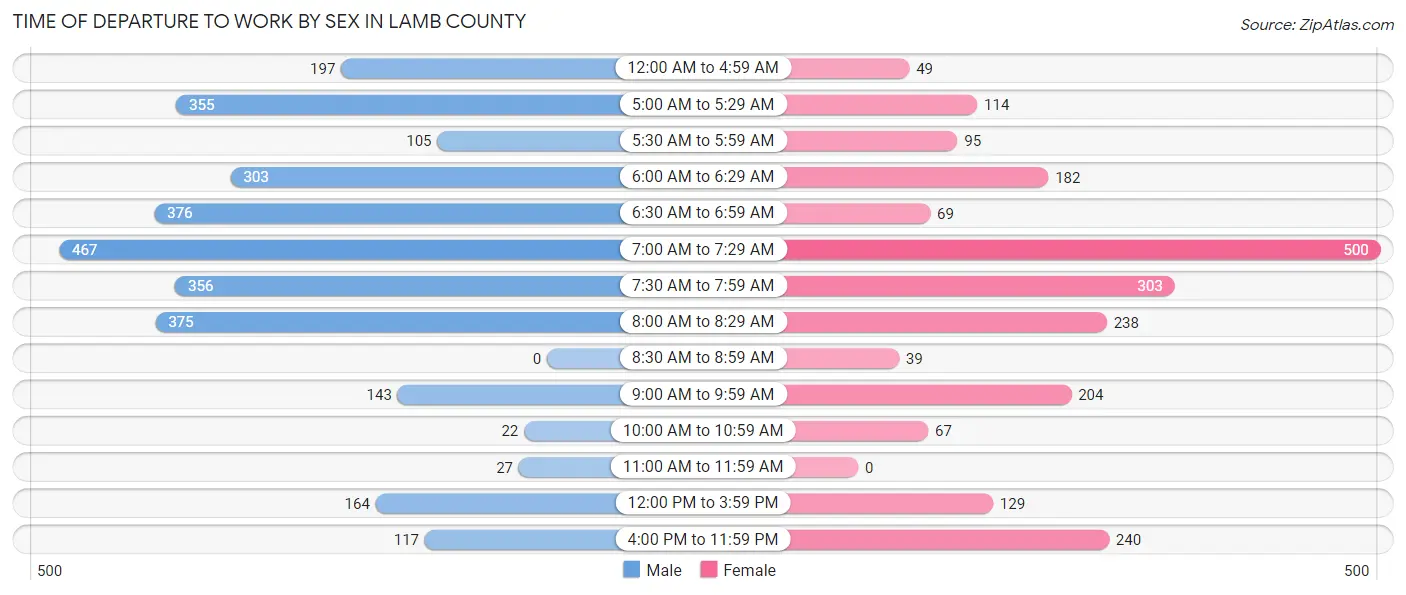
| Time of Departure | Male | Female |
| 12:00 AM to 4:59 AM | 197 (6.6%) | 49 (2.2%) |
| 5:00 AM to 5:29 AM | 355 (11.8%) | 114 (5.1%) |
| 5:30 AM to 5:59 AM | 105 (3.5%) | 95 (4.3%) |
| 6:00 AM to 6:29 AM | 303 (10.1%) | 182 (8.2%) |
| 6:30 AM to 6:59 AM | 376 (12.5%) | 69 (3.1%) |
| 7:00 AM to 7:29 AM | 467 (15.5%) | 500 (22.4%) |
| 7:30 AM to 7:59 AM | 356 (11.8%) | 303 (13.6%) |
| 8:00 AM to 8:29 AM | 375 (12.5%) | 238 (10.7%) |
| 8:30 AM to 8:59 AM | 0 (0.0%) | 39 (1.8%) |
| 9:00 AM to 9:59 AM | 143 (4.8%) | 204 (9.1%) |
| 10:00 AM to 10:59 AM | 22 (0.7%) | 67 (3.0%) |
| 11:00 AM to 11:59 AM | 27 (0.9%) | 0 (0.0%) |
| 12:00 PM to 3:59 PM | 164 (5.4%) | 129 (5.8%) |
| 4:00 PM to 11:59 PM | 117 (3.9%) | 240 (10.8%) |
| Total | 3,007 (100.0%) | 2,229 (100.0%) |
Housing Occupancy in Lamb County
Occupancy by Ownership in Lamb County
Of the total 4,632 dwellings in Lamb County, owner-occupied units account for 3,375 (72.9%), while renter-occupied units make up 1,257 (27.1%).
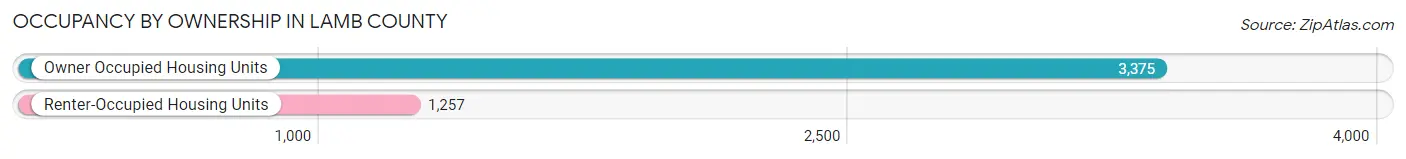
| Occupancy | # Housing Units | % Housing Units |
| Owner Occupied Housing Units | 3,375 | 72.9% |
| Renter-Occupied Housing Units | 1,257 | 27.1% |
| Total Occupied Housing Units | 4,632 | 100.0% |
Occupancy by Household Size in Lamb County
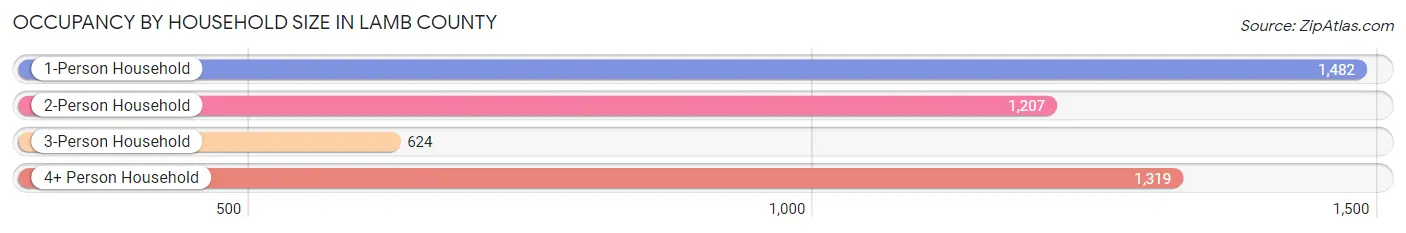
| Household Size | # Housing Units | % Housing Units |
| 1-Person Household | 1,482 | 32.0% |
| 2-Person Household | 1,207 | 26.1% |
| 3-Person Household | 624 | 13.5% |
| 4+ Person Household | 1,319 | 28.5% |
| Total Housing Units | 4,632 | 100.0% |
Occupancy by Ownership by Household Size in Lamb County
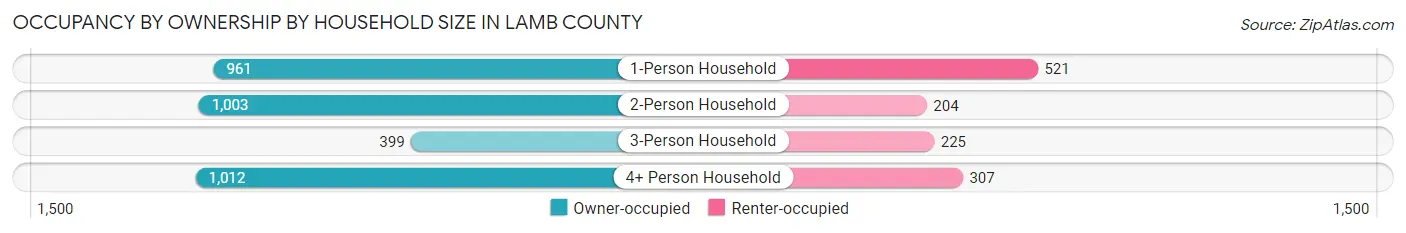
| Household Size | Owner-occupied | Renter-occupied |
| 1-Person Household | 961 (64.8%) | 521 (35.2%) |
| 2-Person Household | 1,003 (83.1%) | 204 (16.9%) |
| 3-Person Household | 399 (63.9%) | 225 (36.1%) |
| 4+ Person Household | 1,012 (76.7%) | 307 (23.3%) |
| Total Housing Units | 3,375 (72.9%) | 1,257 (27.1%) |
Occupancy by Educational Attainment in Lamb County
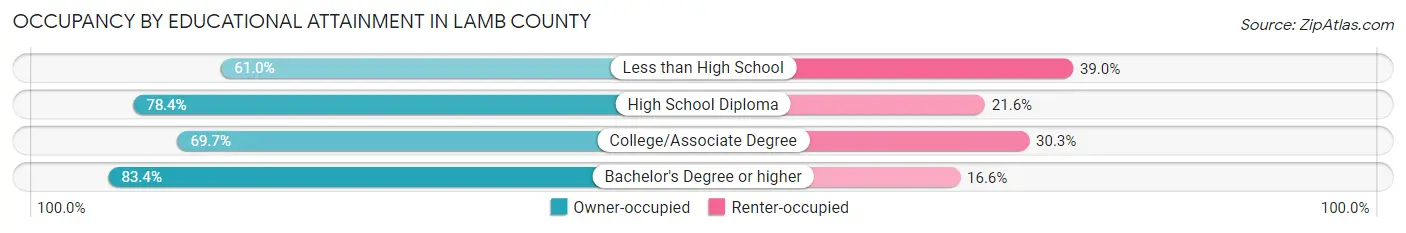
| Household Size | Owner-occupied | Renter-occupied |
| Less than High School | 600 (61.0%) | 384 (39.0%) |
| High School Diploma | 1,299 (78.4%) | 357 (21.6%) |
| College/Associate Degree | 940 (69.7%) | 409 (30.3%) |
| Bachelor's Degree or higher | 536 (83.4%) | 107 (16.6%) |
Occupancy by Age of Householder in Lamb County
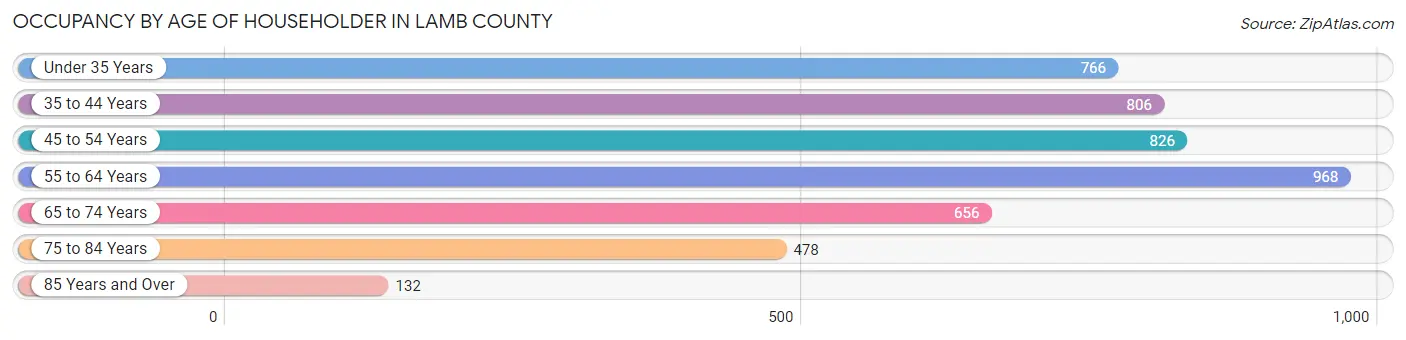
| Age Bracket | # Households | % Households |
| Under 35 Years | 766 | 16.5% |
| 35 to 44 Years | 806 | 17.4% |
| 45 to 54 Years | 826 | 17.8% |
| 55 to 64 Years | 968 | 20.9% |
| 65 to 74 Years | 656 | 14.2% |
| 75 to 84 Years | 478 | 10.3% |
| 85 Years and Over | 132 | 2.9% |
| Total | 4,632 | 100.0% |
Housing Finances in Lamb County
Median Income by Occupancy in Lamb County
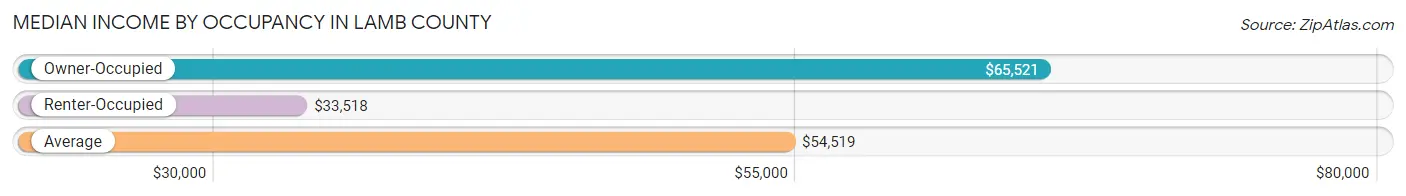
| Occupancy Type | # Households | Median Income |
| Owner-Occupied | 3,375 (72.9%) | $65,521 |
| Renter-Occupied | 1,257 (27.1%) | $33,518 |
| Average | 4,632 (100.0%) | $54,519 |
Occupancy by Householder Income Bracket in Lamb County
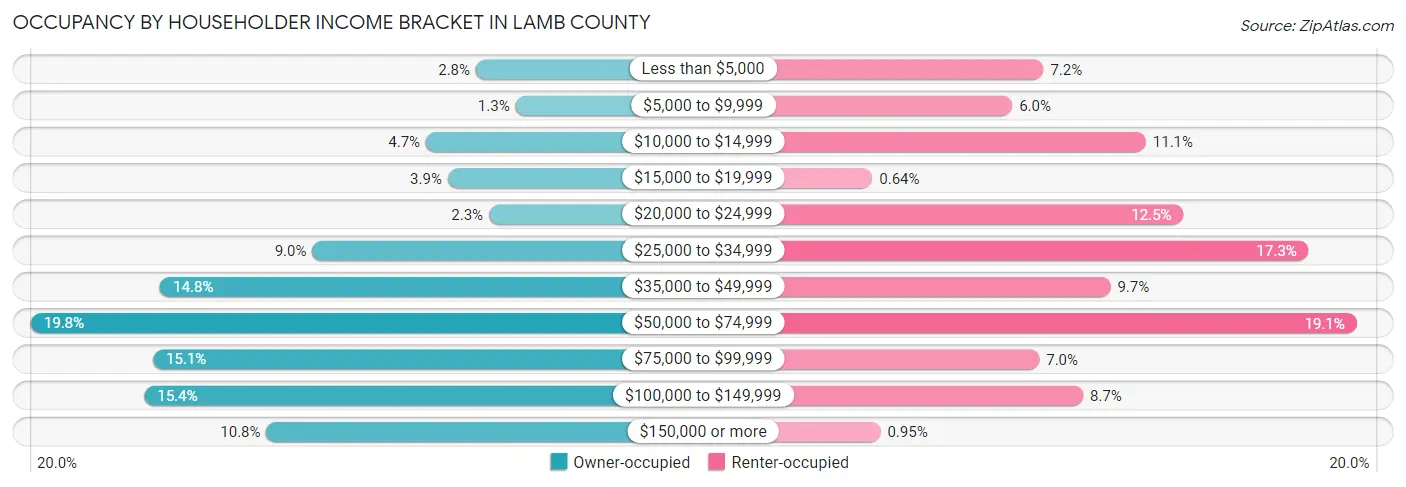
| Income Bracket | Owner-occupied | Renter-occupied |
| Less than $5,000 | 95 (2.8%) | 90 (7.2%) |
| $5,000 to $9,999 | 44 (1.3%) | 75 (6.0%) |
| $10,000 to $14,999 | 159 (4.7%) | 139 (11.1%) |
| $15,000 to $19,999 | 131 (3.9%) | 8 (0.6%) |
| $20,000 to $24,999 | 78 (2.3%) | 157 (12.5%) |
| $25,000 to $34,999 | 305 (9.0%) | 217 (17.3%) |
| $35,000 to $49,999 | 501 (14.8%) | 122 (9.7%) |
| $50,000 to $74,999 | 667 (19.8%) | 240 (19.1%) |
| $75,000 to $99,999 | 510 (15.1%) | 88 (7.0%) |
| $100,000 to $149,999 | 521 (15.4%) | 109 (8.7%) |
| $150,000 or more | 364 (10.8%) | 12 (0.9%) |
| Total | 3,375 (100.0%) | 1,257 (100.0%) |
Monthly Housing Cost Tiers in Lamb County
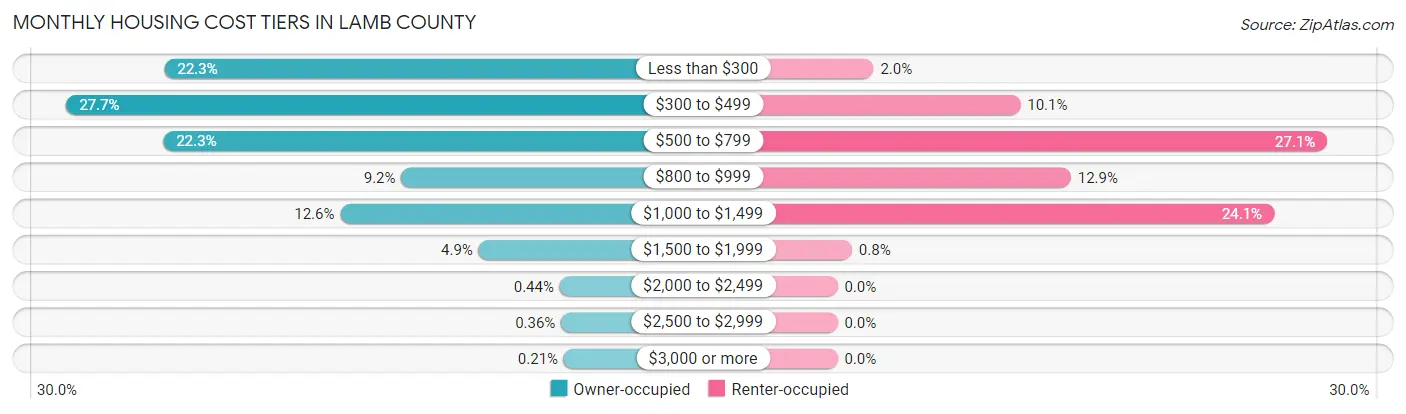
| Monthly Cost | Owner-occupied | Renter-occupied |
| Less than $300 | 752 (22.3%) | 25 (2.0%) |
| $300 to $499 | 935 (27.7%) | 127 (10.1%) |
| $500 to $799 | 754 (22.3%) | 340 (27.1%) |
| $800 to $999 | 310 (9.2%) | 162 (12.9%) |
| $1,000 to $1,499 | 424 (12.6%) | 303 (24.1%) |
| $1,500 to $1,999 | 166 (4.9%) | 10 (0.8%) |
| $2,000 to $2,499 | 15 (0.4%) | 0 (0.0%) |
| $2,500 to $2,999 | 12 (0.4%) | 0 (0.0%) |
| $3,000 or more | 7 (0.2%) | 0 (0.0%) |
| Total | 3,375 (100.0%) | 1,257 (100.0%) |
Physical Housing Characteristics in Lamb County
Housing Structures in Lamb County
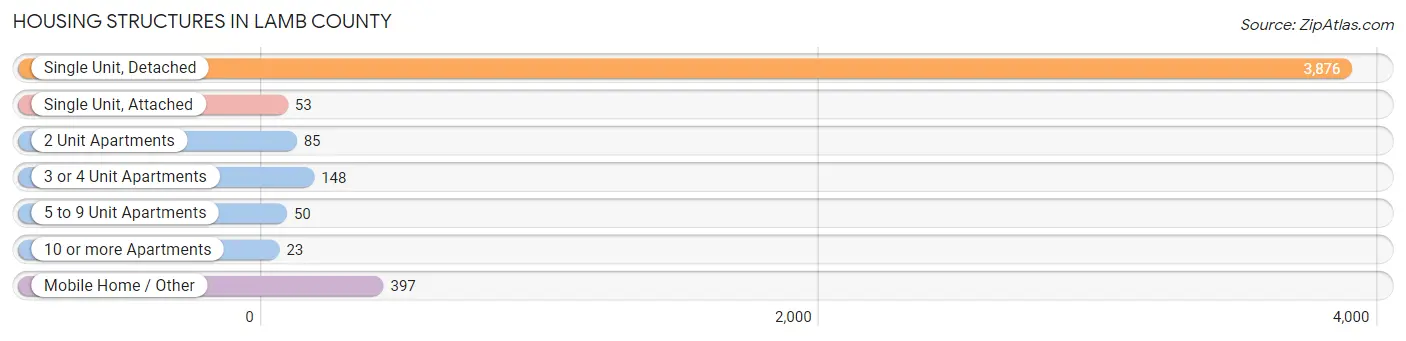
| Structure Type | # Housing Units | % Housing Units |
| Single Unit, Detached | 3,876 | 83.7% |
| Single Unit, Attached | 53 | 1.1% |
| 2 Unit Apartments | 85 | 1.8% |
| 3 or 4 Unit Apartments | 148 | 3.2% |
| 5 to 9 Unit Apartments | 50 | 1.1% |
| 10 or more Apartments | 23 | 0.5% |
| Mobile Home / Other | 397 | 8.6% |
| Total | 4,632 | 100.0% |
Housing Structures by Occupancy in Lamb County
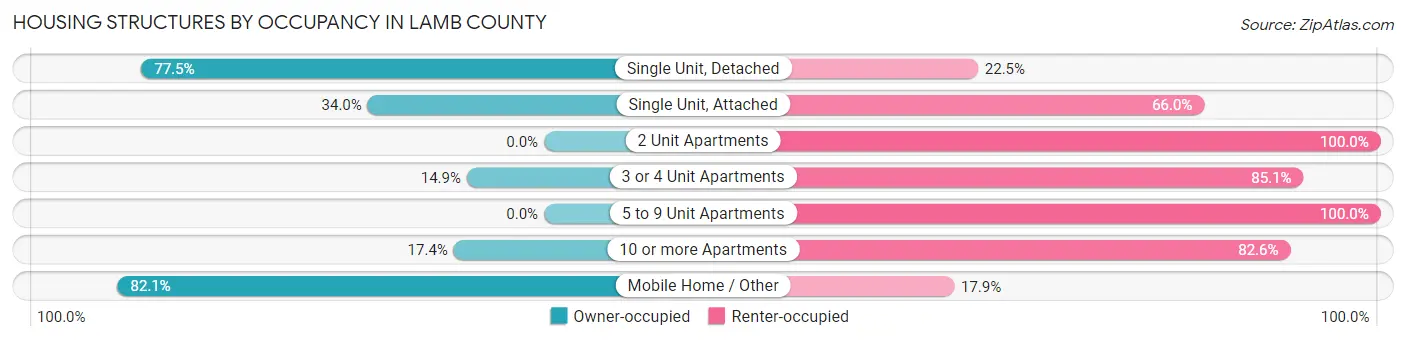
| Structure Type | Owner-occupied | Renter-occupied |
| Single Unit, Detached | 3,005 (77.5%) | 871 (22.5%) |
| Single Unit, Attached | 18 (34.0%) | 35 (66.0%) |
| 2 Unit Apartments | 0 (0.0%) | 85 (100.0%) |
| 3 or 4 Unit Apartments | 22 (14.9%) | 126 (85.1%) |
| 5 to 9 Unit Apartments | 0 (0.0%) | 50 (100.0%) |
| 10 or more Apartments | 4 (17.4%) | 19 (82.6%) |
| Mobile Home / Other | 326 (82.1%) | 71 (17.9%) |
| Total | 3,375 (72.9%) | 1,257 (27.1%) |
Housing Structures by Number of Rooms in Lamb County
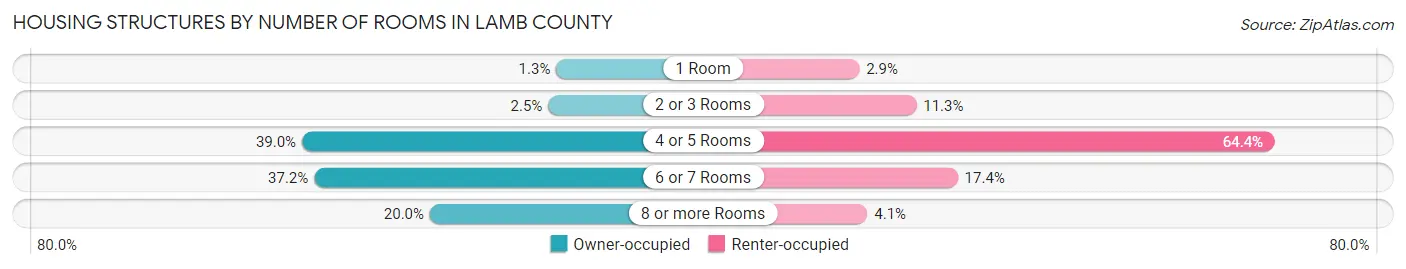
| Number of Rooms | Owner-occupied | Renter-occupied |
| 1 Room | 45 (1.3%) | 36 (2.9%) |
| 2 or 3 Rooms | 85 (2.5%) | 142 (11.3%) |
| 4 or 5 Rooms | 1,315 (39.0%) | 809 (64.4%) |
| 6 or 7 Rooms | 1,254 (37.2%) | 219 (17.4%) |
| 8 or more Rooms | 676 (20.0%) | 51 (4.1%) |
| Total | 3,375 (100.0%) | 1,257 (100.0%) |
Housing Structure by Heating Type in Lamb County
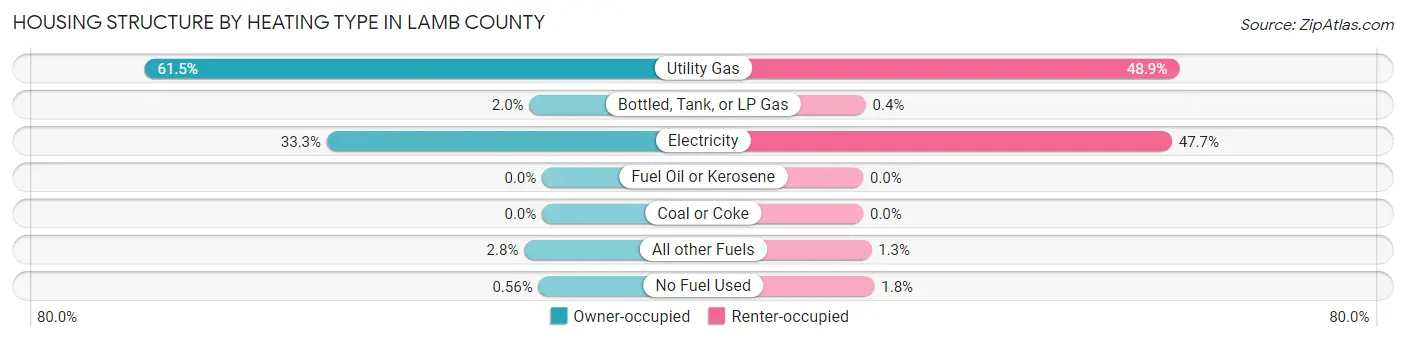
| Heating Type | Owner-occupied | Renter-occupied |
| Utility Gas | 2,074 (61.5%) | 614 (48.8%) |
| Bottled, Tank, or LP Gas | 66 (2.0%) | 5 (0.4%) |
| Electricity | 1,123 (33.3%) | 600 (47.7%) |
| Fuel Oil or Kerosene | 0 (0.0%) | 0 (0.0%) |
| Coal or Coke | 0 (0.0%) | 0 (0.0%) |
| All other Fuels | 93 (2.8%) | 16 (1.3%) |
| No Fuel Used | 19 (0.6%) | 22 (1.8%) |
| Total | 3,375 (100.0%) | 1,257 (100.0%) |
Household Vehicle Usage in Lamb County
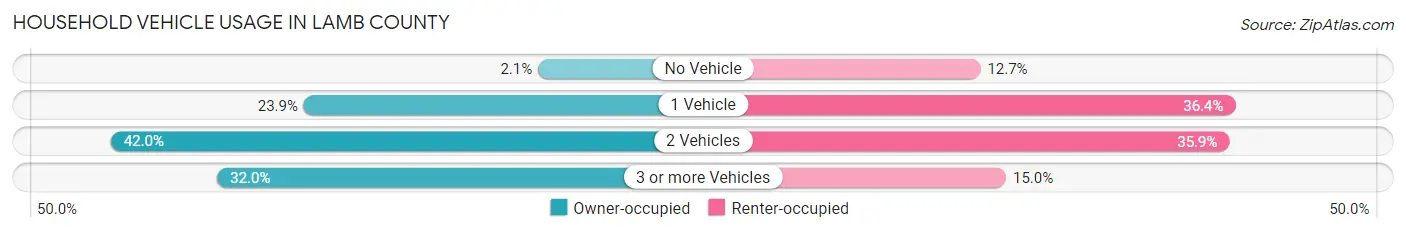
| Vehicles per Household | Owner-occupied | Renter-occupied |
| No Vehicle | 70 (2.1%) | 159 (12.7%) |
| 1 Vehicle | 808 (23.9%) | 458 (36.4%) |
| 2 Vehicles | 1,416 (42.0%) | 451 (35.9%) |
| 3 or more Vehicles | 1,081 (32.0%) | 189 (15.0%) |
| Total | 3,375 (100.0%) | 1,257 (100.0%) |
Real Estate & Mortgages in Lamb County
Real Estate and Mortgage Overview in Lamb County
| Characteristic | Without Mortgage | With Mortgage |
| Housing Units | 2,451 | 924 |
| Median Property Value | $65,700 | $129,700 |
| Median Household Income | $52,070 | $143 |
| Monthly Housing Costs | $389 | $0 |
| Real Estate Taxes | $636 | $139 |
Property Value by Mortgage Status in Lamb County
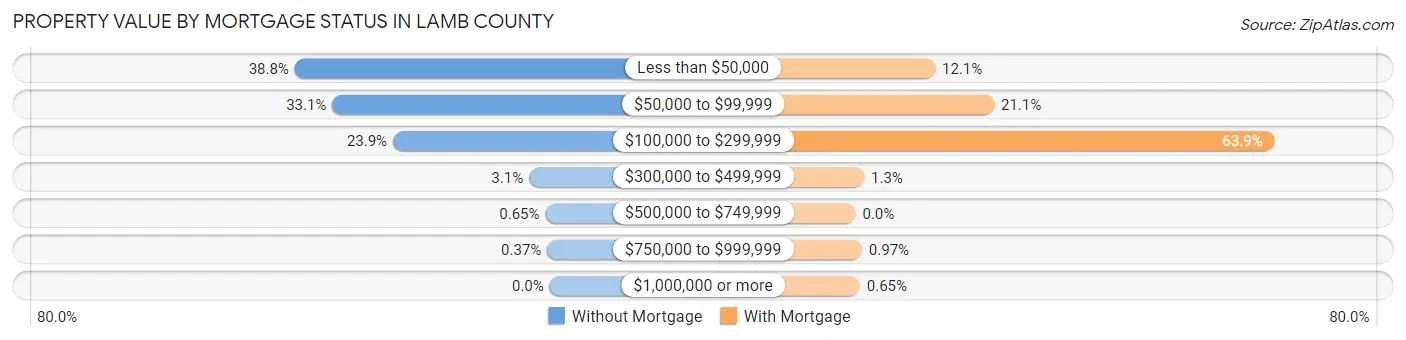
| Property Value | Without Mortgage | With Mortgage |
| Less than $50,000 | 952 (38.8%) | 112 (12.1%) |
| $50,000 to $99,999 | 812 (33.1%) | 195 (21.1%) |
| $100,000 to $299,999 | 585 (23.9%) | 590 (63.8%) |
| $300,000 to $499,999 | 77 (3.1%) | 12 (1.3%) |
| $500,000 to $749,999 | 16 (0.6%) | 0 (0.0%) |
| $750,000 to $999,999 | 9 (0.4%) | 9 (1.0%) |
| $1,000,000 or more | 0 (0.0%) | 6 (0.6%) |
| Total | 2,451 (100.0%) | 924 (100.0%) |
Household Income by Mortgage Status in Lamb County
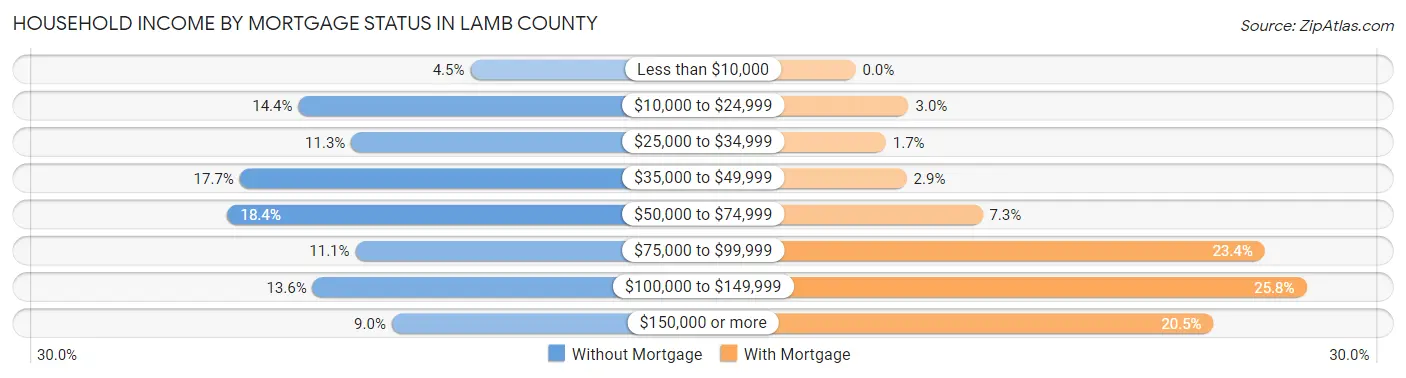
| Household Income | Without Mortgage | With Mortgage |
| Less than $10,000 | 111 (4.5%) | 0 (0.0%) |
| $10,000 to $24,999 | 352 (14.4%) | 28 (3.0%) |
| $25,000 to $34,999 | 278 (11.3%) | 16 (1.7%) |
| $35,000 to $49,999 | 434 (17.7%) | 27 (2.9%) |
| $50,000 to $74,999 | 451 (18.4%) | 67 (7.2%) |
| $75,000 to $99,999 | 272 (11.1%) | 216 (23.4%) |
| $100,000 to $149,999 | 332 (13.6%) | 238 (25.8%) |
| $150,000 or more | 221 (9.0%) | 189 (20.4%) |
| Total | 2,451 (100.0%) | 924 (100.0%) |
Property Value to Household Income Ratio in Lamb County
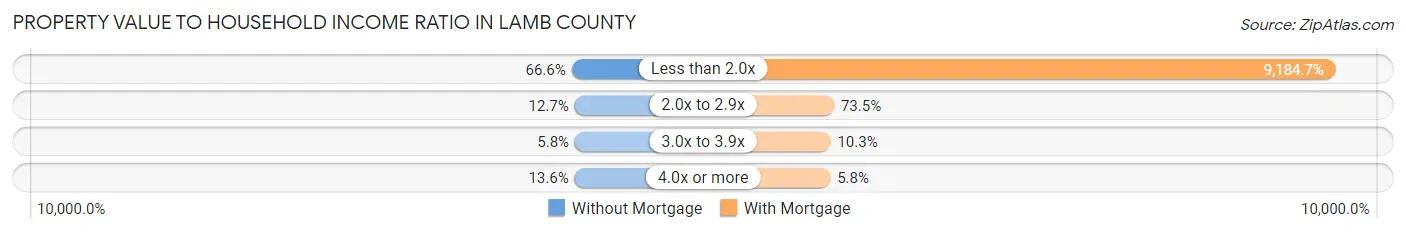
| Value-to-Income Ratio | Without Mortgage | With Mortgage |
| Less than 2.0x | 1,633 (66.6%) | 84,867 (9,184.7%) |
| 2.0x to 2.9x | 311 (12.7%) | 679 (73.5%) |
| 3.0x to 3.9x | 142 (5.8%) | 95 (10.3%) |
| 4.0x or more | 332 (13.6%) | 54 (5.8%) |
| Total | 2,451 (100.0%) | 924 (100.0%) |
Real Estate Taxes by Mortgage Status in Lamb County
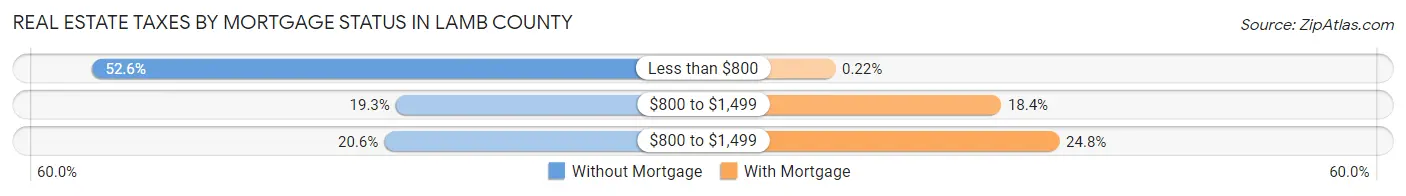
| Property Taxes | Without Mortgage | With Mortgage |
| Less than $800 | 1,288 (52.5%) | 2 (0.2%) |
| $800 to $1,499 | 474 (19.3%) | 170 (18.4%) |
| $800 to $1,499 | 505 (20.6%) | 229 (24.8%) |
| Total | 2,451 (100.0%) | 924 (100.0%) |
Health & Disability in Lamb County
Health Insurance Coverage by Age in Lamb County
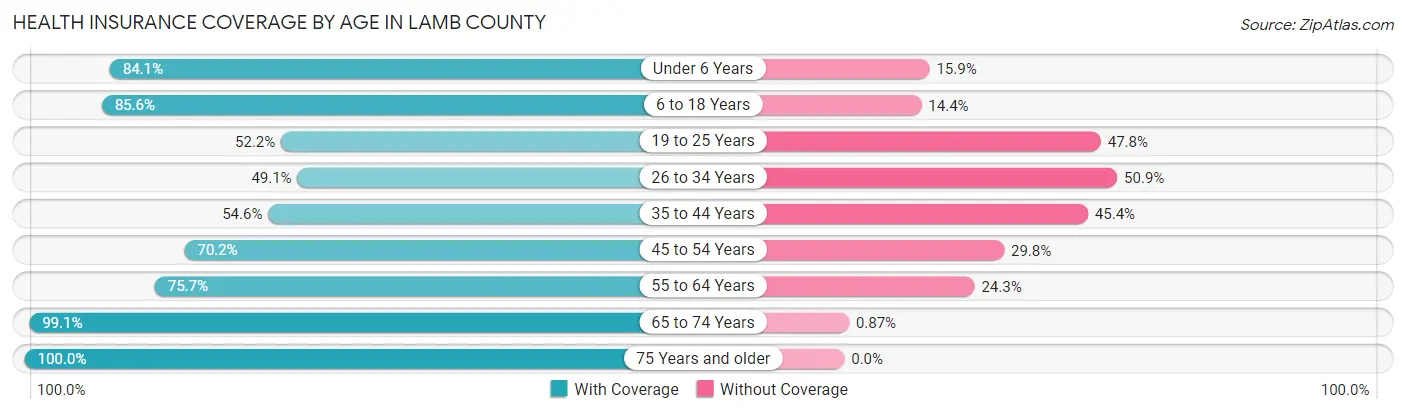
| Age Bracket | With Coverage | Without Coverage |
| Under 6 Years | 868 (84.1%) | 164 (15.9%) |
| 6 to 18 Years | 2,412 (85.6%) | 405 (14.4%) |
| 19 to 25 Years | 576 (52.2%) | 528 (47.8%) |
| 26 to 34 Years | 612 (49.1%) | 634 (50.9%) |
| 35 to 44 Years | 842 (54.6%) | 701 (45.4%) |
| 45 to 54 Years | 997 (70.2%) | 423 (29.8%) |
| 55 to 64 Years | 1,204 (75.7%) | 386 (24.3%) |
| 65 to 74 Years | 1,133 (99.1%) | 10 (0.9%) |
| 75 Years and older | 925 (100.0%) | 0 (0.0%) |
| Total | 9,569 (74.6%) | 3,251 (25.4%) |
Health Insurance Coverage by Citizenship Status in Lamb County
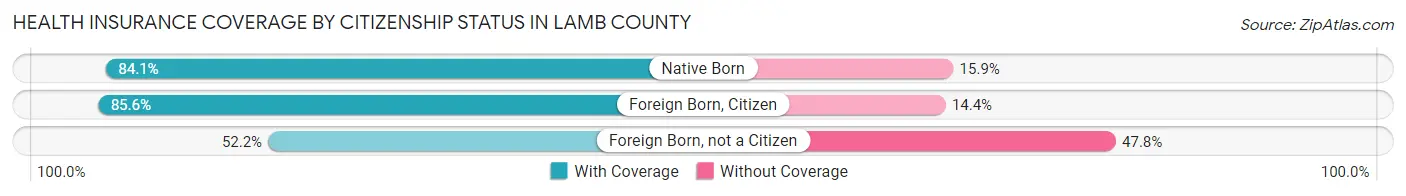
| Citizenship Status | With Coverage | Without Coverage |
| Native Born | 868 (84.1%) | 164 (15.9%) |
| Foreign Born, Citizen | 2,412 (85.6%) | 405 (14.4%) |
| Foreign Born, not a Citizen | 576 (52.2%) | 528 (47.8%) |
Health Insurance Coverage by Household Income in Lamb County
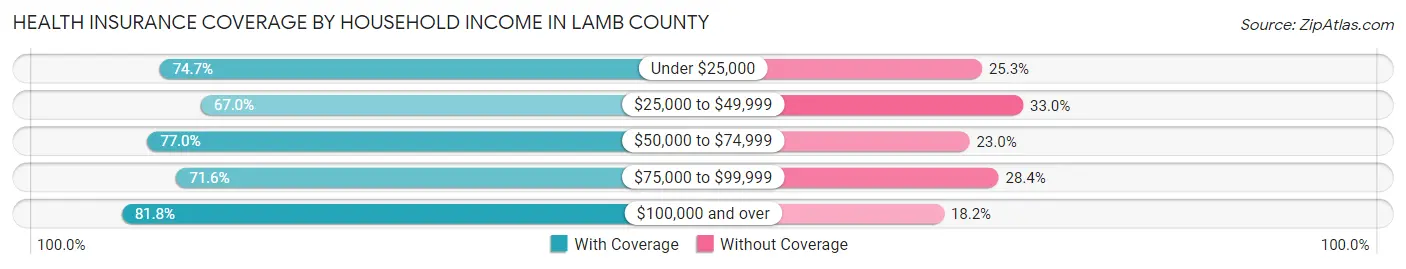
| Household Income | With Coverage | Without Coverage |
| Under $25,000 | 1,224 (74.7%) | 415 (25.3%) |
| $25,000 to $49,999 | 2,052 (67.0%) | 1,012 (33.0%) |
| $50,000 to $74,999 | 1,966 (77.0%) | 587 (23.0%) |
| $75,000 to $99,999 | 1,568 (71.6%) | 623 (28.4%) |
| $100,000 and over | 2,759 (81.8%) | 614 (18.2%) |
Public vs Private Health Insurance Coverage by Age in Lamb County
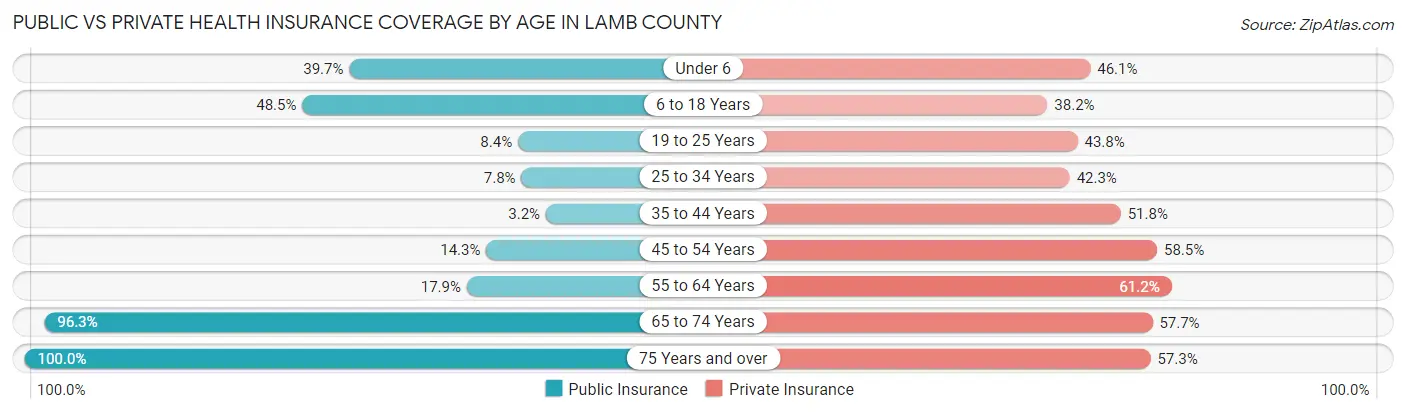
| Age Bracket | Public Insurance | Private Insurance |
| Under 6 | 410 (39.7%) | 476 (46.1%) |
| 6 to 18 Years | 1,365 (48.5%) | 1,075 (38.2%) |
| 19 to 25 Years | 93 (8.4%) | 483 (43.8%) |
| 25 to 34 Years | 97 (7.8%) | 527 (42.3%) |
| 35 to 44 Years | 50 (3.2%) | 799 (51.8%) |
| 45 to 54 Years | 203 (14.3%) | 831 (58.5%) |
| 55 to 64 Years | 285 (17.9%) | 973 (61.2%) |
| 65 to 74 Years | 1,101 (96.3%) | 659 (57.7%) |
| 75 Years and over | 925 (100.0%) | 530 (57.3%) |
| Total | 4,529 (35.3%) | 6,353 (49.6%) |
Disability Status by Sex by Age in Lamb County
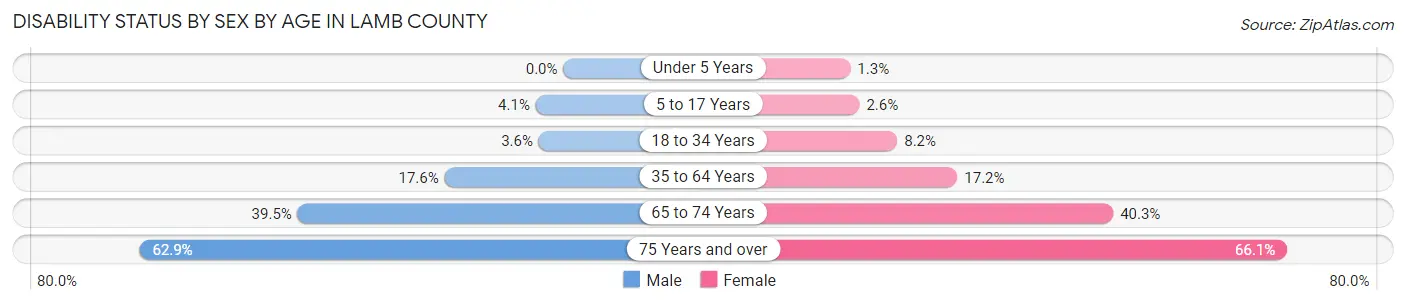
| Age Bracket | Male | Female |
| Under 5 Years | 0 (0.0%) | 5 (1.3%) |
| 5 to 17 Years | 55 (4.1%) | 35 (2.6%) |
| 18 to 34 Years | 50 (3.6%) | 103 (8.2%) |
| 35 to 64 Years | 397 (17.6%) | 395 (17.2%) |
| 65 to 74 Years | 215 (39.5%) | 241 (40.3%) |
| 75 Years and over | 270 (62.9%) | 328 (66.1%) |
Disability Class by Sex by Age in Lamb County
Disability Class: Hearing Difficulty
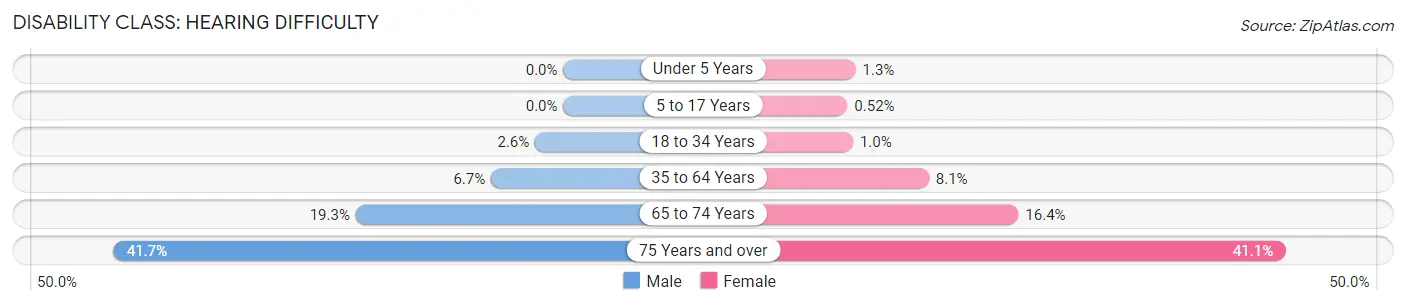
| Age Bracket | Male | Female |
| Under 5 Years | 0 (0.0%) | 5 (1.3%) |
| 5 to 17 Years | 0 (0.0%) | 7 (0.5%) |
| 18 to 34 Years | 36 (2.6%) | 13 (1.0%) |
| 35 to 64 Years | 151 (6.7%) | 186 (8.1%) |
| 65 to 74 Years | 105 (19.3%) | 98 (16.4%) |
| 75 Years and over | 179 (41.7%) | 204 (41.1%) |
Disability Class: Vision Difficulty
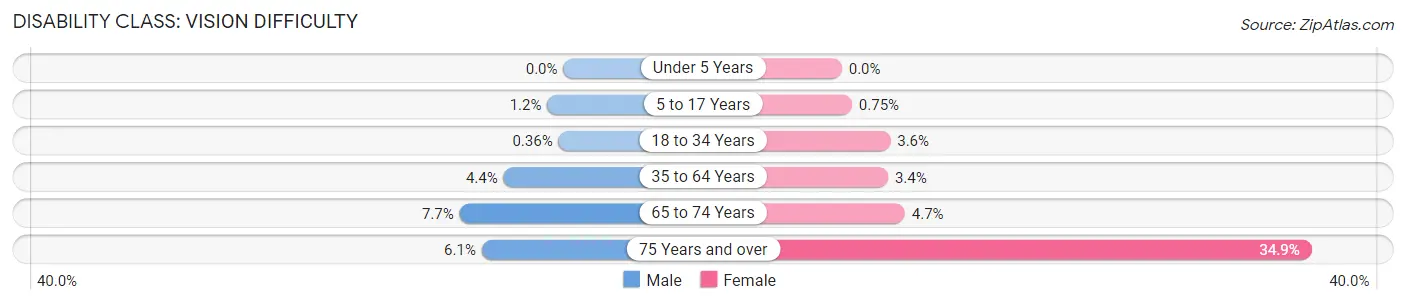
| Age Bracket | Male | Female |
| Under 5 Years | 0 (0.0%) | 0 (0.0%) |
| 5 to 17 Years | 16 (1.2%) | 10 (0.7%) |
| 18 to 34 Years | 5 (0.4%) | 45 (3.6%) |
| 35 to 64 Years | 100 (4.4%) | 79 (3.4%) |
| 65 to 74 Years | 42 (7.7%) | 28 (4.7%) |
| 75 Years and over | 26 (6.1%) | 173 (34.9%) |
Disability Class: Cognitive Difficulty
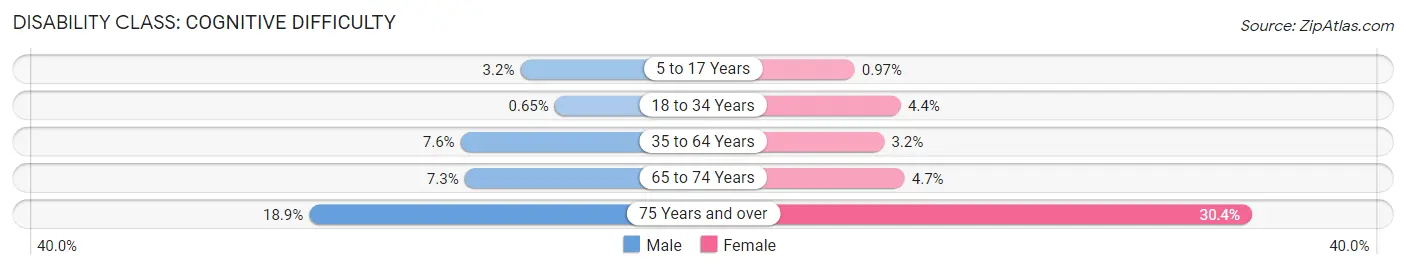
| Age Bracket | Male | Female |
| 5 to 17 Years | 43 (3.2%) | 13 (1.0%) |
| 18 to 34 Years | 9 (0.6%) | 55 (4.4%) |
| 35 to 64 Years | 172 (7.6%) | 73 (3.2%) |
| 65 to 74 Years | 40 (7.3%) | 28 (4.7%) |
| 75 Years and over | 81 (18.9%) | 151 (30.4%) |
Disability Class: Ambulatory Difficulty
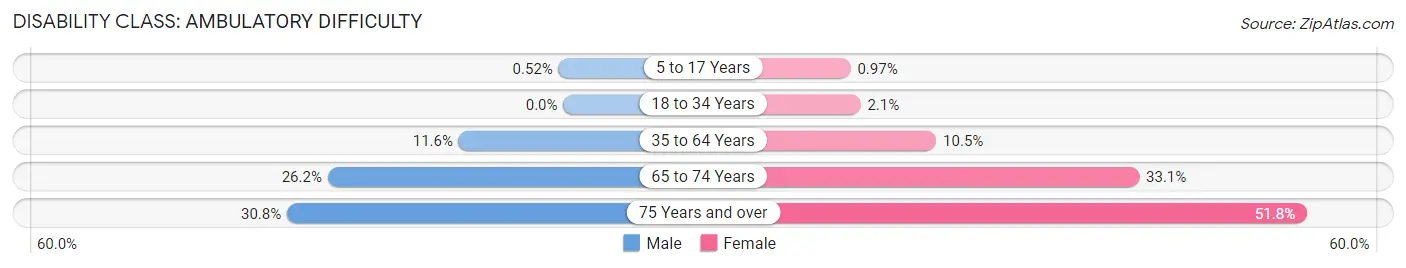
| Age Bracket | Male | Female |
| 5 to 17 Years | 7 (0.5%) | 13 (1.0%) |
| 18 to 34 Years | 0 (0.0%) | 26 (2.1%) |
| 35 to 64 Years | 262 (11.6%) | 242 (10.5%) |
| 65 to 74 Years | 143 (26.2%) | 198 (33.1%) |
| 75 Years and over | 132 (30.8%) | 257 (51.8%) |
Disability Class: Self-Care Difficulty
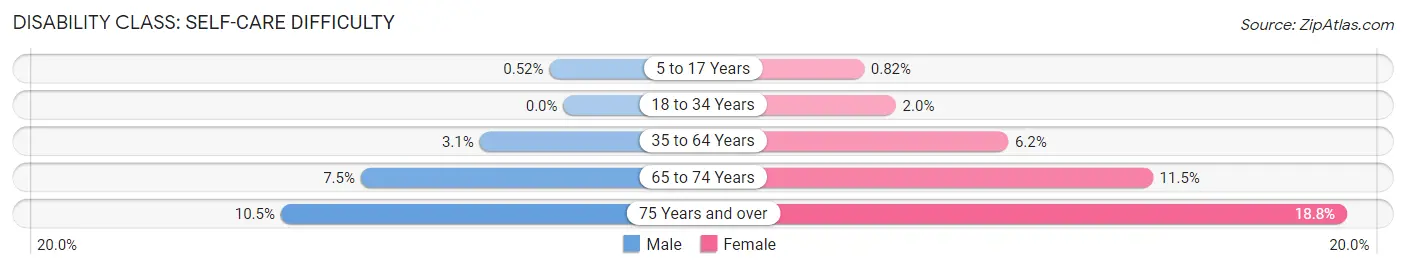
| Age Bracket | Male | Female |
| 5 to 17 Years | 7 (0.5%) | 11 (0.8%) |
| 18 to 34 Years | 0 (0.0%) | 25 (2.0%) |
| 35 to 64 Years | 70 (3.1%) | 142 (6.2%) |
| 65 to 74 Years | 41 (7.5%) | 69 (11.5%) |
| 75 Years and over | 45 (10.5%) | 93 (18.8%) |
Technology Access in Lamb County
Computing Device Access in Lamb County
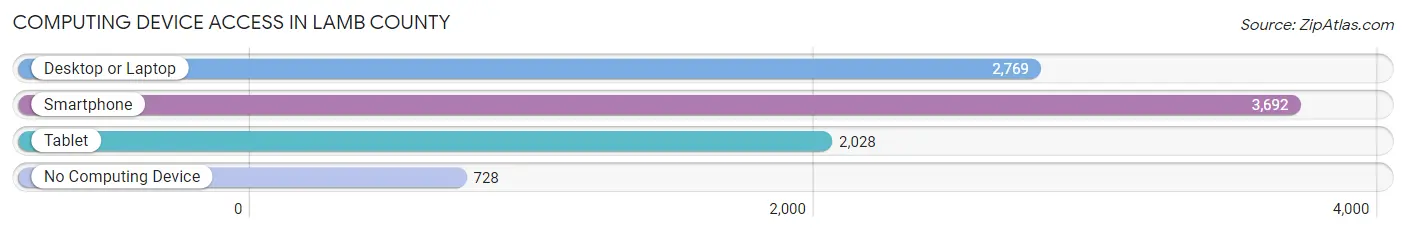
| Device Type | # Households | % Households |
| Desktop or Laptop | 2,769 | 59.8% |
| Smartphone | 3,692 | 79.7% |
| Tablet | 2,028 | 43.8% |
| No Computing Device | 728 | 15.7% |
| Total | 4,632 | 100.0% |
Internet Access in Lamb County
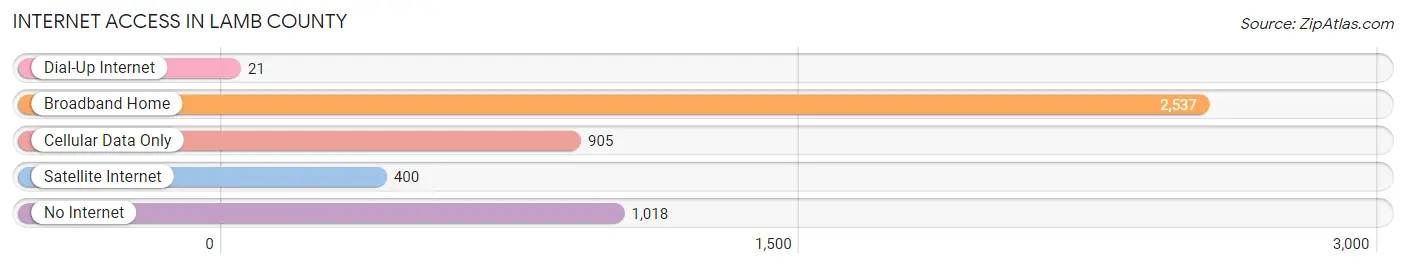
| Internet Type | # Households | % Households |
| Dial-Up Internet | 21 | 0.4% |
| Broadband Home | 2,537 | 54.8% |
| Cellular Data Only | 905 | 19.5% |
| Satellite Internet | 400 | 8.6% |
| No Internet | 1,018 | 22.0% |
| Total | 4,632 | 100.0% |
Lamb County Summary
Lamb County is located in the northwestern part of the state of Texas, and is bordered by Bailey County to the north, Castro County to the east, Hale County to the south, and Parmer County to the west. The county seat is Littlefield, and the county has a total area of 890 square miles. As of the 2010 census, the population was 12,964, making it the second-least populous county in Texas.
Geography
Lamb County is located in the High Plains region of Texas, and is mostly flat with some rolling hills. The terrain is mostly covered in grasslands, with some areas of mesquite and cactus. The county is drained by the Littlefield Draw, which flows through the center of the county. The county is also home to several small lakes, including Lake Littlefield, Lake Ransom, and Lake Merritt.
Climate
Lamb County has a semi-arid climate, with hot summers and mild winters. The average annual temperature is 64°F, and the average annual precipitation is 17.5 inches.
History
Lamb County was established in 1876, and was named for George A. Lamb, a Texas state legislator. The county was originally part of Bexar County, and was later part of Young County before becoming its own county. The county seat was originally located in Springlake, but was moved to Littlefield in 1921.
Economy
Agriculture is the main economic activity in Lamb County, with cotton being the primary crop. Other crops grown in the county include corn, wheat, sorghum, and hay. The county is also home to several oil and gas fields, and there are several wind farms in the area.
Demographics
As of the 2010 census, the population of Lamb County was 12,964, with a population density of 15 people per square mile. The racial makeup of the county was 79.3% White, 0.7% African American, 0.7% Native American, 0.3% Asian, 0.1% Pacific Islander, 16.7% from other races, and 2.1% from two or more races. Hispanic or Latino of any race were 44.2% of the population.
The median income for a household in the county was $31,945, and the median income for a family was $37,917. The per capita income for the county was $15,845. About 18.2% of the population was below the poverty line.
Education
Lamb County is served by the Littlefield Independent School District, which has four elementary schools, one middle school, and one high school. The county is also home to South Plains College, a two-year community college.
Common Questions
What is Per Capita Income in Lamb County?
Per Capita income in Lamb County is $26,687.
What is the Median Family Income in Lamb County?
Median Family Income in Lamb County is $69,626.
What is the Median Household income in Lamb County?
Median Household Income in Lamb County is $54,519.
What is Income or Wage Gap in Lamb County?
Income or Wage Gap in Lamb County is 42.9%.
Women in Lamb County earn 57.1 cents for every dollar earned by a man.
What is Family Income Deficit in Lamb County?
Family Income Deficit in Lamb County is $11,086.
Families that are below poverty line in Lamb County earn $11,086 less on average than the poverty threshold level.
What is Inequality or Gini Index in Lamb County?
Inequality or Gini Index in Lamb County is 0.44.
What is the Total Population of Lamb County?
Total Population of Lamb County is 13,024.
What is the Total Male Population of Lamb County?
Total Male Population of Lamb County is 6,523.
What is the Total Female Population of Lamb County?
Total Female Population of Lamb County is 6,501.
What is the Ratio of Males per 100 Females in Lamb County?
There are 100.34 Males per 100 Females in Lamb County.
What is the Ratio of Females per 100 Males in Lamb County?
There are 99.66 Females per 100 Males in Lamb County.
What is the Median Population Age in Lamb County?
Median Population Age in Lamb County is 36.8 Years.
What is the Average Family Size in Lamb County
Average Family Size in Lamb County is 3.5 People.
What is the Average Household Size in Lamb County
Average Household Size in Lamb County is 2.8 People.
How Large is the Labor Force in Lamb County?
There are 5,719 People in the Labor Forcein in Lamb County.
What is the Percentage of People in the Labor Force in Lamb County?
58.2% of People are in the Labor Force in Lamb County.
What is the Unemployment Rate in Lamb County?
Unemployment Rate in Lamb County is 2.8%.