Lamar County, TX Map & Demographics
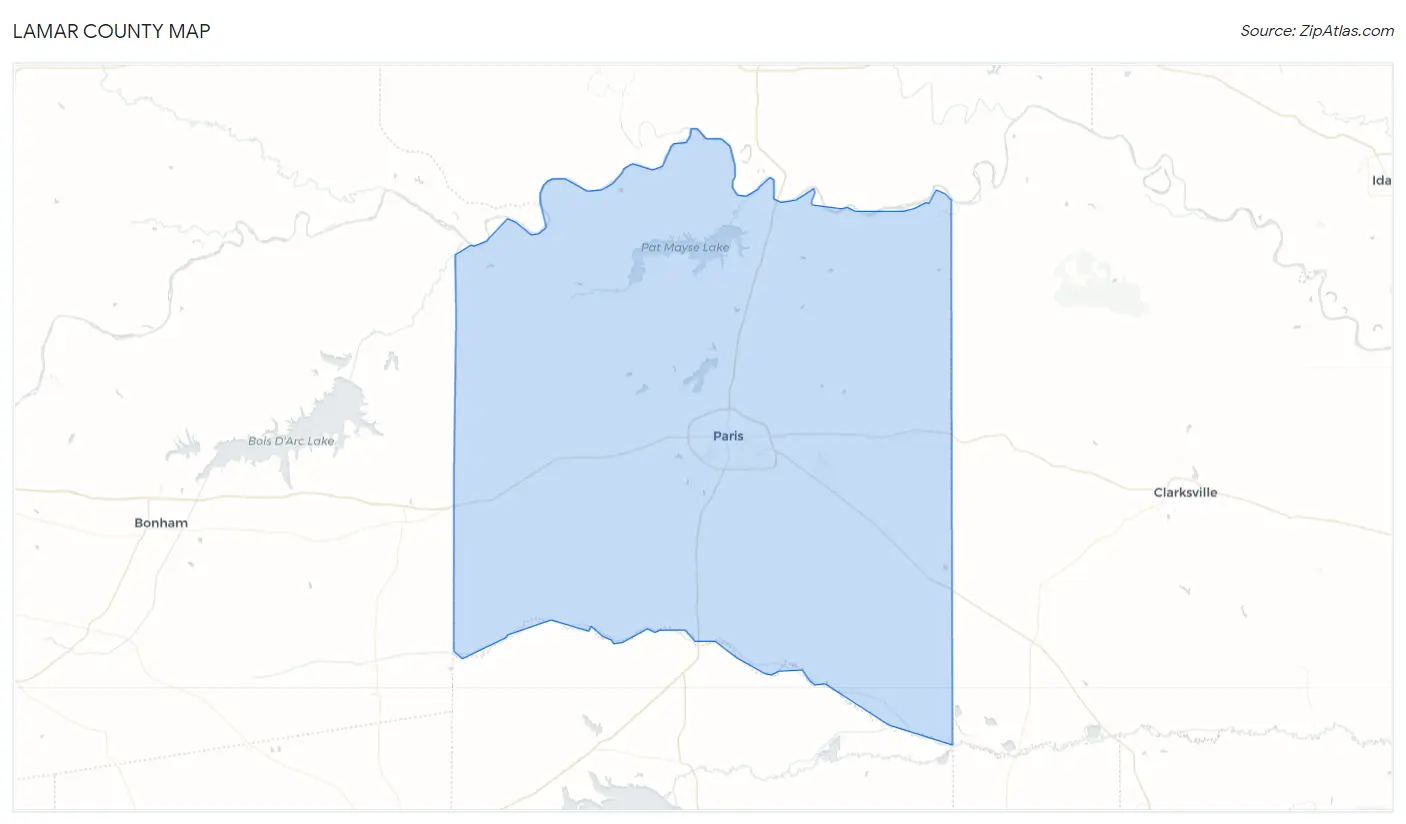
Lamar County Map
Lamar County Overview
$29,888
PER CAPITA INCOME
$71,214
AVG FAMILY INCOME
$58,246
AVG HOUSEHOLD INCOME
32.6%
WAGE / INCOME GAP [ % ]
67.4¢/ $1
WAGE / INCOME GAP [ $ ]
$11,613
FAMILY INCOME DEFICIT
0.46
INEQUALITY / GINI INDEX
50,149
TOTAL POPULATION
24,449
MALE POPULATION
25,700
FEMALE POPULATION
95.13
MALES / 100 FEMALES
105.12
FEMALES / 100 MALES
40.3
MEDIAN AGE
3.0
AVG FAMILY SIZE
2.5
AVG HOUSEHOLD SIZE
23,812
LABOR FORCE [ PEOPLE ]
60.4%
PERCENT IN LABOR FORCE
3.9%
UNEMPLOYMENT RATE
Lamar County Area Codes
Income in Lamar County
Income Overview in Lamar County
Per Capita Income in Lamar County is $29,888, while median incomes of families and households are $71,214 and $58,246 respectively.
| Characteristic | Number | Measure |
| Per Capita Income | 50,149 | $29,888 |
| Median Family Income | 13,700 | $71,214 |
| Mean Family Income | 13,700 | $89,513 |
| Median Household Income | 20,122 | $58,246 |
| Mean Household Income | 20,122 | $73,449 |
| Income Deficit | 13,700 | $11,613 |
| Wage / Income Gap (%) | 50,149 | 32.55% |
| Wage / Income Gap ($) | 50,149 | 67.45¢ per $1 |
| Gini / Inequality Index | 50,149 | 0.46 |
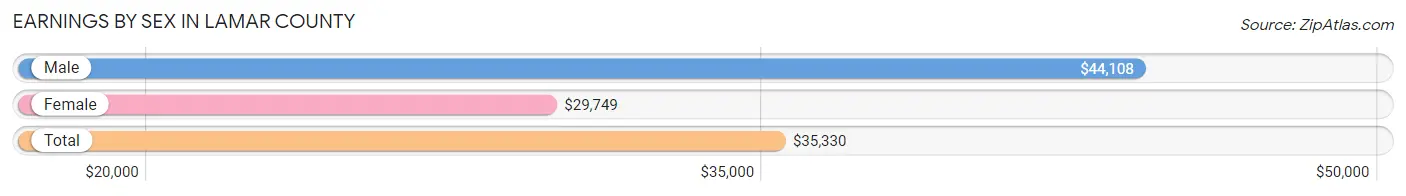
Earnings by Sex in Lamar County
Average Earnings in Lamar County are $35,330, $44,108 for men and $29,749 for women, a difference of 32.6%.
| Sex | Number | Average Earnings |
| Male | 13,065 (52.8%) | $44,108 |
| Female | 11,677 (47.2%) | $29,749 |
| Total | 24,742 (100.0%) | $35,330 |
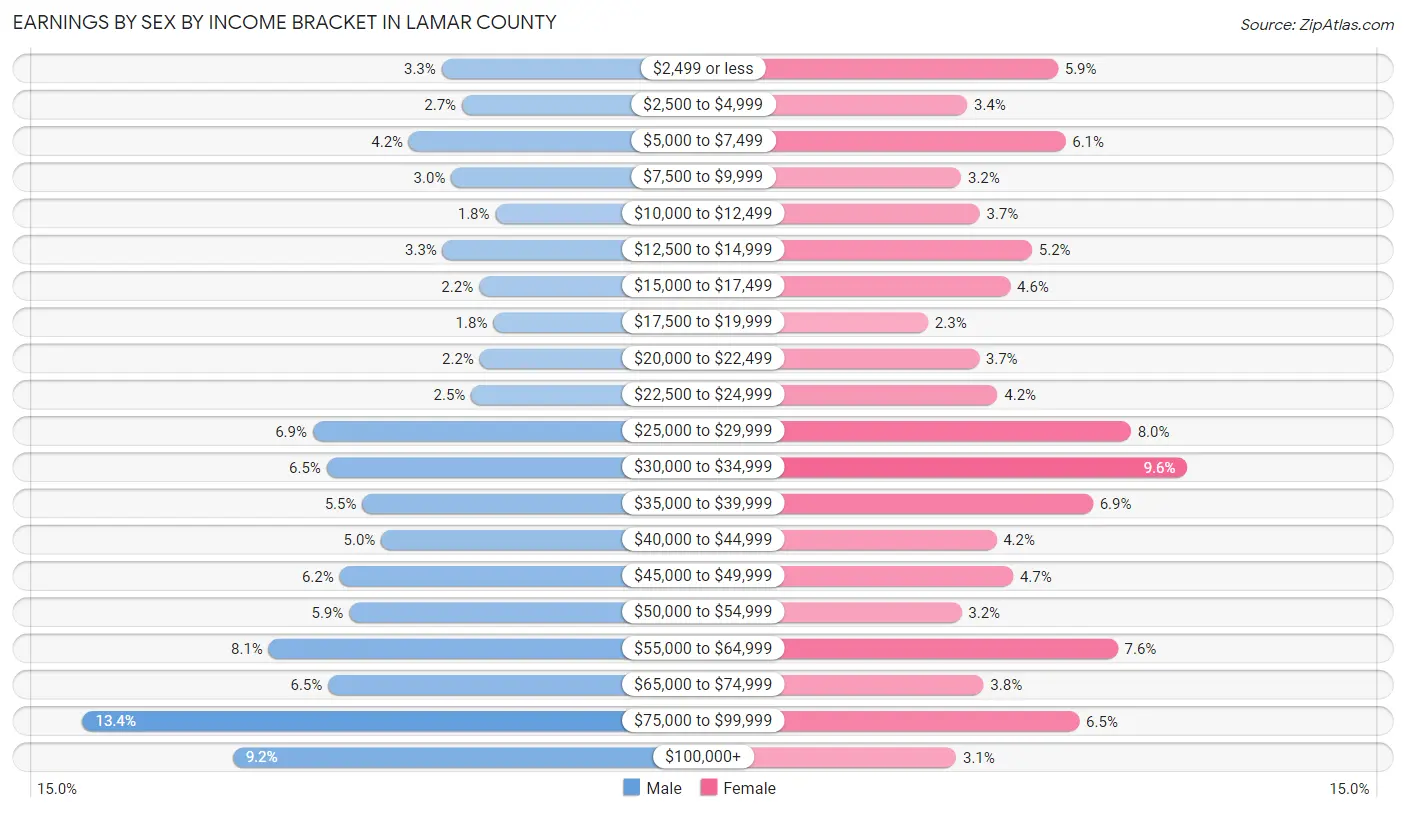
Earnings by Sex by Income Bracket in Lamar County
The most common earnings brackets in Lamar County are $75,000 to $99,999 for men (1,747 | 13.4%) and $30,000 to $34,999 for women (1,117 | 9.6%).
| Income | Male | Female |
| $2,499 or less | 428 (3.3%) | 692 (5.9%) |
| $2,500 to $4,999 | 354 (2.7%) | 395 (3.4%) |
| $5,000 to $7,499 | 549 (4.2%) | 717 (6.1%) |
| $7,500 to $9,999 | 393 (3.0%) | 375 (3.2%) |
| $10,000 to $12,499 | 231 (1.8%) | 436 (3.7%) |
| $12,500 to $14,999 | 425 (3.3%) | 607 (5.2%) |
| $15,000 to $17,499 | 291 (2.2%) | 536 (4.6%) |
| $17,500 to $19,999 | 239 (1.8%) | 266 (2.3%) |
| $20,000 to $22,499 | 289 (2.2%) | 433 (3.7%) |
| $22,500 to $24,999 | 320 (2.5%) | 494 (4.2%) |
| $25,000 to $29,999 | 902 (6.9%) | 932 (8.0%) |
| $30,000 to $34,999 | 851 (6.5%) | 1,117 (9.6%) |
| $35,000 to $39,999 | 720 (5.5%) | 807 (6.9%) |
| $40,000 to $44,999 | 650 (5.0%) | 491 (4.2%) |
| $45,000 to $49,999 | 804 (6.1%) | 545 (4.7%) |
| $50,000 to $54,999 | 768 (5.9%) | 376 (3.2%) |
| $55,000 to $64,999 | 1,063 (8.1%) | 889 (7.6%) |
| $65,000 to $74,999 | 845 (6.5%) | 448 (3.8%) |
| $75,000 to $99,999 | 1,747 (13.4%) | 763 (6.5%) |
| $100,000+ | 1,196 (9.1%) | 358 (3.1%) |
| Total | 13,065 (100.0%) | 11,677 (100.0%) |
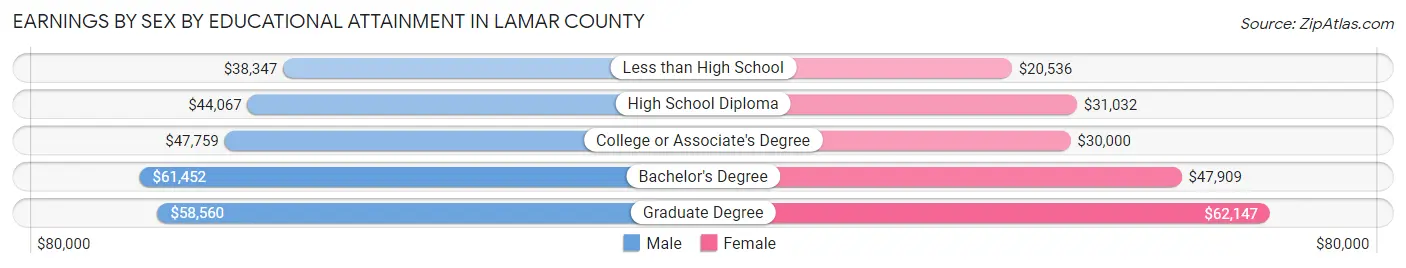
Earnings by Sex by Educational Attainment in Lamar County
Average earnings in Lamar County are $48,194 for men and $32,811 for women, a difference of 31.9%. Men with an educational attainment of bachelor's degree enjoy the highest average annual earnings of $61,452, while those with less than high school education earn the least with $38,347. Women with an educational attainment of graduate degree earn the most with the average annual earnings of $62,147, while those with less than high school education have the smallest earnings of $20,536.
| Educational Attainment | Male Income | Female Income |
| Less than High School | $38,347 | $20,536 |
| High School Diploma | $44,067 | $31,032 |
| College or Associate's Degree | $47,759 | $30,000 |
| Bachelor's Degree | $61,452 | $47,909 |
| Graduate Degree | $58,560 | $62,147 |
| Total | $48,194 | $32,811 |
Family Income in Lamar County
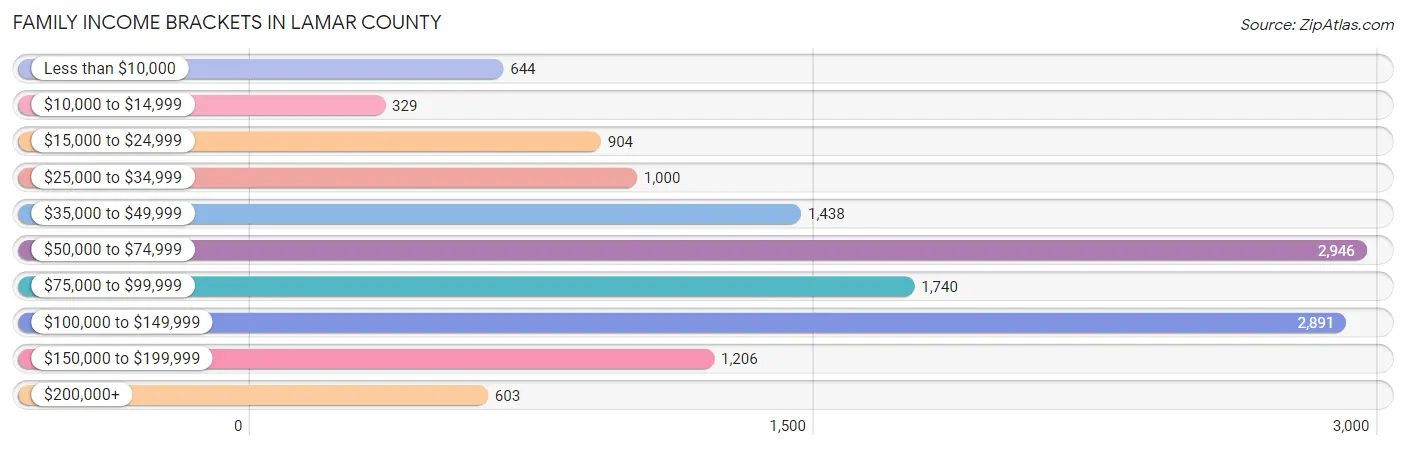
Family Income Brackets in Lamar County
According to the Lamar County family income data, there are 2,946 families falling into the $50,000 to $74,999 income range, which is the most common income bracket and makes up 21.5% of all families. Conversely, the $10,000 to $14,999 income bracket is the least frequent group with only 329 families (2.4%) belonging to this category.
| Income Bracket | # Families | % Families |
| Less than $10,000 | 644 | 4.7% |
| $10,000 to $14,999 | 329 | 2.4% |
| $15,000 to $24,999 | 904 | 6.6% |
| $25,000 to $34,999 | 1,000 | 7.3% |
| $35,000 to $49,999 | 1,438 | 10.5% |
| $50,000 to $74,999 | 2,946 | 21.5% |
| $75,000 to $99,999 | 1,740 | 12.7% |
| $100,000 to $149,999 | 2,891 | 21.1% |
| $150,000 to $199,999 | 1,206 | 8.8% |
| $200,000+ | 603 | 4.4% |
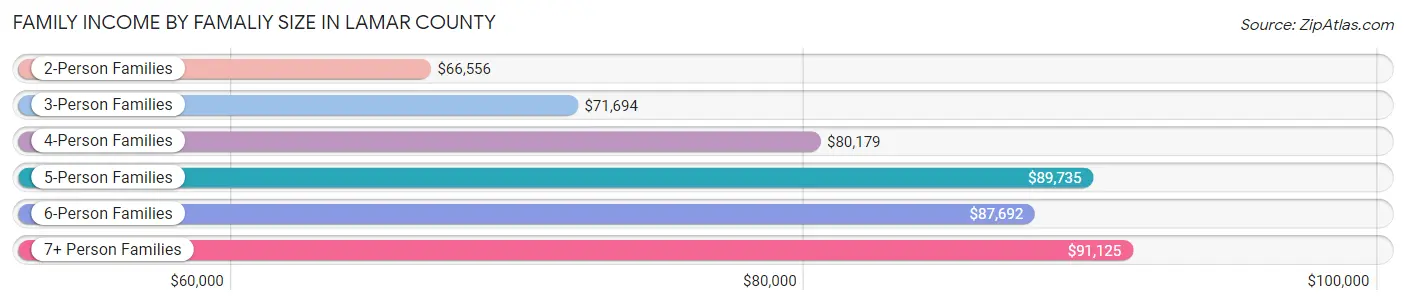
Family Income by Famaliy Size in Lamar County
7+ person families (249 | 1.8%) account for the highest median family income in Lamar County with $91,125 per family, while 2-person families (6,894 | 50.3%) have the highest median income of $33,278 per family member.
| Income Bracket | # Families | Median Income |
| 2-Person Families | 6,894 (50.3%) | $66,556 |
| 3-Person Families | 3,175 (23.2%) | $71,694 |
| 4-Person Families | 1,999 (14.6%) | $80,179 |
| 5-Person Families | 1,117 (8.2%) | $89,735 |
| 6-Person Families | 266 (1.9%) | $87,692 |
| 7+ Person Families | 249 (1.8%) | $91,125 |
| Total | 13,700 (100.0%) | $71,214 |
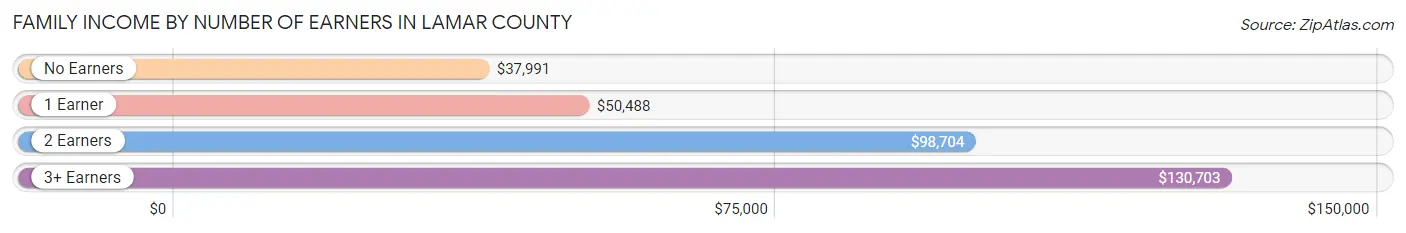
Family Income by Number of Earners in Lamar County
The median family income in Lamar County is $71,214, with families comprising 3+ earners (1,361) having the highest median family income of $130,703, while families with no earners (2,290) have the lowest median family income of $37,991, accounting for 9.9% and 16.7% of families, respectively.
| Number of Earners | # Families | Median Income |
| No Earners | 2,290 (16.7%) | $37,991 |
| 1 Earner | 4,602 (33.6%) | $50,488 |
| 2 Earners | 5,447 (39.8%) | $98,704 |
| 3+ Earners | 1,361 (9.9%) | $130,703 |
| Total | 13,700 (100.0%) | $71,214 |
Household Income in Lamar County
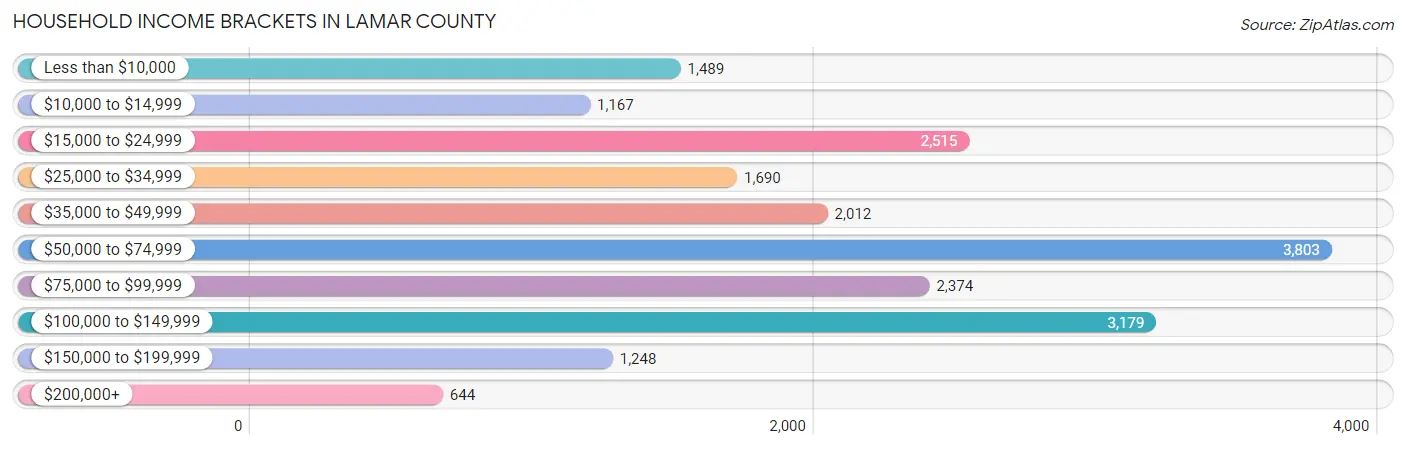
Household Income Brackets in Lamar County
With 3,803 households falling in the category, the $50,000 to $74,999 income range is the most frequent in Lamar County, accounting for 18.9% of all households. In contrast, only 644 households (3.2%) fall into the $200,000+ income bracket, making it the least populous group.
| Income Bracket | # Households | % Households |
| Less than $10,000 | 1,489 | 7.4% |
| $10,000 to $14,999 | 1,167 | 5.8% |
| $15,000 to $24,999 | 2,515 | 12.5% |
| $25,000 to $34,999 | 1,690 | 8.4% |
| $35,000 to $49,999 | 2,012 | 10.0% |
| $50,000 to $74,999 | 3,803 | 18.9% |
| $75,000 to $99,999 | 2,374 | 11.8% |
| $100,000 to $149,999 | 3,179 | 15.8% |
| $150,000 to $199,999 | 1,248 | 6.2% |
| $200,000+ | 644 | 3.2% |
Household Income by Householder Age in Lamar County
The median household income in Lamar County is $58,246, with the highest median household income of $70,448 found in the 45 to 64 years age bracket for the primary householder. A total of 7,010 households (34.8%) fall into this category. Meanwhile, the 15 to 24 years age bracket for the primary householder has the lowest median household income of $26,767, with 505 households (2.5%) in this group.
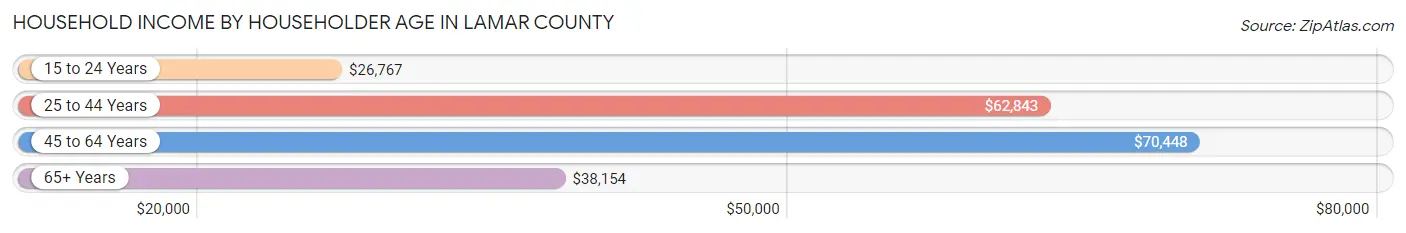
| Income Bracket | # Households | Median Income |
| 15 to 24 Years | 505 (2.5%) | $26,767 |
| 25 to 44 Years | 5,928 (29.5%) | $62,843 |
| 45 to 64 Years | 7,010 (34.8%) | $70,448 |
| 65+ Years | 6,679 (33.2%) | $38,154 |
| Total | 20,122 (100.0%) | $58,246 |
Poverty in Lamar County
Income Below Poverty by Sex and Age in Lamar County
With 14.5% poverty level for males and 17.4% for females among the residents of Lamar County, 5 year old males and 6 to 11 year old females are the most vulnerable to poverty, with 203 males (37.1%) and 438 females (26.6%) in their respective age groups living below the poverty level.
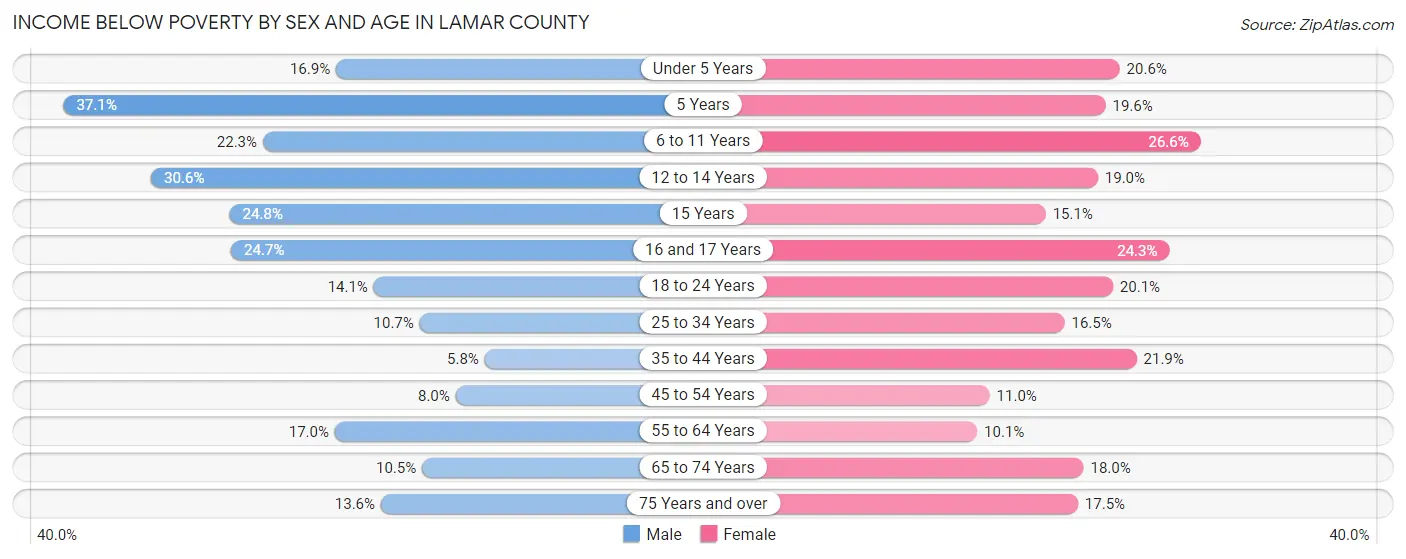
| Age Bracket | Male | Female |
| Under 5 Years | 280 (16.9%) | 319 (20.6%) |
| 5 Years | 203 (37.1%) | 102 (19.6%) |
| 6 to 11 Years | 423 (22.3%) | 438 (26.6%) |
| 12 to 14 Years | 315 (30.6%) | 196 (19.0%) |
| 15 Years | 83 (24.8%) | 68 (15.1%) |
| 16 and 17 Years | 185 (24.7%) | 115 (24.3%) |
| 18 to 24 Years | 250 (14.1%) | 420 (20.1%) |
| 25 to 34 Years | 346 (10.7%) | 504 (16.5%) |
| 35 to 44 Years | 147 (5.8%) | 648 (21.9%) |
| 45 to 54 Years | 246 (8.0%) | 344 (11.0%) |
| 55 to 64 Years | 521 (17.0%) | 331 (10.1%) |
| 65 to 74 Years | 275 (10.5%) | 526 (17.9%) |
| 75 Years and over | 212 (13.6%) | 395 (17.5%) |
| Total | 3,486 (14.5%) | 4,406 (17.4%) |
Income Above Poverty by Sex and Age in Lamar County
According to the poverty statistics in Lamar County, males aged 35 to 44 years and females aged 55 to 64 years are the age groups that are most secure financially, with 94.2% of males and 89.9% of females in these age groups living above the poverty line.
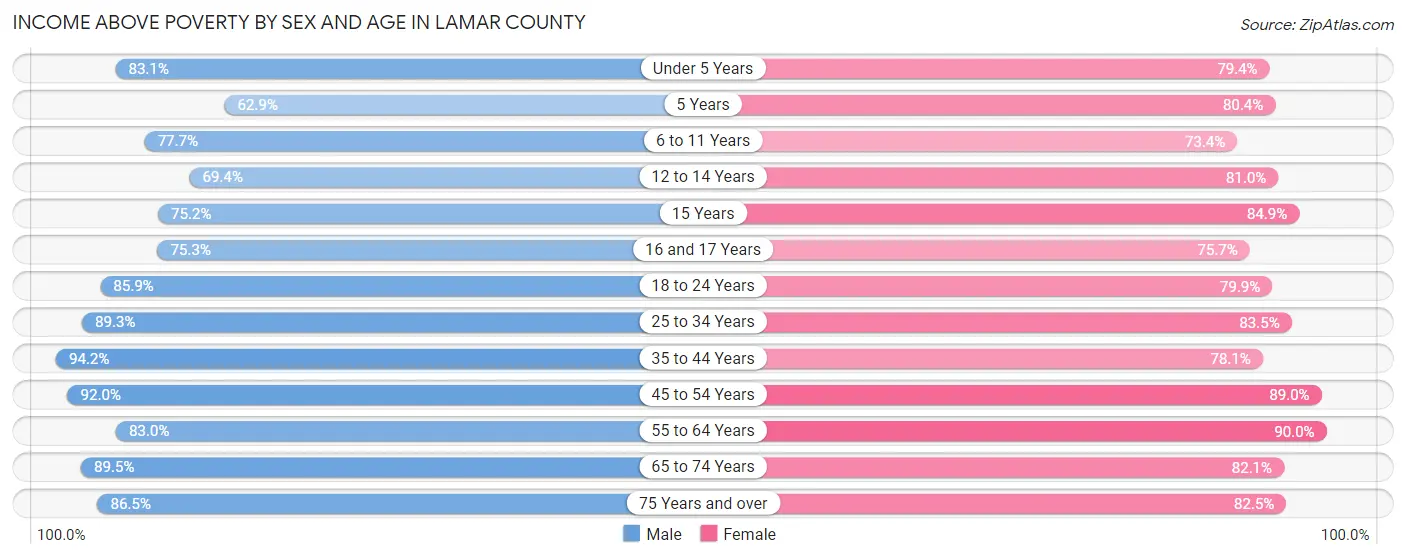
| Age Bracket | Male | Female |
| Under 5 Years | 1,379 (83.1%) | 1,227 (79.4%) |
| 5 Years | 344 (62.9%) | 419 (80.4%) |
| 6 to 11 Years | 1,473 (77.7%) | 1,207 (73.4%) |
| 12 to 14 Years | 714 (69.4%) | 835 (81.0%) |
| 15 Years | 252 (75.2%) | 381 (84.9%) |
| 16 and 17 Years | 565 (75.3%) | 358 (75.7%) |
| 18 to 24 Years | 1,525 (85.9%) | 1,666 (79.9%) |
| 25 to 34 Years | 2,898 (89.3%) | 2,543 (83.5%) |
| 35 to 44 Years | 2,369 (94.2%) | 2,312 (78.1%) |
| 45 to 54 Years | 2,828 (92.0%) | 2,788 (89.0%) |
| 55 to 64 Years | 2,549 (83.0%) | 2,962 (89.9%) |
| 65 to 74 Years | 2,346 (89.5%) | 2,404 (82.1%) |
| 75 Years and over | 1,353 (86.5%) | 1,858 (82.5%) |
| Total | 20,595 (85.5%) | 20,960 (82.6%) |
Income Below Poverty Among Married-Couple Families in Lamar County
The poverty statistics for married-couple families in Lamar County show that 5.3% or 504 of the total 9,418 families live below the poverty line. Families with 5 or more children have the highest poverty rate of 19.6%, comprising of 22 families. On the other hand, families with no children have the lowest poverty rate of 4.8%, which includes 281 families.
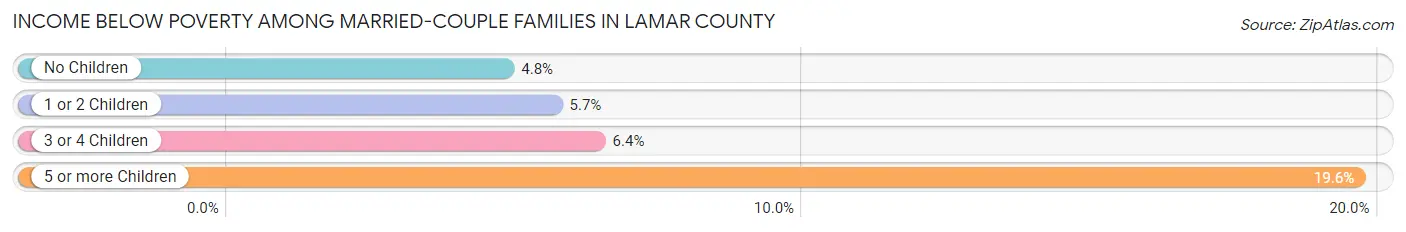
| Children | Above Poverty | Below Poverty |
| No Children | 5,559 (95.2%) | 281 (4.8%) |
| 1 or 2 Children | 2,636 (94.4%) | 158 (5.7%) |
| 3 or 4 Children | 629 (93.6%) | 43 (6.4%) |
| 5 or more Children | 90 (80.4%) | 22 (19.6%) |
| Total | 8,914 (94.7%) | 504 (5.3%) |
Income Below Poverty Among Single-Parent Households in Lamar County
According to the poverty data in Lamar County, 6.8% or 80 single-father households and 35.9% or 1,115 single-mother households are living below the poverty line. Among single-father households, those with 3 or 4 children have the highest poverty rate, with 26 households (28.0%) experiencing poverty. Likewise, among single-mother households, those with 3 or 4 children have the highest poverty rate, with 430 households (74.1%) falling below the poverty line.
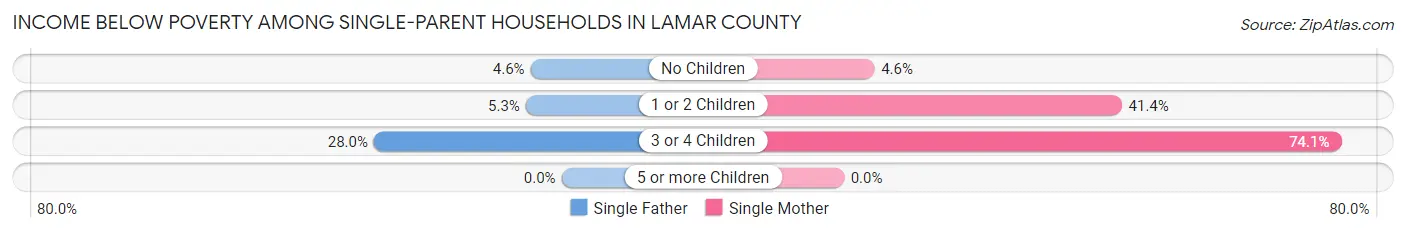
| Children | Single Father | Single Mother |
| No Children | 25 (4.6%) | 43 (4.5%) |
| 1 or 2 Children | 29 (5.3%) | 642 (41.4%) |
| 3 or 4 Children | 26 (28.0%) | 430 (74.1%) |
| 5 or more Children | 0 (0.0%) | 0 (0.0%) |
| Total | 80 (6.8%) | 1,115 (35.9%) |
Income Below Poverty Among Married-Couple vs Single-Parent Households in Lamar County
The poverty data for Lamar County shows that 504 of the married-couple family households (5.3%) and 1,195 of the single-parent households (27.9%) are living below the poverty level. Within the married-couple family households, those with 5 or more children have the highest poverty rate, with 22 households (19.6%) falling below the poverty line. Among the single-parent households, those with 3 or 4 children have the highest poverty rate, with 456 household (67.8%) living below poverty.
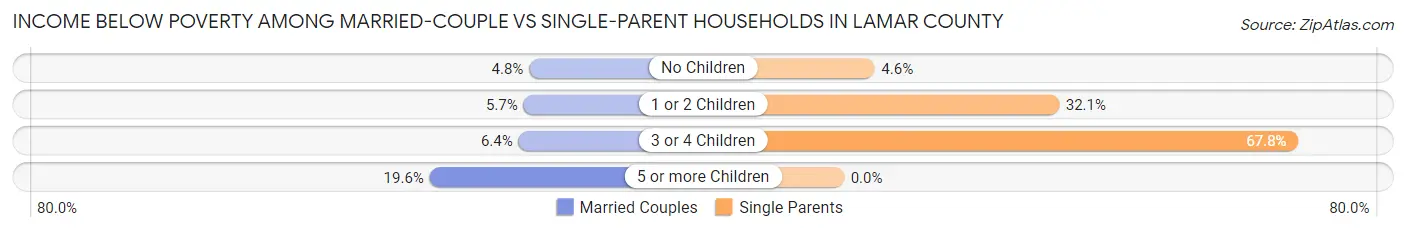
| Children | Married-Couple Families | Single-Parent Households |
| No Children | 281 (4.8%) | 68 (4.6%) |
| 1 or 2 Children | 158 (5.7%) | 671 (32.1%) |
| 3 or 4 Children | 43 (6.4%) | 456 (67.8%) |
| 5 or more Children | 22 (19.6%) | 0 (0.0%) |
| Total | 504 (5.3%) | 1,195 (27.9%) |
Race in Lamar County
The most populous races in Lamar County are White / Caucasian (38,958 | 77.7%), Black / African American (6,380 | 12.7%), and Hispanic or Latino (4,409 | 8.8%).
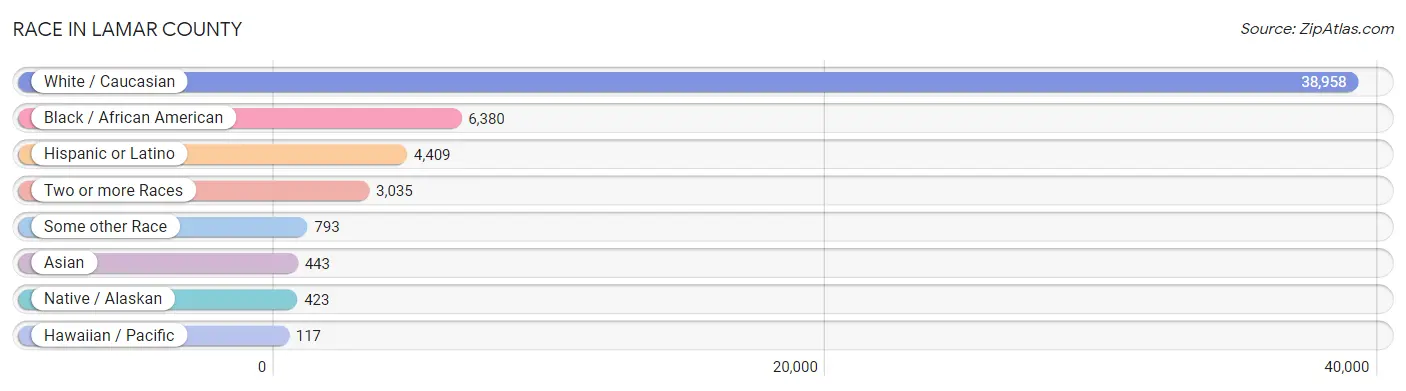
| Race | # Population | % Population |
| Asian | 443 | 0.9% |
| Black / African American | 6,380 | 12.7% |
| Hawaiian / Pacific | 117 | 0.2% |
| Hispanic or Latino | 4,409 | 8.8% |
| Native / Alaskan | 423 | 0.8% |
| White / Caucasian | 38,958 | 77.7% |
| Two or more Races | 3,035 | 6.0% |
| Some other Race | 793 | 1.6% |
| Total | 50,149 | 100.0% |
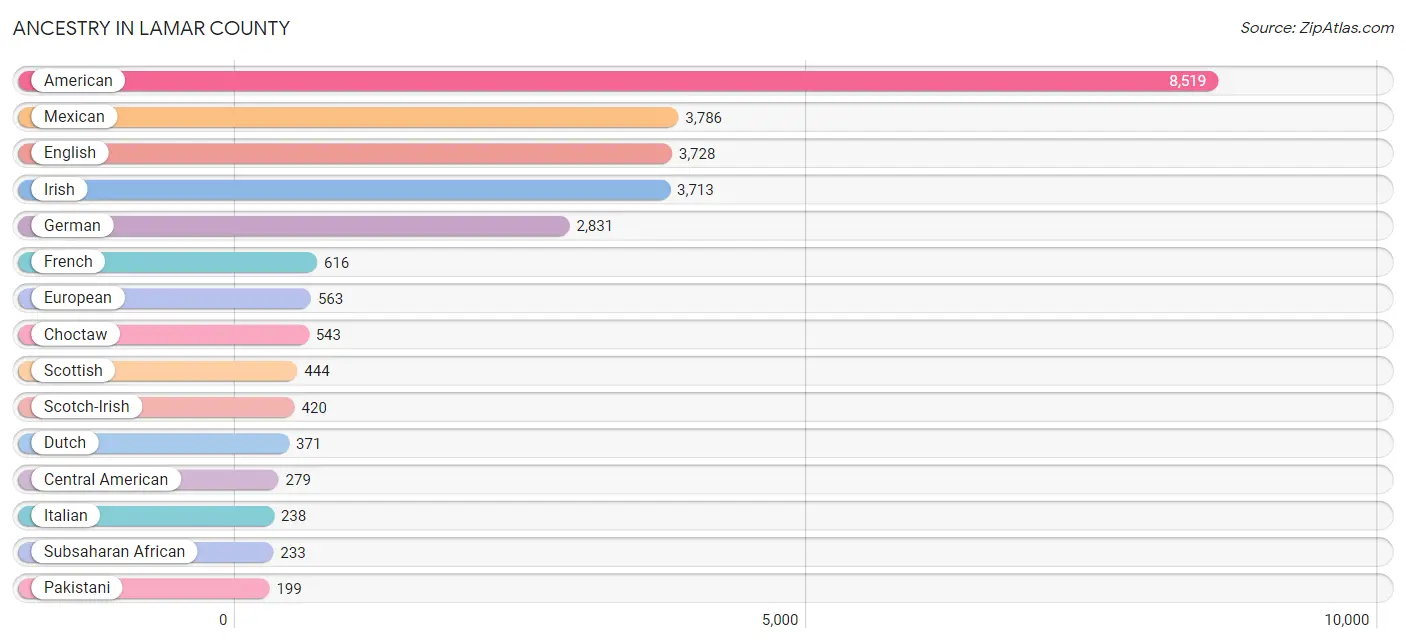
Ancestry in Lamar County
The most populous ancestries reported in Lamar County are American (8,519 | 17.0%), Mexican (3,786 | 7.5%), English (3,728 | 7.4%), Irish (3,713 | 7.4%), and German (2,831 | 5.7%), together accounting for 45.0% of all Lamar County residents.
| Ancestry | # Population | % Population |
| African | 107 | 0.2% |
| American | 8,519 | 17.0% |
| Apache | 27 | 0.1% |
| Arab | 63 | 0.1% |
| Australian | 18 | 0.0% |
| Bhutanese | 44 | 0.1% |
| Blackfeet | 13 | 0.0% |
| Bolivian | 10 | 0.0% |
| British | 94 | 0.2% |
| Bulgarian | 5 | 0.0% |
| Canadian | 192 | 0.4% |
| Central American | 279 | 0.6% |
| Cherokee | 184 | 0.4% |
| Chickasaw | 132 | 0.3% |
| Choctaw | 543 | 1.1% |
| Creek | 42 | 0.1% |
| Croatian | 16 | 0.0% |
| Czech | 51 | 0.1% |
| Czechoslovakian | 37 | 0.1% |
| Danish | 63 | 0.1% |
| Dominican | 3 | 0.0% |
| Dutch | 371 | 0.7% |
| Dutch West Indian | 44 | 0.1% |
| Eastern European | 100 | 0.2% |
| English | 3,728 | 7.4% |
| European | 563 | 1.1% |
| French | 616 | 1.2% |
| French Canadian | 38 | 0.1% |
| German | 2,831 | 5.7% |
| Ghanaian | 27 | 0.1% |
| Greek | 3 | 0.0% |
| Guatemalan | 2 | 0.0% |
| Haitian | 25 | 0.1% |
| Honduran | 186 | 0.4% |
| Houma | 114 | 0.2% |
| Indian (Asian) | 186 | 0.4% |
| Irish | 3,713 | 7.4% |
| Italian | 238 | 0.5% |
| Korean | 123 | 0.3% |
| Lebanese | 9 | 0.0% |
| Mexican | 3,786 | 7.5% |
| Mexican American Indian | 30 | 0.1% |
| Native Hawaiian | 42 | 0.1% |
| Nigerian | 44 | 0.1% |
| Northern European | 49 | 0.1% |
| Norwegian | 154 | 0.3% |
| Ottawa | 14 | 0.0% |
| Pakistani | 199 | 0.4% |
| Palestinian | 54 | 0.1% |
| Panamanian | 87 | 0.2% |
| Pennsylvania German | 191 | 0.4% |
| Polish | 66 | 0.1% |
| Portuguese | 26 | 0.1% |
| Puerto Rican | 71 | 0.1% |
| Russian | 60 | 0.1% |
| Salvadoran | 4 | 0.0% |
| Samoan | 13 | 0.0% |
| Scandinavian | 114 | 0.2% |
| Scotch-Irish | 420 | 0.8% |
| Scottish | 444 | 0.9% |
| South American | 10 | 0.0% |
| Spaniard | 27 | 0.1% |
| Spanish | 37 | 0.1% |
| Sri Lankan | 90 | 0.2% |
| Subsaharan African | 233 | 0.5% |
| Sudanese | 55 | 0.1% |
| Swedish | 148 | 0.3% |
| Swiss | 25 | 0.1% |
| Thai | 46 | 0.1% |
| Ugandan | 55 | 0.1% |
| Ukrainian | 40 | 0.1% |
| Welsh | 105 | 0.2% |
| Yaqui | 6 | 0.0% | View All 73 Rows |
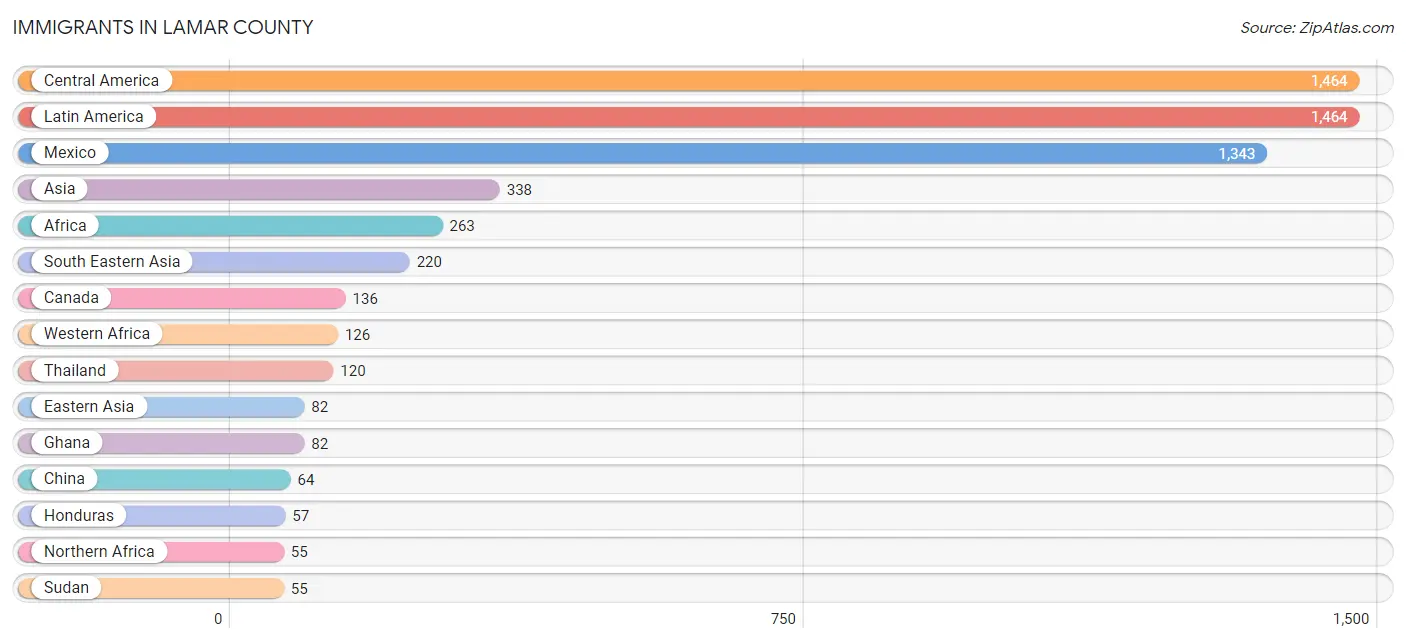
Immigrants in Lamar County
The most numerous immigrant groups reported in Lamar County came from Central America (1,464 | 2.9%), Latin America (1,464 | 2.9%), Mexico (1,343 | 2.7%), Asia (338 | 0.7%), and Africa (263 | 0.5%), together accounting for 9.7% of all Lamar County residents.
| Immigration Origin | # Population | % Population |
| Africa | 263 | 0.5% |
| Asia | 338 | 0.7% |
| Cambodia | 25 | 0.1% |
| Canada | 136 | 0.3% |
| Central America | 1,464 | 2.9% |
| China | 64 | 0.1% |
| Costa Rica | 1 | 0.0% |
| Eastern Asia | 82 | 0.2% |
| El Salvador | 7 | 0.0% |
| England | 20 | 0.0% |
| Europe | 43 | 0.1% |
| Germany | 9 | 0.0% |
| Ghana | 82 | 0.2% |
| Guatemala | 45 | 0.1% |
| Honduras | 57 | 0.1% |
| Japan | 6 | 0.0% |
| Korea | 12 | 0.0% |
| Latin America | 1,464 | 2.9% |
| Lebanon | 9 | 0.0% |
| Mexico | 1,343 | 2.7% |
| Nigeria | 44 | 0.1% |
| Northern Africa | 55 | 0.1% |
| Northern Europe | 34 | 0.1% |
| Panama | 11 | 0.0% |
| Philippines | 50 | 0.1% |
| South Eastern Asia | 220 | 0.4% |
| Sudan | 55 | 0.1% |
| Thailand | 120 | 0.2% |
| Vietnam | 25 | 0.1% |
| Western Africa | 126 | 0.3% |
| Western Asia | 9 | 0.0% |
| Western Europe | 9 | 0.0% | View All 32 Rows |
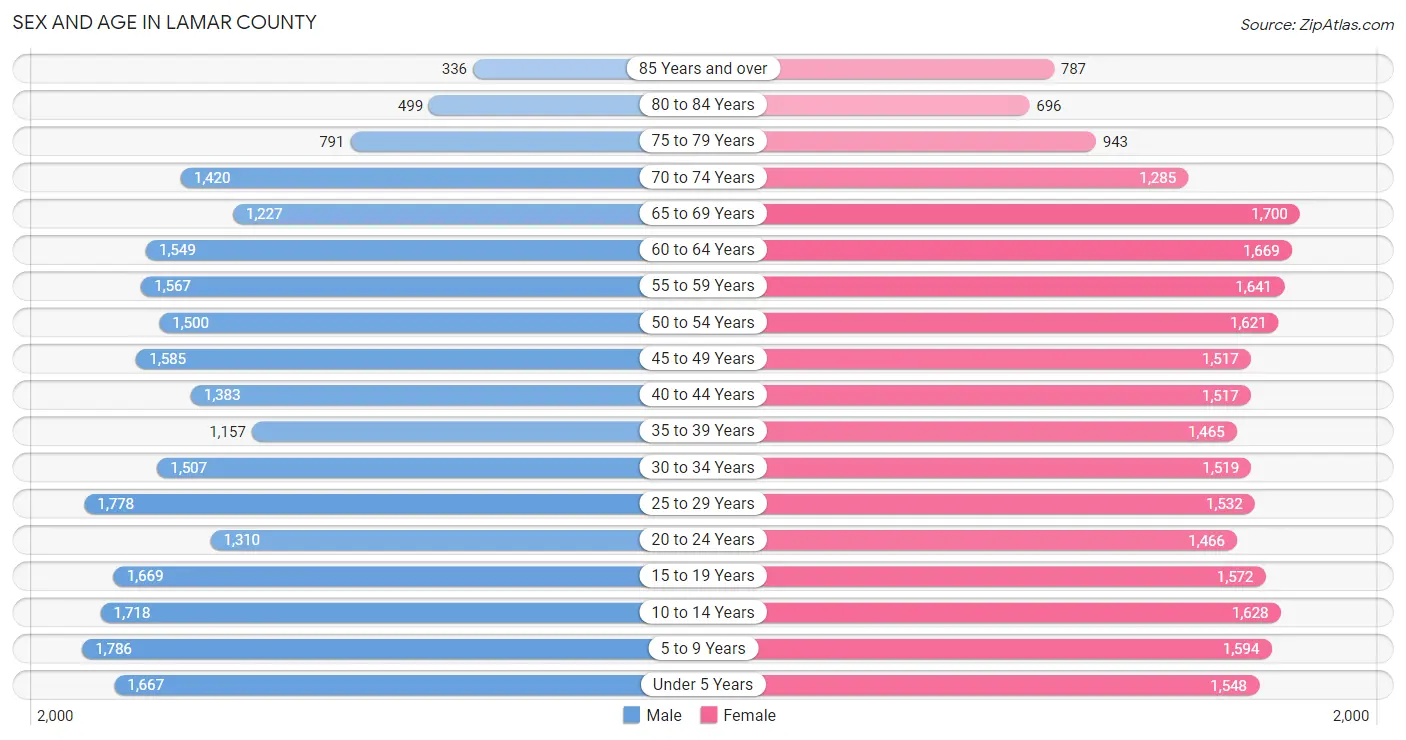
Sex and Age in Lamar County
Sex and Age in Lamar County
The most populous age groups in Lamar County are 5 to 9 Years (1,786 | 7.3%) for men and 65 to 69 Years (1,700 | 6.6%) for women.
| Age Bracket | Male | Female |
| Under 5 Years | 1,667 (6.8%) | 1,548 (6.0%) |
| 5 to 9 Years | 1,786 (7.3%) | 1,594 (6.2%) |
| 10 to 14 Years | 1,718 (7.0%) | 1,628 (6.3%) |
| 15 to 19 Years | 1,669 (6.8%) | 1,572 (6.1%) |
| 20 to 24 Years | 1,310 (5.4%) | 1,466 (5.7%) |
| 25 to 29 Years | 1,778 (7.3%) | 1,532 (6.0%) |
| 30 to 34 Years | 1,507 (6.2%) | 1,519 (5.9%) |
| 35 to 39 Years | 1,157 (4.7%) | 1,465 (5.7%) |
| 40 to 44 Years | 1,383 (5.7%) | 1,517 (5.9%) |
| 45 to 49 Years | 1,585 (6.5%) | 1,517 (5.9%) |
| 50 to 54 Years | 1,500 (6.1%) | 1,621 (6.3%) |
| 55 to 59 Years | 1,567 (6.4%) | 1,641 (6.4%) |
| 60 to 64 Years | 1,549 (6.3%) | 1,669 (6.5%) |
| 65 to 69 Years | 1,227 (5.0%) | 1,700 (6.6%) |
| 70 to 74 Years | 1,420 (5.8%) | 1,285 (5.0%) |
| 75 to 79 Years | 791 (3.2%) | 943 (3.7%) |
| 80 to 84 Years | 499 (2.0%) | 696 (2.7%) |
| 85 Years and over | 336 (1.4%) | 787 (3.1%) |
| Total | 24,449 (100.0%) | 25,700 (100.0%) |
Families and Households in Lamar County
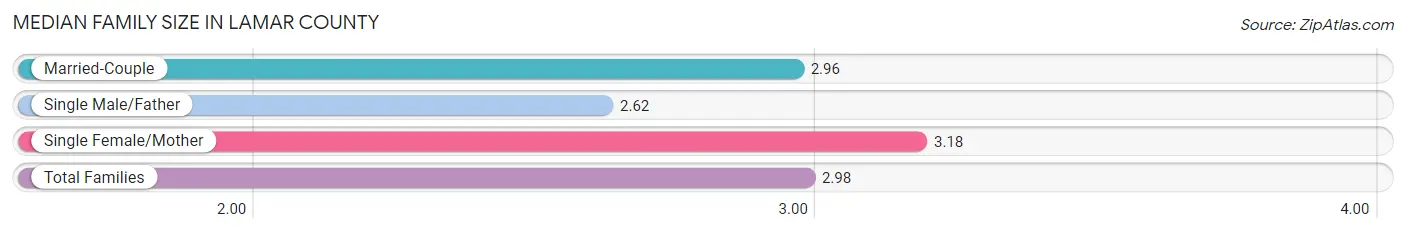
Median Family Size in Lamar County
The median family size in Lamar County is 2.98 persons per family, with single female/mother families (3,106 | 22.7%) accounting for the largest median family size of 3.18 persons per family. On the other hand, single male/father families (1,176 | 8.6%) represent the smallest median family size with 2.62 persons per family.
| Family Type | # Families | Family Size |
| Married-Couple | 9,418 (68.7%) | 2.96 |
| Single Male/Father | 1,176 (8.6%) | 2.62 |
| Single Female/Mother | 3,106 (22.7%) | 3.18 |
| Total Families | 13,700 (100.0%) | 2.98 |
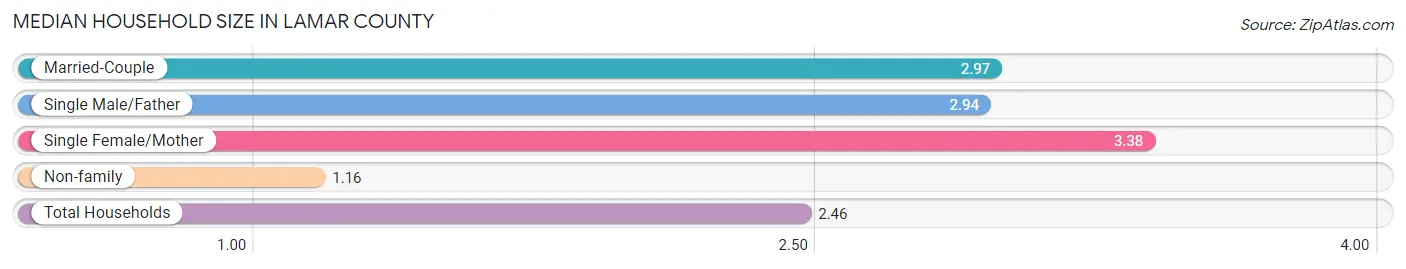
Median Household Size in Lamar County
The median household size in Lamar County is 2.46 persons per household, with single female/mother households (3,106 | 15.4%) accounting for the largest median household size of 3.38 persons per household. non-family households (6,422 | 31.9%) represent the smallest median household size with 1.16 persons per household.
| Household Type | # Households | Household Size |
| Married-Couple | 9,418 (46.8%) | 2.97 |
| Single Male/Father | 1,176 (5.8%) | 2.94 |
| Single Female/Mother | 3,106 (15.4%) | 3.38 |
| Non-family | 6,422 (31.9%) | 1.16 |
| Total Households | 20,122 (100.0%) | 2.46 |
Household Size by Marriage Status in Lamar County
Out of a total of 20,122 households in Lamar County, 13,700 (68.1%) are family households, while 6,422 (31.9%) are nonfamily households. The most numerous type of family households are 2-person households, comprising 6,501, and the most common type of nonfamily households are 1-person households, comprising 5,603.
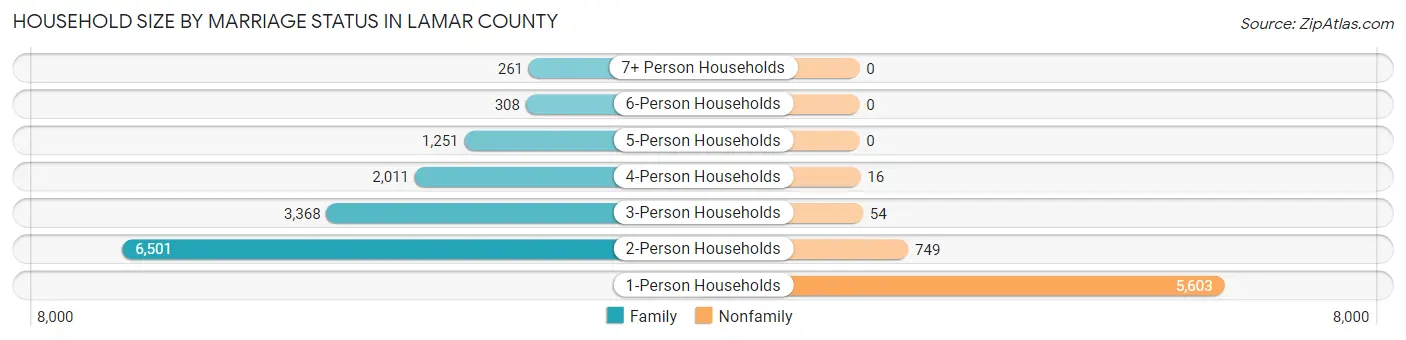
| Household Size | Family Households | Nonfamily Households |
| 1-Person Households | - | 5,603 (27.9%) |
| 2-Person Households | 6,501 (32.3%) | 749 (3.7%) |
| 3-Person Households | 3,368 (16.7%) | 54 (0.3%) |
| 4-Person Households | 2,011 (10.0%) | 16 (0.1%) |
| 5-Person Households | 1,251 (6.2%) | 0 (0.0%) |
| 6-Person Households | 308 (1.5%) | 0 (0.0%) |
| 7+ Person Households | 261 (1.3%) | 0 (0.0%) |
| Total | 13,700 (68.1%) | 6,422 (31.9%) |
Female Fertility in Lamar County
Fertility by Age in Lamar County
Average fertility rate in Lamar County is 65.0 births per 1,000 women. Women in the age bracket of 20 to 34 years have the highest fertility rate with 143.0 births per 1,000 women. Women in the age bracket of 20 to 34 years acount for 91.9% of all women with births.
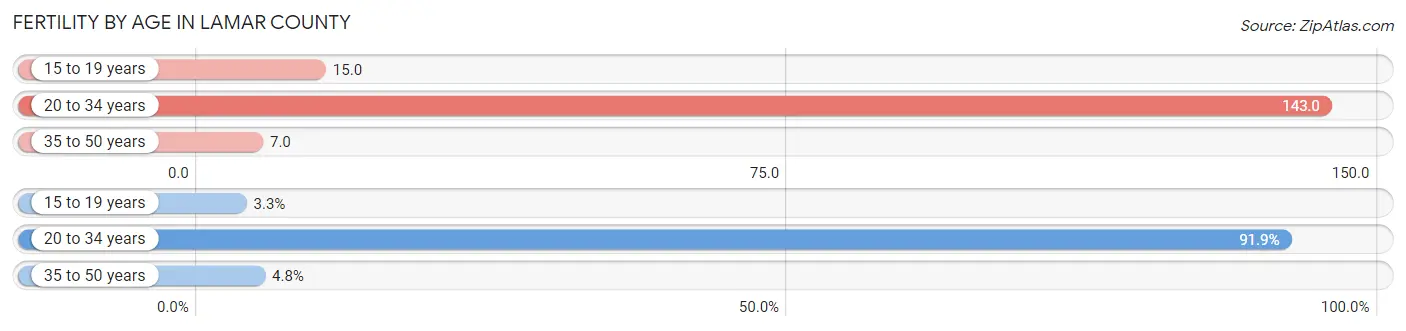
| Age Bracket | Women with Births | Births / 1,000 Women |
| 15 to 19 years | 23 (3.3%) | 15.0 |
| 20 to 34 years | 646 (91.9%) | 143.0 |
| 35 to 50 years | 34 (4.8%) | 7.0 |
| Total | 703 (100.0%) | 65.0 |
Fertility by Age by Marriage Status in Lamar County
64.4% of women with births (703) in Lamar County are married. The highest percentage of unmarried women with births falls into 15 to 19 years age bracket with 100.0% of them unmarried at the time of birth, while the lowest percentage of unmarried women with births belong to 20 to 34 years age bracket with 33.3% of them unmarried.
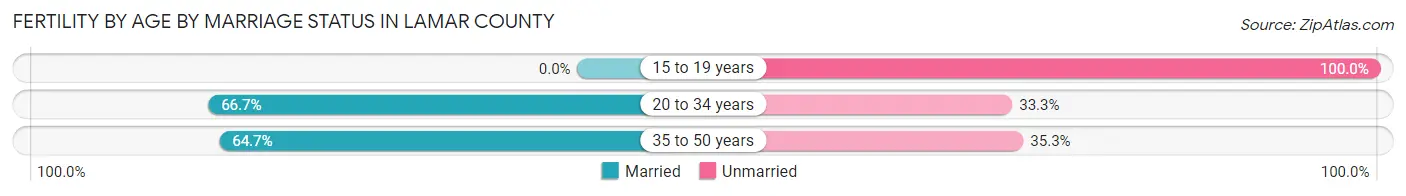
| Age Bracket | Married | Unmarried |
| 15 to 19 years | 0 (0.0%) | 23 (100.0%) |
| 20 to 34 years | 431 (66.7%) | 215 (33.3%) |
| 35 to 50 years | 22 (64.7%) | 12 (35.3%) |
| Total | 453 (64.4%) | 250 (35.6%) |
Fertility by Education in Lamar County
Average fertility rate in Lamar County is 65.0 births per 1,000 women. Women with the education attainment of graduate degree have the highest fertility rate of 111.0 births per 1,000 women, while women with the education attainment of high school diploma have the lowest fertility at 30.0 births per 1,000 women. Women with the education attainment of college or associate's degree represent 55.0% of all women with births.
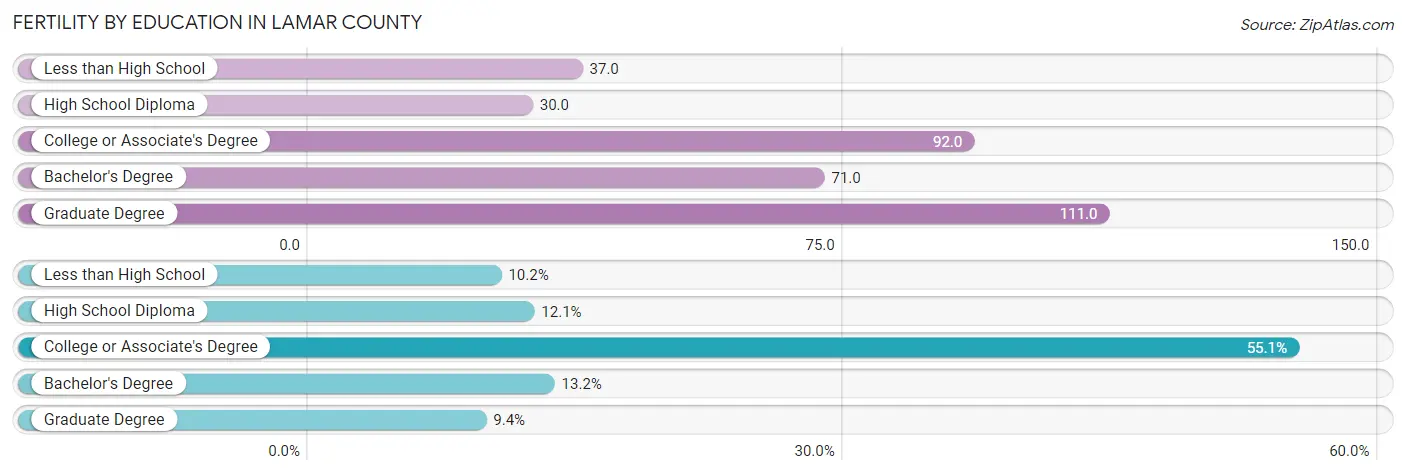
| Educational Attainment | Women with Births | Births / 1,000 Women |
| Less than High School | 72 (10.2%) | 37.0 |
| High School Diploma | 85 (12.1%) | 30.0 |
| College or Associate's Degree | 387 (55.0%) | 92.0 |
| Bachelor's Degree | 93 (13.2%) | 71.0 |
| Graduate Degree | 66 (9.4%) | 111.0 |
| Total | 703 (100.0%) | 65.0 |
Fertility by Education by Marriage Status in Lamar County
35.6% of women with births in Lamar County are unmarried. Women with the educational attainment of bachelor's degree are most likely to be married with 100.0% of them married at childbirth, while women with the educational attainment of high school diploma are least likely to be married with 91.8% of them unmarried at childbirth.
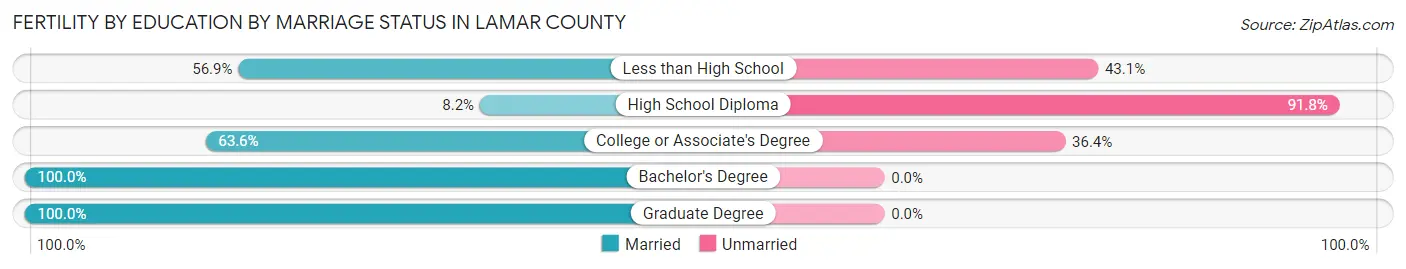
| Educational Attainment | Married | Unmarried |
| Less than High School | 41 (56.9%) | 31 (43.1%) |
| High School Diploma | 7 (8.2%) | 78 (91.8%) |
| College or Associate's Degree | 246 (63.6%) | 141 (36.4%) |
| Bachelor's Degree | 93 (100.0%) | 0 (0.0%) |
| Graduate Degree | 66 (100.0%) | 0 (0.0%) |
| Total | 453 (64.4%) | 250 (35.6%) |
Employment Characteristics in Lamar County
Employment by Class of Employer in Lamar County
Among the 22,572 employed individuals in Lamar County, private company employees (15,560 | 68.9%), local government employees (1,734 | 7.7%), and self-employed (not incorporated) (1,571 | 7.0%) make up the most common classes of employment.
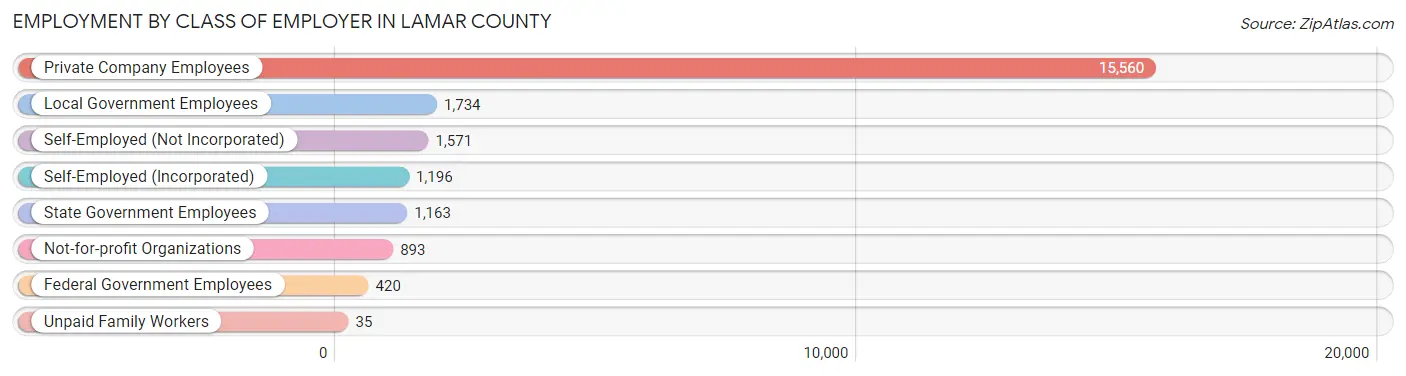
| Employer Class | # Employees | % Employees |
| Private Company Employees | 15,560 | 68.9% |
| Self-Employed (Incorporated) | 1,196 | 5.3% |
| Self-Employed (Not Incorporated) | 1,571 | 7.0% |
| Not-for-profit Organizations | 893 | 4.0% |
| Local Government Employees | 1,734 | 7.7% |
| State Government Employees | 1,163 | 5.1% |
| Federal Government Employees | 420 | 1.9% |
| Unpaid Family Workers | 35 | 0.2% |
| Total | 22,572 | 100.0% |
Employment Status by Age in Lamar County
According to the labor force statistics for Lamar County, out of the total population over 16 years of age (39,424), 60.4% or 23,812 individuals are in the labor force, with 3.9% or 929 of them unemployed. The age group with the highest labor force participation rate is 20 to 24 years, with 85.3% or 2,368 individuals in the labor force. Within the labor force, the 25 to 29 years age range has the highest percentage of unemployed individuals, with 9.0% or 243 of them being unemployed.
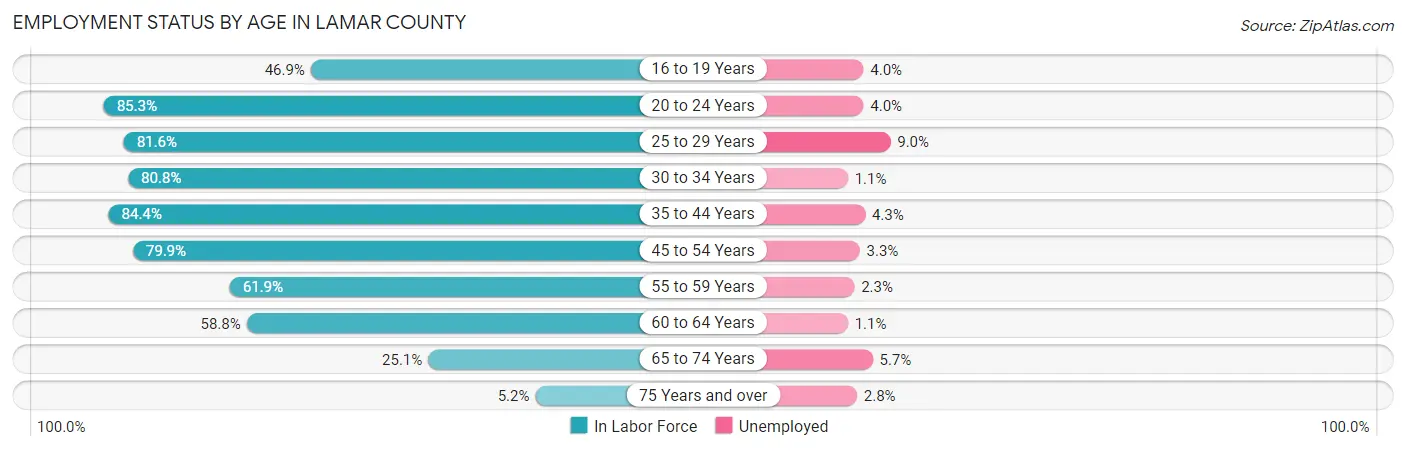
| Age Bracket | In Labor Force | Unemployed |
| 16 to 19 Years | 1,152 (46.9%) | 46 (4.0%) |
| 20 to 24 Years | 2,368 (85.3%) | 95 (4.0%) |
| 25 to 29 Years | 2,701 (81.6%) | 243 (9.0%) |
| 30 to 34 Years | 2,445 (80.8%) | 27 (1.1%) |
| 35 to 44 Years | 4,661 (84.4%) | 200 (4.3%) |
| 45 to 54 Years | 4,972 (79.9%) | 164 (3.3%) |
| 55 to 59 Years | 1,986 (61.9%) | 46 (2.3%) |
| 60 to 64 Years | 1,892 (58.8%) | 21 (1.1%) |
| 65 to 74 Years | 1,414 (25.1%) | 81 (5.7%) |
| 75 Years and over | 211 (5.2%) | 6 (2.8%) |
| Total | 23,812 (60.4%) | 929 (3.9%) |
Employment Status by Educational Attainment in Lamar County
According to labor force statistics for Lamar County, 76.1% of individuals (18,650) out of the total population between 25 and 64 years of age (24,507) are in the labor force, with 3.8% or 709 of them being unemployed. The group with the highest labor force participation rate are those with the educational attainment of bachelor's degree or higher, with 88.0% or 4,338 individuals in the labor force. Within the labor force, individuals with less than high school education have the highest percentage of unemployment, with 5.8% or 97 of them being unemployed.
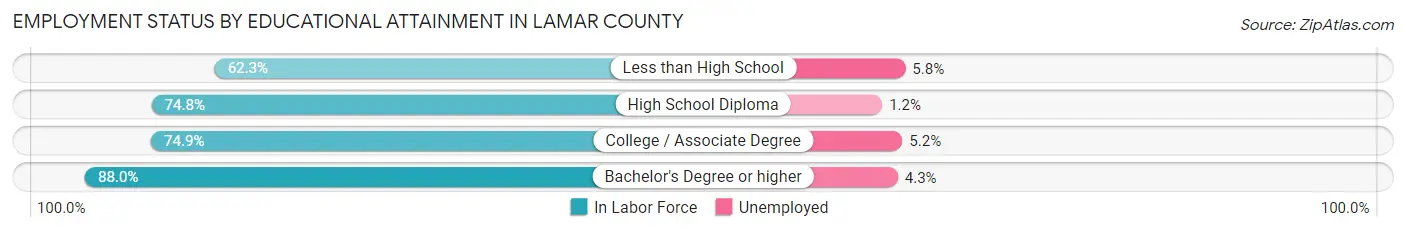
| Educational Attainment | In Labor Force | Unemployed |
| Less than High School | 1,670 (62.3%) | 155 (5.8%) |
| High School Diploma | 6,199 (74.8%) | 99 (1.2%) |
| College / Associate Degree | 6,449 (74.9%) | 448 (5.2%) |
| Bachelor's Degree or higher | 4,338 (88.0%) | 212 (4.3%) |
| Total | 18,650 (76.1%) | 931 (3.8%) |
Employment Occupations by Sex in Lamar County
Management, Business, Science and Arts Occupations
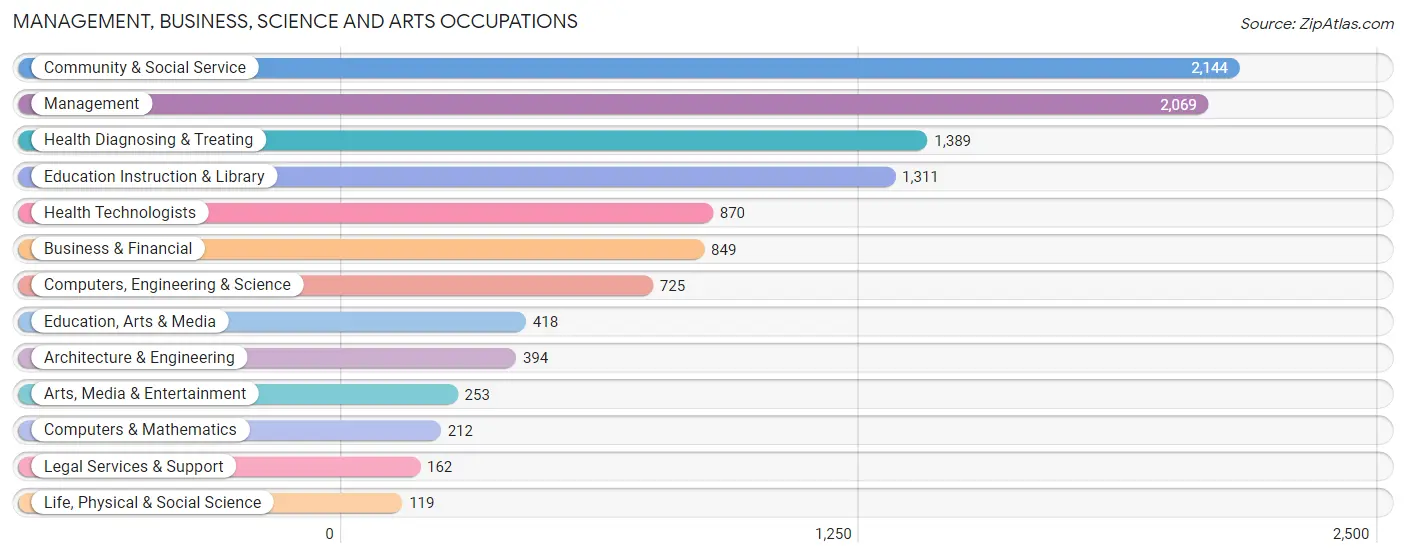
The most common Management, Business, Science and Arts occupations in Lamar County are Community & Social Service (2,144 | 9.4%), Management (2,069 | 9.0%), Health Diagnosing & Treating (1,389 | 6.1%), Education Instruction & Library (1,311 | 5.7%), and Health Technologists (870 | 3.8%).
Management, Business, Science and Arts Occupations by Sex
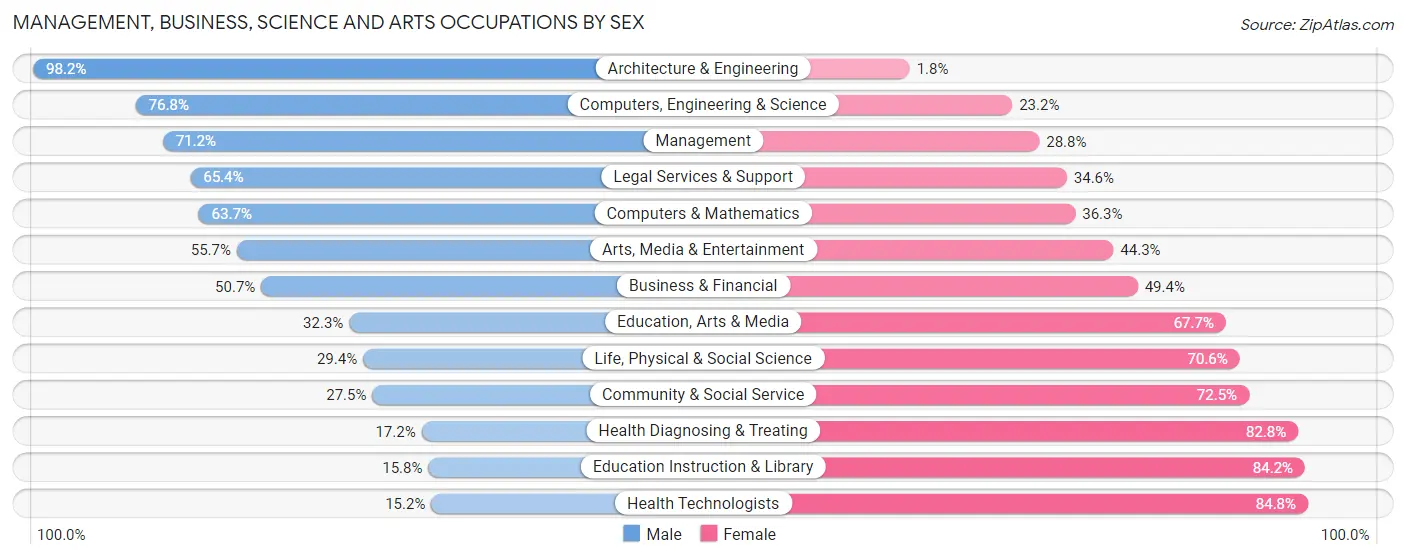
Within the Management, Business, Science and Arts occupations in Lamar County, the most male-oriented occupations are Architecture & Engineering (98.2%), Computers, Engineering & Science (76.8%), and Management (71.2%), while the most female-oriented occupations are Health Technologists (84.8%), Education Instruction & Library (84.2%), and Health Diagnosing & Treating (82.8%).
| Occupation | Male | Female |
| Management | 1,473 (71.2%) | 596 (28.8%) |
| Business & Financial | 430 (50.6%) | 419 (49.3%) |
| Computers, Engineering & Science | 557 (76.8%) | 168 (23.2%) |
| Computers & Mathematics | 135 (63.7%) | 77 (36.3%) |
| Architecture & Engineering | 387 (98.2%) | 7 (1.8%) |
| Life, Physical & Social Science | 35 (29.4%) | 84 (70.6%) |
| Community & Social Service | 589 (27.5%) | 1,555 (72.5%) |
| Education, Arts & Media | 135 (32.3%) | 283 (67.7%) |
| Legal Services & Support | 106 (65.4%) | 56 (34.6%) |
| Education Instruction & Library | 207 (15.8%) | 1,104 (84.2%) |
| Arts, Media & Entertainment | 141 (55.7%) | 112 (44.3%) |
| Health Diagnosing & Treating | 239 (17.2%) | 1,150 (82.8%) |
| Health Technologists | 132 (15.2%) | 738 (84.8%) |
| Total (Category) | 3,288 (45.8%) | 3,888 (54.2%) |
| Total (Overall) | 12,074 (52.8%) | 10,805 (47.2%) |
Services Occupations
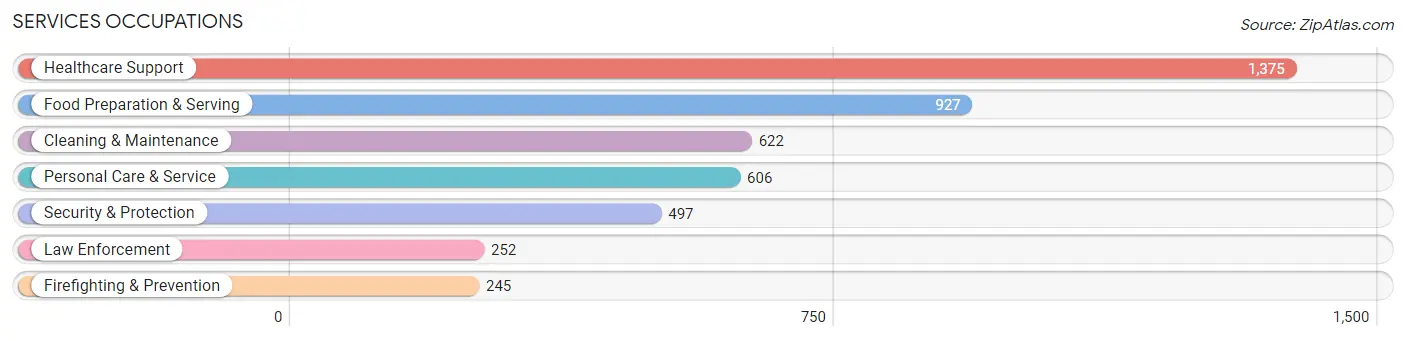
The most common Services occupations in Lamar County are Healthcare Support (1,375 | 6.0%), Food Preparation & Serving (927 | 4.1%), Cleaning & Maintenance (622 | 2.7%), Personal Care & Service (606 | 2.6%), and Security & Protection (497 | 2.2%).
Services Occupations by Sex
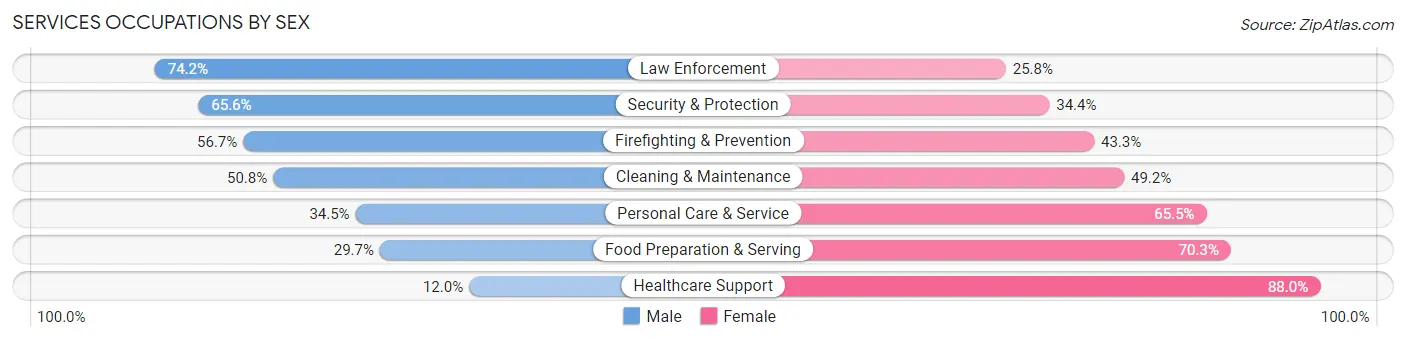
Within the Services occupations in Lamar County, the most male-oriented occupations are Law Enforcement (74.2%), Security & Protection (65.6%), and Firefighting & Prevention (56.7%), while the most female-oriented occupations are Healthcare Support (88.0%), Food Preparation & Serving (70.3%), and Personal Care & Service (65.5%).
| Occupation | Male | Female |
| Healthcare Support | 165 (12.0%) | 1,210 (88.0%) |
| Security & Protection | 326 (65.6%) | 171 (34.4%) |
| Firefighting & Prevention | 139 (56.7%) | 106 (43.3%) |
| Law Enforcement | 187 (74.2%) | 65 (25.8%) |
| Food Preparation & Serving | 275 (29.7%) | 652 (70.3%) |
| Cleaning & Maintenance | 316 (50.8%) | 306 (49.2%) |
| Personal Care & Service | 209 (34.5%) | 397 (65.5%) |
| Total (Category) | 1,291 (32.1%) | 2,736 (67.9%) |
| Total (Overall) | 12,074 (52.8%) | 10,805 (47.2%) |
Sales and Office Occupations
The most common Sales and Office occupations in Lamar County are Sales & Related (2,403 | 10.5%), and Office & Administration (2,148 | 9.4%).

Sales and Office Occupations by Sex

| Occupation | Male | Female |
| Sales & Related | 1,219 (50.7%) | 1,184 (49.3%) |
| Office & Administration | 248 (11.6%) | 1,900 (88.4%) |
| Total (Category) | 1,467 (32.2%) | 3,084 (67.8%) |
| Total (Overall) | 12,074 (52.8%) | 10,805 (47.2%) |
Natural Resources, Construction and Maintenance Occupations
The most common Natural Resources, Construction and Maintenance occupations in Lamar County are Construction & Extraction (1,397 | 6.1%), Installation, Maintenance & Repair (1,155 | 5.1%), and Farming, Fishing & Forestry (447 | 1.9%).
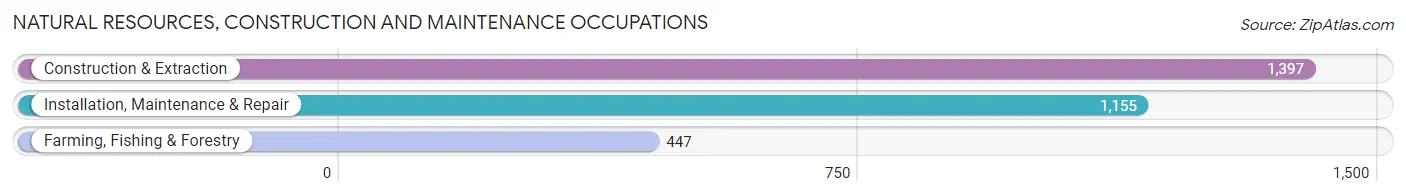
Natural Resources, Construction and Maintenance Occupations by Sex
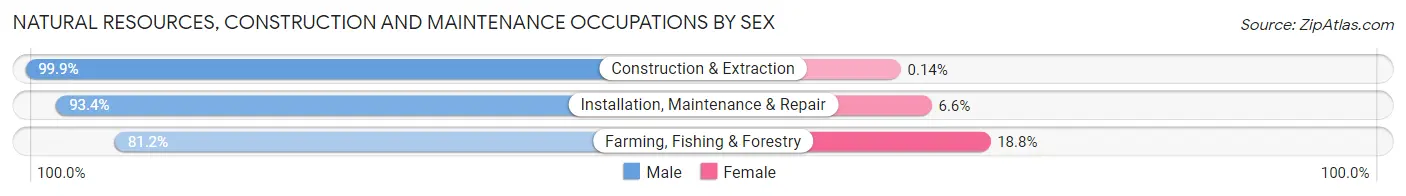
| Occupation | Male | Female |
| Farming, Fishing & Forestry | 363 (81.2%) | 84 (18.8%) |
| Construction & Extraction | 1,395 (99.9%) | 2 (0.1%) |
| Installation, Maintenance & Repair | 1,079 (93.4%) | 76 (6.6%) |
| Total (Category) | 2,837 (94.6%) | 162 (5.4%) |
| Total (Overall) | 12,074 (52.8%) | 10,805 (47.2%) |
Production, Transportation and Moving Occupations
The most common Production, Transportation and Moving occupations in Lamar County are Production (1,816 | 7.9%), Material Moving (1,162 | 5.1%), and Transportation (1,148 | 5.0%).
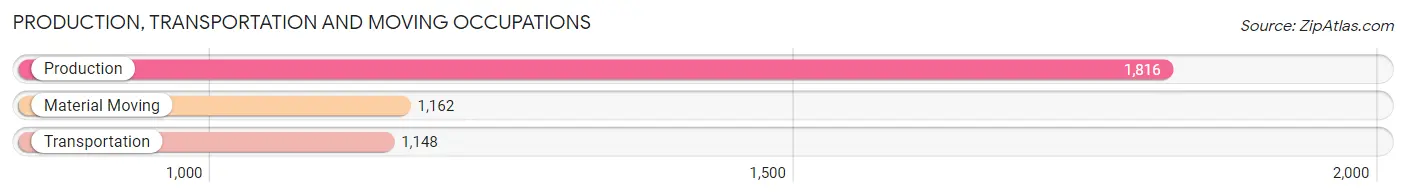
Production, Transportation and Moving Occupations by Sex
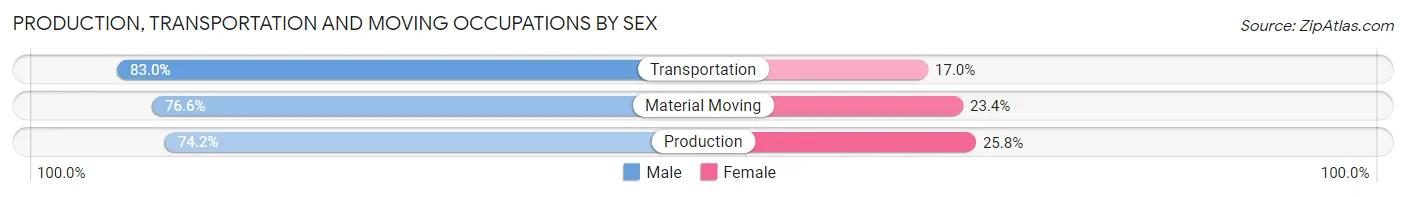
| Occupation | Male | Female |
| Production | 1,348 (74.2%) | 468 (25.8%) |
| Transportation | 953 (83.0%) | 195 (17.0%) |
| Material Moving | 890 (76.6%) | 272 (23.4%) |
| Total (Category) | 3,191 (77.3%) | 935 (22.7%) |
| Total (Overall) | 12,074 (52.8%) | 10,805 (47.2%) |
Employment Industries by Sex in Lamar County
Employment Industries in Lamar County
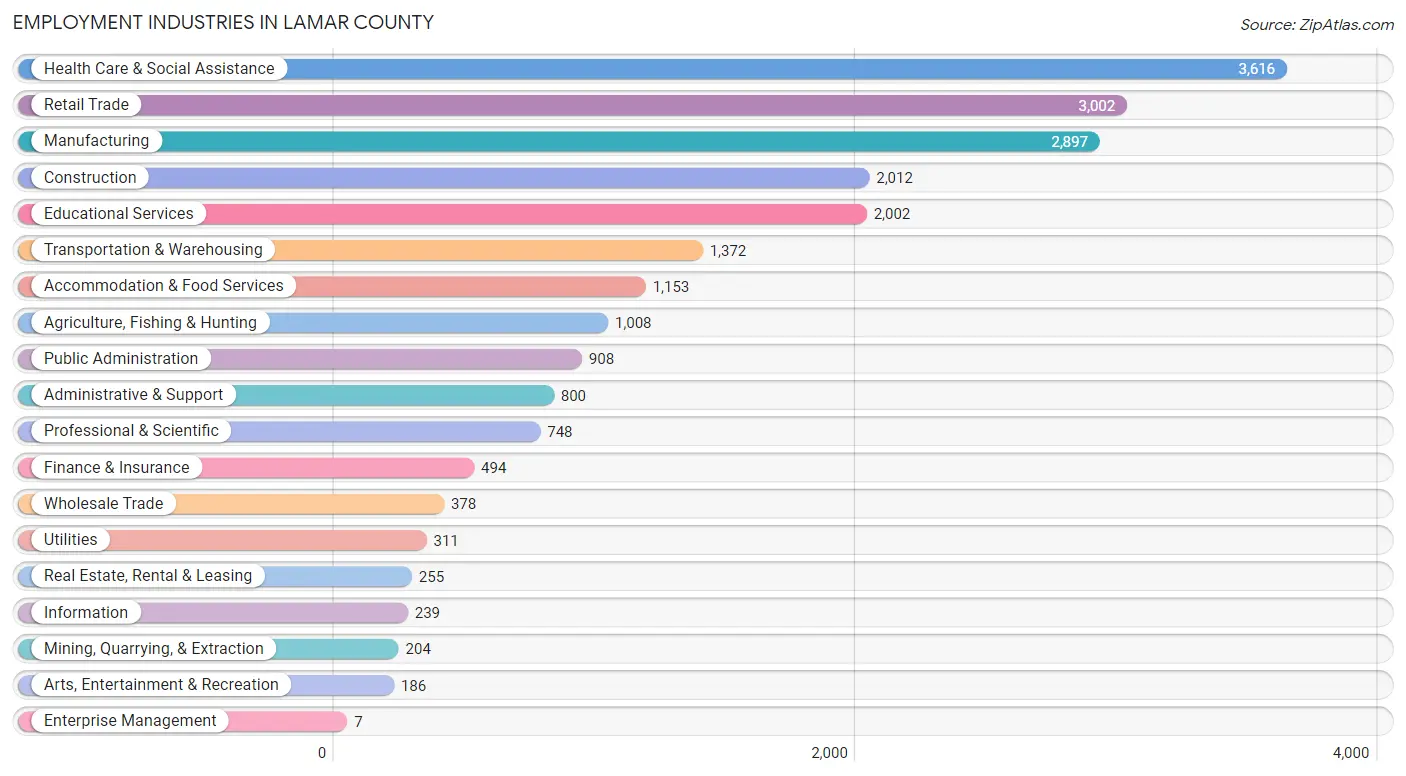
The major employment industries in Lamar County include Health Care & Social Assistance (3,616 | 15.8%), Retail Trade (3,002 | 13.1%), Manufacturing (2,897 | 12.7%), Construction (2,012 | 8.8%), and Educational Services (2,002 | 8.7%).
Employment Industries by Sex in Lamar County
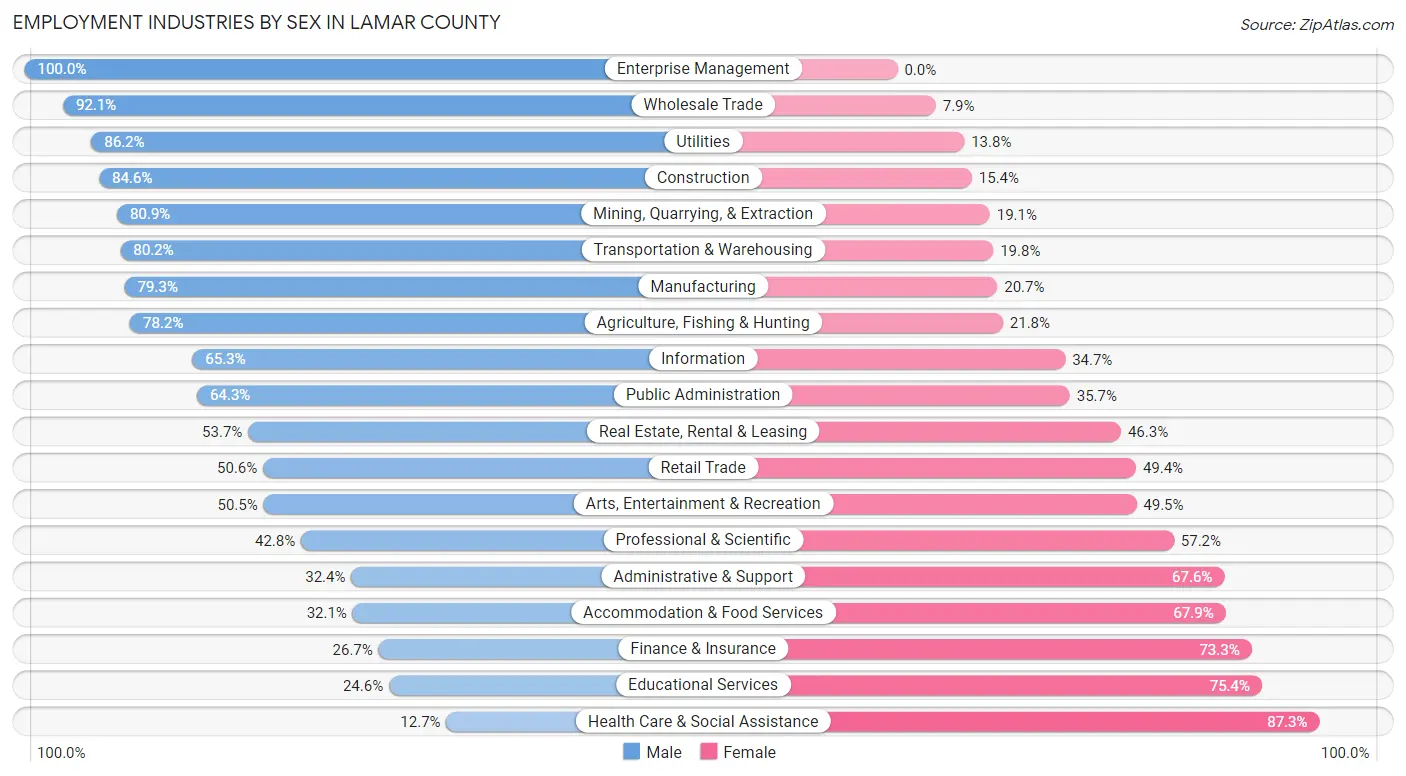
The Lamar County industries that see more men than women are Enterprise Management (100.0%), Wholesale Trade (92.1%), and Utilities (86.2%), whereas the industries that tend to have a higher number of women are Health Care & Social Assistance (87.3%), Educational Services (75.4%), and Finance & Insurance (73.3%).
| Industry | Male | Female |
| Agriculture, Fishing & Hunting | 788 (78.2%) | 220 (21.8%) |
| Mining, Quarrying, & Extraction | 165 (80.9%) | 39 (19.1%) |
| Construction | 1,702 (84.6%) | 310 (15.4%) |
| Manufacturing | 2,298 (79.3%) | 599 (20.7%) |
| Wholesale Trade | 348 (92.1%) | 30 (7.9%) |
| Retail Trade | 1,520 (50.6%) | 1,482 (49.4%) |
| Transportation & Warehousing | 1,100 (80.2%) | 272 (19.8%) |
| Utilities | 268 (86.2%) | 43 (13.8%) |
| Information | 156 (65.3%) | 83 (34.7%) |
| Finance & Insurance | 132 (26.7%) | 362 (73.3%) |
| Real Estate, Rental & Leasing | 137 (53.7%) | 118 (46.3%) |
| Professional & Scientific | 320 (42.8%) | 428 (57.2%) |
| Enterprise Management | 7 (100.0%) | 0 (0.0%) |
| Administrative & Support | 259 (32.4%) | 541 (67.6%) |
| Educational Services | 492 (24.6%) | 1,510 (75.4%) |
| Health Care & Social Assistance | 459 (12.7%) | 3,157 (87.3%) |
| Arts, Entertainment & Recreation | 94 (50.5%) | 92 (49.5%) |
| Accommodation & Food Services | 370 (32.1%) | 783 (67.9%) |
| Public Administration | 584 (64.3%) | 324 (35.7%) |
| Total | 12,074 (52.8%) | 10,805 (47.2%) |
Education in Lamar County
School Enrollment in Lamar County
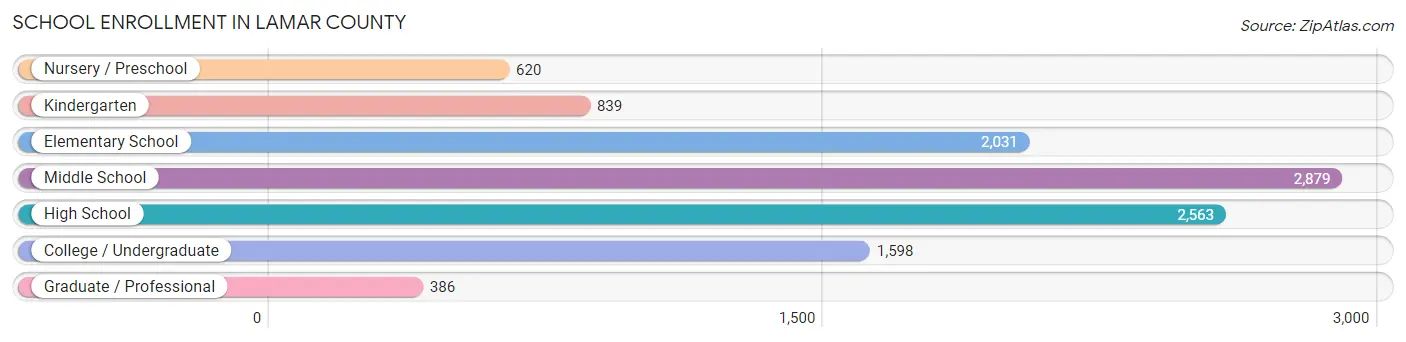
The most common levels of schooling among the 10,916 students in Lamar County are middle school (2,879 | 26.4%), high school (2,563 | 23.5%), and elementary school (2,031 | 18.6%).
| School Level | # Students | % Students |
| Nursery / Preschool | 620 | 5.7% |
| Kindergarten | 839 | 7.7% |
| Elementary School | 2,031 | 18.6% |
| Middle School | 2,879 | 26.4% |
| High School | 2,563 | 23.5% |
| College / Undergraduate | 1,598 | 14.6% |
| Graduate / Professional | 386 | 3.5% |
| Total | 10,916 | 100.0% |
School Enrollment by Age by Funding Source in Lamar County
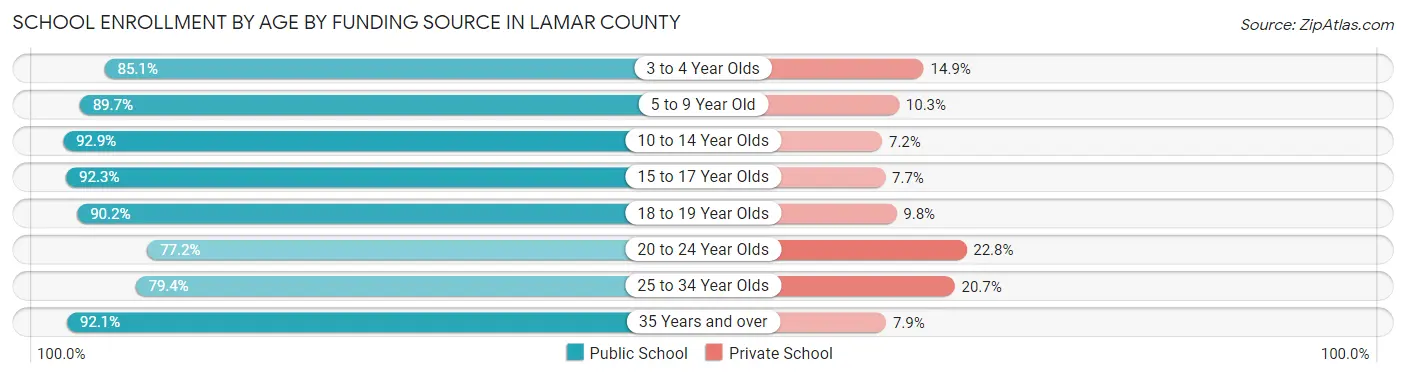
Out of a total of 10,916 students who are enrolled in schools in Lamar County, 1,070 (9.8%) attend a private institution, while the remaining 9,846 (90.2%) are enrolled in public schools. The age group of 20 to 24 year olds has the highest likelihood of being enrolled in private schools, with 119 (22.8% in the age bracket) enrolled. Conversely, the age group of 10 to 14 year olds has the lowest likelihood of being enrolled in a private school, with 3,015 (92.8% in the age bracket) attending a public institution.
| Age Bracket | Public School | Private School |
| 3 to 4 Year Olds | 297 (85.1%) | 52 (14.9%) |
| 5 to 9 Year Old | 2,661 (89.7%) | 305 (10.3%) |
| 10 to 14 Year Olds | 3,015 (92.8%) | 232 (7.1%) |
| 15 to 17 Year Olds | 1,830 (92.3%) | 153 (7.7%) |
| 18 to 19 Year Olds | 818 (90.2%) | 89 (9.8%) |
| 20 to 24 Year Olds | 402 (77.2%) | 119 (22.8%) |
| 25 to 34 Year Olds | 315 (79.3%) | 82 (20.6%) |
| 35 Years and over | 503 (92.1%) | 43 (7.9%) |
| Total | 9,846 (90.2%) | 1,070 (9.8%) |
Educational Attainment by Field of Study in Lamar County
Education (1,655 | 21.8%), business (1,201 | 15.9%), science & technology (881 | 11.6%), arts & humanities (617 | 8.1%), and bio, nature & agricultural (572 | 7.5%) are the most common fields of study among 7,577 individuals in Lamar County who have obtained a bachelor's degree or higher.
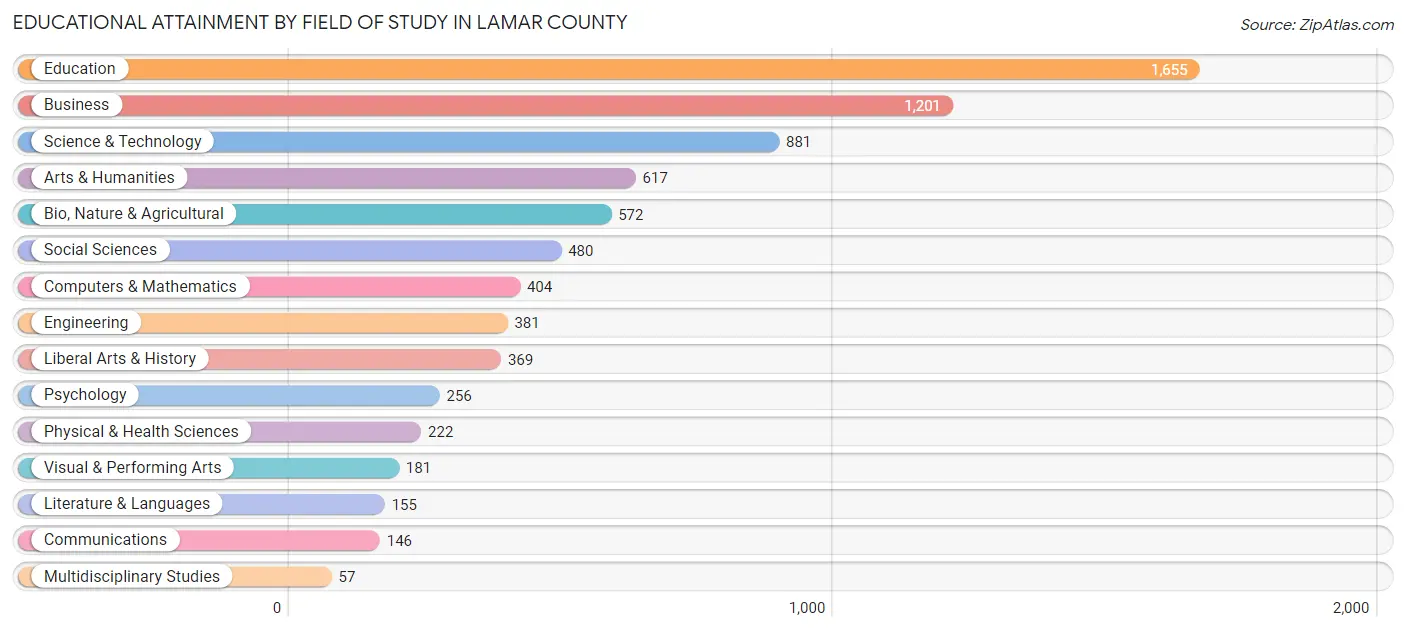
| Field of Study | # Graduates | % Graduates |
| Computers & Mathematics | 404 | 5.3% |
| Bio, Nature & Agricultural | 572 | 7.5% |
| Physical & Health Sciences | 222 | 2.9% |
| Psychology | 256 | 3.4% |
| Social Sciences | 480 | 6.3% |
| Engineering | 381 | 5.0% |
| Multidisciplinary Studies | 57 | 0.7% |
| Science & Technology | 881 | 11.6% |
| Business | 1,201 | 15.9% |
| Education | 1,655 | 21.8% |
| Literature & Languages | 155 | 2.1% |
| Liberal Arts & History | 369 | 4.9% |
| Visual & Performing Arts | 181 | 2.4% |
| Communications | 146 | 1.9% |
| Arts & Humanities | 617 | 8.1% |
| Total | 7,577 | 100.0% |
Transportation & Commute in Lamar County
Vehicle Availability by Sex in Lamar County
The most prevalent vehicle ownership categories in Lamar County are males with 2 vehicles (4,995, accounting for 41.8%) and females with 2 vehicles (4,199, making up 47.3%).
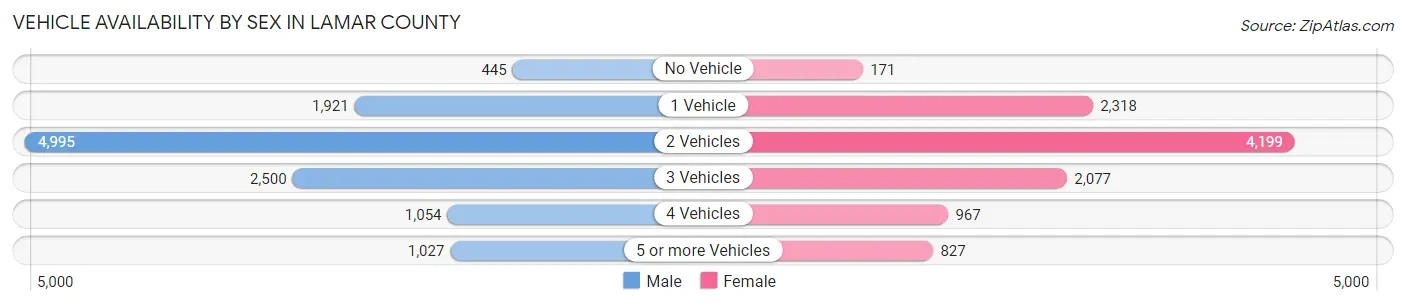
| Vehicles Available | Male | Female |
| No Vehicle | 445 (3.7%) | 171 (1.6%) |
| 1 Vehicle | 1,921 (16.1%) | 2,318 (22.0%) |
| 2 Vehicles | 4,995 (41.8%) | 4,199 (39.8%) |
| 3 Vehicles | 2,500 (20.9%) | 2,077 (19.7%) |
| 4 Vehicles | 1,054 (8.8%) | 967 (9.2%) |
| 5 or more Vehicles | 1,027 (8.6%) | 827 (7.8%) |
| Total | 11,942 (100.0%) | 10,559 (100.0%) |
Commute Time in Lamar County
The most frequently occuring commute durations in Lamar County are 10 to 14 minutes (5,261 commuters, 24.7%), 15 to 19 minutes (4,465 commuters, 21.0%), and 5 to 9 minutes (3,397 commuters, 16.0%).
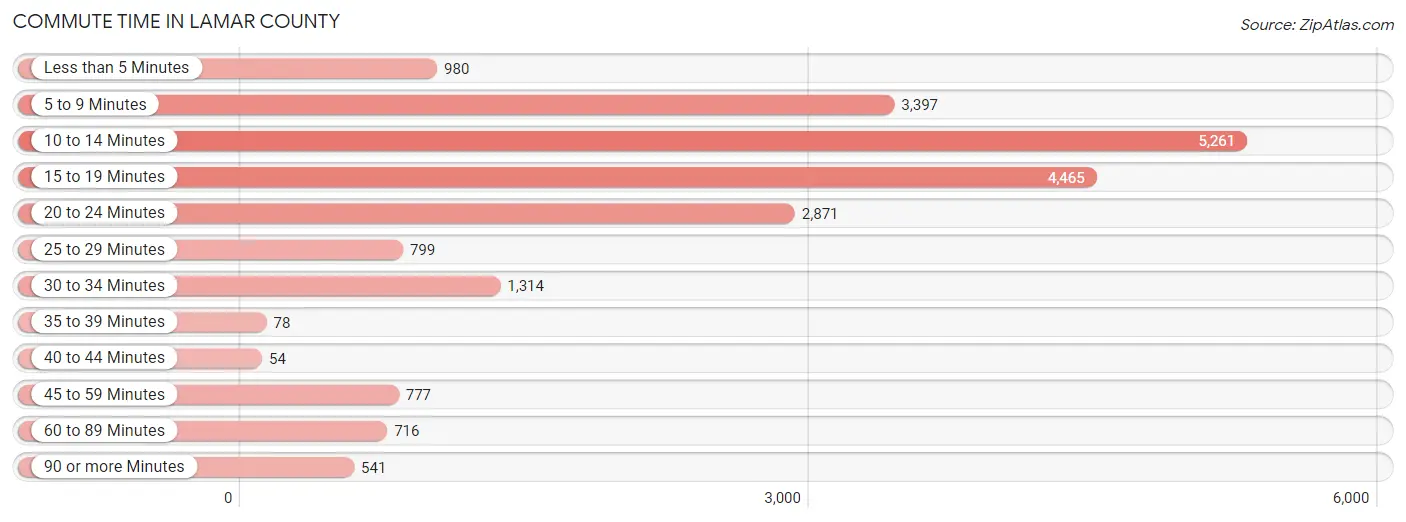
| Commute Time | # Commuters | % Commuters |
| Less than 5 Minutes | 980 | 4.6% |
| 5 to 9 Minutes | 3,397 | 16.0% |
| 10 to 14 Minutes | 5,261 | 24.7% |
| 15 to 19 Minutes | 4,465 | 21.0% |
| 20 to 24 Minutes | 2,871 | 13.5% |
| 25 to 29 Minutes | 799 | 3.8% |
| 30 to 34 Minutes | 1,314 | 6.2% |
| 35 to 39 Minutes | 78 | 0.4% |
| 40 to 44 Minutes | 54 | 0.3% |
| 45 to 59 Minutes | 777 | 3.7% |
| 60 to 89 Minutes | 716 | 3.4% |
| 90 or more Minutes | 541 | 2.5% |
Commute Time by Sex in Lamar County
The most common commute times in Lamar County are 10 to 14 minutes (2,821 commuters, 24.9%) for males and 10 to 14 minutes (2,440 commuters, 24.6%) for females.
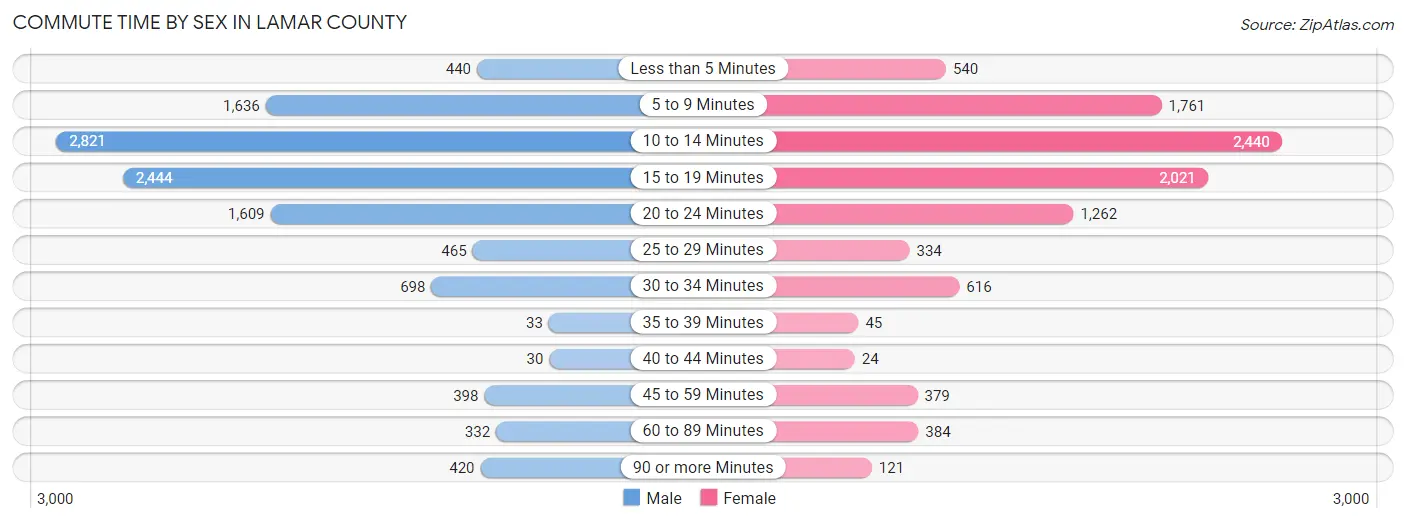
| Commute Time | Male | Female |
| Less than 5 Minutes | 440 (3.9%) | 540 (5.4%) |
| 5 to 9 Minutes | 1,636 (14.4%) | 1,761 (17.7%) |
| 10 to 14 Minutes | 2,821 (24.9%) | 2,440 (24.6%) |
| 15 to 19 Minutes | 2,444 (21.6%) | 2,021 (20.4%) |
| 20 to 24 Minutes | 1,609 (14.2%) | 1,262 (12.7%) |
| 25 to 29 Minutes | 465 (4.1%) | 334 (3.4%) |
| 30 to 34 Minutes | 698 (6.2%) | 616 (6.2%) |
| 35 to 39 Minutes | 33 (0.3%) | 45 (0.4%) |
| 40 to 44 Minutes | 30 (0.3%) | 24 (0.2%) |
| 45 to 59 Minutes | 398 (3.5%) | 379 (3.8%) |
| 60 to 89 Minutes | 332 (2.9%) | 384 (3.9%) |
| 90 or more Minutes | 420 (3.7%) | 121 (1.2%) |
Time of Departure to Work by Sex in Lamar County
The most frequent times of departure to work in Lamar County are 7:00 AM to 7:29 AM (1,682, 14.8%) for males and 7:30 AM to 7:59 AM (2,028, 20.4%) for females.
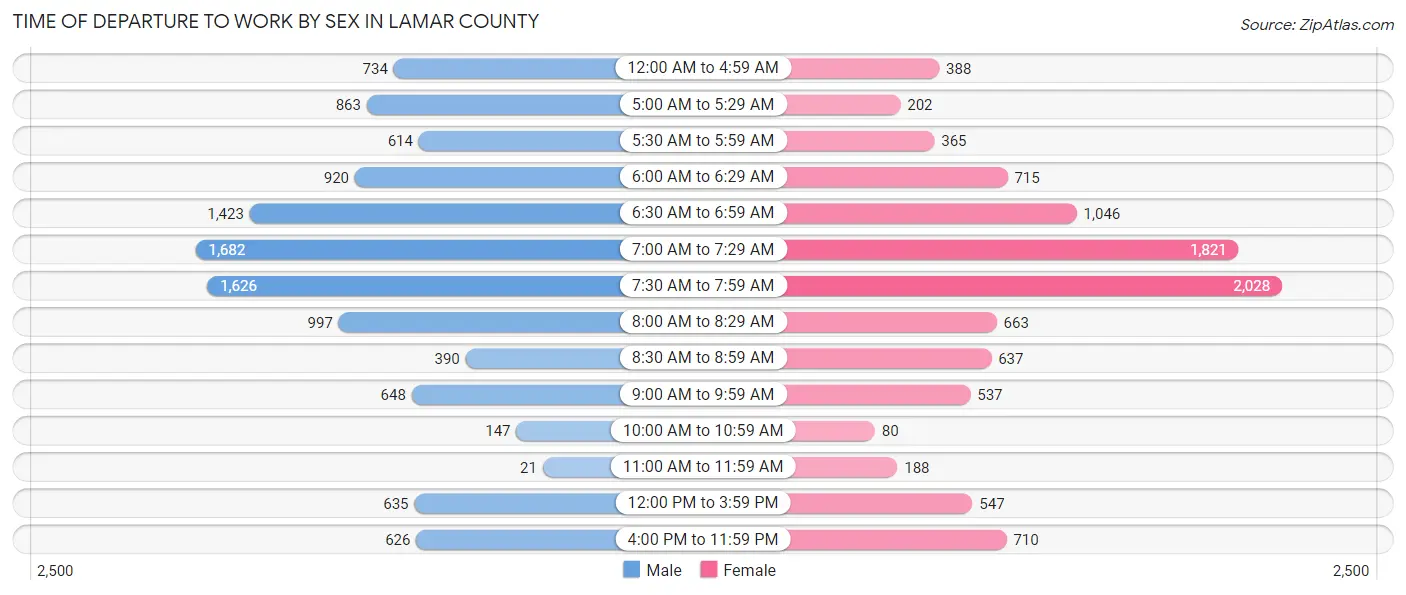
| Time of Departure | Male | Female |
| 12:00 AM to 4:59 AM | 734 (6.5%) | 388 (3.9%) |
| 5:00 AM to 5:29 AM | 863 (7.6%) | 202 (2.0%) |
| 5:30 AM to 5:59 AM | 614 (5.4%) | 365 (3.7%) |
| 6:00 AM to 6:29 AM | 920 (8.1%) | 715 (7.2%) |
| 6:30 AM to 6:59 AM | 1,423 (12.6%) | 1,046 (10.5%) |
| 7:00 AM to 7:29 AM | 1,682 (14.8%) | 1,821 (18.3%) |
| 7:30 AM to 7:59 AM | 1,626 (14.4%) | 2,028 (20.4%) |
| 8:00 AM to 8:29 AM | 997 (8.8%) | 663 (6.7%) |
| 8:30 AM to 8:59 AM | 390 (3.4%) | 637 (6.4%) |
| 9:00 AM to 9:59 AM | 648 (5.7%) | 537 (5.4%) |
| 10:00 AM to 10:59 AM | 147 (1.3%) | 80 (0.8%) |
| 11:00 AM to 11:59 AM | 21 (0.2%) | 188 (1.9%) |
| 12:00 PM to 3:59 PM | 635 (5.6%) | 547 (5.5%) |
| 4:00 PM to 11:59 PM | 626 (5.5%) | 710 (7.1%) |
| Total | 11,326 (100.0%) | 9,927 (100.0%) |
Housing Occupancy in Lamar County
Occupancy by Ownership in Lamar County
Of the total 20,122 dwellings in Lamar County, owner-occupied units account for 13,423 (66.7%), while renter-occupied units make up 6,699 (33.3%).
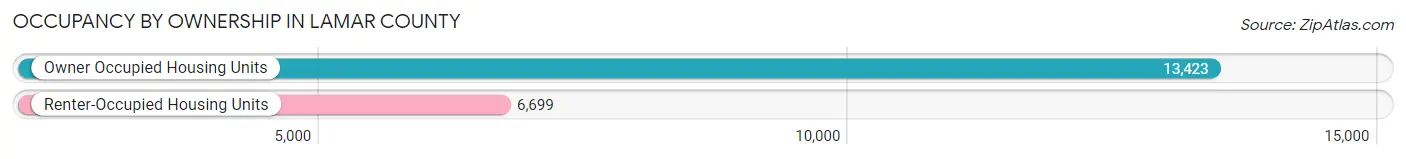
| Occupancy | # Housing Units | % Housing Units |
| Owner Occupied Housing Units | 13,423 | 66.7% |
| Renter-Occupied Housing Units | 6,699 | 33.3% |
| Total Occupied Housing Units | 20,122 | 100.0% |
Occupancy by Household Size in Lamar County
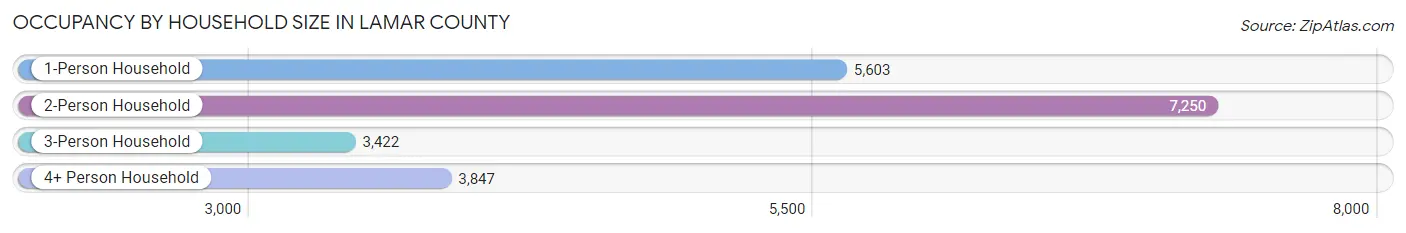
| Household Size | # Housing Units | % Housing Units |
| 1-Person Household | 5,603 | 27.9% |
| 2-Person Household | 7,250 | 36.0% |
| 3-Person Household | 3,422 | 17.0% |
| 4+ Person Household | 3,847 | 19.1% |
| Total Housing Units | 20,122 | 100.0% |
Occupancy by Ownership by Household Size in Lamar County
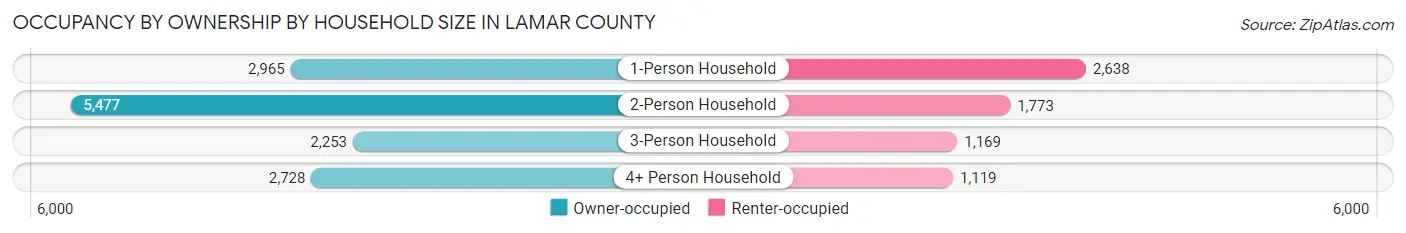
| Household Size | Owner-occupied | Renter-occupied |
| 1-Person Household | 2,965 (52.9%) | 2,638 (47.1%) |
| 2-Person Household | 5,477 (75.5%) | 1,773 (24.5%) |
| 3-Person Household | 2,253 (65.8%) | 1,169 (34.2%) |
| 4+ Person Household | 2,728 (70.9%) | 1,119 (29.1%) |
| Total Housing Units | 13,423 (66.7%) | 6,699 (33.3%) |
Occupancy by Educational Attainment in Lamar County
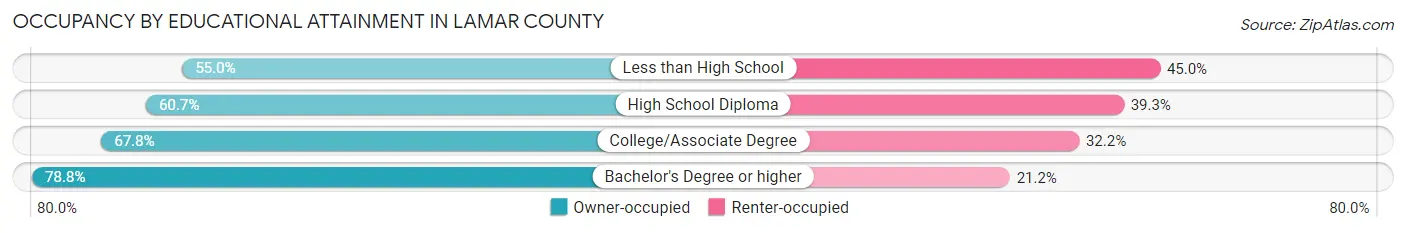
| Household Size | Owner-occupied | Renter-occupied |
| Less than High School | 1,428 (55.0%) | 1,169 (45.0%) |
| High School Diploma | 3,545 (60.7%) | 2,291 (39.3%) |
| College/Associate Degree | 4,710 (67.8%) | 2,234 (32.2%) |
| Bachelor's Degree or higher | 3,740 (78.8%) | 1,005 (21.2%) |
Occupancy by Age of Householder in Lamar County
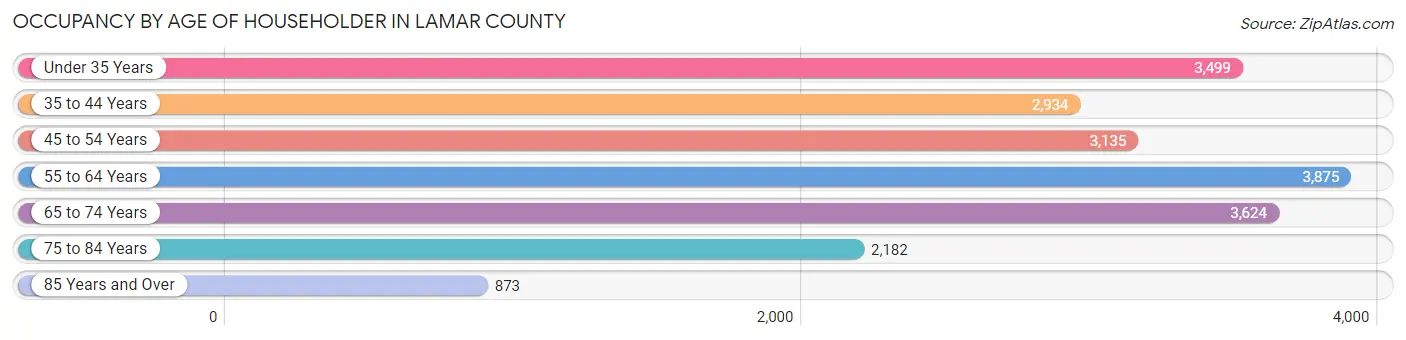
| Age Bracket | # Households | % Households |
| Under 35 Years | 3,499 | 17.4% |
| 35 to 44 Years | 2,934 | 14.6% |
| 45 to 54 Years | 3,135 | 15.6% |
| 55 to 64 Years | 3,875 | 19.3% |
| 65 to 74 Years | 3,624 | 18.0% |
| 75 to 84 Years | 2,182 | 10.8% |
| 85 Years and Over | 873 | 4.3% |
| Total | 20,122 | 100.0% |
Housing Finances in Lamar County
Median Income by Occupancy in Lamar County
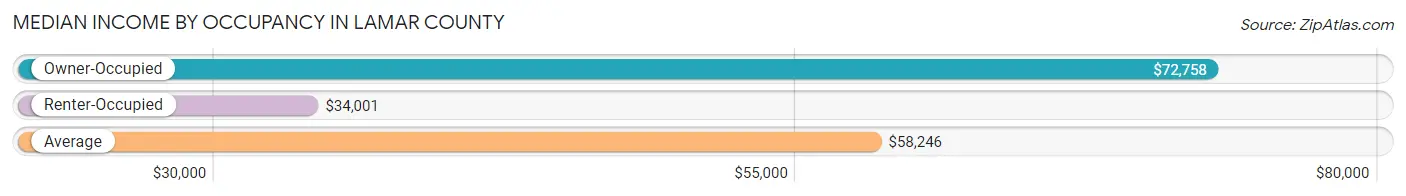
| Occupancy Type | # Households | Median Income |
| Owner-Occupied | 13,423 (66.7%) | $72,758 |
| Renter-Occupied | 6,699 (33.3%) | $34,001 |
| Average | 20,122 (100.0%) | $58,246 |
Occupancy by Householder Income Bracket in Lamar County
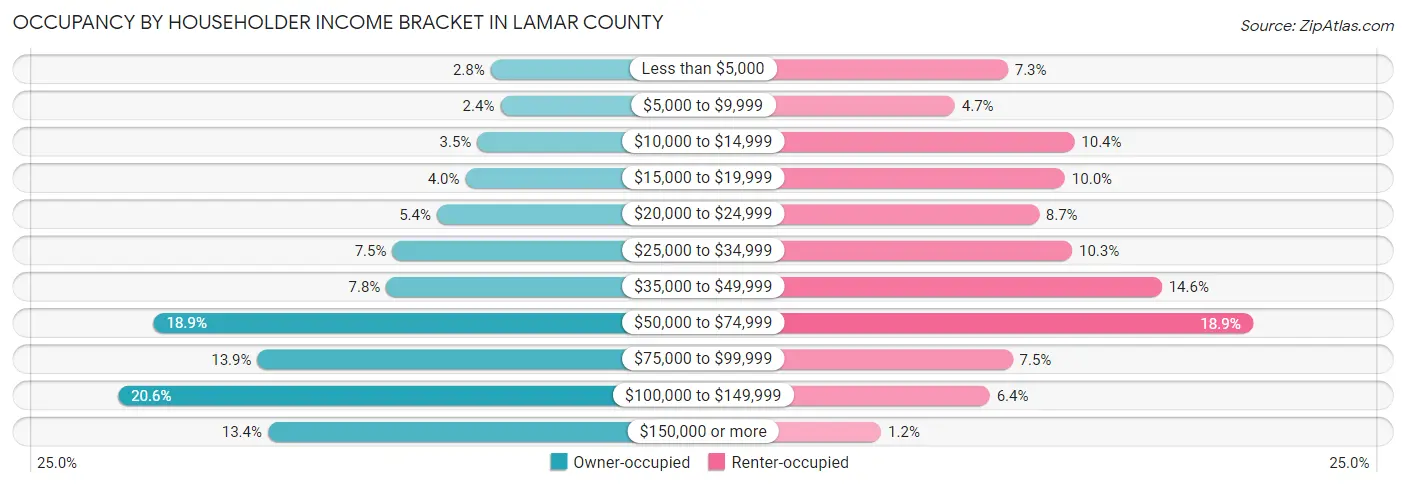
| Income Bracket | Owner-occupied | Renter-occupied |
| Less than $5,000 | 377 (2.8%) | 486 (7.2%) |
| $5,000 to $9,999 | 315 (2.4%) | 317 (4.7%) |
| $10,000 to $14,999 | 463 (3.5%) | 698 (10.4%) |
| $15,000 to $19,999 | 538 (4.0%) | 668 (10.0%) |
| $20,000 to $24,999 | 721 (5.4%) | 585 (8.7%) |
| $25,000 to $34,999 | 1,005 (7.5%) | 691 (10.3%) |
| $35,000 to $49,999 | 1,044 (7.8%) | 977 (14.6%) |
| $50,000 to $74,999 | 2,531 (18.9%) | 1,266 (18.9%) |
| $75,000 to $99,999 | 1,868 (13.9%) | 501 (7.5%) |
| $100,000 to $149,999 | 2,759 (20.5%) | 428 (6.4%) |
| $150,000 or more | 1,802 (13.4%) | 82 (1.2%) |
| Total | 13,423 (100.0%) | 6,699 (100.0%) |
Monthly Housing Cost Tiers in Lamar County
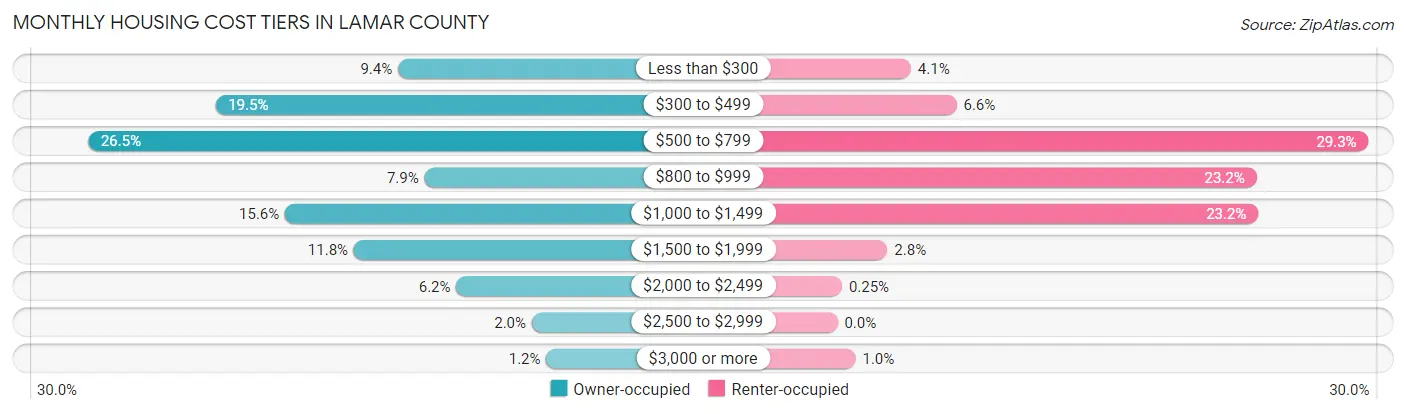
| Monthly Cost | Owner-occupied | Renter-occupied |
| Less than $300 | 1,258 (9.4%) | 272 (4.1%) |
| $300 to $499 | 2,613 (19.5%) | 441 (6.6%) |
| $500 to $799 | 3,558 (26.5%) | 1,965 (29.3%) |
| $800 to $999 | 1,062 (7.9%) | 1,551 (23.2%) |
| $1,000 to $1,499 | 2,096 (15.6%) | 1,557 (23.2%) |
| $1,500 to $1,999 | 1,585 (11.8%) | 185 (2.8%) |
| $2,000 to $2,499 | 826 (6.1%) | 17 (0.3%) |
| $2,500 to $2,999 | 266 (2.0%) | 0 (0.0%) |
| $3,000 or more | 159 (1.2%) | 67 (1.0%) |
| Total | 13,423 (100.0%) | 6,699 (100.0%) |
Physical Housing Characteristics in Lamar County
Housing Structures in Lamar County
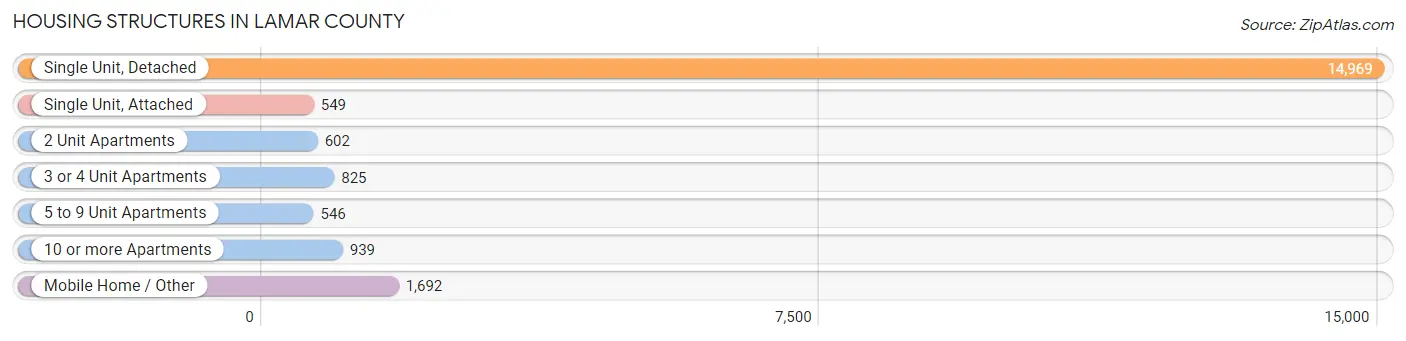
| Structure Type | # Housing Units | % Housing Units |
| Single Unit, Detached | 14,969 | 74.4% |
| Single Unit, Attached | 549 | 2.7% |
| 2 Unit Apartments | 602 | 3.0% |
| 3 or 4 Unit Apartments | 825 | 4.1% |
| 5 to 9 Unit Apartments | 546 | 2.7% |
| 10 or more Apartments | 939 | 4.7% |
| Mobile Home / Other | 1,692 | 8.4% |
| Total | 20,122 | 100.0% |
Housing Structures by Occupancy in Lamar County
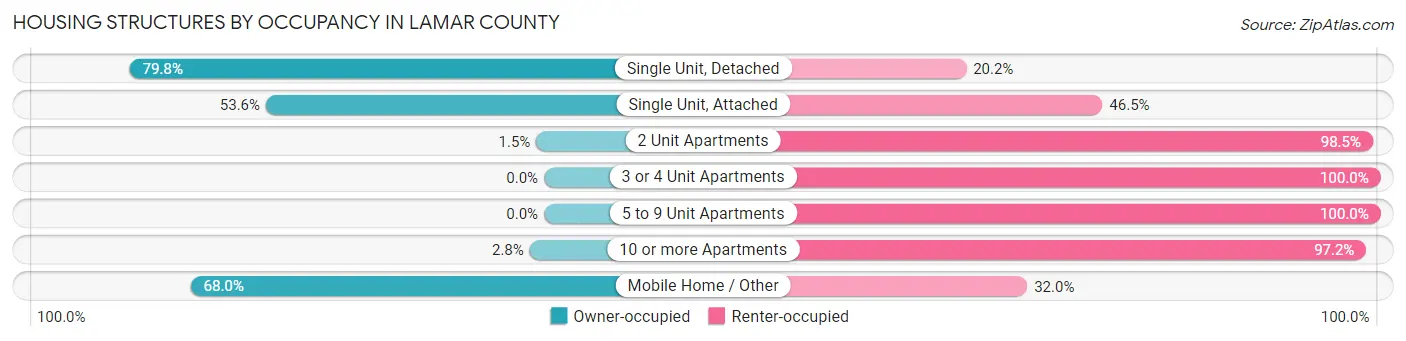
| Structure Type | Owner-occupied | Renter-occupied |
| Single Unit, Detached | 11,943 (79.8%) | 3,026 (20.2%) |
| Single Unit, Attached | 294 (53.5%) | 255 (46.5%) |
| 2 Unit Apartments | 9 (1.5%) | 593 (98.5%) |
| 3 or 4 Unit Apartments | 0 (0.0%) | 825 (100.0%) |
| 5 to 9 Unit Apartments | 0 (0.0%) | 546 (100.0%) |
| 10 or more Apartments | 26 (2.8%) | 913 (97.2%) |
| Mobile Home / Other | 1,151 (68.0%) | 541 (32.0%) |
| Total | 13,423 (66.7%) | 6,699 (33.3%) |
Housing Structures by Number of Rooms in Lamar County
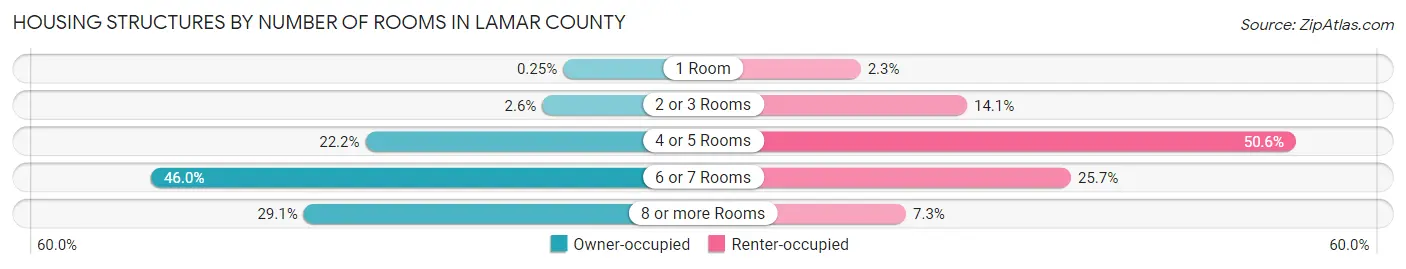
| Number of Rooms | Owner-occupied | Renter-occupied |
| 1 Room | 33 (0.3%) | 155 (2.3%) |
| 2 or 3 Rooms | 343 (2.6%) | 945 (14.1%) |
| 4 or 5 Rooms | 2,978 (22.2%) | 3,389 (50.6%) |
| 6 or 7 Rooms | 6,170 (46.0%) | 1,718 (25.7%) |
| 8 or more Rooms | 3,899 (29.0%) | 492 (7.3%) |
| Total | 13,423 (100.0%) | 6,699 (100.0%) |
Housing Structure by Heating Type in Lamar County
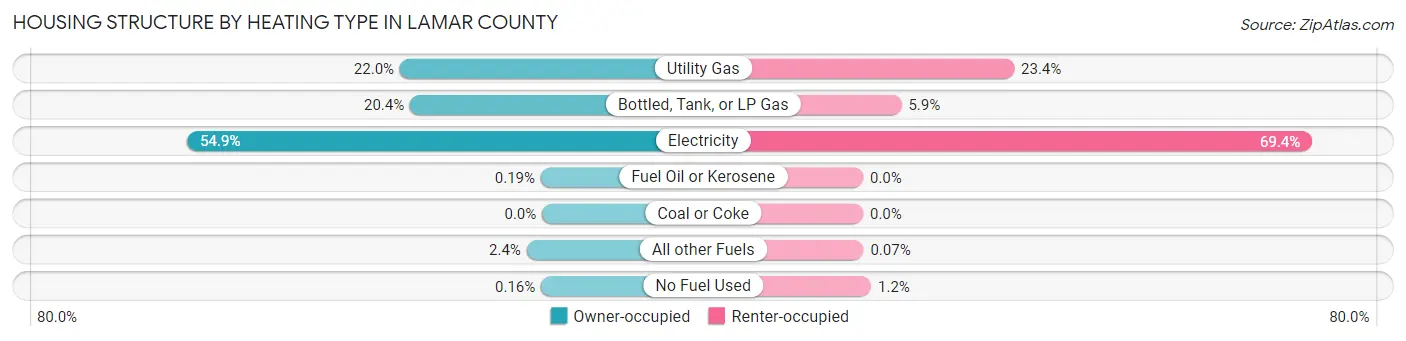
| Heating Type | Owner-occupied | Renter-occupied |
| Utility Gas | 2,951 (22.0%) | 1,564 (23.4%) |
| Bottled, Tank, or LP Gas | 2,739 (20.4%) | 398 (5.9%) |
| Electricity | 7,368 (54.9%) | 4,649 (69.4%) |
| Fuel Oil or Kerosene | 25 (0.2%) | 0 (0.0%) |
| Coal or Coke | 0 (0.0%) | 0 (0.0%) |
| All other Fuels | 319 (2.4%) | 5 (0.1%) |
| No Fuel Used | 21 (0.2%) | 83 (1.2%) |
| Total | 13,423 (100.0%) | 6,699 (100.0%) |
Household Vehicle Usage in Lamar County
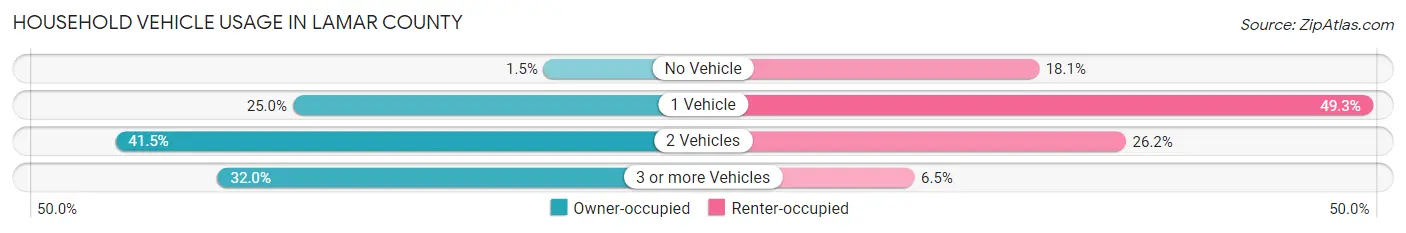
| Vehicles per Household | Owner-occupied | Renter-occupied |
| No Vehicle | 207 (1.5%) | 1,212 (18.1%) |
| 1 Vehicle | 3,350 (25.0%) | 3,299 (49.2%) |
| 2 Vehicles | 5,573 (41.5%) | 1,755 (26.2%) |
| 3 or more Vehicles | 4,293 (32.0%) | 433 (6.5%) |
| Total | 13,423 (100.0%) | 6,699 (100.0%) |
Real Estate & Mortgages in Lamar County
Real Estate and Mortgage Overview in Lamar County
| Characteristic | Without Mortgage | With Mortgage |
| Housing Units | 7,712 | 5,711 |
| Median Property Value | $120,000 | $193,200 |
| Median Household Income | $59,336 | $1,158 |
| Monthly Housing Costs | $506 | $152 |
| Real Estate Taxes | $1,282 | $260 |
Property Value by Mortgage Status in Lamar County
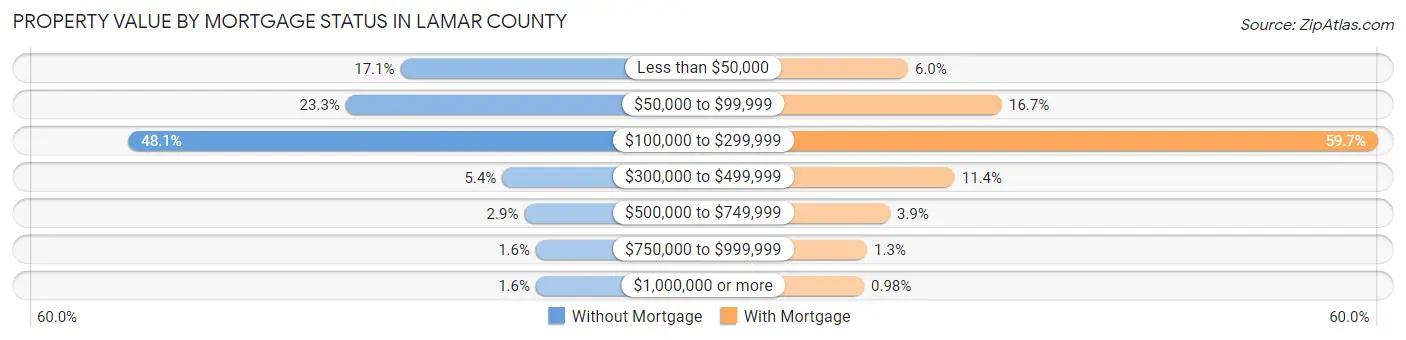
| Property Value | Without Mortgage | With Mortgage |
| Less than $50,000 | 1,316 (17.1%) | 342 (6.0%) |
| $50,000 to $99,999 | 1,798 (23.3%) | 956 (16.7%) |
| $100,000 to $299,999 | 3,712 (48.1%) | 3,408 (59.7%) |
| $300,000 to $499,999 | 418 (5.4%) | 648 (11.4%) |
| $500,000 to $749,999 | 224 (2.9%) | 225 (3.9%) |
| $750,000 to $999,999 | 122 (1.6%) | 76 (1.3%) |
| $1,000,000 or more | 122 (1.6%) | 56 (1.0%) |
| Total | 7,712 (100.0%) | 5,711 (100.0%) |
Household Income by Mortgage Status in Lamar County
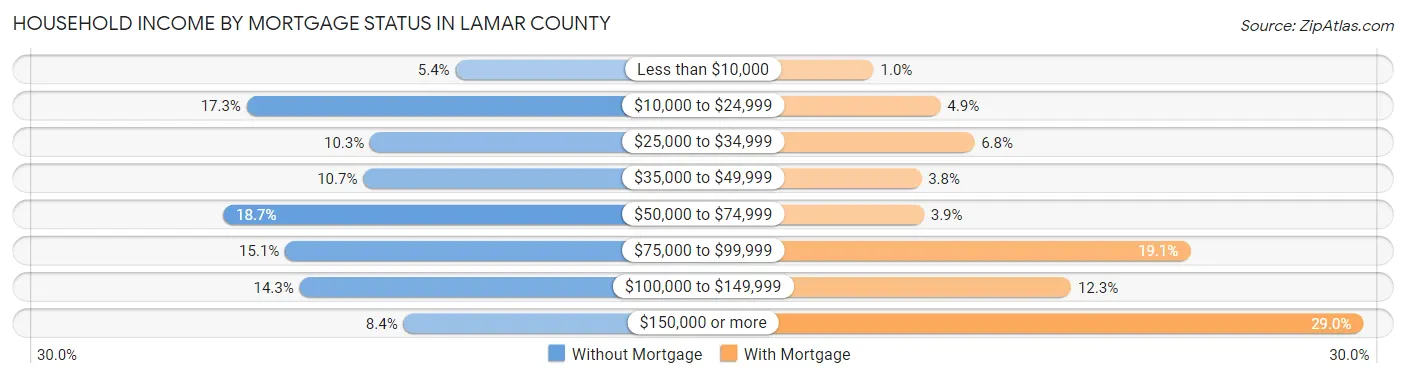
| Household Income | Without Mortgage | With Mortgage |
| Less than $10,000 | 415 (5.4%) | 59 (1.0%) |
| $10,000 to $24,999 | 1,335 (17.3%) | 277 (4.9%) |
| $25,000 to $34,999 | 791 (10.3%) | 387 (6.8%) |
| $35,000 to $49,999 | 821 (10.6%) | 214 (3.7%) |
| $50,000 to $74,999 | 1,439 (18.7%) | 223 (3.9%) |
| $75,000 to $99,999 | 1,165 (15.1%) | 1,092 (19.1%) |
| $100,000 to $149,999 | 1,102 (14.3%) | 703 (12.3%) |
| $150,000 or more | 644 (8.4%) | 1,657 (29.0%) |
| Total | 7,712 (100.0%) | 5,711 (100.0%) |
Property Value to Household Income Ratio in Lamar County
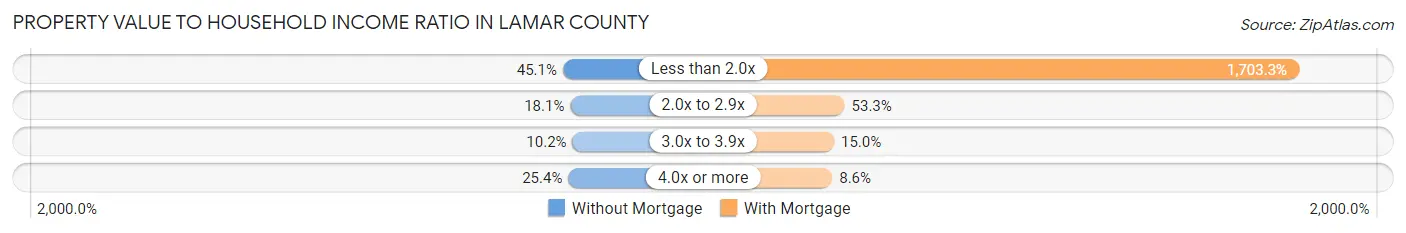
| Value-to-Income Ratio | Without Mortgage | With Mortgage |
| Less than 2.0x | 3,477 (45.1%) | 97,276 (1,703.3%) |
| 2.0x to 2.9x | 1,399 (18.1%) | 3,046 (53.3%) |
| 3.0x to 3.9x | 784 (10.2%) | 859 (15.0%) |
| 4.0x or more | 1,961 (25.4%) | 491 (8.6%) |
| Total | 7,712 (100.0%) | 5,711 (100.0%) |
Real Estate Taxes by Mortgage Status in Lamar County
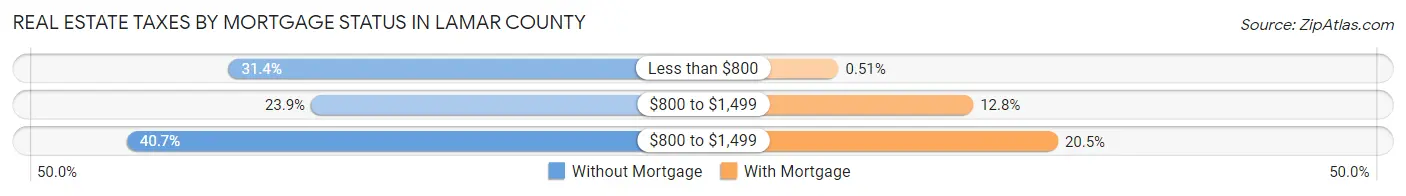
| Property Taxes | Without Mortgage | With Mortgage |
| Less than $800 | 2,419 (31.4%) | 29 (0.5%) |
| $800 to $1,499 | 1,839 (23.8%) | 731 (12.8%) |
| $800 to $1,499 | 3,136 (40.7%) | 1,173 (20.5%) |
| Total | 7,712 (100.0%) | 5,711 (100.0%) |
Health & Disability in Lamar County
Health Insurance Coverage by Age in Lamar County
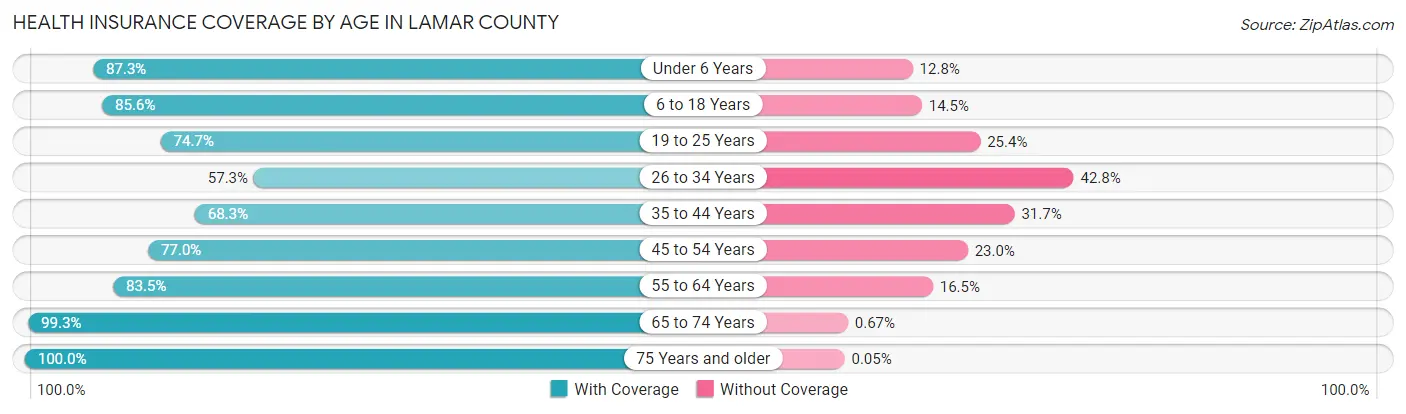
| Age Bracket | With Coverage | Without Coverage |
| Under 6 Years | 3,749 (87.3%) | 548 (12.8%) |
| 6 to 18 Years | 7,054 (85.6%) | 1,191 (14.4%) |
| 19 to 25 Years | 2,921 (74.7%) | 992 (25.4%) |
| 26 to 34 Years | 3,307 (57.3%) | 2,469 (42.7%) |
| 35 to 44 Years | 3,738 (68.3%) | 1,738 (31.7%) |
| 45 to 54 Years | 4,778 (77.0%) | 1,428 (23.0%) |
| 55 to 64 Years | 5,313 (83.5%) | 1,050 (16.5%) |
| 65 to 74 Years | 5,514 (99.3%) | 37 (0.7%) |
| 75 Years and older | 3,816 (100.0%) | 2 (0.1%) |
| Total | 40,190 (80.9%) | 9,455 (19.1%) |
Health Insurance Coverage by Citizenship Status in Lamar County
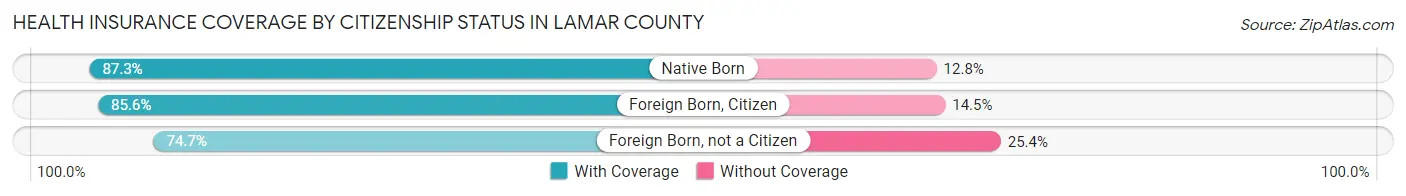
| Citizenship Status | With Coverage | Without Coverage |
| Native Born | 3,749 (87.3%) | 548 (12.8%) |
| Foreign Born, Citizen | 7,054 (85.6%) | 1,191 (14.4%) |
| Foreign Born, not a Citizen | 2,921 (74.7%) | 992 (25.4%) |
Health Insurance Coverage by Household Income in Lamar County
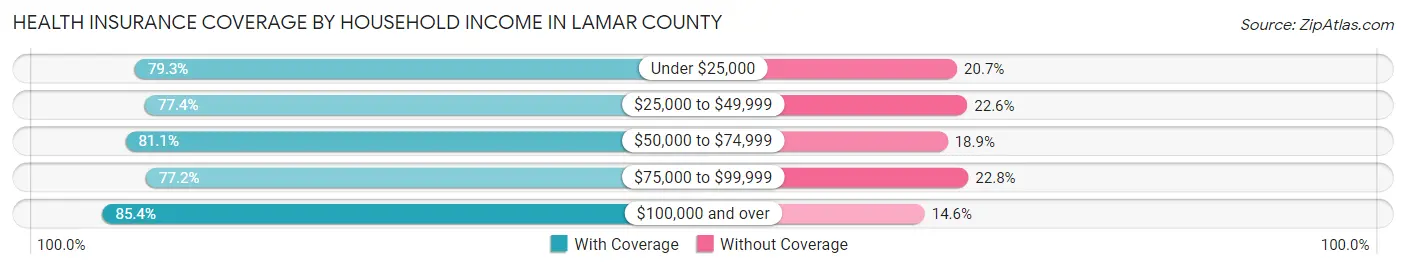
| Household Income | With Coverage | Without Coverage |
| Under $25,000 | 6,956 (79.3%) | 1,813 (20.7%) |
| $25,000 to $49,999 | 6,306 (77.4%) | 1,840 (22.6%) |
| $50,000 to $74,999 | 8,028 (81.1%) | 1,872 (18.9%) |
| $75,000 to $99,999 | 5,530 (77.2%) | 1,631 (22.8%) |
| $100,000 and over | 13,175 (85.4%) | 2,255 (14.6%) |
Public vs Private Health Insurance Coverage by Age in Lamar County
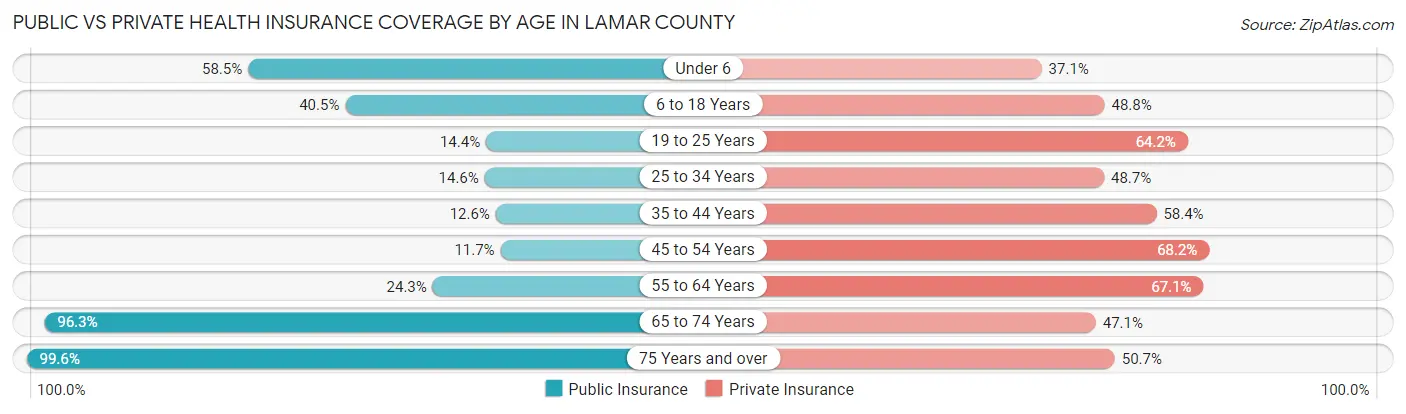
| Age Bracket | Public Insurance | Private Insurance |
| Under 6 | 2,515 (58.5%) | 1,594 (37.1%) |
| 6 to 18 Years | 3,338 (40.5%) | 4,021 (48.8%) |
| 19 to 25 Years | 562 (14.4%) | 2,512 (64.2%) |
| 25 to 34 Years | 844 (14.6%) | 2,811 (48.7%) |
| 35 to 44 Years | 688 (12.6%) | 3,198 (58.4%) |
| 45 to 54 Years | 725 (11.7%) | 4,232 (68.2%) |
| 55 to 64 Years | 1,544 (24.3%) | 4,271 (67.1%) |
| 65 to 74 Years | 5,348 (96.3%) | 2,617 (47.1%) |
| 75 Years and over | 3,804 (99.6%) | 1,935 (50.7%) |
| Total | 19,368 (39.0%) | 27,191 (54.8%) |
Disability Status by Sex by Age in Lamar County
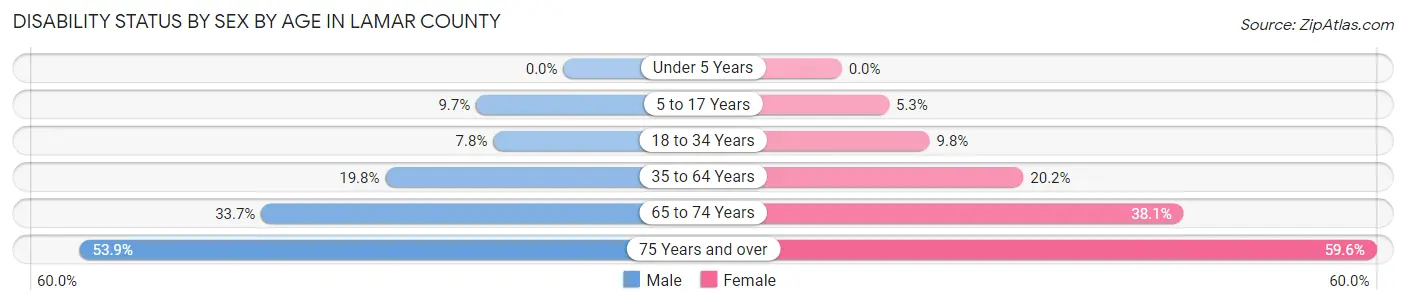
| Age Bracket | Male | Female |
| Under 5 Years | 0 (0.0%) | 0 (0.0%) |
| 5 to 17 Years | 446 (9.7%) | 218 (5.3%) |
| 18 to 34 Years | 400 (7.8%) | 505 (9.8%) |
| 35 to 64 Years | 1,717 (19.8%) | 1,898 (20.2%) |
| 65 to 74 Years | 882 (33.7%) | 1,115 (38.1%) |
| 75 Years and over | 843 (53.9%) | 1,342 (59.6%) |
Disability Class by Sex by Age in Lamar County
Disability Class: Hearing Difficulty
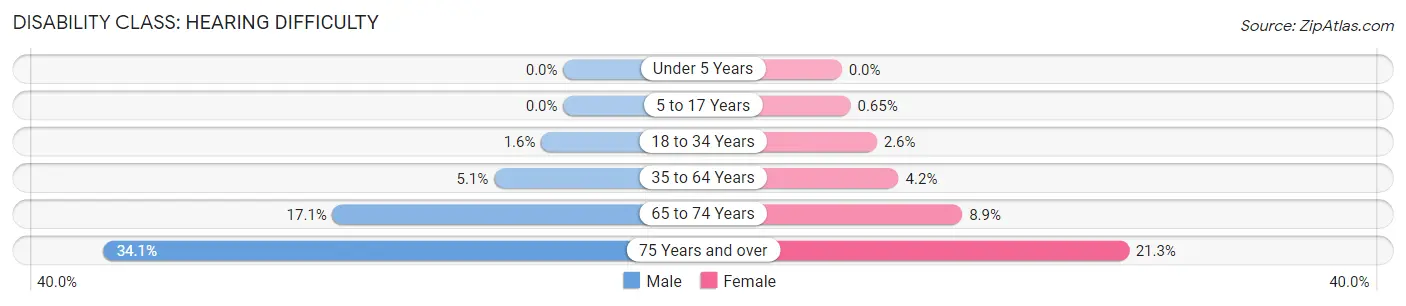
| Age Bracket | Male | Female |
| Under 5 Years | 0 (0.0%) | 0 (0.0%) |
| 5 to 17 Years | 0 (0.0%) | 27 (0.6%) |
| 18 to 34 Years | 84 (1.6%) | 134 (2.6%) |
| 35 to 64 Years | 445 (5.1%) | 396 (4.2%) |
| 65 to 74 Years | 449 (17.1%) | 262 (8.9%) |
| 75 Years and over | 534 (34.1%) | 480 (21.3%) |
Disability Class: Vision Difficulty
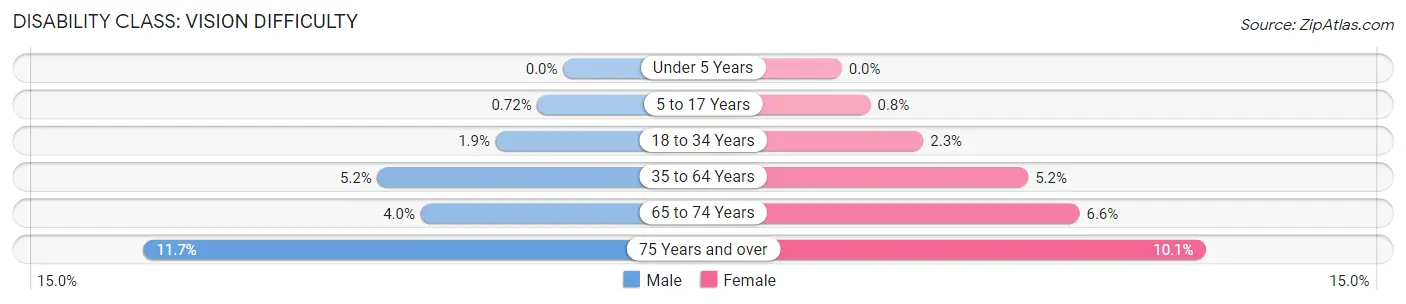
| Age Bracket | Male | Female |
| Under 5 Years | 0 (0.0%) | 0 (0.0%) |
| 5 to 17 Years | 33 (0.7%) | 33 (0.8%) |
| 18 to 34 Years | 96 (1.9%) | 117 (2.3%) |
| 35 to 64 Years | 448 (5.2%) | 487 (5.2%) |
| 65 to 74 Years | 104 (4.0%) | 194 (6.6%) |
| 75 Years and over | 183 (11.7%) | 228 (10.1%) |
Disability Class: Cognitive Difficulty
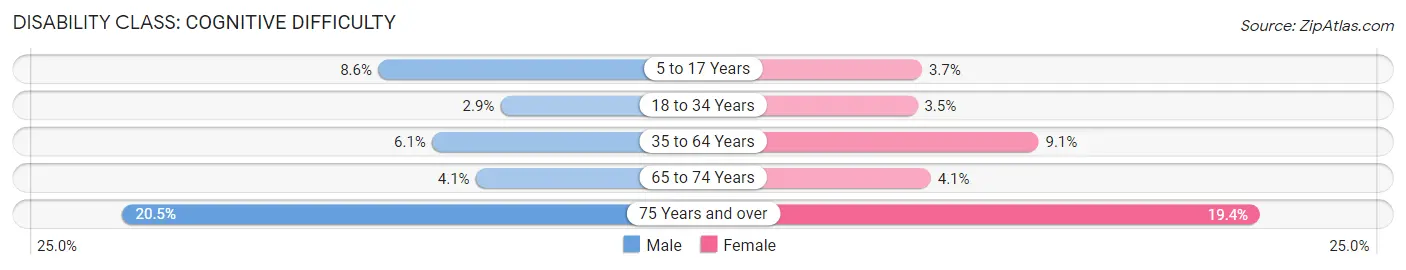
| Age Bracket | Male | Female |
| 5 to 17 Years | 395 (8.6%) | 154 (3.7%) |
| 18 to 34 Years | 150 (2.9%) | 181 (3.5%) |
| 35 to 64 Years | 529 (6.1%) | 857 (9.1%) |
| 65 to 74 Years | 107 (4.1%) | 121 (4.1%) |
| 75 Years and over | 320 (20.4%) | 437 (19.4%) |
Disability Class: Ambulatory Difficulty
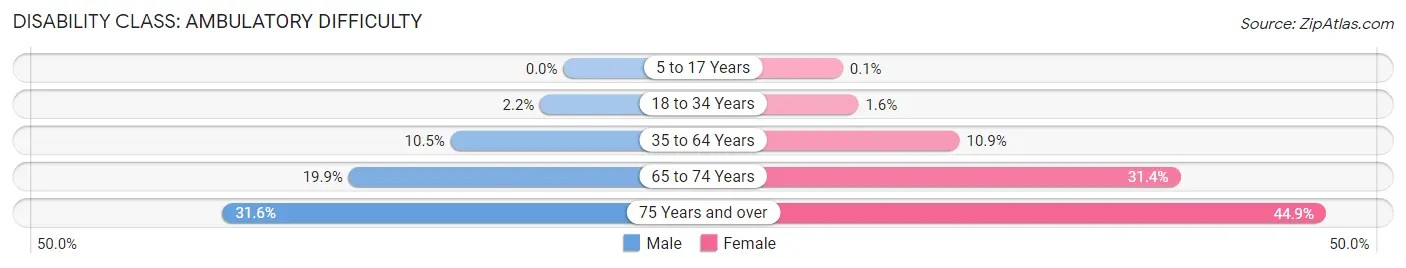
| Age Bracket | Male | Female |
| 5 to 17 Years | 0 (0.0%) | 4 (0.1%) |
| 18 to 34 Years | 110 (2.1%) | 80 (1.5%) |
| 35 to 64 Years | 906 (10.5%) | 1,026 (10.9%) |
| 65 to 74 Years | 522 (19.9%) | 920 (31.4%) |
| 75 Years and over | 495 (31.6%) | 1,012 (44.9%) |
Disability Class: Self-Care Difficulty
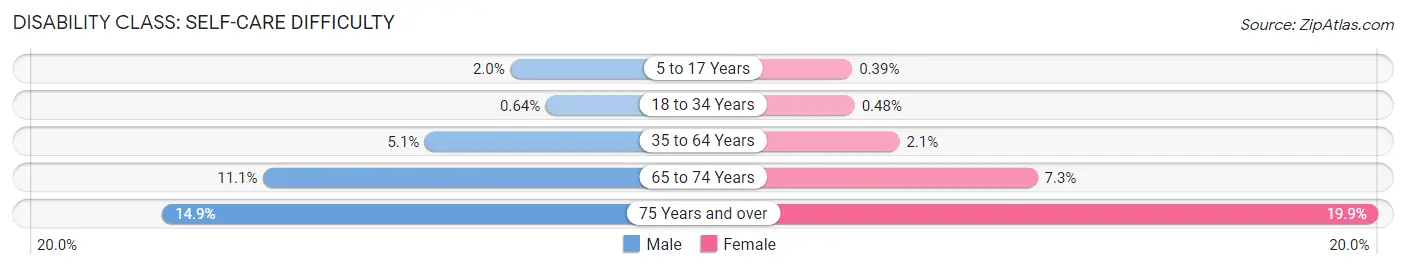
| Age Bracket | Male | Female |
| 5 to 17 Years | 90 (2.0%) | 16 (0.4%) |
| 18 to 34 Years | 33 (0.6%) | 25 (0.5%) |
| 35 to 64 Years | 444 (5.1%) | 201 (2.1%) |
| 65 to 74 Years | 292 (11.1%) | 213 (7.3%) |
| 75 Years and over | 233 (14.9%) | 449 (19.9%) |
Technology Access in Lamar County
Computing Device Access in Lamar County
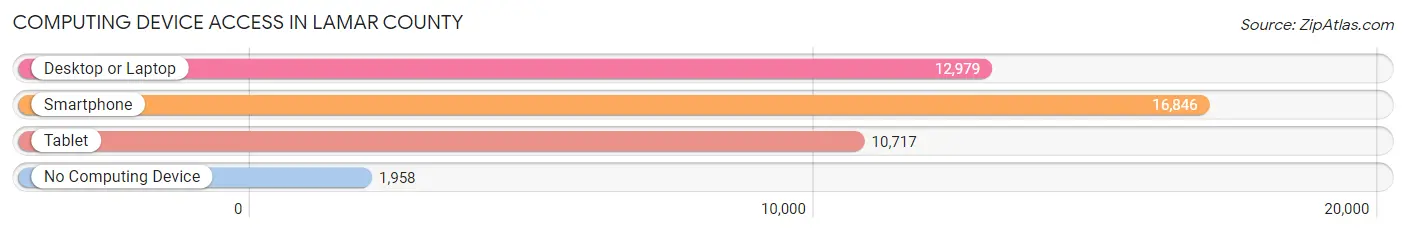
| Device Type | # Households | % Households |
| Desktop or Laptop | 12,979 | 64.5% |
| Smartphone | 16,846 | 83.7% |
| Tablet | 10,717 | 53.3% |
| No Computing Device | 1,958 | 9.7% |
| Total | 20,122 | 100.0% |
Internet Access in Lamar County
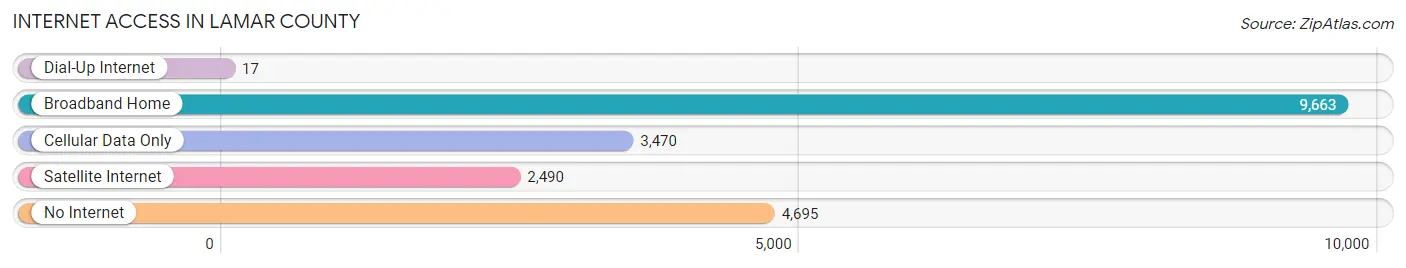
| Internet Type | # Households | % Households |
| Dial-Up Internet | 17 | 0.1% |
| Broadband Home | 9,663 | 48.0% |
| Cellular Data Only | 3,470 | 17.2% |
| Satellite Internet | 2,490 | 12.4% |
| No Internet | 4,695 | 23.3% |
| Total | 20,122 | 100.0% |
Lamar County Summary
Lamar County is located in the northeastern corner of the state of Texas, and is part of the Texoma region. It is bordered by Red River County to the north, Fannin County to the east, Delta County to the south, and Hunt County to the west. The county seat is Paris, and the largest city is Paris. The county has a total area of 890 square miles, of which 886 square miles is land and 4.2 square miles is water.
History
Lamar County was established in 1841 and named after Mirabeau B. Lamar, the second president of the Republic of Texas. The county was originally part of Red River County, but was later divided into its own county. The first settlers in the area were mostly from the southern states, and the county was largely agricultural.
In the late 19th century, the county began to experience an economic boom due to the discovery of oil and natural gas. This led to the development of several towns, including Paris, which became the county seat in 1844.
In the early 20th century, the county experienced a population boom due to the development of the cotton industry. This led to the development of several towns, including Blossom, Reno, and Roxton.
Geography
Lamar County is located in the northeastern corner of the state of Texas, and is part of the Texoma region. It is bordered by Red River County to the north, Fannin County to the east, Delta County to the south, and Hunt County to the west. The county has a total area of 890 square miles, of which 886 square miles is land and 4.2 square miles is water.
The terrain of Lamar County is mostly flat, with some rolling hills in the western part of the county. The county is drained by the Red River, which forms its northern border. The county also contains several small lakes, including Lake Crook, Lake Lamar, and Lake Bob Sandlin.
Economy
The economy of Lamar County is largely based on agriculture and oil and gas production. The county is home to several large farms, which produce cotton, corn, soybeans, and wheat. The county is also home to several oil and gas fields, which produce natural gas and crude oil.
In addition to agriculture and oil and gas production, the county is also home to several manufacturing companies, including a paper mill, a furniture factory, and a plastics plant. The county is also home to several retail stores, restaurants, and other businesses.
Demographics
As of the 2010 census, the population of Lamar County was 49,793. The racial makeup of the county was 79.2% White, 15.7% African American, 0.5% Native American, 0.5% Asian, 0.1% Pacific Islander, 2.7% from other races, and 1.4% from two or more races. Hispanic or Latino of any race were 6.3% of the population.
The median income for a household in the county was $37,945, and the median income for a family was $45,945. The per capita income for the county was $19,945. About 14.2% of families and 17.7% of the population were below the poverty line, including 25.2% of those under age 18 and 11.7% of those age 65 or over.
Common Questions
What is Per Capita Income in Lamar County?
Per Capita income in Lamar County is $29,888.
What is the Median Family Income in Lamar County?
Median Family Income in Lamar County is $71,214.
What is the Median Household income in Lamar County?
Median Household Income in Lamar County is $58,246.
What is Income or Wage Gap in Lamar County?
Income or Wage Gap in Lamar County is 32.6%.
Women in Lamar County earn 67.4 cents for every dollar earned by a man.
What is Family Income Deficit in Lamar County?
Family Income Deficit in Lamar County is $11,613.
Families that are below poverty line in Lamar County earn $11,613 less on average than the poverty threshold level.
What is Inequality or Gini Index in Lamar County?
Inequality or Gini Index in Lamar County is 0.46.
What is the Total Population of Lamar County?
Total Population of Lamar County is 50,149.
What is the Total Male Population of Lamar County?
Total Male Population of Lamar County is 24,449.
What is the Total Female Population of Lamar County?
Total Female Population of Lamar County is 25,700.
What is the Ratio of Males per 100 Females in Lamar County?
There are 95.13 Males per 100 Females in Lamar County.
What is the Ratio of Females per 100 Males in Lamar County?
There are 105.12 Females per 100 Males in Lamar County.
What is the Median Population Age in Lamar County?
Median Population Age in Lamar County is 40.3 Years.
What is the Average Family Size in Lamar County
Average Family Size in Lamar County is 3.0 People.
What is the Average Household Size in Lamar County
Average Household Size in Lamar County is 2.5 People.
How Large is the Labor Force in Lamar County?
There are 23,812 People in the Labor Forcein in Lamar County.
What is the Percentage of People in the Labor Force in Lamar County?
60.4% of People are in the Labor Force in Lamar County.
What is the Unemployment Rate in Lamar County?
Unemployment Rate in Lamar County is 3.9%.