La Salle County, TX Map & Demographics
La Salle County Map

La Salle County Overview
$15,492
PER CAPITA INCOME
$54,291
AVG FAMILY INCOME
$62,798
AVG HOUSEHOLD INCOME
1.0%
WAGE / INCOME GAP [ % ]
99.0¢/ $1
WAGE / INCOME GAP [ $ ]
$8,622
FAMILY INCOME DEFICIT
0.38
INEQUALITY / GINI INDEX
6,965
TOTAL POPULATION
4,303
MALE POPULATION
2,662
FEMALE POPULATION
161.65
MALES / 100 FEMALES
61.86
FEMALES / 100 MALES
35.0
MEDIAN AGE
3.8
AVG FAMILY SIZE
3.6
AVG HOUSEHOLD SIZE
2,308
LABOR FORCE [ PEOPLE ]
40.9%
PERCENT IN LABOR FORCE
4.2%
UNEMPLOYMENT RATE
Income in La Salle County
Income Overview in La Salle County
Per Capita Income in La Salle County is $15,492, while median incomes of families and households are $54,291 and $62,798 respectively.
| Characteristic | Number | Measure |
| Per Capita Income | 6,965 | $15,492 |
| Median Family Income | 1,411 | $54,291 |
| Mean Family Income | 1,411 | $60,767 |
| Median Household Income | 1,688 | $62,798 |
| Mean Household Income | 1,688 | $63,787 |
| Income Deficit | 1,411 | $8,622 |
| Wage / Income Gap (%) | 6,965 | 1.04% |
| Wage / Income Gap ($) | 6,965 | 98.96¢ per $1 |
| Gini / Inequality Index | 6,965 | 0.38 |
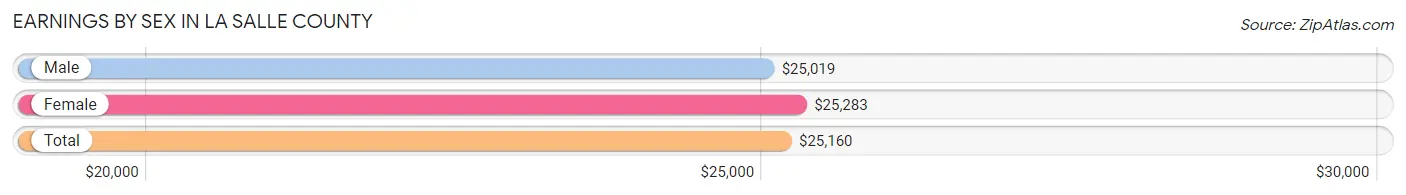
Earnings by Sex in La Salle County
Average Earnings in La Salle County are $25,160, $25,019 for men and $25,283 for women, a difference of 1.0%.
| Sex | Number | Average Earnings |
| Male | 1,621 (67.0%) | $25,019 |
| Female | 799 (33.0%) | $25,283 |
| Total | 2,420 (100.0%) | $25,160 |
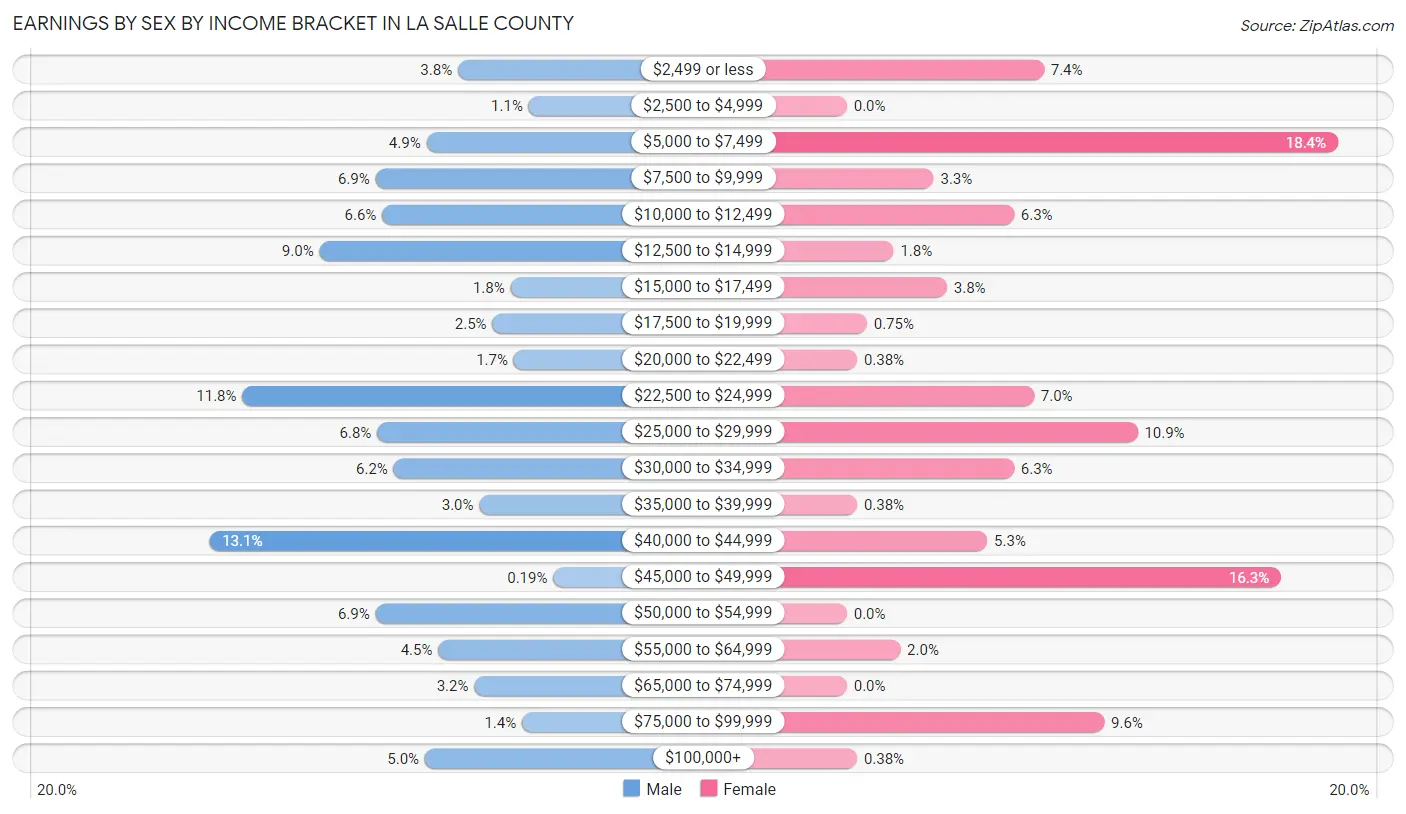
Earnings by Sex by Income Bracket in La Salle County
The most common earnings brackets in La Salle County are $40,000 to $44,999 for men (212 | 13.1%) and $5,000 to $7,499 for women (147 | 18.4%).
| Income | Male | Female |
| $2,499 or less | 61 (3.8%) | 59 (7.4%) |
| $2,500 to $4,999 | 18 (1.1%) | 0 (0.0%) |
| $5,000 to $7,499 | 80 (4.9%) | 147 (18.4%) |
| $7,500 to $9,999 | 111 (6.9%) | 26 (3.3%) |
| $10,000 to $12,499 | 107 (6.6%) | 50 (6.3%) |
| $12,500 to $14,999 | 145 (8.9%) | 14 (1.8%) |
| $15,000 to $17,499 | 29 (1.8%) | 30 (3.7%) |
| $17,500 to $19,999 | 40 (2.5%) | 6 (0.7%) |
| $20,000 to $22,499 | 27 (1.7%) | 3 (0.4%) |
| $22,500 to $24,999 | 192 (11.8%) | 56 (7.0%) |
| $25,000 to $29,999 | 110 (6.8%) | 87 (10.9%) |
| $30,000 to $34,999 | 100 (6.2%) | 50 (6.3%) |
| $35,000 to $39,999 | 48 (3.0%) | 3 (0.4%) |
| $40,000 to $44,999 | 212 (13.1%) | 42 (5.3%) |
| $45,000 to $49,999 | 3 (0.2%) | 130 (16.3%) |
| $50,000 to $54,999 | 111 (6.9%) | 0 (0.0%) |
| $55,000 to $64,999 | 73 (4.5%) | 16 (2.0%) |
| $65,000 to $74,999 | 51 (3.2%) | 0 (0.0%) |
| $75,000 to $99,999 | 22 (1.4%) | 77 (9.6%) |
| $100,000+ | 81 (5.0%) | 3 (0.4%) |
| Total | 1,621 (100.0%) | 799 (100.0%) |
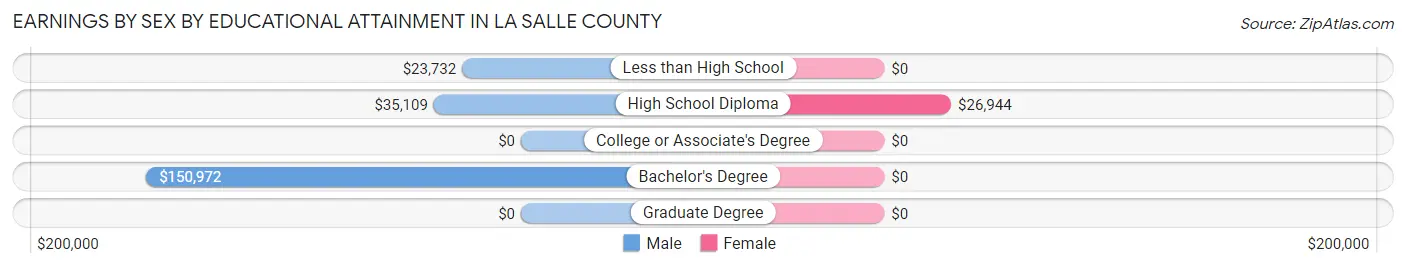
Earnings by Sex by Educational Attainment in La Salle County
Average earnings in La Salle County are $29,899 for men and $29,167 for women, a difference of 2.5%. Men with an educational attainment of bachelor's degree enjoy the highest average annual earnings of $150,972, while those with less than high school education earn the least with $23,732. Women with an educational attainment of high school diploma earn the most with the average annual earnings of $26,944, while those with high school diploma education have the smallest earnings of $26,944.
| Educational Attainment | Male Income | Female Income |
| Less than High School | $23,732 | $0 |
| High School Diploma | $35,109 | $26,944 |
| College or Associate's Degree | - | - |
| Bachelor's Degree | $150,972 | $0 |
| Graduate Degree | - | - |
| Total | $29,899 | $29,167 |
Family Income in La Salle County
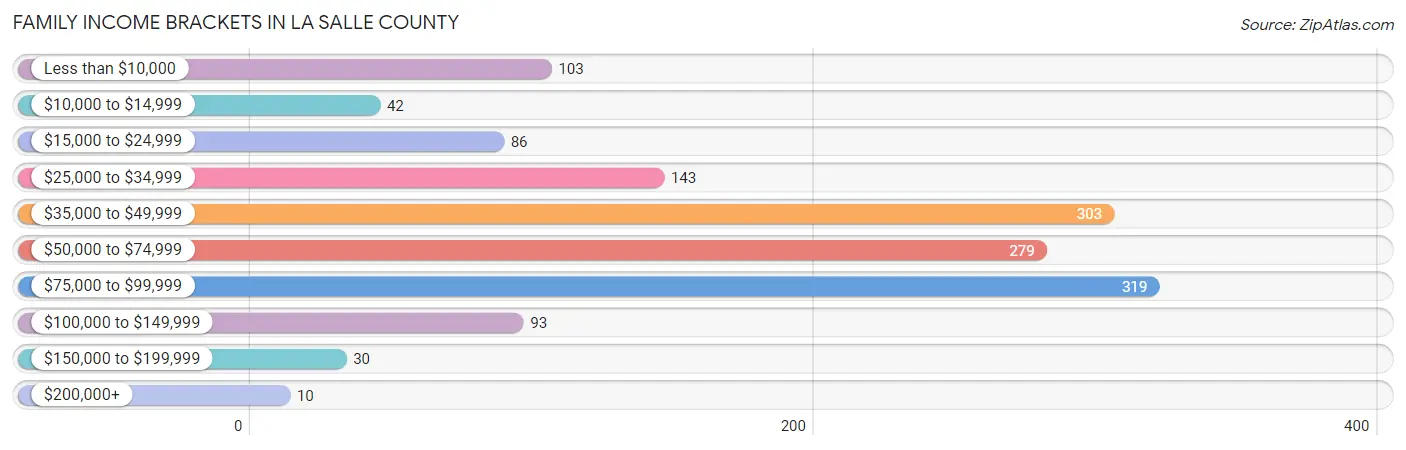
Family Income Brackets in La Salle County
According to the La Salle County family income data, there are 319 families falling into the $75,000 to $99,999 income range, which is the most common income bracket and makes up 22.6% of all families. Conversely, the $200,000+ income bracket is the least frequent group with only 10 families (0.7%) belonging to this category.
| Income Bracket | # Families | % Families |
| Less than $10,000 | 103 | 7.3% |
| $10,000 to $14,999 | 42 | 3.0% |
| $15,000 to $24,999 | 86 | 6.1% |
| $25,000 to $34,999 | 143 | 10.1% |
| $35,000 to $49,999 | 303 | 21.5% |
| $50,000 to $74,999 | 279 | 19.8% |
| $75,000 to $99,999 | 319 | 22.6% |
| $100,000 to $149,999 | 93 | 6.6% |
| $150,000 to $199,999 | 30 | 2.1% |
| $200,000+ | 10 | 0.7% |
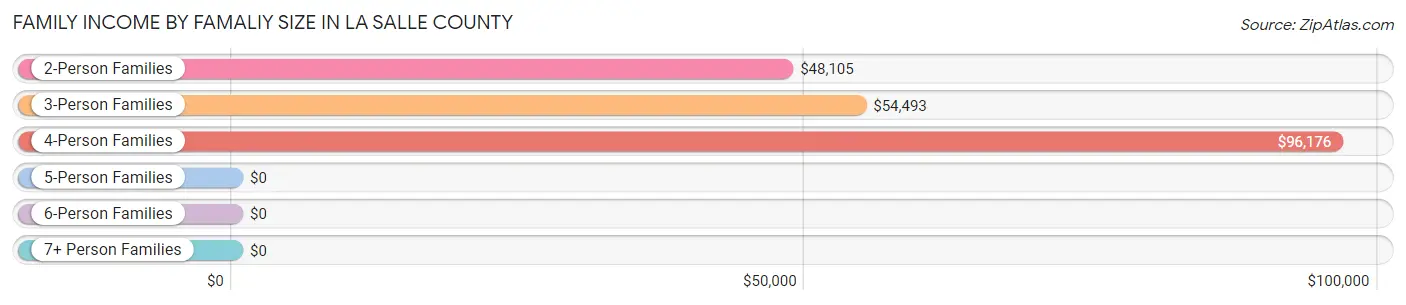
Family Income by Famaliy Size in La Salle County
4-person families (148 | 10.5%) account for the highest median family income in La Salle County with $96,176 per family, while 2-person families (443 | 31.4%) have the highest median income of $24,052 per family member.
| Income Bracket | # Families | Median Income |
| 2-Person Families | 443 (31.4%) | $48,105 |
| 3-Person Families | 519 (36.8%) | $54,493 |
| 4-Person Families | 148 (10.5%) | $96,176 |
| 5-Person Families | 207 (14.7%) | $0 |
| 6-Person Families | 94 (6.7%) | $0 |
| 7+ Person Families | 0 (0.0%) | $0 |
| Total | 1,411 (100.0%) | $54,291 |
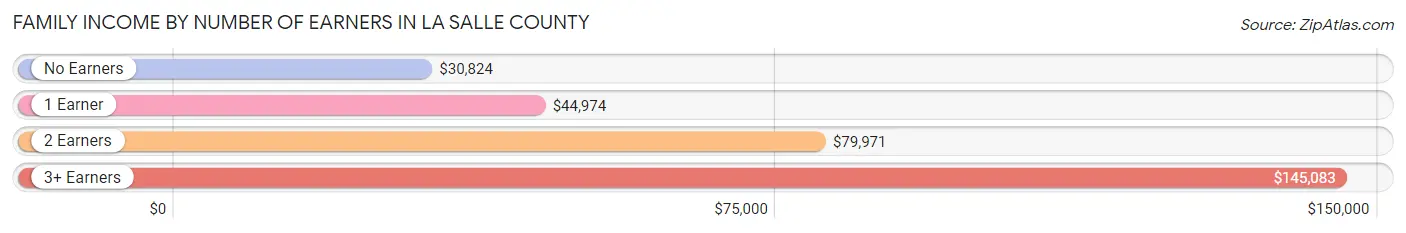
Family Income by Number of Earners in La Salle County
The median family income in La Salle County is $54,291, with families comprising 3+ earners (69) having the highest median family income of $145,083, while families with no earners (235) have the lowest median family income of $30,824, accounting for 4.9% and 16.7% of families, respectively.
| Number of Earners | # Families | Median Income |
| No Earners | 235 (16.7%) | $30,824 |
| 1 Earner | 723 (51.2%) | $44,974 |
| 2 Earners | 384 (27.2%) | $79,971 |
| 3+ Earners | 69 (4.9%) | $145,083 |
| Total | 1,411 (100.0%) | $54,291 |
Household Income in La Salle County
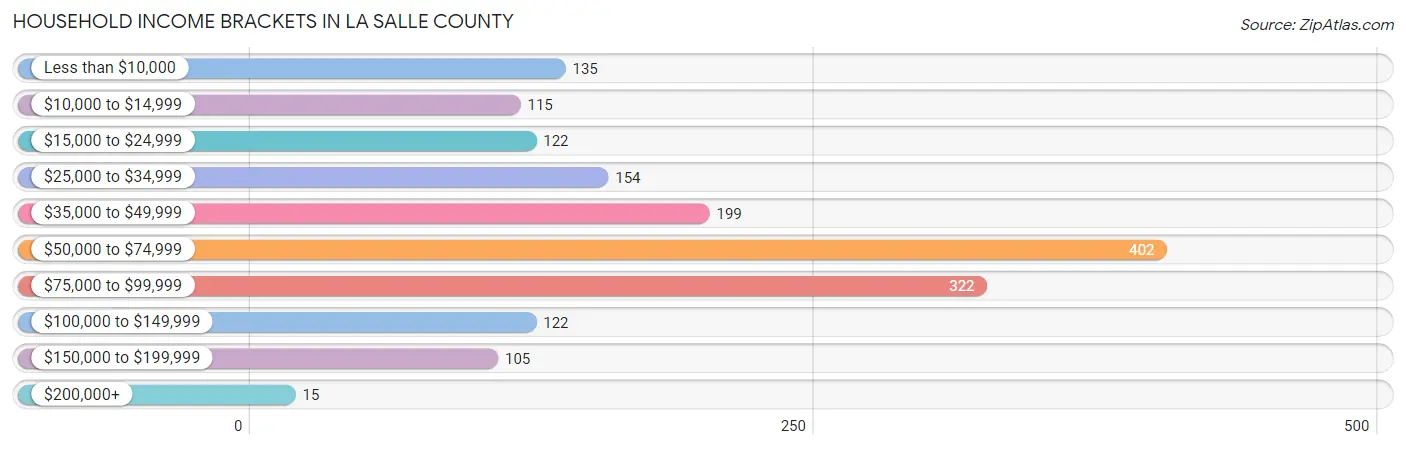
Household Income Brackets in La Salle County
With 402 households falling in the category, the $50,000 to $74,999 income range is the most frequent in La Salle County, accounting for 23.8% of all households. In contrast, only 15 households (0.9%) fall into the $200,000+ income bracket, making it the least populous group.
| Income Bracket | # Households | % Households |
| Less than $10,000 | 135 | 8.0% |
| $10,000 to $14,999 | 115 | 6.8% |
| $15,000 to $24,999 | 122 | 7.2% |
| $25,000 to $34,999 | 154 | 9.1% |
| $35,000 to $49,999 | 199 | 11.8% |
| $50,000 to $74,999 | 402 | 23.8% |
| $75,000 to $99,999 | 322 | 19.1% |
| $100,000 to $149,999 | 122 | 7.2% |
| $150,000 to $199,999 | 105 | 6.2% |
| $200,000+ | 15 | 0.9% |
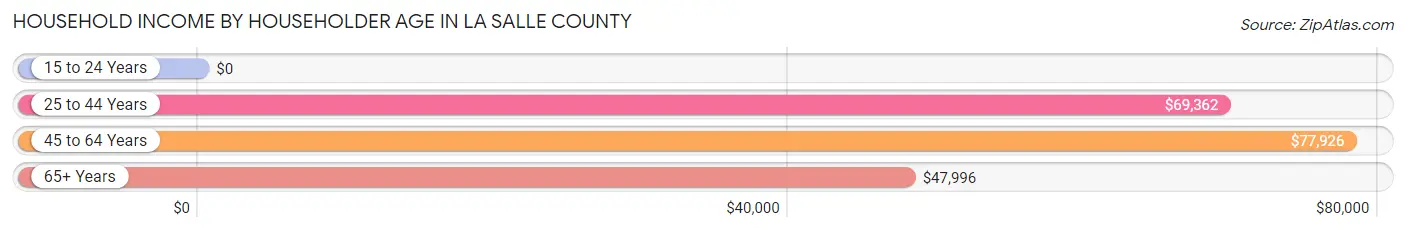
Household Income by Householder Age in La Salle County
The median household income in La Salle County is $62,798, with the highest median household income of $77,926 found in the 45 to 64 years age bracket for the primary householder. A total of 525 households (31.1%) fall into this category. Meanwhile, the 15 to 24 years age bracket for the primary householder has the lowest median household income of $0, with 21 households (1.2%) in this group.
| Income Bracket | # Households | Median Income |
| 15 to 24 Years | 21 (1.2%) | $0 |
| 25 to 44 Years | 526 (31.2%) | $69,362 |
| 45 to 64 Years | 525 (31.1%) | $77,926 |
| 65+ Years | 616 (36.5%) | $47,996 |
| Total | 1,688 (100.0%) | $62,798 |
Poverty in La Salle County
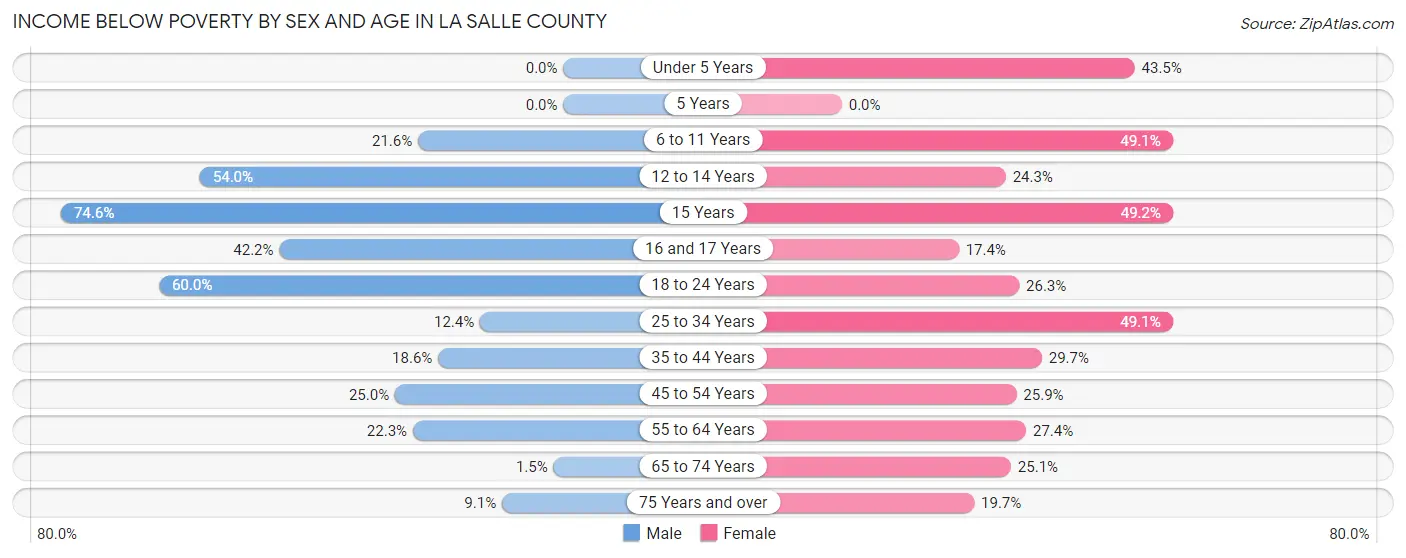
Income Below Poverty by Sex and Age in La Salle County
With 26.2% poverty level for males and 30.3% for females among the residents of La Salle County, 15 year old males and 15 year old females are the most vulnerable to poverty, with 91 males (74.6%) and 29 females (49.1%) in their respective age groups living below the poverty level.
| Age Bracket | Male | Female |
| Under 5 Years | 0 (0.0%) | 40 (43.5%) |
| 5 Years | 0 (0.0%) | 0 (0.0%) |
| 6 to 11 Years | 79 (21.6%) | 140 (49.1%) |
| 12 to 14 Years | 68 (54.0%) | 37 (24.3%) |
| 15 Years | 91 (74.6%) | 29 (49.1%) |
| 16 and 17 Years | 35 (42.2%) | 25 (17.4%) |
| 18 to 24 Years | 308 (60.0%) | 79 (26.3%) |
| 25 to 34 Years | 71 (12.4%) | 82 (49.1%) |
| 35 to 44 Years | 50 (18.6%) | 120 (29.7%) |
| 45 to 54 Years | 79 (25.0%) | 70 (25.9%) |
| 55 to 64 Years | 65 (22.3%) | 55 (27.4%) |
| 65 to 74 Years | 3 (1.5%) | 55 (25.1%) |
| 75 Years and over | 35 (9.1%) | 67 (19.7%) |
| Total | 884 (26.2%) | 799 (30.3%) |
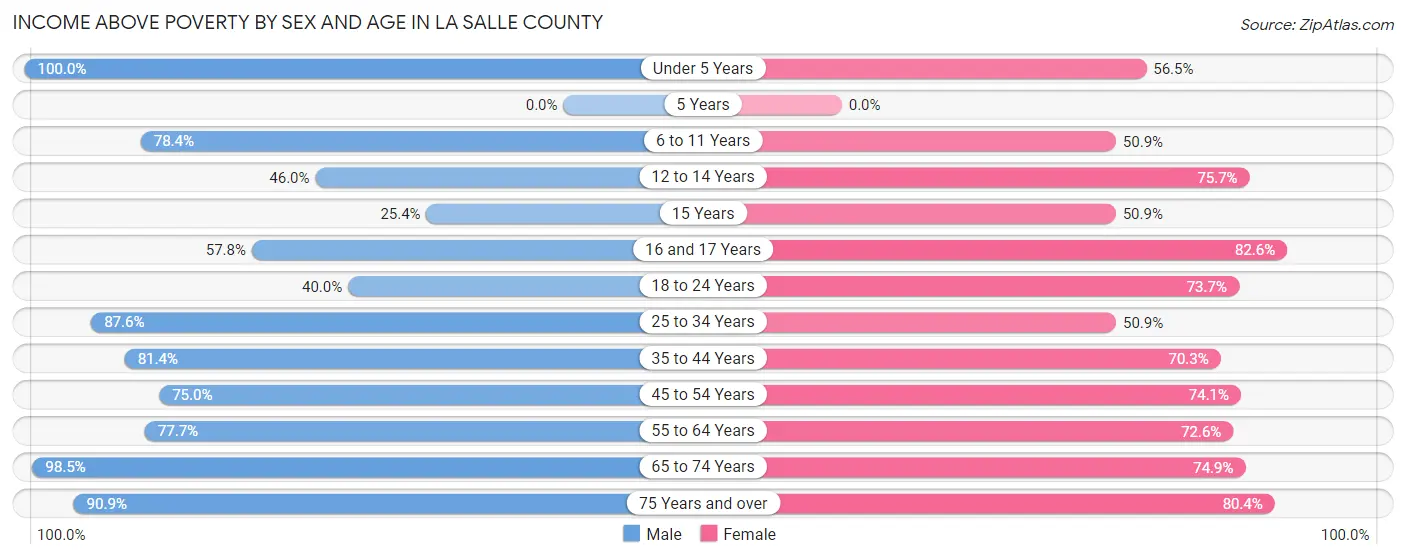
Income Above Poverty by Sex and Age in La Salle County
According to the poverty statistics in La Salle County, males aged under 5 years and females aged 16 and 17 years are the age groups that are most secure financially, with 100.0% of males and 82.6% of females in these age groups living above the poverty line.
| Age Bracket | Male | Female |
| Under 5 Years | 120 (100.0%) | 52 (56.5%) |
| 5 Years | 0 (0.0%) | 0 (0.0%) |
| 6 to 11 Years | 287 (78.4%) | 145 (50.9%) |
| 12 to 14 Years | 58 (46.0%) | 115 (75.7%) |
| 15 Years | 31 (25.4%) | 30 (50.8%) |
| 16 and 17 Years | 48 (57.8%) | 119 (82.6%) |
| 18 to 24 Years | 205 (40.0%) | 221 (73.7%) |
| 25 to 34 Years | 503 (87.6%) | 85 (50.9%) |
| 35 to 44 Years | 219 (81.4%) | 284 (70.3%) |
| 45 to 54 Years | 237 (75.0%) | 200 (74.1%) |
| 55 to 64 Years | 226 (77.7%) | 146 (72.6%) |
| 65 to 74 Years | 203 (98.5%) | 164 (74.9%) |
| 75 Years and over | 349 (90.9%) | 274 (80.3%) |
| Total | 2,486 (73.8%) | 1,835 (69.7%) |
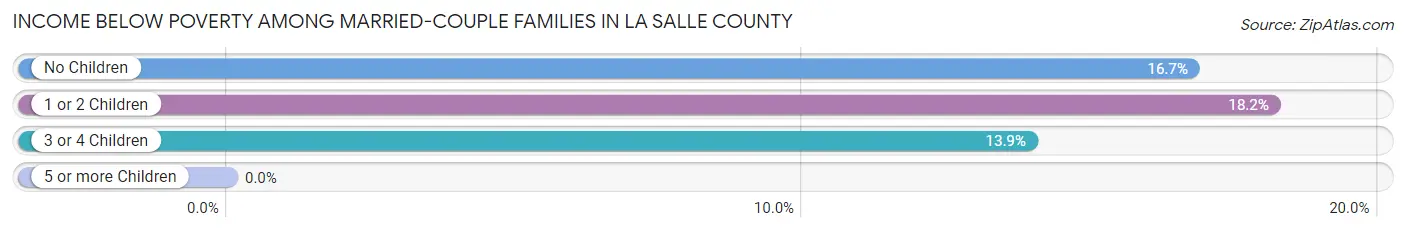
Income Below Poverty Among Married-Couple Families in La Salle County
The poverty statistics for married-couple families in La Salle County show that 16.9% or 174 of the total 1,027 families live below the poverty line. Families with 1 or 2 children have the highest poverty rate of 18.1%, comprising of 55 families. On the other hand, families with 3 or 4 children have the lowest poverty rate of 13.9%, which includes 11 families.
| Children | Above Poverty | Below Poverty |
| No Children | 537 (83.3%) | 108 (16.7%) |
| 1 or 2 Children | 248 (81.9%) | 55 (18.1%) |
| 3 or 4 Children | 68 (86.1%) | 11 (13.9%) |
| 5 or more Children | 0 (0.0%) | 0 (0.0%) |
| Total | 853 (83.1%) | 174 (16.9%) |
Income Below Poverty Among Single-Parent Households in La Salle County
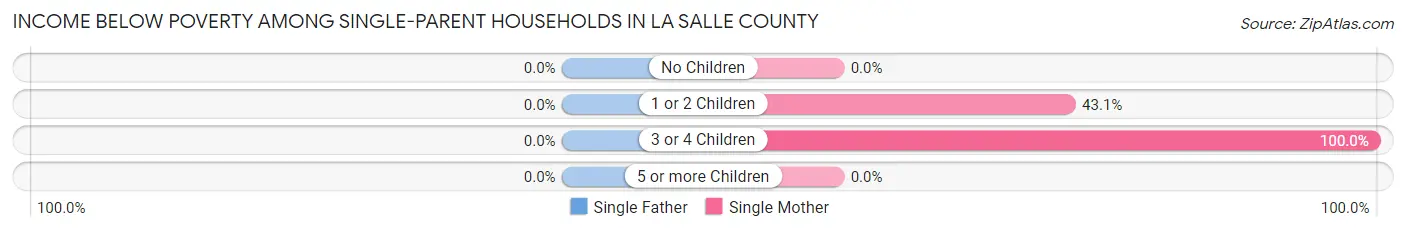
| Children | Single Father | Single Mother |
| No Children | 0 (0.0%) | 0 (0.0%) |
| 1 or 2 Children | 0 (0.0%) | 47 (43.1%) |
| 3 or 4 Children | 0 (0.0%) | 46 (100.0%) |
| 5 or more Children | 0 (0.0%) | 0 (0.0%) |
| Total | 0 (0.0%) | 93 (49.5%) |
Income Below Poverty Among Married-Couple vs Single-Parent Households in La Salle County
The poverty data for La Salle County shows that 174 of the married-couple family households (16.9%) and 93 of the single-parent households (24.2%) are living below the poverty level. Within the married-couple family households, those with 1 or 2 children have the highest poverty rate, with 55 households (18.1%) falling below the poverty line. Among the single-parent households, those with 3 or 4 children have the highest poverty rate, with 46 household (100.0%) living below poverty.
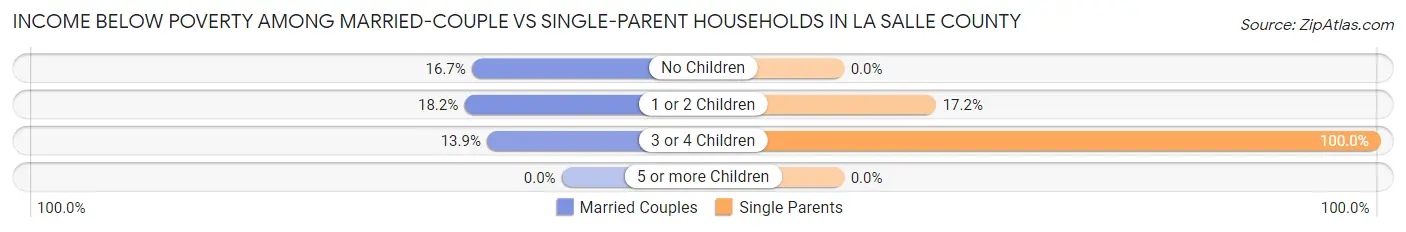
| Children | Married-Couple Families | Single-Parent Households |
| No Children | 108 (16.7%) | 0 (0.0%) |
| 1 or 2 Children | 55 (18.1%) | 47 (17.2%) |
| 3 or 4 Children | 11 (13.9%) | 46 (100.0%) |
| 5 or more Children | 0 (0.0%) | 0 (0.0%) |
| Total | 174 (16.9%) | 93 (24.2%) |
Race in La Salle County
The most populous races in La Salle County are Hispanic or Latino (6,090 | 87.4%), White / Caucasian (3,627 | 52.1%), and Two or more Races (2,239 | 32.2%).
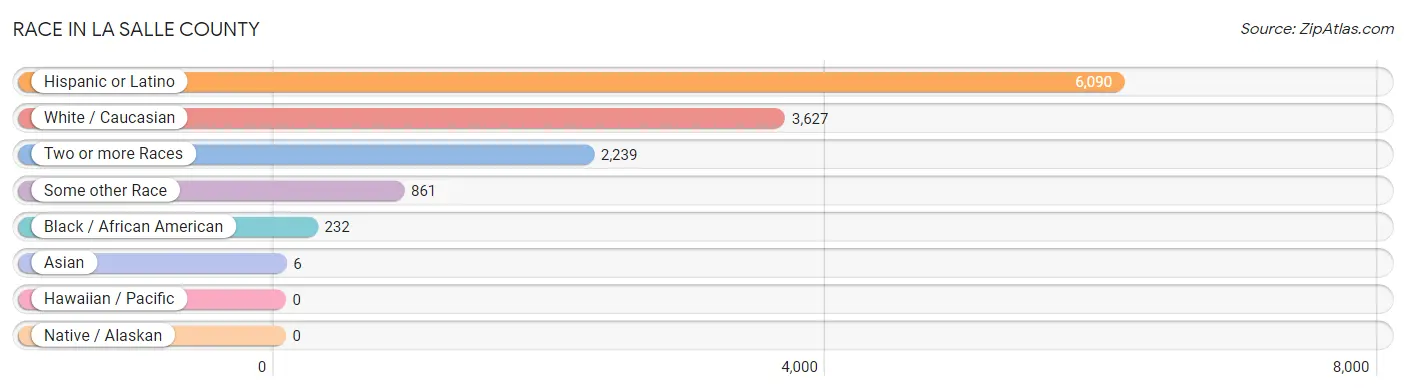
| Race | # Population | % Population |
| Asian | 6 | 0.1% |
| Black / African American | 232 | 3.3% |
| Hawaiian / Pacific | 0 | 0.0% |
| Hispanic or Latino | 6,090 | 87.4% |
| Native / Alaskan | 0 | 0.0% |
| White / Caucasian | 3,627 | 52.1% |
| Two or more Races | 2,239 | 32.2% |
| Some other Race | 861 | 12.4% |
| Total | 6,965 | 100.0% |
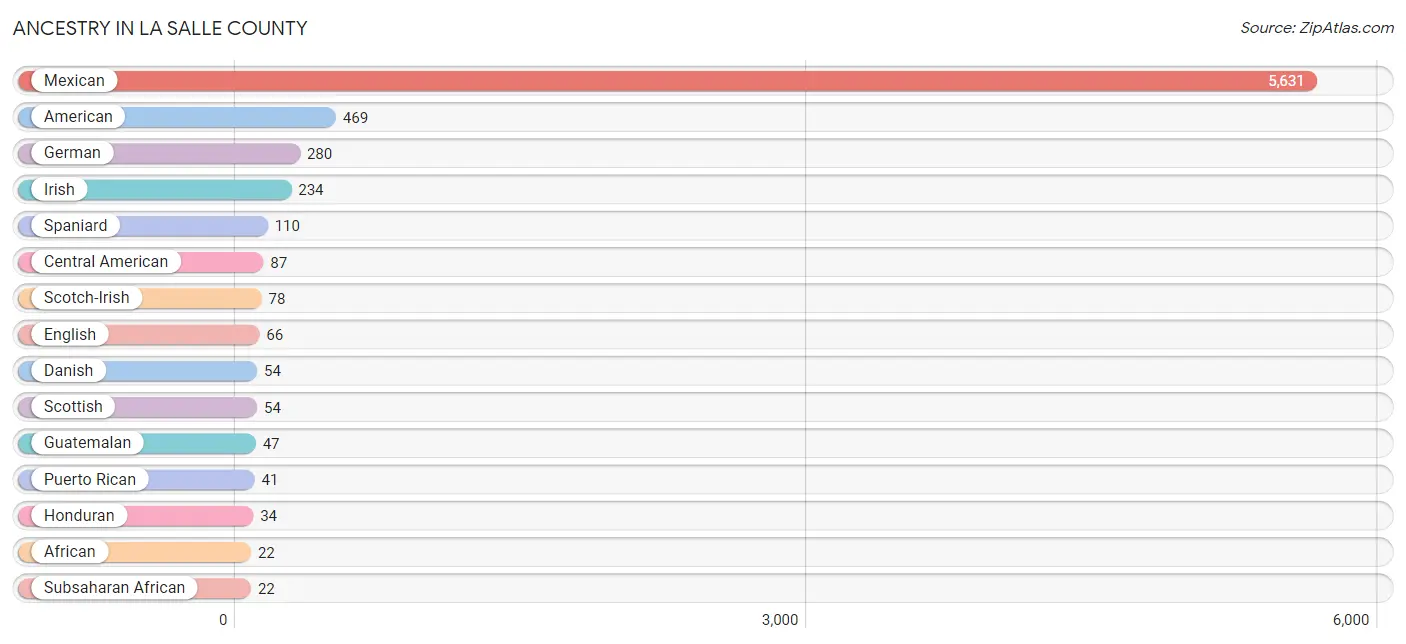
Ancestry in La Salle County
The most populous ancestries reported in La Salle County are Mexican (5,631 | 80.8%), American (469 | 6.7%), German (280 | 4.0%), Irish (234 | 3.4%), and Spaniard (110 | 1.6%), together accounting for 96.5% of all La Salle County residents.
| Ancestry | # Population | % Population |
| African | 22 | 0.3% |
| American | 469 | 6.7% |
| Apache | 7 | 0.1% |
| British | 13 | 0.2% |
| Central American | 87 | 1.3% |
| Danish | 54 | 0.8% |
| English | 66 | 0.9% |
| European | 7 | 0.1% |
| German | 280 | 4.0% |
| Guatemalan | 47 | 0.7% |
| Honduran | 34 | 0.5% |
| Irish | 234 | 3.4% |
| Jamaican | 7 | 0.1% |
| Mexican | 5,631 | 80.8% |
| Norwegian | 7 | 0.1% |
| Polish | 14 | 0.2% |
| Puerto Rican | 41 | 0.6% |
| Salvadoran | 6 | 0.1% |
| Scotch-Irish | 78 | 1.1% |
| Scottish | 54 | 0.8% |
| Spaniard | 110 | 1.6% |
| Sri Lankan | 6 | 0.1% |
| Subsaharan African | 22 | 0.3% | View All 23 Rows |
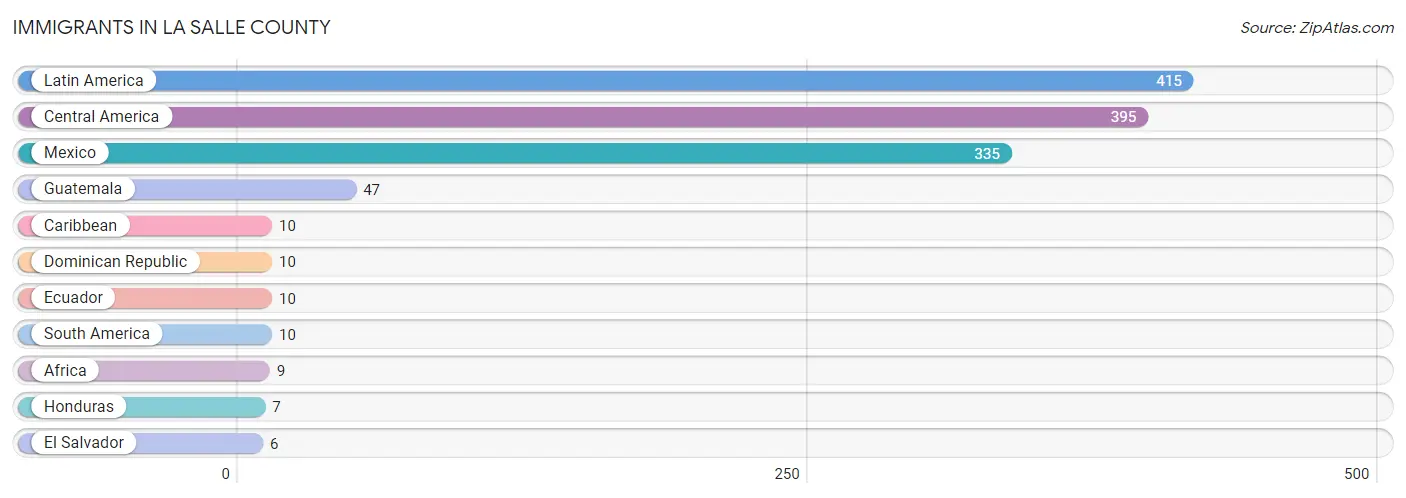
Immigrants in La Salle County
The most numerous immigrant groups reported in La Salle County came from Latin America (415 | 6.0%), Central America (395 | 5.7%), Mexico (335 | 4.8%), Guatemala (47 | 0.7%), and Caribbean (10 | 0.1%), together accounting for 17.3% of all La Salle County residents.
| Immigration Origin | # Population | % Population |
| Africa | 9 | 0.1% |
| Caribbean | 10 | 0.1% |
| Central America | 395 | 5.7% |
| Dominican Republic | 10 | 0.1% |
| Ecuador | 10 | 0.1% |
| El Salvador | 6 | 0.1% |
| Guatemala | 47 | 0.7% |
| Honduras | 7 | 0.1% |
| Latin America | 415 | 6.0% |
| Mexico | 335 | 4.8% |
| South America | 10 | 0.1% | View All 11 Rows |
Sex and Age in La Salle County
Sex and Age in La Salle County
The most populous age groups in La Salle County are 15 to 19 Years (615 | 14.3%) for men and 35 to 39 Years (300 | 11.3%) for women.
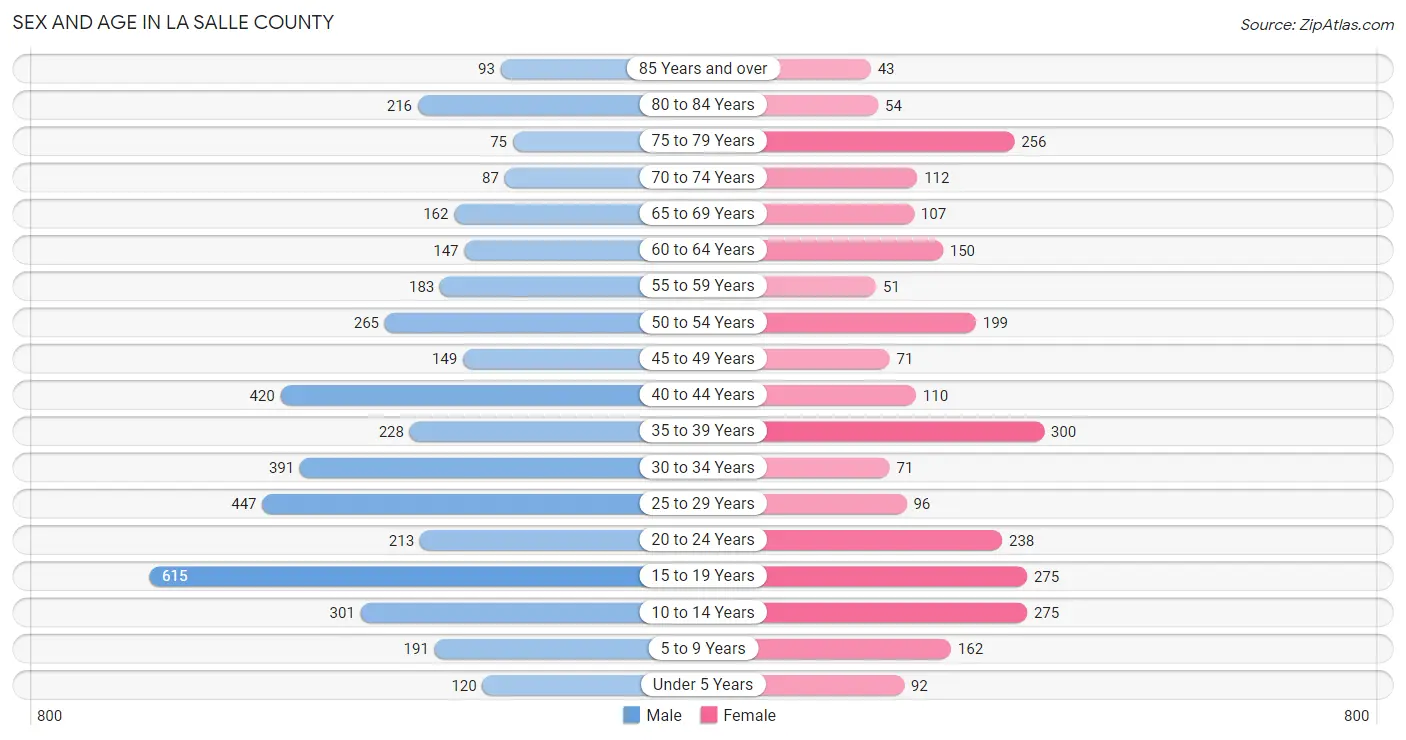
| Age Bracket | Male | Female |
| Under 5 Years | 120 (2.8%) | 92 (3.5%) |
| 5 to 9 Years | 191 (4.4%) | 162 (6.1%) |
| 10 to 14 Years | 301 (7.0%) | 275 (10.3%) |
| 15 to 19 Years | 615 (14.3%) | 275 (10.3%) |
| 20 to 24 Years | 213 (5.0%) | 238 (8.9%) |
| 25 to 29 Years | 447 (10.4%) | 96 (3.6%) |
| 30 to 34 Years | 391 (9.1%) | 71 (2.7%) |
| 35 to 39 Years | 228 (5.3%) | 300 (11.3%) |
| 40 to 44 Years | 420 (9.8%) | 110 (4.1%) |
| 45 to 49 Years | 149 (3.5%) | 71 (2.7%) |
| 50 to 54 Years | 265 (6.2%) | 199 (7.5%) |
| 55 to 59 Years | 183 (4.3%) | 51 (1.9%) |
| 60 to 64 Years | 147 (3.4%) | 150 (5.6%) |
| 65 to 69 Years | 162 (3.8%) | 107 (4.0%) |
| 70 to 74 Years | 87 (2.0%) | 112 (4.2%) |
| 75 to 79 Years | 75 (1.7%) | 256 (9.6%) |
| 80 to 84 Years | 216 (5.0%) | 54 (2.0%) |
| 85 Years and over | 93 (2.2%) | 43 (1.6%) |
| Total | 4,303 (100.0%) | 2,662 (100.0%) |
Families and Households in La Salle County
Median Family Size in La Salle County
The median family size in La Salle County is 3.81 persons per family, with single female/mother families (188 | 13.3%) accounting for the largest median family size of 5.91 persons per family. On the other hand, single male/father families (196 | 13.9%) represent the smallest median family size with 2.61 persons per family.
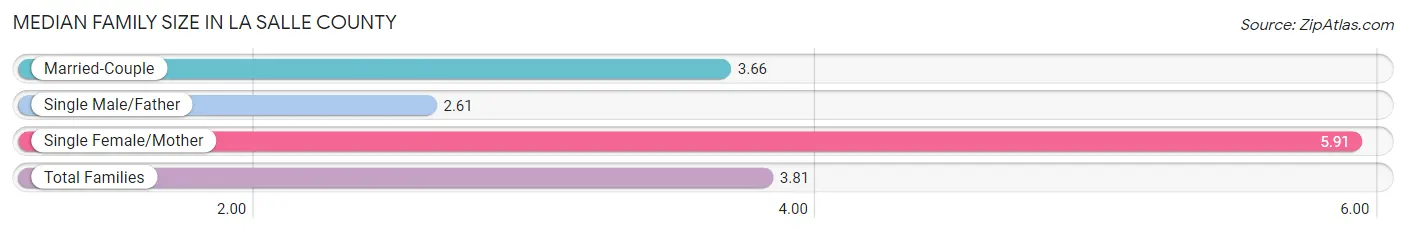
| Family Type | # Families | Family Size |
| Married-Couple | 1,027 (72.8%) | 3.66 |
| Single Male/Father | 196 (13.9%) | 2.61 |
| Single Female/Mother | 188 (13.3%) | 5.91 |
| Total Families | 1,411 (100.0%) | 3.81 |
Median Household Size in La Salle County
The median household size in La Salle County is 3.56 persons per household, with single female/mother households (188 | 11.1%) accounting for the largest median household size of 5.96 persons per household. non-family households (277 | 16.4%) represent the smallest median household size with 1.56 persons per household.
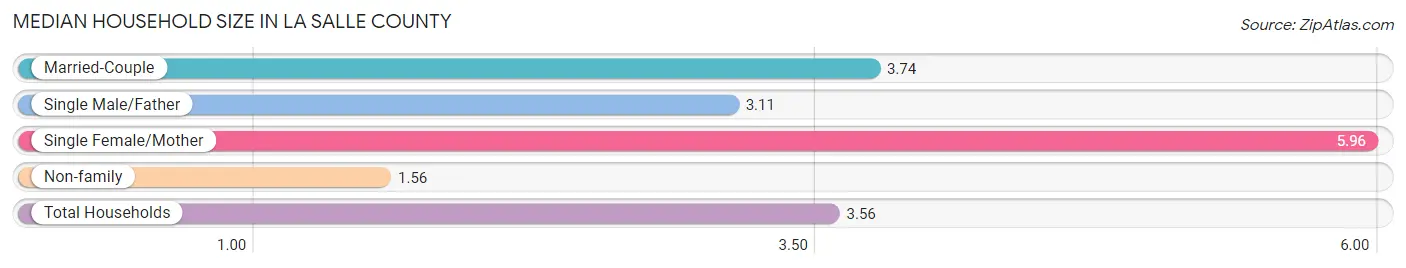
| Household Type | # Households | Household Size |
| Married-Couple | 1,027 (60.8%) | 3.74 |
| Single Male/Father | 196 (11.6%) | 3.11 |
| Single Female/Mother | 188 (11.1%) | 5.96 |
| Non-family | 277 (16.4%) | 1.56 |
| Total Households | 1,688 (100.0%) | 3.56 |
Household Size by Marriage Status in La Salle County
Out of a total of 1,688 households in La Salle County, 1,411 (83.6%) are family households, while 277 (16.4%) are nonfamily households. The most numerous type of family households are 2-person households, comprising 443, and the most common type of nonfamily households are 1-person households, comprising 217.
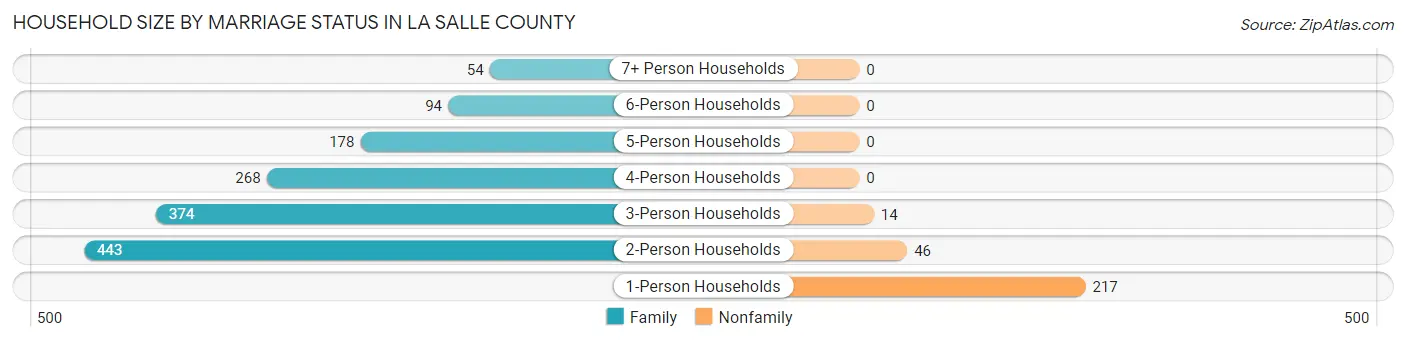
| Household Size | Family Households | Nonfamily Households |
| 1-Person Households | - | 217 (12.9%) |
| 2-Person Households | 443 (26.2%) | 46 (2.7%) |
| 3-Person Households | 374 (22.2%) | 14 (0.8%) |
| 4-Person Households | 268 (15.9%) | 0 (0.0%) |
| 5-Person Households | 178 (10.5%) | 0 (0.0%) |
| 6-Person Households | 94 (5.6%) | 0 (0.0%) |
| 7+ Person Households | 54 (3.2%) | 0 (0.0%) |
| Total | 1,411 (83.6%) | 277 (16.4%) |
Female Fertility in La Salle County
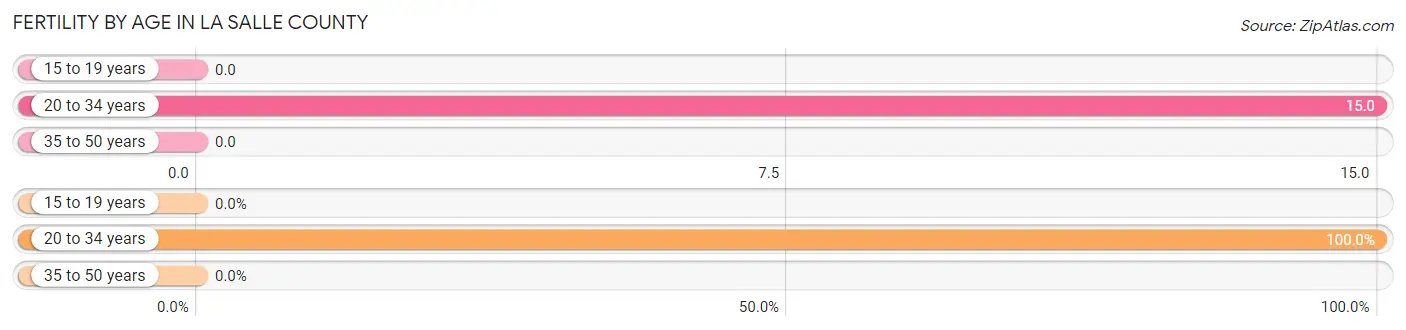
Fertility by Age in La Salle County
Average fertility rate in La Salle County is 5.0 births per 1,000 women. Women in the age bracket of 20 to 34 years have the highest fertility rate with 15.0 births per 1,000 women. Women in the age bracket of 20 to 34 years acount for 100.0% of all women with births.
| Age Bracket | Women with Births | Births / 1,000 Women |
| 15 to 19 years | 0 (0.0%) | 0.0 |
| 20 to 34 years | 6 (100.0%) | 15.0 |
| 35 to 50 years | 0 (0.0%) | 0.0 |
| Total | 6 (100.0%) | 5.0 |
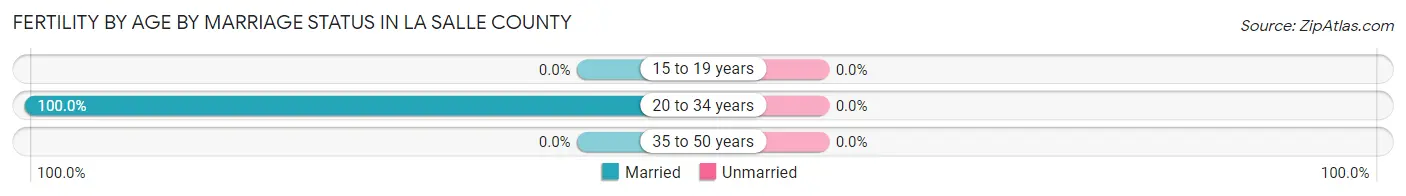
Fertility by Age by Marriage Status in La Salle County
| Age Bracket | Married | Unmarried |
| 15 to 19 years | 0 (0.0%) | 0 (0.0%) |
| 20 to 34 years | 6 (100.0%) | 0 (0.0%) |
| 35 to 50 years | 0 (0.0%) | 0 (0.0%) |
| Total | 6 (100.0%) | 0 (0.0%) |
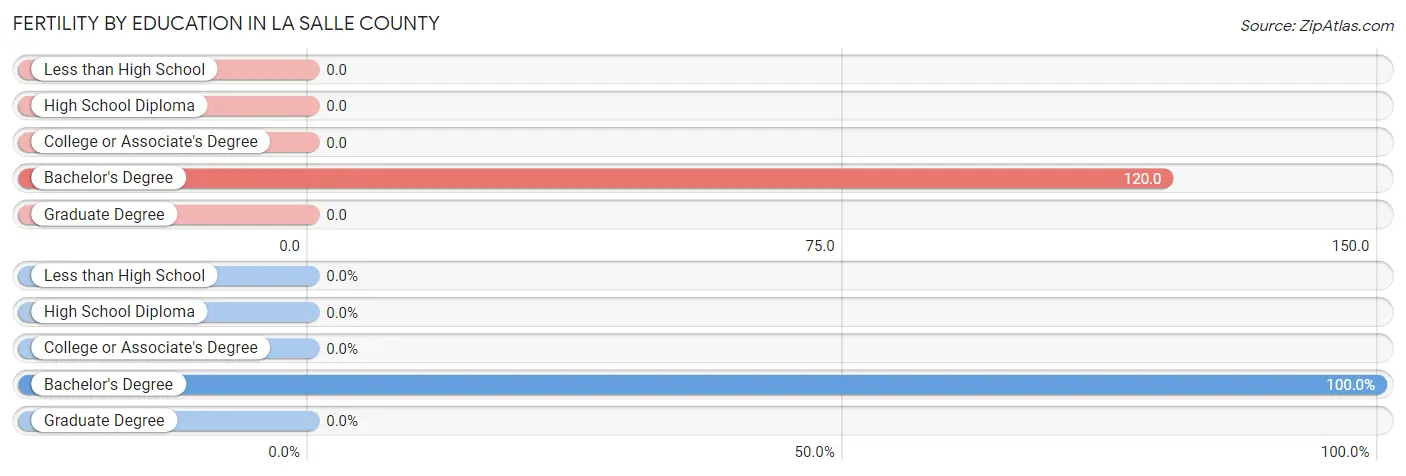
Fertility by Education in La Salle County
| Educational Attainment | Women with Births | Births / 1,000 Women |
| Less than High School | 0 (0.0%) | 0.0 |
| High School Diploma | 0 (0.0%) | 0.0 |
| College or Associate's Degree | 0 (0.0%) | 0.0 |
| Bachelor's Degree | 6 (100.0%) | 120.0 |
| Graduate Degree | 0 (0.0%) | 0.0 |
| Total | 6 (100.0%) | 5.0 |
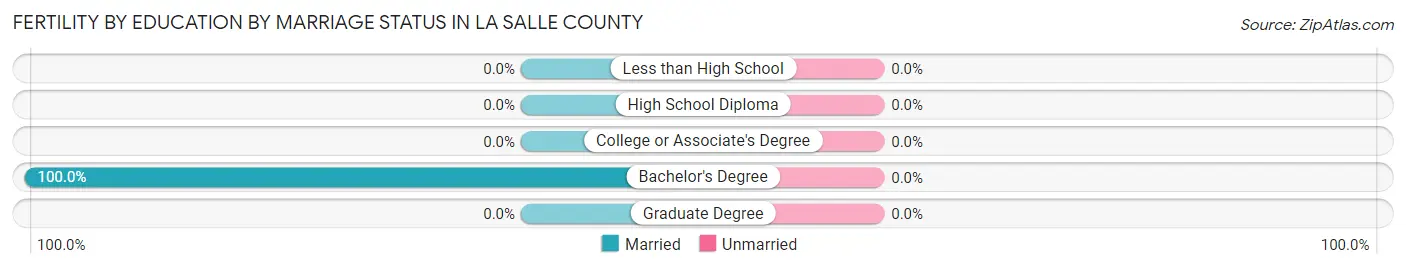
Fertility by Education by Marriage Status in La Salle County
| Educational Attainment | Married | Unmarried |
| Less than High School | 0 (0.0%) | 0 (0.0%) |
| High School Diploma | 0 (0.0%) | 0 (0.0%) |
| College or Associate's Degree | 0 (0.0%) | 0 (0.0%) |
| Bachelor's Degree | 6 (100.0%) | 0 (0.0%) |
| Graduate Degree | 0 (0.0%) | 0 (0.0%) |
| Total | 6 (100.0%) | 0 (0.0%) |
Employment Characteristics in La Salle County
Employment by Class of Employer in La Salle County
Among the 2,207 employed individuals in La Salle County, private company employees (1,303 | 59.0%), local government employees (352 | 16.0%), and self-employed (not incorporated) (198 | 9.0%) make up the most common classes of employment.
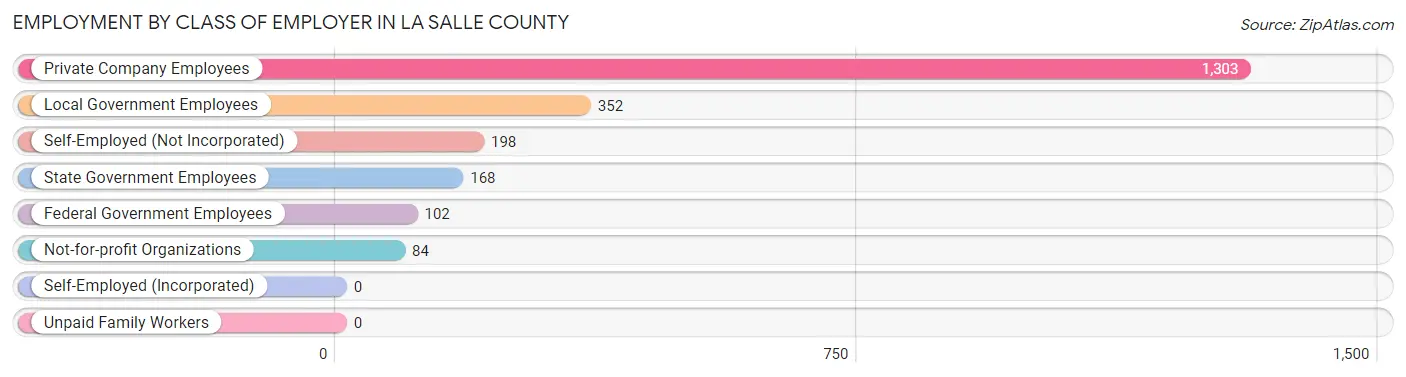
| Employer Class | # Employees | % Employees |
| Private Company Employees | 1,303 | 59.0% |
| Self-Employed (Incorporated) | 0 | 0.0% |
| Self-Employed (Not Incorporated) | 198 | 9.0% |
| Not-for-profit Organizations | 84 | 3.8% |
| Local Government Employees | 352 | 16.0% |
| State Government Employees | 168 | 7.6% |
| Federal Government Employees | 102 | 4.6% |
| Unpaid Family Workers | 0 | 0.0% |
| Total | 2,207 | 100.0% |
Employment Status by Age in La Salle County
According to the labor force statistics for La Salle County, out of the total population over 16 years of age (5,643), 40.9% or 2,308 individuals are in the labor force, with 4.2% or 97 of them unemployed. The age group with the highest labor force participation rate is 45 to 54 years, with 74.1% or 507 individuals in the labor force. Within the labor force, the 45 to 54 years age range has the highest percentage of unemployed individuals, with 17.0% or 86 of them being unemployed.
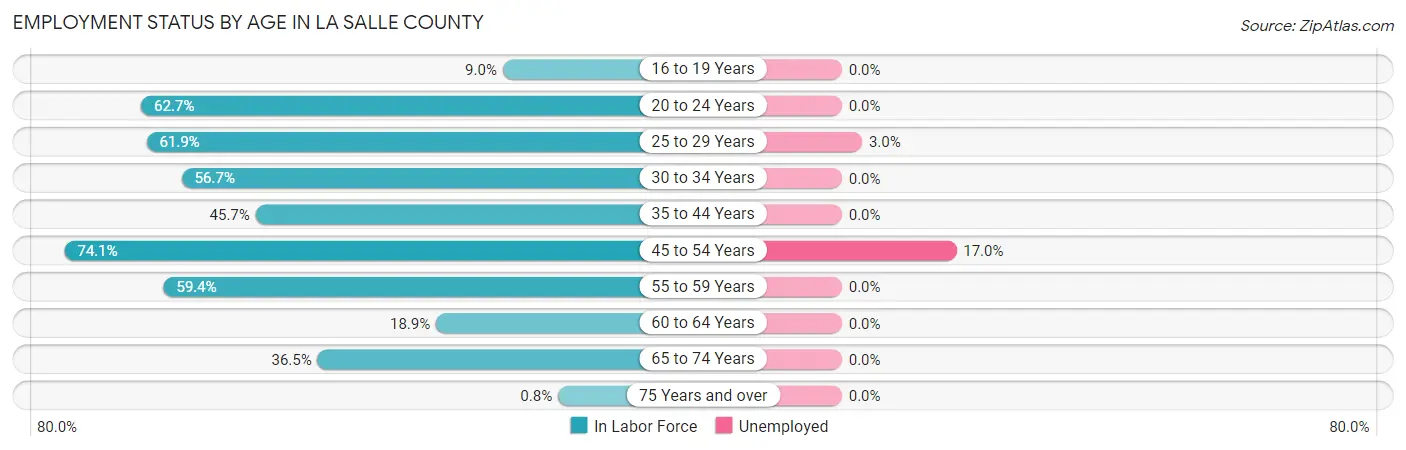
| Age Bracket | In Labor Force | Unemployed |
| 16 to 19 Years | 64 (9.0%) | 0 (0.0%) |
| 20 to 24 Years | 283 (62.7%) | 0 (0.0%) |
| 25 to 29 Years | 336 (61.9%) | 10 (3.0%) |
| 30 to 34 Years | 262 (56.7%) | 0 (0.0%) |
| 35 to 44 Years | 484 (45.7%) | 0 (0.0%) |
| 45 to 54 Years | 507 (74.1%) | 86 (17.0%) |
| 55 to 59 Years | 139 (59.4%) | 0 (0.0%) |
| 60 to 64 Years | 56 (18.9%) | 0 (0.0%) |
| 65 to 74 Years | 171 (36.5%) | 0 (0.0%) |
| 75 Years and over | 6 (0.8%) | 0 (0.0%) |
| Total | 2,308 (40.9%) | 97 (4.2%) |
Employment Status by Educational Attainment in La Salle County
According to labor force statistics for La Salle County, 54.4% of individuals (1,783) out of the total population between 25 and 64 years of age (3,278) are in the labor force, with 5.4% or 96 of them being unemployed. The group with the highest labor force participation rate are those with the educational attainment of bachelor's degree or higher, with 73.6% or 162 individuals in the labor force. Within the labor force, individuals with less than high school education have the highest percentage of unemployment, with 17.5% or 57 of them being unemployed.
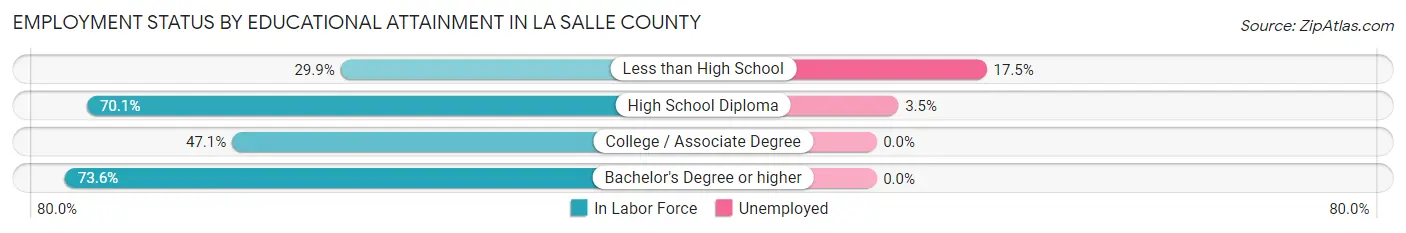
| Educational Attainment | In Labor Force | Unemployed |
| Less than High School | 325 (29.9%) | 190 (17.5%) |
| High School Diploma | 1,124 (70.1%) | 56 (3.5%) |
| College / Associate Degree | 173 (47.1%) | 0 (0.0%) |
| Bachelor's Degree or higher | 162 (73.6%) | 0 (0.0%) |
| Total | 1,783 (54.4%) | 177 (5.4%) |
Employment Occupations by Sex in La Salle County
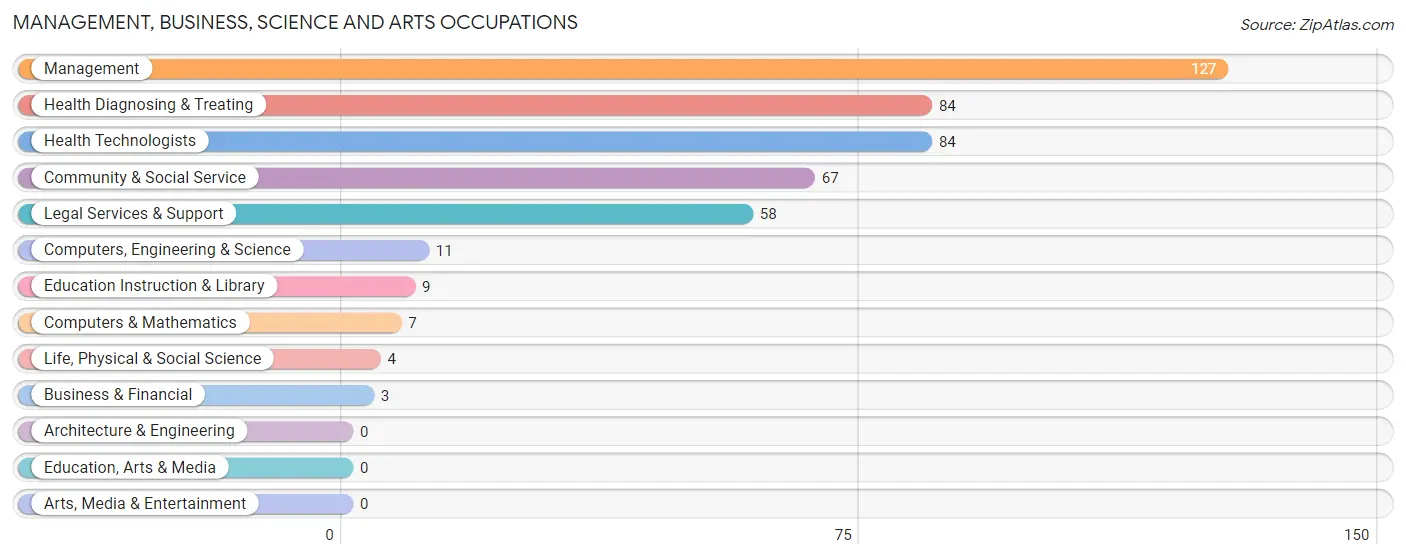
Management, Business, Science and Arts Occupations
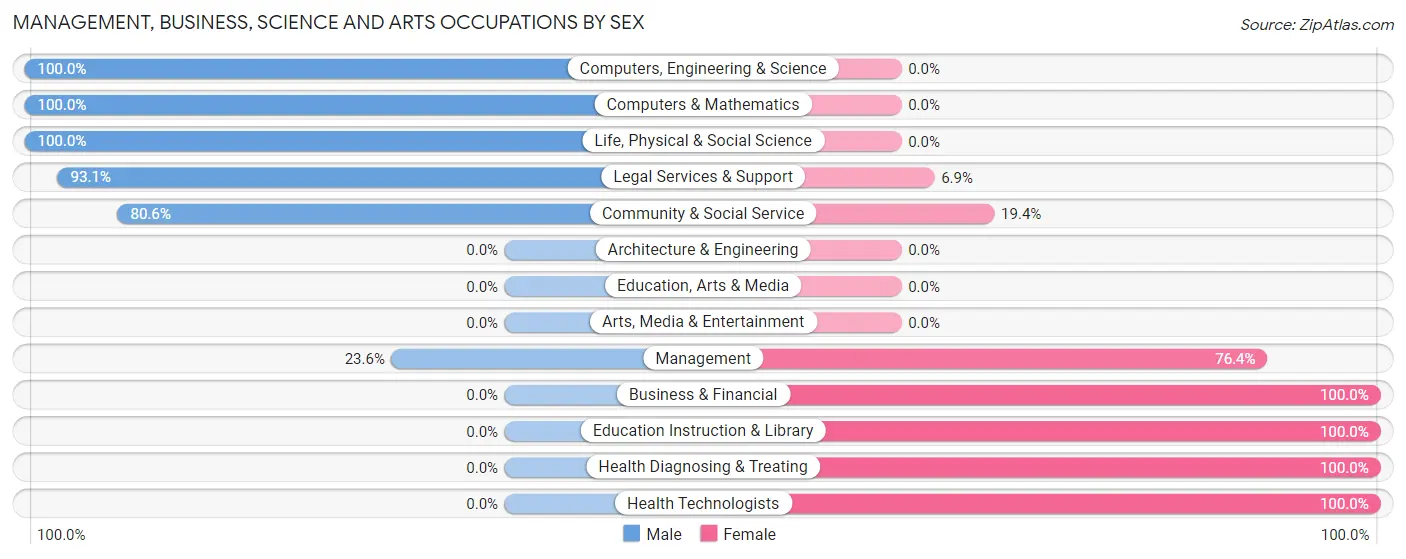
The most common Management, Business, Science and Arts occupations in La Salle County are Management (127 | 5.7%), Health Diagnosing & Treating (84 | 3.8%), Health Technologists (84 | 3.8%), Community & Social Service (67 | 3.0%), and Legal Services & Support (58 | 2.6%).
Management, Business, Science and Arts Occupations by Sex
Within the Management, Business, Science and Arts occupations in La Salle County, the most male-oriented occupations are Computers, Engineering & Science (100.0%), Computers & Mathematics (100.0%), and Life, Physical & Social Science (100.0%), while the most female-oriented occupations are Business & Financial (100.0%), Education Instruction & Library (100.0%), and Health Diagnosing & Treating (100.0%).
| Occupation | Male | Female |
| Management | 30 (23.6%) | 97 (76.4%) |
| Business & Financial | 0 (0.0%) | 3 (100.0%) |
| Computers, Engineering & Science | 11 (100.0%) | 0 (0.0%) |
| Computers & Mathematics | 7 (100.0%) | 0 (0.0%) |
| Architecture & Engineering | 0 (0.0%) | 0 (0.0%) |
| Life, Physical & Social Science | 4 (100.0%) | 0 (0.0%) |
| Community & Social Service | 54 (80.6%) | 13 (19.4%) |
| Education, Arts & Media | 0 (0.0%) | 0 (0.0%) |
| Legal Services & Support | 54 (93.1%) | 4 (6.9%) |
| Education Instruction & Library | 0 (0.0%) | 9 (100.0%) |
| Arts, Media & Entertainment | 0 (0.0%) | 0 (0.0%) |
| Health Diagnosing & Treating | 0 (0.0%) | 84 (100.0%) |
| Health Technologists | 0 (0.0%) | 84 (100.0%) |
| Total (Category) | 95 (32.5%) | 197 (67.5%) |
| Total (Overall) | 1,455 (65.8%) | 757 (34.2%) |
Services Occupations
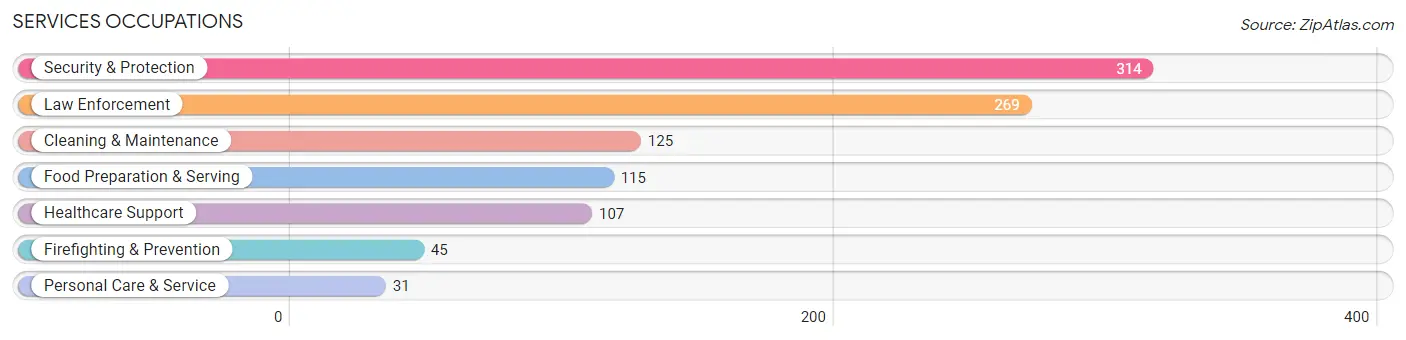
The most common Services occupations in La Salle County are Security & Protection (314 | 14.2%), Law Enforcement (269 | 12.2%), Cleaning & Maintenance (125 | 5.7%), Food Preparation & Serving (115 | 5.2%), and Healthcare Support (107 | 4.8%).
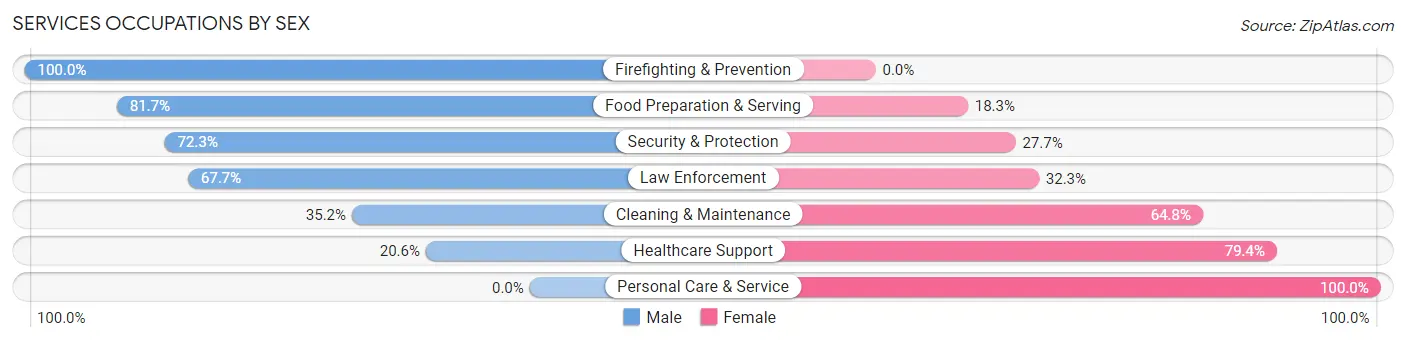
Services Occupations by Sex
Within the Services occupations in La Salle County, the most male-oriented occupations are Firefighting & Prevention (100.0%), Food Preparation & Serving (81.7%), and Security & Protection (72.3%), while the most female-oriented occupations are Personal Care & Service (100.0%), Healthcare Support (79.4%), and Cleaning & Maintenance (64.8%).
| Occupation | Male | Female |
| Healthcare Support | 22 (20.6%) | 85 (79.4%) |
| Security & Protection | 227 (72.3%) | 87 (27.7%) |
| Firefighting & Prevention | 45 (100.0%) | 0 (0.0%) |
| Law Enforcement | 182 (67.7%) | 87 (32.3%) |
| Food Preparation & Serving | 94 (81.7%) | 21 (18.3%) |
| Cleaning & Maintenance | 44 (35.2%) | 81 (64.8%) |
| Personal Care & Service | 0 (0.0%) | 31 (100.0%) |
| Total (Category) | 387 (55.9%) | 305 (44.1%) |
| Total (Overall) | 1,455 (65.8%) | 757 (34.2%) |
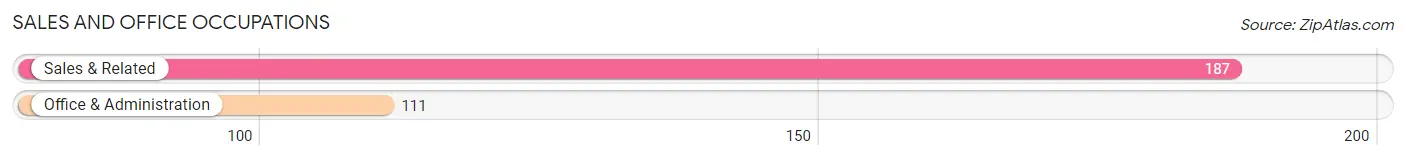
Sales and Office Occupations
The most common Sales and Office occupations in La Salle County are Sales & Related (187 | 8.5%), and Office & Administration (111 | 5.0%).
Sales and Office Occupations by Sex
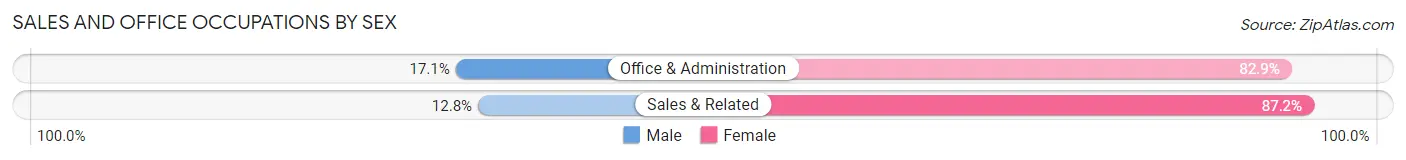
| Occupation | Male | Female |
| Sales & Related | 24 (12.8%) | 163 (87.2%) |
| Office & Administration | 19 (17.1%) | 92 (82.9%) |
| Total (Category) | 43 (14.4%) | 255 (85.6%) |
| Total (Overall) | 1,455 (65.8%) | 757 (34.2%) |
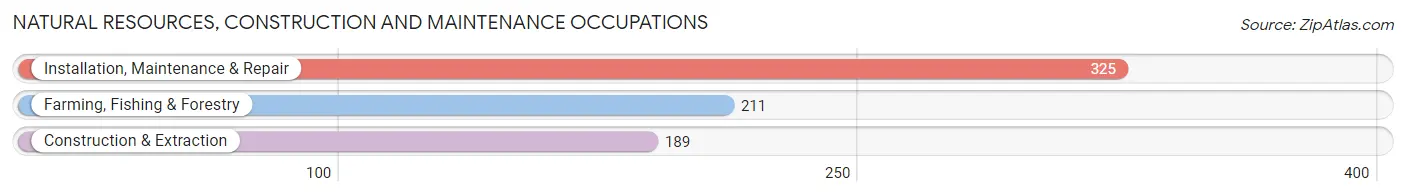
Natural Resources, Construction and Maintenance Occupations
The most common Natural Resources, Construction and Maintenance occupations in La Salle County are Installation, Maintenance & Repair (325 | 14.7%), Farming, Fishing & Forestry (211 | 9.5%), and Construction & Extraction (189 | 8.5%).
Natural Resources, Construction and Maintenance Occupations by Sex
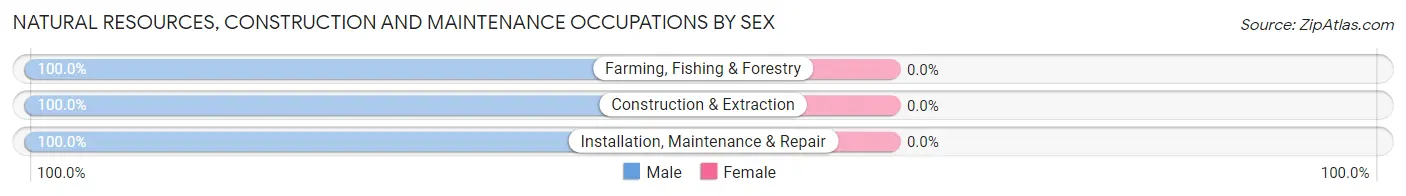
| Occupation | Male | Female |
| Farming, Fishing & Forestry | 211 (100.0%) | 0 (0.0%) |
| Construction & Extraction | 189 (100.0%) | 0 (0.0%) |
| Installation, Maintenance & Repair | 325 (100.0%) | 0 (0.0%) |
| Total (Category) | 725 (100.0%) | 0 (0.0%) |
| Total (Overall) | 1,455 (65.8%) | 757 (34.2%) |
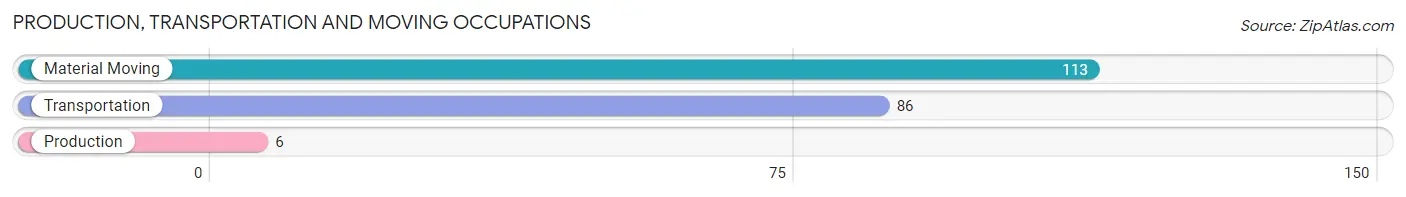
Production, Transportation and Moving Occupations
The most common Production, Transportation and Moving occupations in La Salle County are Material Moving (113 | 5.1%), Transportation (86 | 3.9%), and Production (6 | 0.3%).
Production, Transportation and Moving Occupations by Sex
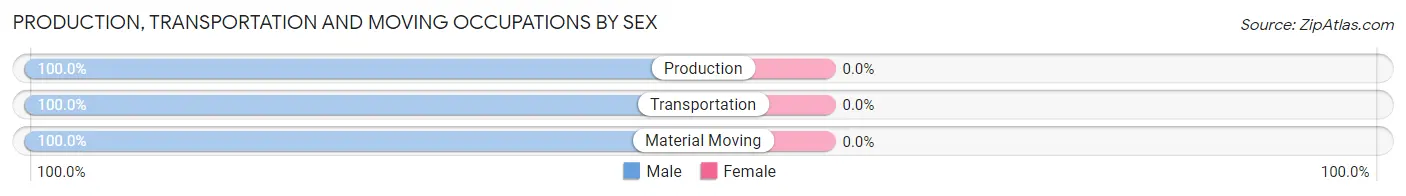
| Occupation | Male | Female |
| Production | 6 (100.0%) | 0 (0.0%) |
| Transportation | 86 (100.0%) | 0 (0.0%) |
| Material Moving | 113 (100.0%) | 0 (0.0%) |
| Total (Category) | 205 (100.0%) | 0 (0.0%) |
| Total (Overall) | 1,455 (65.8%) | 757 (34.2%) |
Employment Industries by Sex in La Salle County
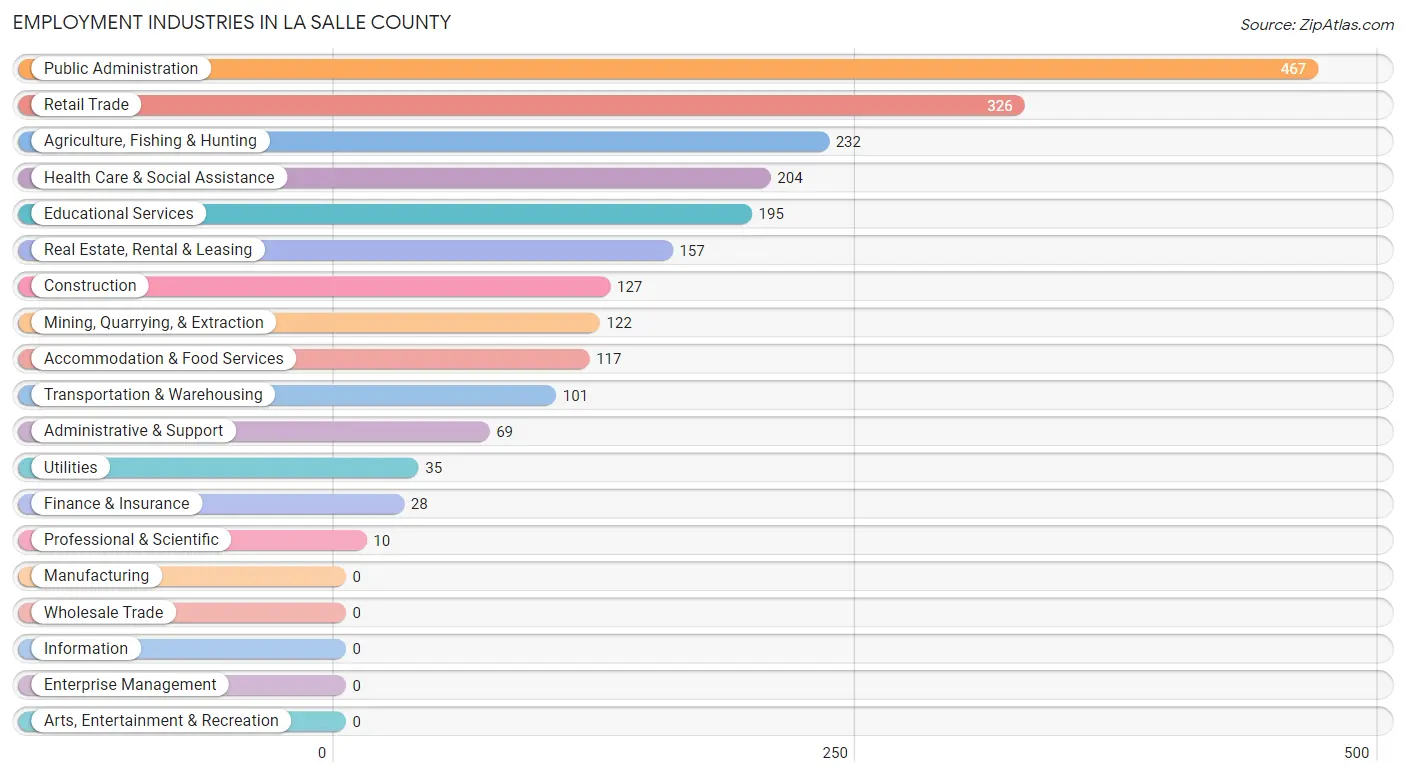
Employment Industries in La Salle County
The major employment industries in La Salle County include Public Administration (467 | 21.1%), Retail Trade (326 | 14.7%), Agriculture, Fishing & Hunting (232 | 10.5%), Health Care & Social Assistance (204 | 9.2%), and Educational Services (195 | 8.8%).
Employment Industries by Sex in La Salle County
The La Salle County industries that see more men than women are Transportation & Warehousing (100.0%), Utilities (100.0%), and Administrative & Support (100.0%), whereas the industries that tend to have a higher number of women are Finance & Insurance (100.0%), Educational Services (100.0%), and Health Care & Social Assistance (86.3%).
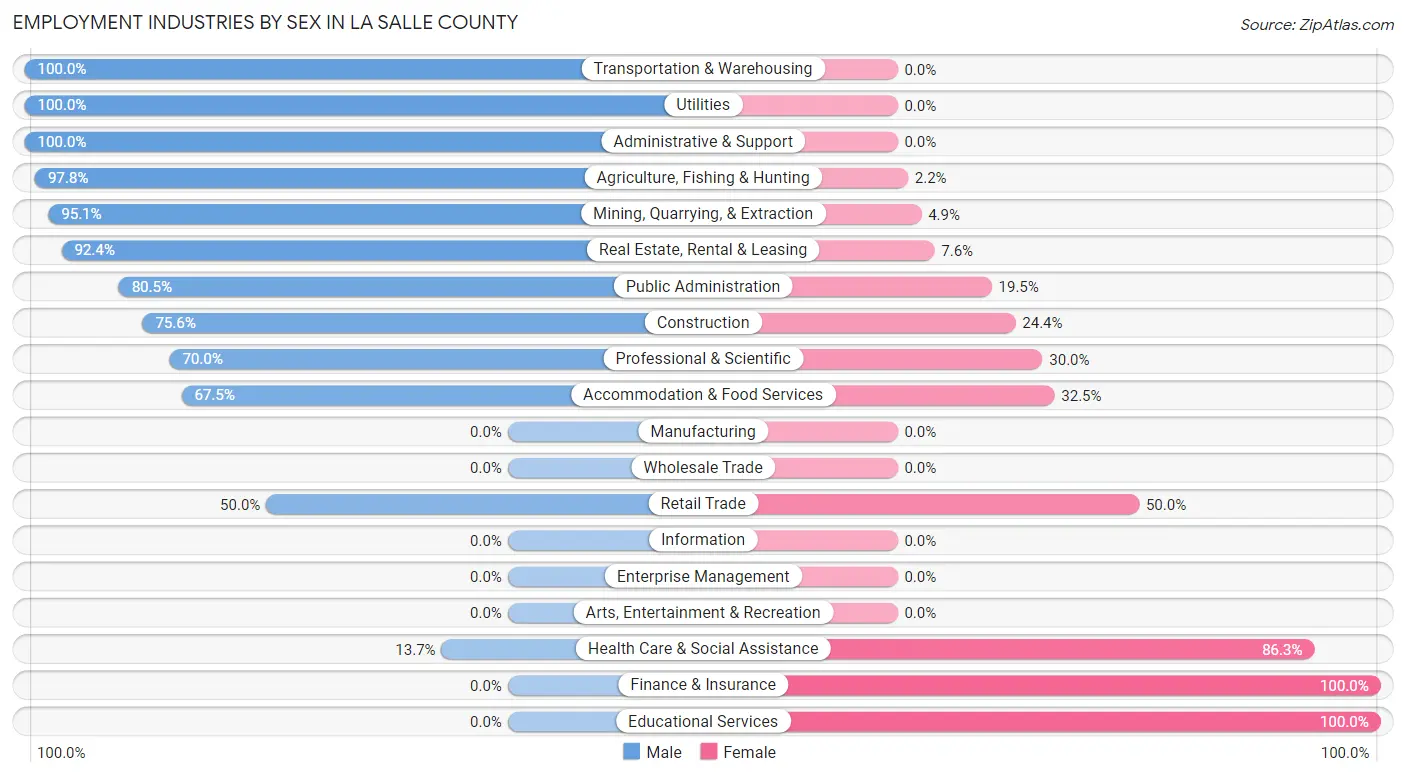
| Industry | Male | Female |
| Agriculture, Fishing & Hunting | 227 (97.8%) | 5 (2.2%) |
| Mining, Quarrying, & Extraction | 116 (95.1%) | 6 (4.9%) |
| Construction | 96 (75.6%) | 31 (24.4%) |
| Manufacturing | 0 (0.0%) | 0 (0.0%) |
| Wholesale Trade | 0 (0.0%) | 0 (0.0%) |
| Retail Trade | 163 (50.0%) | 163 (50.0%) |
| Transportation & Warehousing | 101 (100.0%) | 0 (0.0%) |
| Utilities | 35 (100.0%) | 0 (0.0%) |
| Information | 0 (0.0%) | 0 (0.0%) |
| Finance & Insurance | 0 (0.0%) | 28 (100.0%) |
| Real Estate, Rental & Leasing | 145 (92.4%) | 12 (7.6%) |
| Professional & Scientific | 7 (70.0%) | 3 (30.0%) |
| Enterprise Management | 0 (0.0%) | 0 (0.0%) |
| Administrative & Support | 69 (100.0%) | 0 (0.0%) |
| Educational Services | 0 (0.0%) | 195 (100.0%) |
| Health Care & Social Assistance | 28 (13.7%) | 176 (86.3%) |
| Arts, Entertainment & Recreation | 0 (0.0%) | 0 (0.0%) |
| Accommodation & Food Services | 79 (67.5%) | 38 (32.5%) |
| Public Administration | 376 (80.5%) | 91 (19.5%) |
| Total | 1,455 (65.8%) | 757 (34.2%) |
Education in La Salle County
School Enrollment in La Salle County
The most common levels of schooling among the 1,930 students in La Salle County are high school (893 | 46.3%), elementary school (425 | 22.0%), and college / undergraduate (329 | 17.1%).
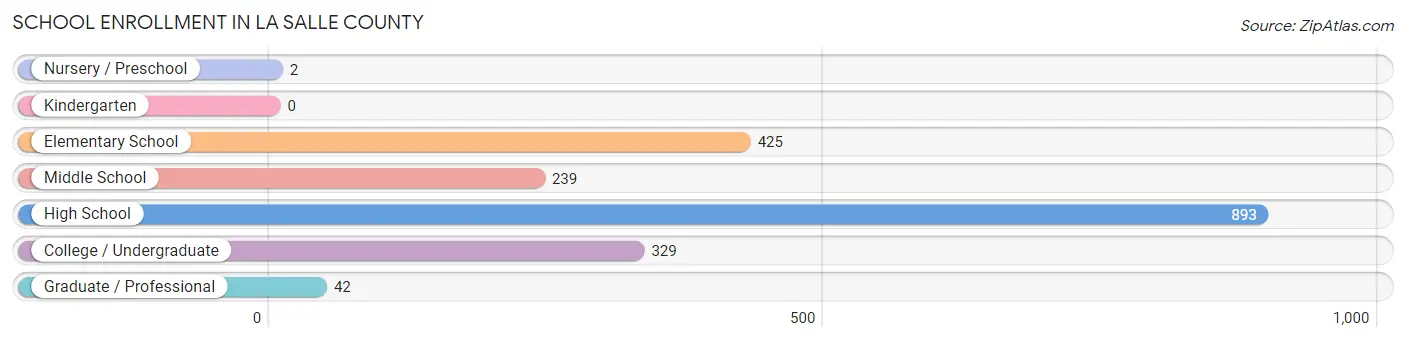
| School Level | # Students | % Students |
| Nursery / Preschool | 2 | 0.1% |
| Kindergarten | 0 | 0.0% |
| Elementary School | 425 | 22.0% |
| Middle School | 239 | 12.4% |
| High School | 893 | 46.3% |
| College / Undergraduate | 329 | 17.1% |
| Graduate / Professional | 42 | 2.2% |
| Total | 1,930 | 100.0% |
School Enrollment by Age by Funding Source in La Salle County
Out of a total of 1,930 students who are enrolled in schools in La Salle County, 423 (21.9%) attend a private institution, while the remaining 1,507 (78.1%) are enrolled in public schools. The age group of 35 years and over has the highest likelihood of being enrolled in private schools, with 113 (85.0% in the age bracket) enrolled. Conversely, the age group of 3 to 4 year olds has the lowest likelihood of being enrolled in a private school, with 2 (100.0% in the age bracket) attending a public institution.
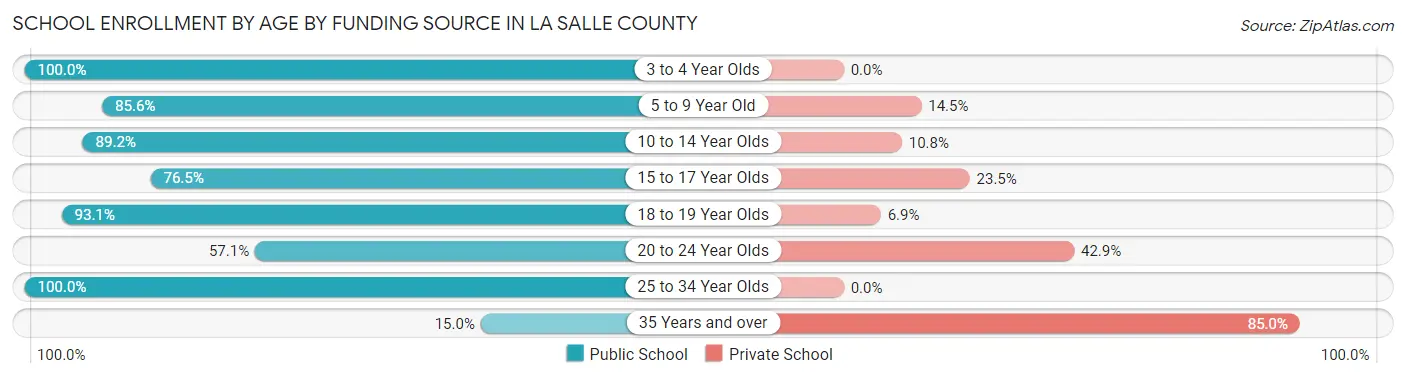
| Age Bracket | Public School | Private School |
| 3 to 4 Year Olds | 2 (100.0%) | 0 (0.0%) |
| 5 to 9 Year Old | 302 (85.6%) | 51 (14.4%) |
| 10 to 14 Year Olds | 305 (89.2%) | 37 (10.8%) |
| 15 to 17 Year Olds | 274 (76.5%) | 84 (23.5%) |
| 18 to 19 Year Olds | 378 (93.1%) | 28 (6.9%) |
| 20 to 24 Year Olds | 145 (57.1%) | 109 (42.9%) |
| 25 to 34 Year Olds | 82 (100.0%) | 0 (0.0%) |
| 35 Years and over | 20 (15.0%) | 113 (85.0%) |
| Total | 1,507 (78.1%) | 423 (21.9%) |
Educational Attainment by Field of Study in La Salle County
Business (105 | 41.2%), science & technology (50 | 19.6%), education (36 | 14.1%), computers & mathematics (28 | 11.0%), and engineering (22 | 8.6%) are the most common fields of study among 255 individuals in La Salle County who have obtained a bachelor's degree or higher.
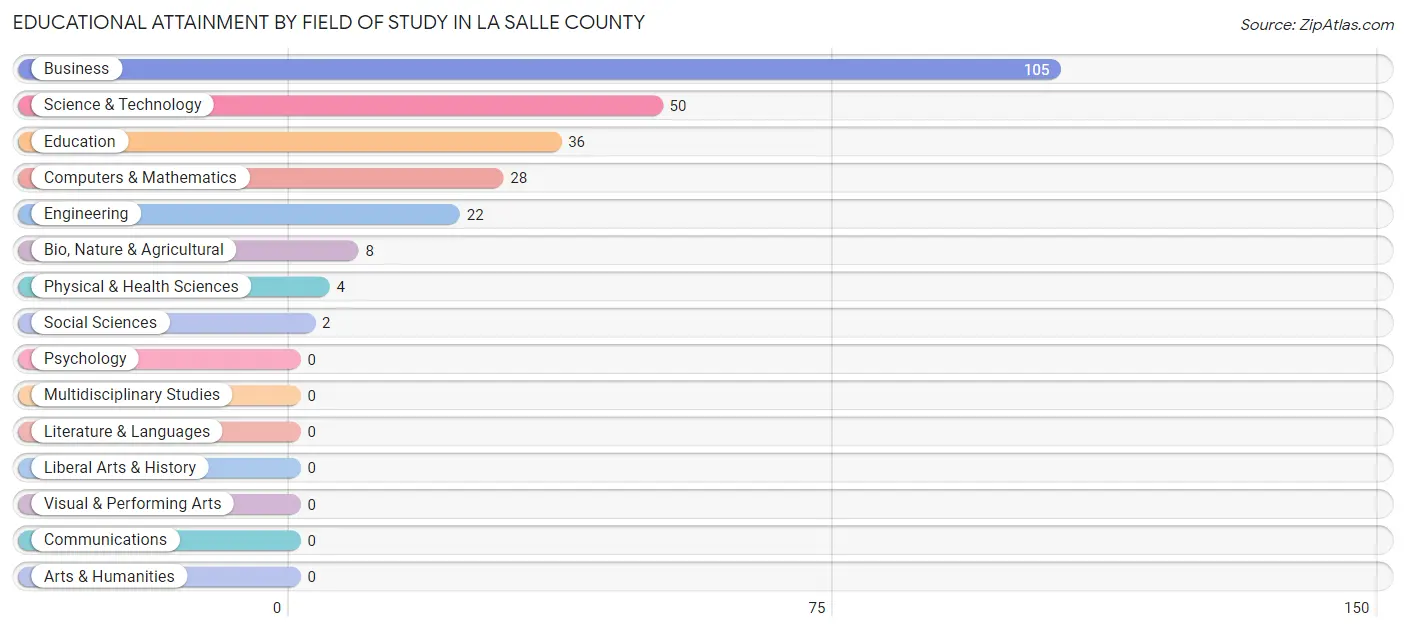
| Field of Study | # Graduates | % Graduates |
| Computers & Mathematics | 28 | 11.0% |
| Bio, Nature & Agricultural | 8 | 3.1% |
| Physical & Health Sciences | 4 | 1.6% |
| Psychology | 0 | 0.0% |
| Social Sciences | 2 | 0.8% |
| Engineering | 22 | 8.6% |
| Multidisciplinary Studies | 0 | 0.0% |
| Science & Technology | 50 | 19.6% |
| Business | 105 | 41.2% |
| Education | 36 | 14.1% |
| Literature & Languages | 0 | 0.0% |
| Liberal Arts & History | 0 | 0.0% |
| Visual & Performing Arts | 0 | 0.0% |
| Communications | 0 | 0.0% |
| Arts & Humanities | 0 | 0.0% |
| Total | 255 | 100.0% |
Transportation & Commute in La Salle County
Vehicle Availability by Sex in La Salle County
The most prevalent vehicle ownership categories in La Salle County are males with 2 vehicles (739, accounting for 50.8%) and females with 2 vehicles (351, making up 98.3%).
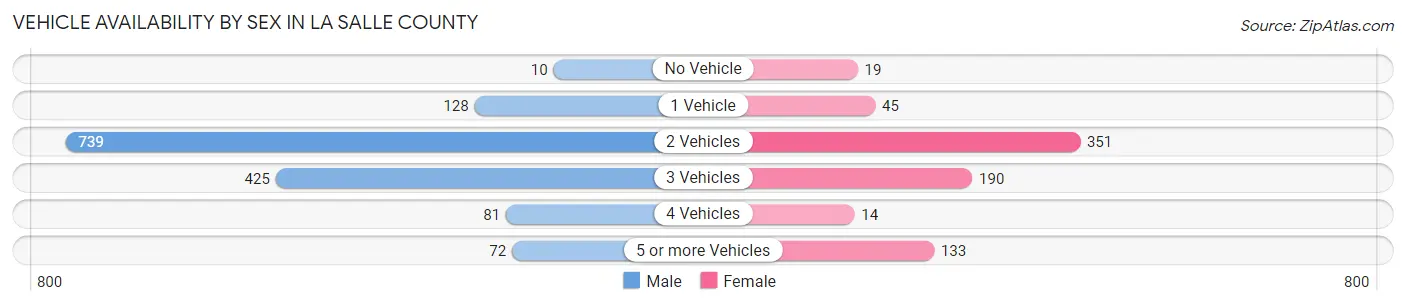
| Vehicles Available | Male | Female |
| No Vehicle | 10 (0.7%) | 19 (2.5%) |
| 1 Vehicle | 128 (8.8%) | 45 (6.0%) |
| 2 Vehicles | 739 (50.8%) | 351 (46.7%) |
| 3 Vehicles | 425 (29.2%) | 190 (25.3%) |
| 4 Vehicles | 81 (5.6%) | 14 (1.9%) |
| 5 or more Vehicles | 72 (5.0%) | 133 (17.7%) |
| Total | 1,455 (100.0%) | 752 (100.0%) |
Commute Time in La Salle County
The most frequently occuring commute durations in La Salle County are 5 to 9 minutes (915 commuters, 42.5%), 30 to 34 minutes (314 commuters, 14.6%), and 10 to 14 minutes (210 commuters, 9.8%).
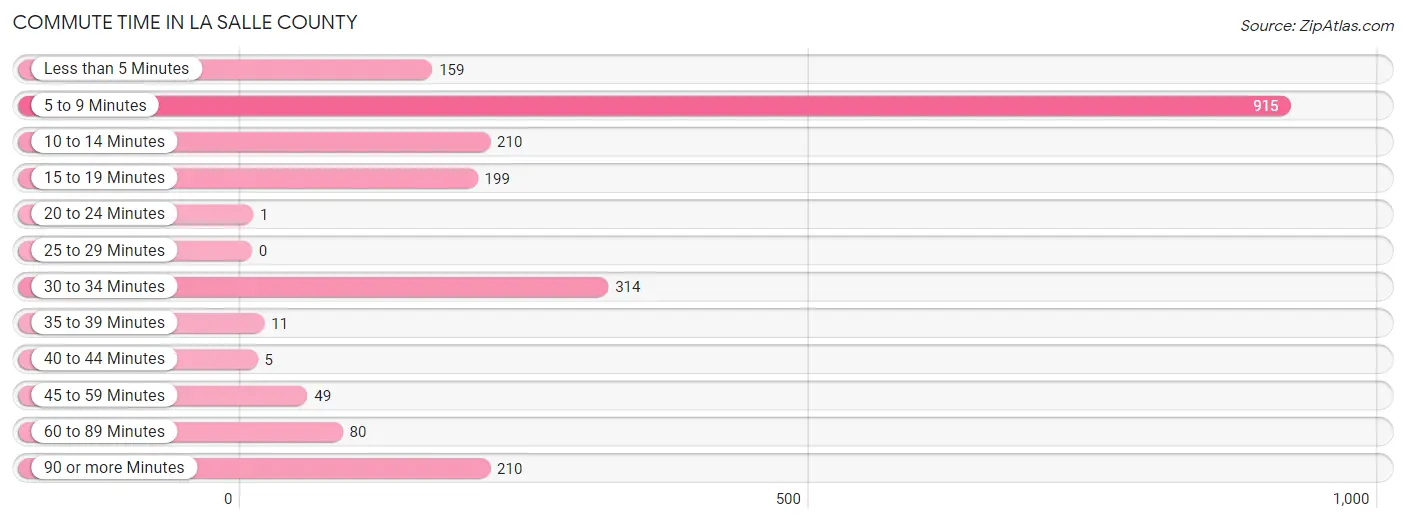
| Commute Time | # Commuters | % Commuters |
| Less than 5 Minutes | 159 | 7.4% |
| 5 to 9 Minutes | 915 | 42.5% |
| 10 to 14 Minutes | 210 | 9.8% |
| 15 to 19 Minutes | 199 | 9.2% |
| 20 to 24 Minutes | 1 | 0.1% |
| 25 to 29 Minutes | 0 | 0.0% |
| 30 to 34 Minutes | 314 | 14.6% |
| 35 to 39 Minutes | 11 | 0.5% |
| 40 to 44 Minutes | 5 | 0.2% |
| 45 to 59 Minutes | 49 | 2.3% |
| 60 to 89 Minutes | 80 | 3.7% |
| 90 or more Minutes | 210 | 9.8% |
Commute Time by Sex in La Salle County
The most common commute times in La Salle County are 5 to 9 minutes (586 commuters, 40.6%) for males and 5 to 9 minutes (329 commuters, 46.4%) for females.
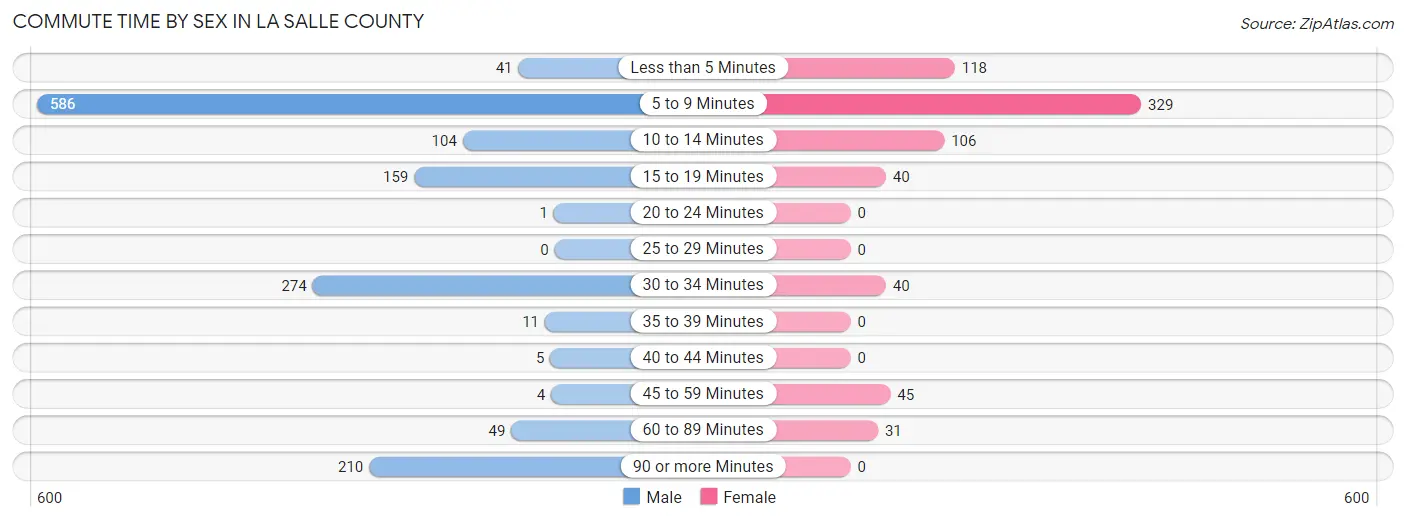
| Commute Time | Male | Female |
| Less than 5 Minutes | 41 (2.8%) | 118 (16.6%) |
| 5 to 9 Minutes | 586 (40.6%) | 329 (46.4%) |
| 10 to 14 Minutes | 104 (7.2%) | 106 (14.9%) |
| 15 to 19 Minutes | 159 (11.0%) | 40 (5.6%) |
| 20 to 24 Minutes | 1 (0.1%) | 0 (0.0%) |
| 25 to 29 Minutes | 0 (0.0%) | 0 (0.0%) |
| 30 to 34 Minutes | 274 (19.0%) | 40 (5.6%) |
| 35 to 39 Minutes | 11 (0.8%) | 0 (0.0%) |
| 40 to 44 Minutes | 5 (0.4%) | 0 (0.0%) |
| 45 to 59 Minutes | 4 (0.3%) | 45 (6.4%) |
| 60 to 89 Minutes | 49 (3.4%) | 31 (4.4%) |
| 90 or more Minutes | 210 (14.5%) | 0 (0.0%) |
Time of Departure to Work by Sex in La Salle County
The most frequent times of departure to work in La Salle County are 7:30 AM to 7:59 AM (243, 16.8%) for males and 7:00 AM to 7:29 AM (189, 26.7%) for females.
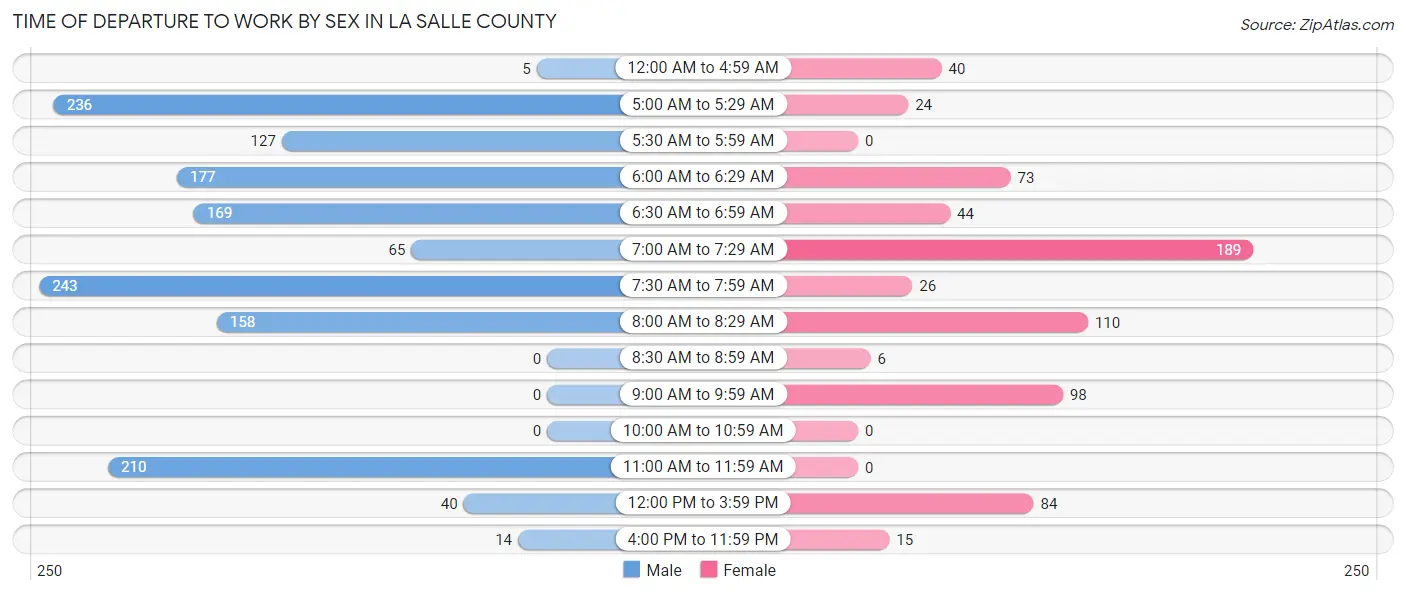
| Time of Departure | Male | Female |
| 12:00 AM to 4:59 AM | 5 (0.4%) | 40 (5.6%) |
| 5:00 AM to 5:29 AM | 236 (16.3%) | 24 (3.4%) |
| 5:30 AM to 5:59 AM | 127 (8.8%) | 0 (0.0%) |
| 6:00 AM to 6:29 AM | 177 (12.3%) | 73 (10.3%) |
| 6:30 AM to 6:59 AM | 169 (11.7%) | 44 (6.2%) |
| 7:00 AM to 7:29 AM | 65 (4.5%) | 189 (26.7%) |
| 7:30 AM to 7:59 AM | 243 (16.8%) | 26 (3.7%) |
| 8:00 AM to 8:29 AM | 158 (10.9%) | 110 (15.5%) |
| 8:30 AM to 8:59 AM | 0 (0.0%) | 6 (0.9%) |
| 9:00 AM to 9:59 AM | 0 (0.0%) | 98 (13.8%) |
| 10:00 AM to 10:59 AM | 0 (0.0%) | 0 (0.0%) |
| 11:00 AM to 11:59 AM | 210 (14.5%) | 0 (0.0%) |
| 12:00 PM to 3:59 PM | 40 (2.8%) | 84 (11.8%) |
| 4:00 PM to 11:59 PM | 14 (1.0%) | 15 (2.1%) |
| Total | 1,444 (100.0%) | 709 (100.0%) |
Housing Occupancy in La Salle County
Occupancy by Ownership in La Salle County
Of the total 1,688 dwellings in La Salle County, owner-occupied units account for 1,335 (79.1%), while renter-occupied units make up 353 (20.9%).
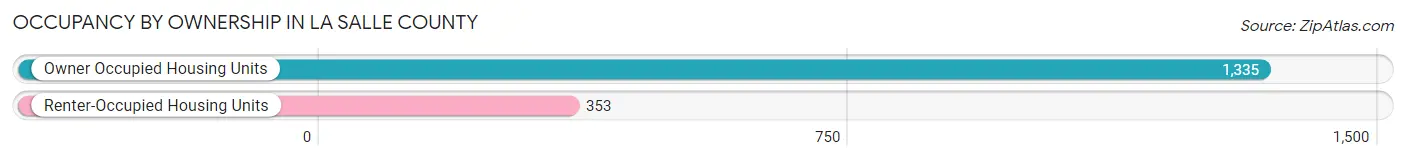
| Occupancy | # Housing Units | % Housing Units |
| Owner Occupied Housing Units | 1,335 | 79.1% |
| Renter-Occupied Housing Units | 353 | 20.9% |
| Total Occupied Housing Units | 1,688 | 100.0% |
Occupancy by Household Size in La Salle County
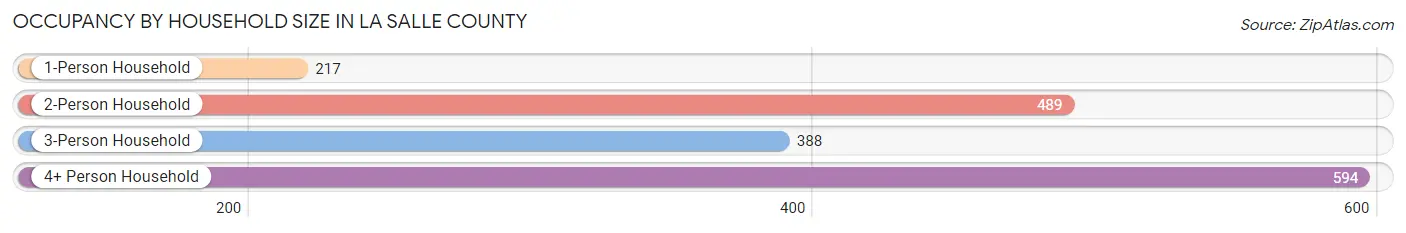
| Household Size | # Housing Units | % Housing Units |
| 1-Person Household | 217 | 12.9% |
| 2-Person Household | 489 | 29.0% |
| 3-Person Household | 388 | 23.0% |
| 4+ Person Household | 594 | 35.2% |
| Total Housing Units | 1,688 | 100.0% |
Occupancy by Ownership by Household Size in La Salle County
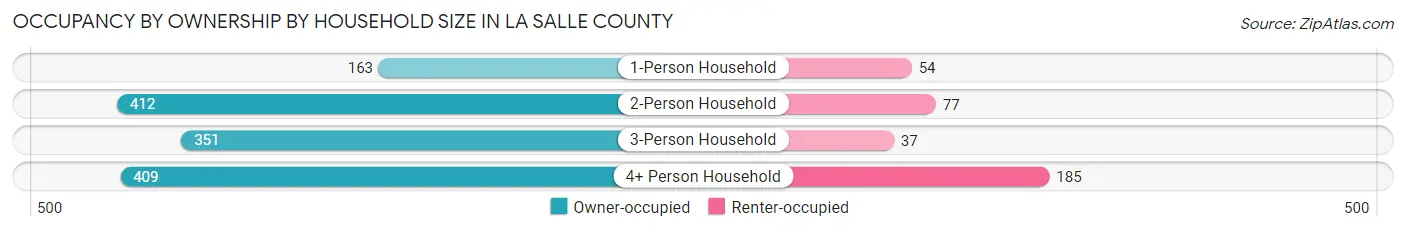
| Household Size | Owner-occupied | Renter-occupied |
| 1-Person Household | 163 (75.1%) | 54 (24.9%) |
| 2-Person Household | 412 (84.3%) | 77 (15.8%) |
| 3-Person Household | 351 (90.5%) | 37 (9.5%) |
| 4+ Person Household | 409 (68.9%) | 185 (31.1%) |
| Total Housing Units | 1,335 (79.1%) | 353 (20.9%) |
Occupancy by Educational Attainment in La Salle County
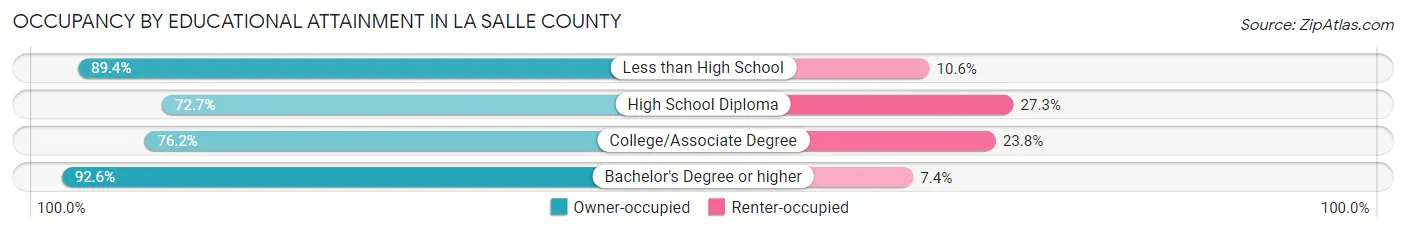
| Household Size | Owner-occupied | Renter-occupied |
| Less than High School | 388 (89.4%) | 46 (10.6%) |
| High School Diploma | 603 (72.7%) | 226 (27.3%) |
| College/Associate Degree | 231 (76.2%) | 72 (23.8%) |
| Bachelor's Degree or higher | 113 (92.6%) | 9 (7.4%) |
Occupancy by Age of Householder in La Salle County
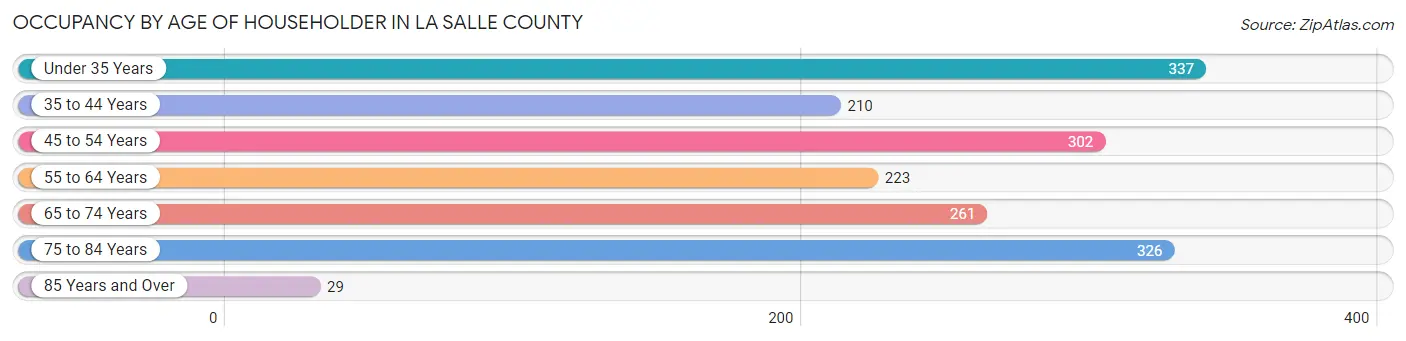
| Age Bracket | # Households | % Households |
| Under 35 Years | 337 | 20.0% |
| 35 to 44 Years | 210 | 12.4% |
| 45 to 54 Years | 302 | 17.9% |
| 55 to 64 Years | 223 | 13.2% |
| 65 to 74 Years | 261 | 15.5% |
| 75 to 84 Years | 326 | 19.3% |
| 85 Years and Over | 29 | 1.7% |
| Total | 1,688 | 100.0% |
Housing Finances in La Salle County
Median Income by Occupancy in La Salle County
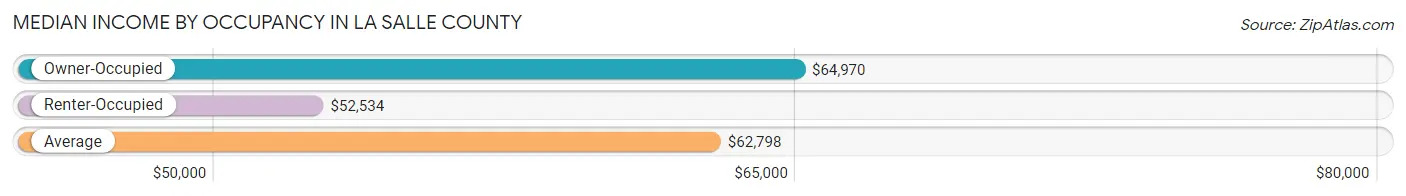
| Occupancy Type | # Households | Median Income |
| Owner-Occupied | 1,335 (79.1%) | $64,970 |
| Renter-Occupied | 353 (20.9%) | $52,534 |
| Average | 1,688 (100.0%) | $62,798 |
Occupancy by Householder Income Bracket in La Salle County
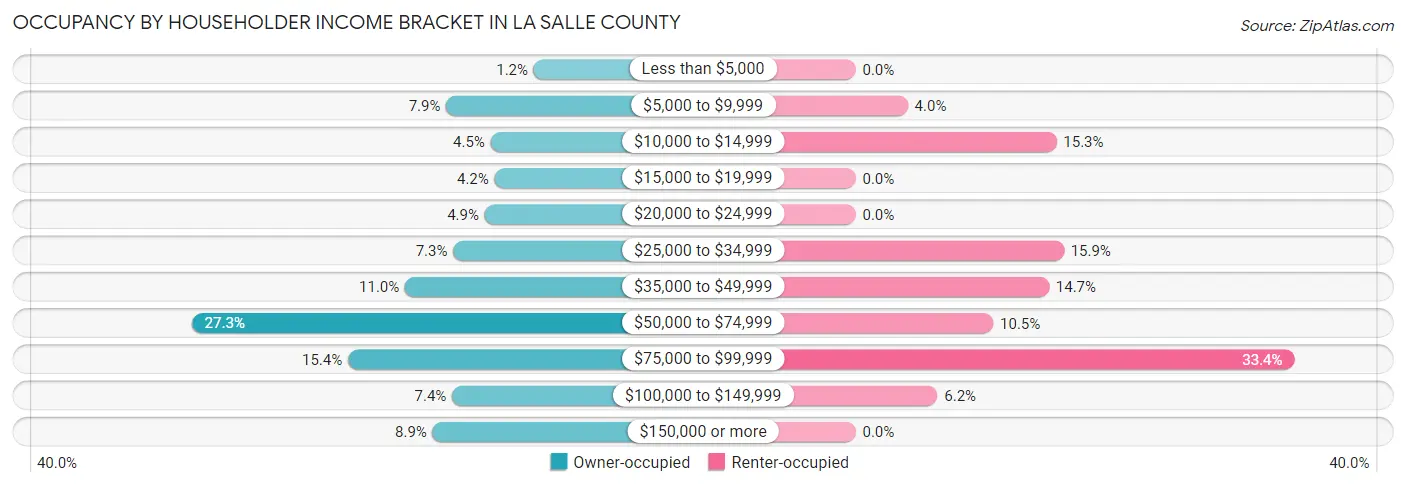
| Income Bracket | Owner-occupied | Renter-occupied |
| Less than $5,000 | 16 (1.2%) | 0 (0.0%) |
| $5,000 to $9,999 | 105 (7.9%) | 14 (4.0%) |
| $10,000 to $14,999 | 60 (4.5%) | 54 (15.3%) |
| $15,000 to $19,999 | 56 (4.2%) | 0 (0.0%) |
| $20,000 to $24,999 | 66 (4.9%) | 0 (0.0%) |
| $25,000 to $34,999 | 98 (7.3%) | 56 (15.9%) |
| $35,000 to $49,999 | 147 (11.0%) | 52 (14.7%) |
| $50,000 to $74,999 | 364 (27.3%) | 37 (10.5%) |
| $75,000 to $99,999 | 205 (15.4%) | 118 (33.4%) |
| $100,000 to $149,999 | 99 (7.4%) | 22 (6.2%) |
| $150,000 or more | 119 (8.9%) | 0 (0.0%) |
| Total | 1,335 (100.0%) | 353 (100.0%) |
Monthly Housing Cost Tiers in La Salle County
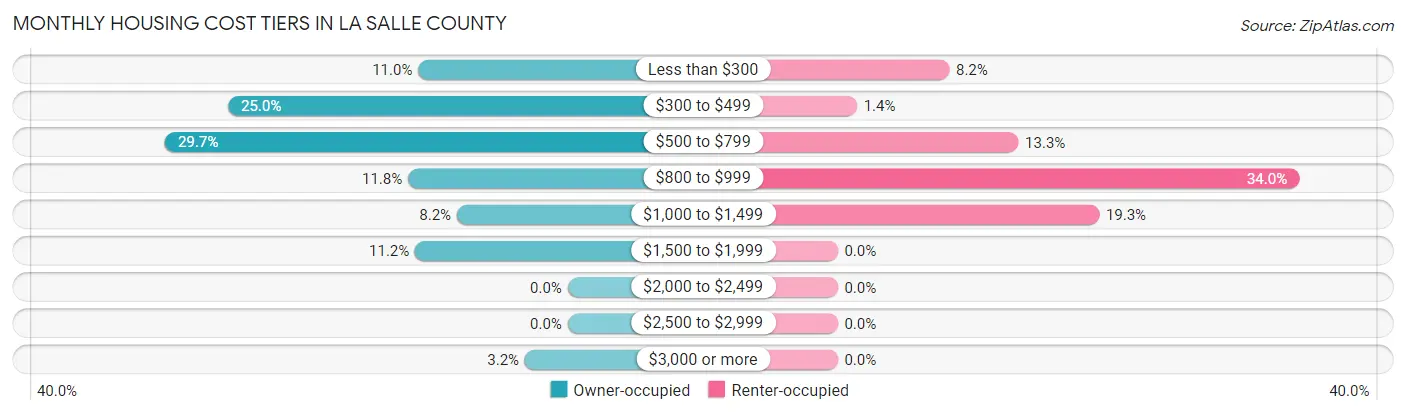
| Monthly Cost | Owner-occupied | Renter-occupied |
| Less than $300 | 147 (11.0%) | 29 (8.2%) |
| $300 to $499 | 334 (25.0%) | 5 (1.4%) |
| $500 to $799 | 396 (29.7%) | 47 (13.3%) |
| $800 to $999 | 157 (11.8%) | 120 (34.0%) |
| $1,000 to $1,499 | 109 (8.2%) | 68 (19.3%) |
| $1,500 to $1,999 | 150 (11.2%) | 0 (0.0%) |
| $2,000 to $2,499 | 0 (0.0%) | 0 (0.0%) |
| $2,500 to $2,999 | 0 (0.0%) | 0 (0.0%) |
| $3,000 or more | 42 (3.2%) | 0 (0.0%) |
| Total | 1,335 (100.0%) | 353 (100.0%) |
Physical Housing Characteristics in La Salle County
Housing Structures in La Salle County
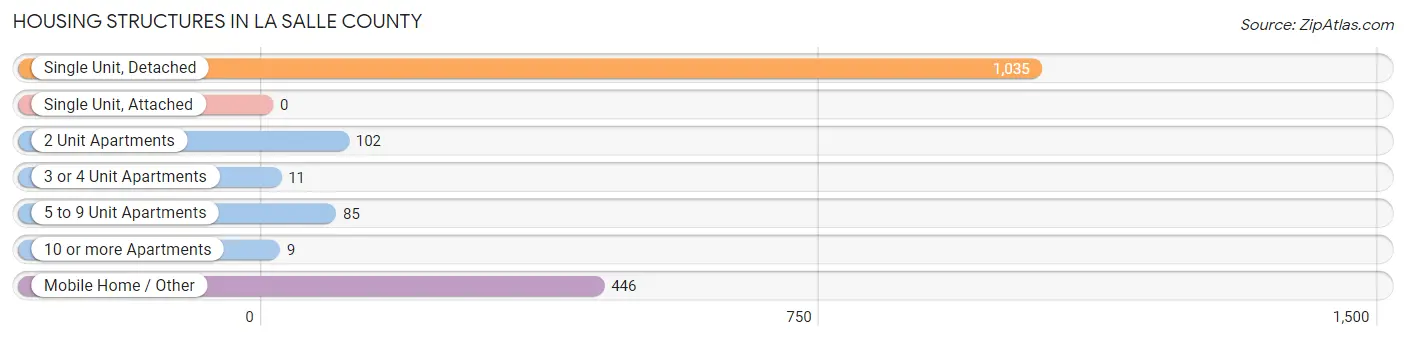
| Structure Type | # Housing Units | % Housing Units |
| Single Unit, Detached | 1,035 | 61.3% |
| Single Unit, Attached | 0 | 0.0% |
| 2 Unit Apartments | 102 | 6.0% |
| 3 or 4 Unit Apartments | 11 | 0.6% |
| 5 to 9 Unit Apartments | 85 | 5.0% |
| 10 or more Apartments | 9 | 0.5% |
| Mobile Home / Other | 446 | 26.4% |
| Total | 1,688 | 100.0% |
Housing Structures by Occupancy in La Salle County
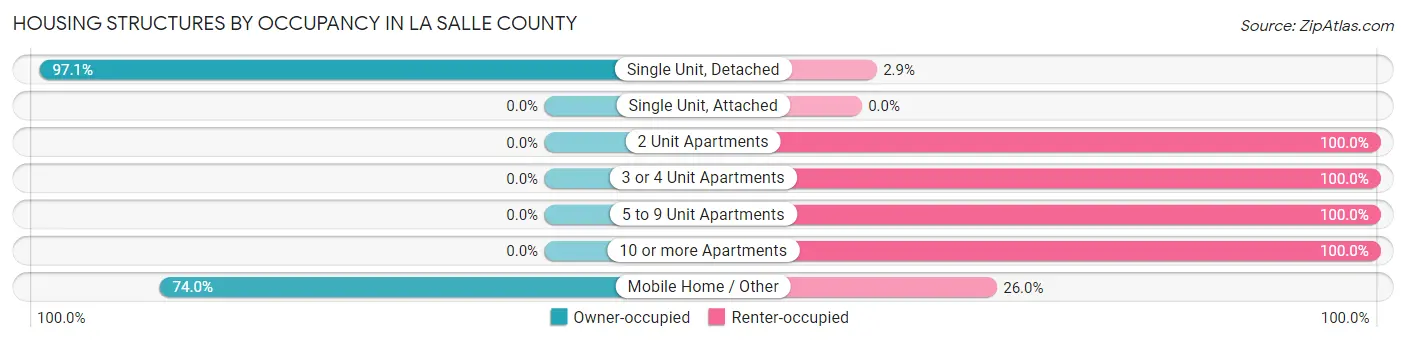
| Structure Type | Owner-occupied | Renter-occupied |
| Single Unit, Detached | 1,005 (97.1%) | 30 (2.9%) |
| Single Unit, Attached | 0 (0.0%) | 0 (0.0%) |
| 2 Unit Apartments | 0 (0.0%) | 102 (100.0%) |
| 3 or 4 Unit Apartments | 0 (0.0%) | 11 (100.0%) |
| 5 to 9 Unit Apartments | 0 (0.0%) | 85 (100.0%) |
| 10 or more Apartments | 0 (0.0%) | 9 (100.0%) |
| Mobile Home / Other | 330 (74.0%) | 116 (26.0%) |
| Total | 1,335 (79.1%) | 353 (20.9%) |
Housing Structures by Number of Rooms in La Salle County
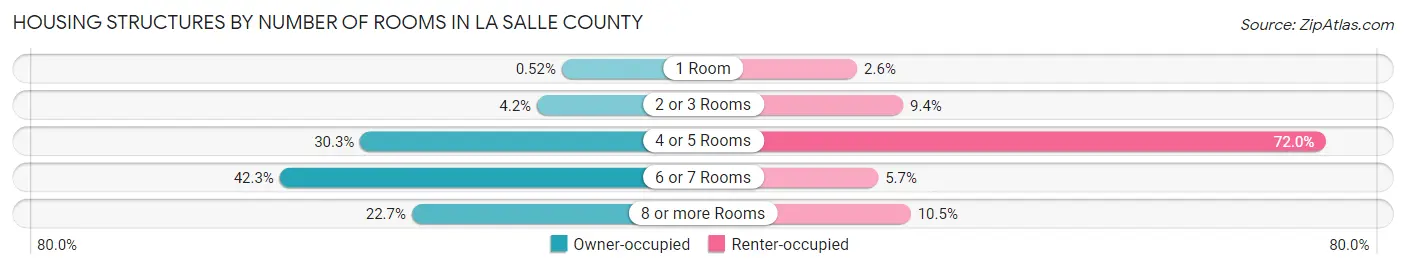
| Number of Rooms | Owner-occupied | Renter-occupied |
| 1 Room | 7 (0.5%) | 9 (2.5%) |
| 2 or 3 Rooms | 56 (4.2%) | 33 (9.3%) |
| 4 or 5 Rooms | 405 (30.3%) | 254 (72.0%) |
| 6 or 7 Rooms | 564 (42.2%) | 20 (5.7%) |
| 8 or more Rooms | 303 (22.7%) | 37 (10.5%) |
| Total | 1,335 (100.0%) | 353 (100.0%) |
Housing Structure by Heating Type in La Salle County
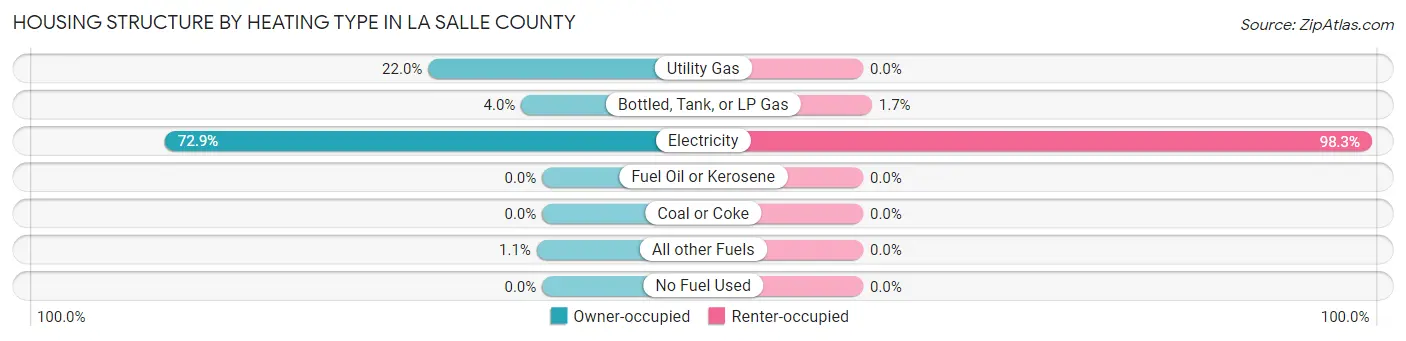
| Heating Type | Owner-occupied | Renter-occupied |
| Utility Gas | 294 (22.0%) | 0 (0.0%) |
| Bottled, Tank, or LP Gas | 54 (4.0%) | 6 (1.7%) |
| Electricity | 973 (72.9%) | 347 (98.3%) |
| Fuel Oil or Kerosene | 0 (0.0%) | 0 (0.0%) |
| Coal or Coke | 0 (0.0%) | 0 (0.0%) |
| All other Fuels | 14 (1.1%) | 0 (0.0%) |
| No Fuel Used | 0 (0.0%) | 0 (0.0%) |
| Total | 1,335 (100.0%) | 353 (100.0%) |
Household Vehicle Usage in La Salle County
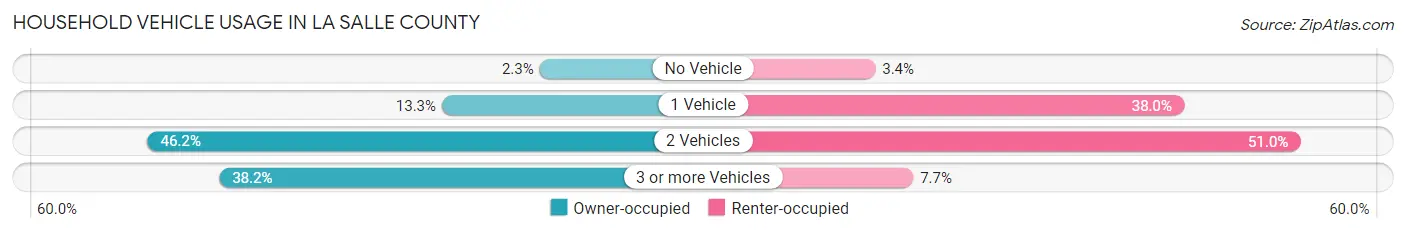
| Vehicles per Household | Owner-occupied | Renter-occupied |
| No Vehicle | 31 (2.3%) | 12 (3.4%) |
| 1 Vehicle | 177 (13.3%) | 134 (38.0%) |
| 2 Vehicles | 617 (46.2%) | 180 (51.0%) |
| 3 or more Vehicles | 510 (38.2%) | 27 (7.6%) |
| Total | 1,335 (100.0%) | 353 (100.0%) |
Real Estate & Mortgages in La Salle County
Real Estate and Mortgage Overview in La Salle County
| Characteristic | Without Mortgage | With Mortgage |
| Housing Units | 912 | 423 |
| Median Property Value | $93,700 | $178,200 |
| Median Household Income | $49,980 | $13 |
| Monthly Housing Costs | $481 | $42 |
| Real Estate Taxes | $959 | $0 |
Property Value by Mortgage Status in La Salle County
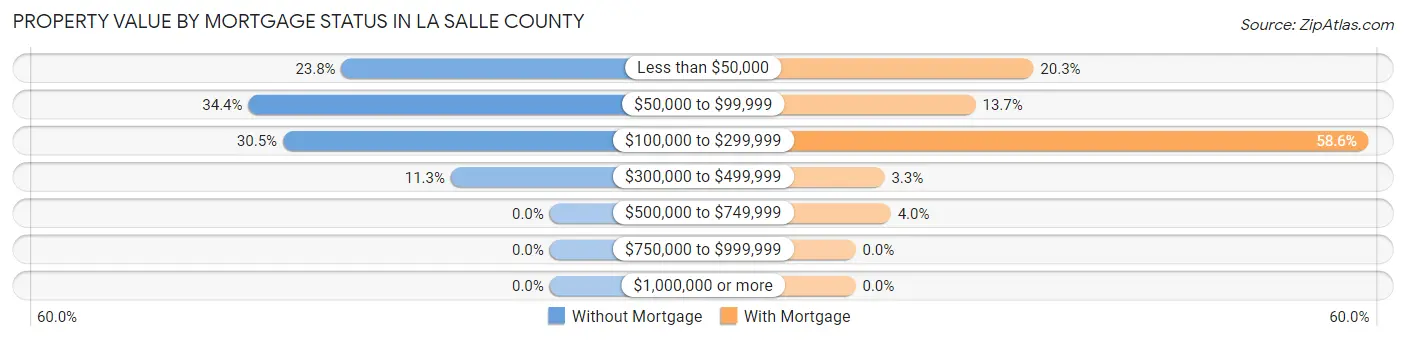
| Property Value | Without Mortgage | With Mortgage |
| Less than $50,000 | 217 (23.8%) | 86 (20.3%) |
| $50,000 to $99,999 | 314 (34.4%) | 58 (13.7%) |
| $100,000 to $299,999 | 278 (30.5%) | 248 (58.6%) |
| $300,000 to $499,999 | 103 (11.3%) | 14 (3.3%) |
| $500,000 to $749,999 | 0 (0.0%) | 17 (4.0%) |
| $750,000 to $999,999 | 0 (0.0%) | 0 (0.0%) |
| $1,000,000 or more | 0 (0.0%) | 0 (0.0%) |
| Total | 912 (100.0%) | 423 (100.0%) |
Household Income by Mortgage Status in La Salle County
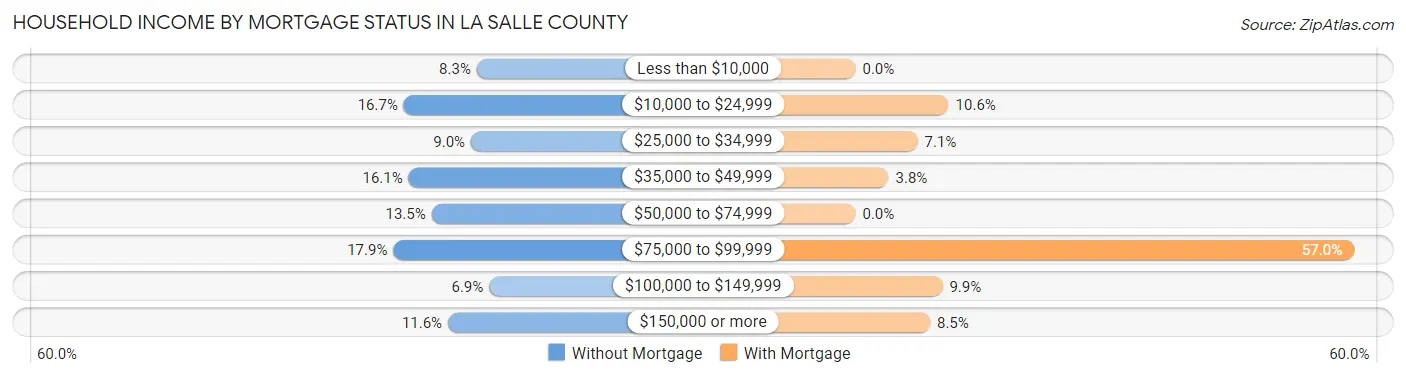
| Household Income | Without Mortgage | With Mortgage |
| Less than $10,000 | 76 (8.3%) | 0 (0.0%) |
| $10,000 to $24,999 | 152 (16.7%) | 45 (10.6%) |
| $25,000 to $34,999 | 82 (9.0%) | 30 (7.1%) |
| $35,000 to $49,999 | 147 (16.1%) | 16 (3.8%) |
| $50,000 to $74,999 | 123 (13.5%) | 0 (0.0%) |
| $75,000 to $99,999 | 163 (17.9%) | 241 (57.0%) |
| $100,000 to $149,999 | 63 (6.9%) | 42 (9.9%) |
| $150,000 or more | 106 (11.6%) | 36 (8.5%) |
| Total | 912 (100.0%) | 423 (100.0%) |
Property Value to Household Income Ratio in La Salle County
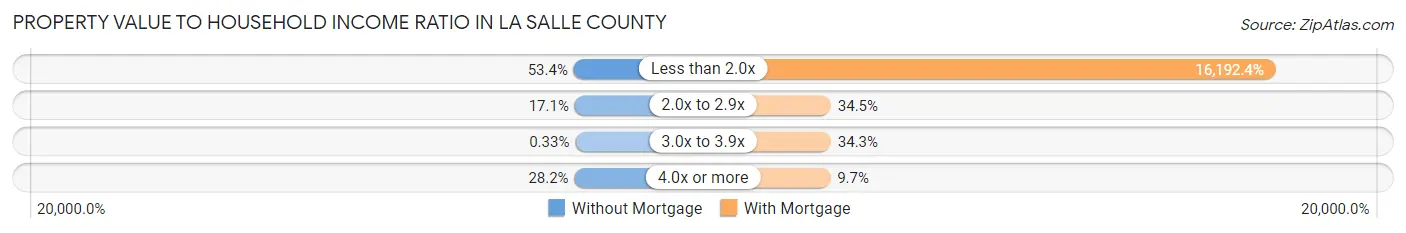
| Value-to-Income Ratio | Without Mortgage | With Mortgage |
| Less than 2.0x | 487 (53.4%) | 68,494 (16,192.4%) |
| 2.0x to 2.9x | 156 (17.1%) | 146 (34.5%) |
| 3.0x to 3.9x | 3 (0.3%) | 145 (34.3%) |
| 4.0x or more | 257 (28.2%) | 41 (9.7%) |
| Total | 912 (100.0%) | 423 (100.0%) |
Real Estate Taxes by Mortgage Status in La Salle County
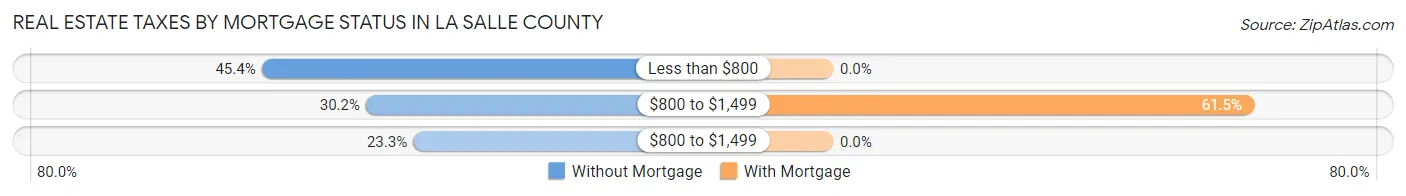
| Property Taxes | Without Mortgage | With Mortgage |
| Less than $800 | 414 (45.4%) | 0 (0.0%) |
| $800 to $1,499 | 275 (30.1%) | 260 (61.5%) |
| $800 to $1,499 | 212 (23.3%) | 0 (0.0%) |
| Total | 912 (100.0%) | 423 (100.0%) |
Health & Disability in La Salle County
Health Insurance Coverage by Age in La Salle County
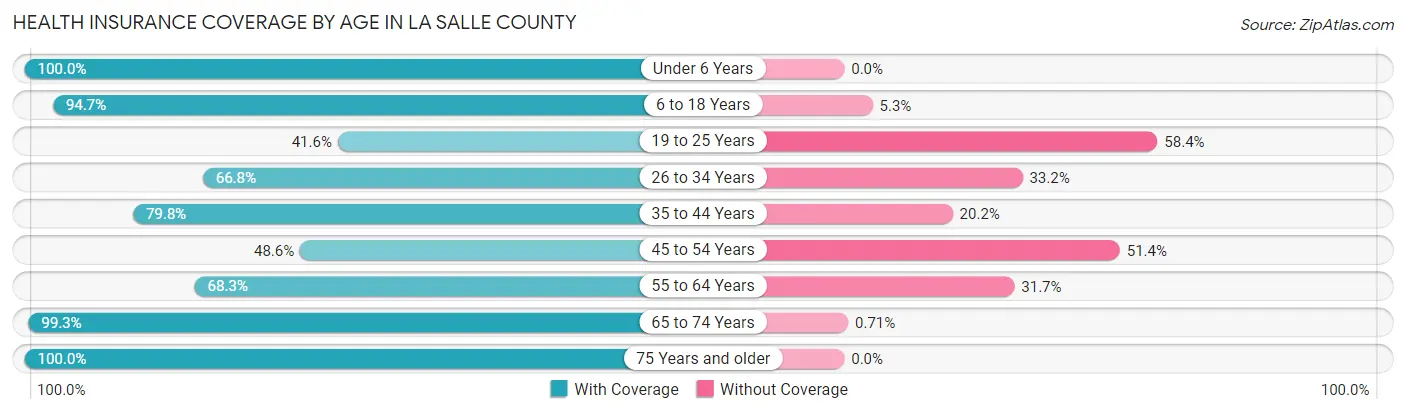
| Age Bracket | With Coverage | Without Coverage |
| Under 6 Years | 212 (100.0%) | 0 (0.0%) |
| 6 to 18 Years | 1,668 (94.7%) | 93 (5.3%) |
| 19 to 25 Years | 196 (41.6%) | 275 (58.4%) |
| 26 to 34 Years | 440 (66.8%) | 219 (33.2%) |
| 35 to 44 Years | 537 (79.8%) | 136 (20.2%) |
| 45 to 54 Years | 285 (48.6%) | 301 (51.4%) |
| 55 to 64 Years | 336 (68.3%) | 156 (31.7%) |
| 65 to 74 Years | 422 (99.3%) | 3 (0.7%) |
| 75 Years and older | 725 (100.0%) | 0 (0.0%) |
| Total | 4,821 (80.3%) | 1,183 (19.7%) |
Health Insurance Coverage by Citizenship Status in La Salle County
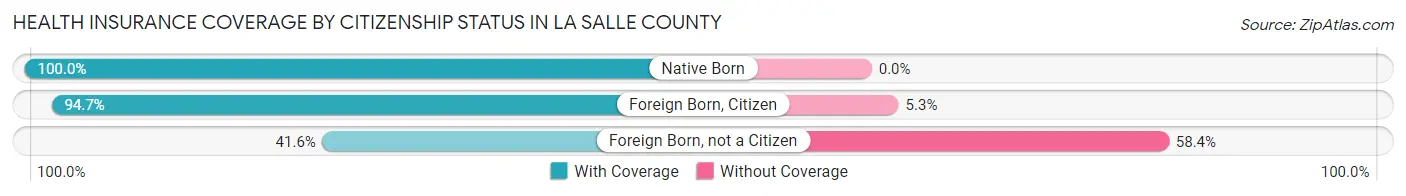
| Citizenship Status | With Coverage | Without Coverage |
| Native Born | 212 (100.0%) | 0 (0.0%) |
| Foreign Born, Citizen | 1,668 (94.7%) | 93 (5.3%) |
| Foreign Born, not a Citizen | 196 (41.6%) | 275 (58.4%) |
Health Insurance Coverage by Household Income in La Salle County
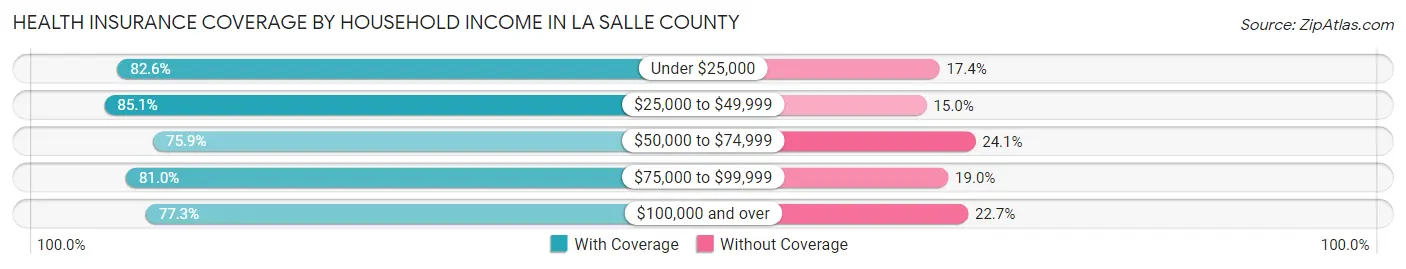
| Household Income | With Coverage | Without Coverage |
| Under $25,000 | 837 (82.6%) | 176 (17.4%) |
| $25,000 to $49,999 | 1,132 (85.1%) | 199 (14.9%) |
| $50,000 to $74,999 | 1,034 (75.9%) | 328 (24.1%) |
| $75,000 to $99,999 | 913 (81.0%) | 214 (19.0%) |
| $100,000 and over | 905 (77.3%) | 266 (22.7%) |
Public vs Private Health Insurance Coverage by Age in La Salle County
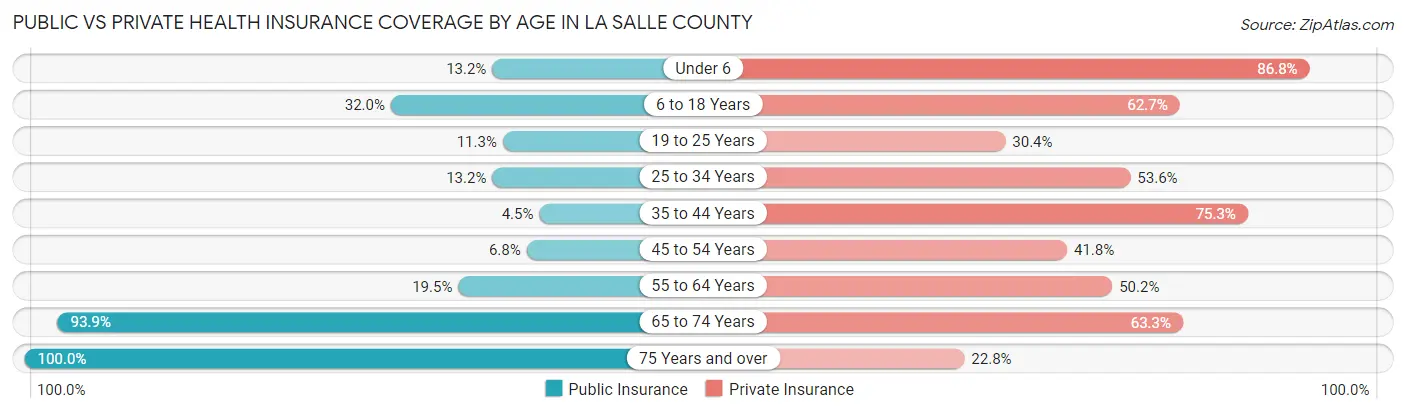
| Age Bracket | Public Insurance | Private Insurance |
| Under 6 | 28 (13.2%) | 184 (86.8%) |
| 6 to 18 Years | 564 (32.0%) | 1,104 (62.7%) |
| 19 to 25 Years | 53 (11.3%) | 143 (30.4%) |
| 25 to 34 Years | 87 (13.2%) | 353 (53.6%) |
| 35 to 44 Years | 30 (4.5%) | 507 (75.3%) |
| 45 to 54 Years | 40 (6.8%) | 245 (41.8%) |
| 55 to 64 Years | 96 (19.5%) | 247 (50.2%) |
| 65 to 74 Years | 399 (93.9%) | 269 (63.3%) |
| 75 Years and over | 725 (100.0%) | 165 (22.8%) |
| Total | 2,022 (33.7%) | 3,217 (53.6%) |
Disability Status by Sex by Age in La Salle County
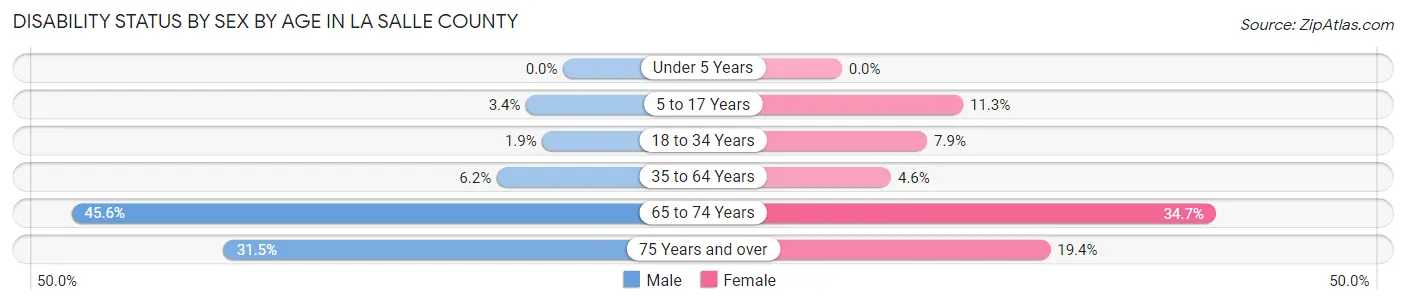
| Age Bracket | Male | Female |
| Under 5 Years | 0 (0.0%) | 0 (0.0%) |
| 5 to 17 Years | 24 (3.4%) | 72 (11.3%) |
| 18 to 34 Years | 21 (1.9%) | 37 (7.9%) |
| 35 to 64 Years | 54 (6.2%) | 40 (4.6%) |
| 65 to 74 Years | 94 (45.6%) | 76 (34.7%) |
| 75 Years and over | 121 (31.5%) | 66 (19.4%) |
Disability Class by Sex by Age in La Salle County
Disability Class: Hearing Difficulty
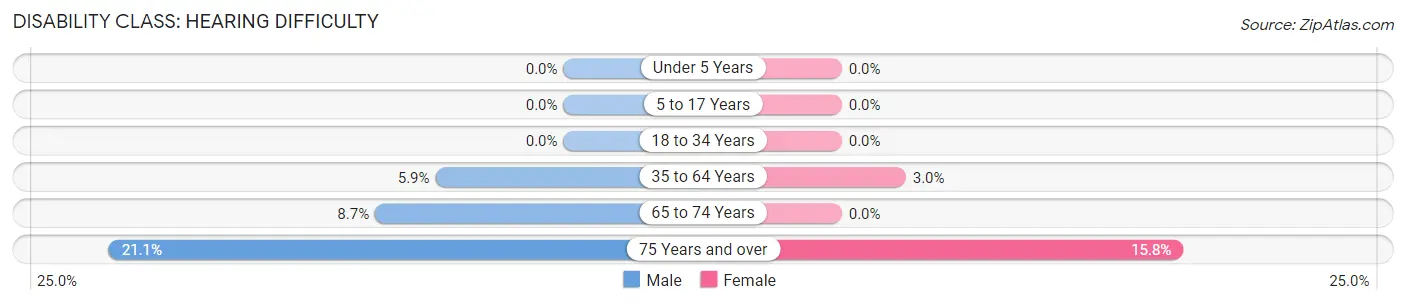
| Age Bracket | Male | Female |
| Under 5 Years | 0 (0.0%) | 0 (0.0%) |
| 5 to 17 Years | 0 (0.0%) | 0 (0.0%) |
| 18 to 34 Years | 0 (0.0%) | 0 (0.0%) |
| 35 to 64 Years | 52 (5.9%) | 26 (3.0%) |
| 65 to 74 Years | 18 (8.7%) | 0 (0.0%) |
| 75 Years and over | 81 (21.1%) | 54 (15.8%) |
Disability Class: Vision Difficulty
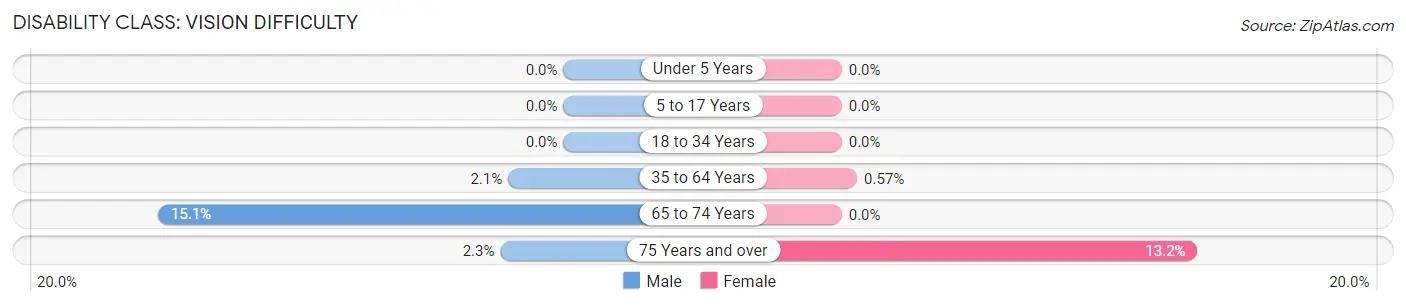
| Age Bracket | Male | Female |
| Under 5 Years | 0 (0.0%) | 0 (0.0%) |
| 5 to 17 Years | 0 (0.0%) | 0 (0.0%) |
| 18 to 34 Years | 0 (0.0%) | 0 (0.0%) |
| 35 to 64 Years | 18 (2.1%) | 5 (0.6%) |
| 65 to 74 Years | 31 (15.0%) | 0 (0.0%) |
| 75 Years and over | 9 (2.3%) | 45 (13.2%) |
Disability Class: Cognitive Difficulty
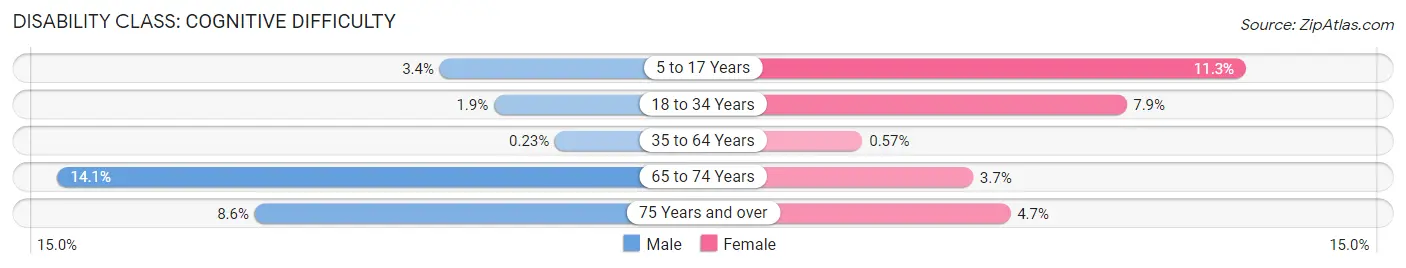
| Age Bracket | Male | Female |
| 5 to 17 Years | 24 (3.4%) | 72 (11.3%) |
| 18 to 34 Years | 21 (1.9%) | 37 (7.9%) |
| 35 to 64 Years | 2 (0.2%) | 5 (0.6%) |
| 65 to 74 Years | 29 (14.1%) | 8 (3.6%) |
| 75 Years and over | 33 (8.6%) | 16 (4.7%) |
Disability Class: Ambulatory Difficulty
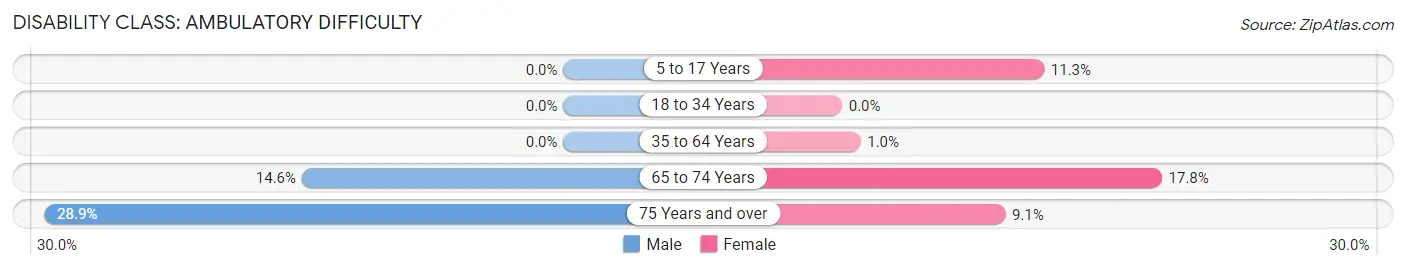
| Age Bracket | Male | Female |
| 5 to 17 Years | 0 (0.0%) | 72 (11.3%) |
| 18 to 34 Years | 0 (0.0%) | 0 (0.0%) |
| 35 to 64 Years | 0 (0.0%) | 9 (1.0%) |
| 65 to 74 Years | 30 (14.6%) | 39 (17.8%) |
| 75 Years and over | 111 (28.9%) | 31 (9.1%) |
Disability Class: Self-Care Difficulty
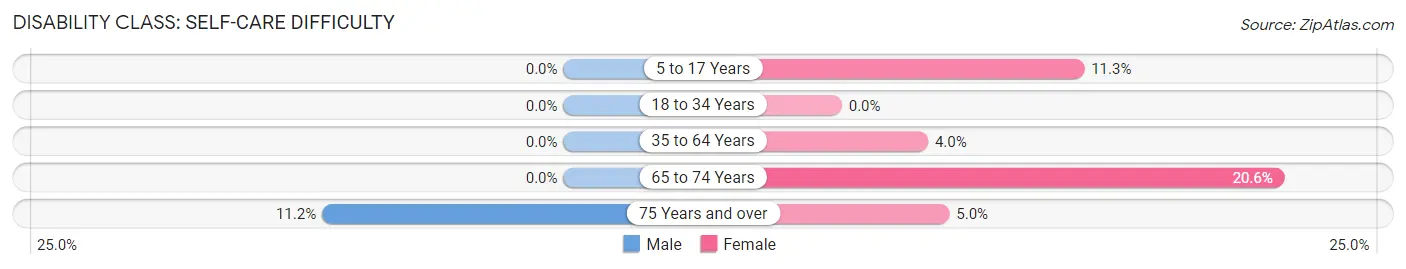
| Age Bracket | Male | Female |
| 5 to 17 Years | 0 (0.0%) | 72 (11.3%) |
| 18 to 34 Years | 0 (0.0%) | 0 (0.0%) |
| 35 to 64 Years | 0 (0.0%) | 35 (4.0%) |
| 65 to 74 Years | 0 (0.0%) | 45 (20.5%) |
| 75 Years and over | 43 (11.2%) | 17 (5.0%) |
Technology Access in La Salle County
Computing Device Access in La Salle County
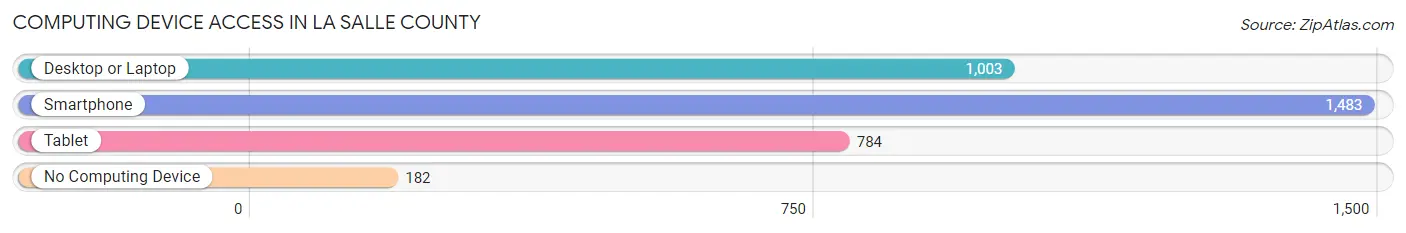
| Device Type | # Households | % Households |
| Desktop or Laptop | 1,003 | 59.4% |
| Smartphone | 1,483 | 87.9% |
| Tablet | 784 | 46.5% |
| No Computing Device | 182 | 10.8% |
| Total | 1,688 | 100.0% |
Internet Access in La Salle County
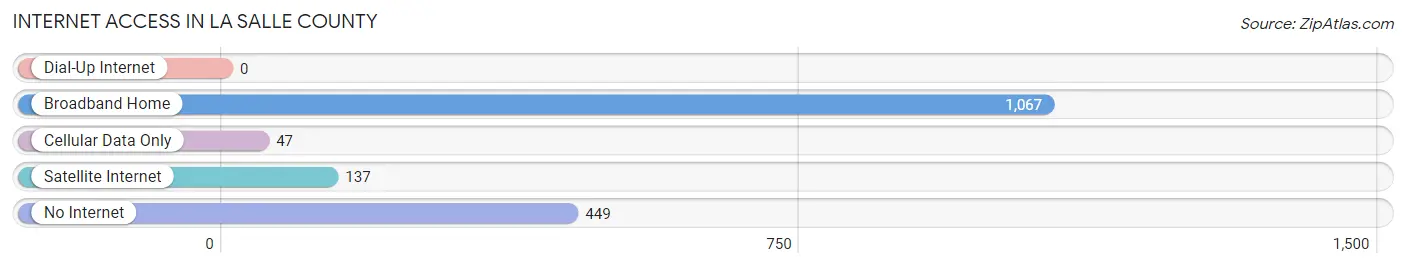
| Internet Type | # Households | % Households |
| Dial-Up Internet | 0 | 0.0% |
| Broadband Home | 1,067 | 63.2% |
| Cellular Data Only | 47 | 2.8% |
| Satellite Internet | 137 | 8.1% |
| No Internet | 449 | 26.6% |
| Total | 1,688 | 100.0% |
La Salle County Summary
La Salle County is located in the south-central region of Texas, and is part of the Eagle Ford Shale region. It is bordered by Webb County to the north, McMullen County to the east, Dimmit County to the south, and Zavala County to the west. The county seat is Cotulla, and the largest city is Encinal. The county has a total area of 1,335 square miles, of which 1,334 square miles is land and 1 square mile is water.
History
La Salle County was established in 1858 and named after René-Robert Cavelier, Sieur de La Salle, a French explorer who explored the area in the late 1600s. The county was originally part of the Nueces Strip, a disputed area between the United States and Mexico. The area was settled by ranchers and farmers in the late 1800s, and the population grew steadily throughout the 20th century.
Geography
La Salle County is located in the south-central region of Texas, and is part of the Eagle Ford Shale region. It is bordered by Webb County to the north, McMullen County to the east, Dimmit County to the south, and Zavala County to the west. The county has a total area of 1,335 square miles, of which 1,334 square miles is land and 1 square mile is water. The terrain is mostly flat, with some rolling hills in the western part of the county. The climate is semi-arid, with hot summers and mild winters.
Economy
The economy of La Salle County is largely based on agriculture and oil and gas production. The county is home to several large ranches, and the main crops grown in the area are cotton, corn, sorghum, and wheat. Oil and gas production is a major industry in the county, and the Eagle Ford Shale formation is a major source of oil and gas. The county also has a growing tourism industry, with several state parks and recreational areas.
Demographics
As of the 2010 census, the population of La Salle County was 6,886. The racial makeup of the county was 79.2% White, 0.7% African American, 0.4% Native American, 0.2% Asian, 0.1% Pacific Islander, 17.7% from other races, and 1.7% from two or more races. Hispanic or Latino of any race were 81.2% of the population. The median household income was $30,945, and the median family income was $35,938. The per capita income was $14,945. About 20.3% of the population was below the poverty line.
La Salle County is a rural area with a diverse population. The county has a strong agricultural and oil and gas industry, and is home to several state parks and recreational areas. The population is largely Hispanic, and the median household income is lower than the state average. The county is a growing area, and is expected to continue to grow in the coming years.
Common Questions
What is Per Capita Income in La Salle County?
Per Capita income in La Salle County is $15,492.
What is the Median Family Income in La Salle County?
Median Family Income in La Salle County is $54,291.
What is the Median Household income in La Salle County?
Median Household Income in La Salle County is $62,798.
What is Income or Wage Gap in La Salle County?
Income or Wage Gap in La Salle County is 1.0%.
Women in La Salle County earn 99.0 cents for every dollar earned by a man.
What is Family Income Deficit in La Salle County?
Family Income Deficit in La Salle County is $8,622.
Families that are below poverty line in La Salle County earn $8,622 less on average than the poverty threshold level.
What is Inequality or Gini Index in La Salle County?
Inequality or Gini Index in La Salle County is 0.38.
What is the Total Population of La Salle County?
Total Population of La Salle County is 6,965.
What is the Total Male Population of La Salle County?
Total Male Population of La Salle County is 4,303.
What is the Total Female Population of La Salle County?
Total Female Population of La Salle County is 2,662.
What is the Ratio of Males per 100 Females in La Salle County?
There are 161.65 Males per 100 Females in La Salle County.
What is the Ratio of Females per 100 Males in La Salle County?
There are 61.86 Females per 100 Males in La Salle County.
What is the Median Population Age in La Salle County?
Median Population Age in La Salle County is 35.0 Years.
What is the Average Family Size in La Salle County
Average Family Size in La Salle County is 3.8 People.
What is the Average Household Size in La Salle County
Average Household Size in La Salle County is 3.6 People.
How Large is the Labor Force in La Salle County?
There are 2,308 People in the Labor Forcein in La Salle County.
What is the Percentage of People in the Labor Force in La Salle County?
40.9% of People are in the Labor Force in La Salle County.
What is the Unemployment Rate in La Salle County?
Unemployment Rate in La Salle County is 4.2%.