Knox County, TX Map & Demographics
Knox County Map
Knox County Overview
$24,892
PER CAPITA INCOME
$58,686
AVG FAMILY INCOME
$48,750
AVG HOUSEHOLD INCOME
32.3%
WAGE / INCOME GAP [ % ]
67.7¢/ $1
WAGE / INCOME GAP [ $ ]
$8,763
FAMILY INCOME DEFICIT
0.43
INEQUALITY / GINI INDEX
3,333
TOTAL POPULATION
1,629
MALE POPULATION
1,704
FEMALE POPULATION
95.60
MALES / 100 FEMALES
104.60
FEMALES / 100 MALES
41.1
MEDIAN AGE
3.1
AVG FAMILY SIZE
2.6
AVG HOUSEHOLD SIZE
1,466
LABOR FORCE [ PEOPLE ]
55.5%
PERCENT IN LABOR FORCE
1.6%
UNEMPLOYMENT RATE
Knox County Area Codes
Income in Knox County
Income Overview in Knox County
Per Capita Income in Knox County is $24,892, while median incomes of families and households are $58,686 and $48,750 respectively.
| Characteristic | Number | Measure |
| Per Capita Income | 3,333 | $24,892 |
| Median Family Income | 890 | $58,686 |
| Mean Family Income | 890 | $75,171 |
| Median Household Income | 1,248 | $48,750 |
| Mean Household Income | 1,248 | $64,145 |
| Income Deficit | 890 | $8,763 |
| Wage / Income Gap (%) | 3,333 | 32.33% |
| Wage / Income Gap ($) | 3,333 | 67.67¢ per $1 |
| Gini / Inequality Index | 3,333 | 0.43 |
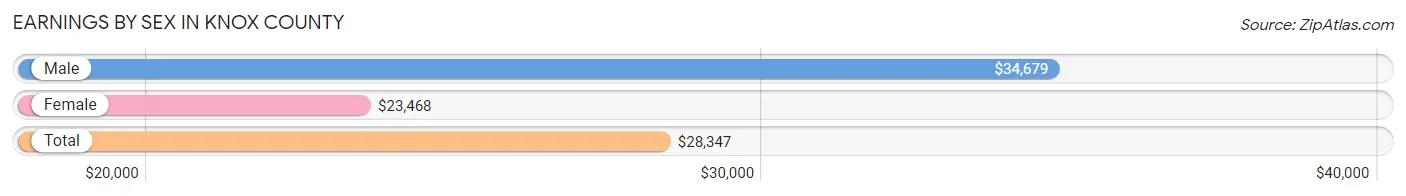
Earnings by Sex in Knox County
Average Earnings in Knox County are $28,347, $34,679 for men and $23,468 for women, a difference of 32.3%.
| Sex | Number | Average Earnings |
| Male | 887 (56.6%) | $34,679 |
| Female | 679 (43.4%) | $23,468 |
| Total | 1,566 (100.0%) | $28,347 |
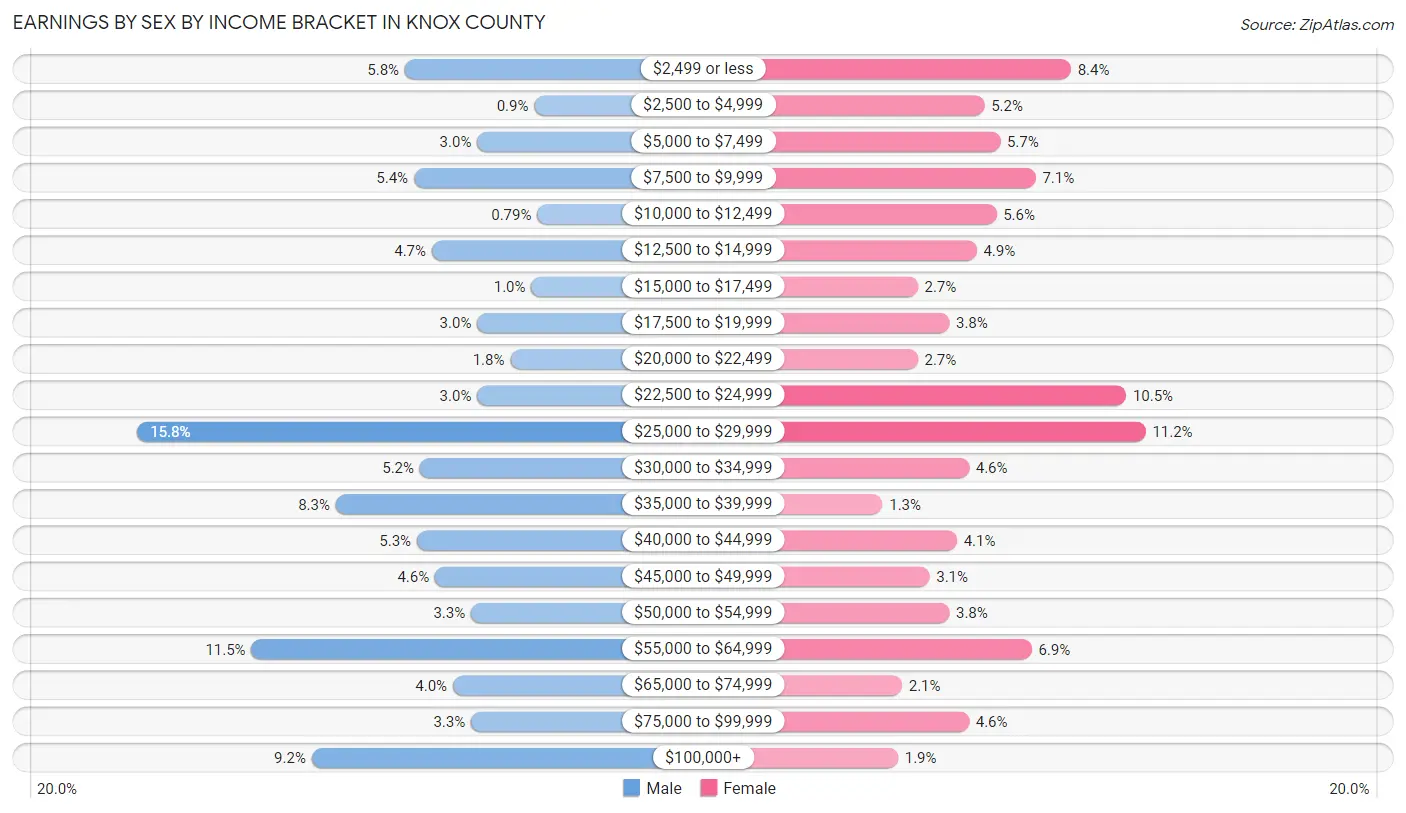
Earnings by Sex by Income Bracket in Knox County
The most common earnings brackets in Knox County are $25,000 to $29,999 for men (140 | 15.8%) and $25,000 to $29,999 for women (76 | 11.2%).
| Income | Male | Female |
| $2,499 or less | 51 (5.8%) | 57 (8.4%) |
| $2,500 to $4,999 | 8 (0.9%) | 35 (5.1%) |
| $5,000 to $7,499 | 27 (3.0%) | 39 (5.7%) |
| $7,500 to $9,999 | 48 (5.4%) | 48 (7.1%) |
| $10,000 to $12,499 | 7 (0.8%) | 38 (5.6%) |
| $12,500 to $14,999 | 42 (4.7%) | 33 (4.9%) |
| $15,000 to $17,499 | 9 (1.0%) | 18 (2.6%) |
| $17,500 to $19,999 | 27 (3.0%) | 26 (3.8%) |
| $20,000 to $22,499 | 16 (1.8%) | 18 (2.6%) |
| $22,500 to $24,999 | 27 (3.0%) | 71 (10.5%) |
| $25,000 to $29,999 | 140 (15.8%) | 76 (11.2%) |
| $30,000 to $34,999 | 46 (5.2%) | 31 (4.6%) |
| $35,000 to $39,999 | 74 (8.3%) | 9 (1.3%) |
| $40,000 to $44,999 | 47 (5.3%) | 28 (4.1%) |
| $45,000 to $49,999 | 41 (4.6%) | 21 (3.1%) |
| $50,000 to $54,999 | 29 (3.3%) | 26 (3.8%) |
| $55,000 to $64,999 | 102 (11.5%) | 47 (6.9%) |
| $65,000 to $74,999 | 35 (4.0%) | 14 (2.1%) |
| $75,000 to $99,999 | 29 (3.3%) | 31 (4.6%) |
| $100,000+ | 82 (9.2%) | 13 (1.9%) |
| Total | 887 (100.0%) | 679 (100.0%) |
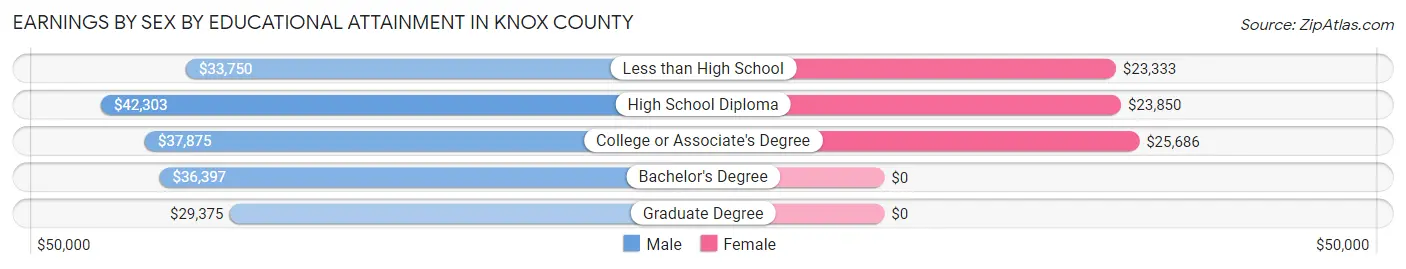
Earnings by Sex by Educational Attainment in Knox County
Average earnings in Knox County are $36,277 for men and $24,454 for women, a difference of 32.6%. Men with an educational attainment of high school diploma enjoy the highest average annual earnings of $42,303, while those with graduate degree education earn the least with $29,375. Women with an educational attainment of college or associate's degree earn the most with the average annual earnings of $25,686, while those with less than high school education have the smallest earnings of $23,333.
| Educational Attainment | Male Income | Female Income |
| Less than High School | $33,750 | $23,333 |
| High School Diploma | $42,303 | $23,850 |
| College or Associate's Degree | $37,875 | $25,686 |
| Bachelor's Degree | $36,397 | $0 |
| Graduate Degree | $29,375 | $0 |
| Total | $36,277 | $24,454 |
Family Income in Knox County
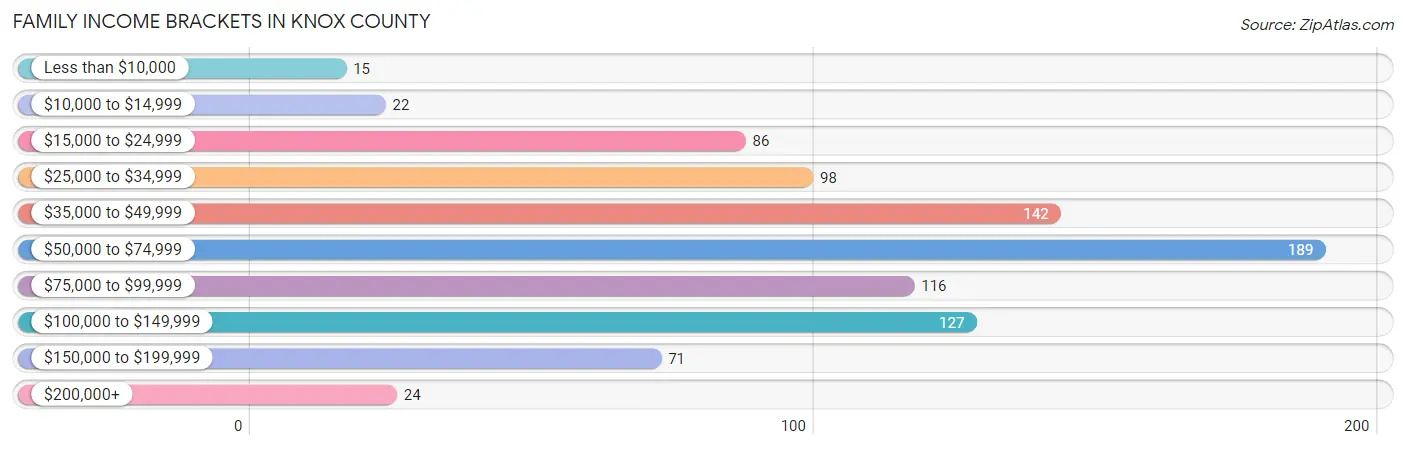
Family Income Brackets in Knox County
According to the Knox County family income data, there are 189 families falling into the $50,000 to $74,999 income range, which is the most common income bracket and makes up 21.2% of all families. Conversely, the less than $10,000 income bracket is the least frequent group with only 15 families (1.7%) belonging to this category.
| Income Bracket | # Families | % Families |
| Less than $10,000 | 15 | 1.7% |
| $10,000 to $14,999 | 22 | 2.5% |
| $15,000 to $24,999 | 86 | 9.7% |
| $25,000 to $34,999 | 98 | 11.0% |
| $35,000 to $49,999 | 142 | 16.0% |
| $50,000 to $74,999 | 189 | 21.2% |
| $75,000 to $99,999 | 116 | 13.0% |
| $100,000 to $149,999 | 127 | 14.3% |
| $150,000 to $199,999 | 71 | 8.0% |
| $200,000+ | 24 | 2.7% |
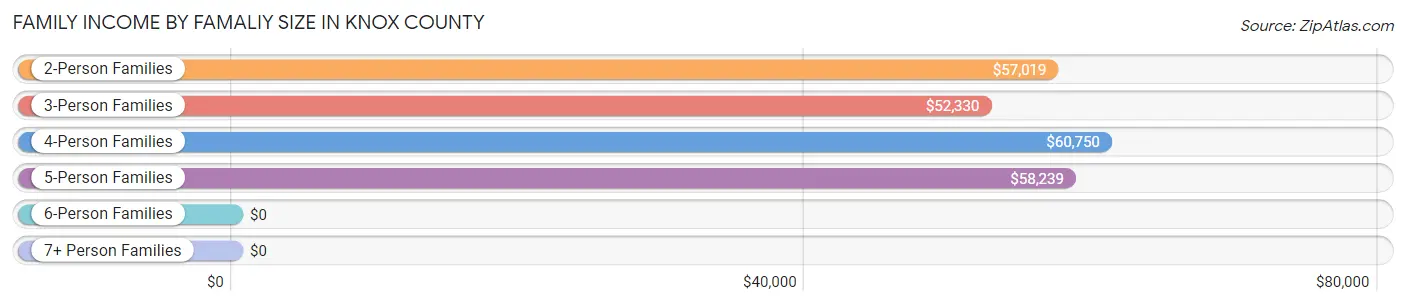
Family Income by Famaliy Size in Knox County
4-person families (151 | 17.0%) account for the highest median family income in Knox County with $60,750 per family, while 2-person families (479 | 53.8%) have the highest median income of $28,510 per family member.
| Income Bracket | # Families | Median Income |
| 2-Person Families | 479 (53.8%) | $57,019 |
| 3-Person Families | 133 (14.9%) | $52,330 |
| 4-Person Families | 151 (17.0%) | $60,750 |
| 5-Person Families | 86 (9.7%) | $58,239 |
| 6-Person Families | 35 (3.9%) | $0 |
| 7+ Person Families | 6 (0.7%) | $0 |
| Total | 890 (100.0%) | $58,686 |
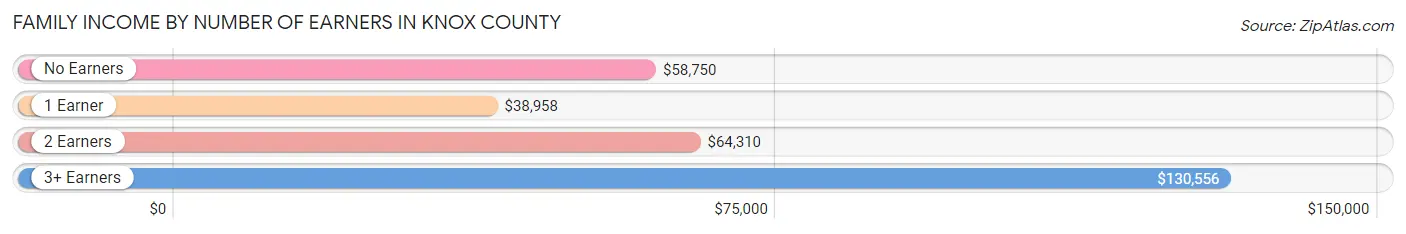
Family Income by Number of Earners in Knox County
The median family income in Knox County is $58,686, with families comprising 3+ earners (44) having the highest median family income of $130,556, while families with 1 earner (312) have the lowest median family income of $38,958, accounting for 4.9% and 35.1% of families, respectively.
| Number of Earners | # Families | Median Income |
| No Earners | 130 (14.6%) | $58,750 |
| 1 Earner | 312 (35.1%) | $38,958 |
| 2 Earners | 404 (45.4%) | $64,310 |
| 3+ Earners | 44 (4.9%) | $130,556 |
| Total | 890 (100.0%) | $58,686 |
Household Income in Knox County
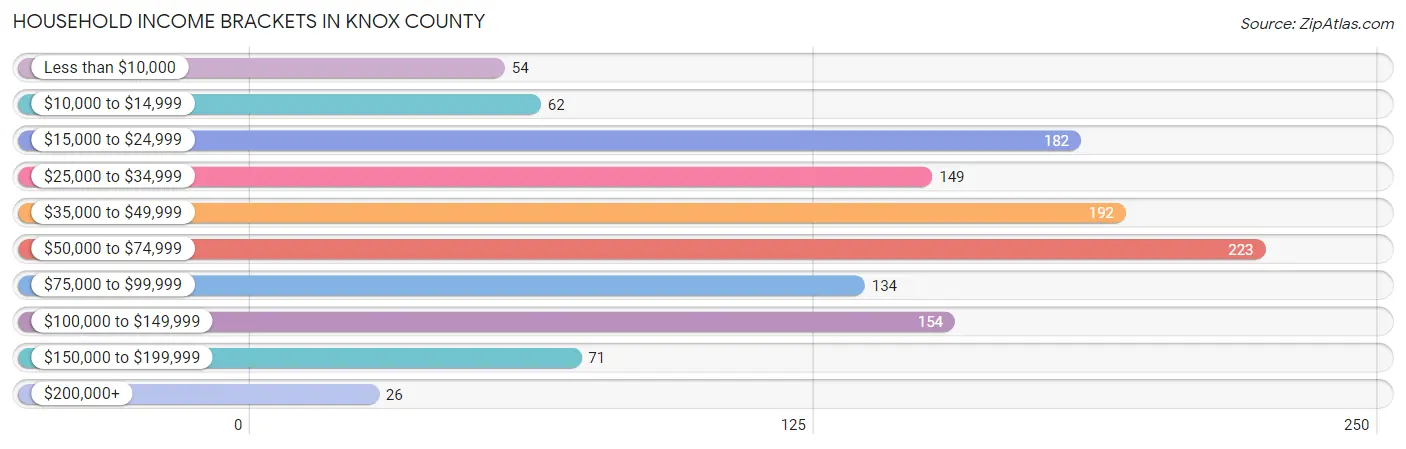
Household Income Brackets in Knox County
With 223 households falling in the category, the $50,000 to $74,999 income range is the most frequent in Knox County, accounting for 17.9% of all households. In contrast, only 26 households (2.1%) fall into the $200,000+ income bracket, making it the least populous group.
| Income Bracket | # Households | % Households |
| Less than $10,000 | 54 | 4.3% |
| $10,000 to $14,999 | 62 | 5.0% |
| $15,000 to $24,999 | 182 | 14.6% |
| $25,000 to $34,999 | 149 | 11.9% |
| $35,000 to $49,999 | 192 | 15.4% |
| $50,000 to $74,999 | 223 | 17.9% |
| $75,000 to $99,999 | 134 | 10.7% |
| $100,000 to $149,999 | 154 | 12.3% |
| $150,000 to $199,999 | 71 | 5.7% |
| $200,000+ | 26 | 2.1% |
Household Income by Householder Age in Knox County
The median household income in Knox County is $48,750, with the highest median household income of $77,969 found in the 45 to 64 years age bracket for the primary householder. A total of 423 households (33.9%) fall into this category. Meanwhile, the 15 to 24 years age bracket for the primary householder has the lowest median household income of $0, with 20 households (1.6%) in this group.
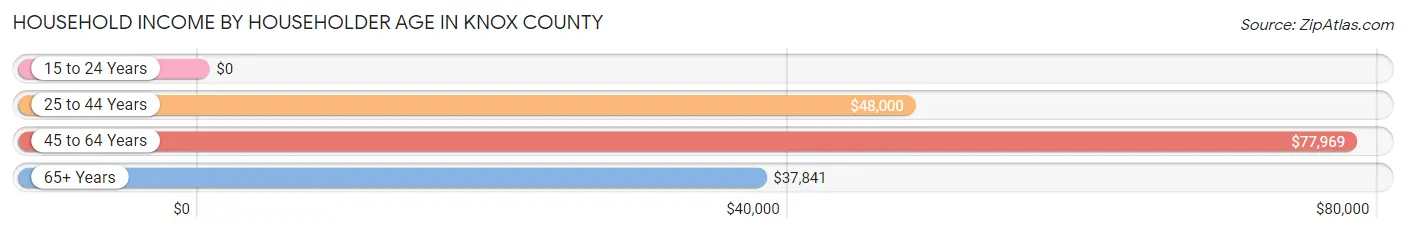
| Income Bracket | # Households | Median Income |
| 15 to 24 Years | 20 (1.6%) | $0 |
| 25 to 44 Years | 434 (34.8%) | $48,000 |
| 45 to 64 Years | 423 (33.9%) | $77,969 |
| 65+ Years | 371 (29.7%) | $37,841 |
| Total | 1,248 (100.0%) | $48,750 |
Poverty in Knox County
Income Below Poverty by Sex and Age in Knox County
With 11.7% poverty level for males and 11.1% for females among the residents of Knox County, 12 to 14 year old males and 6 to 11 year old females are the most vulnerable to poverty, with 22 males (28.9%) and 20 females (17.5%) in their respective age groups living below the poverty level.
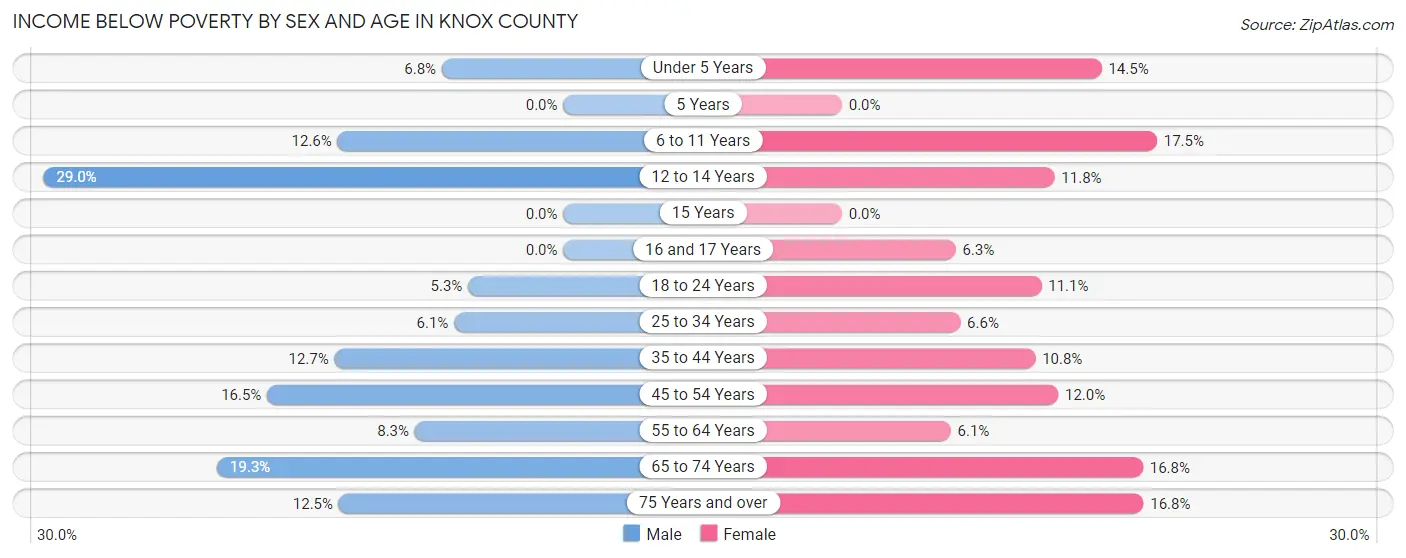
| Age Bracket | Male | Female |
| Under 5 Years | 5 (6.8%) | 12 (14.5%) |
| 5 Years | 0 (0.0%) | 0 (0.0%) |
| 6 to 11 Years | 24 (12.6%) | 20 (17.5%) |
| 12 to 14 Years | 22 (28.9%) | 9 (11.8%) |
| 15 Years | 0 (0.0%) | 0 (0.0%) |
| 16 and 17 Years | 0 (0.0%) | 5 (6.3%) |
| 18 to 24 Years | 7 (5.3%) | 8 (11.1%) |
| 25 to 34 Years | 9 (6.1%) | 12 (6.6%) |
| 35 to 44 Years | 27 (12.7%) | 28 (10.8%) |
| 45 to 54 Years | 31 (16.5%) | 23 (12.0%) |
| 55 to 64 Years | 22 (8.3%) | 12 (6.1%) |
| 65 to 74 Years | 27 (19.3%) | 30 (16.8%) |
| 75 Years and over | 10 (12.5%) | 23 (16.8%) |
| Total | 184 (11.7%) | 182 (11.1%) |
Income Above Poverty by Sex and Age in Knox County
According to the poverty statistics in Knox County, males aged 5 years and females aged 5 years are the age groups that are most secure financially, with 100.0% of males and 100.0% of females in these age groups living above the poverty line.
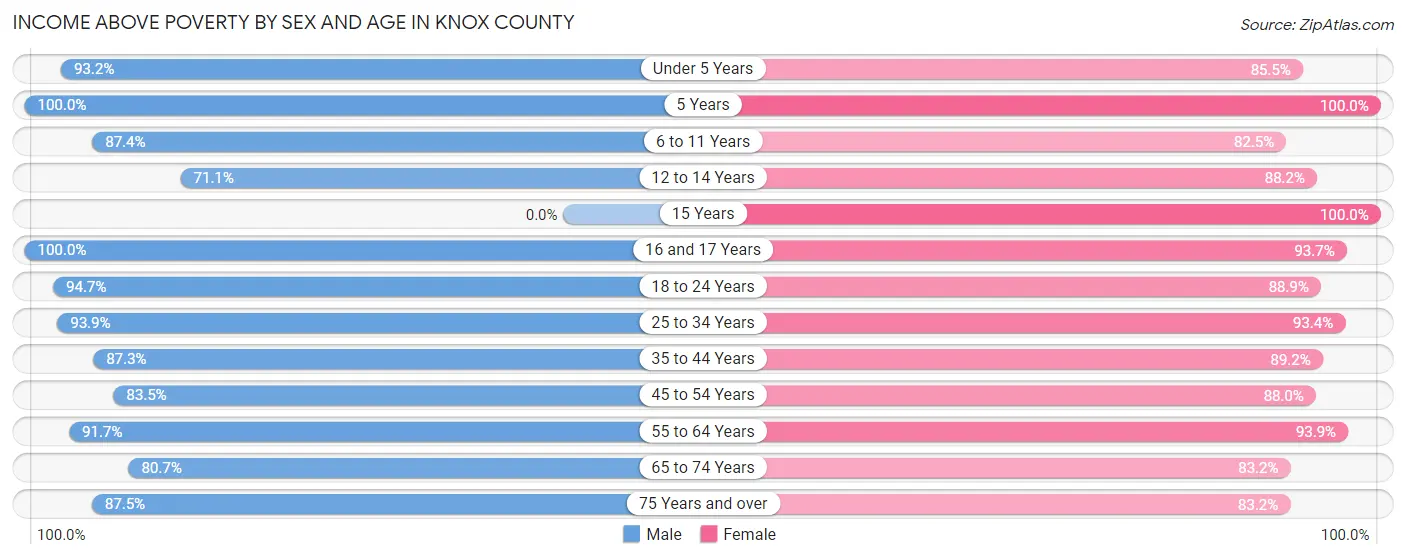
| Age Bracket | Male | Female |
| Under 5 Years | 69 (93.2%) | 71 (85.5%) |
| 5 Years | 12 (100.0%) | 38 (100.0%) |
| 6 to 11 Years | 167 (87.4%) | 94 (82.5%) |
| 12 to 14 Years | 54 (71.1%) | 67 (88.2%) |
| 15 Years | 0 (0.0%) | 27 (100.0%) |
| 16 and 17 Years | 48 (100.0%) | 74 (93.7%) |
| 18 to 24 Years | 125 (94.7%) | 64 (88.9%) |
| 25 to 34 Years | 139 (93.9%) | 170 (93.4%) |
| 35 to 44 Years | 185 (87.3%) | 232 (89.2%) |
| 45 to 54 Years | 157 (83.5%) | 168 (88.0%) |
| 55 to 64 Years | 244 (91.7%) | 186 (93.9%) |
| 65 to 74 Years | 113 (80.7%) | 149 (83.2%) |
| 75 Years and over | 70 (87.5%) | 114 (83.2%) |
| Total | 1,383 (88.3%) | 1,454 (88.9%) |
Income Below Poverty Among Married-Couple Families in Knox County
The poverty statistics for married-couple families in Knox County show that 5.3% or 35 of the total 657 families live below the poverty line. Families with no children have the highest poverty rate of 6.8%, comprising of 26 families. On the other hand, families with 5 or more children have the lowest poverty rate of 0.0%, which includes 0 families.
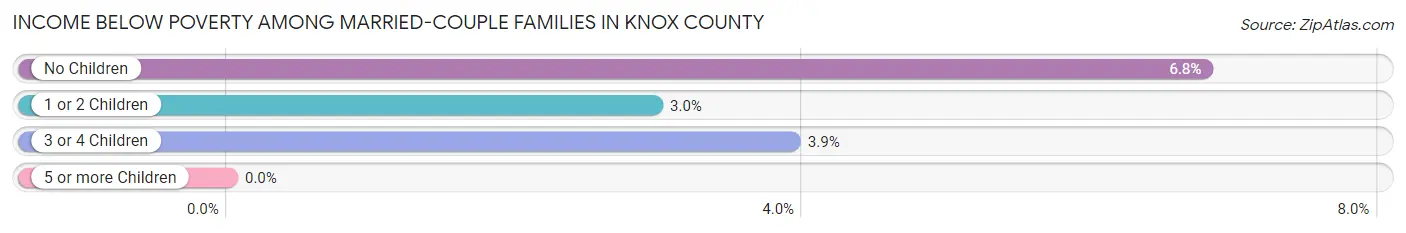
| Children | Above Poverty | Below Poverty |
| No Children | 357 (93.2%) | 26 (6.8%) |
| 1 or 2 Children | 164 (97.0%) | 5 (3.0%) |
| 3 or 4 Children | 98 (96.1%) | 4 (3.9%) |
| 5 or more Children | 3 (100.0%) | 0 (0.0%) |
| Total | 622 (94.7%) | 35 (5.3%) |
Income Below Poverty Among Single-Parent Households in Knox County
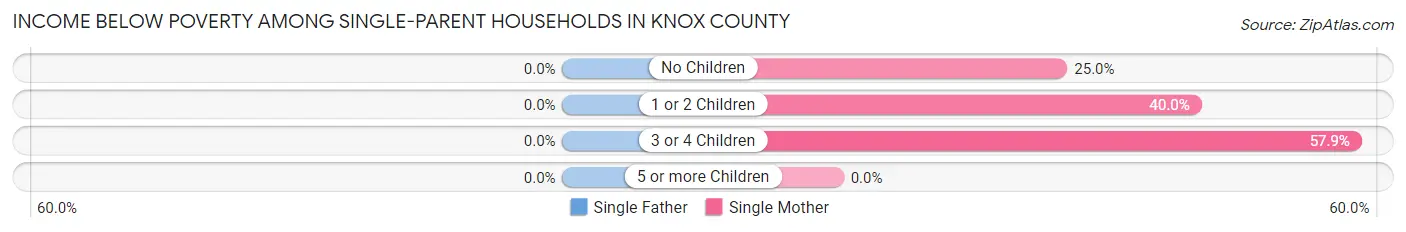
| Children | Single Father | Single Mother |
| No Children | 0 (0.0%) | 21 (25.0%) |
| 1 or 2 Children | 0 (0.0%) | 14 (40.0%) |
| 3 or 4 Children | 0 (0.0%) | 11 (57.9%) |
| 5 or more Children | 0 (0.0%) | 0 (0.0%) |
| Total | 0 (0.0%) | 46 (33.3%) |
Income Below Poverty Among Married-Couple vs Single-Parent Households in Knox County
The poverty data for Knox County shows that 35 of the married-couple family households (5.3%) and 46 of the single-parent households (19.7%) are living below the poverty level. Within the married-couple family households, those with no children have the highest poverty rate, with 26 households (6.8%) falling below the poverty line. Among the single-parent households, those with 3 or 4 children have the highest poverty rate, with 11 household (57.9%) living below poverty.
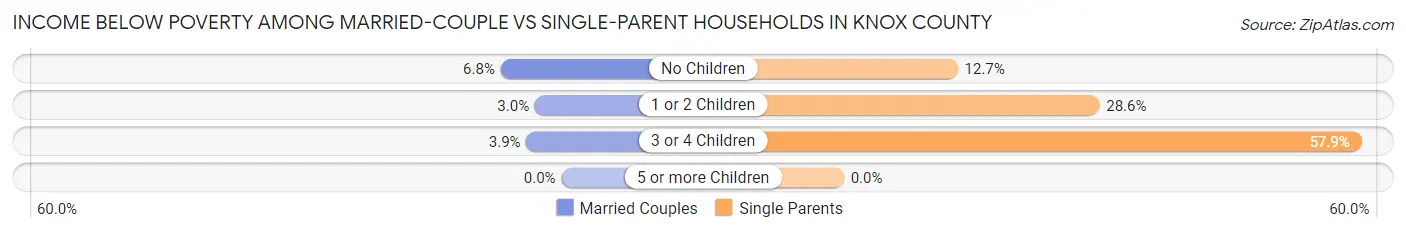
| Children | Married-Couple Families | Single-Parent Households |
| No Children | 26 (6.8%) | 21 (12.7%) |
| 1 or 2 Children | 5 (3.0%) | 14 (28.6%) |
| 3 or 4 Children | 4 (3.9%) | 11 (57.9%) |
| 5 or more Children | 0 (0.0%) | 0 (0.0%) |
| Total | 35 (5.3%) | 46 (19.7%) |
Race in Knox County
The most populous races in Knox County are White / Caucasian (2,442 | 73.3%), Hispanic or Latino (1,164 | 34.9%), and Two or more Races (471 | 14.1%).
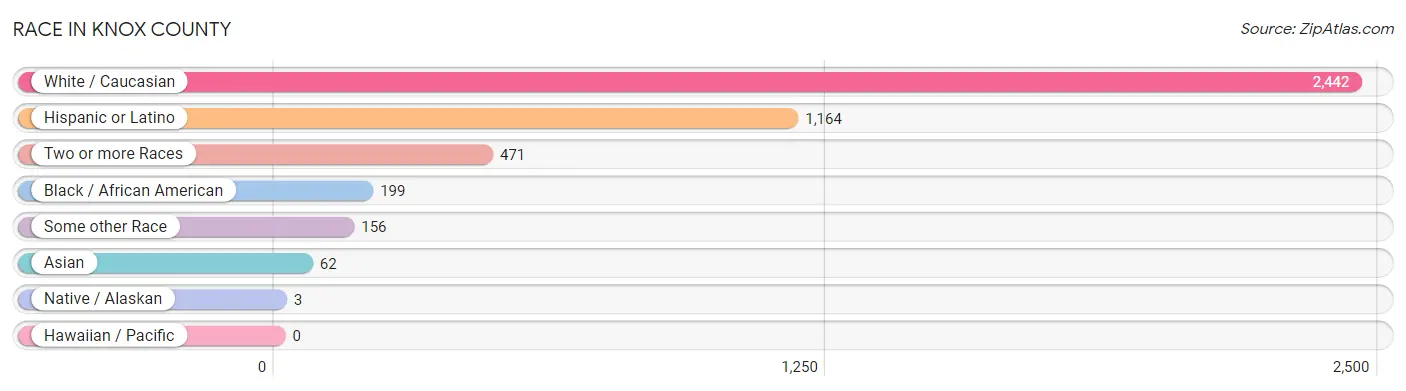
| Race | # Population | % Population |
| Asian | 62 | 1.9% |
| Black / African American | 199 | 6.0% |
| Hawaiian / Pacific | 0 | 0.0% |
| Hispanic or Latino | 1,164 | 34.9% |
| Native / Alaskan | 3 | 0.1% |
| White / Caucasian | 2,442 | 73.3% |
| Two or more Races | 471 | 14.1% |
| Some other Race | 156 | 4.7% |
| Total | 3,333 | 100.0% |
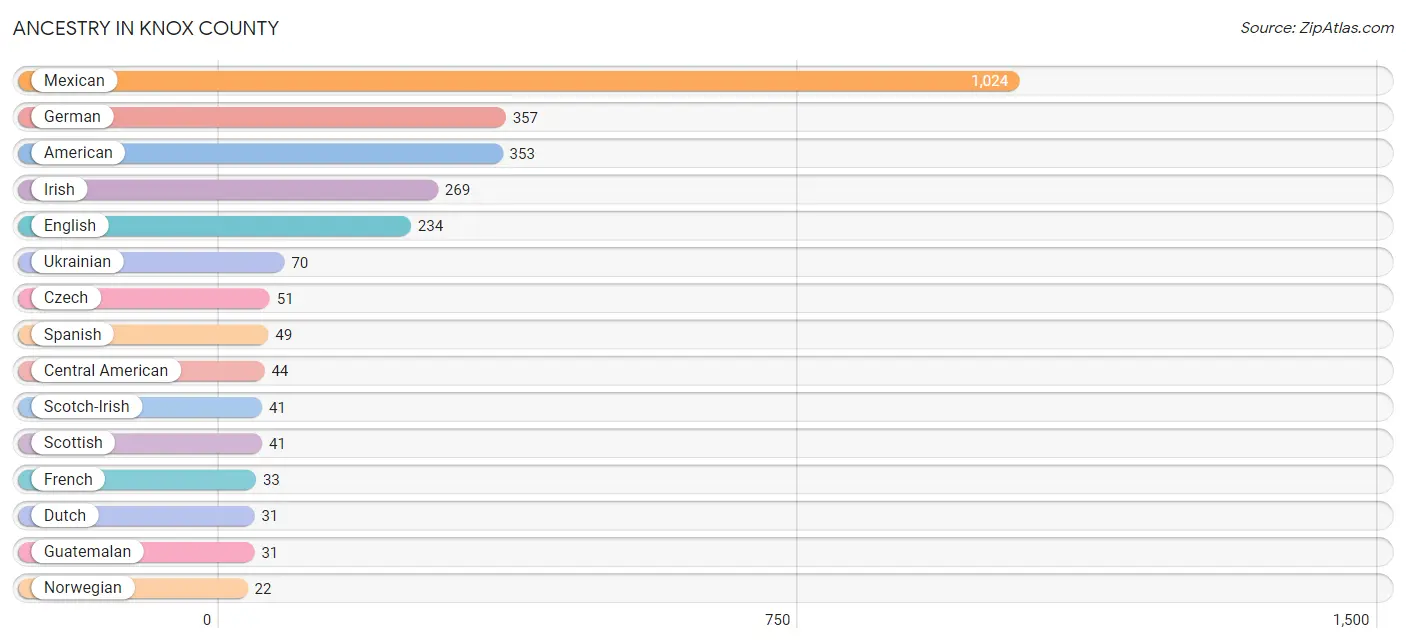
Ancestry in Knox County
The most populous ancestries reported in Knox County are Mexican (1,024 | 30.7%), German (357 | 10.7%), American (353 | 10.6%), Irish (269 | 8.1%), and English (234 | 7.0%), together accounting for 67.1% of all Knox County residents.
| Ancestry | # Population | % Population |
| American | 353 | 10.6% |
| Arab | 11 | 0.3% |
| Blackfeet | 2 | 0.1% |
| British | 10 | 0.3% |
| Celtic | 2 | 0.1% |
| Central American | 44 | 1.3% |
| Cherokee | 8 | 0.2% |
| Chickasaw | 3 | 0.1% |
| Choctaw | 2 | 0.1% |
| Comanche | 2 | 0.1% |
| Cuban | 6 | 0.2% |
| Czech | 51 | 1.5% |
| Czechoslovakian | 6 | 0.2% |
| Dutch | 31 | 0.9% |
| Dutch West Indian | 3 | 0.1% |
| English | 234 | 7.0% |
| French | 33 | 1.0% |
| German | 357 | 10.7% |
| Guatemalan | 31 | 0.9% |
| Honduran | 11 | 0.3% |
| Indian (Asian) | 10 | 0.3% |
| Irish | 269 | 8.1% |
| Italian | 19 | 0.6% |
| Lebanese | 11 | 0.3% |
| Mexican | 1,024 | 30.7% |
| Norwegian | 22 | 0.7% |
| Pennsylvania German | 3 | 0.1% |
| Polish | 10 | 0.3% |
| Salvadoran | 2 | 0.1% |
| Scandinavian | 4 | 0.1% |
| Scotch-Irish | 41 | 1.2% |
| Scottish | 41 | 1.2% |
| Spanish | 49 | 1.5% |
| Swedish | 5 | 0.2% |
| Swiss | 4 | 0.1% |
| Ukrainian | 70 | 2.1% |
| Welsh | 14 | 0.4% | View All 37 Rows |
Immigrants in Knox County
The most numerous immigrant groups reported in Knox County came from Central America (207 | 6.2%), Latin America (207 | 6.2%), Mexico (197 | 5.9%), Asia (62 | 1.9%), and Nepal (62 | 1.9%), together accounting for 22.1% of all Knox County residents.
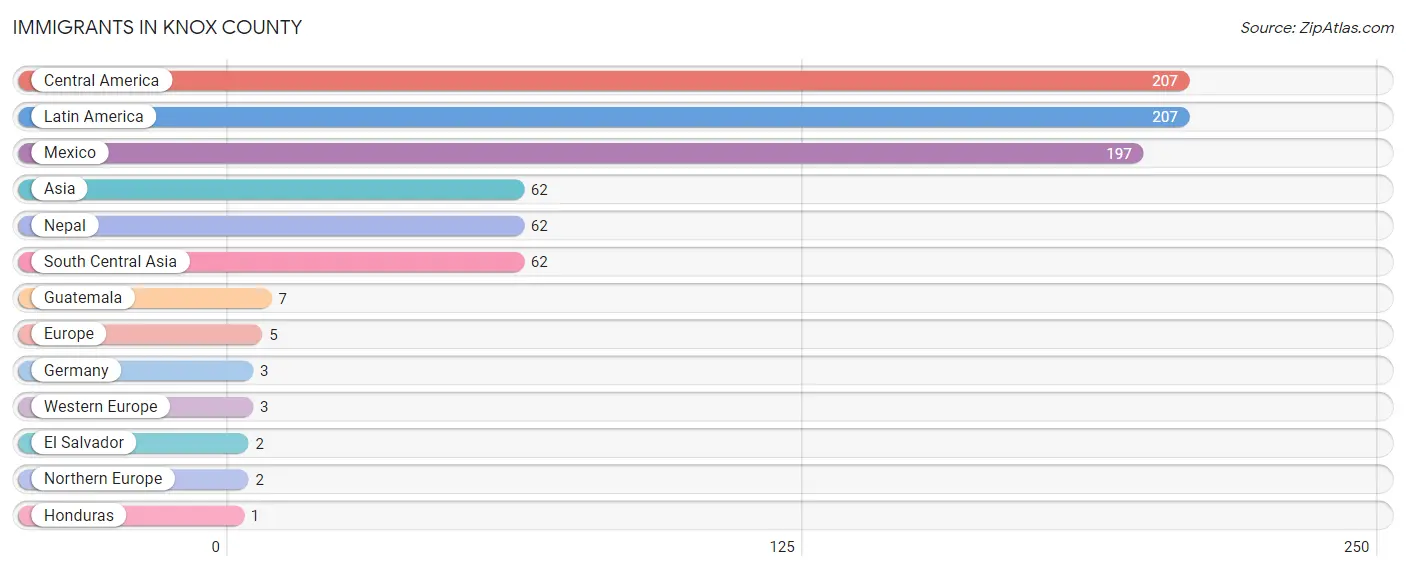
| Immigration Origin | # Population | % Population |
| Asia | 62 | 1.9% |
| Central America | 207 | 6.2% |
| El Salvador | 2 | 0.1% |
| Europe | 5 | 0.2% |
| Germany | 3 | 0.1% |
| Guatemala | 7 | 0.2% |
| Honduras | 1 | 0.0% |
| Latin America | 207 | 6.2% |
| Mexico | 197 | 5.9% |
| Nepal | 62 | 1.9% |
| Northern Europe | 2 | 0.1% |
| South Central Asia | 62 | 1.9% |
| Western Europe | 3 | 0.1% | View All 13 Rows |
Sex and Age in Knox County
Sex and Age in Knox County
The most populous age groups in Knox County are 5 to 9 Years (173 | 10.6%) for men and 60 to 64 Years (159 | 9.3%) for women.
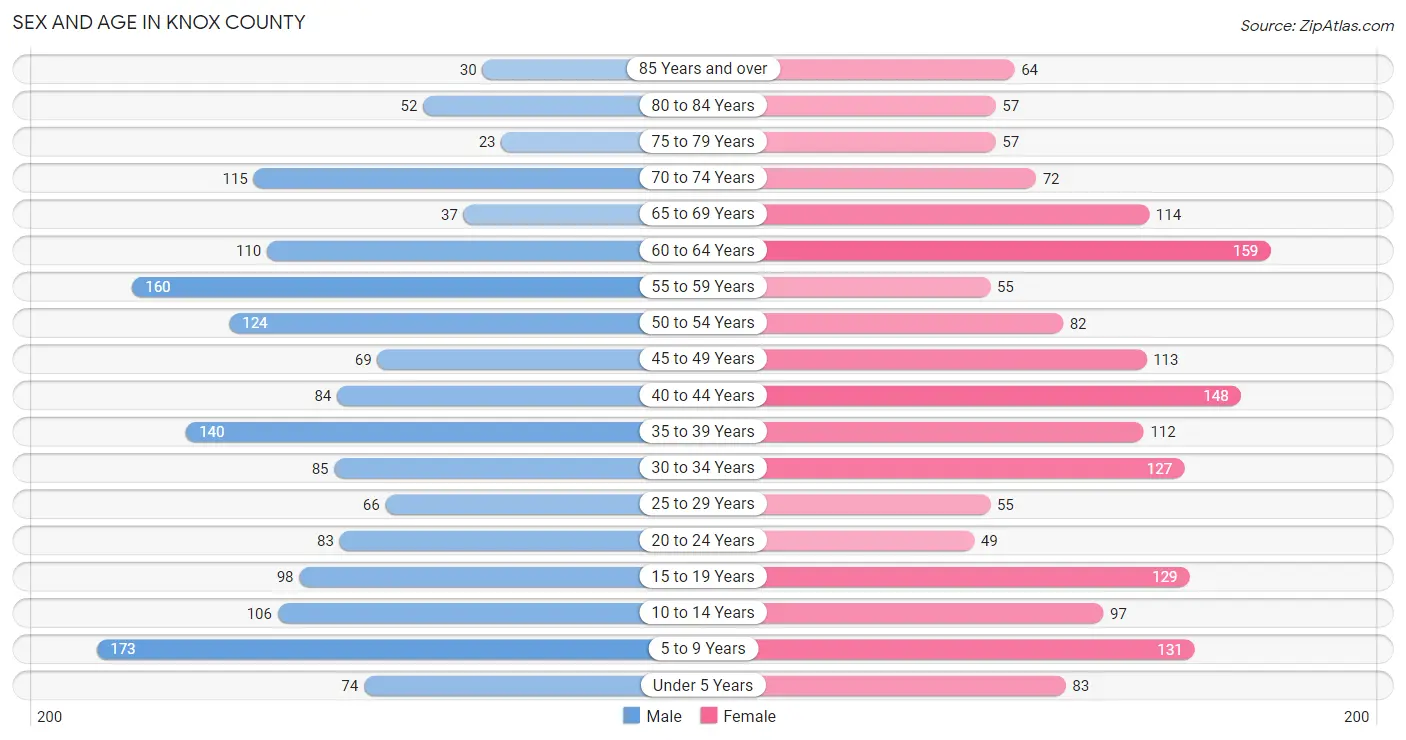
| Age Bracket | Male | Female |
| Under 5 Years | 74 (4.5%) | 83 (4.9%) |
| 5 to 9 Years | 173 (10.6%) | 131 (7.7%) |
| 10 to 14 Years | 106 (6.5%) | 97 (5.7%) |
| 15 to 19 Years | 98 (6.0%) | 129 (7.6%) |
| 20 to 24 Years | 83 (5.1%) | 49 (2.9%) |
| 25 to 29 Years | 66 (4.1%) | 55 (3.2%) |
| 30 to 34 Years | 85 (5.2%) | 127 (7.4%) |
| 35 to 39 Years | 140 (8.6%) | 112 (6.6%) |
| 40 to 44 Years | 84 (5.2%) | 148 (8.7%) |
| 45 to 49 Years | 69 (4.2%) | 113 (6.6%) |
| 50 to 54 Years | 124 (7.6%) | 82 (4.8%) |
| 55 to 59 Years | 160 (9.8%) | 55 (3.2%) |
| 60 to 64 Years | 110 (6.8%) | 159 (9.3%) |
| 65 to 69 Years | 37 (2.3%) | 114 (6.7%) |
| 70 to 74 Years | 115 (7.1%) | 72 (4.2%) |
| 75 to 79 Years | 23 (1.4%) | 57 (3.4%) |
| 80 to 84 Years | 52 (3.2%) | 57 (3.4%) |
| 85 Years and over | 30 (1.8%) | 64 (3.8%) |
| Total | 1,629 (100.0%) | 1,704 (100.0%) |
Families and Households in Knox County
Median Family Size in Knox County
The median family size in Knox County is 3.12 persons per family, with married-couple families (657 | 73.8%) accounting for the largest median family size of 3.29 persons per family. On the other hand, single male/father families (95 | 10.7%) represent the smallest median family size with 1.91 persons per family.
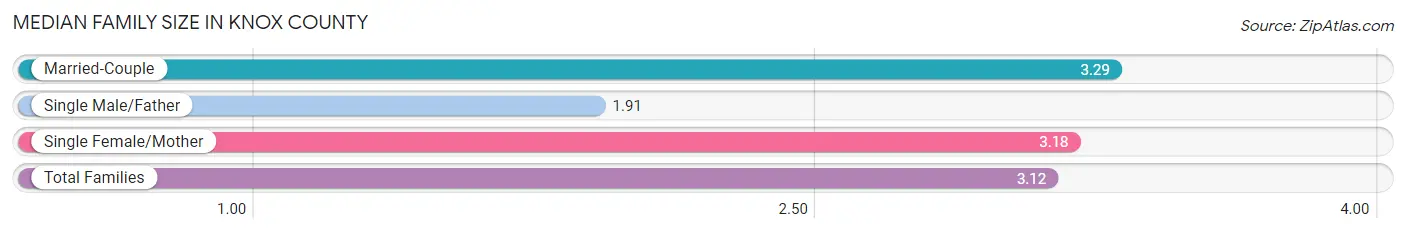
| Family Type | # Families | Family Size |
| Married-Couple | 657 (73.8%) | 3.29 |
| Single Male/Father | 95 (10.7%) | 1.91 |
| Single Female/Mother | 138 (15.5%) | 3.18 |
| Total Families | 890 (100.0%) | 3.12 |
Median Household Size in Knox County
The median household size in Knox County is 2.56 persons per household, with married-couple households (657 | 52.6%) accounting for the largest median household size of 3.29 persons per household. non-family households (358 | 28.7%) represent the smallest median household size with 1.13 persons per household.
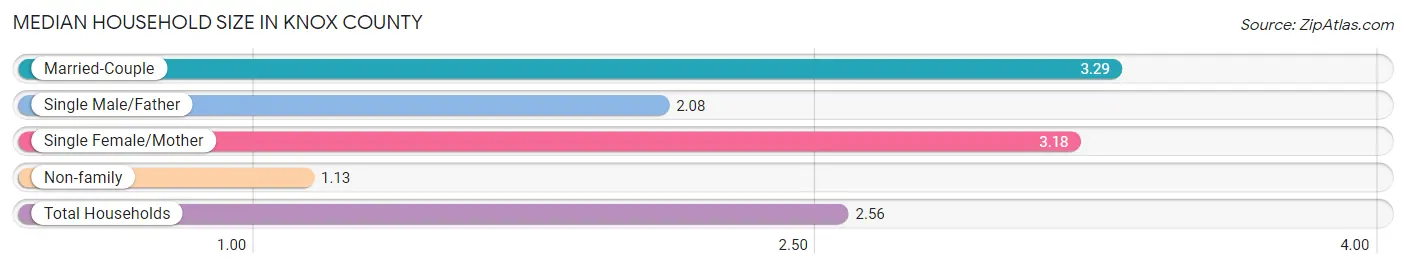
| Household Type | # Households | Household Size |
| Married-Couple | 657 (52.6%) | 3.29 |
| Single Male/Father | 95 (7.6%) | 2.08 |
| Single Female/Mother | 138 (11.1%) | 3.18 |
| Non-family | 358 (28.7%) | 1.13 |
| Total Households | 1,248 (100.0%) | 2.56 |
Household Size by Marriage Status in Knox County
Out of a total of 1,248 households in Knox County, 890 (71.3%) are family households, while 358 (28.7%) are nonfamily households. The most numerous type of family households are 2-person households, comprising 462, and the most common type of nonfamily households are 1-person households, comprising 323.
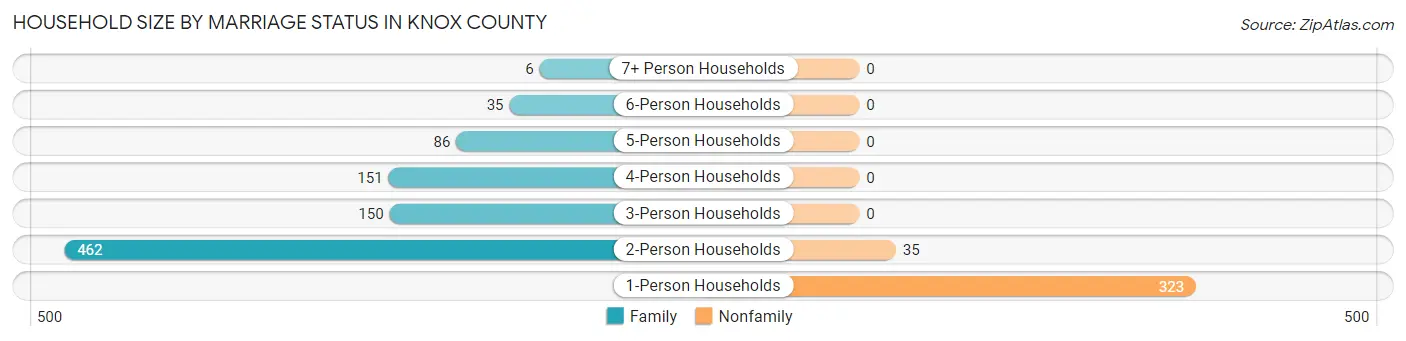
| Household Size | Family Households | Nonfamily Households |
| 1-Person Households | - | 323 (25.9%) |
| 2-Person Households | 462 (37.0%) | 35 (2.8%) |
| 3-Person Households | 150 (12.0%) | 0 (0.0%) |
| 4-Person Households | 151 (12.1%) | 0 (0.0%) |
| 5-Person Households | 86 (6.9%) | 0 (0.0%) |
| 6-Person Households | 35 (2.8%) | 0 (0.0%) |
| 7+ Person Households | 6 (0.5%) | 0 (0.0%) |
| Total | 890 (71.3%) | 358 (28.7%) |
Female Fertility in Knox County
Fertility by Age in Knox County
Average fertility rate in Knox County is 138.0 births per 1,000 women. Women in the age bracket of 20 to 34 years have the highest fertility rate with 234.0 births per 1,000 women. Women in the age bracket of 20 to 34 years acount for 51.9% of all women with births.
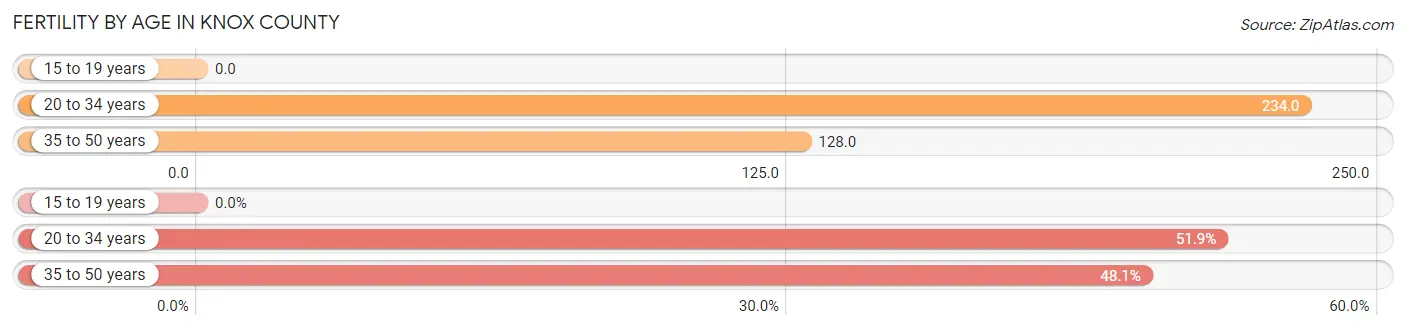
| Age Bracket | Women with Births | Births / 1,000 Women |
| 15 to 19 years | 0 (0.0%) | 0.0 |
| 20 to 34 years | 54 (51.9%) | 234.0 |
| 35 to 50 years | 50 (48.1%) | 128.0 |
| Total | 104 (100.0%) | 138.0 |
Fertility by Age by Marriage Status in Knox County
69.2% of women with births (104) in Knox County are married. The highest percentage of unmarried women with births falls into 35 to 50 years age bracket with 64.0% of them unmarried at the time of birth, while the lowest percentage of unmarried women with births belong to 20 to 34 years age bracket with 0.0% of them unmarried.
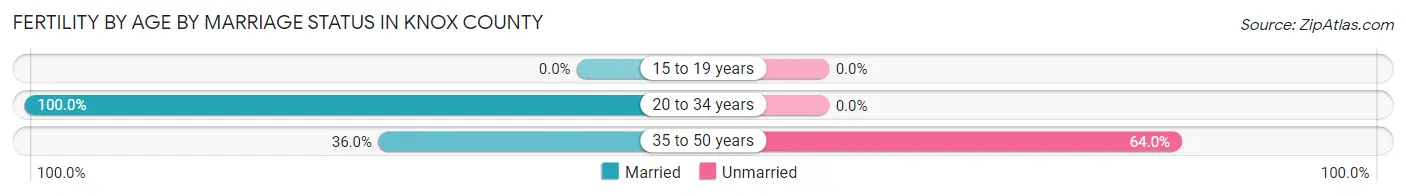
| Age Bracket | Married | Unmarried |
| 15 to 19 years | 0 (0.0%) | 0 (0.0%) |
| 20 to 34 years | 54 (100.0%) | 0 (0.0%) |
| 35 to 50 years | 18 (36.0%) | 32 (64.0%) |
| Total | 72 (69.2%) | 32 (30.8%) |
Fertility by Education in Knox County
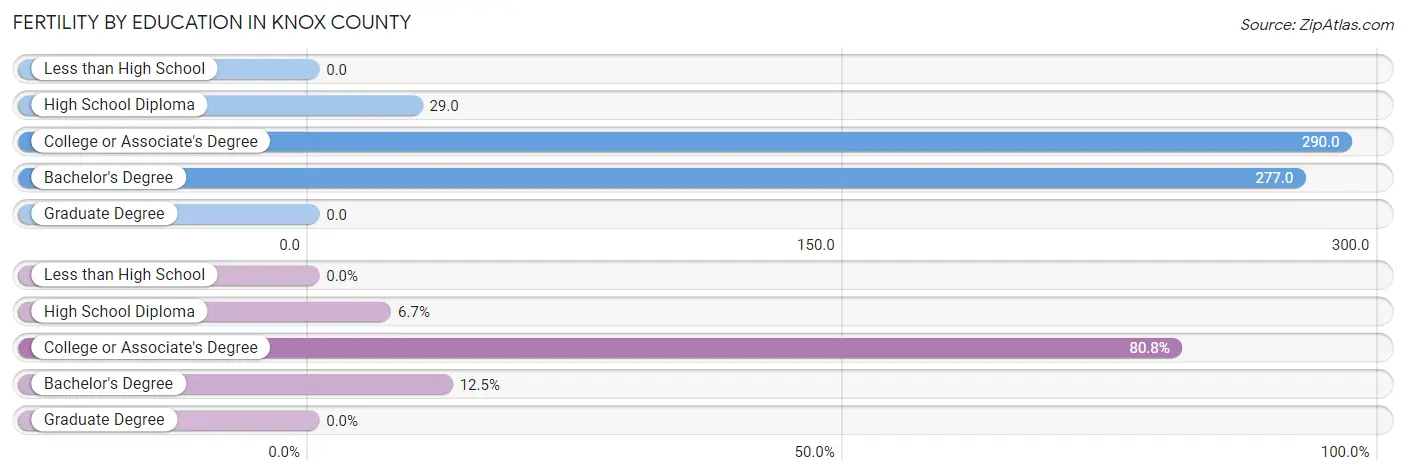
| Educational Attainment | Women with Births | Births / 1,000 Women |
| Less than High School | 0 (0.0%) | 0.0 |
| High School Diploma | 7 (6.7%) | 29.0 |
| College or Associate's Degree | 84 (80.8%) | 290.0 |
| Bachelor's Degree | 13 (12.5%) | 277.0 |
| Graduate Degree | 0 (0.0%) | 0.0 |
| Total | 104 (100.0%) | 138.0 |
Fertility by Education by Marriage Status in Knox County
30.8% of women with births in Knox County are unmarried. Women with the educational attainment of high school diploma are most likely to be married with 100.0% of them married at childbirth, while women with the educational attainment of college or associate's degree are least likely to be married with 38.1% of them unmarried at childbirth.
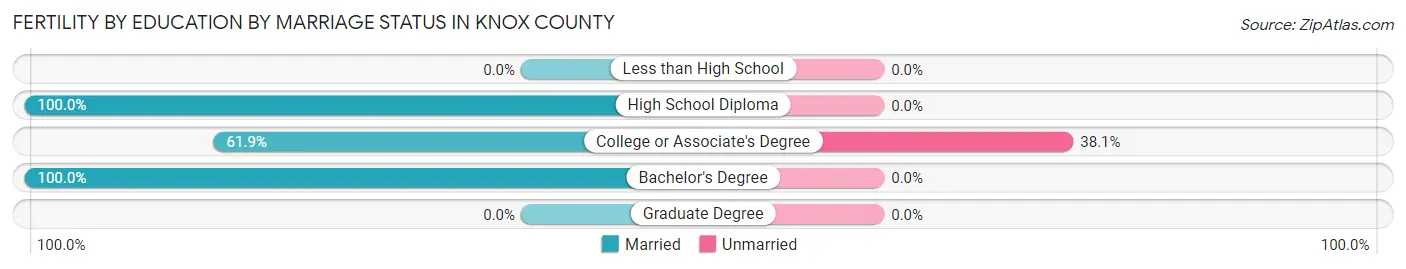
| Educational Attainment | Married | Unmarried |
| Less than High School | 0 (0.0%) | 0 (0.0%) |
| High School Diploma | 7 (100.0%) | 0 (0.0%) |
| College or Associate's Degree | 52 (61.9%) | 32 (38.1%) |
| Bachelor's Degree | 13 (100.0%) | 0 (0.0%) |
| Graduate Degree | 0 (0.0%) | 0 (0.0%) |
| Total | 72 (69.2%) | 32 (30.8%) |
Employment Characteristics in Knox County
Employment by Class of Employer in Knox County
Among the 1,394 employed individuals in Knox County, private company employees (746 | 53.5%), self-employed (not incorporated) (189 | 13.6%), and local government employees (160 | 11.5%) make up the most common classes of employment.
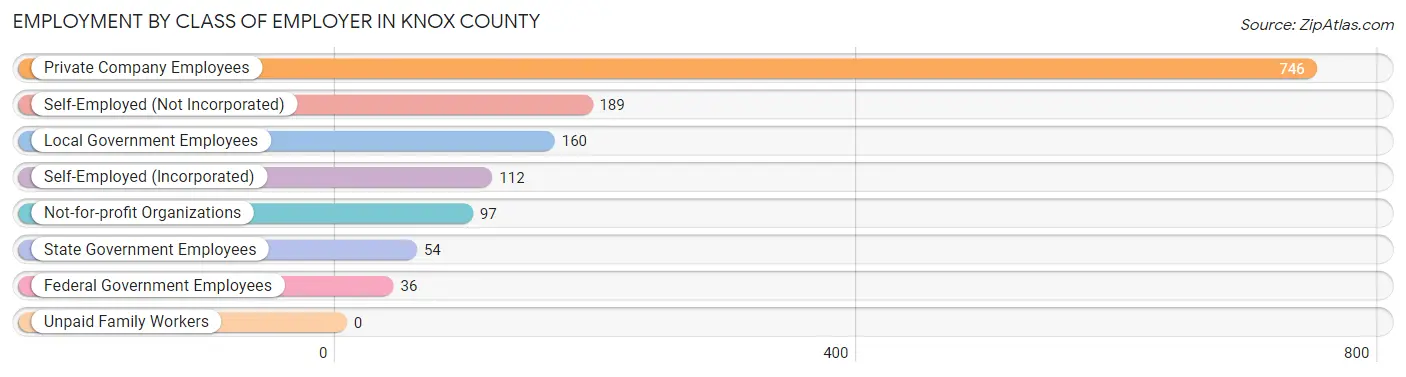
| Employer Class | # Employees | % Employees |
| Private Company Employees | 746 | 53.5% |
| Self-Employed (Incorporated) | 112 | 8.0% |
| Self-Employed (Not Incorporated) | 189 | 13.6% |
| Not-for-profit Organizations | 97 | 7.0% |
| Local Government Employees | 160 | 11.5% |
| State Government Employees | 54 | 3.9% |
| Federal Government Employees | 36 | 2.6% |
| Unpaid Family Workers | 0 | 0.0% |
| Total | 1,394 | 100.0% |
Employment Status by Age in Knox County
According to the labor force statistics for Knox County, out of the total population over 16 years of age (2,642), 55.5% or 1,466 individuals are in the labor force, with 1.6% or 23 of them unemployed. The age group with the highest labor force participation rate is 35 to 44 years, with 83.3% or 403 individuals in the labor force. Within the labor force, the 30 to 34 years age range has the highest percentage of unemployed individuals, with 4.1% or 6 of them being unemployed.
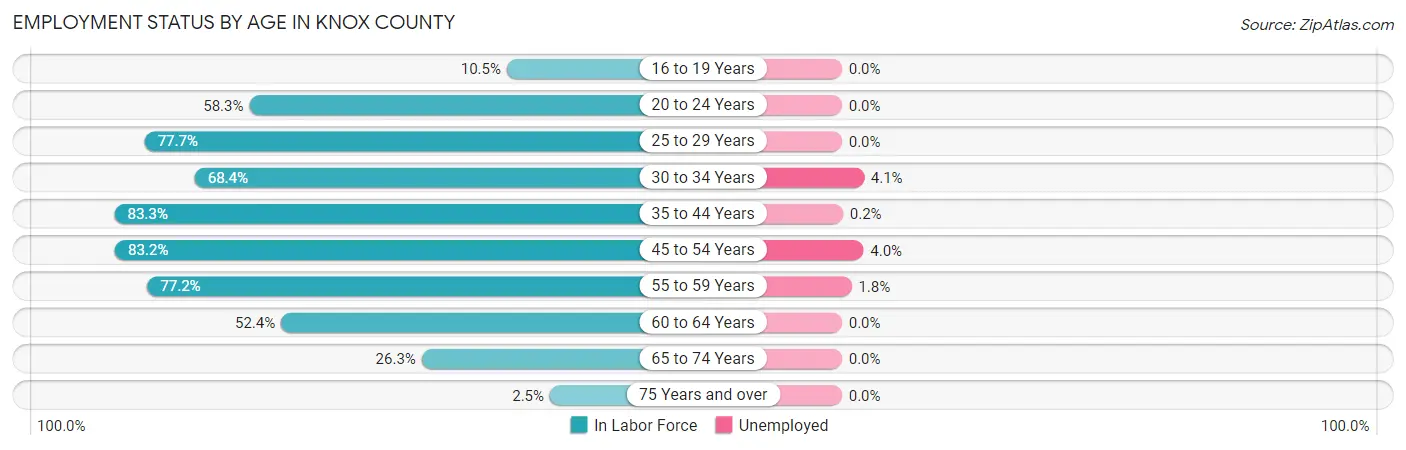
| Age Bracket | In Labor Force | Unemployed |
| 16 to 19 Years | 21 (10.5%) | 0 (0.0%) |
| 20 to 24 Years | 77 (58.3%) | 0 (0.0%) |
| 25 to 29 Years | 94 (77.7%) | 0 (0.0%) |
| 30 to 34 Years | 145 (68.4%) | 6 (4.1%) |
| 35 to 44 Years | 403 (83.3%) | 1 (0.2%) |
| 45 to 54 Years | 323 (83.2%) | 13 (4.0%) |
| 55 to 59 Years | 166 (77.2%) | 3 (1.8%) |
| 60 to 64 Years | 141 (52.4%) | 0 (0.0%) |
| 65 to 74 Years | 89 (26.3%) | 0 (0.0%) |
| 75 Years and over | 7 (2.5%) | 0 (0.0%) |
| Total | 1,466 (55.5%) | 23 (1.6%) |
Employment Status by Educational Attainment in Knox County
According to labor force statistics for Knox County, 75.3% of individuals (1,272) out of the total population between 25 and 64 years of age (1,689) are in the labor force, with 1.8% or 23 of them being unemployed. The group with the highest labor force participation rate are those with the educational attainment of college / associate degree, with 83.2% or 533 individuals in the labor force. Within the labor force, individuals with less than high school education have the highest percentage of unemployment, with 12.0% or 23 of them being unemployed.
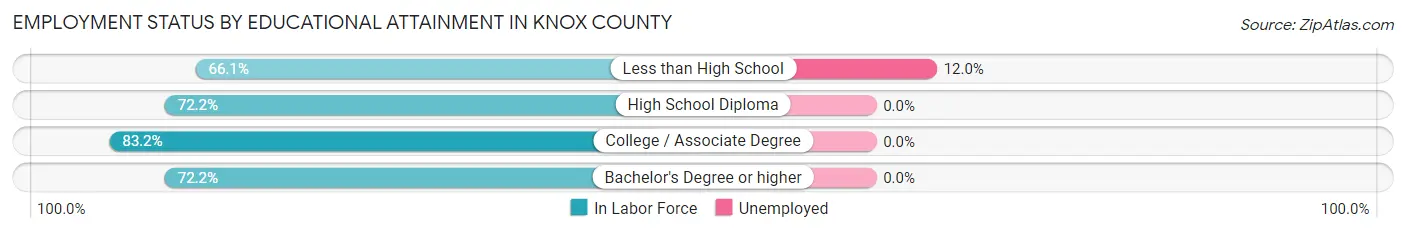
| Educational Attainment | In Labor Force | Unemployed |
| Less than High School | 191 (66.1%) | 35 (12.0%) |
| High School Diploma | 408 (72.2%) | 0 (0.0%) |
| College / Associate Degree | 533 (83.2%) | 0 (0.0%) |
| Bachelor's Degree or higher | 140 (72.2%) | 0 (0.0%) |
| Total | 1,272 (75.3%) | 30 (1.8%) |
Employment Occupations by Sex in Knox County
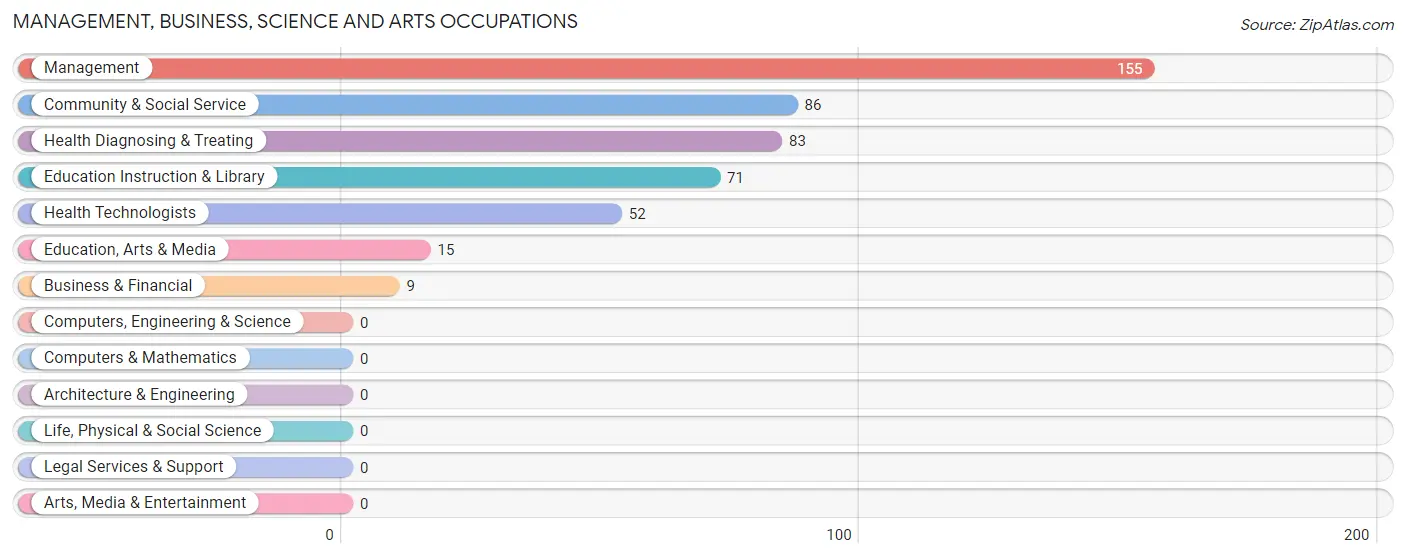
Management, Business, Science and Arts Occupations
The most common Management, Business, Science and Arts occupations in Knox County are Management (155 | 10.7%), Community & Social Service (86 | 6.0%), Health Diagnosing & Treating (83 | 5.8%), Education Instruction & Library (71 | 4.9%), and Health Technologists (52 | 3.6%).
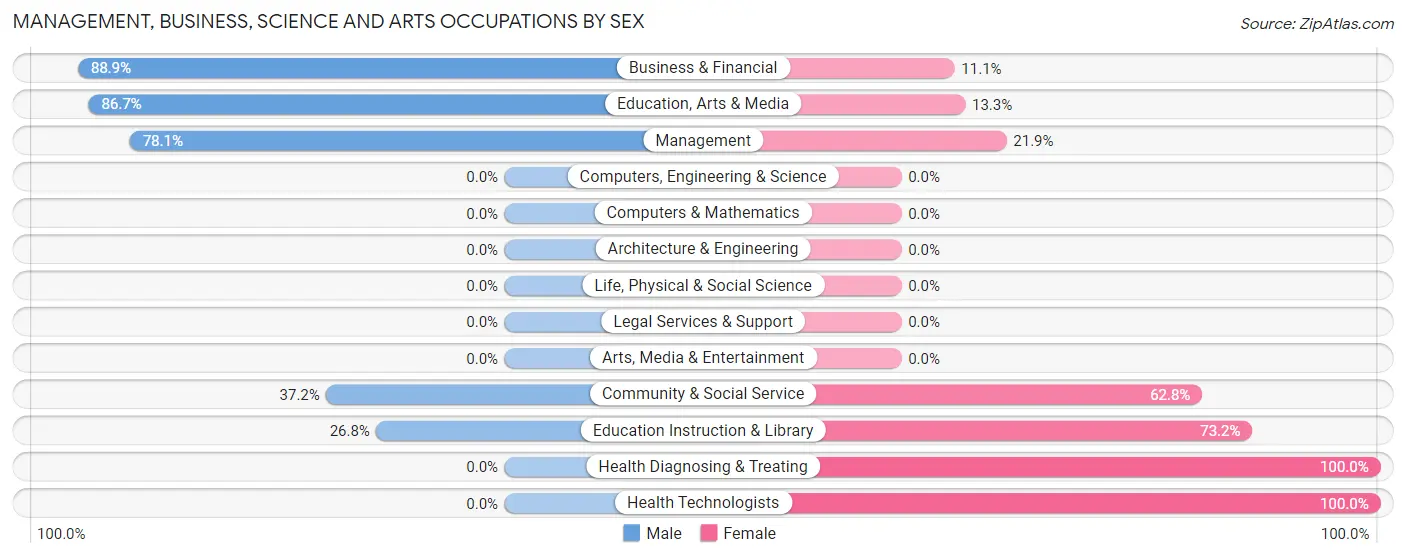
Management, Business, Science and Arts Occupations by Sex
Within the Management, Business, Science and Arts occupations in Knox County, the most male-oriented occupations are Business & Financial (88.9%), Education, Arts & Media (86.7%), and Management (78.1%), while the most female-oriented occupations are Health Diagnosing & Treating (100.0%), Health Technologists (100.0%), and Education Instruction & Library (73.2%).
| Occupation | Male | Female |
| Management | 121 (78.1%) | 34 (21.9%) |
| Business & Financial | 8 (88.9%) | 1 (11.1%) |
| Computers, Engineering & Science | 0 (0.0%) | 0 (0.0%) |
| Computers & Mathematics | 0 (0.0%) | 0 (0.0%) |
| Architecture & Engineering | 0 (0.0%) | 0 (0.0%) |
| Life, Physical & Social Science | 0 (0.0%) | 0 (0.0%) |
| Community & Social Service | 32 (37.2%) | 54 (62.8%) |
| Education, Arts & Media | 13 (86.7%) | 2 (13.3%) |
| Legal Services & Support | 0 (0.0%) | 0 (0.0%) |
| Education Instruction & Library | 19 (26.8%) | 52 (73.2%) |
| Arts, Media & Entertainment | 0 (0.0%) | 0 (0.0%) |
| Health Diagnosing & Treating | 0 (0.0%) | 83 (100.0%) |
| Health Technologists | 0 (0.0%) | 52 (100.0%) |
| Total (Category) | 161 (48.3%) | 172 (51.6%) |
| Total (Overall) | 822 (57.0%) | 621 (43.0%) |
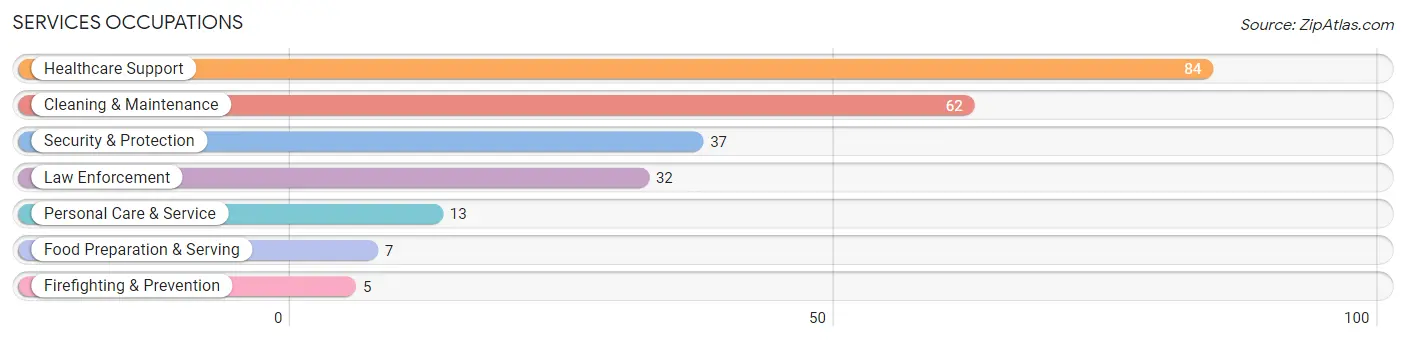
Services Occupations
The most common Services occupations in Knox County are Healthcare Support (84 | 5.8%), Cleaning & Maintenance (62 | 4.3%), Security & Protection (37 | 2.6%), Law Enforcement (32 | 2.2%), and Personal Care & Service (13 | 0.9%).
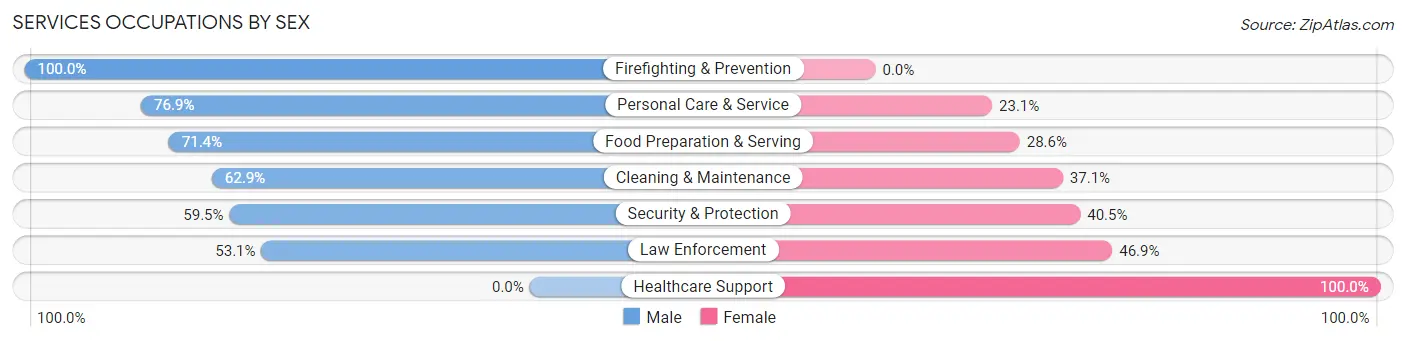
Services Occupations by Sex
Within the Services occupations in Knox County, the most male-oriented occupations are Firefighting & Prevention (100.0%), Personal Care & Service (76.9%), and Food Preparation & Serving (71.4%), while the most female-oriented occupations are Healthcare Support (100.0%), Law Enforcement (46.9%), and Security & Protection (40.5%).
| Occupation | Male | Female |
| Healthcare Support | 0 (0.0%) | 84 (100.0%) |
| Security & Protection | 22 (59.5%) | 15 (40.5%) |
| Firefighting & Prevention | 5 (100.0%) | 0 (0.0%) |
| Law Enforcement | 17 (53.1%) | 15 (46.9%) |
| Food Preparation & Serving | 5 (71.4%) | 2 (28.6%) |
| Cleaning & Maintenance | 39 (62.9%) | 23 (37.1%) |
| Personal Care & Service | 10 (76.9%) | 3 (23.1%) |
| Total (Category) | 76 (37.4%) | 127 (62.6%) |
| Total (Overall) | 822 (57.0%) | 621 (43.0%) |
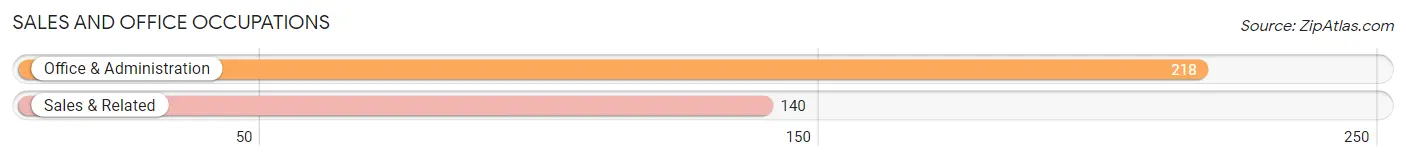
Sales and Office Occupations
The most common Sales and Office occupations in Knox County are Office & Administration (218 | 15.1%), and Sales & Related (140 | 9.7%).
Sales and Office Occupations by Sex
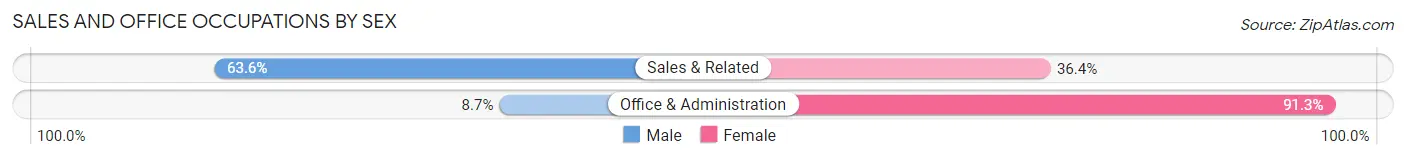
| Occupation | Male | Female |
| Sales & Related | 89 (63.6%) | 51 (36.4%) |
| Office & Administration | 19 (8.7%) | 199 (91.3%) |
| Total (Category) | 108 (30.2%) | 250 (69.8%) |
| Total (Overall) | 822 (57.0%) | 621 (43.0%) |
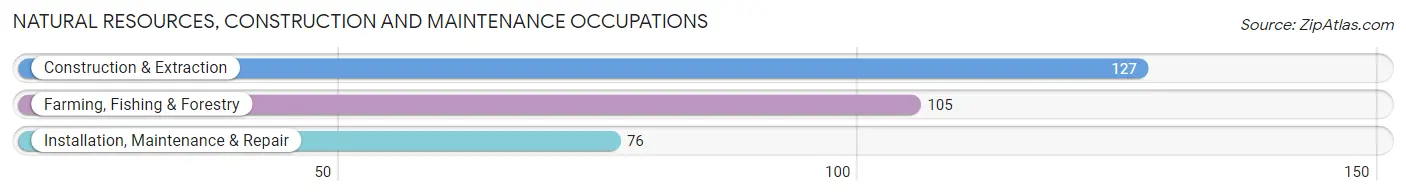
Natural Resources, Construction and Maintenance Occupations
The most common Natural Resources, Construction and Maintenance occupations in Knox County are Construction & Extraction (127 | 8.8%), Farming, Fishing & Forestry (105 | 7.3%), and Installation, Maintenance & Repair (76 | 5.3%).
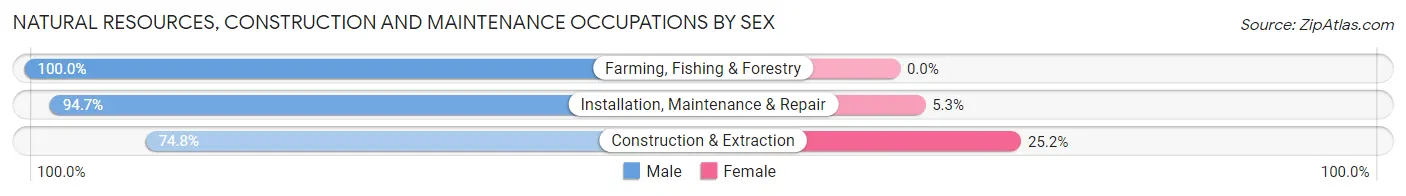
Natural Resources, Construction and Maintenance Occupations by Sex
| Occupation | Male | Female |
| Farming, Fishing & Forestry | 105 (100.0%) | 0 (0.0%) |
| Construction & Extraction | 95 (74.8%) | 32 (25.2%) |
| Installation, Maintenance & Repair | 72 (94.7%) | 4 (5.3%) |
| Total (Category) | 272 (88.3%) | 36 (11.7%) |
| Total (Overall) | 822 (57.0%) | 621 (43.0%) |
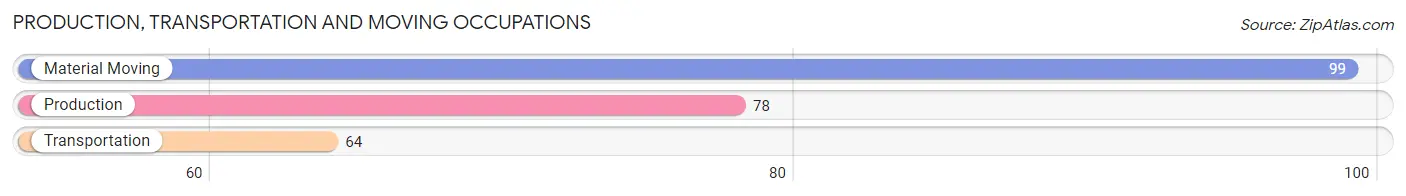
Production, Transportation and Moving Occupations
The most common Production, Transportation and Moving occupations in Knox County are Material Moving (99 | 6.9%), Production (78 | 5.4%), and Transportation (64 | 4.4%).
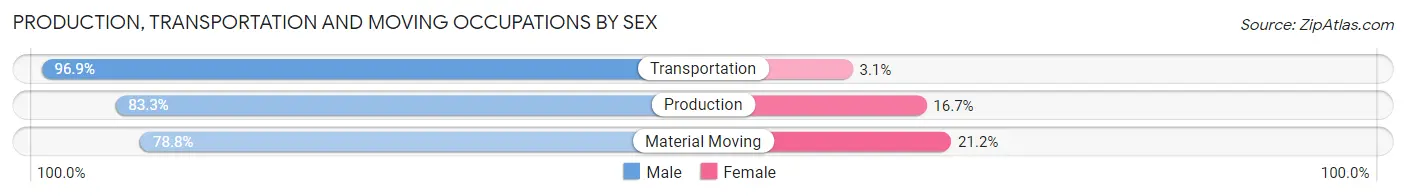
Production, Transportation and Moving Occupations by Sex
| Occupation | Male | Female |
| Production | 65 (83.3%) | 13 (16.7%) |
| Transportation | 62 (96.9%) | 2 (3.1%) |
| Material Moving | 78 (78.8%) | 21 (21.2%) |
| Total (Category) | 205 (85.1%) | 36 (14.9%) |
| Total (Overall) | 822 (57.0%) | 621 (43.0%) |
Employment Industries by Sex in Knox County
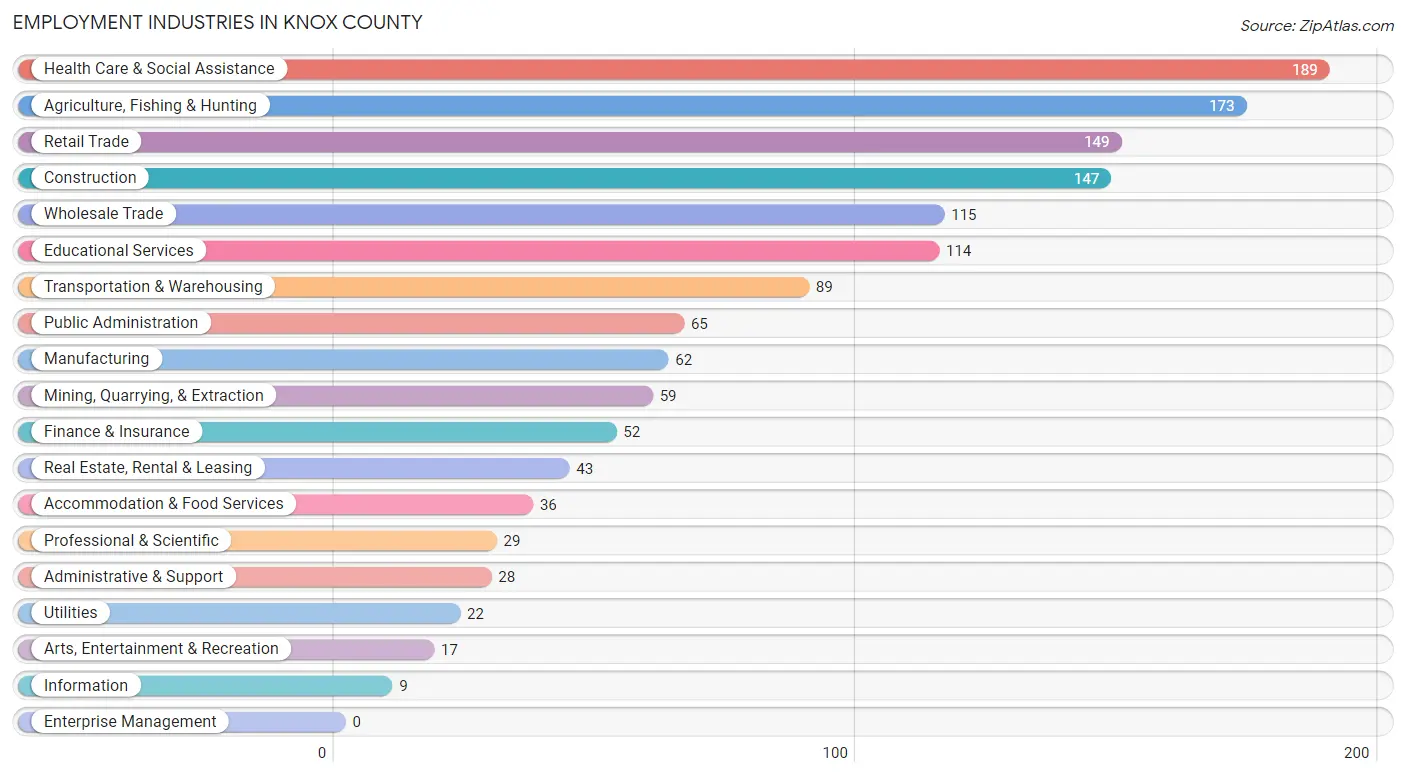
Employment Industries in Knox County
The major employment industries in Knox County include Health Care & Social Assistance (189 | 13.1%), Agriculture, Fishing & Hunting (173 | 12.0%), Retail Trade (149 | 10.3%), Construction (147 | 10.2%), and Wholesale Trade (115 | 8.0%).
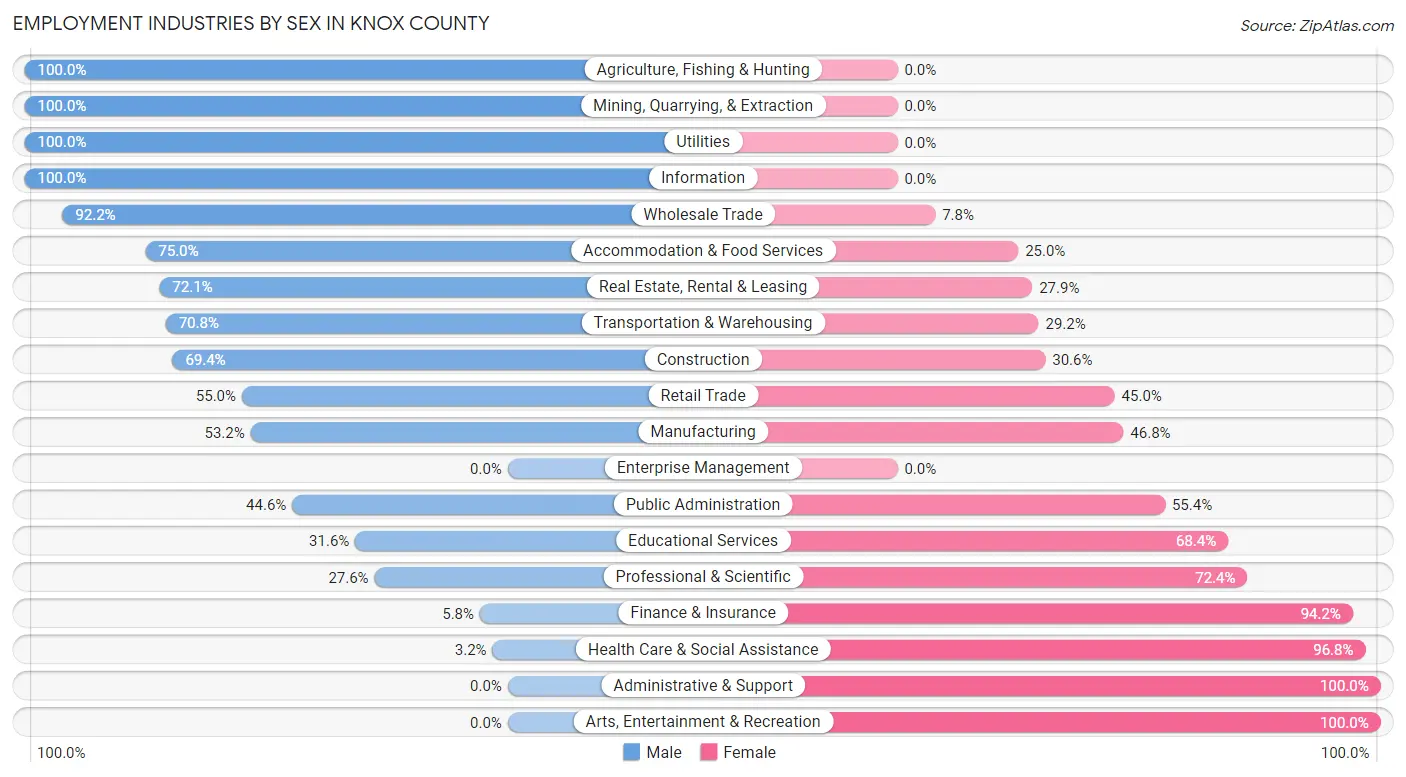
Employment Industries by Sex in Knox County
The Knox County industries that see more men than women are Agriculture, Fishing & Hunting (100.0%), Mining, Quarrying, & Extraction (100.0%), and Utilities (100.0%), whereas the industries that tend to have a higher number of women are Administrative & Support (100.0%), Arts, Entertainment & Recreation (100.0%), and Health Care & Social Assistance (96.8%).
| Industry | Male | Female |
| Agriculture, Fishing & Hunting | 173 (100.0%) | 0 (0.0%) |
| Mining, Quarrying, & Extraction | 59 (100.0%) | 0 (0.0%) |
| Construction | 102 (69.4%) | 45 (30.6%) |
| Manufacturing | 33 (53.2%) | 29 (46.8%) |
| Wholesale Trade | 106 (92.2%) | 9 (7.8%) |
| Retail Trade | 82 (55.0%) | 67 (45.0%) |
| Transportation & Warehousing | 63 (70.8%) | 26 (29.2%) |
| Utilities | 22 (100.0%) | 0 (0.0%) |
| Information | 9 (100.0%) | 0 (0.0%) |
| Finance & Insurance | 3 (5.8%) | 49 (94.2%) |
| Real Estate, Rental & Leasing | 31 (72.1%) | 12 (27.9%) |
| Professional & Scientific | 8 (27.6%) | 21 (72.4%) |
| Enterprise Management | 0 (0.0%) | 0 (0.0%) |
| Administrative & Support | 0 (0.0%) | 28 (100.0%) |
| Educational Services | 36 (31.6%) | 78 (68.4%) |
| Health Care & Social Assistance | 6 (3.2%) | 183 (96.8%) |
| Arts, Entertainment & Recreation | 0 (0.0%) | 17 (100.0%) |
| Accommodation & Food Services | 27 (75.0%) | 9 (25.0%) |
| Public Administration | 29 (44.6%) | 36 (55.4%) |
| Total | 822 (57.0%) | 621 (43.0%) |
Education in Knox County
School Enrollment in Knox County
The most common levels of schooling among the 835 students in Knox County are high school (218 | 26.1%), elementary school (206 | 24.7%), and middle school (166 | 19.9%).
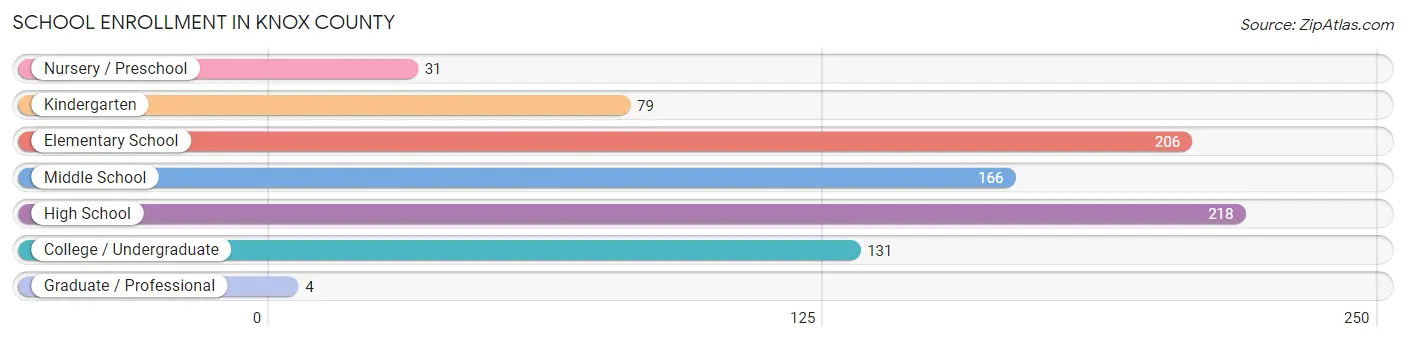
| School Level | # Students | % Students |
| Nursery / Preschool | 31 | 3.7% |
| Kindergarten | 79 | 9.5% |
| Elementary School | 206 | 24.7% |
| Middle School | 166 | 19.9% |
| High School | 218 | 26.1% |
| College / Undergraduate | 131 | 15.7% |
| Graduate / Professional | 4 | 0.5% |
| Total | 835 | 100.0% |
School Enrollment by Age by Funding Source in Knox County
Out of a total of 835 students who are enrolled in schools in Knox County, 47 (5.6%) attend a private institution, while the remaining 788 (94.4%) are enrolled in public schools. The age group of 15 to 17 year olds has the highest likelihood of being enrolled in private schools, with 30 (20.0% in the age bracket) enrolled. Conversely, the age group of 10 to 14 year olds has the lowest likelihood of being enrolled in a private school, with 203 (100.0% in the age bracket) attending a public institution.
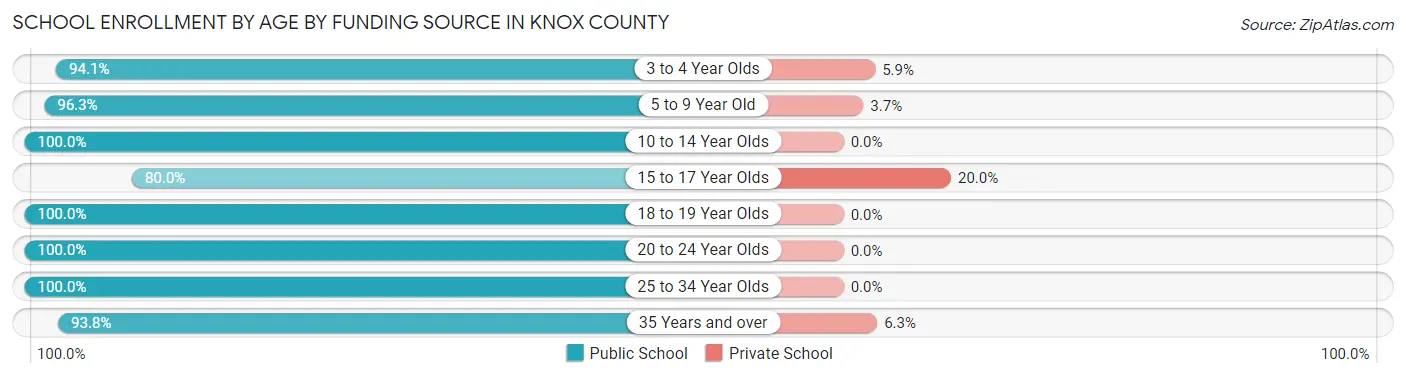
| Age Bracket | Public School | Private School |
| 3 to 4 Year Olds | 16 (94.1%) | 1 (5.9%) |
| 5 to 9 Year Old | 288 (96.3%) | 11 (3.7%) |
| 10 to 14 Year Olds | 203 (100.0%) | 0 (0.0%) |
| 15 to 17 Year Olds | 120 (80.0%) | 30 (20.0%) |
| 18 to 19 Year Olds | 51 (100.0%) | 0 (0.0%) |
| 20 to 24 Year Olds | 29 (100.0%) | 0 (0.0%) |
| 25 to 34 Year Olds | 6 (100.0%) | 0 (0.0%) |
| 35 Years and over | 75 (93.8%) | 5 (6.2%) |
| Total | 788 (94.4%) | 47 (5.6%) |
Educational Attainment by Field of Study in Knox County
Education (130 | 38.5%), business (72 | 21.3%), arts & humanities (28 | 8.3%), bio, nature & agricultural (27 | 8.0%), and science & technology (21 | 6.2%) are the most common fields of study among 338 individuals in Knox County who have obtained a bachelor's degree or higher.
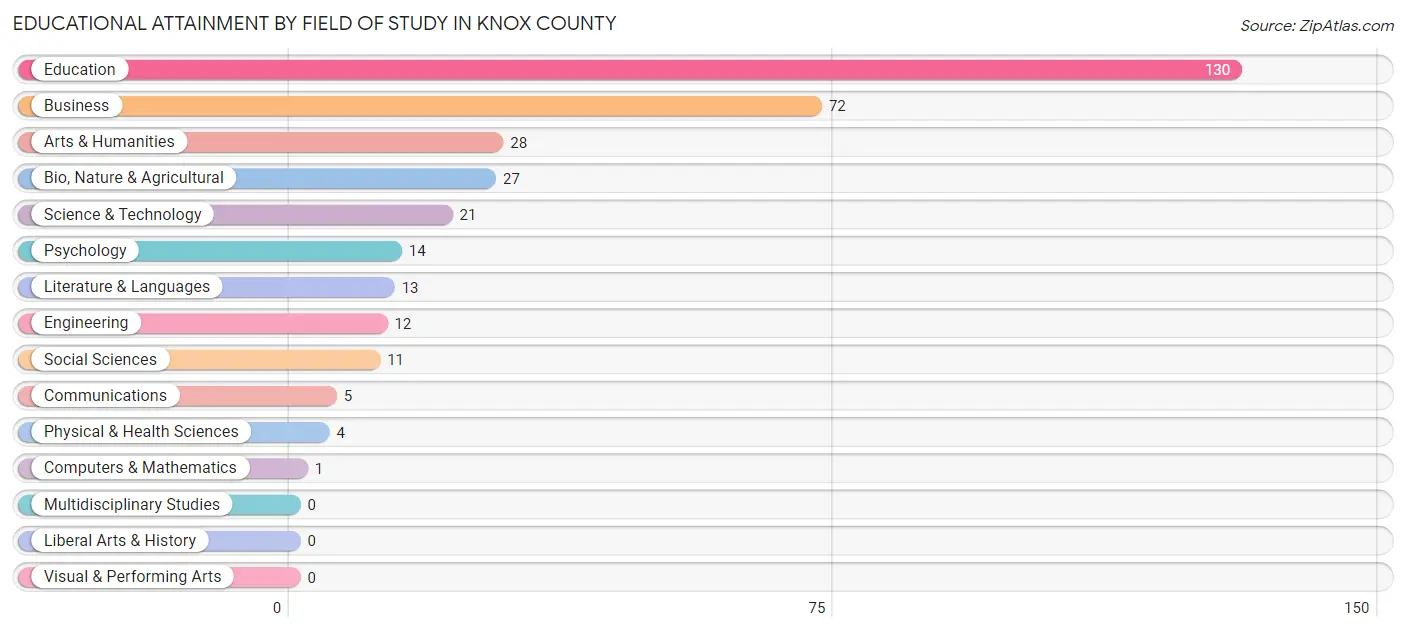
| Field of Study | # Graduates | % Graduates |
| Computers & Mathematics | 1 | 0.3% |
| Bio, Nature & Agricultural | 27 | 8.0% |
| Physical & Health Sciences | 4 | 1.2% |
| Psychology | 14 | 4.1% |
| Social Sciences | 11 | 3.3% |
| Engineering | 12 | 3.5% |
| Multidisciplinary Studies | 0 | 0.0% |
| Science & Technology | 21 | 6.2% |
| Business | 72 | 21.3% |
| Education | 130 | 38.5% |
| Literature & Languages | 13 | 3.8% |
| Liberal Arts & History | 0 | 0.0% |
| Visual & Performing Arts | 0 | 0.0% |
| Communications | 5 | 1.5% |
| Arts & Humanities | 28 | 8.3% |
| Total | 338 | 100.0% |
Transportation & Commute in Knox County
Vehicle Availability by Sex in Knox County
The most prevalent vehicle ownership categories in Knox County are males with 2 vehicles (310, accounting for 38.8%) and females with 2 vehicles (229, making up 52.2%).
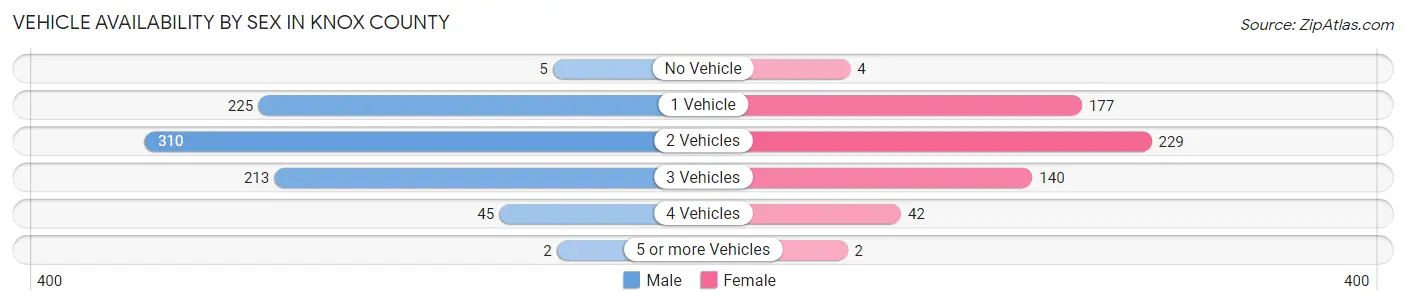
| Vehicles Available | Male | Female |
| No Vehicle | 5 (0.6%) | 4 (0.7%) |
| 1 Vehicle | 225 (28.1%) | 177 (29.8%) |
| 2 Vehicles | 310 (38.8%) | 229 (38.6%) |
| 3 Vehicles | 213 (26.6%) | 140 (23.6%) |
| 4 Vehicles | 45 (5.6%) | 42 (7.1%) |
| 5 or more Vehicles | 2 (0.3%) | 2 (0.3%) |
| Total | 800 (100.0%) | 594 (100.0%) |
Commute Time in Knox County
The most frequently occuring commute durations in Knox County are 5 to 9 minutes (334 commuters, 24.9%), less than 5 minutes (321 commuters, 23.9%), and 10 to 14 minutes (187 commuters, 13.9%).
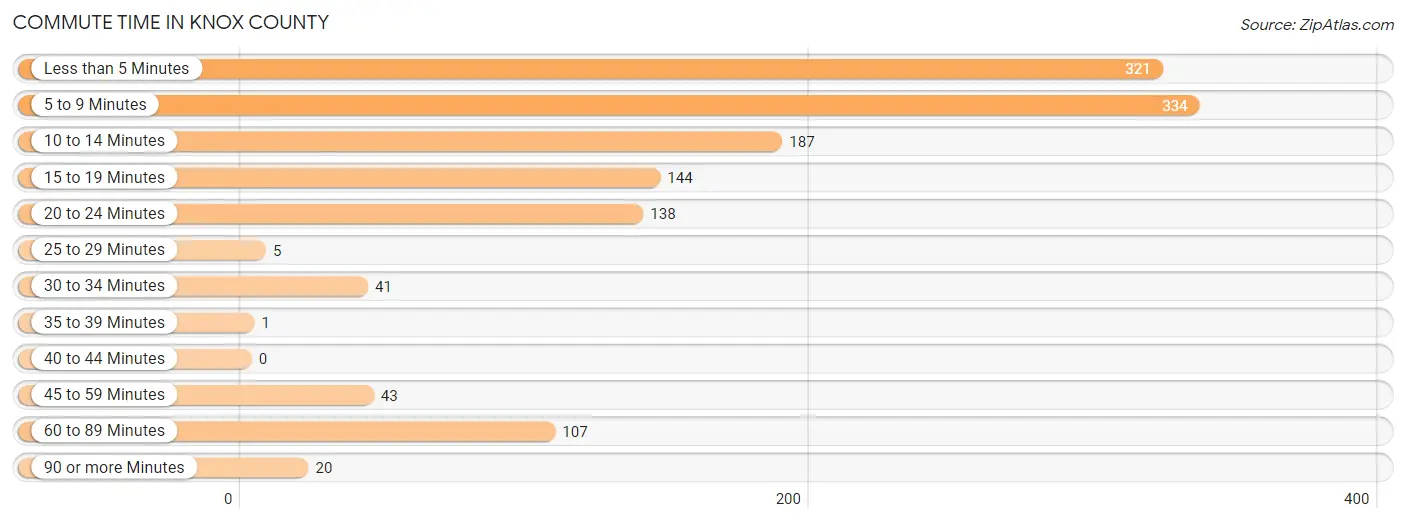
| Commute Time | # Commuters | % Commuters |
| Less than 5 Minutes | 321 | 23.9% |
| 5 to 9 Minutes | 334 | 24.9% |
| 10 to 14 Minutes | 187 | 13.9% |
| 15 to 19 Minutes | 144 | 10.7% |
| 20 to 24 Minutes | 138 | 10.3% |
| 25 to 29 Minutes | 5 | 0.4% |
| 30 to 34 Minutes | 41 | 3.1% |
| 35 to 39 Minutes | 1 | 0.1% |
| 40 to 44 Minutes | 0 | 0.0% |
| 45 to 59 Minutes | 43 | 3.2% |
| 60 to 89 Minutes | 107 | 8.0% |
| 90 or more Minutes | 20 | 1.5% |
Commute Time by Sex in Knox County
The most common commute times in Knox County are 5 to 9 minutes (210 commuters, 27.2%) for males and less than 5 minutes (140 commuters, 24.6%) for females.
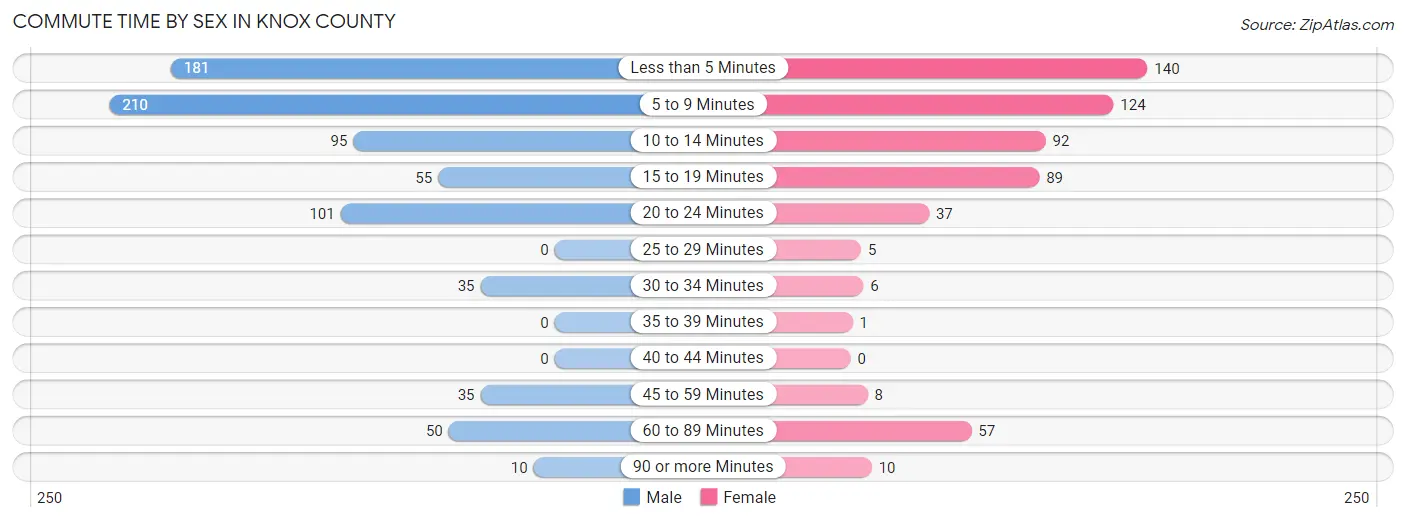
| Commute Time | Male | Female |
| Less than 5 Minutes | 181 (23.4%) | 140 (24.6%) |
| 5 to 9 Minutes | 210 (27.2%) | 124 (21.8%) |
| 10 to 14 Minutes | 95 (12.3%) | 92 (16.2%) |
| 15 to 19 Minutes | 55 (7.1%) | 89 (15.6%) |
| 20 to 24 Minutes | 101 (13.1%) | 37 (6.5%) |
| 25 to 29 Minutes | 0 (0.0%) | 5 (0.9%) |
| 30 to 34 Minutes | 35 (4.5%) | 6 (1.1%) |
| 35 to 39 Minutes | 0 (0.0%) | 1 (0.2%) |
| 40 to 44 Minutes | 0 (0.0%) | 0 (0.0%) |
| 45 to 59 Minutes | 35 (4.5%) | 8 (1.4%) |
| 60 to 89 Minutes | 50 (6.5%) | 57 (10.0%) |
| 90 or more Minutes | 10 (1.3%) | 10 (1.8%) |
Time of Departure to Work by Sex in Knox County
The most frequent times of departure to work in Knox County are 7:00 AM to 7:29 AM (191, 24.7%) for males and 7:30 AM to 7:59 AM (161, 28.3%) for females.
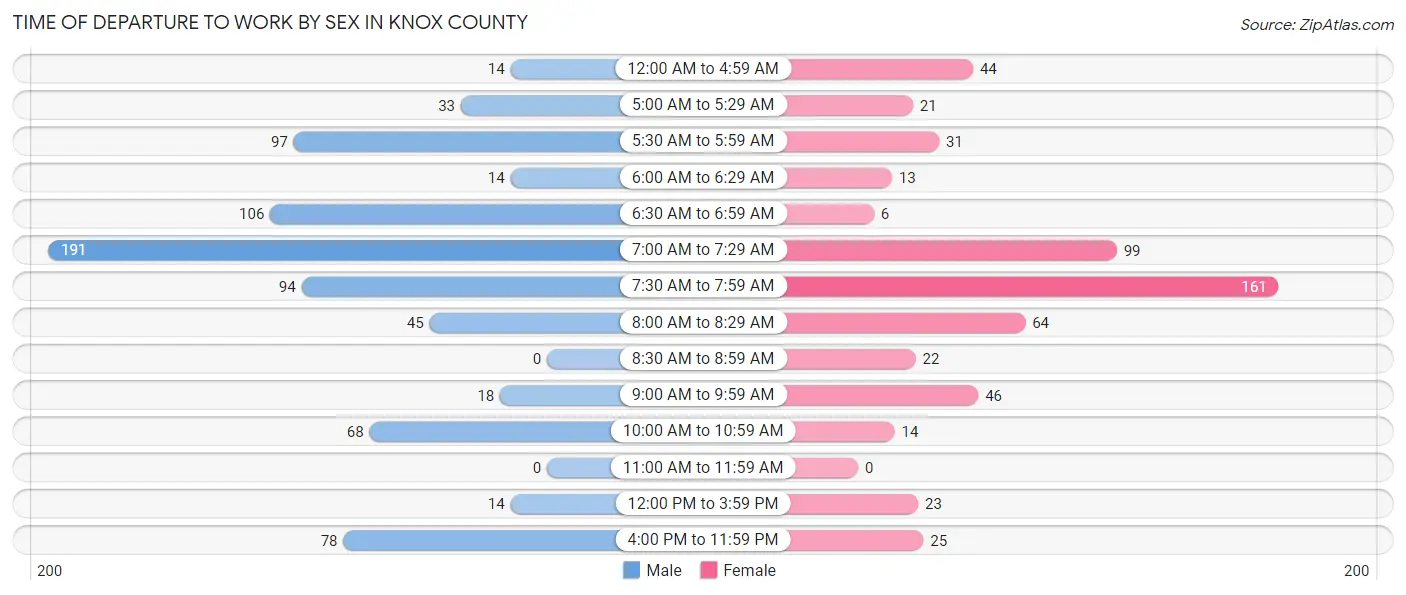
| Time of Departure | Male | Female |
| 12:00 AM to 4:59 AM | 14 (1.8%) | 44 (7.7%) |
| 5:00 AM to 5:29 AM | 33 (4.3%) | 21 (3.7%) |
| 5:30 AM to 5:59 AM | 97 (12.6%) | 31 (5.4%) |
| 6:00 AM to 6:29 AM | 14 (1.8%) | 13 (2.3%) |
| 6:30 AM to 6:59 AM | 106 (13.7%) | 6 (1.1%) |
| 7:00 AM to 7:29 AM | 191 (24.7%) | 99 (17.4%) |
| 7:30 AM to 7:59 AM | 94 (12.2%) | 161 (28.3%) |
| 8:00 AM to 8:29 AM | 45 (5.8%) | 64 (11.3%) |
| 8:30 AM to 8:59 AM | 0 (0.0%) | 22 (3.9%) |
| 9:00 AM to 9:59 AM | 18 (2.3%) | 46 (8.1%) |
| 10:00 AM to 10:59 AM | 68 (8.8%) | 14 (2.5%) |
| 11:00 AM to 11:59 AM | 0 (0.0%) | 0 (0.0%) |
| 12:00 PM to 3:59 PM | 14 (1.8%) | 23 (4.0%) |
| 4:00 PM to 11:59 PM | 78 (10.1%) | 25 (4.4%) |
| Total | 772 (100.0%) | 569 (100.0%) |
Housing Occupancy in Knox County
Occupancy by Ownership in Knox County
Of the total 1,248 dwellings in Knox County, owner-occupied units account for 974 (78.0%), while renter-occupied units make up 274 (22.0%).
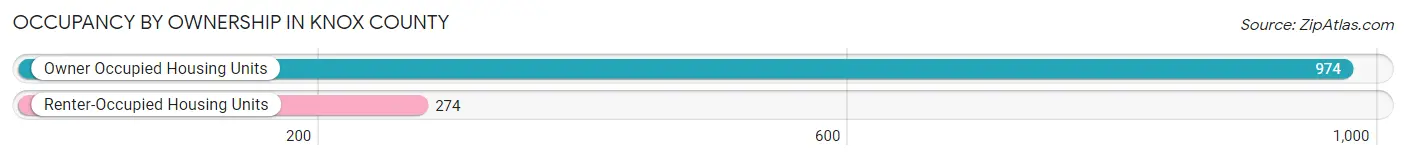
| Occupancy | # Housing Units | % Housing Units |
| Owner Occupied Housing Units | 974 | 78.0% |
| Renter-Occupied Housing Units | 274 | 22.0% |
| Total Occupied Housing Units | 1,248 | 100.0% |
Occupancy by Household Size in Knox County
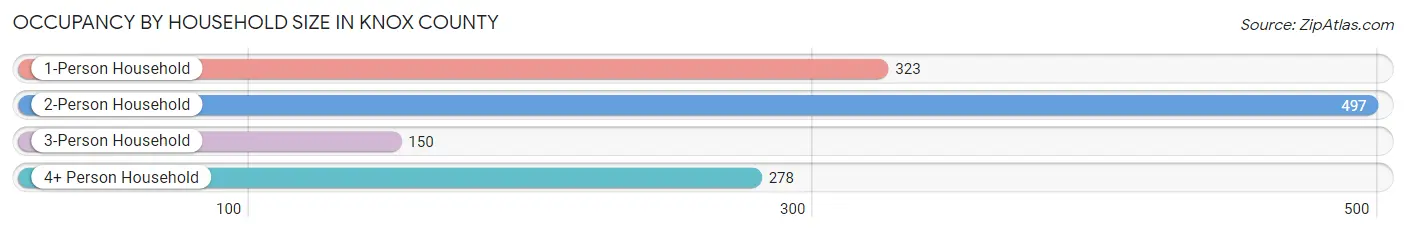
| Household Size | # Housing Units | % Housing Units |
| 1-Person Household | 323 | 25.9% |
| 2-Person Household | 497 | 39.8% |
| 3-Person Household | 150 | 12.0% |
| 4+ Person Household | 278 | 22.3% |
| Total Housing Units | 1,248 | 100.0% |
Occupancy by Ownership by Household Size in Knox County
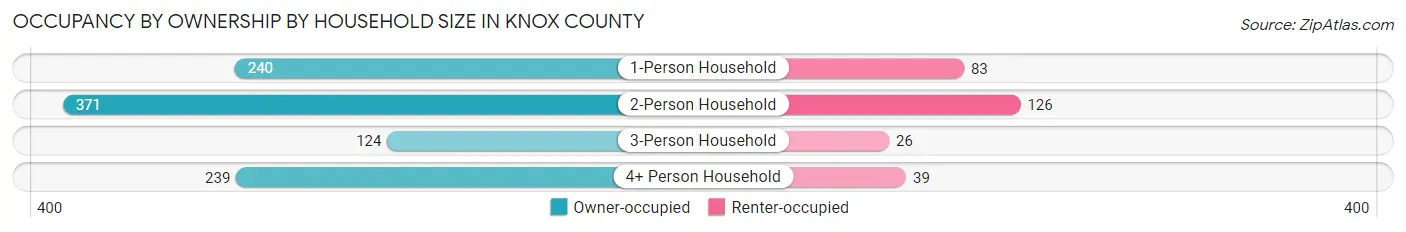
| Household Size | Owner-occupied | Renter-occupied |
| 1-Person Household | 240 (74.3%) | 83 (25.7%) |
| 2-Person Household | 371 (74.7%) | 126 (25.4%) |
| 3-Person Household | 124 (82.7%) | 26 (17.3%) |
| 4+ Person Household | 239 (86.0%) | 39 (14.0%) |
| Total Housing Units | 974 (78.0%) | 274 (22.0%) |
Occupancy by Educational Attainment in Knox County
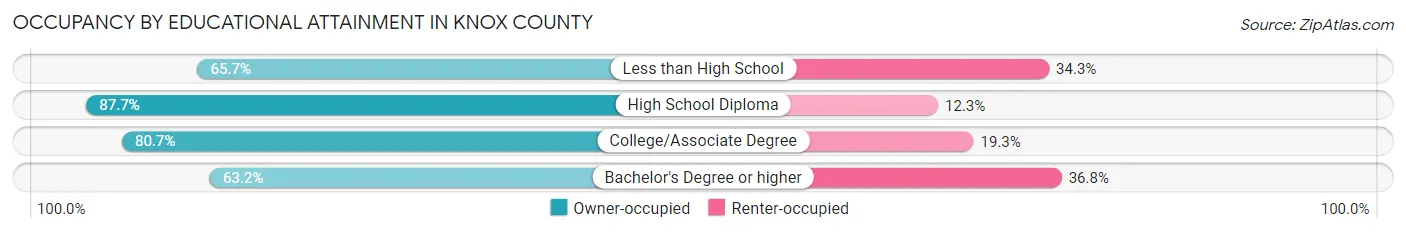
| Household Size | Owner-occupied | Renter-occupied |
| Less than High School | 113 (65.7%) | 59 (34.3%) |
| High School Diploma | 372 (87.7%) | 52 (12.3%) |
| College/Associate Degree | 355 (80.7%) | 85 (19.3%) |
| Bachelor's Degree or higher | 134 (63.2%) | 78 (36.8%) |
Occupancy by Age of Householder in Knox County
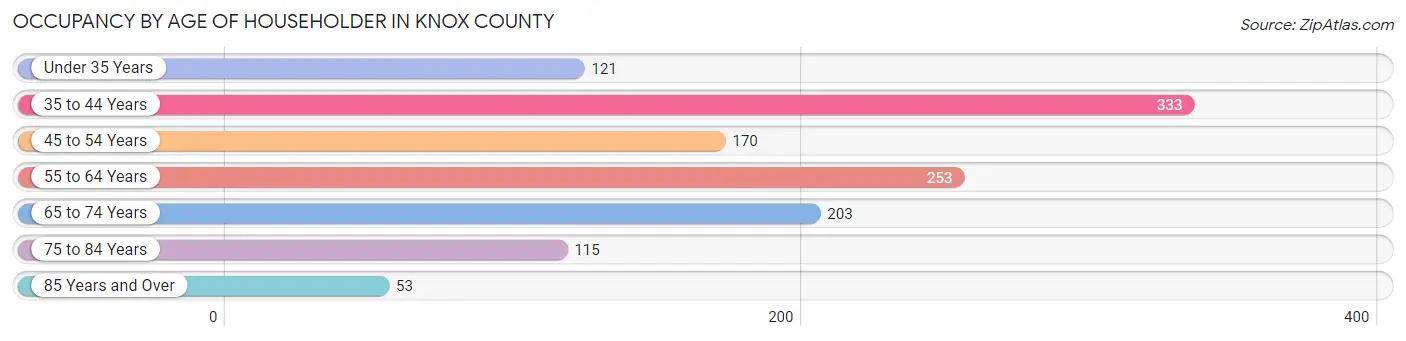
| Age Bracket | # Households | % Households |
| Under 35 Years | 121 | 9.7% |
| 35 to 44 Years | 333 | 26.7% |
| 45 to 54 Years | 170 | 13.6% |
| 55 to 64 Years | 253 | 20.3% |
| 65 to 74 Years | 203 | 16.3% |
| 75 to 84 Years | 115 | 9.2% |
| 85 Years and Over | 53 | 4.3% |
| Total | 1,248 | 100.0% |
Housing Finances in Knox County
Median Income by Occupancy in Knox County
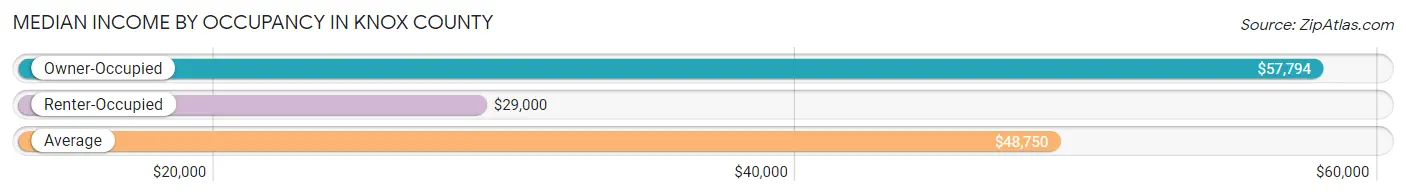
| Occupancy Type | # Households | Median Income |
| Owner-Occupied | 974 (78.0%) | $57,794 |
| Renter-Occupied | 274 (22.0%) | $29,000 |
| Average | 1,248 (100.0%) | $48,750 |
Occupancy by Householder Income Bracket in Knox County
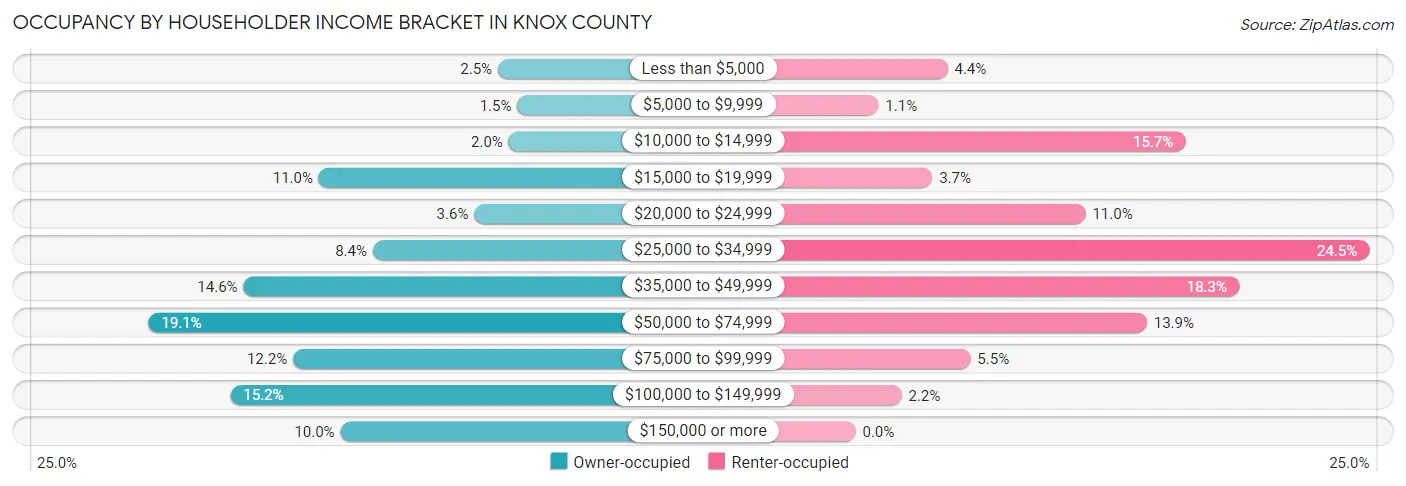
| Income Bracket | Owner-occupied | Renter-occupied |
| Less than $5,000 | 24 (2.5%) | 12 (4.4%) |
| $5,000 to $9,999 | 15 (1.5%) | 3 (1.1%) |
| $10,000 to $14,999 | 19 (1.9%) | 43 (15.7%) |
| $15,000 to $19,999 | 107 (11.0%) | 10 (3.6%) |
| $20,000 to $24,999 | 35 (3.6%) | 30 (11.0%) |
| $25,000 to $34,999 | 82 (8.4%) | 67 (24.4%) |
| $35,000 to $49,999 | 142 (14.6%) | 50 (18.2%) |
| $50,000 to $74,999 | 186 (19.1%) | 38 (13.9%) |
| $75,000 to $99,999 | 119 (12.2%) | 15 (5.5%) |
| $100,000 to $149,999 | 148 (15.2%) | 6 (2.2%) |
| $150,000 or more | 97 (10.0%) | 0 (0.0%) |
| Total | 974 (100.0%) | 274 (100.0%) |
Monthly Housing Cost Tiers in Knox County
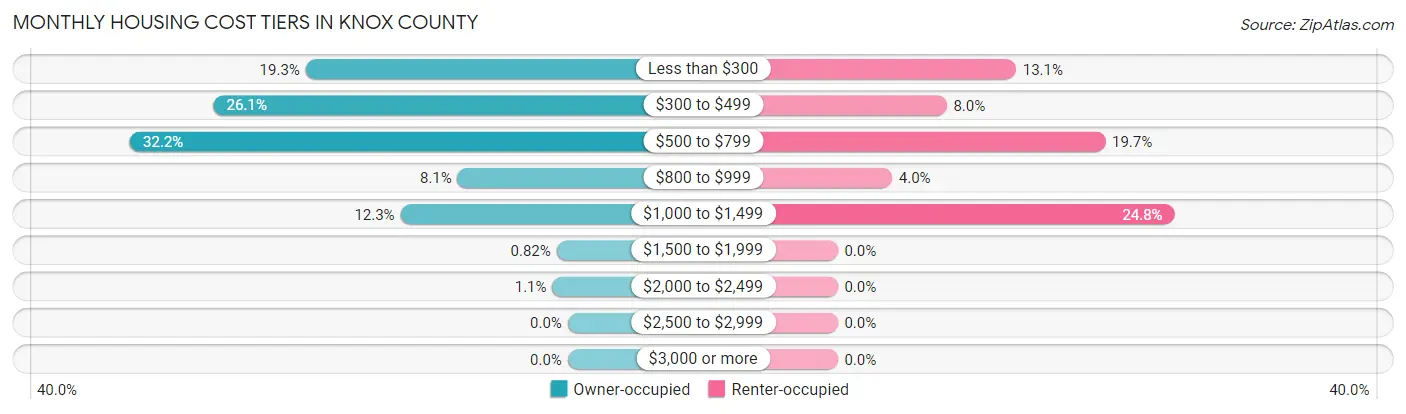
| Monthly Cost | Owner-occupied | Renter-occupied |
| Less than $300 | 188 (19.3%) | 36 (13.1%) |
| $300 to $499 | 254 (26.1%) | 22 (8.0%) |
| $500 to $799 | 314 (32.2%) | 54 (19.7%) |
| $800 to $999 | 79 (8.1%) | 11 (4.0%) |
| $1,000 to $1,499 | 120 (12.3%) | 68 (24.8%) |
| $1,500 to $1,999 | 8 (0.8%) | 0 (0.0%) |
| $2,000 to $2,499 | 11 (1.1%) | 0 (0.0%) |
| $2,500 to $2,999 | 0 (0.0%) | 0 (0.0%) |
| $3,000 or more | 0 (0.0%) | 0 (0.0%) |
| Total | 974 (100.0%) | 274 (100.0%) |
Physical Housing Characteristics in Knox County
Housing Structures in Knox County
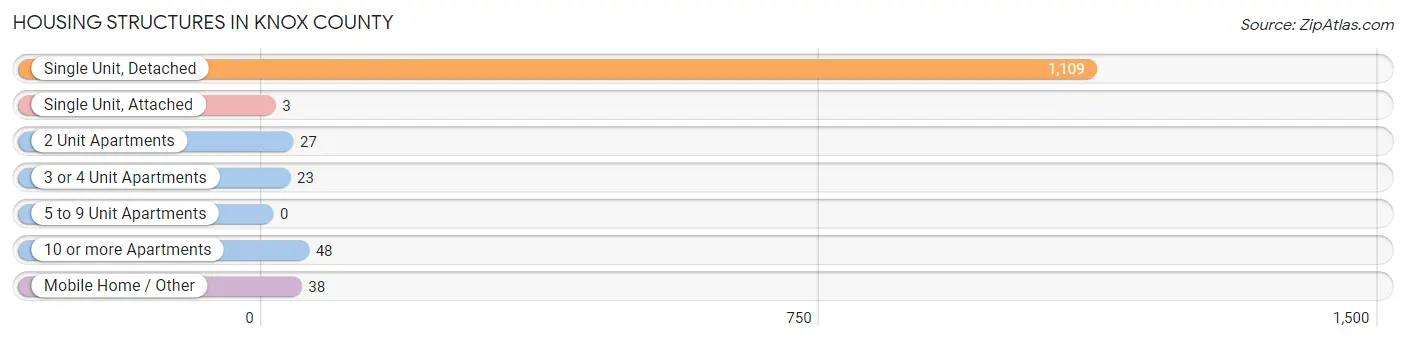
| Structure Type | # Housing Units | % Housing Units |
| Single Unit, Detached | 1,109 | 88.9% |
| Single Unit, Attached | 3 | 0.2% |
| 2 Unit Apartments | 27 | 2.2% |
| 3 or 4 Unit Apartments | 23 | 1.8% |
| 5 to 9 Unit Apartments | 0 | 0.0% |
| 10 or more Apartments | 48 | 3.8% |
| Mobile Home / Other | 38 | 3.0% |
| Total | 1,248 | 100.0% |
Housing Structures by Occupancy in Knox County
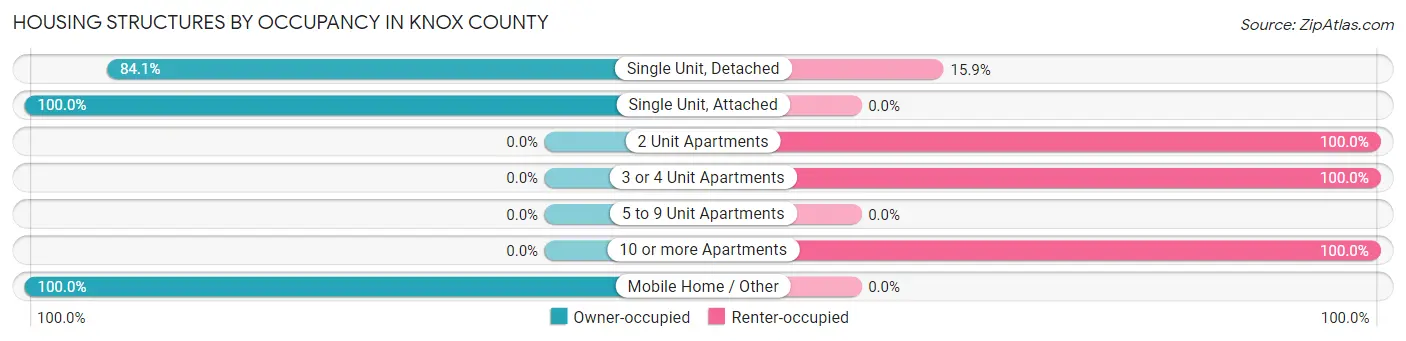
| Structure Type | Owner-occupied | Renter-occupied |
| Single Unit, Detached | 933 (84.1%) | 176 (15.9%) |
| Single Unit, Attached | 3 (100.0%) | 0 (0.0%) |
| 2 Unit Apartments | 0 (0.0%) | 27 (100.0%) |
| 3 or 4 Unit Apartments | 0 (0.0%) | 23 (100.0%) |
| 5 to 9 Unit Apartments | 0 (0.0%) | 0 (0.0%) |
| 10 or more Apartments | 0 (0.0%) | 48 (100.0%) |
| Mobile Home / Other | 38 (100.0%) | 0 (0.0%) |
| Total | 974 (78.0%) | 274 (22.0%) |
Housing Structures by Number of Rooms in Knox County
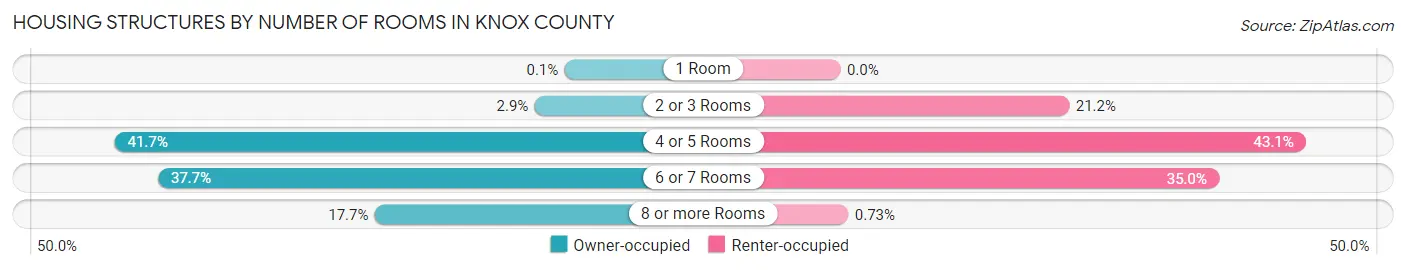
| Number of Rooms | Owner-occupied | Renter-occupied |
| 1 Room | 1 (0.1%) | 0 (0.0%) |
| 2 or 3 Rooms | 28 (2.9%) | 58 (21.2%) |
| 4 or 5 Rooms | 406 (41.7%) | 118 (43.1%) |
| 6 or 7 Rooms | 367 (37.7%) | 96 (35.0%) |
| 8 or more Rooms | 172 (17.7%) | 2 (0.7%) |
| Total | 974 (100.0%) | 274 (100.0%) |
Housing Structure by Heating Type in Knox County
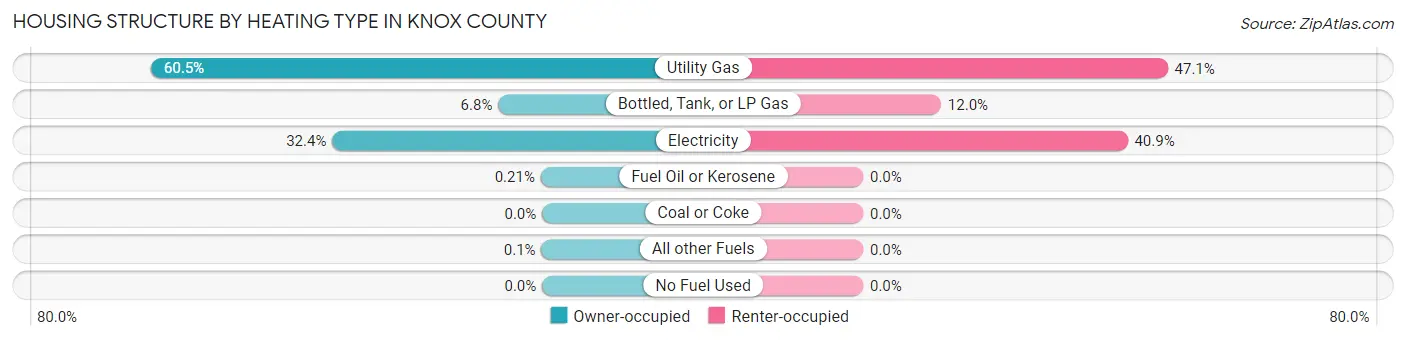
| Heating Type | Owner-occupied | Renter-occupied |
| Utility Gas | 589 (60.5%) | 129 (47.1%) |
| Bottled, Tank, or LP Gas | 66 (6.8%) | 33 (12.0%) |
| Electricity | 316 (32.4%) | 112 (40.9%) |
| Fuel Oil or Kerosene | 2 (0.2%) | 0 (0.0%) |
| Coal or Coke | 0 (0.0%) | 0 (0.0%) |
| All other Fuels | 1 (0.1%) | 0 (0.0%) |
| No Fuel Used | 0 (0.0%) | 0 (0.0%) |
| Total | 974 (100.0%) | 274 (100.0%) |
Household Vehicle Usage in Knox County
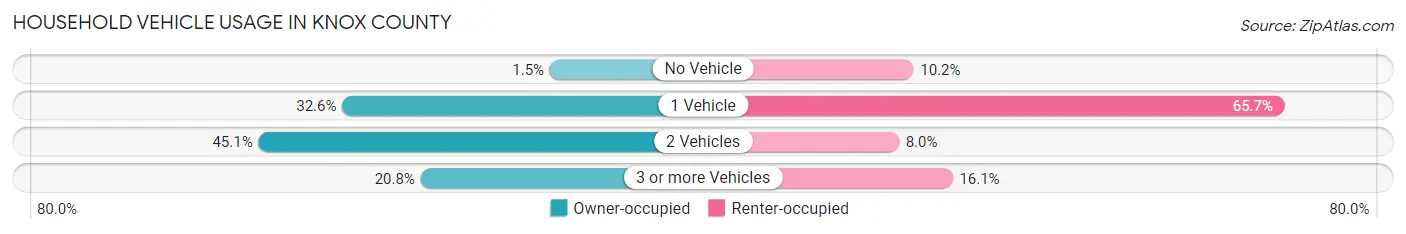
| Vehicles per Household | Owner-occupied | Renter-occupied |
| No Vehicle | 15 (1.5%) | 28 (10.2%) |
| 1 Vehicle | 317 (32.6%) | 180 (65.7%) |
| 2 Vehicles | 439 (45.1%) | 22 (8.0%) |
| 3 or more Vehicles | 203 (20.8%) | 44 (16.1%) |
| Total | 974 (100.0%) | 274 (100.0%) |
Real Estate & Mortgages in Knox County
Real Estate and Mortgage Overview in Knox County
| Characteristic | Without Mortgage | With Mortgage |
| Housing Units | 749 | 225 |
| Median Property Value | $53,300 | $60,200 |
| Median Household Income | $51,806 | $41 |
| Monthly Housing Costs | $456 | $0 |
| Real Estate Taxes | $1,042 | $27 |
Property Value by Mortgage Status in Knox County
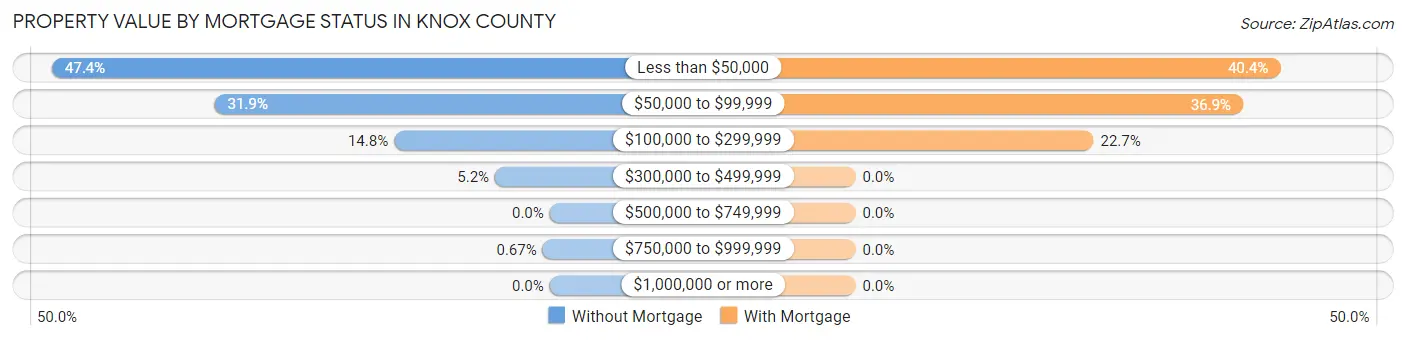
| Property Value | Without Mortgage | With Mortgage |
| Less than $50,000 | 355 (47.4%) | 91 (40.4%) |
| $50,000 to $99,999 | 239 (31.9%) | 83 (36.9%) |
| $100,000 to $299,999 | 111 (14.8%) | 51 (22.7%) |
| $300,000 to $499,999 | 39 (5.2%) | 0 (0.0%) |
| $500,000 to $749,999 | 0 (0.0%) | 0 (0.0%) |
| $750,000 to $999,999 | 5 (0.7%) | 0 (0.0%) |
| $1,000,000 or more | 0 (0.0%) | 0 (0.0%) |
| Total | 749 (100.0%) | 225 (100.0%) |
Household Income by Mortgage Status in Knox County
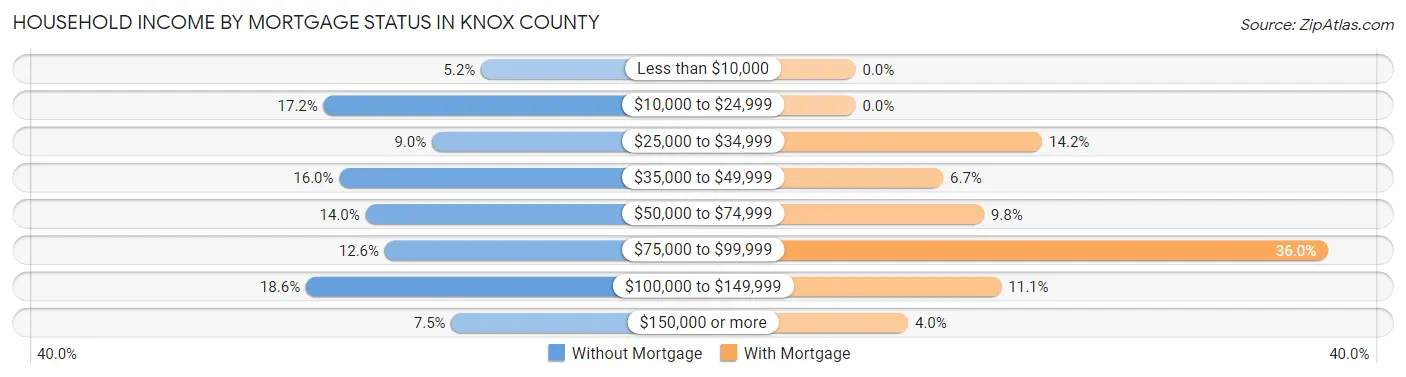
| Household Income | Without Mortgage | With Mortgage |
| Less than $10,000 | 39 (5.2%) | 0 (0.0%) |
| $10,000 to $24,999 | 129 (17.2%) | 0 (0.0%) |
| $25,000 to $34,999 | 67 (8.9%) | 32 (14.2%) |
| $35,000 to $49,999 | 120 (16.0%) | 15 (6.7%) |
| $50,000 to $74,999 | 105 (14.0%) | 22 (9.8%) |
| $75,000 to $99,999 | 94 (12.6%) | 81 (36.0%) |
| $100,000 to $149,999 | 139 (18.6%) | 25 (11.1%) |
| $150,000 or more | 56 (7.5%) | 9 (4.0%) |
| Total | 749 (100.0%) | 225 (100.0%) |
Property Value to Household Income Ratio in Knox County
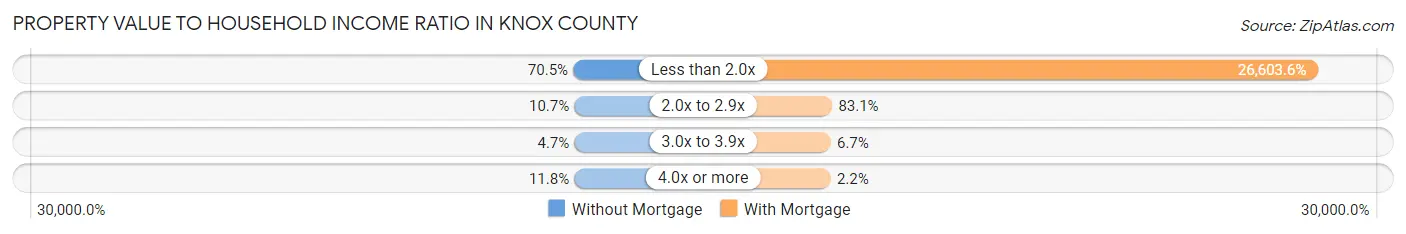
| Value-to-Income Ratio | Without Mortgage | With Mortgage |
| Less than 2.0x | 528 (70.5%) | 59,858 (26,603.6%) |
| 2.0x to 2.9x | 80 (10.7%) | 187 (83.1%) |
| 3.0x to 3.9x | 35 (4.7%) | 15 (6.7%) |
| 4.0x or more | 88 (11.7%) | 5 (2.2%) |
| Total | 749 (100.0%) | 225 (100.0%) |
Real Estate Taxes by Mortgage Status in Knox County
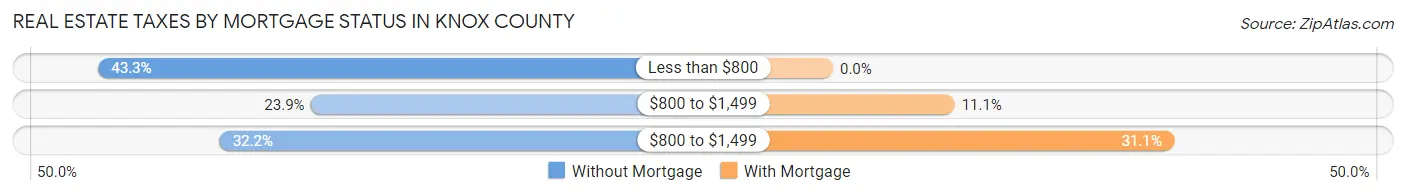
| Property Taxes | Without Mortgage | With Mortgage |
| Less than $800 | 324 (43.3%) | 0 (0.0%) |
| $800 to $1,499 | 179 (23.9%) | 25 (11.1%) |
| $800 to $1,499 | 241 (32.2%) | 70 (31.1%) |
| Total | 749 (100.0%) | 225 (100.0%) |
Health & Disability in Knox County
Health Insurance Coverage by Age in Knox County
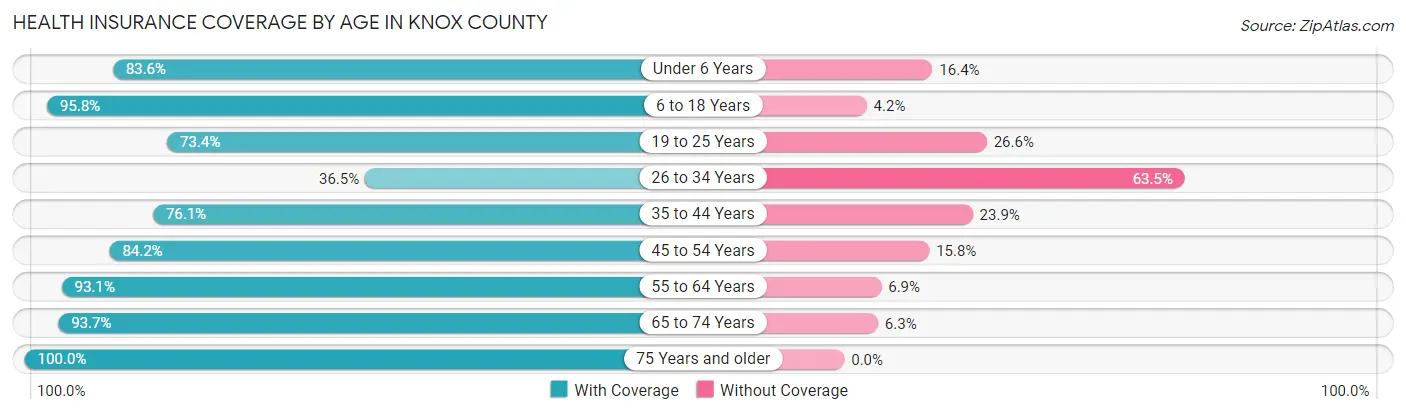
| Age Bracket | With Coverage | Without Coverage |
| Under 6 Years | 173 (83.6%) | 34 (16.4%) |
| 6 to 18 Years | 643 (95.8%) | 28 (4.2%) |
| 19 to 25 Years | 141 (73.4%) | 51 (26.6%) |
| 26 to 34 Years | 103 (36.5%) | 179 (63.5%) |
| 35 to 44 Years | 359 (76.1%) | 113 (23.9%) |
| 45 to 54 Years | 319 (84.2%) | 60 (15.8%) |
| 55 to 64 Years | 432 (93.1%) | 32 (6.9%) |
| 65 to 74 Years | 299 (93.7%) | 20 (6.3%) |
| 75 Years and older | 217 (100.0%) | 0 (0.0%) |
| Total | 2,686 (83.9%) | 517 (16.1%) |
Health Insurance Coverage by Citizenship Status in Knox County
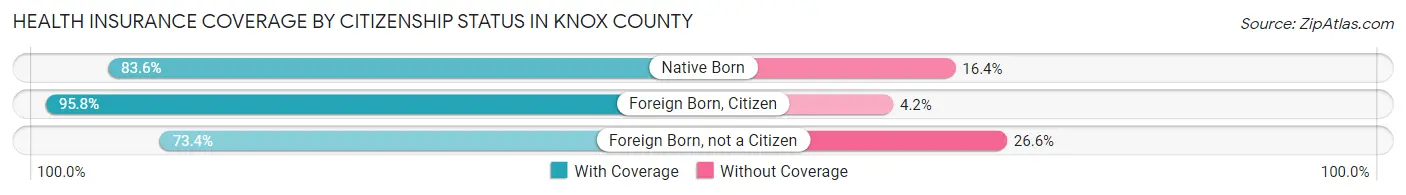
| Citizenship Status | With Coverage | Without Coverage |
| Native Born | 173 (83.6%) | 34 (16.4%) |
| Foreign Born, Citizen | 643 (95.8%) | 28 (4.2%) |
| Foreign Born, not a Citizen | 141 (73.4%) | 51 (26.6%) |
Health Insurance Coverage by Household Income in Knox County
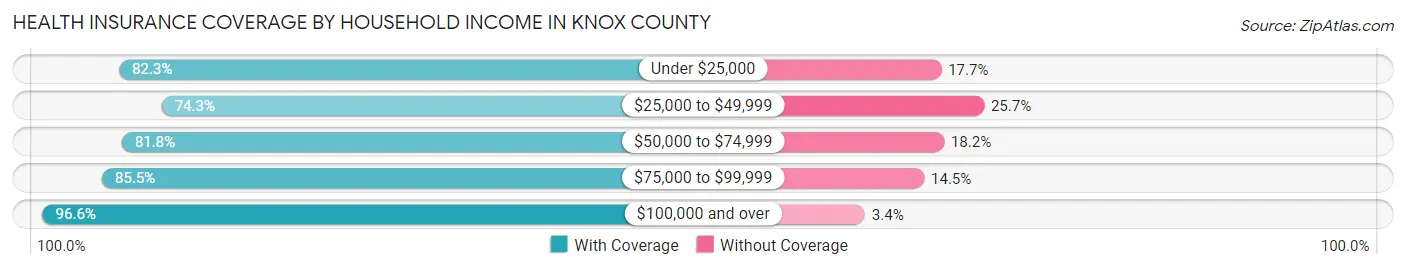
| Household Income | With Coverage | Without Coverage |
| Under $25,000 | 363 (82.3%) | 78 (17.7%) |
| $25,000 to $49,999 | 610 (74.3%) | 211 (25.7%) |
| $50,000 to $74,999 | 638 (81.8%) | 142 (18.2%) |
| $75,000 to $99,999 | 360 (85.5%) | 61 (14.5%) |
| $100,000 and over | 712 (96.6%) | 25 (3.4%) |
Public vs Private Health Insurance Coverage by Age in Knox County
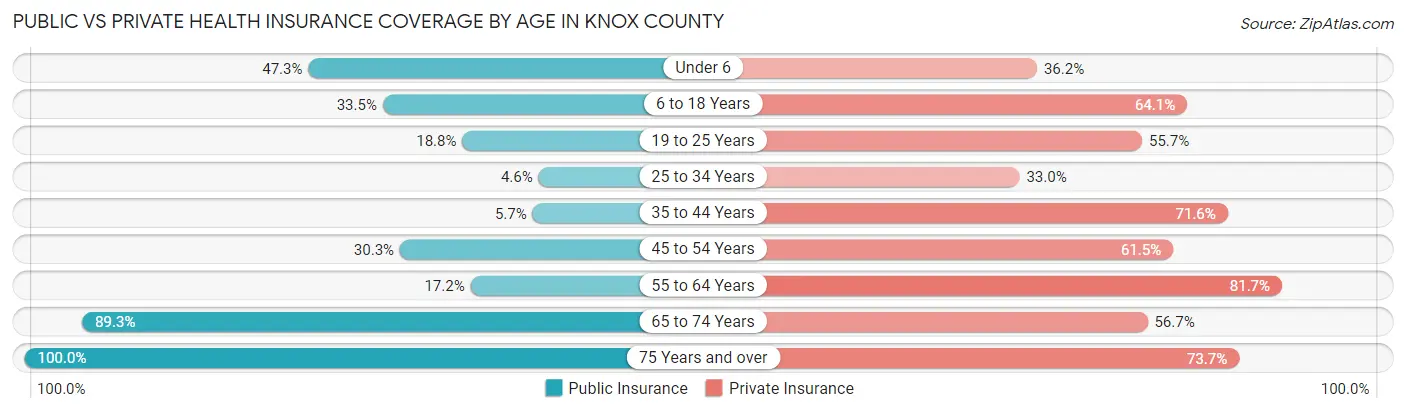
| Age Bracket | Public Insurance | Private Insurance |
| Under 6 | 98 (47.3%) | 75 (36.2%) |
| 6 to 18 Years | 225 (33.5%) | 430 (64.1%) |
| 19 to 25 Years | 36 (18.8%) | 107 (55.7%) |
| 25 to 34 Years | 13 (4.6%) | 93 (33.0%) |
| 35 to 44 Years | 27 (5.7%) | 338 (71.6%) |
| 45 to 54 Years | 115 (30.3%) | 233 (61.5%) |
| 55 to 64 Years | 80 (17.2%) | 379 (81.7%) |
| 65 to 74 Years | 285 (89.3%) | 181 (56.7%) |
| 75 Years and over | 217 (100.0%) | 160 (73.7%) |
| Total | 1,096 (34.2%) | 1,996 (62.3%) |
Disability Status by Sex by Age in Knox County
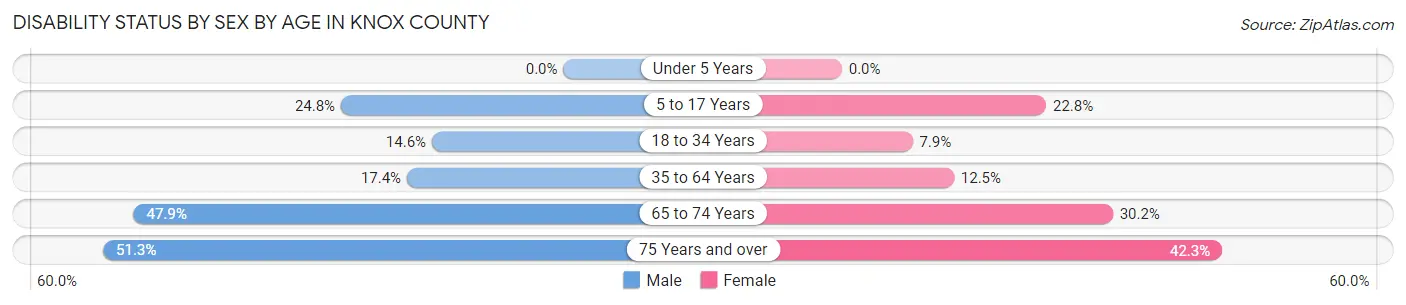
| Age Bracket | Male | Female |
| Under 5 Years | 0 (0.0%) | 0 (0.0%) |
| 5 to 17 Years | 81 (24.8%) | 76 (22.8%) |
| 18 to 34 Years | 41 (14.6%) | 20 (7.9%) |
| 35 to 64 Years | 116 (17.4%) | 81 (12.5%) |
| 65 to 74 Years | 67 (47.9%) | 54 (30.2%) |
| 75 Years and over | 41 (51.2%) | 58 (42.3%) |
Disability Class by Sex by Age in Knox County
Disability Class: Hearing Difficulty
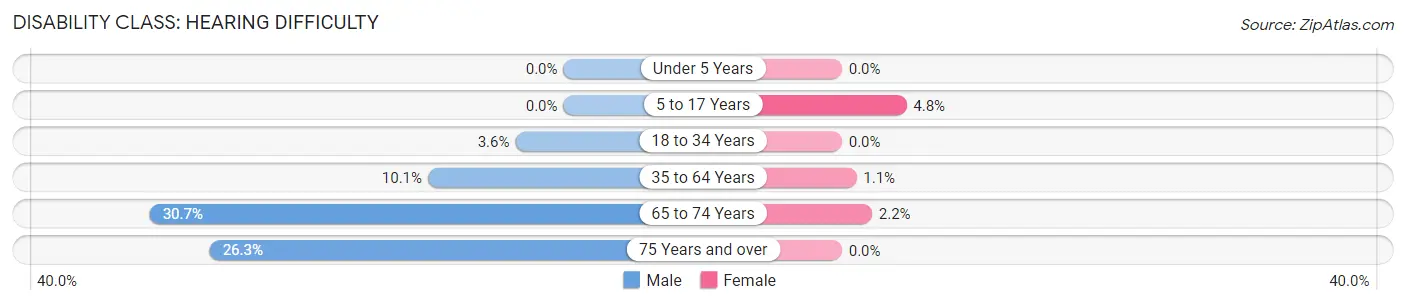
| Age Bracket | Male | Female |
| Under 5 Years | 0 (0.0%) | 0 (0.0%) |
| 5 to 17 Years | 0 (0.0%) | 16 (4.8%) |
| 18 to 34 Years | 10 (3.6%) | 0 (0.0%) |
| 35 to 64 Years | 67 (10.1%) | 7 (1.1%) |
| 65 to 74 Years | 43 (30.7%) | 4 (2.2%) |
| 75 Years and over | 21 (26.3%) | 0 (0.0%) |
Disability Class: Vision Difficulty
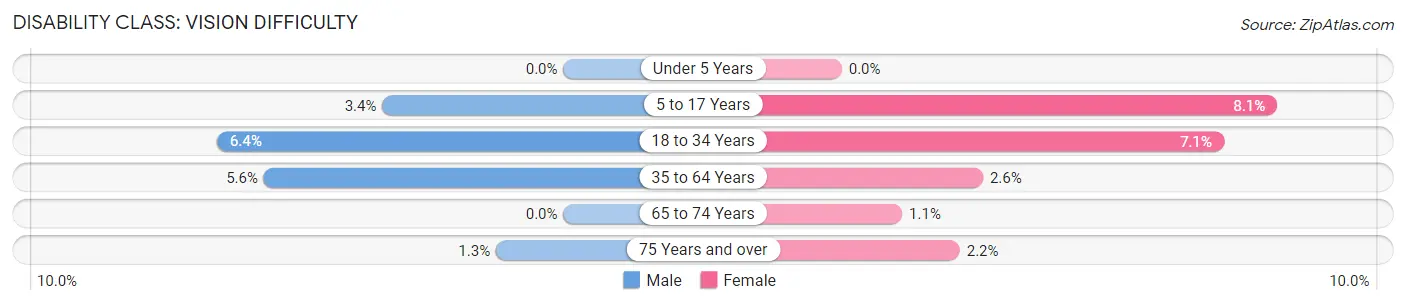
| Age Bracket | Male | Female |
| Under 5 Years | 0 (0.0%) | 0 (0.0%) |
| 5 to 17 Years | 11 (3.4%) | 27 (8.1%) |
| 18 to 34 Years | 18 (6.4%) | 18 (7.1%) |
| 35 to 64 Years | 37 (5.6%) | 17 (2.6%) |
| 65 to 74 Years | 0 (0.0%) | 2 (1.1%) |
| 75 Years and over | 1 (1.3%) | 3 (2.2%) |
Disability Class: Cognitive Difficulty
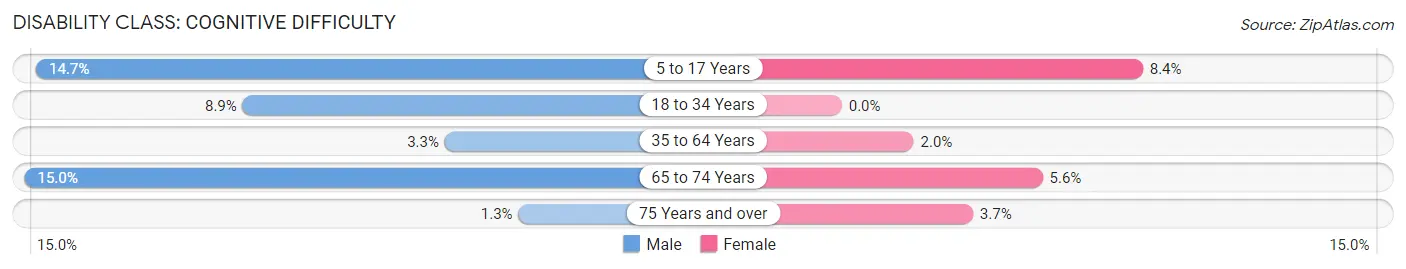
| Age Bracket | Male | Female |
| 5 to 17 Years | 48 (14.7%) | 28 (8.4%) |
| 18 to 34 Years | 25 (8.9%) | 0 (0.0%) |
| 35 to 64 Years | 22 (3.3%) | 13 (2.0%) |
| 65 to 74 Years | 21 (15.0%) | 10 (5.6%) |
| 75 Years and over | 1 (1.3%) | 5 (3.6%) |
Disability Class: Ambulatory Difficulty
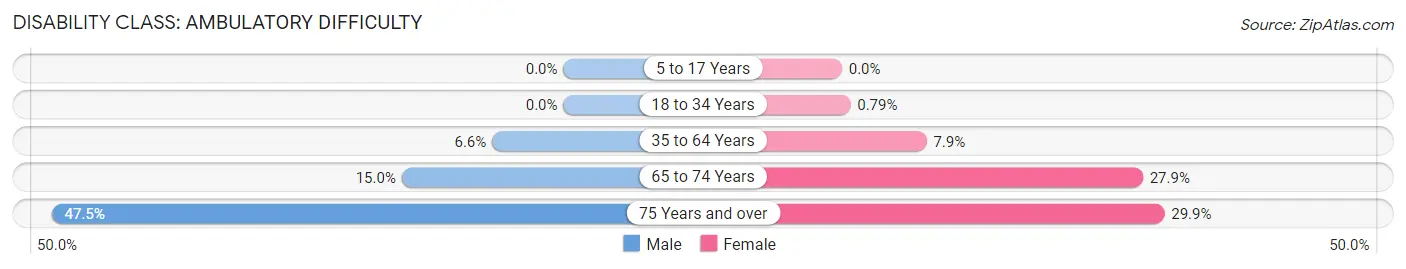
| Age Bracket | Male | Female |
| 5 to 17 Years | 0 (0.0%) | 0 (0.0%) |
| 18 to 34 Years | 0 (0.0%) | 2 (0.8%) |
| 35 to 64 Years | 44 (6.6%) | 51 (7.9%) |
| 65 to 74 Years | 21 (15.0%) | 50 (27.9%) |
| 75 Years and over | 38 (47.5%) | 41 (29.9%) |
Disability Class: Self-Care Difficulty
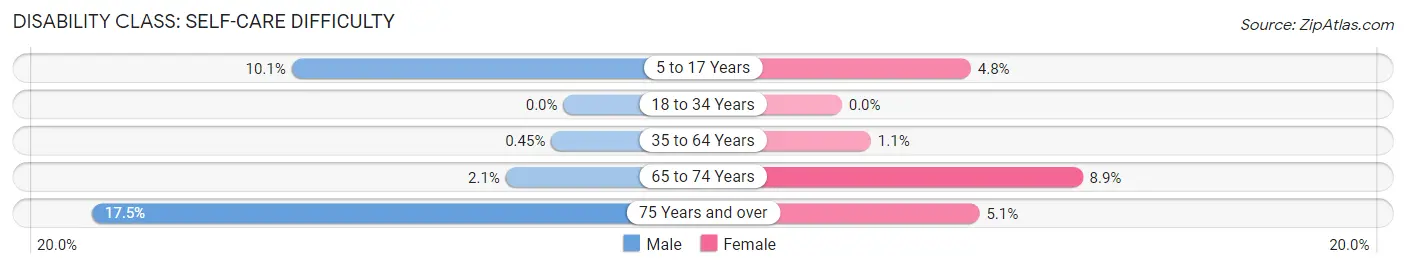
| Age Bracket | Male | Female |
| 5 to 17 Years | 33 (10.1%) | 16 (4.8%) |
| 18 to 34 Years | 0 (0.0%) | 0 (0.0%) |
| 35 to 64 Years | 3 (0.4%) | 7 (1.1%) |
| 65 to 74 Years | 3 (2.1%) | 16 (8.9%) |
| 75 Years and over | 14 (17.5%) | 7 (5.1%) |
Technology Access in Knox County
Computing Device Access in Knox County
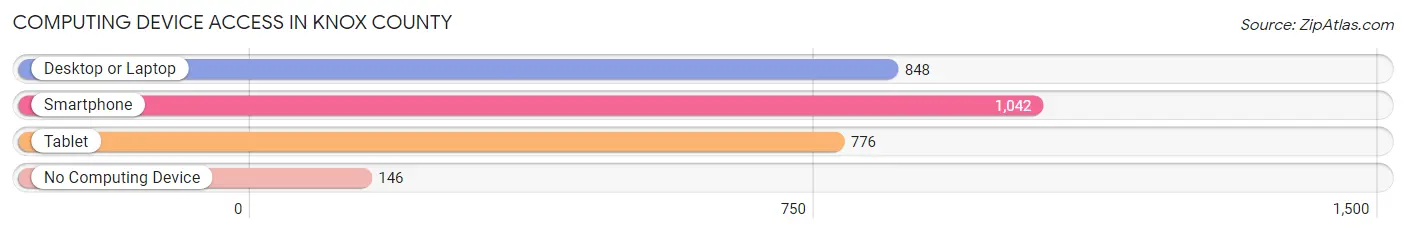
| Device Type | # Households | % Households |
| Desktop or Laptop | 848 | 67.9% |
| Smartphone | 1,042 | 83.5% |
| Tablet | 776 | 62.2% |
| No Computing Device | 146 | 11.7% |
| Total | 1,248 | 100.0% |
Internet Access in Knox County
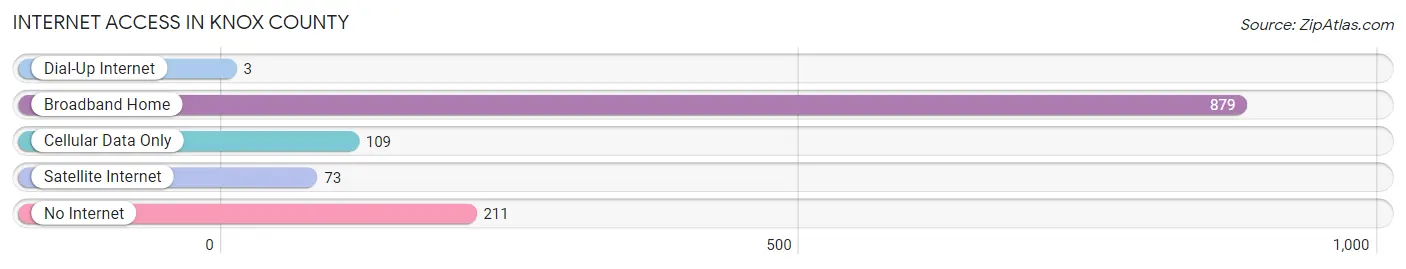
| Internet Type | # Households | % Households |
| Dial-Up Internet | 3 | 0.2% |
| Broadband Home | 879 | 70.4% |
| Cellular Data Only | 109 | 8.7% |
| Satellite Internet | 73 | 5.9% |
| No Internet | 211 | 16.9% |
| Total | 1,248 | 100.0% |
Knox County Summary
Knox County is located in the northern part of Texas, in the United States. It is bordered by Haskell County to the north, King County to the east, Stonewall County to the south, and Fisher County to the west. The county seat is Benjamin, and the largest city is Munday. The county was created in 1858 and named after Henry Knox, the first Secretary of War.
Geography
Knox County covers an area of 919 square miles, making it the second-largest county in Texas. The terrain is mostly flat, with some rolling hills in the western part of the county. The county is drained by the Salt Fork of the Brazos River, which flows through the center of the county. The county is also home to several small lakes, including Lake Munday, Lake Benjamin, and Lake Knox.
The climate of Knox County is semi-arid, with hot summers and mild winters. The average annual temperature is around 68°F, and the average annual precipitation is around 22 inches.
Demographics
As of the 2010 census, there were 3,719 people living in Knox County. The population density was 4 people per square mile. The racial makeup of the county was 94.3% White, 0.3% African American, 0.3% Native American, 0.2% Asian, 0.1% Pacific Islander, 3.7% from other races, and 1.2% from two or more races. Hispanic or Latino of any race were 8.2% of the population.
The median income for a household in the county was $31,250, and the median income for a family was $37,500. The per capita income for the county was $15,845. About 16.2% of families and 19.2% of the population were below the poverty line, including 25.2% of those under age 18 and 15.2% of those age 65 or over.
Economy
The economy of Knox County is largely based on agriculture. The county is home to several large farms, which produce a variety of crops, including cotton, corn, wheat, and sorghum. Livestock production is also important to the local economy, with cattle, sheep, and goats being raised in the area.
The county is also home to several oil and gas fields, which provide jobs and revenue for the local economy. The county is served by several highways, including US Highway 82, which runs through the center of the county.
History
Knox County was created in 1858 from parts of Haskell and Stonewall counties. The county was named after Henry Knox, the first Secretary of War. The county seat was originally located in Benjamin, but was moved to Munday in 1891.
The county was largely rural until the early 20th century, when oil and gas were discovered in the area. This led to an economic boom, and the population of the county grew rapidly. The county continued to grow throughout the 20th century, and today it is home to a diverse economy and population.
Common Questions
What is Per Capita Income in Knox County?
Per Capita income in Knox County is $24,892.
What is the Median Family Income in Knox County?
Median Family Income in Knox County is $58,686.
What is the Median Household income in Knox County?
Median Household Income in Knox County is $48,750.
What is Income or Wage Gap in Knox County?
Income or Wage Gap in Knox County is 32.3%.
Women in Knox County earn 67.7 cents for every dollar earned by a man.
What is Family Income Deficit in Knox County?
Family Income Deficit in Knox County is $8,763.
Families that are below poverty line in Knox County earn $8,763 less on average than the poverty threshold level.
What is Inequality or Gini Index in Knox County?
Inequality or Gini Index in Knox County is 0.43.
What is the Total Population of Knox County?
Total Population of Knox County is 3,333.
What is the Total Male Population of Knox County?
Total Male Population of Knox County is 1,629.
What is the Total Female Population of Knox County?
Total Female Population of Knox County is 1,704.
What is the Ratio of Males per 100 Females in Knox County?
There are 95.60 Males per 100 Females in Knox County.
What is the Ratio of Females per 100 Males in Knox County?
There are 104.60 Females per 100 Males in Knox County.
What is the Median Population Age in Knox County?
Median Population Age in Knox County is 41.1 Years.
What is the Average Family Size in Knox County
Average Family Size in Knox County is 3.1 People.
What is the Average Household Size in Knox County
Average Household Size in Knox County is 2.6 People.
How Large is the Labor Force in Knox County?
There are 1,466 People in the Labor Forcein in Knox County.
What is the Percentage of People in the Labor Force in Knox County?
55.5% of People are in the Labor Force in Knox County.
What is the Unemployment Rate in Knox County?
Unemployment Rate in Knox County is 1.6%.