Kleberg County, TX Map & Demographics
Kleberg County Map
Kleberg County Overview
$25,876
PER CAPITA INCOME
$62,635
AVG FAMILY INCOME
$52,487
AVG HOUSEHOLD INCOME
43.9%
WAGE / INCOME GAP [ % ]
56.1¢/ $1
WAGE / INCOME GAP [ $ ]
$12,912
FAMILY INCOME DEFICIT
0.48
INEQUALITY / GINI INDEX
30,860
TOTAL POPULATION
15,582
MALE POPULATION
15,278
FEMALE POPULATION
101.99
MALES / 100 FEMALES
98.05
FEMALES / 100 MALES
28.6
MEDIAN AGE
3.1
AVG FAMILY SIZE
2.4
AVG HOUSEHOLD SIZE
14,353
LABOR FORCE [ PEOPLE ]
59.3%
PERCENT IN LABOR FORCE
7.5%
UNEMPLOYMENT RATE
Kleberg County Area Codes
Income in Kleberg County
Income Overview in Kleberg County
Per Capita Income in Kleberg County is $25,876, while median incomes of families and households are $62,635 and $52,487 respectively.
| Characteristic | Number | Measure |
| Per Capita Income | 30,860 | $25,876 |
| Median Family Income | 7,142 | $62,635 |
| Mean Family Income | 7,142 | $78,396 |
| Median Household Income | 11,915 | $52,487 |
| Mean Household Income | 11,915 | $67,464 |
| Income Deficit | 7,142 | $12,912 |
| Wage / Income Gap (%) | 30,860 | 43.91% |
| Wage / Income Gap ($) | 30,860 | 56.09¢ per $1 |
| Gini / Inequality Index | 30,860 | 0.48 |
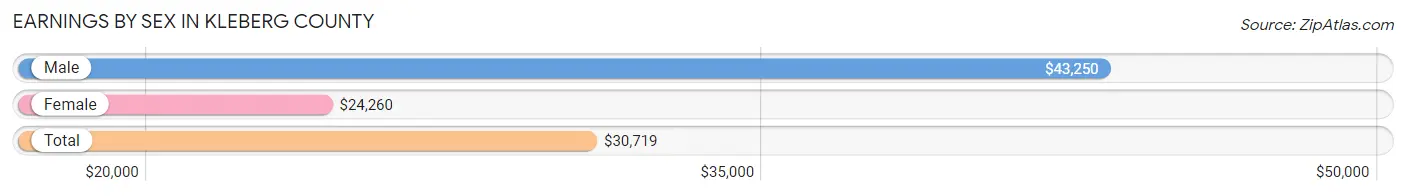
Earnings by Sex in Kleberg County
Average Earnings in Kleberg County are $30,719, $43,250 for men and $24,260 for women, a difference of 43.9%.
| Sex | Number | Average Earnings |
| Male | 8,097 (54.3%) | $43,250 |
| Female | 6,816 (45.7%) | $24,260 |
| Total | 14,913 (100.0%) | $30,719 |
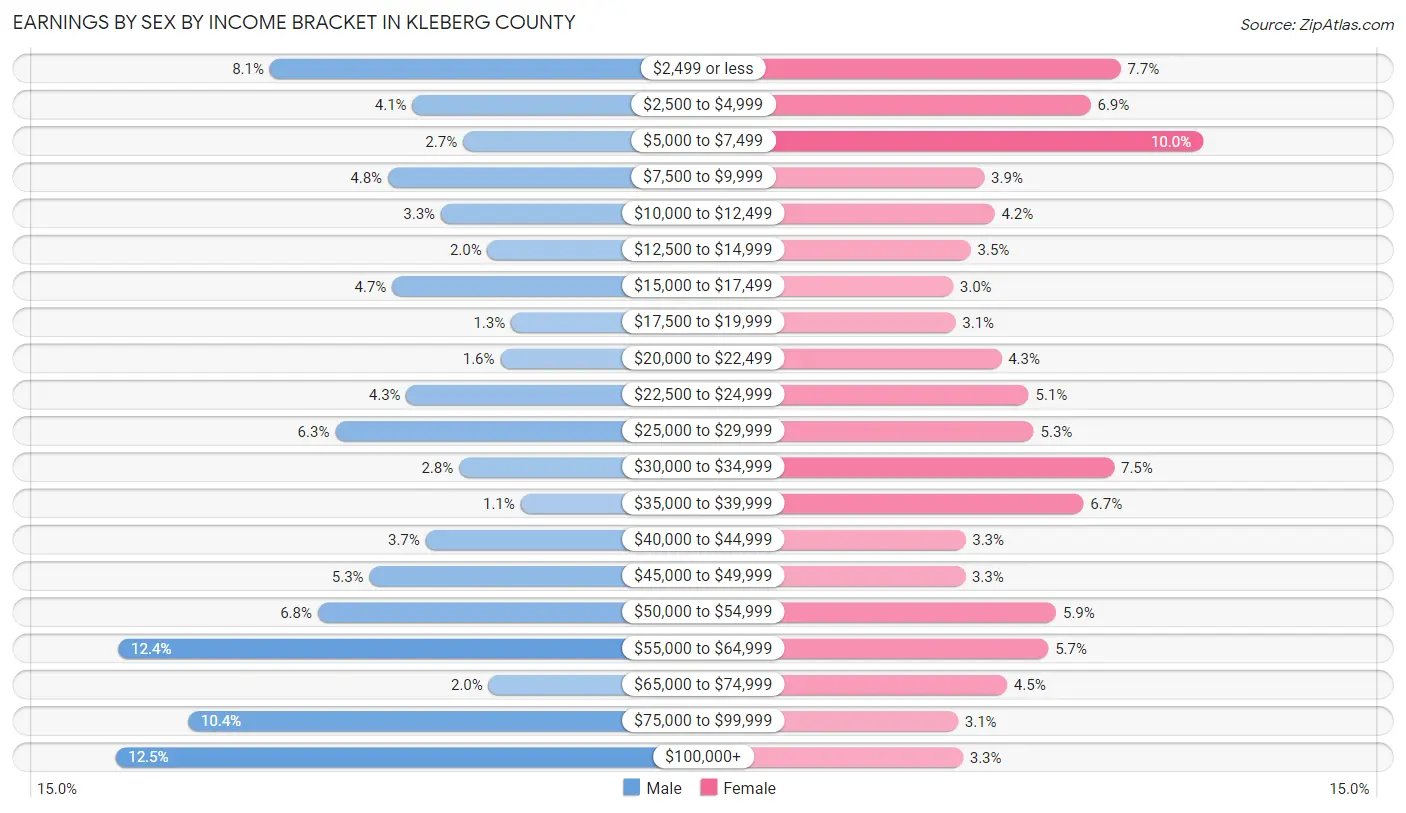
Earnings by Sex by Income Bracket in Kleberg County
The most common earnings brackets in Kleberg County are $100,000+ for men (1,008 | 12.4%) and $5,000 to $7,499 for women (682 | 10.0%).
| Income | Male | Female |
| $2,499 or less | 657 (8.1%) | 524 (7.7%) |
| $2,500 to $4,999 | 332 (4.1%) | 467 (6.9%) |
| $5,000 to $7,499 | 217 (2.7%) | 682 (10.0%) |
| $7,500 to $9,999 | 388 (4.8%) | 263 (3.9%) |
| $10,000 to $12,499 | 267 (3.3%) | 283 (4.2%) |
| $12,500 to $14,999 | 161 (2.0%) | 237 (3.5%) |
| $15,000 to $17,499 | 378 (4.7%) | 203 (3.0%) |
| $17,500 to $19,999 | 108 (1.3%) | 208 (3.0%) |
| $20,000 to $22,499 | 132 (1.6%) | 296 (4.3%) |
| $22,500 to $24,999 | 346 (4.3%) | 348 (5.1%) |
| $25,000 to $29,999 | 508 (6.3%) | 358 (5.2%) |
| $30,000 to $34,999 | 226 (2.8%) | 512 (7.5%) |
| $35,000 to $39,999 | 86 (1.1%) | 453 (6.7%) |
| $40,000 to $44,999 | 302 (3.7%) | 227 (3.3%) |
| $45,000 to $49,999 | 430 (5.3%) | 226 (3.3%) |
| $50,000 to $54,999 | 547 (6.8%) | 401 (5.9%) |
| $55,000 to $64,999 | 1,002 (12.4%) | 386 (5.7%) |
| $65,000 to $74,999 | 159 (2.0%) | 307 (4.5%) |
| $75,000 to $99,999 | 843 (10.4%) | 213 (3.1%) |
| $100,000+ | 1,008 (12.4%) | 222 (3.3%) |
| Total | 8,097 (100.0%) | 6,816 (100.0%) |
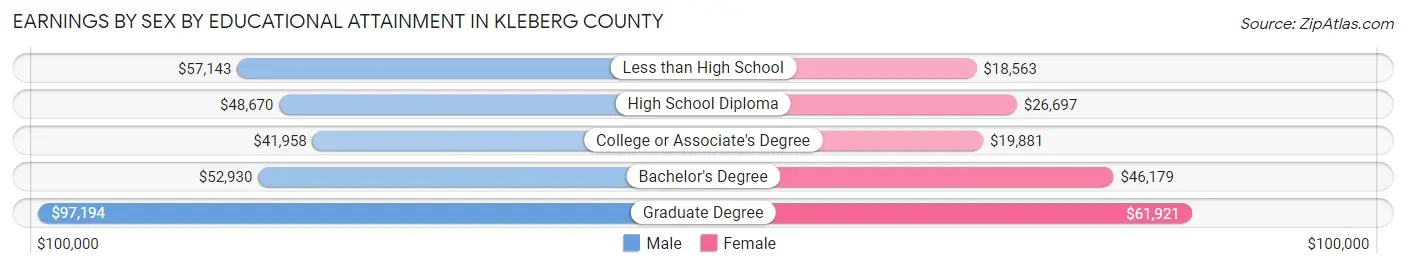
Earnings by Sex by Educational Attainment in Kleberg County
Average earnings in Kleberg County are $51,276 for men and $31,684 for women, a difference of 38.2%. Men with an educational attainment of graduate degree enjoy the highest average annual earnings of $97,194, while those with college or associate's degree education earn the least with $41,958. Women with an educational attainment of graduate degree earn the most with the average annual earnings of $61,921, while those with less than high school education have the smallest earnings of $18,563.
| Educational Attainment | Male Income | Female Income |
| Less than High School | $57,143 | $18,563 |
| High School Diploma | $48,670 | $26,697 |
| College or Associate's Degree | $41,958 | $19,881 |
| Bachelor's Degree | $52,930 | $46,179 |
| Graduate Degree | $97,194 | $61,921 |
| Total | $51,276 | $31,684 |
Family Income in Kleberg County
Family Income Brackets in Kleberg County
According to the Kleberg County family income data, there are 1,286 families falling into the $100,000 to $149,999 income range, which is the most common income bracket and makes up 18.0% of all families. Conversely, the $10,000 to $14,999 income bracket is the least frequent group with only 229 families (3.2%) belonging to this category.
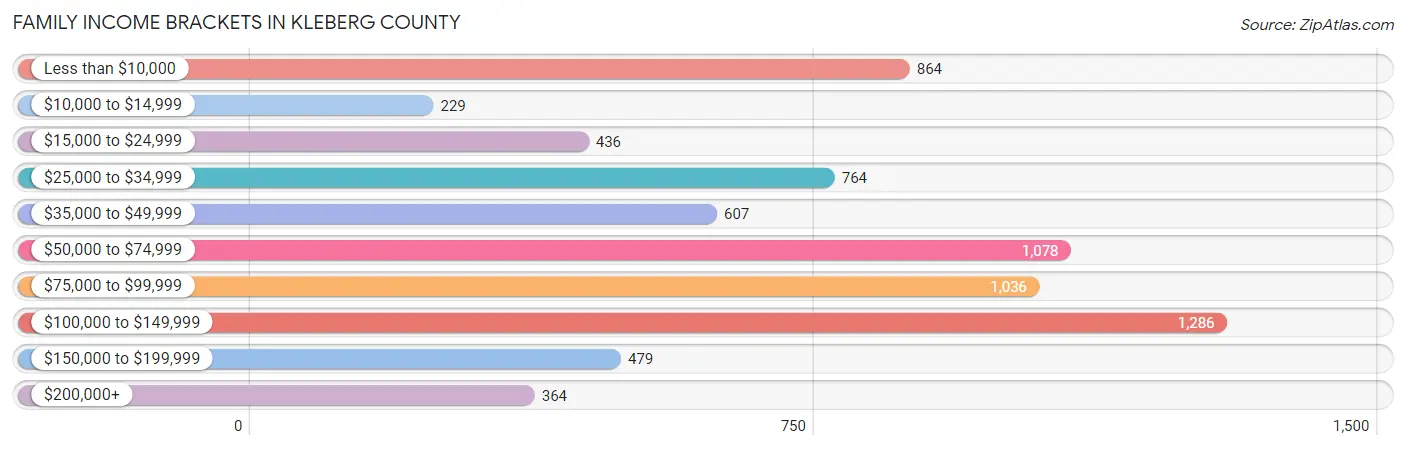
| Income Bracket | # Families | % Families |
| Less than $10,000 | 864 | 12.1% |
| $10,000 to $14,999 | 229 | 3.2% |
| $15,000 to $24,999 | 436 | 6.1% |
| $25,000 to $34,999 | 764 | 10.7% |
| $35,000 to $49,999 | 607 | 8.5% |
| $50,000 to $74,999 | 1,078 | 15.1% |
| $75,000 to $99,999 | 1,036 | 14.5% |
| $100,000 to $149,999 | 1,286 | 18.0% |
| $150,000 to $199,999 | 479 | 6.7% |
| $200,000+ | 364 | 5.1% |
Family Income by Famaliy Size in Kleberg County
5-person families (457 | 6.4%) account for the highest median family income in Kleberg County with $96,012 per family, while 2-person families (3,152 | 44.1%) have the highest median income of $28,836 per family member.
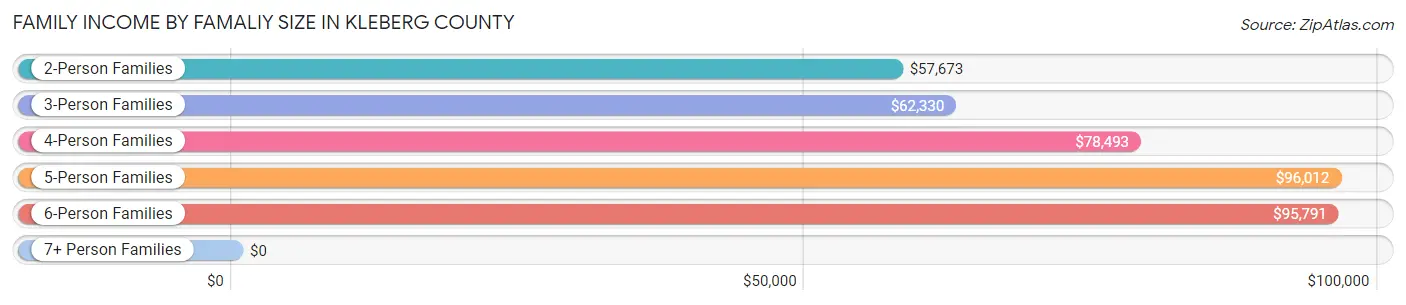
| Income Bracket | # Families | Median Income |
| 2-Person Families | 3,152 (44.1%) | $57,673 |
| 3-Person Families | 1,471 (20.6%) | $62,330 |
| 4-Person Families | 1,731 (24.2%) | $78,493 |
| 5-Person Families | 457 (6.4%) | $96,012 |
| 6-Person Families | 179 (2.5%) | $95,791 |
| 7+ Person Families | 152 (2.1%) | $0 |
| Total | 7,142 (100.0%) | $62,635 |
Family Income by Number of Earners in Kleberg County
The median family income in Kleberg County is $62,635, with families comprising 3+ earners (506) having the highest median family income of $109,174, while families with no earners (1,345) have the lowest median family income of $23,925, accounting for 7.1% and 18.8% of families, respectively.
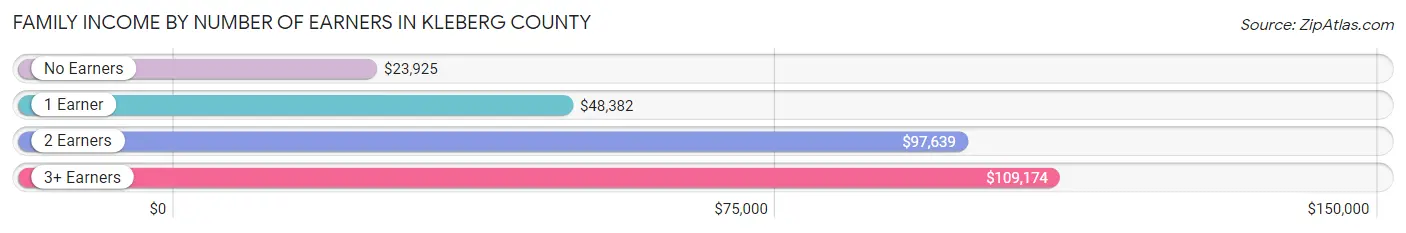
| Number of Earners | # Families | Median Income |
| No Earners | 1,345 (18.8%) | $23,925 |
| 1 Earner | 2,792 (39.1%) | $48,382 |
| 2 Earners | 2,499 (35.0%) | $97,639 |
| 3+ Earners | 506 (7.1%) | $109,174 |
| Total | 7,142 (100.0%) | $62,635 |
Household Income in Kleberg County
Household Income Brackets in Kleberg County
With 1,990 households falling in the category, the $50,000 to $74,999 income range is the most frequent in Kleberg County, accounting for 16.7% of all households. In contrast, only 405 households (3.4%) fall into the $200,000+ income bracket, making it the least populous group.
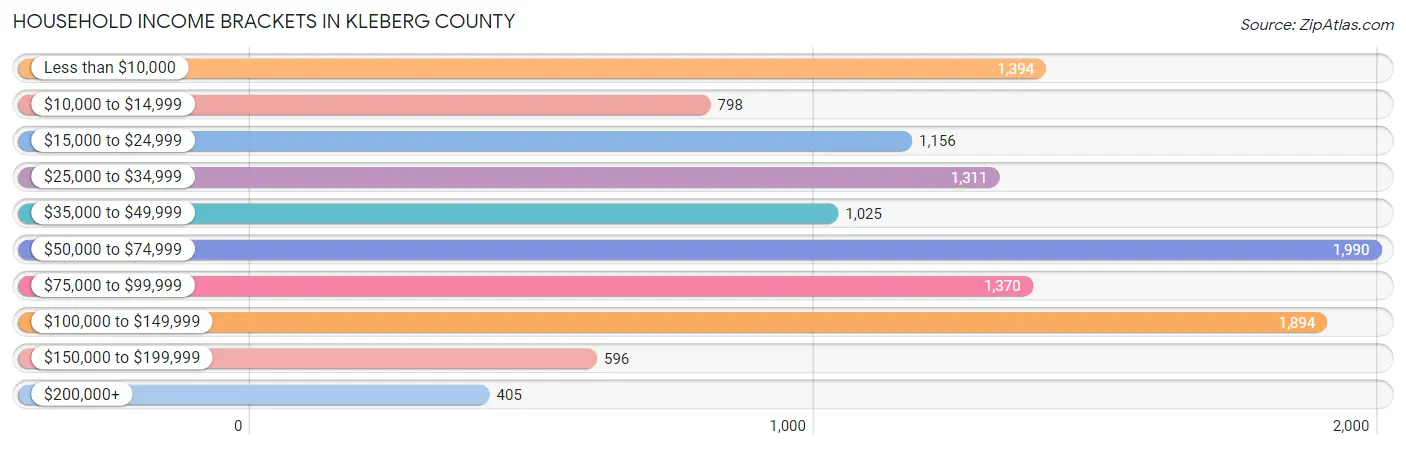
| Income Bracket | # Households | % Households |
| Less than $10,000 | 1,394 | 11.7% |
| $10,000 to $14,999 | 798 | 6.7% |
| $15,000 to $24,999 | 1,156 | 9.7% |
| $25,000 to $34,999 | 1,311 | 11.0% |
| $35,000 to $49,999 | 1,025 | 8.6% |
| $50,000 to $74,999 | 1,990 | 16.7% |
| $75,000 to $99,999 | 1,370 | 11.5% |
| $100,000 to $149,999 | 1,894 | 15.9% |
| $150,000 to $199,999 | 596 | 5.0% |
| $200,000+ | 405 | 3.4% |
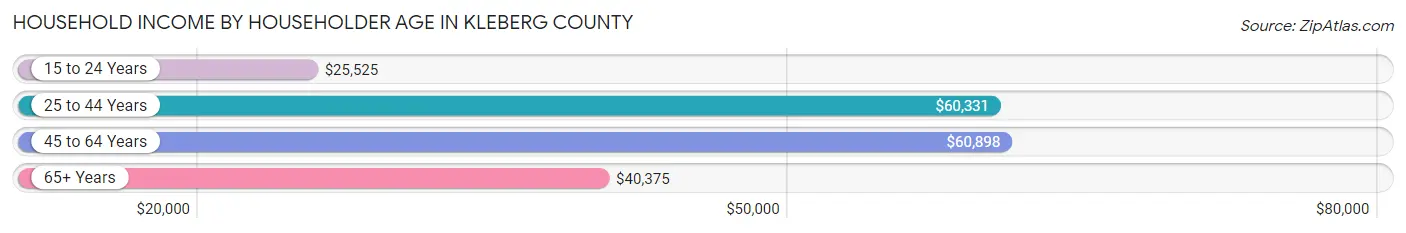
Household Income by Householder Age in Kleberg County
The median household income in Kleberg County is $52,487, with the highest median household income of $60,898 found in the 45 to 64 years age bracket for the primary householder. A total of 3,201 households (26.9%) fall into this category. Meanwhile, the 15 to 24 years age bracket for the primary householder has the lowest median household income of $25,525, with 1,967 households (16.5%) in this group.
| Income Bracket | # Households | Median Income |
| 15 to 24 Years | 1,967 (16.5%) | $25,525 |
| 25 to 44 Years | 4,315 (36.2%) | $60,331 |
| 45 to 64 Years | 3,201 (26.9%) | $60,898 |
| 65+ Years | 2,432 (20.4%) | $40,375 |
| Total | 11,915 (100.0%) | $52,487 |
Poverty in Kleberg County
Income Below Poverty by Sex and Age in Kleberg County
With 26.5% poverty level for males and 34.7% for females among the residents of Kleberg County, 5 year old males and 18 to 24 year old females are the most vulnerable to poverty, with 206 males (81.4%) and 1,399 females (54.7%) in their respective age groups living below the poverty level.
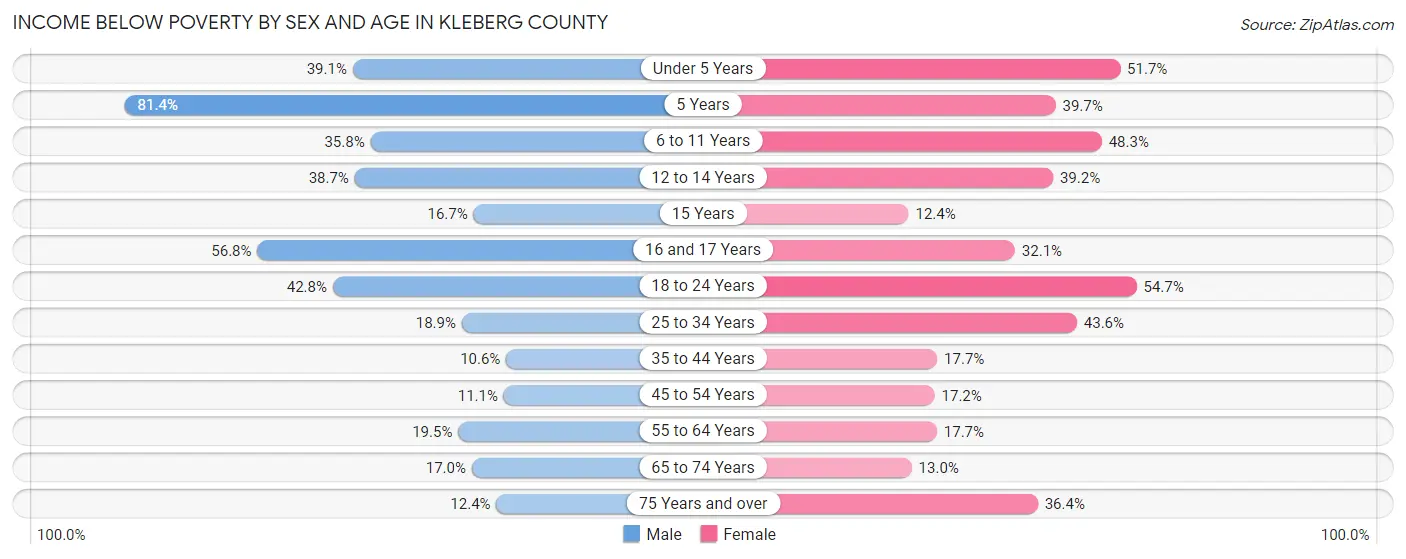
| Age Bracket | Male | Female |
| Under 5 Years | 439 (39.1%) | 494 (51.7%) |
| 5 Years | 206 (81.4%) | 98 (39.7%) |
| 6 to 11 Years | 377 (35.8%) | 539 (48.2%) |
| 12 to 14 Years | 306 (38.7%) | 265 (39.2%) |
| 15 Years | 18 (16.7%) | 29 (12.4%) |
| 16 and 17 Years | 259 (56.8%) | 125 (32.1%) |
| 18 to 24 Years | 961 (42.8%) | 1,399 (54.7%) |
| 25 to 34 Years | 416 (18.9%) | 835 (43.6%) |
| 35 to 44 Years | 190 (10.6%) | 294 (17.7%) |
| 45 to 54 Years | 156 (11.1%) | 240 (17.2%) |
| 55 to 64 Years | 264 (19.5%) | 225 (17.6%) |
| 65 to 74 Years | 182 (17.0%) | 151 (13.0%) |
| 75 Years and over | 90 (12.4%) | 327 (36.4%) |
| Total | 3,864 (26.5%) | 5,021 (34.7%) |
Income Above Poverty by Sex and Age in Kleberg County
According to the poverty statistics in Kleberg County, males aged 35 to 44 years and females aged 15 years are the age groups that are most secure financially, with 89.4% of males and 87.6% of females in these age groups living above the poverty line.
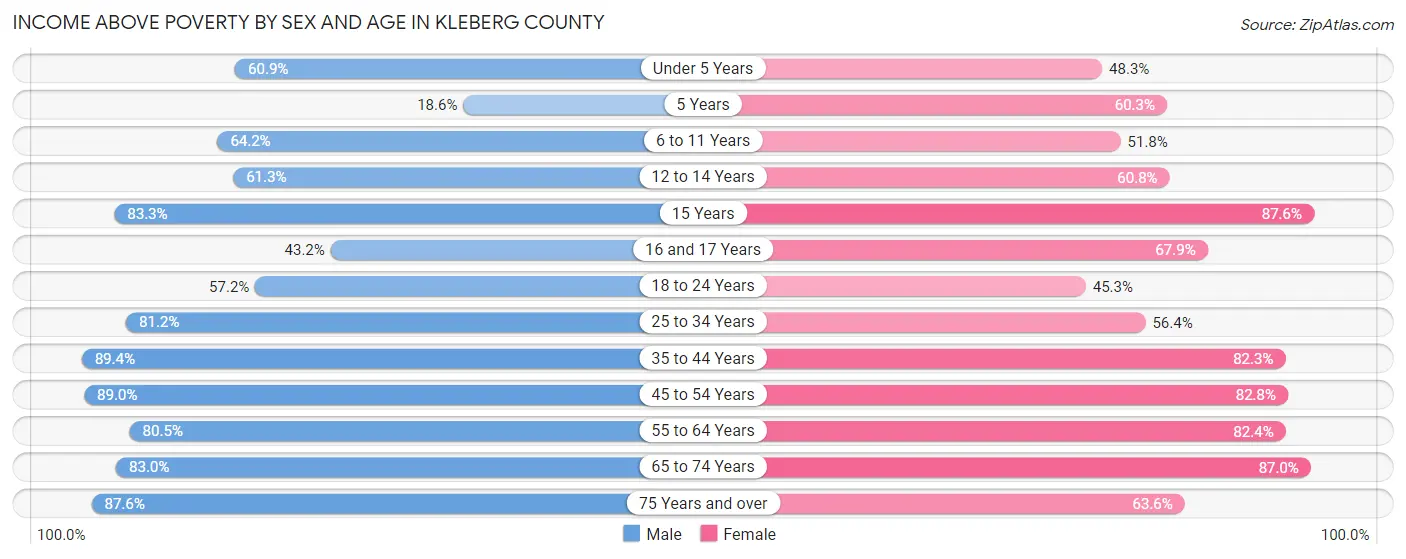
| Age Bracket | Male | Female |
| Under 5 Years | 684 (60.9%) | 462 (48.3%) |
| 5 Years | 47 (18.6%) | 149 (60.3%) |
| 6 to 11 Years | 676 (64.2%) | 578 (51.7%) |
| 12 to 14 Years | 484 (61.3%) | 411 (60.8%) |
| 15 Years | 90 (83.3%) | 205 (87.6%) |
| 16 and 17 Years | 197 (43.2%) | 264 (67.9%) |
| 18 to 24 Years | 1,285 (57.2%) | 1,158 (45.3%) |
| 25 to 34 Years | 1,791 (81.1%) | 1,079 (56.4%) |
| 35 to 44 Years | 1,600 (89.4%) | 1,367 (82.3%) |
| 45 to 54 Years | 1,256 (88.9%) | 1,153 (82.8%) |
| 55 to 64 Years | 1,089 (80.5%) | 1,050 (82.4%) |
| 65 to 74 Years | 889 (83.0%) | 1,013 (87.0%) |
| 75 Years and over | 634 (87.6%) | 572 (63.6%) |
| Total | 10,722 (73.5%) | 9,461 (65.3%) |
Income Below Poverty Among Married-Couple Families in Kleberg County
The poverty statistics for married-couple families in Kleberg County show that 7.8% or 345 of the total 4,445 families live below the poverty line. Families with 5 or more children have the highest poverty rate of 100.0%, comprising of 21 families. On the other hand, families with no children have the lowest poverty rate of 3.7%, which includes 92 families.
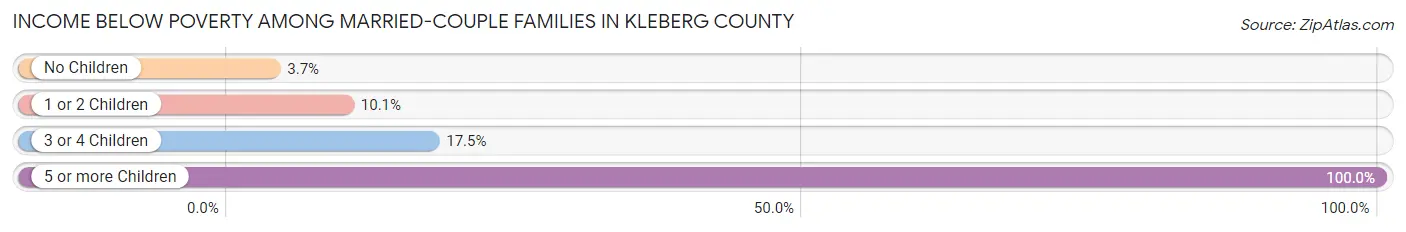
| Children | Above Poverty | Below Poverty |
| No Children | 2,405 (96.3%) | 92 (3.7%) |
| 1 or 2 Children | 1,276 (89.9%) | 143 (10.1%) |
| 3 or 4 Children | 419 (82.5%) | 89 (17.5%) |
| 5 or more Children | 0 (0.0%) | 21 (100.0%) |
| Total | 4,100 (92.2%) | 345 (7.8%) |
Income Below Poverty Among Single-Parent Households in Kleberg County
According to the poverty data in Kleberg County, 40.3% or 281 single-father households and 54.3% or 1,086 single-mother households are living below the poverty line. Among single-father households, those with 1 or 2 children have the highest poverty rate, with 141 households (45.8%) experiencing poverty. Likewise, among single-mother households, those with 5 or more children have the highest poverty rate, with 10 households (100.0%) falling below the poverty line.
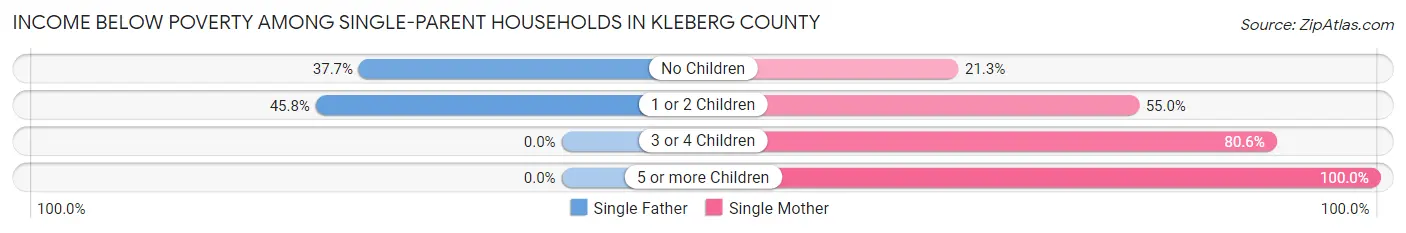
| Children | Single Father | Single Mother |
| No Children | 140 (37.7%) | 88 (21.3%) |
| 1 or 2 Children | 141 (45.8%) | 605 (54.9%) |
| 3 or 4 Children | 0 (0.0%) | 383 (80.6%) |
| 5 or more Children | 0 (0.0%) | 10 (100.0%) |
| Total | 281 (40.3%) | 1,086 (54.3%) |
Income Below Poverty Among Married-Couple vs Single-Parent Households in Kleberg County
The poverty data for Kleberg County shows that 345 of the married-couple family households (7.8%) and 1,367 of the single-parent households (50.7%) are living below the poverty level. Within the married-couple family households, those with 5 or more children have the highest poverty rate, with 21 households (100.0%) falling below the poverty line. Among the single-parent households, those with 5 or more children have the highest poverty rate, with 10 household (100.0%) living below poverty.
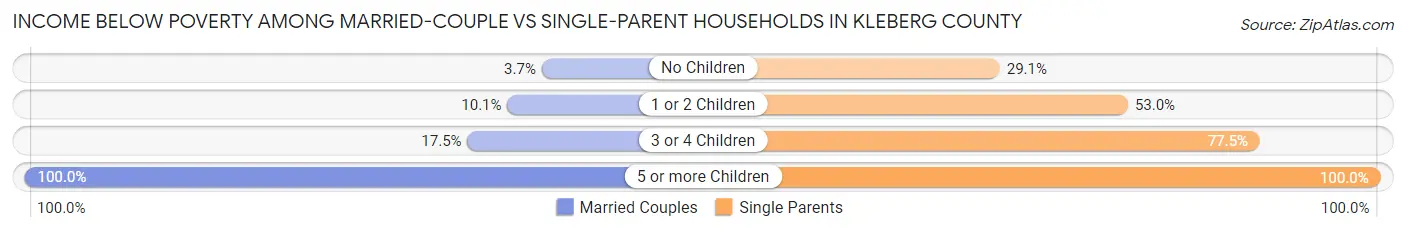
| Children | Married-Couple Families | Single-Parent Households |
| No Children | 92 (3.7%) | 228 (29.1%) |
| 1 or 2 Children | 143 (10.1%) | 746 (52.9%) |
| 3 or 4 Children | 89 (17.5%) | 383 (77.5%) |
| 5 or more Children | 21 (100.0%) | 10 (100.0%) |
| Total | 345 (7.8%) | 1,367 (50.7%) |
Race in Kleberg County
The most populous races in Kleberg County are Hispanic or Latino (22,672 | 73.5%), White / Caucasian (18,374 | 59.5%), and Two or more Races (9,480 | 30.7%).
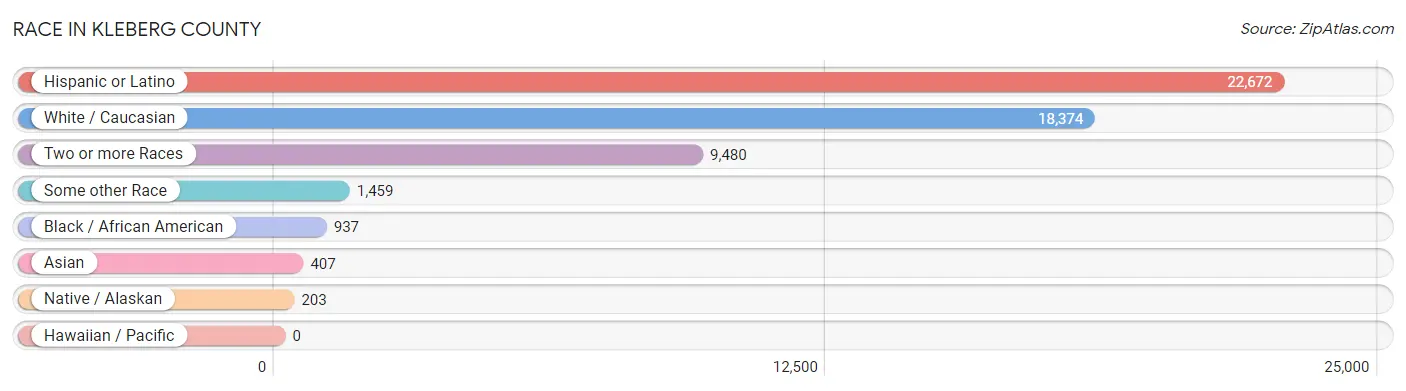
| Race | # Population | % Population |
| Asian | 407 | 1.3% |
| Black / African American | 937 | 3.0% |
| Hawaiian / Pacific | 0 | 0.0% |
| Hispanic or Latino | 22,672 | 73.5% |
| Native / Alaskan | 203 | 0.7% |
| White / Caucasian | 18,374 | 59.5% |
| Two or more Races | 9,480 | 30.7% |
| Some other Race | 1,459 | 4.7% |
| Total | 30,860 | 100.0% |
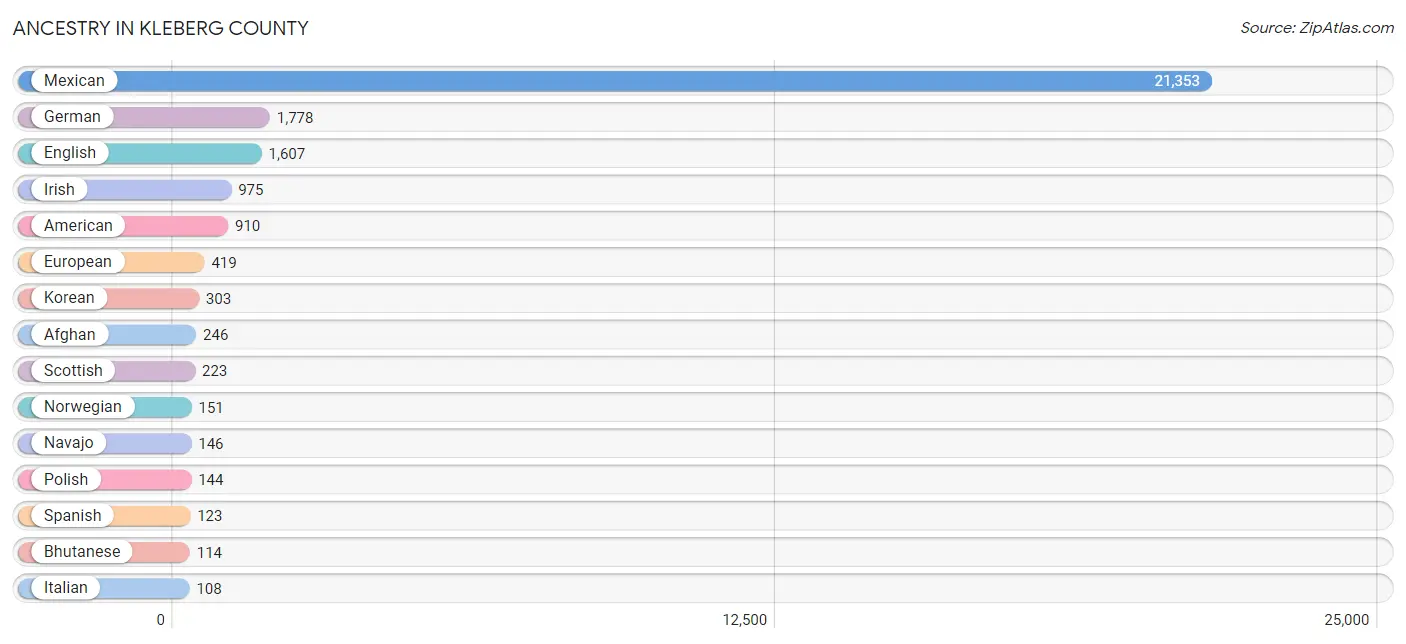
Ancestry in Kleberg County
The most populous ancestries reported in Kleberg County are Mexican (21,353 | 69.2%), German (1,778 | 5.8%), English (1,607 | 5.2%), Irish (975 | 3.2%), and American (910 | 2.9%), together accounting for 86.3% of all Kleberg County residents.
| Ancestry | # Population | % Population |
| Afghan | 246 | 0.8% |
| African | 44 | 0.1% |
| American | 910 | 2.9% |
| Apache | 13 | 0.0% |
| Argentinean | 10 | 0.0% |
| Austrian | 23 | 0.1% |
| Bhutanese | 114 | 0.4% |
| Bolivian | 30 | 0.1% |
| Brazilian | 28 | 0.1% |
| British | 52 | 0.2% |
| Burmese | 11 | 0.0% |
| Central American | 47 | 0.2% |
| Cherokee | 11 | 0.0% |
| Chickasaw | 17 | 0.1% |
| Creek | 31 | 0.1% |
| Cuban | 33 | 0.1% |
| Czech | 100 | 0.3% |
| Danish | 12 | 0.0% |
| Dominican | 33 | 0.1% |
| Dutch | 53 | 0.2% |
| Dutch West Indian | 8 | 0.0% |
| Eastern European | 23 | 0.1% |
| English | 1,607 | 5.2% |
| European | 419 | 1.4% |
| Filipino | 12 | 0.0% |
| French | 74 | 0.2% |
| French Canadian | 43 | 0.1% |
| German | 1,778 | 5.8% |
| Greek | 11 | 0.0% |
| Guatemalan | 7 | 0.0% |
| Honduran | 15 | 0.1% |
| Indian (Asian) | 70 | 0.2% |
| Inupiat | 2 | 0.0% |
| Irish | 975 | 3.2% |
| Italian | 108 | 0.4% |
| Japanese | 4 | 0.0% |
| Korean | 303 | 1.0% |
| Laotian | 44 | 0.1% |
| Mexican | 21,353 | 69.2% |
| Navajo | 146 | 0.5% |
| Nigerian | 39 | 0.1% |
| Northern European | 35 | 0.1% |
| Norwegian | 151 | 0.5% |
| Pakistani | 44 | 0.1% |
| Panamanian | 10 | 0.0% |
| Peruvian | 30 | 0.1% |
| Polish | 144 | 0.5% |
| Portuguese | 7 | 0.0% |
| Puerto Rican | 41 | 0.1% |
| Russian | 16 | 0.1% |
| Salvadoran | 15 | 0.1% |
| Scandinavian | 34 | 0.1% |
| Scotch-Irish | 97 | 0.3% |
| Scottish | 223 | 0.7% |
| Slovak | 11 | 0.0% |
| South American | 70 | 0.2% |
| Spaniard | 20 | 0.1% |
| Spanish | 123 | 0.4% |
| Sri Lankan | 18 | 0.1% |
| Subsaharan African | 83 | 0.3% |
| Swedish | 44 | 0.1% |
| Thai | 66 | 0.2% |
| Ukrainian | 16 | 0.1% |
| Welsh | 5 | 0.0% | View All 64 Rows |
Immigrants in Kleberg County
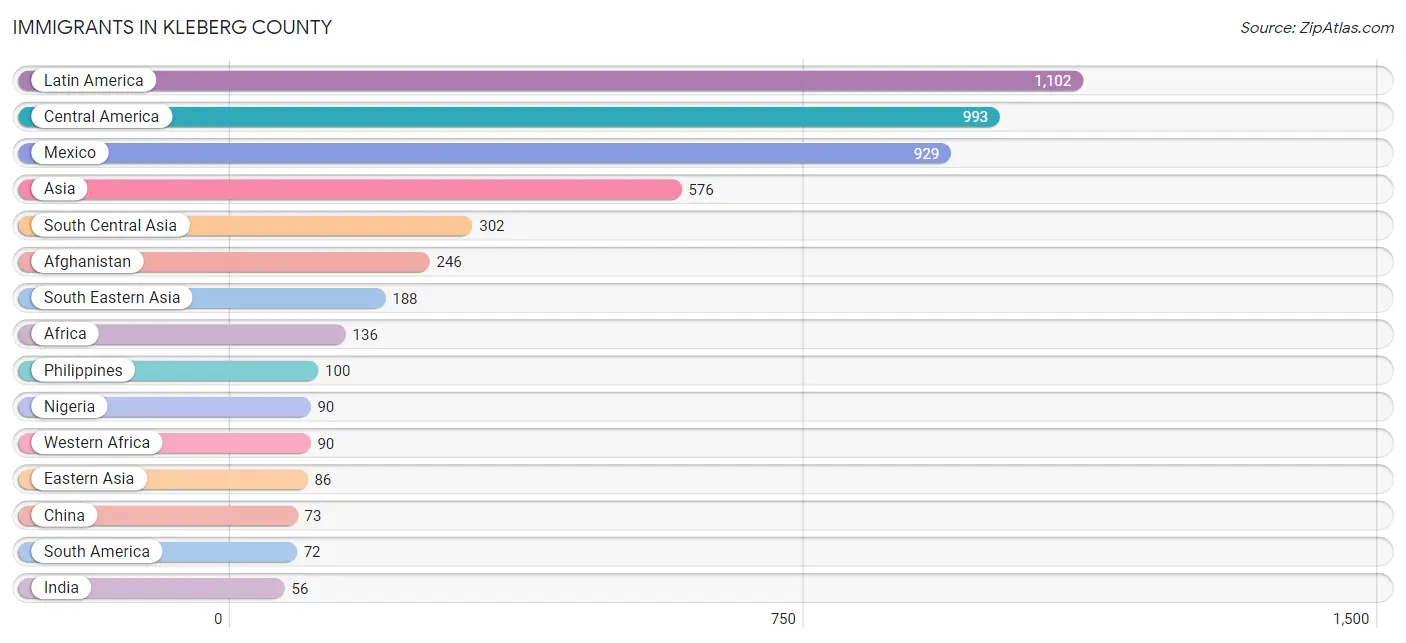
The most numerous immigrant groups reported in Kleberg County came from Latin America (1,102 | 3.6%), Central America (993 | 3.2%), Mexico (929 | 3.0%), Asia (576 | 1.9%), and South Central Asia (302 | 1.0%), together accounting for 12.7% of all Kleberg County residents.
| Immigration Origin | # Population | % Population |
| Afghanistan | 246 | 0.8% |
| Africa | 136 | 0.4% |
| Asia | 576 | 1.9% |
| Bolivia | 7 | 0.0% |
| Brazil | 35 | 0.1% |
| Canada | 21 | 0.1% |
| Caribbean | 37 | 0.1% |
| Central America | 993 | 3.2% |
| China | 73 | 0.2% |
| Cuba | 9 | 0.0% |
| Dominican Republic | 18 | 0.1% |
| Eastern Asia | 86 | 0.3% |
| El Salvador | 15 | 0.1% |
| Europe | 49 | 0.2% |
| Germany | 49 | 0.2% |
| Guatemala | 5 | 0.0% |
| Honduras | 44 | 0.1% |
| India | 56 | 0.2% |
| Indonesia | 44 | 0.1% |
| Jamaica | 10 | 0.0% |
| Japan | 13 | 0.0% |
| Latin America | 1,102 | 3.6% |
| Mexico | 929 | 3.0% |
| Nigeria | 90 | 0.3% |
| Peru | 30 | 0.1% |
| Philippines | 100 | 0.3% |
| South America | 72 | 0.2% |
| South Central Asia | 302 | 1.0% |
| South Eastern Asia | 188 | 0.6% |
| Taiwan | 12 | 0.0% |
| Thailand | 44 | 0.1% |
| Western Africa | 90 | 0.3% |
| Western Europe | 49 | 0.2% | View All 33 Rows |
Sex and Age in Kleberg County
Sex and Age in Kleberg County
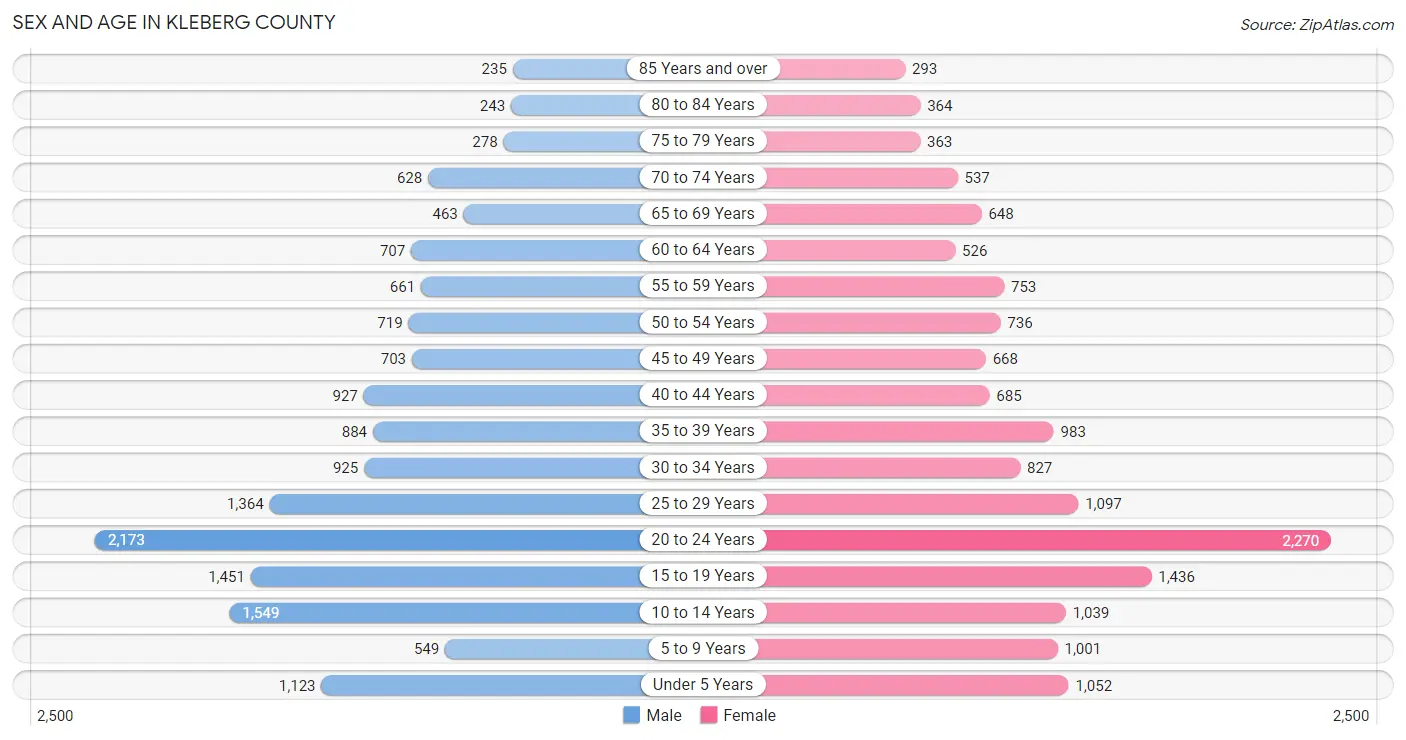
The most populous age groups in Kleberg County are 20 to 24 Years (2,173 | 14.0%) for men and 20 to 24 Years (2,270 | 14.9%) for women.
| Age Bracket | Male | Female |
| Under 5 Years | 1,123 (7.2%) | 1,052 (6.9%) |
| 5 to 9 Years | 549 (3.5%) | 1,001 (6.6%) |
| 10 to 14 Years | 1,549 (9.9%) | 1,039 (6.8%) |
| 15 to 19 Years | 1,451 (9.3%) | 1,436 (9.4%) |
| 20 to 24 Years | 2,173 (14.0%) | 2,270 (14.9%) |
| 25 to 29 Years | 1,364 (8.7%) | 1,097 (7.2%) |
| 30 to 34 Years | 925 (5.9%) | 827 (5.4%) |
| 35 to 39 Years | 884 (5.7%) | 983 (6.4%) |
| 40 to 44 Years | 927 (5.9%) | 685 (4.5%) |
| 45 to 49 Years | 703 (4.5%) | 668 (4.4%) |
| 50 to 54 Years | 719 (4.6%) | 736 (4.8%) |
| 55 to 59 Years | 661 (4.2%) | 753 (4.9%) |
| 60 to 64 Years | 707 (4.5%) | 526 (3.4%) |
| 65 to 69 Years | 463 (3.0%) | 648 (4.2%) |
| 70 to 74 Years | 628 (4.0%) | 537 (3.5%) |
| 75 to 79 Years | 278 (1.8%) | 363 (2.4%) |
| 80 to 84 Years | 243 (1.6%) | 364 (2.4%) |
| 85 Years and over | 235 (1.5%) | 293 (1.9%) |
| Total | 15,582 (100.0%) | 15,278 (100.0%) |
Families and Households in Kleberg County
Median Family Size in Kleberg County
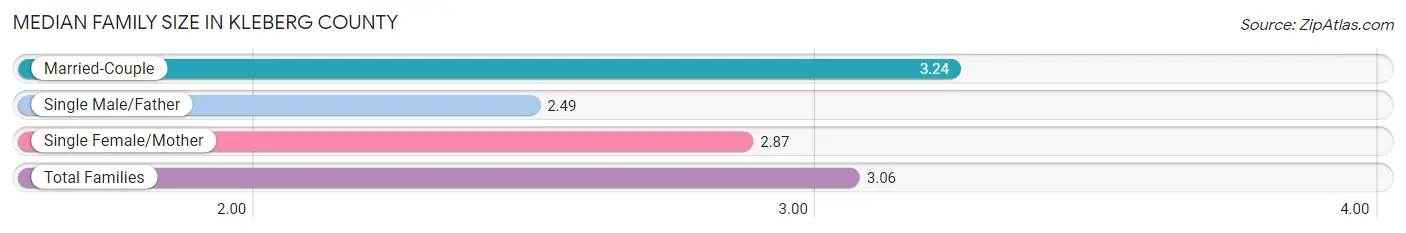
The median family size in Kleberg County is 3.06 persons per family, with married-couple families (4,445 | 62.2%) accounting for the largest median family size of 3.24 persons per family. On the other hand, single male/father families (698 | 9.8%) represent the smallest median family size with 2.49 persons per family.
| Family Type | # Families | Family Size |
| Married-Couple | 4,445 (62.2%) | 3.24 |
| Single Male/Father | 698 (9.8%) | 2.49 |
| Single Female/Mother | 1,999 (28.0%) | 2.87 |
| Total Families | 7,142 (100.0%) | 3.06 |
Median Household Size in Kleberg County
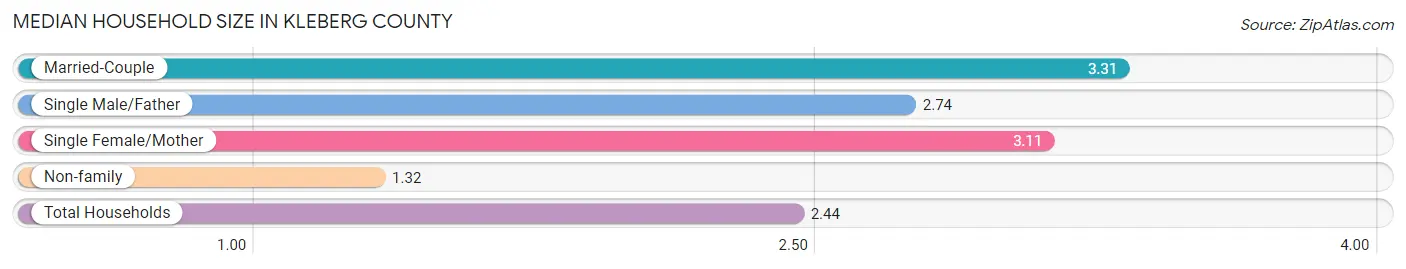
The median household size in Kleberg County is 2.44 persons per household, with married-couple households (4,445 | 37.3%) accounting for the largest median household size of 3.31 persons per household. non-family households (4,773 | 40.1%) represent the smallest median household size with 1.32 persons per household.
| Household Type | # Households | Household Size |
| Married-Couple | 4,445 (37.3%) | 3.31 |
| Single Male/Father | 698 (5.9%) | 2.74 |
| Single Female/Mother | 1,999 (16.8%) | 3.11 |
| Non-family | 4,773 (40.1%) | 1.32 |
| Total Households | 11,915 (100.0%) | 2.44 |
Household Size by Marriage Status in Kleberg County
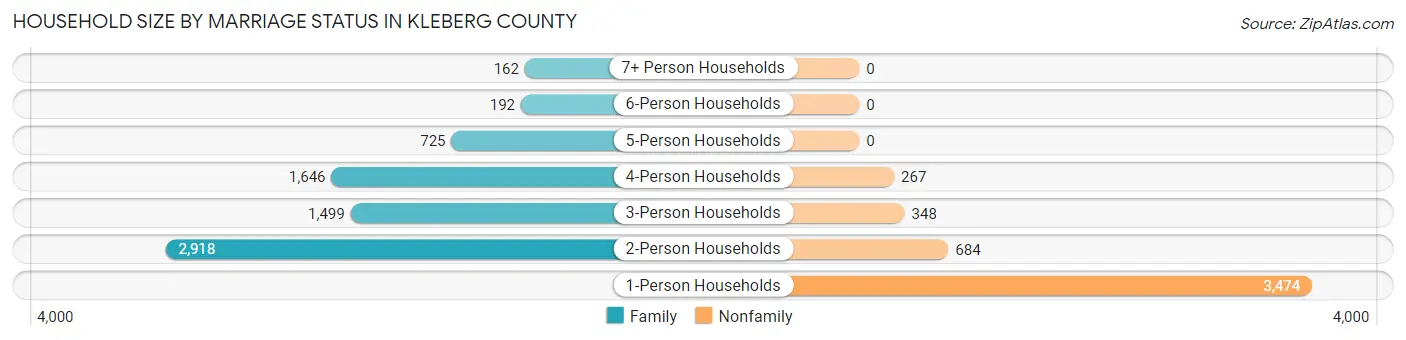
Out of a total of 11,915 households in Kleberg County, 7,142 (59.9%) are family households, while 4,773 (40.1%) are nonfamily households. The most numerous type of family households are 2-person households, comprising 2,918, and the most common type of nonfamily households are 1-person households, comprising 3,474.
| Household Size | Family Households | Nonfamily Households |
| 1-Person Households | - | 3,474 (29.2%) |
| 2-Person Households | 2,918 (24.5%) | 684 (5.7%) |
| 3-Person Households | 1,499 (12.6%) | 348 (2.9%) |
| 4-Person Households | 1,646 (13.8%) | 267 (2.2%) |
| 5-Person Households | 725 (6.1%) | 0 (0.0%) |
| 6-Person Households | 192 (1.6%) | 0 (0.0%) |
| 7+ Person Households | 162 (1.4%) | 0 (0.0%) |
| Total | 7,142 (59.9%) | 4,773 (40.1%) |
Female Fertility in Kleberg County
Fertility by Age in Kleberg County
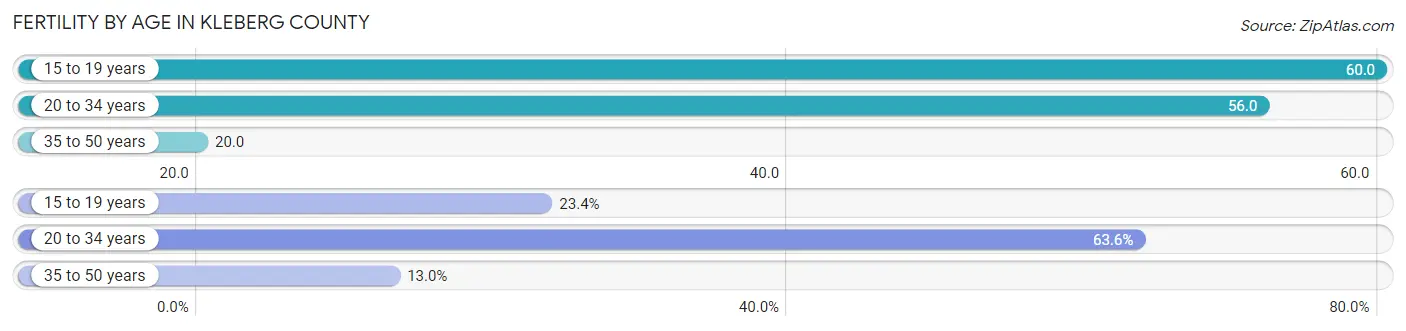
Average fertility rate in Kleberg County is 46.0 births per 1,000 women. Women in the age bracket of 15 to 19 years have the highest fertility rate with 60.0 births per 1,000 women. Women in the age bracket of 20 to 34 years acount for 63.6% of all women with births.
| Age Bracket | Women with Births | Births / 1,000 Women |
| 15 to 19 years | 86 (23.4%) | 60.0 |
| 20 to 34 years | 234 (63.6%) | 56.0 |
| 35 to 50 years | 48 (13.0%) | 20.0 |
| Total | 368 (100.0%) | 46.0 |
Fertility by Age by Marriage Status in Kleberg County
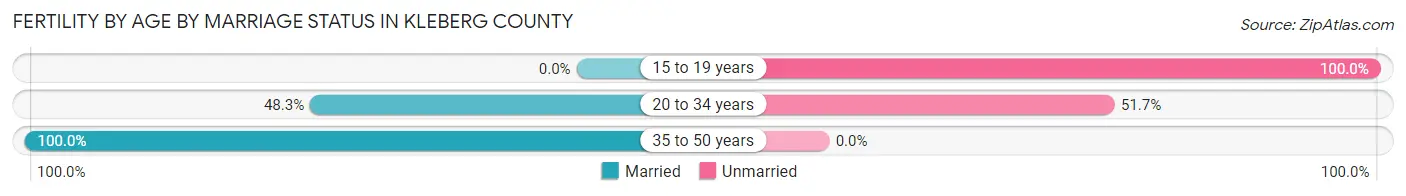
43.8% of women with births (368) in Kleberg County are married. The highest percentage of unmarried women with births falls into 15 to 19 years age bracket with 100.0% of them unmarried at the time of birth, while the lowest percentage of unmarried women with births belong to 35 to 50 years age bracket with 0.0% of them unmarried.
| Age Bracket | Married | Unmarried |
| 15 to 19 years | 0 (0.0%) | 86 (100.0%) |
| 20 to 34 years | 113 (48.3%) | 121 (51.7%) |
| 35 to 50 years | 48 (100.0%) | 0 (0.0%) |
| Total | 161 (43.8%) | 207 (56.2%) |
Fertility by Education in Kleberg County
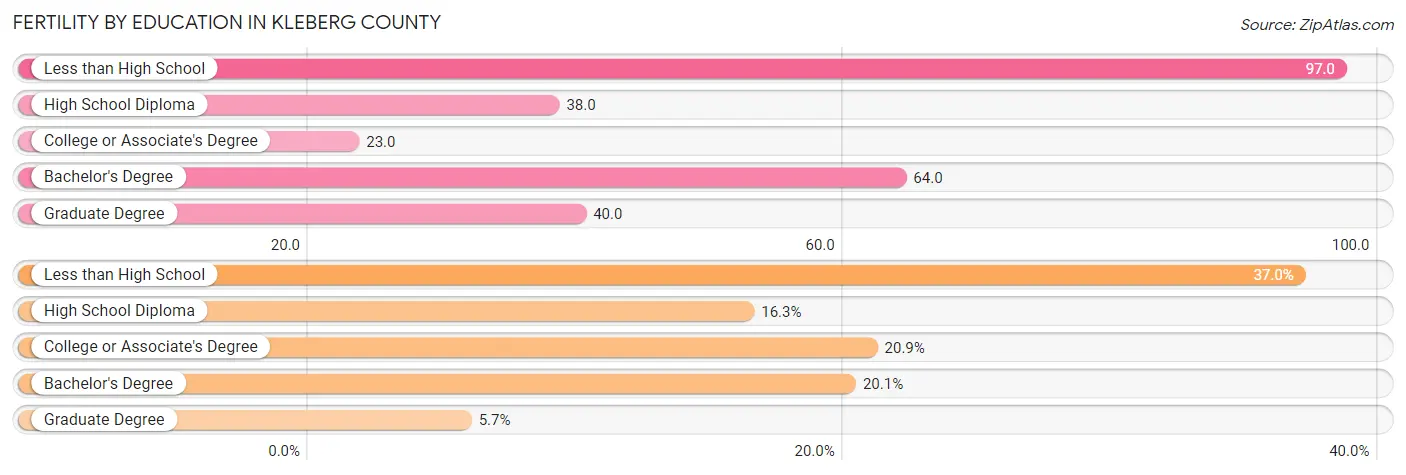
Average fertility rate in Kleberg County is 46.0 births per 1,000 women. Women with the education attainment of less than high school have the highest fertility rate of 97.0 births per 1,000 women, while women with the education attainment of college or associate's degree have the lowest fertility at 23.0 births per 1,000 women. Women with the education attainment of less than high school represent 37.0% of all women with births.
| Educational Attainment | Women with Births | Births / 1,000 Women |
| Less than High School | 136 (37.0%) | 97.0 |
| High School Diploma | 60 (16.3%) | 38.0 |
| College or Associate's Degree | 77 (20.9%) | 23.0 |
| Bachelor's Degree | 74 (20.1%) | 64.0 |
| Graduate Degree | 21 (5.7%) | 40.0 |
| Total | 368 (100.0%) | 46.0 |
Fertility by Education by Marriage Status in Kleberg County
56.2% of women with births in Kleberg County are unmarried. Women with the educational attainment of bachelor's degree are most likely to be married with 100.0% of them married at childbirth, while women with the educational attainment of high school diploma are least likely to be married with 85.0% of them unmarried at childbirth.
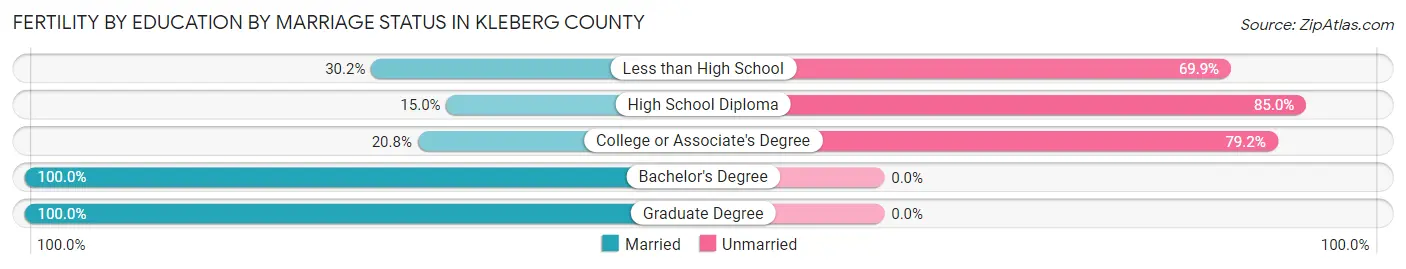
| Educational Attainment | Married | Unmarried |
| Less than High School | 41 (30.1%) | 95 (69.9%) |
| High School Diploma | 9 (15.0%) | 51 (85.0%) |
| College or Associate's Degree | 16 (20.8%) | 61 (79.2%) |
| Bachelor's Degree | 74 (100.0%) | 0 (0.0%) |
| Graduate Degree | 21 (100.0%) | 0 (0.0%) |
| Total | 161 (43.8%) | 207 (56.2%) |
Employment Characteristics in Kleberg County
Employment by Class of Employer in Kleberg County
Among the 13,086 employed individuals in Kleberg County, private company employees (7,839 | 59.9%), state government employees (1,540 | 11.8%), and local government employees (1,080 | 8.3%) make up the most common classes of employment.
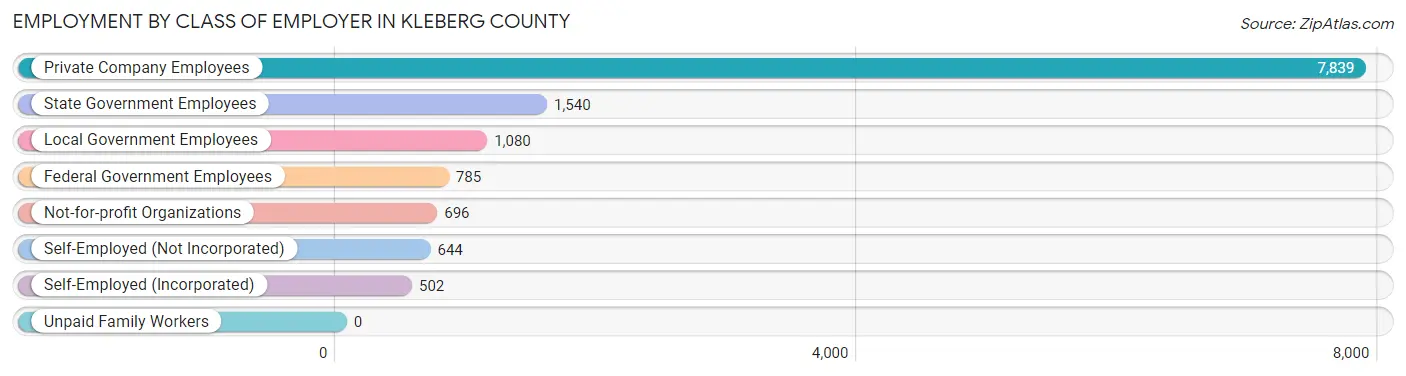
| Employer Class | # Employees | % Employees |
| Private Company Employees | 7,839 | 59.9% |
| Self-Employed (Incorporated) | 502 | 3.8% |
| Self-Employed (Not Incorporated) | 644 | 4.9% |
| Not-for-profit Organizations | 696 | 5.3% |
| Local Government Employees | 1,080 | 8.3% |
| State Government Employees | 1,540 | 11.8% |
| Federal Government Employees | 785 | 6.0% |
| Unpaid Family Workers | 0 | 0.0% |
| Total | 13,086 | 100.0% |
Employment Status by Age in Kleberg County
According to the labor force statistics for Kleberg County, out of the total population over 16 years of age (24,204), 59.3% or 14,353 individuals are in the labor force, with 7.5% or 1,076 of them unemployed. The age group with the highest labor force participation rate is 35 to 44 years, with 82.1% or 2,856 individuals in the labor force. Within the labor force, the 16 to 19 years age range has the highest percentage of unemployed individuals, with 27.0% or 214 of them being unemployed.
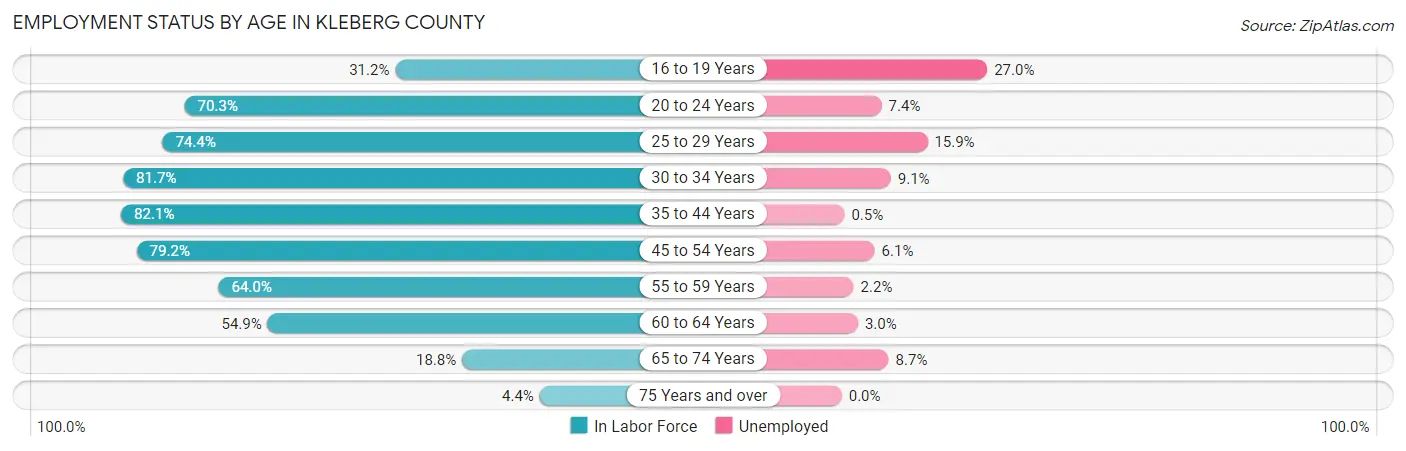
| Age Bracket | In Labor Force | Unemployed |
| 16 to 19 Years | 794 (31.2%) | 214 (27.0%) |
| 20 to 24 Years | 3,123 (70.3%) | 231 (7.4%) |
| 25 to 29 Years | 1,831 (74.4%) | 291 (15.9%) |
| 30 to 34 Years | 1,431 (81.7%) | 130 (9.1%) |
| 35 to 44 Years | 2,856 (82.1%) | 14 (0.5%) |
| 45 to 54 Years | 2,238 (79.2%) | 137 (6.1%) |
| 55 to 59 Years | 905 (64.0%) | 20 (2.2%) |
| 60 to 64 Years | 677 (54.9%) | 20 (3.0%) |
| 65 to 74 Years | 428 (18.8%) | 37 (8.7%) |
| 75 Years and over | 78 (4.4%) | 0 (0.0%) |
| Total | 14,353 (59.3%) | 1,076 (7.5%) |
Employment Status by Educational Attainment in Kleberg County
According to labor force statistics for Kleberg County, 75.5% of individuals (9,940) out of the total population between 25 and 64 years of age (13,165) are in the labor force, with 6.0% or 596 of them being unemployed. The group with the highest labor force participation rate are those with the educational attainment of bachelor's degree or higher, with 83.5% or 2,746 individuals in the labor force. Within the labor force, individuals with high school diploma education have the highest percentage of unemployment, with 9.9% or 330 of them being unemployed.
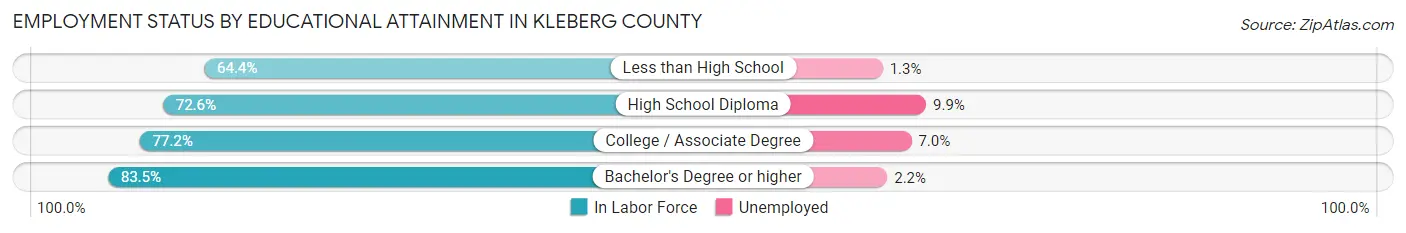
| Educational Attainment | In Labor Force | Unemployed |
| Less than High School | 1,119 (64.4%) | 23 (1.3%) |
| High School Diploma | 3,337 (72.6%) | 455 (9.9%) |
| College / Associate Degree | 2,734 (77.2%) | 248 (7.0%) |
| Bachelor's Degree or higher | 2,746 (83.5%) | 72 (2.2%) |
| Total | 9,940 (75.5%) | 790 (6.0%) |
Employment Occupations by Sex in Kleberg County
Management, Business, Science and Arts Occupations
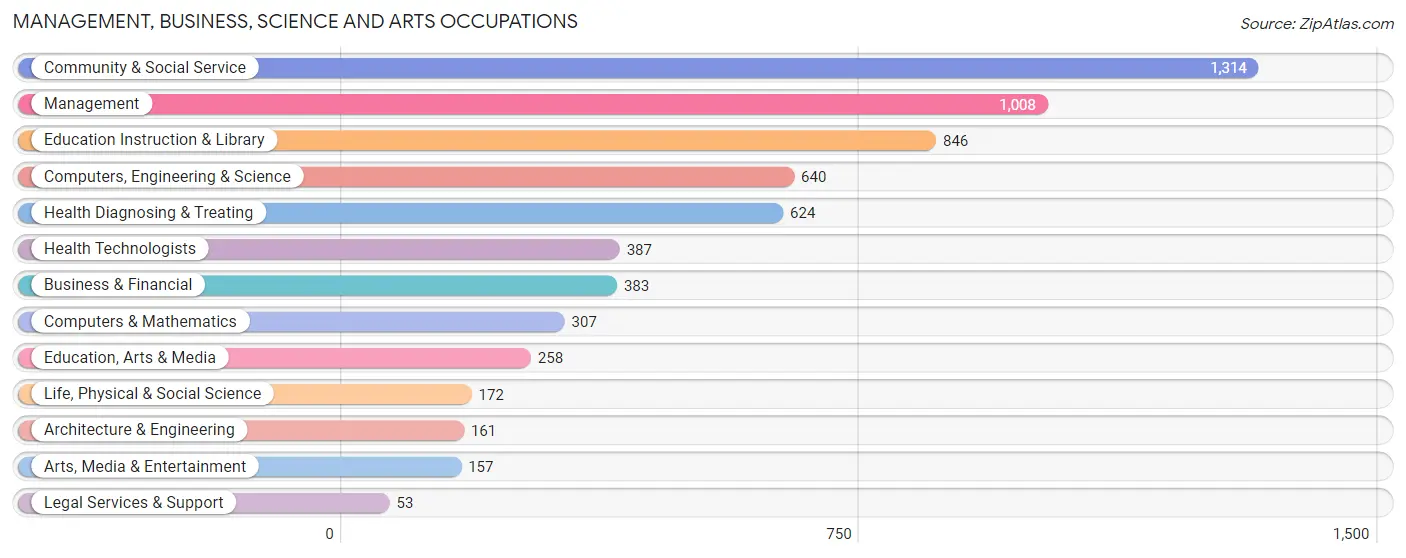
The most common Management, Business, Science and Arts occupations in Kleberg County are Community & Social Service (1,314 | 10.1%), Management (1,008 | 7.8%), Education Instruction & Library (846 | 6.5%), Computers, Engineering & Science (640 | 4.9%), and Health Diagnosing & Treating (624 | 4.8%).
Management, Business, Science and Arts Occupations by Sex
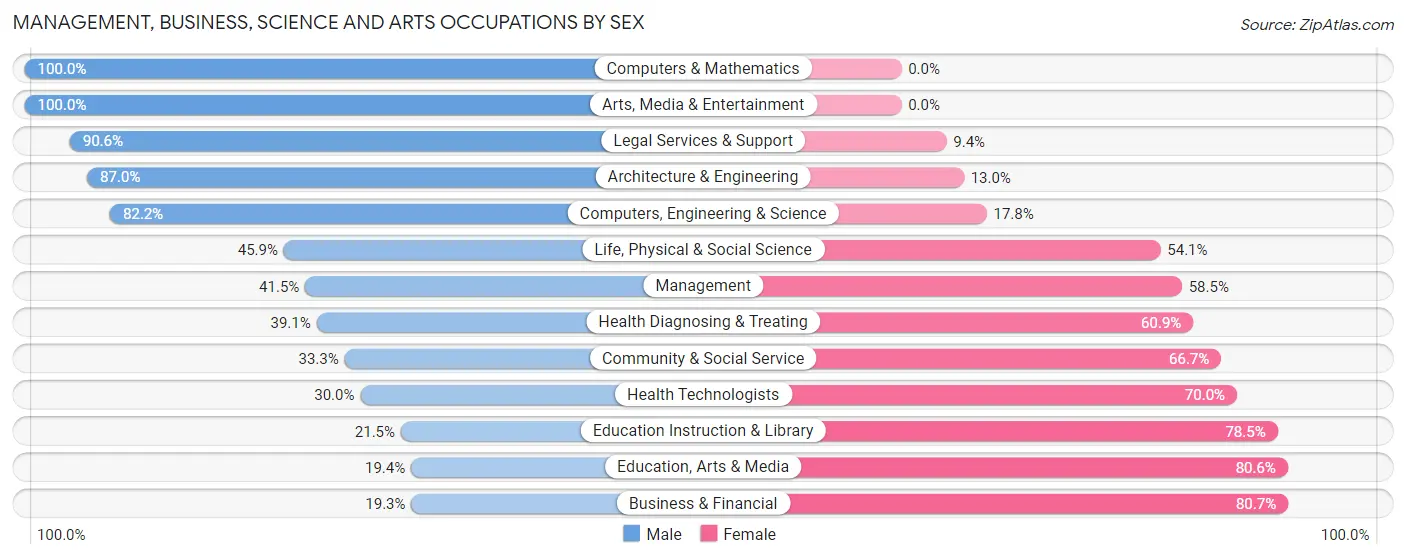
Within the Management, Business, Science and Arts occupations in Kleberg County, the most male-oriented occupations are Computers & Mathematics (100.0%), Arts, Media & Entertainment (100.0%), and Legal Services & Support (90.6%), while the most female-oriented occupations are Business & Financial (80.7%), Education, Arts & Media (80.6%), and Education Instruction & Library (78.5%).
| Occupation | Male | Female |
| Management | 418 (41.5%) | 590 (58.5%) |
| Business & Financial | 74 (19.3%) | 309 (80.7%) |
| Computers, Engineering & Science | 526 (82.2%) | 114 (17.8%) |
| Computers & Mathematics | 307 (100.0%) | 0 (0.0%) |
| Architecture & Engineering | 140 (87.0%) | 21 (13.0%) |
| Life, Physical & Social Science | 79 (45.9%) | 93 (54.1%) |
| Community & Social Service | 437 (33.3%) | 877 (66.7%) |
| Education, Arts & Media | 50 (19.4%) | 208 (80.6%) |
| Legal Services & Support | 48 (90.6%) | 5 (9.4%) |
| Education Instruction & Library | 182 (21.5%) | 664 (78.5%) |
| Arts, Media & Entertainment | 157 (100.0%) | 0 (0.0%) |
| Health Diagnosing & Treating | 244 (39.1%) | 380 (60.9%) |
| Health Technologists | 116 (30.0%) | 271 (70.0%) |
| Total (Category) | 1,699 (42.8%) | 2,270 (57.2%) |
| Total (Overall) | 6,889 (53.0%) | 6,101 (47.0%) |
Services Occupations
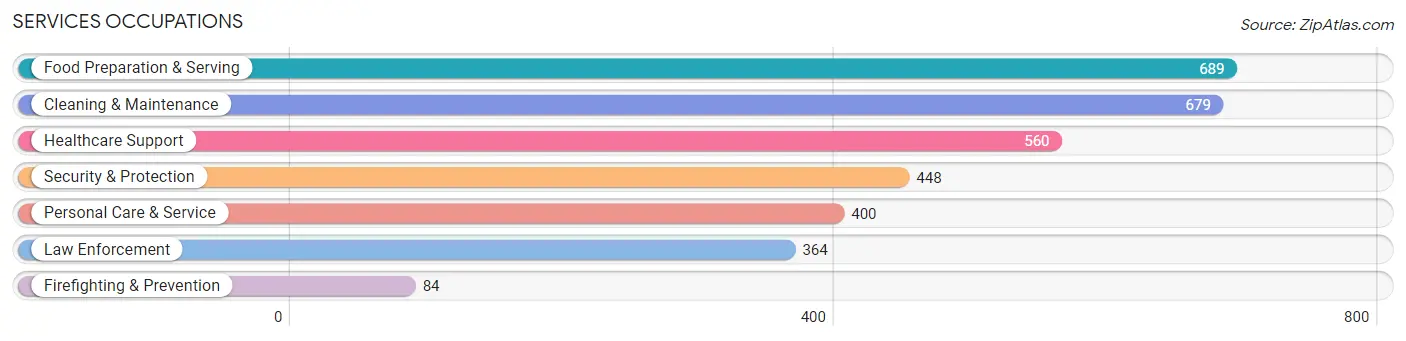
The most common Services occupations in Kleberg County are Food Preparation & Serving (689 | 5.3%), Cleaning & Maintenance (679 | 5.2%), Healthcare Support (560 | 4.3%), Security & Protection (448 | 3.5%), and Personal Care & Service (400 | 3.1%).
Services Occupations by Sex
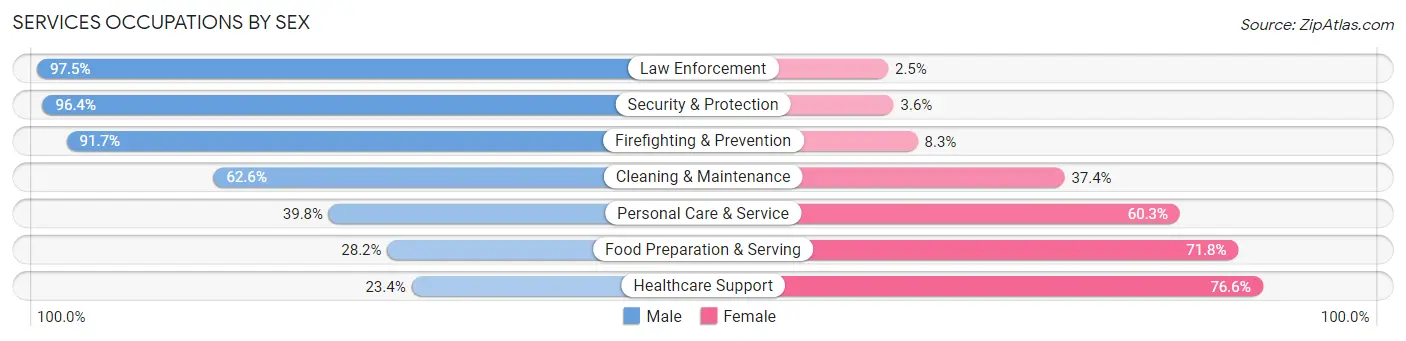
Within the Services occupations in Kleberg County, the most male-oriented occupations are Law Enforcement (97.5%), Security & Protection (96.4%), and Firefighting & Prevention (91.7%), while the most female-oriented occupations are Healthcare Support (76.6%), Food Preparation & Serving (71.8%), and Personal Care & Service (60.3%).
| Occupation | Male | Female |
| Healthcare Support | 131 (23.4%) | 429 (76.6%) |
| Security & Protection | 432 (96.4%) | 16 (3.6%) |
| Firefighting & Prevention | 77 (91.7%) | 7 (8.3%) |
| Law Enforcement | 355 (97.5%) | 9 (2.5%) |
| Food Preparation & Serving | 194 (28.2%) | 495 (71.8%) |
| Cleaning & Maintenance | 425 (62.6%) | 254 (37.4%) |
| Personal Care & Service | 159 (39.8%) | 241 (60.3%) |
| Total (Category) | 1,341 (48.3%) | 1,435 (51.7%) |
| Total (Overall) | 6,889 (53.0%) | 6,101 (47.0%) |
Sales and Office Occupations
The most common Sales and Office occupations in Kleberg County are Sales & Related (1,423 | 11.0%), and Office & Administration (1,352 | 10.4%).
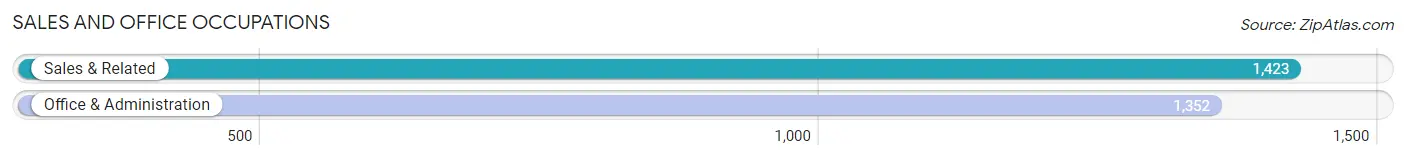
Sales and Office Occupations by Sex

| Occupation | Male | Female |
| Sales & Related | 535 (37.6%) | 888 (62.4%) |
| Office & Administration | 244 (18.0%) | 1,108 (82.0%) |
| Total (Category) | 779 (28.1%) | 1,996 (71.9%) |
| Total (Overall) | 6,889 (53.0%) | 6,101 (47.0%) |
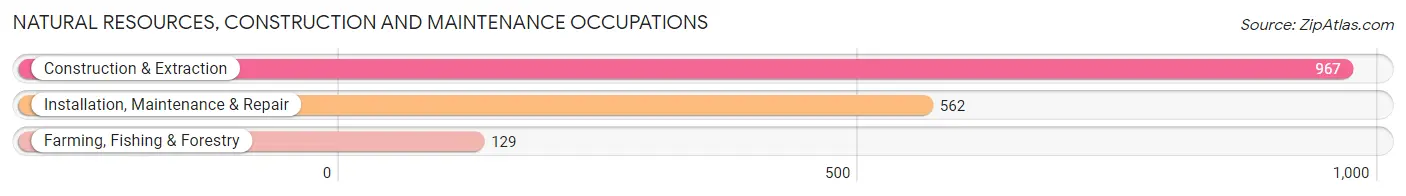
Natural Resources, Construction and Maintenance Occupations
The most common Natural Resources, Construction and Maintenance occupations in Kleberg County are Construction & Extraction (967 | 7.4%), Installation, Maintenance & Repair (562 | 4.3%), and Farming, Fishing & Forestry (129 | 1.0%).
Natural Resources, Construction and Maintenance Occupations by Sex
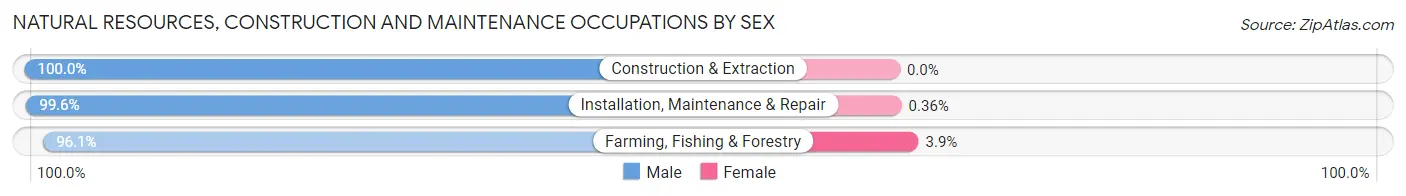
| Occupation | Male | Female |
| Farming, Fishing & Forestry | 124 (96.1%) | 5 (3.9%) |
| Construction & Extraction | 967 (100.0%) | 0 (0.0%) |
| Installation, Maintenance & Repair | 560 (99.6%) | 2 (0.4%) |
| Total (Category) | 1,651 (99.6%) | 7 (0.4%) |
| Total (Overall) | 6,889 (53.0%) | 6,101 (47.0%) |
Production, Transportation and Moving Occupations
The most common Production, Transportation and Moving occupations in Kleberg County are Material Moving (697 | 5.4%), Transportation (586 | 4.5%), and Production (529 | 4.1%).
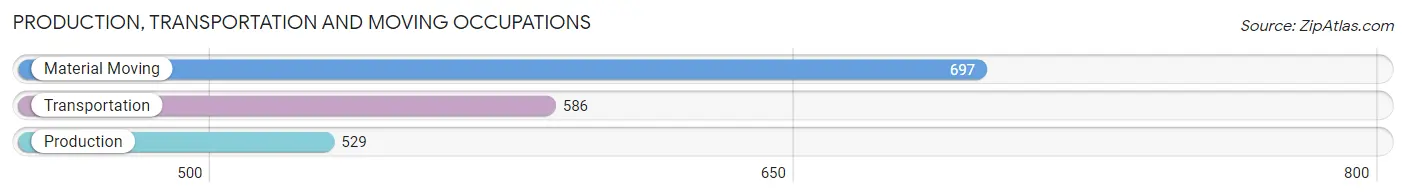
Production, Transportation and Moving Occupations by Sex
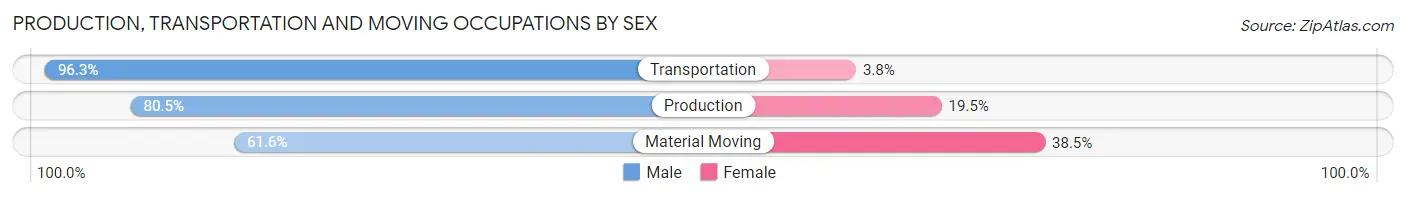
| Occupation | Male | Female |
| Production | 426 (80.5%) | 103 (19.5%) |
| Transportation | 564 (96.3%) | 22 (3.7%) |
| Material Moving | 429 (61.6%) | 268 (38.5%) |
| Total (Category) | 1,419 (78.3%) | 393 (21.7%) |
| Total (Overall) | 6,889 (53.0%) | 6,101 (47.0%) |
Employment Industries by Sex in Kleberg County
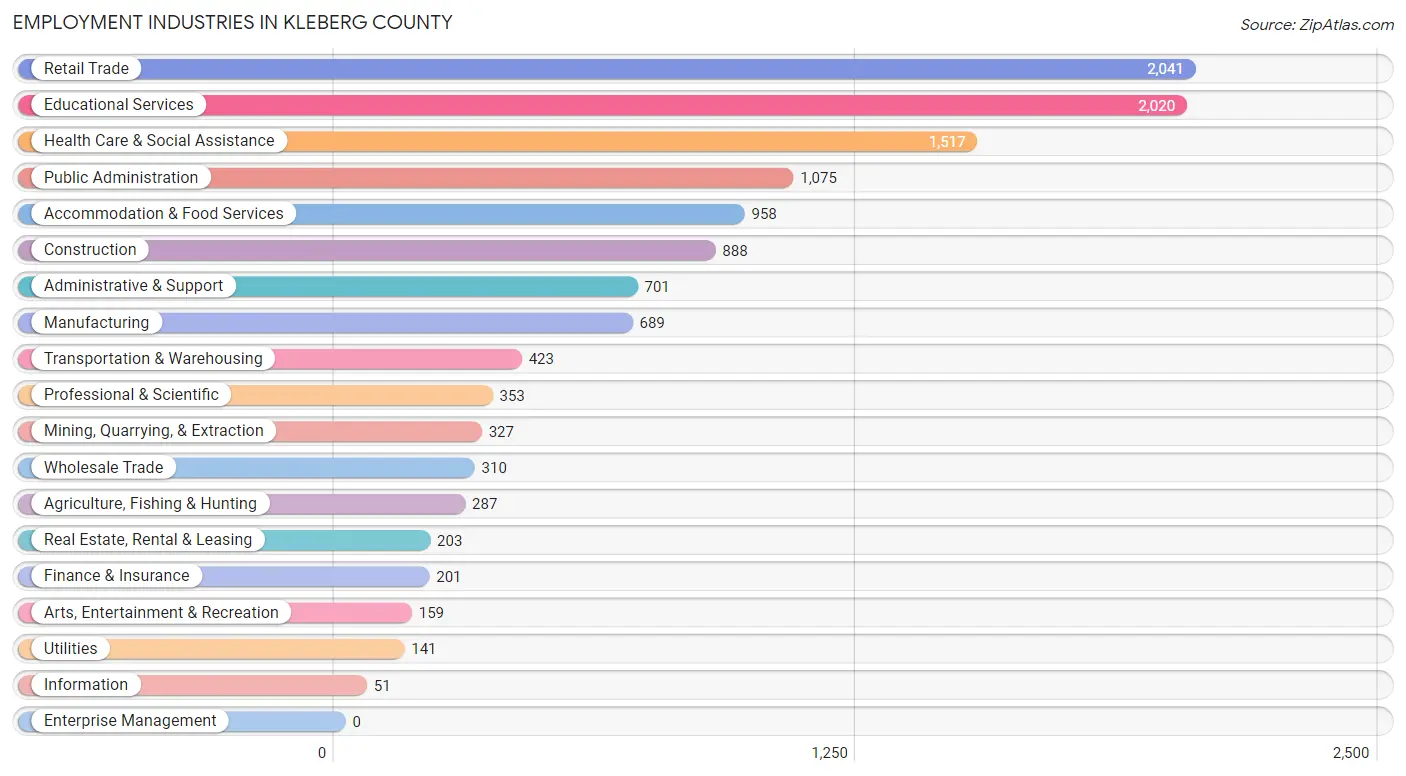
Employment Industries in Kleberg County
The major employment industries in Kleberg County include Retail Trade (2,041 | 15.7%), Educational Services (2,020 | 15.5%), Health Care & Social Assistance (1,517 | 11.7%), Public Administration (1,075 | 8.3%), and Accommodation & Food Services (958 | 7.4%).
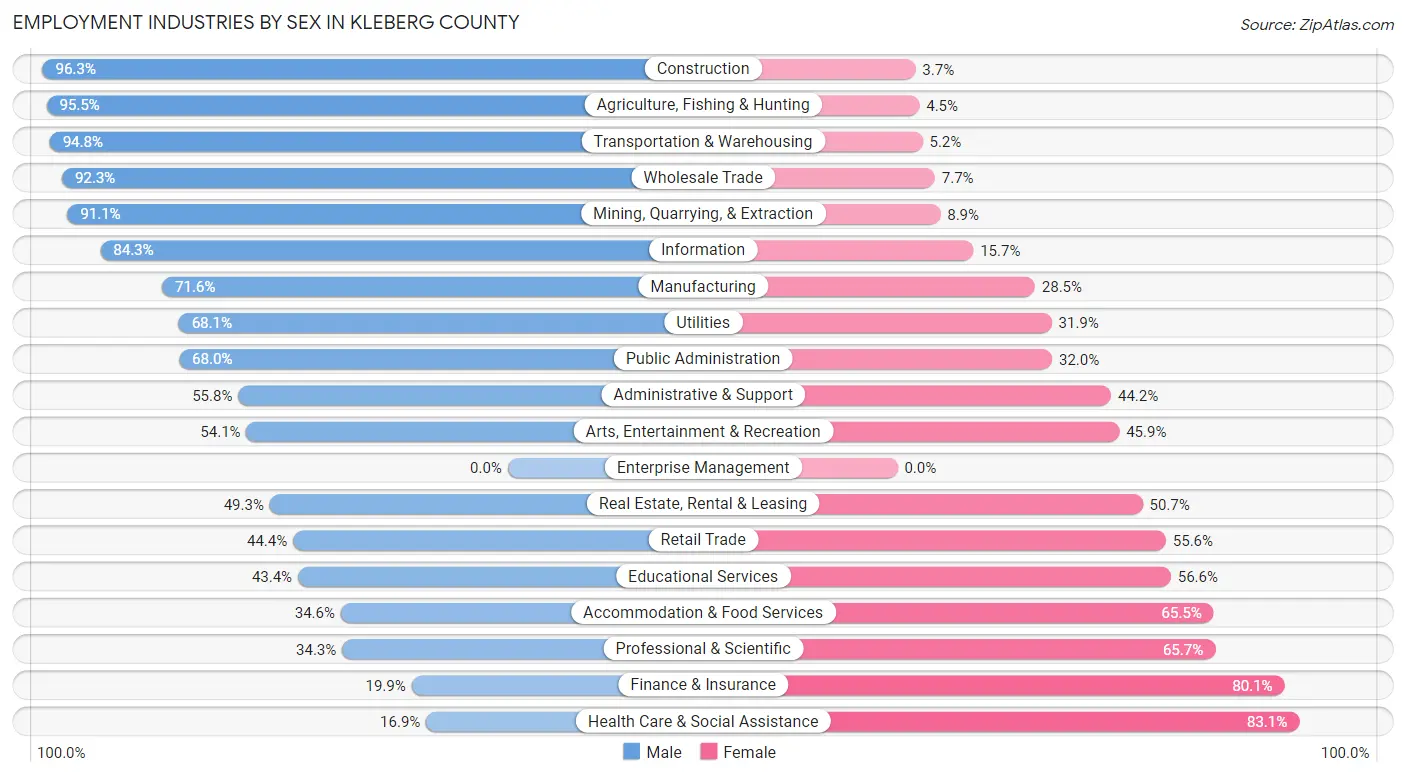
Employment Industries by Sex in Kleberg County
The Kleberg County industries that see more men than women are Construction (96.3%), Agriculture, Fishing & Hunting (95.5%), and Transportation & Warehousing (94.8%), whereas the industries that tend to have a higher number of women are Health Care & Social Assistance (83.1%), Finance & Insurance (80.1%), and Professional & Scientific (65.7%).
| Industry | Male | Female |
| Agriculture, Fishing & Hunting | 274 (95.5%) | 13 (4.5%) |
| Mining, Quarrying, & Extraction | 298 (91.1%) | 29 (8.9%) |
| Construction | 855 (96.3%) | 33 (3.7%) |
| Manufacturing | 493 (71.6%) | 196 (28.4%) |
| Wholesale Trade | 286 (92.3%) | 24 (7.7%) |
| Retail Trade | 907 (44.4%) | 1,134 (55.6%) |
| Transportation & Warehousing | 401 (94.8%) | 22 (5.2%) |
| Utilities | 96 (68.1%) | 45 (31.9%) |
| Information | 43 (84.3%) | 8 (15.7%) |
| Finance & Insurance | 40 (19.9%) | 161 (80.1%) |
| Real Estate, Rental & Leasing | 100 (49.3%) | 103 (50.7%) |
| Professional & Scientific | 121 (34.3%) | 232 (65.7%) |
| Enterprise Management | 0 (0.0%) | 0 (0.0%) |
| Administrative & Support | 391 (55.8%) | 310 (44.2%) |
| Educational Services | 877 (43.4%) | 1,143 (56.6%) |
| Health Care & Social Assistance | 256 (16.9%) | 1,261 (83.1%) |
| Arts, Entertainment & Recreation | 86 (54.1%) | 73 (45.9%) |
| Accommodation & Food Services | 331 (34.5%) | 627 (65.4%) |
| Public Administration | 731 (68.0%) | 344 (32.0%) |
| Total | 6,889 (53.0%) | 6,101 (47.0%) |
Education in Kleberg County
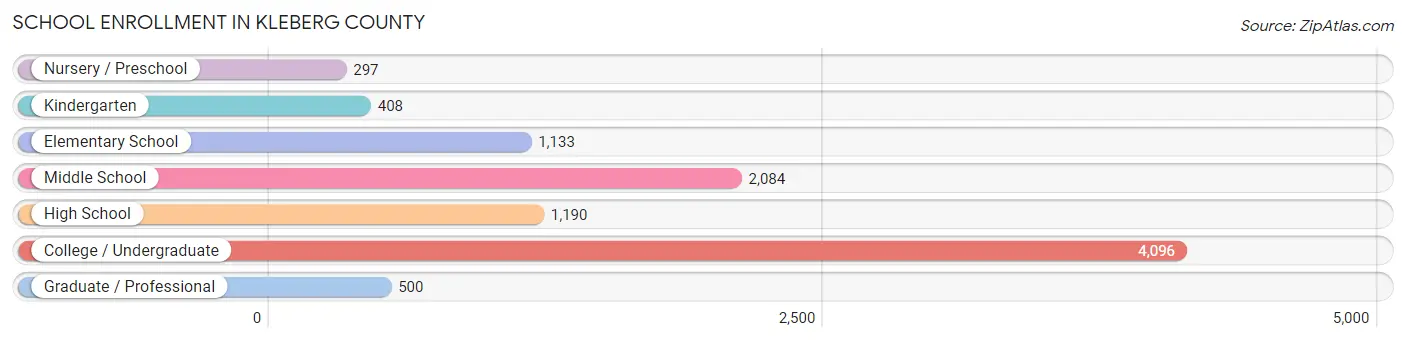
School Enrollment in Kleberg County
The most common levels of schooling among the 9,708 students in Kleberg County are college / undergraduate (4,096 | 42.2%), middle school (2,084 | 21.5%), and high school (1,190 | 12.3%).
| School Level | # Students | % Students |
| Nursery / Preschool | 297 | 3.1% |
| Kindergarten | 408 | 4.2% |
| Elementary School | 1,133 | 11.7% |
| Middle School | 2,084 | 21.5% |
| High School | 1,190 | 12.3% |
| College / Undergraduate | 4,096 | 42.2% |
| Graduate / Professional | 500 | 5.1% |
| Total | 9,708 | 100.0% |
School Enrollment by Age by Funding Source in Kleberg County
Out of a total of 9,708 students who are enrolled in schools in Kleberg County, 796 (8.2%) attend a private institution, while the remaining 8,912 (91.8%) are enrolled in public schools. The age group of 3 to 4 year olds has the highest likelihood of being enrolled in private schools, with 87 (27.0% in the age bracket) enrolled. Conversely, the age group of 15 to 17 year olds has the lowest likelihood of being enrolled in a private school, with 999 (98.4% in the age bracket) attending a public institution.
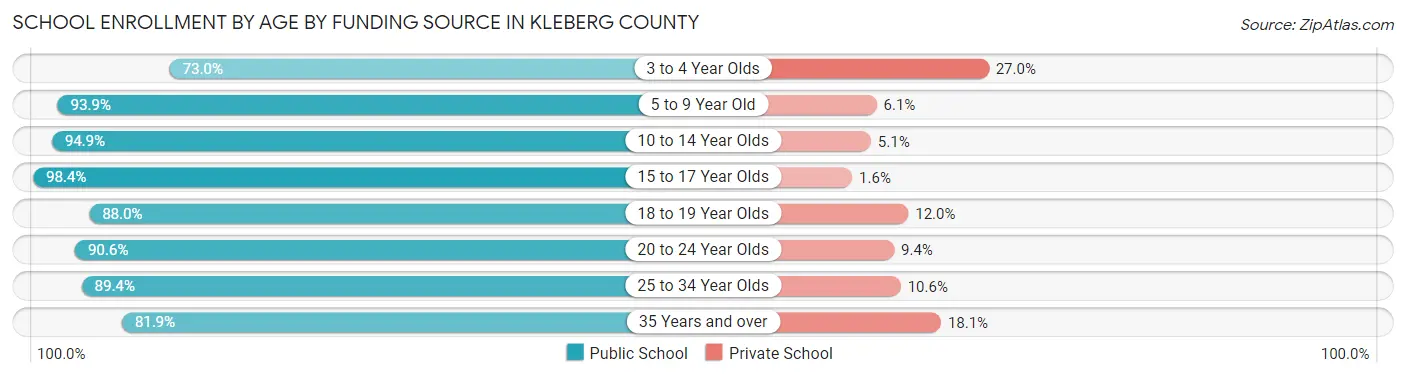
| Age Bracket | Public School | Private School |
| 3 to 4 Year Olds | 235 (73.0%) | 87 (27.0%) |
| 5 to 9 Year Old | 1,193 (93.9%) | 78 (6.1%) |
| 10 to 14 Year Olds | 2,228 (94.9%) | 119 (5.1%) |
| 15 to 17 Year Olds | 999 (98.4%) | 16 (1.6%) |
| 18 to 19 Year Olds | 1,162 (88.0%) | 159 (12.0%) |
| 20 to 24 Year Olds | 2,499 (90.6%) | 259 (9.4%) |
| 25 to 34 Year Olds | 479 (89.4%) | 57 (10.6%) |
| 35 Years and over | 113 (81.9%) | 25 (18.1%) |
| Total | 8,912 (91.8%) | 796 (8.2%) |
Educational Attainment by Field of Study in Kleberg County
Business (809 | 19.4%), education (688 | 16.5%), bio, nature & agricultural (422 | 10.1%), science & technology (392 | 9.4%), and arts & humanities (303 | 7.2%) are the most common fields of study among 4,179 individuals in Kleberg County who have obtained a bachelor's degree or higher.
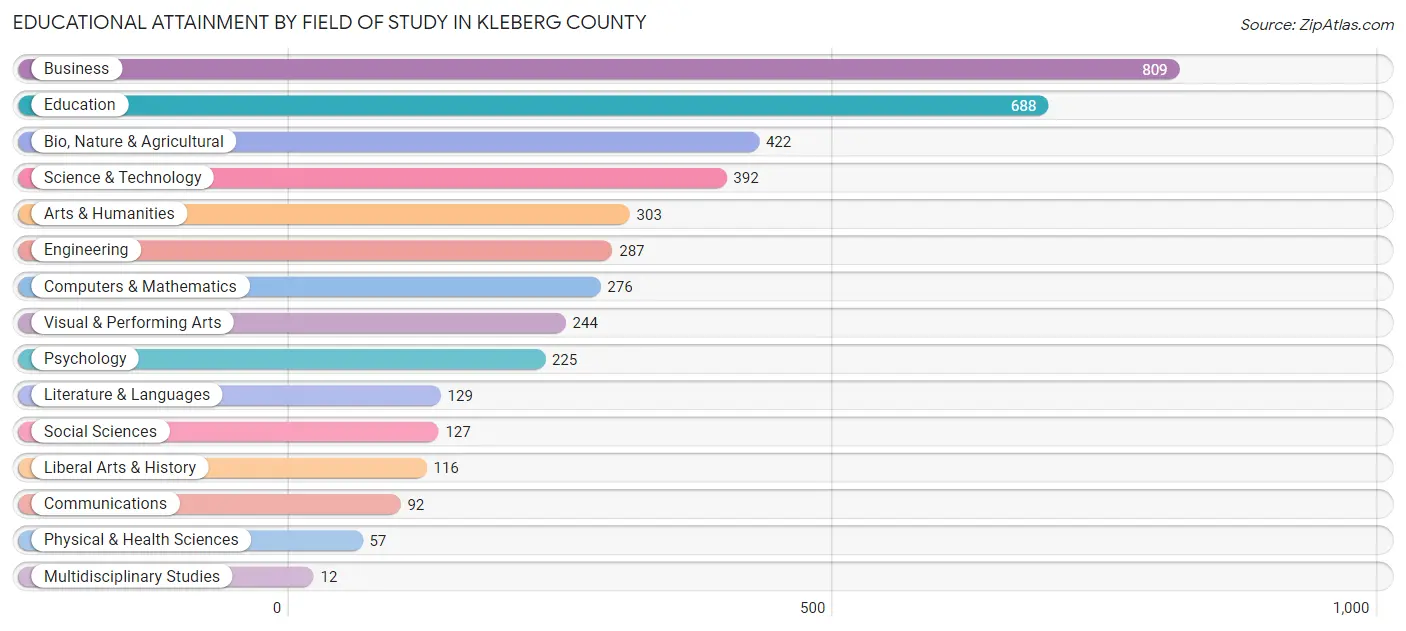
| Field of Study | # Graduates | % Graduates |
| Computers & Mathematics | 276 | 6.6% |
| Bio, Nature & Agricultural | 422 | 10.1% |
| Physical & Health Sciences | 57 | 1.4% |
| Psychology | 225 | 5.4% |
| Social Sciences | 127 | 3.0% |
| Engineering | 287 | 6.9% |
| Multidisciplinary Studies | 12 | 0.3% |
| Science & Technology | 392 | 9.4% |
| Business | 809 | 19.4% |
| Education | 688 | 16.5% |
| Literature & Languages | 129 | 3.1% |
| Liberal Arts & History | 116 | 2.8% |
| Visual & Performing Arts | 244 | 5.8% |
| Communications | 92 | 2.2% |
| Arts & Humanities | 303 | 7.2% |
| Total | 4,179 | 100.0% |
Transportation & Commute in Kleberg County
Vehicle Availability by Sex in Kleberg County
The most prevalent vehicle ownership categories in Kleberg County are males with 2 vehicles (2,983, accounting for 44.3%) and females with 2 vehicles (2,491, making up 50.6%).
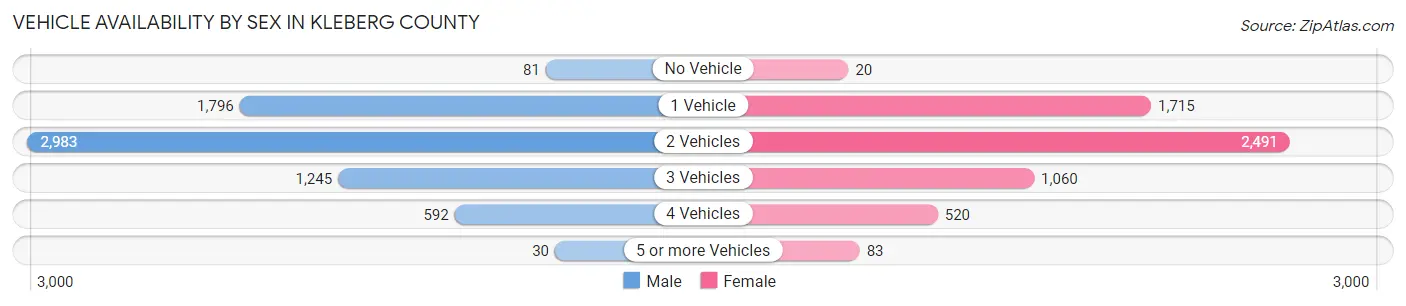
| Vehicles Available | Male | Female |
| No Vehicle | 81 (1.2%) | 20 (0.3%) |
| 1 Vehicle | 1,796 (26.7%) | 1,715 (29.1%) |
| 2 Vehicles | 2,983 (44.3%) | 2,491 (42.3%) |
| 3 Vehicles | 1,245 (18.5%) | 1,060 (18.0%) |
| 4 Vehicles | 592 (8.8%) | 520 (8.8%) |
| 5 or more Vehicles | 30 (0.4%) | 83 (1.4%) |
| Total | 6,727 (100.0%) | 5,889 (100.0%) |
Commute Time in Kleberg County
The most frequently occuring commute durations in Kleberg County are 5 to 9 minutes (3,052 commuters, 24.7%), 10 to 14 minutes (2,835 commuters, 22.9%), and 15 to 19 minutes (1,972 commuters, 15.9%).
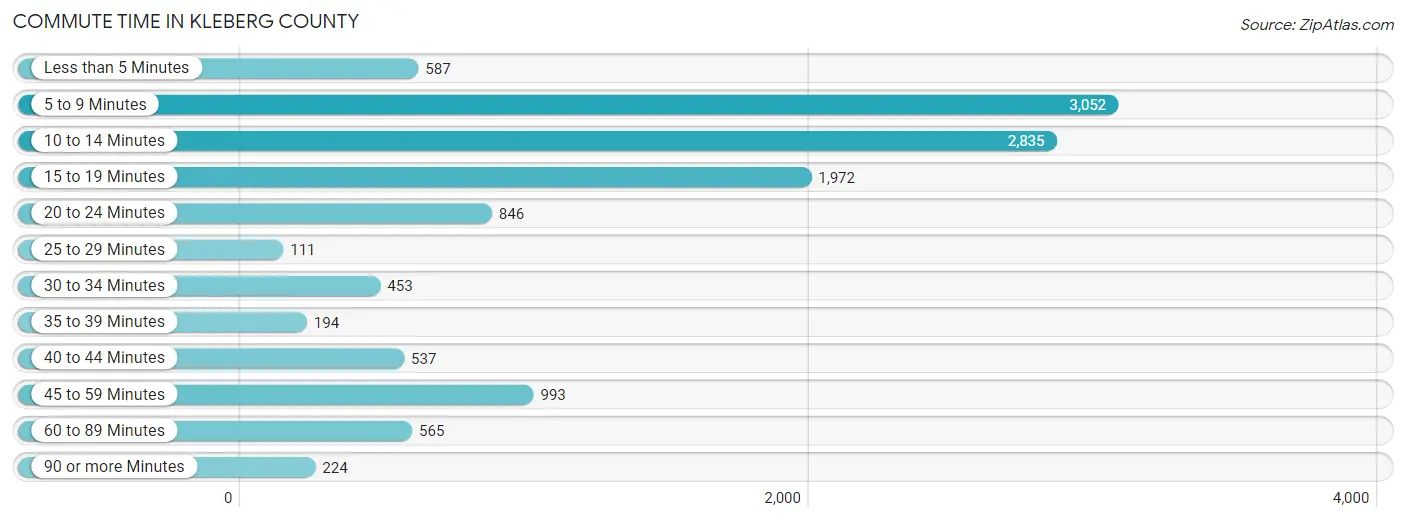
| Commute Time | # Commuters | % Commuters |
| Less than 5 Minutes | 587 | 4.8% |
| 5 to 9 Minutes | 3,052 | 24.7% |
| 10 to 14 Minutes | 2,835 | 22.9% |
| 15 to 19 Minutes | 1,972 | 15.9% |
| 20 to 24 Minutes | 846 | 6.8% |
| 25 to 29 Minutes | 111 | 0.9% |
| 30 to 34 Minutes | 453 | 3.7% |
| 35 to 39 Minutes | 194 | 1.6% |
| 40 to 44 Minutes | 537 | 4.3% |
| 45 to 59 Minutes | 993 | 8.0% |
| 60 to 89 Minutes | 565 | 4.6% |
| 90 or more Minutes | 224 | 1.8% |
Commute Time by Sex in Kleberg County
The most common commute times in Kleberg County are 10 to 14 minutes (1,515 commuters, 22.3%) for males and 5 to 9 minutes (1,655 commuters, 29.7%) for females.
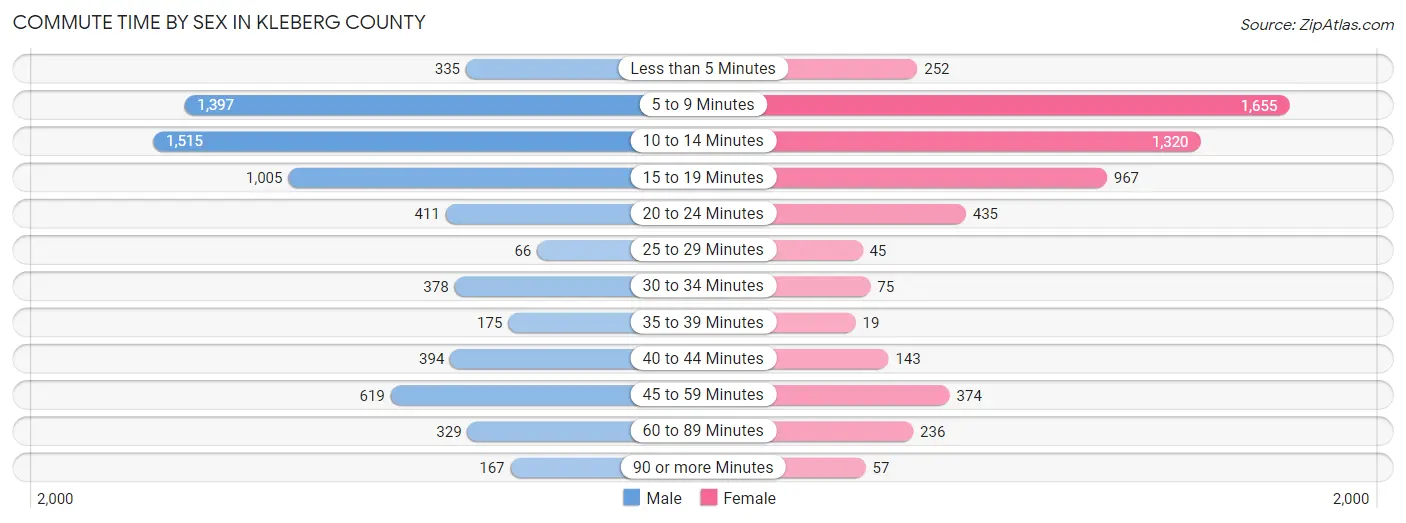
| Commute Time | Male | Female |
| Less than 5 Minutes | 335 (4.9%) | 252 (4.5%) |
| 5 to 9 Minutes | 1,397 (20.6%) | 1,655 (29.7%) |
| 10 to 14 Minutes | 1,515 (22.3%) | 1,320 (23.7%) |
| 15 to 19 Minutes | 1,005 (14.8%) | 967 (17.3%) |
| 20 to 24 Minutes | 411 (6.0%) | 435 (7.8%) |
| 25 to 29 Minutes | 66 (1.0%) | 45 (0.8%) |
| 30 to 34 Minutes | 378 (5.6%) | 75 (1.3%) |
| 35 to 39 Minutes | 175 (2.6%) | 19 (0.3%) |
| 40 to 44 Minutes | 394 (5.8%) | 143 (2.6%) |
| 45 to 59 Minutes | 619 (9.1%) | 374 (6.7%) |
| 60 to 89 Minutes | 329 (4.8%) | 236 (4.2%) |
| 90 or more Minutes | 167 (2.5%) | 57 (1.0%) |
Time of Departure to Work by Sex in Kleberg County
The most frequent times of departure to work in Kleberg County are 8:00 AM to 8:29 AM (1,070, 15.8%) for males and 7:00 AM to 7:29 AM (1,192, 21.4%) for females.
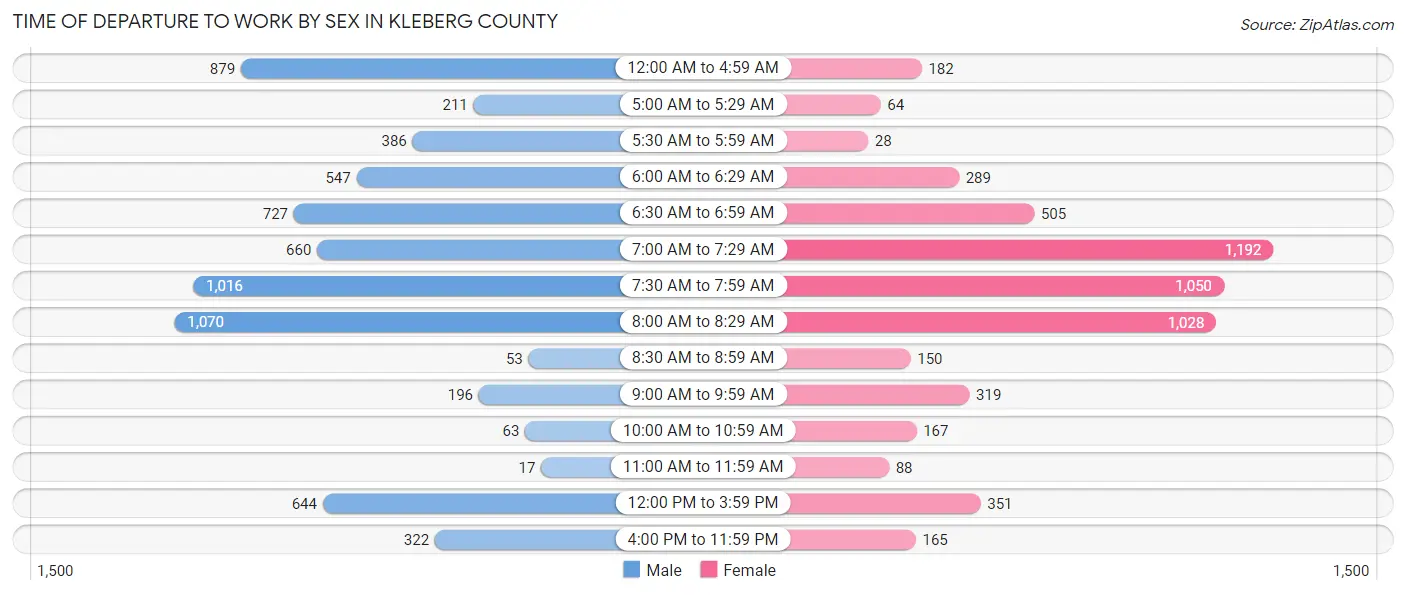
| Time of Departure | Male | Female |
| 12:00 AM to 4:59 AM | 879 (12.9%) | 182 (3.3%) |
| 5:00 AM to 5:29 AM | 211 (3.1%) | 64 (1.1%) |
| 5:30 AM to 5:59 AM | 386 (5.7%) | 28 (0.5%) |
| 6:00 AM to 6:29 AM | 547 (8.1%) | 289 (5.2%) |
| 6:30 AM to 6:59 AM | 727 (10.7%) | 505 (9.0%) |
| 7:00 AM to 7:29 AM | 660 (9.7%) | 1,192 (21.4%) |
| 7:30 AM to 7:59 AM | 1,016 (15.0%) | 1,050 (18.8%) |
| 8:00 AM to 8:29 AM | 1,070 (15.8%) | 1,028 (18.4%) |
| 8:30 AM to 8:59 AM | 53 (0.8%) | 150 (2.7%) |
| 9:00 AM to 9:59 AM | 196 (2.9%) | 319 (5.7%) |
| 10:00 AM to 10:59 AM | 63 (0.9%) | 167 (3.0%) |
| 11:00 AM to 11:59 AM | 17 (0.3%) | 88 (1.6%) |
| 12:00 PM to 3:59 PM | 644 (9.5%) | 351 (6.3%) |
| 4:00 PM to 11:59 PM | 322 (4.7%) | 165 (3.0%) |
| Total | 6,791 (100.0%) | 5,578 (100.0%) |
Housing Occupancy in Kleberg County
Occupancy by Ownership in Kleberg County
Of the total 11,915 dwellings in Kleberg County, owner-occupied units account for 6,443 (54.1%), while renter-occupied units make up 5,472 (45.9%).
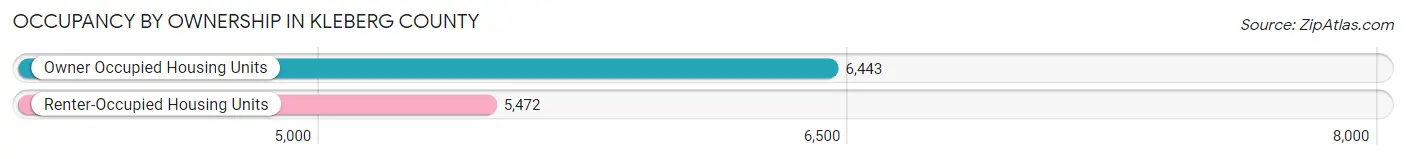
| Occupancy | # Housing Units | % Housing Units |
| Owner Occupied Housing Units | 6,443 | 54.1% |
| Renter-Occupied Housing Units | 5,472 | 45.9% |
| Total Occupied Housing Units | 11,915 | 100.0% |
Occupancy by Household Size in Kleberg County
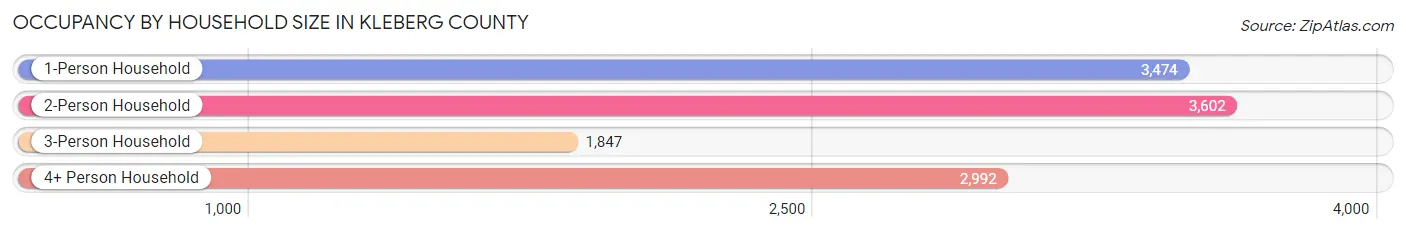
| Household Size | # Housing Units | % Housing Units |
| 1-Person Household | 3,474 | 29.2% |
| 2-Person Household | 3,602 | 30.2% |
| 3-Person Household | 1,847 | 15.5% |
| 4+ Person Household | 2,992 | 25.1% |
| Total Housing Units | 11,915 | 100.0% |
Occupancy by Ownership by Household Size in Kleberg County
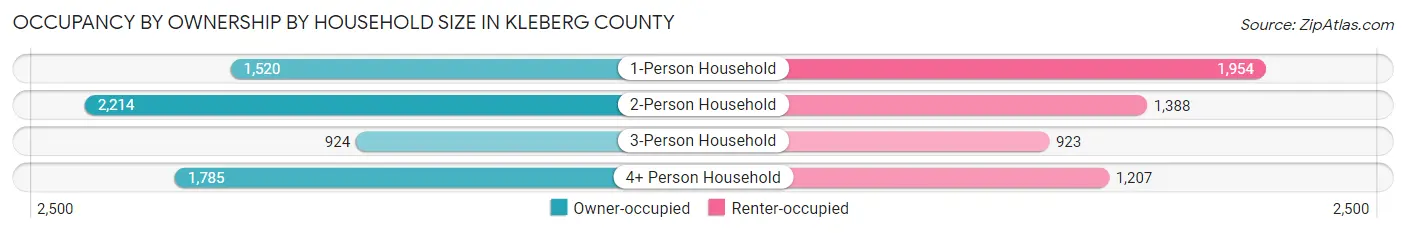
| Household Size | Owner-occupied | Renter-occupied |
| 1-Person Household | 1,520 (43.8%) | 1,954 (56.2%) |
| 2-Person Household | 2,214 (61.5%) | 1,388 (38.5%) |
| 3-Person Household | 924 (50.0%) | 923 (50.0%) |
| 4+ Person Household | 1,785 (59.7%) | 1,207 (40.3%) |
| Total Housing Units | 6,443 (54.1%) | 5,472 (45.9%) |
Occupancy by Educational Attainment in Kleberg County
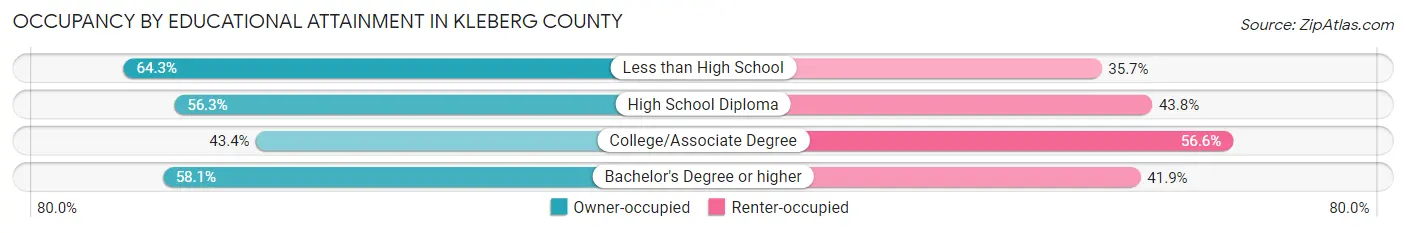
| Household Size | Owner-occupied | Renter-occupied |
| Less than High School | 1,132 (64.3%) | 629 (35.7%) |
| High School Diploma | 2,231 (56.2%) | 1,735 (43.8%) |
| College/Associate Degree | 1,519 (43.4%) | 1,982 (56.6%) |
| Bachelor's Degree or higher | 1,561 (58.1%) | 1,126 (41.9%) |
Occupancy by Age of Householder in Kleberg County
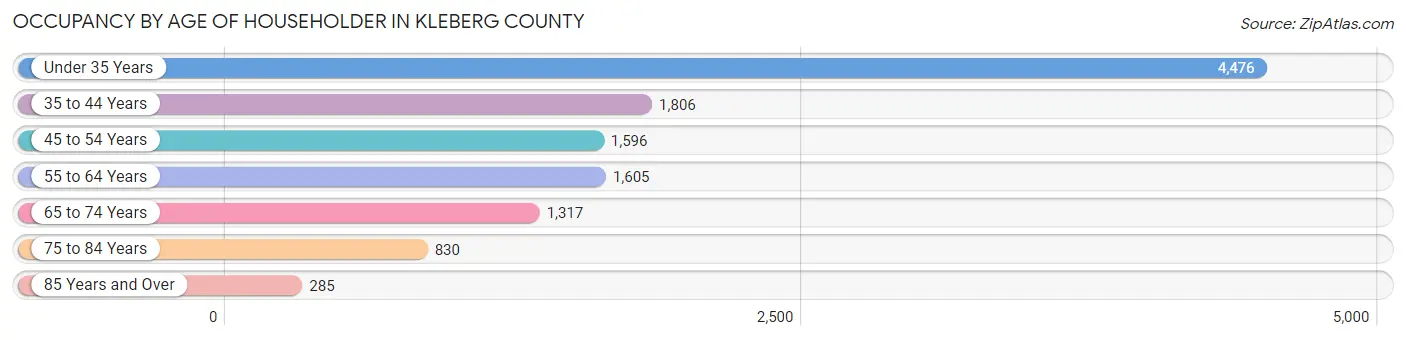
| Age Bracket | # Households | % Households |
| Under 35 Years | 4,476 | 37.6% |
| 35 to 44 Years | 1,806 | 15.2% |
| 45 to 54 Years | 1,596 | 13.4% |
| 55 to 64 Years | 1,605 | 13.5% |
| 65 to 74 Years | 1,317 | 11.1% |
| 75 to 84 Years | 830 | 7.0% |
| 85 Years and Over | 285 | 2.4% |
| Total | 11,915 | 100.0% |
Housing Finances in Kleberg County
Median Income by Occupancy in Kleberg County
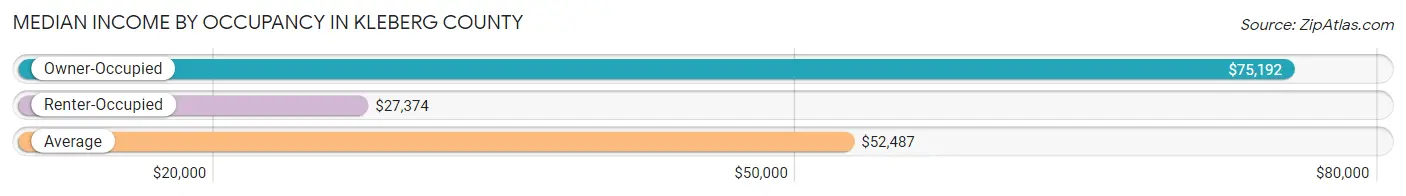
| Occupancy Type | # Households | Median Income |
| Owner-Occupied | 6,443 (54.1%) | $75,192 |
| Renter-Occupied | 5,472 (45.9%) | $27,374 |
| Average | 11,915 (100.0%) | $52,487 |
Occupancy by Householder Income Bracket in Kleberg County
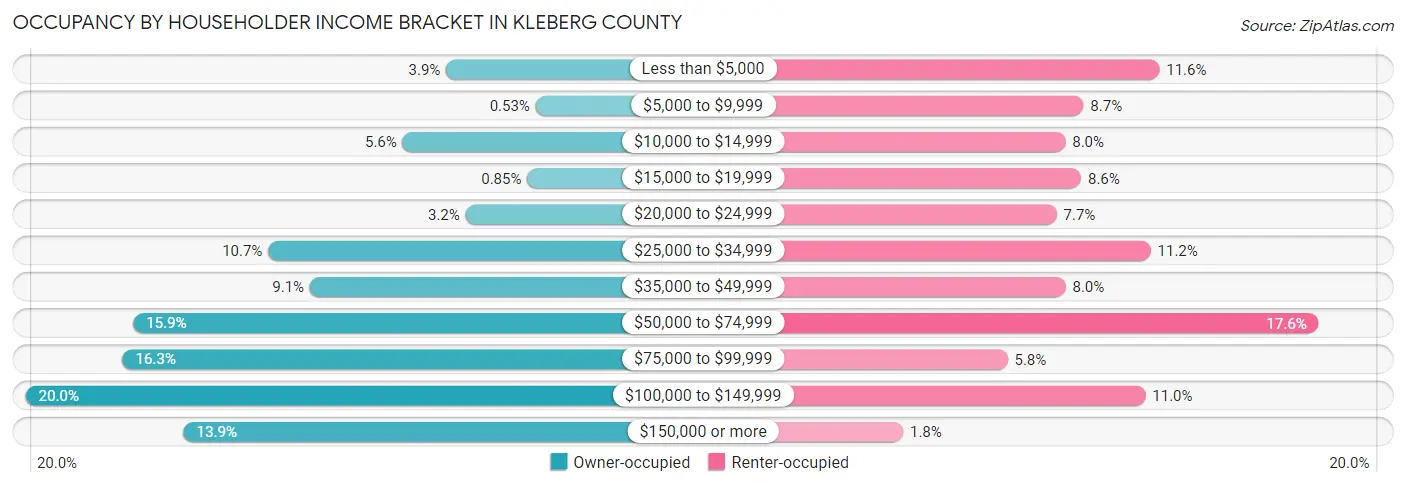
| Income Bracket | Owner-occupied | Renter-occupied |
| Less than $5,000 | 254 (3.9%) | 633 (11.6%) |
| $5,000 to $9,999 | 34 (0.5%) | 475 (8.7%) |
| $10,000 to $14,999 | 361 (5.6%) | 437 (8.0%) |
| $15,000 to $19,999 | 55 (0.9%) | 470 (8.6%) |
| $20,000 to $24,999 | 206 (3.2%) | 419 (7.7%) |
| $25,000 to $34,999 | 691 (10.7%) | 615 (11.2%) |
| $35,000 to $49,999 | 588 (9.1%) | 438 (8.0%) |
| $50,000 to $74,999 | 1,022 (15.9%) | 965 (17.6%) |
| $75,000 to $99,999 | 1,048 (16.3%) | 317 (5.8%) |
| $100,000 to $149,999 | 1,286 (20.0%) | 604 (11.0%) |
| $150,000 or more | 898 (13.9%) | 99 (1.8%) |
| Total | 6,443 (100.0%) | 5,472 (100.0%) |
Monthly Housing Cost Tiers in Kleberg County
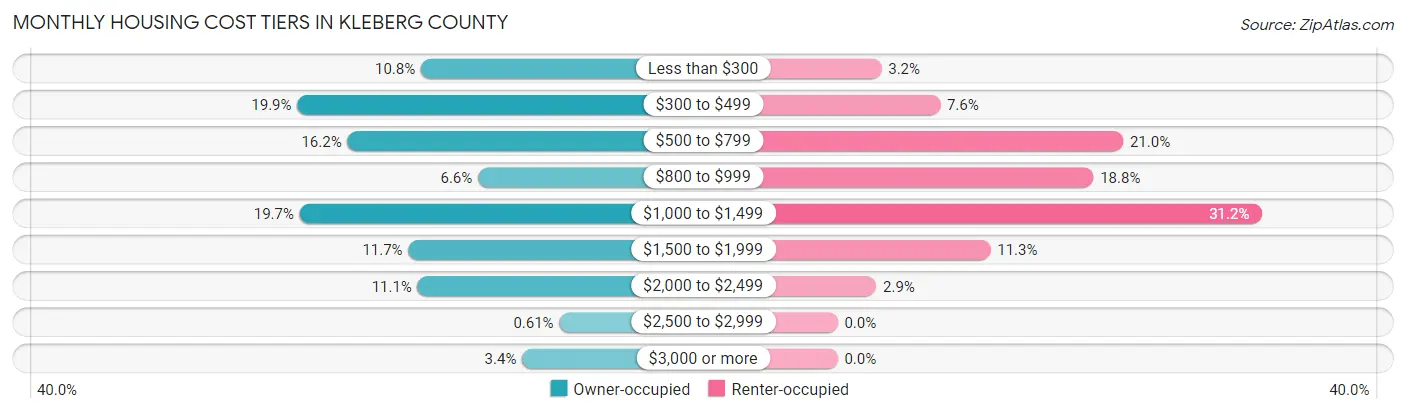
| Monthly Cost | Owner-occupied | Renter-occupied |
| Less than $300 | 696 (10.8%) | 177 (3.2%) |
| $300 to $499 | 1,283 (19.9%) | 413 (7.5%) |
| $500 to $799 | 1,045 (16.2%) | 1,151 (21.0%) |
| $800 to $999 | 425 (6.6%) | 1,031 (18.8%) |
| $1,000 to $1,499 | 1,271 (19.7%) | 1,708 (31.2%) |
| $1,500 to $1,999 | 756 (11.7%) | 616 (11.3%) |
| $2,000 to $2,499 | 712 (11.1%) | 156 (2.9%) |
| $2,500 to $2,999 | 39 (0.6%) | 0 (0.0%) |
| $3,000 or more | 216 (3.4%) | 0 (0.0%) |
| Total | 6,443 (100.0%) | 5,472 (100.0%) |
Physical Housing Characteristics in Kleberg County
Housing Structures in Kleberg County
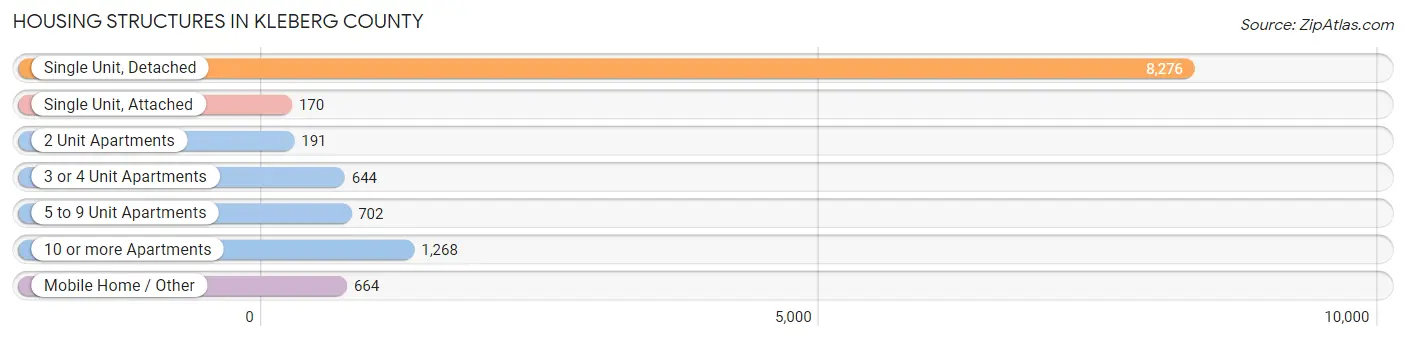
| Structure Type | # Housing Units | % Housing Units |
| Single Unit, Detached | 8,276 | 69.5% |
| Single Unit, Attached | 170 | 1.4% |
| 2 Unit Apartments | 191 | 1.6% |
| 3 or 4 Unit Apartments | 644 | 5.4% |
| 5 to 9 Unit Apartments | 702 | 5.9% |
| 10 or more Apartments | 1,268 | 10.6% |
| Mobile Home / Other | 664 | 5.6% |
| Total | 11,915 | 100.0% |
Housing Structures by Occupancy in Kleberg County
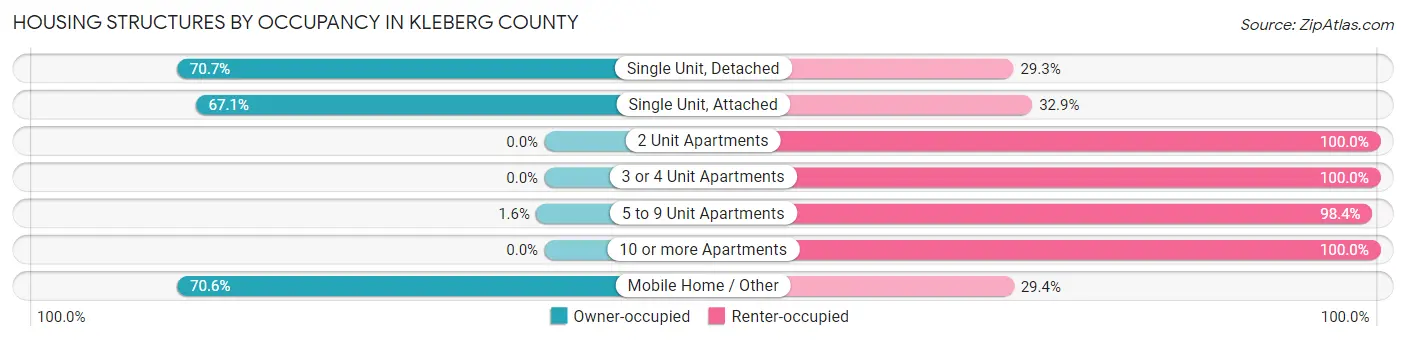
| Structure Type | Owner-occupied | Renter-occupied |
| Single Unit, Detached | 5,849 (70.7%) | 2,427 (29.3%) |
| Single Unit, Attached | 114 (67.1%) | 56 (32.9%) |
| 2 Unit Apartments | 0 (0.0%) | 191 (100.0%) |
| 3 or 4 Unit Apartments | 0 (0.0%) | 644 (100.0%) |
| 5 to 9 Unit Apartments | 11 (1.6%) | 691 (98.4%) |
| 10 or more Apartments | 0 (0.0%) | 1,268 (100.0%) |
| Mobile Home / Other | 469 (70.6%) | 195 (29.4%) |
| Total | 6,443 (54.1%) | 5,472 (45.9%) |
Housing Structures by Number of Rooms in Kleberg County
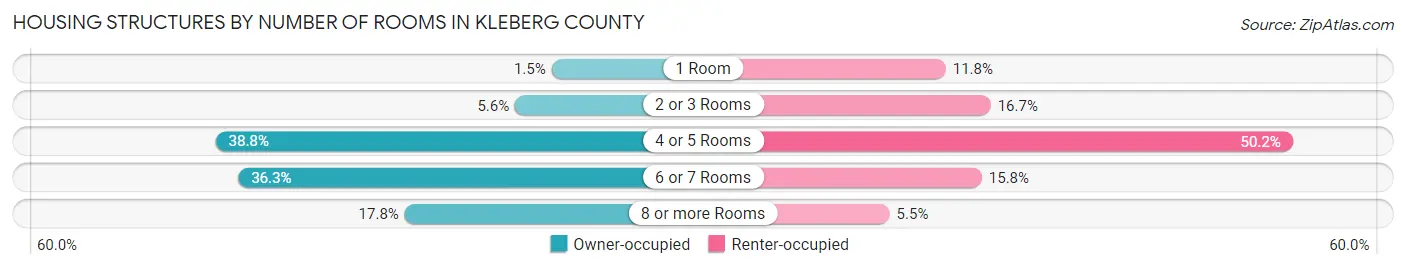
| Number of Rooms | Owner-occupied | Renter-occupied |
| 1 Room | 98 (1.5%) | 643 (11.7%) |
| 2 or 3 Rooms | 359 (5.6%) | 916 (16.7%) |
| 4 or 5 Rooms | 2,500 (38.8%) | 2,749 (50.2%) |
| 6 or 7 Rooms | 2,338 (36.3%) | 862 (15.8%) |
| 8 or more Rooms | 1,148 (17.8%) | 302 (5.5%) |
| Total | 6,443 (100.0%) | 5,472 (100.0%) |
Housing Structure by Heating Type in Kleberg County
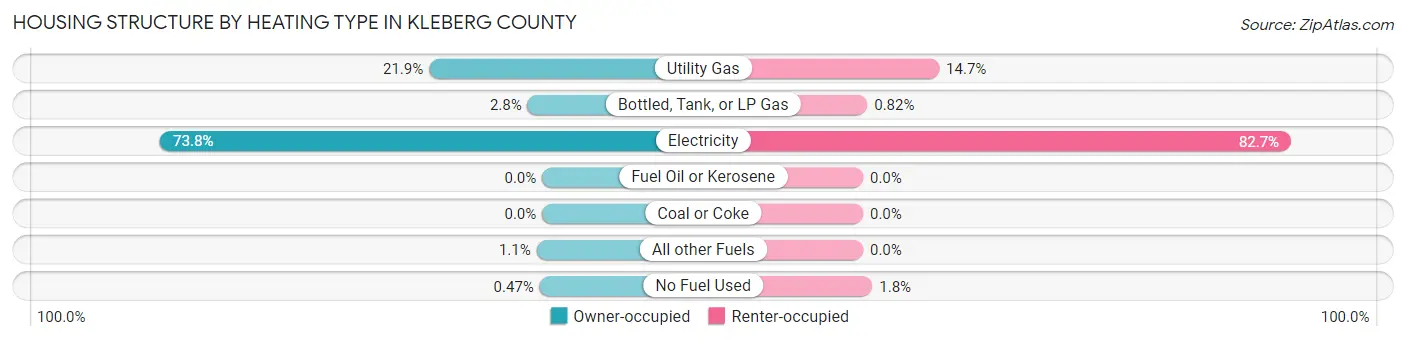
| Heating Type | Owner-occupied | Renter-occupied |
| Utility Gas | 1,408 (21.8%) | 805 (14.7%) |
| Bottled, Tank, or LP Gas | 181 (2.8%) | 45 (0.8%) |
| Electricity | 4,755 (73.8%) | 4,524 (82.7%) |
| Fuel Oil or Kerosene | 0 (0.0%) | 0 (0.0%) |
| Coal or Coke | 0 (0.0%) | 0 (0.0%) |
| All other Fuels | 69 (1.1%) | 0 (0.0%) |
| No Fuel Used | 30 (0.5%) | 98 (1.8%) |
| Total | 6,443 (100.0%) | 5,472 (100.0%) |
Household Vehicle Usage in Kleberg County
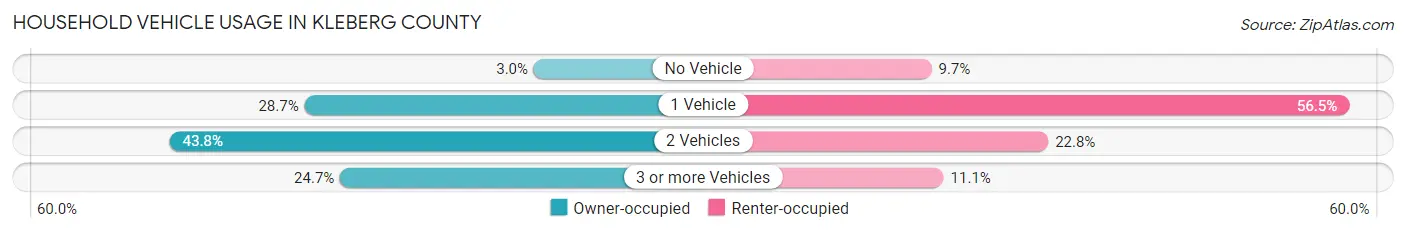
| Vehicles per Household | Owner-occupied | Renter-occupied |
| No Vehicle | 190 (2.9%) | 531 (9.7%) |
| 1 Vehicle | 1,846 (28.6%) | 3,090 (56.5%) |
| 2 Vehicles | 2,819 (43.8%) | 1,246 (22.8%) |
| 3 or more Vehicles | 1,588 (24.6%) | 605 (11.1%) |
| Total | 6,443 (100.0%) | 5,472 (100.0%) |
Real Estate & Mortgages in Kleberg County
Real Estate and Mortgage Overview in Kleberg County
| Characteristic | Without Mortgage | With Mortgage |
| Housing Units | 3,429 | 3,014 |
| Median Property Value | $87,300 | $181,800 |
| Median Household Income | $54,528 | $668 |
| Monthly Housing Costs | $465 | $168 |
| Real Estate Taxes | $1,129 | $82 |
Property Value by Mortgage Status in Kleberg County
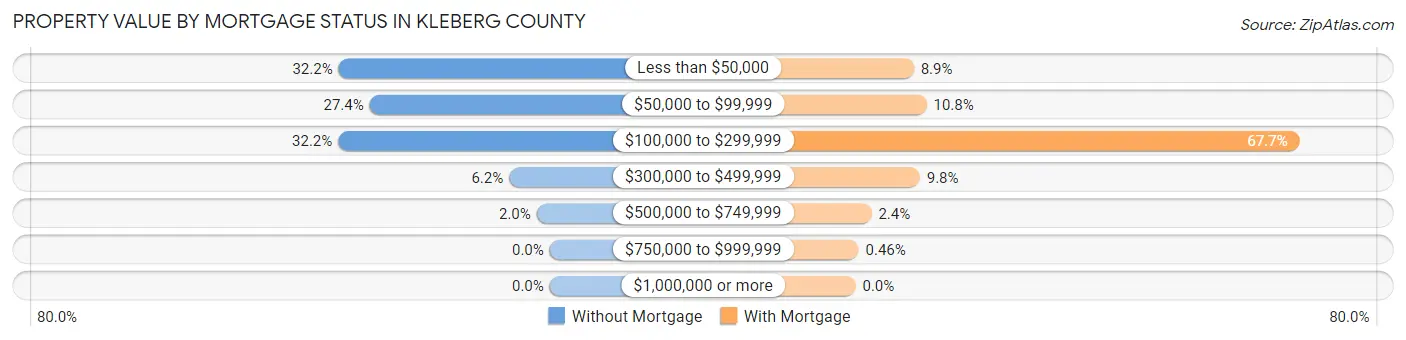
| Property Value | Without Mortgage | With Mortgage |
| Less than $50,000 | 1,103 (32.2%) | 267 (8.9%) |
| $50,000 to $99,999 | 941 (27.4%) | 326 (10.8%) |
| $100,000 to $299,999 | 1,105 (32.2%) | 2,039 (67.6%) |
| $300,000 to $499,999 | 212 (6.2%) | 295 (9.8%) |
| $500,000 to $749,999 | 68 (2.0%) | 73 (2.4%) |
| $750,000 to $999,999 | 0 (0.0%) | 14 (0.5%) |
| $1,000,000 or more | 0 (0.0%) | 0 (0.0%) |
| Total | 3,429 (100.0%) | 3,014 (100.0%) |
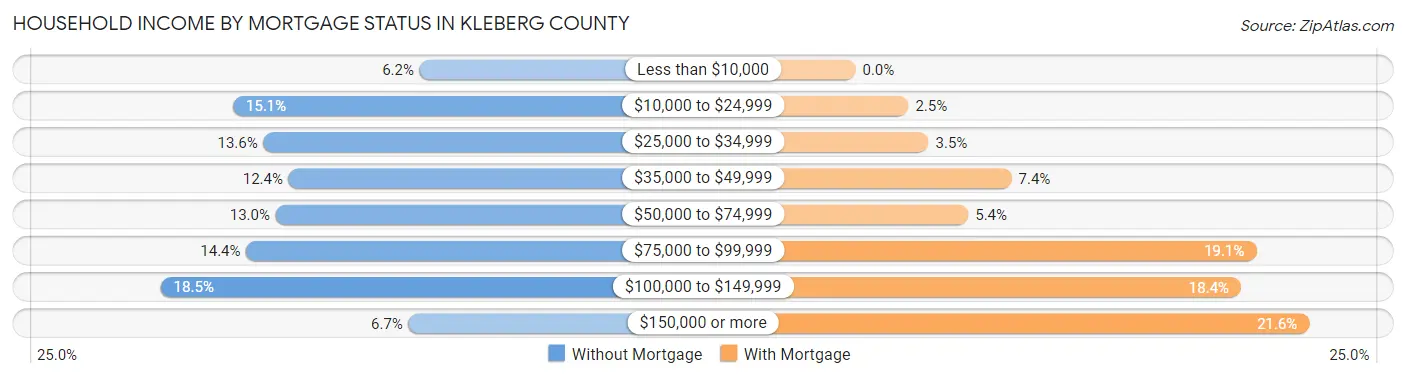
Household Income by Mortgage Status in Kleberg County
| Household Income | Without Mortgage | With Mortgage |
| Less than $10,000 | 212 (6.2%) | 0 (0.0%) |
| $10,000 to $24,999 | 517 (15.1%) | 76 (2.5%) |
| $25,000 to $34,999 | 467 (13.6%) | 105 (3.5%) |
| $35,000 to $49,999 | 426 (12.4%) | 224 (7.4%) |
| $50,000 to $74,999 | 447 (13.0%) | 162 (5.4%) |
| $75,000 to $99,999 | 495 (14.4%) | 575 (19.1%) |
| $100,000 to $149,999 | 635 (18.5%) | 553 (18.3%) |
| $150,000 or more | 230 (6.7%) | 651 (21.6%) |
| Total | 3,429 (100.0%) | 3,014 (100.0%) |
Property Value to Household Income Ratio in Kleberg County

| Value-to-Income Ratio | Without Mortgage | With Mortgage |
| Less than 2.0x | 2,074 (60.5%) | 95,245 (3,160.1%) |
| 2.0x to 2.9x | 293 (8.5%) | 1,603 (53.2%) |
| 3.0x to 3.9x | 357 (10.4%) | 645 (21.4%) |
| 4.0x or more | 631 (18.4%) | 314 (10.4%) |
| Total | 3,429 (100.0%) | 3,014 (100.0%) |
Real Estate Taxes by Mortgage Status in Kleberg County
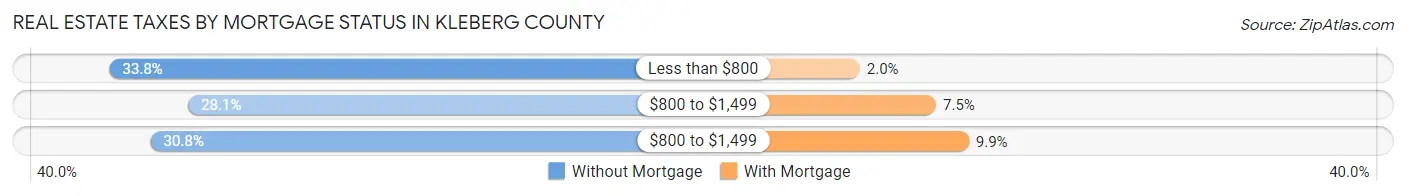
| Property Taxes | Without Mortgage | With Mortgage |
| Less than $800 | 1,159 (33.8%) | 59 (2.0%) |
| $800 to $1,499 | 962 (28.1%) | 227 (7.5%) |
| $800 to $1,499 | 1,056 (30.8%) | 299 (9.9%) |
| Total | 3,429 (100.0%) | 3,014 (100.0%) |
Health & Disability in Kleberg County
Health Insurance Coverage by Age in Kleberg County
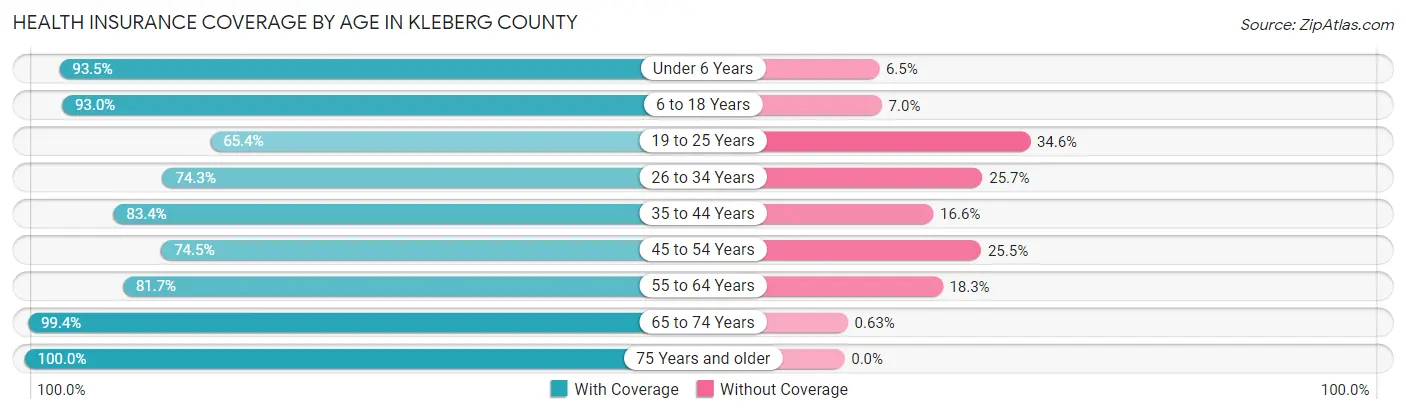
| Age Bracket | With Coverage | Without Coverage |
| Under 6 Years | 2,502 (93.5%) | 173 (6.5%) |
| 6 to 18 Years | 5,181 (93.0%) | 388 (7.0%) |
| 19 to 25 Years | 3,792 (65.4%) | 2,008 (34.6%) |
| 26 to 34 Years | 2,578 (74.3%) | 893 (25.7%) |
| 35 to 44 Years | 2,860 (83.4%) | 568 (16.6%) |
| 45 to 54 Years | 2,090 (74.5%) | 715 (25.5%) |
| 55 to 64 Years | 2,147 (81.7%) | 481 (18.3%) |
| 65 to 74 Years | 2,221 (99.4%) | 14 (0.6%) |
| 75 Years and older | 1,623 (100.0%) | 0 (0.0%) |
| Total | 24,994 (82.7%) | 5,240 (17.3%) |
Health Insurance Coverage by Citizenship Status in Kleberg County
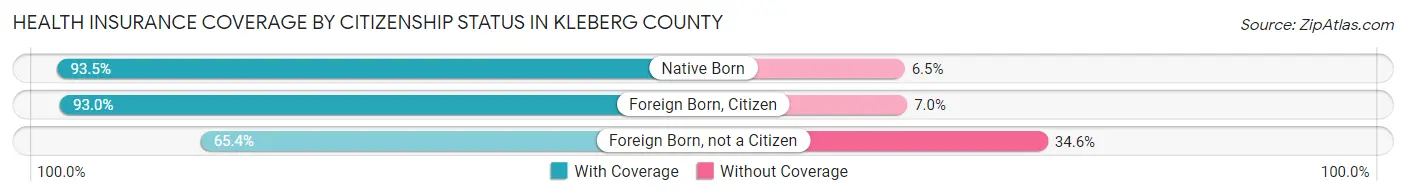
| Citizenship Status | With Coverage | Without Coverage |
| Native Born | 2,502 (93.5%) | 173 (6.5%) |
| Foreign Born, Citizen | 5,181 (93.0%) | 388 (7.0%) |
| Foreign Born, not a Citizen | 3,792 (65.4%) | 2,008 (34.6%) |
Health Insurance Coverage by Household Income in Kleberg County
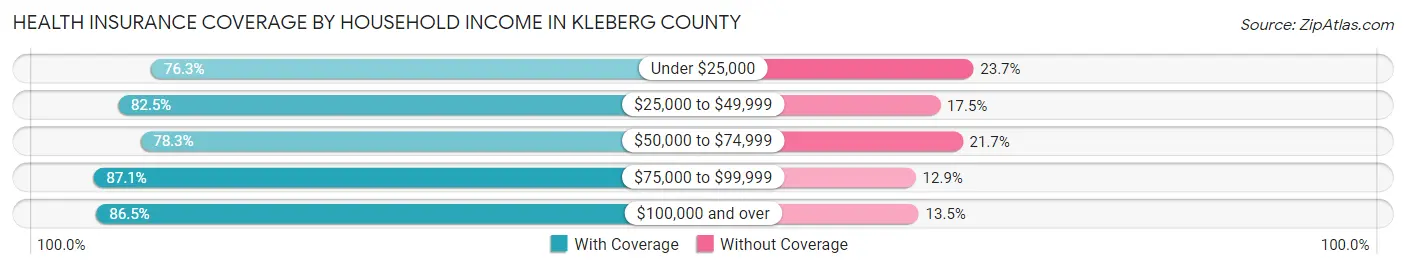
| Household Income | With Coverage | Without Coverage |
| Under $25,000 | 4,679 (76.3%) | 1,454 (23.7%) |
| $25,000 to $49,999 | 4,737 (82.5%) | 1,004 (17.5%) |
| $50,000 to $74,999 | 3,345 (78.3%) | 926 (21.7%) |
| $75,000 to $99,999 | 3,472 (87.1%) | 514 (12.9%) |
| $100,000 and over | 7,534 (86.5%) | 1,172 (13.5%) |
Public vs Private Health Insurance Coverage by Age in Kleberg County
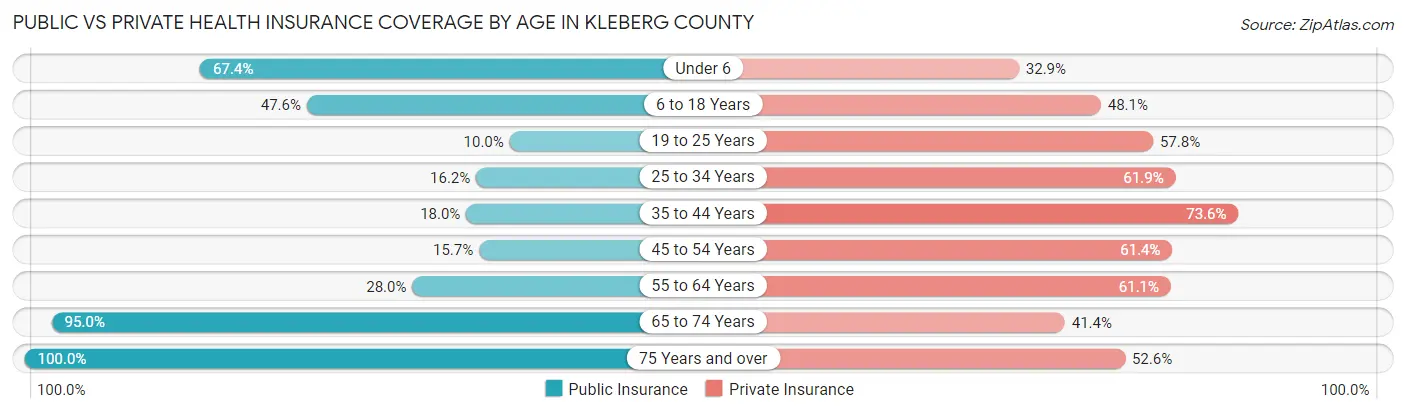
| Age Bracket | Public Insurance | Private Insurance |
| Under 6 | 1,804 (67.4%) | 879 (32.9%) |
| 6 to 18 Years | 2,652 (47.6%) | 2,677 (48.1%) |
| 19 to 25 Years | 579 (10.0%) | 3,350 (57.8%) |
| 25 to 34 Years | 562 (16.2%) | 2,150 (61.9%) |
| 35 to 44 Years | 618 (18.0%) | 2,523 (73.6%) |
| 45 to 54 Years | 439 (15.7%) | 1,721 (61.4%) |
| 55 to 64 Years | 737 (28.0%) | 1,605 (61.1%) |
| 65 to 74 Years | 2,123 (95.0%) | 925 (41.4%) |
| 75 Years and over | 1,623 (100.0%) | 853 (52.6%) |
| Total | 11,137 (36.8%) | 16,683 (55.2%) |
Disability Status by Sex by Age in Kleberg County
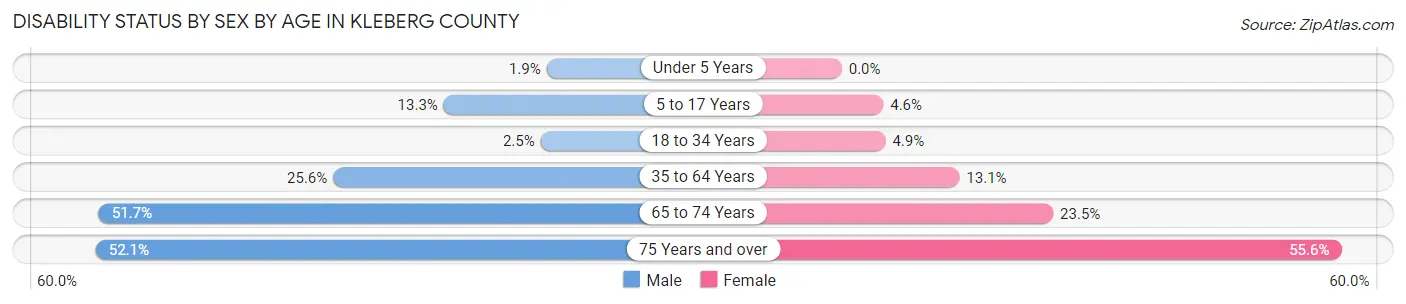
| Age Bracket | Male | Female |
| Under 5 Years | 21 (1.9%) | 0 (0.0%) |
| 5 to 17 Years | 356 (13.3%) | 123 (4.6%) |
| 18 to 34 Years | 128 (2.5%) | 241 (4.9%) |
| 35 to 64 Years | 1,162 (25.6%) | 567 (13.1%) |
| 65 to 74 Years | 554 (51.7%) | 274 (23.5%) |
| 75 Years and over | 377 (52.1%) | 500 (55.6%) |
Disability Class by Sex by Age in Kleberg County
Disability Class: Hearing Difficulty
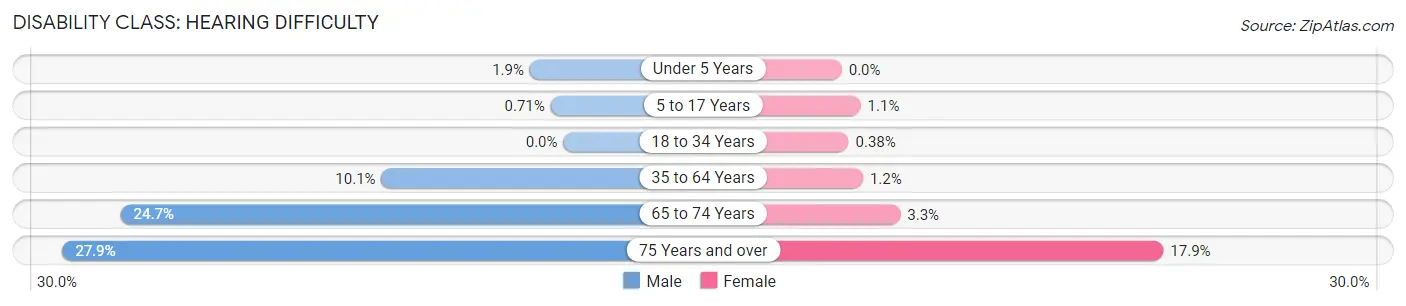
| Age Bracket | Male | Female |
| Under 5 Years | 21 (1.9%) | 0 (0.0%) |
| 5 to 17 Years | 19 (0.7%) | 28 (1.1%) |
| 18 to 34 Years | 0 (0.0%) | 19 (0.4%) |
| 35 to 64 Years | 459 (10.1%) | 51 (1.2%) |
| 65 to 74 Years | 264 (24.6%) | 38 (3.3%) |
| 75 Years and over | 202 (27.9%) | 161 (17.9%) |
Disability Class: Vision Difficulty
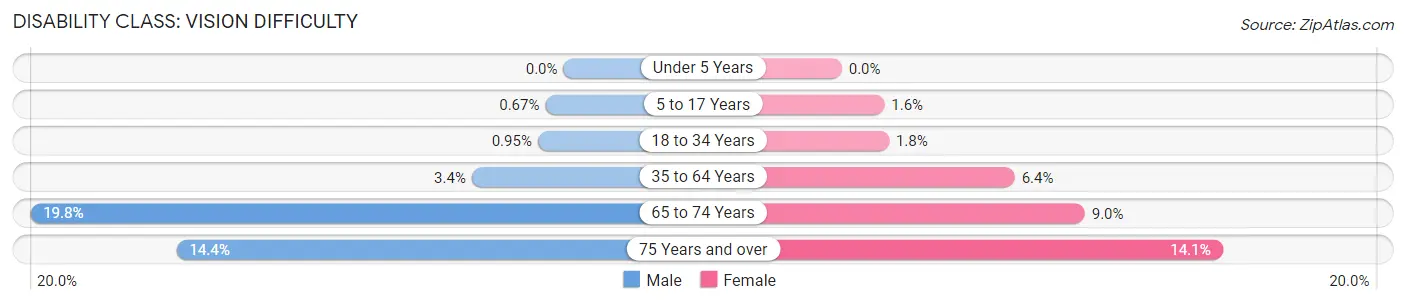
| Age Bracket | Male | Female |
| Under 5 Years | 0 (0.0%) | 0 (0.0%) |
| 5 to 17 Years | 18 (0.7%) | 42 (1.6%) |
| 18 to 34 Years | 48 (0.9%) | 87 (1.8%) |
| 35 to 64 Years | 154 (3.4%) | 278 (6.4%) |
| 65 to 74 Years | 212 (19.8%) | 105 (9.0%) |
| 75 Years and over | 104 (14.4%) | 127 (14.1%) |
Disability Class: Cognitive Difficulty
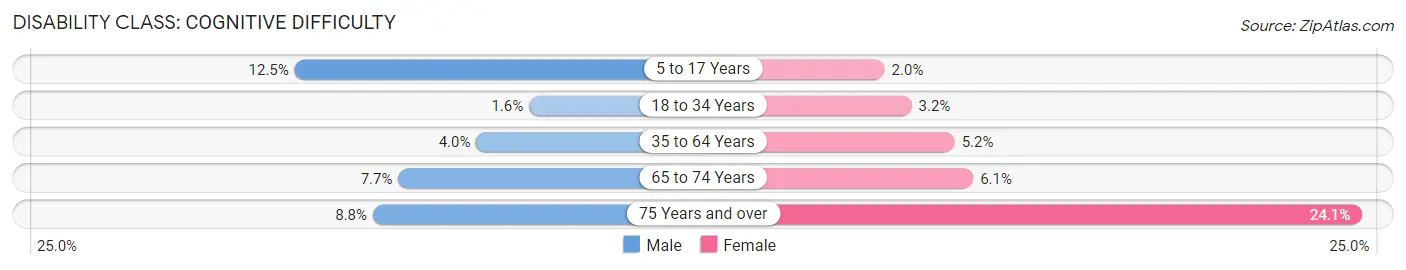
| Age Bracket | Male | Female |
| 5 to 17 Years | 333 (12.5%) | 53 (2.0%) |
| 18 to 34 Years | 80 (1.6%) | 161 (3.2%) |
| 35 to 64 Years | 183 (4.0%) | 227 (5.2%) |
| 65 to 74 Years | 82 (7.7%) | 71 (6.1%) |
| 75 Years and over | 64 (8.8%) | 217 (24.1%) |
Disability Class: Ambulatory Difficulty
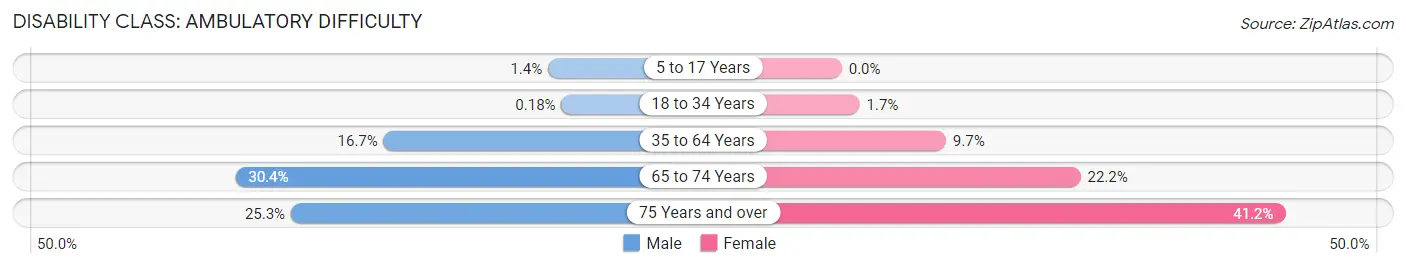
| Age Bracket | Male | Female |
| 5 to 17 Years | 38 (1.4%) | 0 (0.0%) |
| 18 to 34 Years | 9 (0.2%) | 82 (1.7%) |
| 35 to 64 Years | 756 (16.7%) | 418 (9.7%) |
| 65 to 74 Years | 326 (30.4%) | 258 (22.2%) |
| 75 Years and over | 183 (25.3%) | 370 (41.2%) |
Disability Class: Self-Care Difficulty
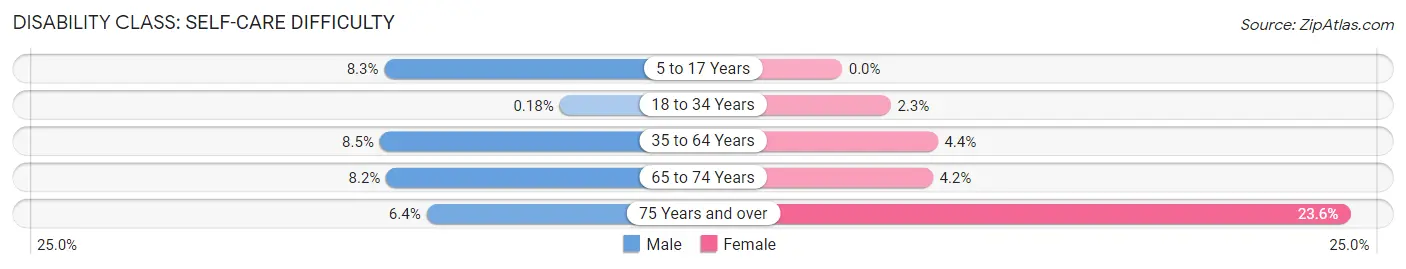
| Age Bracket | Male | Female |
| 5 to 17 Years | 222 (8.3%) | 0 (0.0%) |
| 18 to 34 Years | 9 (0.2%) | 112 (2.3%) |
| 35 to 64 Years | 386 (8.5%) | 192 (4.4%) |
| 65 to 74 Years | 88 (8.2%) | 49 (4.2%) |
| 75 Years and over | 46 (6.4%) | 212 (23.6%) |
Technology Access in Kleberg County
Computing Device Access in Kleberg County
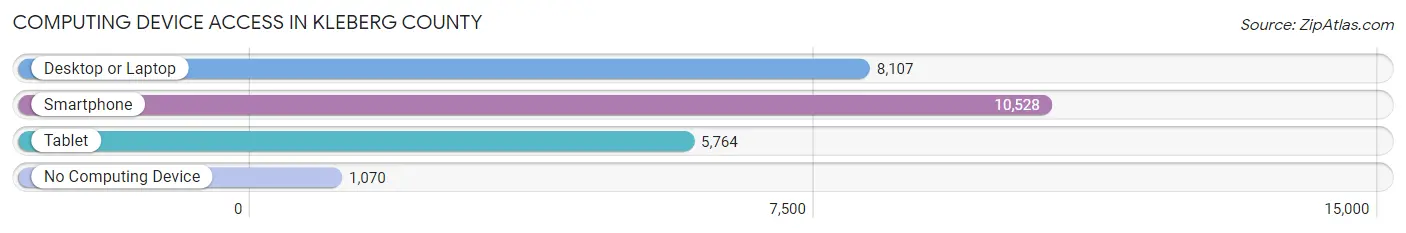
| Device Type | # Households | % Households |
| Desktop or Laptop | 8,107 | 68.0% |
| Smartphone | 10,528 | 88.4% |
| Tablet | 5,764 | 48.4% |
| No Computing Device | 1,070 | 9.0% |
| Total | 11,915 | 100.0% |
Internet Access in Kleberg County
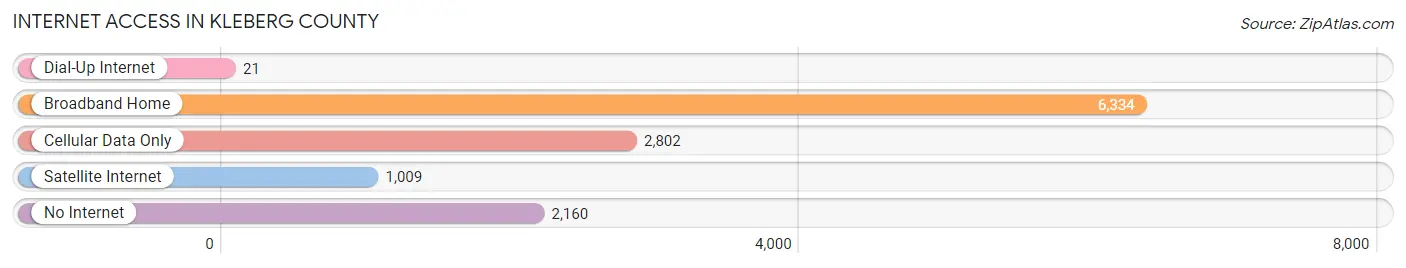
| Internet Type | # Households | % Households |
| Dial-Up Internet | 21 | 0.2% |
| Broadband Home | 6,334 | 53.2% |
| Cellular Data Only | 2,802 | 23.5% |
| Satellite Internet | 1,009 | 8.5% |
| No Internet | 2,160 | 18.1% |
| Total | 11,915 | 100.0% |
Kleberg County Summary
Kleberg County is located in the southern part of Texas, in the Coastal Plains region of the state. It is bordered by Nueces County to the east, San Patricio County to the north, Kenedy County to the south, and Willacy County to the west. The county seat is Kingsville, and the county is named after Robert J. Kleberg, a prominent rancher and politician in the area.
Geography
Kleberg County covers an area of 1,079 square miles, making it the second smallest county in Texas. The terrain is mostly flat, with some rolling hills in the northern part of the county. The climate is semi-arid, with hot summers and mild winters. The average annual precipitation is about 22 inches.
The county is home to several bodies of water, including the Laguna Madre, the Nueces River, and the San Fernando Creek. The Laguna Madre is a shallow, hypersaline lagoon that runs along the coast of the county. The Nueces River is a major river in the region, and the San Fernando Creek is a tributary of the Nueces.
Economy
Kleberg County has a diverse economy, with a mix of agriculture, manufacturing, and services. Agriculture is the largest sector, with cotton, sorghum, and hay being the main crops. The county is also home to several large ranches, which raise cattle, sheep, and goats.
Manufacturing is the second largest sector, with several large companies located in the county. These include a paper mill, a chemical plant, and a food processing plant. The service sector is also important, with several hospitals, banks, and other businesses located in the county.
Demographics
As of the 2010 census, Kleberg County had a population of 32,061. The population is mostly Hispanic, with about 70% of the population identifying as such. The median household income is $41,945, and the median age is 33.
The county is home to several military bases, including Naval Air Station Kingsville and Naval Air Station Corpus Christi. These bases provide a significant economic boost to the county, as well as employment opportunities for local residents.
Conclusion
Kleberg County is a small but diverse county in the southern part of Texas. It has a mix of agriculture, manufacturing, and services, and is home to several military bases. The population is mostly Hispanic, and the median household income is $41,945. The county is a great place to live and work, and offers a variety of opportunities for its residents.
Common Questions
What is Per Capita Income in Kleberg County?
Per Capita income in Kleberg County is $25,876.
What is the Median Family Income in Kleberg County?
Median Family Income in Kleberg County is $62,635.
What is the Median Household income in Kleberg County?
Median Household Income in Kleberg County is $52,487.
What is Income or Wage Gap in Kleberg County?
Income or Wage Gap in Kleberg County is 43.9%.
Women in Kleberg County earn 56.1 cents for every dollar earned by a man.
What is Family Income Deficit in Kleberg County?
Family Income Deficit in Kleberg County is $12,912.
Families that are below poverty line in Kleberg County earn $12,912 less on average than the poverty threshold level.
What is Inequality or Gini Index in Kleberg County?
Inequality or Gini Index in Kleberg County is 0.48.
What is the Total Population of Kleberg County?
Total Population of Kleberg County is 30,860.
What is the Total Male Population of Kleberg County?
Total Male Population of Kleberg County is 15,582.
What is the Total Female Population of Kleberg County?
Total Female Population of Kleberg County is 15,278.
What is the Ratio of Males per 100 Females in Kleberg County?
There are 101.99 Males per 100 Females in Kleberg County.
What is the Ratio of Females per 100 Males in Kleberg County?
There are 98.05 Females per 100 Males in Kleberg County.
What is the Median Population Age in Kleberg County?
Median Population Age in Kleberg County is 28.6 Years.
What is the Average Family Size in Kleberg County
Average Family Size in Kleberg County is 3.1 People.
What is the Average Household Size in Kleberg County
Average Household Size in Kleberg County is 2.4 People.
How Large is the Labor Force in Kleberg County?
There are 14,353 People in the Labor Forcein in Kleberg County.
What is the Percentage of People in the Labor Force in Kleberg County?
59.3% of People are in the Labor Force in Kleberg County.
What is the Unemployment Rate in Kleberg County?
Unemployment Rate in Kleberg County is 7.5%.