Kinney County, TX Map & Demographics
Kinney County Map
Kinney County Overview
$29,833
PER CAPITA INCOME
$67,852
AVG FAMILY INCOME
$52,386
AVG HOUSEHOLD INCOME
47.7%
WAGE / INCOME GAP [ % ]
52.3¢/ $1
WAGE / INCOME GAP [ $ ]
0.40
INEQUALITY / GINI INDEX
3,157
TOTAL POPULATION
1,947
MALE POPULATION
1,210
FEMALE POPULATION
160.91
MALES / 100 FEMALES
62.15
FEMALES / 100 MALES
47.5
MEDIAN AGE
3.7
AVG FAMILY SIZE
2.7
AVG HOUSEHOLD SIZE
1,340
LABOR FORCE [ PEOPLE ]
48.1%
PERCENT IN LABOR FORCE
1.9%
UNEMPLOYMENT RATE
Kinney County Area Codes
Income in Kinney County
Income Overview in Kinney County
Per Capita Income in Kinney County is $29,833, while median incomes of families and households are $67,852 and $52,386 respectively.
| Characteristic | Number | Measure |
| Per Capita Income | 3,157 | $29,833 |
| Median Family Income | 598 | $67,852 |
| Mean Family Income | 598 | $64,301 |
| Median Household Income | 1,105 | $52,386 |
| Mean Household Income | 1,105 | $64,114 |
| Income Deficit | 598 | $0 |
| Wage / Income Gap (%) | 3,157 | 47.66% |
| Wage / Income Gap ($) | 3,157 | 52.34¢ per $1 |
| Gini / Inequality Index | 3,157 | 0.40 |
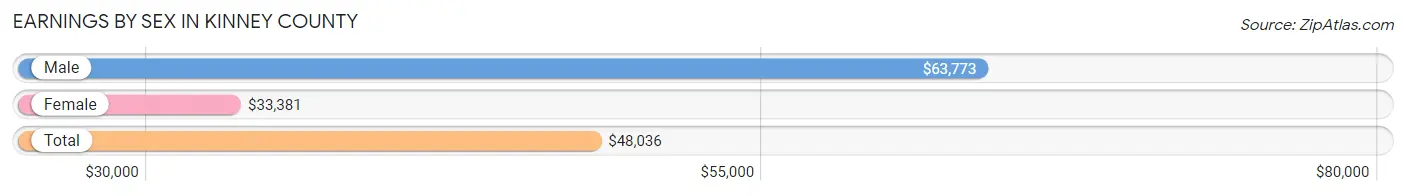
Earnings by Sex in Kinney County
Average Earnings in Kinney County are $48,036, $63,773 for men and $33,381 for women, a difference of 47.7%.
| Sex | Number | Average Earnings |
| Male | 756 (53.3%) | $63,773 |
| Female | 661 (46.7%) | $33,381 |
| Total | 1,417 (100.0%) | $48,036 |
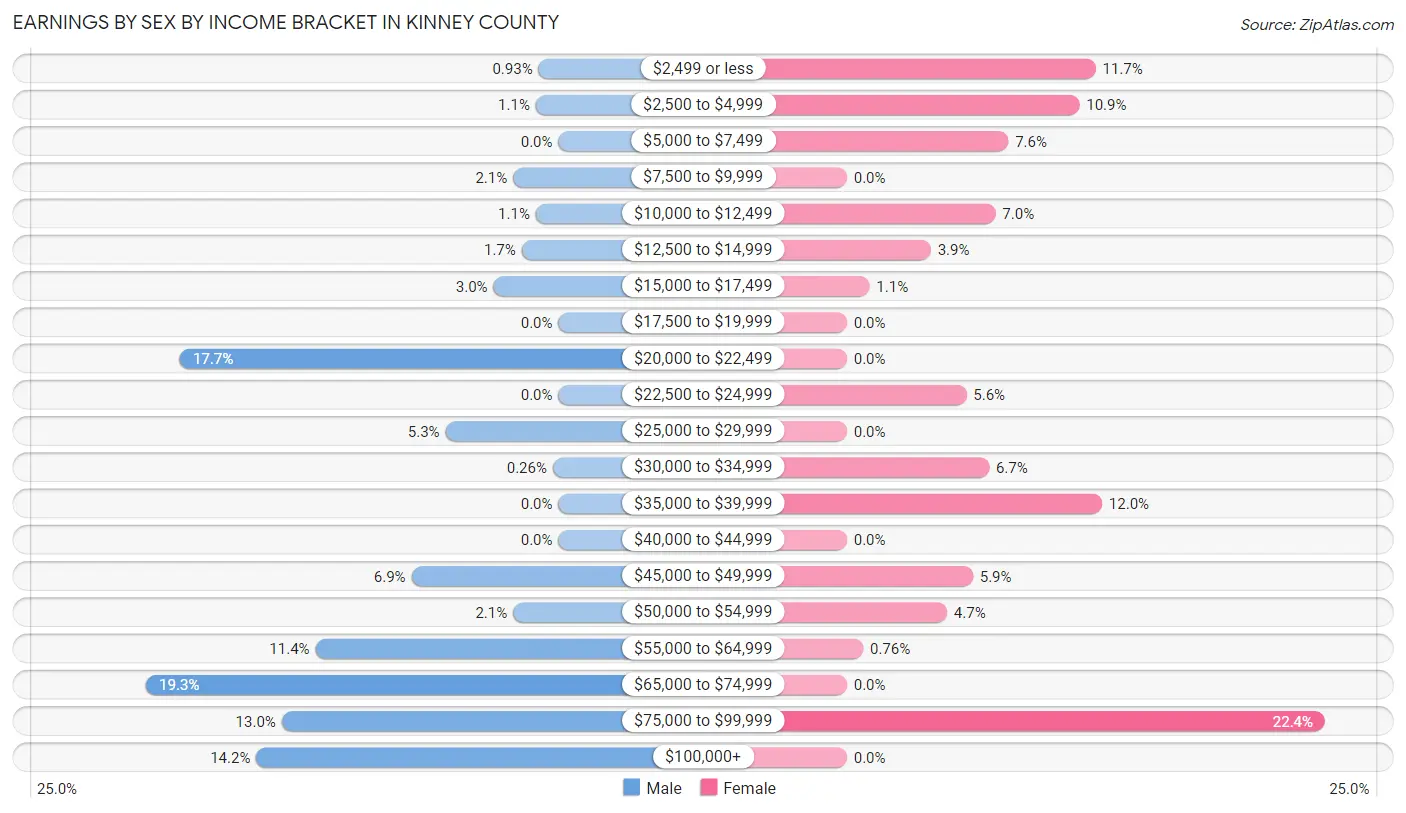
Earnings by Sex by Income Bracket in Kinney County
The most common earnings brackets in Kinney County are $65,000 to $74,999 for men (146 | 19.3%) and $75,000 to $99,999 for women (148 | 22.4%).
| Income | Male | Female |
| $2,499 or less | 7 (0.9%) | 77 (11.7%) |
| $2,500 to $4,999 | 8 (1.1%) | 72 (10.9%) |
| $5,000 to $7,499 | 0 (0.0%) | 50 (7.6%) |
| $7,500 to $9,999 | 16 (2.1%) | 0 (0.0%) |
| $10,000 to $12,499 | 8 (1.1%) | 46 (7.0%) |
| $12,500 to $14,999 | 13 (1.7%) | 26 (3.9%) |
| $15,000 to $17,499 | 23 (3.0%) | 7 (1.1%) |
| $17,500 to $19,999 | 0 (0.0%) | 0 (0.0%) |
| $20,000 to $22,499 | 134 (17.7%) | 0 (0.0%) |
| $22,500 to $24,999 | 0 (0.0%) | 37 (5.6%) |
| $25,000 to $29,999 | 40 (5.3%) | 0 (0.0%) |
| $30,000 to $34,999 | 2 (0.3%) | 44 (6.7%) |
| $35,000 to $39,999 | 0 (0.0%) | 79 (11.9%) |
| $40,000 to $44,999 | 0 (0.0%) | 0 (0.0%) |
| $45,000 to $49,999 | 52 (6.9%) | 39 (5.9%) |
| $50,000 to $54,999 | 16 (2.1%) | 31 (4.7%) |
| $55,000 to $64,999 | 86 (11.4%) | 5 (0.8%) |
| $65,000 to $74,999 | 146 (19.3%) | 0 (0.0%) |
| $75,000 to $99,999 | 98 (13.0%) | 148 (22.4%) |
| $100,000+ | 107 (14.1%) | 0 (0.0%) |
| Total | 756 (100.0%) | 661 (100.0%) |
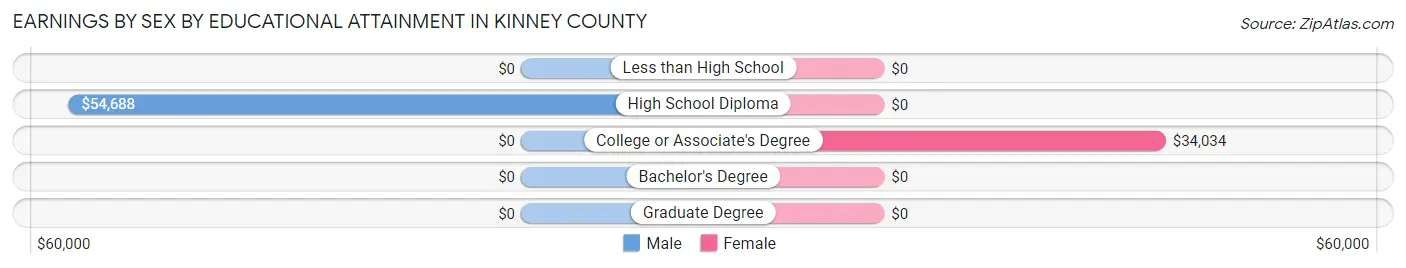
Earnings by Sex by Educational Attainment in Kinney County
Average earnings in Kinney County are $64,477 for men and $38,400 for women, a difference of 40.4%. Men with an educational attainment of high school diploma enjoy the highest average annual earnings of $54,688, while those with high school diploma education earn the least with $54,688. Women with an educational attainment of college or associate's degree earn the most with the average annual earnings of $34,034, while those with college or associate's degree education have the smallest earnings of $34,034.
| Educational Attainment | Male Income | Female Income |
| Less than High School | - | - |
| High School Diploma | $54,688 | $0 |
| College or Associate's Degree | - | - |
| Bachelor's Degree | - | - |
| Graduate Degree | - | - |
| Total | $64,477 | $38,400 |
Family Income in Kinney County
Family Income Brackets in Kinney County
According to the Kinney County family income data, there are 268 families falling into the $50,000 to $74,999 income range, which is the most common income bracket and makes up 44.8% of all families.
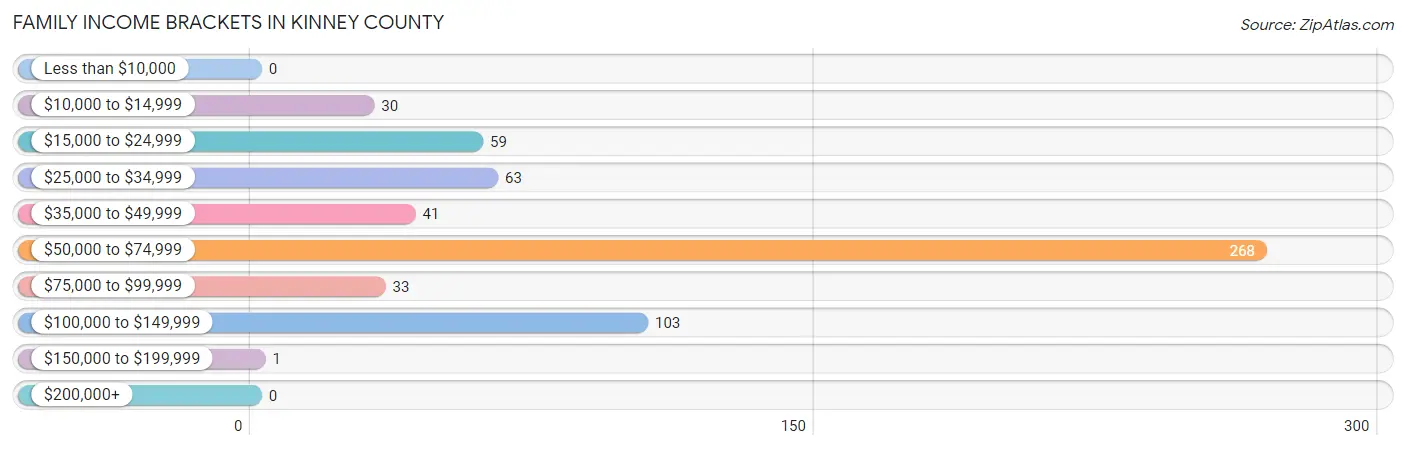
| Income Bracket | # Families | % Families |
| Less than $10,000 | 0 | 0.0% |
| $10,000 to $14,999 | 30 | 5.0% |
| $15,000 to $24,999 | 59 | 9.9% |
| $25,000 to $34,999 | 63 | 10.5% |
| $35,000 to $49,999 | 41 | 6.9% |
| $50,000 to $74,999 | 268 | 44.8% |
| $75,000 to $99,999 | 33 | 5.5% |
| $100,000 to $149,999 | 103 | 17.2% |
| $150,000 to $199,999 | 1 | 0.2% |
| $200,000+ | 0 | 0.0% |
Family Income by Famaliy Size in Kinney County
2-person families (341 | 57.0%) account for the highest median family income in Kinney County with $68,639 per family, while 2-person families (341 | 57.0%) have the highest median income of $34,320 per family member.
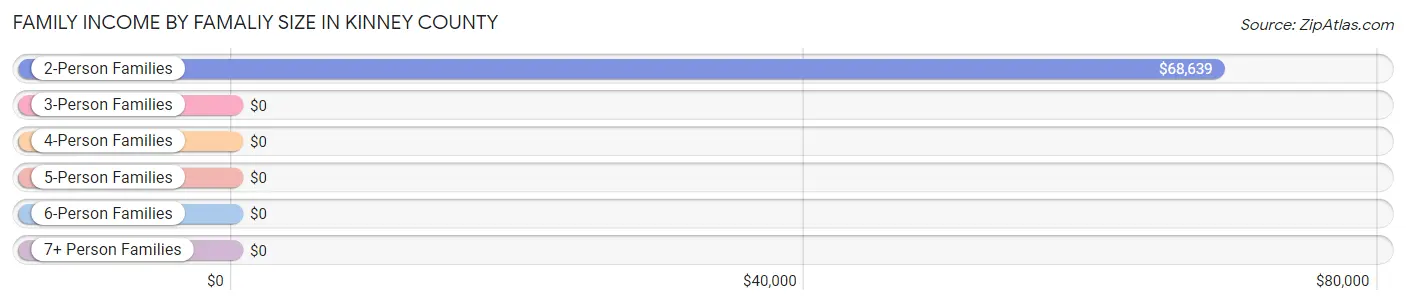
| Income Bracket | # Families | Median Income |
| 2-Person Families | 341 (57.0%) | $68,639 |
| 3-Person Families | 142 (23.7%) | $0 |
| 4-Person Families | 96 (16.1%) | $0 |
| 5-Person Families | 19 (3.2%) | $0 |
| 6-Person Families | 0 (0.0%) | $0 |
| 7+ Person Families | 0 (0.0%) | $0 |
| Total | 598 (100.0%) | $67,852 |
Family Income by Number of Earners in Kinney County
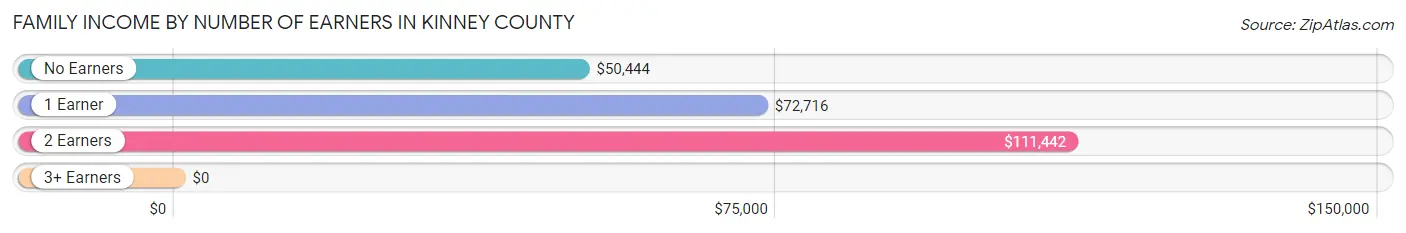
| Number of Earners | # Families | Median Income |
| No Earners | 275 (46.0%) | $50,444 |
| 1 Earner | 155 (25.9%) | $72,716 |
| 2 Earners | 103 (17.2%) | $111,442 |
| 3+ Earners | 65 (10.9%) | $0 |
| Total | 598 (100.0%) | $67,852 |
Household Income in Kinney County
Household Income Brackets in Kinney County
With 315 households falling in the category, the $50,000 to $74,999 income range is the most frequent in Kinney County, accounting for 28.5% of all households.
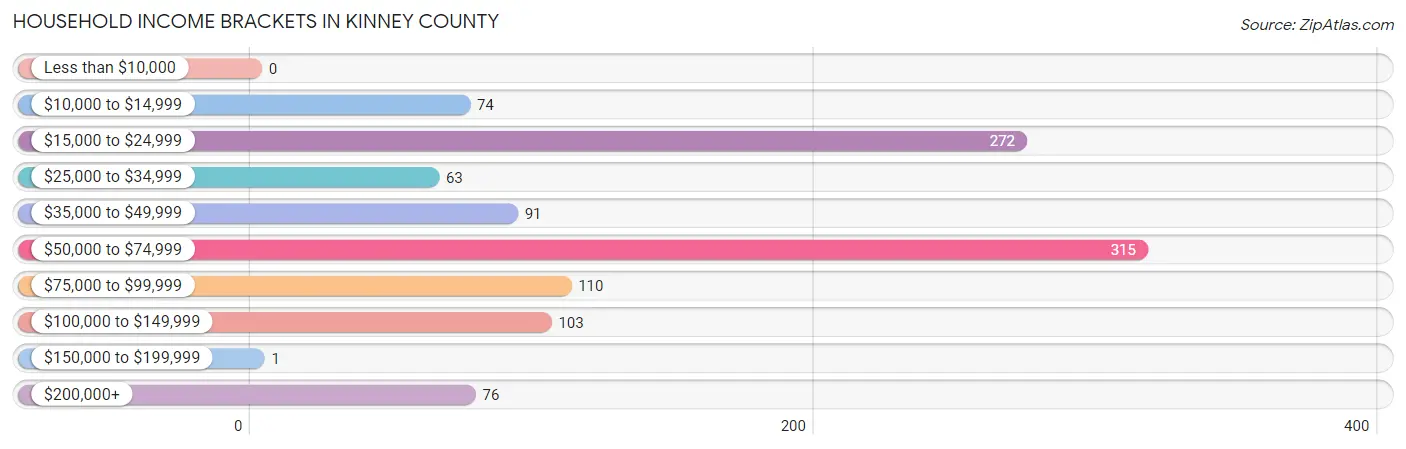
| Income Bracket | # Households | % Households |
| Less than $10,000 | 0 | 0.0% |
| $10,000 to $14,999 | 74 | 6.7% |
| $15,000 to $24,999 | 272 | 24.6% |
| $25,000 to $34,999 | 63 | 5.7% |
| $35,000 to $49,999 | 91 | 8.2% |
| $50,000 to $74,999 | 315 | 28.5% |
| $75,000 to $99,999 | 110 | 10.0% |
| $100,000 to $149,999 | 103 | 9.3% |
| $150,000 to $199,999 | 1 | 0.1% |
| $200,000+ | 76 | 6.9% |
Household Income by Householder Age in Kinney County
The median household income in Kinney County is $52,386, with the highest median household income of $67,632 found in the 45 to 64 years age bracket for the primary householder. A total of 480 households (43.4%) fall into this category. Meanwhile, the 15 to 24 years age bracket for the primary householder has the lowest median household income of $0, with 27 households (2.4%) in this group.
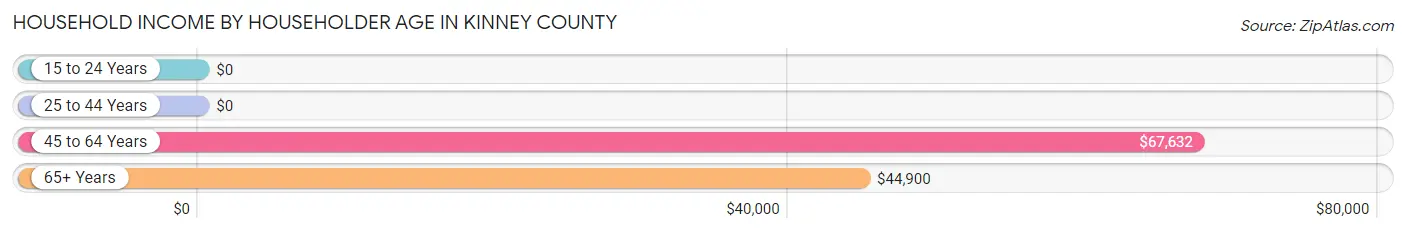
| Income Bracket | # Households | Median Income |
| 15 to 24 Years | 27 (2.4%) | $0 |
| 25 to 44 Years | 112 (10.1%) | $0 |
| 45 to 64 Years | 480 (43.4%) | $67,632 |
| 65+ Years | 486 (44.0%) | $44,900 |
| Total | 1,105 (100.0%) | $52,386 |
Poverty in Kinney County
Income Below Poverty by Sex and Age in Kinney County
With 15.4% poverty level for males and 16.0% for females among the residents of Kinney County, 15 year old males and 12 to 14 year old females are the most vulnerable to poverty, with 103 males (100.0%) and 25 females (100.0%) in their respective age groups living below the poverty level.
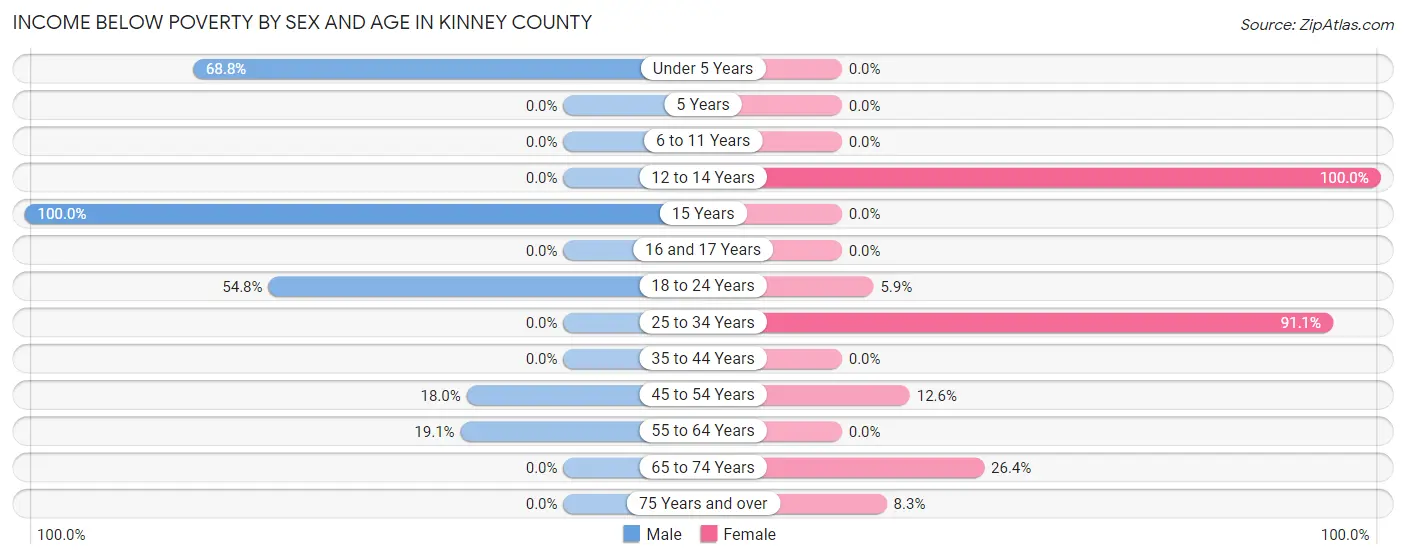
| Age Bracket | Male | Female |
| Under 5 Years | 44 (68.8%) | 0 (0.0%) |
| 5 Years | 0 (0.0%) | 0 (0.0%) |
| 6 to 11 Years | 0 (0.0%) | 0 (0.0%) |
| 12 to 14 Years | 0 (0.0%) | 25 (100.0%) |
| 15 Years | 103 (100.0%) | 0 (0.0%) |
| 16 and 17 Years | 0 (0.0%) | 0 (0.0%) |
| 18 to 24 Years | 23 (54.8%) | 10 (5.9%) |
| 25 to 34 Years | 0 (0.0%) | 72 (91.1%) |
| 35 to 44 Years | 0 (0.0%) | 0 (0.0%) |
| 45 to 54 Years | 53 (18.0%) | 13 (12.6%) |
| 55 to 64 Years | 43 (19.1%) | 0 (0.0%) |
| 65 to 74 Years | 0 (0.0%) | 56 (26.4%) |
| 75 Years and over | 0 (0.0%) | 17 (8.3%) |
| Total | 266 (15.4%) | 193 (16.0%) |
Income Above Poverty by Sex and Age in Kinney County
According to the poverty statistics in Kinney County, males aged 5 years and females aged under 5 years are the age groups that are most secure financially, with 100.0% of males and 100.0% of females in these age groups living above the poverty line.
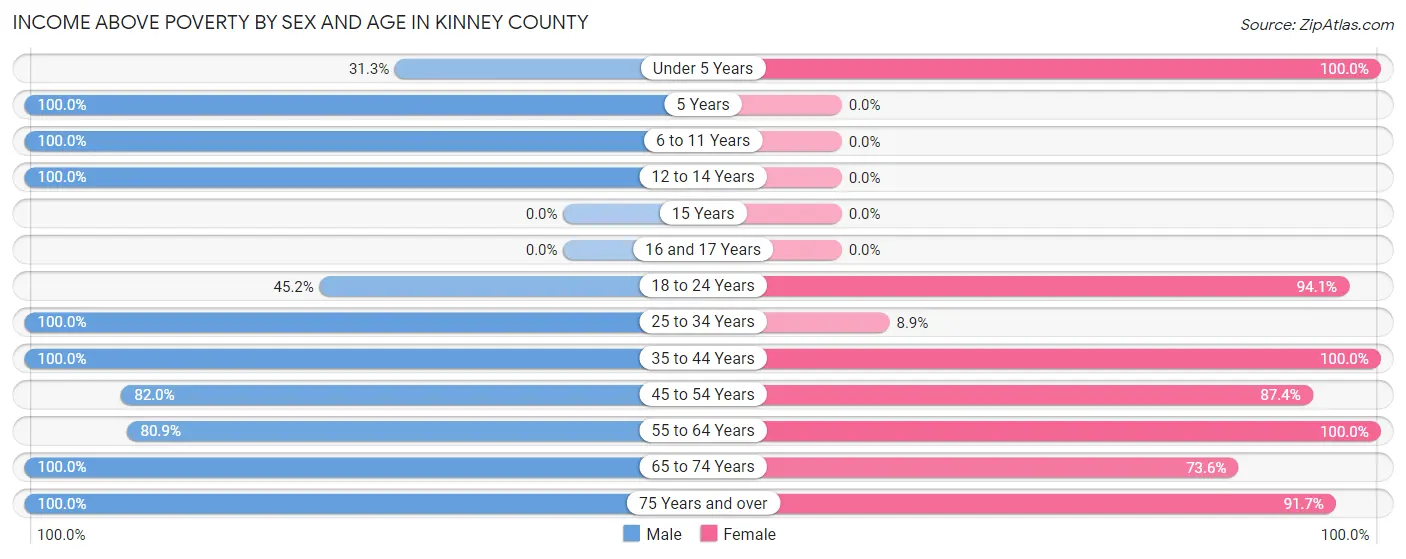
| Age Bracket | Male | Female |
| Under 5 Years | 20 (31.2%) | 71 (100.0%) |
| 5 Years | 31 (100.0%) | 0 (0.0%) |
| 6 to 11 Years | 48 (100.0%) | 0 (0.0%) |
| 12 to 14 Years | 29 (100.0%) | 0 (0.0%) |
| 15 Years | 0 (0.0%) | 0 (0.0%) |
| 16 and 17 Years | 0 (0.0%) | 0 (0.0%) |
| 18 to 24 Years | 19 (45.2%) | 160 (94.1%) |
| 25 to 34 Years | 467 (100.0%) | 7 (8.9%) |
| 35 to 44 Years | 82 (100.0%) | 63 (100.0%) |
| 45 to 54 Years | 242 (82.0%) | 90 (87.4%) |
| 55 to 64 Years | 182 (80.9%) | 283 (100.0%) |
| 65 to 74 Years | 145 (100.0%) | 156 (73.6%) |
| 75 Years and over | 197 (100.0%) | 187 (91.7%) |
| Total | 1,462 (84.6%) | 1,017 (84.1%) |
Income Below Poverty Among Married-Couple Families in Kinney County
The poverty statistics for married-couple families in Kinney County show that 1.9% or 8 of the total 423 families live below the poverty line. Families with 1 or 2 children have the highest poverty rate of 29.6%, comprising of 8 families. On the other hand, families with no children have the lowest poverty rate of 0.0%, which includes 0 families.
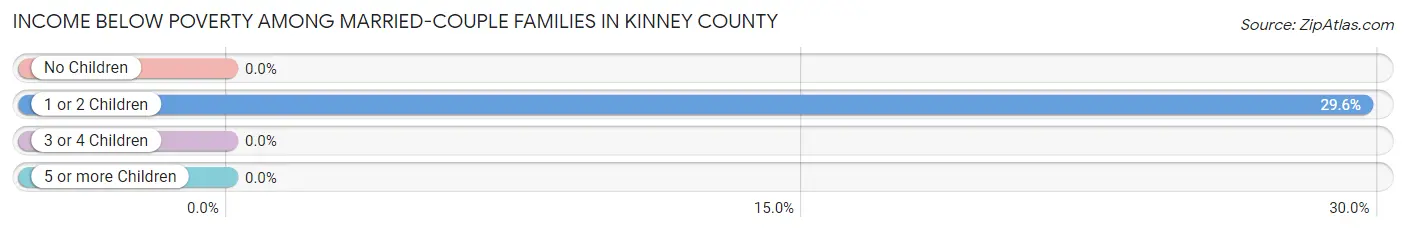
| Children | Above Poverty | Below Poverty |
| No Children | 377 (100.0%) | 0 (0.0%) |
| 1 or 2 Children | 19 (70.4%) | 8 (29.6%) |
| 3 or 4 Children | 19 (100.0%) | 0 (0.0%) |
| 5 or more Children | 0 (0.0%) | 0 (0.0%) |
| Total | 415 (98.1%) | 8 (1.9%) |
Income Below Poverty Among Single-Parent Households in Kinney County
According to the poverty data in Kinney County, 40.5% or 30 single-father households and 29.7% or 30 single-mother households are living below the poverty line. Among single-father households, those with 1 or 2 children have the highest poverty rate, with 30 households (100.0%) experiencing poverty. Likewise, among single-mother households, those with 1 or 2 children have the highest poverty rate, with 13 households (65.0%) falling below the poverty line.
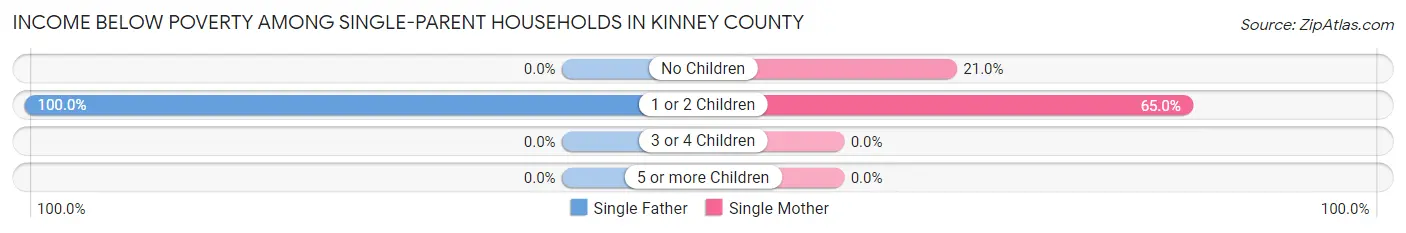
| Children | Single Father | Single Mother |
| No Children | 0 (0.0%) | 17 (21.0%) |
| 1 or 2 Children | 30 (100.0%) | 13 (65.0%) |
| 3 or 4 Children | 0 (0.0%) | 0 (0.0%) |
| 5 or more Children | 0 (0.0%) | 0 (0.0%) |
| Total | 30 (40.5%) | 30 (29.7%) |
Income Below Poverty Among Married-Couple vs Single-Parent Households in Kinney County
The poverty data for Kinney County shows that 8 of the married-couple family households (1.9%) and 60 of the single-parent households (34.3%) are living below the poverty level. Within the married-couple family households, those with 1 or 2 children have the highest poverty rate, with 8 households (29.6%) falling below the poverty line. Among the single-parent households, those with 1 or 2 children have the highest poverty rate, with 43 household (86.0%) living below poverty.
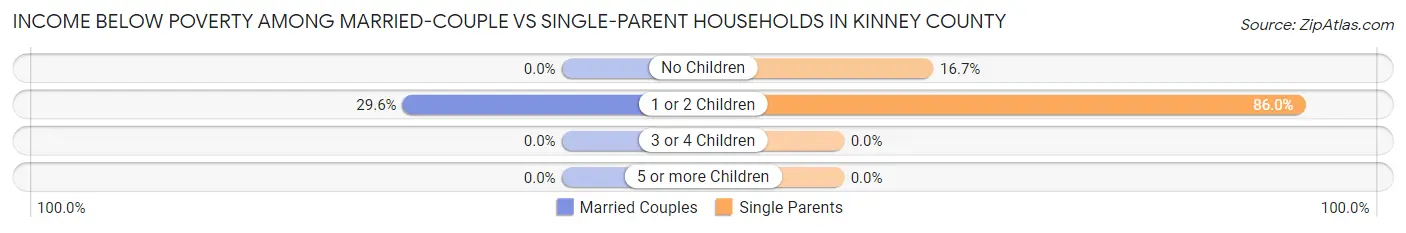
| Children | Married-Couple Families | Single-Parent Households |
| No Children | 0 (0.0%) | 17 (16.7%) |
| 1 or 2 Children | 8 (29.6%) | 43 (86.0%) |
| 3 or 4 Children | 0 (0.0%) | 0 (0.0%) |
| 5 or more Children | 0 (0.0%) | 0 (0.0%) |
| Total | 8 (1.9%) | 60 (34.3%) |
Race in Kinney County
The most populous races in Kinney County are White / Caucasian (2,661 | 84.3%), Hispanic or Latino (2,032 | 64.4%), and Two or more Races (460 | 14.6%).
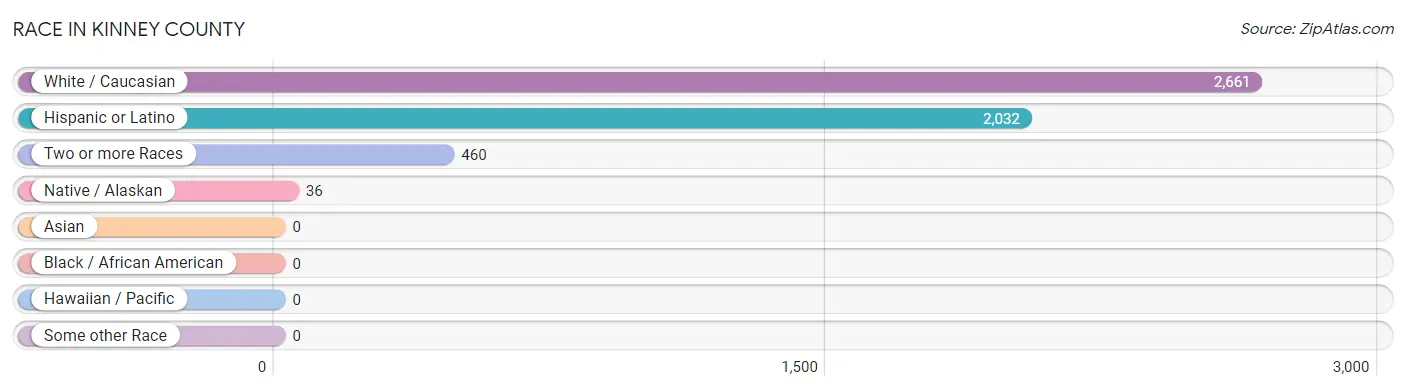
| Race | # Population | % Population |
| Asian | 0 | 0.0% |
| Black / African American | 0 | 0.0% |
| Hawaiian / Pacific | 0 | 0.0% |
| Hispanic or Latino | 2,032 | 64.4% |
| Native / Alaskan | 36 | 1.1% |
| White / Caucasian | 2,661 | 84.3% |
| Two or more Races | 460 | 14.6% |
| Some other Race | 0 | 0.0% |
| Total | 3,157 | 100.0% |
Ancestry in Kinney County
The most populous ancestries reported in Kinney County are Mexican (1,772 | 56.1%), Irish (240 | 7.6%), British (211 | 6.7%), German (201 | 6.4%), and English (113 | 3.6%), together accounting for 80.4% of all Kinney County residents.
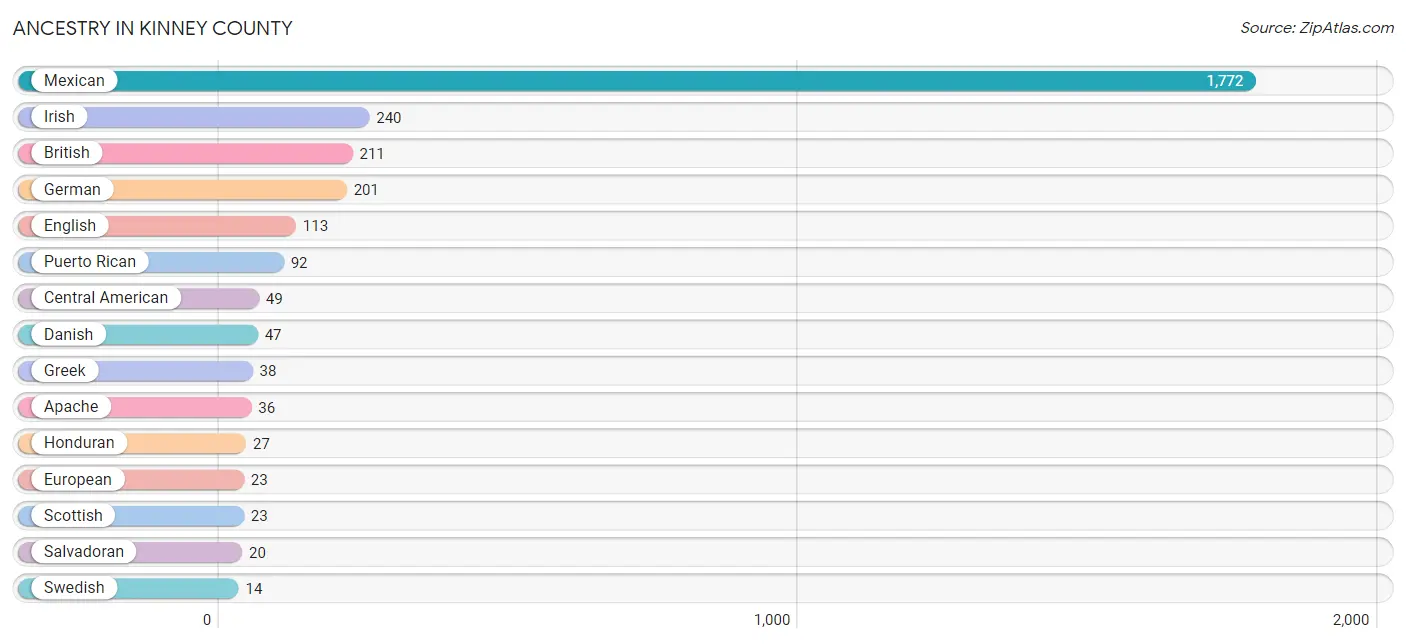
| Ancestry | # Population | % Population |
| Apache | 36 | 1.1% |
| British | 211 | 6.7% |
| Central American | 49 | 1.5% |
| Cherokee | 13 | 0.4% |
| Colombian | 1 | 0.0% |
| Danish | 47 | 1.5% |
| English | 113 | 3.6% |
| European | 23 | 0.7% |
| French | 8 | 0.3% |
| German | 201 | 6.4% |
| Greek | 38 | 1.2% |
| Guatemalan | 2 | 0.1% |
| Honduran | 27 | 0.9% |
| Irish | 240 | 7.6% |
| Italian | 12 | 0.4% |
| Mexican | 1,772 | 56.1% |
| Puerto Rican | 92 | 2.9% |
| Salvadoran | 20 | 0.6% |
| Scottish | 23 | 0.7% |
| South American | 1 | 0.0% |
| Swedish | 14 | 0.4% |
| Welsh | 5 | 0.2% | View All 22 Rows |
Immigrants in Kinney County
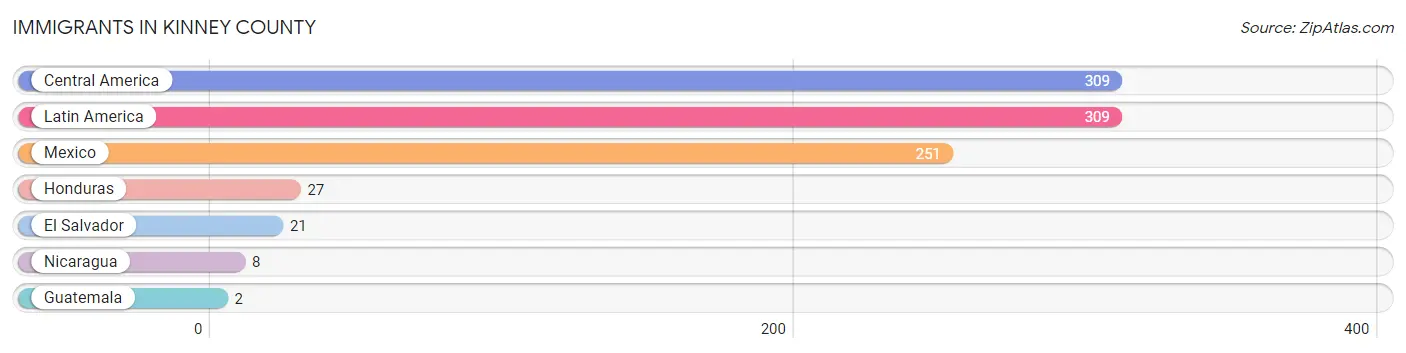
The most numerous immigrant groups reported in Kinney County came from Central America (309 | 9.8%), Latin America (309 | 9.8%), Mexico (251 | 8.0%), Honduras (27 | 0.9%), and El Salvador (21 | 0.7%), together accounting for 29.1% of all Kinney County residents.
| Immigration Origin | # Population | % Population |
| Central America | 309 | 9.8% |
| El Salvador | 21 | 0.7% |
| Guatemala | 2 | 0.1% |
| Honduras | 27 | 0.9% |
| Latin America | 309 | 9.8% |
| Mexico | 251 | 8.0% |
| Nicaragua | 8 | 0.3% | View All 7 Rows |
Sex and Age in Kinney County
Sex and Age in Kinney County
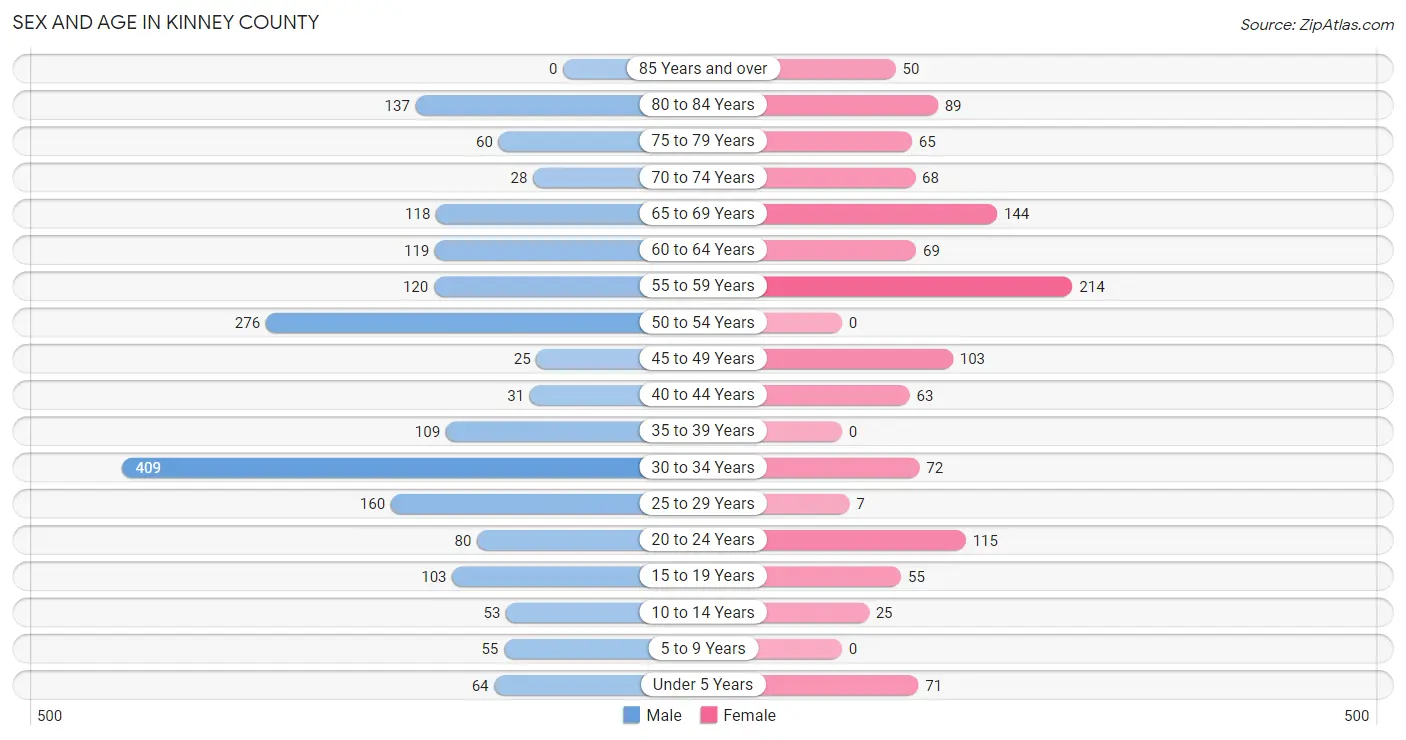
The most populous age groups in Kinney County are 30 to 34 Years (409 | 21.0%) for men and 55 to 59 Years (214 | 17.7%) for women.
| Age Bracket | Male | Female |
| Under 5 Years | 64 (3.3%) | 71 (5.9%) |
| 5 to 9 Years | 55 (2.8%) | 0 (0.0%) |
| 10 to 14 Years | 53 (2.7%) | 25 (2.1%) |
| 15 to 19 Years | 103 (5.3%) | 55 (4.5%) |
| 20 to 24 Years | 80 (4.1%) | 115 (9.5%) |
| 25 to 29 Years | 160 (8.2%) | 7 (0.6%) |
| 30 to 34 Years | 409 (21.0%) | 72 (5.9%) |
| 35 to 39 Years | 109 (5.6%) | 0 (0.0%) |
| 40 to 44 Years | 31 (1.6%) | 63 (5.2%) |
| 45 to 49 Years | 25 (1.3%) | 103 (8.5%) |
| 50 to 54 Years | 276 (14.2%) | 0 (0.0%) |
| 55 to 59 Years | 120 (6.2%) | 214 (17.7%) |
| 60 to 64 Years | 119 (6.1%) | 69 (5.7%) |
| 65 to 69 Years | 118 (6.1%) | 144 (11.9%) |
| 70 to 74 Years | 28 (1.4%) | 68 (5.6%) |
| 75 to 79 Years | 60 (3.1%) | 65 (5.4%) |
| 80 to 84 Years | 137 (7.0%) | 89 (7.4%) |
| 85 Years and over | 0 (0.0%) | 50 (4.1%) |
| Total | 1,947 (100.0%) | 1,210 (100.0%) |
Families and Households in Kinney County
Median Family Size in Kinney County
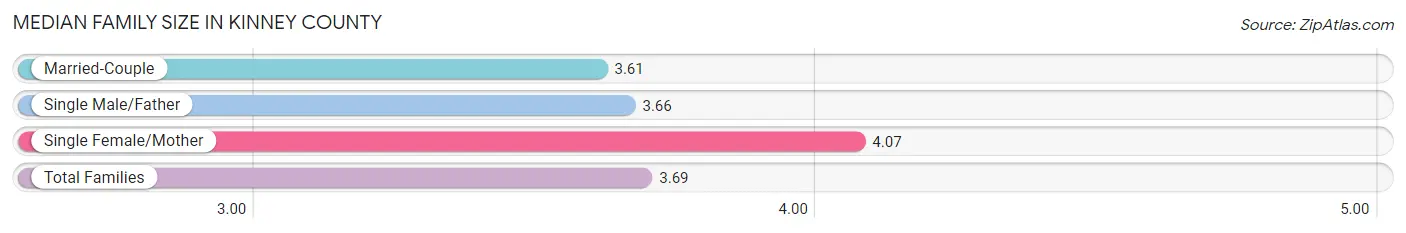
The median family size in Kinney County is 3.69 persons per family, with single female/mother families (101 | 16.9%) accounting for the largest median family size of 4.07 persons per family. On the other hand, married-couple families (423 | 70.7%) represent the smallest median family size with 3.61 persons per family.
| Family Type | # Families | Family Size |
| Married-Couple | 423 (70.7%) | 3.61 |
| Single Male/Father | 74 (12.4%) | 3.66 |
| Single Female/Mother | 101 (16.9%) | 4.07 |
| Total Families | 598 (100.0%) | 3.69 |
Median Household Size in Kinney County
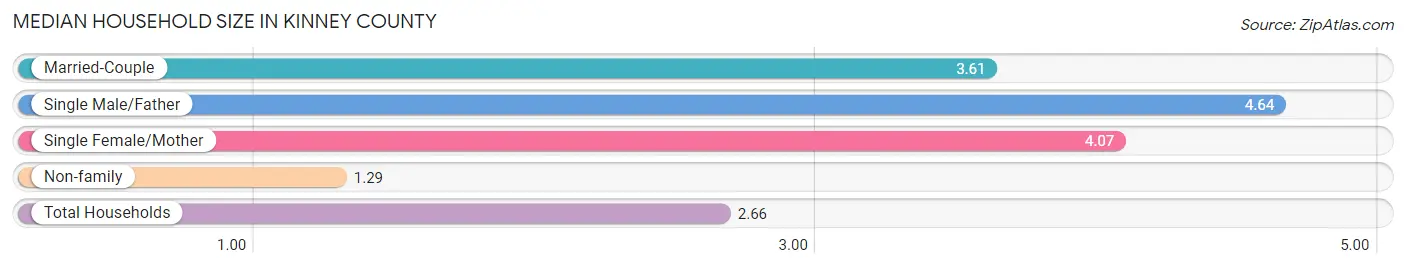
The median household size in Kinney County is 2.66 persons per household, with single male/father households (74 | 6.7%) accounting for the largest median household size of 4.64 persons per household. non-family households (507 | 45.9%) represent the smallest median household size with 1.29 persons per household.
| Household Type | # Households | Household Size |
| Married-Couple | 423 (38.3%) | 3.61 |
| Single Male/Father | 74 (6.7%) | 4.64 |
| Single Female/Mother | 101 (9.1%) | 4.07 |
| Non-family | 507 (45.9%) | 1.29 |
| Total Households | 1,105 (100.0%) | 2.66 |
Household Size by Marriage Status in Kinney County
Out of a total of 1,105 households in Kinney County, 598 (54.1%) are family households, while 507 (45.9%) are nonfamily households. The most numerous type of family households are 2-person households, comprising 341, and the most common type of nonfamily households are 1-person households, comprising 431.
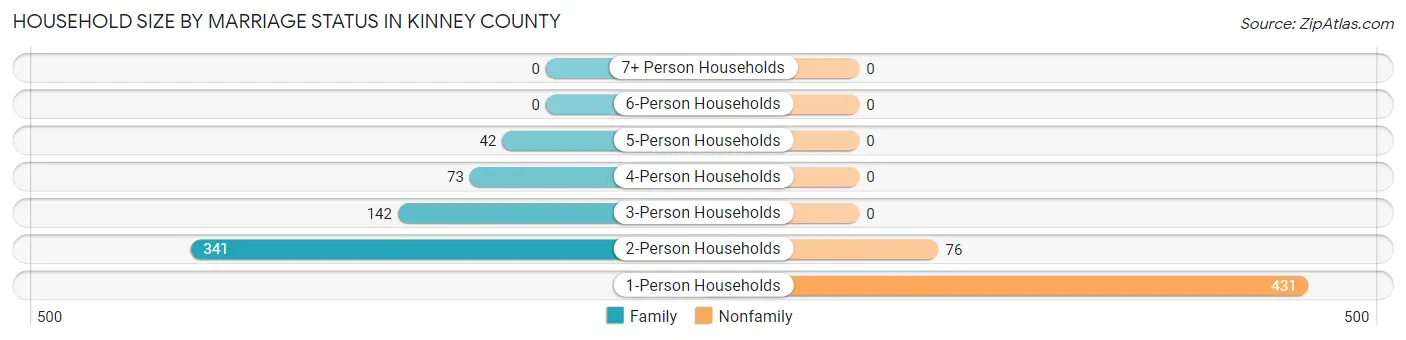
| Household Size | Family Households | Nonfamily Households |
| 1-Person Households | - | 431 (39.0%) |
| 2-Person Households | 341 (30.9%) | 76 (6.9%) |
| 3-Person Households | 142 (12.9%) | 0 (0.0%) |
| 4-Person Households | 73 (6.6%) | 0 (0.0%) |
| 5-Person Households | 42 (3.8%) | 0 (0.0%) |
| 6-Person Households | 0 (0.0%) | 0 (0.0%) |
| 7+ Person Households | 0 (0.0%) | 0 (0.0%) |
| Total | 598 (54.1%) | 507 (45.9%) |
Female Fertility in Kinney County
Fertility by Age in Kinney County
Average fertility rate in Kinney County is 46.0 births per 1,000 women. Women in the age bracket of 20 to 34 years have the highest fertility rate with 98.0 births per 1,000 women. Women in the age bracket of 20 to 34 years acount for 100.0% of all women with births.
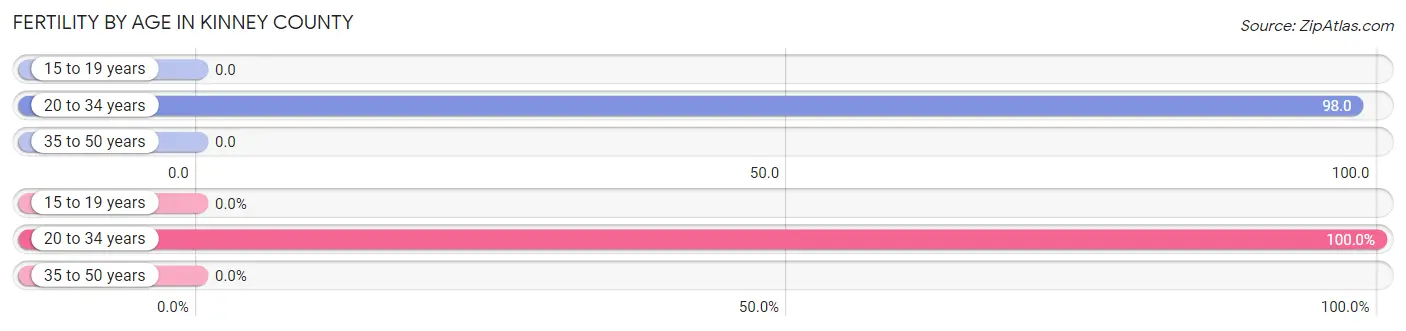
| Age Bracket | Women with Births | Births / 1,000 Women |
| 15 to 19 years | 0 (0.0%) | 0.0 |
| 20 to 34 years | 19 (100.0%) | 98.0 |
| 35 to 50 years | 0 (0.0%) | 0.0 |
| Total | 19 (100.0%) | 46.0 |
Fertility by Age by Marriage Status in Kinney County
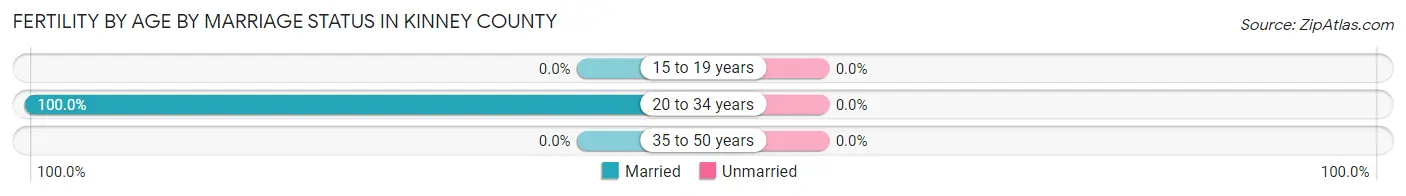
| Age Bracket | Married | Unmarried |
| 15 to 19 years | 0 (0.0%) | 0 (0.0%) |
| 20 to 34 years | 19 (100.0%) | 0 (0.0%) |
| 35 to 50 years | 0 (0.0%) | 0 (0.0%) |
| Total | 19 (100.0%) | 0 (0.0%) |
Fertility by Education in Kinney County
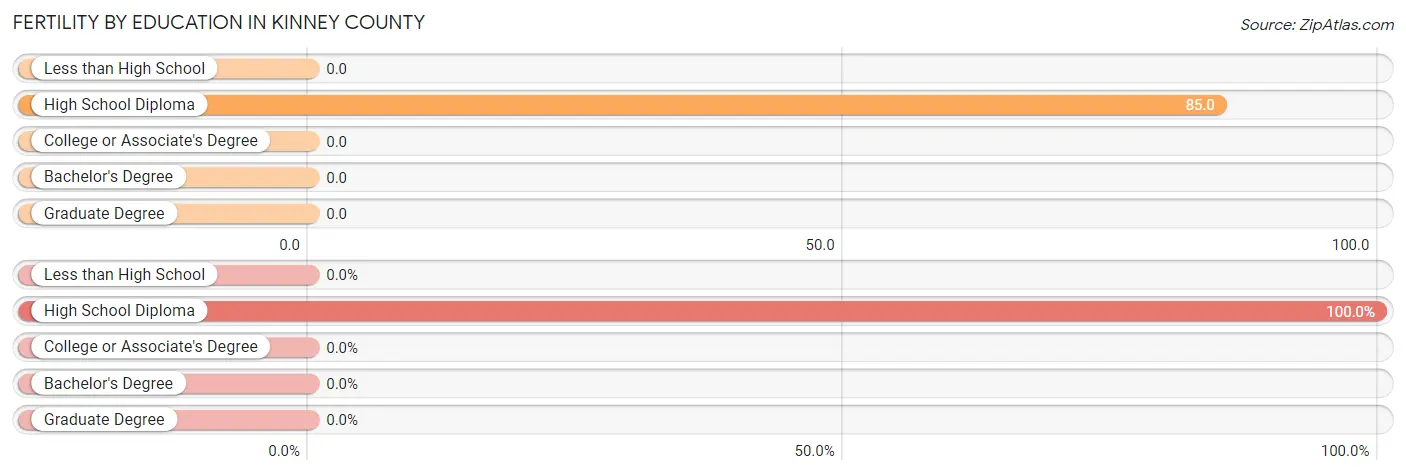
| Educational Attainment | Women with Births | Births / 1,000 Women |
| Less than High School | 0 (0.0%) | 0.0 |
| High School Diploma | 19 (100.0%) | 85.0 |
| College or Associate's Degree | 0 (0.0%) | 0.0 |
| Bachelor's Degree | 0 (0.0%) | 0.0 |
| Graduate Degree | 0 (0.0%) | 0.0 |
| Total | 19 (100.0%) | 46.0 |
Fertility by Education by Marriage Status in Kinney County
| Educational Attainment | Married | Unmarried |
| Less than High School | 0 (0.0%) | 0 (0.0%) |
| High School Diploma | 19 (100.0%) | 0 (0.0%) |
| College or Associate's Degree | 0 (0.0%) | 0 (0.0%) |
| Bachelor's Degree | 0 (0.0%) | 0 (0.0%) |
| Graduate Degree | 0 (0.0%) | 0 (0.0%) |
| Total | 19 (100.0%) | 0 (0.0%) |
Employment Characteristics in Kinney County
Employment by Class of Employer in Kinney County
Among the 1,314 employed individuals in Kinney County, private company employees (538 | 40.9%), local government employees (362 | 27.6%), and federal government employees (171 | 13.0%) make up the most common classes of employment.
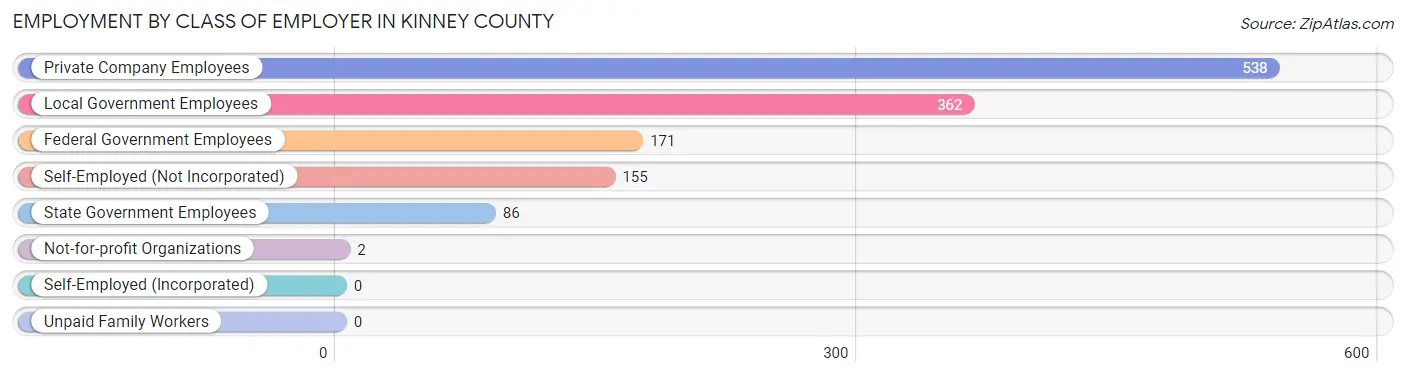
| Employer Class | # Employees | % Employees |
| Private Company Employees | 538 | 40.9% |
| Self-Employed (Incorporated) | 0 | 0.0% |
| Self-Employed (Not Incorporated) | 155 | 11.8% |
| Not-for-profit Organizations | 2 | 0.2% |
| Local Government Employees | 362 | 27.6% |
| State Government Employees | 86 | 6.5% |
| Federal Government Employees | 171 | 13.0% |
| Unpaid Family Workers | 0 | 0.0% |
| Total | 1,314 | 100.0% |
Employment Status by Age in Kinney County
According to the labor force statistics for Kinney County, out of the total population over 16 years of age (2,786), 48.1% or 1,340 individuals are in the labor force, with 1.9% or 25 of them unemployed. The age group with the highest labor force participation rate is 55 to 59 years, with 79.0% or 264 individuals in the labor force. Within the labor force, the 20 to 24 years age range has the highest percentage of unemployed individuals, with 14.6% or 19 of them being unemployed.
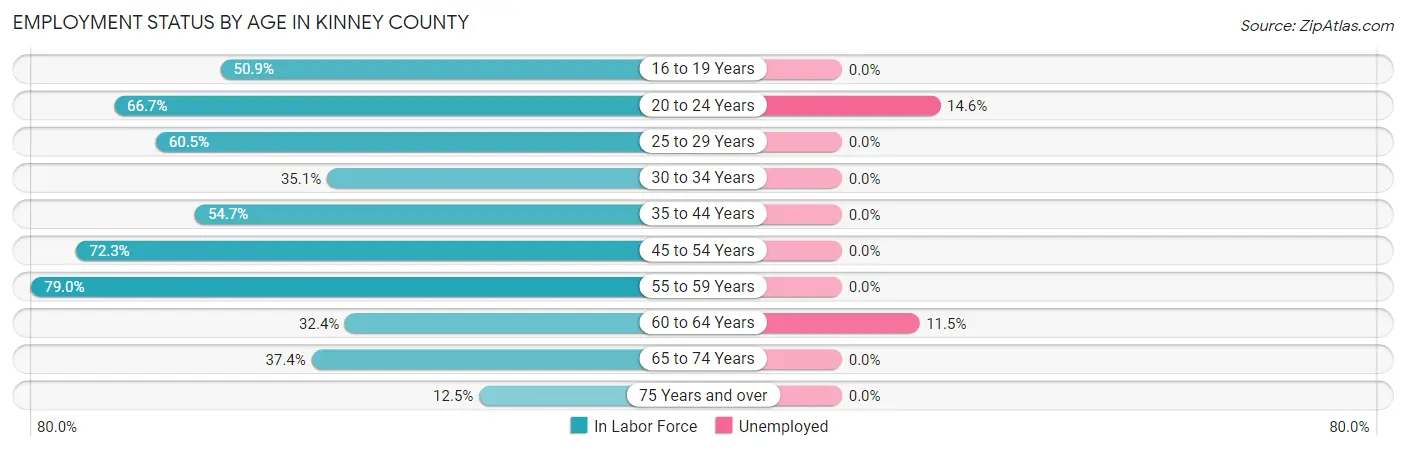
| Age Bracket | In Labor Force | Unemployed |
| 16 to 19 Years | 28 (50.9%) | 0 (0.0%) |
| 20 to 24 Years | 130 (66.7%) | 19 (14.6%) |
| 25 to 29 Years | 101 (60.5%) | 0 (0.0%) |
| 30 to 34 Years | 169 (35.1%) | 0 (0.0%) |
| 35 to 44 Years | 111 (54.7%) | 0 (0.0%) |
| 45 to 54 Years | 292 (72.3%) | 0 (0.0%) |
| 55 to 59 Years | 264 (79.0%) | 0 (0.0%) |
| 60 to 64 Years | 61 (32.4%) | 7 (11.5%) |
| 65 to 74 Years | 134 (37.4%) | 0 (0.0%) |
| 75 Years and over | 50 (12.5%) | 0 (0.0%) |
| Total | 1,340 (48.1%) | 25 (1.9%) |
Employment Status by Educational Attainment in Kinney County
According to labor force statistics for Kinney County, 56.2% of individuals (999) out of the total population between 25 and 64 years of age (1,777) are in the labor force, with 0.7% or 7 of them being unemployed. The group with the highest labor force participation rate are those with the educational attainment of high school diploma, with 82.7% or 435 individuals in the labor force. Within the labor force, individuals with college / associate degree education have the highest percentage of unemployment, with 2.3% or 7 of them being unemployed.
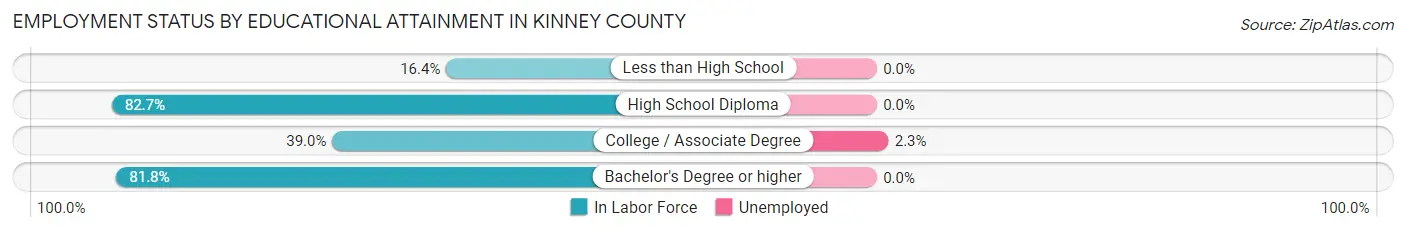
| Educational Attainment | In Labor Force | Unemployed |
| Less than High School | 31 (16.4%) | 0 (0.0%) |
| High School Diploma | 435 (82.7%) | 0 (0.0%) |
| College / Associate Degree | 307 (39.0%) | 18 (2.3%) |
| Bachelor's Degree or higher | 225 (81.8%) | 0 (0.0%) |
| Total | 999 (56.2%) | 12 (0.7%) |
Employment Occupations by Sex in Kinney County
Management, Business, Science and Arts Occupations
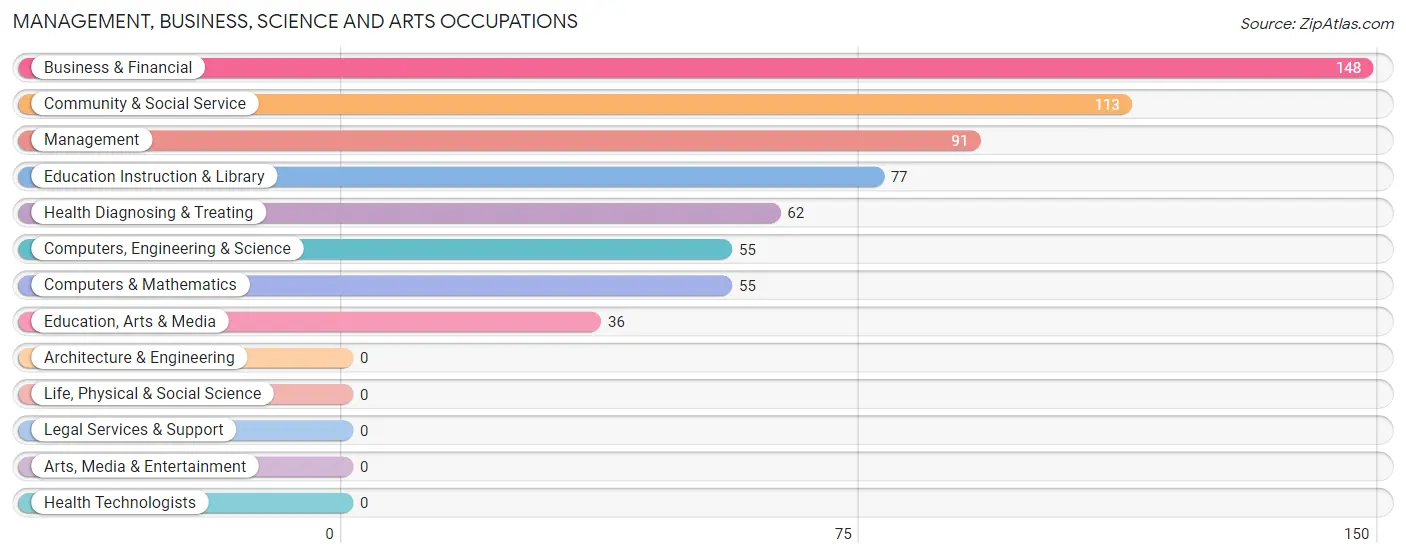
The most common Management, Business, Science and Arts occupations in Kinney County are Business & Financial (148 | 11.3%), Community & Social Service (113 | 8.6%), Management (91 | 6.9%), Education Instruction & Library (77 | 5.9%), and Health Diagnosing & Treating (62 | 4.7%).
Management, Business, Science and Arts Occupations by Sex
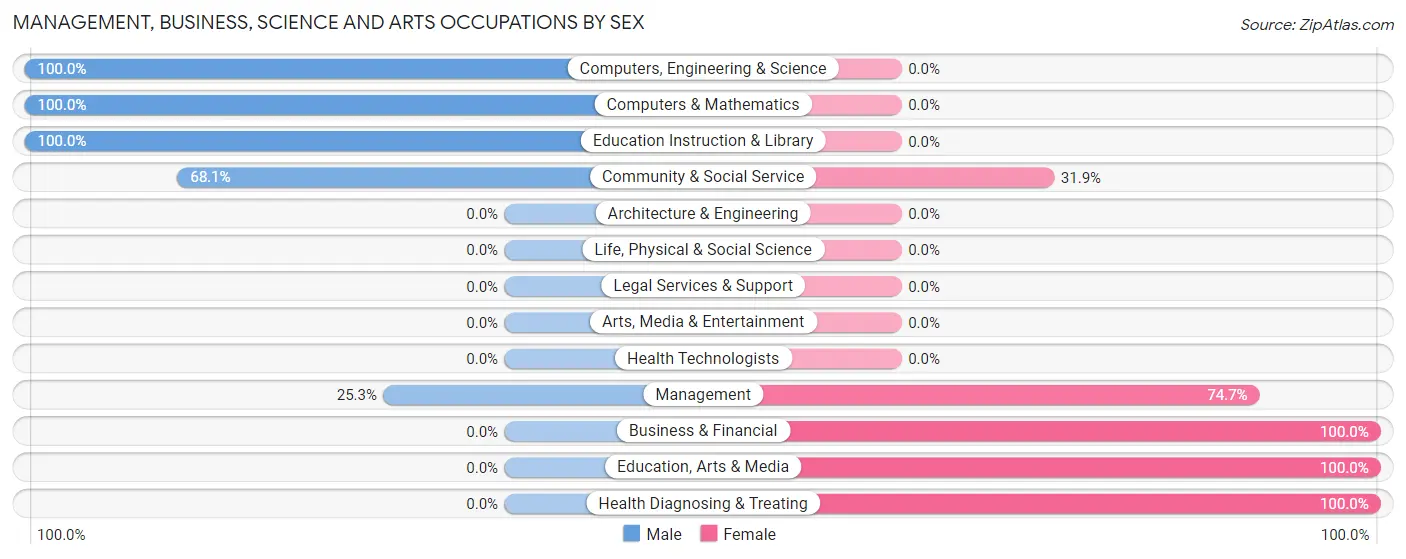
Within the Management, Business, Science and Arts occupations in Kinney County, the most male-oriented occupations are Computers, Engineering & Science (100.0%), Computers & Mathematics (100.0%), and Education Instruction & Library (100.0%), while the most female-oriented occupations are Business & Financial (100.0%), Education, Arts & Media (100.0%), and Health Diagnosing & Treating (100.0%).
| Occupation | Male | Female |
| Management | 23 (25.3%) | 68 (74.7%) |
| Business & Financial | 0 (0.0%) | 148 (100.0%) |
| Computers, Engineering & Science | 55 (100.0%) | 0 (0.0%) |
| Computers & Mathematics | 55 (100.0%) | 0 (0.0%) |
| Architecture & Engineering | 0 (0.0%) | 0 (0.0%) |
| Life, Physical & Social Science | 0 (0.0%) | 0 (0.0%) |
| Community & Social Service | 77 (68.1%) | 36 (31.9%) |
| Education, Arts & Media | 0 (0.0%) | 36 (100.0%) |
| Legal Services & Support | 0 (0.0%) | 0 (0.0%) |
| Education Instruction & Library | 77 (100.0%) | 0 (0.0%) |
| Arts, Media & Entertainment | 0 (0.0%) | 0 (0.0%) |
| Health Diagnosing & Treating | 0 (0.0%) | 62 (100.0%) |
| Health Technologists | 0 (0.0%) | 0 (0.0%) |
| Total (Category) | 155 (33.1%) | 314 (66.9%) |
| Total (Overall) | 688 (52.4%) | 626 (47.6%) |
Services Occupations
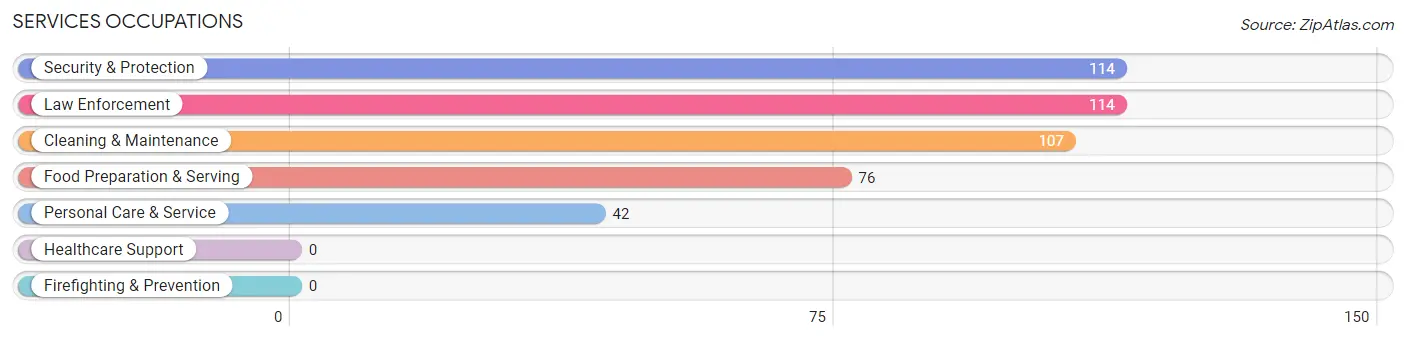
The most common Services occupations in Kinney County are Security & Protection (114 | 8.7%), Law Enforcement (114 | 8.7%), Cleaning & Maintenance (107 | 8.1%), Food Preparation & Serving (76 | 5.8%), and Personal Care & Service (42 | 3.2%).
Services Occupations by Sex
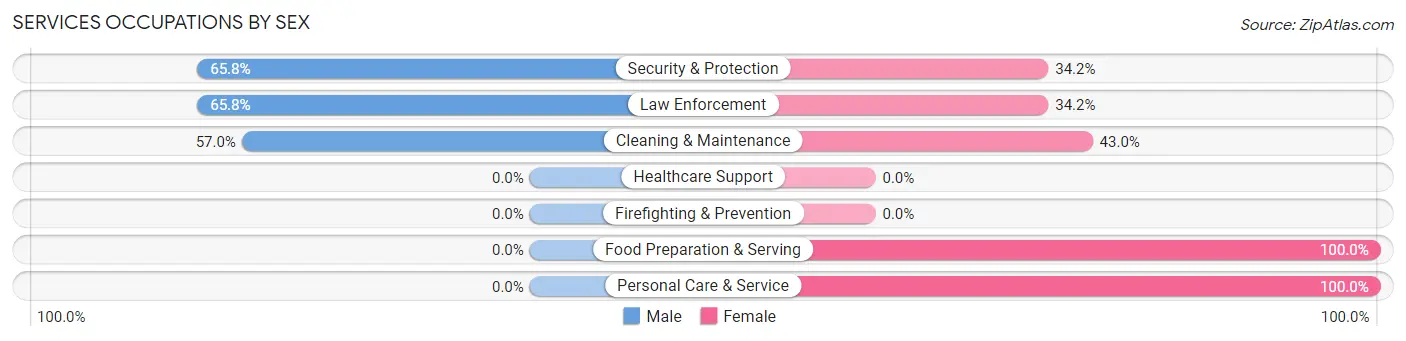
Within the Services occupations in Kinney County, the most male-oriented occupations are Security & Protection (65.8%), Law Enforcement (65.8%), and Cleaning & Maintenance (57.0%), while the most female-oriented occupations are Food Preparation & Serving (100.0%), Personal Care & Service (100.0%), and Cleaning & Maintenance (43.0%).
| Occupation | Male | Female |
| Healthcare Support | 0 (0.0%) | 0 (0.0%) |
| Security & Protection | 75 (65.8%) | 39 (34.2%) |
| Firefighting & Prevention | 0 (0.0%) | 0 (0.0%) |
| Law Enforcement | 75 (65.8%) | 39 (34.2%) |
| Food Preparation & Serving | 0 (0.0%) | 76 (100.0%) |
| Cleaning & Maintenance | 61 (57.0%) | 46 (43.0%) |
| Personal Care & Service | 0 (0.0%) | 42 (100.0%) |
| Total (Category) | 136 (40.1%) | 203 (59.9%) |
| Total (Overall) | 688 (52.4%) | 626 (47.6%) |
Sales and Office Occupations
The most common Sales and Office occupations in Kinney County are Sales & Related (101 | 7.7%), and Office & Administration (29 | 2.2%).
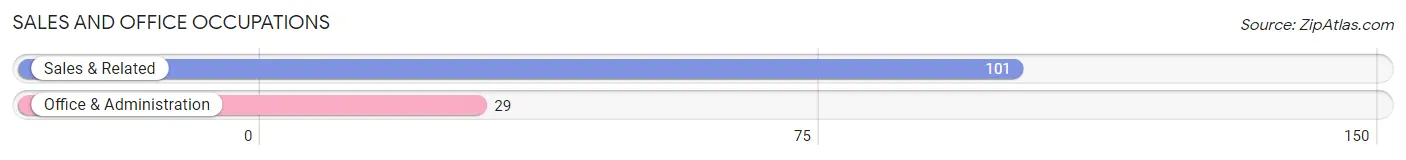
Sales and Office Occupations by Sex
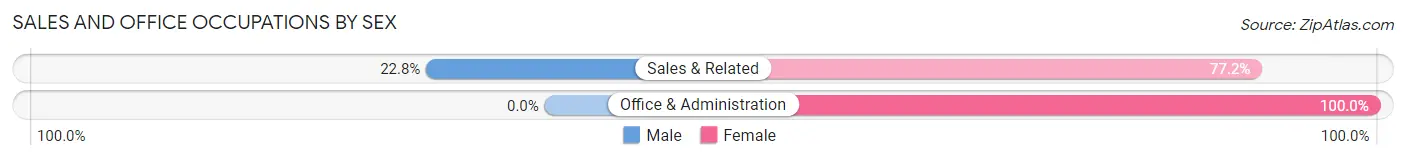
| Occupation | Male | Female |
| Sales & Related | 23 (22.8%) | 78 (77.2%) |
| Office & Administration | 0 (0.0%) | 29 (100.0%) |
| Total (Category) | 23 (17.7%) | 107 (82.3%) |
| Total (Overall) | 688 (52.4%) | 626 (47.6%) |
Natural Resources, Construction and Maintenance Occupations
The most common Natural Resources, Construction and Maintenance occupations in Kinney County are Construction & Extraction (40 | 3.0%), Installation, Maintenance & Repair (33 | 2.5%), and Farming, Fishing & Forestry (16 | 1.2%).
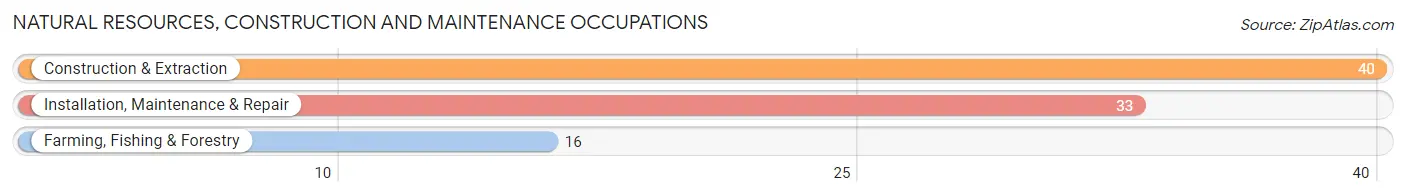
Natural Resources, Construction and Maintenance Occupations by Sex
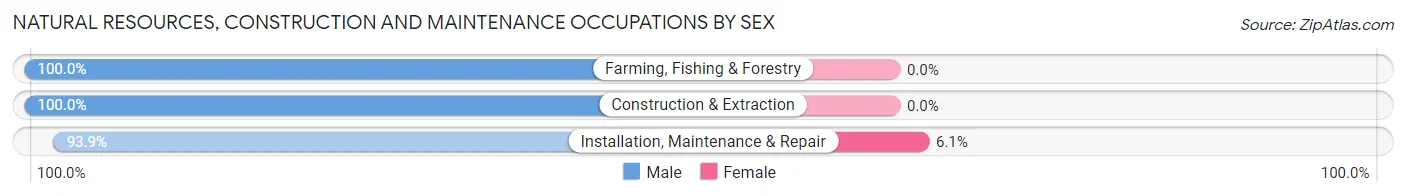
| Occupation | Male | Female |
| Farming, Fishing & Forestry | 16 (100.0%) | 0 (0.0%) |
| Construction & Extraction | 40 (100.0%) | 0 (0.0%) |
| Installation, Maintenance & Repair | 31 (93.9%) | 2 (6.1%) |
| Total (Category) | 87 (97.8%) | 2 (2.2%) |
| Total (Overall) | 688 (52.4%) | 626 (47.6%) |
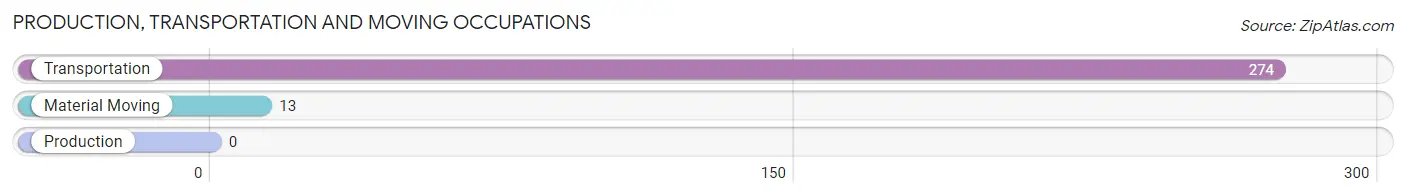
Production, Transportation and Moving Occupations
The most common Production, Transportation and Moving occupations in Kinney County are Transportation (274 | 20.8%), and Material Moving (13 | 1.0%).
Production, Transportation and Moving Occupations by Sex
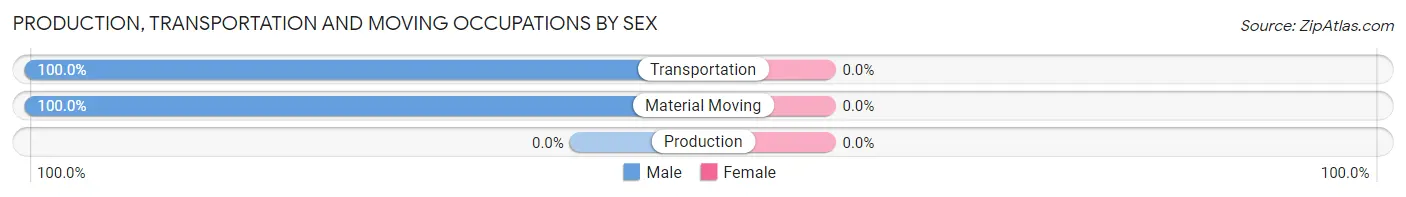
| Occupation | Male | Female |
| Production | 0 (0.0%) | 0 (0.0%) |
| Transportation | 274 (100.0%) | 0 (0.0%) |
| Material Moving | 13 (100.0%) | 0 (0.0%) |
| Total (Category) | 287 (100.0%) | 0 (0.0%) |
| Total (Overall) | 688 (52.4%) | 626 (47.6%) |
Employment Industries by Sex in Kinney County
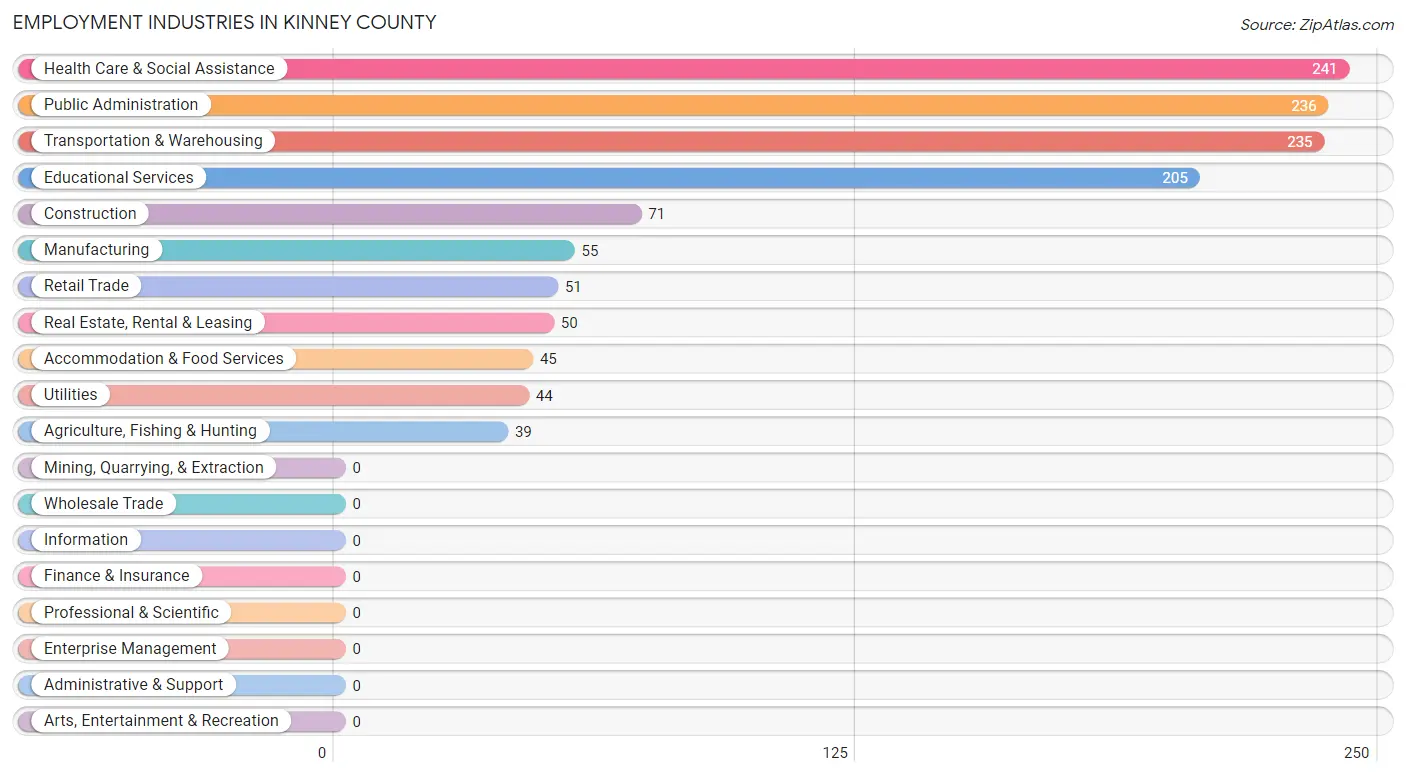
Employment Industries in Kinney County
The major employment industries in Kinney County include Health Care & Social Assistance (241 | 18.3%), Public Administration (236 | 18.0%), Transportation & Warehousing (235 | 17.9%), Educational Services (205 | 15.6%), and Construction (71 | 5.4%).
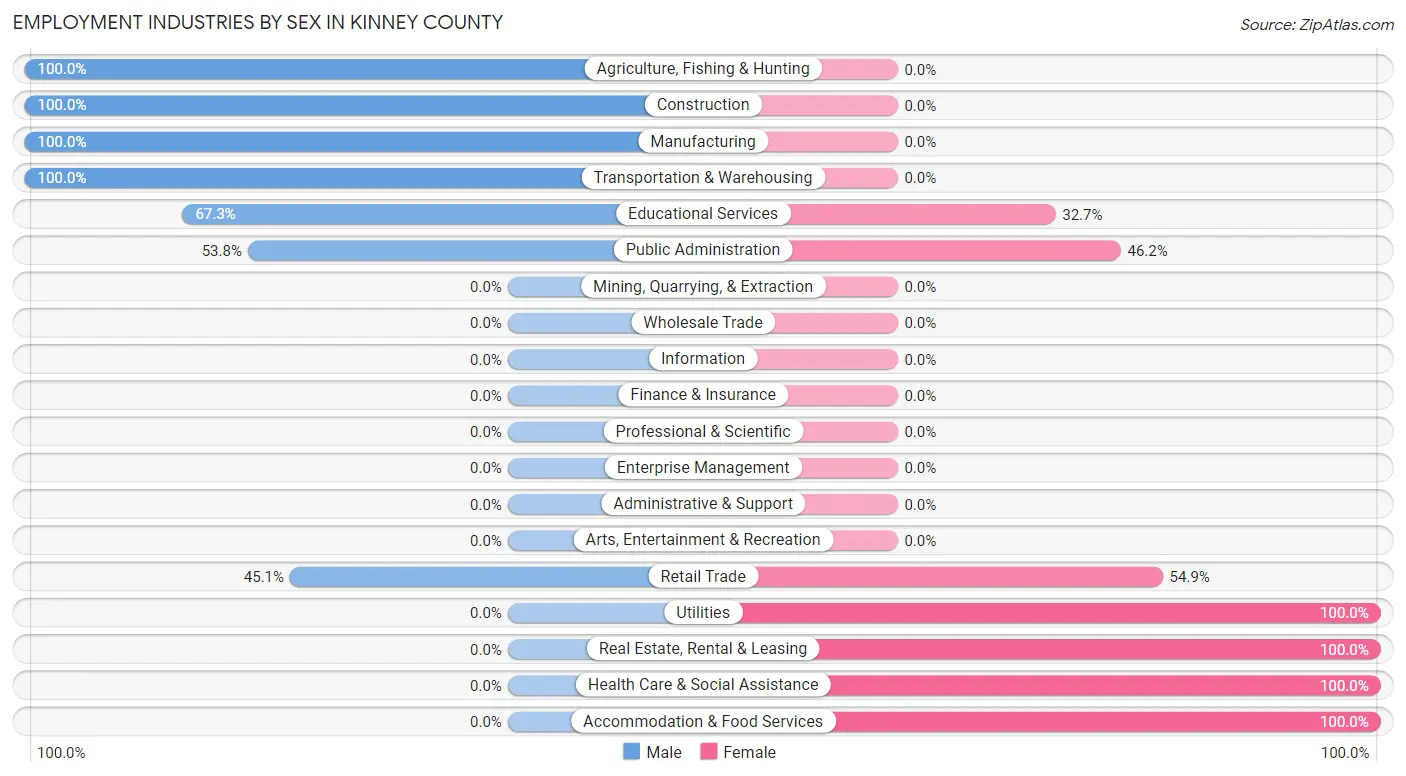
Employment Industries by Sex in Kinney County
The Kinney County industries that see more men than women are Agriculture, Fishing & Hunting (100.0%), Construction (100.0%), and Manufacturing (100.0%), whereas the industries that tend to have a higher number of women are Utilities (100.0%), Real Estate, Rental & Leasing (100.0%), and Health Care & Social Assistance (100.0%).
| Industry | Male | Female |
| Agriculture, Fishing & Hunting | 39 (100.0%) | 0 (0.0%) |
| Mining, Quarrying, & Extraction | 0 (0.0%) | 0 (0.0%) |
| Construction | 71 (100.0%) | 0 (0.0%) |
| Manufacturing | 55 (100.0%) | 0 (0.0%) |
| Wholesale Trade | 0 (0.0%) | 0 (0.0%) |
| Retail Trade | 23 (45.1%) | 28 (54.9%) |
| Transportation & Warehousing | 235 (100.0%) | 0 (0.0%) |
| Utilities | 0 (0.0%) | 44 (100.0%) |
| Information | 0 (0.0%) | 0 (0.0%) |
| Finance & Insurance | 0 (0.0%) | 0 (0.0%) |
| Real Estate, Rental & Leasing | 0 (0.0%) | 50 (100.0%) |
| Professional & Scientific | 0 (0.0%) | 0 (0.0%) |
| Enterprise Management | 0 (0.0%) | 0 (0.0%) |
| Administrative & Support | 0 (0.0%) | 0 (0.0%) |
| Educational Services | 138 (67.3%) | 67 (32.7%) |
| Health Care & Social Assistance | 0 (0.0%) | 241 (100.0%) |
| Arts, Entertainment & Recreation | 0 (0.0%) | 0 (0.0%) |
| Accommodation & Food Services | 0 (0.0%) | 45 (100.0%) |
| Public Administration | 127 (53.8%) | 109 (46.2%) |
| Total | 688 (52.4%) | 626 (47.6%) |
Education in Kinney County
School Enrollment in Kinney County
The most common levels of schooling among the 442 students in Kinney County are college / undergraduate (204 | 46.2%), high school (131 | 29.6%), and middle school (54 | 12.2%).
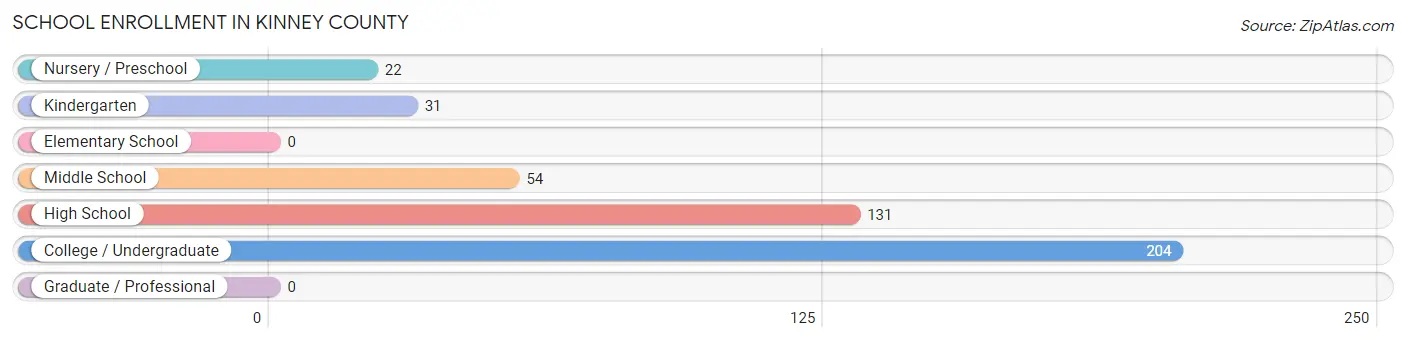
| School Level | # Students | % Students |
| Nursery / Preschool | 22 | 5.0% |
| Kindergarten | 31 | 7.0% |
| Elementary School | 0 | 0.0% |
| Middle School | 54 | 12.2% |
| High School | 131 | 29.6% |
| College / Undergraduate | 204 | 46.2% |
| Graduate / Professional | 0 | 0.0% |
| Total | 442 | 100.0% |
School Enrollment by Age by Funding Source in Kinney County
Out of a total of 442 students who are enrolled in schools in Kinney County, 52 (11.8%) attend a private institution, while the remaining 390 (88.2%) are enrolled in public schools. The age group of 15 to 17 year olds has the highest likelihood of being enrolled in private schools, with 52 (50.5% in the age bracket) enrolled. Conversely, the age group of 3 to 4 year olds has the lowest likelihood of being enrolled in a private school, with 22 (100.0% in the age bracket) attending a public institution.
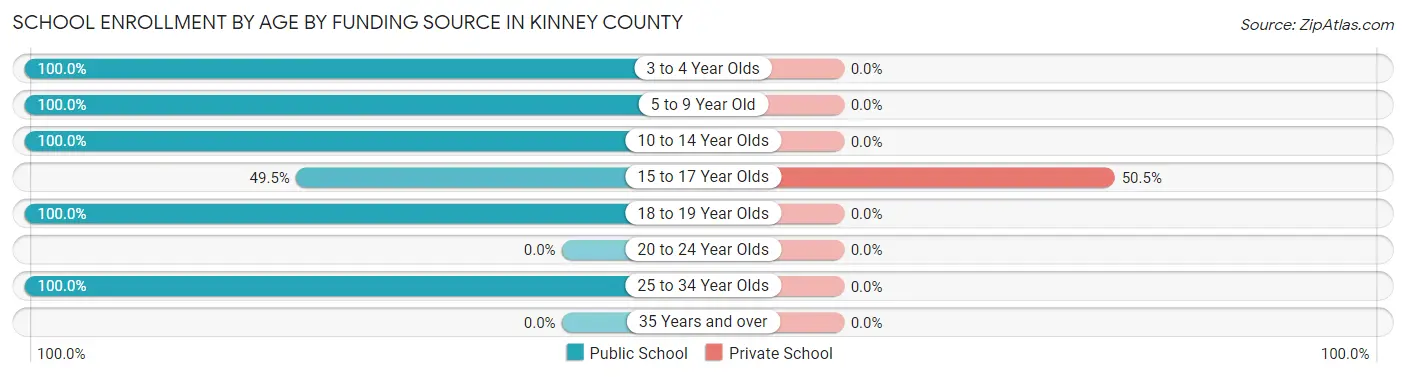
| Age Bracket | Public School | Private School |
| 3 to 4 Year Olds | 22 (100.0%) | 0 (0.0%) |
| 5 to 9 Year Old | 31 (100.0%) | 0 (0.0%) |
| 10 to 14 Year Olds | 54 (100.0%) | 0 (0.0%) |
| 15 to 17 Year Olds | 51 (49.5%) | 52 (50.5%) |
| 18 to 19 Year Olds | 28 (100.0%) | 0 (0.0%) |
| 20 to 24 Year Olds | 0 (0.0%) | 0 (0.0%) |
| 25 to 34 Year Olds | 204 (100.0%) | 0 (0.0%) |
| 35 Years and over | 0 (0.0%) | 0 (0.0%) |
| Total | 390 (88.2%) | 52 (11.8%) |
Educational Attainment by Field of Study in Kinney County
Business (177 | 52.5%), liberal arts & history (77 | 22.9%), education (51 | 15.1%), science & technology (26 | 7.7%), and social sciences (6 | 1.8%) are the most common fields of study among 337 individuals in Kinney County who have obtained a bachelor's degree or higher.
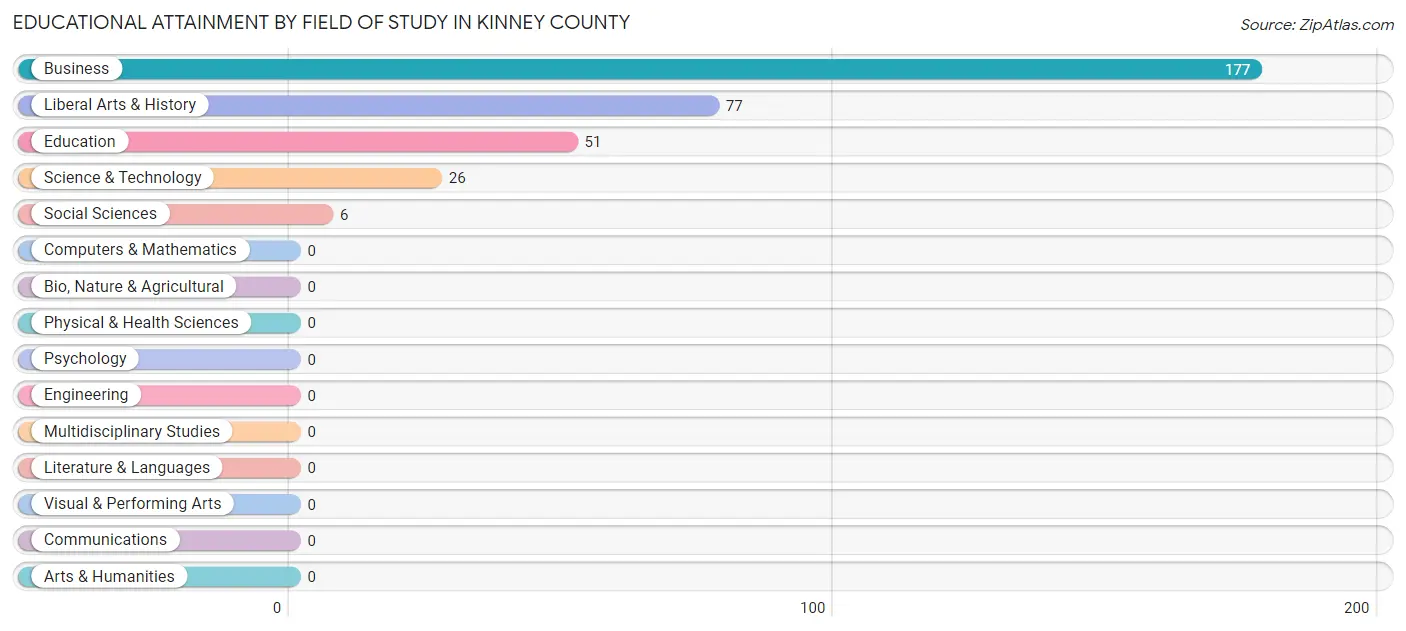
| Field of Study | # Graduates | % Graduates |
| Computers & Mathematics | 0 | 0.0% |
| Bio, Nature & Agricultural | 0 | 0.0% |
| Physical & Health Sciences | 0 | 0.0% |
| Psychology | 0 | 0.0% |
| Social Sciences | 6 | 1.8% |
| Engineering | 0 | 0.0% |
| Multidisciplinary Studies | 0 | 0.0% |
| Science & Technology | 26 | 7.7% |
| Business | 177 | 52.5% |
| Education | 51 | 15.1% |
| Literature & Languages | 0 | 0.0% |
| Liberal Arts & History | 77 | 22.9% |
| Visual & Performing Arts | 0 | 0.0% |
| Communications | 0 | 0.0% |
| Arts & Humanities | 0 | 0.0% |
| Total | 337 | 100.0% |
Transportation & Commute in Kinney County
Vehicle Availability by Sex in Kinney County
The most prevalent vehicle ownership categories in Kinney County are males with 3 vehicles (290, accounting for 42.1%) and females with 3 vehicles (106, making up 46.5%).
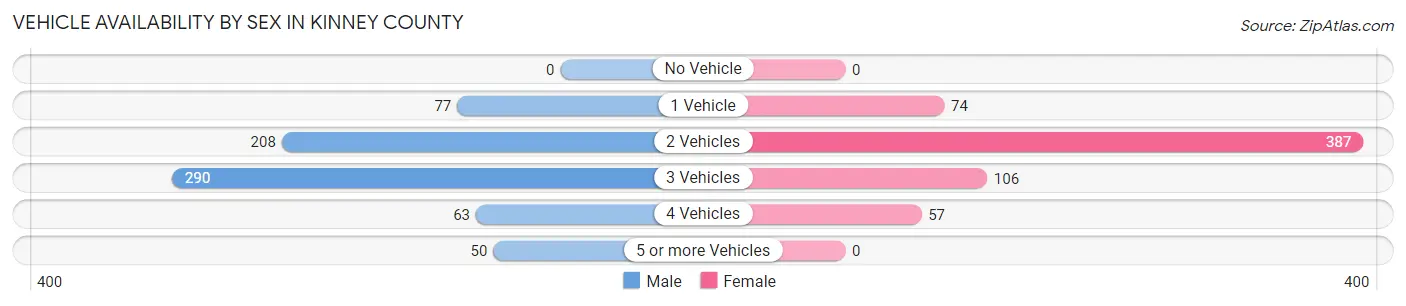
| Vehicles Available | Male | Female |
| No Vehicle | 0 (0.0%) | 0 (0.0%) |
| 1 Vehicle | 77 (11.2%) | 74 (11.9%) |
| 2 Vehicles | 208 (30.2%) | 387 (62.0%) |
| 3 Vehicles | 290 (42.1%) | 106 (17.0%) |
| 4 Vehicles | 63 (9.2%) | 57 (9.1%) |
| 5 or more Vehicles | 50 (7.3%) | 0 (0.0%) |
| Total | 688 (100.0%) | 624 (100.0%) |
Commute Time in Kinney County
The most frequently occuring commute durations in Kinney County are 5 to 9 minutes (747 commuters, 65.8%), less than 5 minutes (169 commuters, 14.9%), and 10 to 14 minutes (155 commuters, 13.6%).
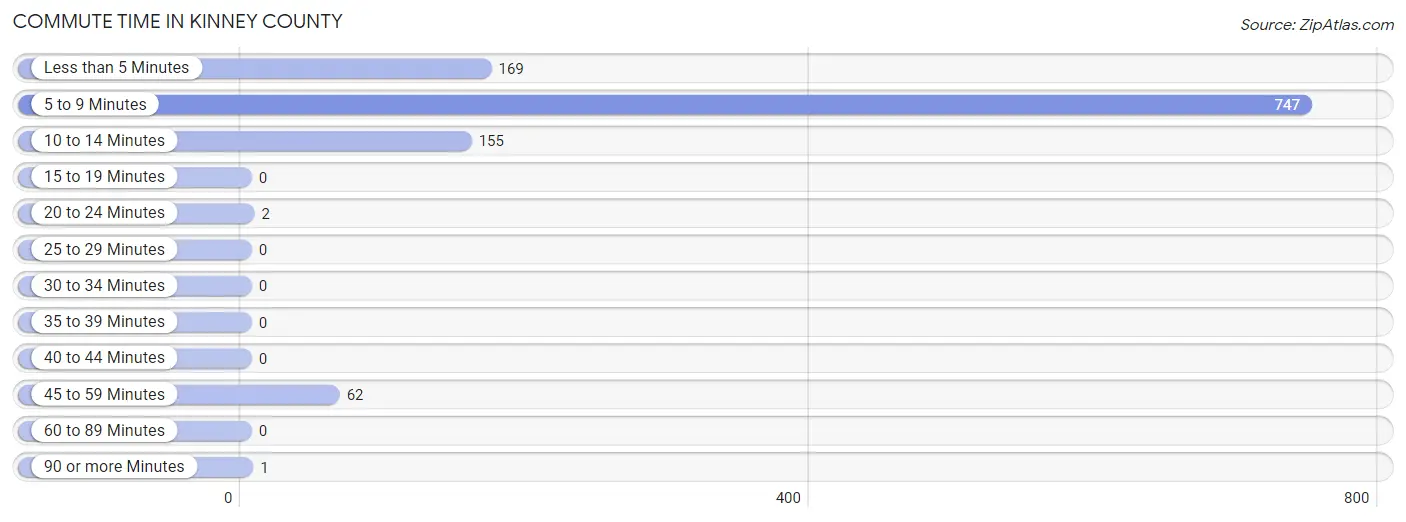
| Commute Time | # Commuters | % Commuters |
| Less than 5 Minutes | 169 | 14.9% |
| 5 to 9 Minutes | 747 | 65.8% |
| 10 to 14 Minutes | 155 | 13.6% |
| 15 to 19 Minutes | 0 | 0.0% |
| 20 to 24 Minutes | 2 | 0.2% |
| 25 to 29 Minutes | 0 | 0.0% |
| 30 to 34 Minutes | 0 | 0.0% |
| 35 to 39 Minutes | 0 | 0.0% |
| 40 to 44 Minutes | 0 | 0.0% |
| 45 to 59 Minutes | 62 | 5.5% |
| 60 to 89 Minutes | 0 | 0.0% |
| 90 or more Minutes | 1 | 0.1% |
Commute Time by Sex in Kinney County
The most common commute times in Kinney County are 5 to 9 minutes (464 commuters, 76.8%) for males and 5 to 9 minutes (283 commuters, 53.2%) for females.
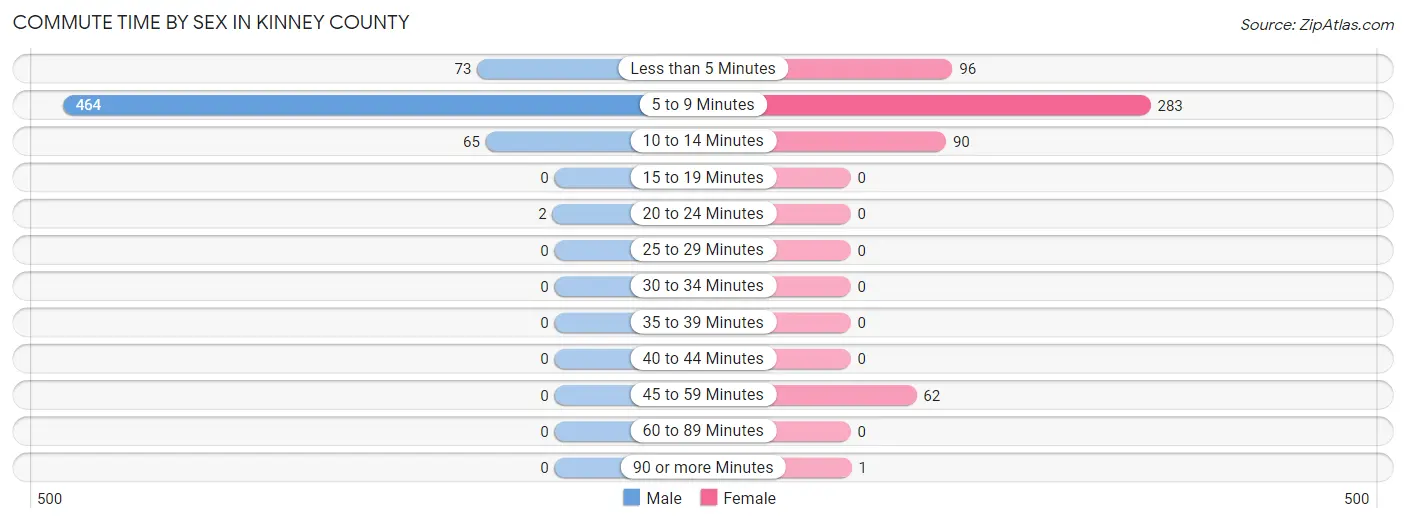
| Commute Time | Male | Female |
| Less than 5 Minutes | 73 (12.1%) | 96 (18.0%) |
| 5 to 9 Minutes | 464 (76.8%) | 283 (53.2%) |
| 10 to 14 Minutes | 65 (10.8%) | 90 (16.9%) |
| 15 to 19 Minutes | 0 (0.0%) | 0 (0.0%) |
| 20 to 24 Minutes | 2 (0.3%) | 0 (0.0%) |
| 25 to 29 Minutes | 0 (0.0%) | 0 (0.0%) |
| 30 to 34 Minutes | 0 (0.0%) | 0 (0.0%) |
| 35 to 39 Minutes | 0 (0.0%) | 0 (0.0%) |
| 40 to 44 Minutes | 0 (0.0%) | 0 (0.0%) |
| 45 to 59 Minutes | 0 (0.0%) | 62 (11.7%) |
| 60 to 89 Minutes | 0 (0.0%) | 0 (0.0%) |
| 90 or more Minutes | 0 (0.0%) | 1 (0.2%) |
Time of Departure to Work by Sex in Kinney County
The most frequent times of departure to work in Kinney County are 6:00 AM to 6:29 AM (306, 50.7%) for males and 7:30 AM to 7:59 AM (164, 30.8%) for females.
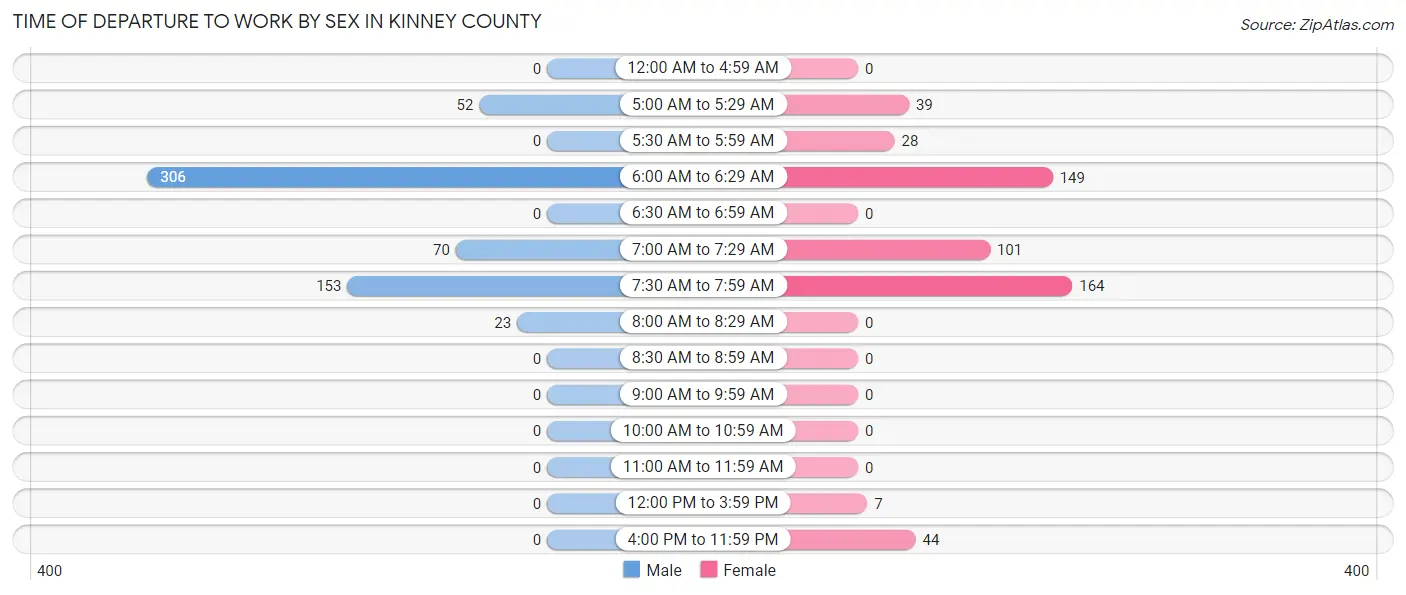
| Time of Departure | Male | Female |
| 12:00 AM to 4:59 AM | 0 (0.0%) | 0 (0.0%) |
| 5:00 AM to 5:29 AM | 52 (8.6%) | 39 (7.3%) |
| 5:30 AM to 5:59 AM | 0 (0.0%) | 28 (5.3%) |
| 6:00 AM to 6:29 AM | 306 (50.7%) | 149 (28.0%) |
| 6:30 AM to 6:59 AM | 0 (0.0%) | 0 (0.0%) |
| 7:00 AM to 7:29 AM | 70 (11.6%) | 101 (19.0%) |
| 7:30 AM to 7:59 AM | 153 (25.3%) | 164 (30.8%) |
| 8:00 AM to 8:29 AM | 23 (3.8%) | 0 (0.0%) |
| 8:30 AM to 8:59 AM | 0 (0.0%) | 0 (0.0%) |
| 9:00 AM to 9:59 AM | 0 (0.0%) | 0 (0.0%) |
| 10:00 AM to 10:59 AM | 0 (0.0%) | 0 (0.0%) |
| 11:00 AM to 11:59 AM | 0 (0.0%) | 0 (0.0%) |
| 12:00 PM to 3:59 PM | 0 (0.0%) | 7 (1.3%) |
| 4:00 PM to 11:59 PM | 0 (0.0%) | 44 (8.3%) |
| Total | 604 (100.0%) | 532 (100.0%) |
Housing Occupancy in Kinney County
Occupancy by Ownership in Kinney County
Of the total 1,105 dwellings in Kinney County, owner-occupied units account for 829 (75.0%), while renter-occupied units make up 276 (25.0%).
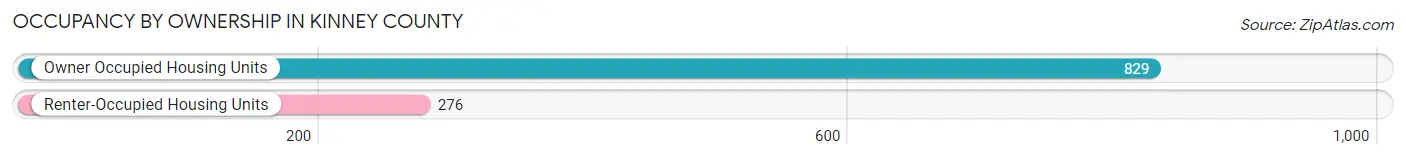
| Occupancy | # Housing Units | % Housing Units |
| Owner Occupied Housing Units | 829 | 75.0% |
| Renter-Occupied Housing Units | 276 | 25.0% |
| Total Occupied Housing Units | 1,105 | 100.0% |
Occupancy by Household Size in Kinney County
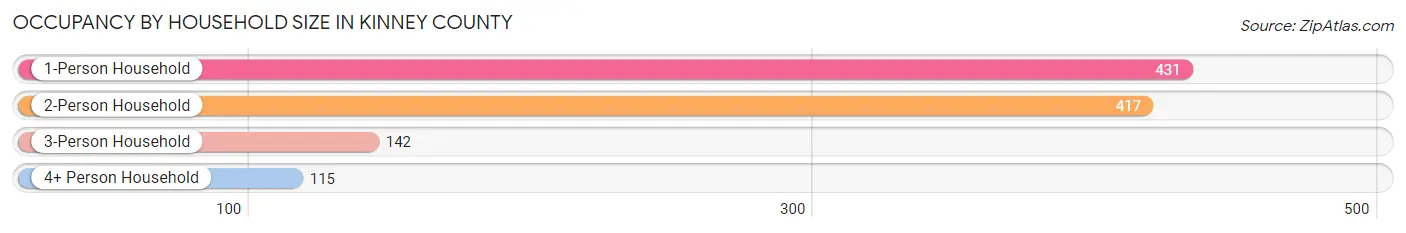
| Household Size | # Housing Units | % Housing Units |
| 1-Person Household | 431 | 39.0% |
| 2-Person Household | 417 | 37.7% |
| 3-Person Household | 142 | 12.9% |
| 4+ Person Household | 115 | 10.4% |
| Total Housing Units | 1,105 | 100.0% |
Occupancy by Ownership by Household Size in Kinney County
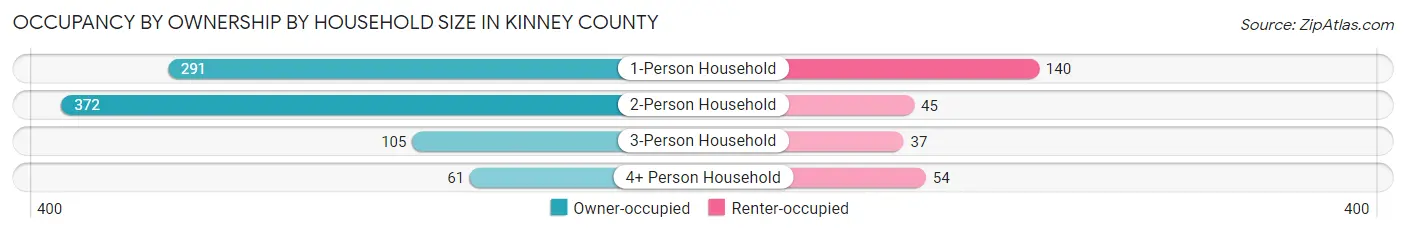
| Household Size | Owner-occupied | Renter-occupied |
| 1-Person Household | 291 (67.5%) | 140 (32.5%) |
| 2-Person Household | 372 (89.2%) | 45 (10.8%) |
| 3-Person Household | 105 (73.9%) | 37 (26.1%) |
| 4+ Person Household | 61 (53.0%) | 54 (47.0%) |
| Total Housing Units | 829 (75.0%) | 276 (25.0%) |
Occupancy by Educational Attainment in Kinney County
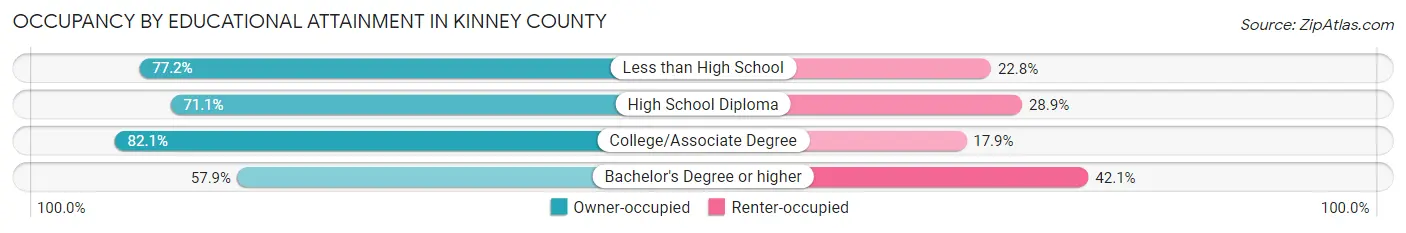
| Household Size | Owner-occupied | Renter-occupied |
| Less than High School | 95 (77.2%) | 28 (22.8%) |
| High School Diploma | 182 (71.1%) | 74 (28.9%) |
| College/Associate Degree | 446 (82.1%) | 97 (17.9%) |
| Bachelor's Degree or higher | 106 (57.9%) | 77 (42.1%) |
Occupancy by Age of Householder in Kinney County
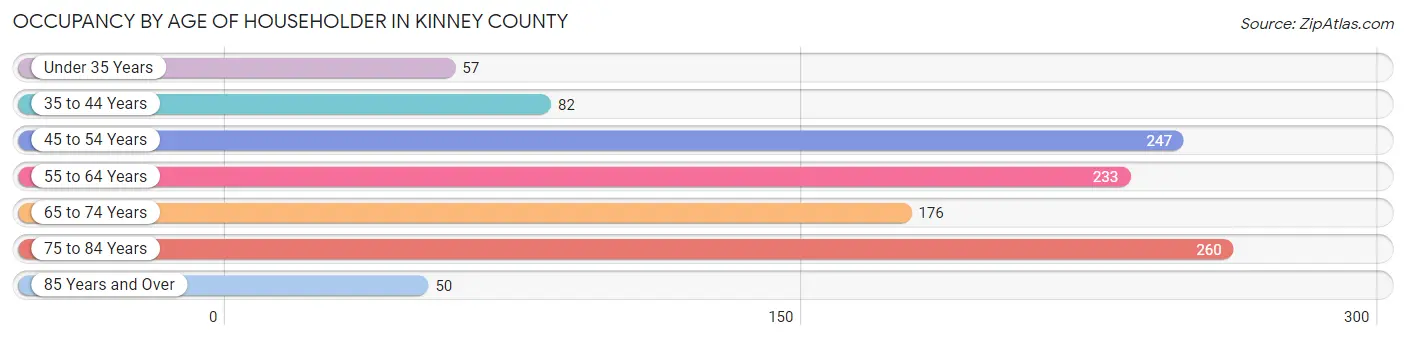
| Age Bracket | # Households | % Households |
| Under 35 Years | 57 | 5.2% |
| 35 to 44 Years | 82 | 7.4% |
| 45 to 54 Years | 247 | 22.4% |
| 55 to 64 Years | 233 | 21.1% |
| 65 to 74 Years | 176 | 15.9% |
| 75 to 84 Years | 260 | 23.5% |
| 85 Years and Over | 50 | 4.5% |
| Total | 1,105 | 100.0% |
Housing Finances in Kinney County
Median Income by Occupancy in Kinney County
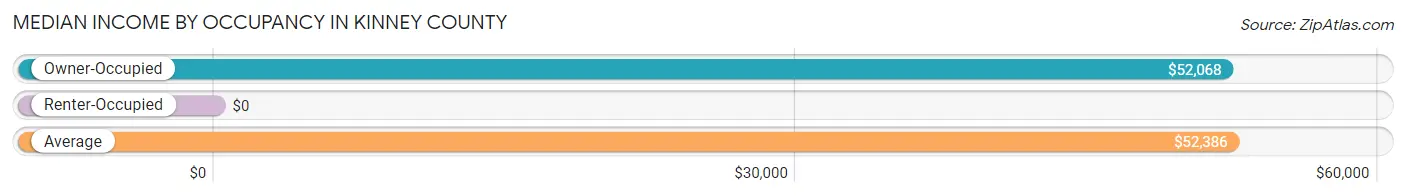
| Occupancy Type | # Households | Median Income |
| Owner-Occupied | 829 (75.0%) | $52,068 |
| Renter-Occupied | 276 (25.0%) | $0 |
| Average | 1,105 (100.0%) | $52,386 |
Occupancy by Householder Income Bracket in Kinney County
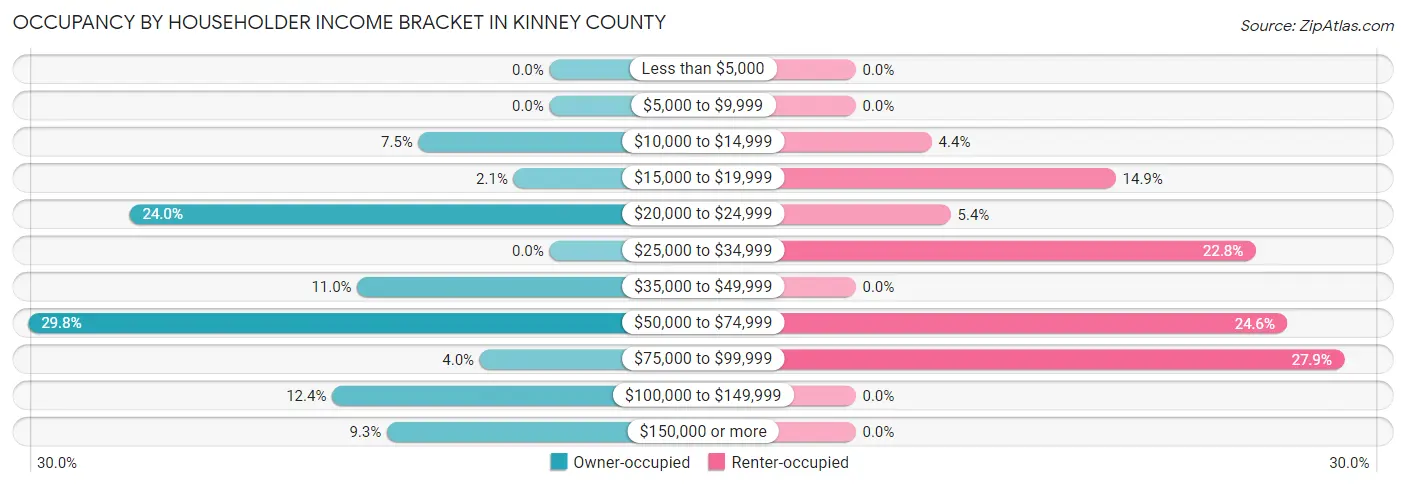
| Income Bracket | Owner-occupied | Renter-occupied |
| Less than $5,000 | 0 (0.0%) | 0 (0.0%) |
| $5,000 to $9,999 | 0 (0.0%) | 0 (0.0%) |
| $10,000 to $14,999 | 62 (7.5%) | 12 (4.3%) |
| $15,000 to $19,999 | 17 (2.1%) | 41 (14.9%) |
| $20,000 to $24,999 | 199 (24.0%) | 15 (5.4%) |
| $25,000 to $34,999 | 0 (0.0%) | 63 (22.8%) |
| $35,000 to $49,999 | 91 (11.0%) | 0 (0.0%) |
| $50,000 to $74,999 | 247 (29.8%) | 68 (24.6%) |
| $75,000 to $99,999 | 33 (4.0%) | 77 (27.9%) |
| $100,000 to $149,999 | 103 (12.4%) | 0 (0.0%) |
| $150,000 or more | 77 (9.3%) | 0 (0.0%) |
| Total | 829 (100.0%) | 276 (100.0%) |
Monthly Housing Cost Tiers in Kinney County
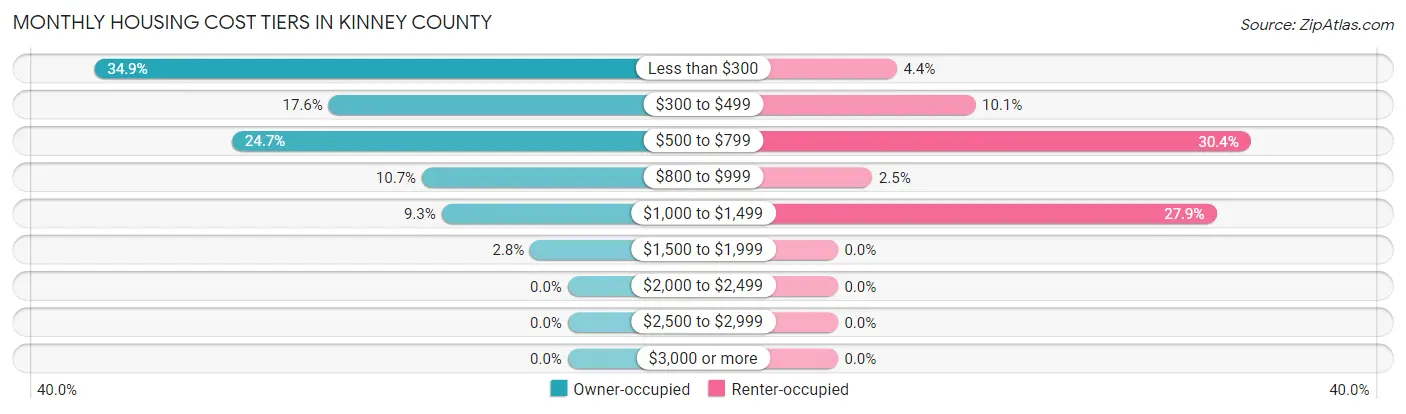
| Monthly Cost | Owner-occupied | Renter-occupied |
| Less than $300 | 289 (34.9%) | 12 (4.3%) |
| $300 to $499 | 146 (17.6%) | 28 (10.1%) |
| $500 to $799 | 205 (24.7%) | 84 (30.4%) |
| $800 to $999 | 89 (10.7%) | 7 (2.5%) |
| $1,000 to $1,499 | 77 (9.3%) | 77 (27.9%) |
| $1,500 to $1,999 | 23 (2.8%) | 0 (0.0%) |
| $2,000 to $2,499 | 0 (0.0%) | 0 (0.0%) |
| $2,500 to $2,999 | 0 (0.0%) | 0 (0.0%) |
| $3,000 or more | 0 (0.0%) | 0 (0.0%) |
| Total | 829 (100.0%) | 276 (100.0%) |
Physical Housing Characteristics in Kinney County
Housing Structures in Kinney County
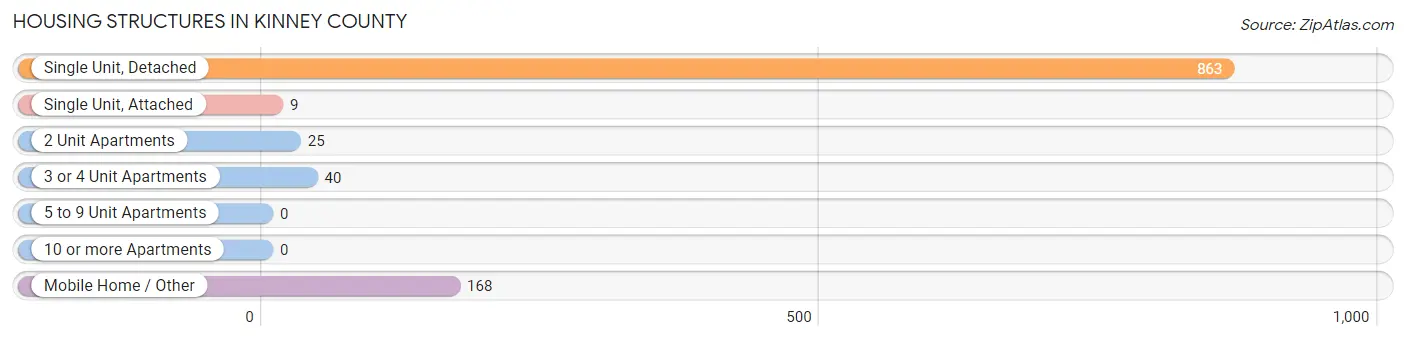
| Structure Type | # Housing Units | % Housing Units |
| Single Unit, Detached | 863 | 78.1% |
| Single Unit, Attached | 9 | 0.8% |
| 2 Unit Apartments | 25 | 2.3% |
| 3 or 4 Unit Apartments | 40 | 3.6% |
| 5 to 9 Unit Apartments | 0 | 0.0% |
| 10 or more Apartments | 0 | 0.0% |
| Mobile Home / Other | 168 | 15.2% |
| Total | 1,105 | 100.0% |
Housing Structures by Occupancy in Kinney County
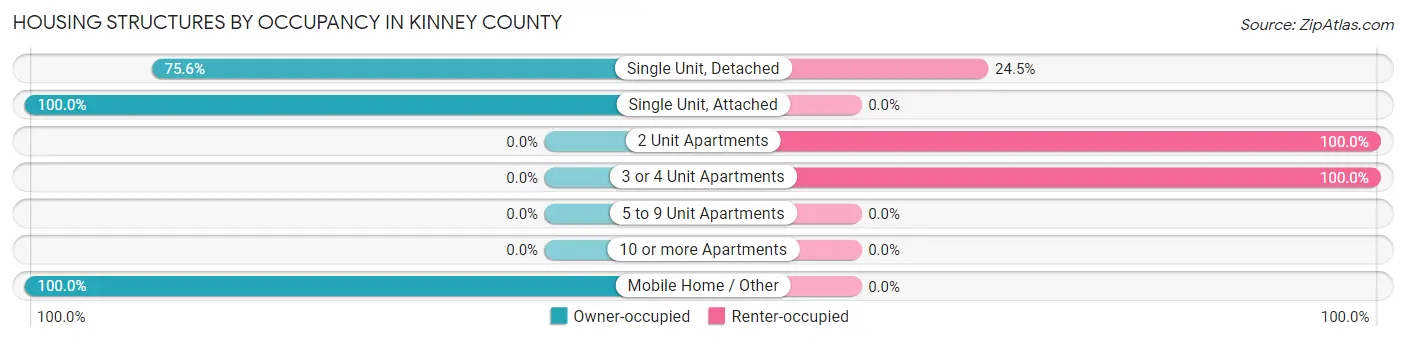
| Structure Type | Owner-occupied | Renter-occupied |
| Single Unit, Detached | 652 (75.5%) | 211 (24.4%) |
| Single Unit, Attached | 9 (100.0%) | 0 (0.0%) |
| 2 Unit Apartments | 0 (0.0%) | 25 (100.0%) |
| 3 or 4 Unit Apartments | 0 (0.0%) | 40 (100.0%) |
| 5 to 9 Unit Apartments | 0 (0.0%) | 0 (0.0%) |
| 10 or more Apartments | 0 (0.0%) | 0 (0.0%) |
| Mobile Home / Other | 168 (100.0%) | 0 (0.0%) |
| Total | 829 (75.0%) | 276 (25.0%) |
Housing Structures by Number of Rooms in Kinney County
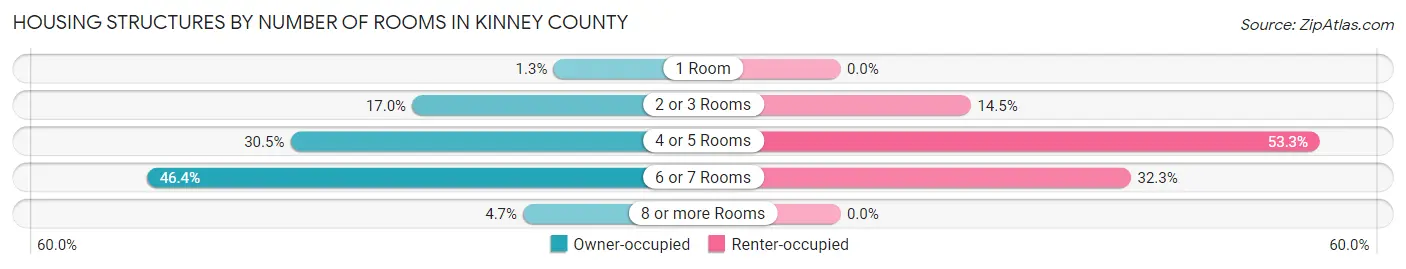
| Number of Rooms | Owner-occupied | Renter-occupied |
| 1 Room | 11 (1.3%) | 0 (0.0%) |
| 2 or 3 Rooms | 141 (17.0%) | 40 (14.5%) |
| 4 or 5 Rooms | 253 (30.5%) | 147 (53.3%) |
| 6 or 7 Rooms | 385 (46.4%) | 89 (32.3%) |
| 8 or more Rooms | 39 (4.7%) | 0 (0.0%) |
| Total | 829 (100.0%) | 276 (100.0%) |
Housing Structure by Heating Type in Kinney County
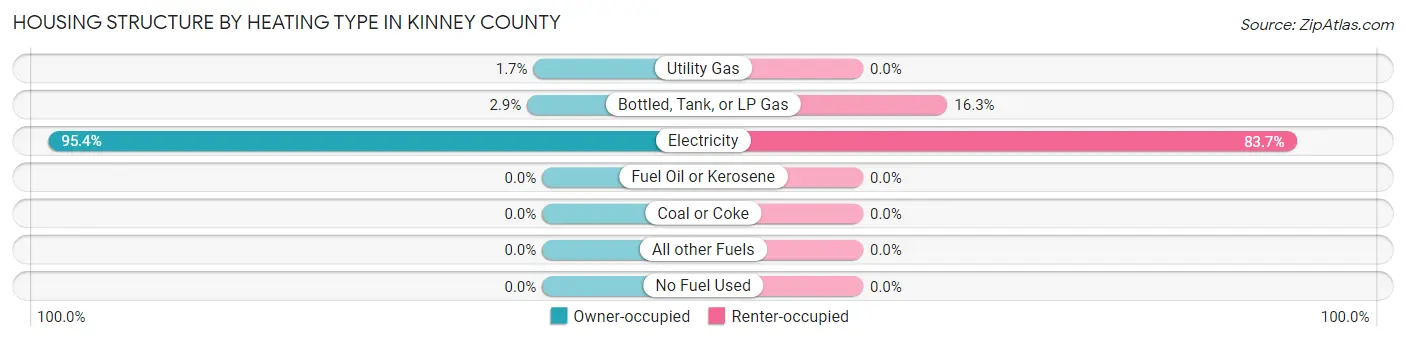
| Heating Type | Owner-occupied | Renter-occupied |
| Utility Gas | 14 (1.7%) | 0 (0.0%) |
| Bottled, Tank, or LP Gas | 24 (2.9%) | 45 (16.3%) |
| Electricity | 791 (95.4%) | 231 (83.7%) |
| Fuel Oil or Kerosene | 0 (0.0%) | 0 (0.0%) |
| Coal or Coke | 0 (0.0%) | 0 (0.0%) |
| All other Fuels | 0 (0.0%) | 0 (0.0%) |
| No Fuel Used | 0 (0.0%) | 0 (0.0%) |
| Total | 829 (100.0%) | 276 (100.0%) |
Household Vehicle Usage in Kinney County
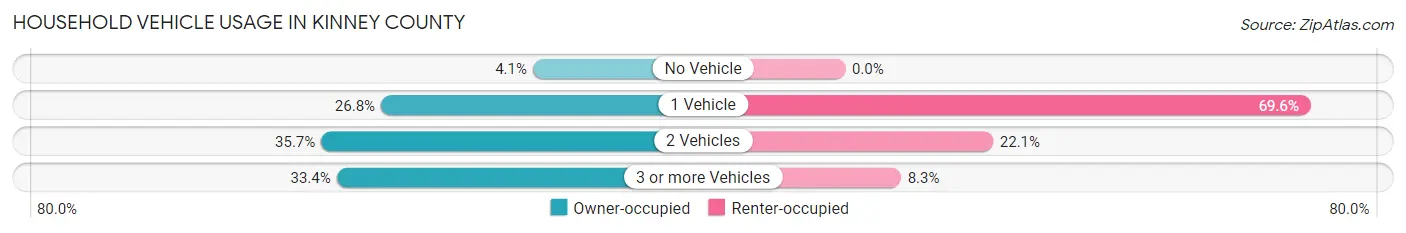
| Vehicles per Household | Owner-occupied | Renter-occupied |
| No Vehicle | 34 (4.1%) | 0 (0.0%) |
| 1 Vehicle | 222 (26.8%) | 192 (69.6%) |
| 2 Vehicles | 296 (35.7%) | 61 (22.1%) |
| 3 or more Vehicles | 277 (33.4%) | 23 (8.3%) |
| Total | 829 (100.0%) | 276 (100.0%) |
Real Estate & Mortgages in Kinney County
Real Estate and Mortgage Overview in Kinney County
| Characteristic | Without Mortgage | With Mortgage |
| Housing Units | 690 | 139 |
| Median Property Value | $110,900 | $118,800 |
| Median Household Income | $59,306 | $0 |
| Monthly Housing Costs | $344 | $0 |
| Real Estate Taxes | $1,069 | $0 |
Property Value by Mortgage Status in Kinney County
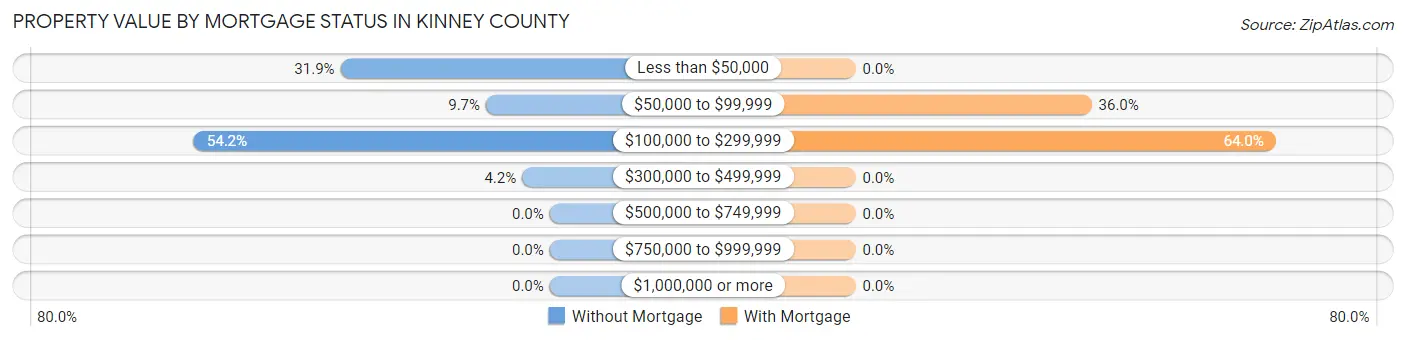
| Property Value | Without Mortgage | With Mortgage |
| Less than $50,000 | 220 (31.9%) | 0 (0.0%) |
| $50,000 to $99,999 | 67 (9.7%) | 50 (36.0%) |
| $100,000 to $299,999 | 374 (54.2%) | 89 (64.0%) |
| $300,000 to $499,999 | 29 (4.2%) | 0 (0.0%) |
| $500,000 to $749,999 | 0 (0.0%) | 0 (0.0%) |
| $750,000 to $999,999 | 0 (0.0%) | 0 (0.0%) |
| $1,000,000 or more | 0 (0.0%) | 0 (0.0%) |
| Total | 690 (100.0%) | 139 (100.0%) |
Household Income by Mortgage Status in Kinney County
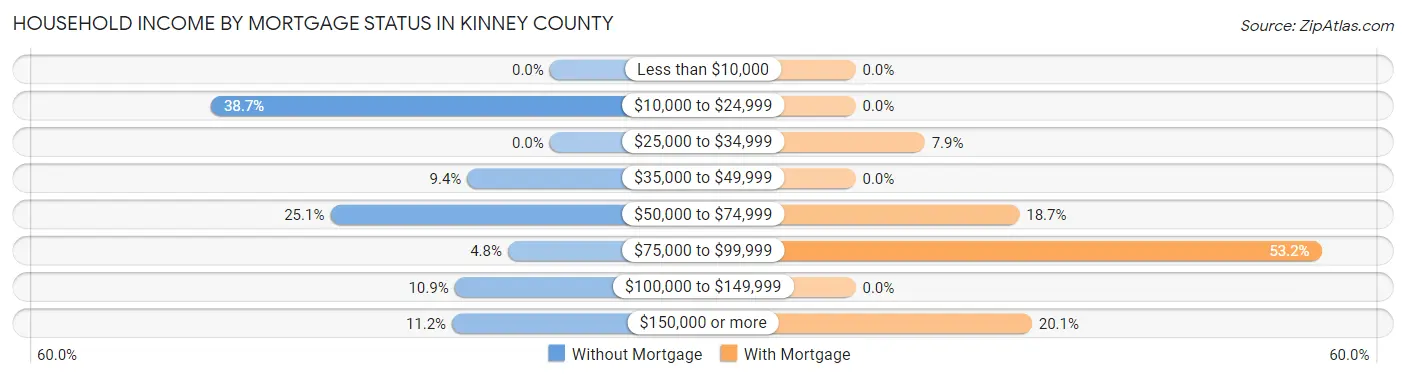
| Household Income | Without Mortgage | With Mortgage |
| Less than $10,000 | 0 (0.0%) | 0 (0.0%) |
| $10,000 to $24,999 | 267 (38.7%) | 0 (0.0%) |
| $25,000 to $34,999 | 0 (0.0%) | 11 (7.9%) |
| $35,000 to $49,999 | 65 (9.4%) | 0 (0.0%) |
| $50,000 to $74,999 | 173 (25.1%) | 26 (18.7%) |
| $75,000 to $99,999 | 33 (4.8%) | 74 (53.2%) |
| $100,000 to $149,999 | 75 (10.9%) | 0 (0.0%) |
| $150,000 or more | 77 (11.2%) | 28 (20.1%) |
| Total | 690 (100.0%) | 139 (100.0%) |
Property Value to Household Income Ratio in Kinney County
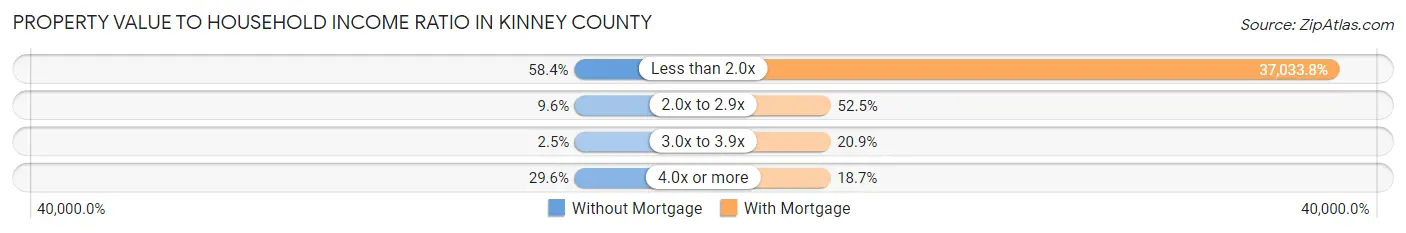
| Value-to-Income Ratio | Without Mortgage | With Mortgage |
| Less than 2.0x | 403 (58.4%) | 51,477 (37,033.8%) |
| 2.0x to 2.9x | 66 (9.6%) | 73 (52.5%) |
| 3.0x to 3.9x | 17 (2.5%) | 29 (20.9%) |
| 4.0x or more | 204 (29.6%) | 26 (18.7%) |
| Total | 690 (100.0%) | 139 (100.0%) |
Real Estate Taxes by Mortgage Status in Kinney County
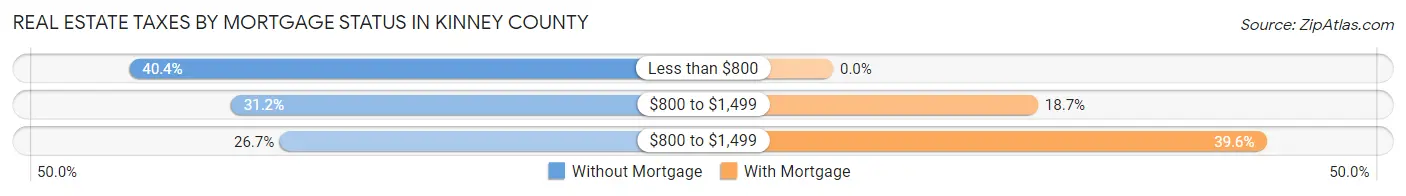
| Property Taxes | Without Mortgage | With Mortgage |
| Less than $800 | 279 (40.4%) | 0 (0.0%) |
| $800 to $1,499 | 215 (31.2%) | 26 (18.7%) |
| $800 to $1,499 | 184 (26.7%) | 55 (39.6%) |
| Total | 690 (100.0%) | 139 (100.0%) |
Health & Disability in Kinney County
Health Insurance Coverage by Age in Kinney County
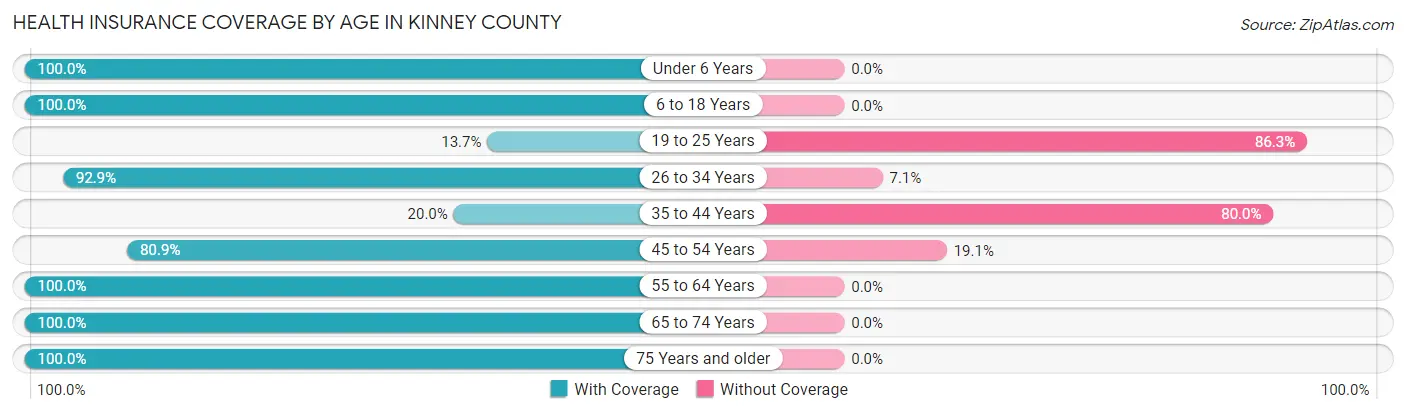
| Age Bracket | With Coverage | Without Coverage |
| Under 6 Years | 166 (100.0%) | 0 (0.0%) |
| 6 to 18 Years | 233 (100.0%) | 0 (0.0%) |
| 19 to 25 Years | 27 (13.7%) | 170 (86.3%) |
| 26 to 34 Years | 495 (92.9%) | 38 (7.1%) |
| 35 to 44 Years | 29 (20.0%) | 116 (80.0%) |
| 45 to 54 Years | 322 (80.9%) | 76 (19.1%) |
| 55 to 64 Years | 508 (100.0%) | 0 (0.0%) |
| 65 to 74 Years | 357 (100.0%) | 0 (0.0%) |
| 75 Years and older | 401 (100.0%) | 0 (0.0%) |
| Total | 2,538 (86.4%) | 400 (13.6%) |
Health Insurance Coverage by Citizenship Status in Kinney County
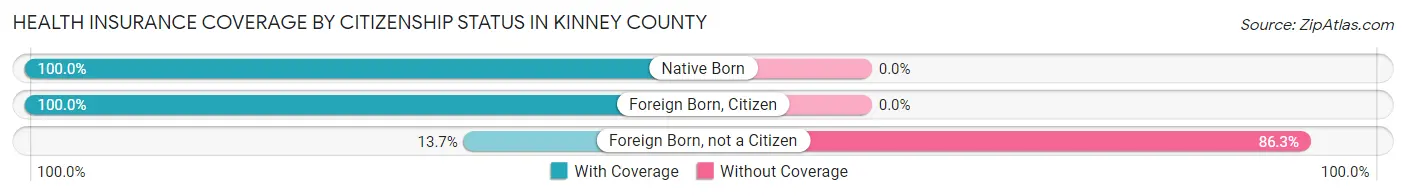
| Citizenship Status | With Coverage | Without Coverage |
| Native Born | 166 (100.0%) | 0 (0.0%) |
| Foreign Born, Citizen | 233 (100.0%) | 0 (0.0%) |
| Foreign Born, not a Citizen | 27 (13.7%) | 170 (86.3%) |
Health Insurance Coverage by Household Income in Kinney County
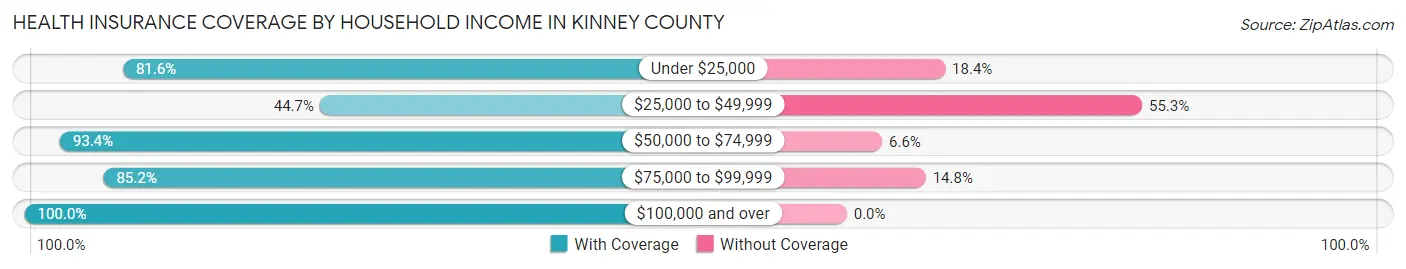
| Household Income | With Coverage | Without Coverage |
| Under $25,000 | 571 (81.6%) | 129 (18.4%) |
| $25,000 to $49,999 | 160 (44.7%) | 198 (55.3%) |
| $50,000 to $74,999 | 706 (93.4%) | 50 (6.6%) |
| $75,000 to $99,999 | 121 (85.2%) | 21 (14.8%) |
| $100,000 and over | 980 (100.0%) | 0 (0.0%) |
Public vs Private Health Insurance Coverage by Age in Kinney County
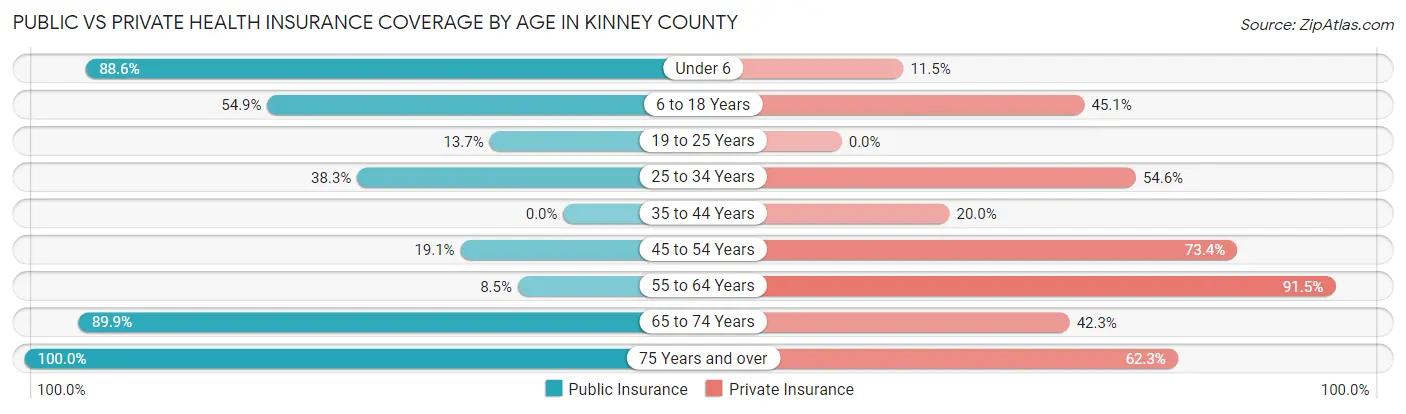
| Age Bracket | Public Insurance | Private Insurance |
| Under 6 | 147 (88.5%) | 19 (11.5%) |
| 6 to 18 Years | 128 (54.9%) | 105 (45.1%) |
| 19 to 25 Years | 27 (13.7%) | 0 (0.0%) |
| 25 to 34 Years | 204 (38.3%) | 291 (54.6%) |
| 35 to 44 Years | 0 (0.0%) | 29 (20.0%) |
| 45 to 54 Years | 76 (19.1%) | 292 (73.4%) |
| 55 to 64 Years | 43 (8.5%) | 465 (91.5%) |
| 65 to 74 Years | 321 (89.9%) | 151 (42.3%) |
| 75 Years and over | 401 (100.0%) | 250 (62.3%) |
| Total | 1,347 (45.9%) | 1,602 (54.5%) |
Disability Status by Sex by Age in Kinney County
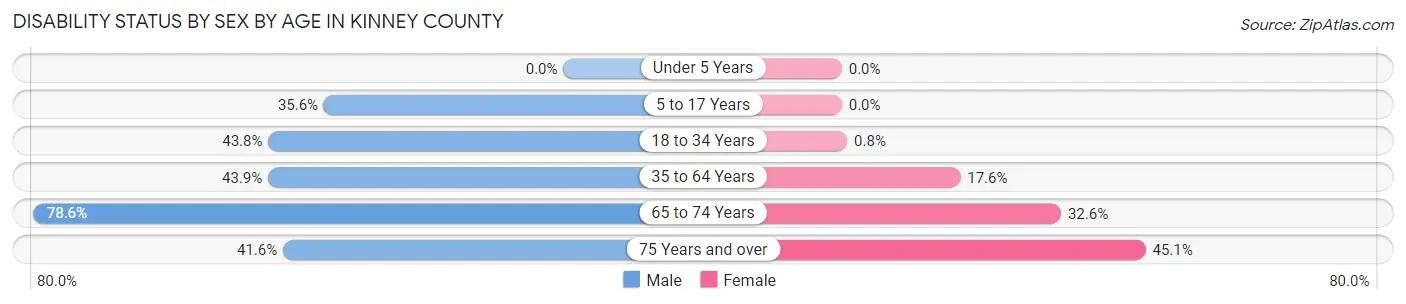
| Age Bracket | Male | Female |
| Under 5 Years | 0 (0.0%) | 0 (0.0%) |
| 5 to 17 Years | 75 (35.5%) | 0 (0.0%) |
| 18 to 34 Years | 223 (43.8%) | 2 (0.8%) |
| 35 to 64 Years | 264 (43.9%) | 79 (17.6%) |
| 65 to 74 Years | 114 (78.6%) | 69 (32.6%) |
| 75 Years and over | 82 (41.6%) | 92 (45.1%) |
Disability Class by Sex by Age in Kinney County
Disability Class: Hearing Difficulty
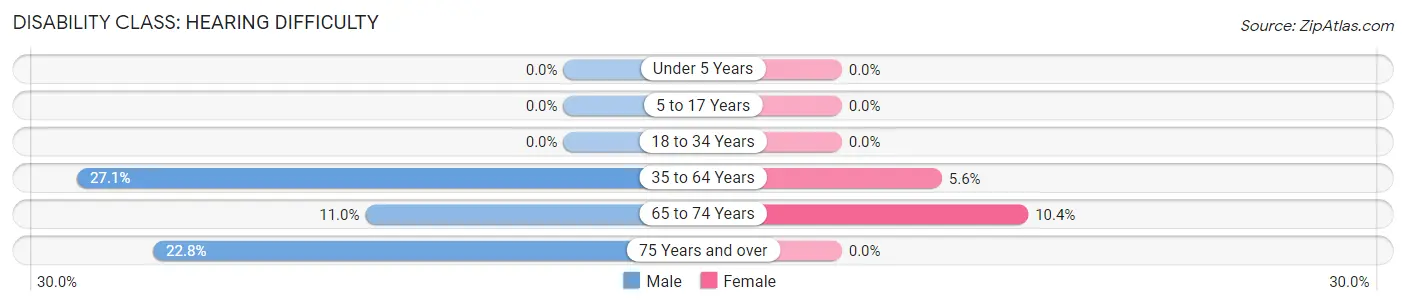
| Age Bracket | Male | Female |
| Under 5 Years | 0 (0.0%) | 0 (0.0%) |
| 5 to 17 Years | 0 (0.0%) | 0 (0.0%) |
| 18 to 34 Years | 0 (0.0%) | 0 (0.0%) |
| 35 to 64 Years | 163 (27.1%) | 25 (5.6%) |
| 65 to 74 Years | 16 (11.0%) | 22 (10.4%) |
| 75 Years and over | 45 (22.8%) | 0 (0.0%) |
Disability Class: Vision Difficulty
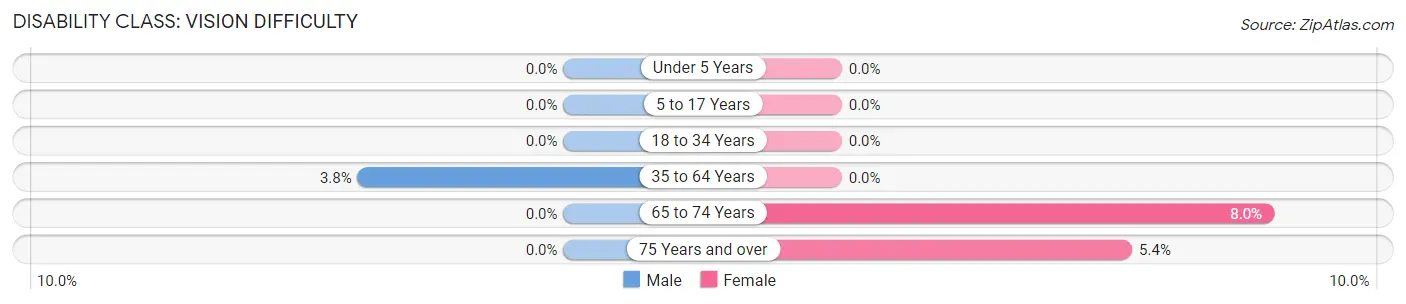
| Age Bracket | Male | Female |
| Under 5 Years | 0 (0.0%) | 0 (0.0%) |
| 5 to 17 Years | 0 (0.0%) | 0 (0.0%) |
| 18 to 34 Years | 0 (0.0%) | 0 (0.0%) |
| 35 to 64 Years | 23 (3.8%) | 0 (0.0%) |
| 65 to 74 Years | 0 (0.0%) | 17 (8.0%) |
| 75 Years and over | 0 (0.0%) | 11 (5.4%) |
Disability Class: Cognitive Difficulty
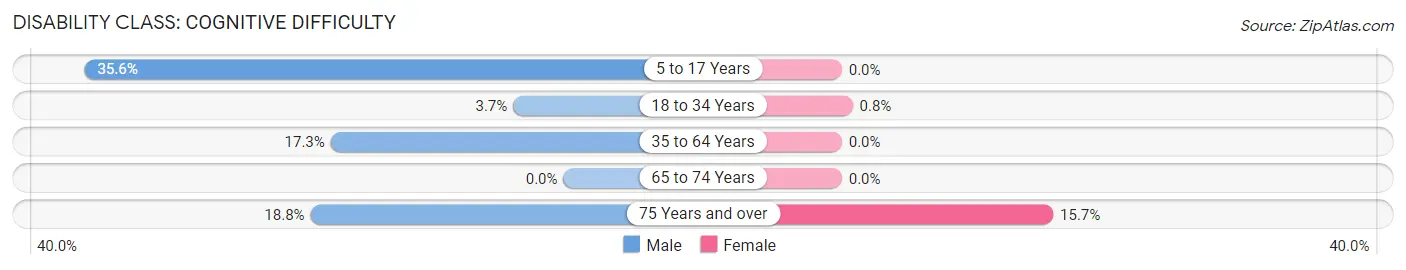
| Age Bracket | Male | Female |
| 5 to 17 Years | 75 (35.5%) | 0 (0.0%) |
| 18 to 34 Years | 19 (3.7%) | 2 (0.8%) |
| 35 to 64 Years | 104 (17.3%) | 0 (0.0%) |
| 65 to 74 Years | 0 (0.0%) | 0 (0.0%) |
| 75 Years and over | 37 (18.8%) | 32 (15.7%) |
Disability Class: Ambulatory Difficulty
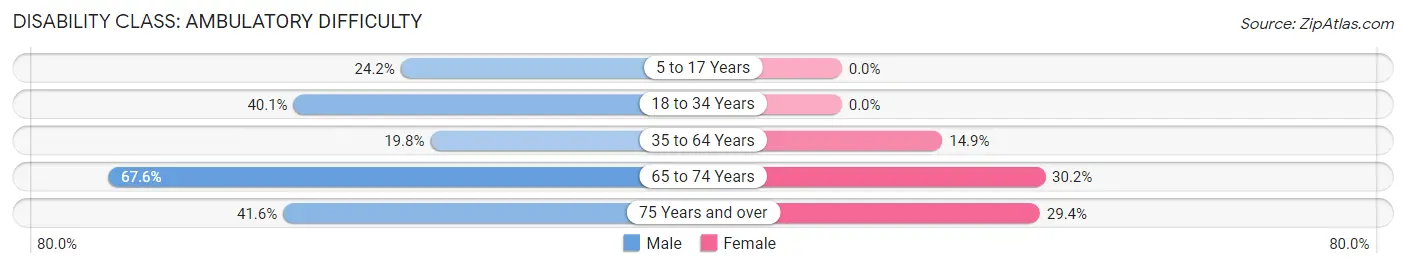
| Age Bracket | Male | Female |
| 5 to 17 Years | 51 (24.2%) | 0 (0.0%) |
| 18 to 34 Years | 204 (40.1%) | 0 (0.0%) |
| 35 to 64 Years | 119 (19.8%) | 67 (14.9%) |
| 65 to 74 Years | 98 (67.6%) | 64 (30.2%) |
| 75 Years and over | 82 (41.6%) | 60 (29.4%) |
Disability Class: Self-Care Difficulty
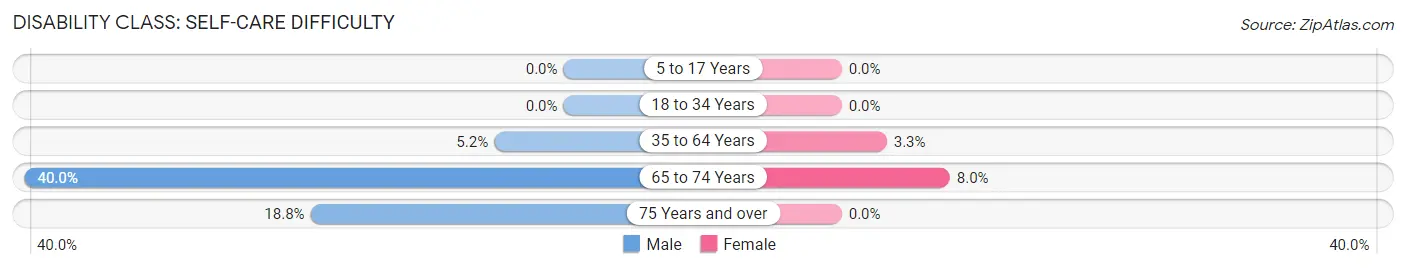
| Age Bracket | Male | Female |
| 5 to 17 Years | 0 (0.0%) | 0 (0.0%) |
| 18 to 34 Years | 0 (0.0%) | 0 (0.0%) |
| 35 to 64 Years | 31 (5.1%) | 15 (3.3%) |
| 65 to 74 Years | 58 (40.0%) | 17 (8.0%) |
| 75 Years and over | 37 (18.8%) | 0 (0.0%) |
Technology Access in Kinney County
Computing Device Access in Kinney County
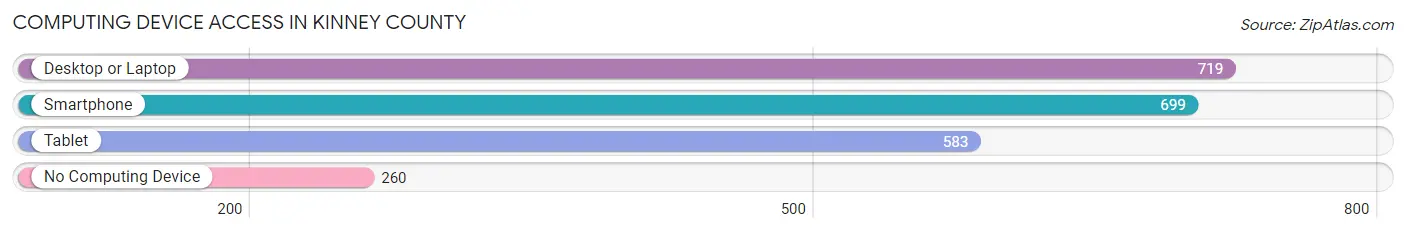
| Device Type | # Households | % Households |
| Desktop or Laptop | 719 | 65.1% |
| Smartphone | 699 | 63.3% |
| Tablet | 583 | 52.8% |
| No Computing Device | 260 | 23.5% |
| Total | 1,105 | 100.0% |
Internet Access in Kinney County
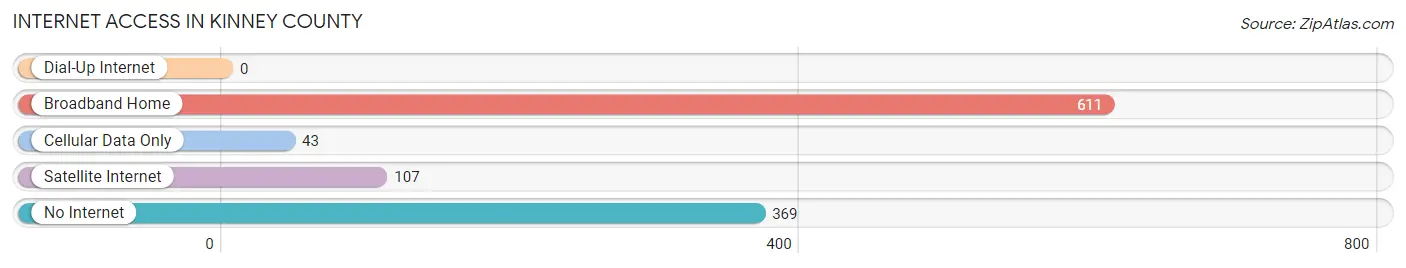
| Internet Type | # Households | % Households |
| Dial-Up Internet | 0 | 0.0% |
| Broadband Home | 611 | 55.3% |
| Cellular Data Only | 43 | 3.9% |
| Satellite Internet | 107 | 9.7% |
| No Internet | 369 | 33.4% |
| Total | 1,105 | 100.0% |
Kinney County Summary
Kinney County is located in the southwestern region of Texas, and is part of the Edwards Plateau. It is bordered by Val Verde County to the north, Uvalde County to the east, Maverick County to the south, and Edwards County to the west. The county seat is Brackettville, and the county has a total area of 1,360 square miles.
History
Kinney County was established in 1858 and named after Henry Lawrence Kinney, a prominent Texas politician and soldier. The county was originally part of Uvalde County, but was later divided into its own county. The first settlers in the area were ranchers, who were attracted to the area by the abundance of grass and water. The county was also home to several Native American tribes, including the Lipan Apache, Comanche, and Kickapoo.
In the late 19th century, the county became a popular destination for settlers from the Midwest, who were drawn to the area by the promise of free land. The county was also home to several military installations, including Fort Clark and Fort McKavett.
Geography
Kinney County is located in the southwestern region of Texas, and is part of the Edwards Plateau. It is bordered by Val Verde County to the north, Uvalde County to the east, Maverick County to the south, and Edwards County to the west. The county has a total area of 1,360 square miles, and is mostly flat with some rolling hills. The terrain is mostly covered in grasslands, with some areas of brush and cactus. The county is also home to several rivers, including the Nueces, Frio, and San Antonio.
Economy
The economy of Kinney County is largely based on agriculture and ranching. The county is home to several large ranches, and the main crops grown in the area are cotton, corn, wheat, and sorghum. The county is also home to several oil and gas fields, and the oil and gas industry is a major contributor to the local economy.
In addition to agriculture and ranching, the county is also home to several military installations, including Fort Clark and Fort McKavett. These installations provide jobs and economic activity to the area.
Demographics
As of the 2010 census, Kinney County had a population of 3,598. The population was spread out with 28.3% under the age of 18, 8.2% from 18 to 24, 24.2% from 25 to 44, 25.2% from 45 to 64, and 14.1% who were 65 years of age or older. The median age was 38.3 years.
The racial makeup of the county was 79.2% White, 0.7% African American, 0.7% Native American, 0.2% Asian, 0.1% Pacific Islander, 17.2% from other races, and 2.0% from two or more races. Hispanic or Latino of any race were 57.2% of the population.
The median income for a household in the county was $30,938, and the median income for a family was $35,938. The per capita income for the county was $14,945. About 18.2% of families and 22.2% of the population were below the poverty line, including 28.2% of those under age 18 and 16.2% of those age 65 or over.
Common Questions
What is Per Capita Income in Kinney County?
Per Capita income in Kinney County is $29,833.
What is the Median Family Income in Kinney County?
Median Family Income in Kinney County is $67,852.
What is the Median Household income in Kinney County?
Median Household Income in Kinney County is $52,386.
What is Income or Wage Gap in Kinney County?
Income or Wage Gap in Kinney County is 47.7%.
Women in Kinney County earn 52.3 cents for every dollar earned by a man.
What is Inequality or Gini Index in Kinney County?
Inequality or Gini Index in Kinney County is 0.40.
What is the Total Population of Kinney County?
Total Population of Kinney County is 3,157.
What is the Total Male Population of Kinney County?
Total Male Population of Kinney County is 1,947.
What is the Total Female Population of Kinney County?
Total Female Population of Kinney County is 1,210.
What is the Ratio of Males per 100 Females in Kinney County?
There are 160.91 Males per 100 Females in Kinney County.
What is the Ratio of Females per 100 Males in Kinney County?
There are 62.15 Females per 100 Males in Kinney County.
What is the Median Population Age in Kinney County?
Median Population Age in Kinney County is 47.5 Years.
What is the Average Family Size in Kinney County
Average Family Size in Kinney County is 3.7 People.
What is the Average Household Size in Kinney County
Average Household Size in Kinney County is 2.7 People.
How Large is the Labor Force in Kinney County?
There are 1,340 People in the Labor Forcein in Kinney County.
What is the Percentage of People in the Labor Force in Kinney County?
48.1% of People are in the Labor Force in Kinney County.
What is the Unemployment Rate in Kinney County?
Unemployment Rate in Kinney County is 1.9%.