King County, TX Map & Demographics
King County Map
King County Overview
$26,408
PER CAPITA INCOME
$48,750
AVG FAMILY INCOME
$59,375
AVG HOUSEHOLD INCOME
24.7%
WAGE / INCOME GAP [ % ]
75.3¢/ $1
WAGE / INCOME GAP [ $ ]
0.47
INEQUALITY / GINI INDEX
216
TOTAL POPULATION
113
MALE POPULATION
103
FEMALE POPULATION
109.71
MALES / 100 FEMALES
91.15
FEMALES / 100 MALES
35.8
MEDIAN AGE
2.8
AVG FAMILY SIZE
2.7
AVG HOUSEHOLD SIZE
89
LABOR FORCE [ PEOPLE ]
53.9%
PERCENT IN LABOR FORCE
4.5%
UNEMPLOYMENT RATE
King County Area Codes
Income in King County
Income Overview in King County
Per Capita Income in King County is $26,408, while median incomes of families and households are $48,750 and $59,375 respectively.
| Characteristic | Number | Measure |
| Per Capita Income | 216 | $26,408 |
| Median Family Income | 73 | $48,750 |
| Mean Family Income | 73 | $64,815 |
| Median Household Income | 80 | $59,375 |
| Mean Household Income | 80 | $67,984 |
| Income Deficit | 73 | $0 |
| Wage / Income Gap (%) | 216 | 24.66% |
| Wage / Income Gap ($) | 216 | 75.34¢ per $1 |
| Gini / Inequality Index | 216 | 0.47 |
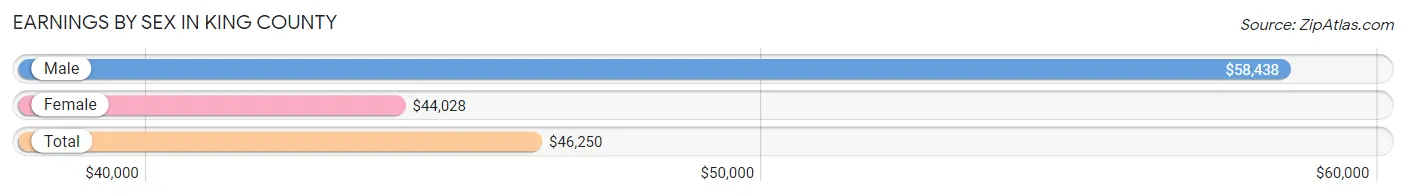
Earnings by Sex in King County
Average Earnings in King County are $46,250, $58,438 for men and $44,028 for women, a difference of 24.7%.
| Sex | Number | Average Earnings |
| Male | 45 (50.0%) | $58,438 |
| Female | 45 (50.0%) | $44,028 |
| Total | 90 (100.0%) | $46,250 |
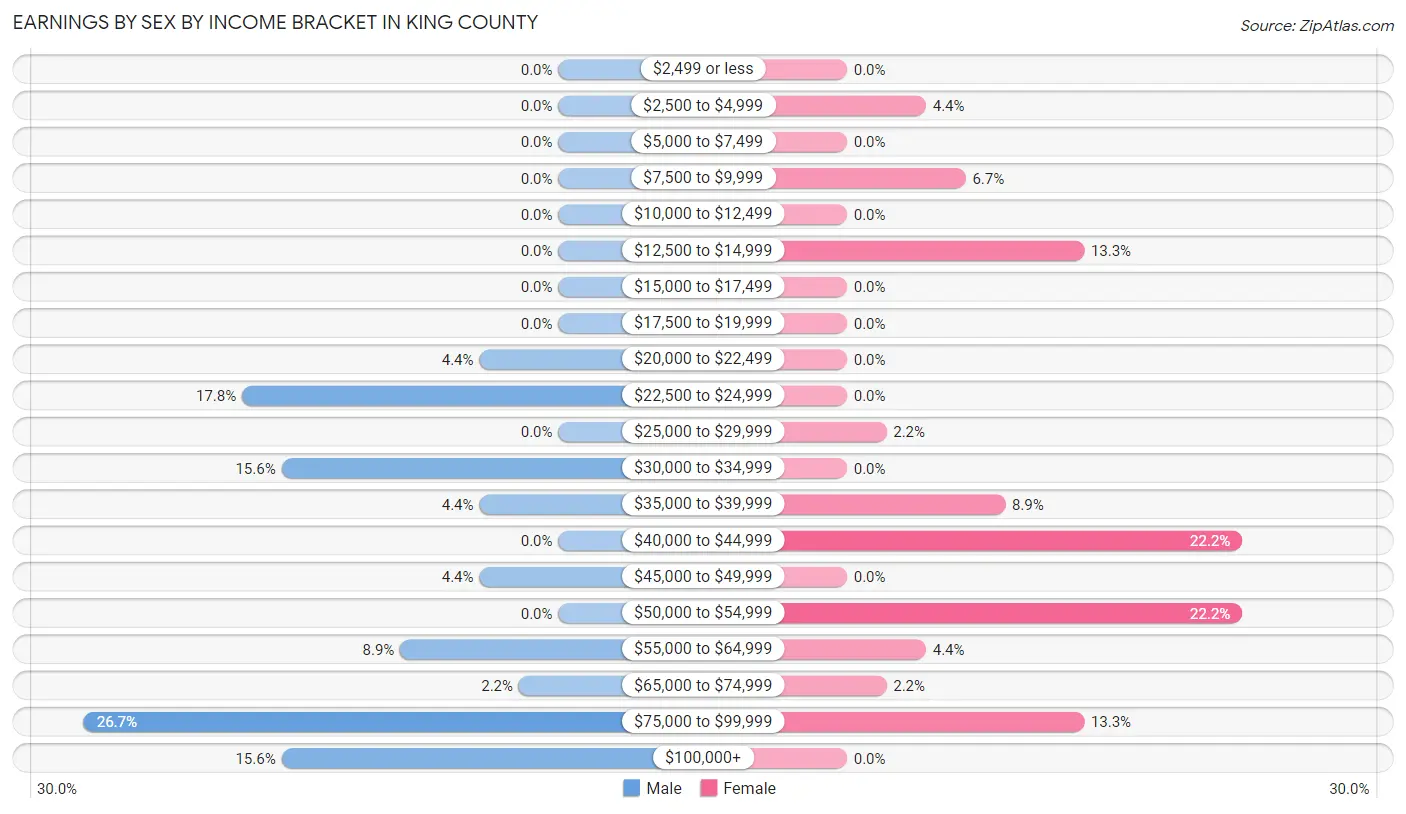
Earnings by Sex by Income Bracket in King County
The most common earnings brackets in King County are $75,000 to $99,999 for men (12 | 26.7%) and $40,000 to $44,999 for women (10 | 22.2%).
| Income | Male | Female |
| $2,499 or less | 0 (0.0%) | 0 (0.0%) |
| $2,500 to $4,999 | 0 (0.0%) | 2 (4.4%) |
| $5,000 to $7,499 | 0 (0.0%) | 0 (0.0%) |
| $7,500 to $9,999 | 0 (0.0%) | 3 (6.7%) |
| $10,000 to $12,499 | 0 (0.0%) | 0 (0.0%) |
| $12,500 to $14,999 | 0 (0.0%) | 6 (13.3%) |
| $15,000 to $17,499 | 0 (0.0%) | 0 (0.0%) |
| $17,500 to $19,999 | 0 (0.0%) | 0 (0.0%) |
| $20,000 to $22,499 | 2 (4.4%) | 0 (0.0%) |
| $22,500 to $24,999 | 8 (17.8%) | 0 (0.0%) |
| $25,000 to $29,999 | 0 (0.0%) | 1 (2.2%) |
| $30,000 to $34,999 | 7 (15.6%) | 0 (0.0%) |
| $35,000 to $39,999 | 2 (4.4%) | 4 (8.9%) |
| $40,000 to $44,999 | 0 (0.0%) | 10 (22.2%) |
| $45,000 to $49,999 | 2 (4.4%) | 0 (0.0%) |
| $50,000 to $54,999 | 0 (0.0%) | 10 (22.2%) |
| $55,000 to $64,999 | 4 (8.9%) | 2 (4.4%) |
| $65,000 to $74,999 | 1 (2.2%) | 1 (2.2%) |
| $75,000 to $99,999 | 12 (26.7%) | 6 (13.3%) |
| $100,000+ | 7 (15.6%) | 0 (0.0%) |
| Total | 45 (100.0%) | 45 (100.0%) |
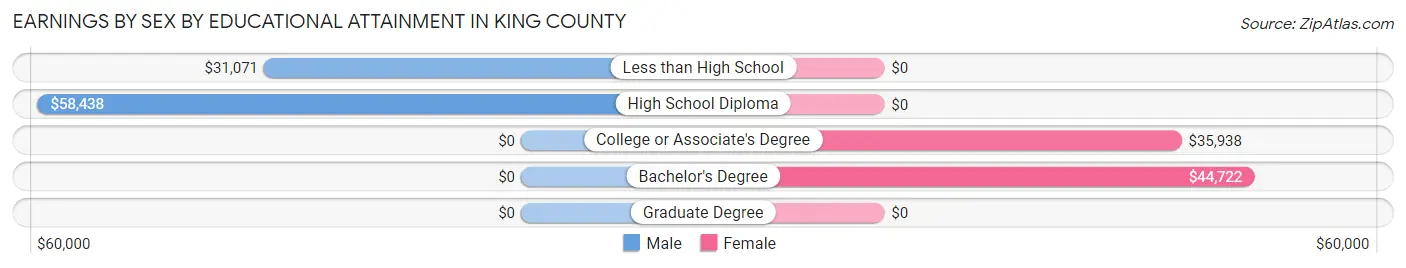
Earnings by Sex by Educational Attainment in King County
Average earnings in King County are $58,438 for men and $44,028 for women, a difference of 24.7%. Men with an educational attainment of high school diploma enjoy the highest average annual earnings of $58,438, while those with less than high school education earn the least with $31,071. Women with an educational attainment of bachelor's degree earn the most with the average annual earnings of $44,722, while those with college or associate's degree education have the smallest earnings of $35,938.
| Educational Attainment | Male Income | Female Income |
| Less than High School | $31,071 | $0 |
| High School Diploma | $58,438 | $0 |
| College or Associate's Degree | - | - |
| Bachelor's Degree | - | - |
| Graduate Degree | - | - |
| Total | $58,438 | $44,028 |
Family Income in King County
Family Income Brackets in King County
According to the King County family income data, there are 17 families falling into the $50,000 to $74,999 income range, which is the most common income bracket and makes up 23.3% of all families.
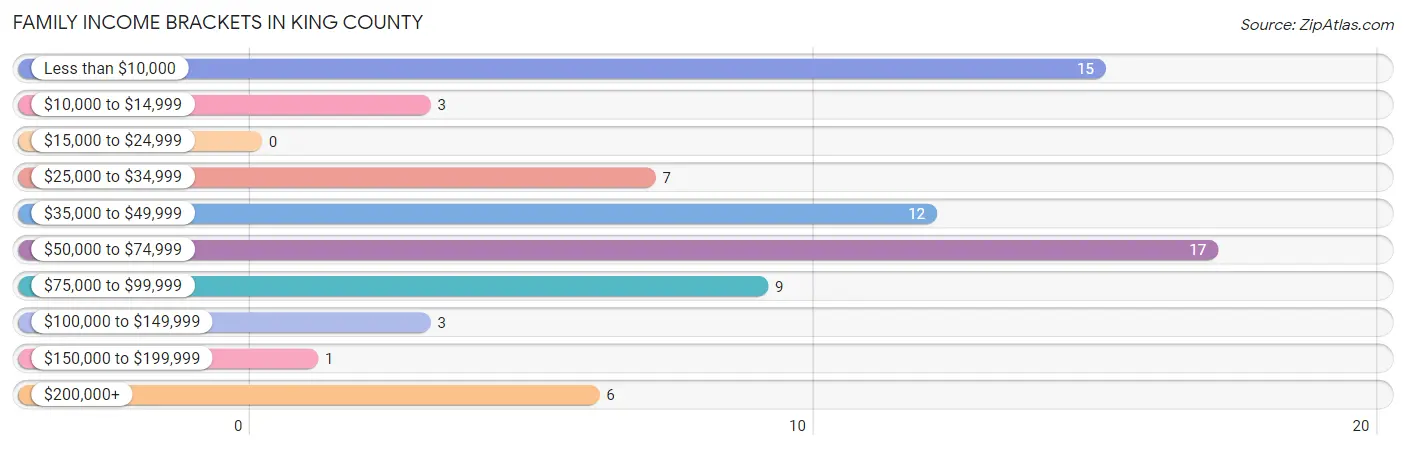
| Income Bracket | # Families | % Families |
| Less than $10,000 | 15 | 20.5% |
| $10,000 to $14,999 | 3 | 4.1% |
| $15,000 to $24,999 | 0 | 0.0% |
| $25,000 to $34,999 | 7 | 9.6% |
| $35,000 to $49,999 | 12 | 16.4% |
| $50,000 to $74,999 | 17 | 23.3% |
| $75,000 to $99,999 | 9 | 12.3% |
| $100,000 to $149,999 | 3 | 4.1% |
| $150,000 to $199,999 | 1 | 1.4% |
| $200,000+ | 6 | 8.2% |
Family Income by Famaliy Size in King County
4-person families (21 | 28.8%) account for the highest median family income in King County with $88,194 per family, while 2-person families (23 | 31.5%) have the highest median income of $34,514 per family member.
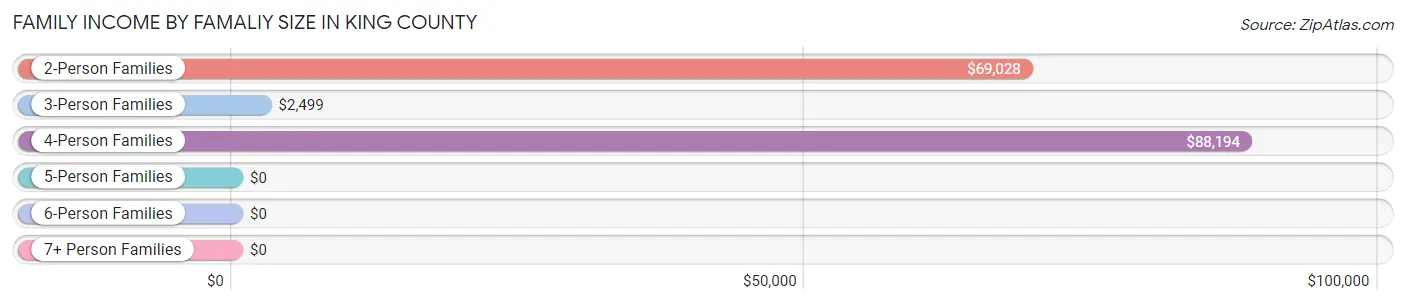
| Income Bracket | # Families | Median Income |
| 2-Person Families | 23 (31.5%) | $69,028 |
| 3-Person Families | 26 (35.6%) | $2,499 |
| 4-Person Families | 21 (28.8%) | $88,194 |
| 5-Person Families | 3 (4.1%) | $0 |
| 6-Person Families | 0 (0.0%) | $0 |
| 7+ Person Families | 0 (0.0%) | $0 |
| Total | 73 (100.0%) | $48,750 |
Family Income by Number of Earners in King County
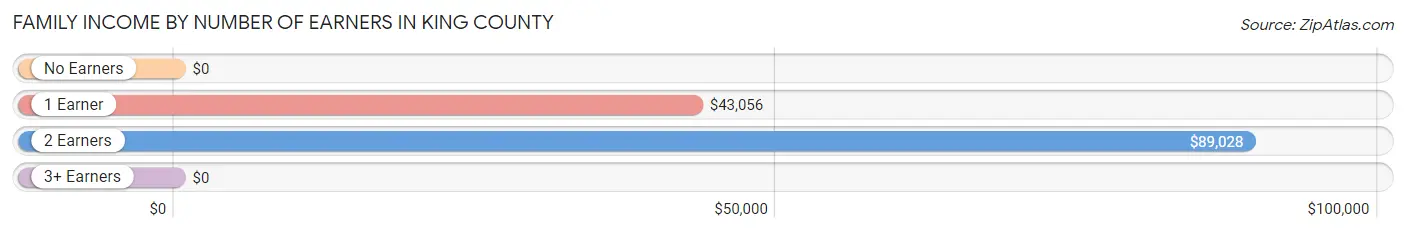
| Number of Earners | # Families | Median Income |
| No Earners | 24 (32.9%) | $0 |
| 1 Earner | 24 (32.9%) | $43,056 |
| 2 Earners | 25 (34.3%) | $89,028 |
| 3+ Earners | 0 (0.0%) | $0 |
| Total | 73 (100.0%) | $48,750 |
Household Income in King County
Household Income Brackets in King County
With 17 households falling in the category, the $50,000 to $74,999 income range is the most frequent in King County, accounting for 21.2% of all households.
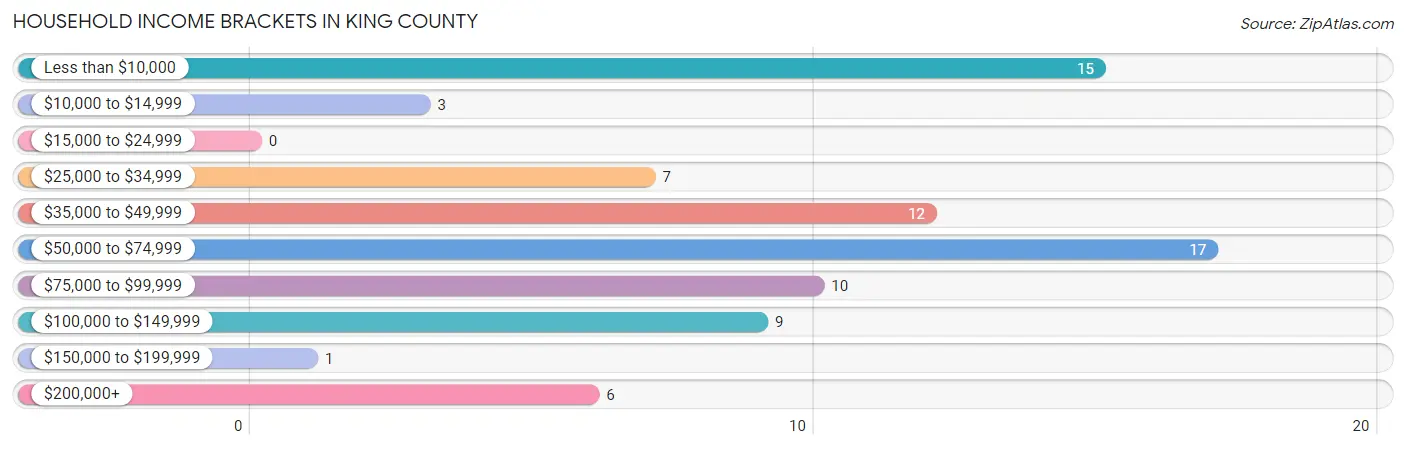
| Income Bracket | # Households | % Households |
| Less than $10,000 | 15 | 18.8% |
| $10,000 to $14,999 | 3 | 3.8% |
| $15,000 to $24,999 | 0 | 0.0% |
| $25,000 to $34,999 | 7 | 8.8% |
| $35,000 to $49,999 | 12 | 15.0% |
| $50,000 to $74,999 | 17 | 21.3% |
| $75,000 to $99,999 | 10 | 12.5% |
| $100,000 to $149,999 | 9 | 11.3% |
| $150,000 to $199,999 | 1 | 1.3% |
| $200,000+ | 6 | 7.5% |
Household Income by Householder Age in King County
The median household income in King County is $59,375, with the highest median household income of $88,333 found in the 25 to 44 years age bracket for the primary householder. A total of 32 households (40.0%) fall into this category.
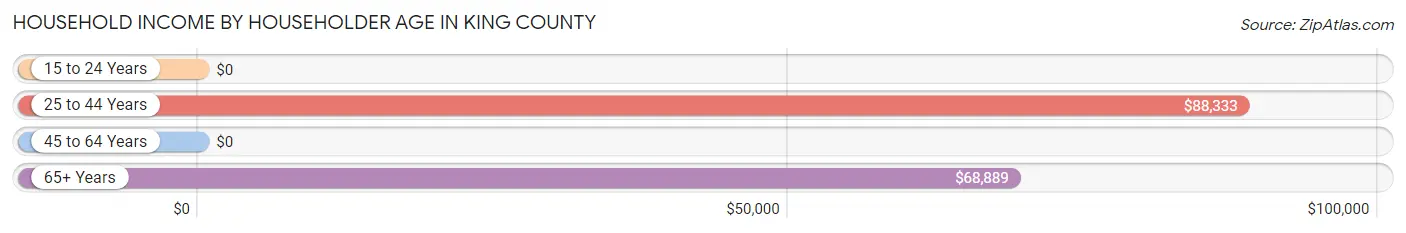
| Income Bracket | # Households | Median Income |
| 15 to 24 Years | 0 (0.0%) | $0 |
| 25 to 44 Years | 32 (40.0%) | $88,333 |
| 45 to 64 Years | 34 (42.5%) | $0 |
| 65+ Years | 14 (17.5%) | $68,889 |
| Total | 80 (100.0%) | $59,375 |
Poverty in King County
Income Below Poverty by Sex and Age in King County
With 29.2% poverty level for males and 26.2% for females among the residents of King County, 35 to 44 year old males and 18 to 24 year old females are the most vulnerable to poverty, with 22 males (73.3%) and 5 females (100.0%) in their respective age groups living below the poverty level.
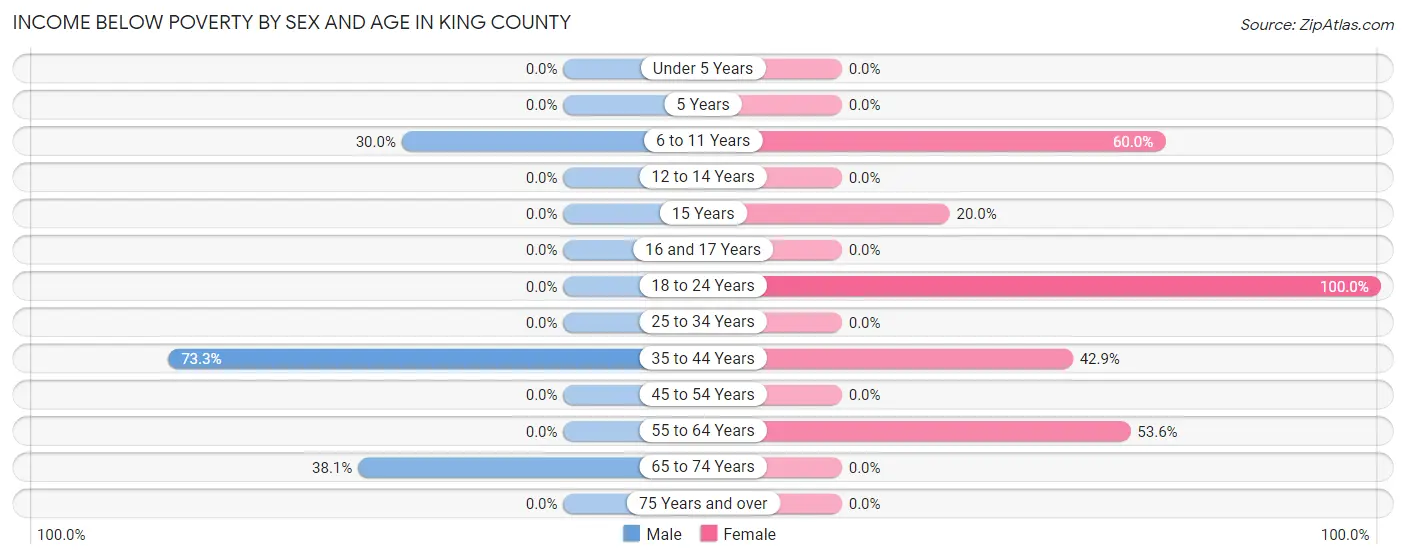
| Age Bracket | Male | Female |
| Under 5 Years | 0 (0.0%) | 0 (0.0%) |
| 5 Years | 0 (0.0%) | 0 (0.0%) |
| 6 to 11 Years | 3 (30.0%) | 3 (60.0%) |
| 12 to 14 Years | 0 (0.0%) | 0 (0.0%) |
| 15 Years | 0 (0.0%) | 1 (20.0%) |
| 16 and 17 Years | 0 (0.0%) | 0 (0.0%) |
| 18 to 24 Years | 0 (0.0%) | 5 (100.0%) |
| 25 to 34 Years | 0 (0.0%) | 0 (0.0%) |
| 35 to 44 Years | 22 (73.3%) | 3 (42.9%) |
| 45 to 54 Years | 0 (0.0%) | 0 (0.0%) |
| 55 to 64 Years | 0 (0.0%) | 15 (53.6%) |
| 65 to 74 Years | 8 (38.1%) | 0 (0.0%) |
| 75 Years and over | 0 (0.0%) | 0 (0.0%) |
| Total | 33 (29.2%) | 27 (26.2%) |
Income Above Poverty by Sex and Age in King County
According to the poverty statistics in King County, males aged under 5 years and females aged under 5 years are the age groups that are most secure financially, with 100.0% of males and 100.0% of females in these age groups living above the poverty line.
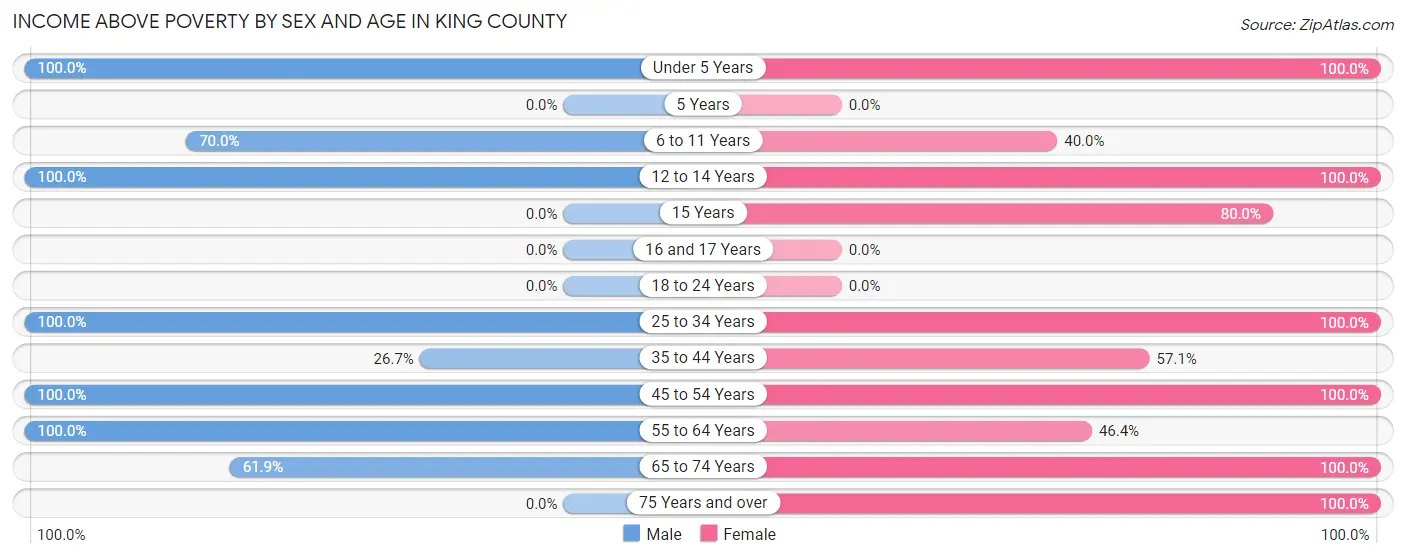
| Age Bracket | Male | Female |
| Under 5 Years | 9 (100.0%) | 5 (100.0%) |
| 5 Years | 0 (0.0%) | 0 (0.0%) |
| 6 to 11 Years | 7 (70.0%) | 2 (40.0%) |
| 12 to 14 Years | 10 (100.0%) | 7 (100.0%) |
| 15 Years | 0 (0.0%) | 4 (80.0%) |
| 16 and 17 Years | 0 (0.0%) | 0 (0.0%) |
| 18 to 24 Years | 0 (0.0%) | 0 (0.0%) |
| 25 to 34 Years | 9 (100.0%) | 26 (100.0%) |
| 35 to 44 Years | 8 (26.7%) | 4 (57.1%) |
| 45 to 54 Years | 11 (100.0%) | 8 (100.0%) |
| 55 to 64 Years | 13 (100.0%) | 13 (46.4%) |
| 65 to 74 Years | 13 (61.9%) | 5 (100.0%) |
| 75 Years and over | 0 (0.0%) | 2 (100.0%) |
| Total | 80 (70.8%) | 76 (73.8%) |
Income Below Poverty Among Married-Couple Families in King County
The poverty statistics for married-couple families in King County show that 25.9% or 15 of the total 58 families live below the poverty line. Families with no children have the highest poverty rate of 41.7%, comprising of 15 families. On the other hand, families with 1 or 2 children have the lowest poverty rate of 0.0%, which includes 0 families.
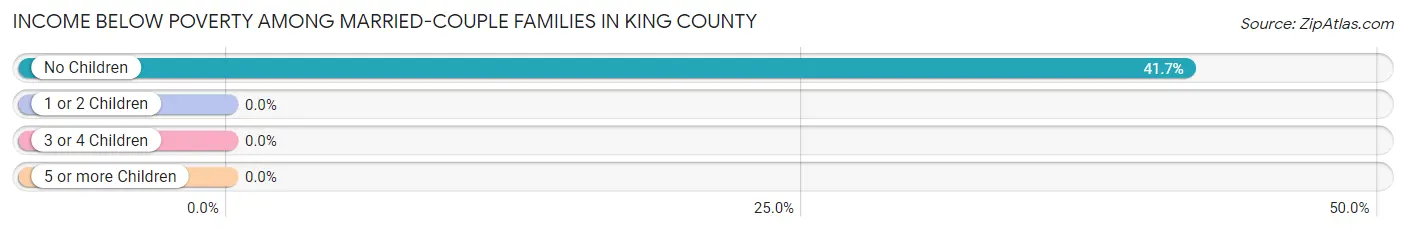
| Children | Above Poverty | Below Poverty |
| No Children | 21 (58.3%) | 15 (41.7%) |
| 1 or 2 Children | 22 (100.0%) | 0 (0.0%) |
| 3 or 4 Children | 0 (0.0%) | 0 (0.0%) |
| 5 or more Children | 0 (0.0%) | 0 (0.0%) |
| Total | 43 (74.1%) | 15 (25.9%) |
Income Below Poverty Among Single-Parent Households in King County
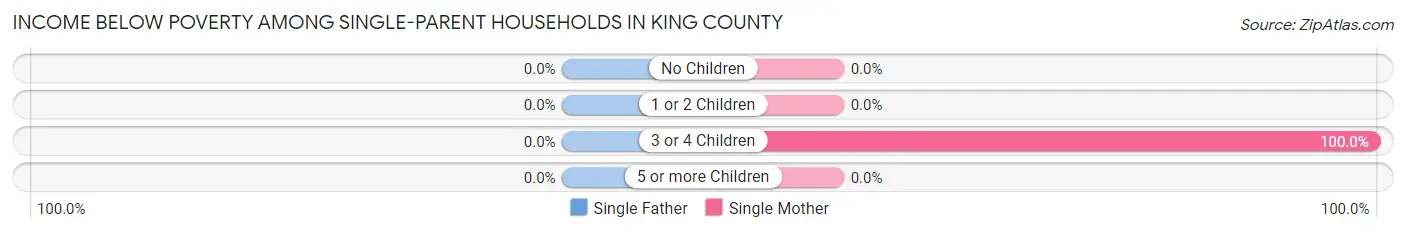
| Children | Single Father | Single Mother |
| No Children | 0 (0.0%) | 0 (0.0%) |
| 1 or 2 Children | 0 (0.0%) | 0 (0.0%) |
| 3 or 4 Children | 0 (0.0%) | 3 (100.0%) |
| 5 or more Children | 0 (0.0%) | 0 (0.0%) |
| Total | 0 (0.0%) | 3 (20.0%) |
Income Below Poverty Among Married-Couple vs Single-Parent Households in King County
The poverty data for King County shows that 15 of the married-couple family households (25.9%) and 3 of the single-parent households (20.0%) are living below the poverty level. Within the married-couple family households, those with no children have the highest poverty rate, with 15 households (41.7%) falling below the poverty line. Among the single-parent households, those with 3 or 4 children have the highest poverty rate, with 3 household (100.0%) living below poverty.
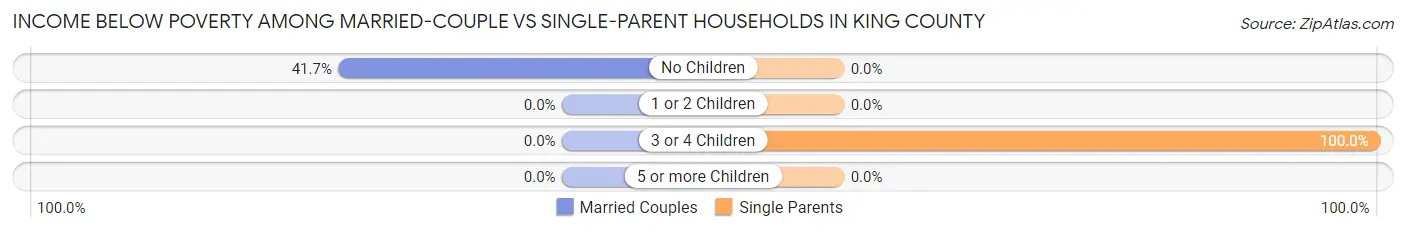
| Children | Married-Couple Families | Single-Parent Households |
| No Children | 15 (41.7%) | 0 (0.0%) |
| 1 or 2 Children | 0 (0.0%) | 0 (0.0%) |
| 3 or 4 Children | 0 (0.0%) | 3 (100.0%) |
| 5 or more Children | 0 (0.0%) | 0 (0.0%) |
| Total | 15 (25.9%) | 3 (20.0%) |
Race in King County
The most populous races in King County are White / Caucasian (184 | 85.2%), Hispanic or Latino (71 | 32.9%), and Two or more Races (29 | 13.4%).
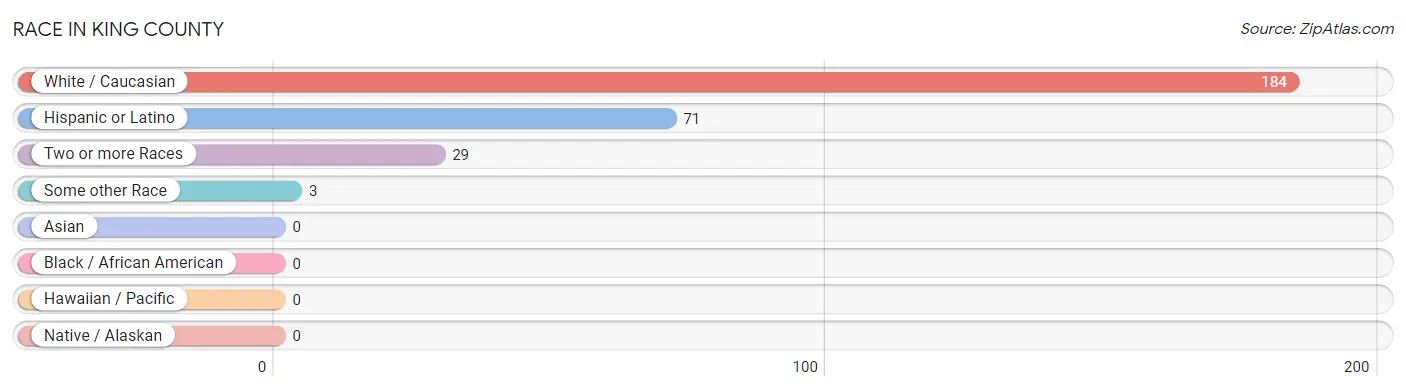
| Race | # Population | % Population |
| Asian | 0 | 0.0% |
| Black / African American | 0 | 0.0% |
| Hawaiian / Pacific | 0 | 0.0% |
| Hispanic or Latino | 71 | 32.9% |
| Native / Alaskan | 0 | 0.0% |
| White / Caucasian | 184 | 85.2% |
| Two or more Races | 29 | 13.4% |
| Some other Race | 3 | 1.4% |
| Total | 216 | 100.0% |
Ancestry in King County
The most populous ancestries reported in King County are Mexican (71 | 32.9%), English (58 | 26.9%), German (22 | 10.2%), Irish (21 | 9.7%), and Scottish (16 | 7.4%), together accounting for 87.0% of all King County residents.
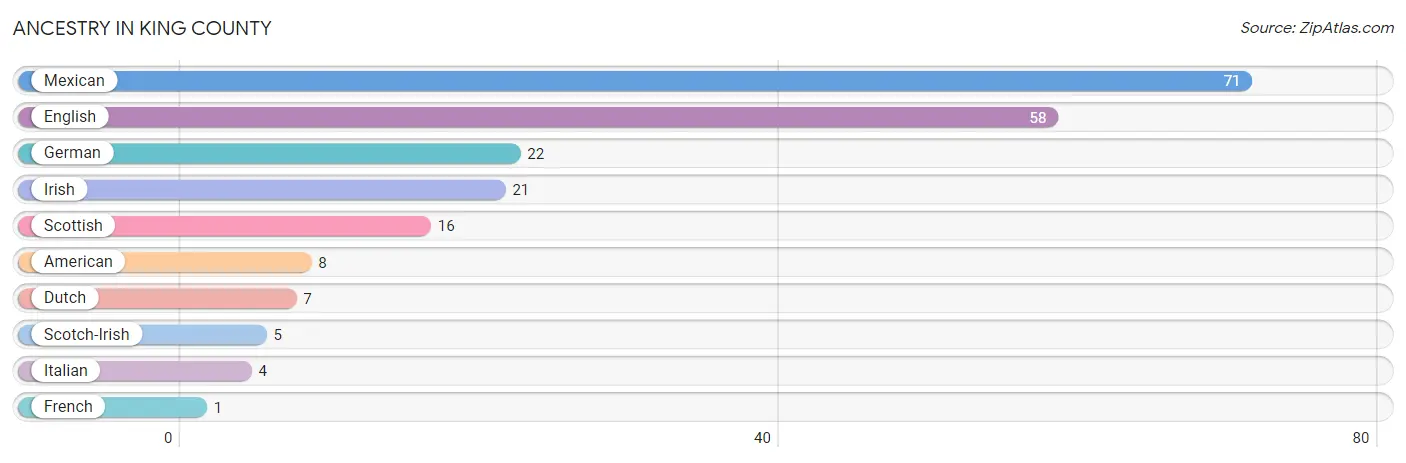
| Ancestry | # Population | % Population |
| American | 8 | 3.7% |
| Dutch | 7 | 3.2% |
| English | 58 | 26.9% |
| French | 1 | 0.5% |
| German | 22 | 10.2% |
| Irish | 21 | 9.7% |
| Italian | 4 | 1.8% |
| Mexican | 71 | 32.9% |
| Scotch-Irish | 5 | 2.3% |
| Scottish | 16 | 7.4% | View All 10 Rows |
Immigrants in King County
The most numerous immigrant groups reported in King County came from Central America (30 | 13.9%), Latin America (30 | 13.9%), and Mexico (30 | 13.9%), together accounting for 41.7% of all King County residents.
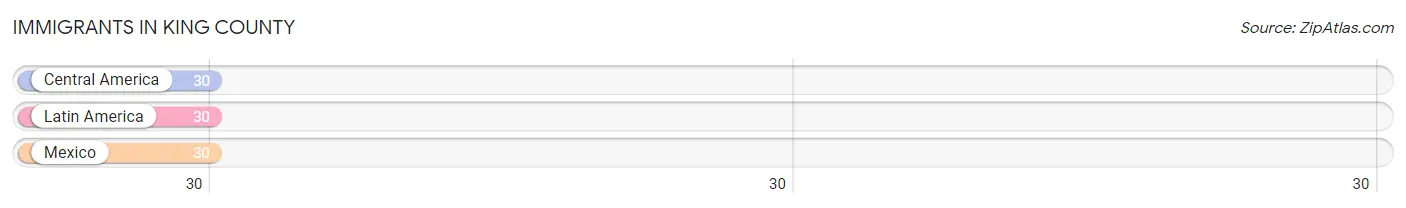
| Immigration Origin | # Population | % Population |
| Central America | 30 | 13.9% |
| Latin America | 30 | 13.9% |
| Mexico | 30 | 13.9% | View All 3 Rows |
Sex and Age in King County
Sex and Age in King County
The most populous age groups in King County are 35 to 39 Years (28 | 24.8%) for men and 25 to 29 Years (25 | 24.3%) for women.
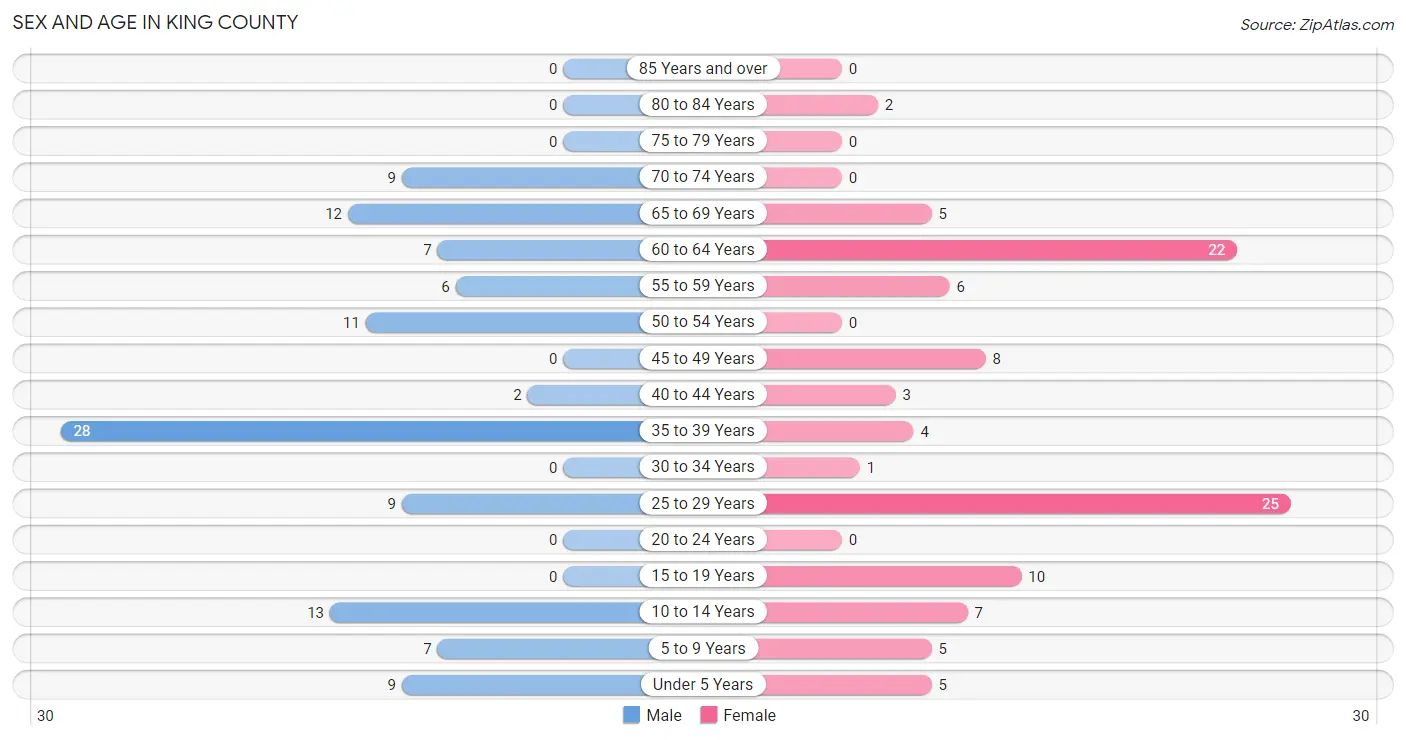
| Age Bracket | Male | Female |
| Under 5 Years | 9 (8.0%) | 5 (4.9%) |
| 5 to 9 Years | 7 (6.2%) | 5 (4.9%) |
| 10 to 14 Years | 13 (11.5%) | 7 (6.8%) |
| 15 to 19 Years | 0 (0.0%) | 10 (9.7%) |
| 20 to 24 Years | 0 (0.0%) | 0 (0.0%) |
| 25 to 29 Years | 9 (8.0%) | 25 (24.3%) |
| 30 to 34 Years | 0 (0.0%) | 1 (1.0%) |
| 35 to 39 Years | 28 (24.8%) | 4 (3.9%) |
| 40 to 44 Years | 2 (1.8%) | 3 (2.9%) |
| 45 to 49 Years | 0 (0.0%) | 8 (7.8%) |
| 50 to 54 Years | 11 (9.7%) | 0 (0.0%) |
| 55 to 59 Years | 6 (5.3%) | 6 (5.8%) |
| 60 to 64 Years | 7 (6.2%) | 22 (21.4%) |
| 65 to 69 Years | 12 (10.6%) | 5 (4.9%) |
| 70 to 74 Years | 9 (8.0%) | 0 (0.0%) |
| 75 to 79 Years | 0 (0.0%) | 0 (0.0%) |
| 80 to 84 Years | 0 (0.0%) | 2 (1.9%) |
| 85 Years and over | 0 (0.0%) | 0 (0.0%) |
| Total | 113 (100.0%) | 103 (100.0%) |
Families and Households in King County
Median Family Size in King County
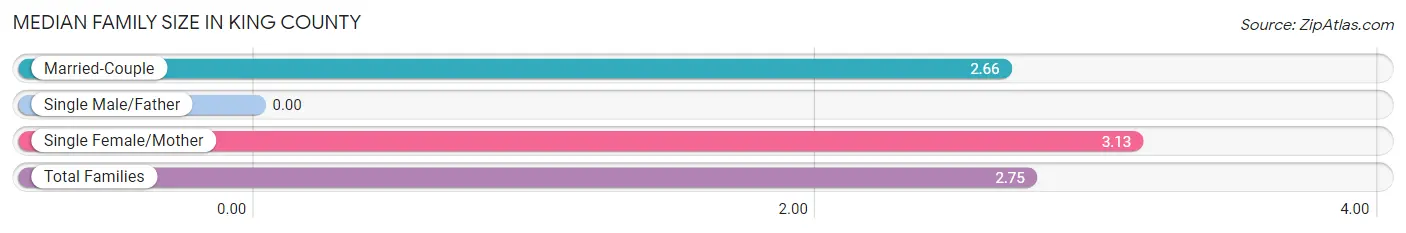
| Family Type | # Families | Family Size |
| Married-Couple | 58 (79.4%) | 2.66 |
| Single Male/Father | 0 (0.0%) | - |
| Single Female/Mother | 15 (20.5%) | 3.13 |
| Total Families | 73 (100.0%) | 2.75 |
Median Household Size in King County
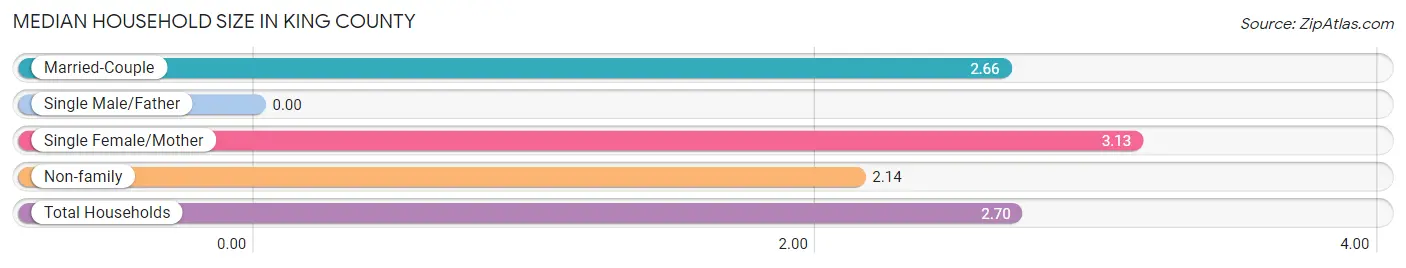
| Household Type | # Households | Household Size |
| Married-Couple | 58 (72.5%) | 2.66 |
| Single Male/Father | 0 (0.0%) | - |
| Single Female/Mother | 15 (18.8%) | 3.13 |
| Non-family | 7 (8.7%) | 2.14 |
| Total Households | 80 (100.0%) | 2.70 |
Household Size by Marriage Status in King County
Out of a total of 80 households in King County, 73 (91.2%) are family households, while 7 (8.7%) are nonfamily households. The most numerous type of family households are 3-person households, comprising 26, and the most common type of nonfamily households are 2-person households, comprising 5.
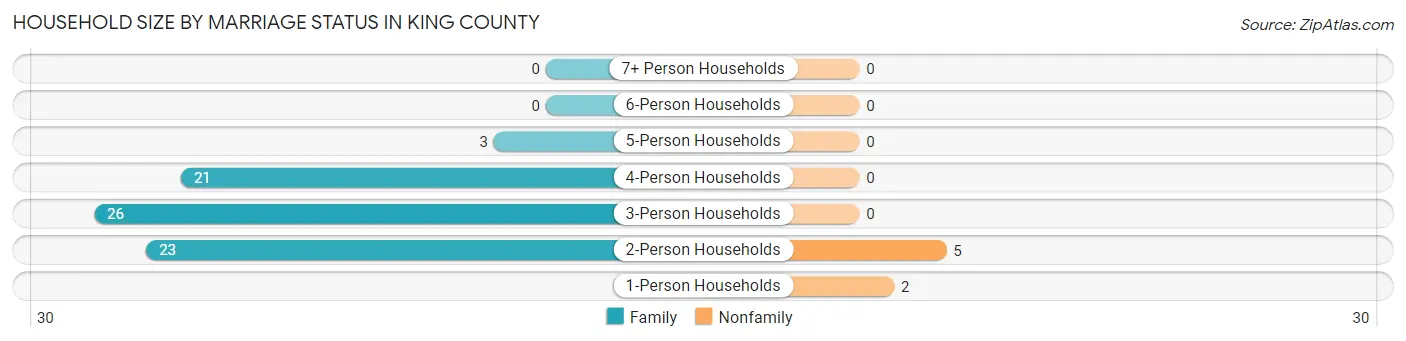
| Household Size | Family Households | Nonfamily Households |
| 1-Person Households | - | 2 (2.5%) |
| 2-Person Households | 23 (28.7%) | 5 (6.2%) |
| 3-Person Households | 26 (32.5%) | 0 (0.0%) |
| 4-Person Households | 21 (26.3%) | 0 (0.0%) |
| 5-Person Households | 3 (3.7%) | 0 (0.0%) |
| 6-Person Households | 0 (0.0%) | 0 (0.0%) |
| 7+ Person Households | 0 (0.0%) | 0 (0.0%) |
| Total | 73 (91.2%) | 7 (8.7%) |
Female Fertility in King County
Fertility by Age in King County
| Age Bracket | Women with Births | Births / 1,000 Women |
| 15 to 19 years | 0 (0.0%) | 0.0 |
| 20 to 34 years | 0 (0.0%) | 0.0 |
| 35 to 50 years | 0 (0.0%) | 0.0 |
| Total | 0 (0.0%) | 0.0 |
Fertility by Age by Marriage Status in King County
| Age Bracket | Married | Unmarried |
| 15 to 19 years | 0 (0.0%) | 0 (0.0%) |
| 20 to 34 years | 0 (0.0%) | 0 (0.0%) |
| 35 to 50 years | 0 (0.0%) | 0 (0.0%) |
| Total | 0 (0.0%) | 0 (0.0%) |
Fertility by Education in King County
| Educational Attainment | Women with Births | Births / 1,000 Women |
| Less than High School | 0 (0.0%) | 0.0 |
| High School Diploma | 0 (0.0%) | 0.0 |
| College or Associate's Degree | 0 (0.0%) | 0.0 |
| Bachelor's Degree | 0 (0.0%) | 0.0 |
| Graduate Degree | 0 (0.0%) | 0.0 |
| Total | 0 (0.0%) | 0.0 |
Fertility by Education by Marriage Status in King County
| Educational Attainment | Married | Unmarried |
| Less than High School | 0 (0.0%) | 0 (0.0%) |
| High School Diploma | 0 (0.0%) | 0 (0.0%) |
| College or Associate's Degree | 0 (0.0%) | 0 (0.0%) |
| Bachelor's Degree | 0 (0.0%) | 0 (0.0%) |
| Graduate Degree | 0 (0.0%) | 0 (0.0%) |
| Total | 0 (0.0%) | 0 (0.0%) |
Employment Characteristics in King County
Employment by Class of Employer in King County
Among the 85 employed individuals in King County, private company employees (52 | 61.2%), local government employees (20 | 23.5%), and not-for-profit organizations (8 | 9.4%) make up the most common classes of employment.
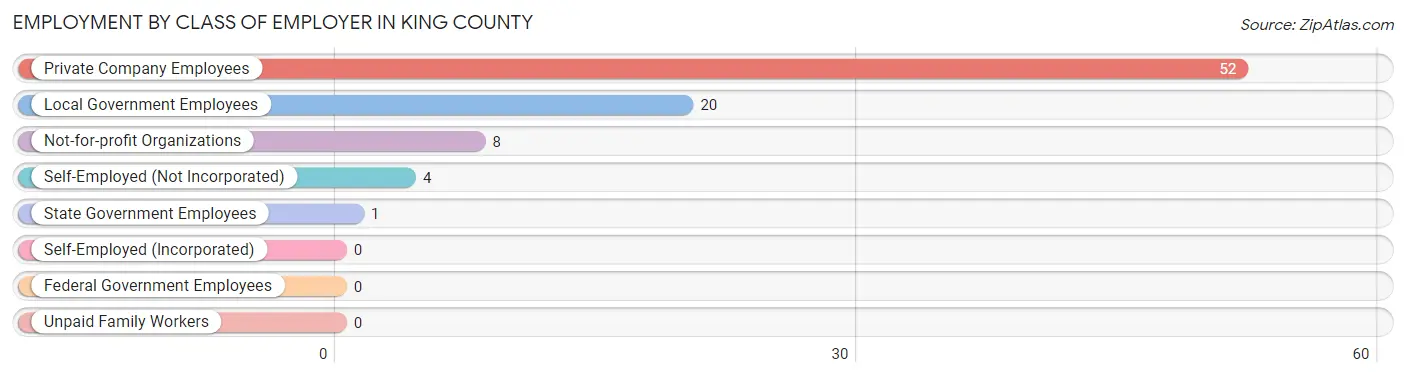
| Employer Class | # Employees | % Employees |
| Private Company Employees | 52 | 61.2% |
| Self-Employed (Incorporated) | 0 | 0.0% |
| Self-Employed (Not Incorporated) | 4 | 4.7% |
| Not-for-profit Organizations | 8 | 9.4% |
| Local Government Employees | 20 | 23.5% |
| State Government Employees | 1 | 1.2% |
| Federal Government Employees | 0 | 0.0% |
| Unpaid Family Workers | 0 | 0.0% |
| Total | 85 | 100.0% |
Employment Status by Age in King County
According to the labor force statistics for King County, out of the total population over 16 years of age (165), 53.9% or 89 individuals are in the labor force, with 4.5% or 4 of them unemployed. The age group with the highest labor force participation rate is 25 to 29 years, with 100.0% or 34 individuals in the labor force. Within the labor force, the 55 to 59 years age range has the highest percentage of unemployed individuals, with 33.3% or 4 of them being unemployed.
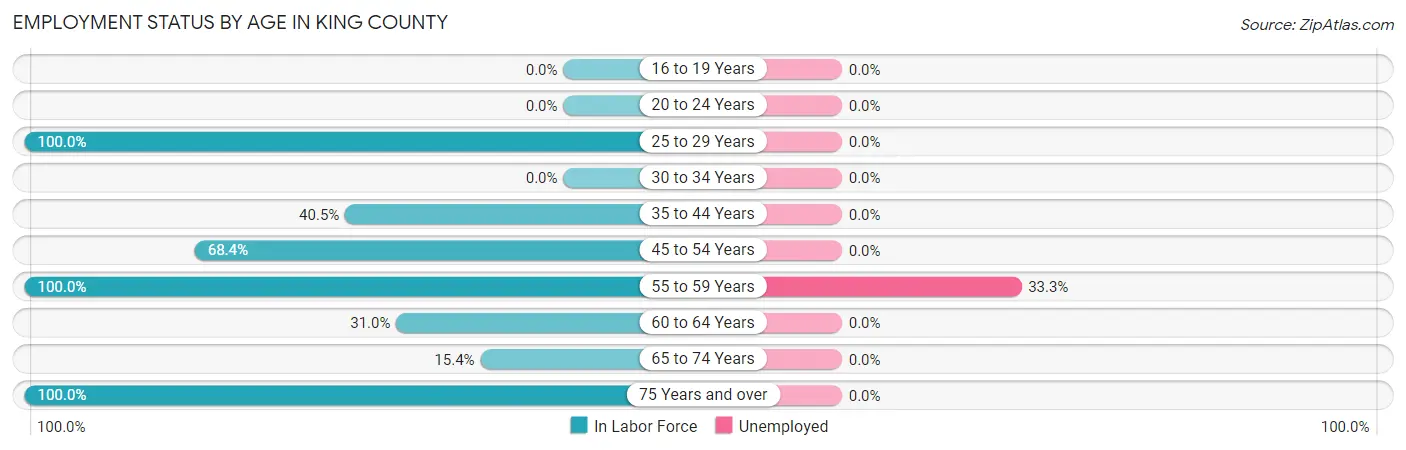
| Age Bracket | In Labor Force | Unemployed |
| 16 to 19 Years | 0 (0.0%) | 0 (0.0%) |
| 20 to 24 Years | 0 (0.0%) | 0 (0.0%) |
| 25 to 29 Years | 34 (100.0%) | 0 (0.0%) |
| 30 to 34 Years | 0 (0.0%) | 0 (0.0%) |
| 35 to 44 Years | 15 (40.5%) | 0 (0.0%) |
| 45 to 54 Years | 13 (68.4%) | 0 (0.0%) |
| 55 to 59 Years | 12 (100.0%) | 4 (33.3%) |
| 60 to 64 Years | 9 (31.0%) | 0 (0.0%) |
| 65 to 74 Years | 4 (15.4%) | 0 (0.0%) |
| 75 Years and over | 2 (100.0%) | 0 (0.0%) |
| Total | 89 (53.9%) | 4 (4.5%) |
Employment Status by Educational Attainment in King County
According to labor force statistics for King County, 62.9% of individuals (83) out of the total population between 25 and 64 years of age (132) are in the labor force, with 4.8% or 4 of them being unemployed. The group with the highest labor force participation rate are those with the educational attainment of bachelor's degree or higher, with 100.0% or 49 individuals in the labor force. Within the labor force, individuals with high school diploma education have the highest percentage of unemployment, with 40.0% or 4 of them being unemployed.
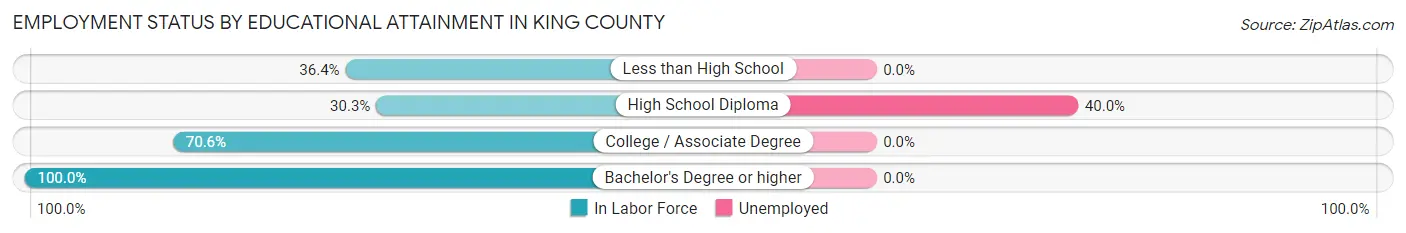
| Educational Attainment | In Labor Force | Unemployed |
| Less than High School | 12 (36.4%) | 0 (0.0%) |
| High School Diploma | 10 (30.3%) | 13 (40.0%) |
| College / Associate Degree | 12 (70.6%) | 0 (0.0%) |
| Bachelor's Degree or higher | 49 (100.0%) | 0 (0.0%) |
| Total | 83 (62.9%) | 6 (4.8%) |
Employment Occupations by Sex in King County
Management, Business, Science and Arts Occupations
The most common Management, Business, Science and Arts occupations in King County are Community & Social Service (18 | 21.2%), Education Instruction & Library (18 | 21.2%), and Management (14 | 16.5%).
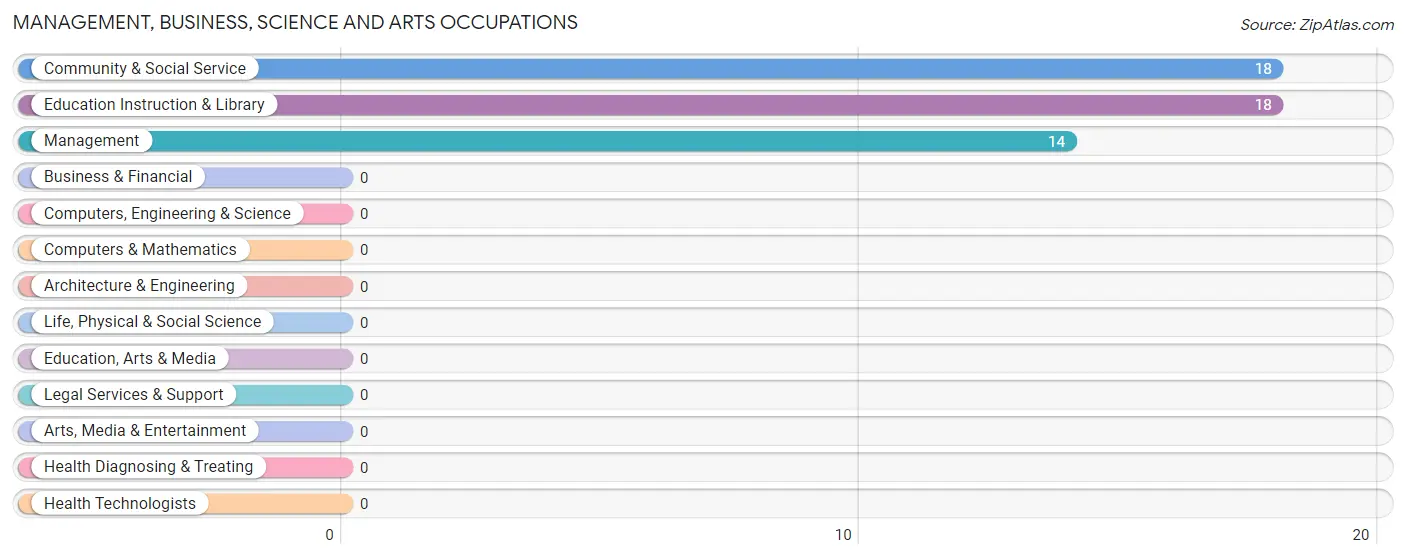
Management, Business, Science and Arts Occupations by Sex
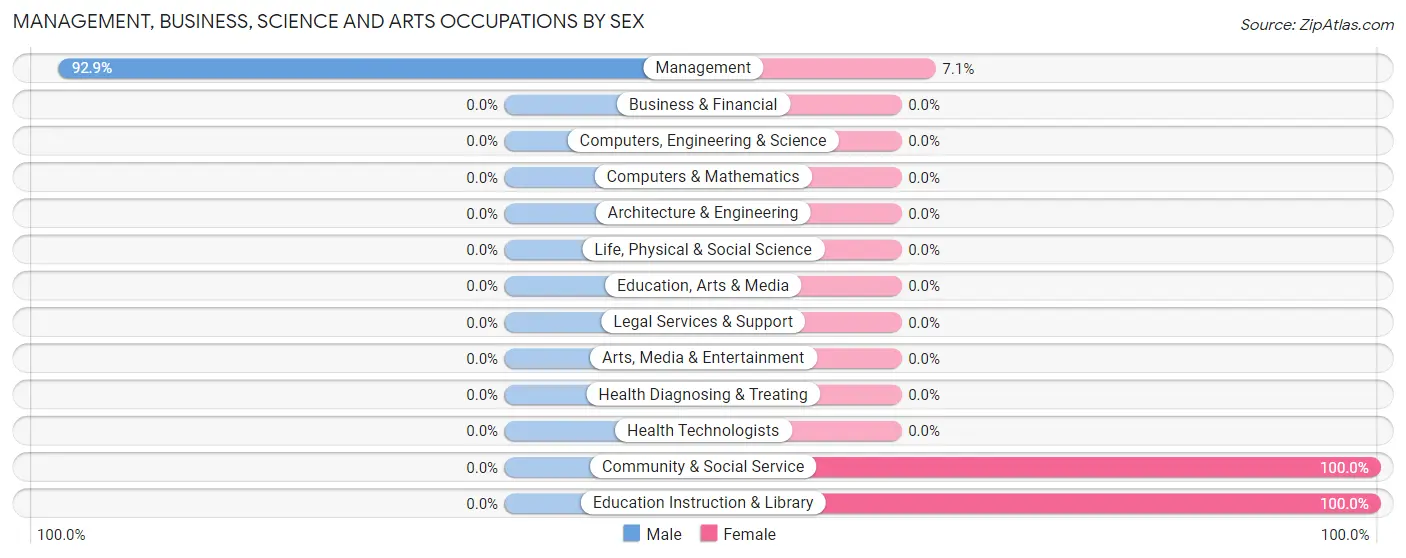
| Occupation | Male | Female |
| Management | 13 (92.9%) | 1 (7.1%) |
| Business & Financial | 0 (0.0%) | 0 (0.0%) |
| Computers, Engineering & Science | 0 (0.0%) | 0 (0.0%) |
| Computers & Mathematics | 0 (0.0%) | 0 (0.0%) |
| Architecture & Engineering | 0 (0.0%) | 0 (0.0%) |
| Life, Physical & Social Science | 0 (0.0%) | 0 (0.0%) |
| Community & Social Service | 0 (0.0%) | 18 (100.0%) |
| Education, Arts & Media | 0 (0.0%) | 0 (0.0%) |
| Legal Services & Support | 0 (0.0%) | 0 (0.0%) |
| Education Instruction & Library | 0 (0.0%) | 18 (100.0%) |
| Arts, Media & Entertainment | 0 (0.0%) | 0 (0.0%) |
| Health Diagnosing & Treating | 0 (0.0%) | 0 (0.0%) |
| Health Technologists | 0 (0.0%) | 0 (0.0%) |
| Total (Category) | 13 (40.6%) | 19 (59.4%) |
| Total (Overall) | 41 (48.2%) | 44 (51.8%) |
Services Occupations
The most common Services occupations in King County are Personal Care & Service (6 | 7.1%), Healthcare Support (4 | 4.7%), and Cleaning & Maintenance (4 | 4.7%).
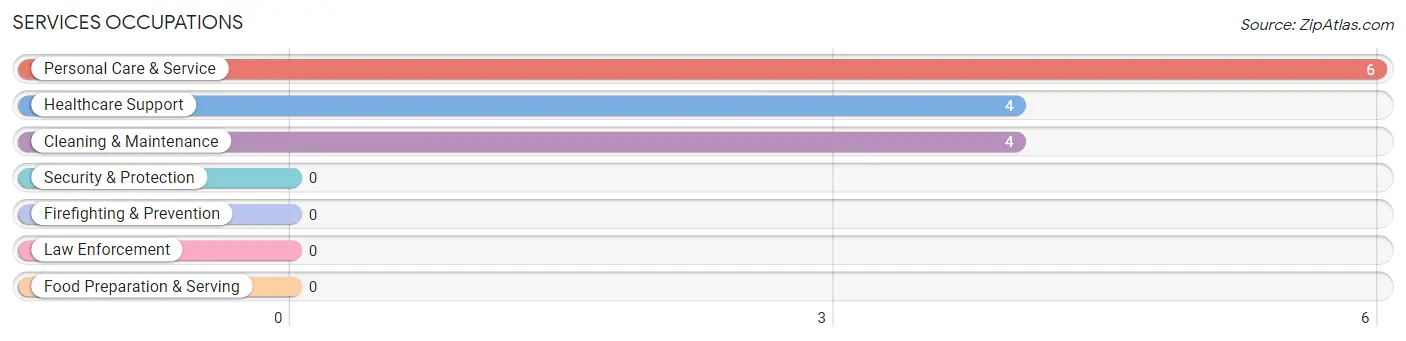
Services Occupations by Sex
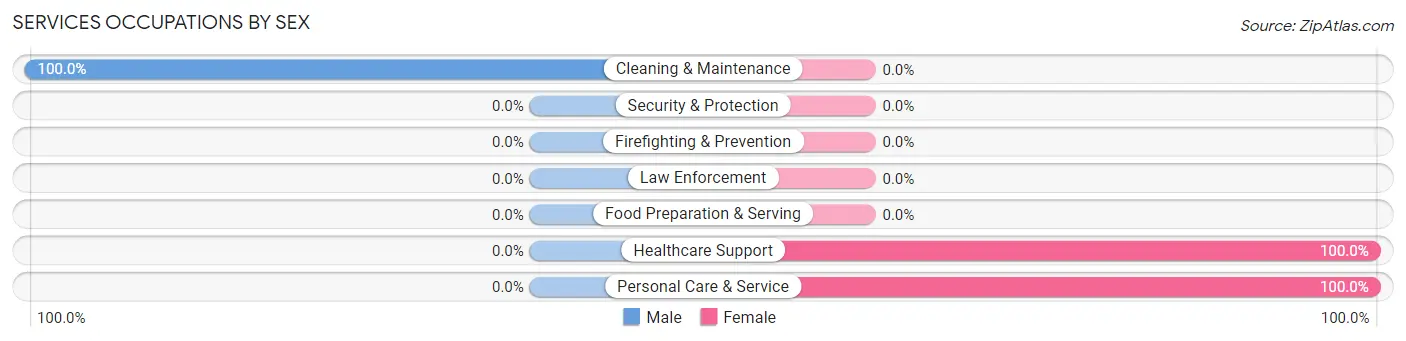
| Occupation | Male | Female |
| Healthcare Support | 0 (0.0%) | 4 (100.0%) |
| Security & Protection | 0 (0.0%) | 0 (0.0%) |
| Firefighting & Prevention | 0 (0.0%) | 0 (0.0%) |
| Law Enforcement | 0 (0.0%) | 0 (0.0%) |
| Food Preparation & Serving | 0 (0.0%) | 0 (0.0%) |
| Cleaning & Maintenance | 4 (100.0%) | 0 (0.0%) |
| Personal Care & Service | 0 (0.0%) | 6 (100.0%) |
| Total (Category) | 4 (28.6%) | 10 (71.4%) |
| Total (Overall) | 41 (48.2%) | 44 (51.8%) |
Sales and Office Occupations
The most common Sales and Office occupations in King County are Office & Administration (12 | 14.1%), and Sales & Related (4 | 4.7%).
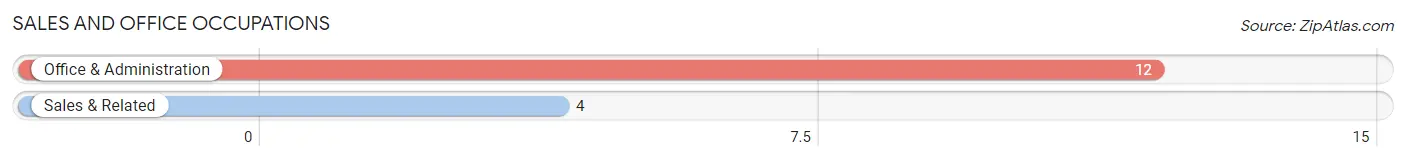
Sales and Office Occupations by Sex
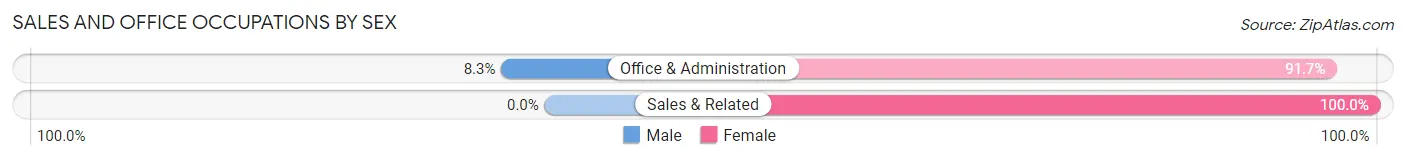
| Occupation | Male | Female |
| Sales & Related | 0 (0.0%) | 4 (100.0%) |
| Office & Administration | 1 (8.3%) | 11 (91.7%) |
| Total (Category) | 1 (6.2%) | 15 (93.8%) |
| Total (Overall) | 41 (48.2%) | 44 (51.8%) |
Natural Resources, Construction and Maintenance Occupations
The most common Natural Resources, Construction and Maintenance occupations in King County are Farming, Fishing & Forestry (18 | 21.2%), and Construction & Extraction (2 | 2.4%).
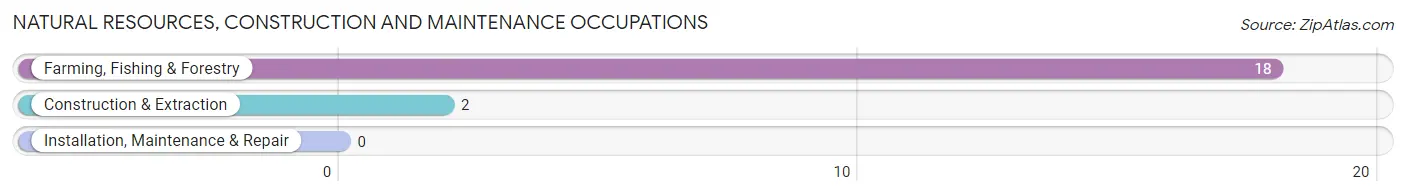
Natural Resources, Construction and Maintenance Occupations by Sex
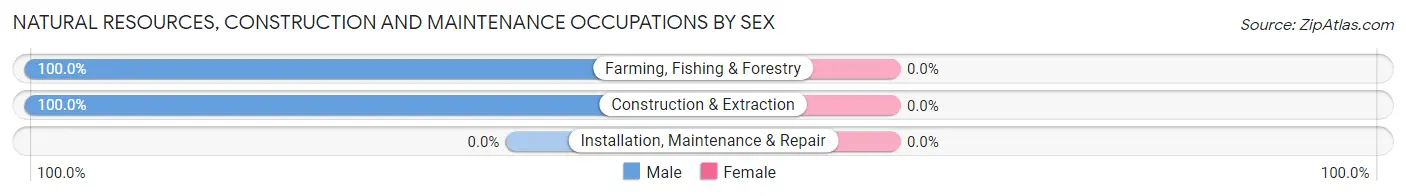
| Occupation | Male | Female |
| Farming, Fishing & Forestry | 18 (100.0%) | 0 (0.0%) |
| Construction & Extraction | 2 (100.0%) | 0 (0.0%) |
| Installation, Maintenance & Repair | 0 (0.0%) | 0 (0.0%) |
| Total (Category) | 20 (100.0%) | 0 (0.0%) |
| Total (Overall) | 41 (48.2%) | 44 (51.8%) |
Production, Transportation and Moving Occupations
The most common Production, Transportation and Moving occupations in King County are Material Moving (2 | 2.4%), and Transportation (1 | 1.2%).
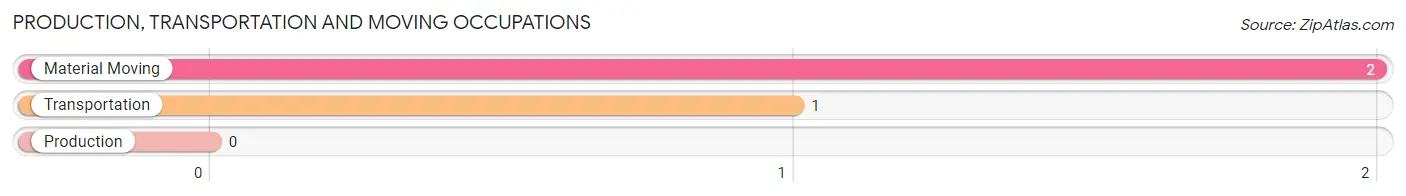
Production, Transportation and Moving Occupations by Sex
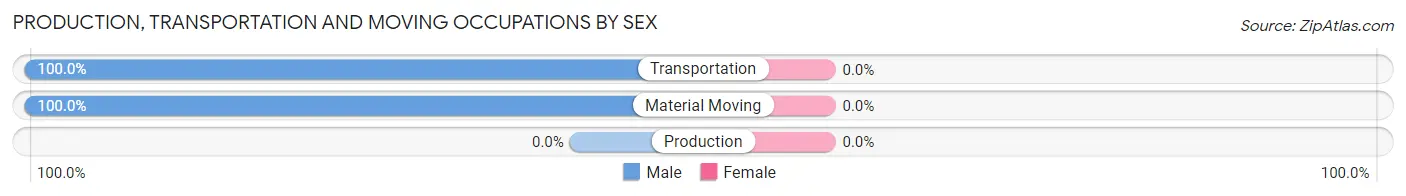
| Occupation | Male | Female |
| Production | 0 (0.0%) | 0 (0.0%) |
| Transportation | 1 (100.0%) | 0 (0.0%) |
| Material Moving | 2 (100.0%) | 0 (0.0%) |
| Total (Category) | 3 (100.0%) | 0 (0.0%) |
| Total (Overall) | 41 (48.2%) | 44 (51.8%) |
Employment Industries by Sex in King County
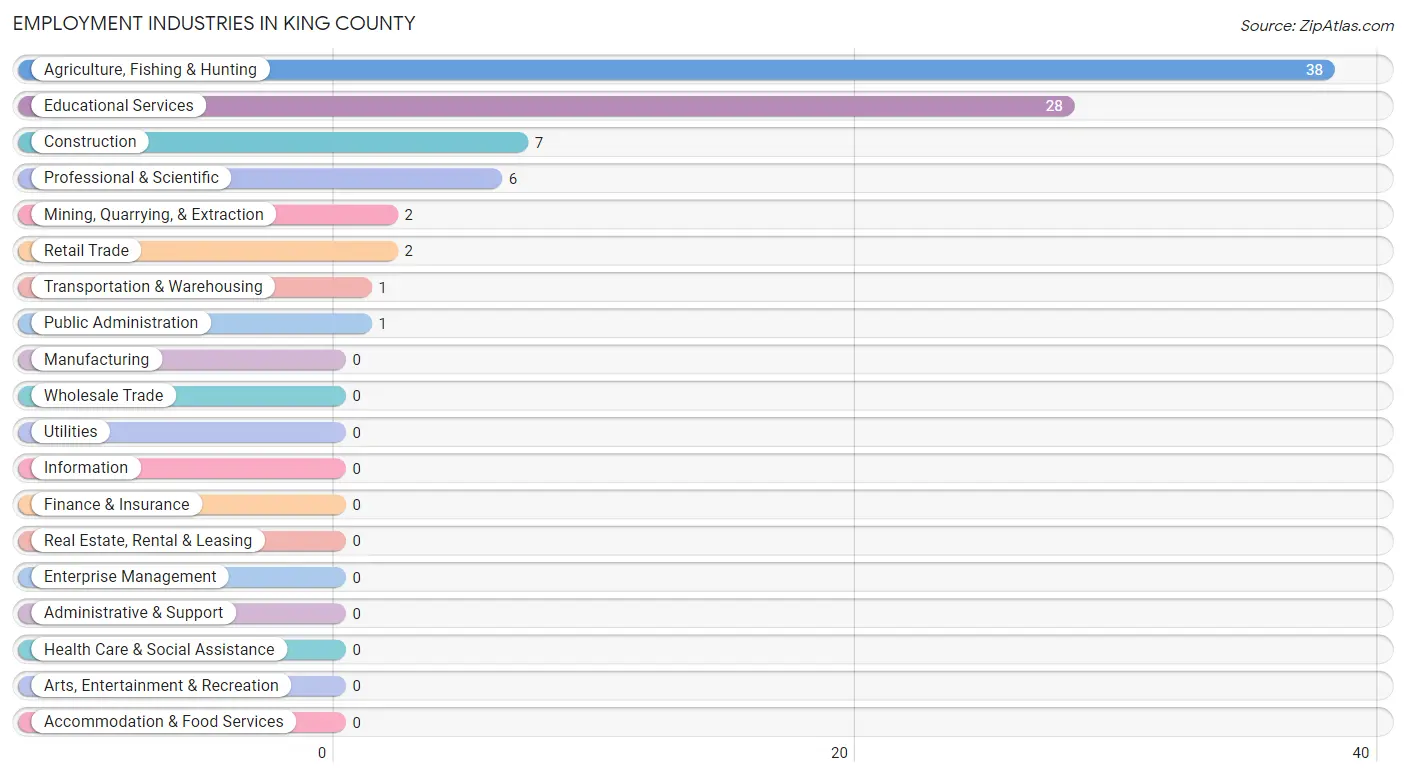
Employment Industries in King County
The major employment industries in King County include Agriculture, Fishing & Hunting (38 | 44.7%), Educational Services (28 | 32.9%), Construction (7 | 8.2%), Professional & Scientific (6 | 7.1%), and Mining, Quarrying, & Extraction (2 | 2.4%).
Employment Industries by Sex in King County
The King County industries that see more men than women are Mining, Quarrying, & Extraction (100.0%), Transportation & Warehousing (100.0%), and Agriculture, Fishing & Hunting (68.4%), whereas the industries that tend to have a higher number of women are Retail Trade (100.0%), Professional & Scientific (100.0%), and Public Administration (100.0%).
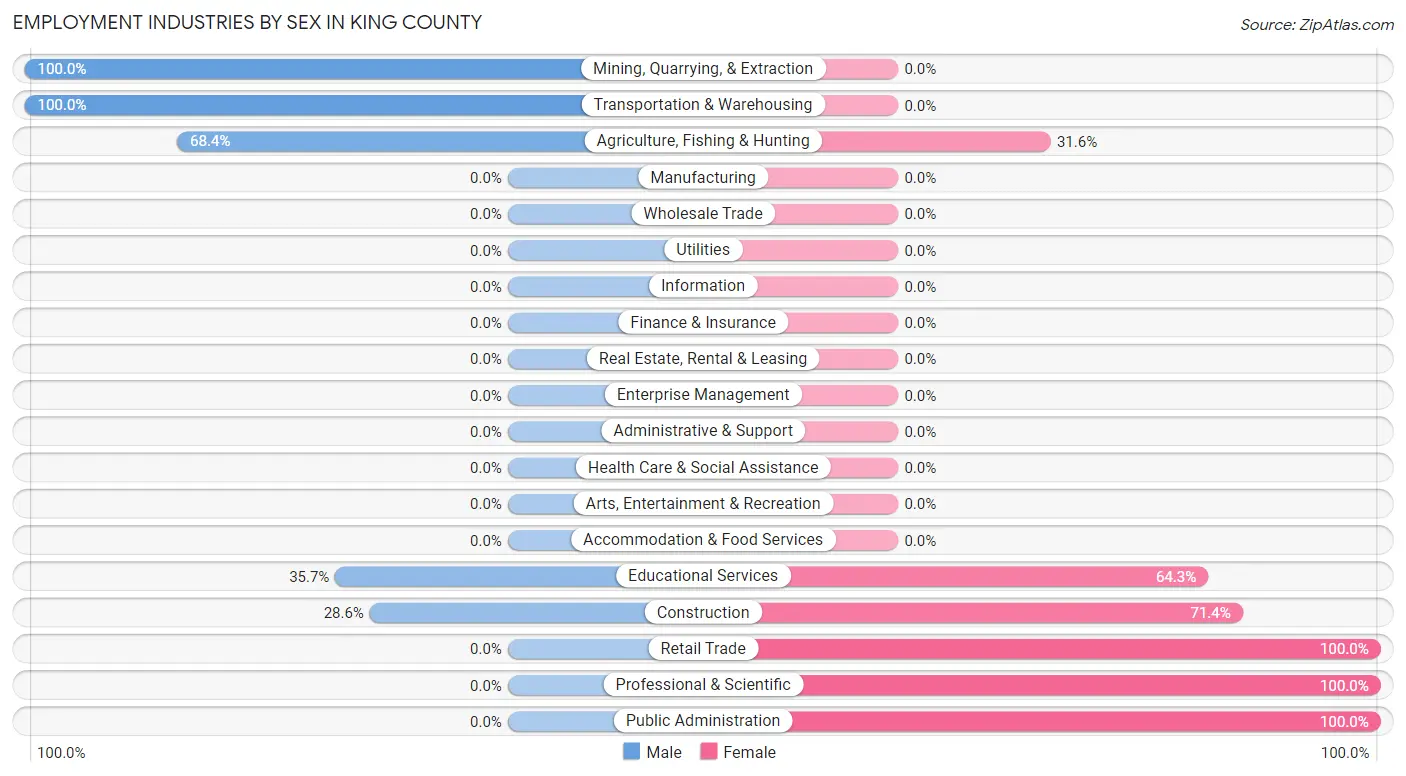
| Industry | Male | Female |
| Agriculture, Fishing & Hunting | 26 (68.4%) | 12 (31.6%) |
| Mining, Quarrying, & Extraction | 2 (100.0%) | 0 (0.0%) |
| Construction | 2 (28.6%) | 5 (71.4%) |
| Manufacturing | 0 (0.0%) | 0 (0.0%) |
| Wholesale Trade | 0 (0.0%) | 0 (0.0%) |
| Retail Trade | 0 (0.0%) | 2 (100.0%) |
| Transportation & Warehousing | 1 (100.0%) | 0 (0.0%) |
| Utilities | 0 (0.0%) | 0 (0.0%) |
| Information | 0 (0.0%) | 0 (0.0%) |
| Finance & Insurance | 0 (0.0%) | 0 (0.0%) |
| Real Estate, Rental & Leasing | 0 (0.0%) | 0 (0.0%) |
| Professional & Scientific | 0 (0.0%) | 6 (100.0%) |
| Enterprise Management | 0 (0.0%) | 0 (0.0%) |
| Administrative & Support | 0 (0.0%) | 0 (0.0%) |
| Educational Services | 10 (35.7%) | 18 (64.3%) |
| Health Care & Social Assistance | 0 (0.0%) | 0 (0.0%) |
| Arts, Entertainment & Recreation | 0 (0.0%) | 0 (0.0%) |
| Accommodation & Food Services | 0 (0.0%) | 0 (0.0%) |
| Public Administration | 0 (0.0%) | 1 (100.0%) |
| Total | 41 (48.2%) | 44 (51.8%) |
Education in King County
School Enrollment in King County
The most common levels of schooling among the 48 students in King County are high school (17 | 35.4%), middle school (13 | 27.1%), and elementary school (12 | 25.0%).
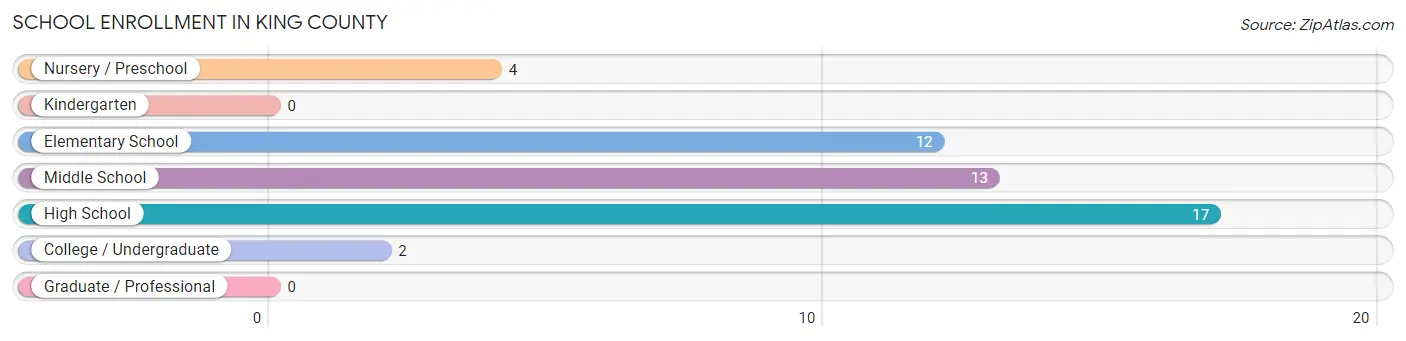
| School Level | # Students | % Students |
| Nursery / Preschool | 4 | 8.3% |
| Kindergarten | 0 | 0.0% |
| Elementary School | 12 | 25.0% |
| Middle School | 13 | 27.1% |
| High School | 17 | 35.4% |
| College / Undergraduate | 2 | 4.2% |
| Graduate / Professional | 0 | 0.0% |
| Total | 48 | 100.0% |
School Enrollment by Age by Funding Source in King County
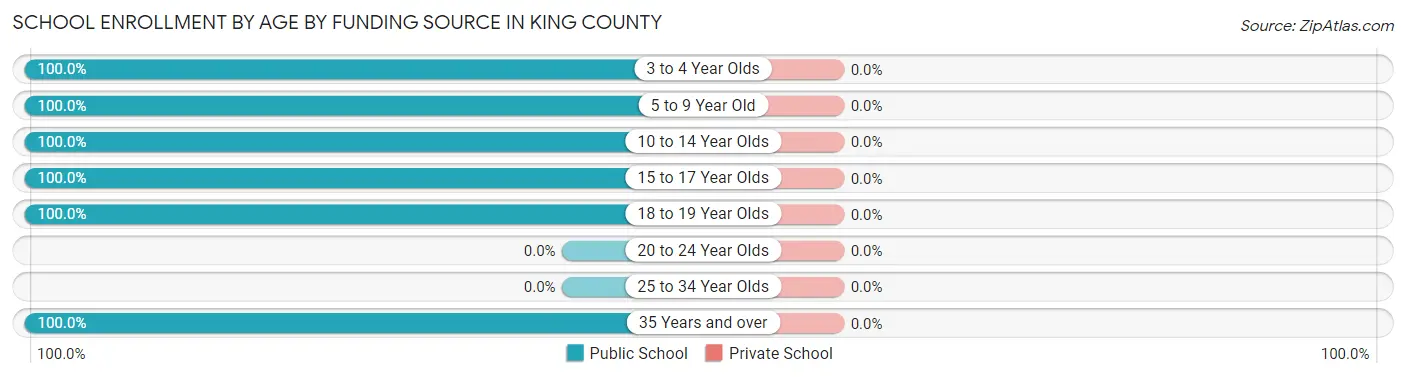
| Age Bracket | Public School | Private School |
| 3 to 4 Year Olds | 4 (100.0%) | 0 (0.0%) |
| 5 to 9 Year Old | 12 (100.0%) | 0 (0.0%) |
| 10 to 14 Year Olds | 20 (100.0%) | 0 (0.0%) |
| 15 to 17 Year Olds | 5 (100.0%) | 0 (0.0%) |
| 18 to 19 Year Olds | 5 (100.0%) | 0 (0.0%) |
| 20 to 24 Year Olds | 0 (0.0%) | 0 (0.0%) |
| 25 to 34 Year Olds | 0 (0.0%) | 0 (0.0%) |
| 35 Years and over | 2 (100.0%) | 0 (0.0%) |
| Total | 48 (100.0%) | 0 (0.0%) |
Educational Attainment by Field of Study in King County
Bio, nature & agricultural (25 | 47.2%), arts & humanities (9 | 17.0%), multidisciplinary studies (8 | 15.1%), education (5 | 9.4%), and physical & health sciences (4 | 7.5%) are the most common fields of study among 53 individuals in King County who have obtained a bachelor's degree or higher.
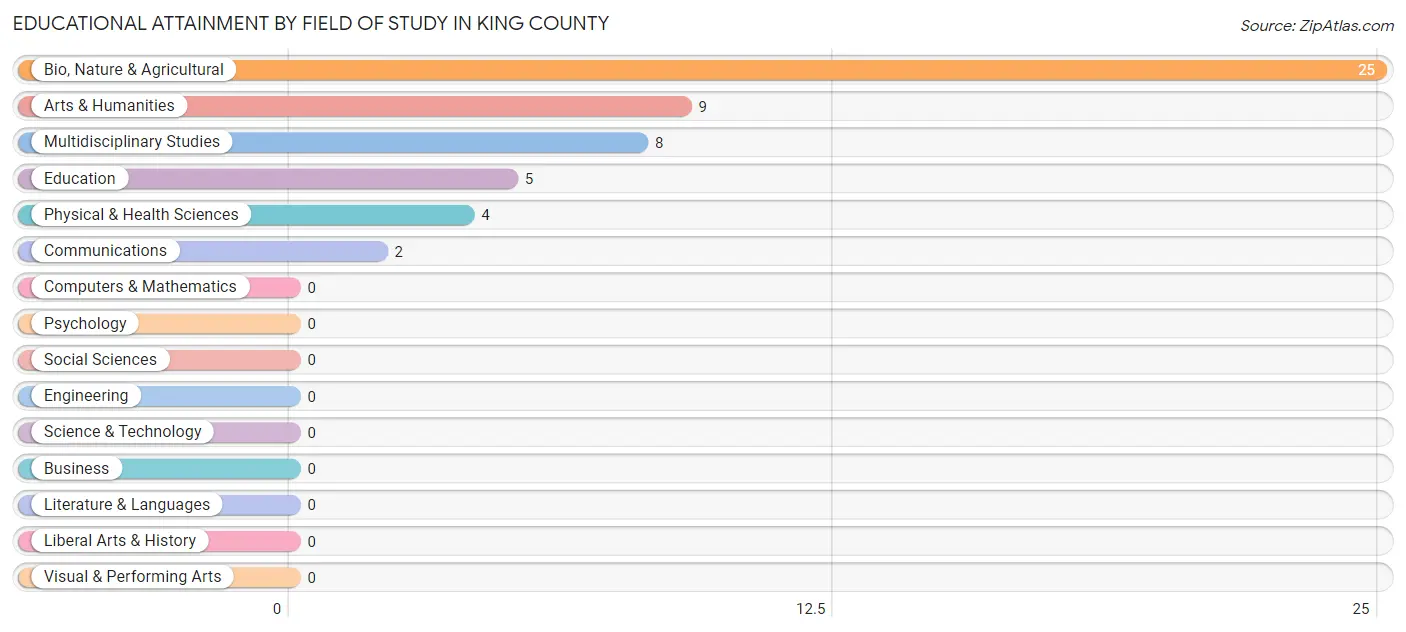
| Field of Study | # Graduates | % Graduates |
| Computers & Mathematics | 0 | 0.0% |
| Bio, Nature & Agricultural | 25 | 47.2% |
| Physical & Health Sciences | 4 | 7.5% |
| Psychology | 0 | 0.0% |
| Social Sciences | 0 | 0.0% |
| Engineering | 0 | 0.0% |
| Multidisciplinary Studies | 8 | 15.1% |
| Science & Technology | 0 | 0.0% |
| Business | 0 | 0.0% |
| Education | 5 | 9.4% |
| Literature & Languages | 0 | 0.0% |
| Liberal Arts & History | 0 | 0.0% |
| Visual & Performing Arts | 0 | 0.0% |
| Communications | 2 | 3.8% |
| Arts & Humanities | 9 | 17.0% |
| Total | 53 | 100.0% |
Transportation & Commute in King County
Vehicle Availability by Sex in King County
The most prevalent vehicle ownership categories in King County are males with 2 vehicles (33, accounting for 80.5%) and females with 2 vehicles (30, making up 75.0%).
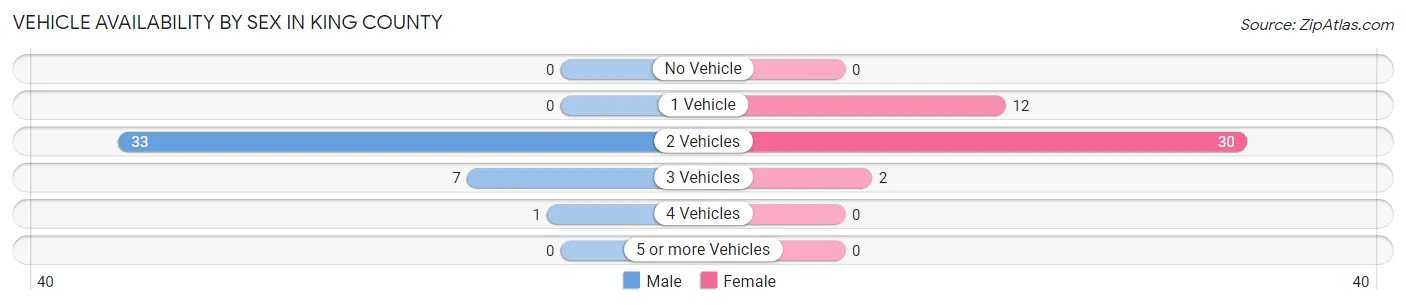
| Vehicles Available | Male | Female |
| No Vehicle | 0 (0.0%) | 0 (0.0%) |
| 1 Vehicle | 0 (0.0%) | 12 (27.3%) |
| 2 Vehicles | 33 (80.5%) | 30 (68.2%) |
| 3 Vehicles | 7 (17.1%) | 2 (4.5%) |
| 4 Vehicles | 1 (2.4%) | 0 (0.0%) |
| 5 or more Vehicles | 0 (0.0%) | 0 (0.0%) |
| Total | 41 (100.0%) | 44 (100.0%) |
Commute Time in King County
The most frequently occuring commute durations in King County are 5 to 9 minutes (40 commuters, 50.6%), 20 to 24 minutes (17 commuters, 21.5%), and less than 5 minutes (9 commuters, 11.4%).
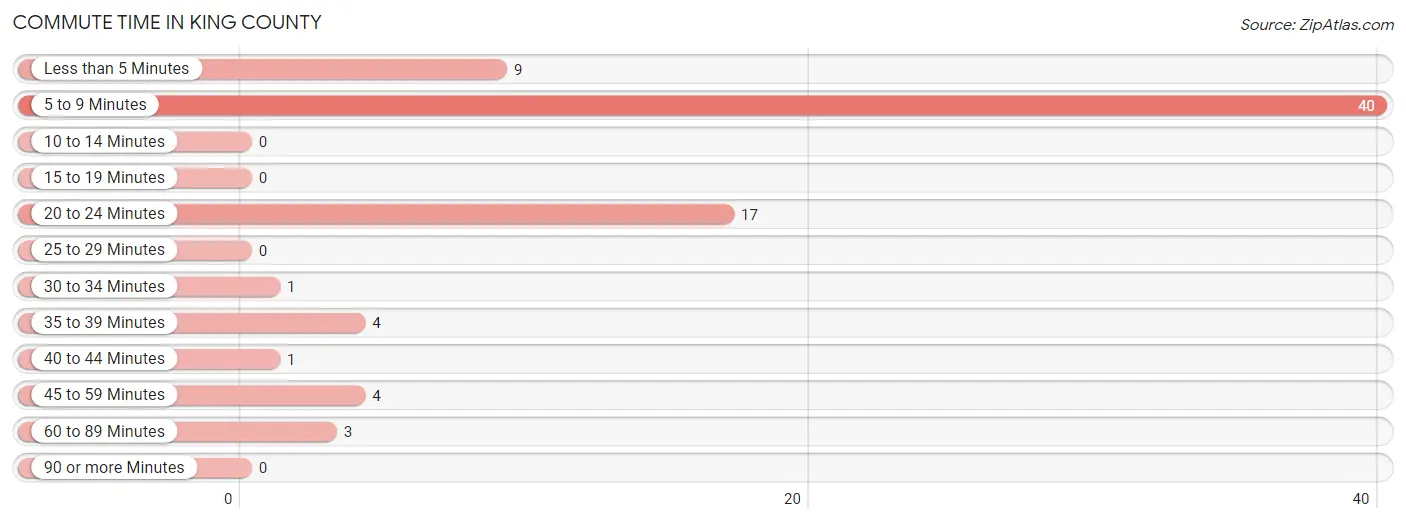
| Commute Time | # Commuters | % Commuters |
| Less than 5 Minutes | 9 | 11.4% |
| 5 to 9 Minutes | 40 | 50.6% |
| 10 to 14 Minutes | 0 | 0.0% |
| 15 to 19 Minutes | 0 | 0.0% |
| 20 to 24 Minutes | 17 | 21.5% |
| 25 to 29 Minutes | 0 | 0.0% |
| 30 to 34 Minutes | 1 | 1.3% |
| 35 to 39 Minutes | 4 | 5.1% |
| 40 to 44 Minutes | 1 | 1.3% |
| 45 to 59 Minutes | 4 | 5.1% |
| 60 to 89 Minutes | 3 | 3.8% |
| 90 or more Minutes | 0 | 0.0% |
Commute Time by Sex in King County
The most common commute times in King County are 5 to 9 minutes (15 commuters, 36.6%) for males and 5 to 9 minutes (25 commuters, 65.8%) for females.
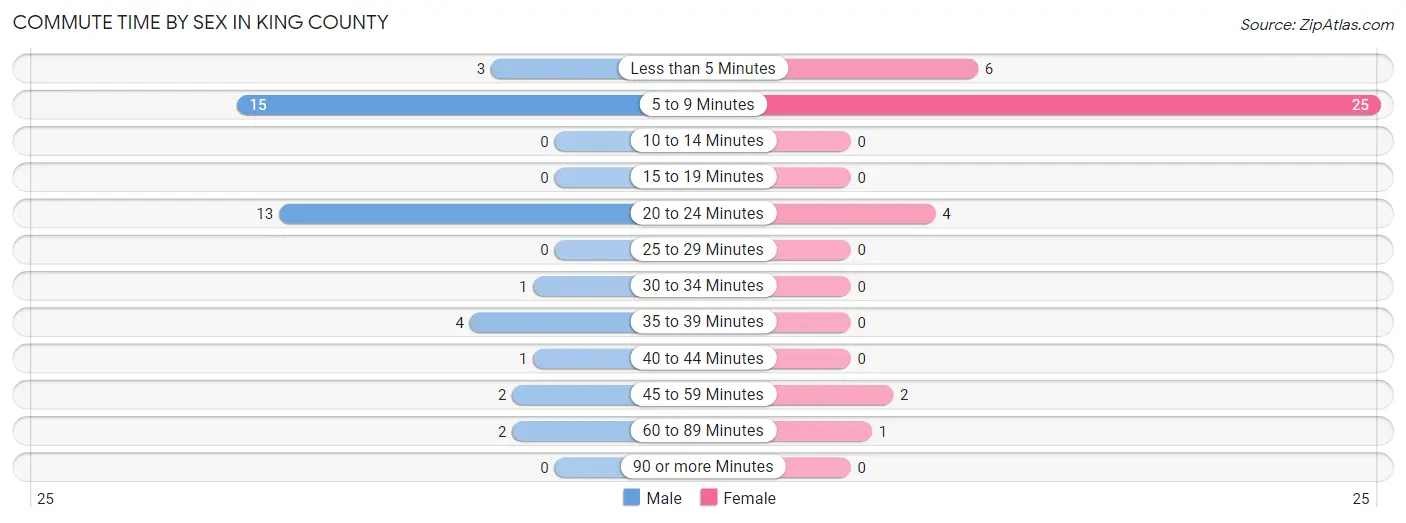
| Commute Time | Male | Female |
| Less than 5 Minutes | 3 (7.3%) | 6 (15.8%) |
| 5 to 9 Minutes | 15 (36.6%) | 25 (65.8%) |
| 10 to 14 Minutes | 0 (0.0%) | 0 (0.0%) |
| 15 to 19 Minutes | 0 (0.0%) | 0 (0.0%) |
| 20 to 24 Minutes | 13 (31.7%) | 4 (10.5%) |
| 25 to 29 Minutes | 0 (0.0%) | 0 (0.0%) |
| 30 to 34 Minutes | 1 (2.4%) | 0 (0.0%) |
| 35 to 39 Minutes | 4 (9.8%) | 0 (0.0%) |
| 40 to 44 Minutes | 1 (2.4%) | 0 (0.0%) |
| 45 to 59 Minutes | 2 (4.9%) | 2 (5.3%) |
| 60 to 89 Minutes | 2 (4.9%) | 1 (2.6%) |
| 90 or more Minutes | 0 (0.0%) | 0 (0.0%) |
Time of Departure to Work by Sex in King County
The most frequent times of departure to work in King County are 7:30 AM to 7:59 AM (10, 24.4%) for males and 7:00 AM to 7:29 AM (20, 52.6%) for females.
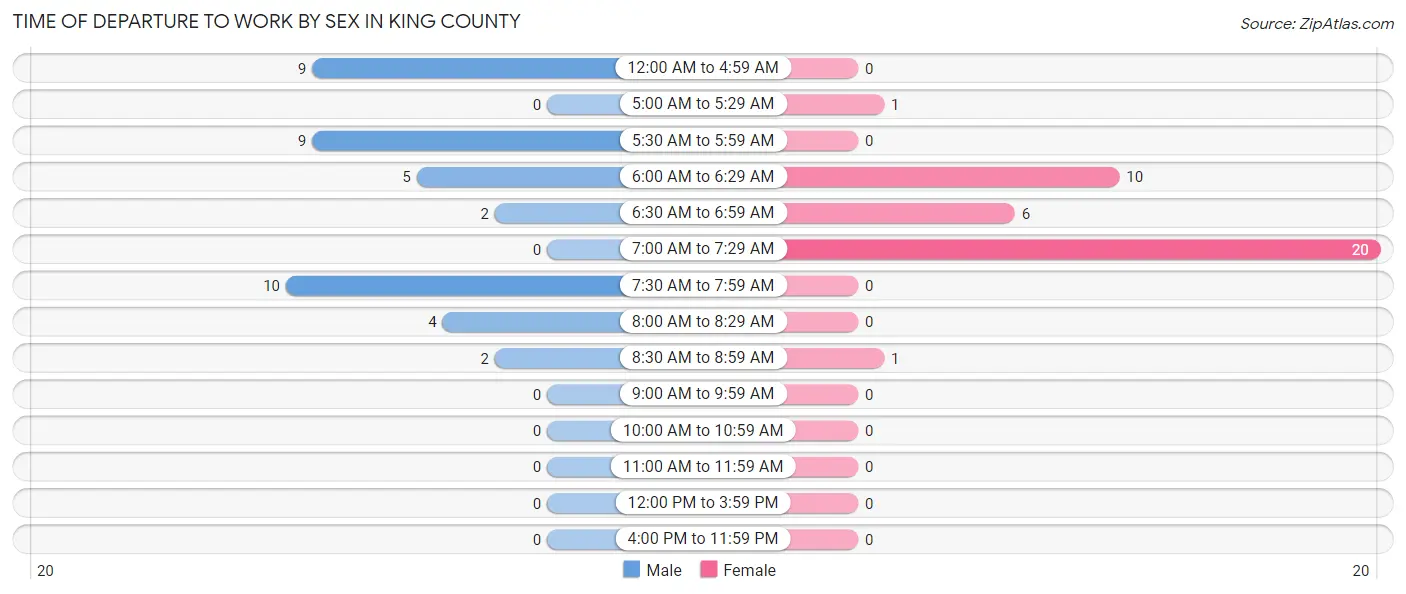
| Time of Departure | Male | Female |
| 12:00 AM to 4:59 AM | 9 (22.0%) | 0 (0.0%) |
| 5:00 AM to 5:29 AM | 0 (0.0%) | 1 (2.6%) |
| 5:30 AM to 5:59 AM | 9 (22.0%) | 0 (0.0%) |
| 6:00 AM to 6:29 AM | 5 (12.2%) | 10 (26.3%) |
| 6:30 AM to 6:59 AM | 2 (4.9%) | 6 (15.8%) |
| 7:00 AM to 7:29 AM | 0 (0.0%) | 20 (52.6%) |
| 7:30 AM to 7:59 AM | 10 (24.4%) | 0 (0.0%) |
| 8:00 AM to 8:29 AM | 4 (9.8%) | 0 (0.0%) |
| 8:30 AM to 8:59 AM | 2 (4.9%) | 1 (2.6%) |
| 9:00 AM to 9:59 AM | 0 (0.0%) | 0 (0.0%) |
| 10:00 AM to 10:59 AM | 0 (0.0%) | 0 (0.0%) |
| 11:00 AM to 11:59 AM | 0 (0.0%) | 0 (0.0%) |
| 12:00 PM to 3:59 PM | 0 (0.0%) | 0 (0.0%) |
| 4:00 PM to 11:59 PM | 0 (0.0%) | 0 (0.0%) |
| Total | 41 (100.0%) | 38 (100.0%) |
Housing Occupancy in King County
Occupancy by Ownership in King County
Of the total 80 dwellings in King County, owner-occupied units account for 32 (40.0%), while renter-occupied units make up 48 (60.0%).
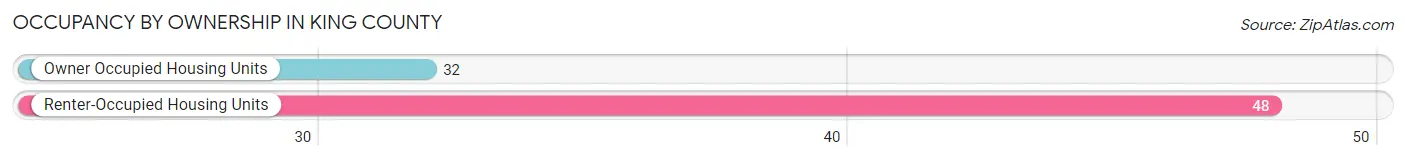
| Occupancy | # Housing Units | % Housing Units |
| Owner Occupied Housing Units | 32 | 40.0% |
| Renter-Occupied Housing Units | 48 | 60.0% |
| Total Occupied Housing Units | 80 | 100.0% |
Occupancy by Household Size in King County
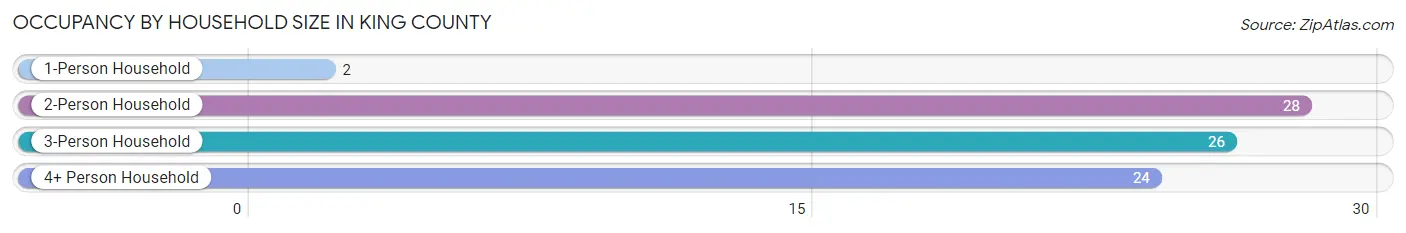
| Household Size | # Housing Units | % Housing Units |
| 1-Person Household | 2 | 2.5% |
| 2-Person Household | 28 | 35.0% |
| 3-Person Household | 26 | 32.5% |
| 4+ Person Household | 24 | 30.0% |
| Total Housing Units | 80 | 100.0% |
Occupancy by Ownership by Household Size in King County
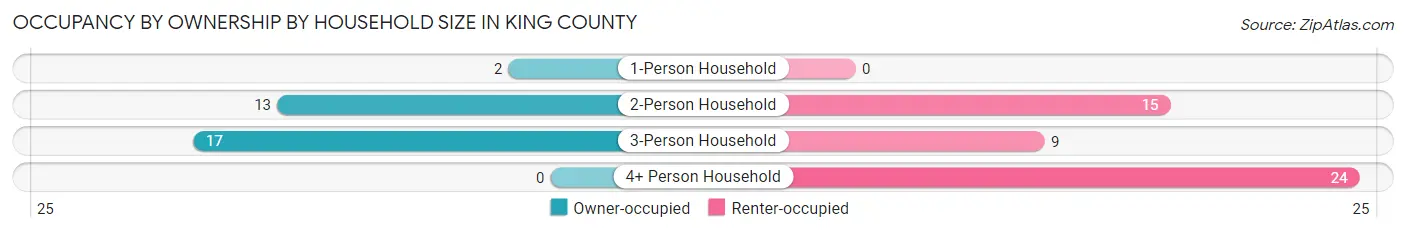
| Household Size | Owner-occupied | Renter-occupied |
| 1-Person Household | 2 (100.0%) | 0 (0.0%) |
| 2-Person Household | 13 (46.4%) | 15 (53.6%) |
| 3-Person Household | 17 (65.4%) | 9 (34.6%) |
| 4+ Person Household | 0 (0.0%) | 24 (100.0%) |
| Total Housing Units | 32 (40.0%) | 48 (60.0%) |
Occupancy by Educational Attainment in King County
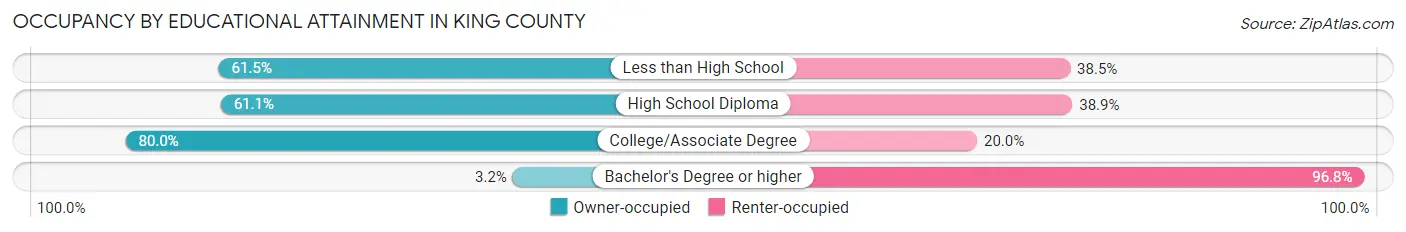
| Household Size | Owner-occupied | Renter-occupied |
| Less than High School | 16 (61.5%) | 10 (38.5%) |
| High School Diploma | 11 (61.1%) | 7 (38.9%) |
| College/Associate Degree | 4 (80.0%) | 1 (20.0%) |
| Bachelor's Degree or higher | 1 (3.2%) | 30 (96.8%) |
Occupancy by Age of Householder in King County
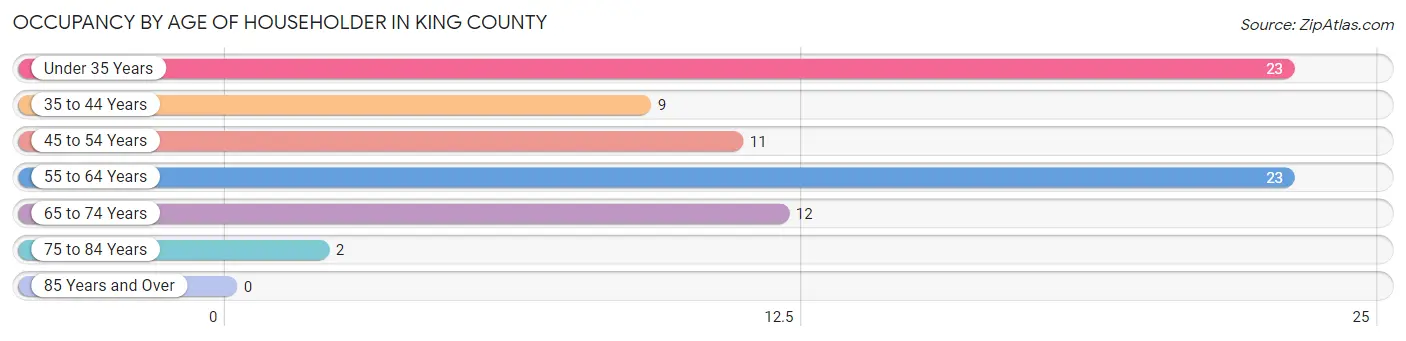
| Age Bracket | # Households | % Households |
| Under 35 Years | 23 | 28.7% |
| 35 to 44 Years | 9 | 11.3% |
| 45 to 54 Years | 11 | 13.8% |
| 55 to 64 Years | 23 | 28.7% |
| 65 to 74 Years | 12 | 15.0% |
| 75 to 84 Years | 2 | 2.5% |
| 85 Years and Over | 0 | 0.0% |
| Total | 80 | 100.0% |
Housing Finances in King County
Median Income by Occupancy in King County
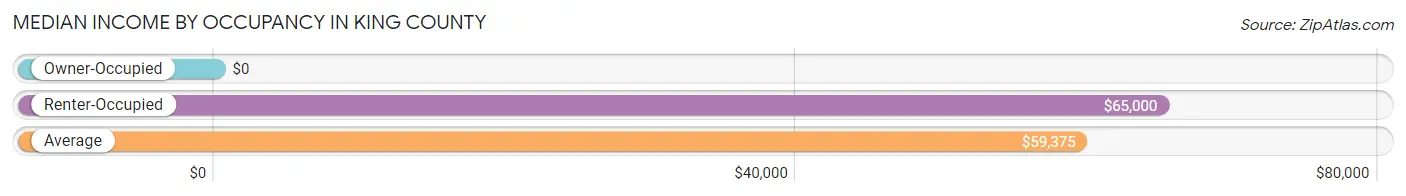
| Occupancy Type | # Households | Median Income |
| Owner-Occupied | 32 (40.0%) | $0 |
| Renter-Occupied | 48 (60.0%) | $65,000 |
| Average | 80 (100.0%) | $59,375 |
Occupancy by Householder Income Bracket in King County
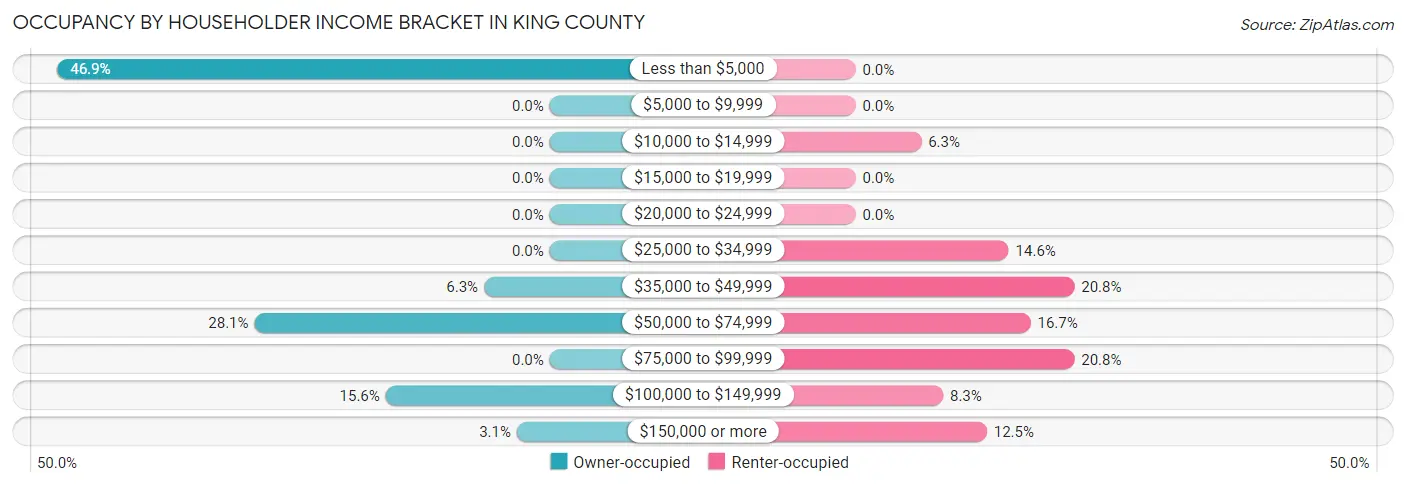
| Income Bracket | Owner-occupied | Renter-occupied |
| Less than $5,000 | 15 (46.9%) | 0 (0.0%) |
| $5,000 to $9,999 | 0 (0.0%) | 0 (0.0%) |
| $10,000 to $14,999 | 0 (0.0%) | 3 (6.2%) |
| $15,000 to $19,999 | 0 (0.0%) | 0 (0.0%) |
| $20,000 to $24,999 | 0 (0.0%) | 0 (0.0%) |
| $25,000 to $34,999 | 0 (0.0%) | 7 (14.6%) |
| $35,000 to $49,999 | 2 (6.2%) | 10 (20.8%) |
| $50,000 to $74,999 | 9 (28.1%) | 8 (16.7%) |
| $75,000 to $99,999 | 0 (0.0%) | 10 (20.8%) |
| $100,000 to $149,999 | 5 (15.6%) | 4 (8.3%) |
| $150,000 or more | 1 (3.1%) | 6 (12.5%) |
| Total | 32 (100.0%) | 48 (100.0%) |
Monthly Housing Cost Tiers in King County
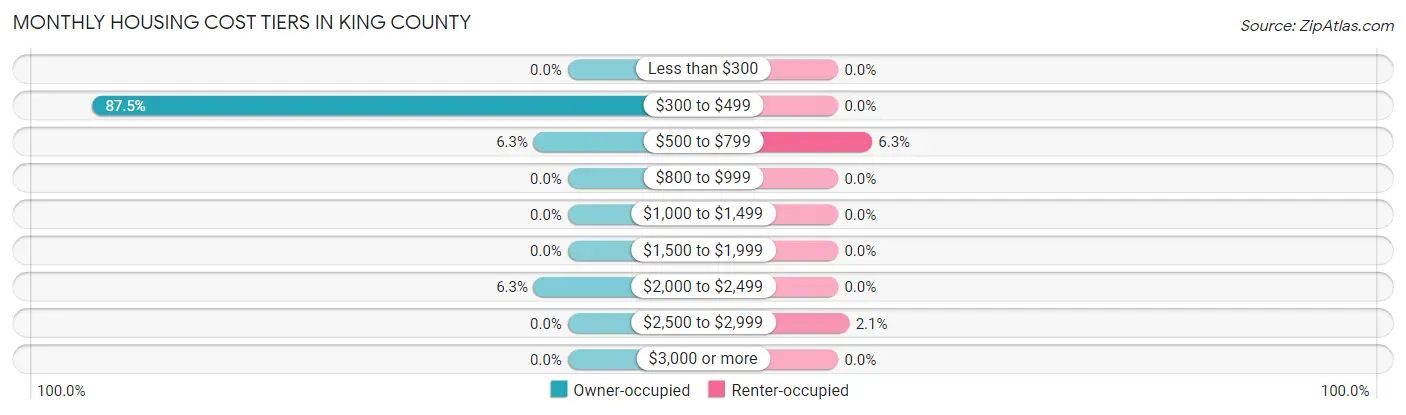
| Monthly Cost | Owner-occupied | Renter-occupied |
| Less than $300 | 0 (0.0%) | 0 (0.0%) |
| $300 to $499 | 28 (87.5%) | 0 (0.0%) |
| $500 to $799 | 2 (6.2%) | 3 (6.2%) |
| $800 to $999 | 0 (0.0%) | 0 (0.0%) |
| $1,000 to $1,499 | 0 (0.0%) | 0 (0.0%) |
| $1,500 to $1,999 | 0 (0.0%) | 0 (0.0%) |
| $2,000 to $2,499 | 2 (6.2%) | 0 (0.0%) |
| $2,500 to $2,999 | 0 (0.0%) | 1 (2.1%) |
| $3,000 or more | 0 (0.0%) | 0 (0.0%) |
| Total | 32 (100.0%) | 48 (100.0%) |
Physical Housing Characteristics in King County
Housing Structures in King County
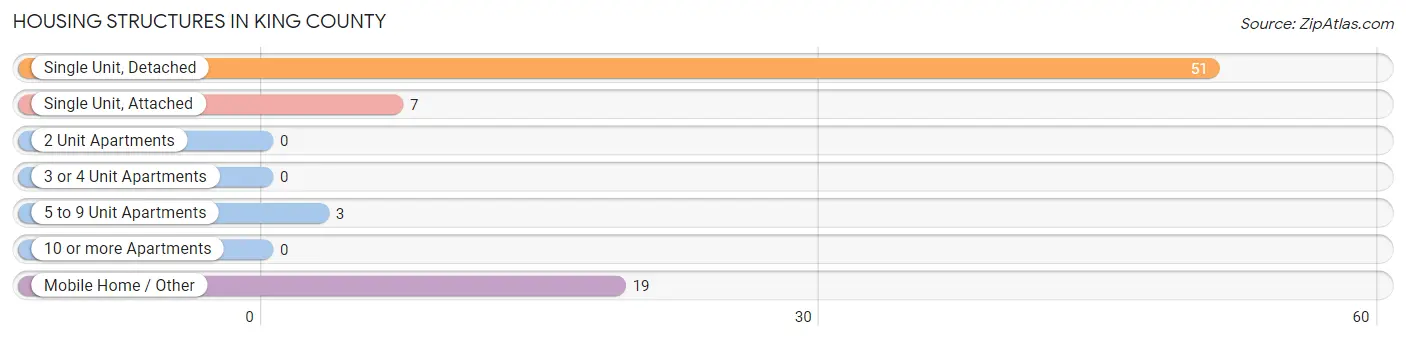
| Structure Type | # Housing Units | % Housing Units |
| Single Unit, Detached | 51 | 63.7% |
| Single Unit, Attached | 7 | 8.7% |
| 2 Unit Apartments | 0 | 0.0% |
| 3 or 4 Unit Apartments | 0 | 0.0% |
| 5 to 9 Unit Apartments | 3 | 3.7% |
| 10 or more Apartments | 0 | 0.0% |
| Mobile Home / Other | 19 | 23.7% |
| Total | 80 | 100.0% |
Housing Structures by Occupancy in King County
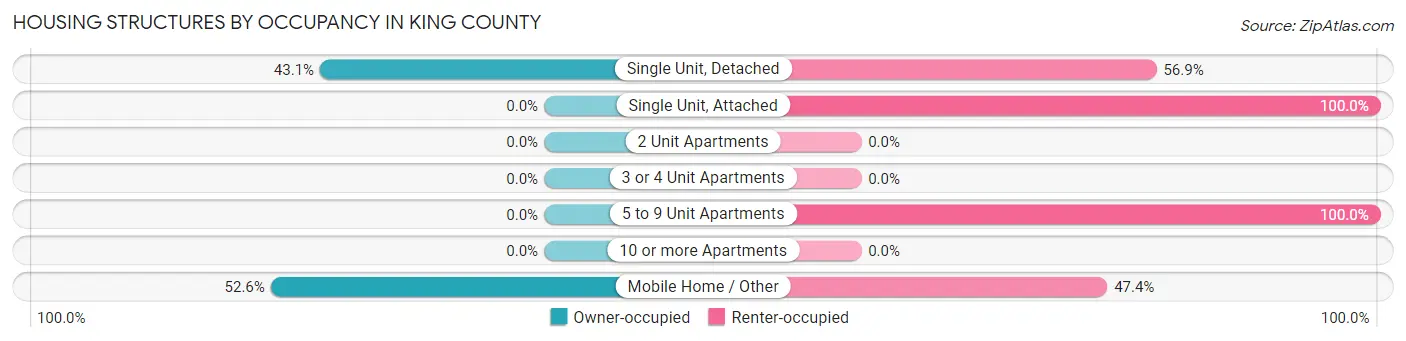
| Structure Type | Owner-occupied | Renter-occupied |
| Single Unit, Detached | 22 (43.1%) | 29 (56.9%) |
| Single Unit, Attached | 0 (0.0%) | 7 (100.0%) |
| 2 Unit Apartments | 0 (0.0%) | 0 (0.0%) |
| 3 or 4 Unit Apartments | 0 (0.0%) | 0 (0.0%) |
| 5 to 9 Unit Apartments | 0 (0.0%) | 3 (100.0%) |
| 10 or more Apartments | 0 (0.0%) | 0 (0.0%) |
| Mobile Home / Other | 10 (52.6%) | 9 (47.4%) |
| Total | 32 (40.0%) | 48 (60.0%) |
Housing Structures by Number of Rooms in King County
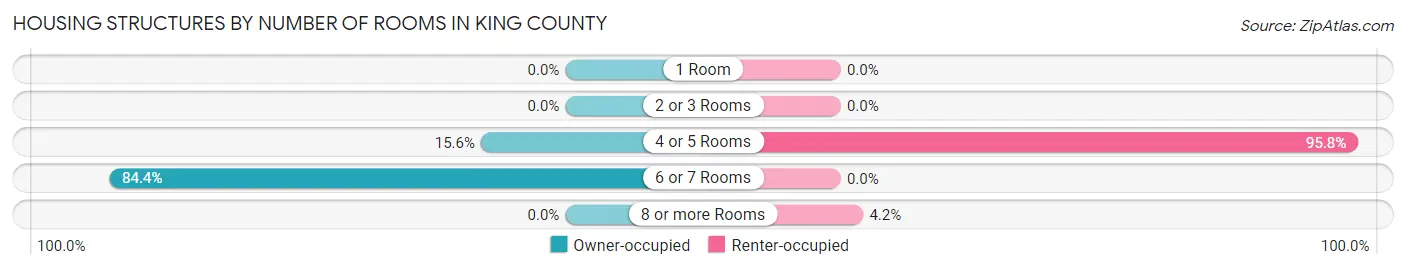
| Number of Rooms | Owner-occupied | Renter-occupied |
| 1 Room | 0 (0.0%) | 0 (0.0%) |
| 2 or 3 Rooms | 0 (0.0%) | 0 (0.0%) |
| 4 or 5 Rooms | 5 (15.6%) | 46 (95.8%) |
| 6 or 7 Rooms | 27 (84.4%) | 0 (0.0%) |
| 8 or more Rooms | 0 (0.0%) | 2 (4.2%) |
| Total | 32 (100.0%) | 48 (100.0%) |
Housing Structure by Heating Type in King County
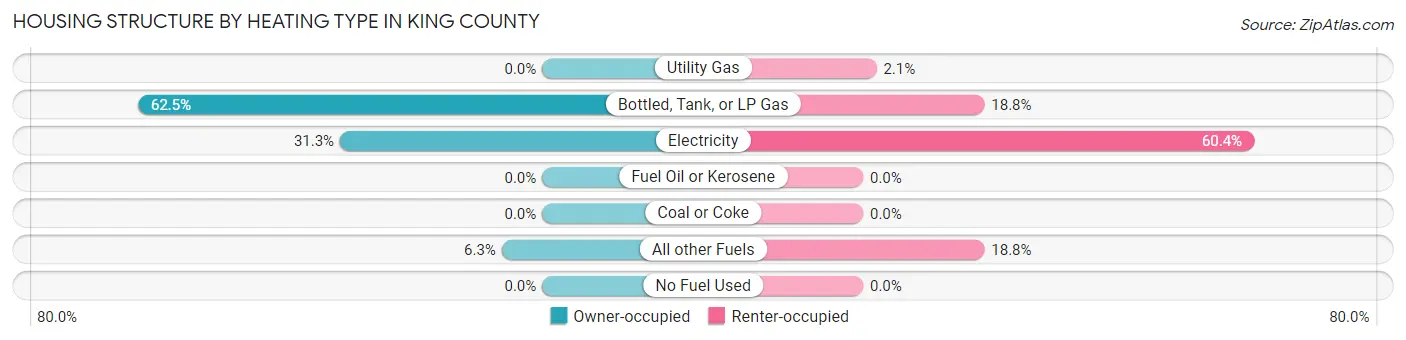
| Heating Type | Owner-occupied | Renter-occupied |
| Utility Gas | 0 (0.0%) | 1 (2.1%) |
| Bottled, Tank, or LP Gas | 20 (62.5%) | 9 (18.8%) |
| Electricity | 10 (31.2%) | 29 (60.4%) |
| Fuel Oil or Kerosene | 0 (0.0%) | 0 (0.0%) |
| Coal or Coke | 0 (0.0%) | 0 (0.0%) |
| All other Fuels | 2 (6.2%) | 9 (18.8%) |
| No Fuel Used | 0 (0.0%) | 0 (0.0%) |
| Total | 32 (100.0%) | 48 (100.0%) |
Household Vehicle Usage in King County
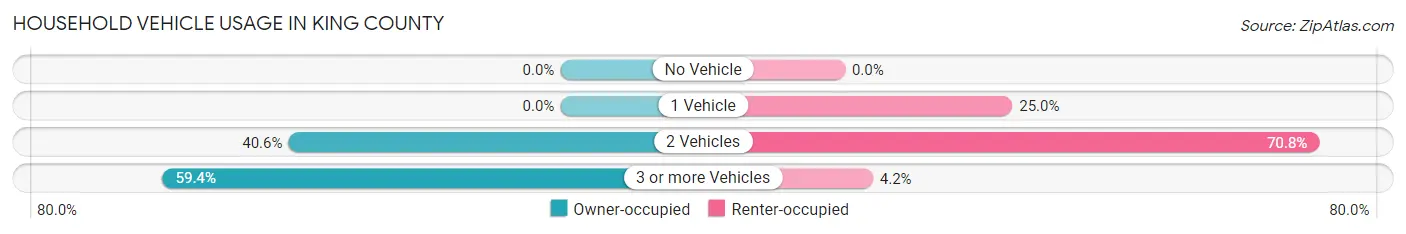
| Vehicles per Household | Owner-occupied | Renter-occupied |
| No Vehicle | 0 (0.0%) | 0 (0.0%) |
| 1 Vehicle | 0 (0.0%) | 12 (25.0%) |
| 2 Vehicles | 13 (40.6%) | 34 (70.8%) |
| 3 or more Vehicles | 19 (59.4%) | 2 (4.2%) |
| Total | 32 (100.0%) | 48 (100.0%) |
Real Estate & Mortgages in King County
Real Estate and Mortgage Overview in King County
| Characteristic | Without Mortgage | With Mortgage |
| Housing Units | 28 | 4 |
| Median Property Value | - | - |
| Median Household Income | $2,499 | $0 |
| Monthly Housing Costs | $452 | $0 |
| Real Estate Taxes | $513 | $0 |
Property Value by Mortgage Status in King County
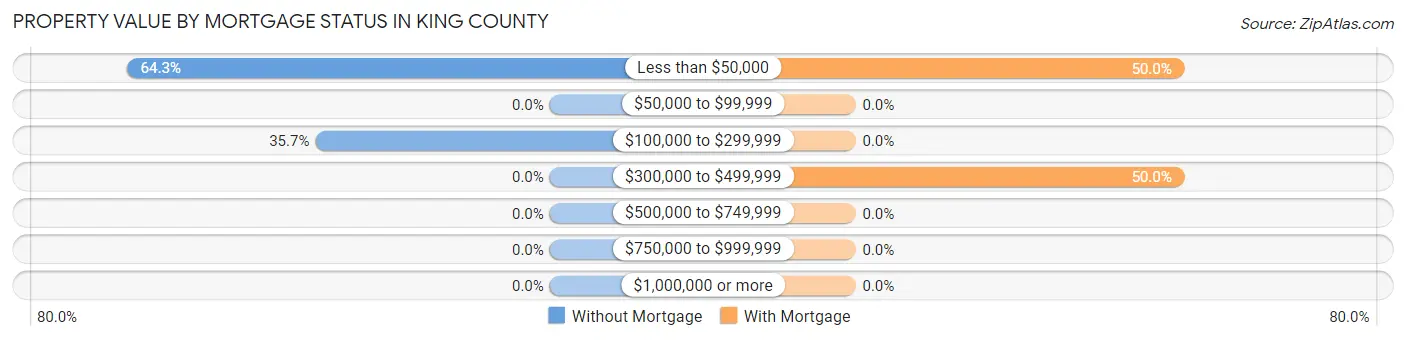
| Property Value | Without Mortgage | With Mortgage |
| Less than $50,000 | 18 (64.3%) | 2 (50.0%) |
| $50,000 to $99,999 | 0 (0.0%) | 0 (0.0%) |
| $100,000 to $299,999 | 10 (35.7%) | 0 (0.0%) |
| $300,000 to $499,999 | 0 (0.0%) | 2 (50.0%) |
| $500,000 to $749,999 | 0 (0.0%) | 0 (0.0%) |
| $750,000 to $999,999 | 0 (0.0%) | 0 (0.0%) |
| $1,000,000 or more | 0 (0.0%) | 0 (0.0%) |
| Total | 28 (100.0%) | 4 (100.0%) |
Household Income by Mortgage Status in King County
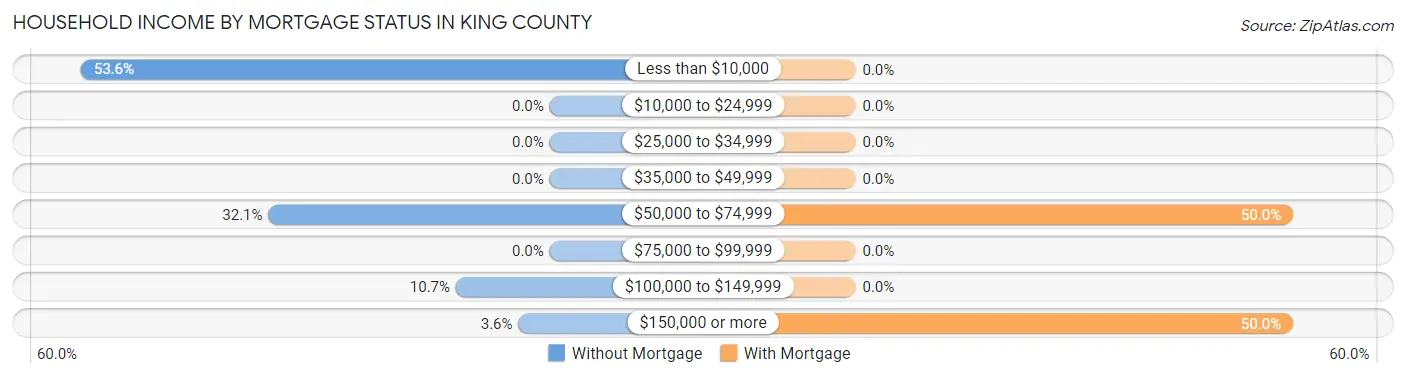
| Household Income | Without Mortgage | With Mortgage |
| Less than $10,000 | 15 (53.6%) | 0 (0.0%) |
| $10,000 to $24,999 | 0 (0.0%) | 0 (0.0%) |
| $25,000 to $34,999 | 0 (0.0%) | 0 (0.0%) |
| $35,000 to $49,999 | 0 (0.0%) | 0 (0.0%) |
| $50,000 to $74,999 | 9 (32.1%) | 2 (50.0%) |
| $75,000 to $99,999 | 0 (0.0%) | 0 (0.0%) |
| $100,000 to $149,999 | 3 (10.7%) | 0 (0.0%) |
| $150,000 or more | 1 (3.6%) | 2 (50.0%) |
| Total | 28 (100.0%) | 4 (100.0%) |
Property Value to Household Income Ratio in King County
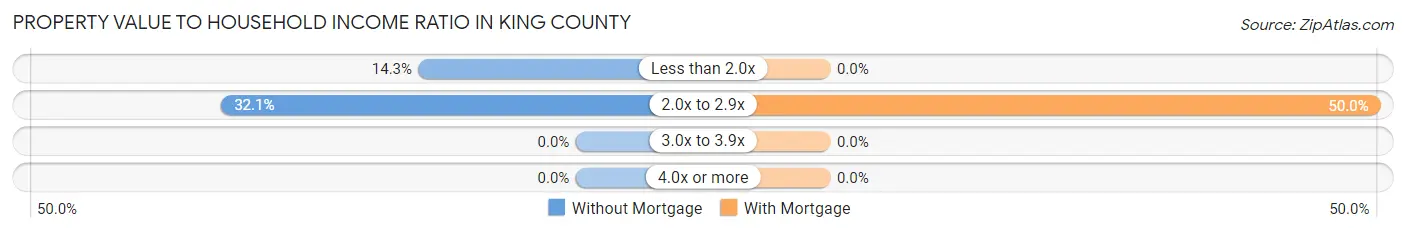
| Value-to-Income Ratio | Without Mortgage | With Mortgage |
| Less than 2.0x | 4 (14.3%) | 0 (0.0%) |
| 2.0x to 2.9x | 9 (32.1%) | 2 (50.0%) |
| 3.0x to 3.9x | 0 (0.0%) | 0 (0.0%) |
| 4.0x or more | 0 (0.0%) | 0 (0.0%) |
| Total | 28 (100.0%) | 4 (100.0%) |
Real Estate Taxes by Mortgage Status in King County
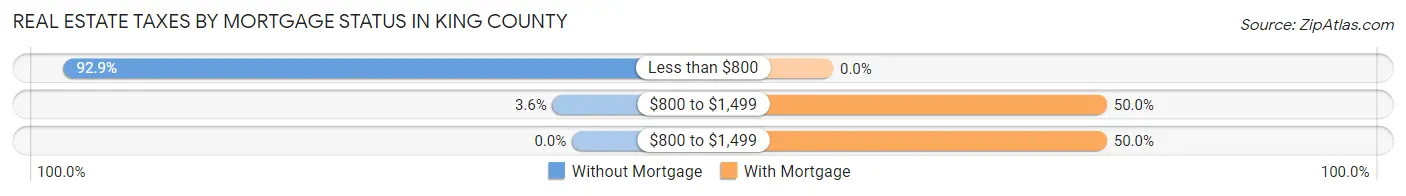
| Property Taxes | Without Mortgage | With Mortgage |
| Less than $800 | 26 (92.9%) | 0 (0.0%) |
| $800 to $1,499 | 1 (3.6%) | 2 (50.0%) |
| $800 to $1,499 | 0 (0.0%) | 2 (50.0%) |
| Total | 28 (100.0%) | 4 (100.0%) |
Health & Disability in King County
Health Insurance Coverage by Age in King County
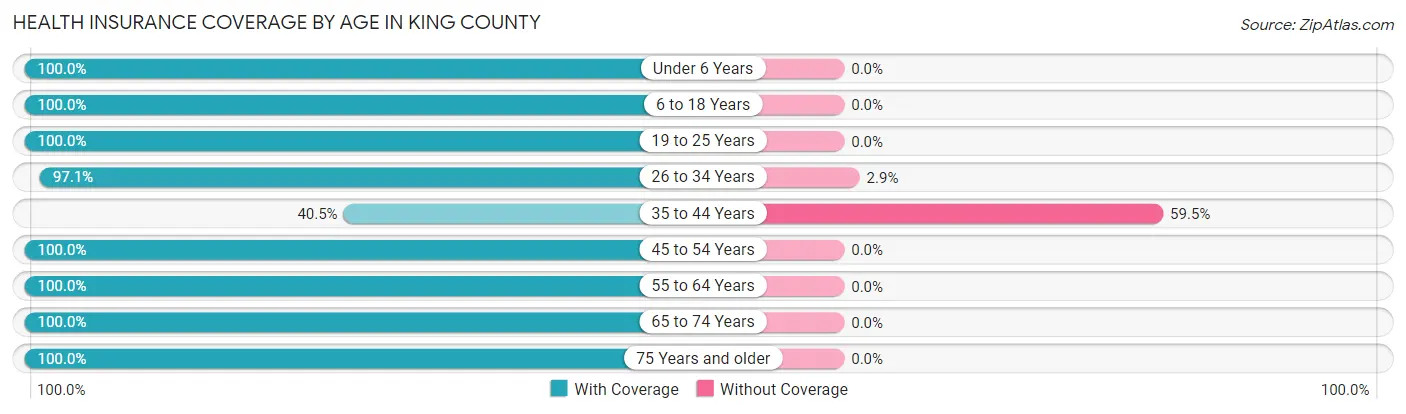
| Age Bracket | With Coverage | Without Coverage |
| Under 6 Years | 14 (100.0%) | 0 (0.0%) |
| 6 to 18 Years | 37 (100.0%) | 0 (0.0%) |
| 19 to 25 Years | 5 (100.0%) | 0 (0.0%) |
| 26 to 34 Years | 34 (97.1%) | 1 (2.9%) |
| 35 to 44 Years | 15 (40.5%) | 22 (59.5%) |
| 45 to 54 Years | 19 (100.0%) | 0 (0.0%) |
| 55 to 64 Years | 41 (100.0%) | 0 (0.0%) |
| 65 to 74 Years | 26 (100.0%) | 0 (0.0%) |
| 75 Years and older | 2 (100.0%) | 0 (0.0%) |
| Total | 193 (89.3%) | 23 (10.6%) |
Health Insurance Coverage by Citizenship Status in King County
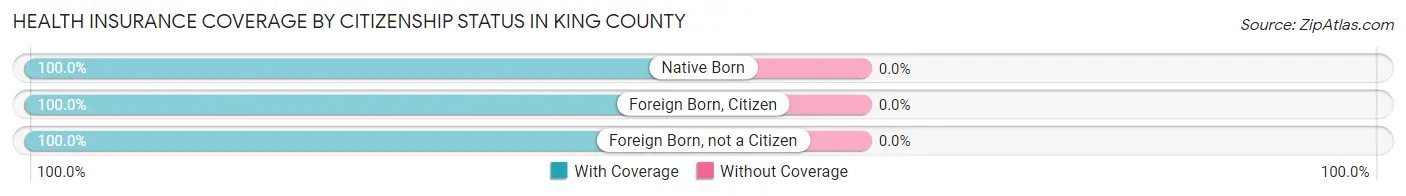
| Citizenship Status | With Coverage | Without Coverage |
| Native Born | 14 (100.0%) | 0 (0.0%) |
| Foreign Born, Citizen | 37 (100.0%) | 0 (0.0%) |
| Foreign Born, not a Citizen | 5 (100.0%) | 0 (0.0%) |
Health Insurance Coverage by Household Income in King County
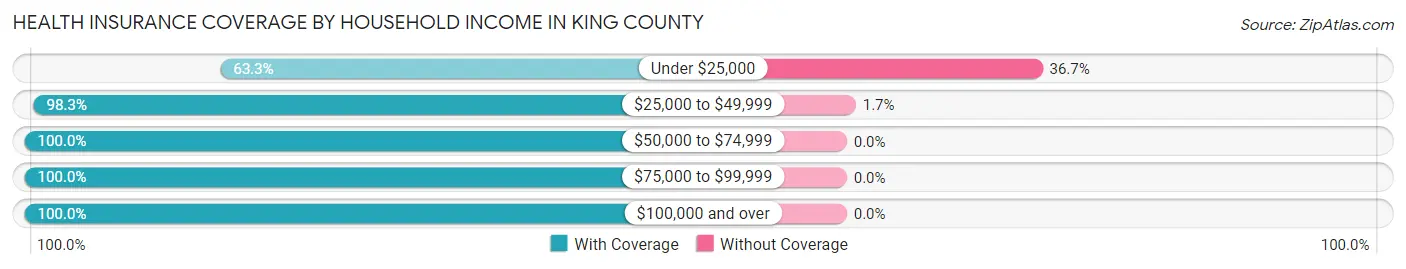
| Household Income | With Coverage | Without Coverage |
| Under $25,000 | 38 (63.3%) | 22 (36.7%) |
| $25,000 to $49,999 | 58 (98.3%) | 1 (1.7%) |
| $50,000 to $74,999 | 30 (100.0%) | 0 (0.0%) |
| $75,000 to $99,999 | 26 (100.0%) | 0 (0.0%) |
| $100,000 and over | 41 (100.0%) | 0 (0.0%) |
Public vs Private Health Insurance Coverage by Age in King County
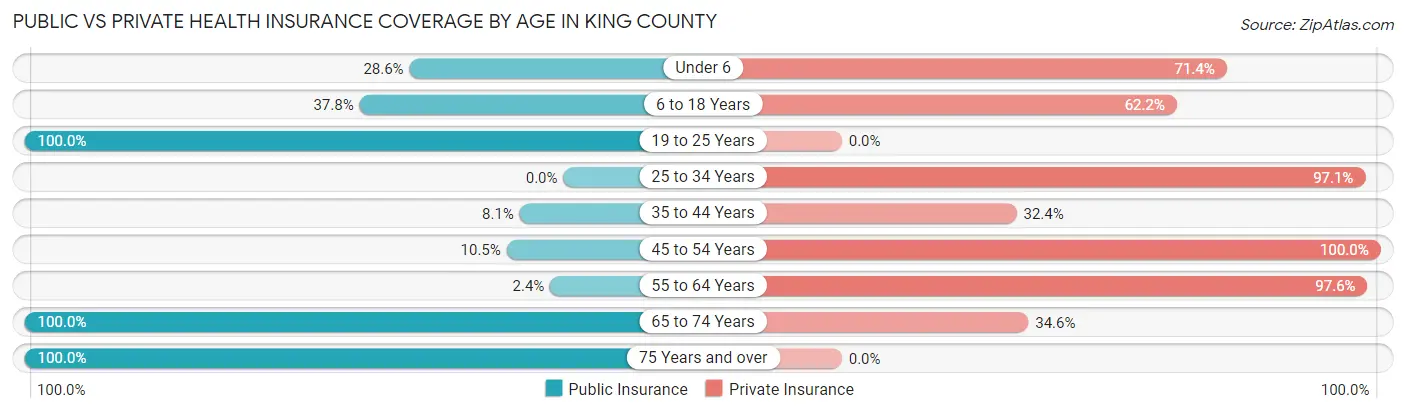
| Age Bracket | Public Insurance | Private Insurance |
| Under 6 | 4 (28.6%) | 10 (71.4%) |
| 6 to 18 Years | 14 (37.8%) | 23 (62.2%) |
| 19 to 25 Years | 5 (100.0%) | 0 (0.0%) |
| 25 to 34 Years | 0 (0.0%) | 34 (97.1%) |
| 35 to 44 Years | 3 (8.1%) | 12 (32.4%) |
| 45 to 54 Years | 2 (10.5%) | 19 (100.0%) |
| 55 to 64 Years | 1 (2.4%) | 40 (97.6%) |
| 65 to 74 Years | 26 (100.0%) | 9 (34.6%) |
| 75 Years and over | 2 (100.0%) | 0 (0.0%) |
| Total | 57 (26.4%) | 147 (68.1%) |
Disability Status by Sex by Age in King County
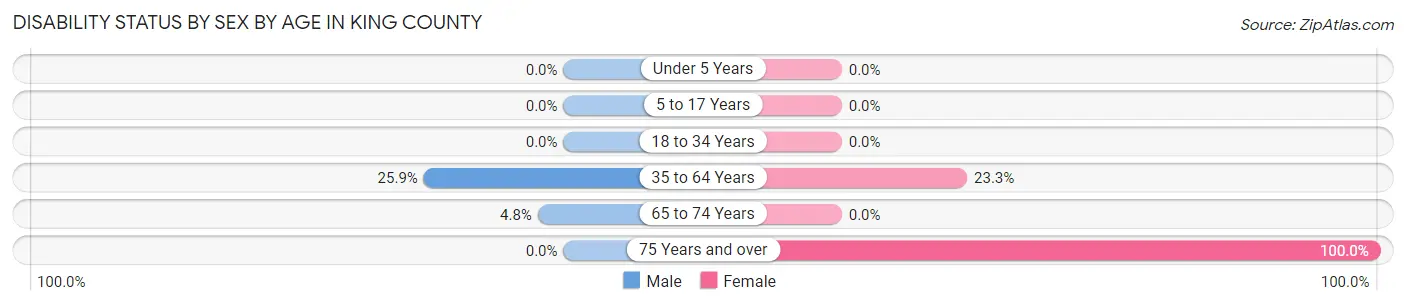
| Age Bracket | Male | Female |
| Under 5 Years | 0 (0.0%) | 0 (0.0%) |
| 5 to 17 Years | 0 (0.0%) | 0 (0.0%) |
| 18 to 34 Years | 0 (0.0%) | 0 (0.0%) |
| 35 to 64 Years | 14 (25.9%) | 10 (23.3%) |
| 65 to 74 Years | 1 (4.8%) | 0 (0.0%) |
| 75 Years and over | 0 (0.0%) | 2 (100.0%) |
Disability Class by Sex by Age in King County
Disability Class: Hearing Difficulty
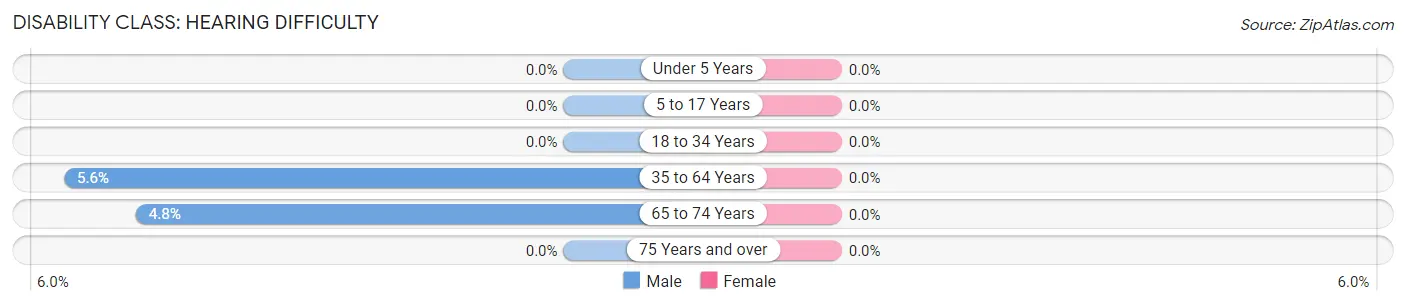
| Age Bracket | Male | Female |
| Under 5 Years | 0 (0.0%) | 0 (0.0%) |
| 5 to 17 Years | 0 (0.0%) | 0 (0.0%) |
| 18 to 34 Years | 0 (0.0%) | 0 (0.0%) |
| 35 to 64 Years | 3 (5.6%) | 0 (0.0%) |
| 65 to 74 Years | 1 (4.8%) | 0 (0.0%) |
| 75 Years and over | 0 (0.0%) | 0 (0.0%) |
Disability Class: Vision Difficulty
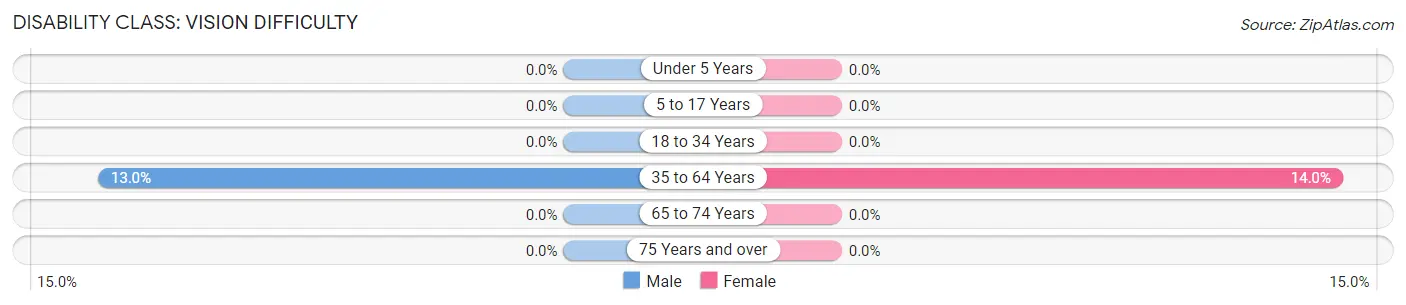
| Age Bracket | Male | Female |
| Under 5 Years | 0 (0.0%) | 0 (0.0%) |
| 5 to 17 Years | 0 (0.0%) | 0 (0.0%) |
| 18 to 34 Years | 0 (0.0%) | 0 (0.0%) |
| 35 to 64 Years | 7 (13.0%) | 6 (14.0%) |
| 65 to 74 Years | 0 (0.0%) | 0 (0.0%) |
| 75 Years and over | 0 (0.0%) | 0 (0.0%) |
Disability Class: Cognitive Difficulty
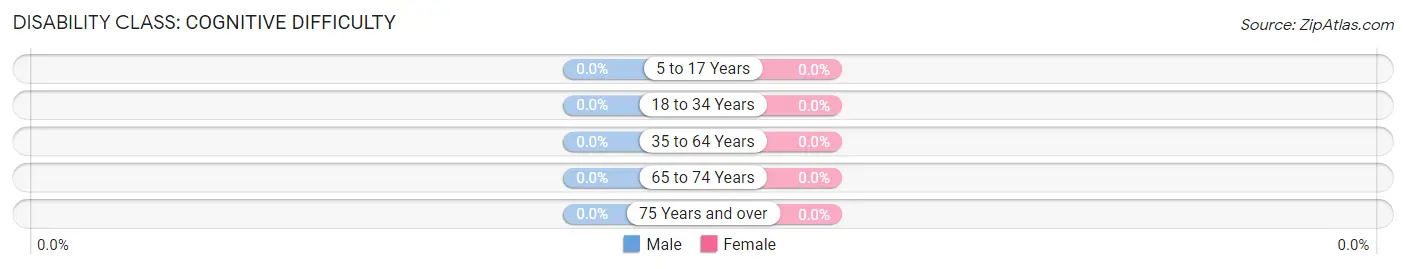
| Age Bracket | Male | Female |
| 5 to 17 Years | 0 (0.0%) | 0 (0.0%) |
| 18 to 34 Years | 0 (0.0%) | 0 (0.0%) |
| 35 to 64 Years | 0 (0.0%) | 0 (0.0%) |
| 65 to 74 Years | 0 (0.0%) | 0 (0.0%) |
| 75 Years and over | 0 (0.0%) | 0 (0.0%) |
Disability Class: Ambulatory Difficulty
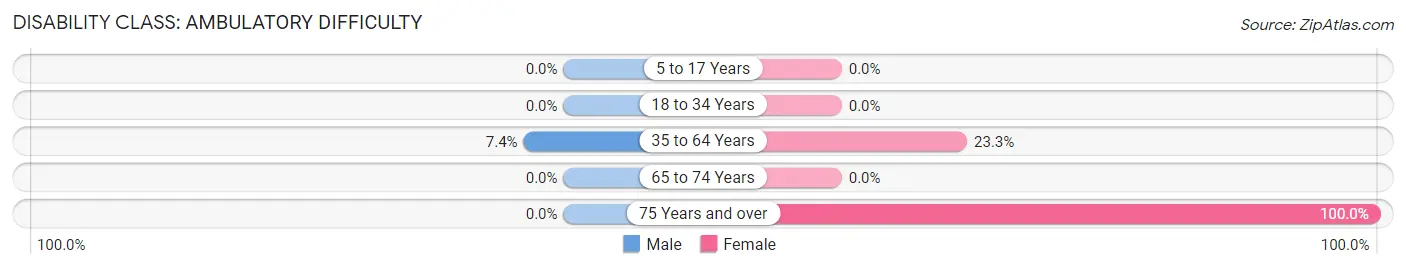
| Age Bracket | Male | Female |
| 5 to 17 Years | 0 (0.0%) | 0 (0.0%) |
| 18 to 34 Years | 0 (0.0%) | 0 (0.0%) |
| 35 to 64 Years | 4 (7.4%) | 10 (23.3%) |
| 65 to 74 Years | 0 (0.0%) | 0 (0.0%) |
| 75 Years and over | 0 (0.0%) | 2 (100.0%) |
Disability Class: Self-Care Difficulty
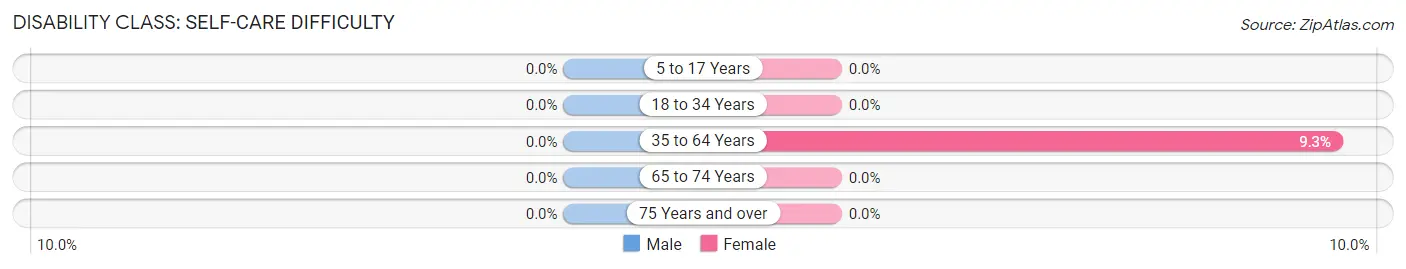
| Age Bracket | Male | Female |
| 5 to 17 Years | 0 (0.0%) | 0 (0.0%) |
| 18 to 34 Years | 0 (0.0%) | 0 (0.0%) |
| 35 to 64 Years | 0 (0.0%) | 4 (9.3%) |
| 65 to 74 Years | 0 (0.0%) | 0 (0.0%) |
| 75 Years and over | 0 (0.0%) | 0 (0.0%) |
Technology Access in King County
Computing Device Access in King County
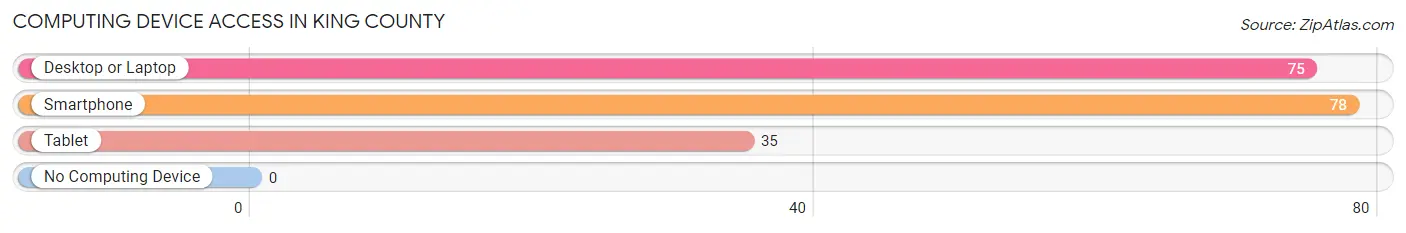
| Device Type | # Households | % Households |
| Desktop or Laptop | 75 | 93.8% |
| Smartphone | 78 | 97.5% |
| Tablet | 35 | 43.8% |
| No Computing Device | 0 | 0.0% |
| Total | 80 | 100.0% |
Internet Access in King County
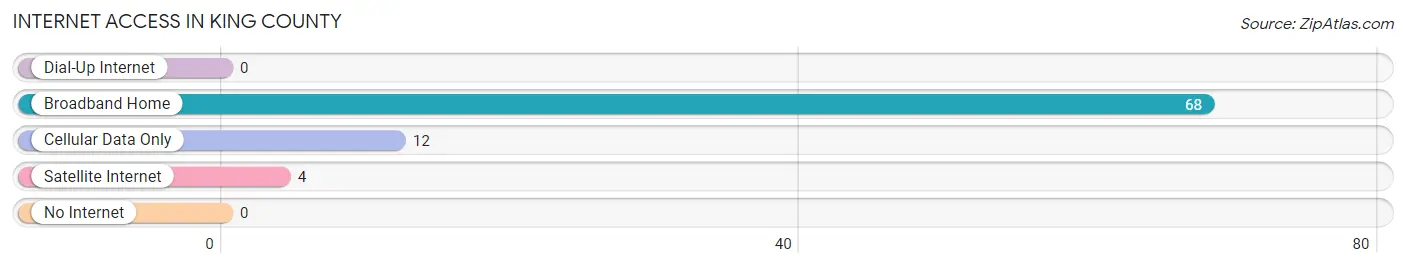
| Internet Type | # Households | % Households |
| Dial-Up Internet | 0 | 0.0% |
| Broadband Home | 68 | 85.0% |
| Cellular Data Only | 12 | 15.0% |
| Satellite Internet | 4 | 5.0% |
| No Internet | 0 | 0.0% |
| Total | 80 | 100.0% |
King County Summary
King County is located in the western part of the state of Texas, in the Panhandle region. It is bordered by Wheeler County to the north, Lipscomb County to the east, Ochiltree County to the south, and Hansford County to the west. The county seat is Guthrie, and the largest city is Spearman.
History
King County was established in 1876 and named for William Philip King, a Texas state senator. The county was originally part of Bexar County, but was later divided into its own county. The first settlers in the area were ranchers, who were attracted to the area by the abundance of grass and water.
In the late 19th century, the Santa Fe Railroad was built through the county, connecting it to other parts of Texas. This allowed for the development of towns such as Guthrie, Spearman, and Gruver. The railroad also allowed for the development of the local economy, as it allowed for the transportation of goods and services.
Geography
King County is located in the western part of the state of Texas, in the Panhandle region. It is bordered by Wheeler County to the north, Lipscomb County to the east, Ochiltree County to the south, and Hansford County to the west. The county has a total area of 902 square miles, of which 899 square miles is land and 3 square miles is water.
The terrain of King County is mostly flat, with some rolling hills in the northern part of the county. The county is drained by the Canadian River, which flows through the county from north to south. The county is also home to several small lakes, including Lake Meredith, Lake Greenbelt, and Lake McBride.
Economy
The economy of King County is largely based on agriculture and oil and gas production. The county is home to several large ranches, which produce cattle, sheep, and other livestock. The county is also home to several oil and gas fields, which produce crude oil and natural gas.
The county is also home to several manufacturing companies, which produce a variety of products, including furniture, clothing, and food products. The county is also home to several retail stores, which sell a variety of goods and services.
Demographics
As of the 2010 census, the population of King County was 3,584. The racial makeup of the county was 81.3% White, 0.7% African American, 0.3% Native American, 0.2% Asian, 0.1% Pacific Islander, 15.7% from other races, and 1.9% from two or more races. Hispanic or Latino of any race were 28.2% of the population.
The median income for a household in the county was $37,917, and the median income for a family was $45,938. The per capita income for the county was $17,945. About 16.2% of families and 20.2% of the population were below the poverty line, including 28.2% of those under age 18 and 11.2% of those age 65 or over.
Common Questions
What is Per Capita Income in King County?
Per Capita income in King County is $26,408.
What is the Median Family Income in King County?
Median Family Income in King County is $48,750.
What is the Median Household income in King County?
Median Household Income in King County is $59,375.
What is Income or Wage Gap in King County?
Income or Wage Gap in King County is 24.7%.
Women in King County earn 75.3 cents for every dollar earned by a man.
What is Inequality or Gini Index in King County?
Inequality or Gini Index in King County is 0.47.
What is the Total Population of King County?
Total Population of King County is 216.
What is the Total Male Population of King County?
Total Male Population of King County is 113.
What is the Total Female Population of King County?
Total Female Population of King County is 103.
What is the Ratio of Males per 100 Females in King County?
There are 109.71 Males per 100 Females in King County.
What is the Ratio of Females per 100 Males in King County?
There are 91.15 Females per 100 Males in King County.
What is the Median Population Age in King County?
Median Population Age in King County is 35.8 Years.
What is the Average Family Size in King County
Average Family Size in King County is 2.8 People.
What is the Average Household Size in King County
Average Household Size in King County is 2.7 People.
How Large is the Labor Force in King County?
There are 89 People in the Labor Forcein in King County.
What is the Percentage of People in the Labor Force in King County?
53.9% of People are in the Labor Force in King County.
What is the Unemployment Rate in King County?
Unemployment Rate in King County is 4.5%.