Kimble County, TX Map & Demographics
Kimble County Map
Kimble County Overview
$39,045
PER CAPITA INCOME
$82,852
AVG FAMILY INCOME
$62,386
AVG HOUSEHOLD INCOME
38.3%
WAGE / INCOME GAP [ % ]
61.7¢/ $1
WAGE / INCOME GAP [ $ ]
0.52
INEQUALITY / GINI INDEX
4,316
TOTAL POPULATION
2,161
MALE POPULATION
2,155
FEMALE POPULATION
100.28
MALES / 100 FEMALES
99.72
FEMALES / 100 MALES
48.4
MEDIAN AGE
3.2
AVG FAMILY SIZE
2.5
AVG HOUSEHOLD SIZE
2,118
LABOR FORCE [ PEOPLE ]
59.4%
PERCENT IN LABOR FORCE
0.8%
UNEMPLOYMENT RATE
Kimble County Area Codes
Income in Kimble County
Income Overview in Kimble County
Per Capita Income in Kimble County is $39,045, while median incomes of families and households are $82,852 and $62,386 respectively.
| Characteristic | Number | Measure |
| Per Capita Income | 4,316 | $39,045 |
| Median Family Income | 1,089 | $82,852 |
| Mean Family Income | 1,089 | $104,477 |
| Median Household Income | 1,715 | $62,386 |
| Mean Household Income | 1,715 | $94,800 |
| Income Deficit | 1,089 | $0 |
| Wage / Income Gap (%) | 4,316 | 38.33% |
| Wage / Income Gap ($) | 4,316 | 61.67¢ per $1 |
| Gini / Inequality Index | 4,316 | 0.52 |
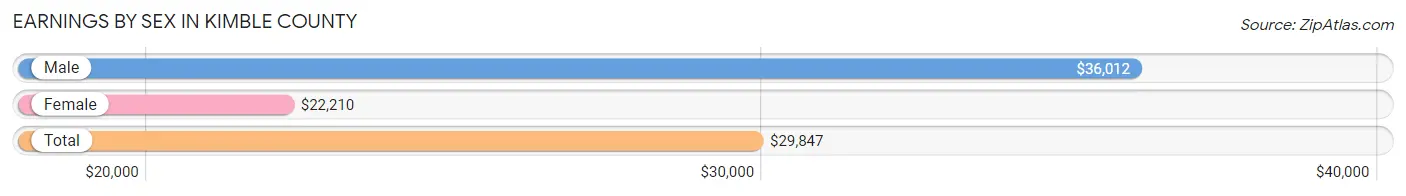
Earnings by Sex in Kimble County
Average Earnings in Kimble County are $29,847, $36,012 for men and $22,210 for women, a difference of 38.3%.
| Sex | Number | Average Earnings |
| Male | 1,149 (52.3%) | $36,012 |
| Female | 1,049 (47.7%) | $22,210 |
| Total | 2,198 (100.0%) | $29,847 |
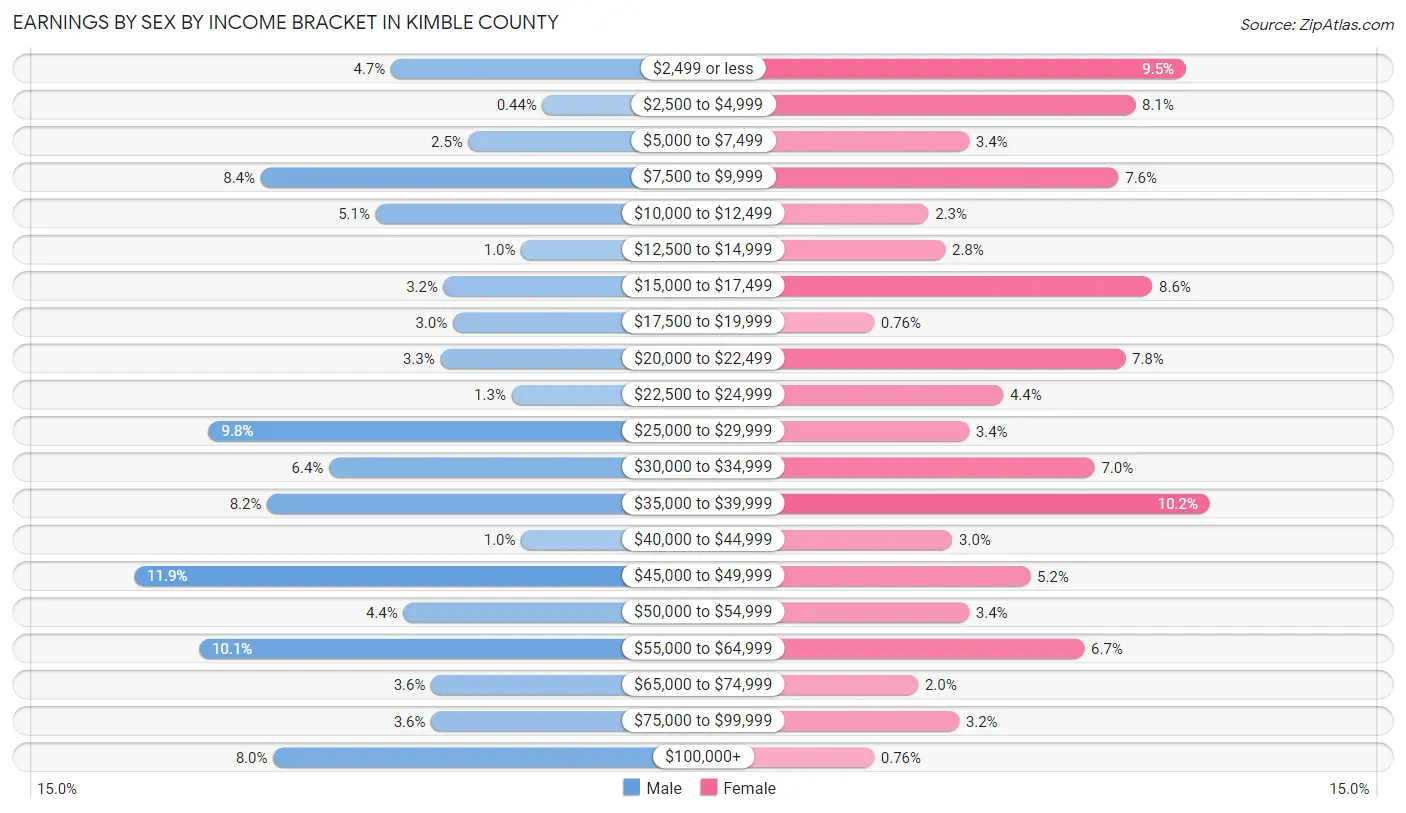
Earnings by Sex by Income Bracket in Kimble County
The most common earnings brackets in Kimble County are $45,000 to $49,999 for men (137 | 11.9%) and $35,000 to $39,999 for women (107 | 10.2%).
| Income | Male | Female |
| $2,499 or less | 54 (4.7%) | 100 (9.5%) |
| $2,500 to $4,999 | 5 (0.4%) | 85 (8.1%) |
| $5,000 to $7,499 | 29 (2.5%) | 36 (3.4%) |
| $7,500 to $9,999 | 96 (8.4%) | 80 (7.6%) |
| $10,000 to $12,499 | 59 (5.1%) | 24 (2.3%) |
| $12,500 to $14,999 | 12 (1.0%) | 29 (2.8%) |
| $15,000 to $17,499 | 37 (3.2%) | 90 (8.6%) |
| $17,500 to $19,999 | 34 (3.0%) | 8 (0.8%) |
| $20,000 to $22,499 | 38 (3.3%) | 82 (7.8%) |
| $22,500 to $24,999 | 15 (1.3%) | 46 (4.4%) |
| $25,000 to $29,999 | 113 (9.8%) | 36 (3.4%) |
| $30,000 to $34,999 | 74 (6.4%) | 73 (7.0%) |
| $35,000 to $39,999 | 94 (8.2%) | 107 (10.2%) |
| $40,000 to $44,999 | 12 (1.0%) | 31 (3.0%) |
| $45,000 to $49,999 | 137 (11.9%) | 54 (5.1%) |
| $50,000 to $54,999 | 50 (4.3%) | 36 (3.4%) |
| $55,000 to $64,999 | 116 (10.1%) | 70 (6.7%) |
| $65,000 to $74,999 | 41 (3.6%) | 21 (2.0%) |
| $75,000 to $99,999 | 41 (3.6%) | 33 (3.2%) |
| $100,000+ | 92 (8.0%) | 8 (0.8%) |
| Total | 1,149 (100.0%) | 1,049 (100.0%) |
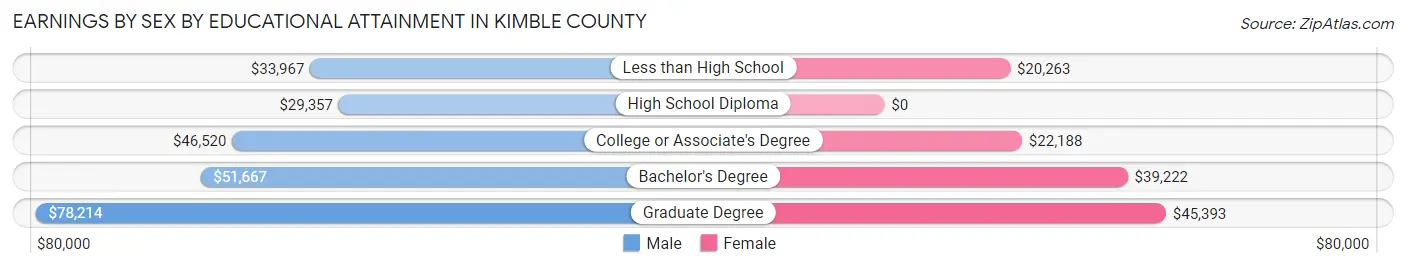
Earnings by Sex by Educational Attainment in Kimble County
Average earnings in Kimble County are $39,863 for men and $28,676 for women, a difference of 28.1%. Men with an educational attainment of graduate degree enjoy the highest average annual earnings of $78,214, while those with high school diploma education earn the least with $29,357. Women with an educational attainment of graduate degree earn the most with the average annual earnings of $45,393, while those with less than high school education have the smallest earnings of $20,263.
| Educational Attainment | Male Income | Female Income |
| Less than High School | $33,967 | $20,263 |
| High School Diploma | $29,357 | $0 |
| College or Associate's Degree | $46,520 | $22,188 |
| Bachelor's Degree | $51,667 | $39,222 |
| Graduate Degree | $78,214 | $45,393 |
| Total | $39,863 | $28,676 |
Family Income in Kimble County
Family Income Brackets in Kimble County
According to the Kimble County family income data, there are 212 families falling into the $100,000 to $149,999 income range, which is the most common income bracket and makes up 19.5% of all families. Conversely, the $10,000 to $14,999 income bracket is the least frequent group with only 19 families (1.7%) belonging to this category.
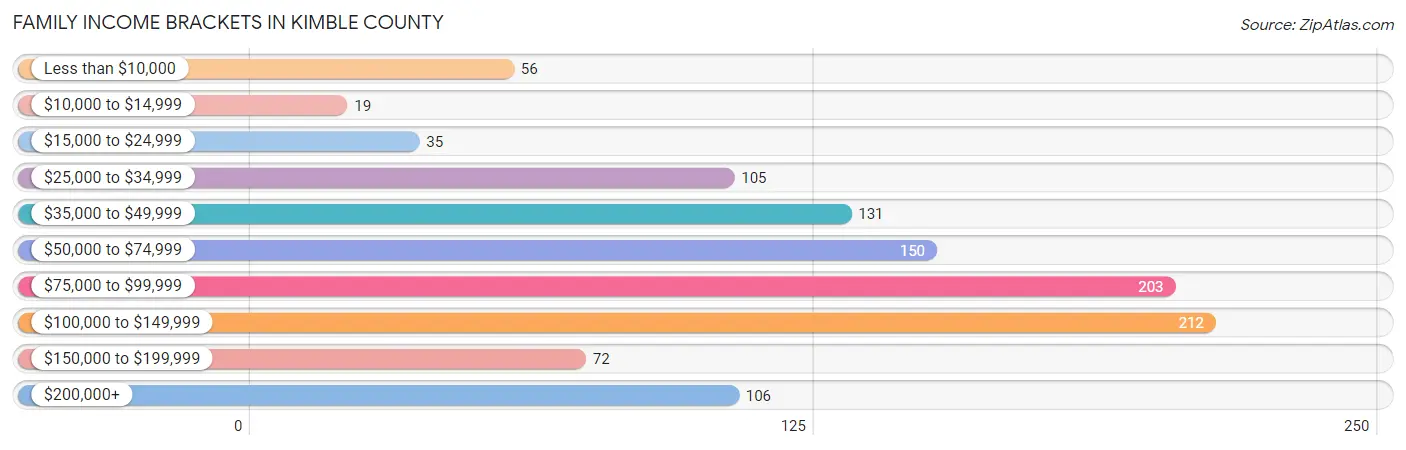
| Income Bracket | # Families | % Families |
| Less than $10,000 | 56 | 5.1% |
| $10,000 to $14,999 | 19 | 1.7% |
| $15,000 to $24,999 | 35 | 3.2% |
| $25,000 to $34,999 | 105 | 9.6% |
| $35,000 to $49,999 | 131 | 12.0% |
| $50,000 to $74,999 | 150 | 13.8% |
| $75,000 to $99,999 | 203 | 18.6% |
| $100,000 to $149,999 | 212 | 19.5% |
| $150,000 to $199,999 | 72 | 6.6% |
| $200,000+ | 106 | 9.7% |
Family Income by Famaliy Size in Kimble County
6-person families (63 | 5.8%) account for the highest median family income in Kimble County with $126,131 per family, while 2-person families (600 | 55.1%) have the highest median income of $38,684 per family member.
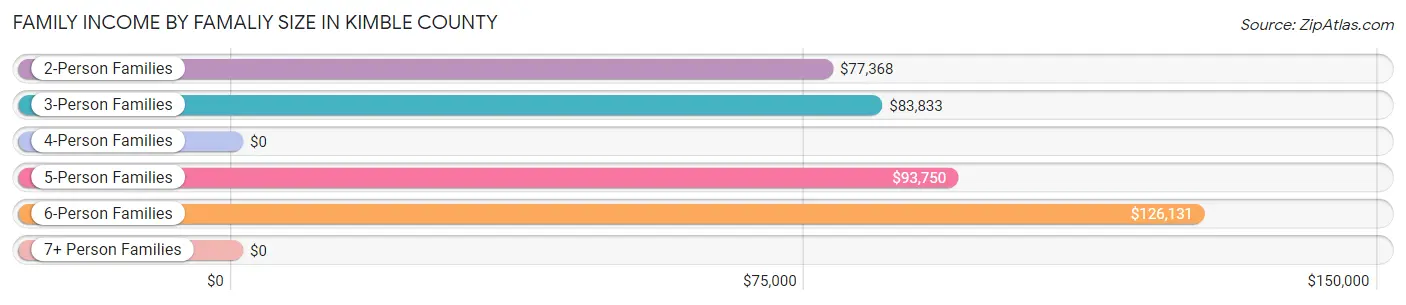
| Income Bracket | # Families | Median Income |
| 2-Person Families | 600 (55.1%) | $77,368 |
| 3-Person Families | 232 (21.3%) | $83,833 |
| 4-Person Families | 162 (14.9%) | $0 |
| 5-Person Families | 26 (2.4%) | $93,750 |
| 6-Person Families | 63 (5.8%) | $126,131 |
| 7+ Person Families | 6 (0.5%) | $0 |
| Total | 1,089 (100.0%) | $82,852 |
Family Income by Number of Earners in Kimble County
The median family income in Kimble County is $82,852, with families comprising 3+ earners (101) having the highest median family income of $104,821, while families with no earners (234) have the lowest median family income of $62,778, accounting for 9.3% and 21.5% of families, respectively.
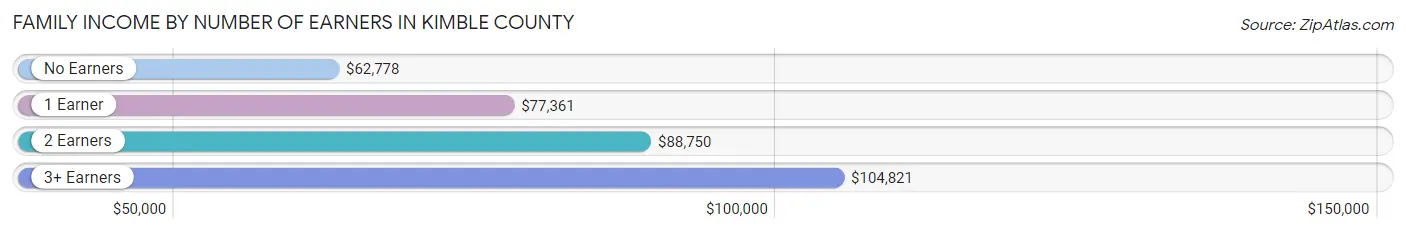
| Number of Earners | # Families | Median Income |
| No Earners | 234 (21.5%) | $62,778 |
| 1 Earner | 301 (27.6%) | $77,361 |
| 2 Earners | 453 (41.6%) | $88,750 |
| 3+ Earners | 101 (9.3%) | $104,821 |
| Total | 1,089 (100.0%) | $82,852 |
Household Income in Kimble County
Household Income Brackets in Kimble County
With 250 households falling in the category, the $100,000 to $149,999 income range is the most frequent in Kimble County, accounting for 14.6% of all households. In contrast, only 72 households (4.2%) fall into the $150,000 to $199,999 income bracket, making it the least populous group.
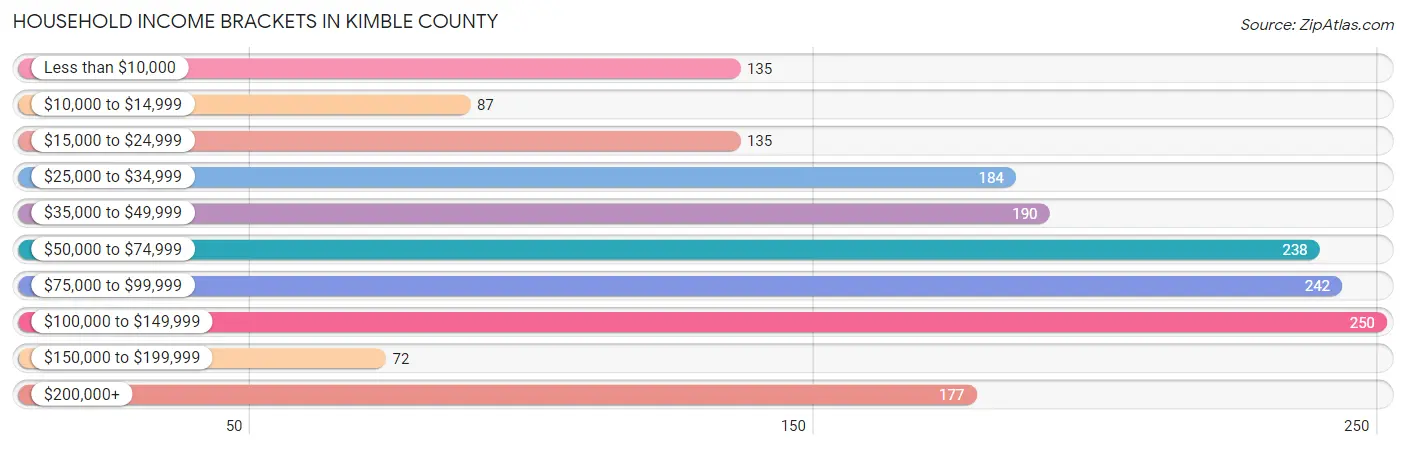
| Income Bracket | # Households | % Households |
| Less than $10,000 | 135 | 7.9% |
| $10,000 to $14,999 | 87 | 5.1% |
| $15,000 to $24,999 | 135 | 7.9% |
| $25,000 to $34,999 | 184 | 10.7% |
| $35,000 to $49,999 | 190 | 11.1% |
| $50,000 to $74,999 | 238 | 13.9% |
| $75,000 to $99,999 | 242 | 14.1% |
| $100,000 to $149,999 | 250 | 14.6% |
| $150,000 to $199,999 | 72 | 4.2% |
| $200,000+ | 177 | 10.3% |
Household Income by Householder Age in Kimble County
The median household income in Kimble County is $62,386, with the highest median household income of $84,583 found in the 45 to 64 years age bracket for the primary householder. A total of 514 households (30.0%) fall into this category. Meanwhile, the 15 to 24 years age bracket for the primary householder has the lowest median household income of $0, with 37 households (2.2%) in this group.
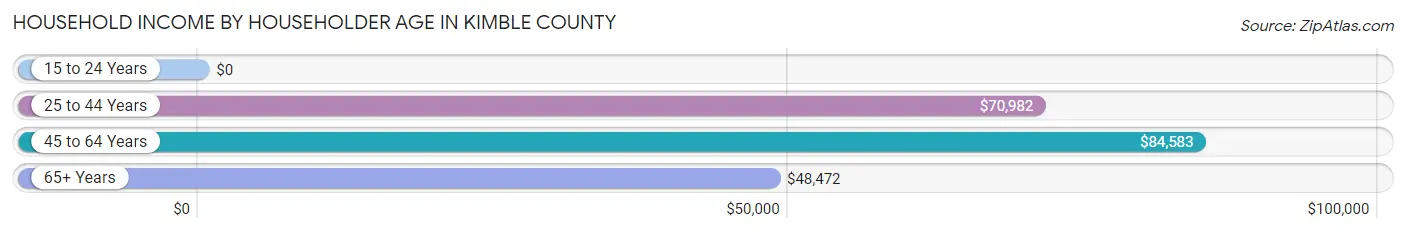
| Income Bracket | # Households | Median Income |
| 15 to 24 Years | 37 (2.2%) | $0 |
| 25 to 44 Years | 369 (21.5%) | $70,982 |
| 45 to 64 Years | 514 (30.0%) | $84,583 |
| 65+ Years | 795 (46.4%) | $48,472 |
| Total | 1,715 (100.0%) | $62,386 |
Poverty in Kimble County
Income Below Poverty by Sex and Age in Kimble County
With 10.9% poverty level for males and 14.0% for females among the residents of Kimble County, under 5 year old males and 75 year old and over females are the most vulnerable to poverty, with 15 males (22.7%) and 61 females (22.9%) in their respective age groups living below the poverty level.
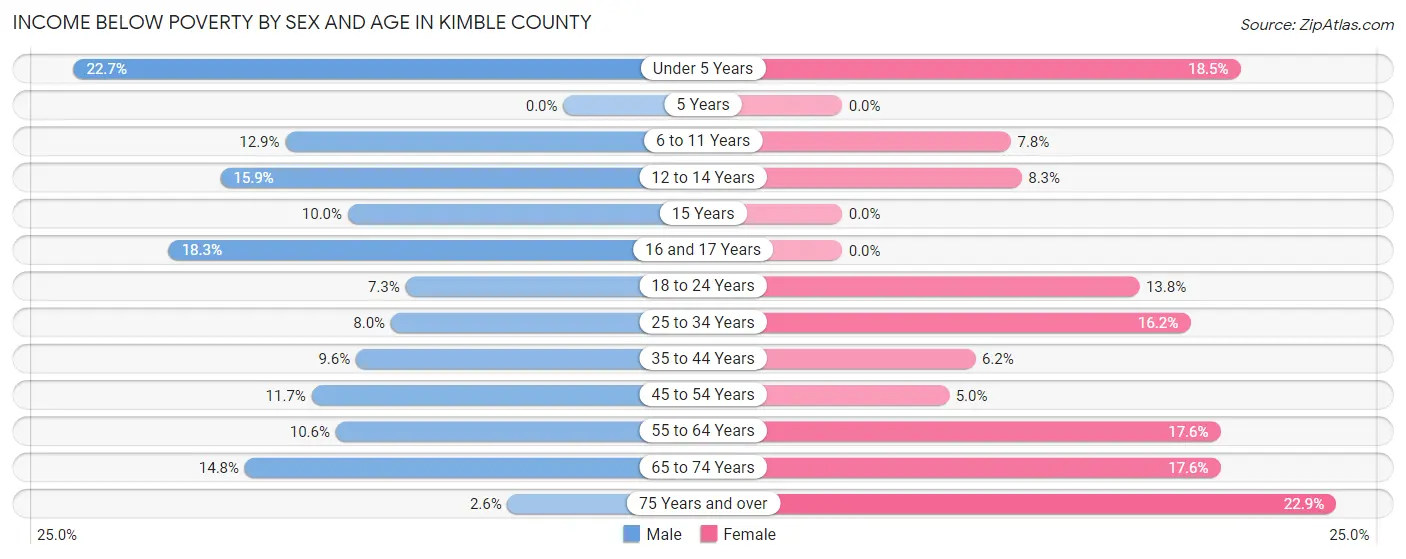
| Age Bracket | Male | Female |
| Under 5 Years | 15 (22.7%) | 27 (18.5%) |
| 5 Years | 0 (0.0%) | 0 (0.0%) |
| 6 to 11 Years | 20 (12.9%) | 9 (7.8%) |
| 12 to 14 Years | 14 (15.9%) | 5 (8.3%) |
| 15 Years | 7 (10.0%) | 0 (0.0%) |
| 16 and 17 Years | 13 (18.3%) | 0 (0.0%) |
| 18 to 24 Years | 12 (7.3%) | 20 (13.8%) |
| 25 to 34 Years | 14 (8.0%) | 32 (16.2%) |
| 35 to 44 Years | 23 (9.6%) | 16 (6.2%) |
| 45 to 54 Years | 23 (11.7%) | 13 (5.0%) |
| 55 to 64 Years | 36 (10.6%) | 46 (17.6%) |
| 65 to 74 Years | 47 (14.8%) | 69 (17.6%) |
| 75 Years and over | 6 (2.6%) | 61 (22.9%) |
| Total | 230 (10.9%) | 298 (14.0%) |
Income Above Poverty by Sex and Age in Kimble County
According to the poverty statistics in Kimble County, males aged 75 years and over and females aged 15 years are the age groups that are most secure financially, with 97.4% of males and 100.0% of females in these age groups living above the poverty line.
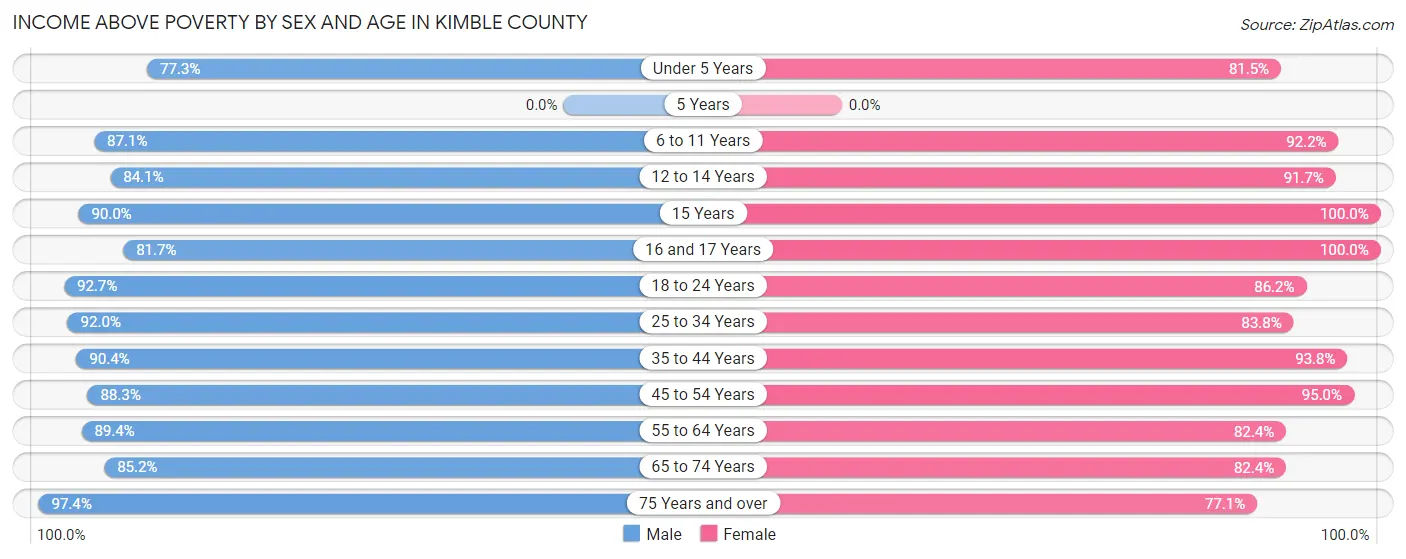
| Age Bracket | Male | Female |
| Under 5 Years | 51 (77.3%) | 119 (81.5%) |
| 5 Years | 0 (0.0%) | 0 (0.0%) |
| 6 to 11 Years | 135 (87.1%) | 106 (92.2%) |
| 12 to 14 Years | 74 (84.1%) | 55 (91.7%) |
| 15 Years | 63 (90.0%) | 20 (100.0%) |
| 16 and 17 Years | 58 (81.7%) | 9 (100.0%) |
| 18 to 24 Years | 152 (92.7%) | 125 (86.2%) |
| 25 to 34 Years | 161 (92.0%) | 166 (83.8%) |
| 35 to 44 Years | 216 (90.4%) | 243 (93.8%) |
| 45 to 54 Years | 174 (88.3%) | 249 (95.0%) |
| 55 to 64 Years | 305 (89.4%) | 216 (82.4%) |
| 65 to 74 Years | 271 (85.2%) | 324 (82.4%) |
| 75 Years and over | 226 (97.4%) | 205 (77.1%) |
| Total | 1,886 (89.1%) | 1,837 (86.0%) |
Income Below Poverty Among Married-Couple Families in Kimble County
The poverty statistics for married-couple families in Kimble County show that 6.7% or 59 of the total 885 families live below the poverty line. Families with 5 or more children have the highest poverty rate of 100.0%, comprising of 6 families. On the other hand, families with 3 or 4 children have the lowest poverty rate of 0.0%, which includes 0 families.
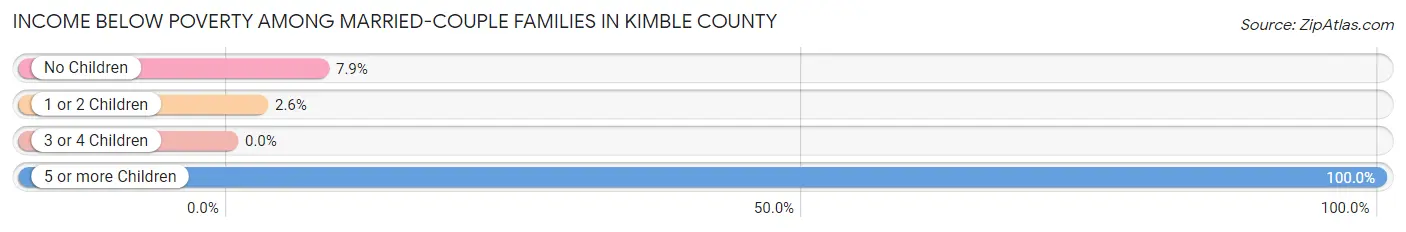
| Children | Above Poverty | Below Poverty |
| No Children | 535 (92.1%) | 46 (7.9%) |
| 1 or 2 Children | 261 (97.4%) | 7 (2.6%) |
| 3 or 4 Children | 30 (100.0%) | 0 (0.0%) |
| 5 or more Children | 0 (0.0%) | 6 (100.0%) |
| Total | 826 (93.3%) | 59 (6.7%) |
Income Below Poverty Among Single-Parent Households in Kimble County
According to the poverty data in Kimble County, 13.8% or 12 single-father households and 20.5% or 24 single-mother households are living below the poverty line. Among single-father households, those with 3 or 4 children have the highest poverty rate, with 7 households (100.0%) experiencing poverty. Likewise, among single-mother households, those with 5 or more children have the highest poverty rate, with 2 households (100.0%) falling below the poverty line.
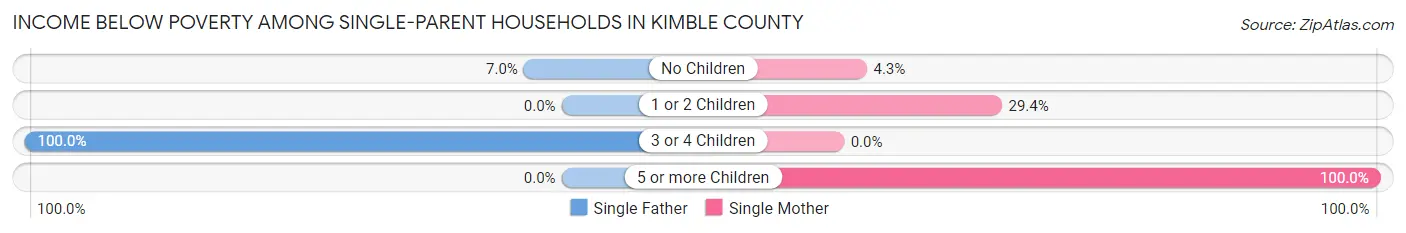
| Children | Single Father | Single Mother |
| No Children | 5 (7.0%) | 2 (4.3%) |
| 1 or 2 Children | 0 (0.0%) | 20 (29.4%) |
| 3 or 4 Children | 7 (100.0%) | 0 (0.0%) |
| 5 or more Children | 0 (0.0%) | 2 (100.0%) |
| Total | 12 (13.8%) | 24 (20.5%) |
Income Below Poverty Among Married-Couple vs Single-Parent Households in Kimble County
The poverty data for Kimble County shows that 59 of the married-couple family households (6.7%) and 36 of the single-parent households (17.6%) are living below the poverty level. Within the married-couple family households, those with 5 or more children have the highest poverty rate, with 6 households (100.0%) falling below the poverty line. Among the single-parent households, those with 3 or 4 children have the highest poverty rate, with 7 household (100.0%) living below poverty.
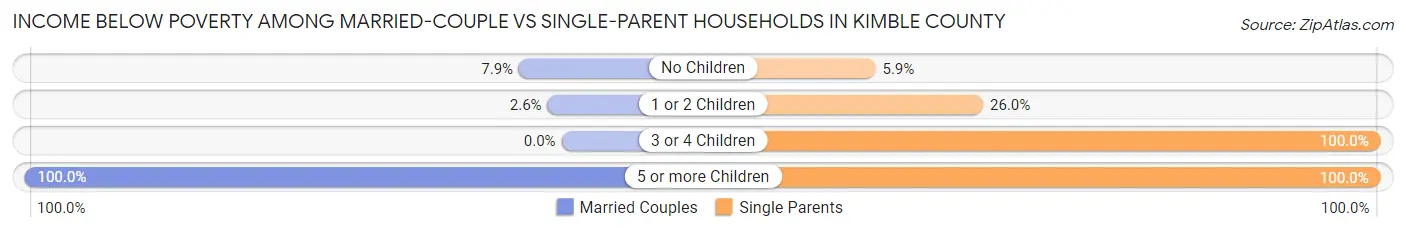
| Children | Married-Couple Families | Single-Parent Households |
| No Children | 46 (7.9%) | 7 (5.9%) |
| 1 or 2 Children | 7 (2.6%) | 20 (26.0%) |
| 3 or 4 Children | 0 (0.0%) | 7 (100.0%) |
| 5 or more Children | 6 (100.0%) | 2 (100.0%) |
| Total | 59 (6.7%) | 36 (17.6%) |
Race in Kimble County
The most populous races in Kimble County are White / Caucasian (3,525 | 81.7%), Hispanic or Latino (1,135 | 26.3%), and Two or more Races (547 | 12.7%).
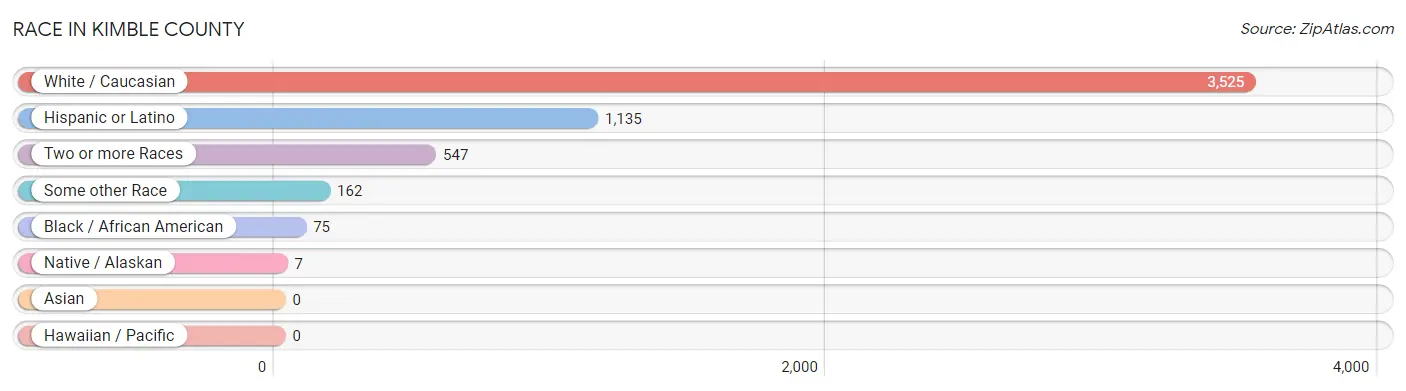
| Race | # Population | % Population |
| Asian | 0 | 0.0% |
| Black / African American | 75 | 1.7% |
| Hawaiian / Pacific | 0 | 0.0% |
| Hispanic or Latino | 1,135 | 26.3% |
| Native / Alaskan | 7 | 0.2% |
| White / Caucasian | 3,525 | 81.7% |
| Two or more Races | 547 | 12.7% |
| Some other Race | 162 | 3.7% |
| Total | 4,316 | 100.0% |
Ancestry in Kimble County
The most populous ancestries reported in Kimble County are German (1,238 | 28.7%), Mexican (1,070 | 24.8%), Irish (458 | 10.6%), English (371 | 8.6%), and American (157 | 3.6%), together accounting for 76.3% of all Kimble County residents.
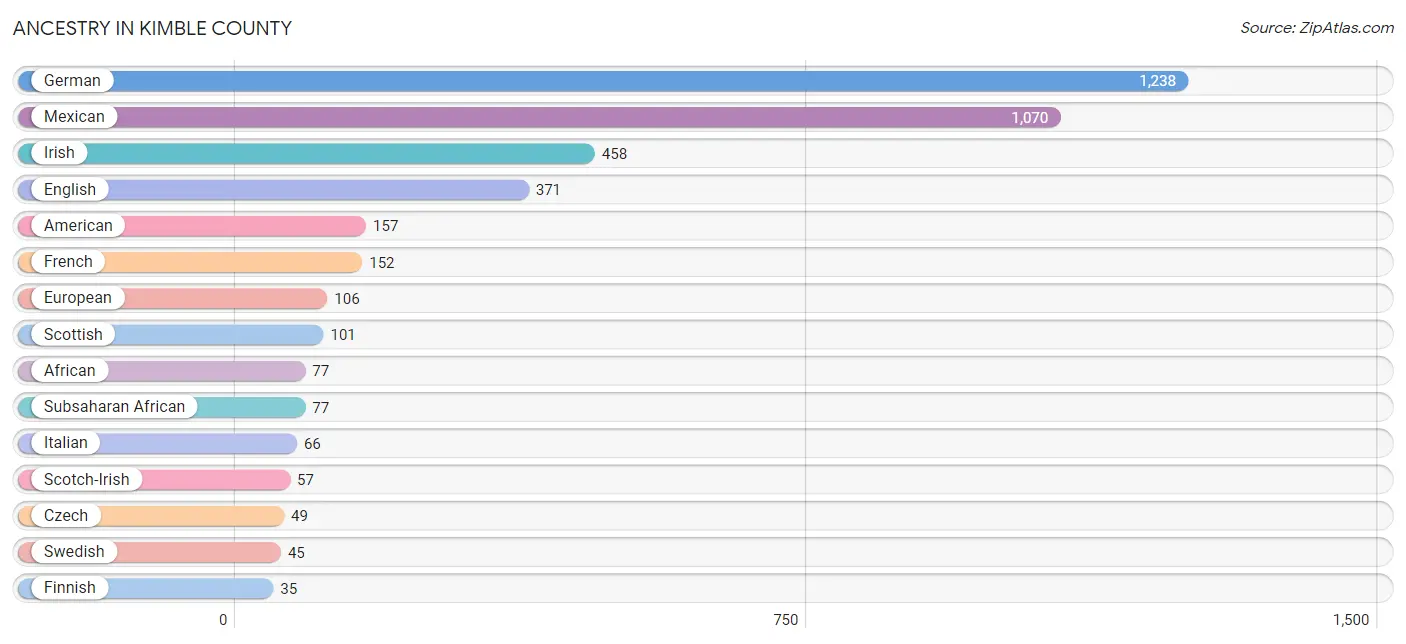
| Ancestry | # Population | % Population |
| African | 77 | 1.8% |
| American | 157 | 3.6% |
| Apache | 12 | 0.3% |
| Belgian | 17 | 0.4% |
| Blackfeet | 6 | 0.1% |
| British | 6 | 0.1% |
| Central American | 1 | 0.0% |
| Central American Indian | 3 | 0.1% |
| Cherokee | 3 | 0.1% |
| Comanche | 12 | 0.3% |
| Croatian | 5 | 0.1% |
| Czech | 49 | 1.1% |
| Czechoslovakian | 10 | 0.2% |
| Eastern European | 7 | 0.2% |
| English | 371 | 8.6% |
| European | 106 | 2.5% |
| Finnish | 35 | 0.8% |
| French | 152 | 3.5% |
| French Canadian | 19 | 0.4% |
| German | 1,238 | 28.7% |
| Irish | 458 | 10.6% |
| Italian | 66 | 1.5% |
| Mexican | 1,070 | 24.8% |
| Norwegian | 21 | 0.5% |
| Puerto Rican | 13 | 0.3% |
| Romanian | 5 | 0.1% |
| Salvadoran | 1 | 0.0% |
| Scandinavian | 10 | 0.2% |
| Scotch-Irish | 57 | 1.3% |
| Scottish | 101 | 2.3% |
| Spaniard | 23 | 0.5% |
| Subsaharan African | 77 | 1.8% |
| Swedish | 45 | 1.0% |
| Swiss | 9 | 0.2% |
| Welsh | 2 | 0.1% | View All 35 Rows |
Immigrants in Kimble County
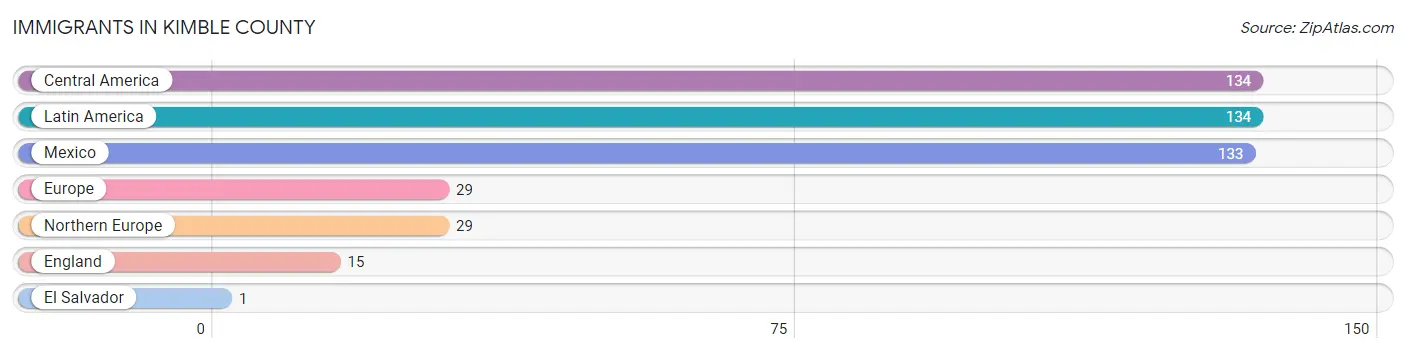
The most numerous immigrant groups reported in Kimble County came from Central America (134 | 3.1%), Latin America (134 | 3.1%), Mexico (133 | 3.1%), Europe (29 | 0.7%), and Northern Europe (29 | 0.7%), together accounting for 10.6% of all Kimble County residents.
| Immigration Origin | # Population | % Population |
| Central America | 134 | 3.1% |
| El Salvador | 1 | 0.0% |
| England | 15 | 0.4% |
| Europe | 29 | 0.7% |
| Latin America | 134 | 3.1% |
| Mexico | 133 | 3.1% |
| Northern Europe | 29 | 0.7% | View All 7 Rows |
Sex and Age in Kimble County
Sex and Age in Kimble County
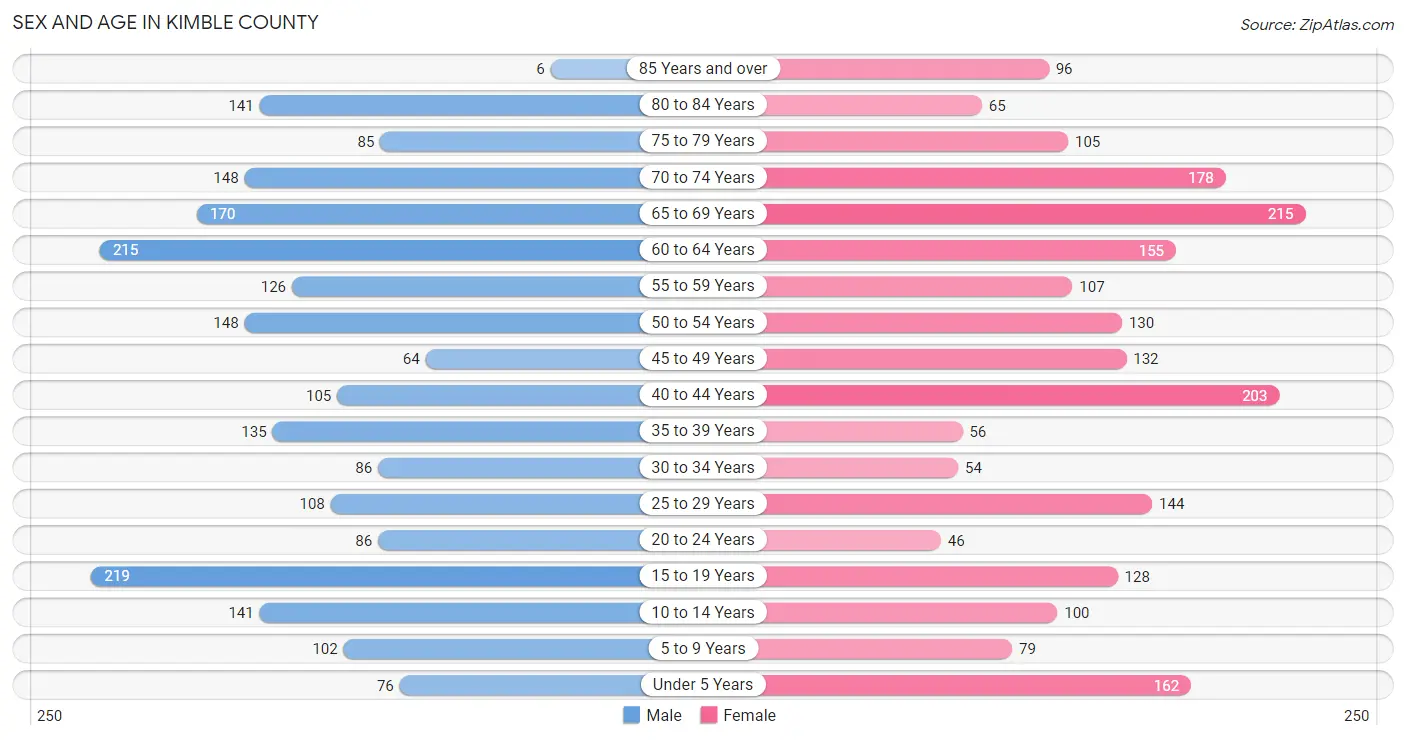
The most populous age groups in Kimble County are 15 to 19 Years (219 | 10.1%) for men and 65 to 69 Years (215 | 10.0%) for women.
| Age Bracket | Male | Female |
| Under 5 Years | 76 (3.5%) | 162 (7.5%) |
| 5 to 9 Years | 102 (4.7%) | 79 (3.7%) |
| 10 to 14 Years | 141 (6.5%) | 100 (4.6%) |
| 15 to 19 Years | 219 (10.1%) | 128 (5.9%) |
| 20 to 24 Years | 86 (4.0%) | 46 (2.1%) |
| 25 to 29 Years | 108 (5.0%) | 144 (6.7%) |
| 30 to 34 Years | 86 (4.0%) | 54 (2.5%) |
| 35 to 39 Years | 135 (6.2%) | 56 (2.6%) |
| 40 to 44 Years | 105 (4.9%) | 203 (9.4%) |
| 45 to 49 Years | 64 (3.0%) | 132 (6.1%) |
| 50 to 54 Years | 148 (6.9%) | 130 (6.0%) |
| 55 to 59 Years | 126 (5.8%) | 107 (5.0%) |
| 60 to 64 Years | 215 (10.0%) | 155 (7.2%) |
| 65 to 69 Years | 170 (7.9%) | 215 (10.0%) |
| 70 to 74 Years | 148 (6.9%) | 178 (8.3%) |
| 75 to 79 Years | 85 (3.9%) | 105 (4.9%) |
| 80 to 84 Years | 141 (6.5%) | 65 (3.0%) |
| 85 Years and over | 6 (0.3%) | 96 (4.4%) |
| Total | 2,161 (100.0%) | 2,155 (100.0%) |
Families and Households in Kimble County
Median Family Size in Kimble County
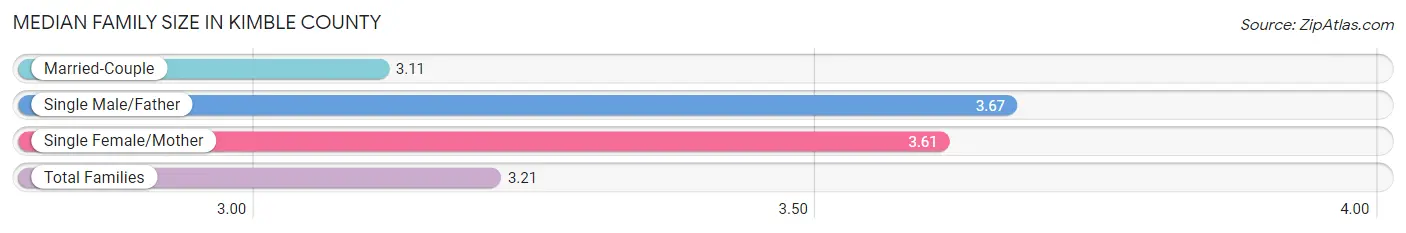
The median family size in Kimble County is 3.21 persons per family, with single male/father families (87 | 8.0%) accounting for the largest median family size of 3.67 persons per family. On the other hand, married-couple families (885 | 81.3%) represent the smallest median family size with 3.11 persons per family.
| Family Type | # Families | Family Size |
| Married-Couple | 885 (81.3%) | 3.11 |
| Single Male/Father | 87 (8.0%) | 3.67 |
| Single Female/Mother | 117 (10.7%) | 3.61 |
| Total Families | 1,089 (100.0%) | 3.21 |
Median Household Size in Kimble County
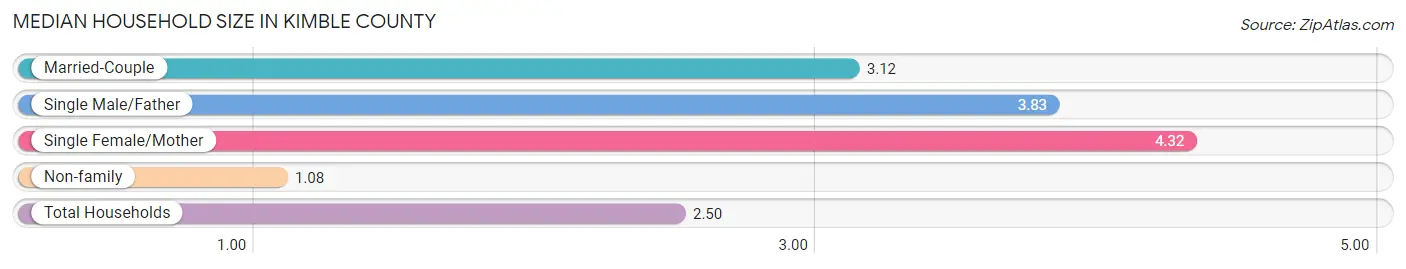
The median household size in Kimble County is 2.50 persons per household, with single female/mother households (117 | 6.8%) accounting for the largest median household size of 4.32 persons per household. non-family households (626 | 36.5%) represent the smallest median household size with 1.08 persons per household.
| Household Type | # Households | Household Size |
| Married-Couple | 885 (51.6%) | 3.12 |
| Single Male/Father | 87 (5.1%) | 3.83 |
| Single Female/Mother | 117 (6.8%) | 4.32 |
| Non-family | 626 (36.5%) | 1.08 |
| Total Households | 1,715 (100.0%) | 2.50 |
Household Size by Marriage Status in Kimble County
Out of a total of 1,715 households in Kimble County, 1,089 (63.5%) are family households, while 626 (36.5%) are nonfamily households. The most numerous type of family households are 2-person households, comprising 550, and the most common type of nonfamily households are 1-person households, comprising 596.
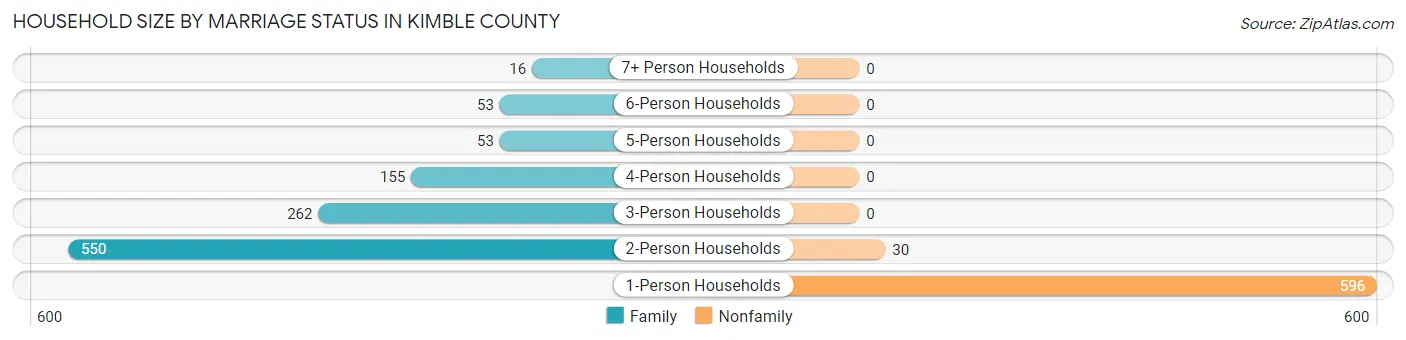
| Household Size | Family Households | Nonfamily Households |
| 1-Person Households | - | 596 (34.7%) |
| 2-Person Households | 550 (32.1%) | 30 (1.8%) |
| 3-Person Households | 262 (15.3%) | 0 (0.0%) |
| 4-Person Households | 155 (9.0%) | 0 (0.0%) |
| 5-Person Households | 53 (3.1%) | 0 (0.0%) |
| 6-Person Households | 53 (3.1%) | 0 (0.0%) |
| 7+ Person Households | 16 (0.9%) | 0 (0.0%) |
| Total | 1,089 (63.5%) | 626 (36.5%) |
Female Fertility in Kimble County
Fertility by Age in Kimble County
Average fertility rate in Kimble County is 78.0 births per 1,000 women. Women in the age bracket of 20 to 34 years have the highest fertility rate with 250.0 births per 1,000 women. Women in the age bracket of 20 to 34 years acount for 100.0% of all women with births.
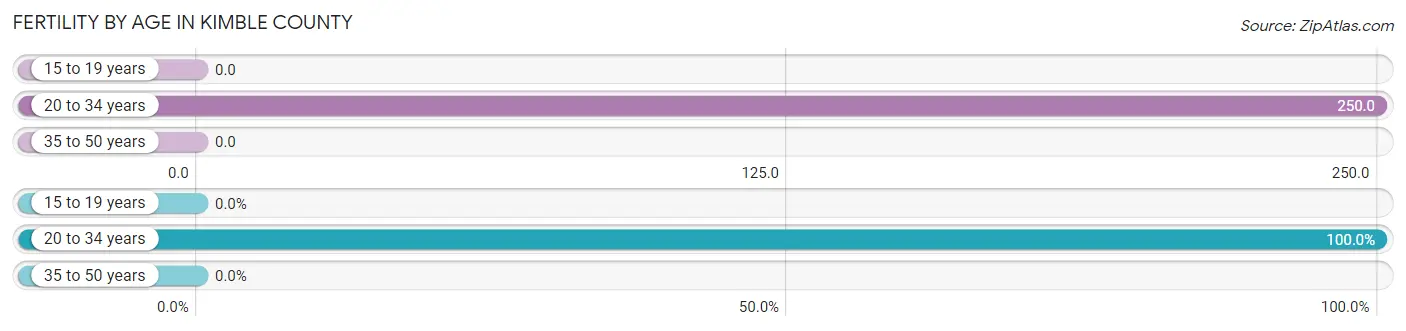
| Age Bracket | Women with Births | Births / 1,000 Women |
| 15 to 19 years | 0 (0.0%) | 0.0 |
| 20 to 34 years | 61 (100.0%) | 250.0 |
| 35 to 50 years | 0 (0.0%) | 0.0 |
| Total | 61 (100.0%) | 78.0 |
Fertility by Age by Marriage Status in Kimble County
41.0% of women with births (61) in Kimble County are married. The highest percentage of unmarried women with births falls into 20 to 34 years age bracket with 59.0% of them unmarried at the time of birth, while the lowest percentage of unmarried women with births belong to 20 to 34 years age bracket with 59.0% of them unmarried.
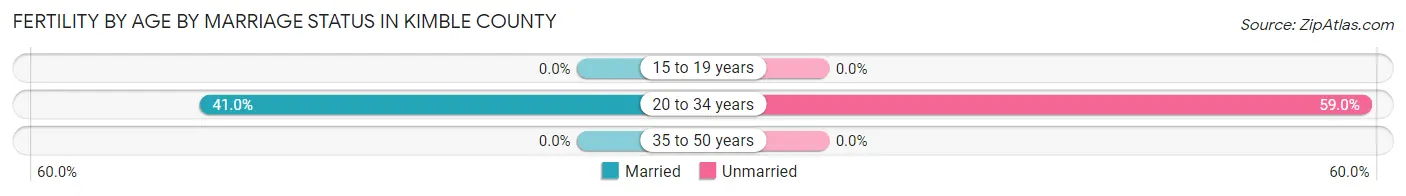
| Age Bracket | Married | Unmarried |
| 15 to 19 years | 0 (0.0%) | 0 (0.0%) |
| 20 to 34 years | 25 (41.0%) | 36 (59.0%) |
| 35 to 50 years | 0 (0.0%) | 0 (0.0%) |
| Total | 25 (41.0%) | 36 (59.0%) |
Fertility by Education in Kimble County
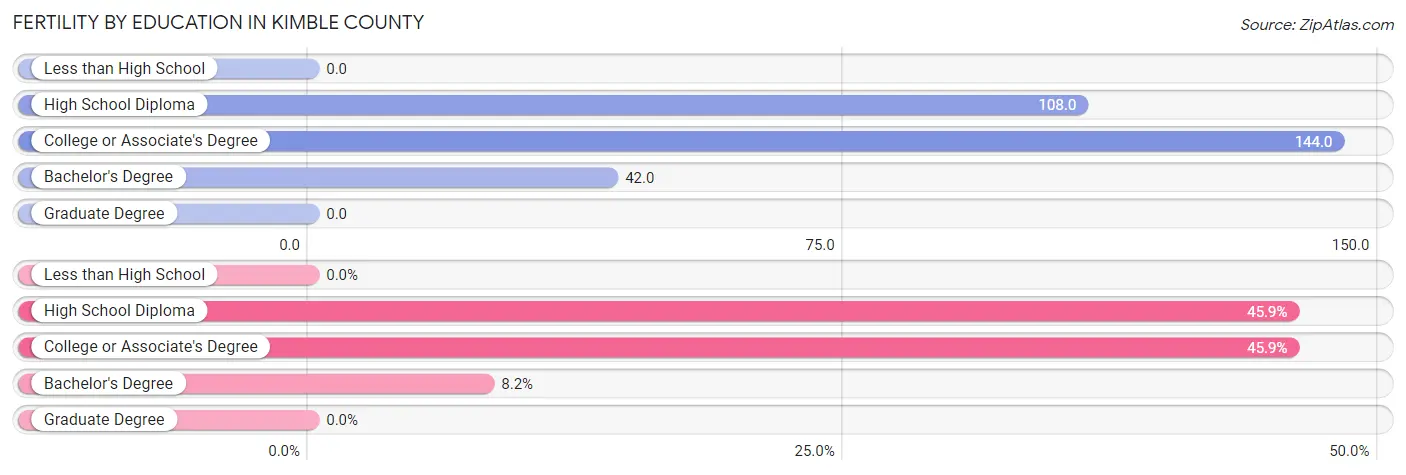
| Educational Attainment | Women with Births | Births / 1,000 Women |
| Less than High School | 0 (0.0%) | 0.0 |
| High School Diploma | 28 (45.9%) | 108.0 |
| College or Associate's Degree | 28 (45.9%) | 144.0 |
| Bachelor's Degree | 5 (8.2%) | 42.0 |
| Graduate Degree | 0 (0.0%) | 0.0 |
| Total | 61 (100.0%) | 78.0 |
Fertility by Education by Marriage Status in Kimble County
59.0% of women with births in Kimble County are unmarried. Women with the educational attainment of bachelor's degree are most likely to be married with 100.0% of them married at childbirth, while women with the educational attainment of high school diploma are least likely to be married with 78.6% of them unmarried at childbirth.
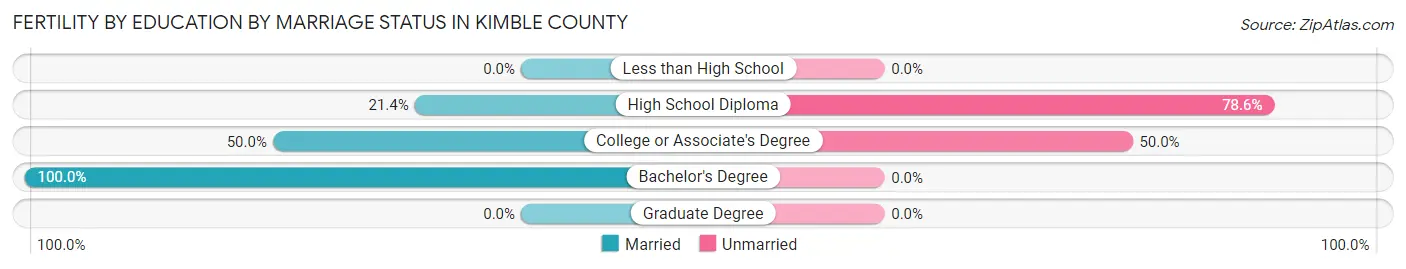
| Educational Attainment | Married | Unmarried |
| Less than High School | 0 (0.0%) | 0 (0.0%) |
| High School Diploma | 6 (21.4%) | 22 (78.6%) |
| College or Associate's Degree | 14 (50.0%) | 14 (50.0%) |
| Bachelor's Degree | 5 (100.0%) | 0 (0.0%) |
| Graduate Degree | 0 (0.0%) | 0 (0.0%) |
| Total | 25 (41.0%) | 36 (59.0%) |
Employment Characteristics in Kimble County
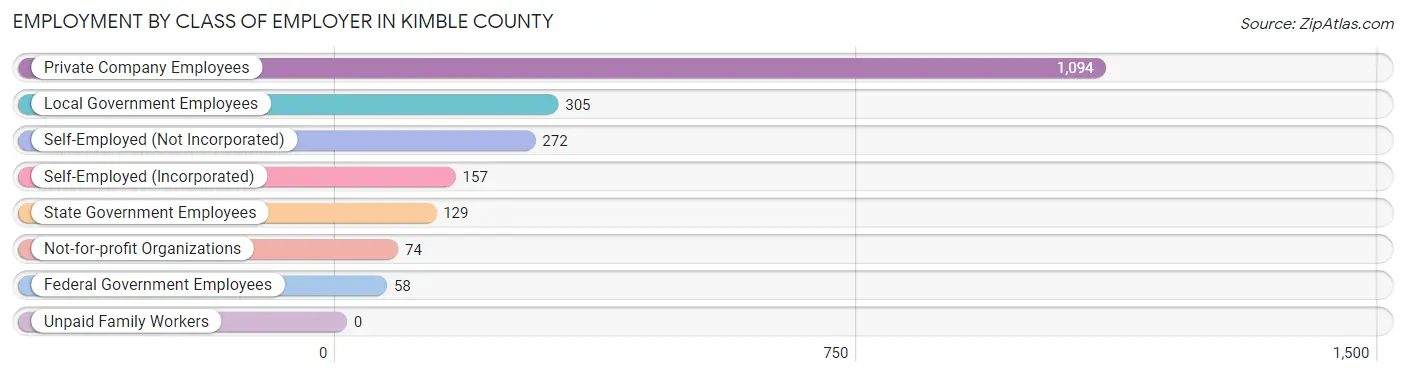
Employment by Class of Employer in Kimble County
Among the 2,089 employed individuals in Kimble County, private company employees (1,094 | 52.4%), local government employees (305 | 14.6%), and self-employed (not incorporated) (272 | 13.0%) make up the most common classes of employment.
| Employer Class | # Employees | % Employees |
| Private Company Employees | 1,094 | 52.4% |
| Self-Employed (Incorporated) | 157 | 7.5% |
| Self-Employed (Not Incorporated) | 272 | 13.0% |
| Not-for-profit Organizations | 74 | 3.5% |
| Local Government Employees | 305 | 14.6% |
| State Government Employees | 129 | 6.2% |
| Federal Government Employees | 58 | 2.8% |
| Unpaid Family Workers | 0 | 0.0% |
| Total | 2,089 | 100.0% |
Employment Status by Age in Kimble County
According to the labor force statistics for Kimble County, out of the total population over 16 years of age (3,566), 59.4% or 2,118 individuals are in the labor force, with 0.8% or 17 of them unemployed. The age group with the highest labor force participation rate is 35 to 44 years, with 93.2% or 465 individuals in the labor force. Within the labor force, the 25 to 29 years age range has the highest percentage of unemployed individuals, with 6.8% or 14 of them being unemployed.
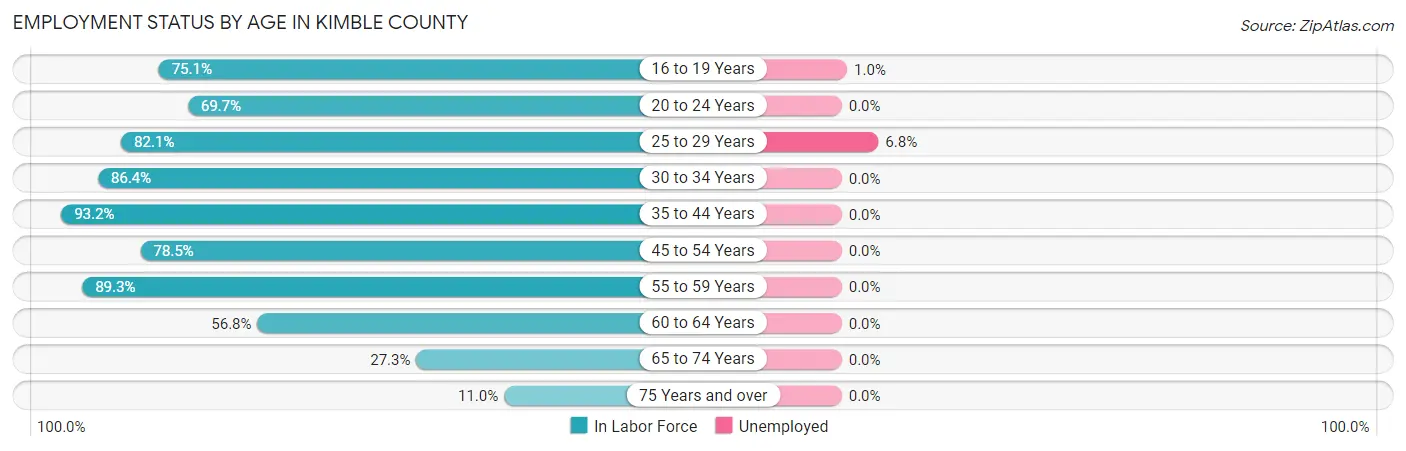
| Age Bracket | In Labor Force | Unemployed |
| 16 to 19 Years | 193 (75.1%) | 2 (1.0%) |
| 20 to 24 Years | 92 (69.7%) | 0 (0.0%) |
| 25 to 29 Years | 207 (82.1%) | 14 (6.8%) |
| 30 to 34 Years | 121 (86.4%) | 0 (0.0%) |
| 35 to 44 Years | 465 (93.2%) | 0 (0.0%) |
| 45 to 54 Years | 372 (78.5%) | 0 (0.0%) |
| 55 to 59 Years | 208 (89.3%) | 0 (0.0%) |
| 60 to 64 Years | 210 (56.8%) | 0 (0.0%) |
| 65 to 74 Years | 194 (27.3%) | 0 (0.0%) |
| 75 Years and over | 55 (11.0%) | 0 (0.0%) |
| Total | 2,118 (59.4%) | 17 (0.8%) |
Employment Status by Educational Attainment in Kimble County
According to labor force statistics for Kimble County, 80.4% of individuals (1,582) out of the total population between 25 and 64 years of age (1,968) are in the labor force, with 0.9% or 14 of them being unemployed. The group with the highest labor force participation rate are those with the educational attainment of bachelor's degree or higher, with 91.5% or 444 individuals in the labor force. Within the labor force, individuals with less than high school education have the highest percentage of unemployment, with 3.0% or 6 of them being unemployed.
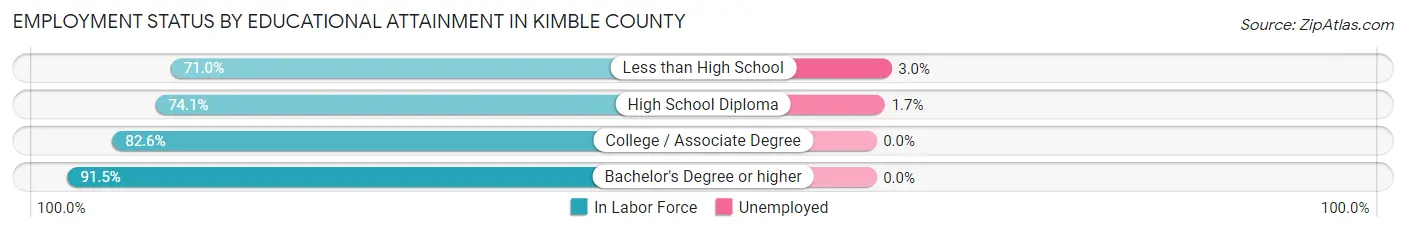
| Educational Attainment | In Labor Force | Unemployed |
| Less than High School | 198 (71.0%) | 8 (3.0%) |
| High School Diploma | 466 (74.1%) | 11 (1.7%) |
| College / Associate Degree | 475 (82.6%) | 0 (0.0%) |
| Bachelor's Degree or higher | 444 (91.5%) | 0 (0.0%) |
| Total | 1,582 (80.4%) | 18 (0.9%) |
Employment Occupations by Sex in Kimble County
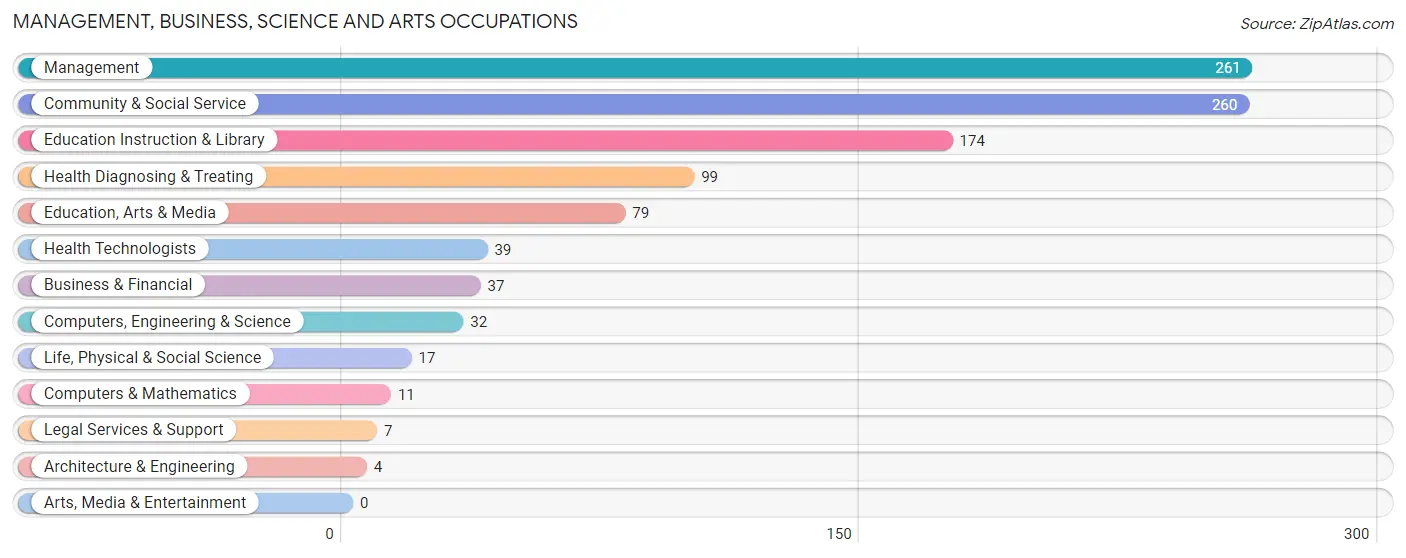
Management, Business, Science and Arts Occupations
The most common Management, Business, Science and Arts occupations in Kimble County are Management (261 | 12.4%), Community & Social Service (260 | 12.4%), Education Instruction & Library (174 | 8.3%), Health Diagnosing & Treating (99 | 4.7%), and Education, Arts & Media (79 | 3.8%).
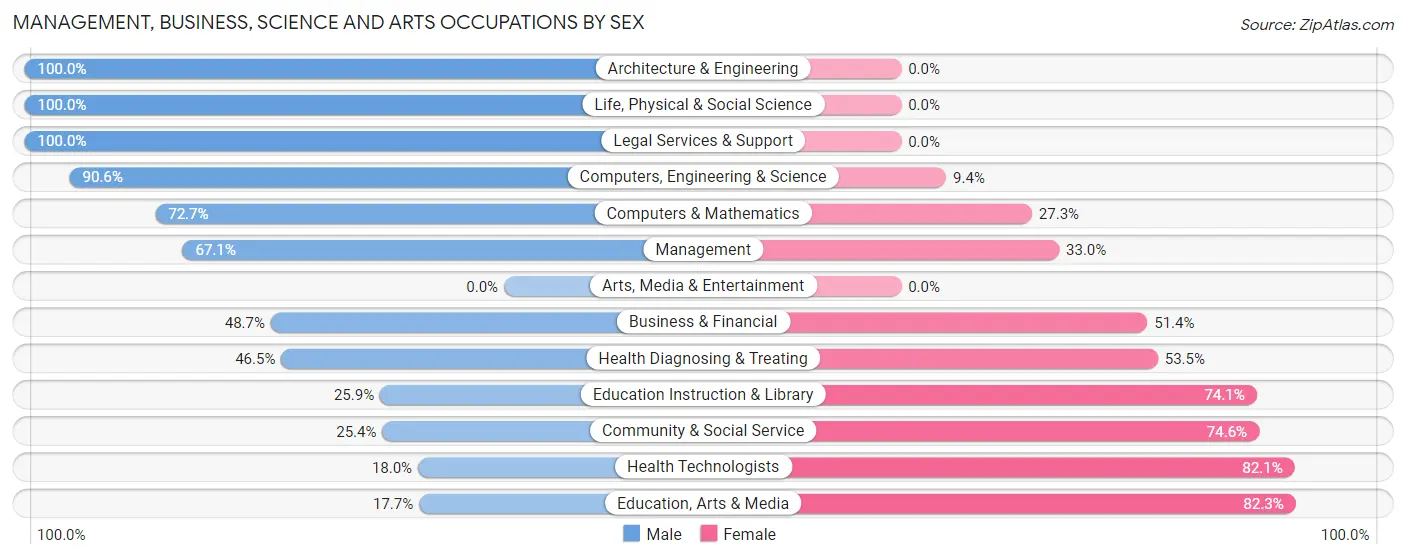
Management, Business, Science and Arts Occupations by Sex
Within the Management, Business, Science and Arts occupations in Kimble County, the most male-oriented occupations are Architecture & Engineering (100.0%), Life, Physical & Social Science (100.0%), and Legal Services & Support (100.0%), while the most female-oriented occupations are Education, Arts & Media (82.3%), Health Technologists (82.1%), and Community & Social Service (74.6%).
| Occupation | Male | Female |
| Management | 175 (67.0%) | 86 (33.0%) |
| Business & Financial | 18 (48.6%) | 19 (51.3%) |
| Computers, Engineering & Science | 29 (90.6%) | 3 (9.4%) |
| Computers & Mathematics | 8 (72.7%) | 3 (27.3%) |
| Architecture & Engineering | 4 (100.0%) | 0 (0.0%) |
| Life, Physical & Social Science | 17 (100.0%) | 0 (0.0%) |
| Community & Social Service | 66 (25.4%) | 194 (74.6%) |
| Education, Arts & Media | 14 (17.7%) | 65 (82.3%) |
| Legal Services & Support | 7 (100.0%) | 0 (0.0%) |
| Education Instruction & Library | 45 (25.9%) | 129 (74.1%) |
| Arts, Media & Entertainment | 0 (0.0%) | 0 (0.0%) |
| Health Diagnosing & Treating | 46 (46.5%) | 53 (53.5%) |
| Health Technologists | 7 (17.9%) | 32 (82.1%) |
| Total (Category) | 334 (48.5%) | 355 (51.5%) |
| Total (Overall) | 1,093 (52.0%) | 1,008 (48.0%) |
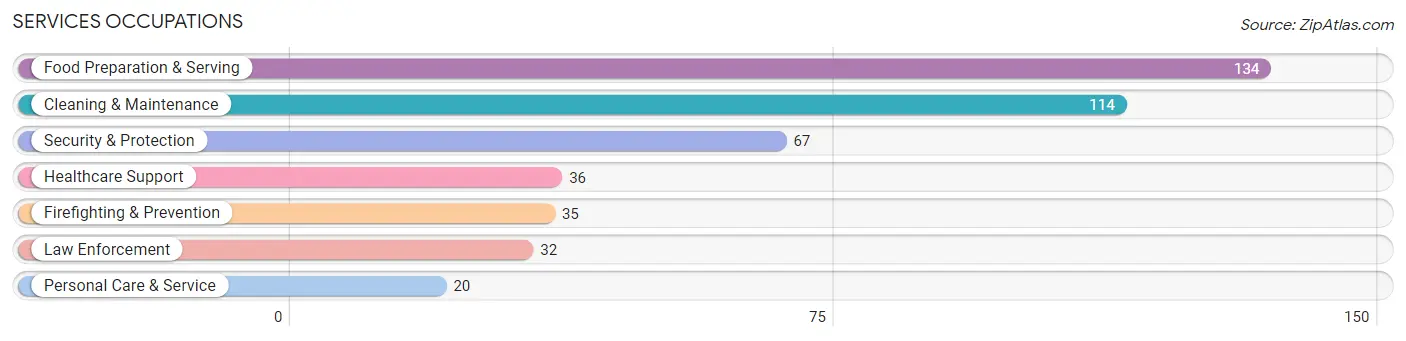
Services Occupations
The most common Services occupations in Kimble County are Food Preparation & Serving (134 | 6.4%), Cleaning & Maintenance (114 | 5.4%), Security & Protection (67 | 3.2%), Healthcare Support (36 | 1.7%), and Firefighting & Prevention (35 | 1.7%).
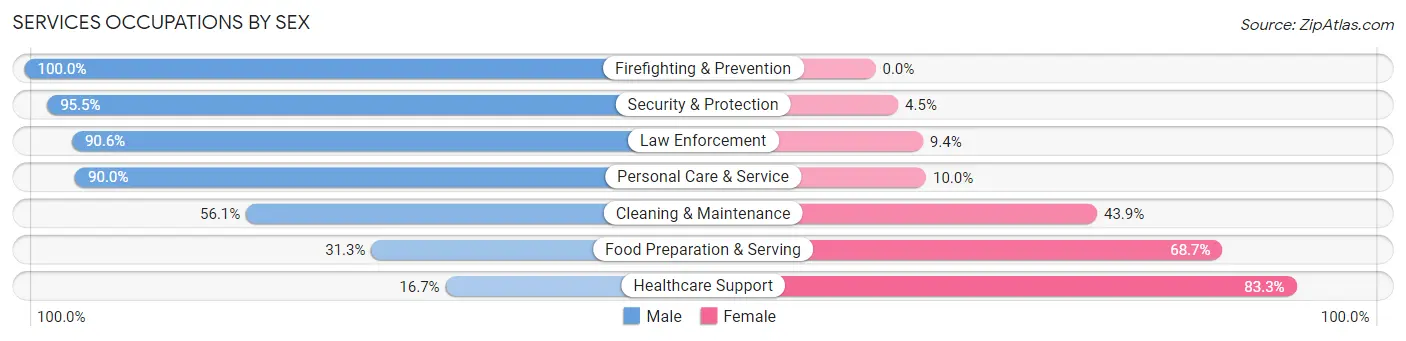
Services Occupations by Sex
Within the Services occupations in Kimble County, the most male-oriented occupations are Firefighting & Prevention (100.0%), Security & Protection (95.5%), and Law Enforcement (90.6%), while the most female-oriented occupations are Healthcare Support (83.3%), Food Preparation & Serving (68.7%), and Cleaning & Maintenance (43.9%).
| Occupation | Male | Female |
| Healthcare Support | 6 (16.7%) | 30 (83.3%) |
| Security & Protection | 64 (95.5%) | 3 (4.5%) |
| Firefighting & Prevention | 35 (100.0%) | 0 (0.0%) |
| Law Enforcement | 29 (90.6%) | 3 (9.4%) |
| Food Preparation & Serving | 42 (31.3%) | 92 (68.7%) |
| Cleaning & Maintenance | 64 (56.1%) | 50 (43.9%) |
| Personal Care & Service | 18 (90.0%) | 2 (10.0%) |
| Total (Category) | 194 (52.3%) | 177 (47.7%) |
| Total (Overall) | 1,093 (52.0%) | 1,008 (48.0%) |
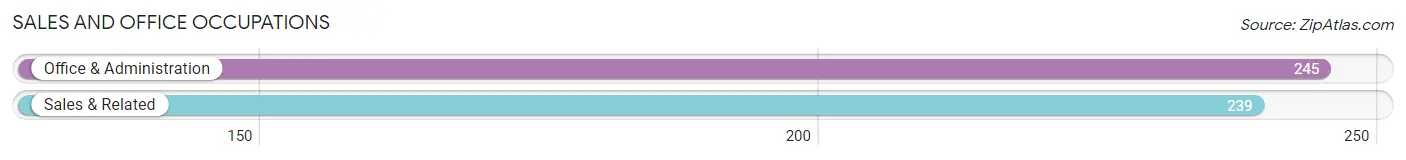
Sales and Office Occupations
The most common Sales and Office occupations in Kimble County are Office & Administration (245 | 11.7%), and Sales & Related (239 | 11.4%).
Sales and Office Occupations by Sex
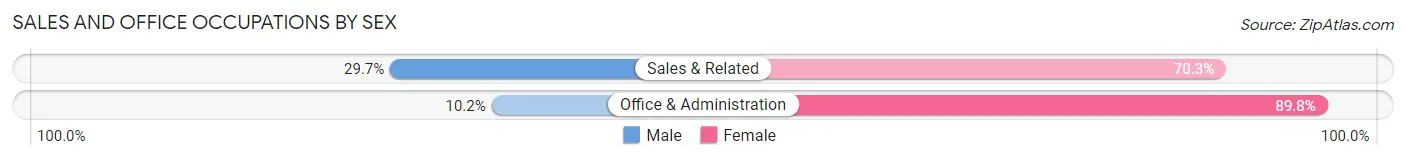
| Occupation | Male | Female |
| Sales & Related | 71 (29.7%) | 168 (70.3%) |
| Office & Administration | 25 (10.2%) | 220 (89.8%) |
| Total (Category) | 96 (19.8%) | 388 (80.2%) |
| Total (Overall) | 1,093 (52.0%) | 1,008 (48.0%) |
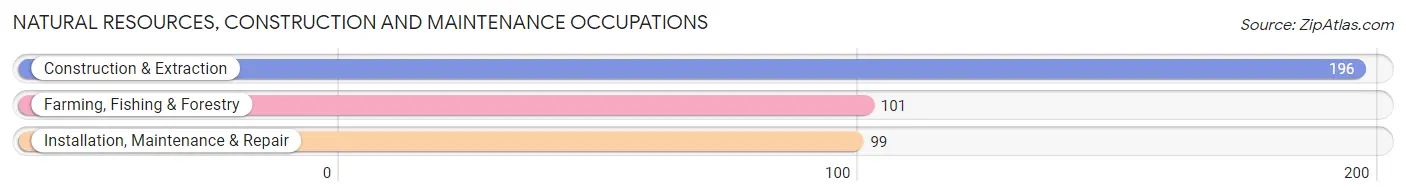
Natural Resources, Construction and Maintenance Occupations
The most common Natural Resources, Construction and Maintenance occupations in Kimble County are Construction & Extraction (196 | 9.3%), Farming, Fishing & Forestry (101 | 4.8%), and Installation, Maintenance & Repair (99 | 4.7%).
Natural Resources, Construction and Maintenance Occupations by Sex
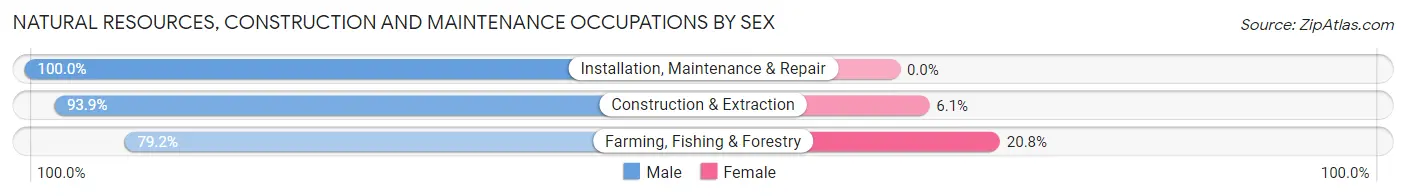
| Occupation | Male | Female |
| Farming, Fishing & Forestry | 80 (79.2%) | 21 (20.8%) |
| Construction & Extraction | 184 (93.9%) | 12 (6.1%) |
| Installation, Maintenance & Repair | 99 (100.0%) | 0 (0.0%) |
| Total (Category) | 363 (91.7%) | 33 (8.3%) |
| Total (Overall) | 1,093 (52.0%) | 1,008 (48.0%) |
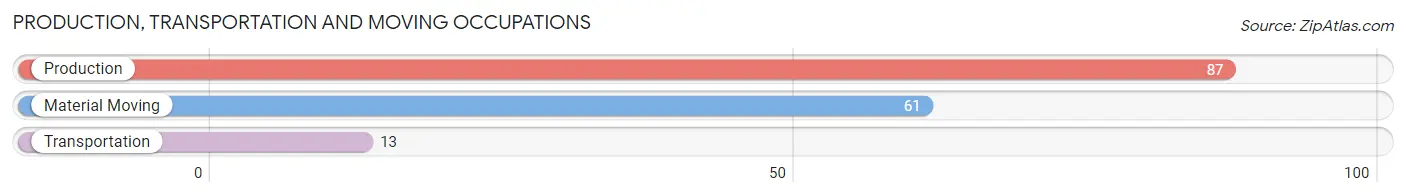
Production, Transportation and Moving Occupations
The most common Production, Transportation and Moving occupations in Kimble County are Production (87 | 4.1%), Material Moving (61 | 2.9%), and Transportation (13 | 0.6%).
Production, Transportation and Moving Occupations by Sex
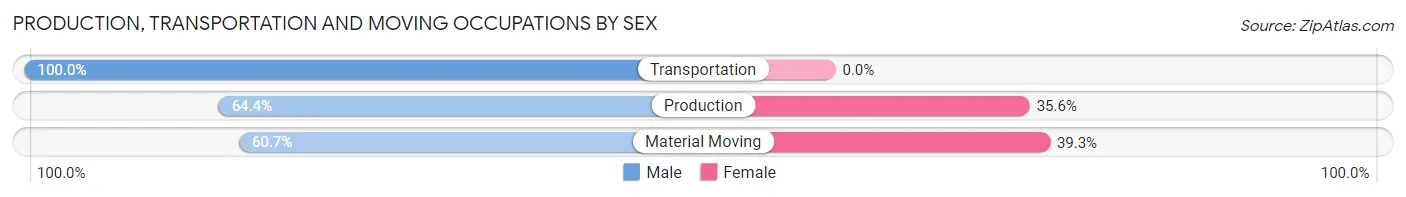
| Occupation | Male | Female |
| Production | 56 (64.4%) | 31 (35.6%) |
| Transportation | 13 (100.0%) | 0 (0.0%) |
| Material Moving | 37 (60.7%) | 24 (39.3%) |
| Total (Category) | 106 (65.8%) | 55 (34.2%) |
| Total (Overall) | 1,093 (52.0%) | 1,008 (48.0%) |
Employment Industries by Sex in Kimble County
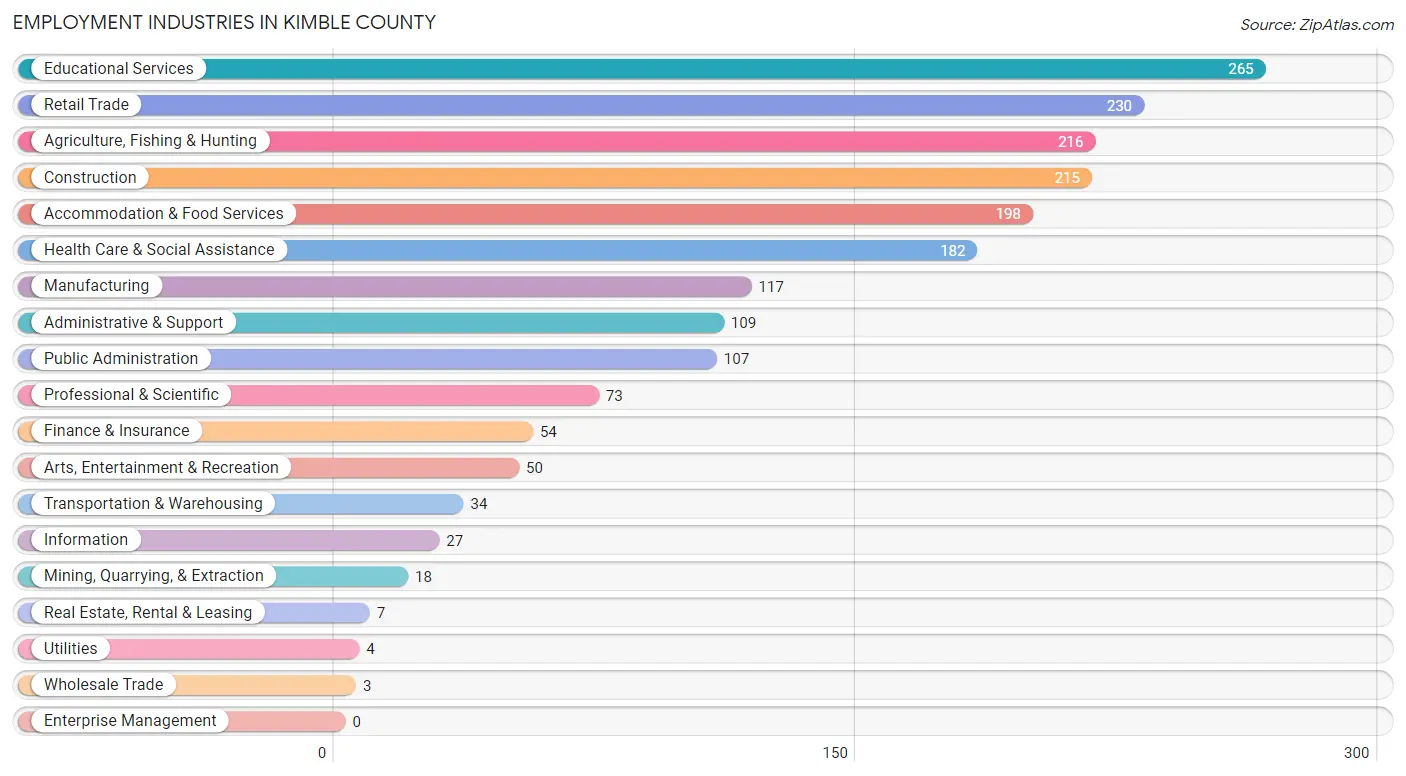
Employment Industries in Kimble County
The major employment industries in Kimble County include Educational Services (265 | 12.6%), Retail Trade (230 | 11.0%), Agriculture, Fishing & Hunting (216 | 10.3%), Construction (215 | 10.2%), and Accommodation & Food Services (198 | 9.4%).
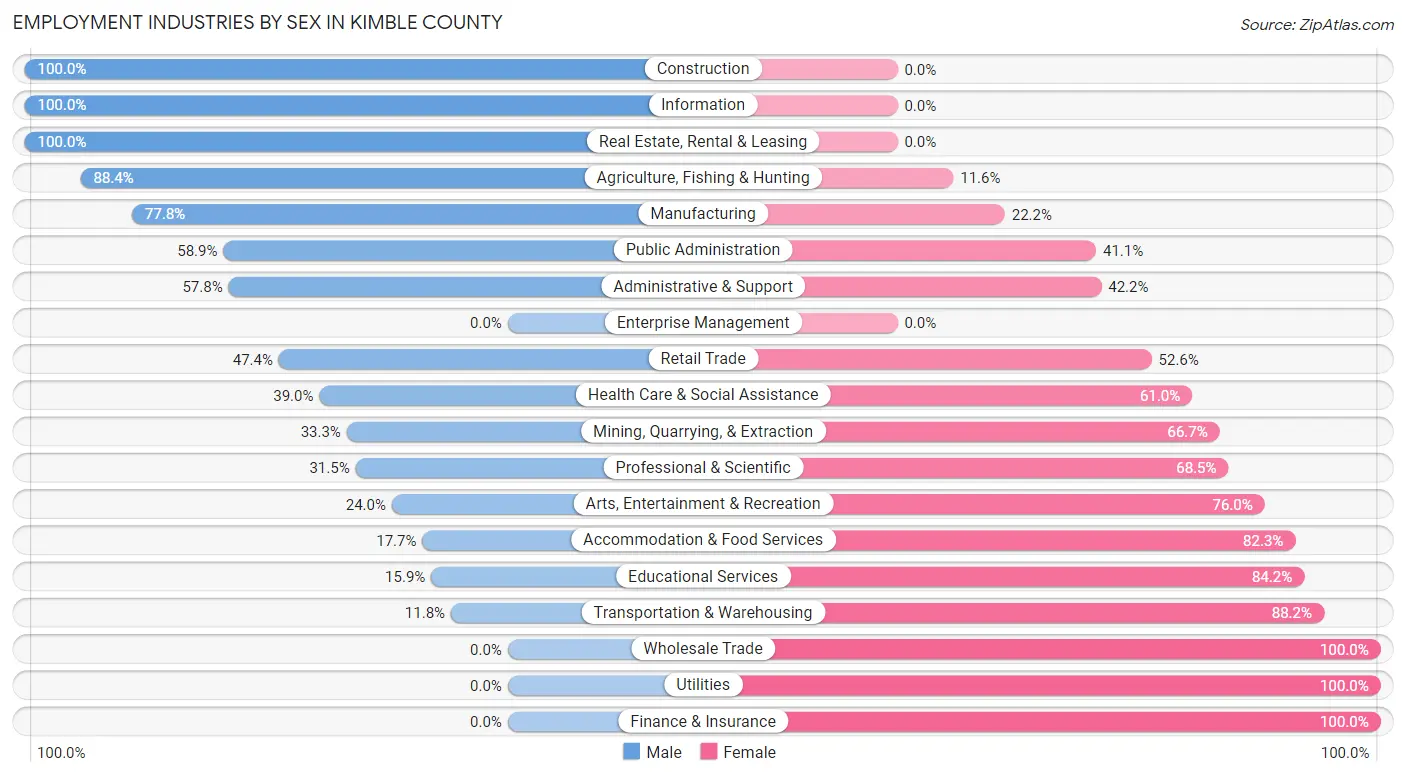
Employment Industries by Sex in Kimble County
The Kimble County industries that see more men than women are Construction (100.0%), Information (100.0%), and Real Estate, Rental & Leasing (100.0%), whereas the industries that tend to have a higher number of women are Wholesale Trade (100.0%), Utilities (100.0%), and Finance & Insurance (100.0%).
| Industry | Male | Female |
| Agriculture, Fishing & Hunting | 191 (88.4%) | 25 (11.6%) |
| Mining, Quarrying, & Extraction | 6 (33.3%) | 12 (66.7%) |
| Construction | 215 (100.0%) | 0 (0.0%) |
| Manufacturing | 91 (77.8%) | 26 (22.2%) |
| Wholesale Trade | 0 (0.0%) | 3 (100.0%) |
| Retail Trade | 109 (47.4%) | 121 (52.6%) |
| Transportation & Warehousing | 4 (11.8%) | 30 (88.2%) |
| Utilities | 0 (0.0%) | 4 (100.0%) |
| Information | 27 (100.0%) | 0 (0.0%) |
| Finance & Insurance | 0 (0.0%) | 54 (100.0%) |
| Real Estate, Rental & Leasing | 7 (100.0%) | 0 (0.0%) |
| Professional & Scientific | 23 (31.5%) | 50 (68.5%) |
| Enterprise Management | 0 (0.0%) | 0 (0.0%) |
| Administrative & Support | 63 (57.8%) | 46 (42.2%) |
| Educational Services | 42 (15.9%) | 223 (84.2%) |
| Health Care & Social Assistance | 71 (39.0%) | 111 (61.0%) |
| Arts, Entertainment & Recreation | 12 (24.0%) | 38 (76.0%) |
| Accommodation & Food Services | 35 (17.7%) | 163 (82.3%) |
| Public Administration | 63 (58.9%) | 44 (41.1%) |
| Total | 1,093 (52.0%) | 1,008 (48.0%) |
Education in Kimble County
School Enrollment in Kimble County
The most common levels of schooling among the 728 students in Kimble County are middle school (221 | 30.4%), high school (199 | 27.3%), and elementary school (185 | 25.4%).
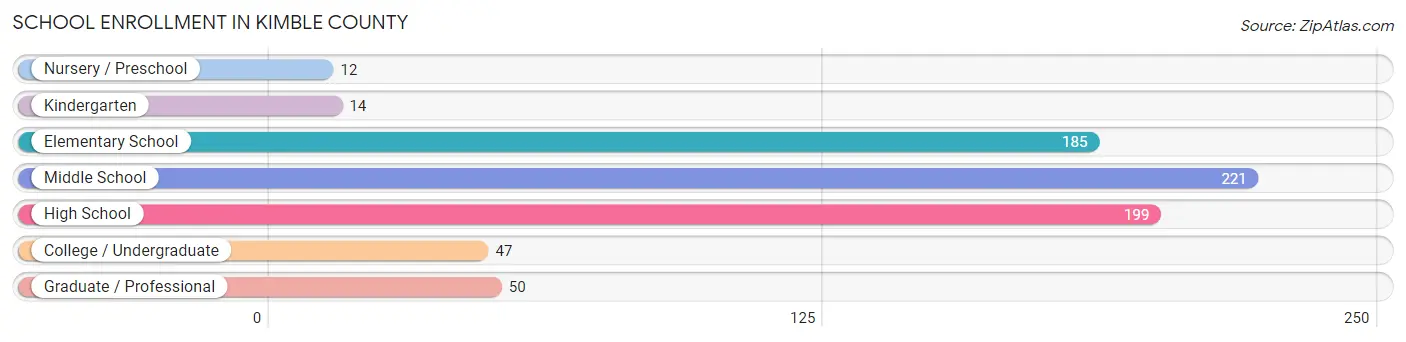
| School Level | # Students | % Students |
| Nursery / Preschool | 12 | 1.7% |
| Kindergarten | 14 | 1.9% |
| Elementary School | 185 | 25.4% |
| Middle School | 221 | 30.4% |
| High School | 199 | 27.3% |
| College / Undergraduate | 47 | 6.5% |
| Graduate / Professional | 50 | 6.9% |
| Total | 728 | 100.0% |
School Enrollment by Age by Funding Source in Kimble County
Out of a total of 728 students who are enrolled in schools in Kimble County, 75 (10.3%) attend a private institution, while the remaining 653 (89.7%) are enrolled in public schools. The age group of 20 to 24 year olds has the highest likelihood of being enrolled in private schools, with 9 (100.0% in the age bracket) enrolled. Conversely, the age group of 3 to 4 year olds has the lowest likelihood of being enrolled in a private school, with 12 (100.0% in the age bracket) attending a public institution.
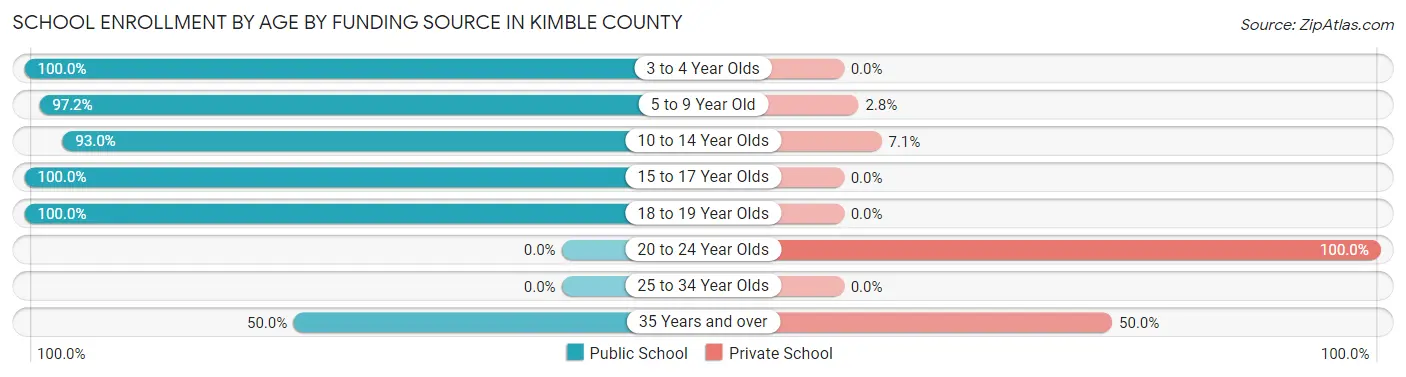
| Age Bracket | Public School | Private School |
| 3 to 4 Year Olds | 12 (100.0%) | 0 (0.0%) |
| 5 to 9 Year Old | 176 (97.2%) | 5 (2.8%) |
| 10 to 14 Year Olds | 224 (92.9%) | 17 (7.0%) |
| 15 to 17 Year Olds | 170 (100.0%) | 0 (0.0%) |
| 18 to 19 Year Olds | 27 (100.0%) | 0 (0.0%) |
| 20 to 24 Year Olds | 0 (0.0%) | 9 (100.0%) |
| 25 to 34 Year Olds | 0 (0.0%) | 0 (0.0%) |
| 35 Years and over | 44 (50.0%) | 44 (50.0%) |
| Total | 653 (89.7%) | 75 (10.3%) |
Educational Attainment by Field of Study in Kimble County
Education (177 | 18.5%), bio, nature & agricultural (124 | 12.9%), science & technology (110 | 11.5%), arts & humanities (92 | 9.6%), and psychology (77 | 8.0%) are the most common fields of study among 959 individuals in Kimble County who have obtained a bachelor's degree or higher.
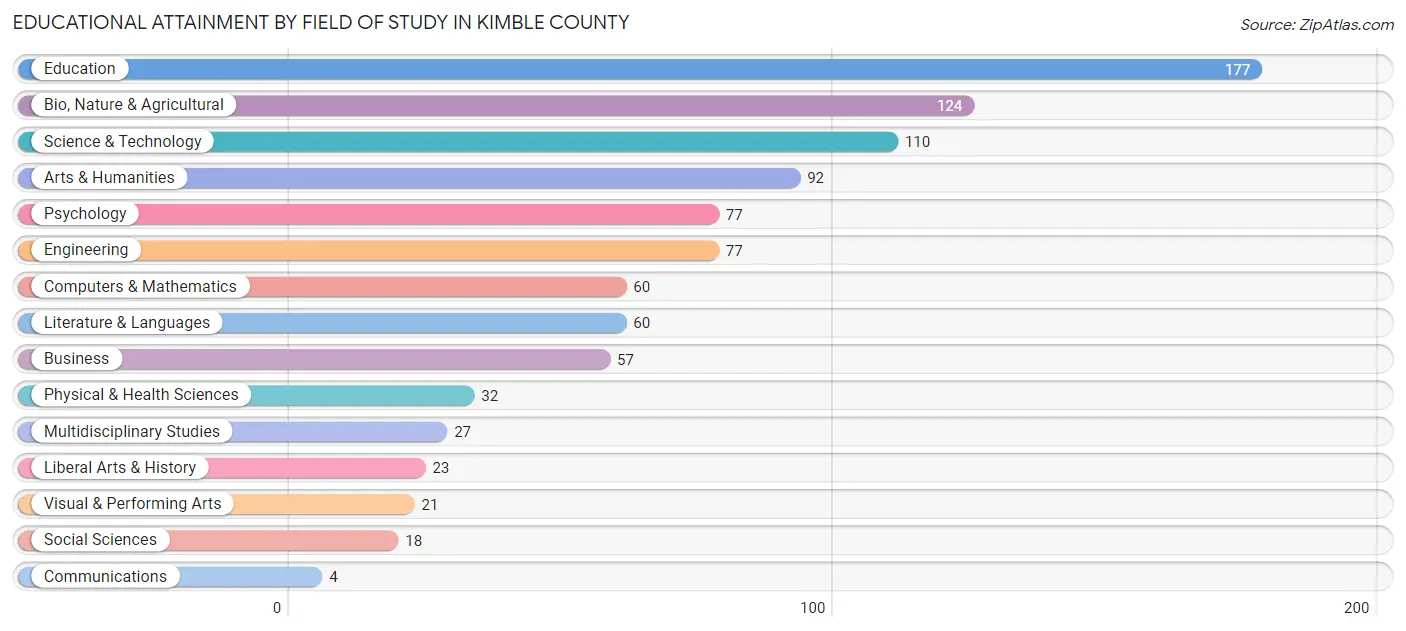
| Field of Study | # Graduates | % Graduates |
| Computers & Mathematics | 60 | 6.3% |
| Bio, Nature & Agricultural | 124 | 12.9% |
| Physical & Health Sciences | 32 | 3.3% |
| Psychology | 77 | 8.0% |
| Social Sciences | 18 | 1.9% |
| Engineering | 77 | 8.0% |
| Multidisciplinary Studies | 27 | 2.8% |
| Science & Technology | 110 | 11.5% |
| Business | 57 | 5.9% |
| Education | 177 | 18.5% |
| Literature & Languages | 60 | 6.3% |
| Liberal Arts & History | 23 | 2.4% |
| Visual & Performing Arts | 21 | 2.2% |
| Communications | 4 | 0.4% |
| Arts & Humanities | 92 | 9.6% |
| Total | 959 | 100.0% |
Transportation & Commute in Kimble County
Vehicle Availability by Sex in Kimble County
The most prevalent vehicle ownership categories in Kimble County are males with 2 vehicles (318, accounting for 29.2%) and females with 2 vehicles (423, making up 31.8%).
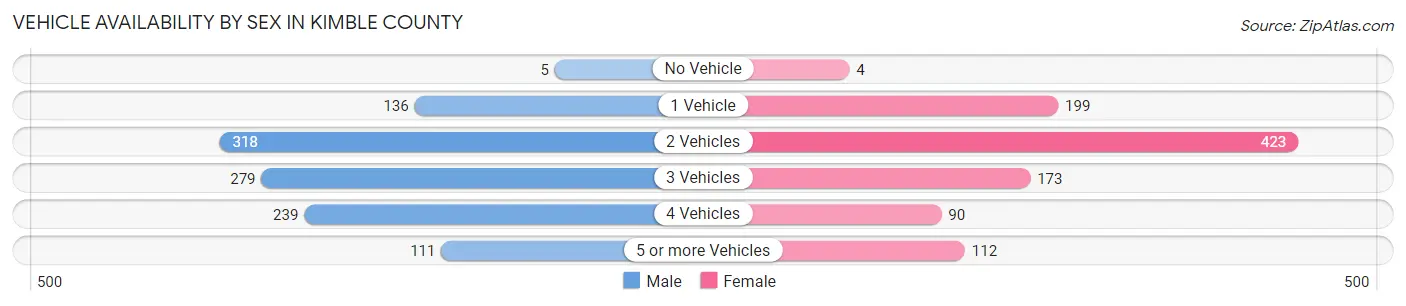
| Vehicles Available | Male | Female |
| No Vehicle | 5 (0.5%) | 4 (0.4%) |
| 1 Vehicle | 136 (12.5%) | 199 (19.9%) |
| 2 Vehicles | 318 (29.2%) | 423 (42.3%) |
| 3 Vehicles | 279 (25.6%) | 173 (17.3%) |
| 4 Vehicles | 239 (22.0%) | 90 (9.0%) |
| 5 or more Vehicles | 111 (10.2%) | 112 (11.2%) |
| Total | 1,088 (100.0%) | 1,001 (100.0%) |
Commute Time in Kimble County
The most frequently occuring commute durations in Kimble County are 5 to 9 minutes (459 commuters, 22.7%), less than 5 minutes (359 commuters, 17.7%), and 15 to 19 minutes (281 commuters, 13.9%).
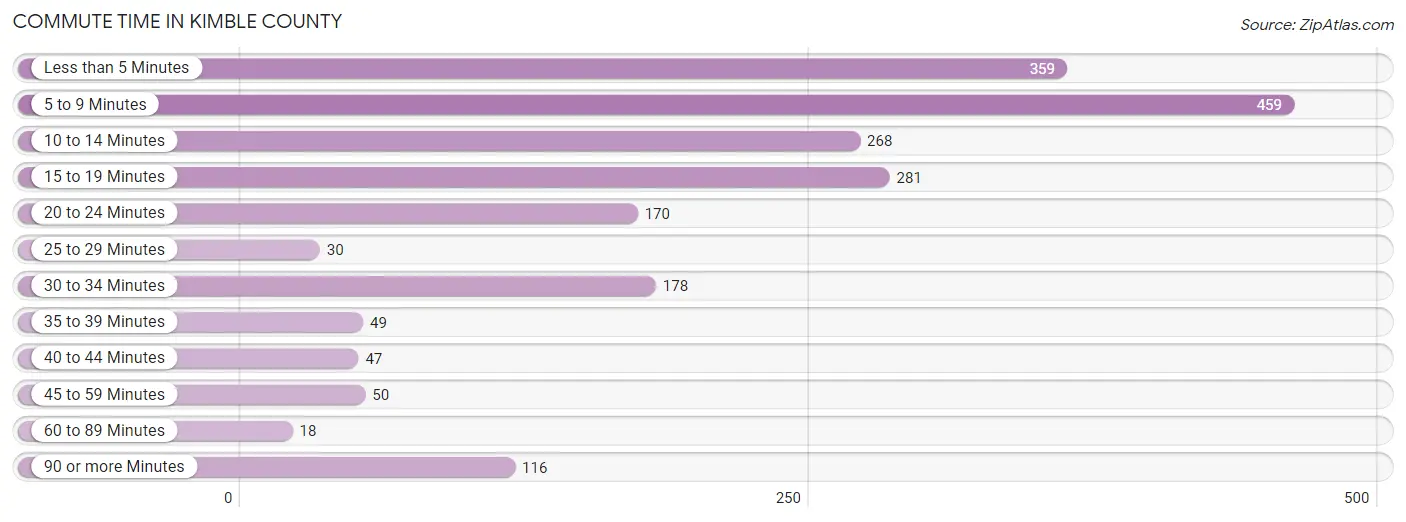
| Commute Time | # Commuters | % Commuters |
| Less than 5 Minutes | 359 | 17.7% |
| 5 to 9 Minutes | 459 | 22.7% |
| 10 to 14 Minutes | 268 | 13.2% |
| 15 to 19 Minutes | 281 | 13.9% |
| 20 to 24 Minutes | 170 | 8.4% |
| 25 to 29 Minutes | 30 | 1.5% |
| 30 to 34 Minutes | 178 | 8.8% |
| 35 to 39 Minutes | 49 | 2.4% |
| 40 to 44 Minutes | 47 | 2.3% |
| 45 to 59 Minutes | 50 | 2.5% |
| 60 to 89 Minutes | 18 | 0.9% |
| 90 or more Minutes | 116 | 5.7% |
Commute Time by Sex in Kimble County
The most common commute times in Kimble County are 15 to 19 minutes (261 commuters, 25.2%) for males and 5 to 9 minutes (250 commuters, 25.3%) for females.
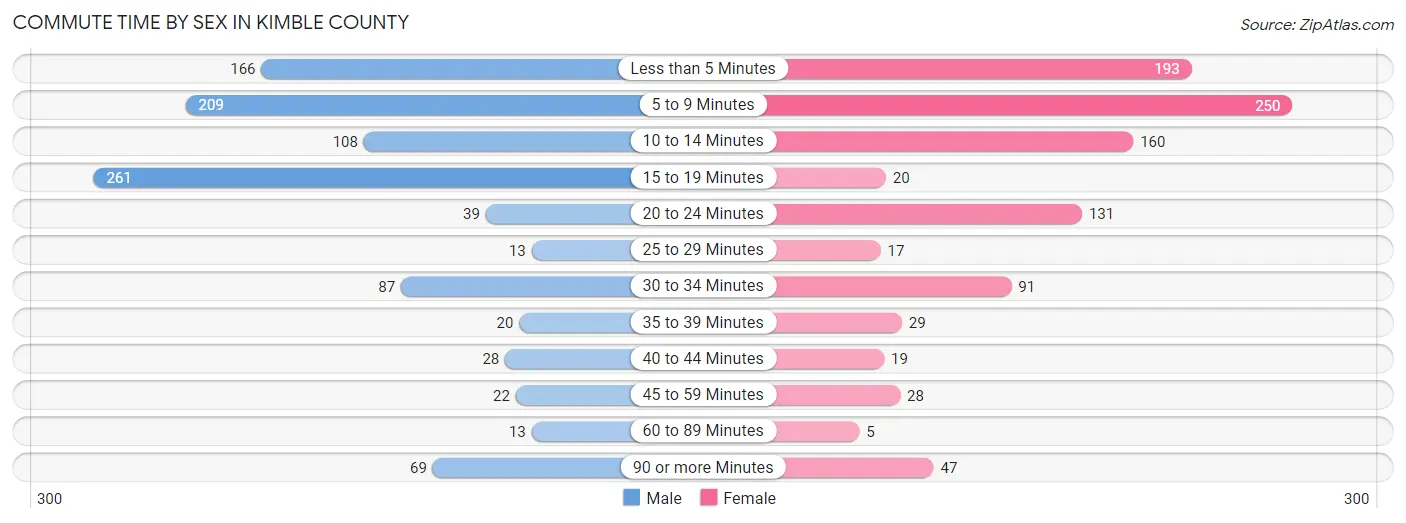
| Commute Time | Male | Female |
| Less than 5 Minutes | 166 (16.0%) | 193 (19.5%) |
| 5 to 9 Minutes | 209 (20.2%) | 250 (25.3%) |
| 10 to 14 Minutes | 108 (10.4%) | 160 (16.2%) |
| 15 to 19 Minutes | 261 (25.2%) | 20 (2.0%) |
| 20 to 24 Minutes | 39 (3.8%) | 131 (13.2%) |
| 25 to 29 Minutes | 13 (1.3%) | 17 (1.7%) |
| 30 to 34 Minutes | 87 (8.4%) | 91 (9.2%) |
| 35 to 39 Minutes | 20 (1.9%) | 29 (2.9%) |
| 40 to 44 Minutes | 28 (2.7%) | 19 (1.9%) |
| 45 to 59 Minutes | 22 (2.1%) | 28 (2.8%) |
| 60 to 89 Minutes | 13 (1.3%) | 5 (0.5%) |
| 90 or more Minutes | 69 (6.7%) | 47 (4.8%) |
Time of Departure to Work by Sex in Kimble County
The most frequent times of departure to work in Kimble County are 8:00 AM to 8:29 AM (172, 16.6%) for males and 8:00 AM to 8:29 AM (259, 26.2%) for females.
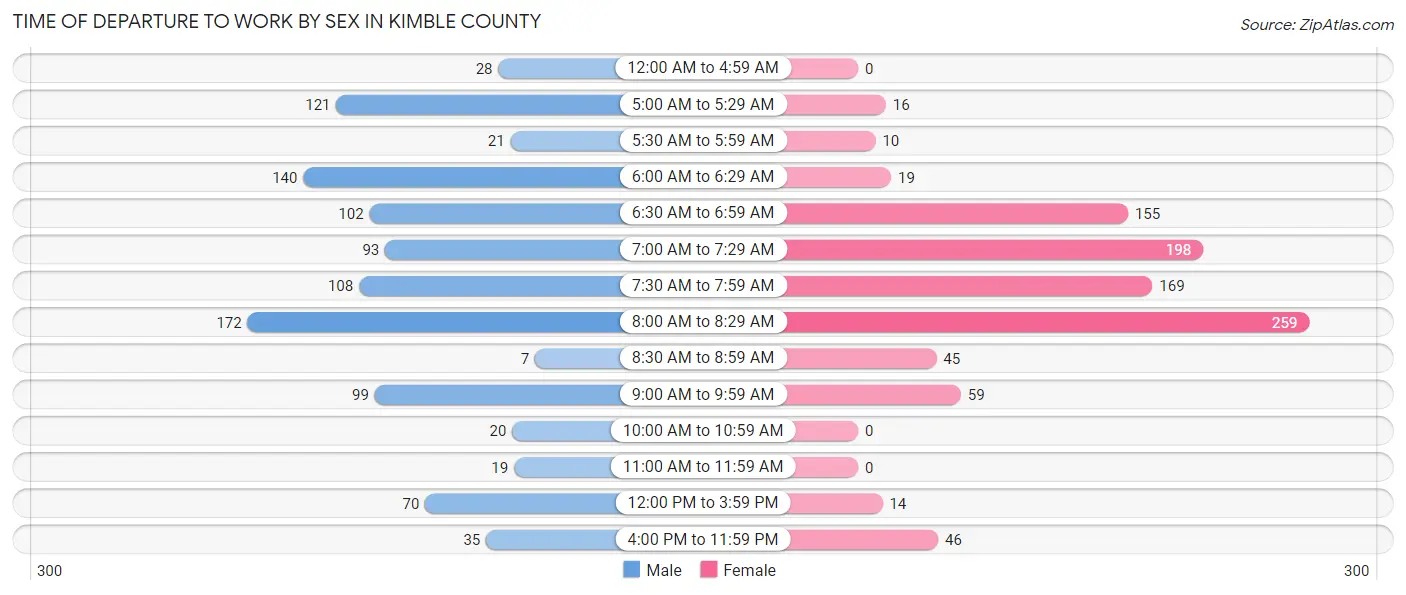
| Time of Departure | Male | Female |
| 12:00 AM to 4:59 AM | 28 (2.7%) | 0 (0.0%) |
| 5:00 AM to 5:29 AM | 121 (11.7%) | 16 (1.6%) |
| 5:30 AM to 5:59 AM | 21 (2.0%) | 10 (1.0%) |
| 6:00 AM to 6:29 AM | 140 (13.5%) | 19 (1.9%) |
| 6:30 AM to 6:59 AM | 102 (9.9%) | 155 (15.7%) |
| 7:00 AM to 7:29 AM | 93 (9.0%) | 198 (20.0%) |
| 7:30 AM to 7:59 AM | 108 (10.4%) | 169 (17.1%) |
| 8:00 AM to 8:29 AM | 172 (16.6%) | 259 (26.2%) |
| 8:30 AM to 8:59 AM | 7 (0.7%) | 45 (4.5%) |
| 9:00 AM to 9:59 AM | 99 (9.6%) | 59 (6.0%) |
| 10:00 AM to 10:59 AM | 20 (1.9%) | 0 (0.0%) |
| 11:00 AM to 11:59 AM | 19 (1.8%) | 0 (0.0%) |
| 12:00 PM to 3:59 PM | 70 (6.8%) | 14 (1.4%) |
| 4:00 PM to 11:59 PM | 35 (3.4%) | 46 (4.6%) |
| Total | 1,035 (100.0%) | 990 (100.0%) |
Housing Occupancy in Kimble County
Occupancy by Ownership in Kimble County
Of the total 1,715 dwellings in Kimble County, owner-occupied units account for 1,359 (79.2%), while renter-occupied units make up 356 (20.8%).
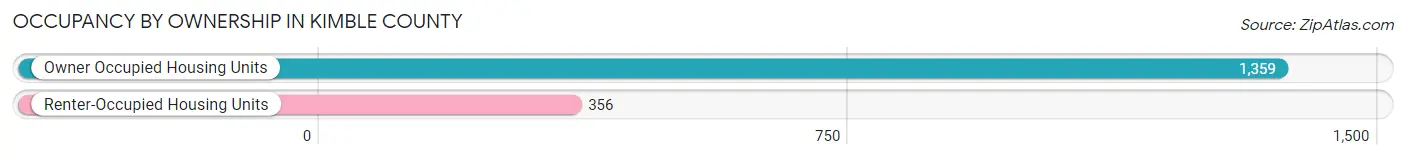
| Occupancy | # Housing Units | % Housing Units |
| Owner Occupied Housing Units | 1,359 | 79.2% |
| Renter-Occupied Housing Units | 356 | 20.8% |
| Total Occupied Housing Units | 1,715 | 100.0% |
Occupancy by Household Size in Kimble County
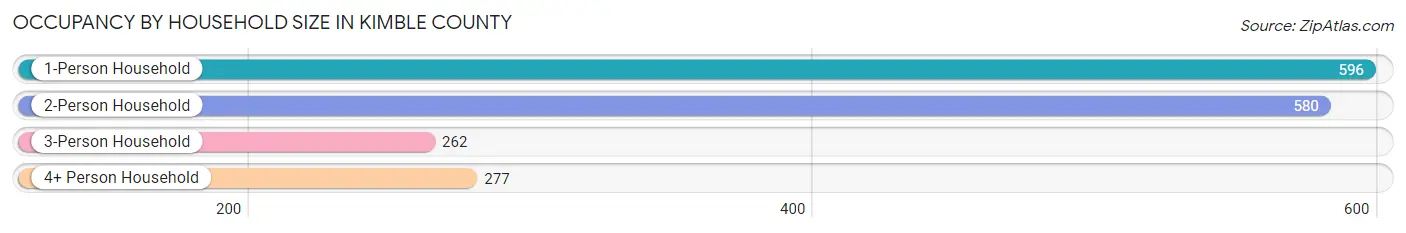
| Household Size | # Housing Units | % Housing Units |
| 1-Person Household | 596 | 34.7% |
| 2-Person Household | 580 | 33.8% |
| 3-Person Household | 262 | 15.3% |
| 4+ Person Household | 277 | 16.2% |
| Total Housing Units | 1,715 | 100.0% |
Occupancy by Ownership by Household Size in Kimble County
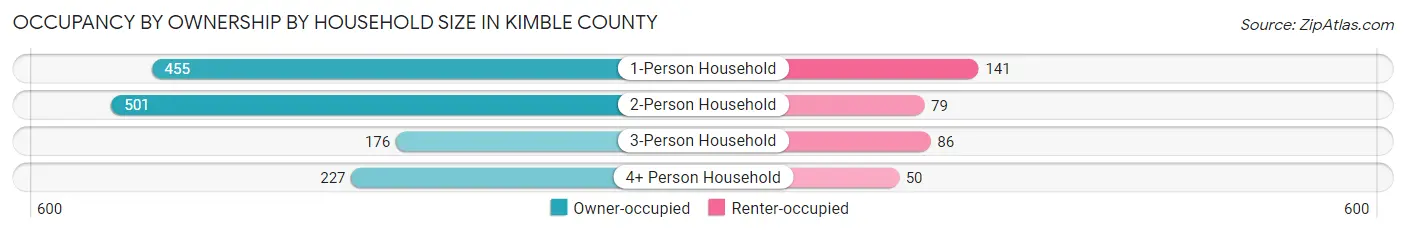
| Household Size | Owner-occupied | Renter-occupied |
| 1-Person Household | 455 (76.3%) | 141 (23.7%) |
| 2-Person Household | 501 (86.4%) | 79 (13.6%) |
| 3-Person Household | 176 (67.2%) | 86 (32.8%) |
| 4+ Person Household | 227 (82.0%) | 50 (18.0%) |
| Total Housing Units | 1,359 (79.2%) | 356 (20.8%) |
Occupancy by Educational Attainment in Kimble County
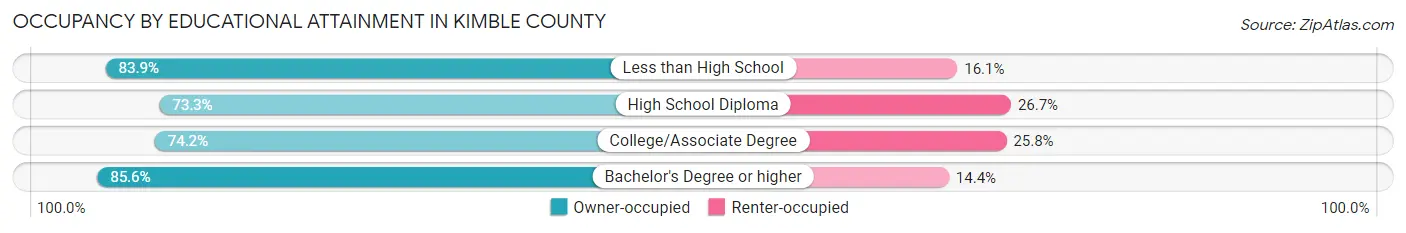
| Household Size | Owner-occupied | Renter-occupied |
| Less than High School | 261 (83.9%) | 50 (16.1%) |
| High School Diploma | 288 (73.3%) | 105 (26.7%) |
| College/Associate Degree | 359 (74.2%) | 125 (25.8%) |
| Bachelor's Degree or higher | 451 (85.6%) | 76 (14.4%) |
Occupancy by Age of Householder in Kimble County
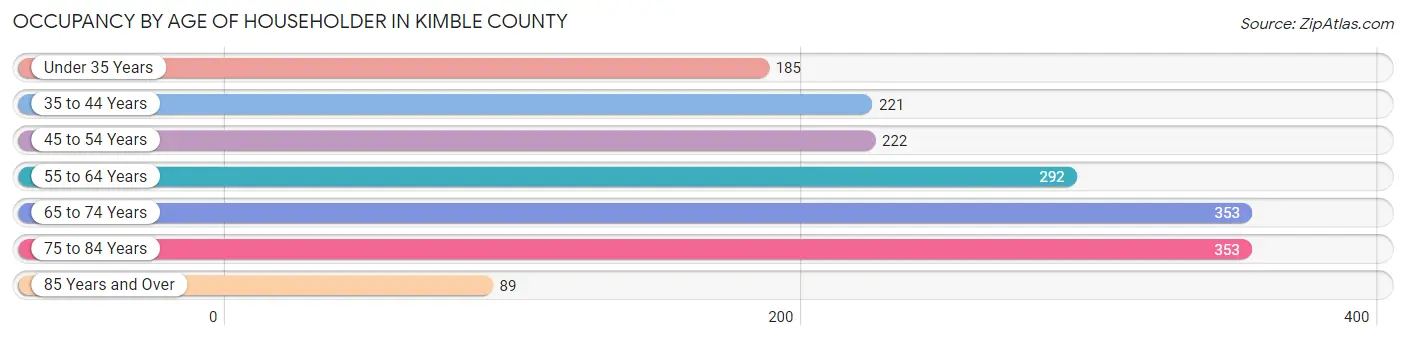
| Age Bracket | # Households | % Households |
| Under 35 Years | 185 | 10.8% |
| 35 to 44 Years | 221 | 12.9% |
| 45 to 54 Years | 222 | 12.9% |
| 55 to 64 Years | 292 | 17.0% |
| 65 to 74 Years | 353 | 20.6% |
| 75 to 84 Years | 353 | 20.6% |
| 85 Years and Over | 89 | 5.2% |
| Total | 1,715 | 100.0% |
Housing Finances in Kimble County
Median Income by Occupancy in Kimble County
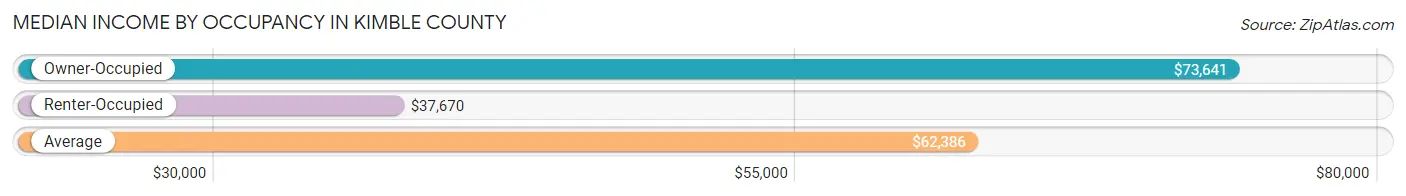
| Occupancy Type | # Households | Median Income |
| Owner-Occupied | 1,359 (79.2%) | $73,641 |
| Renter-Occupied | 356 (20.8%) | $37,670 |
| Average | 1,715 (100.0%) | $62,386 |
Occupancy by Householder Income Bracket in Kimble County
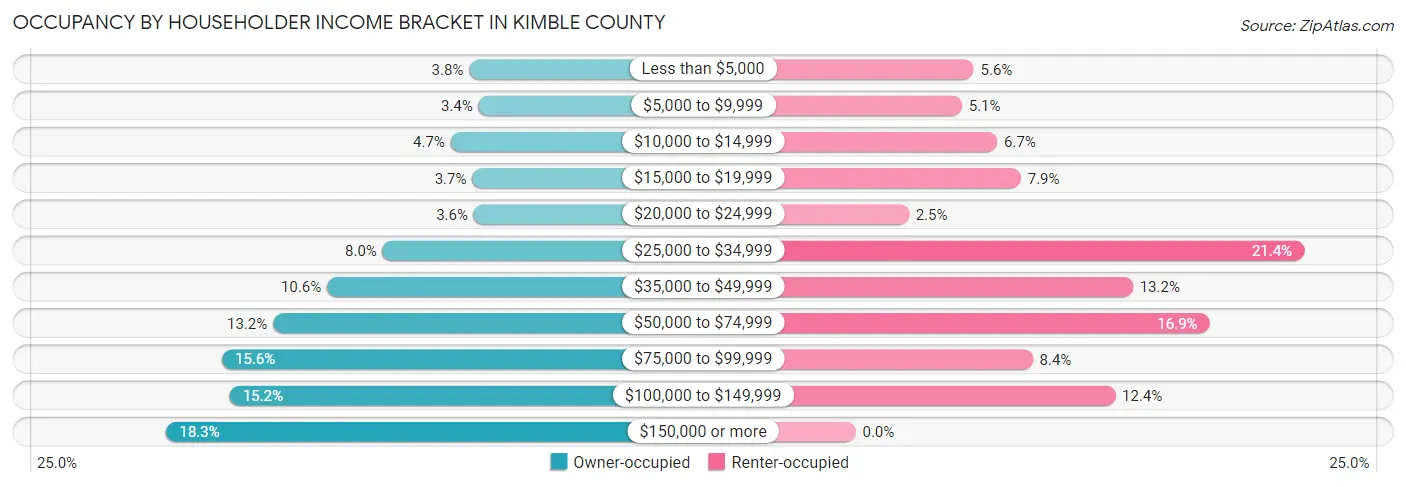
| Income Bracket | Owner-occupied | Renter-occupied |
| Less than $5,000 | 52 (3.8%) | 20 (5.6%) |
| $5,000 to $9,999 | 46 (3.4%) | 18 (5.1%) |
| $10,000 to $14,999 | 64 (4.7%) | 24 (6.7%) |
| $15,000 to $19,999 | 50 (3.7%) | 28 (7.9%) |
| $20,000 to $24,999 | 49 (3.6%) | 9 (2.5%) |
| $25,000 to $34,999 | 108 (8.0%) | 76 (21.3%) |
| $35,000 to $49,999 | 144 (10.6%) | 47 (13.2%) |
| $50,000 to $74,999 | 179 (13.2%) | 60 (16.9%) |
| $75,000 to $99,999 | 212 (15.6%) | 30 (8.4%) |
| $100,000 to $149,999 | 207 (15.2%) | 44 (12.4%) |
| $150,000 or more | 248 (18.2%) | 0 (0.0%) |
| Total | 1,359 (100.0%) | 356 (100.0%) |
Monthly Housing Cost Tiers in Kimble County
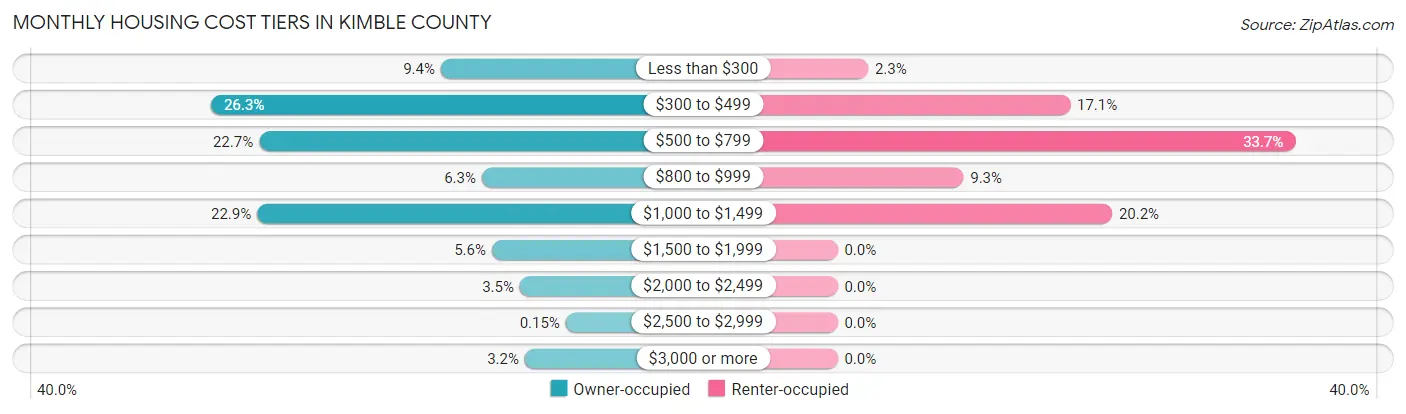
| Monthly Cost | Owner-occupied | Renter-occupied |
| Less than $300 | 127 (9.3%) | 8 (2.2%) |
| $300 to $499 | 357 (26.3%) | 61 (17.1%) |
| $500 to $799 | 309 (22.7%) | 120 (33.7%) |
| $800 to $999 | 86 (6.3%) | 33 (9.3%) |
| $1,000 to $1,499 | 311 (22.9%) | 72 (20.2%) |
| $1,500 to $1,999 | 76 (5.6%) | 0 (0.0%) |
| $2,000 to $2,499 | 48 (3.5%) | 0 (0.0%) |
| $2,500 to $2,999 | 2 (0.2%) | 0 (0.0%) |
| $3,000 or more | 43 (3.2%) | 0 (0.0%) |
| Total | 1,359 (100.0%) | 356 (100.0%) |
Physical Housing Characteristics in Kimble County
Housing Structures in Kimble County
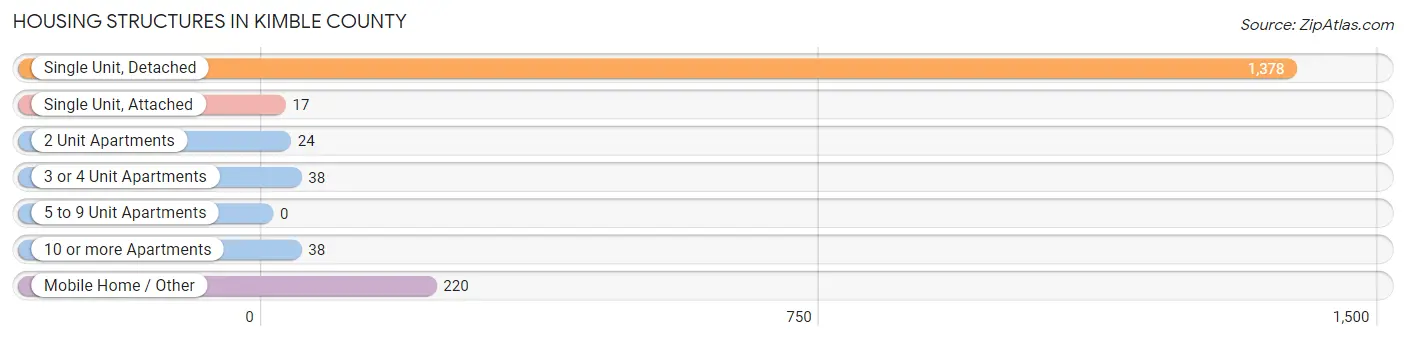
| Structure Type | # Housing Units | % Housing Units |
| Single Unit, Detached | 1,378 | 80.3% |
| Single Unit, Attached | 17 | 1.0% |
| 2 Unit Apartments | 24 | 1.4% |
| 3 or 4 Unit Apartments | 38 | 2.2% |
| 5 to 9 Unit Apartments | 0 | 0.0% |
| 10 or more Apartments | 38 | 2.2% |
| Mobile Home / Other | 220 | 12.8% |
| Total | 1,715 | 100.0% |
Housing Structures by Occupancy in Kimble County
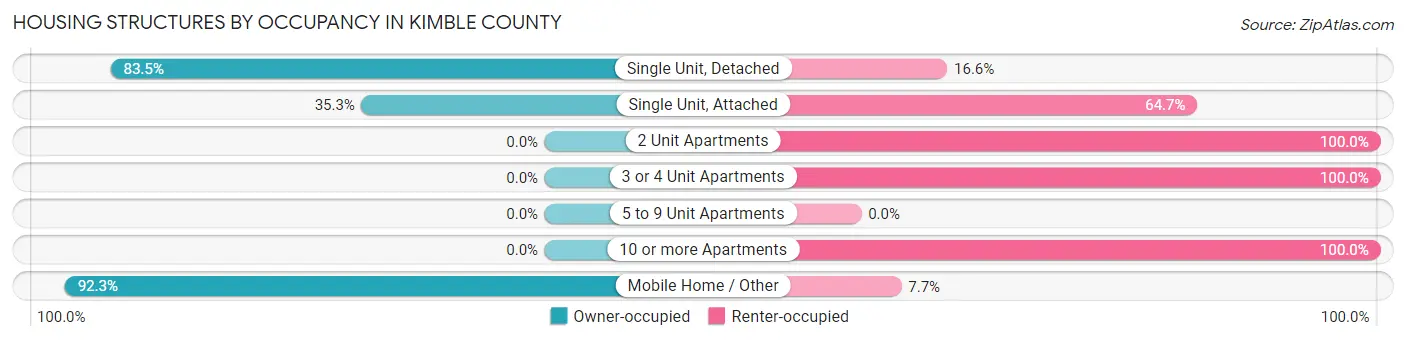
| Structure Type | Owner-occupied | Renter-occupied |
| Single Unit, Detached | 1,150 (83.5%) | 228 (16.6%) |
| Single Unit, Attached | 6 (35.3%) | 11 (64.7%) |
| 2 Unit Apartments | 0 (0.0%) | 24 (100.0%) |
| 3 or 4 Unit Apartments | 0 (0.0%) | 38 (100.0%) |
| 5 to 9 Unit Apartments | 0 (0.0%) | 0 (0.0%) |
| 10 or more Apartments | 0 (0.0%) | 38 (100.0%) |
| Mobile Home / Other | 203 (92.3%) | 17 (7.7%) |
| Total | 1,359 (79.2%) | 356 (20.8%) |
Housing Structures by Number of Rooms in Kimble County
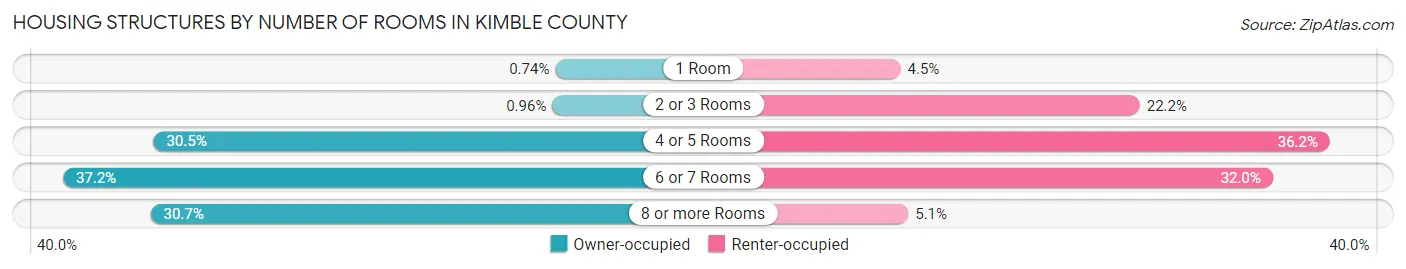
| Number of Rooms | Owner-occupied | Renter-occupied |
| 1 Room | 10 (0.7%) | 16 (4.5%) |
| 2 or 3 Rooms | 13 (1.0%) | 79 (22.2%) |
| 4 or 5 Rooms | 414 (30.5%) | 129 (36.2%) |
| 6 or 7 Rooms | 505 (37.2%) | 114 (32.0%) |
| 8 or more Rooms | 417 (30.7%) | 18 (5.1%) |
| Total | 1,359 (100.0%) | 356 (100.0%) |
Housing Structure by Heating Type in Kimble County
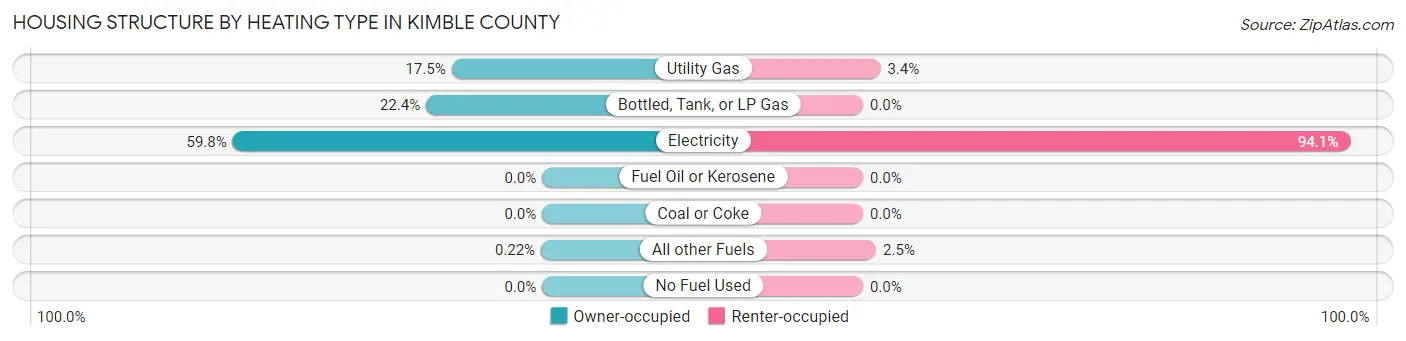
| Heating Type | Owner-occupied | Renter-occupied |
| Utility Gas | 238 (17.5%) | 12 (3.4%) |
| Bottled, Tank, or LP Gas | 305 (22.4%) | 0 (0.0%) |
| Electricity | 813 (59.8%) | 335 (94.1%) |
| Fuel Oil or Kerosene | 0 (0.0%) | 0 (0.0%) |
| Coal or Coke | 0 (0.0%) | 0 (0.0%) |
| All other Fuels | 3 (0.2%) | 9 (2.5%) |
| No Fuel Used | 0 (0.0%) | 0 (0.0%) |
| Total | 1,359 (100.0%) | 356 (100.0%) |
Household Vehicle Usage in Kimble County
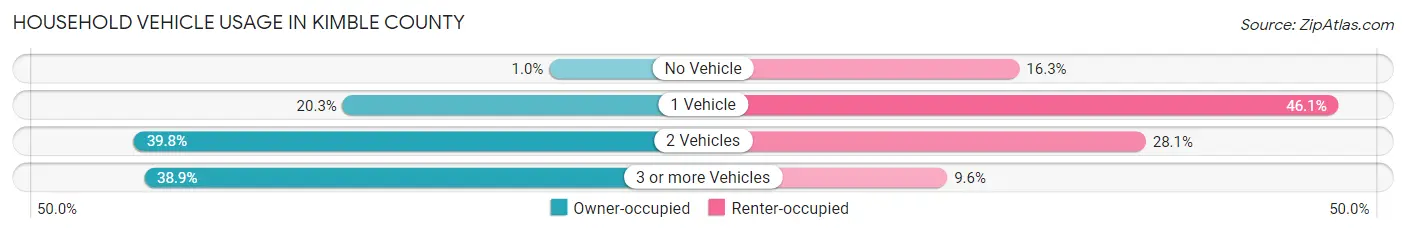
| Vehicles per Household | Owner-occupied | Renter-occupied |
| No Vehicle | 14 (1.0%) | 58 (16.3%) |
| 1 Vehicle | 276 (20.3%) | 164 (46.1%) |
| 2 Vehicles | 541 (39.8%) | 100 (28.1%) |
| 3 or more Vehicles | 528 (38.9%) | 34 (9.6%) |
| Total | 1,359 (100.0%) | 356 (100.0%) |
Real Estate & Mortgages in Kimble County
Real Estate and Mortgage Overview in Kimble County
| Characteristic | Without Mortgage | With Mortgage |
| Housing Units | 1,005 | 354 |
| Median Property Value | $162,500 | $244,000 |
| Median Household Income | $62,917 | $73 |
| Monthly Housing Costs | $528 | $43 |
| Real Estate Taxes | $1,874 | $7 |
Property Value by Mortgage Status in Kimble County
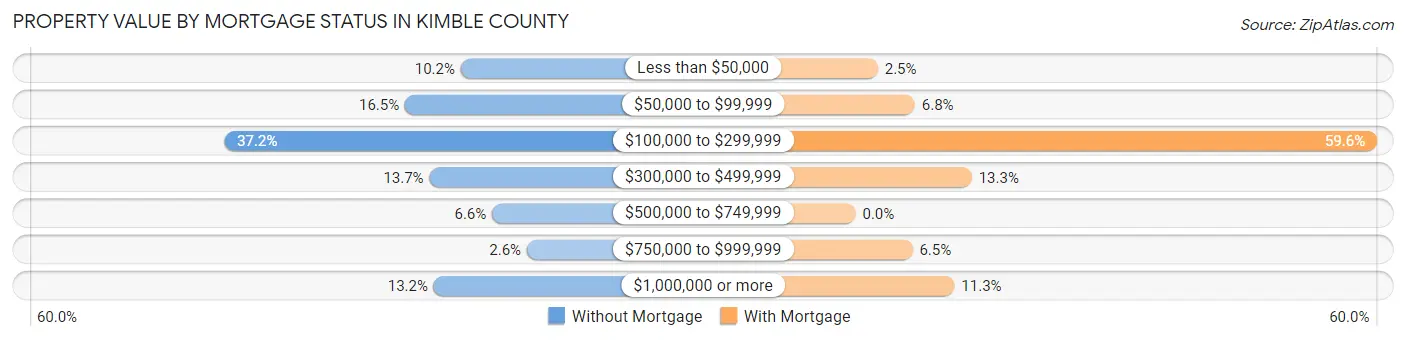
| Property Value | Without Mortgage | With Mortgage |
| Less than $50,000 | 102 (10.2%) | 9 (2.5%) |
| $50,000 to $99,999 | 166 (16.5%) | 24 (6.8%) |
| $100,000 to $299,999 | 374 (37.2%) | 211 (59.6%) |
| $300,000 to $499,999 | 138 (13.7%) | 47 (13.3%) |
| $500,000 to $749,999 | 66 (6.6%) | 0 (0.0%) |
| $750,000 to $999,999 | 26 (2.6%) | 23 (6.5%) |
| $1,000,000 or more | 133 (13.2%) | 40 (11.3%) |
| Total | 1,005 (100.0%) | 354 (100.0%) |
Household Income by Mortgage Status in Kimble County
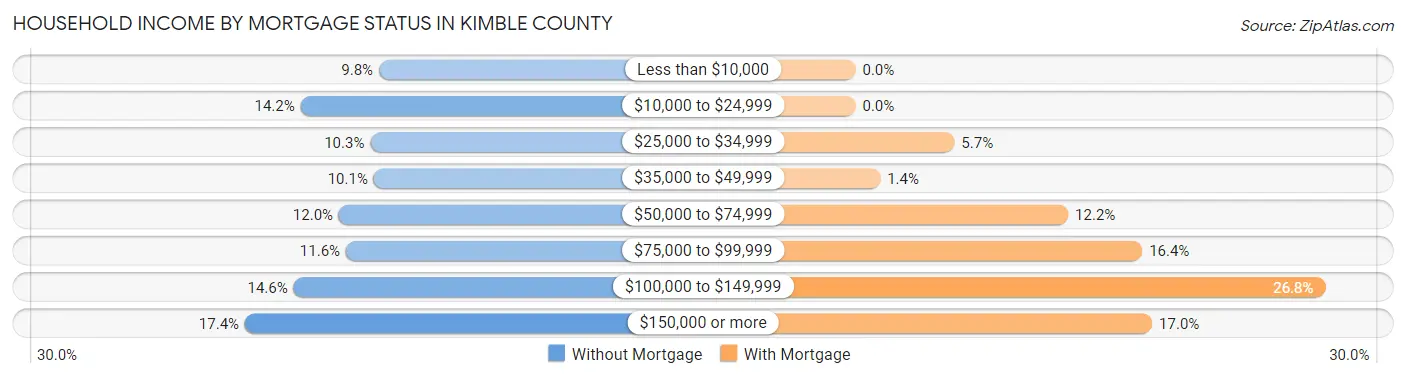
| Household Income | Without Mortgage | With Mortgage |
| Less than $10,000 | 98 (9.8%) | 0 (0.0%) |
| $10,000 to $24,999 | 143 (14.2%) | 0 (0.0%) |
| $25,000 to $34,999 | 103 (10.2%) | 20 (5.7%) |
| $35,000 to $49,999 | 101 (10.1%) | 5 (1.4%) |
| $50,000 to $74,999 | 121 (12.0%) | 43 (12.1%) |
| $75,000 to $99,999 | 117 (11.6%) | 58 (16.4%) |
| $100,000 to $149,999 | 147 (14.6%) | 95 (26.8%) |
| $150,000 or more | 175 (17.4%) | 60 (17.0%) |
| Total | 1,005 (100.0%) | 354 (100.0%) |
Property Value to Household Income Ratio in Kimble County
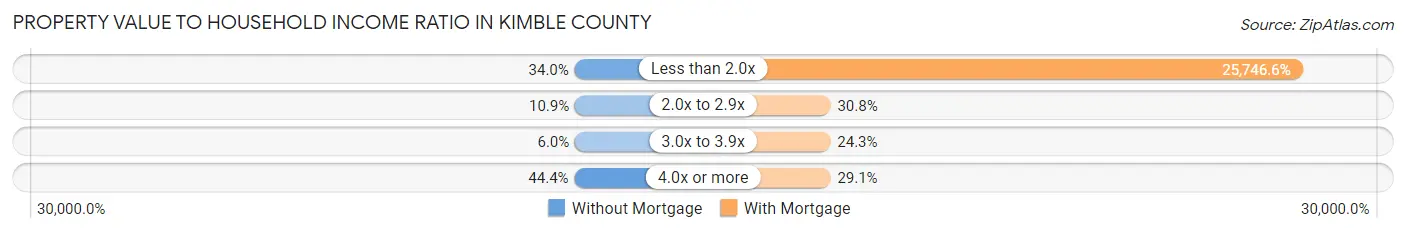
| Value-to-Income Ratio | Without Mortgage | With Mortgage |
| Less than 2.0x | 342 (34.0%) | 91,143 (25,746.6%) |
| 2.0x to 2.9x | 109 (10.8%) | 109 (30.8%) |
| 3.0x to 3.9x | 60 (6.0%) | 86 (24.3%) |
| 4.0x or more | 446 (44.4%) | 103 (29.1%) |
| Total | 1,005 (100.0%) | 354 (100.0%) |
Real Estate Taxes by Mortgage Status in Kimble County
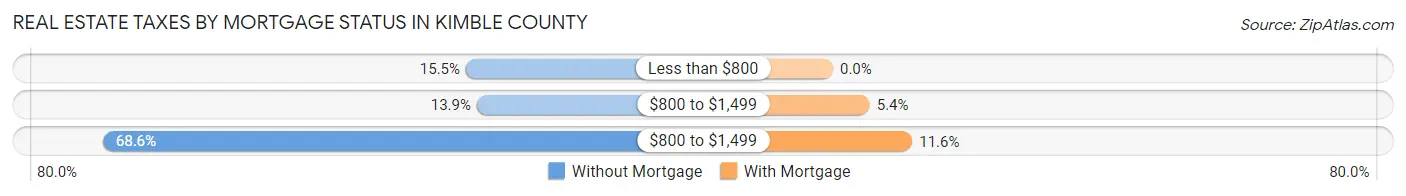
| Property Taxes | Without Mortgage | With Mortgage |
| Less than $800 | 156 (15.5%) | 0 (0.0%) |
| $800 to $1,499 | 140 (13.9%) | 19 (5.4%) |
| $800 to $1,499 | 689 (68.6%) | 41 (11.6%) |
| Total | 1,005 (100.0%) | 354 (100.0%) |
Health & Disability in Kimble County
Health Insurance Coverage by Age in Kimble County
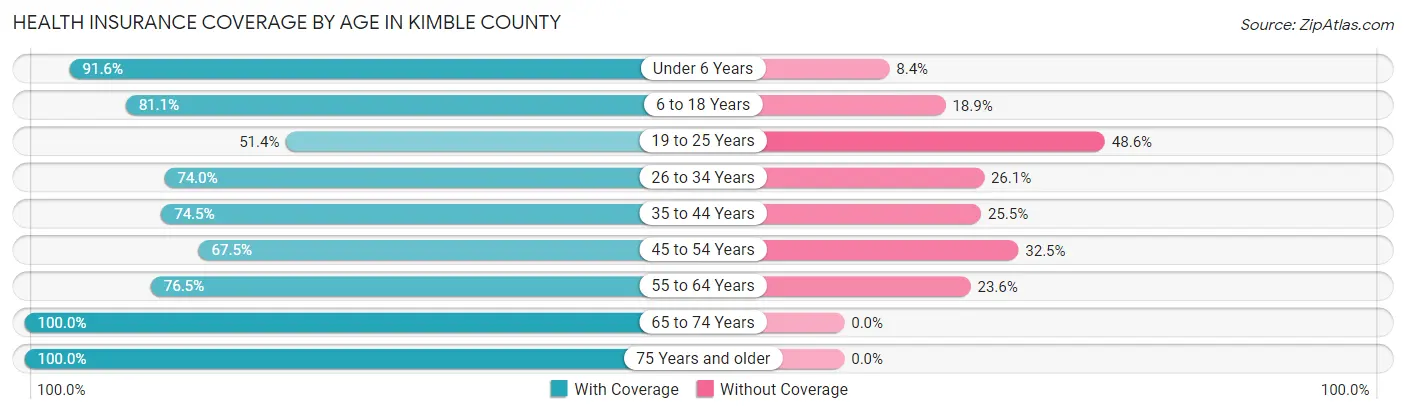
| Age Bracket | With Coverage | Without Coverage |
| Under 6 Years | 218 (91.6%) | 20 (8.4%) |
| 6 to 18 Years | 589 (81.1%) | 137 (18.9%) |
| 19 to 25 Years | 110 (51.4%) | 104 (48.6%) |
| 26 to 34 Years | 247 (74.0%) | 87 (26.1%) |
| 35 to 44 Years | 371 (74.5%) | 127 (25.5%) |
| 45 to 54 Years | 310 (67.5%) | 149 (32.5%) |
| 55 to 64 Years | 461 (76.4%) | 142 (23.5%) |
| 65 to 74 Years | 711 (100.0%) | 0 (0.0%) |
| 75 Years and older | 498 (100.0%) | 0 (0.0%) |
| Total | 3,515 (82.1%) | 766 (17.9%) |
Health Insurance Coverage by Citizenship Status in Kimble County
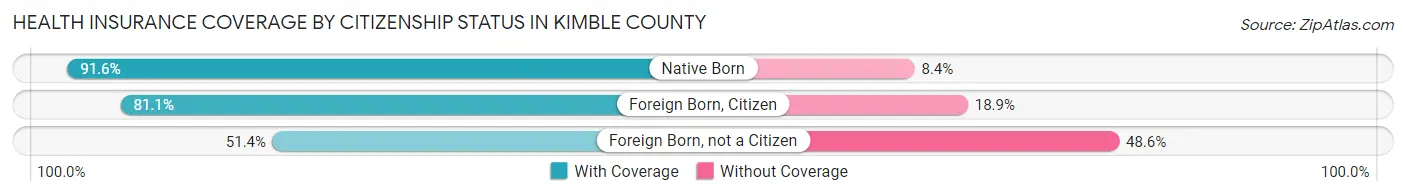
| Citizenship Status | With Coverage | Without Coverage |
| Native Born | 218 (91.6%) | 20 (8.4%) |
| Foreign Born, Citizen | 589 (81.1%) | 137 (18.9%) |
| Foreign Born, not a Citizen | 110 (51.4%) | 104 (48.6%) |
Health Insurance Coverage by Household Income in Kimble County
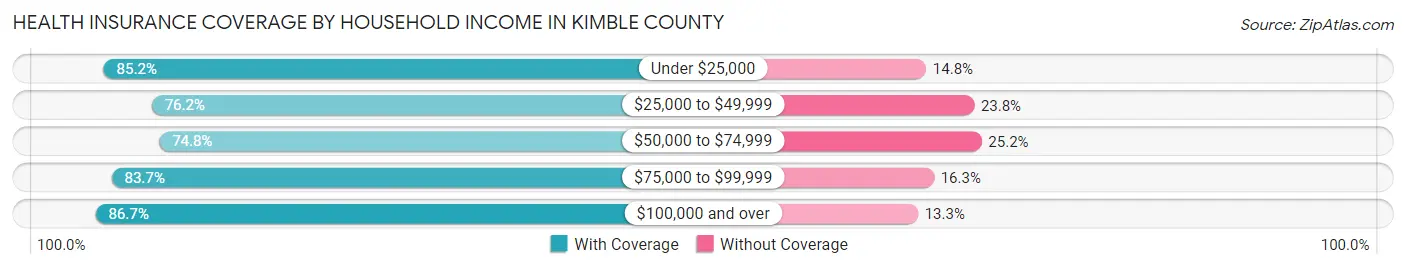
| Household Income | With Coverage | Without Coverage |
| Under $25,000 | 454 (85.2%) | 79 (14.8%) |
| $25,000 to $49,999 | 694 (76.2%) | 217 (23.8%) |
| $50,000 to $74,999 | 433 (74.8%) | 146 (25.2%) |
| $75,000 to $99,999 | 668 (83.7%) | 130 (16.3%) |
| $100,000 and over | 1,266 (86.7%) | 194 (13.3%) |
Public vs Private Health Insurance Coverage by Age in Kimble County
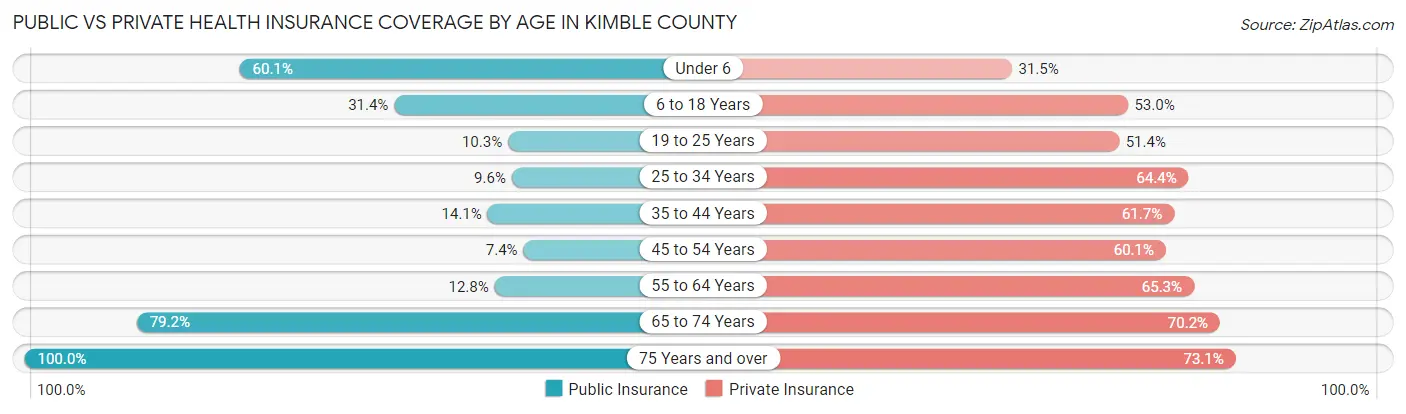
| Age Bracket | Public Insurance | Private Insurance |
| Under 6 | 143 (60.1%) | 75 (31.5%) |
| 6 to 18 Years | 228 (31.4%) | 385 (53.0%) |
| 19 to 25 Years | 22 (10.3%) | 110 (51.4%) |
| 25 to 34 Years | 32 (9.6%) | 215 (64.4%) |
| 35 to 44 Years | 70 (14.1%) | 307 (61.7%) |
| 45 to 54 Years | 34 (7.4%) | 276 (60.1%) |
| 55 to 64 Years | 77 (12.8%) | 394 (65.3%) |
| 65 to 74 Years | 563 (79.2%) | 499 (70.2%) |
| 75 Years and over | 498 (100.0%) | 364 (73.1%) |
| Total | 1,667 (38.9%) | 2,625 (61.3%) |
Disability Status by Sex by Age in Kimble County
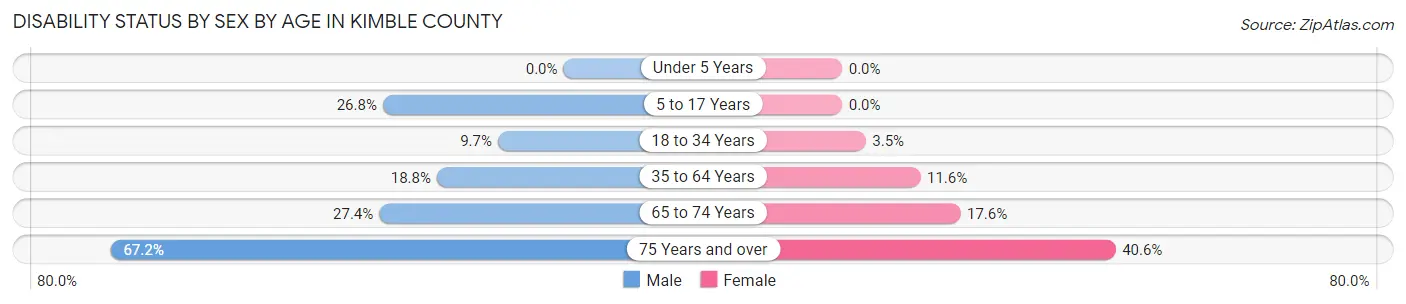
| Age Bracket | Male | Female |
| Under 5 Years | 0 (0.0%) | 0 (0.0%) |
| 5 to 17 Years | 103 (26.8%) | 0 (0.0%) |
| 18 to 34 Years | 33 (9.7%) | 12 (3.5%) |
| 35 to 64 Years | 146 (18.8%) | 91 (11.6%) |
| 65 to 74 Years | 87 (27.4%) | 69 (17.6%) |
| 75 Years and over | 156 (67.2%) | 108 (40.6%) |
Disability Class by Sex by Age in Kimble County
Disability Class: Hearing Difficulty
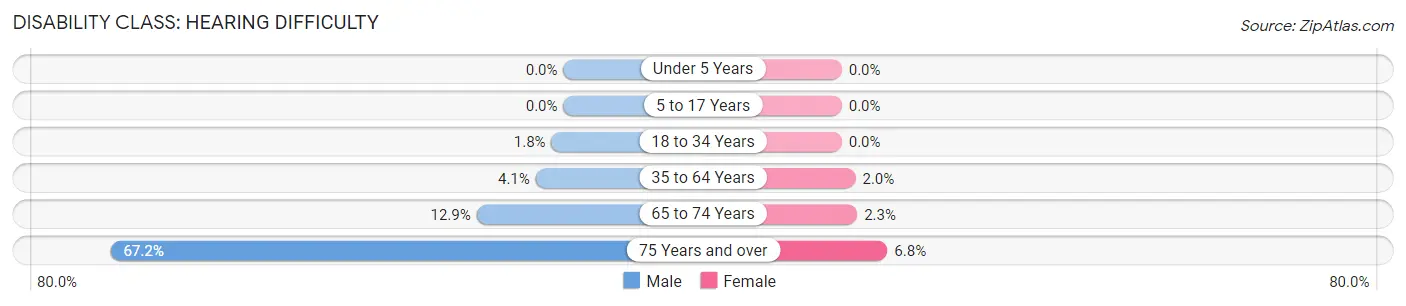
| Age Bracket | Male | Female |
| Under 5 Years | 0 (0.0%) | 0 (0.0%) |
| 5 to 17 Years | 0 (0.0%) | 0 (0.0%) |
| 18 to 34 Years | 6 (1.8%) | 0 (0.0%) |
| 35 to 64 Years | 32 (4.1%) | 16 (2.0%) |
| 65 to 74 Years | 41 (12.9%) | 9 (2.3%) |
| 75 Years and over | 156 (67.2%) | 18 (6.8%) |
Disability Class: Vision Difficulty
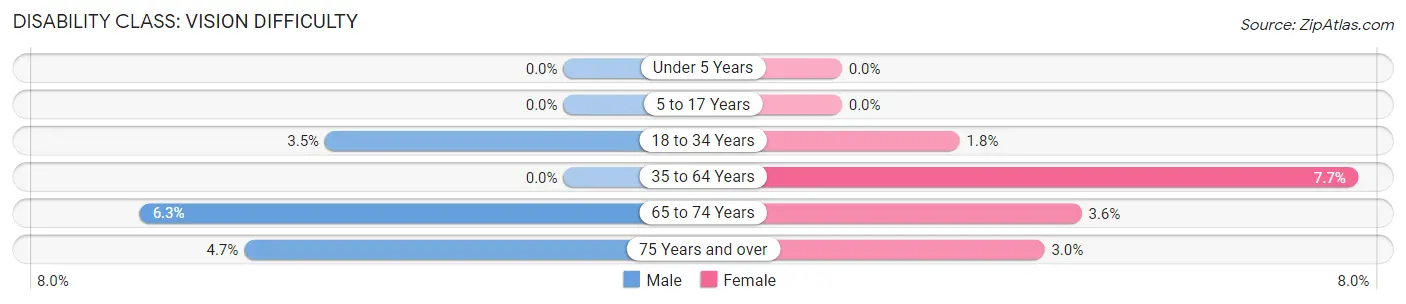
| Age Bracket | Male | Female |
| Under 5 Years | 0 (0.0%) | 0 (0.0%) |
| 5 to 17 Years | 0 (0.0%) | 0 (0.0%) |
| 18 to 34 Years | 12 (3.5%) | 6 (1.8%) |
| 35 to 64 Years | 0 (0.0%) | 60 (7.7%) |
| 65 to 74 Years | 20 (6.3%) | 14 (3.6%) |
| 75 Years and over | 11 (4.7%) | 8 (3.0%) |
Disability Class: Cognitive Difficulty
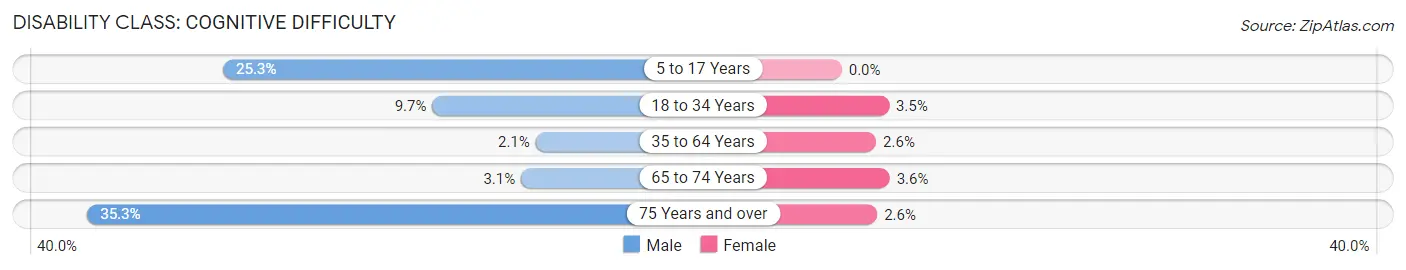
| Age Bracket | Male | Female |
| 5 to 17 Years | 97 (25.3%) | 0 (0.0%) |
| 18 to 34 Years | 33 (9.7%) | 12 (3.5%) |
| 35 to 64 Years | 16 (2.1%) | 20 (2.5%) |
| 65 to 74 Years | 10 (3.1%) | 14 (3.6%) |
| 75 Years and over | 82 (35.3%) | 7 (2.6%) |
Disability Class: Ambulatory Difficulty
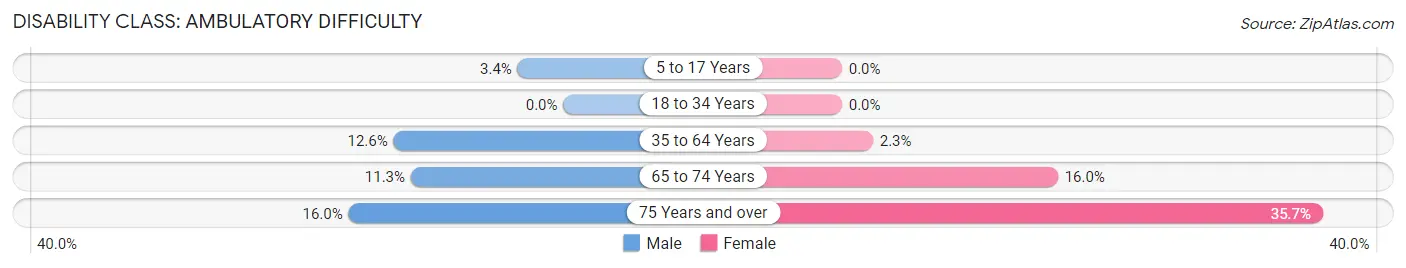
| Age Bracket | Male | Female |
| 5 to 17 Years | 13 (3.4%) | 0 (0.0%) |
| 18 to 34 Years | 0 (0.0%) | 0 (0.0%) |
| 35 to 64 Years | 98 (12.6%) | 18 (2.3%) |
| 65 to 74 Years | 36 (11.3%) | 63 (16.0%) |
| 75 Years and over | 37 (16.0%) | 95 (35.7%) |
Disability Class: Self-Care Difficulty
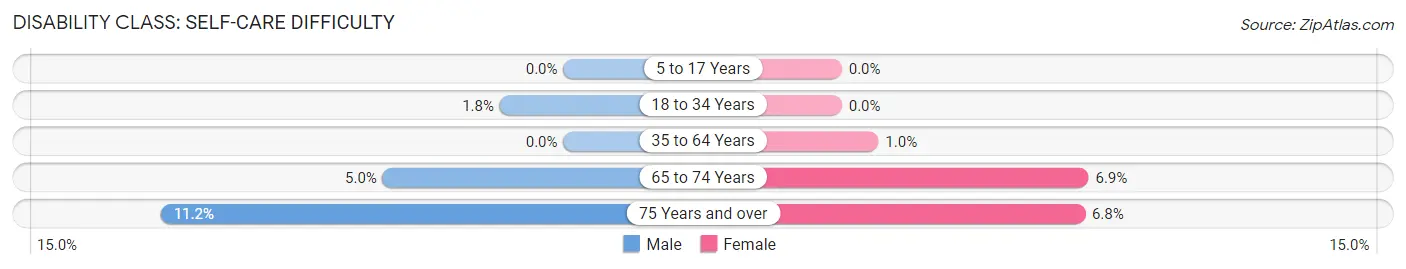
| Age Bracket | Male | Female |
| 5 to 17 Years | 0 (0.0%) | 0 (0.0%) |
| 18 to 34 Years | 6 (1.8%) | 0 (0.0%) |
| 35 to 64 Years | 0 (0.0%) | 8 (1.0%) |
| 65 to 74 Years | 16 (5.0%) | 27 (6.9%) |
| 75 Years and over | 26 (11.2%) | 18 (6.8%) |
Technology Access in Kimble County
Computing Device Access in Kimble County
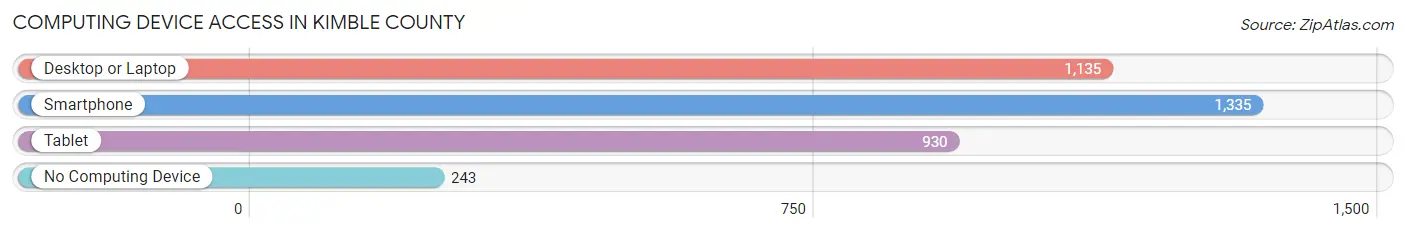
| Device Type | # Households | % Households |
| Desktop or Laptop | 1,135 | 66.2% |
| Smartphone | 1,335 | 77.8% |
| Tablet | 930 | 54.2% |
| No Computing Device | 243 | 14.2% |
| Total | 1,715 | 100.0% |
Internet Access in Kimble County
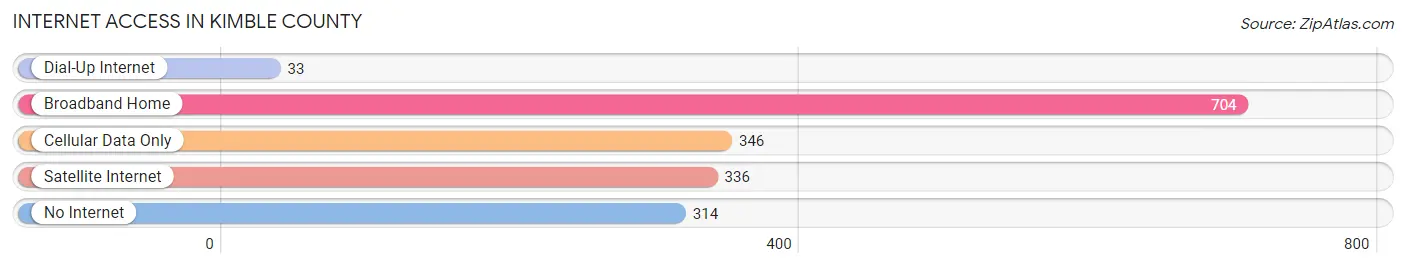
| Internet Type | # Households | % Households |
| Dial-Up Internet | 33 | 1.9% |
| Broadband Home | 704 | 41.0% |
| Cellular Data Only | 346 | 20.2% |
| Satellite Internet | 336 | 19.6% |
| No Internet | 314 | 18.3% |
| Total | 1,715 | 100.0% |
Kimble County Summary
Kimble County is located in the heart of the Texas Hill Country, in the southwestern part of the state. It is bordered by Mason County to the north, Menard County to the east, Sutton County to the south, and Edwards County to the west. The county seat is Junction, and the county is named for George C. Kimble, a Texas Ranger and Confederate soldier.
History
The area that is now Kimble County was first inhabited by Native Americans, including the Tonkawa, Lipan Apache, and Comanche tribes. The first Europeans to explore the area were Spanish missionaries and explorers in the late 1700s. The area was part of the Comancheria, a vast area of land that was home to the Comanche people.
In 1858, the Texas Legislature created Kimble County from parts of Bexar, Gillespie, and Mason counties. The county was named for George C. Kimble, a Texas Ranger and Confederate soldier. The county seat was originally located in Denning, but was moved to Junction in 1876.
Geography
Kimble County covers an area of 1,072 square miles, making it the second-largest county in Texas. The terrain is mostly hilly, with elevations ranging from 1,000 to 2,000 feet. The county is located in the Edwards Plateau region of the Texas Hill Country, and is home to several rivers and creeks, including the Llano, San Saba, and Colorado rivers.
The county is home to several state parks, including Enchanted Rock State Natural Area, South Llano River State Park, and Colorado Bend State Park. The county is also home to several wildlife management areas, including the Mason Mountain Wildlife Management Area and the Mason Mountain State Natural Area.
Economy
Kimble County has a diverse economy, with a mix of agriculture, manufacturing, and tourism. The county is home to several large ranches, and the agricultural sector is the largest employer in the county. Cattle, sheep, goats, and horses are the main livestock raised in the county.
The manufacturing sector is also an important part of the economy, with several companies located in the county. The largest employer in the county is the Kimble County Correctional Facility, which employs over 500 people.
Tourism is also an important part of the economy, with several state parks and wildlife management areas located in the county. Hunting, fishing, and camping are popular activities in the county, and the county is home to several wineries and vineyards.
Demographics
As of the 2010 census, Kimble County had a population of 4,607. The population is mostly white (90.2%), with small percentages of Hispanic (7.2%), African American (1.2%), and Native American (0.7%) residents. The median household income is $41,945, and the median age is 44.
Kimble County is a rural county, with only one incorporated town, Junction. The county is served by two school districts, the Junction Independent School District and the Kimble County Independent School District. The county is also home to several private schools, including the Junction Christian Academy and the Junction Montessori School.
Common Questions
What is Per Capita Income in Kimble County?
Per Capita income in Kimble County is $39,045.
What is the Median Family Income in Kimble County?
Median Family Income in Kimble County is $82,852.
What is the Median Household income in Kimble County?
Median Household Income in Kimble County is $62,386.
What is Income or Wage Gap in Kimble County?
Income or Wage Gap in Kimble County is 38.3%.
Women in Kimble County earn 61.7 cents for every dollar earned by a man.
What is Inequality or Gini Index in Kimble County?
Inequality or Gini Index in Kimble County is 0.52.
What is the Total Population of Kimble County?
Total Population of Kimble County is 4,316.
What is the Total Male Population of Kimble County?
Total Male Population of Kimble County is 2,161.
What is the Total Female Population of Kimble County?
Total Female Population of Kimble County is 2,155.
What is the Ratio of Males per 100 Females in Kimble County?
There are 100.28 Males per 100 Females in Kimble County.
What is the Ratio of Females per 100 Males in Kimble County?
There are 99.72 Females per 100 Males in Kimble County.
What is the Median Population Age in Kimble County?
Median Population Age in Kimble County is 48.4 Years.
What is the Average Family Size in Kimble County
Average Family Size in Kimble County is 3.2 People.
What is the Average Household Size in Kimble County
Average Household Size in Kimble County is 2.5 People.
How Large is the Labor Force in Kimble County?
There are 2,118 People in the Labor Forcein in Kimble County.
What is the Percentage of People in the Labor Force in Kimble County?
59.4% of People are in the Labor Force in Kimble County.
What is the Unemployment Rate in Kimble County?
Unemployment Rate in Kimble County is 0.8%.