Kerr County, TX Map & Demographics
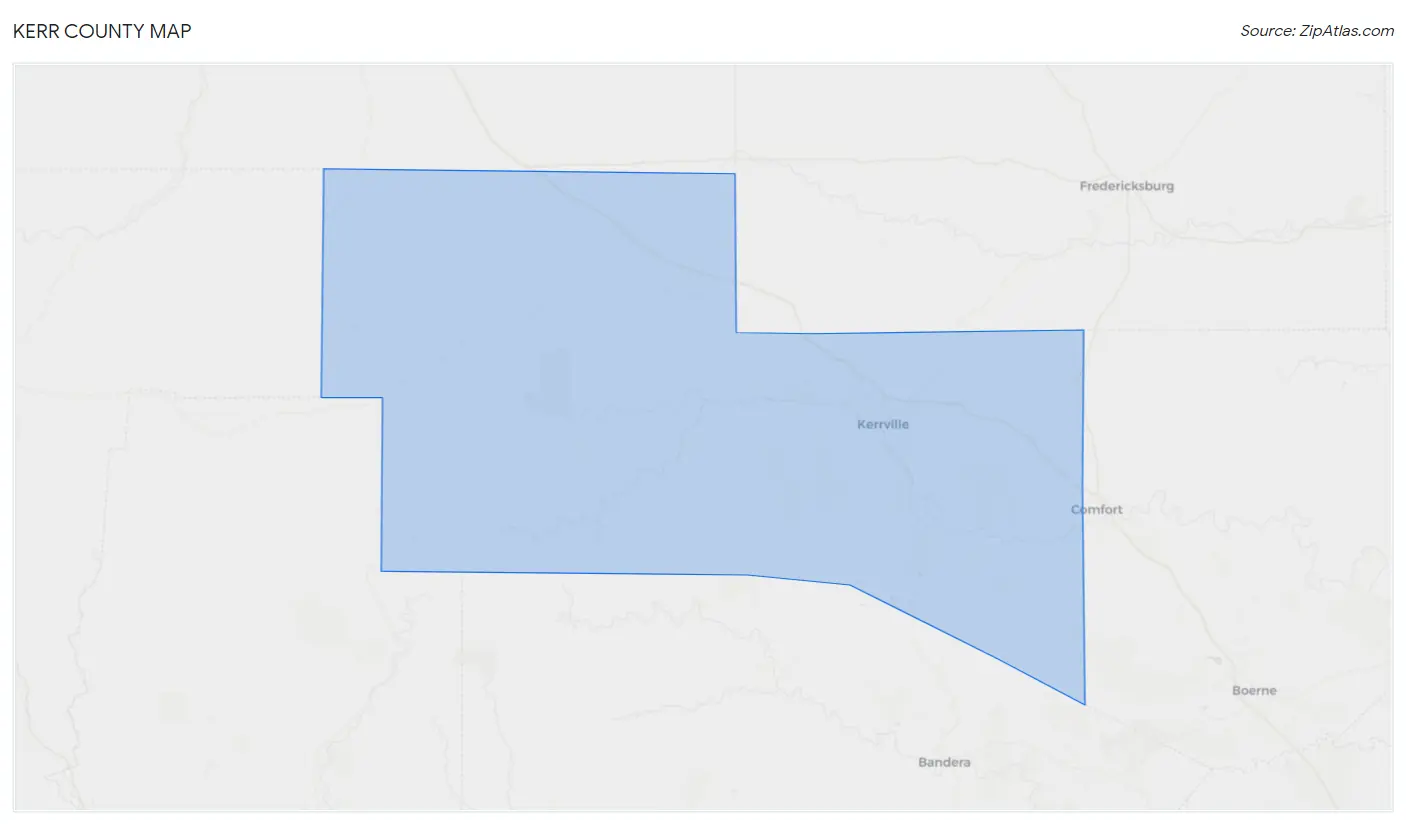
Kerr County Map
Kerr County Overview
$38,003
PER CAPITA INCOME
$81,491
AVG FAMILY INCOME
$66,713
AVG HOUSEHOLD INCOME
17.5%
WAGE / INCOME GAP [ % ]
82.5¢/ $1
WAGE / INCOME GAP [ $ ]
$8,735
FAMILY INCOME DEFICIT
0.46
INEQUALITY / GINI INDEX
52,810
TOTAL POPULATION
25,725
MALE POPULATION
27,085
FEMALE POPULATION
94.98
MALES / 100 FEMALES
105.29
FEMALES / 100 MALES
48.2
MEDIAN AGE
2.8
AVG FAMILY SIZE
2.3
AVG HOUSEHOLD SIZE
24,570
LABOR FORCE [ PEOPLE ]
55.4%
PERCENT IN LABOR FORCE
3.3%
UNEMPLOYMENT RATE
Kerr County Area Codes
Income in Kerr County
Income Overview in Kerr County
Per Capita Income in Kerr County is $38,003, while median incomes of families and households are $81,491 and $66,713 respectively.
| Characteristic | Number | Measure |
| Per Capita Income | 52,810 | $38,003 |
| Median Family Income | 14,613 | $81,491 |
| Mean Family Income | 14,613 | $104,767 |
| Median Household Income | 22,024 | $66,713 |
| Mean Household Income | 22,024 | $91,321 |
| Income Deficit | 14,613 | $8,735 |
| Wage / Income Gap (%) | 52,810 | 17.53% |
| Wage / Income Gap ($) | 52,810 | 82.47¢ per $1 |
| Gini / Inequality Index | 52,810 | 0.46 |
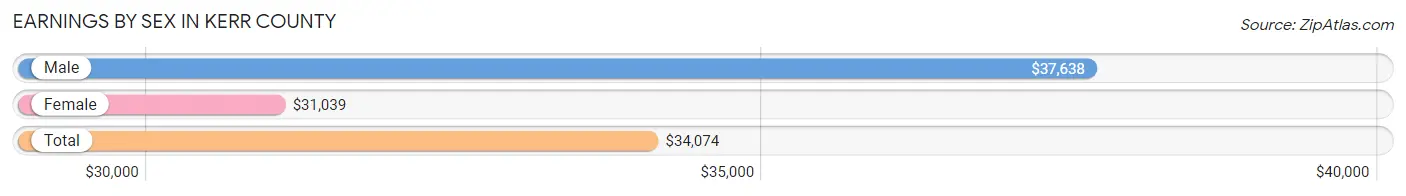
Earnings by Sex in Kerr County
Average Earnings in Kerr County are $34,074, $37,638 for men and $31,039 for women, a difference of 17.5%.
| Sex | Number | Average Earnings |
| Male | 13,332 (51.4%) | $37,638 |
| Female | 12,623 (48.6%) | $31,039 |
| Total | 25,955 (100.0%) | $34,074 |
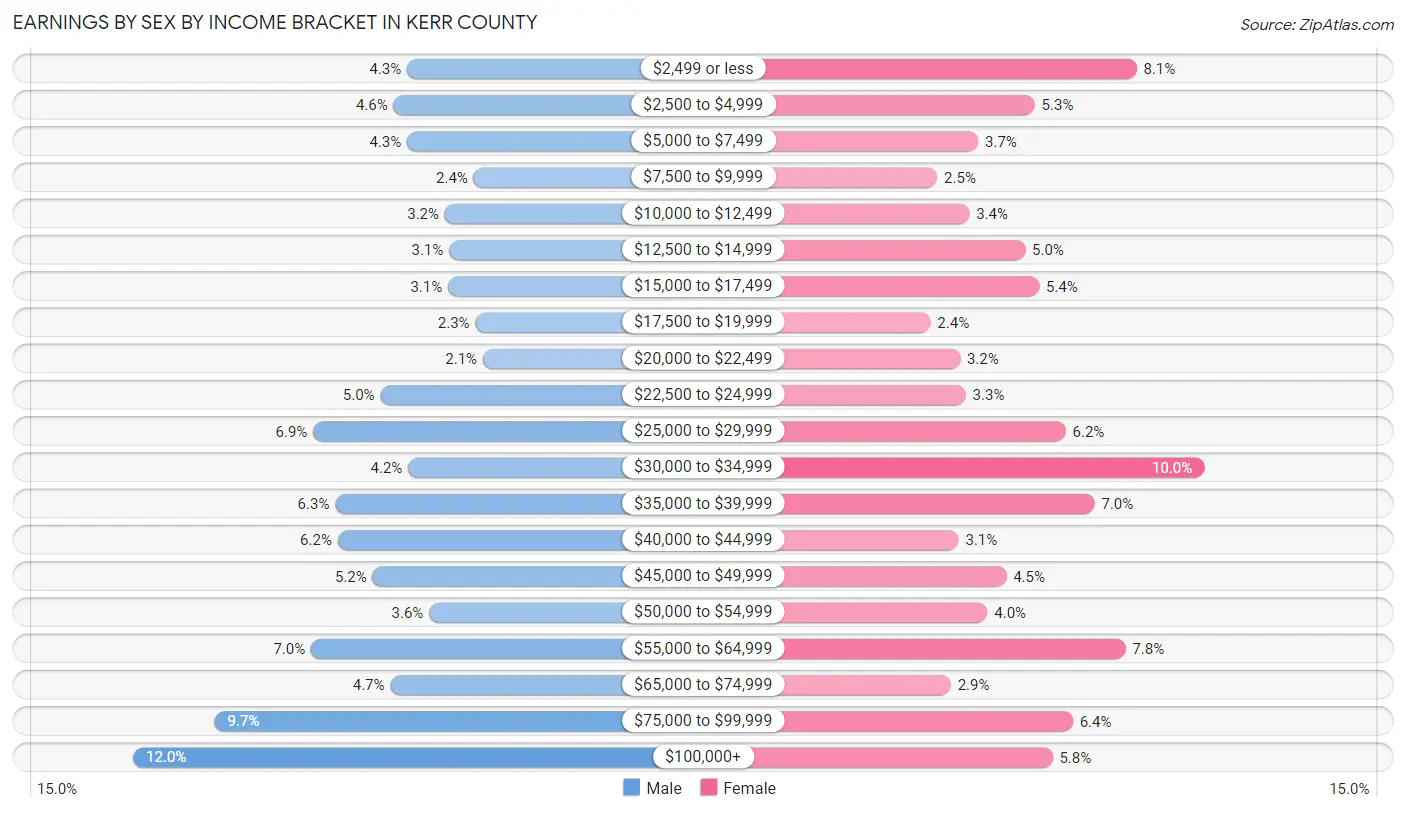
Earnings by Sex by Income Bracket in Kerr County
The most common earnings brackets in Kerr County are $100,000+ for men (1,593 | 11.9%) and $30,000 to $34,999 for women (1,267 | 10.0%).
| Income | Male | Female |
| $2,499 or less | 566 (4.3%) | 1,028 (8.1%) |
| $2,500 to $4,999 | 617 (4.6%) | 667 (5.3%) |
| $5,000 to $7,499 | 566 (4.3%) | 466 (3.7%) |
| $7,500 to $9,999 | 317 (2.4%) | 321 (2.5%) |
| $10,000 to $12,499 | 425 (3.2%) | 434 (3.4%) |
| $12,500 to $14,999 | 409 (3.1%) | 633 (5.0%) |
| $15,000 to $17,499 | 413 (3.1%) | 682 (5.4%) |
| $17,500 to $19,999 | 310 (2.3%) | 297 (2.4%) |
| $20,000 to $22,499 | 282 (2.1%) | 401 (3.2%) |
| $22,500 to $24,999 | 666 (5.0%) | 422 (3.3%) |
| $25,000 to $29,999 | 918 (6.9%) | 776 (6.1%) |
| $30,000 to $34,999 | 563 (4.2%) | 1,267 (10.0%) |
| $35,000 to $39,999 | 836 (6.3%) | 879 (7.0%) |
| $40,000 to $44,999 | 827 (6.2%) | 396 (3.1%) |
| $45,000 to $49,999 | 696 (5.2%) | 566 (4.5%) |
| $50,000 to $54,999 | 484 (3.6%) | 499 (4.0%) |
| $55,000 to $64,999 | 927 (7.0%) | 989 (7.8%) |
| $65,000 to $74,999 | 629 (4.7%) | 369 (2.9%) |
| $75,000 to $99,999 | 1,288 (9.7%) | 801 (6.4%) |
| $100,000+ | 1,593 (11.9%) | 730 (5.8%) |
| Total | 13,332 (100.0%) | 12,623 (100.0%) |
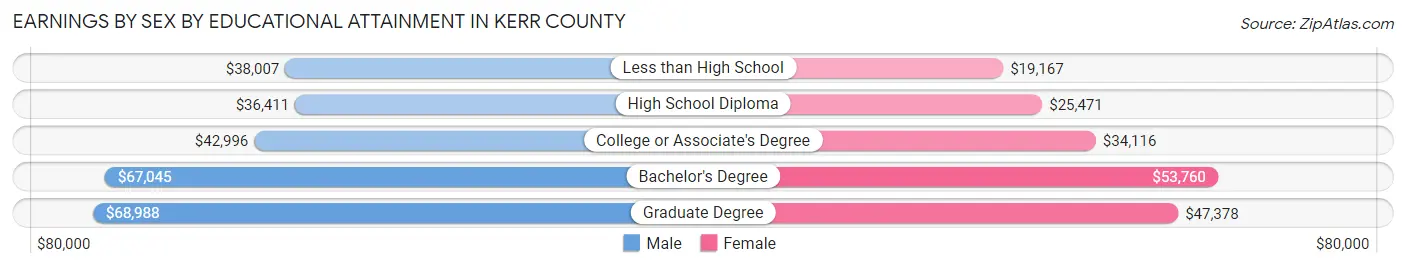
Earnings by Sex by Educational Attainment in Kerr County
Average earnings in Kerr County are $44,498 for men and $33,689 for women, a difference of 24.3%. Men with an educational attainment of graduate degree enjoy the highest average annual earnings of $68,988, while those with high school diploma education earn the least with $36,411. Women with an educational attainment of bachelor's degree earn the most with the average annual earnings of $53,760, while those with less than high school education have the smallest earnings of $19,167.
| Educational Attainment | Male Income | Female Income |
| Less than High School | $38,007 | $19,167 |
| High School Diploma | $36,411 | $25,471 |
| College or Associate's Degree | $42,996 | $34,116 |
| Bachelor's Degree | $67,045 | $53,760 |
| Graduate Degree | $68,988 | $47,378 |
| Total | $44,498 | $33,689 |
Family Income in Kerr County
Family Income Brackets in Kerr County
According to the Kerr County family income data, there are 3,449 families falling into the $100,000 to $149,999 income range, which is the most common income bracket and makes up 23.6% of all families. Conversely, the $10,000 to $14,999 income bracket is the least frequent group with only 190 families (1.3%) belonging to this category.
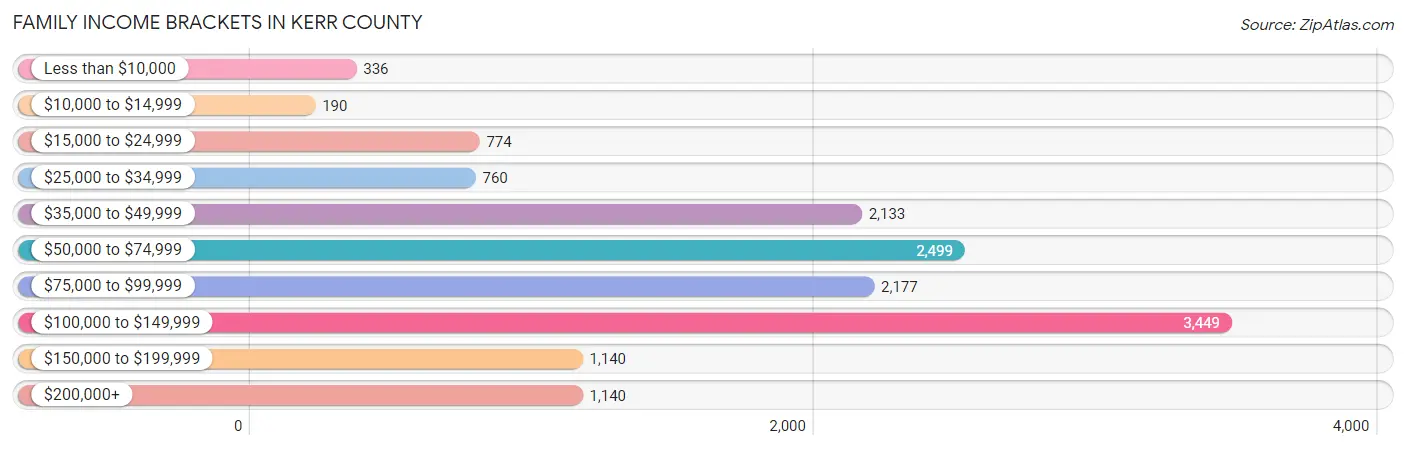
| Income Bracket | # Families | % Families |
| Less than $10,000 | 336 | 2.3% |
| $10,000 to $14,999 | 190 | 1.3% |
| $15,000 to $24,999 | 774 | 5.3% |
| $25,000 to $34,999 | 760 | 5.2% |
| $35,000 to $49,999 | 2,133 | 14.6% |
| $50,000 to $74,999 | 2,499 | 17.1% |
| $75,000 to $99,999 | 2,177 | 14.9% |
| $100,000 to $149,999 | 3,449 | 23.6% |
| $150,000 to $199,999 | 1,140 | 7.8% |
| $200,000+ | 1,140 | 7.8% |
Family Income by Famaliy Size in Kerr County
6-person families (446 | 3.0%) account for the highest median family income in Kerr County with $108,774 per family, while 2-person families (8,927 | 61.1%) have the highest median income of $39,106 per family member.
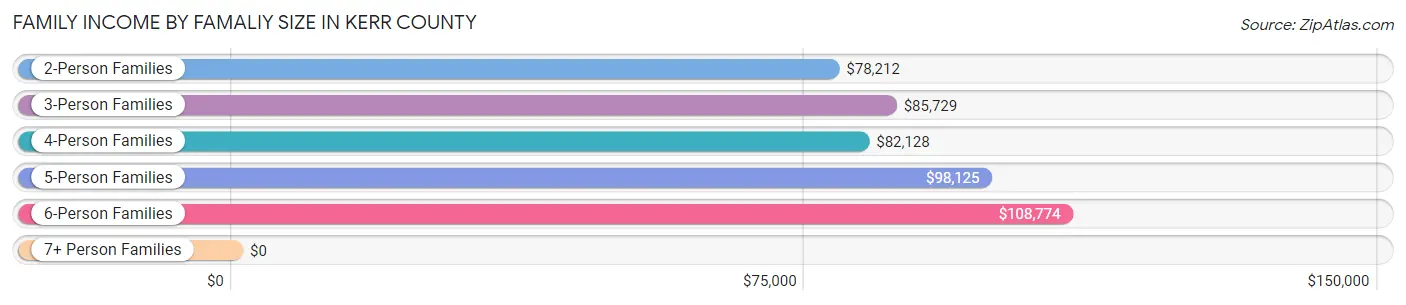
| Income Bracket | # Families | Median Income |
| 2-Person Families | 8,927 (61.1%) | $78,212 |
| 3-Person Families | 2,708 (18.5%) | $85,729 |
| 4-Person Families | 1,729 (11.8%) | $82,128 |
| 5-Person Families | 729 (5.0%) | $98,125 |
| 6-Person Families | 446 (3.0%) | $108,774 |
| 7+ Person Families | 74 (0.5%) | $0 |
| Total | 14,613 (100.0%) | $81,491 |
Family Income by Number of Earners in Kerr County
The median family income in Kerr County is $81,491, with families comprising 3+ earners (1,226) having the highest median family income of $119,345, while families with 1 earner (4,242) have the lowest median family income of $58,727, accounting for 8.4% and 29.0% of families, respectively.
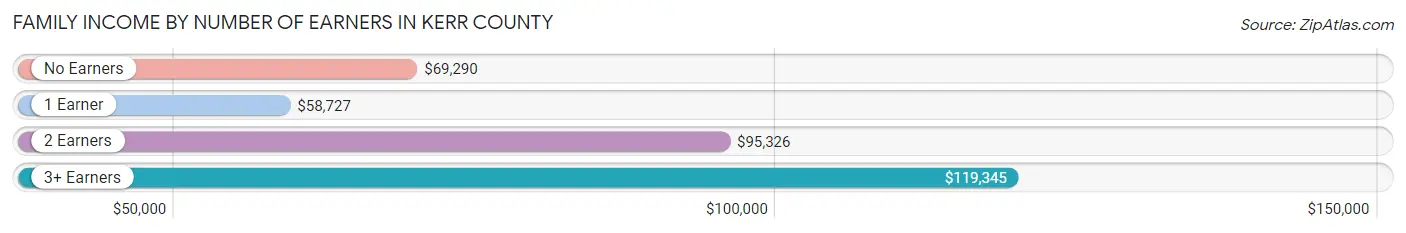
| Number of Earners | # Families | Median Income |
| No Earners | 3,341 (22.9%) | $69,290 |
| 1 Earner | 4,242 (29.0%) | $58,727 |
| 2 Earners | 5,804 (39.7%) | $95,326 |
| 3+ Earners | 1,226 (8.4%) | $119,345 |
| Total | 14,613 (100.0%) | $81,491 |
Household Income in Kerr County
Household Income Brackets in Kerr County
With 4,052 households falling in the category, the $100,000 to $149,999 income range is the most frequent in Kerr County, accounting for 18.4% of all households. In contrast, only 727 households (3.3%) fall into the $10,000 to $14,999 income bracket, making it the least populous group.
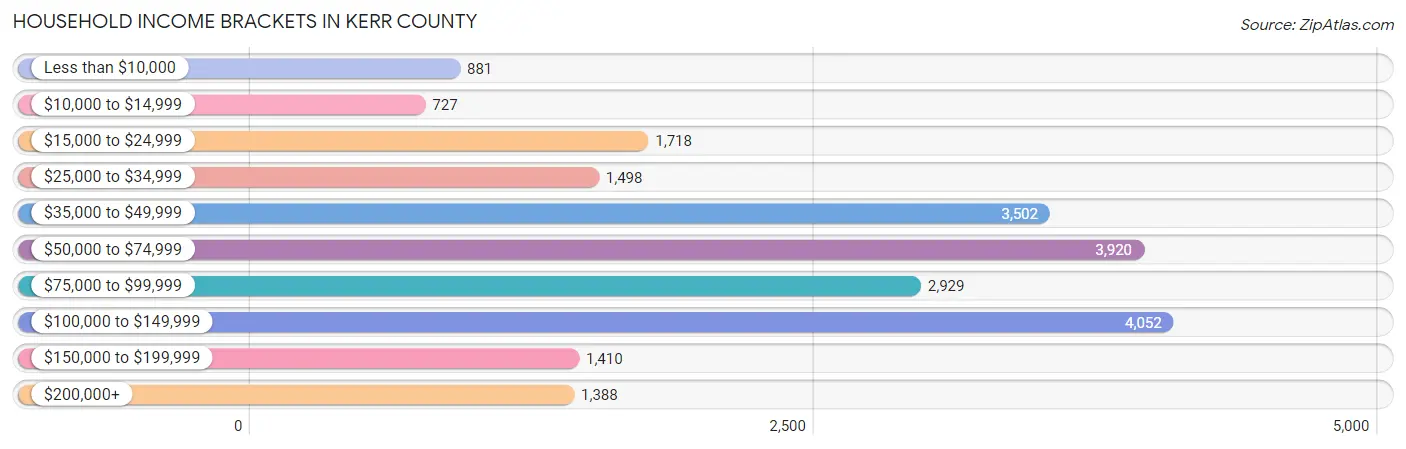
| Income Bracket | # Households | % Households |
| Less than $10,000 | 881 | 4.0% |
| $10,000 to $14,999 | 727 | 3.3% |
| $15,000 to $24,999 | 1,718 | 7.8% |
| $25,000 to $34,999 | 1,498 | 6.8% |
| $35,000 to $49,999 | 3,502 | 15.9% |
| $50,000 to $74,999 | 3,920 | 17.8% |
| $75,000 to $99,999 | 2,929 | 13.3% |
| $100,000 to $149,999 | 4,052 | 18.4% |
| $150,000 to $199,999 | 1,410 | 6.4% |
| $200,000+ | 1,388 | 6.3% |
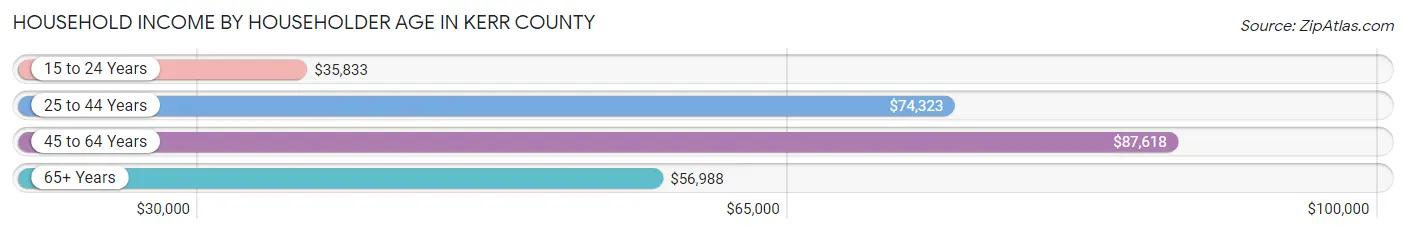
Household Income by Householder Age in Kerr County
The median household income in Kerr County is $66,713, with the highest median household income of $87,618 found in the 45 to 64 years age bracket for the primary householder. A total of 6,975 households (31.7%) fall into this category. Meanwhile, the 15 to 24 years age bracket for the primary householder has the lowest median household income of $35,833, with 816 households (3.7%) in this group.
| Income Bracket | # Households | Median Income |
| 15 to 24 Years | 816 (3.7%) | $35,833 |
| 25 to 44 Years | 4,873 (22.1%) | $74,323 |
| 45 to 64 Years | 6,975 (31.7%) | $87,618 |
| 65+ Years | 9,360 (42.5%) | $56,988 |
| Total | 22,024 (100.0%) | $66,713 |
Poverty in Kerr County
Income Below Poverty by Sex and Age in Kerr County
With 12.6% poverty level for males and 12.5% for females among the residents of Kerr County, under 5 year old males and 18 to 24 year old females are the most vulnerable to poverty, with 313 males (24.4%) and 460 females (25.9%) in their respective age groups living below the poverty level.
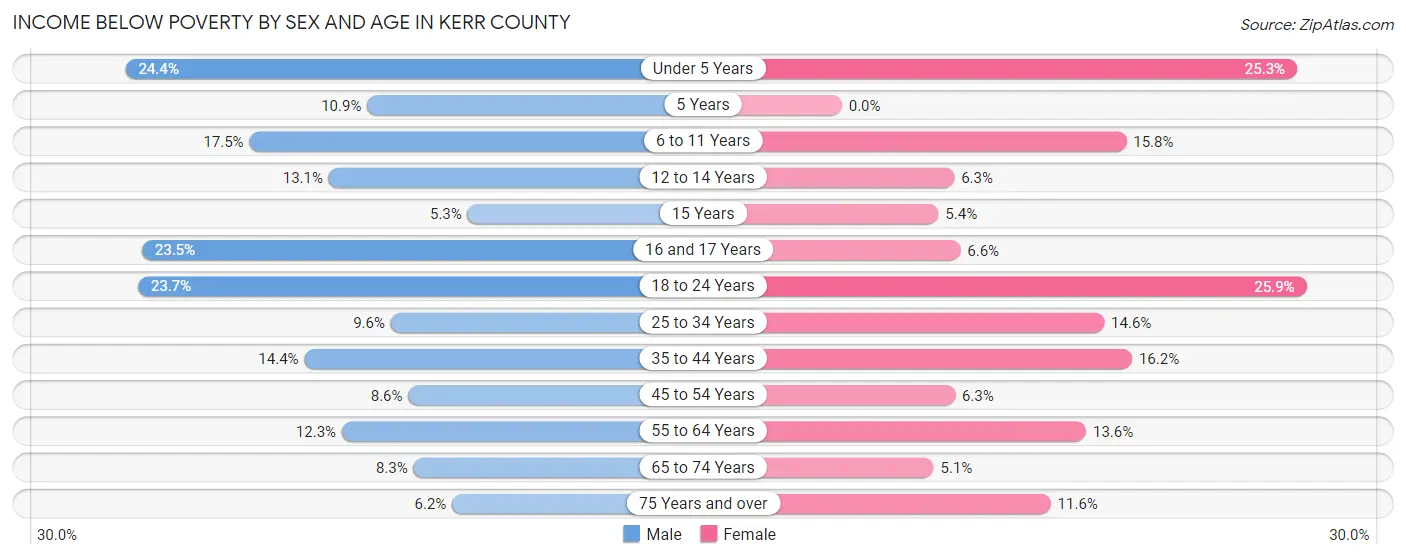
| Age Bracket | Male | Female |
| Under 5 Years | 313 (24.4%) | 317 (25.3%) |
| 5 Years | 38 (10.9%) | 0 (0.0%) |
| 6 to 11 Years | 215 (17.5%) | 251 (15.8%) |
| 12 to 14 Years | 147 (13.1%) | 48 (6.3%) |
| 15 Years | 8 (5.3%) | 10 (5.4%) |
| 16 and 17 Years | 172 (23.5%) | 41 (6.6%) |
| 18 to 24 Years | 458 (23.7%) | 460 (25.9%) |
| 25 to 34 Years | 259 (9.6%) | 399 (14.6%) |
| 35 to 44 Years | 361 (14.4%) | 411 (16.2%) |
| 45 to 54 Years | 226 (8.6%) | 187 (6.3%) |
| 55 to 64 Years | 437 (12.3%) | 528 (13.6%) |
| 65 to 74 Years | 299 (8.3%) | 209 (5.1%) |
| 75 Years and over | 191 (6.2%) | 410 (11.6%) |
| Total | 3,124 (12.6%) | 3,271 (12.5%) |
Income Above Poverty by Sex and Age in Kerr County
According to the poverty statistics in Kerr County, males aged 15 years and females aged 5 years are the age groups that are most secure financially, with 94.7% of males and 100.0% of females in these age groups living above the poverty line.
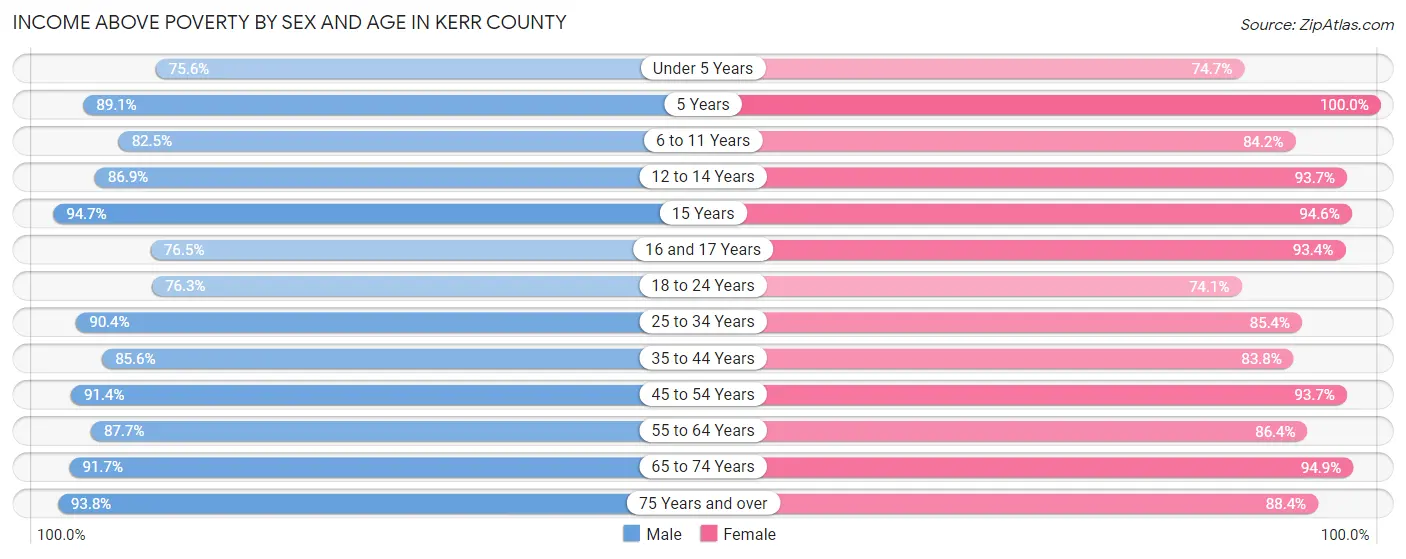
| Age Bracket | Male | Female |
| Under 5 Years | 971 (75.6%) | 934 (74.7%) |
| 5 Years | 310 (89.1%) | 239 (100.0%) |
| 6 to 11 Years | 1,015 (82.5%) | 1,334 (84.2%) |
| 12 to 14 Years | 979 (86.9%) | 719 (93.7%) |
| 15 Years | 142 (94.7%) | 176 (94.6%) |
| 16 and 17 Years | 561 (76.5%) | 580 (93.4%) |
| 18 to 24 Years | 1,475 (76.3%) | 1,318 (74.1%) |
| 25 to 34 Years | 2,436 (90.4%) | 2,332 (85.4%) |
| 35 to 44 Years | 2,142 (85.6%) | 2,132 (83.8%) |
| 45 to 54 Years | 2,393 (91.4%) | 2,779 (93.7%) |
| 55 to 64 Years | 3,108 (87.7%) | 3,355 (86.4%) |
| 65 to 74 Years | 3,288 (91.7%) | 3,880 (94.9%) |
| 75 Years and over | 2,896 (93.8%) | 3,114 (88.4%) |
| Total | 21,716 (87.4%) | 22,892 (87.5%) |
Income Below Poverty Among Married-Couple Families in Kerr County
The poverty statistics for married-couple families in Kerr County show that 3.6% or 390 of the total 10,968 families live below the poverty line. Families with 3 or 4 children have the highest poverty rate of 9.3%, comprising of 75 families. On the other hand, families with 5 or more children have the lowest poverty rate of 0.0%, which includes 0 families.
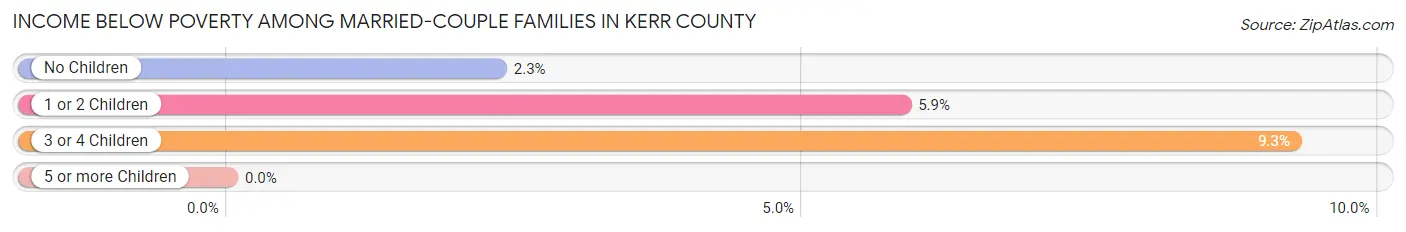
| Children | Above Poverty | Below Poverty |
| No Children | 7,754 (97.7%) | 186 (2.3%) |
| 1 or 2 Children | 2,073 (94.1%) | 129 (5.9%) |
| 3 or 4 Children | 735 (90.7%) | 75 (9.3%) |
| 5 or more Children | 16 (100.0%) | 0 (0.0%) |
| Total | 10,578 (96.4%) | 390 (3.6%) |
Income Below Poverty Among Single-Parent Households in Kerr County
According to the poverty data in Kerr County, 16.1% or 181 single-father households and 24.4% or 616 single-mother households are living below the poverty line. Among single-father households, those with 3 or 4 children have the highest poverty rate, with 19 households (67.9%) experiencing poverty. Likewise, among single-mother households, those with 1 or 2 children have the highest poverty rate, with 483 households (40.6%) falling below the poverty line.
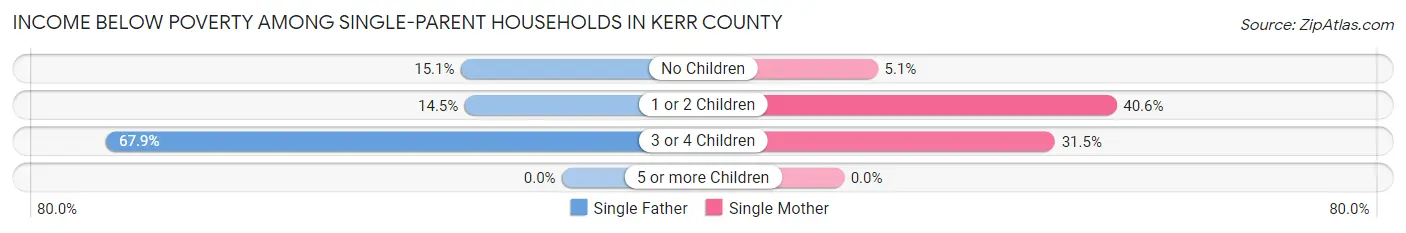
| Children | Single Father | Single Mother |
| No Children | 88 (15.1%) | 55 (5.1%) |
| 1 or 2 Children | 74 (14.5%) | 483 (40.6%) |
| 3 or 4 Children | 19 (67.9%) | 78 (31.5%) |
| 5 or more Children | 0 (0.0%) | 0 (0.0%) |
| Total | 181 (16.1%) | 616 (24.4%) |
Income Below Poverty Among Married-Couple vs Single-Parent Households in Kerr County
The poverty data for Kerr County shows that 390 of the married-couple family households (3.6%) and 797 of the single-parent households (21.9%) are living below the poverty level. Within the married-couple family households, those with 3 or 4 children have the highest poverty rate, with 75 households (9.3%) falling below the poverty line. Among the single-parent households, those with 3 or 4 children have the highest poverty rate, with 97 household (35.1%) living below poverty.
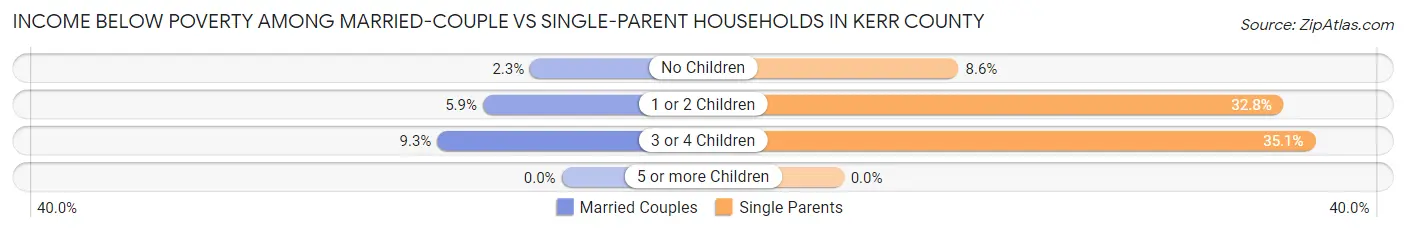
| Children | Married-Couple Families | Single-Parent Households |
| No Children | 186 (2.3%) | 143 (8.6%) |
| 1 or 2 Children | 129 (5.9%) | 557 (32.8%) |
| 3 or 4 Children | 75 (9.3%) | 97 (35.1%) |
| 5 or more Children | 0 (0.0%) | 0 (0.0%) |
| Total | 390 (3.6%) | 797 (21.9%) |
Race in Kerr County
The most populous races in Kerr County are White / Caucasian (41,252 | 78.1%), Hispanic or Latino (14,874 | 28.2%), and Two or more Races (6,225 | 11.8%).
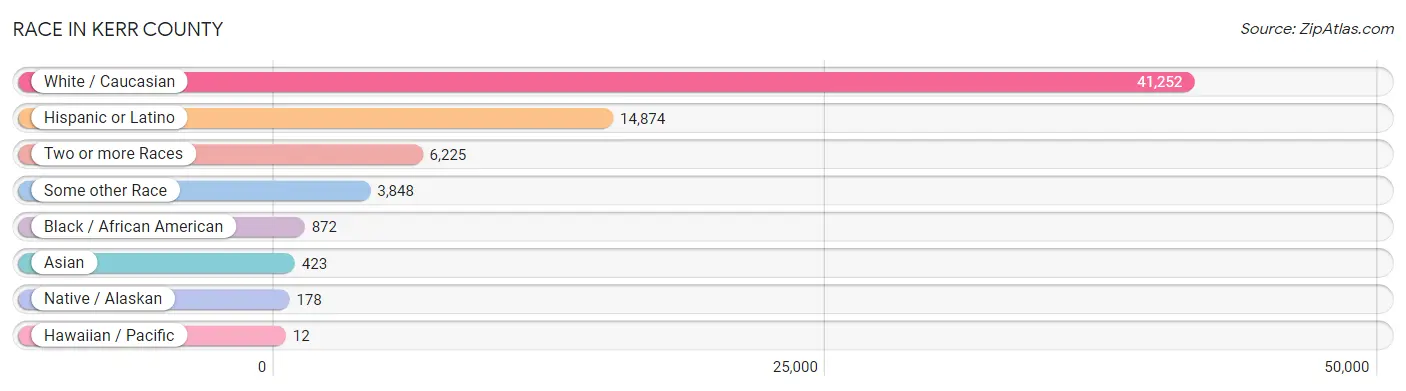
| Race | # Population | % Population |
| Asian | 423 | 0.8% |
| Black / African American | 872 | 1.7% |
| Hawaiian / Pacific | 12 | 0.0% |
| Hispanic or Latino | 14,874 | 28.2% |
| Native / Alaskan | 178 | 0.3% |
| White / Caucasian | 41,252 | 78.1% |
| Two or more Races | 6,225 | 11.8% |
| Some other Race | 3,848 | 7.3% |
| Total | 52,810 | 100.0% |
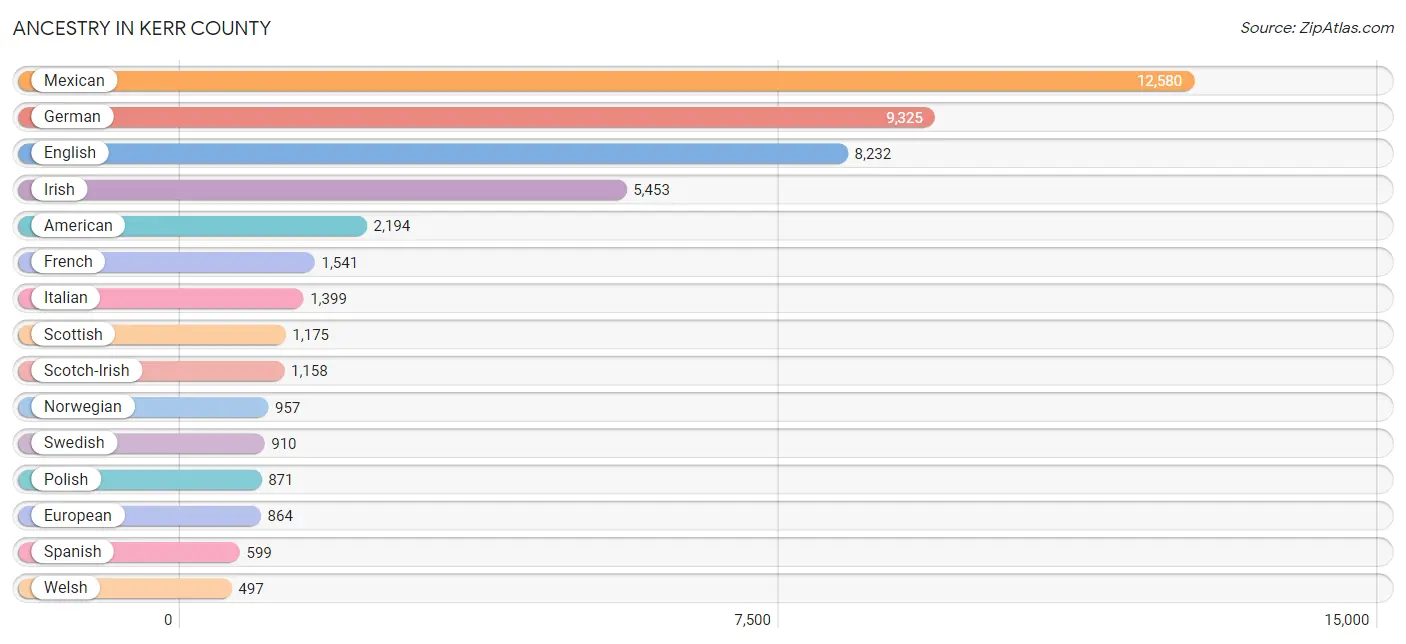
Ancestry in Kerr County
The most populous ancestries reported in Kerr County are Mexican (12,580 | 23.8%), German (9,325 | 17.7%), English (8,232 | 15.6%), Irish (5,453 | 10.3%), and American (2,194 | 4.2%), together accounting for 71.5% of all Kerr County residents.
| Ancestry | # Population | % Population |
| African | 181 | 0.3% |
| Albanian | 6 | 0.0% |
| Alsatian | 28 | 0.1% |
| American | 2,194 | 4.2% |
| Apache | 38 | 0.1% |
| Arab | 32 | 0.1% |
| Argentinean | 13 | 0.0% |
| Armenian | 16 | 0.0% |
| Austrian | 82 | 0.2% |
| Belgian | 54 | 0.1% |
| Belizean | 18 | 0.0% |
| Bhutanese | 97 | 0.2% |
| Blackfeet | 24 | 0.1% |
| British | 458 | 0.9% |
| Burmese | 96 | 0.2% |
| Cajun | 13 | 0.0% |
| Canadian | 25 | 0.1% |
| Central American | 53 | 0.1% |
| Cherokee | 229 | 0.4% |
| Choctaw | 63 | 0.1% |
| Colombian | 50 | 0.1% |
| Comanche | 51 | 0.1% |
| Creek | 12 | 0.0% |
| Croatian | 59 | 0.1% |
| Cuban | 4 | 0.0% |
| Czech | 342 | 0.6% |
| Czechoslovakian | 31 | 0.1% |
| Danish | 148 | 0.3% |
| Dutch | 488 | 0.9% |
| Dutch West Indian | 9 | 0.0% |
| Eastern European | 101 | 0.2% |
| Ecuadorian | 6 | 0.0% |
| English | 8,232 | 15.6% |
| Ethiopian | 4 | 0.0% |
| European | 864 | 1.6% |
| Filipino | 25 | 0.1% |
| Finnish | 82 | 0.2% |
| French | 1,541 | 2.9% |
| French Canadian | 190 | 0.4% |
| German | 9,325 | 17.7% |
| Greek | 82 | 0.2% |
| Guatemalan | 15 | 0.0% |
| Hungarian | 89 | 0.2% |
| Indian (Asian) | 64 | 0.1% |
| Irish | 5,453 | 10.3% |
| Italian | 1,399 | 2.6% |
| Kiowa | 4 | 0.0% |
| Korean | 146 | 0.3% |
| Laotian | 27 | 0.1% |
| Lebanese | 32 | 0.1% |
| Lithuanian | 28 | 0.1% |
| Macedonian | 4 | 0.0% |
| Mexican | 12,580 | 23.8% |
| Mexican American Indian | 2 | 0.0% |
| Native Hawaiian | 12 | 0.0% |
| Northern European | 128 | 0.2% |
| Norwegian | 957 | 1.8% |
| Pakistani | 26 | 0.1% |
| Panamanian | 8 | 0.0% |
| Pennsylvania German | 8 | 0.0% |
| Polish | 871 | 1.7% |
| Portuguese | 41 | 0.1% |
| Potawatomi | 31 | 0.1% |
| Puerto Rican | 268 | 0.5% |
| Romanian | 115 | 0.2% |
| Russian | 406 | 0.8% |
| Salvadoran | 30 | 0.1% |
| Scandinavian | 116 | 0.2% |
| Scotch-Irish | 1,158 | 2.2% |
| Scottish | 1,175 | 2.2% |
| Serbian | 9 | 0.0% |
| Sioux | 66 | 0.1% |
| Slavic | 8 | 0.0% |
| Slovak | 10 | 0.0% |
| South American | 84 | 0.2% |
| Spaniard | 128 | 0.2% |
| Spanish | 599 | 1.1% |
| Sri Lankan | 17 | 0.0% |
| Subsaharan African | 185 | 0.4% |
| Swedish | 910 | 1.7% |
| Swiss | 16 | 0.0% |
| Thai | 270 | 0.5% |
| Turkish | 71 | 0.1% |
| Ukrainian | 13 | 0.0% |
| Venezuelan | 6 | 0.0% |
| Vietnamese | 8 | 0.0% |
| Welsh | 497 | 0.9% | View All 87 Rows |
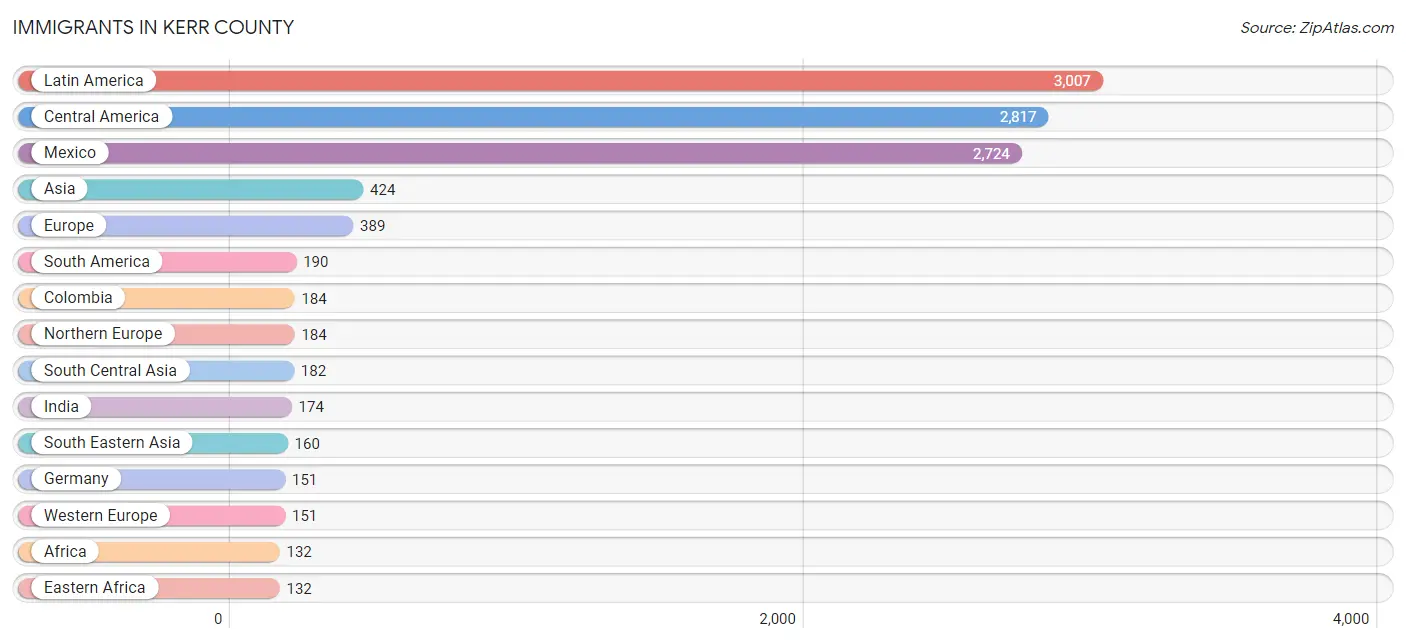
Immigrants in Kerr County
The most numerous immigrant groups reported in Kerr County came from Latin America (3,007 | 5.7%), Central America (2,817 | 5.3%), Mexico (2,724 | 5.2%), Asia (424 | 0.8%), and Europe (389 | 0.7%), together accounting for 17.7% of all Kerr County residents.
| Immigration Origin | # Population | % Population |
| Africa | 132 | 0.3% |
| Asia | 424 | 0.8% |
| Australia | 11 | 0.0% |
| Bangladesh | 8 | 0.0% |
| Belize | 18 | 0.0% |
| Bolivia | 6 | 0.0% |
| Canada | 51 | 0.1% |
| Central America | 2,817 | 5.3% |
| Colombia | 184 | 0.4% |
| Costa Rica | 12 | 0.0% |
| Croatia | 24 | 0.1% |
| Eastern Africa | 132 | 0.3% |
| Eastern Asia | 39 | 0.1% |
| Eastern Europe | 46 | 0.1% |
| El Salvador | 21 | 0.0% |
| England | 104 | 0.2% |
| Europe | 389 | 0.7% |
| Germany | 151 | 0.3% |
| Guatemala | 34 | 0.1% |
| India | 174 | 0.3% |
| Italy | 8 | 0.0% |
| Japan | 36 | 0.1% |
| Korea | 3 | 0.0% |
| Latin America | 3,007 | 5.7% |
| Latvia | 5 | 0.0% |
| Mexico | 2,724 | 5.2% |
| North Macedonia | 4 | 0.0% |
| Northern Europe | 184 | 0.4% |
| Oceania | 11 | 0.0% |
| Panama | 8 | 0.0% |
| Philippines | 125 | 0.2% |
| Poland | 13 | 0.0% |
| South America | 190 | 0.4% |
| South Central Asia | 182 | 0.3% |
| South Eastern Asia | 160 | 0.3% |
| Southern Europe | 8 | 0.0% |
| Thailand | 18 | 0.0% |
| Turkey | 43 | 0.1% |
| Uganda | 17 | 0.0% |
| Vietnam | 17 | 0.0% |
| Western Asia | 43 | 0.1% |
| Western Europe | 151 | 0.3% |
| Zimbabwe | 115 | 0.2% | View All 43 Rows |
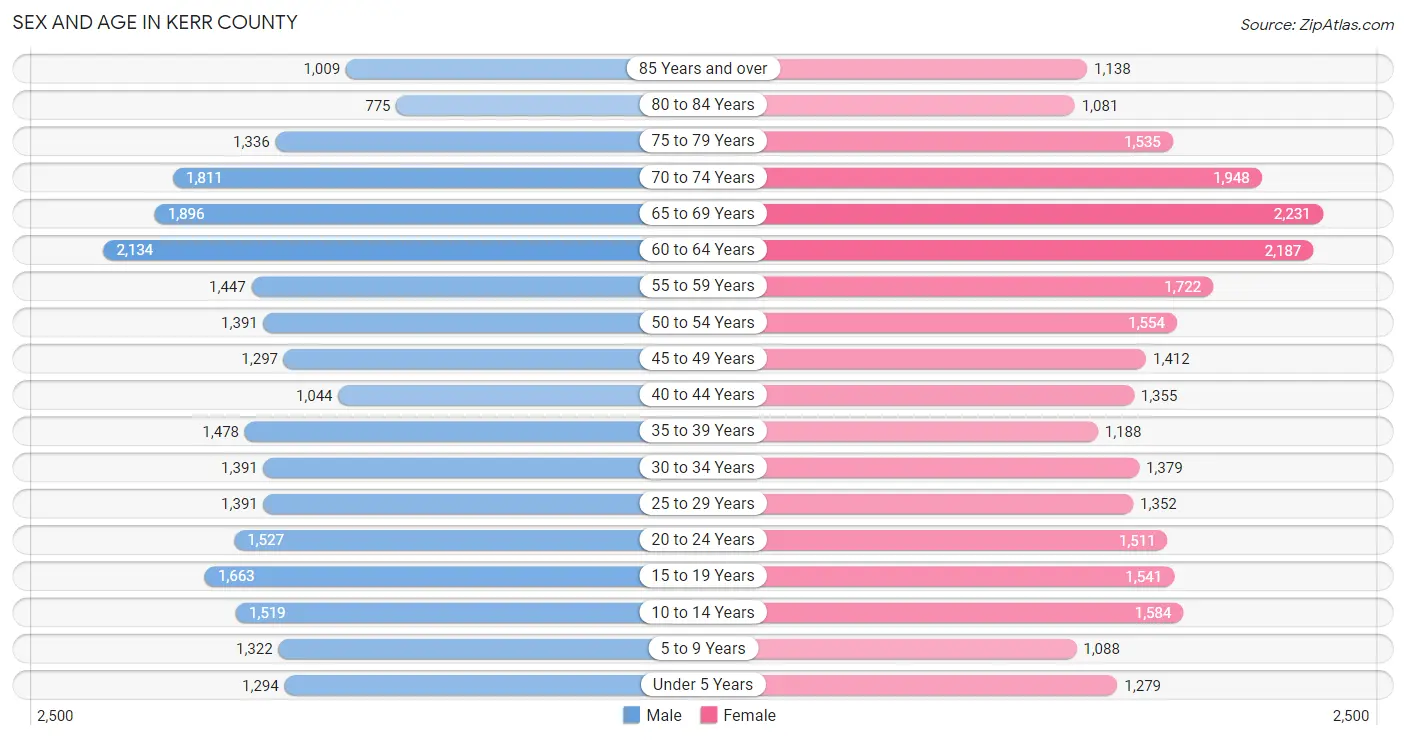
Sex and Age in Kerr County
Sex and Age in Kerr County
The most populous age groups in Kerr County are 60 to 64 Years (2,134 | 8.3%) for men and 65 to 69 Years (2,231 | 8.2%) for women.
| Age Bracket | Male | Female |
| Under 5 Years | 1,294 (5.0%) | 1,279 (4.7%) |
| 5 to 9 Years | 1,322 (5.1%) | 1,088 (4.0%) |
| 10 to 14 Years | 1,519 (5.9%) | 1,584 (5.9%) |
| 15 to 19 Years | 1,663 (6.5%) | 1,541 (5.7%) |
| 20 to 24 Years | 1,527 (5.9%) | 1,511 (5.6%) |
| 25 to 29 Years | 1,391 (5.4%) | 1,352 (5.0%) |
| 30 to 34 Years | 1,391 (5.4%) | 1,379 (5.1%) |
| 35 to 39 Years | 1,478 (5.8%) | 1,188 (4.4%) |
| 40 to 44 Years | 1,044 (4.1%) | 1,355 (5.0%) |
| 45 to 49 Years | 1,297 (5.0%) | 1,412 (5.2%) |
| 50 to 54 Years | 1,391 (5.4%) | 1,554 (5.7%) |
| 55 to 59 Years | 1,447 (5.6%) | 1,722 (6.4%) |
| 60 to 64 Years | 2,134 (8.3%) | 2,187 (8.1%) |
| 65 to 69 Years | 1,896 (7.4%) | 2,231 (8.2%) |
| 70 to 74 Years | 1,811 (7.0%) | 1,948 (7.2%) |
| 75 to 79 Years | 1,336 (5.2%) | 1,535 (5.7%) |
| 80 to 84 Years | 775 (3.0%) | 1,081 (4.0%) |
| 85 Years and over | 1,009 (3.9%) | 1,138 (4.2%) |
| Total | 25,725 (100.0%) | 27,085 (100.0%) |
Families and Households in Kerr County
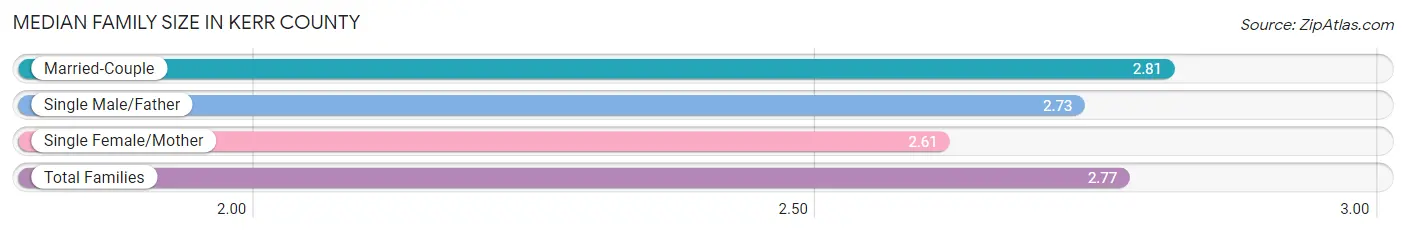
Median Family Size in Kerr County
The median family size in Kerr County is 2.77 persons per family, with married-couple families (10,968 | 75.1%) accounting for the largest median family size of 2.81 persons per family. On the other hand, single female/mother families (2,523 | 17.3%) represent the smallest median family size with 2.61 persons per family.
| Family Type | # Families | Family Size |
| Married-Couple | 10,968 (75.1%) | 2.81 |
| Single Male/Father | 1,122 (7.7%) | 2.73 |
| Single Female/Mother | 2,523 (17.3%) | 2.61 |
| Total Families | 14,613 (100.0%) | 2.77 |
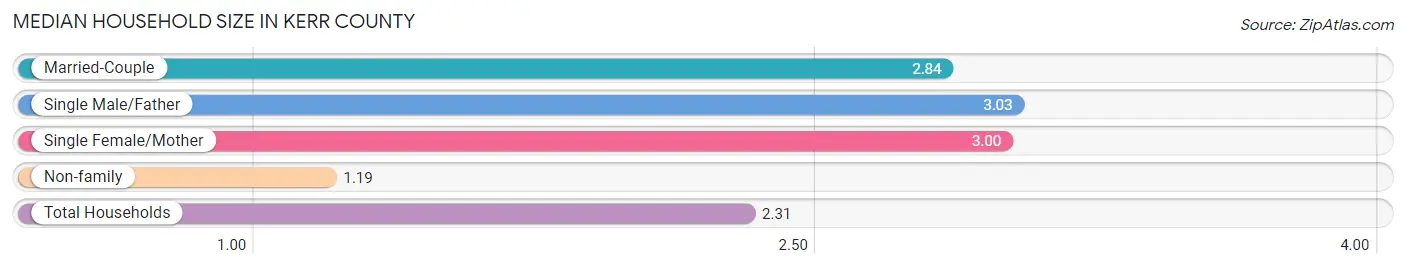
Median Household Size in Kerr County
The median household size in Kerr County is 2.31 persons per household, with single male/father households (1,122 | 5.1%) accounting for the largest median household size of 3.03 persons per household. non-family households (7,411 | 33.7%) represent the smallest median household size with 1.19 persons per household.
| Household Type | # Households | Household Size |
| Married-Couple | 10,968 (49.8%) | 2.84 |
| Single Male/Father | 1,122 (5.1%) | 3.03 |
| Single Female/Mother | 2,523 (11.5%) | 3.00 |
| Non-family | 7,411 (33.7%) | 1.19 |
| Total Households | 22,024 (100.0%) | 2.31 |
Household Size by Marriage Status in Kerr County
Out of a total of 22,024 households in Kerr County, 14,613 (66.3%) are family households, while 7,411 (33.7%) are nonfamily households. The most numerous type of family households are 2-person households, comprising 8,339, and the most common type of nonfamily households are 1-person households, comprising 6,216.
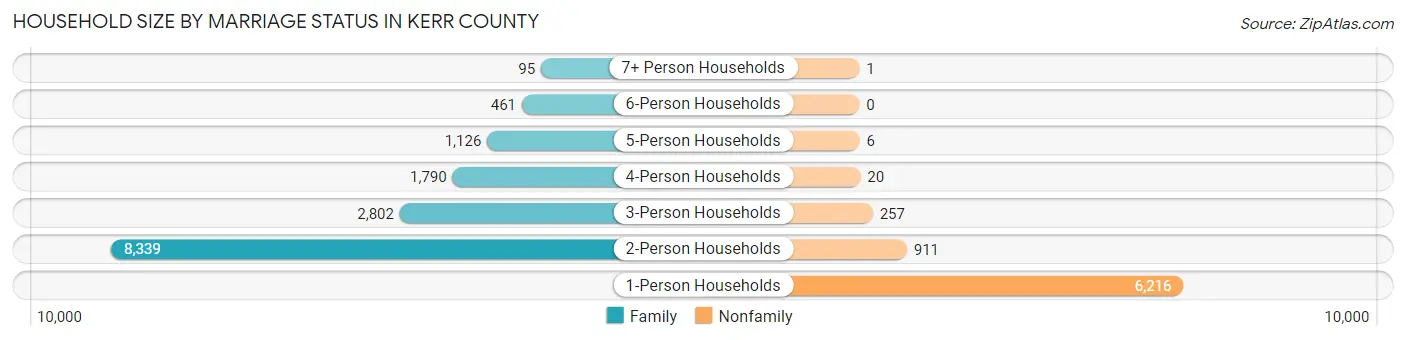
| Household Size | Family Households | Nonfamily Households |
| 1-Person Households | - | 6,216 (28.2%) |
| 2-Person Households | 8,339 (37.9%) | 911 (4.1%) |
| 3-Person Households | 2,802 (12.7%) | 257 (1.2%) |
| 4-Person Households | 1,790 (8.1%) | 20 (0.1%) |
| 5-Person Households | 1,126 (5.1%) | 6 (0.0%) |
| 6-Person Households | 461 (2.1%) | 0 (0.0%) |
| 7+ Person Households | 95 (0.4%) | 1 (0.0%) |
| Total | 14,613 (66.3%) | 7,411 (33.7%) |
Female Fertility in Kerr County
Fertility by Age in Kerr County
Average fertility rate in Kerr County is 64.0 births per 1,000 women. Women in the age bracket of 20 to 34 years have the highest fertility rate with 132.0 births per 1,000 women. Women in the age bracket of 20 to 34 years acount for 89.5% of all women with births.
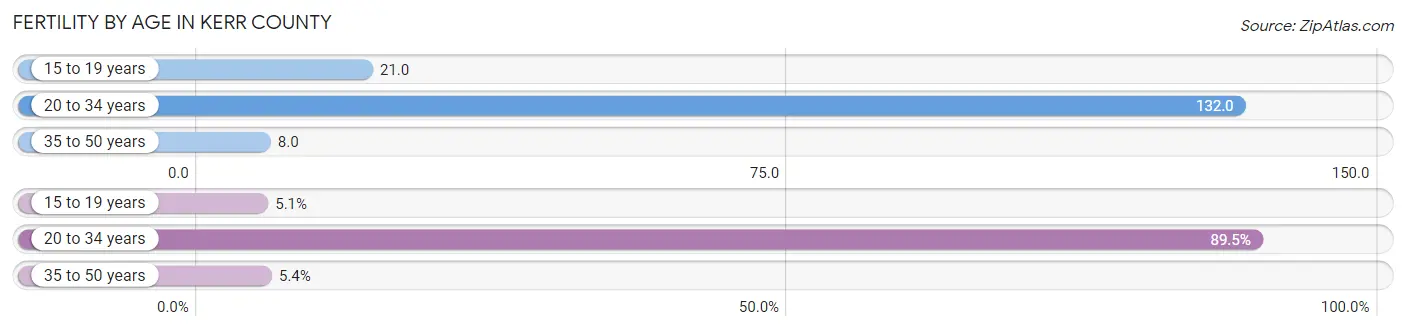
| Age Bracket | Women with Births | Births / 1,000 Women |
| 15 to 19 years | 32 (5.1%) | 21.0 |
| 20 to 34 years | 560 (89.5%) | 132.0 |
| 35 to 50 years | 34 (5.4%) | 8.0 |
| Total | 626 (100.0%) | 64.0 |
Fertility by Age by Marriage Status in Kerr County
63.1% of women with births (626) in Kerr County are married. The highest percentage of unmarried women with births falls into 20 to 34 years age bracket with 40.7% of them unmarried at the time of birth, while the lowest percentage of unmarried women with births belong to 35 to 50 years age bracket with 0.0% of them unmarried.
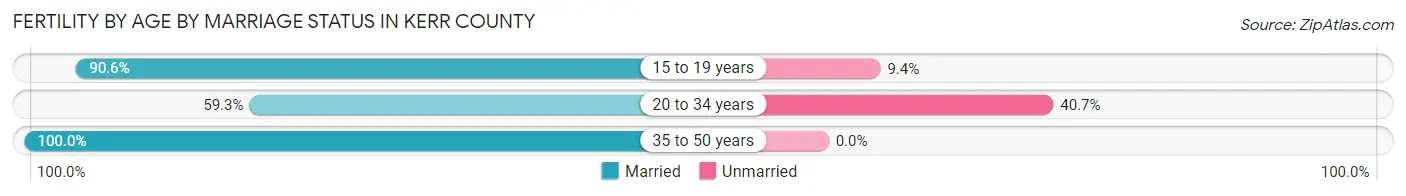
| Age Bracket | Married | Unmarried |
| 15 to 19 years | 29 (90.6%) | 3 (9.4%) |
| 20 to 34 years | 332 (59.3%) | 228 (40.7%) |
| 35 to 50 years | 34 (100.0%) | 0 (0.0%) |
| Total | 395 (63.1%) | 231 (36.9%) |
Fertility by Education in Kerr County
Average fertility rate in Kerr County is 64.0 births per 1,000 women. Women with the education attainment of less than high school have the highest fertility rate of 124.0 births per 1,000 women, while women with the education attainment of bachelor's degree have the lowest fertility at 12.0 births per 1,000 women. Women with the education attainment of less than high school represent 34.0% of all women with births.
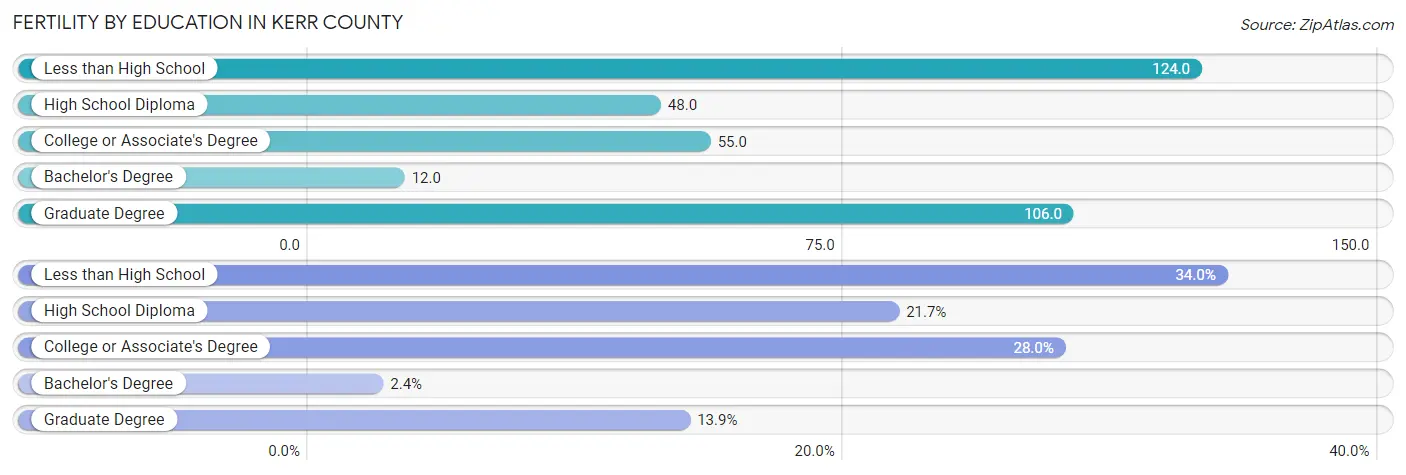
| Educational Attainment | Women with Births | Births / 1,000 Women |
| Less than High School | 213 (34.0%) | 124.0 |
| High School Diploma | 136 (21.7%) | 48.0 |
| College or Associate's Degree | 175 (28.0%) | 55.0 |
| Bachelor's Degree | 15 (2.4%) | 12.0 |
| Graduate Degree | 87 (13.9%) | 106.0 |
| Total | 626 (100.0%) | 64.0 |
Fertility by Education by Marriage Status in Kerr County
36.9% of women with births in Kerr County are unmarried. Women with the educational attainment of bachelor's degree are most likely to be married with 100.0% of them married at childbirth, while women with the educational attainment of high school diploma are least likely to be married with 53.7% of them unmarried at childbirth.
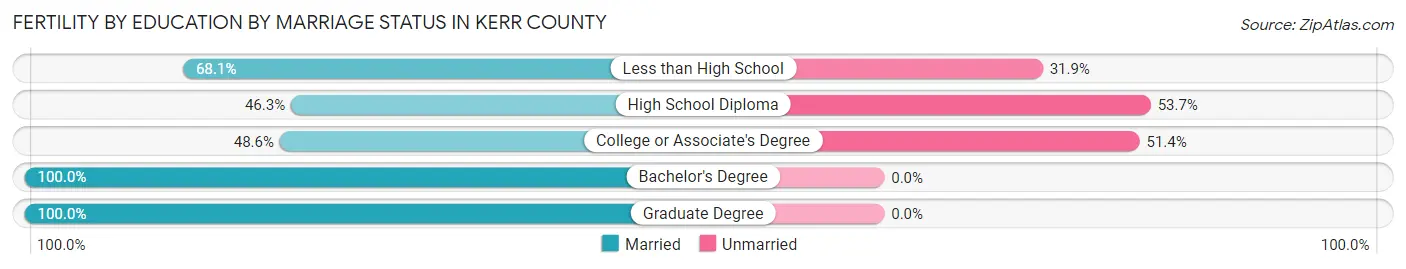
| Educational Attainment | Married | Unmarried |
| Less than High School | 145 (68.1%) | 68 (31.9%) |
| High School Diploma | 63 (46.3%) | 73 (53.7%) |
| College or Associate's Degree | 85 (48.6%) | 90 (51.4%) |
| Bachelor's Degree | 15 (100.0%) | 0 (0.0%) |
| Graduate Degree | 87 (100.0%) | 0 (0.0%) |
| Total | 395 (63.1%) | 231 (36.9%) |
Employment Characteristics in Kerr County
Employment by Class of Employer in Kerr County
Among the 22,844 employed individuals in Kerr County, private company employees (14,095 | 61.7%), self-employed (not incorporated) (2,442 | 10.7%), and not-for-profit organizations (2,391 | 10.5%) make up the most common classes of employment.
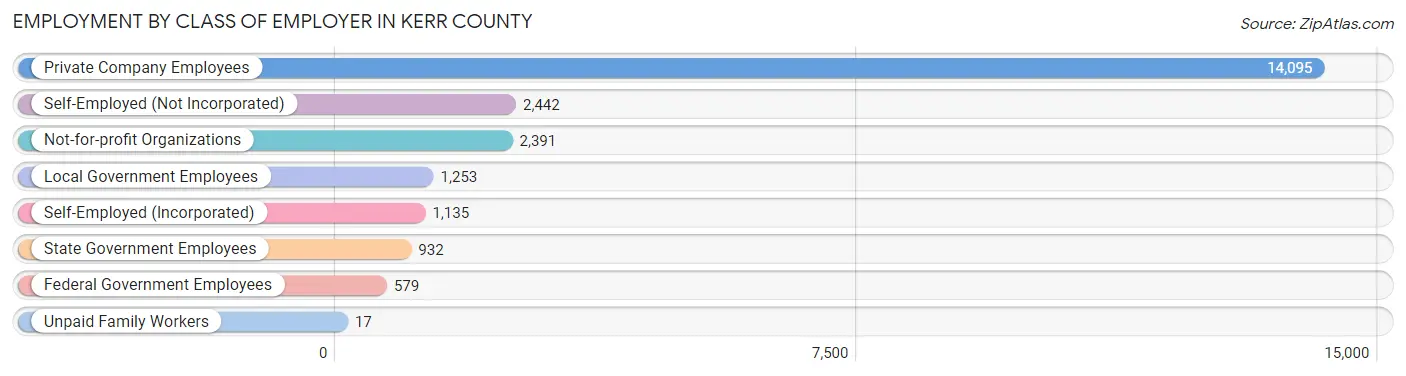
| Employer Class | # Employees | % Employees |
| Private Company Employees | 14,095 | 61.7% |
| Self-Employed (Incorporated) | 1,135 | 5.0% |
| Self-Employed (Not Incorporated) | 2,442 | 10.7% |
| Not-for-profit Organizations | 2,391 | 10.5% |
| Local Government Employees | 1,253 | 5.5% |
| State Government Employees | 932 | 4.1% |
| Federal Government Employees | 579 | 2.5% |
| Unpaid Family Workers | 17 | 0.1% |
| Total | 22,844 | 100.0% |
Employment Status by Age in Kerr County
According to the labor force statistics for Kerr County, out of the total population over 16 years of age (44,350), 55.4% or 24,570 individuals are in the labor force, with 3.3% or 811 of them unemployed. The age group with the highest labor force participation rate is 30 to 34 years, with 82.9% or 2,296 individuals in the labor force. Within the labor force, the 16 to 19 years age range has the highest percentage of unemployed individuals, with 16.3% or 218 of them being unemployed.
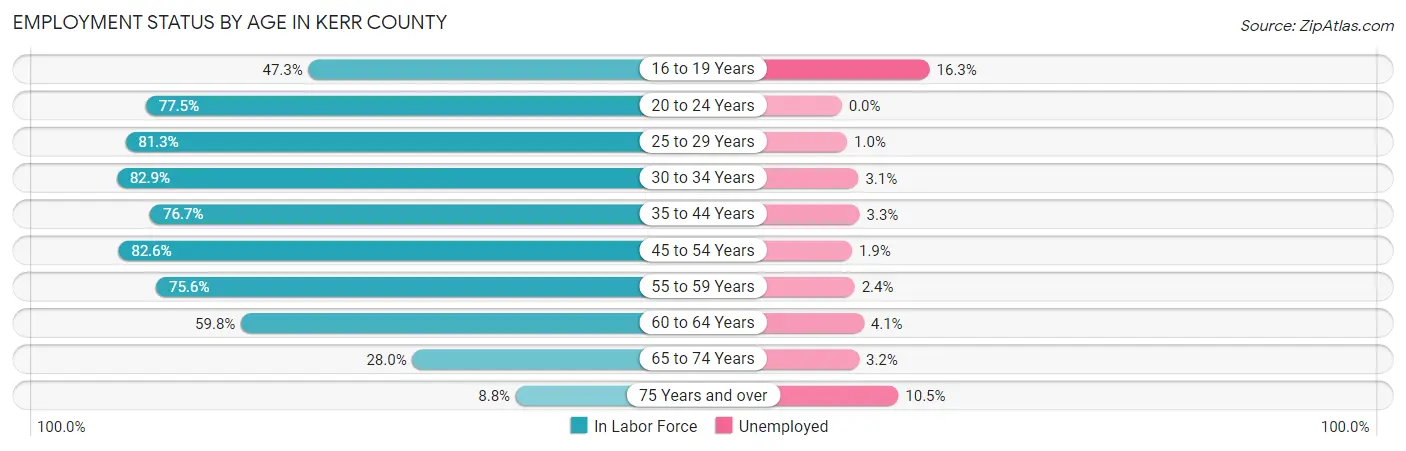
| Age Bracket | In Labor Force | Unemployed |
| 16 to 19 Years | 1,339 (47.3%) | 218 (16.3%) |
| 20 to 24 Years | 2,354 (77.5%) | 0 (0.0%) |
| 25 to 29 Years | 2,230 (81.3%) | 22 (1.0%) |
| 30 to 34 Years | 2,296 (82.9%) | 71 (3.1%) |
| 35 to 44 Years | 3,885 (76.7%) | 128 (3.3%) |
| 45 to 54 Years | 4,670 (82.6%) | 89 (1.9%) |
| 55 to 59 Years | 2,396 (75.6%) | 58 (2.4%) |
| 60 to 64 Years | 2,584 (59.8%) | 106 (4.1%) |
| 65 to 74 Years | 2,208 (28.0%) | 71 (3.2%) |
| 75 Years and over | 605 (8.8%) | 64 (10.5%) |
| Total | 24,570 (55.4%) | 811 (3.3%) |
Employment Status by Educational Attainment in Kerr County
According to labor force statistics for Kerr County, 76.1% of individuals (18,052) out of the total population between 25 and 64 years of age (23,722) are in the labor force, with 2.6% or 469 of them being unemployed. The group with the highest labor force participation rate are those with the educational attainment of bachelor's degree or higher, with 81.2% or 5,396 individuals in the labor force. Within the labor force, individuals with high school diploma education have the highest percentage of unemployment, with 3.4% or 184 of them being unemployed.
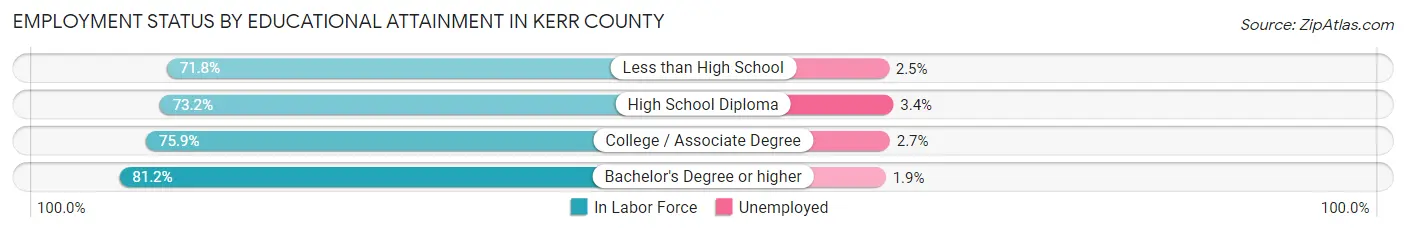
| Educational Attainment | In Labor Force | Unemployed |
| Less than High School | 1,742 (71.8%) | 61 (2.5%) |
| High School Diploma | 5,411 (73.2%) | 251 (3.4%) |
| College / Associate Degree | 5,510 (75.9%) | 196 (2.7%) |
| Bachelor's Degree or higher | 5,396 (81.2%) | 126 (1.9%) |
| Total | 18,052 (76.1%) | 617 (2.6%) |
Employment Occupations by Sex in Kerr County
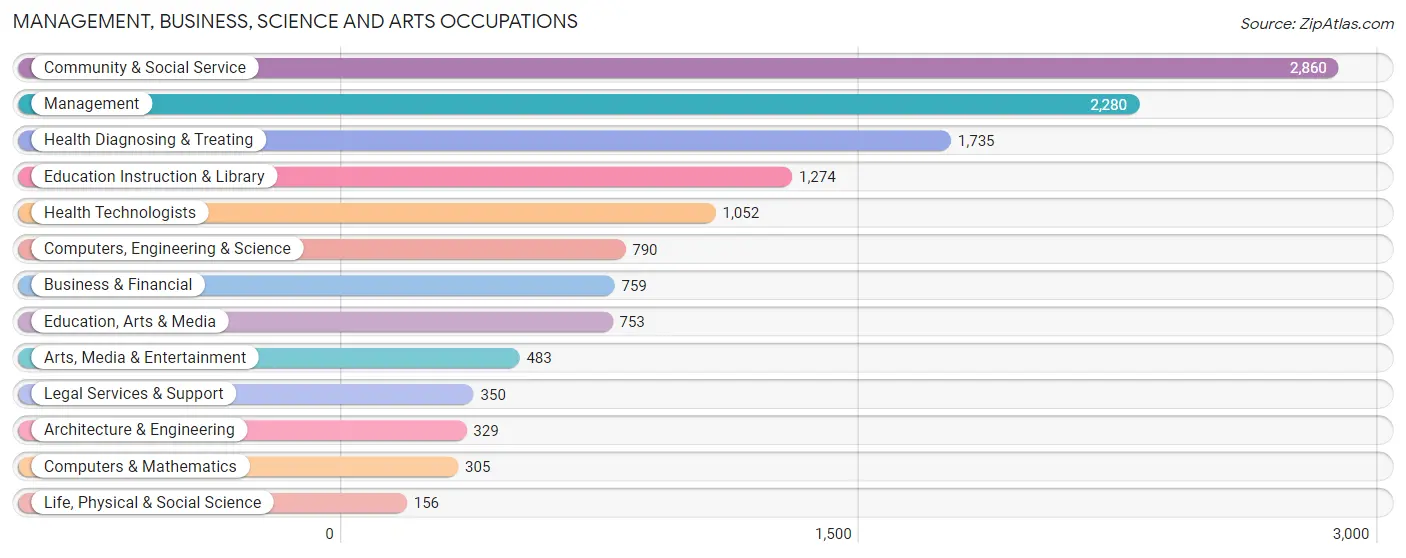
Management, Business, Science and Arts Occupations
The most common Management, Business, Science and Arts occupations in Kerr County are Community & Social Service (2,860 | 12.1%), Management (2,280 | 9.6%), Health Diagnosing & Treating (1,735 | 7.3%), Education Instruction & Library (1,274 | 5.4%), and Health Technologists (1,052 | 4.4%).
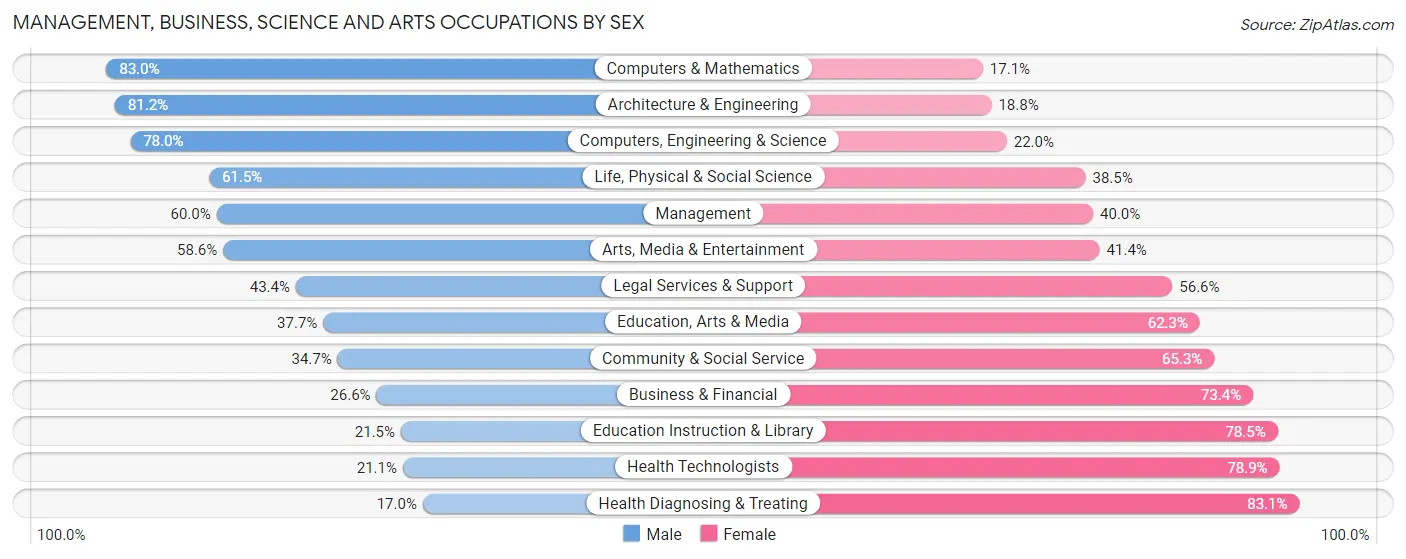
Management, Business, Science and Arts Occupations by Sex
Within the Management, Business, Science and Arts occupations in Kerr County, the most male-oriented occupations are Computers & Mathematics (83.0%), Architecture & Engineering (81.2%), and Computers, Engineering & Science (78.0%), while the most female-oriented occupations are Health Diagnosing & Treating (83.1%), Health Technologists (78.9%), and Education Instruction & Library (78.5%).
| Occupation | Male | Female |
| Management | 1,367 (60.0%) | 913 (40.0%) |
| Business & Financial | 202 (26.6%) | 557 (73.4%) |
| Computers, Engineering & Science | 616 (78.0%) | 174 (22.0%) |
| Computers & Mathematics | 253 (83.0%) | 52 (17.1%) |
| Architecture & Engineering | 267 (81.2%) | 62 (18.8%) |
| Life, Physical & Social Science | 96 (61.5%) | 60 (38.5%) |
| Community & Social Service | 993 (34.7%) | 1,867 (65.3%) |
| Education, Arts & Media | 284 (37.7%) | 469 (62.3%) |
| Legal Services & Support | 152 (43.4%) | 198 (56.6%) |
| Education Instruction & Library | 274 (21.5%) | 1,000 (78.5%) |
| Arts, Media & Entertainment | 283 (58.6%) | 200 (41.4%) |
| Health Diagnosing & Treating | 294 (17.0%) | 1,441 (83.1%) |
| Health Technologists | 222 (21.1%) | 830 (78.9%) |
| Total (Category) | 3,472 (41.2%) | 4,952 (58.8%) |
| Total (Overall) | 12,016 (50.8%) | 11,657 (49.2%) |
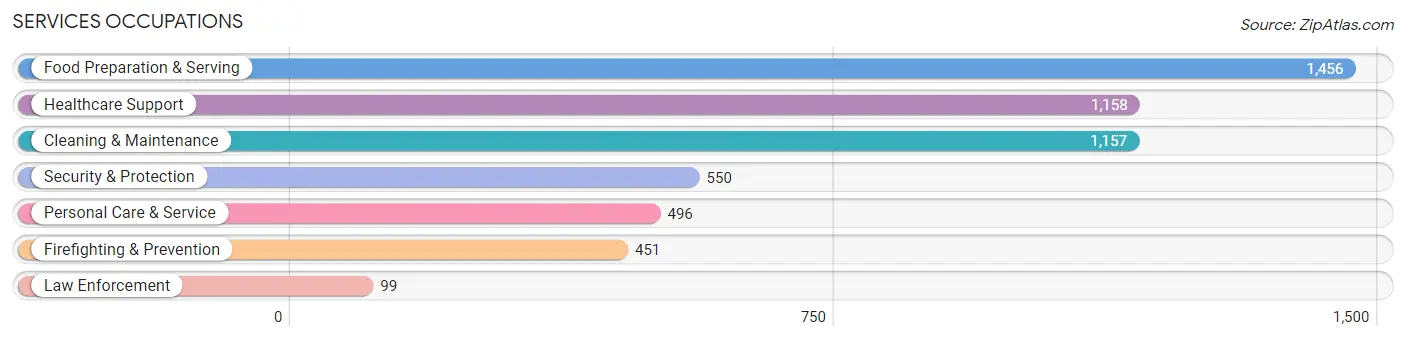
Services Occupations
The most common Services occupations in Kerr County are Food Preparation & Serving (1,456 | 6.1%), Healthcare Support (1,158 | 4.9%), Cleaning & Maintenance (1,157 | 4.9%), Security & Protection (550 | 2.3%), and Personal Care & Service (496 | 2.1%).
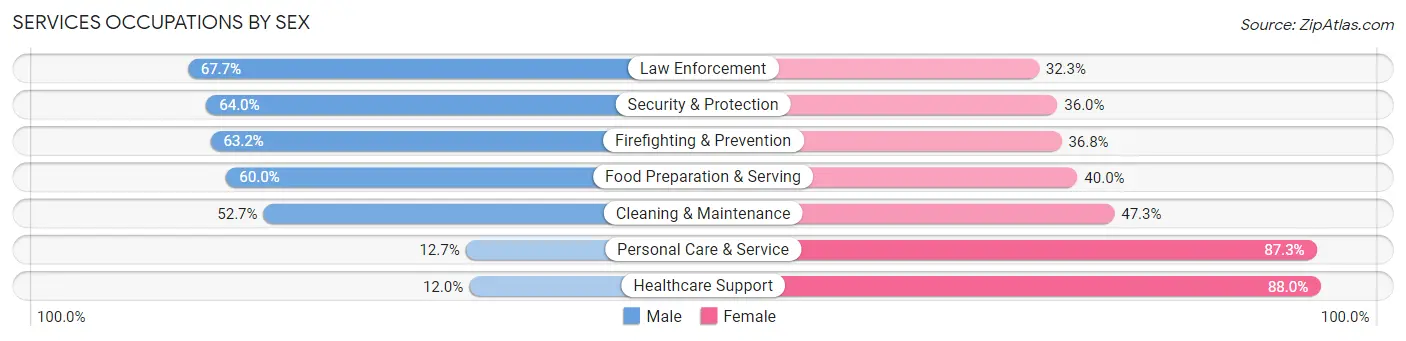
Services Occupations by Sex
Within the Services occupations in Kerr County, the most male-oriented occupations are Law Enforcement (67.7%), Security & Protection (64.0%), and Firefighting & Prevention (63.2%), while the most female-oriented occupations are Healthcare Support (88.0%), Personal Care & Service (87.3%), and Cleaning & Maintenance (47.3%).
| Occupation | Male | Female |
| Healthcare Support | 139 (12.0%) | 1,019 (88.0%) |
| Security & Protection | 352 (64.0%) | 198 (36.0%) |
| Firefighting & Prevention | 285 (63.2%) | 166 (36.8%) |
| Law Enforcement | 67 (67.7%) | 32 (32.3%) |
| Food Preparation & Serving | 874 (60.0%) | 582 (40.0%) |
| Cleaning & Maintenance | 610 (52.7%) | 547 (47.3%) |
| Personal Care & Service | 63 (12.7%) | 433 (87.3%) |
| Total (Category) | 2,038 (42.3%) | 2,779 (57.7%) |
| Total (Overall) | 12,016 (50.8%) | 11,657 (49.2%) |
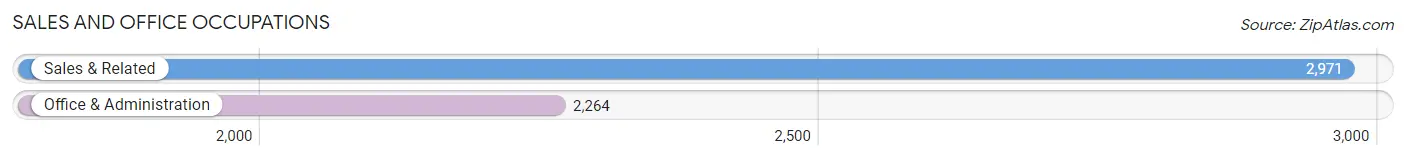
Sales and Office Occupations
The most common Sales and Office occupations in Kerr County are Sales & Related (2,971 | 12.6%), and Office & Administration (2,264 | 9.6%).
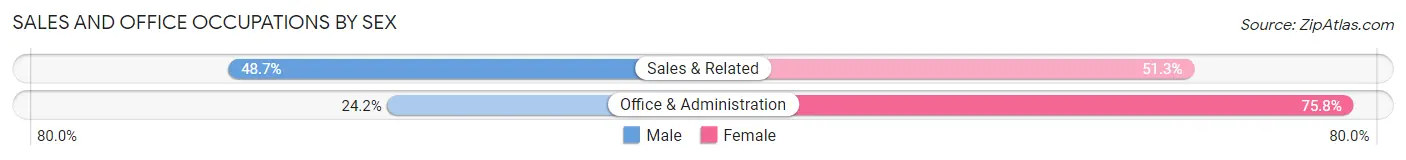
Sales and Office Occupations by Sex
| Occupation | Male | Female |
| Sales & Related | 1,446 (48.7%) | 1,525 (51.3%) |
| Office & Administration | 547 (24.2%) | 1,717 (75.8%) |
| Total (Category) | 1,993 (38.1%) | 3,242 (61.9%) |
| Total (Overall) | 12,016 (50.8%) | 11,657 (49.2%) |
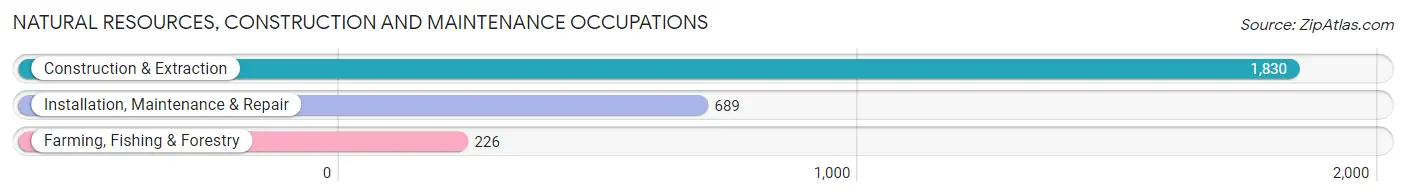
Natural Resources, Construction and Maintenance Occupations
The most common Natural Resources, Construction and Maintenance occupations in Kerr County are Construction & Extraction (1,830 | 7.7%), Installation, Maintenance & Repair (689 | 2.9%), and Farming, Fishing & Forestry (226 | 0.9%).
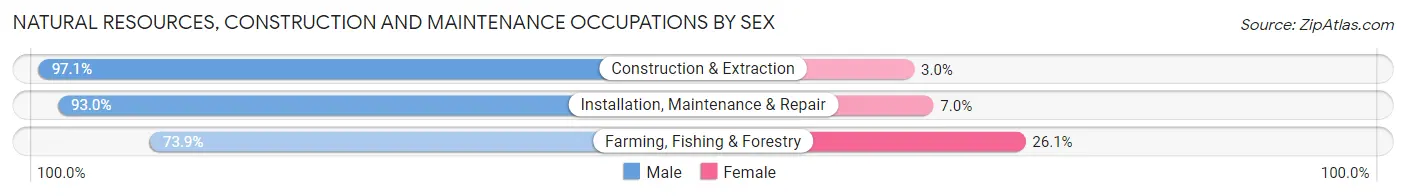
Natural Resources, Construction and Maintenance Occupations by Sex
| Occupation | Male | Female |
| Farming, Fishing & Forestry | 167 (73.9%) | 59 (26.1%) |
| Construction & Extraction | 1,776 (97.1%) | 54 (2.9%) |
| Installation, Maintenance & Repair | 641 (93.0%) | 48 (7.0%) |
| Total (Category) | 2,584 (94.1%) | 161 (5.9%) |
| Total (Overall) | 12,016 (50.8%) | 11,657 (49.2%) |
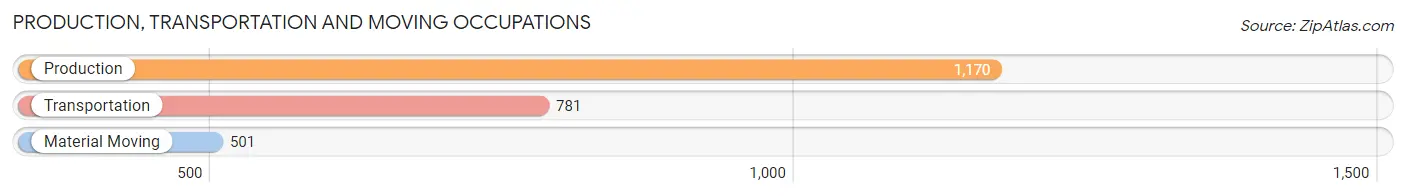
Production, Transportation and Moving Occupations
The most common Production, Transportation and Moving occupations in Kerr County are Production (1,170 | 4.9%), Transportation (781 | 3.3%), and Material Moving (501 | 2.1%).
Production, Transportation and Moving Occupations by Sex
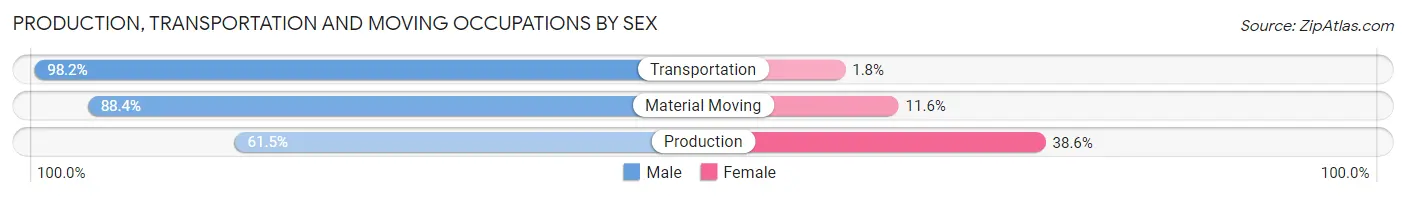
| Occupation | Male | Female |
| Production | 719 (61.5%) | 451 (38.6%) |
| Transportation | 767 (98.2%) | 14 (1.8%) |
| Material Moving | 443 (88.4%) | 58 (11.6%) |
| Total (Category) | 1,929 (78.7%) | 523 (21.3%) |
| Total (Overall) | 12,016 (50.8%) | 11,657 (49.2%) |
Employment Industries by Sex in Kerr County
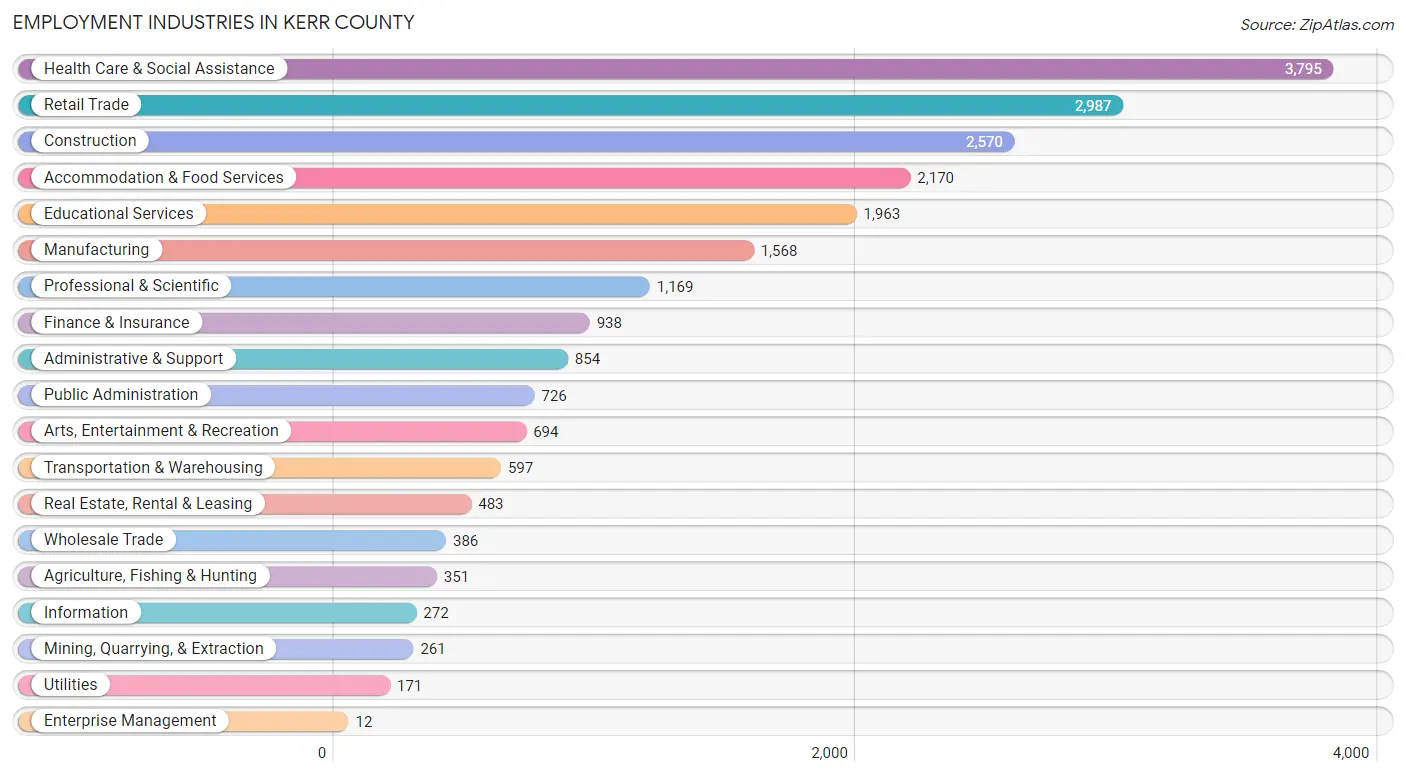
Employment Industries in Kerr County
The major employment industries in Kerr County include Health Care & Social Assistance (3,795 | 16.0%), Retail Trade (2,987 | 12.6%), Construction (2,570 | 10.9%), Accommodation & Food Services (2,170 | 9.2%), and Educational Services (1,963 | 8.3%).
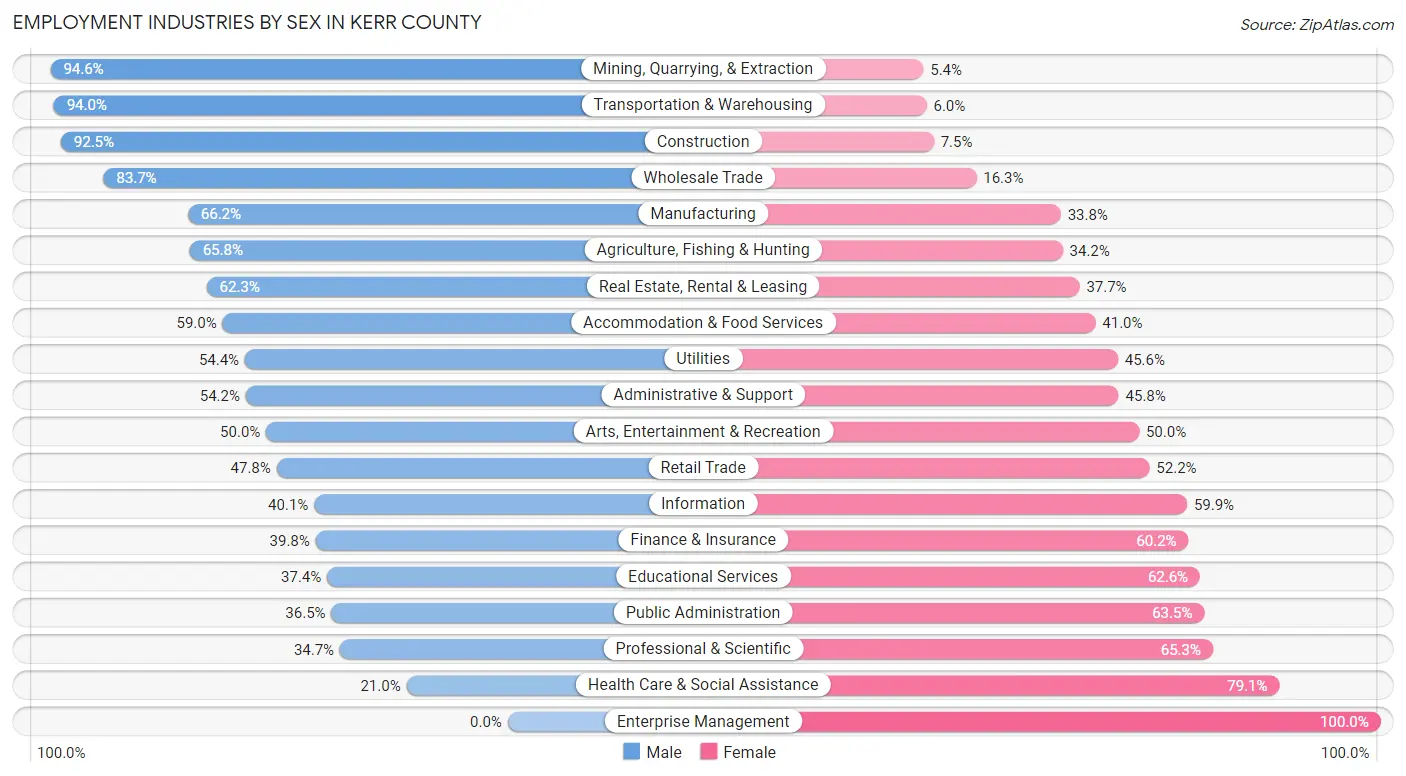
Employment Industries by Sex in Kerr County
The Kerr County industries that see more men than women are Mining, Quarrying, & Extraction (94.6%), Transportation & Warehousing (94.0%), and Construction (92.5%), whereas the industries that tend to have a higher number of women are Enterprise Management (100.0%), Health Care & Social Assistance (79.0%), and Professional & Scientific (65.3%).
| Industry | Male | Female |
| Agriculture, Fishing & Hunting | 231 (65.8%) | 120 (34.2%) |
| Mining, Quarrying, & Extraction | 247 (94.6%) | 14 (5.4%) |
| Construction | 2,377 (92.5%) | 193 (7.5%) |
| Manufacturing | 1,038 (66.2%) | 530 (33.8%) |
| Wholesale Trade | 323 (83.7%) | 63 (16.3%) |
| Retail Trade | 1,429 (47.8%) | 1,558 (52.2%) |
| Transportation & Warehousing | 561 (94.0%) | 36 (6.0%) |
| Utilities | 93 (54.4%) | 78 (45.6%) |
| Information | 109 (40.1%) | 163 (59.9%) |
| Finance & Insurance | 373 (39.8%) | 565 (60.2%) |
| Real Estate, Rental & Leasing | 301 (62.3%) | 182 (37.7%) |
| Professional & Scientific | 406 (34.7%) | 763 (65.3%) |
| Enterprise Management | 0 (0.0%) | 12 (100.0%) |
| Administrative & Support | 463 (54.2%) | 391 (45.8%) |
| Educational Services | 734 (37.4%) | 1,229 (62.6%) |
| Health Care & Social Assistance | 795 (20.9%) | 3,000 (79.0%) |
| Arts, Entertainment & Recreation | 347 (50.0%) | 347 (50.0%) |
| Accommodation & Food Services | 1,281 (59.0%) | 889 (41.0%) |
| Public Administration | 265 (36.5%) | 461 (63.5%) |
| Total | 12,016 (50.8%) | 11,657 (49.2%) |
Education in Kerr County
School Enrollment in Kerr County
The most common levels of schooling among the 9,883 students in Kerr County are high school (2,480 | 25.1%), middle school (2,353 | 23.8%), and elementary school (1,920 | 19.4%).
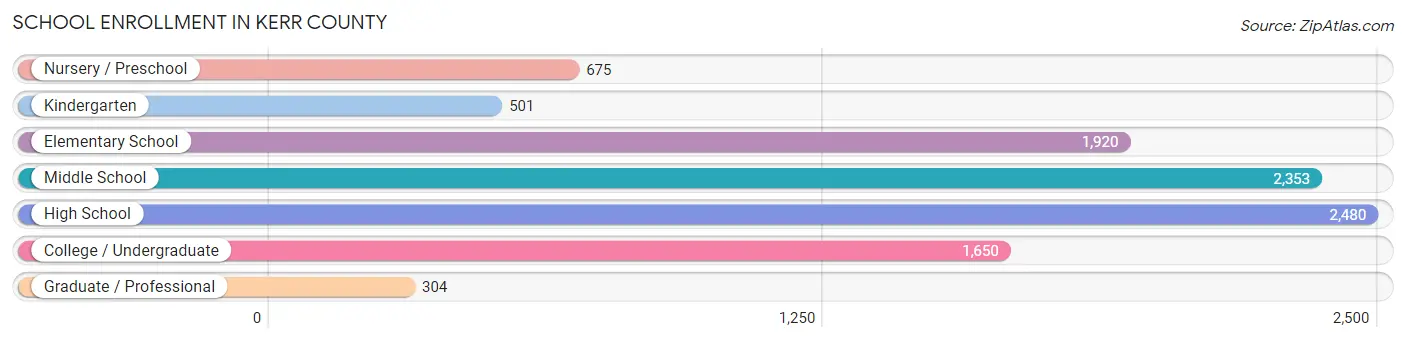
| School Level | # Students | % Students |
| Nursery / Preschool | 675 | 6.8% |
| Kindergarten | 501 | 5.1% |
| Elementary School | 1,920 | 19.4% |
| Middle School | 2,353 | 23.8% |
| High School | 2,480 | 25.1% |
| College / Undergraduate | 1,650 | 16.7% |
| Graduate / Professional | 304 | 3.1% |
| Total | 9,883 | 100.0% |
School Enrollment by Age by Funding Source in Kerr County
Out of a total of 9,883 students who are enrolled in schools in Kerr County, 1,917 (19.4%) attend a private institution, while the remaining 7,966 (80.6%) are enrolled in public schools. The age group of 35 years and over has the highest likelihood of being enrolled in private schools, with 148 (43.9% in the age bracket) enrolled. Conversely, the age group of 15 to 17 year olds has the lowest likelihood of being enrolled in a private school, with 1,532 (89.8% in the age bracket) attending a public institution.
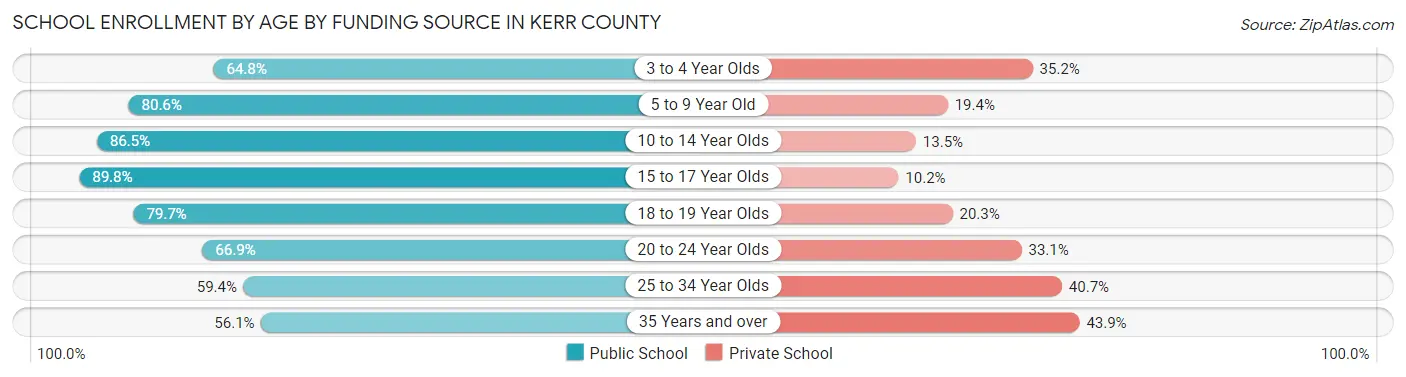
| Age Bracket | Public School | Private School |
| 3 to 4 Year Olds | 254 (64.8%) | 138 (35.2%) |
| 5 to 9 Year Old | 1,868 (80.6%) | 449 (19.4%) |
| 10 to 14 Year Olds | 2,584 (86.5%) | 402 (13.5%) |
| 15 to 17 Year Olds | 1,532 (89.8%) | 174 (10.2%) |
| 18 to 19 Year Olds | 794 (79.7%) | 202 (20.3%) |
| 20 to 24 Year Olds | 543 (66.9%) | 269 (33.1%) |
| 25 to 34 Year Olds | 200 (59.4%) | 137 (40.6%) |
| 35 Years and over | 189 (56.1%) | 148 (43.9%) |
| Total | 7,966 (80.6%) | 1,917 (19.4%) |
Educational Attainment by Field of Study in Kerr County
Business (2,181 | 17.7%), education (1,656 | 13.4%), science & technology (1,192 | 9.7%), engineering (782 | 6.3%), and literature & languages (780 | 6.3%) are the most common fields of study among 12,334 individuals in Kerr County who have obtained a bachelor's degree or higher.
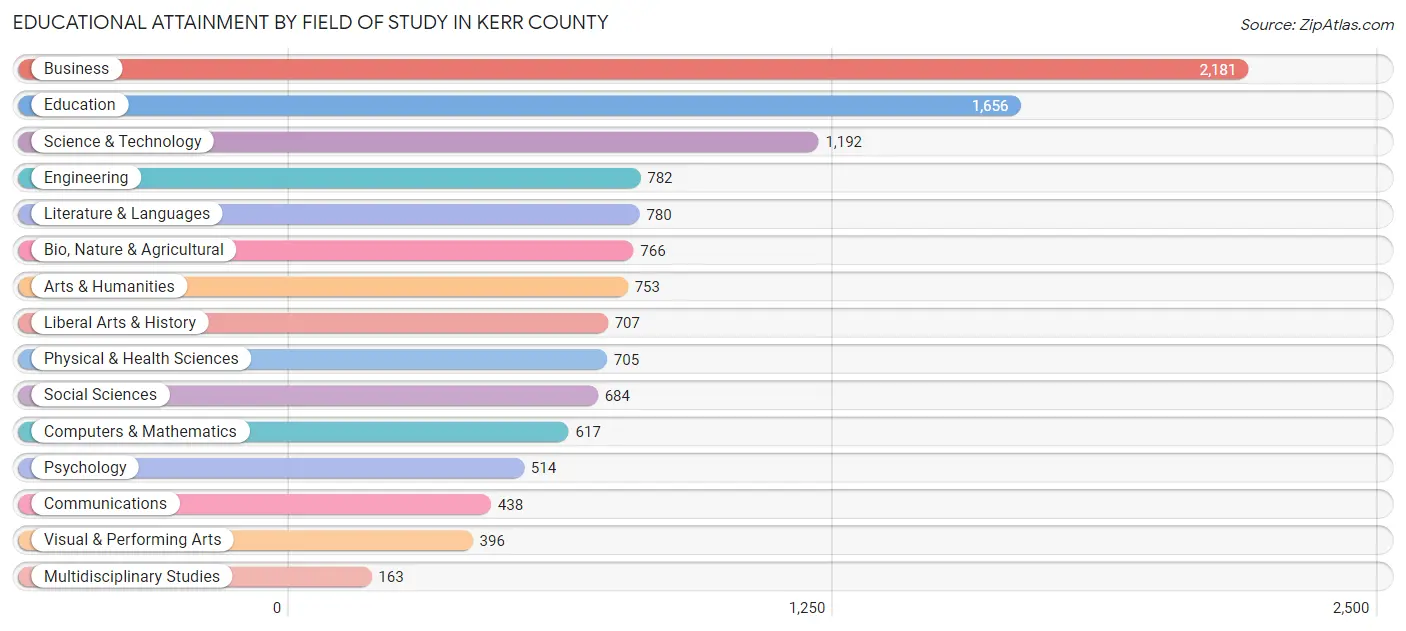
| Field of Study | # Graduates | % Graduates |
| Computers & Mathematics | 617 | 5.0% |
| Bio, Nature & Agricultural | 766 | 6.2% |
| Physical & Health Sciences | 705 | 5.7% |
| Psychology | 514 | 4.2% |
| Social Sciences | 684 | 5.6% |
| Engineering | 782 | 6.3% |
| Multidisciplinary Studies | 163 | 1.3% |
| Science & Technology | 1,192 | 9.7% |
| Business | 2,181 | 17.7% |
| Education | 1,656 | 13.4% |
| Literature & Languages | 780 | 6.3% |
| Liberal Arts & History | 707 | 5.7% |
| Visual & Performing Arts | 396 | 3.2% |
| Communications | 438 | 3.5% |
| Arts & Humanities | 753 | 6.1% |
| Total | 12,334 | 100.0% |
Transportation & Commute in Kerr County
Vehicle Availability by Sex in Kerr County
The most prevalent vehicle ownership categories in Kerr County are males with 2 vehicles (5,053, accounting for 43.9%) and females with 2 vehicles (4,981, making up 45.9%).
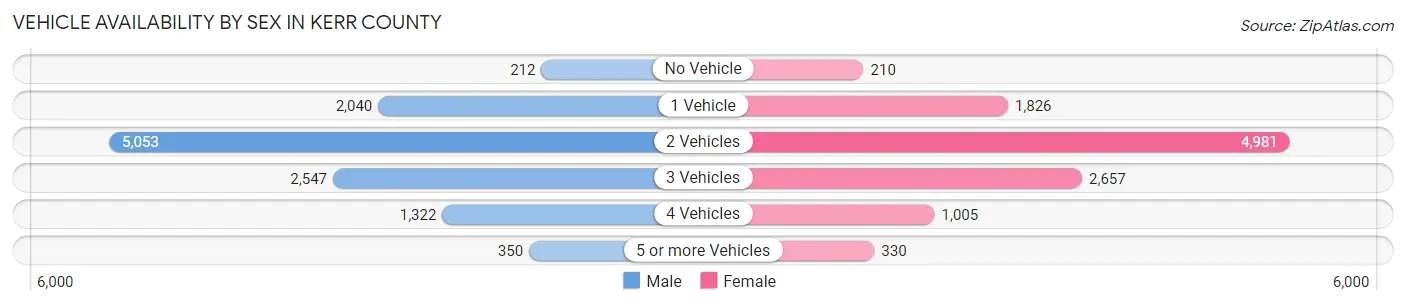
| Vehicles Available | Male | Female |
| No Vehicle | 212 (1.8%) | 210 (1.9%) |
| 1 Vehicle | 2,040 (17.7%) | 1,826 (16.6%) |
| 2 Vehicles | 5,053 (43.9%) | 4,981 (45.2%) |
| 3 Vehicles | 2,547 (22.1%) | 2,657 (24.1%) |
| 4 Vehicles | 1,322 (11.5%) | 1,005 (9.1%) |
| 5 or more Vehicles | 350 (3.0%) | 330 (3.0%) |
| Total | 11,524 (100.0%) | 11,009 (100.0%) |
Commute Time in Kerr County
The most frequently occuring commute durations in Kerr County are 10 to 14 minutes (4,490 commuters, 21.6%), 5 to 9 minutes (3,844 commuters, 18.5%), and 15 to 19 minutes (3,442 commuters, 16.6%).
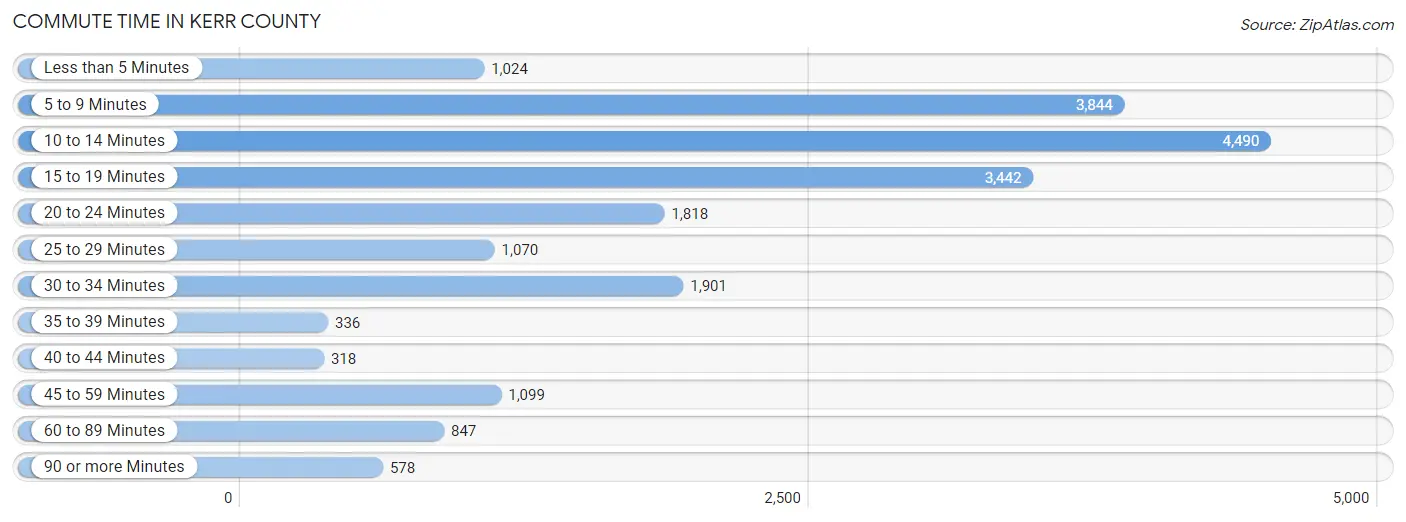
| Commute Time | # Commuters | % Commuters |
| Less than 5 Minutes | 1,024 | 4.9% |
| 5 to 9 Minutes | 3,844 | 18.5% |
| 10 to 14 Minutes | 4,490 | 21.6% |
| 15 to 19 Minutes | 3,442 | 16.6% |
| 20 to 24 Minutes | 1,818 | 8.7% |
| 25 to 29 Minutes | 1,070 | 5.1% |
| 30 to 34 Minutes | 1,901 | 9.1% |
| 35 to 39 Minutes | 336 | 1.6% |
| 40 to 44 Minutes | 318 | 1.5% |
| 45 to 59 Minutes | 1,099 | 5.3% |
| 60 to 89 Minutes | 847 | 4.1% |
| 90 or more Minutes | 578 | 2.8% |
Commute Time by Sex in Kerr County
The most common commute times in Kerr County are 10 to 14 minutes (2,532 commuters, 23.3%) for males and 5 to 9 minutes (1,973 commuters, 20.0%) for females.
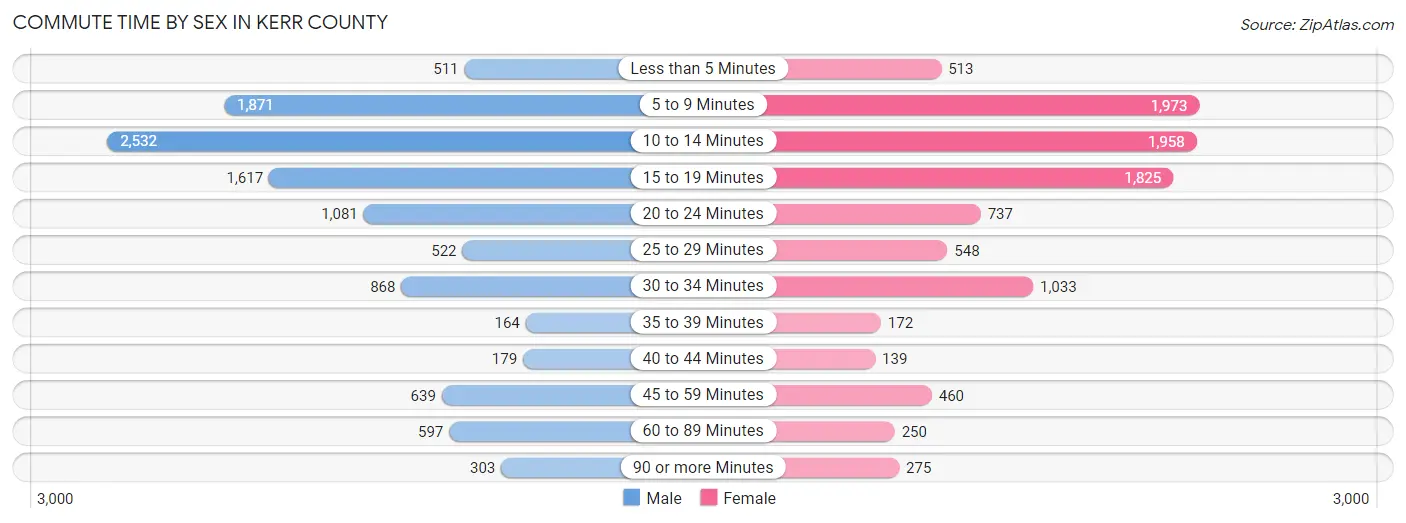
| Commute Time | Male | Female |
| Less than 5 Minutes | 511 (4.7%) | 513 (5.2%) |
| 5 to 9 Minutes | 1,871 (17.2%) | 1,973 (20.0%) |
| 10 to 14 Minutes | 2,532 (23.3%) | 1,958 (19.8%) |
| 15 to 19 Minutes | 1,617 (14.9%) | 1,825 (18.5%) |
| 20 to 24 Minutes | 1,081 (9.9%) | 737 (7.5%) |
| 25 to 29 Minutes | 522 (4.8%) | 548 (5.5%) |
| 30 to 34 Minutes | 868 (8.0%) | 1,033 (10.4%) |
| 35 to 39 Minutes | 164 (1.5%) | 172 (1.7%) |
| 40 to 44 Minutes | 179 (1.6%) | 139 (1.4%) |
| 45 to 59 Minutes | 639 (5.9%) | 460 (4.6%) |
| 60 to 89 Minutes | 597 (5.5%) | 250 (2.5%) |
| 90 or more Minutes | 303 (2.8%) | 275 (2.8%) |
Time of Departure to Work by Sex in Kerr County
The most frequent times of departure to work in Kerr County are 7:00 AM to 7:29 AM (1,961, 18.0%) for males and 7:00 AM to 7:29 AM (1,727, 17.5%) for females.
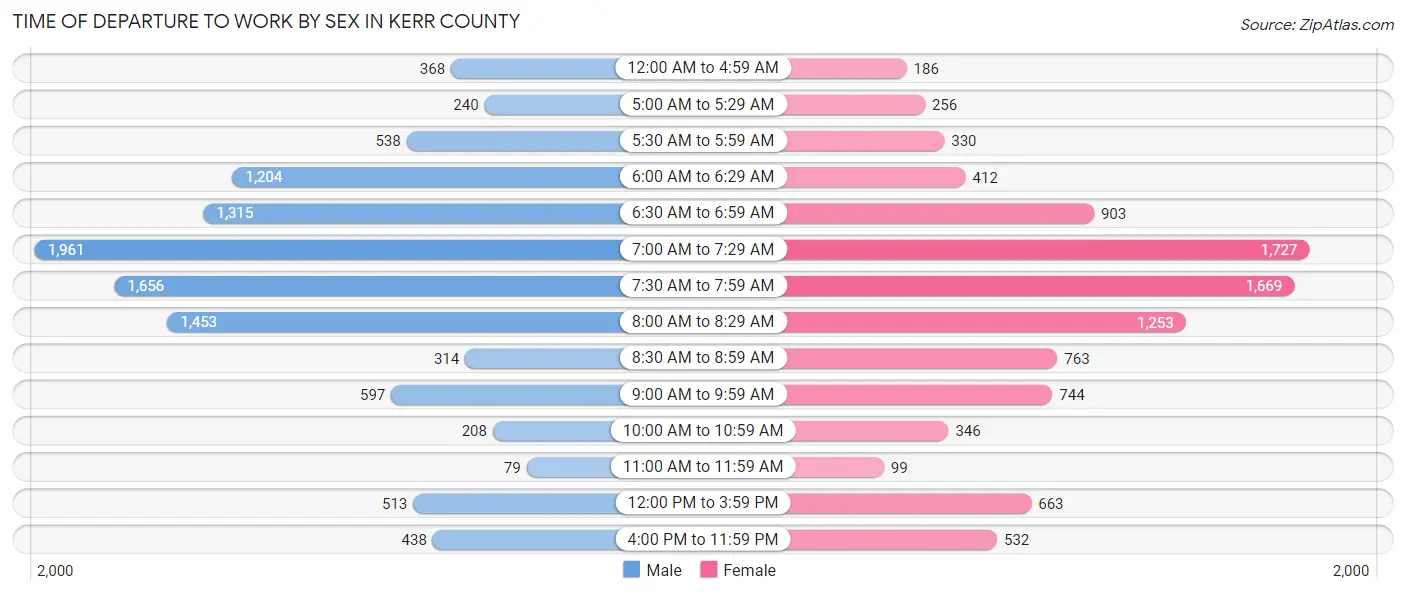
| Time of Departure | Male | Female |
| 12:00 AM to 4:59 AM | 368 (3.4%) | 186 (1.9%) |
| 5:00 AM to 5:29 AM | 240 (2.2%) | 256 (2.6%) |
| 5:30 AM to 5:59 AM | 538 (4.9%) | 330 (3.3%) |
| 6:00 AM to 6:29 AM | 1,204 (11.1%) | 412 (4.2%) |
| 6:30 AM to 6:59 AM | 1,315 (12.1%) | 903 (9.1%) |
| 7:00 AM to 7:29 AM | 1,961 (18.0%) | 1,727 (17.5%) |
| 7:30 AM to 7:59 AM | 1,656 (15.2%) | 1,669 (16.9%) |
| 8:00 AM to 8:29 AM | 1,453 (13.4%) | 1,253 (12.7%) |
| 8:30 AM to 8:59 AM | 314 (2.9%) | 763 (7.7%) |
| 9:00 AM to 9:59 AM | 597 (5.5%) | 744 (7.5%) |
| 10:00 AM to 10:59 AM | 208 (1.9%) | 346 (3.5%) |
| 11:00 AM to 11:59 AM | 79 (0.7%) | 99 (1.0%) |
| 12:00 PM to 3:59 PM | 513 (4.7%) | 663 (6.7%) |
| 4:00 PM to 11:59 PM | 438 (4.0%) | 532 (5.4%) |
| Total | 10,884 (100.0%) | 9,883 (100.0%) |
Housing Occupancy in Kerr County
Occupancy by Ownership in Kerr County
Of the total 22,024 dwellings in Kerr County, owner-occupied units account for 15,571 (70.7%), while renter-occupied units make up 6,453 (29.3%).
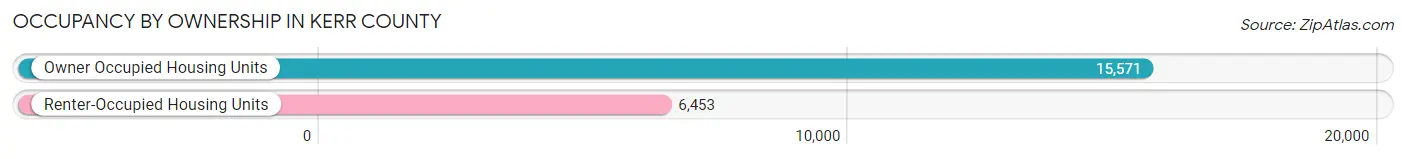
| Occupancy | # Housing Units | % Housing Units |
| Owner Occupied Housing Units | 15,571 | 70.7% |
| Renter-Occupied Housing Units | 6,453 | 29.3% |
| Total Occupied Housing Units | 22,024 | 100.0% |
Occupancy by Household Size in Kerr County
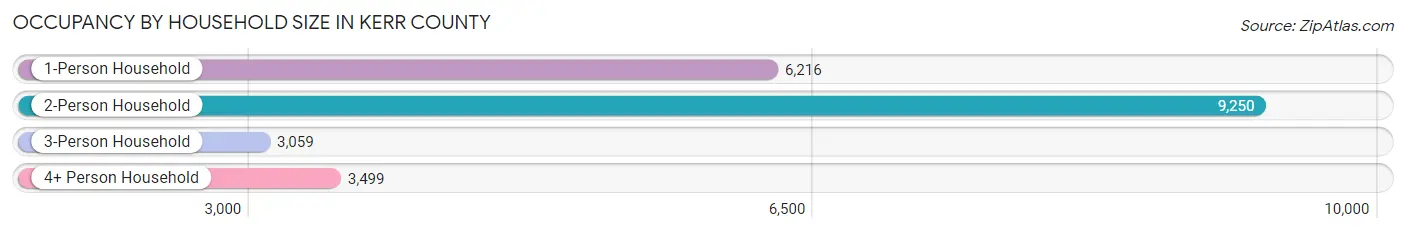
| Household Size | # Housing Units | % Housing Units |
| 1-Person Household | 6,216 | 28.2% |
| 2-Person Household | 9,250 | 42.0% |
| 3-Person Household | 3,059 | 13.9% |
| 4+ Person Household | 3,499 | 15.9% |
| Total Housing Units | 22,024 | 100.0% |
Occupancy by Ownership by Household Size in Kerr County
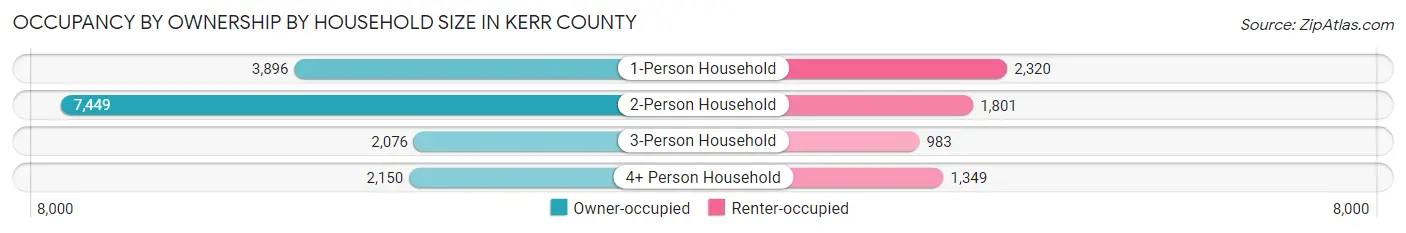
| Household Size | Owner-occupied | Renter-occupied |
| 1-Person Household | 3,896 (62.7%) | 2,320 (37.3%) |
| 2-Person Household | 7,449 (80.5%) | 1,801 (19.5%) |
| 3-Person Household | 2,076 (67.9%) | 983 (32.1%) |
| 4+ Person Household | 2,150 (61.5%) | 1,349 (38.6%) |
| Total Housing Units | 15,571 (70.7%) | 6,453 (29.3%) |
Occupancy by Educational Attainment in Kerr County
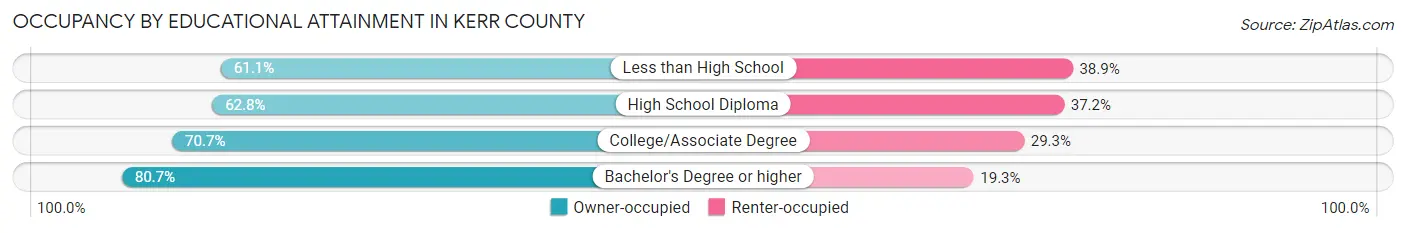
| Household Size | Owner-occupied | Renter-occupied |
| Less than High School | 1,304 (61.1%) | 831 (38.9%) |
| High School Diploma | 3,680 (62.8%) | 2,180 (37.2%) |
| College/Associate Degree | 5,226 (70.7%) | 2,162 (29.3%) |
| Bachelor's Degree or higher | 5,361 (80.7%) | 1,280 (19.3%) |
Occupancy by Age of Householder in Kerr County
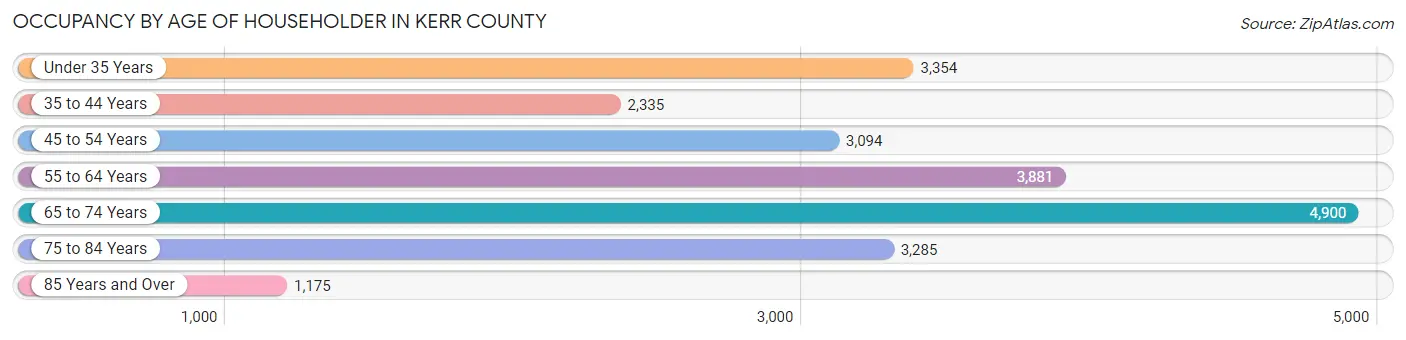
| Age Bracket | # Households | % Households |
| Under 35 Years | 3,354 | 15.2% |
| 35 to 44 Years | 2,335 | 10.6% |
| 45 to 54 Years | 3,094 | 14.1% |
| 55 to 64 Years | 3,881 | 17.6% |
| 65 to 74 Years | 4,900 | 22.3% |
| 75 to 84 Years | 3,285 | 14.9% |
| 85 Years and Over | 1,175 | 5.3% |
| Total | 22,024 | 100.0% |
Housing Finances in Kerr County
Median Income by Occupancy in Kerr County
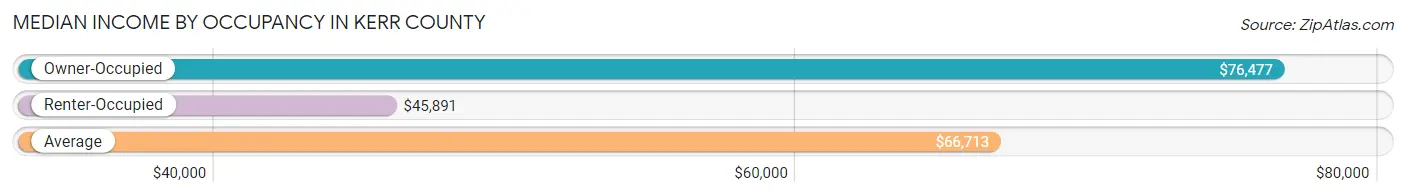
| Occupancy Type | # Households | Median Income |
| Owner-Occupied | 15,571 (70.7%) | $76,477 |
| Renter-Occupied | 6,453 (29.3%) | $45,891 |
| Average | 22,024 (100.0%) | $66,713 |
Occupancy by Householder Income Bracket in Kerr County
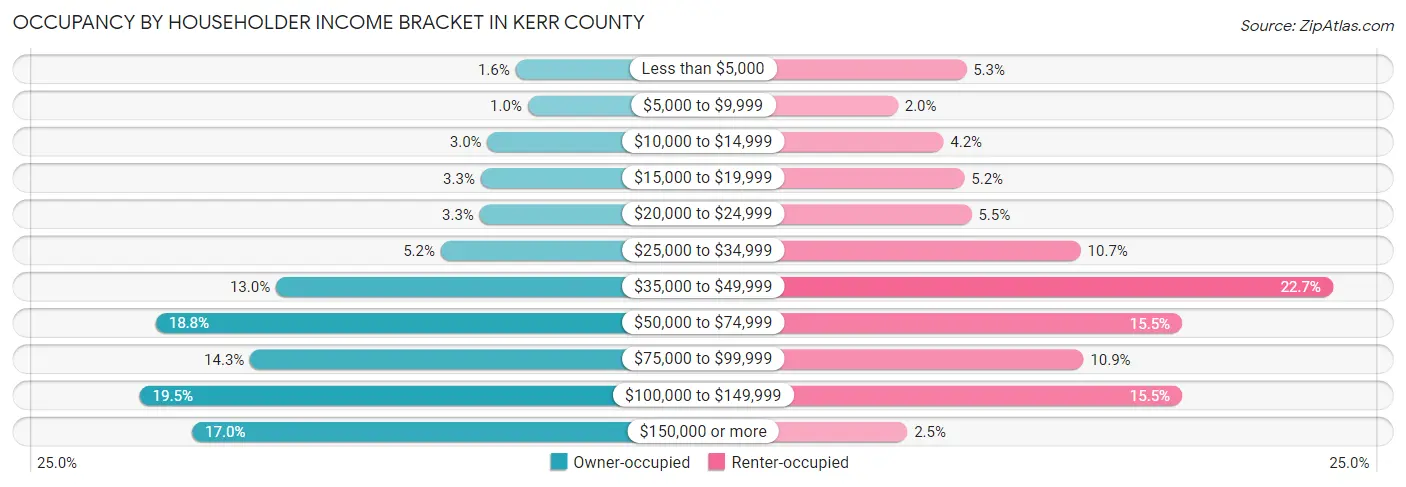
| Income Bracket | Owner-occupied | Renter-occupied |
| Less than $5,000 | 253 (1.6%) | 340 (5.3%) |
| $5,000 to $9,999 | 162 (1.0%) | 130 (2.0%) |
| $10,000 to $14,999 | 461 (3.0%) | 270 (4.2%) |
| $15,000 to $19,999 | 511 (3.3%) | 334 (5.2%) |
| $20,000 to $24,999 | 519 (3.3%) | 356 (5.5%) |
| $25,000 to $34,999 | 807 (5.2%) | 692 (10.7%) |
| $35,000 to $49,999 | 2,029 (13.0%) | 1,466 (22.7%) |
| $50,000 to $74,999 | 2,920 (18.8%) | 1,003 (15.5%) |
| $75,000 to $99,999 | 2,220 (14.3%) | 700 (10.8%) |
| $100,000 to $149,999 | 3,039 (19.5%) | 1,003 (15.5%) |
| $150,000 or more | 2,650 (17.0%) | 159 (2.5%) |
| Total | 15,571 (100.0%) | 6,453 (100.0%) |
Monthly Housing Cost Tiers in Kerr County
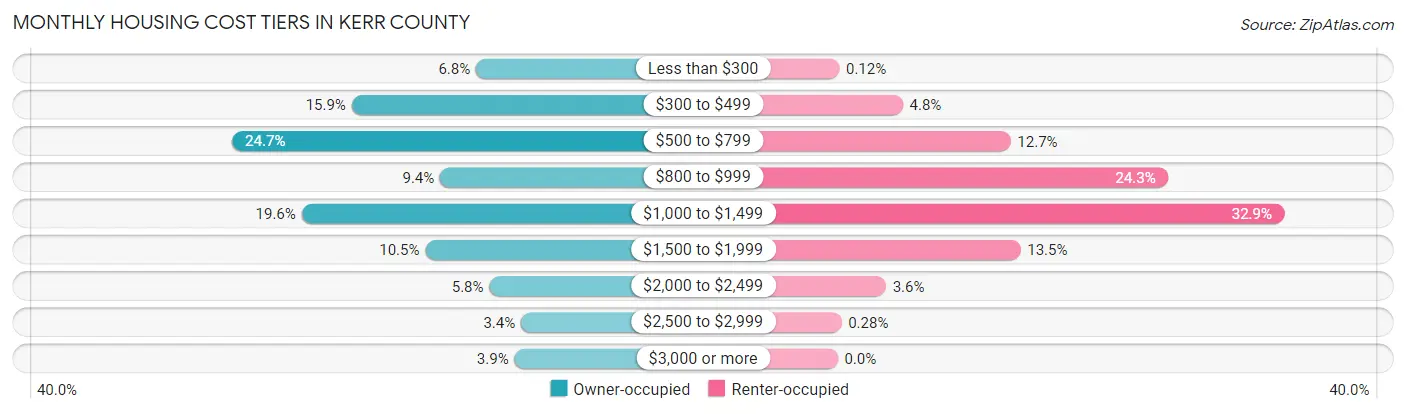
| Monthly Cost | Owner-occupied | Renter-occupied |
| Less than $300 | 1,051 (6.8%) | 8 (0.1%) |
| $300 to $499 | 2,478 (15.9%) | 310 (4.8%) |
| $500 to $799 | 3,848 (24.7%) | 822 (12.7%) |
| $800 to $999 | 1,464 (9.4%) | 1,569 (24.3%) |
| $1,000 to $1,499 | 3,052 (19.6%) | 2,121 (32.9%) |
| $1,500 to $1,999 | 1,634 (10.5%) | 869 (13.5%) |
| $2,000 to $2,499 | 898 (5.8%) | 230 (3.6%) |
| $2,500 to $2,999 | 536 (3.4%) | 18 (0.3%) |
| $3,000 or more | 610 (3.9%) | 0 (0.0%) |
| Total | 15,571 (100.0%) | 6,453 (100.0%) |
Physical Housing Characteristics in Kerr County
Housing Structures in Kerr County
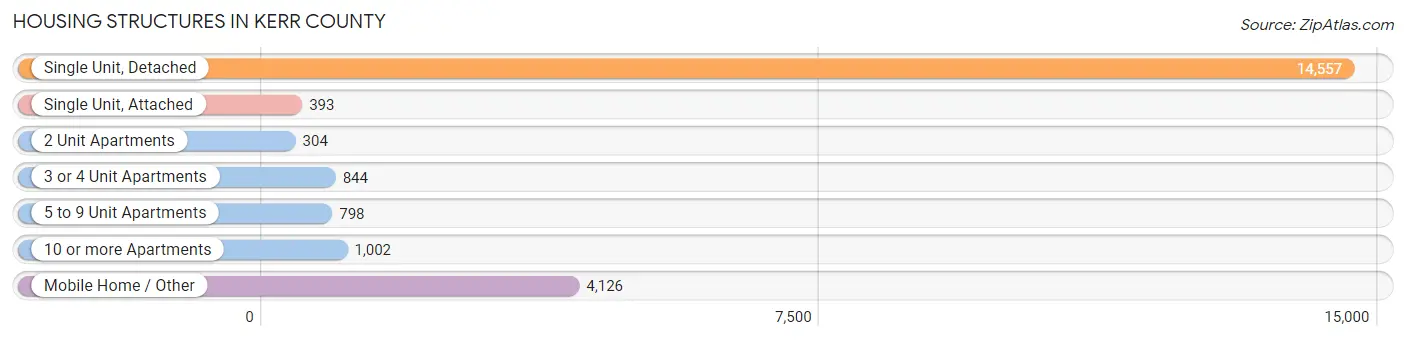
| Structure Type | # Housing Units | % Housing Units |
| Single Unit, Detached | 14,557 | 66.1% |
| Single Unit, Attached | 393 | 1.8% |
| 2 Unit Apartments | 304 | 1.4% |
| 3 or 4 Unit Apartments | 844 | 3.8% |
| 5 to 9 Unit Apartments | 798 | 3.6% |
| 10 or more Apartments | 1,002 | 4.5% |
| Mobile Home / Other | 4,126 | 18.7% |
| Total | 22,024 | 100.0% |
Housing Structures by Occupancy in Kerr County
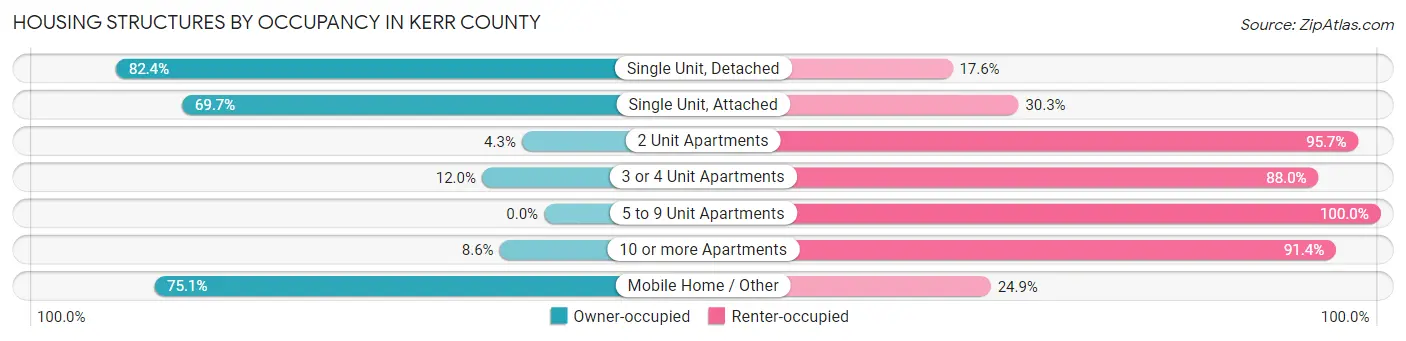
| Structure Type | Owner-occupied | Renter-occupied |
| Single Unit, Detached | 12,000 (82.4%) | 2,557 (17.6%) |
| Single Unit, Attached | 274 (69.7%) | 119 (30.3%) |
| 2 Unit Apartments | 13 (4.3%) | 291 (95.7%) |
| 3 or 4 Unit Apartments | 101 (12.0%) | 743 (88.0%) |
| 5 to 9 Unit Apartments | 0 (0.0%) | 798 (100.0%) |
| 10 or more Apartments | 86 (8.6%) | 916 (91.4%) |
| Mobile Home / Other | 3,097 (75.1%) | 1,029 (24.9%) |
| Total | 15,571 (70.7%) | 6,453 (29.3%) |
Housing Structures by Number of Rooms in Kerr County
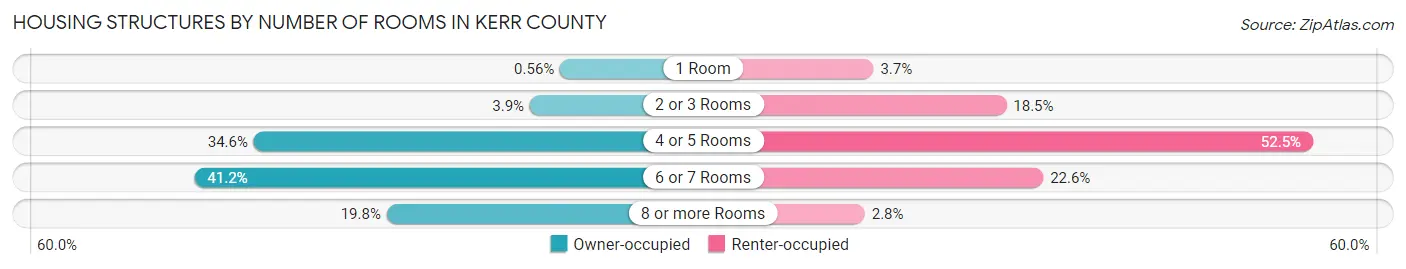
| Number of Rooms | Owner-occupied | Renter-occupied |
| 1 Room | 87 (0.6%) | 240 (3.7%) |
| 2 or 3 Rooms | 610 (3.9%) | 1,192 (18.5%) |
| 4 or 5 Rooms | 5,382 (34.6%) | 3,387 (52.5%) |
| 6 or 7 Rooms | 6,408 (41.1%) | 1,456 (22.6%) |
| 8 or more Rooms | 3,084 (19.8%) | 178 (2.8%) |
| Total | 15,571 (100.0%) | 6,453 (100.0%) |
Housing Structure by Heating Type in Kerr County
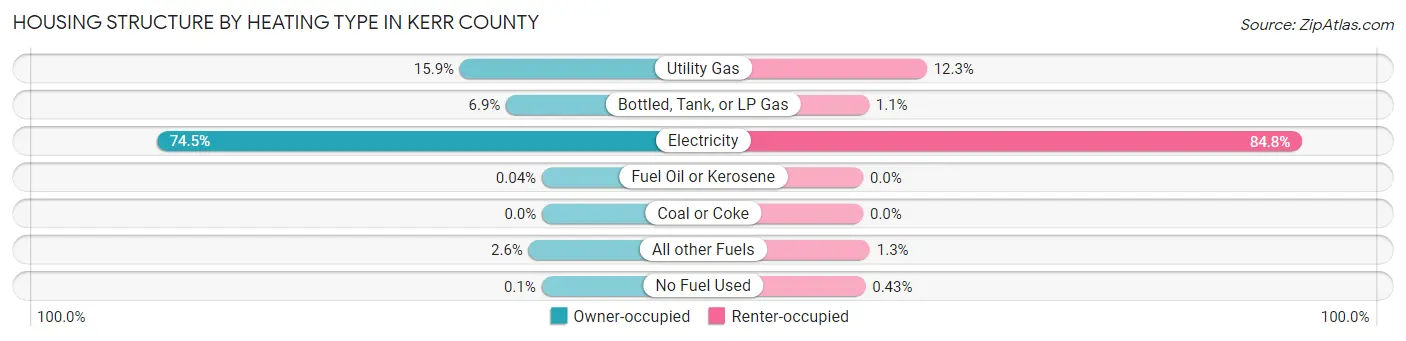
| Heating Type | Owner-occupied | Renter-occupied |
| Utility Gas | 2,473 (15.9%) | 794 (12.3%) |
| Bottled, Tank, or LP Gas | 1,080 (6.9%) | 72 (1.1%) |
| Electricity | 11,594 (74.5%) | 5,474 (84.8%) |
| Fuel Oil or Kerosene | 6 (0.0%) | 0 (0.0%) |
| Coal or Coke | 0 (0.0%) | 0 (0.0%) |
| All other Fuels | 403 (2.6%) | 85 (1.3%) |
| No Fuel Used | 15 (0.1%) | 28 (0.4%) |
| Total | 15,571 (100.0%) | 6,453 (100.0%) |
Household Vehicle Usage in Kerr County
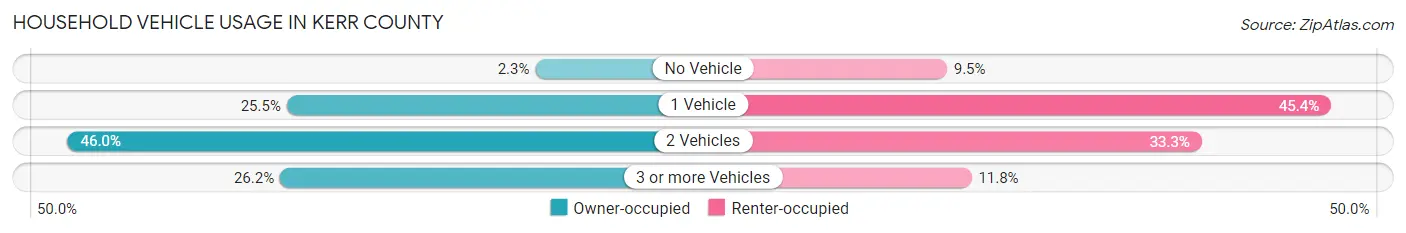
| Vehicles per Household | Owner-occupied | Renter-occupied |
| No Vehicle | 363 (2.3%) | 614 (9.5%) |
| 1 Vehicle | 3,976 (25.5%) | 2,928 (45.4%) |
| 2 Vehicles | 7,159 (46.0%) | 2,149 (33.3%) |
| 3 or more Vehicles | 4,073 (26.2%) | 762 (11.8%) |
| Total | 15,571 (100.0%) | 6,453 (100.0%) |
Real Estate & Mortgages in Kerr County
Real Estate and Mortgage Overview in Kerr County
| Characteristic | Without Mortgage | With Mortgage |
| Housing Units | 9,138 | 6,433 |
| Median Property Value | $261,900 | $259,500 |
| Median Household Income | $69,612 | $1,417 |
| Monthly Housing Costs | $582 | $600 |
| Real Estate Taxes | $2,772 | $412 |
Property Value by Mortgage Status in Kerr County
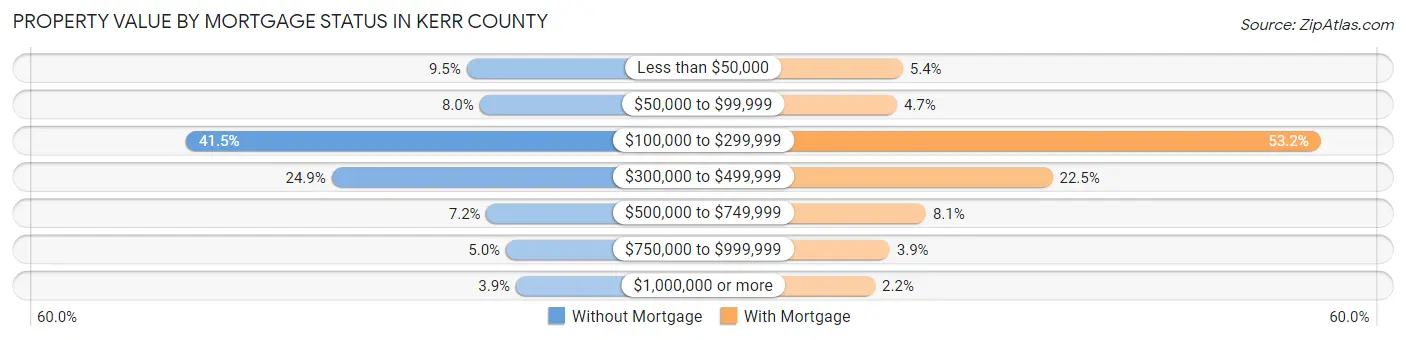
| Property Value | Without Mortgage | With Mortgage |
| Less than $50,000 | 866 (9.5%) | 348 (5.4%) |
| $50,000 to $99,999 | 732 (8.0%) | 304 (4.7%) |
| $100,000 to $299,999 | 3,795 (41.5%) | 3,419 (53.1%) |
| $300,000 to $499,999 | 2,277 (24.9%) | 1,448 (22.5%) |
| $500,000 to $749,999 | 660 (7.2%) | 518 (8.1%) |
| $750,000 to $999,999 | 456 (5.0%) | 252 (3.9%) |
| $1,000,000 or more | 352 (3.8%) | 144 (2.2%) |
| Total | 9,138 (100.0%) | 6,433 (100.0%) |
Household Income by Mortgage Status in Kerr County
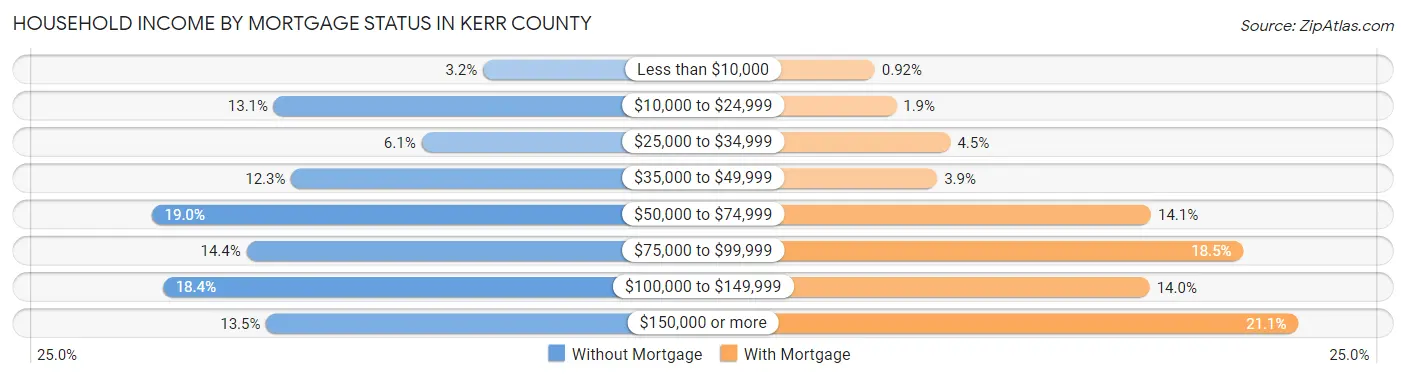
| Household Income | Without Mortgage | With Mortgage |
| Less than $10,000 | 290 (3.2%) | 59 (0.9%) |
| $10,000 to $24,999 | 1,200 (13.1%) | 125 (1.9%) |
| $25,000 to $34,999 | 557 (6.1%) | 291 (4.5%) |
| $35,000 to $49,999 | 1,124 (12.3%) | 250 (3.9%) |
| $50,000 to $74,999 | 1,732 (19.0%) | 905 (14.1%) |
| $75,000 to $99,999 | 1,319 (14.4%) | 1,188 (18.5%) |
| $100,000 to $149,999 | 1,683 (18.4%) | 901 (14.0%) |
| $150,000 or more | 1,233 (13.5%) | 1,356 (21.1%) |
| Total | 9,138 (100.0%) | 6,433 (100.0%) |
Property Value to Household Income Ratio in Kerr County
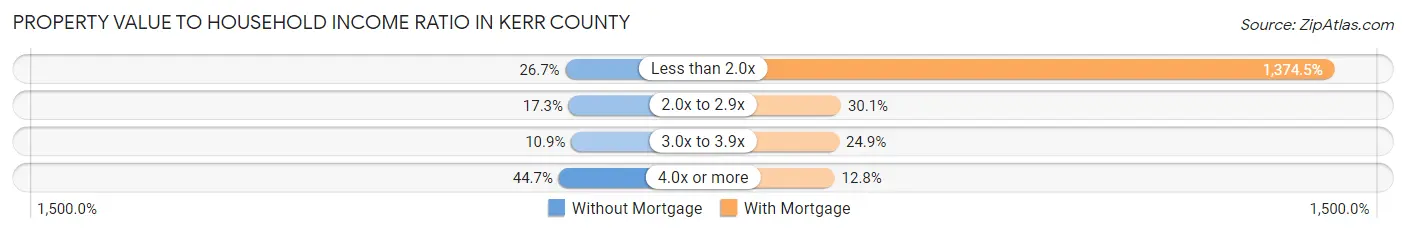
| Value-to-Income Ratio | Without Mortgage | With Mortgage |
| Less than 2.0x | 2,440 (26.7%) | 88,423 (1,374.5%) |
| 2.0x to 2.9x | 1,582 (17.3%) | 1,934 (30.1%) |
| 3.0x to 3.9x | 994 (10.9%) | 1,603 (24.9%) |
| 4.0x or more | 4,082 (44.7%) | 822 (12.8%) |
| Total | 9,138 (100.0%) | 6,433 (100.0%) |
Real Estate Taxes by Mortgage Status in Kerr County
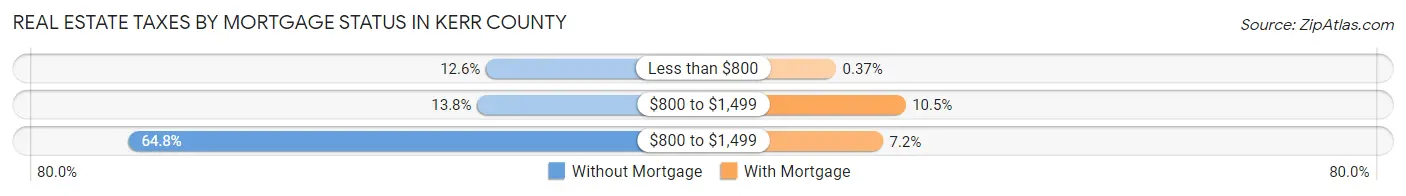
| Property Taxes | Without Mortgage | With Mortgage |
| Less than $800 | 1,147 (12.6%) | 24 (0.4%) |
| $800 to $1,499 | 1,265 (13.8%) | 678 (10.5%) |
| $800 to $1,499 | 5,923 (64.8%) | 465 (7.2%) |
| Total | 9,138 (100.0%) | 6,433 (100.0%) |
Health & Disability in Kerr County
Health Insurance Coverage by Age in Kerr County
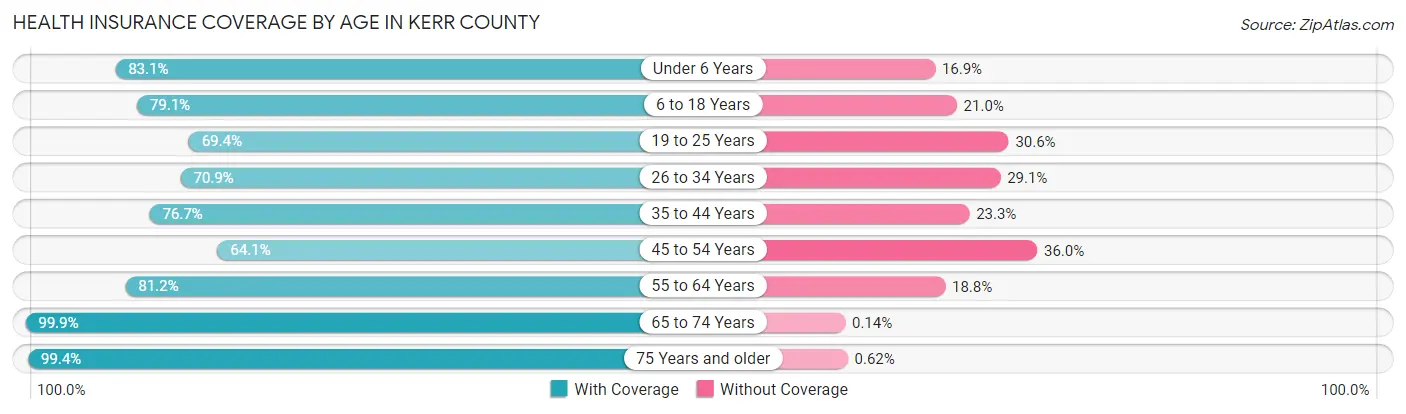
| Age Bracket | With Coverage | Without Coverage |
| Under 6 Years | 2,626 (83.1%) | 534 (16.9%) |
| 6 to 18 Years | 5,758 (79.0%) | 1,526 (20.9%) |
| 19 to 25 Years | 2,838 (69.4%) | 1,252 (30.6%) |
| 26 to 34 Years | 3,516 (70.9%) | 1,441 (29.1%) |
| 35 to 44 Years | 3,871 (76.7%) | 1,175 (23.3%) |
| 45 to 54 Years | 3,577 (64.0%) | 2,008 (35.9%) |
| 55 to 64 Years | 6,033 (81.2%) | 1,395 (18.8%) |
| 65 to 74 Years | 7,665 (99.9%) | 11 (0.1%) |
| 75 Years and older | 6,570 (99.4%) | 41 (0.6%) |
| Total | 42,454 (81.9%) | 9,383 (18.1%) |
Health Insurance Coverage by Citizenship Status in Kerr County
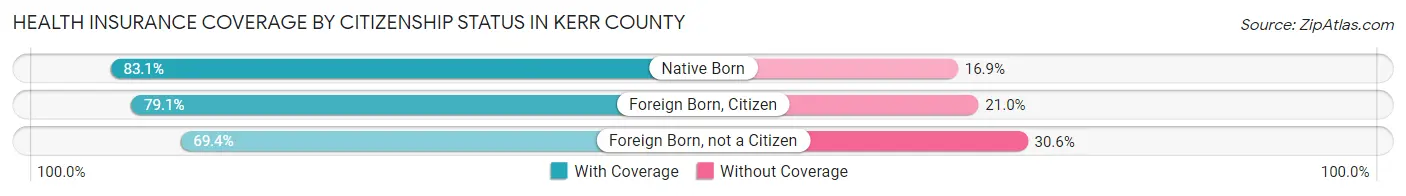
| Citizenship Status | With Coverage | Without Coverage |
| Native Born | 2,626 (83.1%) | 534 (16.9%) |
| Foreign Born, Citizen | 5,758 (79.0%) | 1,526 (20.9%) |
| Foreign Born, not a Citizen | 2,838 (69.4%) | 1,252 (30.6%) |
Health Insurance Coverage by Household Income in Kerr County
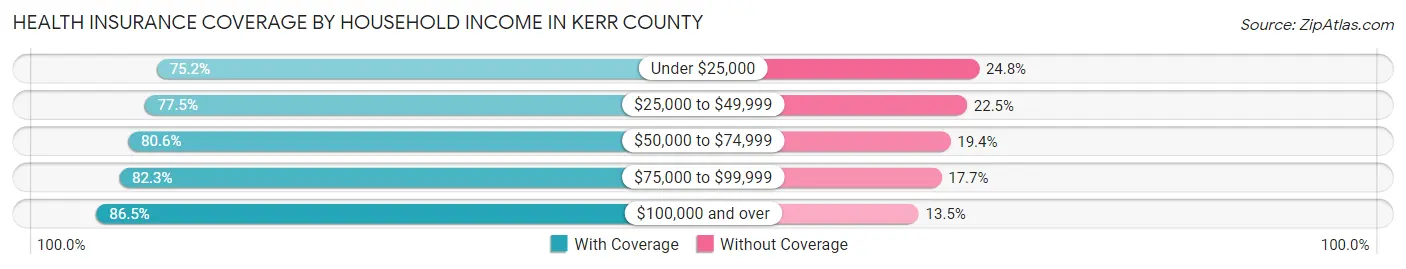
| Household Income | With Coverage | Without Coverage |
| Under $25,000 | 4,121 (75.2%) | 1,356 (24.8%) |
| $25,000 to $49,999 | 7,730 (77.5%) | 2,243 (22.5%) |
| $50,000 to $74,999 | 7,455 (80.6%) | 1,793 (19.4%) |
| $75,000 to $99,999 | 6,041 (82.3%) | 1,300 (17.7%) |
| $100,000 and over | 16,229 (86.5%) | 2,524 (13.5%) |
Public vs Private Health Insurance Coverage by Age in Kerr County
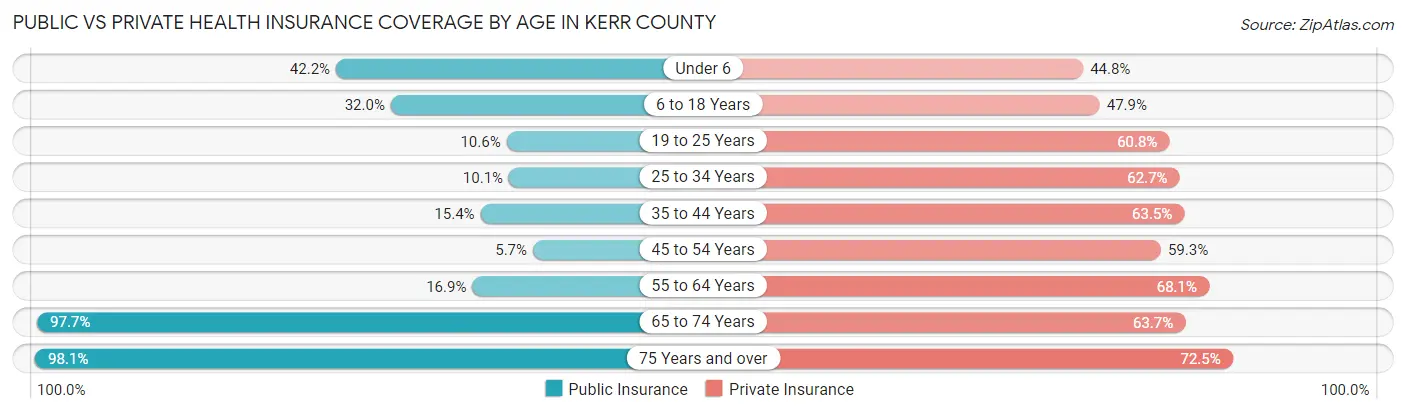
| Age Bracket | Public Insurance | Private Insurance |
| Under 6 | 1,334 (42.2%) | 1,416 (44.8%) |
| 6 to 18 Years | 2,334 (32.0%) | 3,488 (47.9%) |
| 19 to 25 Years | 432 (10.6%) | 2,485 (60.8%) |
| 25 to 34 Years | 501 (10.1%) | 3,106 (62.7%) |
| 35 to 44 Years | 777 (15.4%) | 3,206 (63.5%) |
| 45 to 54 Years | 316 (5.7%) | 3,309 (59.3%) |
| 55 to 64 Years | 1,256 (16.9%) | 5,059 (68.1%) |
| 65 to 74 Years | 7,497 (97.7%) | 4,890 (63.7%) |
| 75 Years and over | 6,482 (98.1%) | 4,794 (72.5%) |
| Total | 20,929 (40.4%) | 31,753 (61.3%) |
Disability Status by Sex by Age in Kerr County
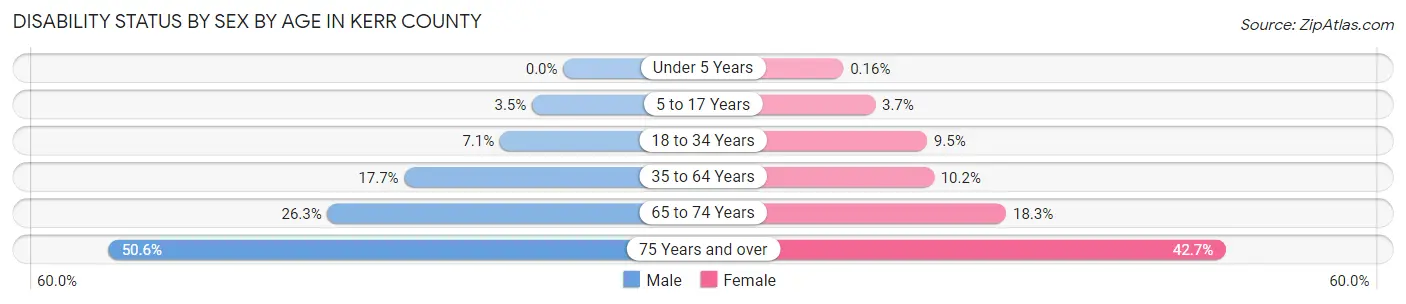
| Age Bracket | Male | Female |
| Under 5 Years | 0 (0.0%) | 2 (0.2%) |
| 5 to 17 Years | 128 (3.5%) | 128 (3.7%) |
| 18 to 34 Years | 341 (7.0%) | 469 (9.5%) |
| 35 to 64 Years | 1,534 (17.7%) | 962 (10.2%) |
| 65 to 74 Years | 942 (26.3%) | 748 (18.3%) |
| 75 Years and over | 1,563 (50.6%) | 1,504 (42.7%) |
Disability Class by Sex by Age in Kerr County
Disability Class: Hearing Difficulty
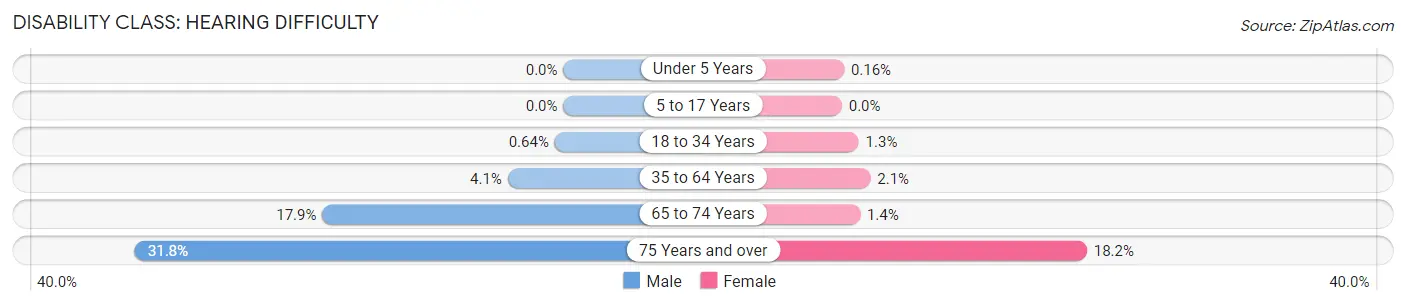
| Age Bracket | Male | Female |
| Under 5 Years | 0 (0.0%) | 2 (0.2%) |
| 5 to 17 Years | 0 (0.0%) | 0 (0.0%) |
| 18 to 34 Years | 31 (0.6%) | 62 (1.3%) |
| 35 to 64 Years | 358 (4.1%) | 199 (2.1%) |
| 65 to 74 Years | 642 (17.9%) | 55 (1.3%) |
| 75 Years and over | 982 (31.8%) | 641 (18.2%) |
Disability Class: Vision Difficulty
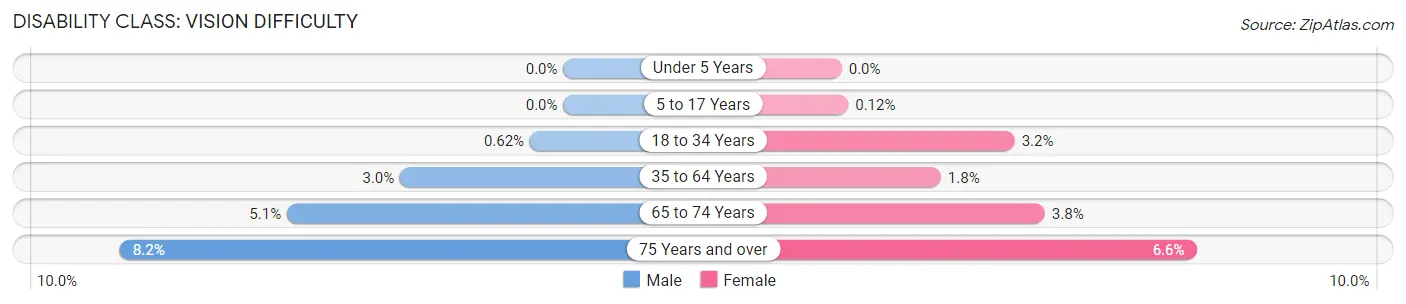
| Age Bracket | Male | Female |
| Under 5 Years | 0 (0.0%) | 0 (0.0%) |
| 5 to 17 Years | 0 (0.0%) | 4 (0.1%) |
| 18 to 34 Years | 30 (0.6%) | 159 (3.2%) |
| 35 to 64 Years | 263 (3.0%) | 173 (1.8%) |
| 65 to 74 Years | 184 (5.1%) | 154 (3.8%) |
| 75 Years and over | 254 (8.2%) | 232 (6.6%) |
Disability Class: Cognitive Difficulty
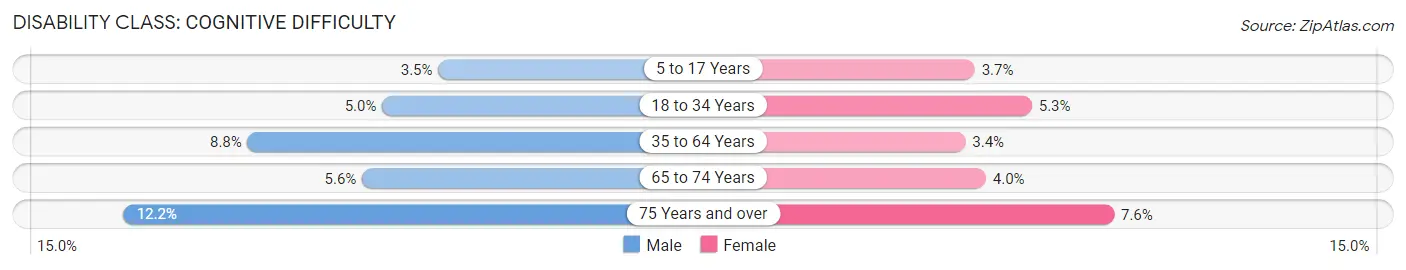
| Age Bracket | Male | Female |
| 5 to 17 Years | 128 (3.5%) | 128 (3.7%) |
| 18 to 34 Years | 244 (5.0%) | 262 (5.3%) |
| 35 to 64 Years | 762 (8.8%) | 323 (3.4%) |
| 65 to 74 Years | 201 (5.6%) | 164 (4.0%) |
| 75 Years and over | 378 (12.2%) | 267 (7.6%) |
Disability Class: Ambulatory Difficulty
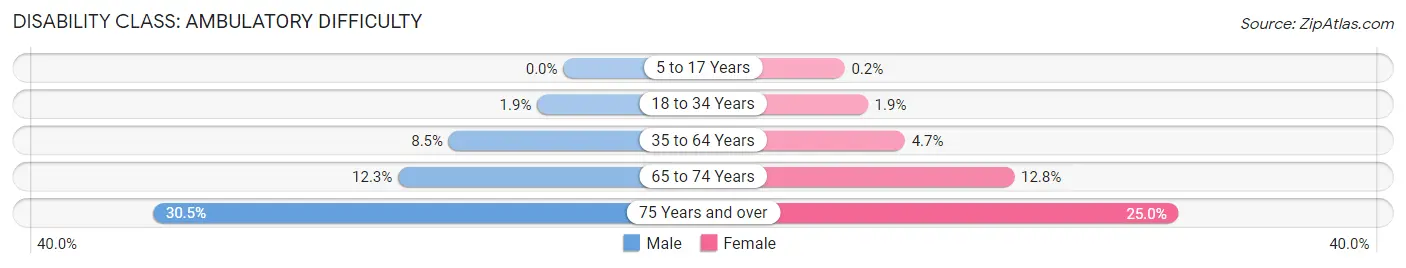
| Age Bracket | Male | Female |
| 5 to 17 Years | 0 (0.0%) | 7 (0.2%) |
| 18 to 34 Years | 94 (1.9%) | 95 (1.9%) |
| 35 to 64 Years | 737 (8.5%) | 439 (4.7%) |
| 65 to 74 Years | 440 (12.3%) | 523 (12.8%) |
| 75 Years and over | 941 (30.5%) | 881 (25.0%) |
Disability Class: Self-Care Difficulty
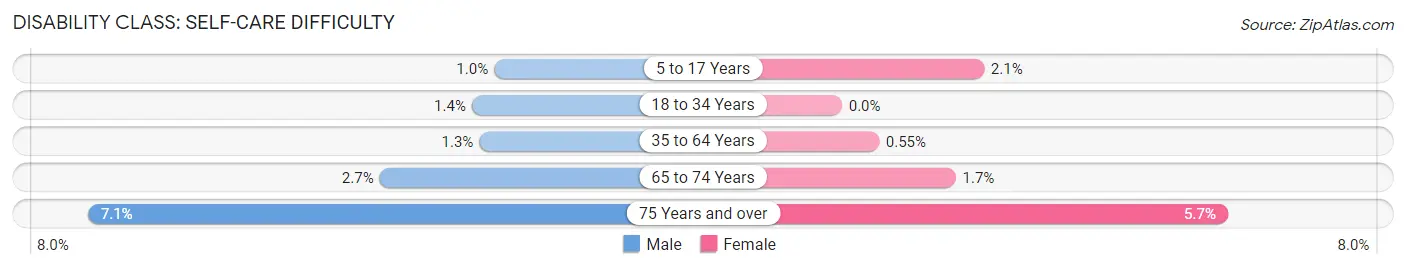
| Age Bracket | Male | Female |
| 5 to 17 Years | 38 (1.0%) | 73 (2.1%) |
| 18 to 34 Years | 66 (1.4%) | 0 (0.0%) |
| 35 to 64 Years | 108 (1.3%) | 52 (0.5%) |
| 65 to 74 Years | 98 (2.7%) | 69 (1.7%) |
| 75 Years and over | 218 (7.1%) | 202 (5.7%) |
Technology Access in Kerr County
Computing Device Access in Kerr County
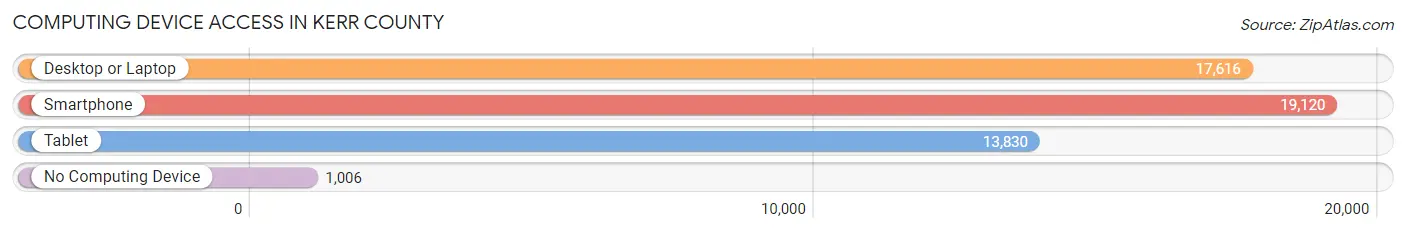
| Device Type | # Households | % Households |
| Desktop or Laptop | 17,616 | 80.0% |
| Smartphone | 19,120 | 86.8% |
| Tablet | 13,830 | 62.8% |
| No Computing Device | 1,006 | 4.6% |
| Total | 22,024 | 100.0% |
Internet Access in Kerr County
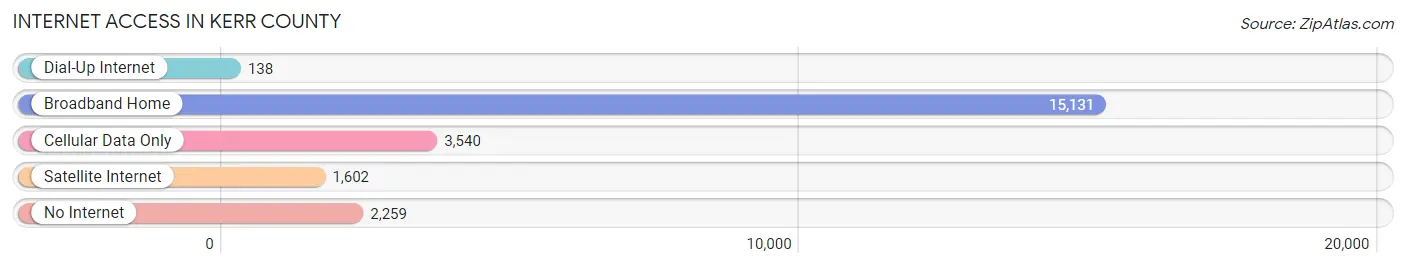
| Internet Type | # Households | % Households |
| Dial-Up Internet | 138 | 0.6% |
| Broadband Home | 15,131 | 68.7% |
| Cellular Data Only | 3,540 | 16.1% |
| Satellite Internet | 1,602 | 7.3% |
| No Internet | 2,259 | 10.3% |
| Total | 22,024 | 100.0% |
Kerr County Summary
Kerr County is located in the Hill Country region of Texas, in the southwestern part of the state. It is bordered by Kendall County to the north, Bandera County to the east, Real County to the south, and Gillespie County to the west. The county seat is Kerrville, which is also the largest city in the county.
Geography
Kerr County covers an area of 1,053 square miles, making it the 33rd largest county in Texas. The terrain is mostly hilly, with elevations ranging from 1,000 to 2,000 feet above sea level. The Guadalupe River runs through the county, and there are several creeks and streams, including the Pedernales River, which forms the county's western boundary. The county is home to several state parks, including Kerrville-Schreiner State Park, Enchanted Rock State Natural Area, and Pedernales Falls State Park.
Demographics
As of the 2010 census, Kerr County had a population of 49,625. The racial makeup of the county was 87.3% White, 0.9% African American, 0.7% Native American, 0.7% Asian, 0.1% Pacific Islander, 8.9% from other races, and 1.5% from two or more races. Hispanic or Latino of any race were 20.2% of the population.
The median household income in the county was $45,837, and the median family income was $51,919. The per capita income was $24,845. About 11.2% of families and 14.7% of the population were below the poverty line, including 19.2% of those under age 18 and 8.7% of those age 65 or over.
Economy
Kerr County's economy is largely based on agriculture and tourism. The county is home to several wineries, and the area is known for its peaches, pecans, and other fruits and vegetables. The county is also home to several ranches, and ranching is an important part of the local economy.
Tourism is also an important part of the local economy. The county is home to several state parks, as well as the Kerrville-Schreiner State Park, which is a popular destination for camping, fishing, and other outdoor activities. The county is also home to several golf courses, and the area is known for its hunting and fishing opportunities.
Conclusion
Kerr County is a rural county located in the Hill Country region of Texas. It is home to several state parks, wineries, and ranches, and the local economy is largely based on agriculture and tourism. The county has a diverse population, with a median household income of $45,837 and a per capita income of $24,845. Kerr County is a popular destination for outdoor activities, and it is known for its hunting and fishing opportunities.
Common Questions
What is Per Capita Income in Kerr County?
Per Capita income in Kerr County is $38,003.
What is the Median Family Income in Kerr County?
Median Family Income in Kerr County is $81,491.
What is the Median Household income in Kerr County?
Median Household Income in Kerr County is $66,713.
What is Income or Wage Gap in Kerr County?
Income or Wage Gap in Kerr County is 17.5%.
Women in Kerr County earn 82.5 cents for every dollar earned by a man.
What is Family Income Deficit in Kerr County?
Family Income Deficit in Kerr County is $8,735.
Families that are below poverty line in Kerr County earn $8,735 less on average than the poverty threshold level.
What is Inequality or Gini Index in Kerr County?
Inequality or Gini Index in Kerr County is 0.46.
What is the Total Population of Kerr County?
Total Population of Kerr County is 52,810.
What is the Total Male Population of Kerr County?
Total Male Population of Kerr County is 25,725.
What is the Total Female Population of Kerr County?
Total Female Population of Kerr County is 27,085.
What is the Ratio of Males per 100 Females in Kerr County?
There are 94.98 Males per 100 Females in Kerr County.
What is the Ratio of Females per 100 Males in Kerr County?
There are 105.29 Females per 100 Males in Kerr County.
What is the Median Population Age in Kerr County?
Median Population Age in Kerr County is 48.2 Years.
What is the Average Family Size in Kerr County
Average Family Size in Kerr County is 2.8 People.
What is the Average Household Size in Kerr County
Average Household Size in Kerr County is 2.3 People.
How Large is the Labor Force in Kerr County?
There are 24,570 People in the Labor Forcein in Kerr County.
What is the Percentage of People in the Labor Force in Kerr County?
55.4% of People are in the Labor Force in Kerr County.
What is the Unemployment Rate in Kerr County?
Unemployment Rate in Kerr County is 3.3%.