Kent County, TX Map & Demographics
Kent County Map
Kent County Overview
$29,575
PER CAPITA INCOME
$81,786
AVG FAMILY INCOME
$68,553
AVG HOUSEHOLD INCOME
0.38
INEQUALITY / GINI INDEX
635
TOTAL POPULATION
323
MALE POPULATION
312
FEMALE POPULATION
103.53
MALES / 100 FEMALES
96.59
FEMALES / 100 MALES
59.9
MEDIAN AGE
3.0
AVG FAMILY SIZE
2.3
AVG HOUSEHOLD SIZE
204
LABOR FORCE [ PEOPLE ]
41.3%
PERCENT IN LABOR FORCE
5.4%
UNEMPLOYMENT RATE
Kent County Area Codes
Income in Kent County
Income Overview in Kent County
Per Capita Income in Kent County is $29,575, while median incomes of families and households are $81,786 and $68,553 respectively.
| Characteristic | Number | Measure |
| Per Capita Income | 635 | $29,575 |
| Median Family Income | 162 | $81,786 |
| Mean Family Income | 162 | $95,009 |
| Median Household Income | 246 | $68,553 |
| Mean Household Income | 246 | $77,335 |
| Income Deficit | 162 | $0 |
| Wage / Income Gap (%) | 635 | 0.00% |
| Wage / Income Gap ($) | 635 | 100.00¢ per $1 |
| Gini / Inequality Index | 635 | 0.38 |
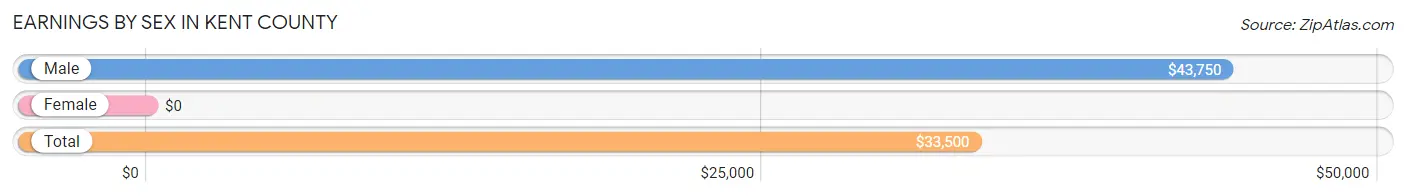
Earnings by Sex in Kent County
| Sex | Number | Average Earnings |
| Male | 116 (45.3%) | $43,750 |
| Female | 140 (54.7%) | $0 |
| Total | 256 (100.0%) | $33,500 |
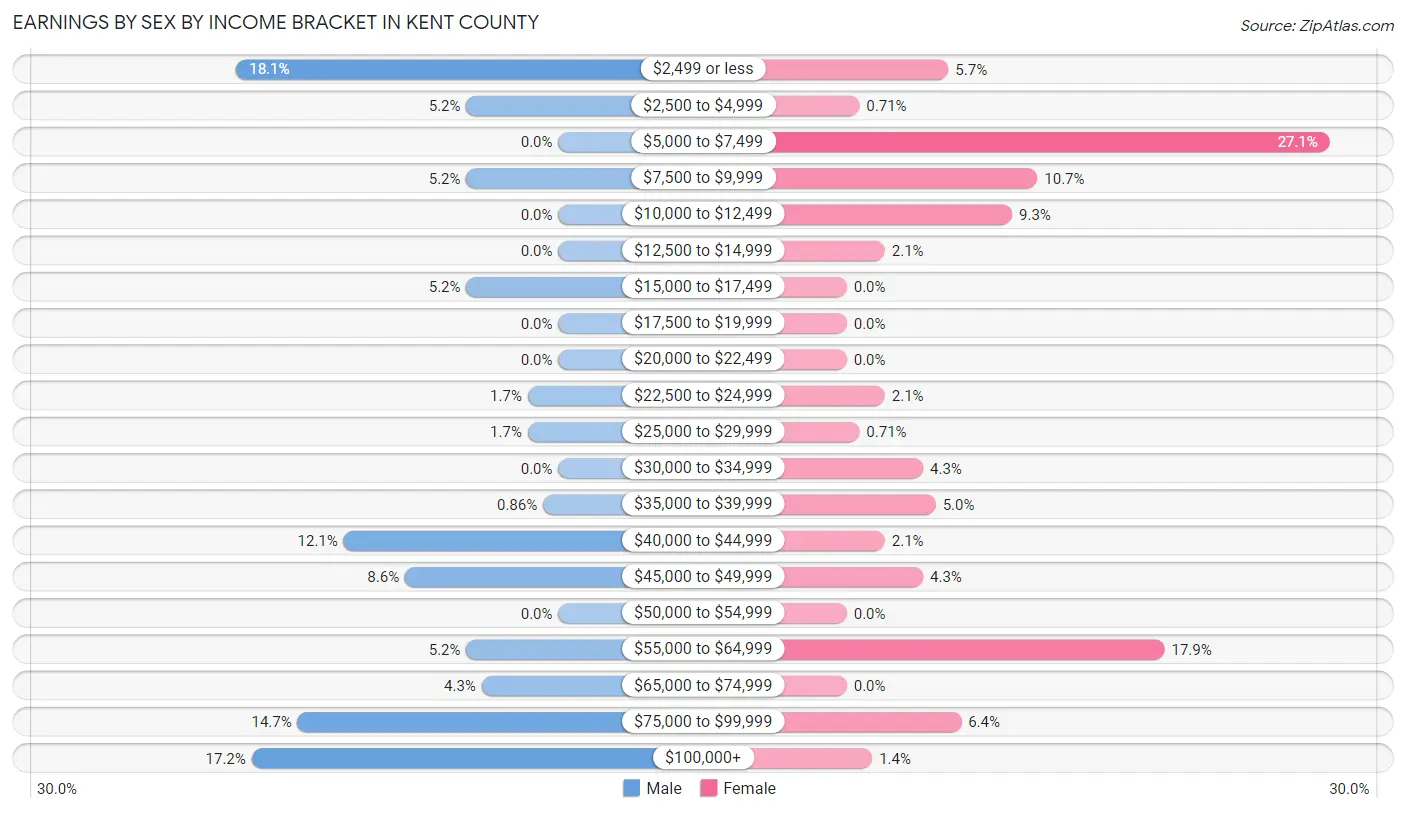
Earnings by Sex by Income Bracket in Kent County
The most common earnings brackets in Kent County are $2,499 or less for men (21 | 18.1%) and $5,000 to $7,499 for women (38 | 27.1%).
| Income | Male | Female |
| $2,499 or less | 21 (18.1%) | 8 (5.7%) |
| $2,500 to $4,999 | 6 (5.2%) | 1 (0.7%) |
| $5,000 to $7,499 | 0 (0.0%) | 38 (27.1%) |
| $7,500 to $9,999 | 6 (5.2%) | 15 (10.7%) |
| $10,000 to $12,499 | 0 (0.0%) | 13 (9.3%) |
| $12,500 to $14,999 | 0 (0.0%) | 3 (2.1%) |
| $15,000 to $17,499 | 6 (5.2%) | 0 (0.0%) |
| $17,500 to $19,999 | 0 (0.0%) | 0 (0.0%) |
| $20,000 to $22,499 | 0 (0.0%) | 0 (0.0%) |
| $22,500 to $24,999 | 2 (1.7%) | 3 (2.1%) |
| $25,000 to $29,999 | 2 (1.7%) | 1 (0.7%) |
| $30,000 to $34,999 | 0 (0.0%) | 6 (4.3%) |
| $35,000 to $39,999 | 1 (0.9%) | 7 (5.0%) |
| $40,000 to $44,999 | 14 (12.1%) | 3 (2.1%) |
| $45,000 to $49,999 | 10 (8.6%) | 6 (4.3%) |
| $50,000 to $54,999 | 0 (0.0%) | 0 (0.0%) |
| $55,000 to $64,999 | 6 (5.2%) | 25 (17.9%) |
| $65,000 to $74,999 | 5 (4.3%) | 0 (0.0%) |
| $75,000 to $99,999 | 17 (14.7%) | 9 (6.4%) |
| $100,000+ | 20 (17.2%) | 2 (1.4%) |
| Total | 116 (100.0%) | 140 (100.0%) |
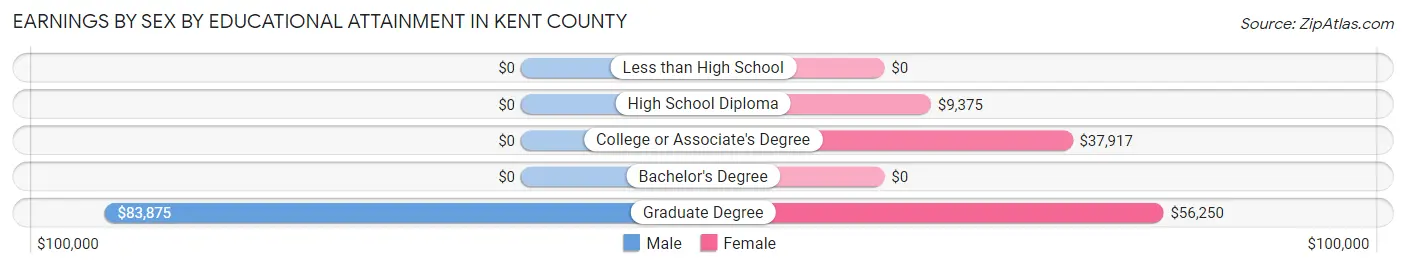
Earnings by Sex by Educational Attainment in Kent County
| Educational Attainment | Male Income | Female Income |
| Less than High School | - | - |
| High School Diploma | - | - |
| College or Associate's Degree | - | - |
| Bachelor's Degree | - | - |
| Graduate Degree | $83,875 | $56,250 |
| Total | $46,406 | $0 |
Family Income in Kent County
Family Income Brackets in Kent County
According to the Kent County family income data, there are 35 families falling into the $100,000 to $149,999 income range, which is the most common income bracket and makes up 21.6% of all families.
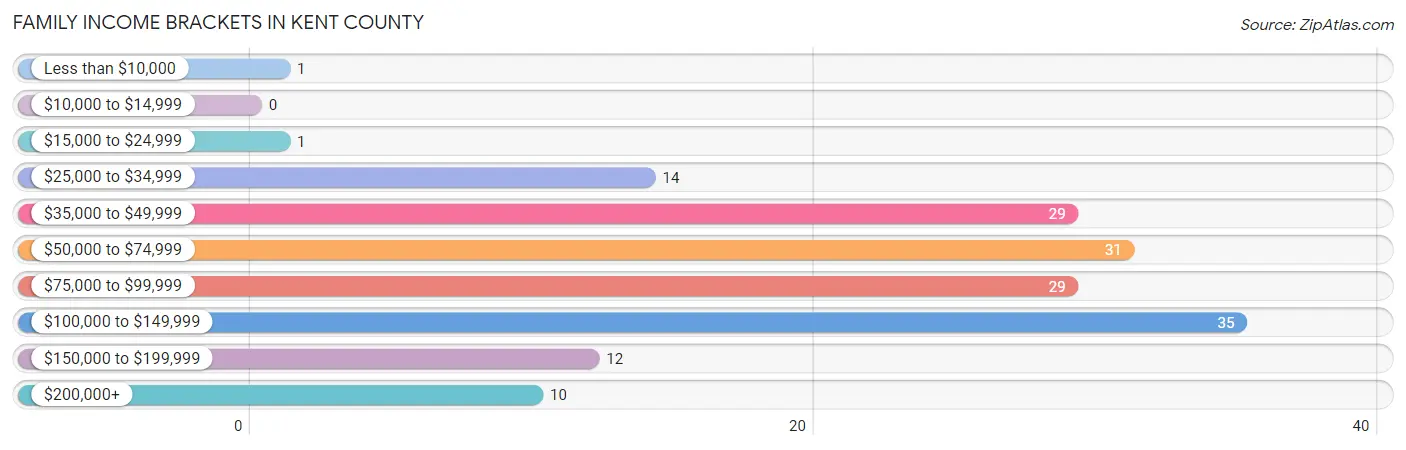
| Income Bracket | # Families | % Families |
| Less than $10,000 | 1 | 0.6% |
| $10,000 to $14,999 | 0 | 0.0% |
| $15,000 to $24,999 | 1 | 0.6% |
| $25,000 to $34,999 | 14 | 8.6% |
| $35,000 to $49,999 | 29 | 17.9% |
| $50,000 to $74,999 | 31 | 19.1% |
| $75,000 to $99,999 | 29 | 17.9% |
| $100,000 to $149,999 | 35 | 21.6% |
| $150,000 to $199,999 | 12 | 7.4% |
| $200,000+ | 10 | 6.2% |
Family Income by Famaliy Size in Kent County
4-person families (21 | 13.0%) account for the highest median family income in Kent County with $140,875 per family, while 4-person families (21 | 13.0%) have the highest median income of $35,219 per family member.
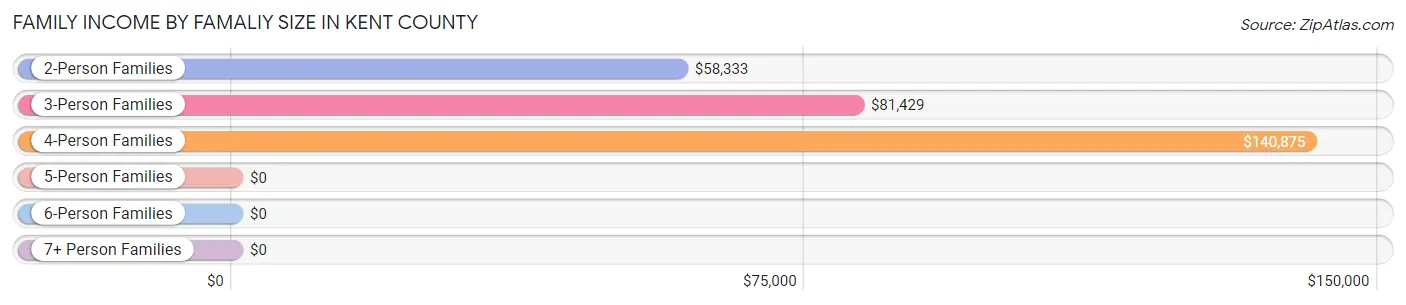
| Income Bracket | # Families | Median Income |
| 2-Person Families | 96 (59.3%) | $58,333 |
| 3-Person Families | 34 (21.0%) | $81,429 |
| 4-Person Families | 21 (13.0%) | $140,875 |
| 5-Person Families | 11 (6.8%) | $0 |
| 6-Person Families | 0 (0.0%) | $0 |
| 7+ Person Families | 0 (0.0%) | $0 |
| Total | 162 (100.0%) | $81,786 |
Family Income by Number of Earners in Kent County
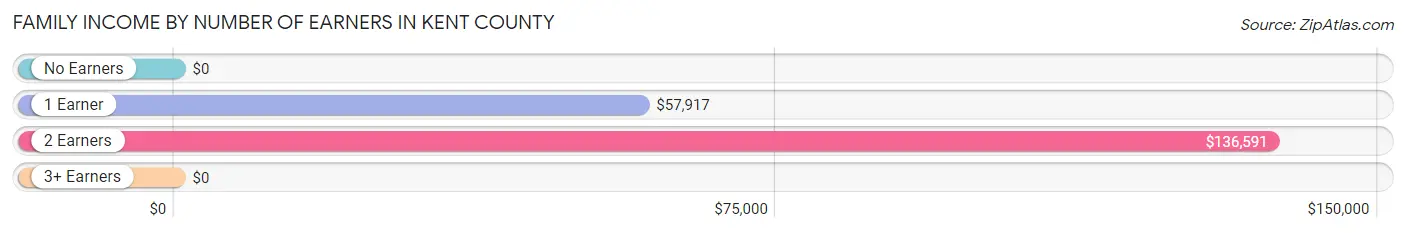
| Number of Earners | # Families | Median Income |
| No Earners | 51 (31.5%) | $0 |
| 1 Earner | 39 (24.1%) | $57,917 |
| 2 Earners | 66 (40.7%) | $136,591 |
| 3+ Earners | 6 (3.7%) | $0 |
| Total | 162 (100.0%) | $81,786 |
Household Income in Kent County
Household Income Brackets in Kent County
With 71 households falling in the category, the $50,000 to $74,999 income range is the most frequent in Kent County, accounting for 28.9% of all households. In contrast, only 10 households (4.1%) fall into the $200,000+ income bracket, making it the least populous group.
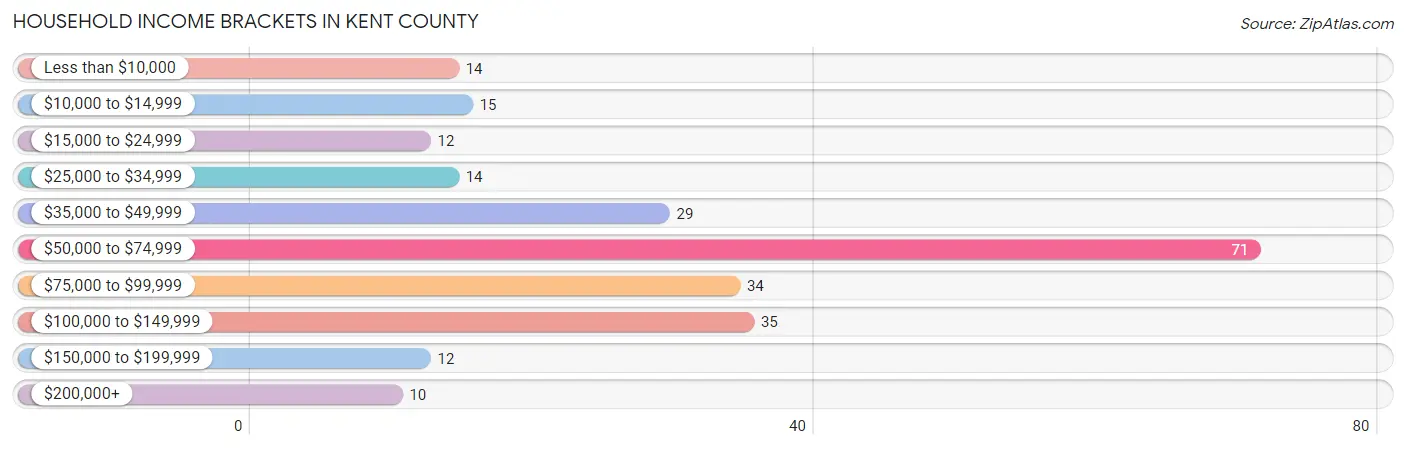
| Income Bracket | # Households | % Households |
| Less than $10,000 | 14 | 5.7% |
| $10,000 to $14,999 | 15 | 6.1% |
| $15,000 to $24,999 | 12 | 4.9% |
| $25,000 to $34,999 | 14 | 5.7% |
| $35,000 to $49,999 | 29 | 11.8% |
| $50,000 to $74,999 | 71 | 28.9% |
| $75,000 to $99,999 | 34 | 13.8% |
| $100,000 to $149,999 | 35 | 14.2% |
| $150,000 to $199,999 | 12 | 4.9% |
| $200,000+ | 10 | 4.1% |
Household Income by Householder Age in Kent County
The median household income in Kent County is $68,553, with the highest median household income of $105,000 found in the 25 to 44 years age bracket for the primary householder. A total of 54 households (22.0%) fall into this category.
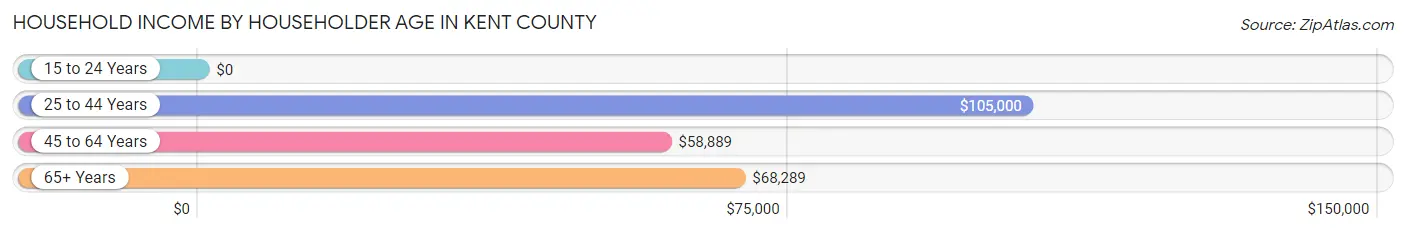
| Income Bracket | # Households | Median Income |
| 15 to 24 Years | 0 (0.0%) | $0 |
| 25 to 44 Years | 54 (22.0%) | $105,000 |
| 45 to 64 Years | 58 (23.6%) | $58,889 |
| 65+ Years | 134 (54.5%) | $68,289 |
| Total | 246 (100.0%) | $68,553 |
Poverty in Kent County
Income Below Poverty by Sex and Age in Kent County
With 10.1% poverty level for males and 5.7% for females among the residents of Kent County, 18 to 24 year old males and 55 to 64 year old females are the most vulnerable to poverty, with 13 males (76.5%) and 7 females (21.9%) in their respective age groups living below the poverty level.
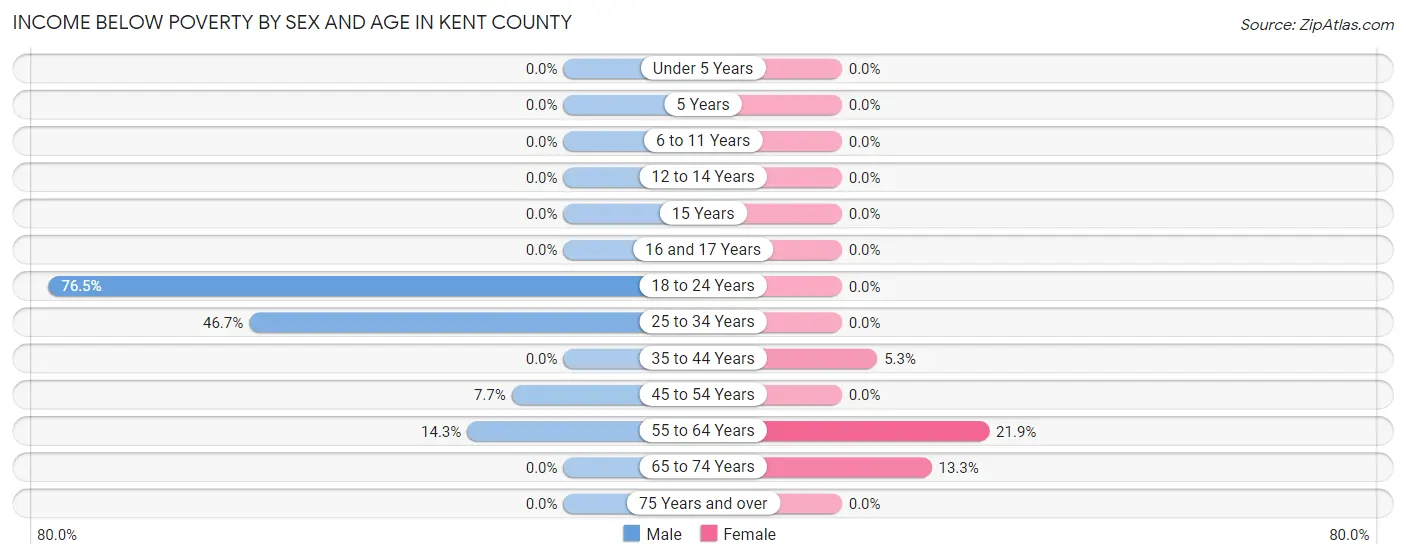
| Age Bracket | Male | Female |
| Under 5 Years | 0 (0.0%) | 0 (0.0%) |
| 5 Years | 0 (0.0%) | 0 (0.0%) |
| 6 to 11 Years | 0 (0.0%) | 0 (0.0%) |
| 12 to 14 Years | 0 (0.0%) | 0 (0.0%) |
| 15 Years | 0 (0.0%) | 0 (0.0%) |
| 16 and 17 Years | 0 (0.0%) | 0 (0.0%) |
| 18 to 24 Years | 13 (76.5%) | 0 (0.0%) |
| 25 to 34 Years | 7 (46.7%) | 0 (0.0%) |
| 35 to 44 Years | 0 (0.0%) | 1 (5.3%) |
| 45 to 54 Years | 1 (7.7%) | 0 (0.0%) |
| 55 to 64 Years | 9 (14.3%) | 7 (21.9%) |
| 65 to 74 Years | 0 (0.0%) | 8 (13.3%) |
| 75 Years and over | 0 (0.0%) | 0 (0.0%) |
| Total | 30 (10.1%) | 16 (5.7%) |
Income Above Poverty by Sex and Age in Kent County
According to the poverty statistics in Kent County, males aged 5 years and females aged under 5 years are the age groups that are most secure financially, with 100.0% of males and 100.0% of females in these age groups living above the poverty line.
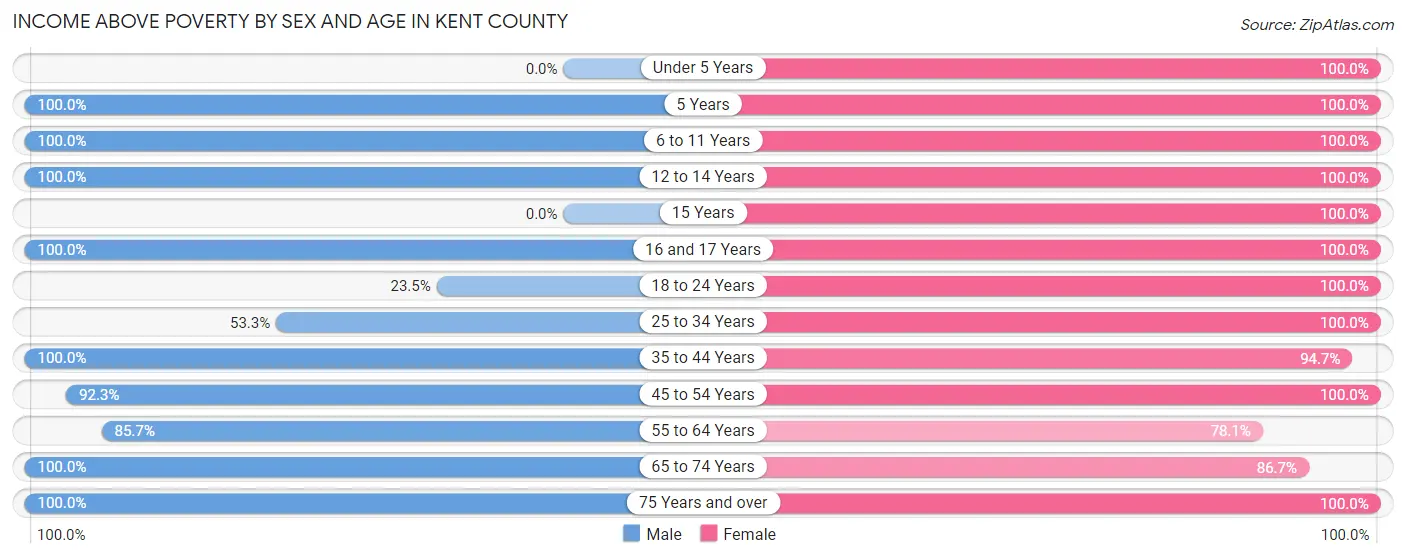
| Age Bracket | Male | Female |
| Under 5 Years | 0 (0.0%) | 20 (100.0%) |
| 5 Years | 12 (100.0%) | 6 (100.0%) |
| 6 to 11 Years | 63 (100.0%) | 17 (100.0%) |
| 12 to 14 Years | 3 (100.0%) | 9 (100.0%) |
| 15 Years | 0 (0.0%) | 2 (100.0%) |
| 16 and 17 Years | 3 (100.0%) | 8 (100.0%) |
| 18 to 24 Years | 4 (23.5%) | 14 (100.0%) |
| 25 to 34 Years | 8 (53.3%) | 10 (100.0%) |
| 35 to 44 Years | 50 (100.0%) | 18 (94.7%) |
| 45 to 54 Years | 12 (92.3%) | 12 (100.0%) |
| 55 to 64 Years | 54 (85.7%) | 25 (78.1%) |
| 65 to 74 Years | 45 (100.0%) | 52 (86.7%) |
| 75 Years and over | 14 (100.0%) | 71 (100.0%) |
| Total | 268 (89.9%) | 264 (94.3%) |
Income Below Poverty Among Married-Couple Families in Kent County
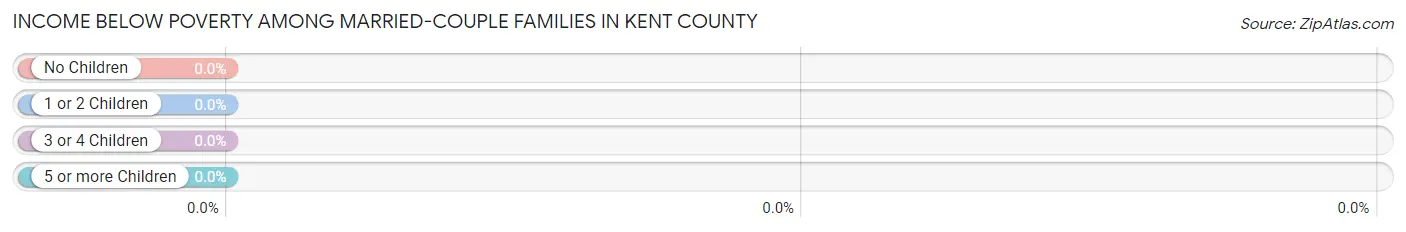
| Children | Above Poverty | Below Poverty |
| No Children | 88 (100.0%) | 0 (0.0%) |
| 1 or 2 Children | 34 (100.0%) | 0 (0.0%) |
| 3 or 4 Children | 11 (100.0%) | 0 (0.0%) |
| 5 or more Children | 0 (0.0%) | 0 (0.0%) |
| Total | 133 (100.0%) | 0 (0.0%) |
Income Below Poverty Among Single-Parent Households in Kent County
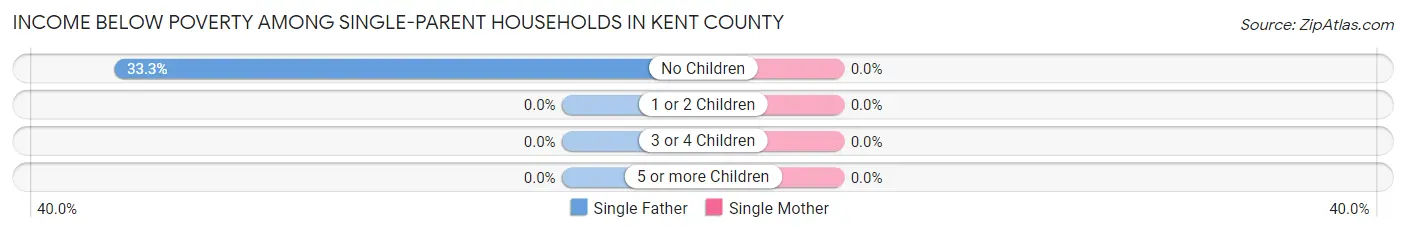
| Children | Single Father | Single Mother |
| No Children | 1 (33.3%) | 0 (0.0%) |
| 1 or 2 Children | 0 (0.0%) | 0 (0.0%) |
| 3 or 4 Children | 0 (0.0%) | 0 (0.0%) |
| 5 or more Children | 0 (0.0%) | 0 (0.0%) |
| Total | 1 (33.3%) | 0 (0.0%) |
Income Below Poverty Among Married-Couple vs Single-Parent Households in Kent County
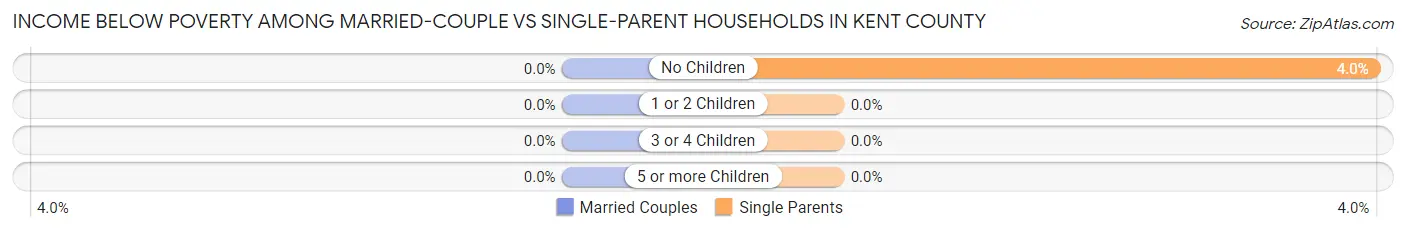
| Children | Married-Couple Families | Single-Parent Households |
| No Children | 0 (0.0%) | 1 (4.0%) |
| 1 or 2 Children | 0 (0.0%) | 0 (0.0%) |
| 3 or 4 Children | 0 (0.0%) | 0 (0.0%) |
| 5 or more Children | 0 (0.0%) | 0 (0.0%) |
| Total | 0 (0.0%) | 1 (3.5%) |
Race in Kent County
The most populous races in Kent County are White / Caucasian (551 | 86.8%), Hispanic or Latino (86 | 13.5%), and Two or more Races (49 | 7.7%).
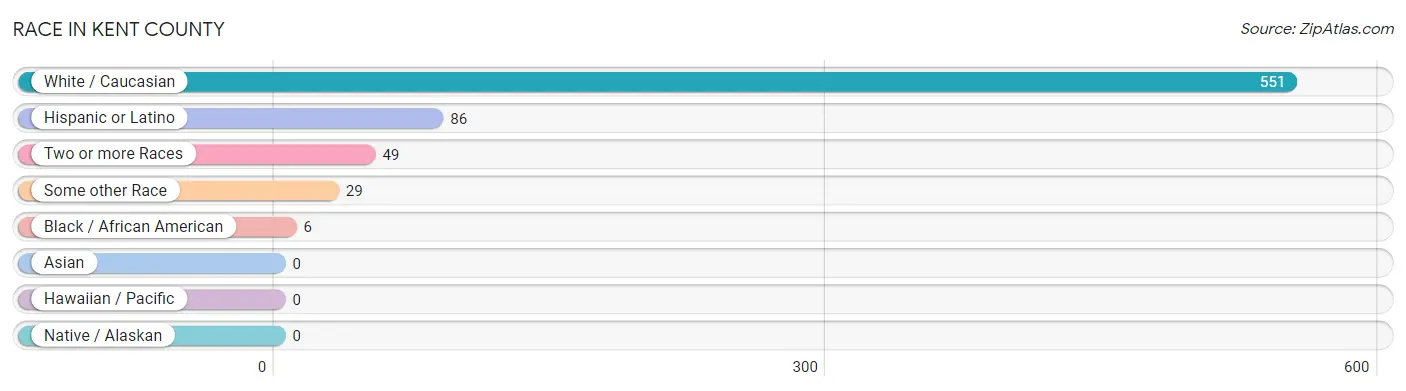
| Race | # Population | % Population |
| Asian | 0 | 0.0% |
| Black / African American | 6 | 0.9% |
| Hawaiian / Pacific | 0 | 0.0% |
| Hispanic or Latino | 86 | 13.5% |
| Native / Alaskan | 0 | 0.0% |
| White / Caucasian | 551 | 86.8% |
| Two or more Races | 49 | 7.7% |
| Some other Race | 29 | 4.6% |
| Total | 635 | 100.0% |
Ancestry in Kent County
The most populous ancestries reported in Kent County are Mexican (83 | 13.1%), English (80 | 12.6%), Scottish (47 | 7.4%), German (45 | 7.1%), and Irish (42 | 6.6%), together accounting for 46.8% of all Kent County residents.
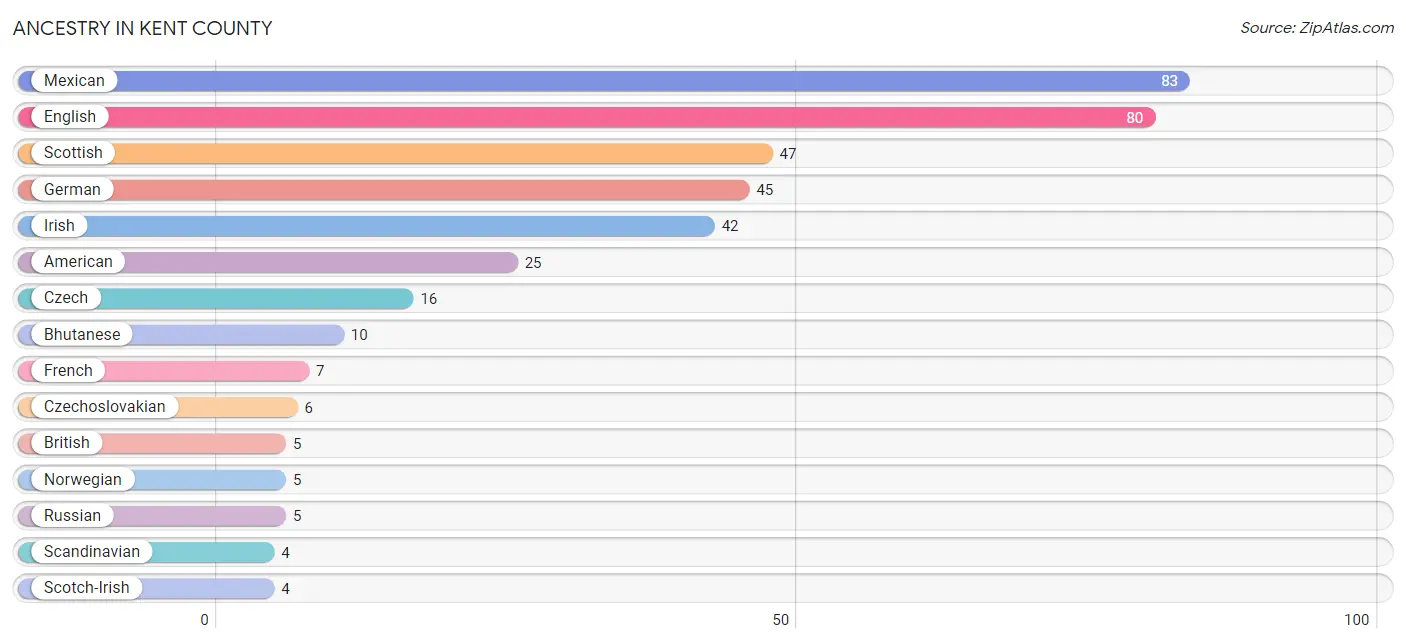
| Ancestry | # Population | % Population |
| American | 25 | 3.9% |
| Bhutanese | 10 | 1.6% |
| British | 5 | 0.8% |
| Cherokee | 1 | 0.2% |
| Czech | 16 | 2.5% |
| Czechoslovakian | 6 | 0.9% |
| Dutch | 2 | 0.3% |
| English | 80 | 12.6% |
| French | 7 | 1.1% |
| German | 45 | 7.1% |
| Irish | 42 | 6.6% |
| Mexican | 83 | 13.1% |
| Northern European | 2 | 0.3% |
| Norwegian | 5 | 0.8% |
| Russian | 5 | 0.8% |
| Scandinavian | 4 | 0.6% |
| Scotch-Irish | 4 | 0.6% |
| Scottish | 47 | 7.4% | View All 18 Rows |
Immigrants in Kent County
The most numerous immigrant groups reported in Kent County came from Eastern Europe (5 | 0.8%), Europe (5 | 0.8%), Russia (5 | 0.8%), Central America (2 | 0.3%), and Latin America (2 | 0.3%), together accounting for 3.0% of all Kent County residents.
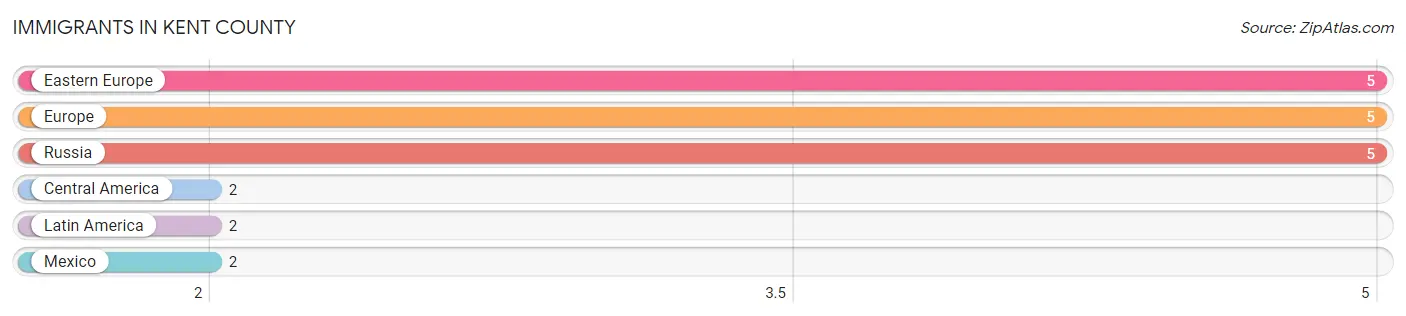
| Immigration Origin | # Population | % Population |
| Central America | 2 | 0.3% |
| Eastern Europe | 5 | 0.8% |
| Europe | 5 | 0.8% |
| Latin America | 2 | 0.3% |
| Mexico | 2 | 0.3% |
| Russia | 5 | 0.8% | View All 6 Rows |
Sex and Age in Kent County
Sex and Age in Kent County
The most populous age groups in Kent County are 60 to 64 Years (58 | 18.0%) for men and 75 to 79 Years (59 | 18.9%) for women.
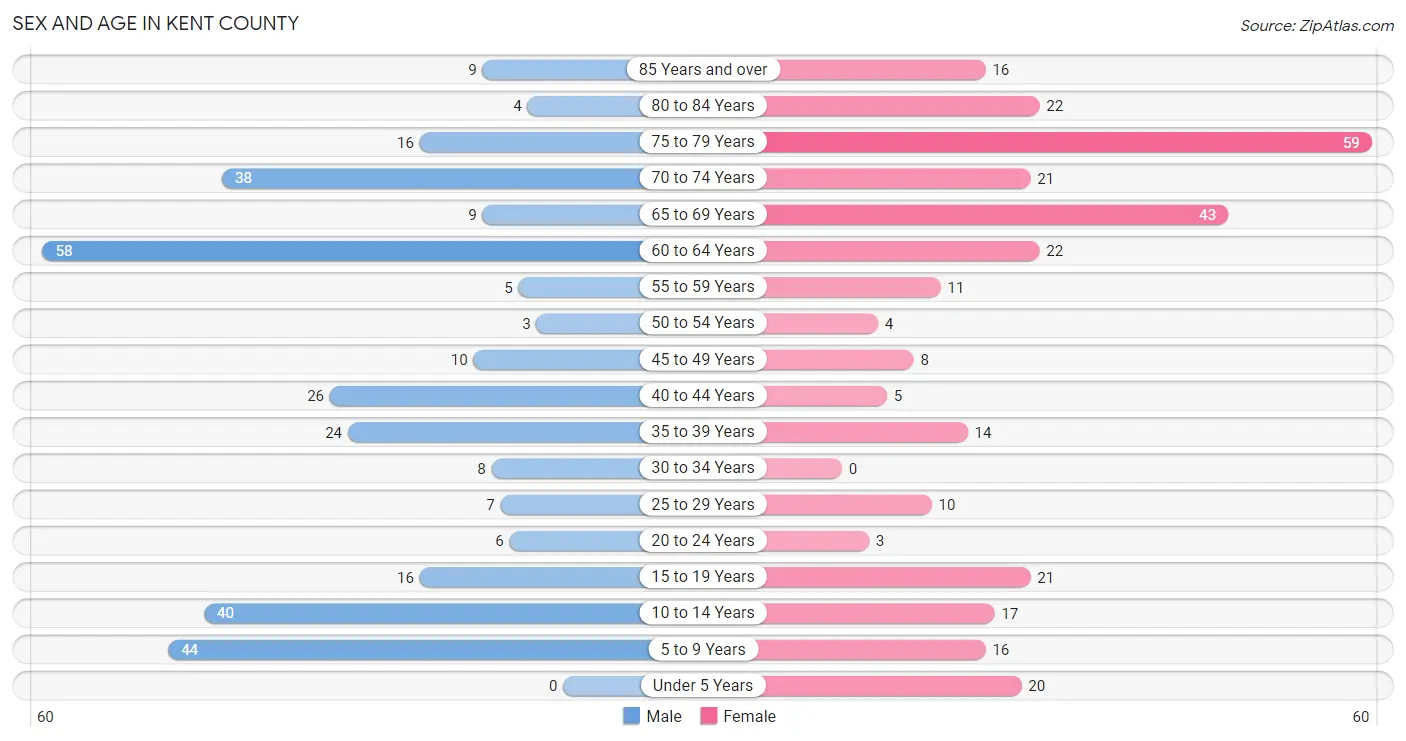
| Age Bracket | Male | Female |
| Under 5 Years | 0 (0.0%) | 20 (6.4%) |
| 5 to 9 Years | 44 (13.6%) | 16 (5.1%) |
| 10 to 14 Years | 40 (12.4%) | 17 (5.4%) |
| 15 to 19 Years | 16 (5.0%) | 21 (6.7%) |
| 20 to 24 Years | 6 (1.9%) | 3 (1.0%) |
| 25 to 29 Years | 7 (2.2%) | 10 (3.2%) |
| 30 to 34 Years | 8 (2.5%) | 0 (0.0%) |
| 35 to 39 Years | 24 (7.4%) | 14 (4.5%) |
| 40 to 44 Years | 26 (8.1%) | 5 (1.6%) |
| 45 to 49 Years | 10 (3.1%) | 8 (2.6%) |
| 50 to 54 Years | 3 (0.9%) | 4 (1.3%) |
| 55 to 59 Years | 5 (1.5%) | 11 (3.5%) |
| 60 to 64 Years | 58 (18.0%) | 22 (7.0%) |
| 65 to 69 Years | 9 (2.8%) | 43 (13.8%) |
| 70 to 74 Years | 38 (11.8%) | 21 (6.7%) |
| 75 to 79 Years | 16 (5.0%) | 59 (18.9%) |
| 80 to 84 Years | 4 (1.2%) | 22 (7.0%) |
| 85 Years and over | 9 (2.8%) | 16 (5.1%) |
| Total | 323 (100.0%) | 312 (100.0%) |
Families and Households in Kent County
Median Family Size in Kent County
The median family size in Kent County is 2.97 persons per family, with single male/father families (3 | 1.8%) accounting for the largest median family size of 4.67 persons per family. On the other hand, single female/mother families (26 | 16.1%) represent the smallest median family size with 2.65 persons per family.
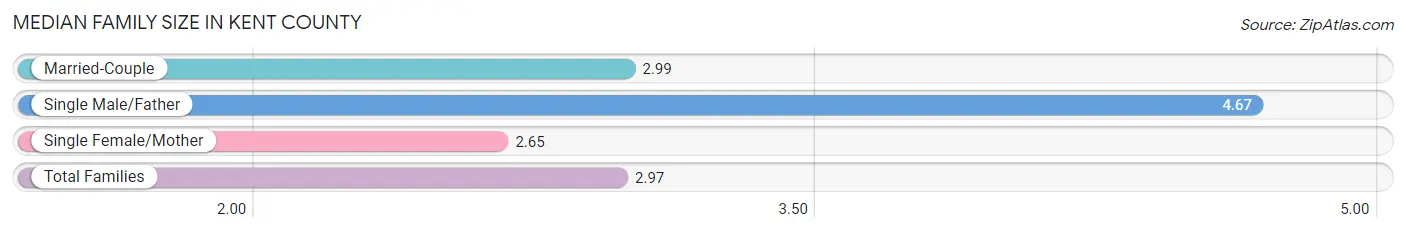
| Family Type | # Families | Family Size |
| Married-Couple | 133 (82.1%) | 2.99 |
| Single Male/Father | 3 (1.8%) | 4.67 |
| Single Female/Mother | 26 (16.1%) | 2.65 |
| Total Families | 162 (100.0%) | 2.97 |
Median Household Size in Kent County
The median household size in Kent County is 2.33 persons per household, with single male/father households (3 | 1.2%) accounting for the largest median household size of 4.67 persons per household. non-family households (84 | 34.2%) represent the smallest median household size with 1.01 persons per household.
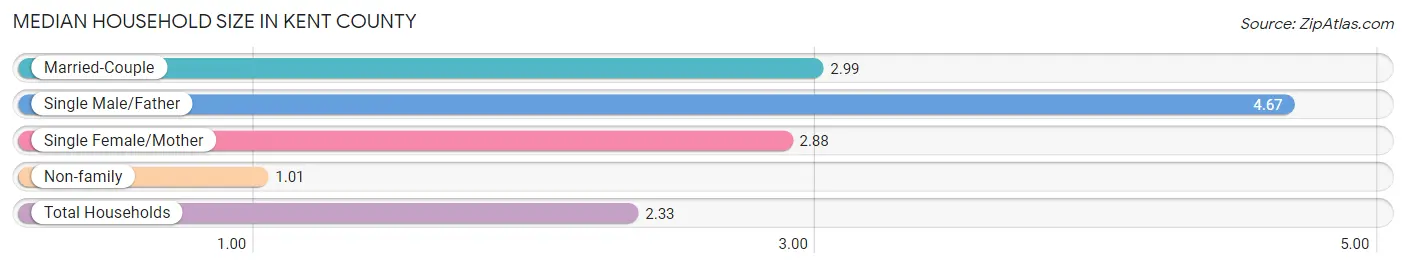
| Household Type | # Households | Household Size |
| Married-Couple | 133 (54.1%) | 2.99 |
| Single Male/Father | 3 (1.2%) | 4.67 |
| Single Female/Mother | 26 (10.6%) | 2.88 |
| Non-family | 84 (34.2%) | 1.01 |
| Total Households | 246 (100.0%) | 2.33 |
Household Size by Marriage Status in Kent County
Out of a total of 246 households in Kent County, 162 (65.8%) are family households, while 84 (34.2%) are nonfamily households. The most numerous type of family households are 2-person households, comprising 95, and the most common type of nonfamily households are 1-person households, comprising 82.
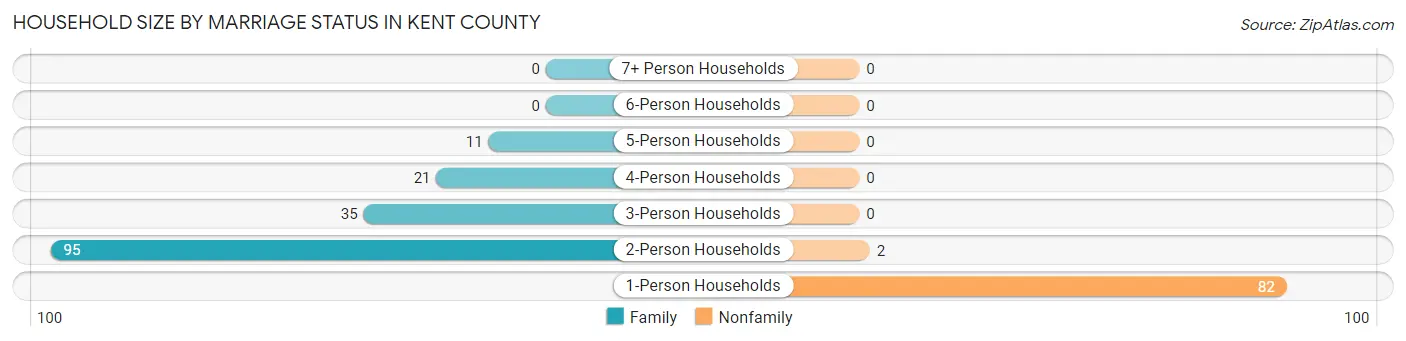
| Household Size | Family Households | Nonfamily Households |
| 1-Person Households | - | 82 (33.3%) |
| 2-Person Households | 95 (38.6%) | 2 (0.8%) |
| 3-Person Households | 35 (14.2%) | 0 (0.0%) |
| 4-Person Households | 21 (8.5%) | 0 (0.0%) |
| 5-Person Households | 11 (4.5%) | 0 (0.0%) |
| 6-Person Households | 0 (0.0%) | 0 (0.0%) |
| 7+ Person Households | 0 (0.0%) | 0 (0.0%) |
| Total | 162 (65.8%) | 84 (34.2%) |
Female Fertility in Kent County
Fertility by Age in Kent County
| Age Bracket | Women with Births | Births / 1,000 Women |
| 15 to 19 years | 0 (0.0%) | 0.0 |
| 20 to 34 years | 0 (0.0%) | 0.0 |
| 35 to 50 years | 0 (0.0%) | 0.0 |
| Total | 0 (0.0%) | 0.0 |
Fertility by Age by Marriage Status in Kent County
| Age Bracket | Married | Unmarried |
| 15 to 19 years | 0 (0.0%) | 0 (0.0%) |
| 20 to 34 years | 0 (0.0%) | 0 (0.0%) |
| 35 to 50 years | 0 (0.0%) | 0 (0.0%) |
| Total | 0 (0.0%) | 0 (0.0%) |
Fertility by Education in Kent County
| Educational Attainment | Women with Births | Births / 1,000 Women |
| Less than High School | 0 (0.0%) | 0.0 |
| High School Diploma | 0 (0.0%) | 0.0 |
| College or Associate's Degree | 0 (0.0%) | 0.0 |
| Bachelor's Degree | 0 (0.0%) | 0.0 |
| Graduate Degree | 0 (0.0%) | 0.0 |
| Total | 0 (0.0%) | 0.0 |
Fertility by Education by Marriage Status in Kent County
| Educational Attainment | Married | Unmarried |
| Less than High School | 0 (0.0%) | 0 (0.0%) |
| High School Diploma | 0 (0.0%) | 0 (0.0%) |
| College or Associate's Degree | 0 (0.0%) | 0 (0.0%) |
| Bachelor's Degree | 0 (0.0%) | 0 (0.0%) |
| Graduate Degree | 0 (0.0%) | 0 (0.0%) |
| Total | 0 (0.0%) | 0 (0.0%) |
Employment Characteristics in Kent County
Employment by Class of Employer in Kent County
Among the 187 employed individuals in Kent County, private company employees (83 | 44.4%), not-for-profit organizations (37 | 19.8%), and local government employees (36 | 19.3%) make up the most common classes of employment.
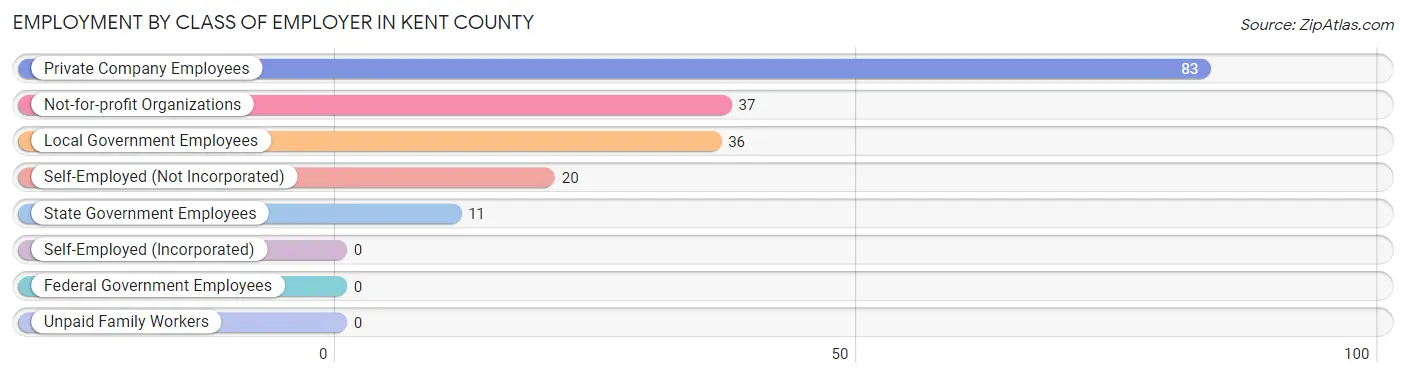
| Employer Class | # Employees | % Employees |
| Private Company Employees | 83 | 44.4% |
| Self-Employed (Incorporated) | 0 | 0.0% |
| Self-Employed (Not Incorporated) | 20 | 10.7% |
| Not-for-profit Organizations | 37 | 19.8% |
| Local Government Employees | 36 | 19.3% |
| State Government Employees | 11 | 5.9% |
| Federal Government Employees | 0 | 0.0% |
| Unpaid Family Workers | 0 | 0.0% |
| Total | 187 | 100.0% |
Employment Status by Age in Kent County
According to the labor force statistics for Kent County, out of the total population over 16 years of age (494), 41.3% or 204 individuals are in the labor force, with 5.4% or 11 of them unemployed. The age group with the highest labor force participation rate is 20 to 24 years, with 100.0% or 9 individuals in the labor force. Within the labor force, the 25 to 29 years age range has the highest percentage of unemployed individuals, with 41.2% or 7 of them being unemployed.
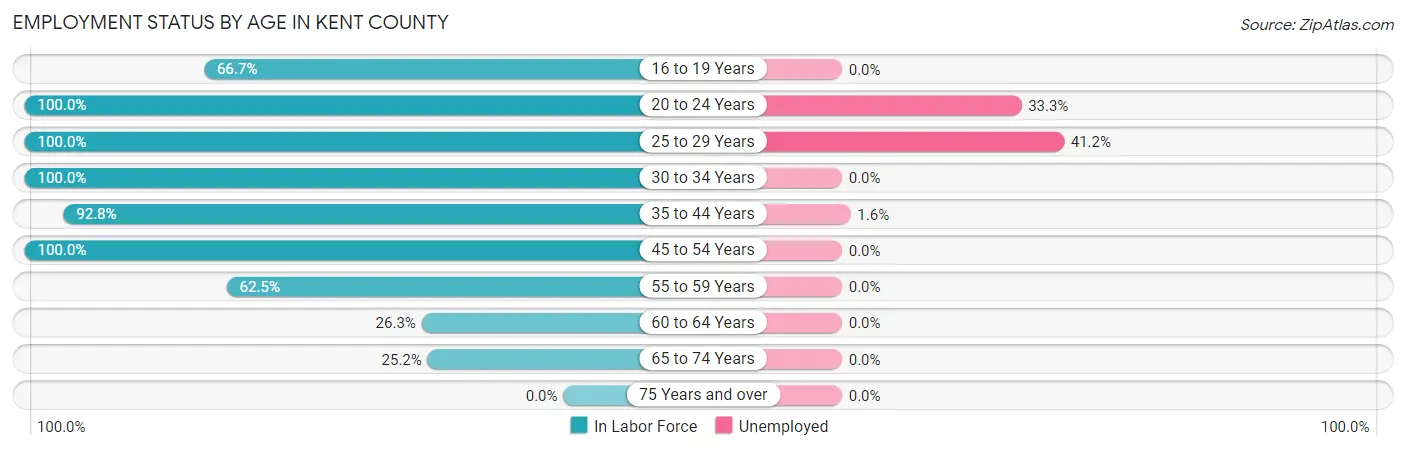
| Age Bracket | In Labor Force | Unemployed |
| 16 to 19 Years | 22 (66.7%) | 0 (0.0%) |
| 20 to 24 Years | 9 (100.0%) | 3 (33.3%) |
| 25 to 29 Years | 17 (100.0%) | 7 (41.2%) |
| 30 to 34 Years | 8 (100.0%) | 0 (0.0%) |
| 35 to 44 Years | 64 (92.8%) | 1 (1.6%) |
| 45 to 54 Years | 25 (100.0%) | 0 (0.0%) |
| 55 to 59 Years | 10 (62.5%) | 0 (0.0%) |
| 60 to 64 Years | 21 (26.3%) | 0 (0.0%) |
| 65 to 74 Years | 28 (25.2%) | 0 (0.0%) |
| 75 Years and over | 0 (0.0%) | 0 (0.0%) |
| Total | 204 (41.3%) | 11 (5.4%) |
Employment Status by Educational Attainment in Kent County
According to labor force statistics for Kent County, 67.4% of individuals (145) out of the total population between 25 and 64 years of age (215) are in the labor force, with 5.5% or 8 of them being unemployed. The group with the highest labor force participation rate are those with the educational attainment of bachelor's degree or higher, with 91.1% or 51 individuals in the labor force. Within the labor force, individuals with high school diploma education have the highest percentage of unemployment, with 36.4% or 8 of them being unemployed.
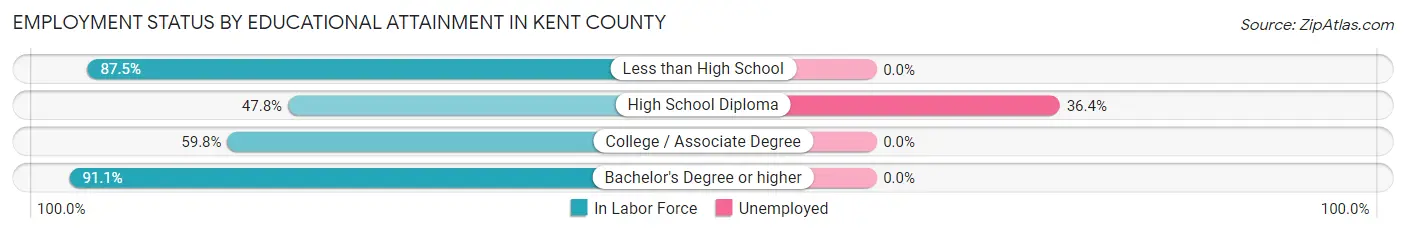
| Educational Attainment | In Labor Force | Unemployed |
| Less than High School | 14 (87.5%) | 0 (0.0%) |
| High School Diploma | 22 (47.8%) | 17 (36.4%) |
| College / Associate Degree | 58 (59.8%) | 0 (0.0%) |
| Bachelor's Degree or higher | 51 (91.1%) | 0 (0.0%) |
| Total | 145 (67.4%) | 12 (5.5%) |
Employment Occupations by Sex in Kent County
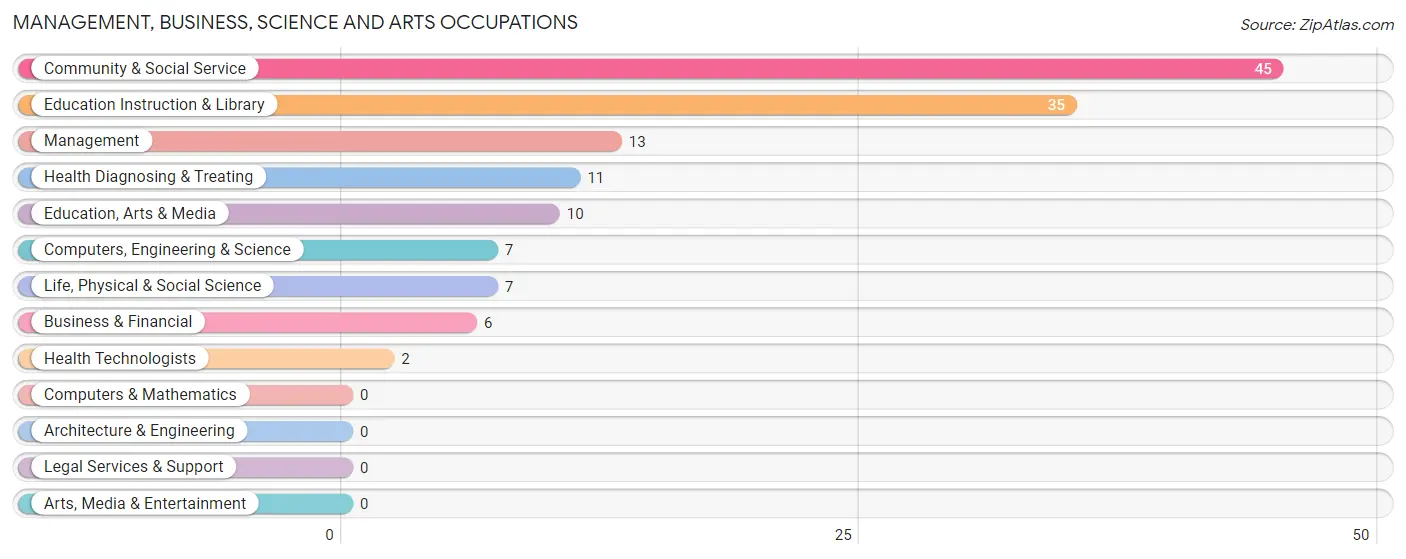
Management, Business, Science and Arts Occupations
The most common Management, Business, Science and Arts occupations in Kent County are Community & Social Service (45 | 23.3%), Education Instruction & Library (35 | 18.1%), Management (13 | 6.7%), Health Diagnosing & Treating (11 | 5.7%), and Education, Arts & Media (10 | 5.2%).
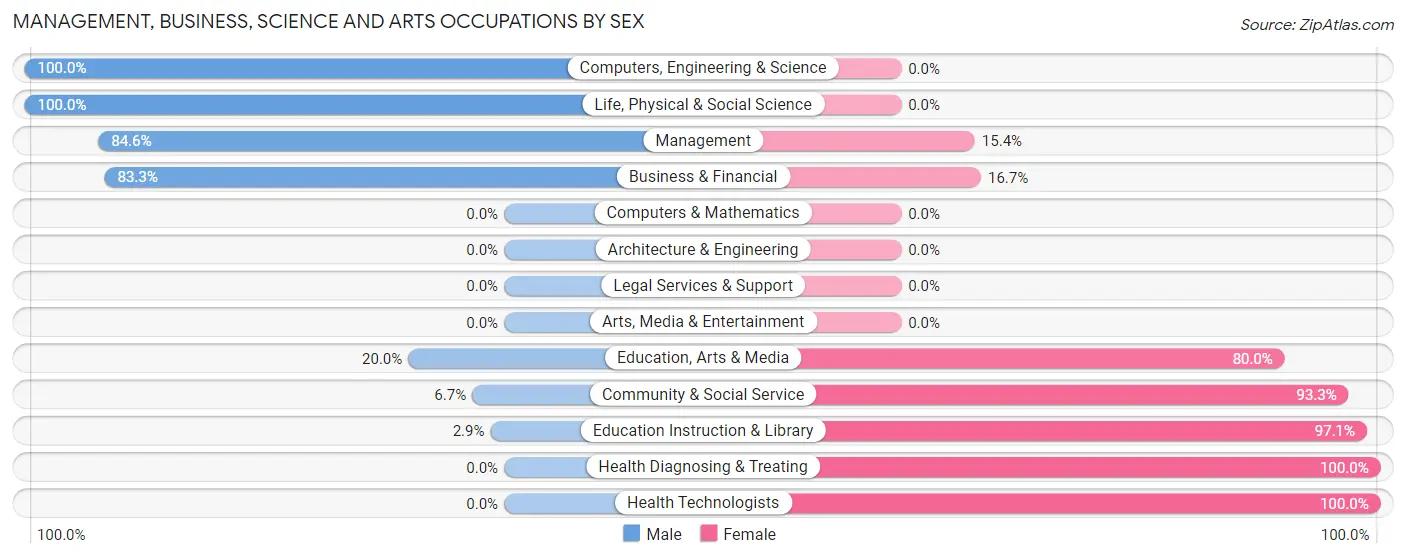
Management, Business, Science and Arts Occupations by Sex
Within the Management, Business, Science and Arts occupations in Kent County, the most male-oriented occupations are Computers, Engineering & Science (100.0%), Life, Physical & Social Science (100.0%), and Management (84.6%), while the most female-oriented occupations are Health Diagnosing & Treating (100.0%), Health Technologists (100.0%), and Education Instruction & Library (97.1%).
| Occupation | Male | Female |
| Management | 11 (84.6%) | 2 (15.4%) |
| Business & Financial | 5 (83.3%) | 1 (16.7%) |
| Computers, Engineering & Science | 7 (100.0%) | 0 (0.0%) |
| Computers & Mathematics | 0 (0.0%) | 0 (0.0%) |
| Architecture & Engineering | 0 (0.0%) | 0 (0.0%) |
| Life, Physical & Social Science | 7 (100.0%) | 0 (0.0%) |
| Community & Social Service | 3 (6.7%) | 42 (93.3%) |
| Education, Arts & Media | 2 (20.0%) | 8 (80.0%) |
| Legal Services & Support | 0 (0.0%) | 0 (0.0%) |
| Education Instruction & Library | 1 (2.9%) | 34 (97.1%) |
| Arts, Media & Entertainment | 0 (0.0%) | 0 (0.0%) |
| Health Diagnosing & Treating | 0 (0.0%) | 11 (100.0%) |
| Health Technologists | 0 (0.0%) | 2 (100.0%) |
| Total (Category) | 26 (31.7%) | 56 (68.3%) |
| Total (Overall) | 103 (53.4%) | 90 (46.6%) |
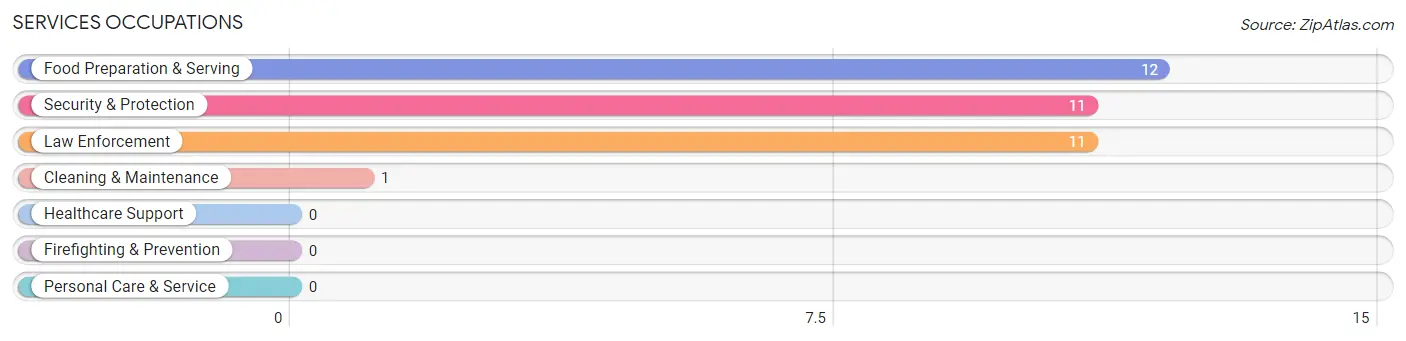
Services Occupations
The most common Services occupations in Kent County are Food Preparation & Serving (12 | 6.2%), Security & Protection (11 | 5.7%), Law Enforcement (11 | 5.7%), and Cleaning & Maintenance (1 | 0.5%).
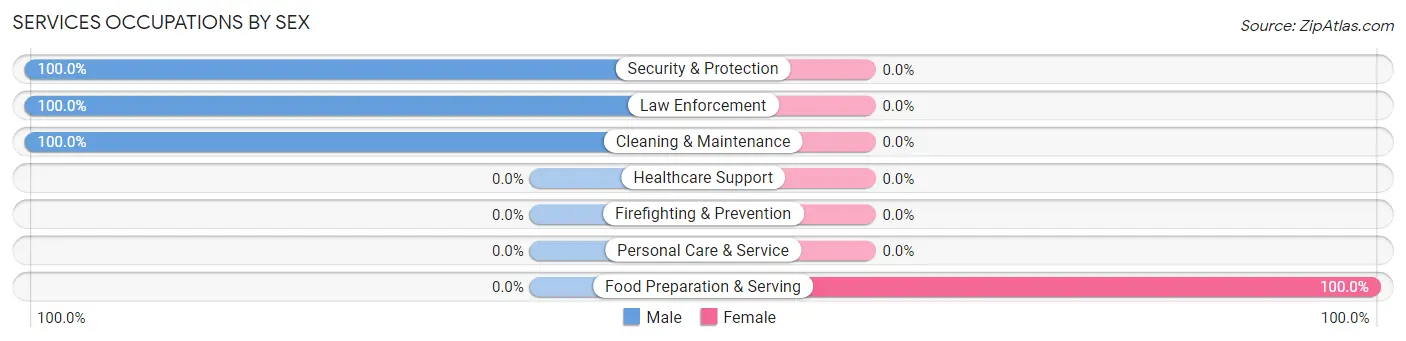
Services Occupations by Sex
| Occupation | Male | Female |
| Healthcare Support | 0 (0.0%) | 0 (0.0%) |
| Security & Protection | 11 (100.0%) | 0 (0.0%) |
| Firefighting & Prevention | 0 (0.0%) | 0 (0.0%) |
| Law Enforcement | 11 (100.0%) | 0 (0.0%) |
| Food Preparation & Serving | 0 (0.0%) | 12 (100.0%) |
| Cleaning & Maintenance | 1 (100.0%) | 0 (0.0%) |
| Personal Care & Service | 0 (0.0%) | 0 (0.0%) |
| Total (Category) | 12 (50.0%) | 12 (50.0%) |
| Total (Overall) | 103 (53.4%) | 90 (46.6%) |
Sales and Office Occupations
The most common Sales and Office occupations in Kent County are Office & Administration (14 | 7.2%), and Sales & Related (9 | 4.7%).

Sales and Office Occupations by Sex

| Occupation | Male | Female |
| Sales & Related | 2 (22.2%) | 7 (77.8%) |
| Office & Administration | 0 (0.0%) | 14 (100.0%) |
| Total (Category) | 2 (8.7%) | 21 (91.3%) |
| Total (Overall) | 103 (53.4%) | 90 (46.6%) |
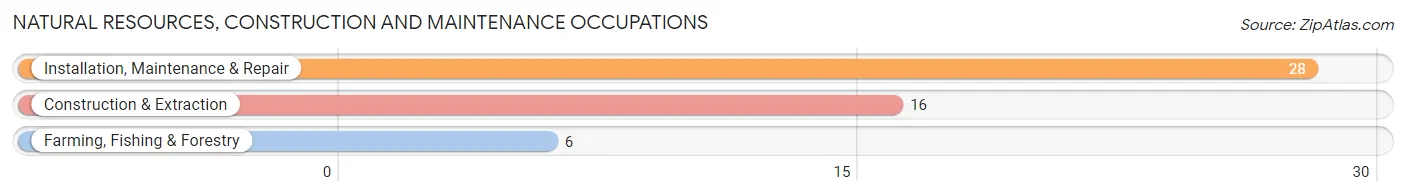
Natural Resources, Construction and Maintenance Occupations
The most common Natural Resources, Construction and Maintenance occupations in Kent County are Installation, Maintenance & Repair (28 | 14.5%), Construction & Extraction (16 | 8.3%), and Farming, Fishing & Forestry (6 | 3.1%).
Natural Resources, Construction and Maintenance Occupations by Sex
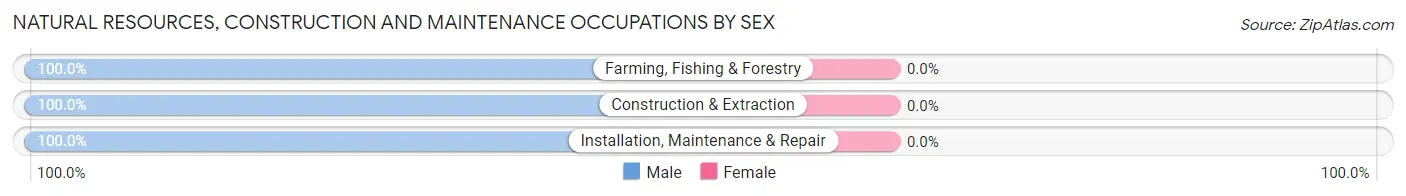
| Occupation | Male | Female |
| Farming, Fishing & Forestry | 6 (100.0%) | 0 (0.0%) |
| Construction & Extraction | 16 (100.0%) | 0 (0.0%) |
| Installation, Maintenance & Repair | 28 (100.0%) | 0 (0.0%) |
| Total (Category) | 50 (100.0%) | 0 (0.0%) |
| Total (Overall) | 103 (53.4%) | 90 (46.6%) |
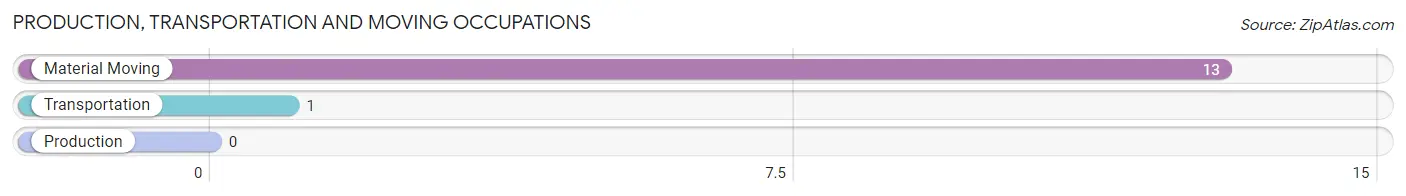
Production, Transportation and Moving Occupations
The most common Production, Transportation and Moving occupations in Kent County are Material Moving (13 | 6.7%), and Transportation (1 | 0.5%).
Production, Transportation and Moving Occupations by Sex
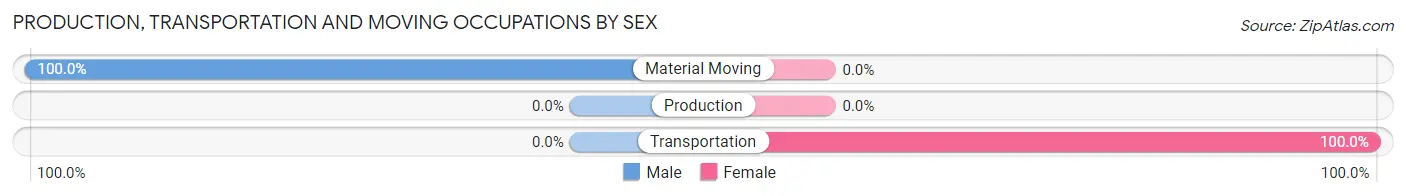
| Occupation | Male | Female |
| Production | 0 (0.0%) | 0 (0.0%) |
| Transportation | 0 (0.0%) | 1 (100.0%) |
| Material Moving | 13 (100.0%) | 0 (0.0%) |
| Total (Category) | 13 (92.9%) | 1 (7.1%) |
| Total (Overall) | 103 (53.4%) | 90 (46.6%) |
Employment Industries by Sex in Kent County
Employment Industries in Kent County
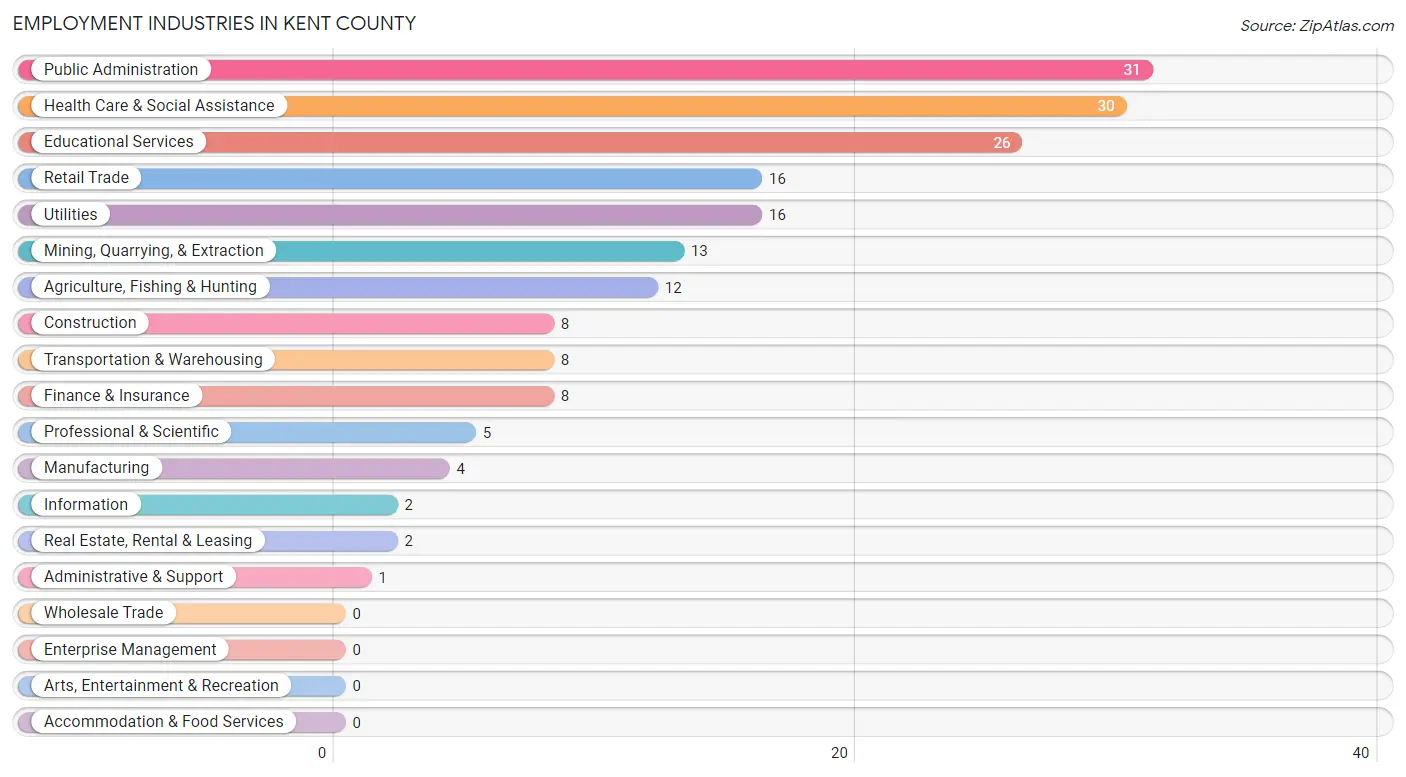
The major employment industries in Kent County include Public Administration (31 | 16.1%), Health Care & Social Assistance (30 | 15.5%), Educational Services (26 | 13.5%), Retail Trade (16 | 8.3%), and Utilities (16 | 8.3%).
Employment Industries by Sex in Kent County
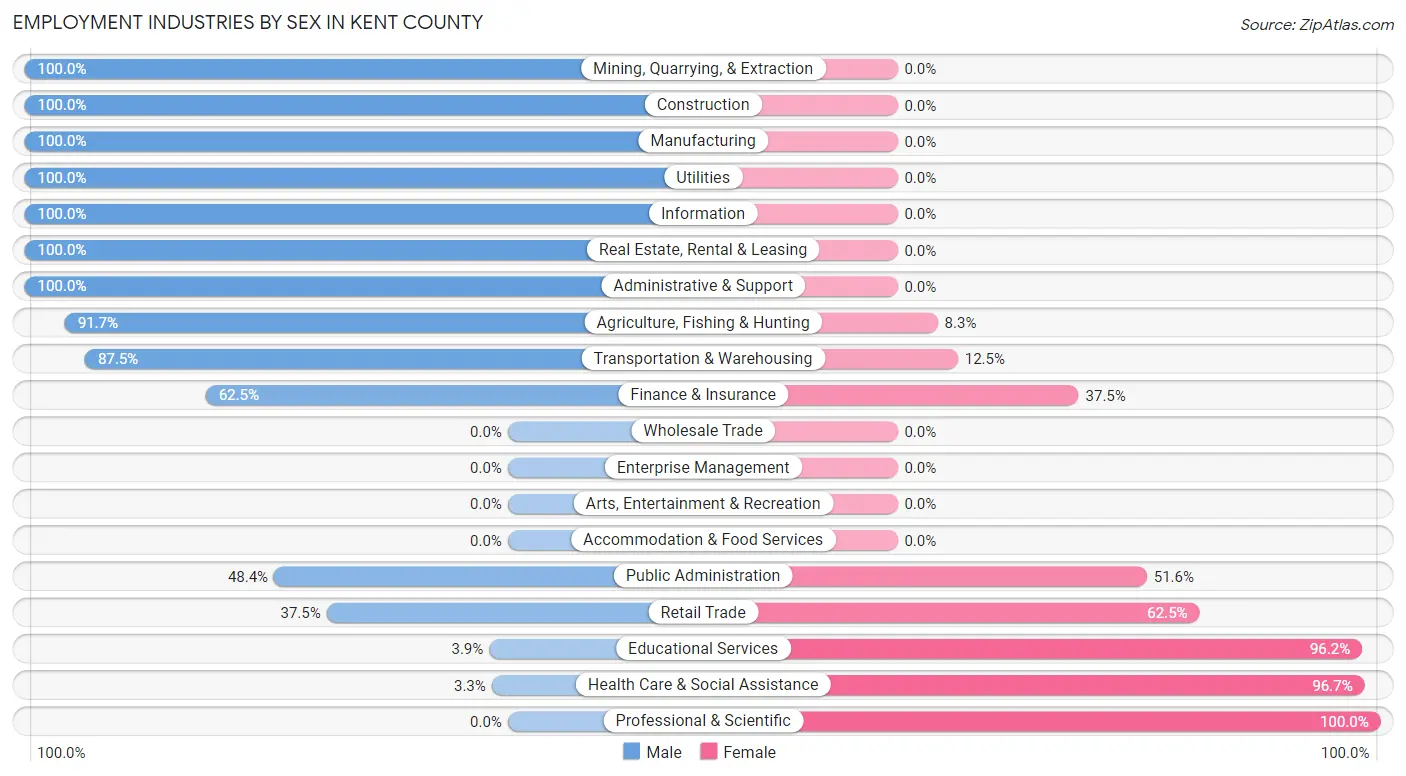
The Kent County industries that see more men than women are Mining, Quarrying, & Extraction (100.0%), Construction (100.0%), and Manufacturing (100.0%), whereas the industries that tend to have a higher number of women are Professional & Scientific (100.0%), Health Care & Social Assistance (96.7%), and Educational Services (96.2%).
| Industry | Male | Female |
| Agriculture, Fishing & Hunting | 11 (91.7%) | 1 (8.3%) |
| Mining, Quarrying, & Extraction | 13 (100.0%) | 0 (0.0%) |
| Construction | 8 (100.0%) | 0 (0.0%) |
| Manufacturing | 4 (100.0%) | 0 (0.0%) |
| Wholesale Trade | 0 (0.0%) | 0 (0.0%) |
| Retail Trade | 6 (37.5%) | 10 (62.5%) |
| Transportation & Warehousing | 7 (87.5%) | 1 (12.5%) |
| Utilities | 16 (100.0%) | 0 (0.0%) |
| Information | 2 (100.0%) | 0 (0.0%) |
| Finance & Insurance | 5 (62.5%) | 3 (37.5%) |
| Real Estate, Rental & Leasing | 2 (100.0%) | 0 (0.0%) |
| Professional & Scientific | 0 (0.0%) | 5 (100.0%) |
| Enterprise Management | 0 (0.0%) | 0 (0.0%) |
| Administrative & Support | 1 (100.0%) | 0 (0.0%) |
| Educational Services | 1 (3.8%) | 25 (96.2%) |
| Health Care & Social Assistance | 1 (3.3%) | 29 (96.7%) |
| Arts, Entertainment & Recreation | 0 (0.0%) | 0 (0.0%) |
| Accommodation & Food Services | 0 (0.0%) | 0 (0.0%) |
| Public Administration | 15 (48.4%) | 16 (51.6%) |
| Total | 103 (53.4%) | 90 (46.6%) |
Education in Kent County
School Enrollment in Kent County
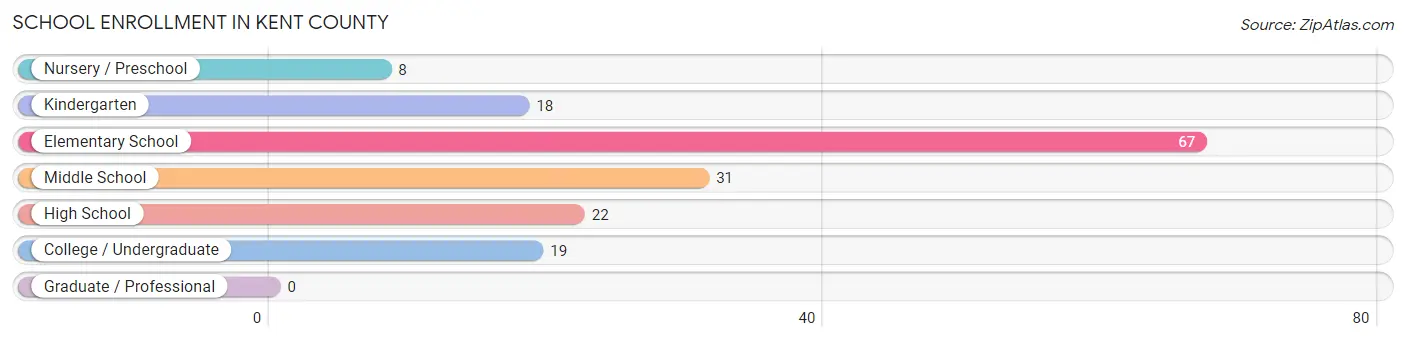
The most common levels of schooling among the 165 students in Kent County are elementary school (67 | 40.6%), middle school (31 | 18.8%), and high school (22 | 13.3%).
| School Level | # Students | % Students |
| Nursery / Preschool | 8 | 4.9% |
| Kindergarten | 18 | 10.9% |
| Elementary School | 67 | 40.6% |
| Middle School | 31 | 18.8% |
| High School | 22 | 13.3% |
| College / Undergraduate | 19 | 11.5% |
| Graduate / Professional | 0 | 0.0% |
| Total | 165 | 100.0% |
School Enrollment by Age by Funding Source in Kent County
| Age Bracket | Public School | Private School |
| 3 to 4 Year Olds | 8 (100.0%) | 0 (0.0%) |
| 5 to 9 Year Old | 59 (100.0%) | 0 (0.0%) |
| 10 to 14 Year Olds | 57 (100.0%) | 0 (0.0%) |
| 15 to 17 Year Olds | 15 (100.0%) | 0 (0.0%) |
| 18 to 19 Year Olds | 18 (100.0%) | 0 (0.0%) |
| 20 to 24 Year Olds | 0 (0.0%) | 0 (0.0%) |
| 25 to 34 Year Olds | 8 (100.0%) | 0 (0.0%) |
| 35 Years and over | 0 (0.0%) | 0 (0.0%) |
| Total | 165 (100.0%) | 0 (0.0%) |
Educational Attainment by Field of Study in Kent County
Education (75 | 50.3%), bio, nature & agricultural (18 | 12.1%), business (13 | 8.7%), liberal arts & history (13 | 8.7%), and computers & mathematics (10 | 6.7%) are the most common fields of study among 149 individuals in Kent County who have obtained a bachelor's degree or higher.
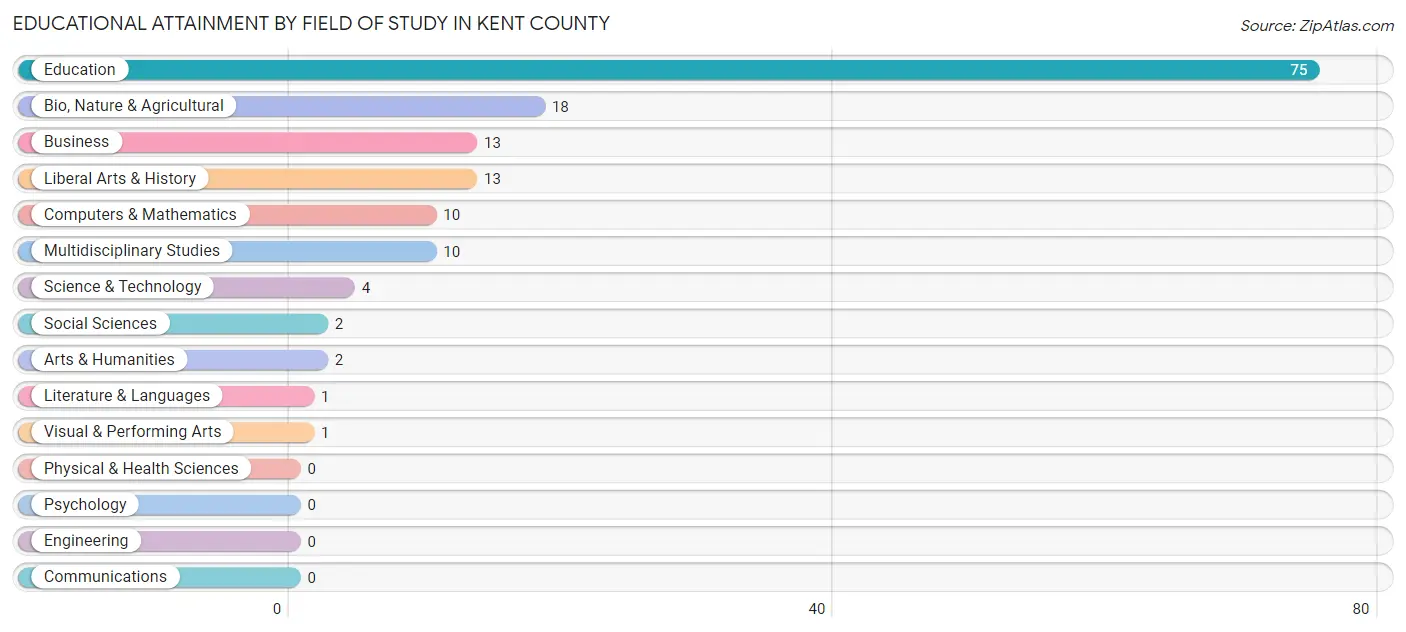
| Field of Study | # Graduates | % Graduates |
| Computers & Mathematics | 10 | 6.7% |
| Bio, Nature & Agricultural | 18 | 12.1% |
| Physical & Health Sciences | 0 | 0.0% |
| Psychology | 0 | 0.0% |
| Social Sciences | 2 | 1.3% |
| Engineering | 0 | 0.0% |
| Multidisciplinary Studies | 10 | 6.7% |
| Science & Technology | 4 | 2.7% |
| Business | 13 | 8.7% |
| Education | 75 | 50.3% |
| Literature & Languages | 1 | 0.7% |
| Liberal Arts & History | 13 | 8.7% |
| Visual & Performing Arts | 1 | 0.7% |
| Communications | 0 | 0.0% |
| Arts & Humanities | 2 | 1.3% |
| Total | 149 | 100.0% |
Transportation & Commute in Kent County
Vehicle Availability by Sex in Kent County
The most prevalent vehicle ownership categories in Kent County are males with 2 vehicles (52, accounting for 53.6%) and females with 2 vehicles (37, making up 59.1%).
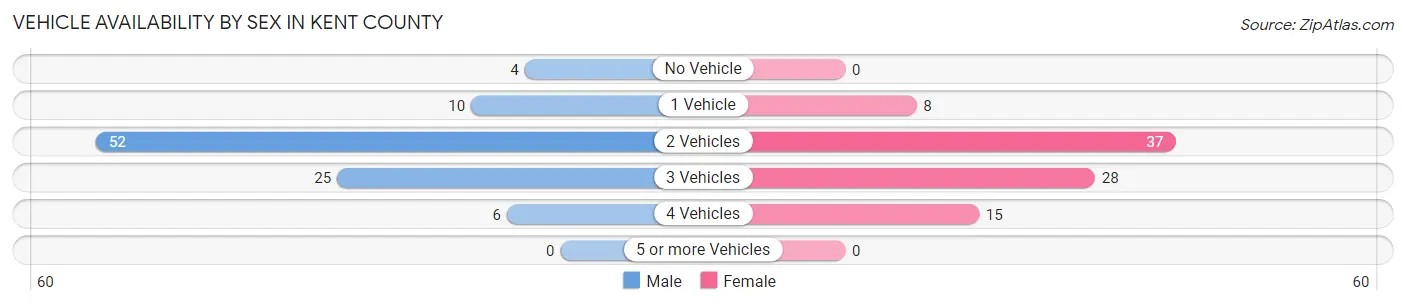
| Vehicles Available | Male | Female |
| No Vehicle | 4 (4.1%) | 0 (0.0%) |
| 1 Vehicle | 10 (10.3%) | 8 (9.1%) |
| 2 Vehicles | 52 (53.6%) | 37 (42.0%) |
| 3 Vehicles | 25 (25.8%) | 28 (31.8%) |
| 4 Vehicles | 6 (6.2%) | 15 (17.1%) |
| 5 or more Vehicles | 0 (0.0%) | 0 (0.0%) |
| Total | 97 (100.0%) | 88 (100.0%) |
Commute Time in Kent County
The most frequently occuring commute durations in Kent County are less than 5 minutes (64 commuters, 37.2%), 5 to 9 minutes (47 commuters, 27.3%), and 25 to 29 minutes (16 commuters, 9.3%).
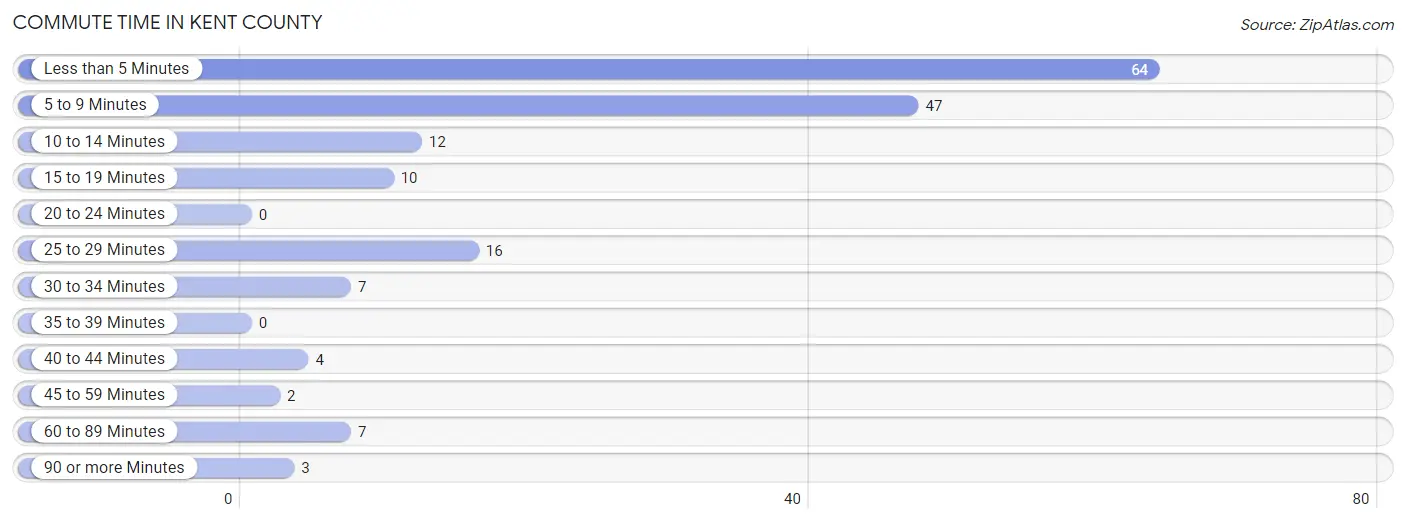
| Commute Time | # Commuters | % Commuters |
| Less than 5 Minutes | 64 | 37.2% |
| 5 to 9 Minutes | 47 | 27.3% |
| 10 to 14 Minutes | 12 | 7.0% |
| 15 to 19 Minutes | 10 | 5.8% |
| 20 to 24 Minutes | 0 | 0.0% |
| 25 to 29 Minutes | 16 | 9.3% |
| 30 to 34 Minutes | 7 | 4.1% |
| 35 to 39 Minutes | 0 | 0.0% |
| 40 to 44 Minutes | 4 | 2.3% |
| 45 to 59 Minutes | 2 | 1.2% |
| 60 to 89 Minutes | 7 | 4.1% |
| 90 or more Minutes | 3 | 1.7% |
Commute Time by Sex in Kent County
The most common commute times in Kent County are less than 5 minutes (27 commuters, 30.0%) for males and less than 5 minutes (37 commuters, 45.1%) for females.
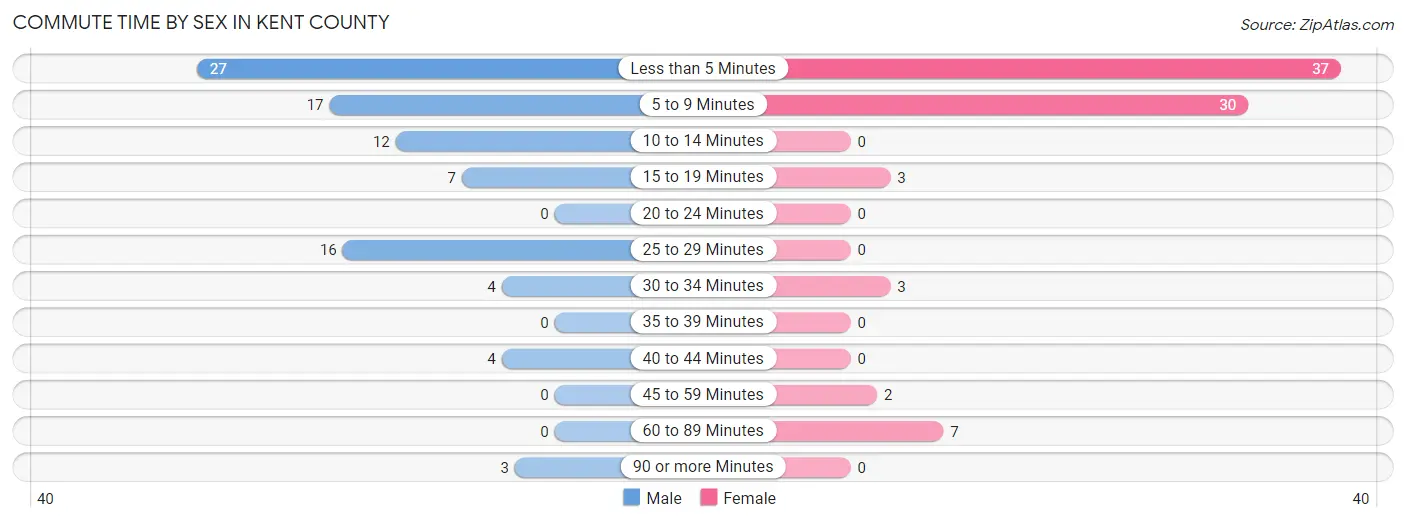
| Commute Time | Male | Female |
| Less than 5 Minutes | 27 (30.0%) | 37 (45.1%) |
| 5 to 9 Minutes | 17 (18.9%) | 30 (36.6%) |
| 10 to 14 Minutes | 12 (13.3%) | 0 (0.0%) |
| 15 to 19 Minutes | 7 (7.8%) | 3 (3.7%) |
| 20 to 24 Minutes | 0 (0.0%) | 0 (0.0%) |
| 25 to 29 Minutes | 16 (17.8%) | 0 (0.0%) |
| 30 to 34 Minutes | 4 (4.4%) | 3 (3.7%) |
| 35 to 39 Minutes | 0 (0.0%) | 0 (0.0%) |
| 40 to 44 Minutes | 4 (4.4%) | 0 (0.0%) |
| 45 to 59 Minutes | 0 (0.0%) | 2 (2.4%) |
| 60 to 89 Minutes | 0 (0.0%) | 7 (8.5%) |
| 90 or more Minutes | 3 (3.3%) | 0 (0.0%) |
Time of Departure to Work by Sex in Kent County
The most frequent times of departure to work in Kent County are 6:30 AM to 6:59 AM (38, 42.2%) for males and 7:30 AM to 7:59 AM (27, 32.9%) for females.
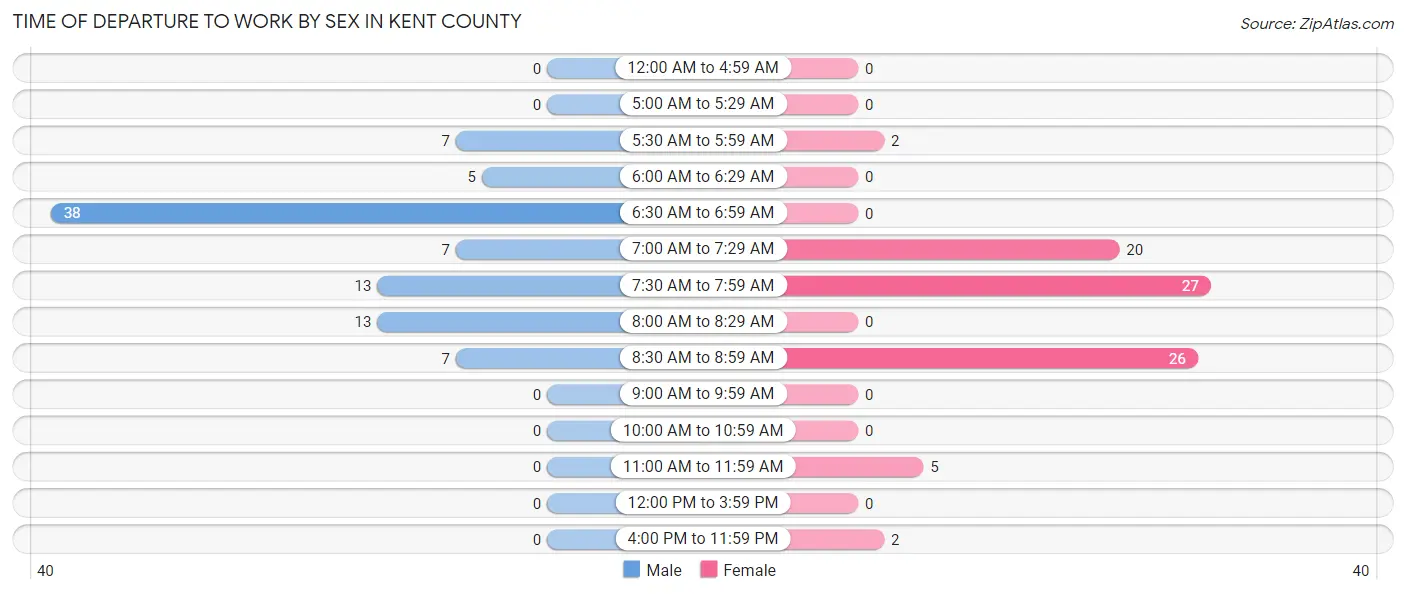
| Time of Departure | Male | Female |
| 12:00 AM to 4:59 AM | 0 (0.0%) | 0 (0.0%) |
| 5:00 AM to 5:29 AM | 0 (0.0%) | 0 (0.0%) |
| 5:30 AM to 5:59 AM | 7 (7.8%) | 2 (2.4%) |
| 6:00 AM to 6:29 AM | 5 (5.6%) | 0 (0.0%) |
| 6:30 AM to 6:59 AM | 38 (42.2%) | 0 (0.0%) |
| 7:00 AM to 7:29 AM | 7 (7.8%) | 20 (24.4%) |
| 7:30 AM to 7:59 AM | 13 (14.4%) | 27 (32.9%) |
| 8:00 AM to 8:29 AM | 13 (14.4%) | 0 (0.0%) |
| 8:30 AM to 8:59 AM | 7 (7.8%) | 26 (31.7%) |
| 9:00 AM to 9:59 AM | 0 (0.0%) | 0 (0.0%) |
| 10:00 AM to 10:59 AM | 0 (0.0%) | 0 (0.0%) |
| 11:00 AM to 11:59 AM | 0 (0.0%) | 5 (6.1%) |
| 12:00 PM to 3:59 PM | 0 (0.0%) | 0 (0.0%) |
| 4:00 PM to 11:59 PM | 0 (0.0%) | 2 (2.4%) |
| Total | 90 (100.0%) | 82 (100.0%) |
Housing Occupancy in Kent County
Occupancy by Ownership in Kent County
Of the total 246 dwellings in Kent County, owner-occupied units account for 199 (80.9%), while renter-occupied units make up 47 (19.1%).
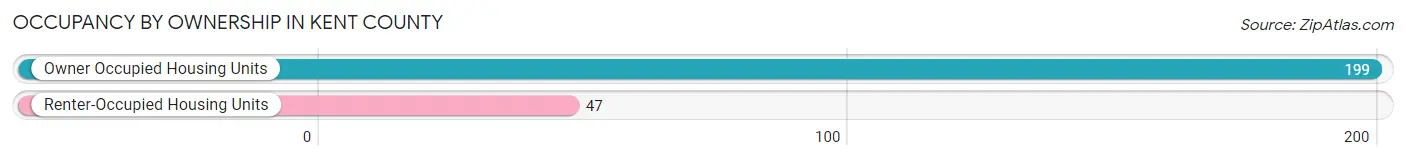
| Occupancy | # Housing Units | % Housing Units |
| Owner Occupied Housing Units | 199 | 80.9% |
| Renter-Occupied Housing Units | 47 | 19.1% |
| Total Occupied Housing Units | 246 | 100.0% |
Occupancy by Household Size in Kent County
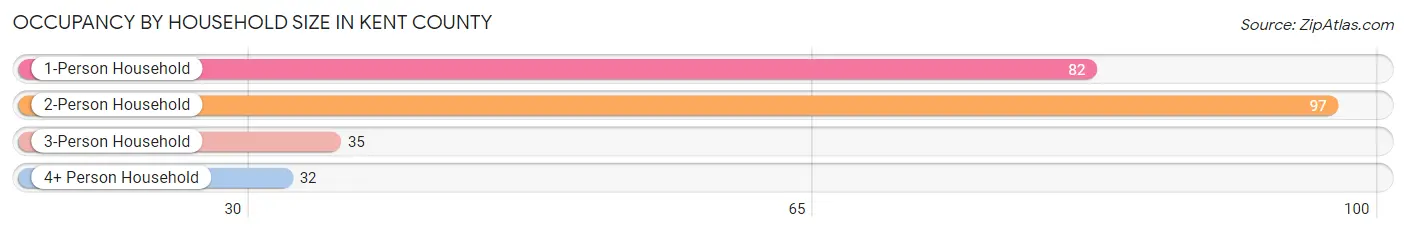
| Household Size | # Housing Units | % Housing Units |
| 1-Person Household | 82 | 33.3% |
| 2-Person Household | 97 | 39.4% |
| 3-Person Household | 35 | 14.2% |
| 4+ Person Household | 32 | 13.0% |
| Total Housing Units | 246 | 100.0% |
Occupancy by Ownership by Household Size in Kent County
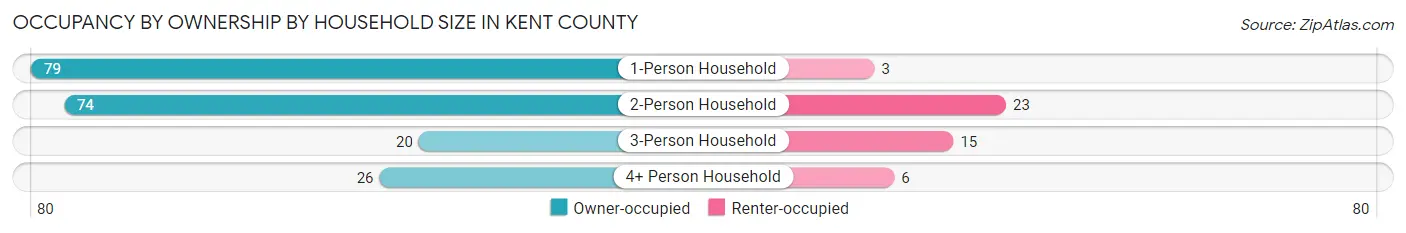
| Household Size | Owner-occupied | Renter-occupied |
| 1-Person Household | 79 (96.3%) | 3 (3.7%) |
| 2-Person Household | 74 (76.3%) | 23 (23.7%) |
| 3-Person Household | 20 (57.1%) | 15 (42.9%) |
| 4+ Person Household | 26 (81.2%) | 6 (18.8%) |
| Total Housing Units | 199 (80.9%) | 47 (19.1%) |
Occupancy by Educational Attainment in Kent County
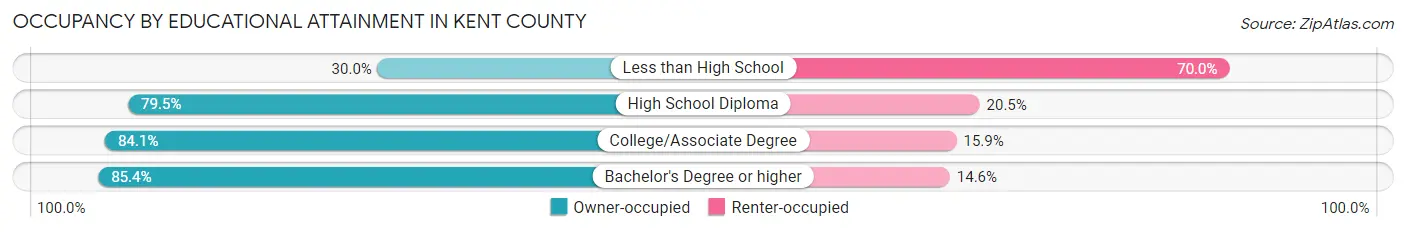
| Household Size | Owner-occupied | Renter-occupied |
| Less than High School | 3 (30.0%) | 7 (70.0%) |
| High School Diploma | 62 (79.5%) | 16 (20.5%) |
| College/Associate Degree | 58 (84.1%) | 11 (15.9%) |
| Bachelor's Degree or higher | 76 (85.4%) | 13 (14.6%) |
Occupancy by Age of Householder in Kent County
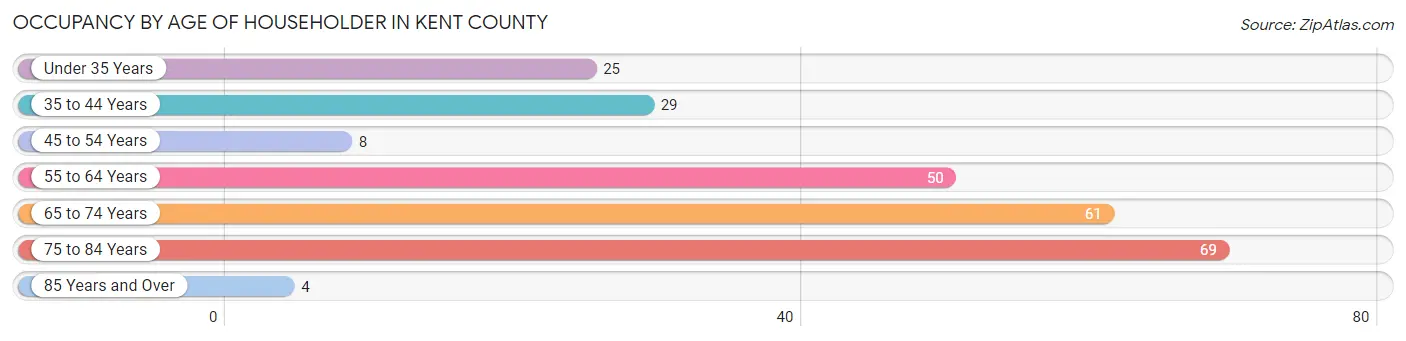
| Age Bracket | # Households | % Households |
| Under 35 Years | 25 | 10.2% |
| 35 to 44 Years | 29 | 11.8% |
| 45 to 54 Years | 8 | 3.3% |
| 55 to 64 Years | 50 | 20.3% |
| 65 to 74 Years | 61 | 24.8% |
| 75 to 84 Years | 69 | 28.1% |
| 85 Years and Over | 4 | 1.6% |
| Total | 246 | 100.0% |
Housing Finances in Kent County
Median Income by Occupancy in Kent County
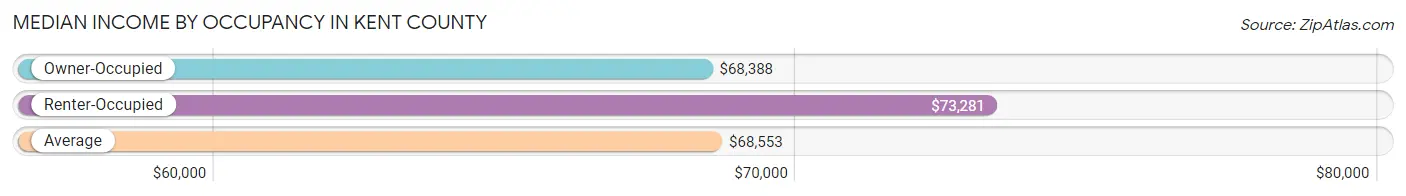
| Occupancy Type | # Households | Median Income |
| Owner-Occupied | 199 (80.9%) | $68,388 |
| Renter-Occupied | 47 (19.1%) | $73,281 |
| Average | 246 (100.0%) | $68,553 |
Occupancy by Householder Income Bracket in Kent County
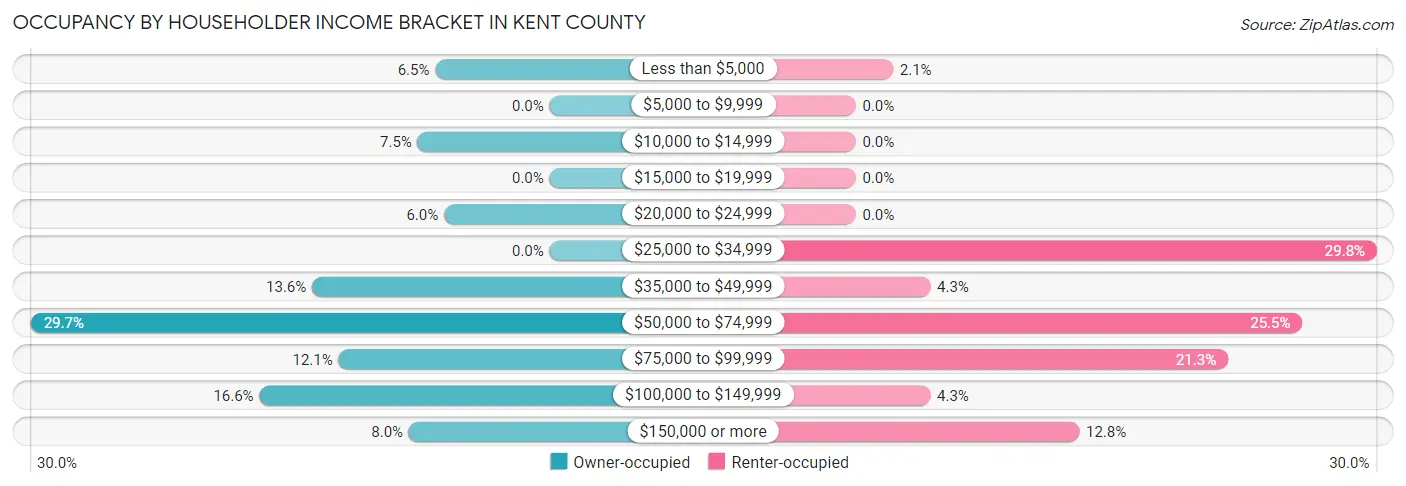
| Income Bracket | Owner-occupied | Renter-occupied |
| Less than $5,000 | 13 (6.5%) | 1 (2.1%) |
| $5,000 to $9,999 | 0 (0.0%) | 0 (0.0%) |
| $10,000 to $14,999 | 15 (7.5%) | 0 (0.0%) |
| $15,000 to $19,999 | 0 (0.0%) | 0 (0.0%) |
| $20,000 to $24,999 | 12 (6.0%) | 0 (0.0%) |
| $25,000 to $34,999 | 0 (0.0%) | 14 (29.8%) |
| $35,000 to $49,999 | 27 (13.6%) | 2 (4.3%) |
| $50,000 to $74,999 | 59 (29.6%) | 12 (25.5%) |
| $75,000 to $99,999 | 24 (12.1%) | 10 (21.3%) |
| $100,000 to $149,999 | 33 (16.6%) | 2 (4.3%) |
| $150,000 or more | 16 (8.0%) | 6 (12.8%) |
| Total | 199 (100.0%) | 47 (100.0%) |
Monthly Housing Cost Tiers in Kent County
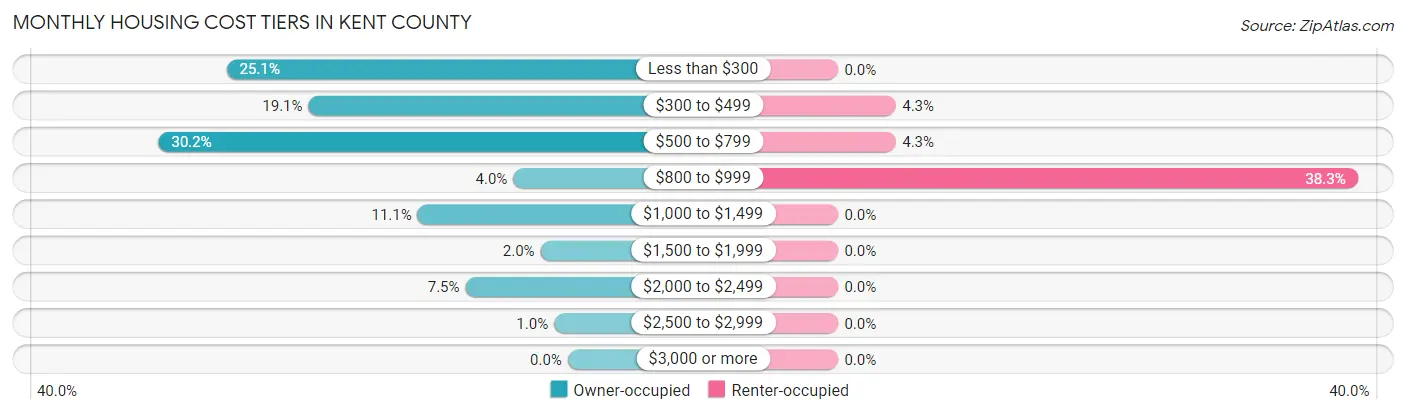
| Monthly Cost | Owner-occupied | Renter-occupied |
| Less than $300 | 50 (25.1%) | 0 (0.0%) |
| $300 to $499 | 38 (19.1%) | 2 (4.3%) |
| $500 to $799 | 60 (30.1%) | 2 (4.3%) |
| $800 to $999 | 8 (4.0%) | 18 (38.3%) |
| $1,000 to $1,499 | 22 (11.1%) | 0 (0.0%) |
| $1,500 to $1,999 | 4 (2.0%) | 0 (0.0%) |
| $2,000 to $2,499 | 15 (7.5%) | 0 (0.0%) |
| $2,500 to $2,999 | 2 (1.0%) | 0 (0.0%) |
| $3,000 or more | 0 (0.0%) | 0 (0.0%) |
| Total | 199 (100.0%) | 47 (100.0%) |
Physical Housing Characteristics in Kent County
Housing Structures in Kent County
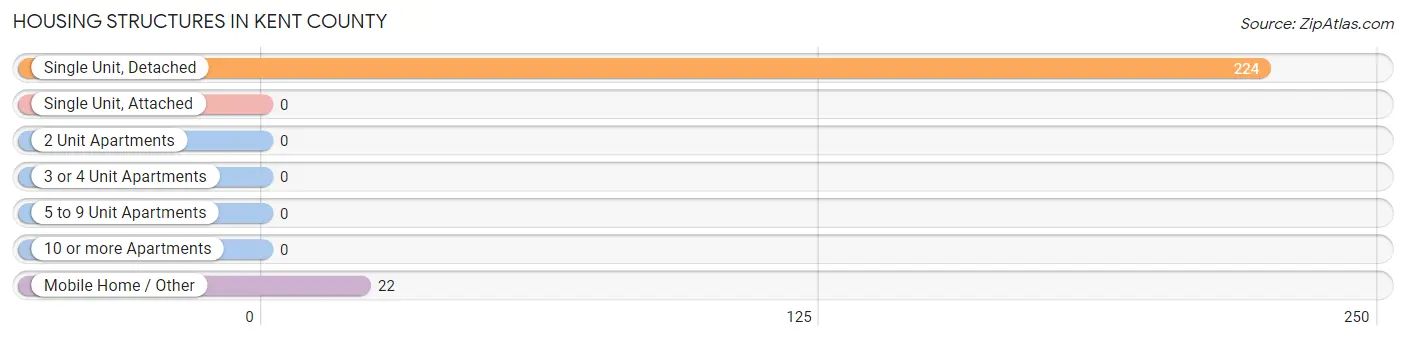
| Structure Type | # Housing Units | % Housing Units |
| Single Unit, Detached | 224 | 91.1% |
| Single Unit, Attached | 0 | 0.0% |
| 2 Unit Apartments | 0 | 0.0% |
| 3 or 4 Unit Apartments | 0 | 0.0% |
| 5 to 9 Unit Apartments | 0 | 0.0% |
| 10 or more Apartments | 0 | 0.0% |
| Mobile Home / Other | 22 | 8.9% |
| Total | 246 | 100.0% |
Housing Structures by Occupancy in Kent County
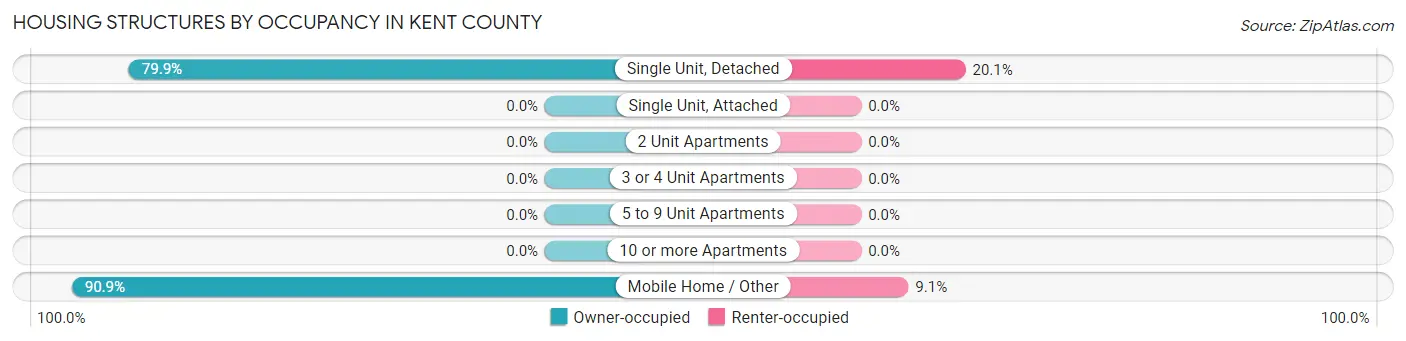
| Structure Type | Owner-occupied | Renter-occupied |
| Single Unit, Detached | 179 (79.9%) | 45 (20.1%) |
| Single Unit, Attached | 0 (0.0%) | 0 (0.0%) |
| 2 Unit Apartments | 0 (0.0%) | 0 (0.0%) |
| 3 or 4 Unit Apartments | 0 (0.0%) | 0 (0.0%) |
| 5 to 9 Unit Apartments | 0 (0.0%) | 0 (0.0%) |
| 10 or more Apartments | 0 (0.0%) | 0 (0.0%) |
| Mobile Home / Other | 20 (90.9%) | 2 (9.1%) |
| Total | 199 (80.9%) | 47 (19.1%) |
Housing Structures by Number of Rooms in Kent County
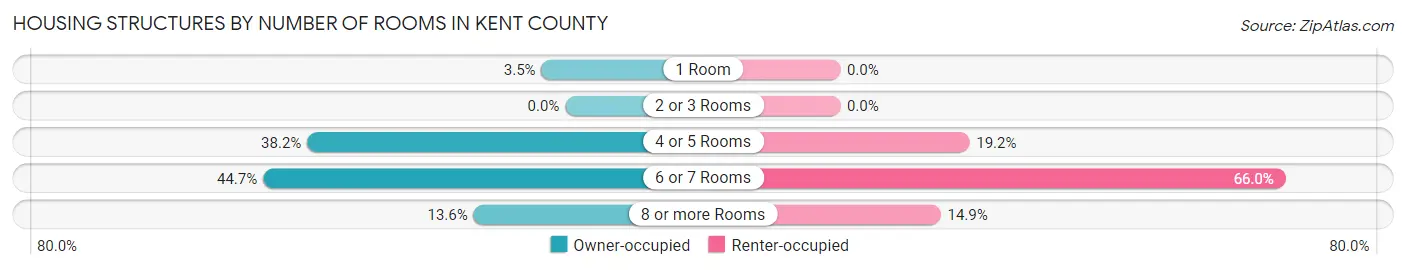
| Number of Rooms | Owner-occupied | Renter-occupied |
| 1 Room | 7 (3.5%) | 0 (0.0%) |
| 2 or 3 Rooms | 0 (0.0%) | 0 (0.0%) |
| 4 or 5 Rooms | 76 (38.2%) | 9 (19.2%) |
| 6 or 7 Rooms | 89 (44.7%) | 31 (66.0%) |
| 8 or more Rooms | 27 (13.6%) | 7 (14.9%) |
| Total | 199 (100.0%) | 47 (100.0%) |
Housing Structure by Heating Type in Kent County
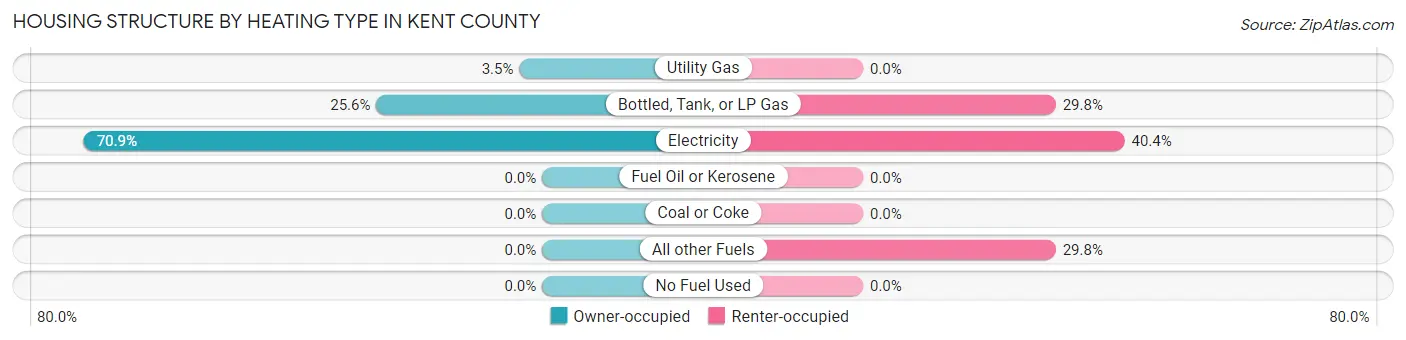
| Heating Type | Owner-occupied | Renter-occupied |
| Utility Gas | 7 (3.5%) | 0 (0.0%) |
| Bottled, Tank, or LP Gas | 51 (25.6%) | 14 (29.8%) |
| Electricity | 141 (70.9%) | 19 (40.4%) |
| Fuel Oil or Kerosene | 0 (0.0%) | 0 (0.0%) |
| Coal or Coke | 0 (0.0%) | 0 (0.0%) |
| All other Fuels | 0 (0.0%) | 14 (29.8%) |
| No Fuel Used | 0 (0.0%) | 0 (0.0%) |
| Total | 199 (100.0%) | 47 (100.0%) |
Household Vehicle Usage in Kent County
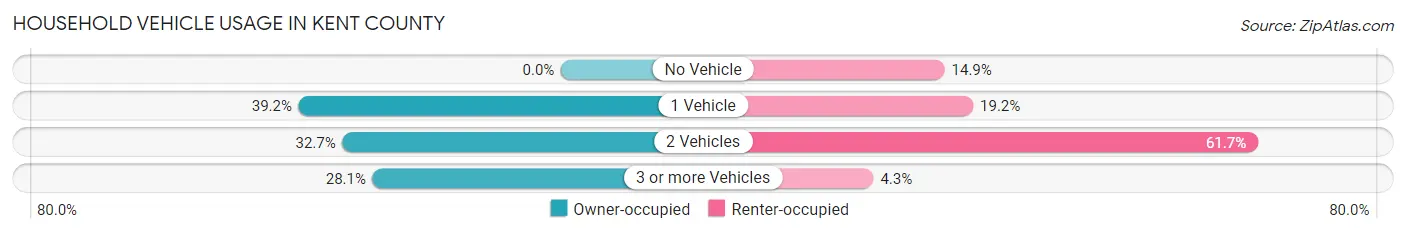
| Vehicles per Household | Owner-occupied | Renter-occupied |
| No Vehicle | 0 (0.0%) | 7 (14.9%) |
| 1 Vehicle | 78 (39.2%) | 9 (19.2%) |
| 2 Vehicles | 65 (32.7%) | 29 (61.7%) |
| 3 or more Vehicles | 56 (28.1%) | 2 (4.3%) |
| Total | 199 (100.0%) | 47 (100.0%) |
Real Estate & Mortgages in Kent County
Real Estate and Mortgage Overview in Kent County
| Characteristic | Without Mortgage | With Mortgage |
| Housing Units | 168 | 31 |
| Median Property Value | $49,300 | $293,800 |
| Median Household Income | $67,697 | $14 |
| Monthly Housing Costs | $460 | $0 |
| Real Estate Taxes | $614 | $0 |
Property Value by Mortgage Status in Kent County
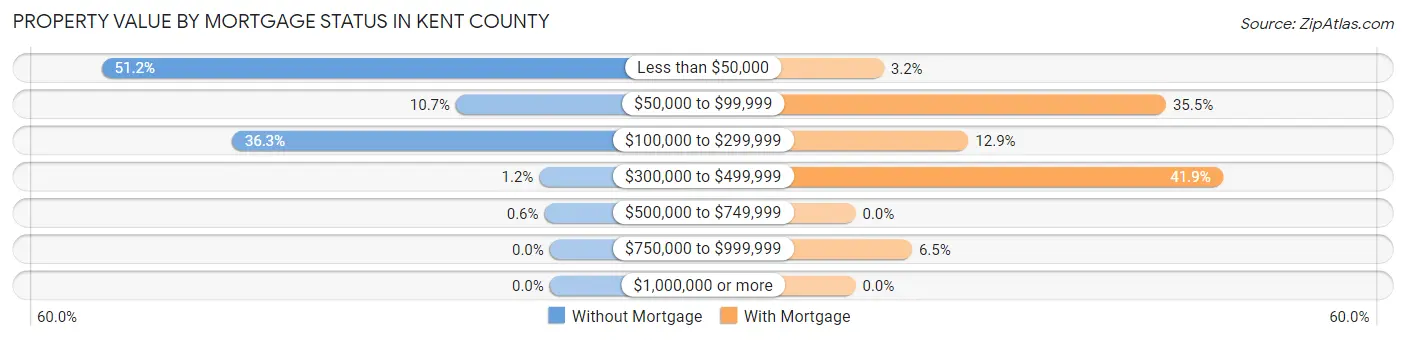
| Property Value | Without Mortgage | With Mortgage |
| Less than $50,000 | 86 (51.2%) | 1 (3.2%) |
| $50,000 to $99,999 | 18 (10.7%) | 11 (35.5%) |
| $100,000 to $299,999 | 61 (36.3%) | 4 (12.9%) |
| $300,000 to $499,999 | 2 (1.2%) | 13 (41.9%) |
| $500,000 to $749,999 | 1 (0.6%) | 0 (0.0%) |
| $750,000 to $999,999 | 0 (0.0%) | 2 (6.5%) |
| $1,000,000 or more | 0 (0.0%) | 0 (0.0%) |
| Total | 168 (100.0%) | 31 (100.0%) |
Household Income by Mortgage Status in Kent County
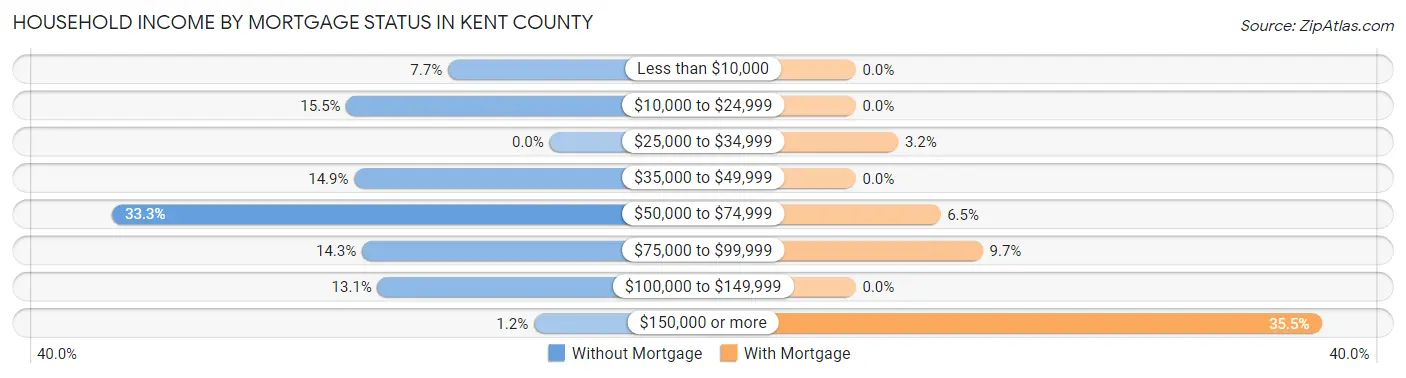
| Household Income | Without Mortgage | With Mortgage |
| Less than $10,000 | 13 (7.7%) | 0 (0.0%) |
| $10,000 to $24,999 | 26 (15.5%) | 0 (0.0%) |
| $25,000 to $34,999 | 0 (0.0%) | 1 (3.2%) |
| $35,000 to $49,999 | 25 (14.9%) | 0 (0.0%) |
| $50,000 to $74,999 | 56 (33.3%) | 2 (6.5%) |
| $75,000 to $99,999 | 24 (14.3%) | 3 (9.7%) |
| $100,000 to $149,999 | 22 (13.1%) | 0 (0.0%) |
| $150,000 or more | 2 (1.2%) | 11 (35.5%) |
| Total | 168 (100.0%) | 31 (100.0%) |
Property Value to Household Income Ratio in Kent County
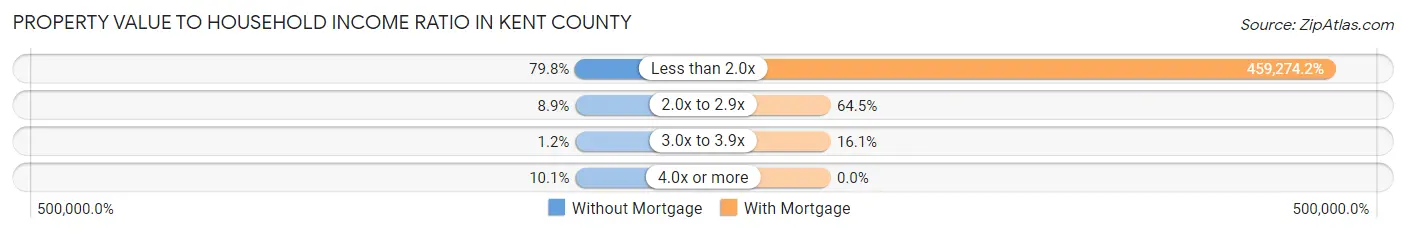
| Value-to-Income Ratio | Without Mortgage | With Mortgage |
| Less than 2.0x | 134 (79.8%) | 142,375 (459,274.2%) |
| 2.0x to 2.9x | 15 (8.9%) | 20 (64.5%) |
| 3.0x to 3.9x | 2 (1.2%) | 5 (16.1%) |
| 4.0x or more | 17 (10.1%) | 0 (0.0%) |
| Total | 168 (100.0%) | 31 (100.0%) |
Real Estate Taxes by Mortgage Status in Kent County
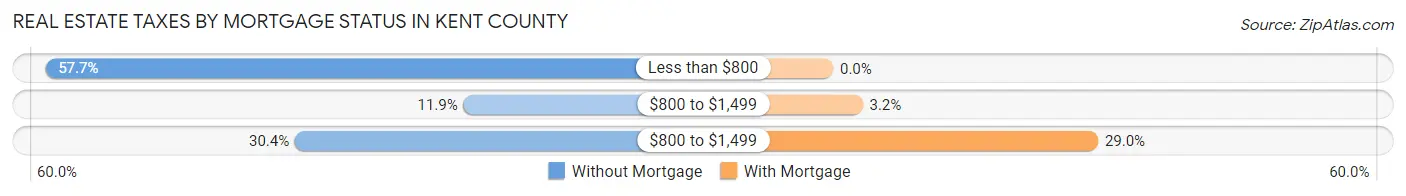
| Property Taxes | Without Mortgage | With Mortgage |
| Less than $800 | 97 (57.7%) | 0 (0.0%) |
| $800 to $1,499 | 20 (11.9%) | 1 (3.2%) |
| $800 to $1,499 | 51 (30.4%) | 9 (29.0%) |
| Total | 168 (100.0%) | 31 (100.0%) |
Health & Disability in Kent County
Health Insurance Coverage by Age in Kent County
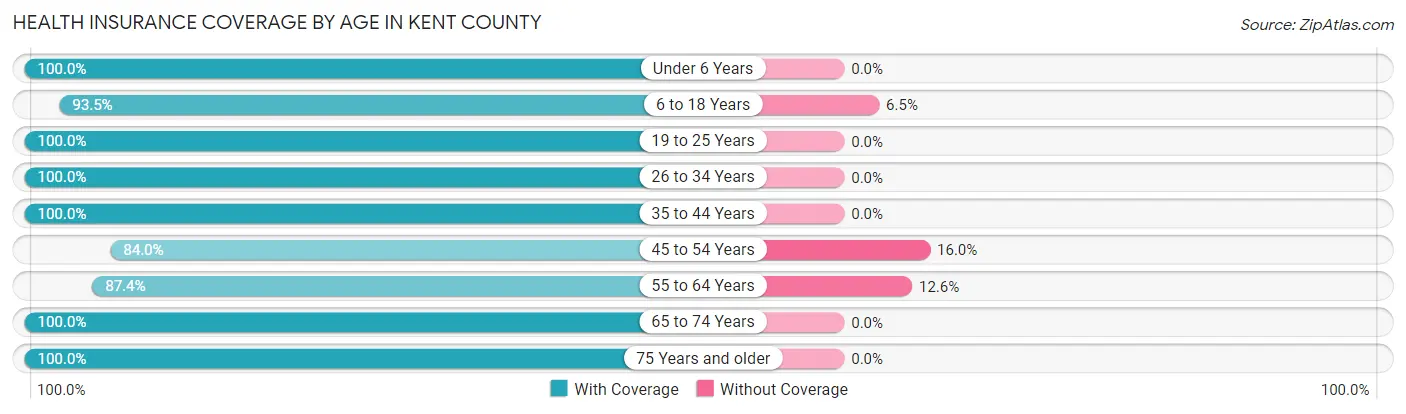
| Age Bracket | With Coverage | Without Coverage |
| Under 6 Years | 38 (100.0%) | 0 (0.0%) |
| 6 to 18 Years | 115 (93.5%) | 8 (6.5%) |
| 19 to 25 Years | 13 (100.0%) | 0 (0.0%) |
| 26 to 34 Years | 25 (100.0%) | 0 (0.0%) |
| 35 to 44 Years | 69 (100.0%) | 0 (0.0%) |
| 45 to 54 Years | 21 (84.0%) | 4 (16.0%) |
| 55 to 64 Years | 83 (87.4%) | 12 (12.6%) |
| 65 to 74 Years | 105 (100.0%) | 0 (0.0%) |
| 75 Years and older | 85 (100.0%) | 0 (0.0%) |
| Total | 554 (95.9%) | 24 (4.2%) |
Health Insurance Coverage by Citizenship Status in Kent County
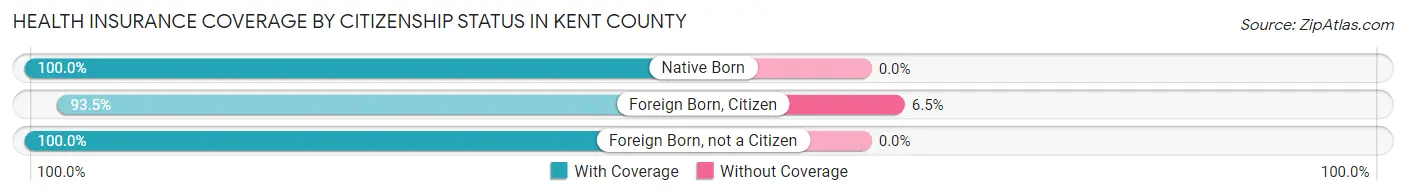
| Citizenship Status | With Coverage | Without Coverage |
| Native Born | 38 (100.0%) | 0 (0.0%) |
| Foreign Born, Citizen | 115 (93.5%) | 8 (6.5%) |
| Foreign Born, not a Citizen | 13 (100.0%) | 0 (0.0%) |
Health Insurance Coverage by Household Income in Kent County
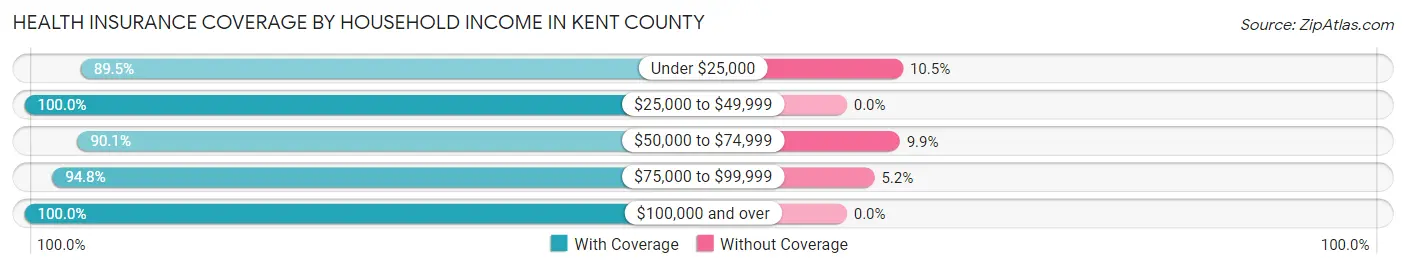
| Household Income | With Coverage | Without Coverage |
| Under $25,000 | 51 (89.5%) | 6 (10.5%) |
| $25,000 to $49,999 | 110 (100.0%) | 0 (0.0%) |
| $50,000 to $74,999 | 100 (90.1%) | 11 (9.9%) |
| $75,000 to $99,999 | 73 (94.8%) | 4 (5.2%) |
| $100,000 and over | 217 (100.0%) | 0 (0.0%) |
Public vs Private Health Insurance Coverage by Age in Kent County
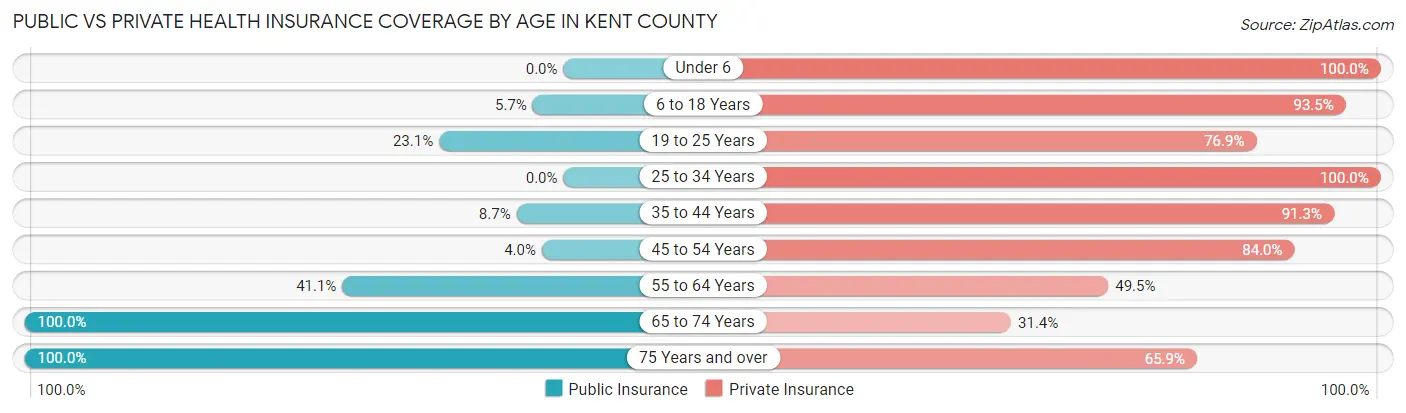
| Age Bracket | Public Insurance | Private Insurance |
| Under 6 | 0 (0.0%) | 38 (100.0%) |
| 6 to 18 Years | 7 (5.7%) | 115 (93.5%) |
| 19 to 25 Years | 3 (23.1%) | 10 (76.9%) |
| 25 to 34 Years | 0 (0.0%) | 25 (100.0%) |
| 35 to 44 Years | 6 (8.7%) | 63 (91.3%) |
| 45 to 54 Years | 1 (4.0%) | 21 (84.0%) |
| 55 to 64 Years | 39 (41.0%) | 47 (49.5%) |
| 65 to 74 Years | 105 (100.0%) | 33 (31.4%) |
| 75 Years and over | 85 (100.0%) | 56 (65.9%) |
| Total | 246 (42.6%) | 408 (70.6%) |
Disability Status by Sex by Age in Kent County
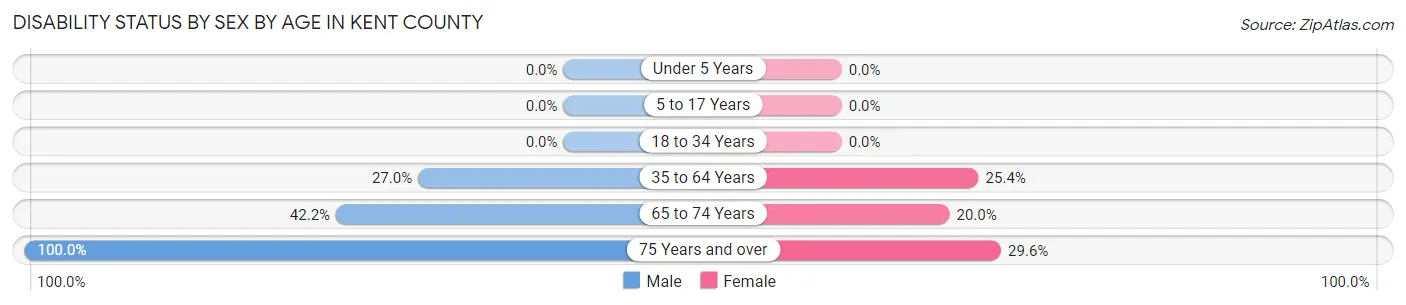
| Age Bracket | Male | Female |
| Under 5 Years | 0 (0.0%) | 0 (0.0%) |
| 5 to 17 Years | 0 (0.0%) | 0 (0.0%) |
| 18 to 34 Years | 0 (0.0%) | 0 (0.0%) |
| 35 to 64 Years | 34 (27.0%) | 16 (25.4%) |
| 65 to 74 Years | 19 (42.2%) | 12 (20.0%) |
| 75 Years and over | 14 (100.0%) | 21 (29.6%) |
Disability Class by Sex by Age in Kent County
Disability Class: Hearing Difficulty
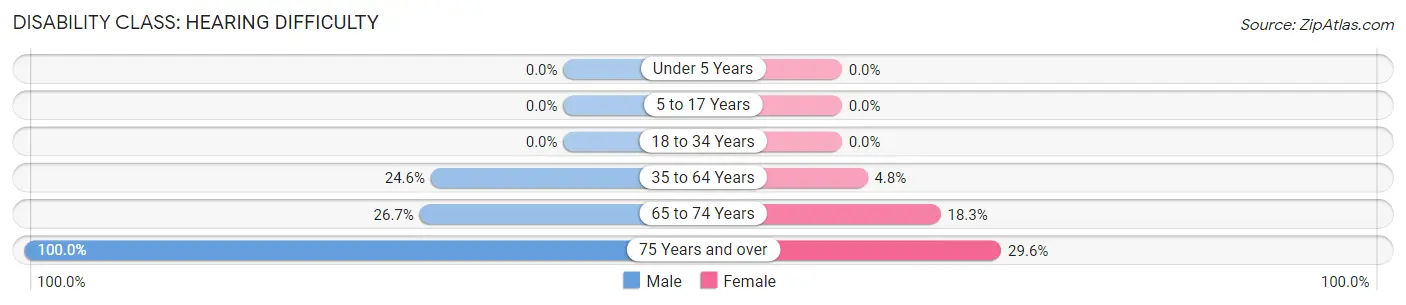
| Age Bracket | Male | Female |
| Under 5 Years | 0 (0.0%) | 0 (0.0%) |
| 5 to 17 Years | 0 (0.0%) | 0 (0.0%) |
| 18 to 34 Years | 0 (0.0%) | 0 (0.0%) |
| 35 to 64 Years | 31 (24.6%) | 3 (4.8%) |
| 65 to 74 Years | 12 (26.7%) | 11 (18.3%) |
| 75 Years and over | 14 (100.0%) | 21 (29.6%) |
Disability Class: Vision Difficulty
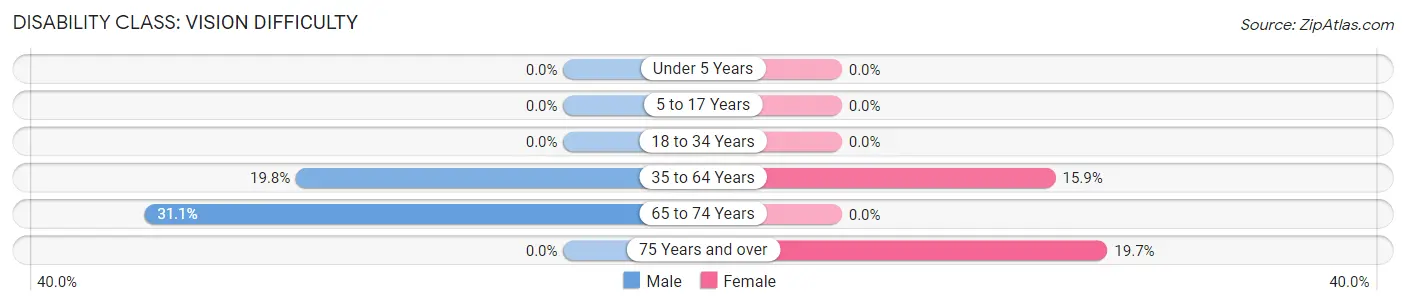
| Age Bracket | Male | Female |
| Under 5 Years | 0 (0.0%) | 0 (0.0%) |
| 5 to 17 Years | 0 (0.0%) | 0 (0.0%) |
| 18 to 34 Years | 0 (0.0%) | 0 (0.0%) |
| 35 to 64 Years | 25 (19.8%) | 10 (15.9%) |
| 65 to 74 Years | 14 (31.1%) | 0 (0.0%) |
| 75 Years and over | 0 (0.0%) | 14 (19.7%) |
Disability Class: Cognitive Difficulty
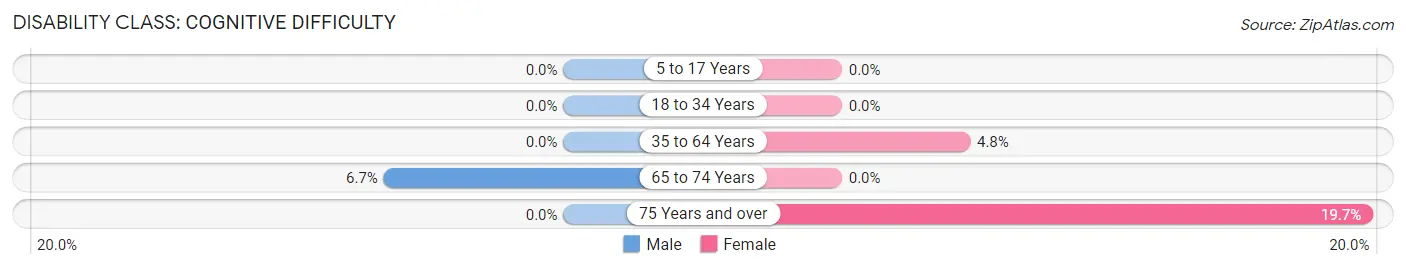
| Age Bracket | Male | Female |
| 5 to 17 Years | 0 (0.0%) | 0 (0.0%) |
| 18 to 34 Years | 0 (0.0%) | 0 (0.0%) |
| 35 to 64 Years | 0 (0.0%) | 3 (4.8%) |
| 65 to 74 Years | 3 (6.7%) | 0 (0.0%) |
| 75 Years and over | 0 (0.0%) | 14 (19.7%) |
Disability Class: Ambulatory Difficulty
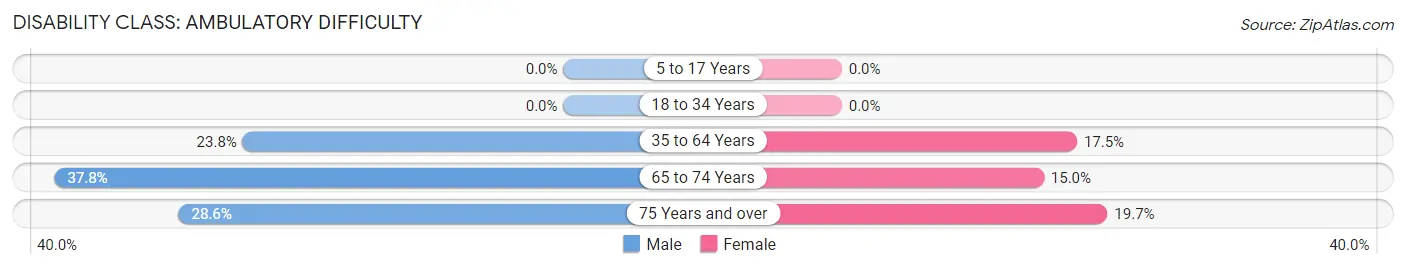
| Age Bracket | Male | Female |
| 5 to 17 Years | 0 (0.0%) | 0 (0.0%) |
| 18 to 34 Years | 0 (0.0%) | 0 (0.0%) |
| 35 to 64 Years | 30 (23.8%) | 11 (17.5%) |
| 65 to 74 Years | 17 (37.8%) | 9 (15.0%) |
| 75 Years and over | 4 (28.6%) | 14 (19.7%) |
Disability Class: Self-Care Difficulty
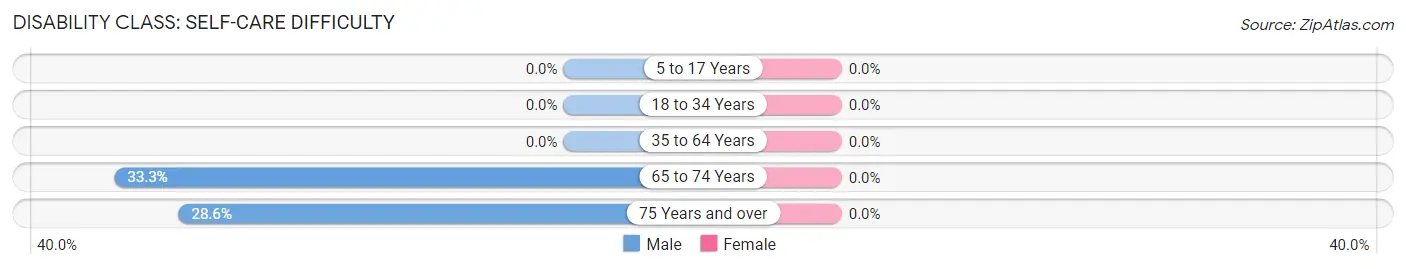
| Age Bracket | Male | Female |
| 5 to 17 Years | 0 (0.0%) | 0 (0.0%) |
| 18 to 34 Years | 0 (0.0%) | 0 (0.0%) |
| 35 to 64 Years | 0 (0.0%) | 0 (0.0%) |
| 65 to 74 Years | 15 (33.3%) | 0 (0.0%) |
| 75 Years and over | 4 (28.6%) | 0 (0.0%) |
Technology Access in Kent County
Computing Device Access in Kent County
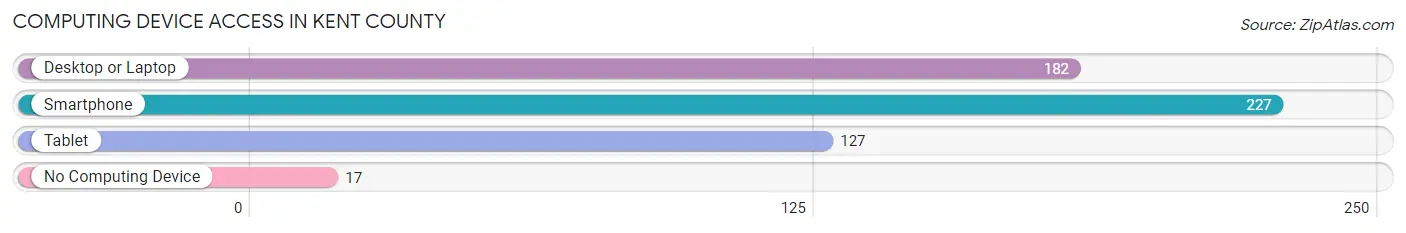
| Device Type | # Households | % Households |
| Desktop or Laptop | 182 | 74.0% |
| Smartphone | 227 | 92.3% |
| Tablet | 127 | 51.6% |
| No Computing Device | 17 | 6.9% |
| Total | 246 | 100.0% |
Internet Access in Kent County
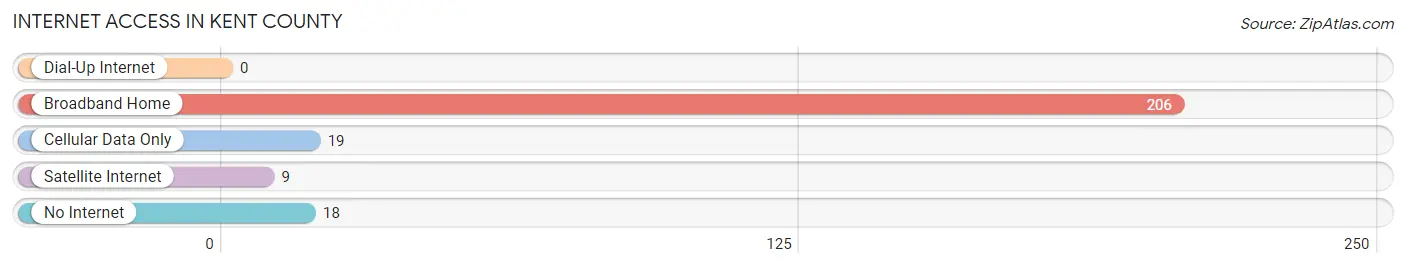
| Internet Type | # Households | % Households |
| Dial-Up Internet | 0 | 0.0% |
| Broadband Home | 206 | 83.7% |
| Cellular Data Only | 19 | 7.7% |
| Satellite Internet | 9 | 3.7% |
| No Internet | 18 | 7.3% |
| Total | 246 | 100.0% |
Kent County Summary
Kent County is located in the Texas Panhandle, in the northwest corner of the state. It is bordered by Dallam County to the north, Hartley County to the east, Oldham County to the south, and Deaf Smith County to the west. The county seat is Jayton, and the largest city is Spur.
History
The area that is now Kent County was first inhabited by Native American tribes, including the Comanche, Kiowa, and Apache. The first Europeans to explore the area were Spanish explorers in the late 1700s. The area was part of the Comancheria, a large area of land that was home to the Comanche people.
In 1876, the Texas legislature created Kent County from portions of Bexar and Young counties. The county was named for Andrew Kent, a Texas Ranger who was killed in the Battle of Plum Creek in 1840.
Geography
Kent County covers an area of 1,072 square miles. The terrain is mostly flat, with some rolling hills in the western part of the county. The county is part of the High Plains region of Texas, and is mostly covered in grasslands. The county is drained by the Salt Fork of the Brazos River, which flows through the county from north to south.
The climate of Kent County is semi-arid, with hot summers and mild winters. The average annual temperature is 64°F, and the average annual precipitation is 19 inches.
Economy
The economy of Kent County is largely based on agriculture. The county is home to a large number of cattle ranches, and the main crops grown in the county are wheat, sorghum, and cotton. The county also has a large oil and gas industry, and is home to several oil and gas production companies.
Demographics
As of the 2010 census, the population of Kent County was 2,845. The population is mostly white (90.3%), with small percentages of African American (3.2%), Hispanic (3.2%), and Native American (1.2%) residents. The median household income in the county is $37,917, and the median home value is $76,400.
The largest city in the county is Spur, with a population of 1,072. Other cities in the county include Jayton (population 545), Girard (population 437), and Aspermont (population 431).
Conclusion
Kent County is a rural county in the Texas Panhandle, with a population of just over 2,800. The economy of the county is largely based on agriculture, and the county is home to a large number of cattle ranches. The county also has a large oil and gas industry, and is home to several oil and gas production companies. The population of the county is mostly white, with small percentages of African American, Hispanic, and Native American residents.
Common Questions
What is Per Capita Income in Kent County?
Per Capita income in Kent County is $29,575.
What is the Median Family Income in Kent County?
Median Family Income in Kent County is $81,786.
What is the Median Household income in Kent County?
Median Household Income in Kent County is $68,553.
What is Inequality or Gini Index in Kent County?
Inequality or Gini Index in Kent County is 0.38.
What is the Total Population of Kent County?
Total Population of Kent County is 635.
What is the Total Male Population of Kent County?
Total Male Population of Kent County is 323.
What is the Total Female Population of Kent County?
Total Female Population of Kent County is 312.
What is the Ratio of Males per 100 Females in Kent County?
There are 103.53 Males per 100 Females in Kent County.
What is the Ratio of Females per 100 Males in Kent County?
There are 96.59 Females per 100 Males in Kent County.
What is the Median Population Age in Kent County?
Median Population Age in Kent County is 59.9 Years.
What is the Average Family Size in Kent County
Average Family Size in Kent County is 3.0 People.
What is the Average Household Size in Kent County
Average Household Size in Kent County is 2.3 People.
How Large is the Labor Force in Kent County?
There are 204 People in the Labor Forcein in Kent County.
What is the Percentage of People in the Labor Force in Kent County?
41.3% of People are in the Labor Force in Kent County.
What is the Unemployment Rate in Kent County?
Unemployment Rate in Kent County is 5.4%.