Kenedy County, TX Map & Demographics
Kenedy County Map
Kenedy County Overview
$21,822
PER CAPITA INCOME
$45,455
AVG FAMILY INCOME
$45,455
AVG HOUSEHOLD INCOME
0.30
INEQUALITY / GINI INDEX
116
TOTAL POPULATION
69
MALE POPULATION
47
FEMALE POPULATION
146.81
MALES / 100 FEMALES
68.12
FEMALES / 100 MALES
39.9
MEDIAN AGE
2.9
AVG FAMILY SIZE
2.9
AVG HOUSEHOLD SIZE
46
LABOR FORCE [ PEOPLE ]
52.3%
PERCENT IN LABOR FORCE
Kenedy County Area Codes
Income in Kenedy County
Income Overview in Kenedy County
Per Capita Income in Kenedy County is $21,822, while median incomes of families and households are $45,455 and $45,455 respectively.
| Characteristic | Number | Measure |
| Per Capita Income | 116 | $21,822 |
| Median Family Income | 38 | $45,455 |
| Mean Family Income | 38 | $56,413 |
| Median Household Income | 38 | $45,455 |
| Mean Household Income | 38 | $56,413 |
| Income Deficit | 38 | $0 |
| Wage / Income Gap (%) | 116 | 0.00% |
| Wage / Income Gap ($) | 116 | 100.00¢ per $1 |
| Gini / Inequality Index | 116 | 0.30 |
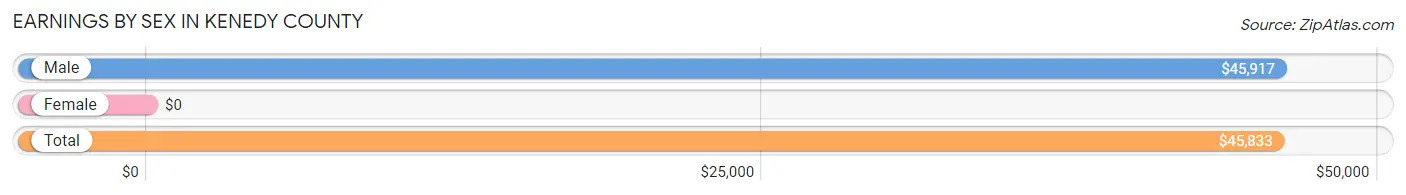
Earnings by Sex in Kenedy County
| Sex | Number | Average Earnings |
| Male | 39 (84.8%) | $45,917 |
| Female | 7 (15.2%) | $0 |
| Total | 46 (100.0%) | $45,833 |
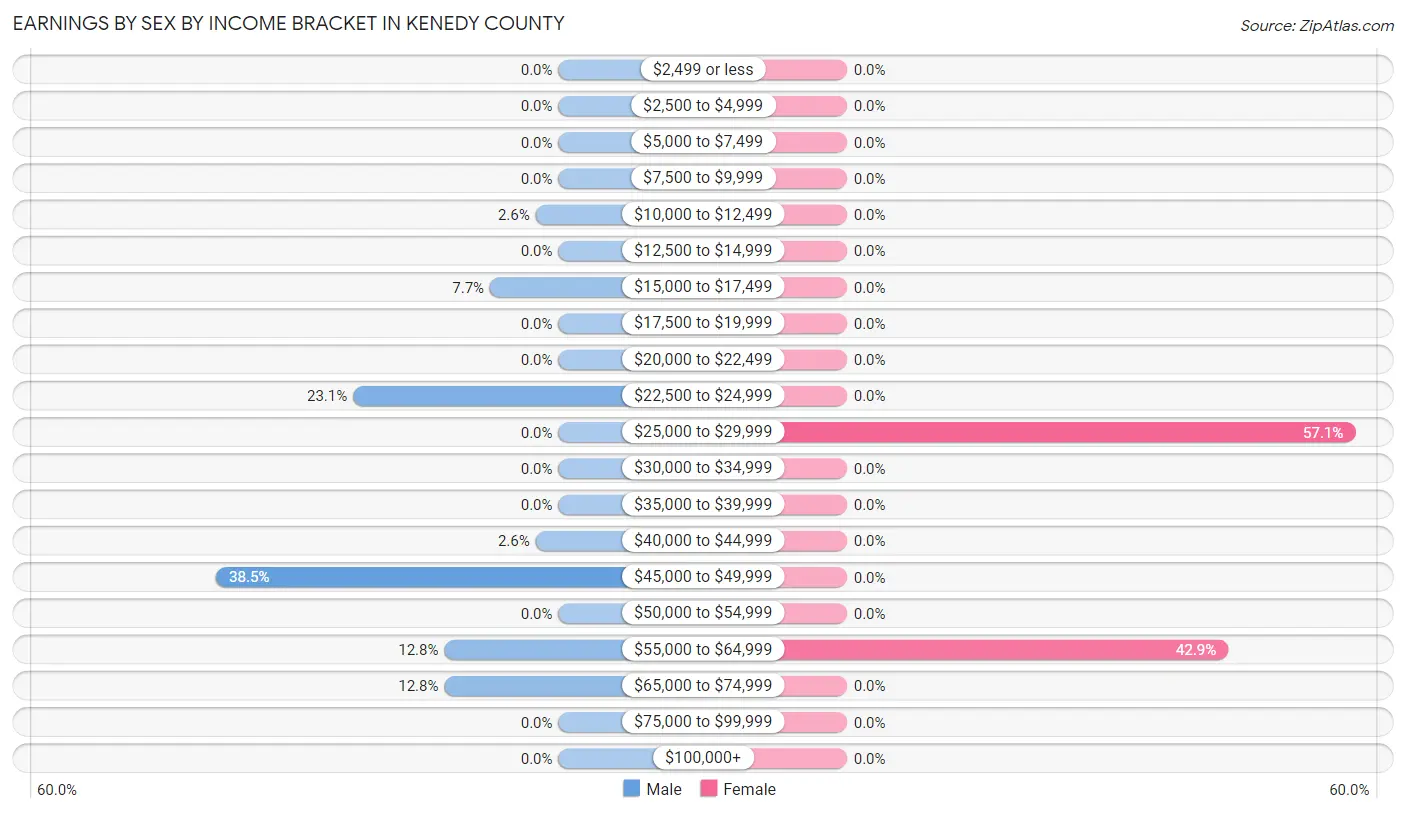
Earnings by Sex by Income Bracket in Kenedy County
The most common earnings brackets in Kenedy County are $45,000 to $49,999 for men (15 | 38.5%) and $25,000 to $29,999 for women (4 | 57.1%).
| Income | Male | Female |
| $2,499 or less | 0 (0.0%) | 0 (0.0%) |
| $2,500 to $4,999 | 0 (0.0%) | 0 (0.0%) |
| $5,000 to $7,499 | 0 (0.0%) | 0 (0.0%) |
| $7,500 to $9,999 | 0 (0.0%) | 0 (0.0%) |
| $10,000 to $12,499 | 1 (2.6%) | 0 (0.0%) |
| $12,500 to $14,999 | 0 (0.0%) | 0 (0.0%) |
| $15,000 to $17,499 | 3 (7.7%) | 0 (0.0%) |
| $17,500 to $19,999 | 0 (0.0%) | 0 (0.0%) |
| $20,000 to $22,499 | 0 (0.0%) | 0 (0.0%) |
| $22,500 to $24,999 | 9 (23.1%) | 0 (0.0%) |
| $25,000 to $29,999 | 0 (0.0%) | 4 (57.1%) |
| $30,000 to $34,999 | 0 (0.0%) | 0 (0.0%) |
| $35,000 to $39,999 | 0 (0.0%) | 0 (0.0%) |
| $40,000 to $44,999 | 1 (2.6%) | 0 (0.0%) |
| $45,000 to $49,999 | 15 (38.5%) | 0 (0.0%) |
| $50,000 to $54,999 | 0 (0.0%) | 0 (0.0%) |
| $55,000 to $64,999 | 5 (12.8%) | 3 (42.9%) |
| $65,000 to $74,999 | 5 (12.8%) | 0 (0.0%) |
| $75,000 to $99,999 | 0 (0.0%) | 0 (0.0%) |
| $100,000+ | 0 (0.0%) | 0 (0.0%) |
| Total | 39 (100.0%) | 7 (100.0%) |
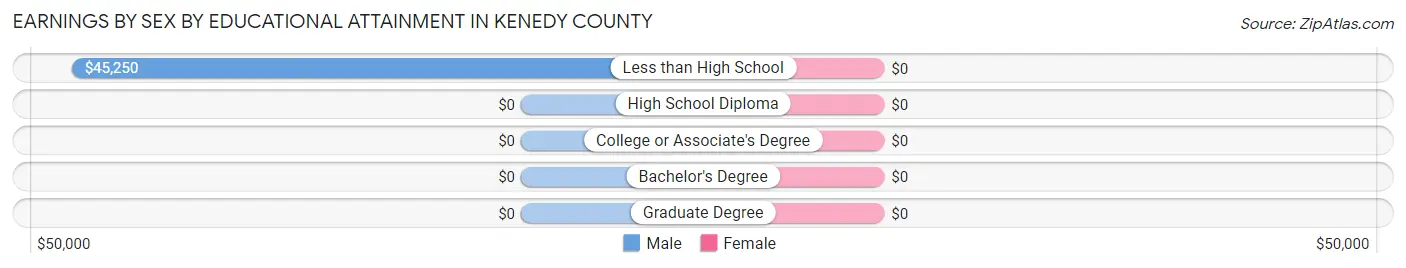
Earnings by Sex by Educational Attainment in Kenedy County
| Educational Attainment | Male Income | Female Income |
| Less than High School | $45,250 | $0 |
| High School Diploma | - | - |
| College or Associate's Degree | - | - |
| Bachelor's Degree | - | - |
| Graduate Degree | - | - |
| Total | $46,000 | $0 |
Family Income in Kenedy County
Family Income Brackets in Kenedy County
According to the Kenedy County family income data, there are 23 families falling into the $35,000 to $49,999 income range, which is the most common income bracket and makes up 60.5% of all families.
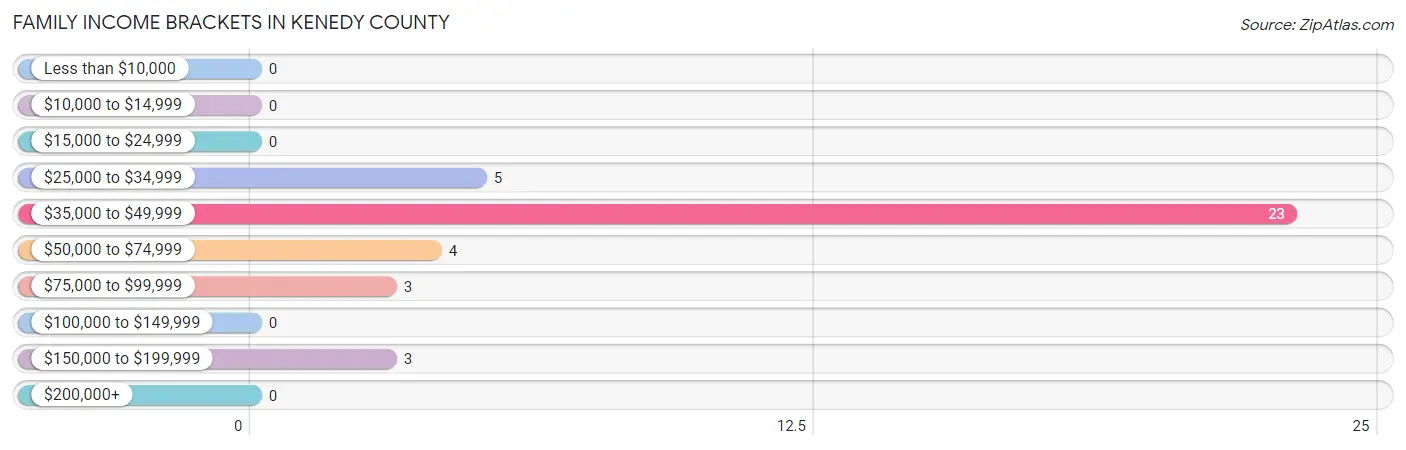
| Income Bracket | # Families | % Families |
| Less than $10,000 | 0 | 0.0% |
| $10,000 to $14,999 | 0 | 0.0% |
| $15,000 to $24,999 | 0 | 0.0% |
| $25,000 to $34,999 | 5 | 13.2% |
| $35,000 to $49,999 | 23 | 60.5% |
| $50,000 to $74,999 | 4 | 10.5% |
| $75,000 to $99,999 | 3 | 7.9% |
| $100,000 to $149,999 | 0 | 0.0% |
| $150,000 to $199,999 | 3 | 7.9% |
| $200,000+ | 0 | 0.0% |
Family Income by Famaliy Size in Kenedy County
2-person families (24 | 63.2%) account for the highest median family income in Kenedy County with $36,944 per family, while 2-person families (24 | 63.2%) have the highest median income of $18,472 per family member.
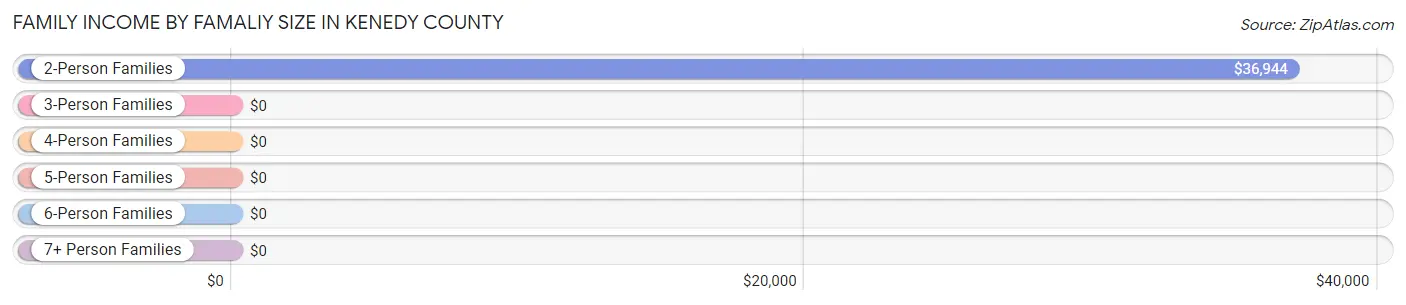
| Income Bracket | # Families | Median Income |
| 2-Person Families | 24 (63.2%) | $36,944 |
| 3-Person Families | 3 (7.9%) | $0 |
| 4-Person Families | 0 (0.0%) | $0 |
| 5-Person Families | 11 (28.9%) | $0 |
| 6-Person Families | 0 (0.0%) | $0 |
| 7+ Person Families | 0 (0.0%) | $0 |
| Total | 38 (100.0%) | $45,455 |
Family Income by Number of Earners in Kenedy County
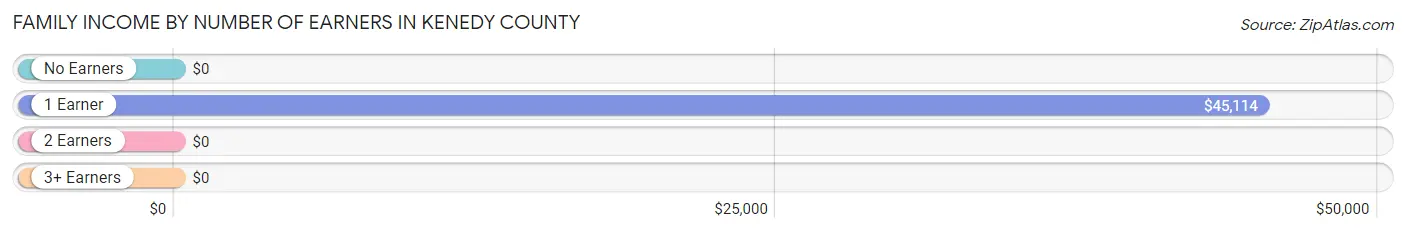
| Number of Earners | # Families | Median Income |
| No Earners | 0 (0.0%) | $0 |
| 1 Earner | 35 (92.1%) | $45,114 |
| 2 Earners | 3 (7.9%) | $0 |
| 3+ Earners | 0 (0.0%) | $0 |
| Total | 38 (100.0%) | $45,455 |
Household Income in Kenedy County
Household Income Brackets in Kenedy County
With 23 households falling in the category, the $35,000 to $49,999 income range is the most frequent in Kenedy County, accounting for 60.5% of all households.
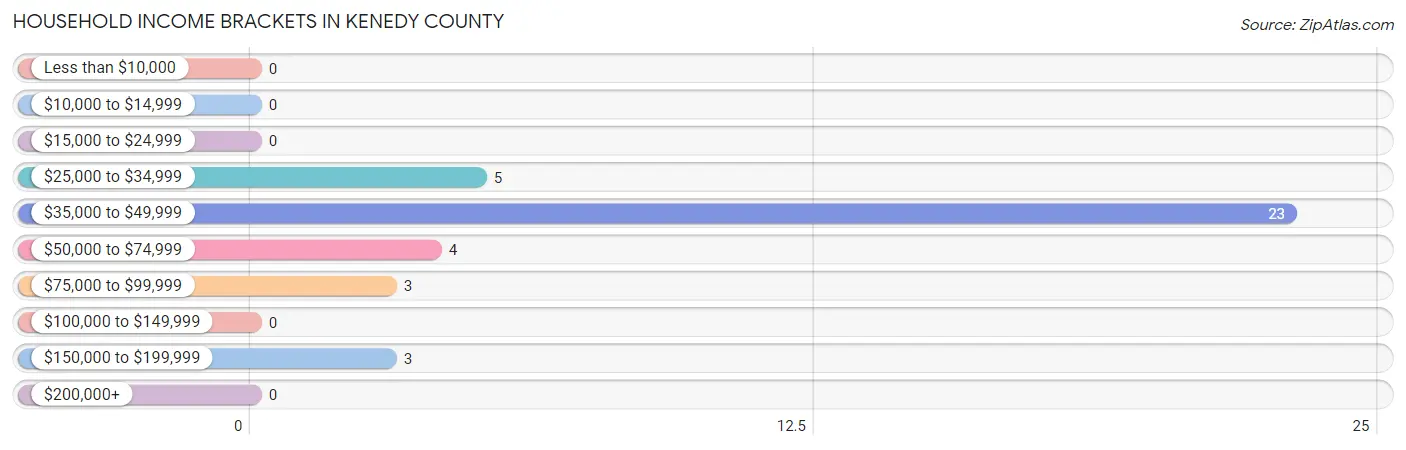
| Income Bracket | # Households | % Households |
| Less than $10,000 | 0 | 0.0% |
| $10,000 to $14,999 | 0 | 0.0% |
| $15,000 to $24,999 | 0 | 0.0% |
| $25,000 to $34,999 | 5 | 13.2% |
| $35,000 to $49,999 | 23 | 60.5% |
| $50,000 to $74,999 | 4 | 10.5% |
| $75,000 to $99,999 | 3 | 7.9% |
| $100,000 to $149,999 | 0 | 0.0% |
| $150,000 to $199,999 | 3 | 7.9% |
| $200,000+ | 0 | 0.0% |
Household Income by Householder Age in Kenedy County
The median household income in Kenedy County is $45,455, with the highest median household income of $36,944 found in the 65+ years age bracket for the primary householder. A total of 24 households (63.2%) fall into this category.
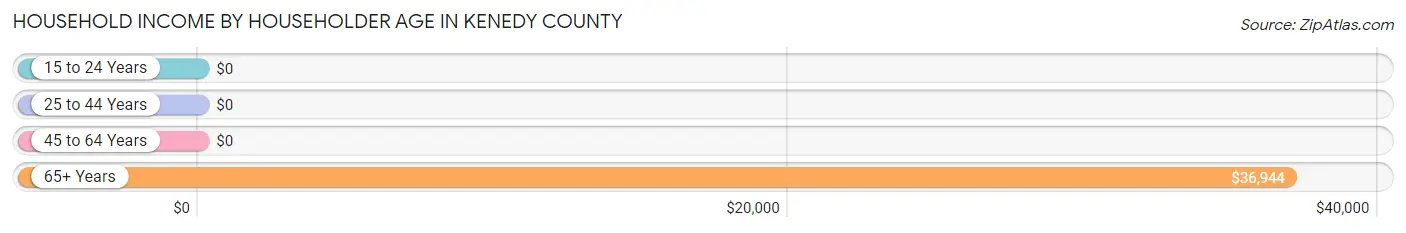
| Income Bracket | # Households | Median Income |
| 15 to 24 Years | 0 (0.0%) | $0 |
| 25 to 44 Years | 11 (28.9%) | $0 |
| 45 to 64 Years | 3 (7.9%) | $0 |
| 65+ Years | 24 (63.2%) | $36,944 |
| Total | 38 (100.0%) | $45,455 |
Poverty in Kenedy County
Income Below Poverty by Sex and Age in Kenedy County
With 2.9% poverty level for males and 2.1% for females among the residents of Kenedy County, 18 to 24 year old males and 75 year old and over females are the most vulnerable to poverty, with 1 males (100.0%) and 1 females (16.7%) in their respective age groups living below the poverty level.
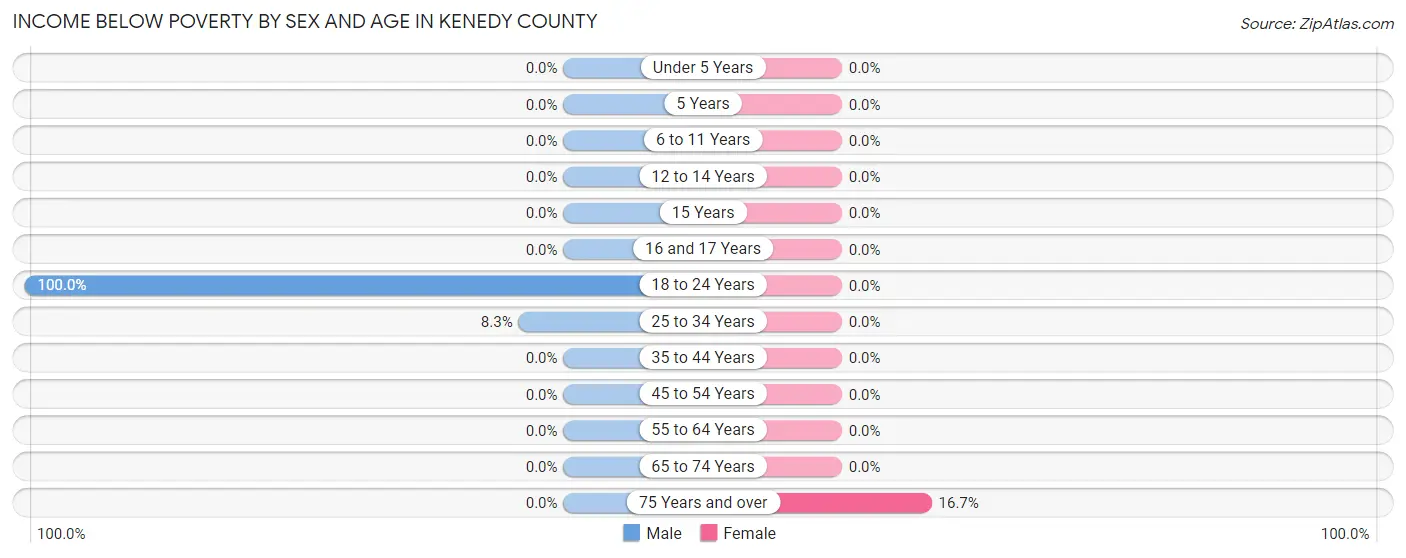
| Age Bracket | Male | Female |
| Under 5 Years | 0 (0.0%) | 0 (0.0%) |
| 5 Years | 0 (0.0%) | 0 (0.0%) |
| 6 to 11 Years | 0 (0.0%) | 0 (0.0%) |
| 12 to 14 Years | 0 (0.0%) | 0 (0.0%) |
| 15 Years | 0 (0.0%) | 0 (0.0%) |
| 16 and 17 Years | 0 (0.0%) | 0 (0.0%) |
| 18 to 24 Years | 1 (100.0%) | 0 (0.0%) |
| 25 to 34 Years | 1 (8.3%) | 0 (0.0%) |
| 35 to 44 Years | 0 (0.0%) | 0 (0.0%) |
| 45 to 54 Years | 0 (0.0%) | 0 (0.0%) |
| 55 to 64 Years | 0 (0.0%) | 0 (0.0%) |
| 65 to 74 Years | 0 (0.0%) | 0 (0.0%) |
| 75 Years and over | 0 (0.0%) | 1 (16.7%) |
| Total | 2 (2.9%) | 1 (2.1%) |
Income Above Poverty by Sex and Age in Kenedy County
According to the poverty statistics in Kenedy County, males aged under 5 years and females aged under 5 years are the age groups that are most secure financially, with 100.0% of males and 100.0% of females in these age groups living above the poverty line.
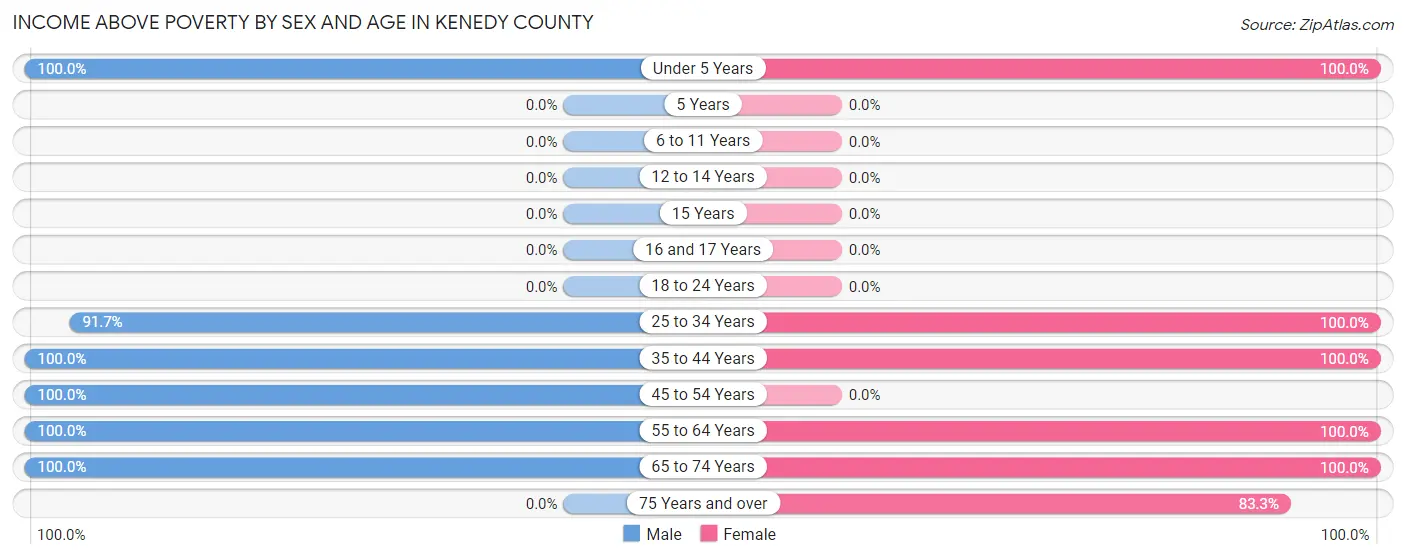
| Age Bracket | Male | Female |
| Under 5 Years | 23 (100.0%) | 5 (100.0%) |
| 5 Years | 0 (0.0%) | 0 (0.0%) |
| 6 to 11 Years | 0 (0.0%) | 0 (0.0%) |
| 12 to 14 Years | 0 (0.0%) | 0 (0.0%) |
| 15 Years | 0 (0.0%) | 0 (0.0%) |
| 16 and 17 Years | 0 (0.0%) | 0 (0.0%) |
| 18 to 24 Years | 0 (0.0%) | 0 (0.0%) |
| 25 to 34 Years | 11 (91.7%) | 10 (100.0%) |
| 35 to 44 Years | 9 (100.0%) | 3 (100.0%) |
| 45 to 54 Years | 4 (100.0%) | 0 (0.0%) |
| 55 to 64 Years | 3 (100.0%) | 4 (100.0%) |
| 65 to 74 Years | 17 (100.0%) | 19 (100.0%) |
| 75 Years and over | 0 (0.0%) | 5 (83.3%) |
| Total | 67 (97.1%) | 46 (97.9%) |
Income Below Poverty Among Married-Couple Families in Kenedy County
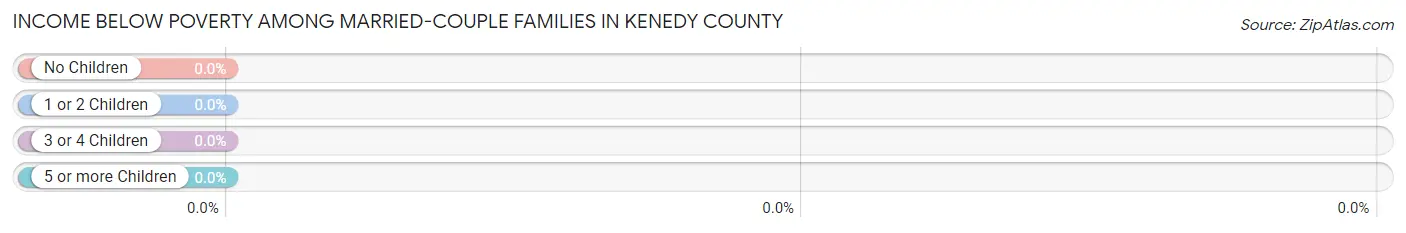
| Children | Above Poverty | Below Poverty |
| No Children | 12 (100.0%) | 0 (0.0%) |
| 1 or 2 Children | 0 (0.0%) | 0 (0.0%) |
| 3 or 4 Children | 11 (100.0%) | 0 (0.0%) |
| 5 or more Children | 0 (0.0%) | 0 (0.0%) |
| Total | 23 (100.0%) | 0 (0.0%) |
Income Below Poverty Among Single-Parent Households in Kenedy County
| Children | Single Father | Single Mother |
| No Children | 0 (0.0%) | 0 (0.0%) |
| 1 or 2 Children | 0 (0.0%) | 0 (0.0%) |
| 3 or 4 Children | 0 (0.0%) | 0 (0.0%) |
| 5 or more Children | 0 (0.0%) | 0 (0.0%) |
| Total | 0 (0.0%) | 0 (0.0%) |
Income Below Poverty Among Married-Couple vs Single-Parent Households in Kenedy County
| Children | Married-Couple Families | Single-Parent Households |
| No Children | 0 (0.0%) | 0 (0.0%) |
| 1 or 2 Children | 0 (0.0%) | 0 (0.0%) |
| 3 or 4 Children | 0 (0.0%) | 0 (0.0%) |
| 5 or more Children | 0 (0.0%) | 0 (0.0%) |
| Total | 0 (0.0%) | 0 (0.0%) |
Race in Kenedy County
The most populous races in Kenedy County are Hispanic or Latino (112 | 96.6%), White / Caucasian (75 | 64.7%), and Two or more Races (39 | 33.6%).
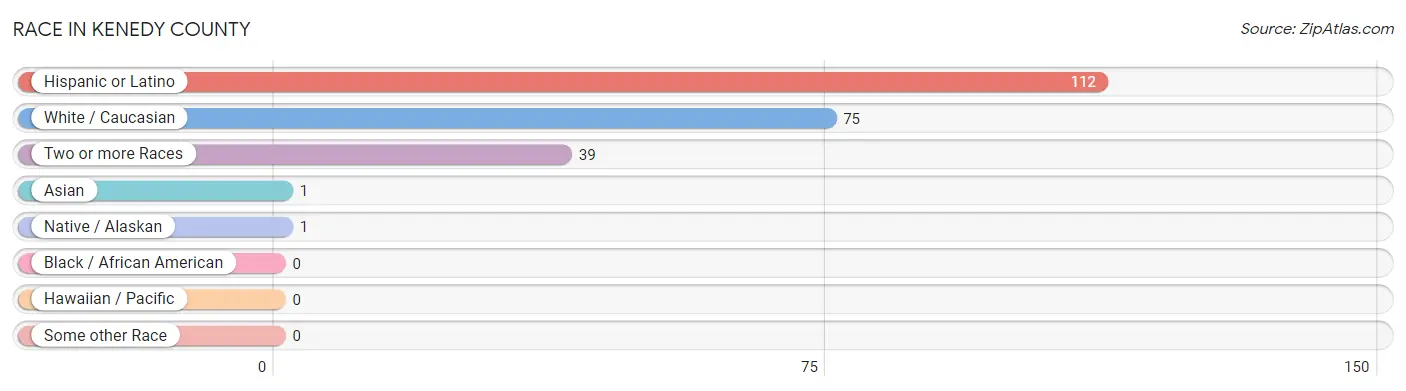
| Race | # Population | % Population |
| Asian | 1 | 0.9% |
| Black / African American | 0 | 0.0% |
| Hawaiian / Pacific | 0 | 0.0% |
| Hispanic or Latino | 112 | 96.6% |
| Native / Alaskan | 1 | 0.9% |
| White / Caucasian | 75 | 64.7% |
| Two or more Races | 39 | 33.6% |
| Some other Race | 0 | 0.0% |
| Total | 116 | 100.0% |
Ancestry in Kenedy County
The most populous ancestries reported in Kenedy County are Mexican (112 | 96.6%), Irish (2 | 1.7%), French (1 | 0.9%), and Thai (1 | 0.9%), together accounting for 100.0% of all Kenedy County residents.
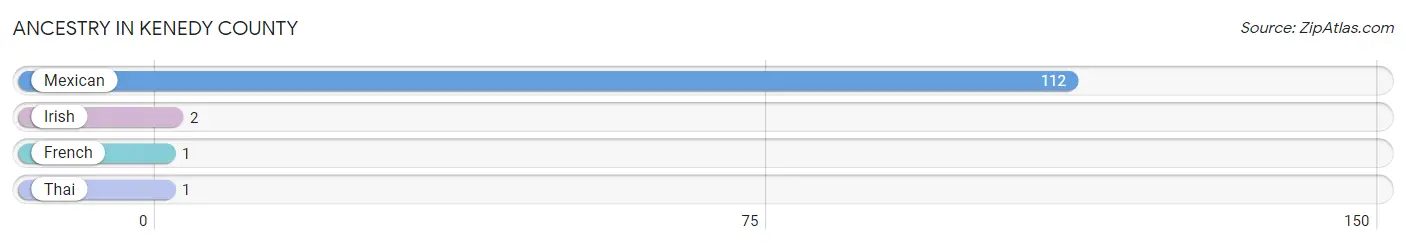
| Ancestry | # Population | % Population |
| French | 1 | 0.9% |
| Irish | 2 | 1.7% |
| Mexican | 112 | 96.6% |
| Thai | 1 | 0.9% | View All 4 Rows |
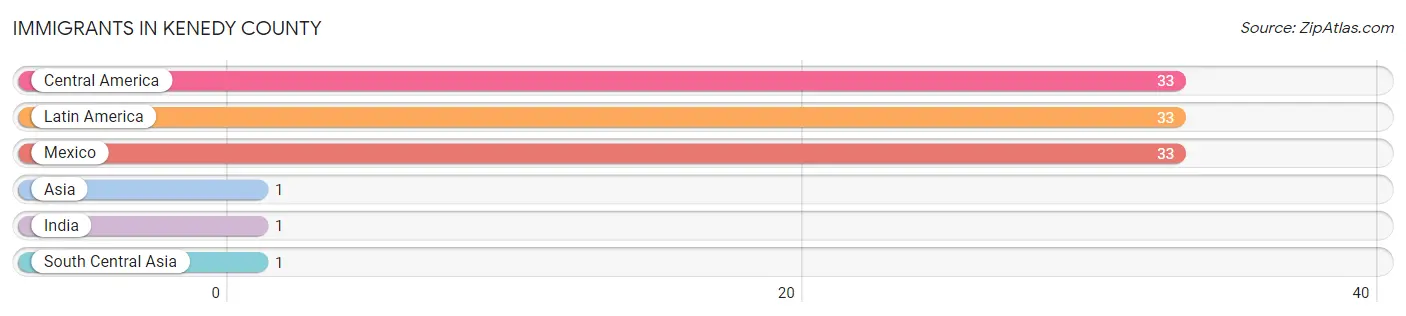
Immigrants in Kenedy County
The most numerous immigrant groups reported in Kenedy County came from Central America (33 | 28.4%), Latin America (33 | 28.4%), Mexico (33 | 28.4%), Asia (1 | 0.9%), and India (1 | 0.9%), together accounting for 87.1% of all Kenedy County residents.
| Immigration Origin | # Population | % Population |
| Asia | 1 | 0.9% |
| Central America | 33 | 28.4% |
| India | 1 | 0.9% |
| Latin America | 33 | 28.4% |
| Mexico | 33 | 28.4% |
| South Central Asia | 1 | 0.9% | View All 6 Rows |
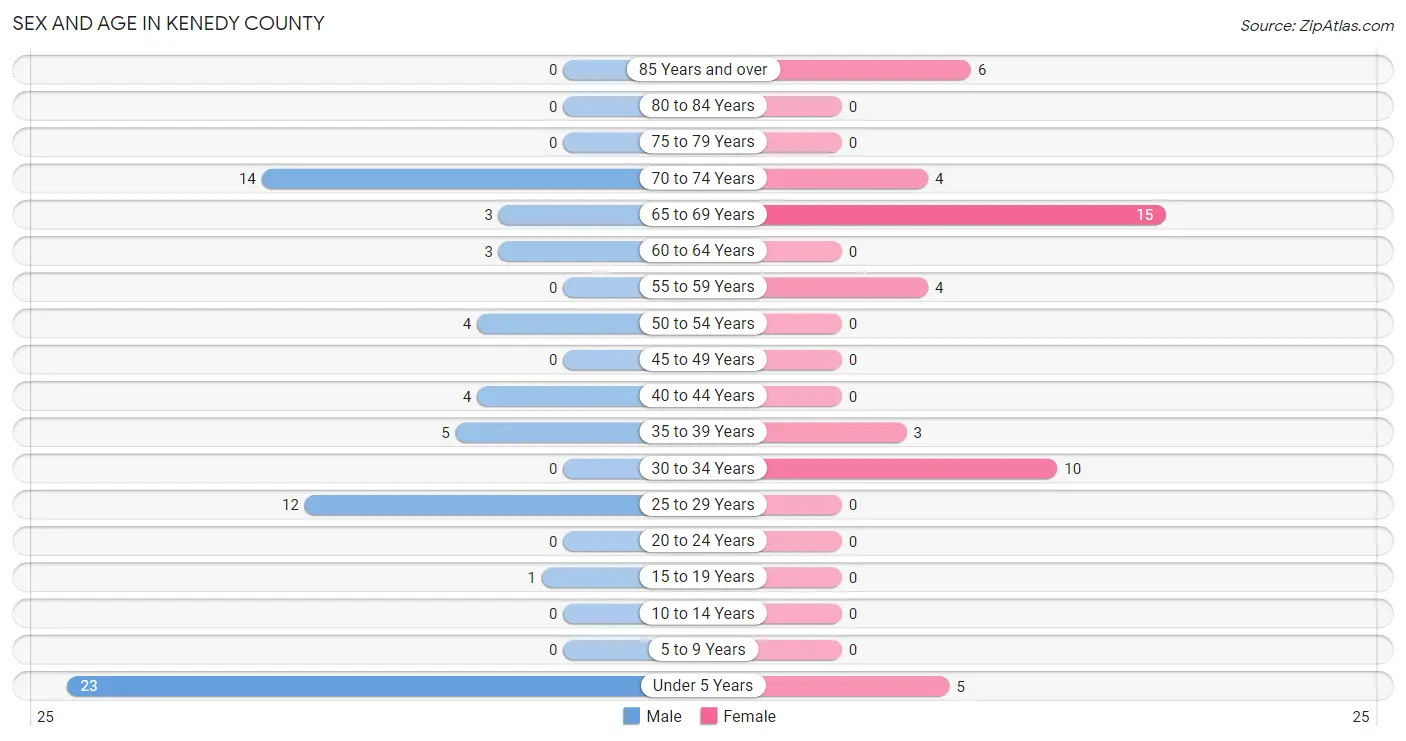
Sex and Age in Kenedy County
Sex and Age in Kenedy County
The most populous age groups in Kenedy County are Under 5 Years (23 | 33.3%) for men and 65 to 69 Years (15 | 31.9%) for women.
| Age Bracket | Male | Female |
| Under 5 Years | 23 (33.3%) | 5 (10.6%) |
| 5 to 9 Years | 0 (0.0%) | 0 (0.0%) |
| 10 to 14 Years | 0 (0.0%) | 0 (0.0%) |
| 15 to 19 Years | 1 (1.5%) | 0 (0.0%) |
| 20 to 24 Years | 0 (0.0%) | 0 (0.0%) |
| 25 to 29 Years | 12 (17.4%) | 0 (0.0%) |
| 30 to 34 Years | 0 (0.0%) | 10 (21.3%) |
| 35 to 39 Years | 5 (7.2%) | 3 (6.4%) |
| 40 to 44 Years | 4 (5.8%) | 0 (0.0%) |
| 45 to 49 Years | 0 (0.0%) | 0 (0.0%) |
| 50 to 54 Years | 4 (5.8%) | 0 (0.0%) |
| 55 to 59 Years | 0 (0.0%) | 4 (8.5%) |
| 60 to 64 Years | 3 (4.3%) | 0 (0.0%) |
| 65 to 69 Years | 3 (4.3%) | 15 (31.9%) |
| 70 to 74 Years | 14 (20.3%) | 4 (8.5%) |
| 75 to 79 Years | 0 (0.0%) | 0 (0.0%) |
| 80 to 84 Years | 0 (0.0%) | 0 (0.0%) |
| 85 Years and over | 0 (0.0%) | 6 (12.8%) |
| Total | 69 (100.0%) | 47 (100.0%) |
Families and Households in Kenedy County
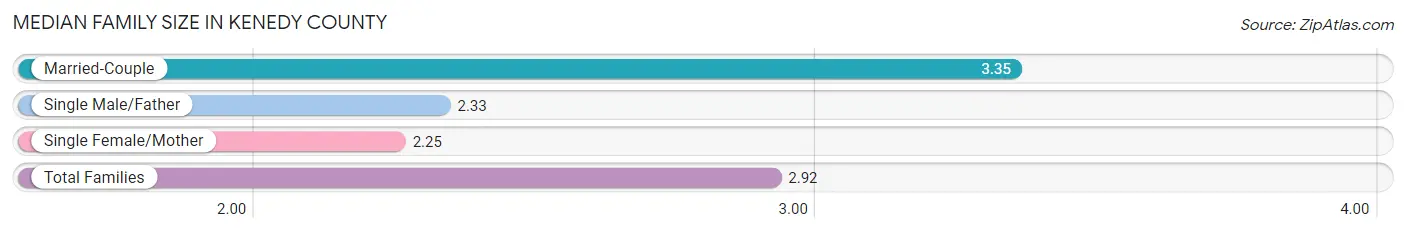
Median Family Size in Kenedy County
The median family size in Kenedy County is 2.92 persons per family, with married-couple families (23 | 60.5%) accounting for the largest median family size of 3.35 persons per family. On the other hand, single female/mother families (12 | 31.6%) represent the smallest median family size with 2.25 persons per family.
| Family Type | # Families | Family Size |
| Married-Couple | 23 (60.5%) | 3.35 |
| Single Male/Father | 3 (7.9%) | 2.33 |
| Single Female/Mother | 12 (31.6%) | 2.25 |
| Total Families | 38 (100.0%) | 2.92 |
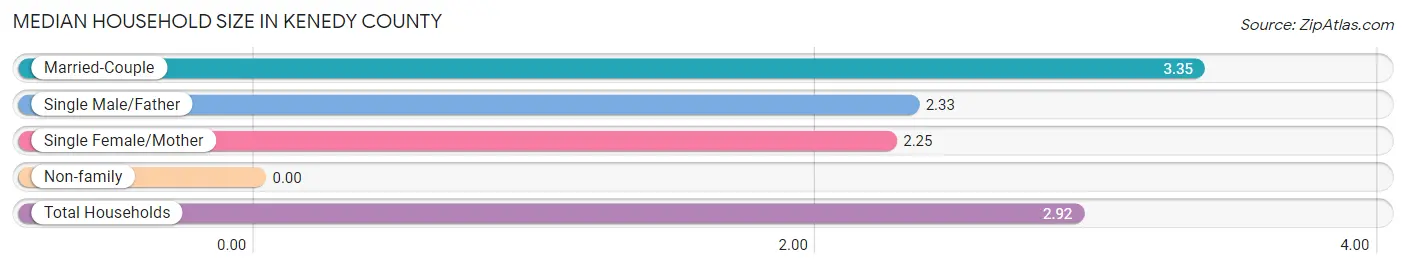
Median Household Size in Kenedy County
| Household Type | # Households | Household Size |
| Married-Couple | 23 (60.5%) | 3.35 |
| Single Male/Father | 3 (7.9%) | 2.33 |
| Single Female/Mother | 12 (31.6%) | 2.25 |
| Non-family | 0 (0.0%) | - |
| Total Households | 38 (100.0%) | 2.92 |
Household Size by Marriage Status in Kenedy County
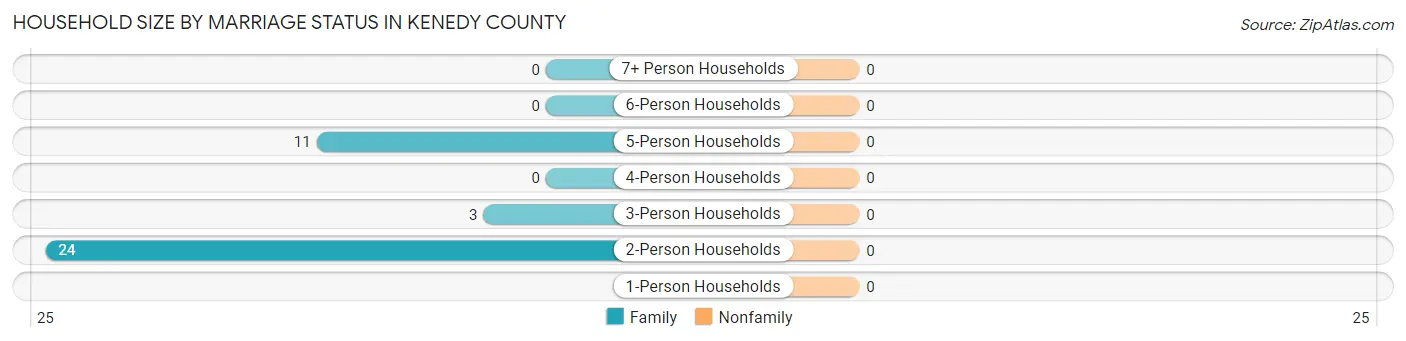
| Household Size | Family Households | Nonfamily Households |
| 1-Person Households | - | 0 (0.0%) |
| 2-Person Households | 24 (63.2%) | 0 (0.0%) |
| 3-Person Households | 3 (7.9%) | 0 (0.0%) |
| 4-Person Households | 0 (0.0%) | 0 (0.0%) |
| 5-Person Households | 11 (28.9%) | 0 (0.0%) |
| 6-Person Households | 0 (0.0%) | 0 (0.0%) |
| 7+ Person Households | 0 (0.0%) | 0 (0.0%) |
| Total | 38 (100.0%) | 0 (0.0%) |
Female Fertility in Kenedy County
Fertility by Age in Kenedy County
Average fertility rate in Kenedy County is 769.0 births per 1,000 women. Women in the age bracket of 20 to 34 years have the highest fertility rate with 1,000.0 births per 1,000 women. Women in the age bracket of 20 to 34 years acount for 100.0% of all women with births.
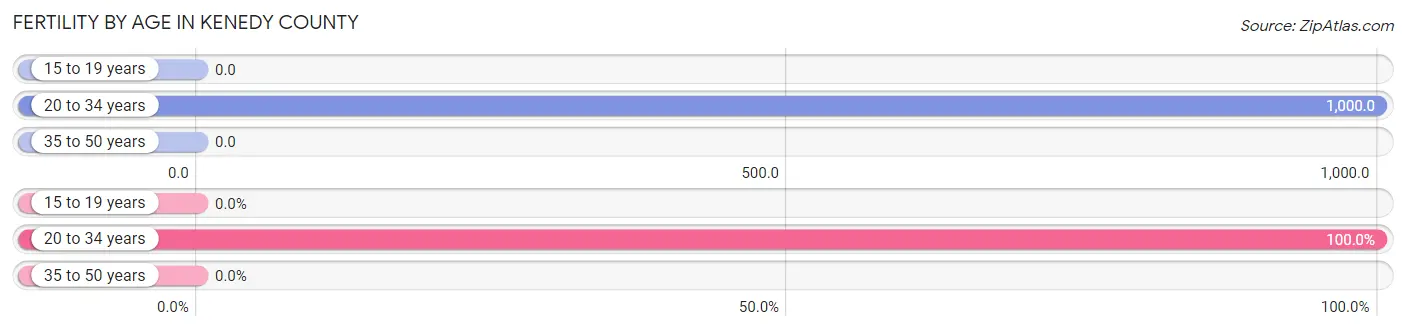
| Age Bracket | Women with Births | Births / 1,000 Women |
| 15 to 19 years | 0 (0.0%) | 0.0 |
| 20 to 34 years | 10 (100.0%) | 1,000.0 |
| 35 to 50 years | 0 (0.0%) | 0.0 |
| Total | 10 (100.0%) | 769.0 |
Fertility by Age by Marriage Status in Kenedy County
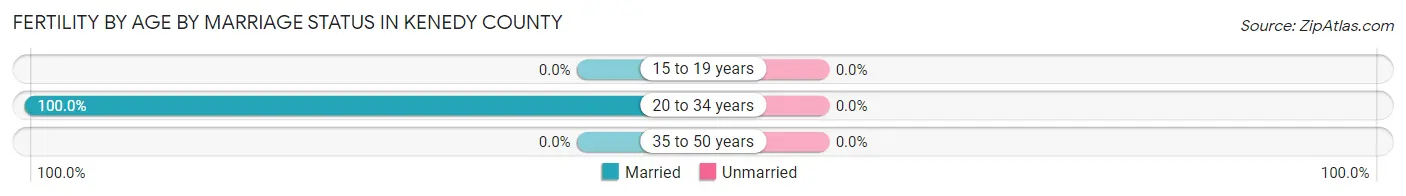
| Age Bracket | Married | Unmarried |
| 15 to 19 years | 0 (0.0%) | 0 (0.0%) |
| 20 to 34 years | 10 (100.0%) | 0 (0.0%) |
| 35 to 50 years | 0 (0.0%) | 0 (0.0%) |
| Total | 10 (100.0%) | 0 (0.0%) |
Fertility by Education in Kenedy County
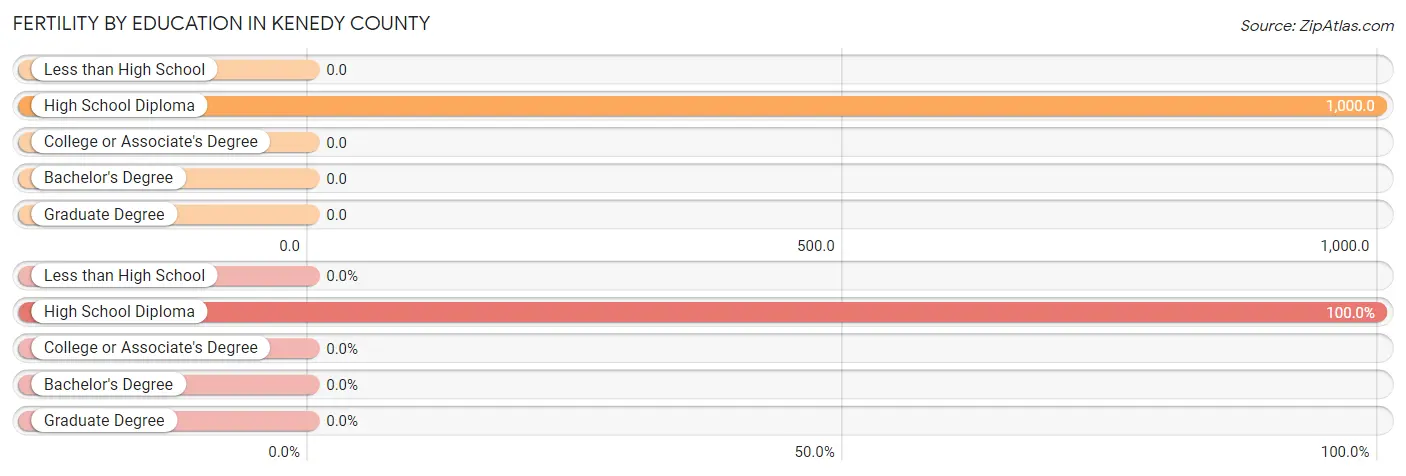
| Educational Attainment | Women with Births | Births / 1,000 Women |
| Less than High School | 0 (0.0%) | 0.0 |
| High School Diploma | 10 (100.0%) | 1,000.0 |
| College or Associate's Degree | 0 (0.0%) | 0.0 |
| Bachelor's Degree | 0 (0.0%) | 0.0 |
| Graduate Degree | 0 (0.0%) | 0.0 |
| Total | 10 (100.0%) | 769.0 |
Fertility by Education by Marriage Status in Kenedy County
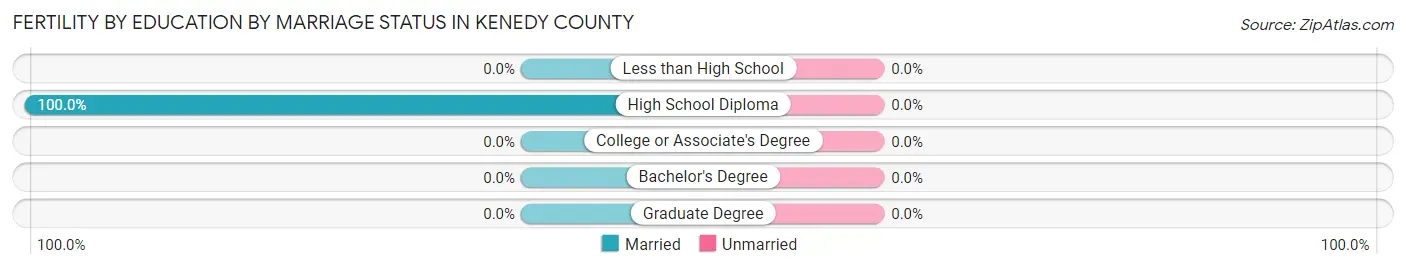
| Educational Attainment | Married | Unmarried |
| Less than High School | 0 (0.0%) | 0 (0.0%) |
| High School Diploma | 10 (100.0%) | 0 (0.0%) |
| College or Associate's Degree | 0 (0.0%) | 0 (0.0%) |
| Bachelor's Degree | 0 (0.0%) | 0 (0.0%) |
| Graduate Degree | 0 (0.0%) | 0 (0.0%) |
| Total | 10 (100.0%) | 0 (0.0%) |
Employment Characteristics in Kenedy County
Employment by Class of Employer in Kenedy County
Among the 46 employed individuals in Kenedy County, private company employees (27 | 58.7%), not-for-profit organizations (12 | 26.1%), and local government employees (7 | 15.2%) make up the most common classes of employment.
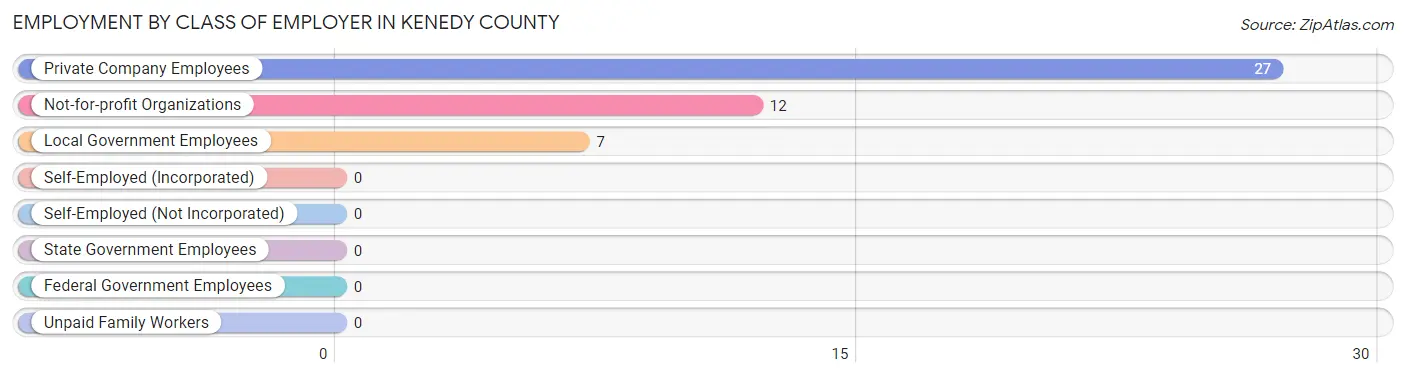
| Employer Class | # Employees | % Employees |
| Private Company Employees | 27 | 58.7% |
| Self-Employed (Incorporated) | 0 | 0.0% |
| Self-Employed (Not Incorporated) | 0 | 0.0% |
| Not-for-profit Organizations | 12 | 26.1% |
| Local Government Employees | 7 | 15.2% |
| State Government Employees | 0 | 0.0% |
| Federal Government Employees | 0 | 0.0% |
| Unpaid Family Workers | 0 | 0.0% |
| Total | 46 | 100.0% |
Employment Status by Age in Kenedy County
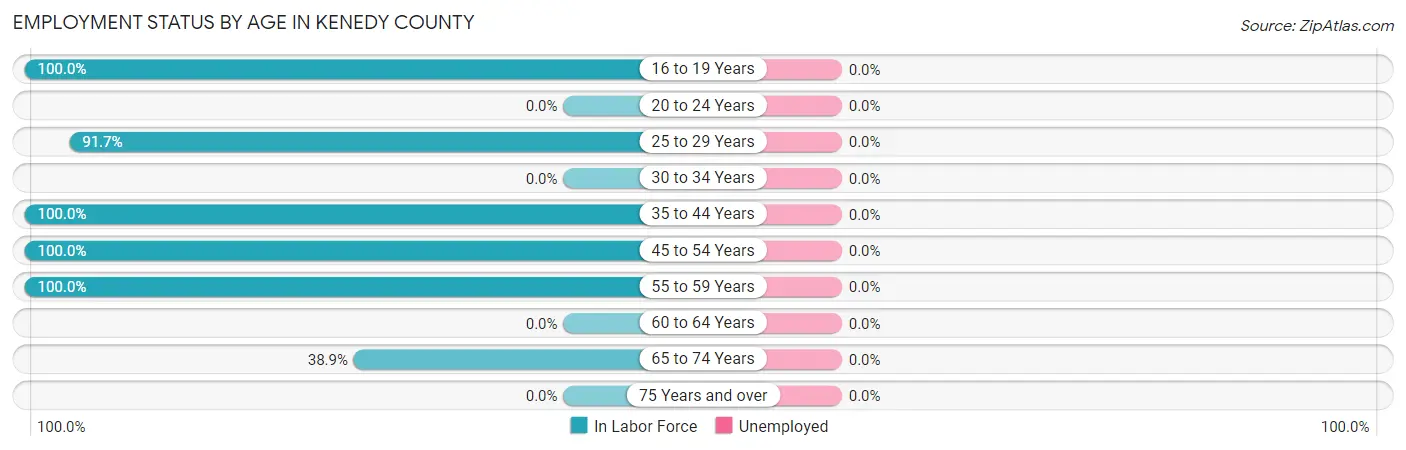
| Age Bracket | In Labor Force | Unemployed |
| 16 to 19 Years | 1 (100.0%) | 0 (0.0%) |
| 20 to 24 Years | 0 (0.0%) | 0 (0.0%) |
| 25 to 29 Years | 11 (91.7%) | 0 (0.0%) |
| 30 to 34 Years | 0 (0.0%) | 0 (0.0%) |
| 35 to 44 Years | 12 (100.0%) | 0 (0.0%) |
| 45 to 54 Years | 4 (100.0%) | 0 (0.0%) |
| 55 to 59 Years | 4 (100.0%) | 0 (0.0%) |
| 60 to 64 Years | 0 (0.0%) | 0 (0.0%) |
| 65 to 74 Years | 14 (38.9%) | 0 (0.0%) |
| 75 Years and over | 0 (0.0%) | 0 (0.0%) |
| Total | 46 (52.3%) | 0 (0.0%) |
Employment Status by Educational Attainment in Kenedy County
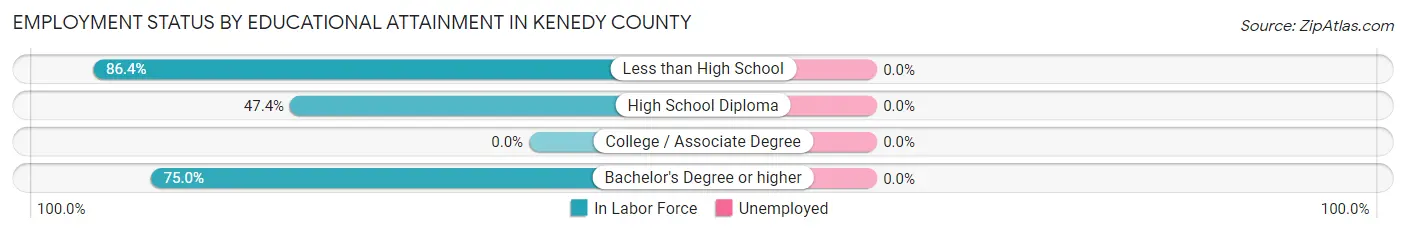
| Educational Attainment | In Labor Force | Unemployed |
| Less than High School | 19 (86.4%) | 0 (0.0%) |
| High School Diploma | 9 (47.4%) | 0 (0.0%) |
| College / Associate Degree | 0 (0.0%) | 0 (0.0%) |
| Bachelor's Degree or higher | 3 (75.0%) | 0 (0.0%) |
| Total | 31 (68.9%) | 0 (0.0%) |
Employment Occupations by Sex in Kenedy County
Management, Business, Science and Arts Occupations
The most common Management, Business, Science and Arts occupations in Kenedy County are Management (9 | 19.6%), Community & Social Service (2 | 4.3%), and Education, Arts & Media (2 | 4.3%).
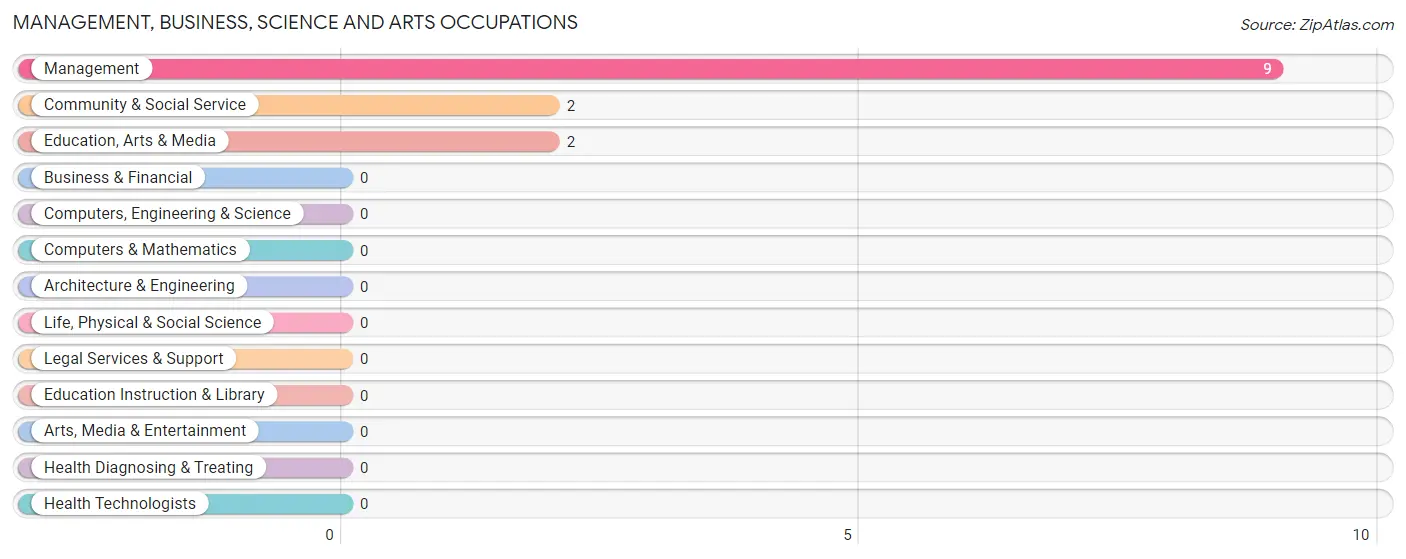
Management, Business, Science and Arts Occupations by Sex
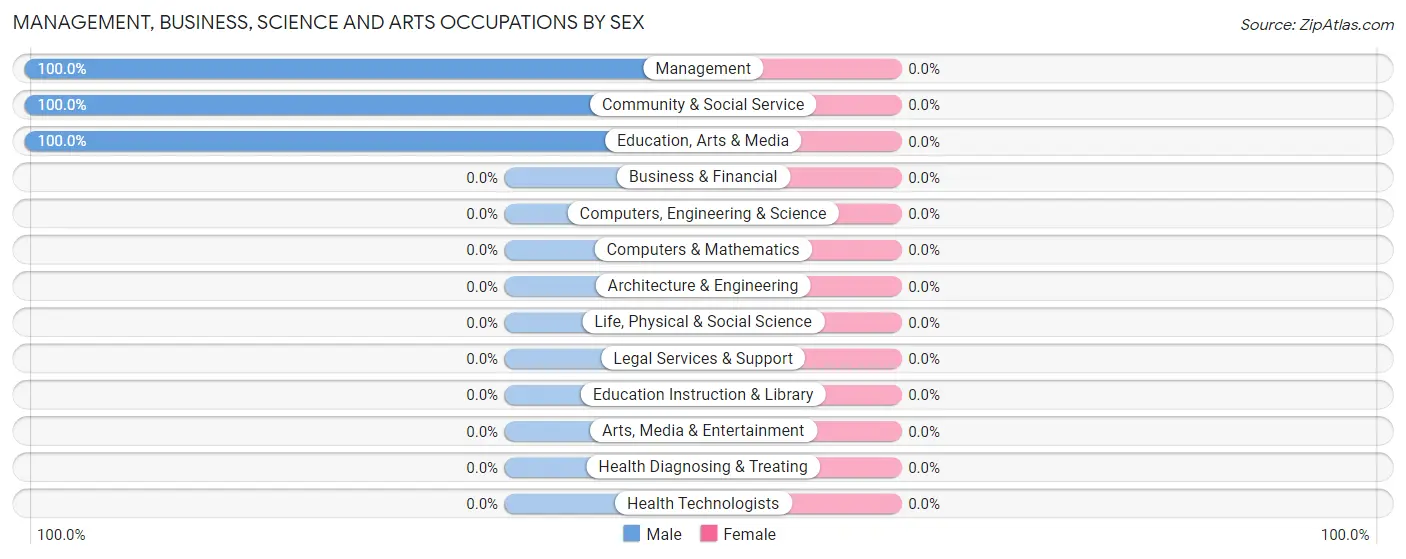
| Occupation | Male | Female |
| Management | 9 (100.0%) | 0 (0.0%) |
| Business & Financial | 0 (0.0%) | 0 (0.0%) |
| Computers, Engineering & Science | 0 (0.0%) | 0 (0.0%) |
| Computers & Mathematics | 0 (0.0%) | 0 (0.0%) |
| Architecture & Engineering | 0 (0.0%) | 0 (0.0%) |
| Life, Physical & Social Science | 0 (0.0%) | 0 (0.0%) |
| Community & Social Service | 2 (100.0%) | 0 (0.0%) |
| Education, Arts & Media | 2 (100.0%) | 0 (0.0%) |
| Legal Services & Support | 0 (0.0%) | 0 (0.0%) |
| Education Instruction & Library | 0 (0.0%) | 0 (0.0%) |
| Arts, Media & Entertainment | 0 (0.0%) | 0 (0.0%) |
| Health Diagnosing & Treating | 0 (0.0%) | 0 (0.0%) |
| Health Technologists | 0 (0.0%) | 0 (0.0%) |
| Total (Category) | 11 (100.0%) | 0 (0.0%) |
| Total (Overall) | 39 (84.8%) | 7 (15.2%) |
Services Occupations
The most common Services occupations in Kenedy County are , and Cleaning & Maintenance (4 | 8.7%).
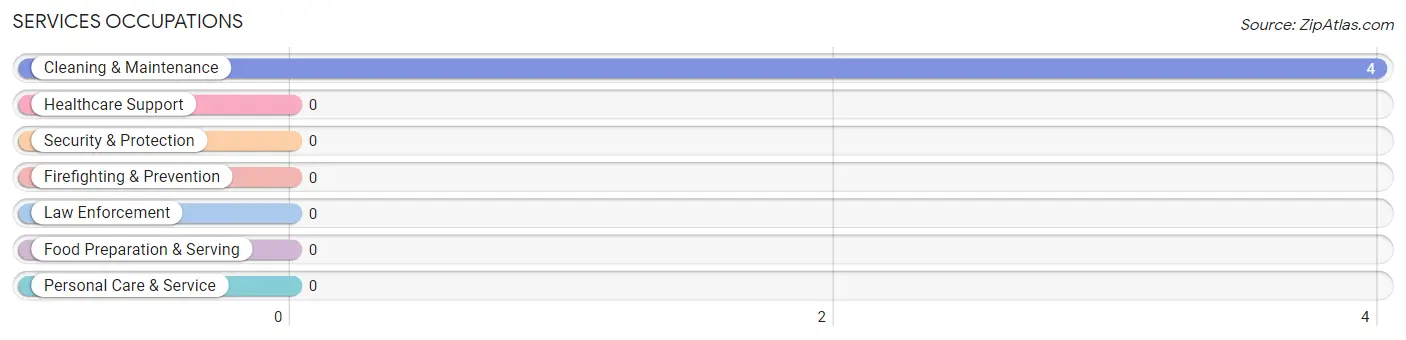
Services Occupations by Sex
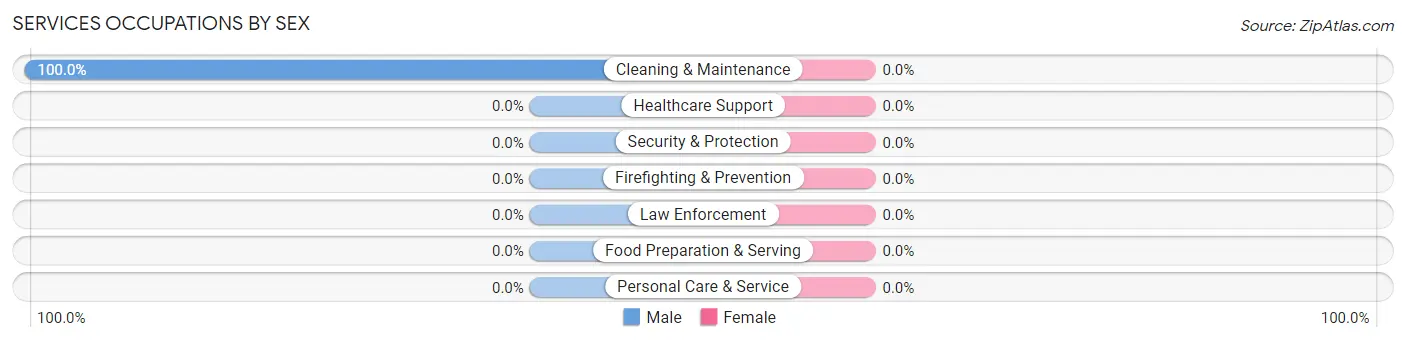
| Occupation | Male | Female |
| Healthcare Support | 0 (0.0%) | 0 (0.0%) |
| Security & Protection | 0 (0.0%) | 0 (0.0%) |
| Firefighting & Prevention | 0 (0.0%) | 0 (0.0%) |
| Law Enforcement | 0 (0.0%) | 0 (0.0%) |
| Food Preparation & Serving | 0 (0.0%) | 0 (0.0%) |
| Cleaning & Maintenance | 4 (100.0%) | 0 (0.0%) |
| Personal Care & Service | 0 (0.0%) | 0 (0.0%) |
| Total (Category) | 4 (100.0%) | 0 (0.0%) |
| Total (Overall) | 39 (84.8%) | 7 (15.2%) |
Sales and Office Occupations
The most common Sales and Office occupations in Kenedy County are , and Office & Administration (3 | 6.5%).
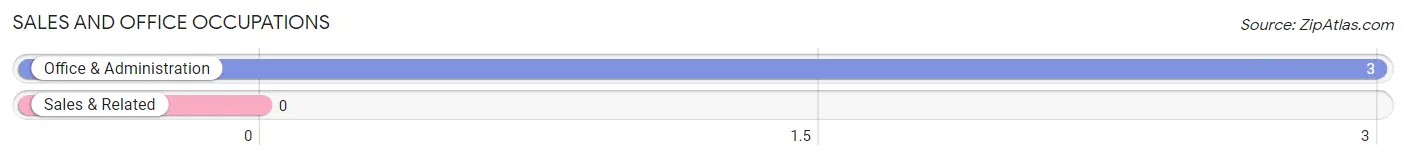
Sales and Office Occupations by Sex
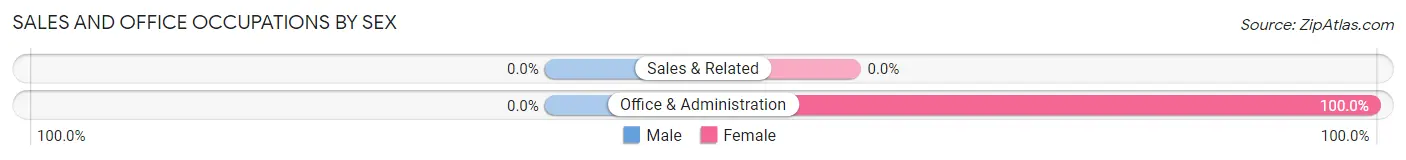
| Occupation | Male | Female |
| Sales & Related | 0 (0.0%) | 0 (0.0%) |
| Office & Administration | 0 (0.0%) | 3 (100.0%) |
| Total (Category) | 0 (0.0%) | 3 (100.0%) |
| Total (Overall) | 39 (84.8%) | 7 (15.2%) |
Natural Resources, Construction and Maintenance Occupations
The most common Natural Resources, Construction and Maintenance occupations in Kenedy County are , and Farming, Fishing & Forestry (14 | 30.4%).
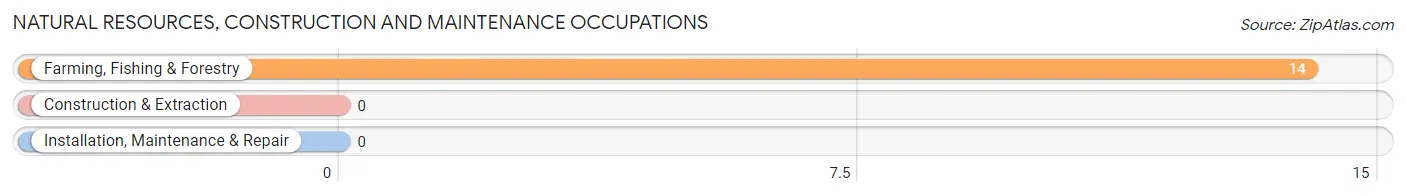
Natural Resources, Construction and Maintenance Occupations by Sex
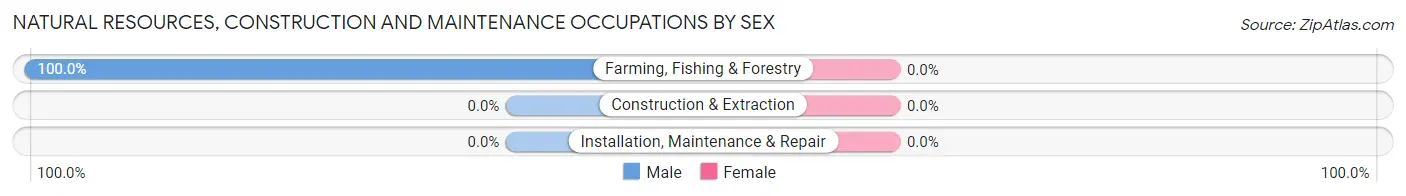
| Occupation | Male | Female |
| Farming, Fishing & Forestry | 14 (100.0%) | 0 (0.0%) |
| Construction & Extraction | 0 (0.0%) | 0 (0.0%) |
| Installation, Maintenance & Repair | 0 (0.0%) | 0 (0.0%) |
| Total (Category) | 14 (100.0%) | 0 (0.0%) |
| Total (Overall) | 39 (84.8%) | 7 (15.2%) |
Production, Transportation and Moving Occupations
The most common Production, Transportation and Moving occupations in Kenedy County are Transportation (9 | 19.6%), and Production (5 | 10.9%).
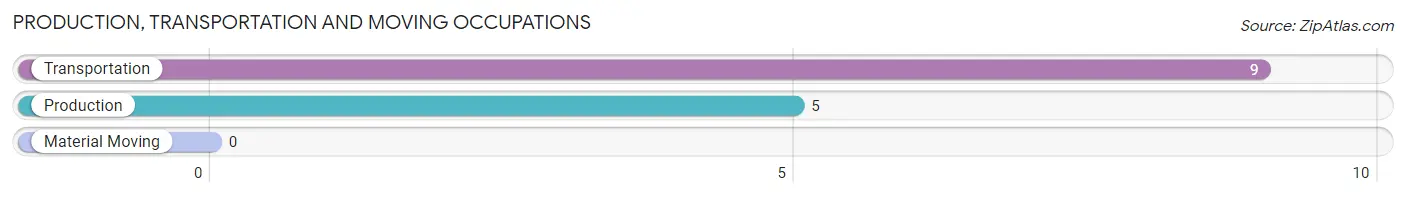
Production, Transportation and Moving Occupations by Sex
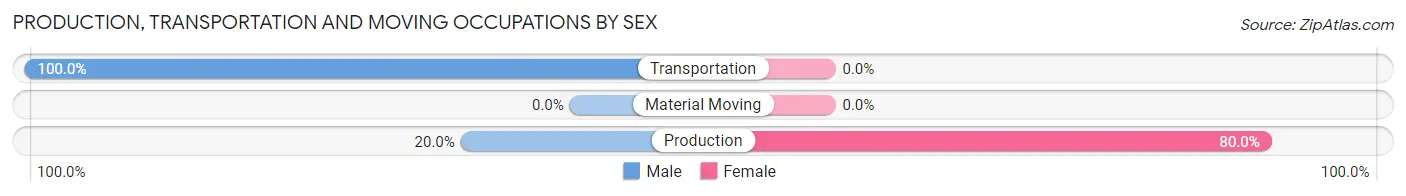
| Occupation | Male | Female |
| Production | 1 (20.0%) | 4 (80.0%) |
| Transportation | 9 (100.0%) | 0 (0.0%) |
| Material Moving | 0 (0.0%) | 0 (0.0%) |
| Total (Category) | 10 (71.4%) | 4 (28.6%) |
| Total (Overall) | 39 (84.8%) | 7 (15.2%) |
Employment Industries by Sex in Kenedy County
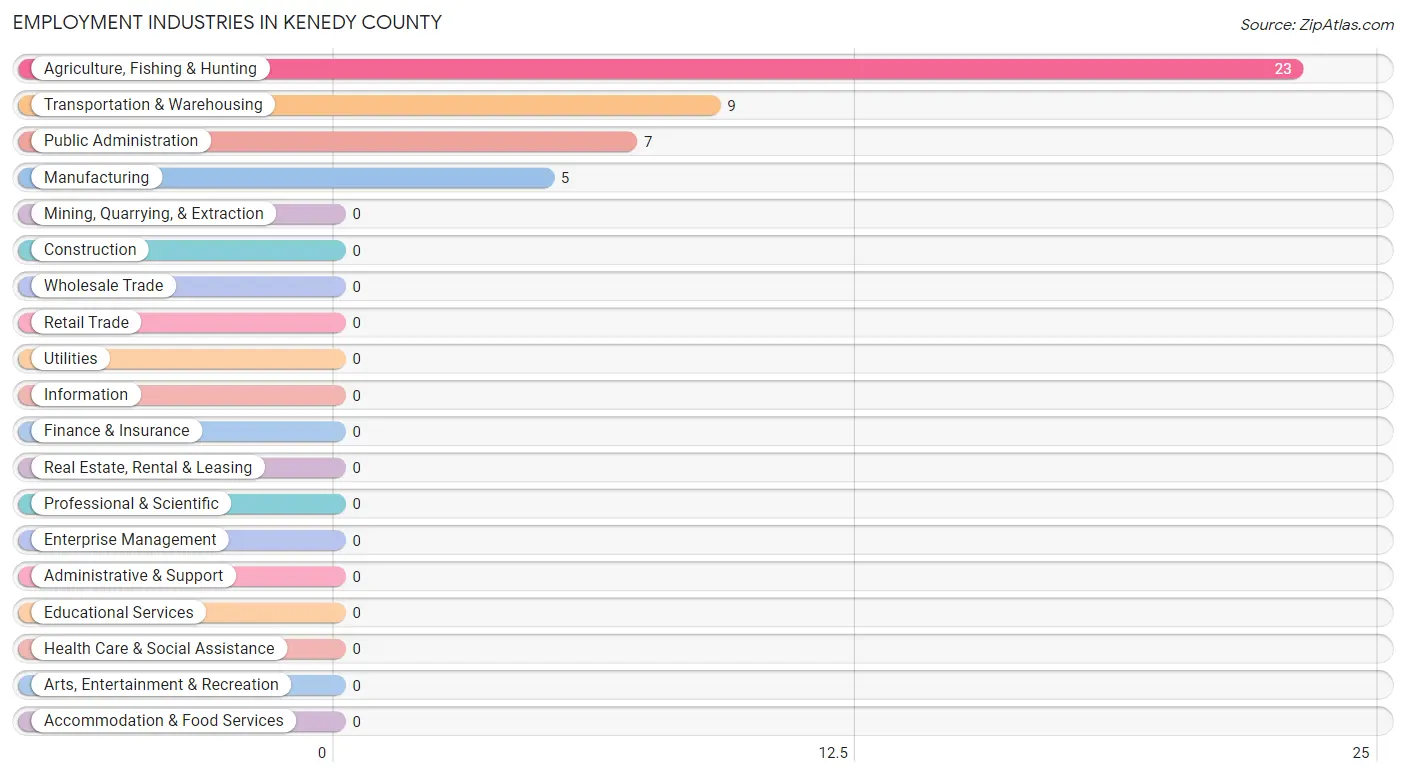
Employment Industries in Kenedy County
The major employment industries in Kenedy County include Agriculture, Fishing & Hunting (23 | 50.0%), Transportation & Warehousing (9 | 19.6%), Public Administration (7 | 15.2%), and Manufacturing (5 | 10.9%).
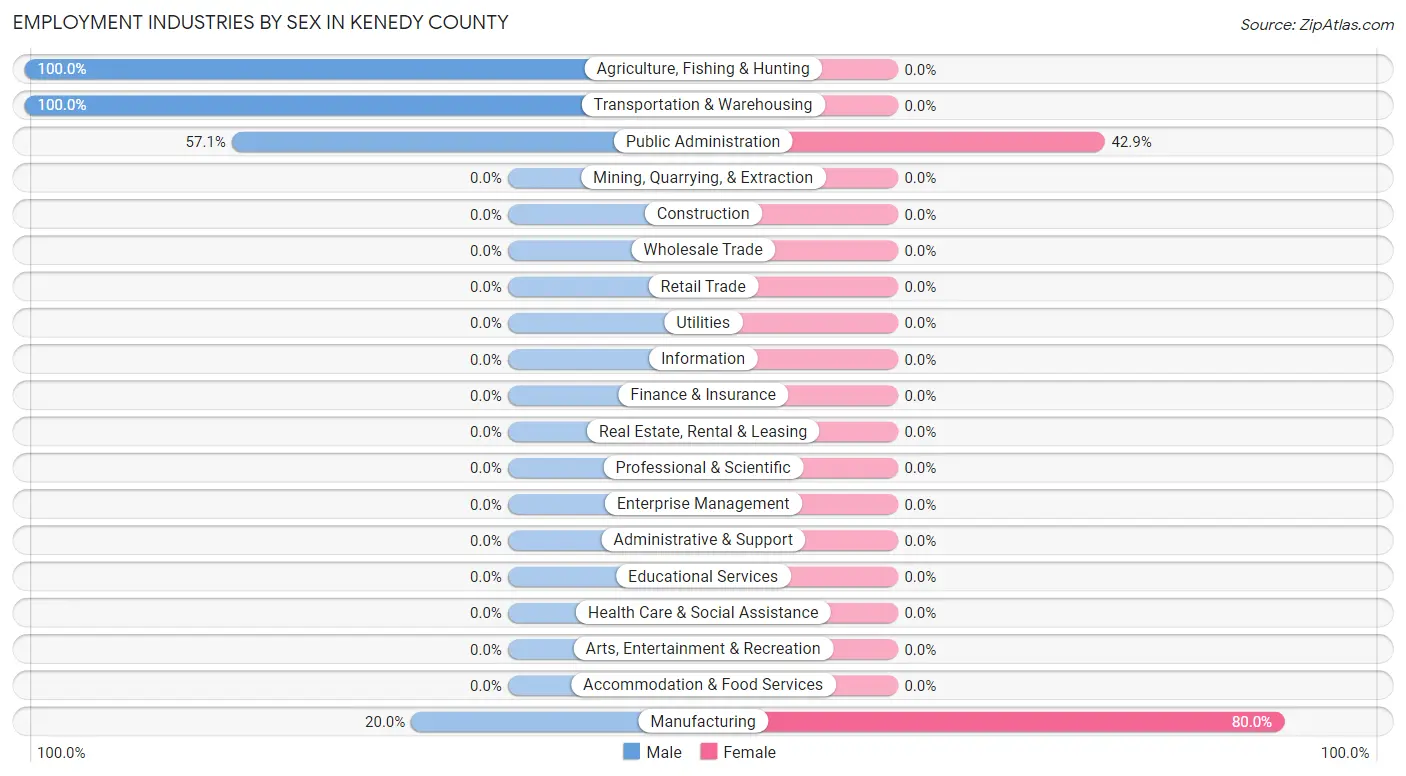
Employment Industries by Sex in Kenedy County
The Kenedy County industries that see more men than women are Agriculture, Fishing & Hunting (100.0%), Transportation & Warehousing (100.0%), and Public Administration (57.1%), whereas the industries that tend to have a higher number of women are Manufacturing (80.0%), and Public Administration (42.9%).
| Industry | Male | Female |
| Agriculture, Fishing & Hunting | 23 (100.0%) | 0 (0.0%) |
| Mining, Quarrying, & Extraction | 0 (0.0%) | 0 (0.0%) |
| Construction | 0 (0.0%) | 0 (0.0%) |
| Manufacturing | 1 (20.0%) | 4 (80.0%) |
| Wholesale Trade | 0 (0.0%) | 0 (0.0%) |
| Retail Trade | 0 (0.0%) | 0 (0.0%) |
| Transportation & Warehousing | 9 (100.0%) | 0 (0.0%) |
| Utilities | 0 (0.0%) | 0 (0.0%) |
| Information | 0 (0.0%) | 0 (0.0%) |
| Finance & Insurance | 0 (0.0%) | 0 (0.0%) |
| Real Estate, Rental & Leasing | 0 (0.0%) | 0 (0.0%) |
| Professional & Scientific | 0 (0.0%) | 0 (0.0%) |
| Enterprise Management | 0 (0.0%) | 0 (0.0%) |
| Administrative & Support | 0 (0.0%) | 0 (0.0%) |
| Educational Services | 0 (0.0%) | 0 (0.0%) |
| Health Care & Social Assistance | 0 (0.0%) | 0 (0.0%) |
| Arts, Entertainment & Recreation | 0 (0.0%) | 0 (0.0%) |
| Accommodation & Food Services | 0 (0.0%) | 0 (0.0%) |
| Public Administration | 4 (57.1%) | 3 (42.9%) |
| Total | 39 (84.8%) | 7 (15.2%) |
Education in Kenedy County
School Enrollment in Kenedy County
The most common levels of schooling among the 13 students in Kenedy County are nursery / preschool (12 | 92.3%), and graduate / professional (1 | 7.7%).
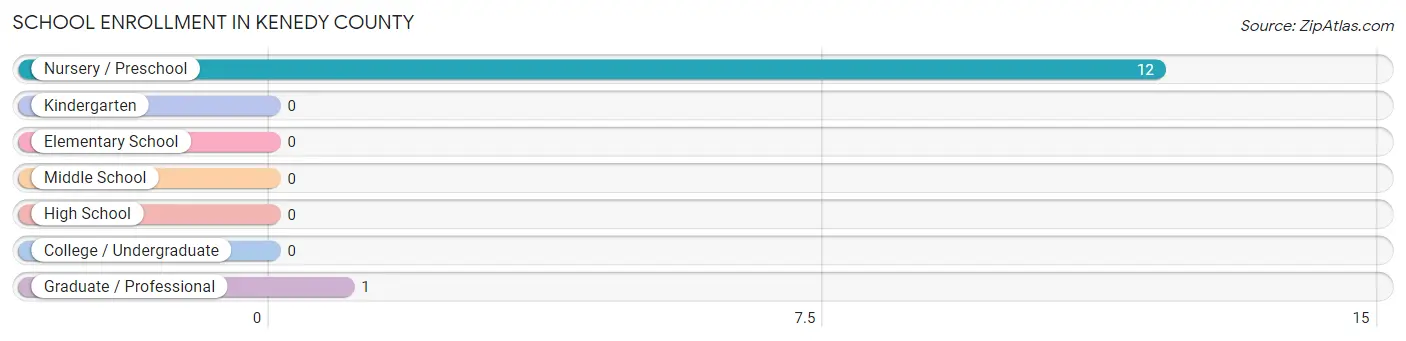
| School Level | # Students | % Students |
| Nursery / Preschool | 12 | 92.3% |
| Kindergarten | 0 | 0.0% |
| Elementary School | 0 | 0.0% |
| Middle School | 0 | 0.0% |
| High School | 0 | 0.0% |
| College / Undergraduate | 0 | 0.0% |
| Graduate / Professional | 1 | 7.7% |
| Total | 13 | 100.0% |
School Enrollment by Age by Funding Source in Kenedy County
Out of a total of 13 students who are enrolled in schools in Kenedy County, 1 (7.7%) attend a private institution, while the remaining 12 (92.3%) are enrolled in public schools. The age group of 25 to 34 year olds has the highest likelihood of being enrolled in private schools, with 1 (100.0% in the age bracket) enrolled. Conversely, the age group of 3 to 4 year olds has the lowest likelihood of being enrolled in a private school, with 12 (100.0% in the age bracket) attending a public institution.
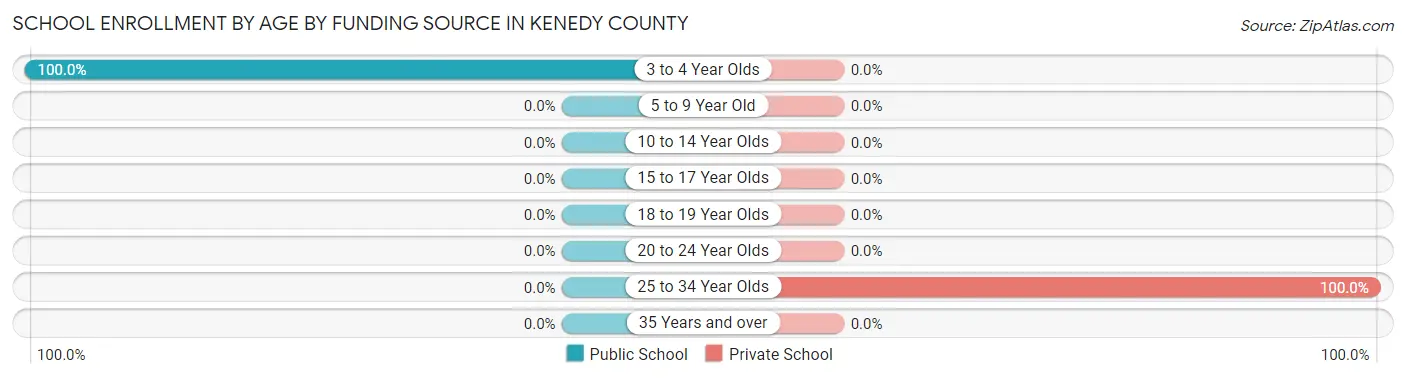
| Age Bracket | Public School | Private School |
| 3 to 4 Year Olds | 12 (100.0%) | 0 (0.0%) |
| 5 to 9 Year Old | 0 (0.0%) | 0 (0.0%) |
| 10 to 14 Year Olds | 0 (0.0%) | 0 (0.0%) |
| 15 to 17 Year Olds | 0 (0.0%) | 0 (0.0%) |
| 18 to 19 Year Olds | 0 (0.0%) | 0 (0.0%) |
| 20 to 24 Year Olds | 0 (0.0%) | 0 (0.0%) |
| 25 to 34 Year Olds | 0 (0.0%) | 1 (100.0%) |
| 35 Years and over | 0 (0.0%) | 0 (0.0%) |
| Total | 12 (92.3%) | 1 (7.7%) |
Educational Attainment by Field of Study in Kenedy County
Business (3 | 42.9%), liberal arts & history (3 | 42.9%), and education (1 | 14.3%) are the most common fields of study among 7 individuals in Kenedy County who have obtained a bachelor's degree or higher.
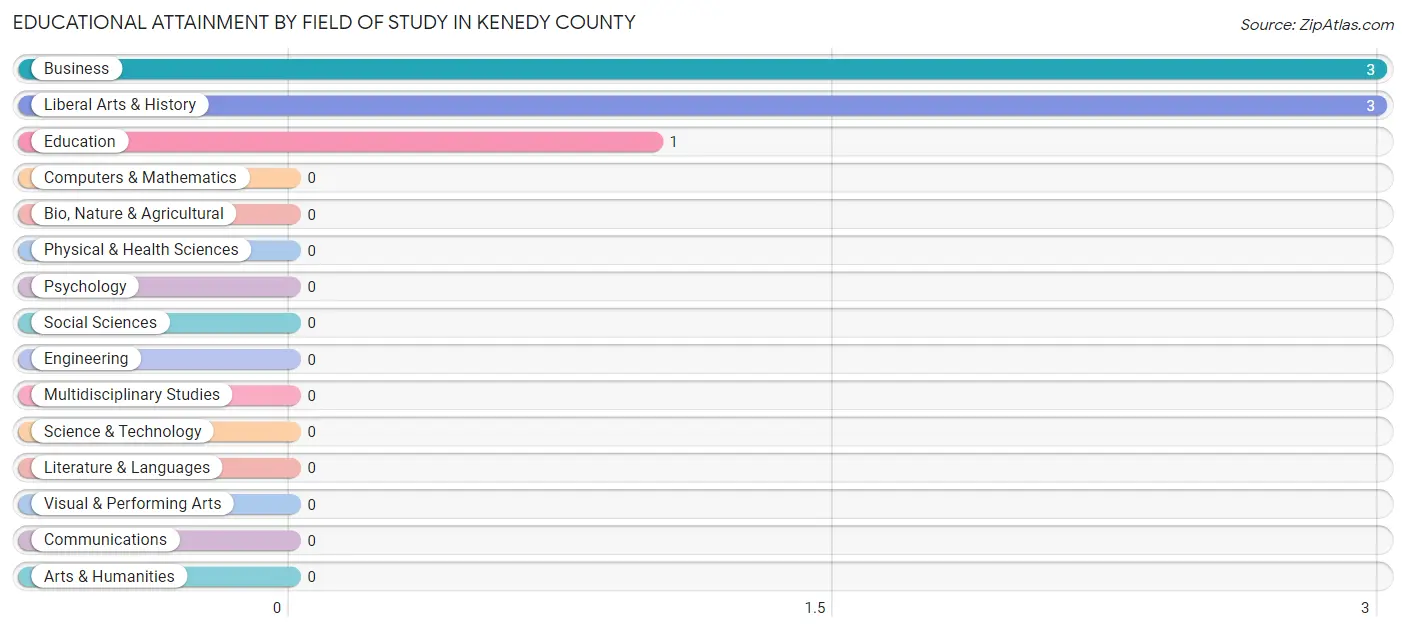
| Field of Study | # Graduates | % Graduates |
| Computers & Mathematics | 0 | 0.0% |
| Bio, Nature & Agricultural | 0 | 0.0% |
| Physical & Health Sciences | 0 | 0.0% |
| Psychology | 0 | 0.0% |
| Social Sciences | 0 | 0.0% |
| Engineering | 0 | 0.0% |
| Multidisciplinary Studies | 0 | 0.0% |
| Science & Technology | 0 | 0.0% |
| Business | 3 | 42.9% |
| Education | 1 | 14.3% |
| Literature & Languages | 0 | 0.0% |
| Liberal Arts & History | 3 | 42.9% |
| Visual & Performing Arts | 0 | 0.0% |
| Communications | 0 | 0.0% |
| Arts & Humanities | 0 | 0.0% |
| Total | 7 | 100.0% |
Transportation & Commute in Kenedy County
Vehicle Availability by Sex in Kenedy County
The most prevalent vehicle ownership categories in Kenedy County are males with 1 vehicle (18, accounting for 50.0%) and females with 1 vehicle (0, making up 257.1%).
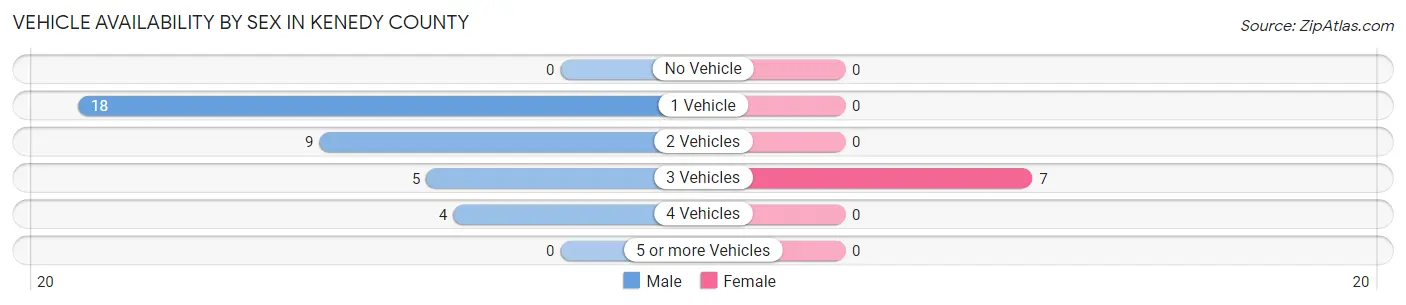
| Vehicles Available | Male | Female |
| No Vehicle | 0 (0.0%) | 0 (0.0%) |
| 1 Vehicle | 18 (50.0%) | 0 (0.0%) |
| 2 Vehicles | 9 (25.0%) | 0 (0.0%) |
| 3 Vehicles | 5 (13.9%) | 7 (100.0%) |
| 4 Vehicles | 4 (11.1%) | 0 (0.0%) |
| 5 or more Vehicles | 0 (0.0%) | 0 (0.0%) |
| Total | 36 (100.0%) | 7 (100.0%) |
Commute Time in Kenedy County
The most frequently occuring commute durations in Kenedy County are 5 to 9 minutes (15 commuters, 33.3%), 15 to 19 minutes (9 commuters, 20.0%), and 30 to 34 minutes (8 commuters, 17.8%).
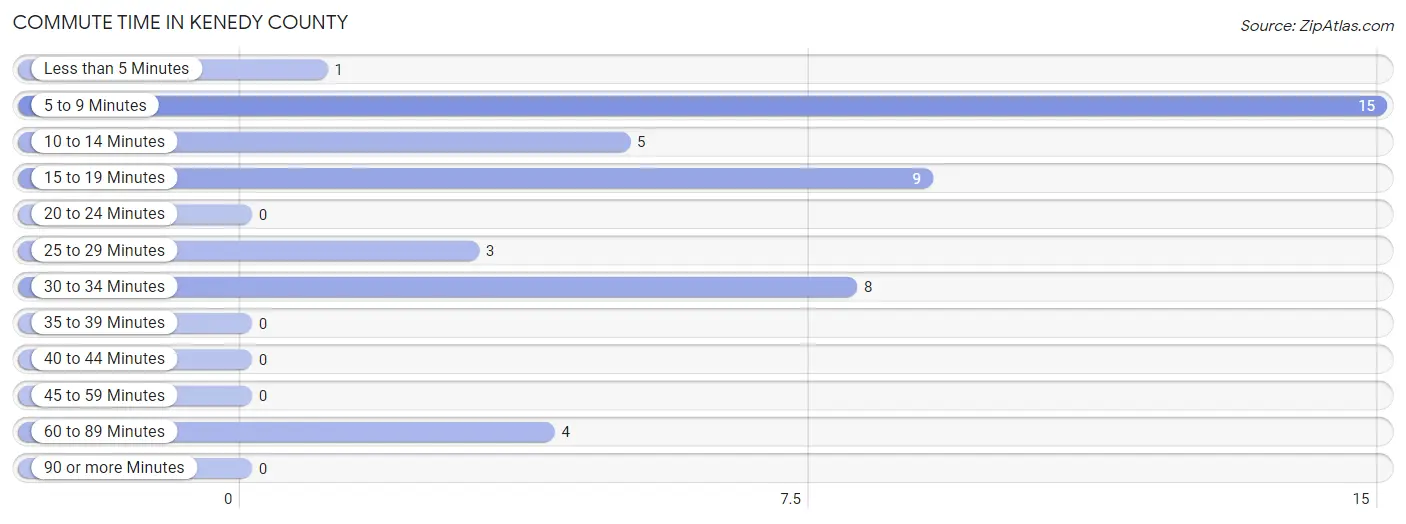
| Commute Time | # Commuters | % Commuters |
| Less than 5 Minutes | 1 | 2.2% |
| 5 to 9 Minutes | 15 | 33.3% |
| 10 to 14 Minutes | 5 | 11.1% |
| 15 to 19 Minutes | 9 | 20.0% |
| 20 to 24 Minutes | 0 | 0.0% |
| 25 to 29 Minutes | 3 | 6.7% |
| 30 to 34 Minutes | 8 | 17.8% |
| 35 to 39 Minutes | 0 | 0.0% |
| 40 to 44 Minutes | 0 | 0.0% |
| 45 to 59 Minutes | 0 | 0.0% |
| 60 to 89 Minutes | 4 | 8.9% |
| 90 or more Minutes | 0 | 0.0% |
Commute Time by Sex in Kenedy County
The most common commute times in Kenedy County are 5 to 9 minutes (15 commuters, 39.5%) for males and 10 to 14 minutes (4 commuters, 57.1%) for females.
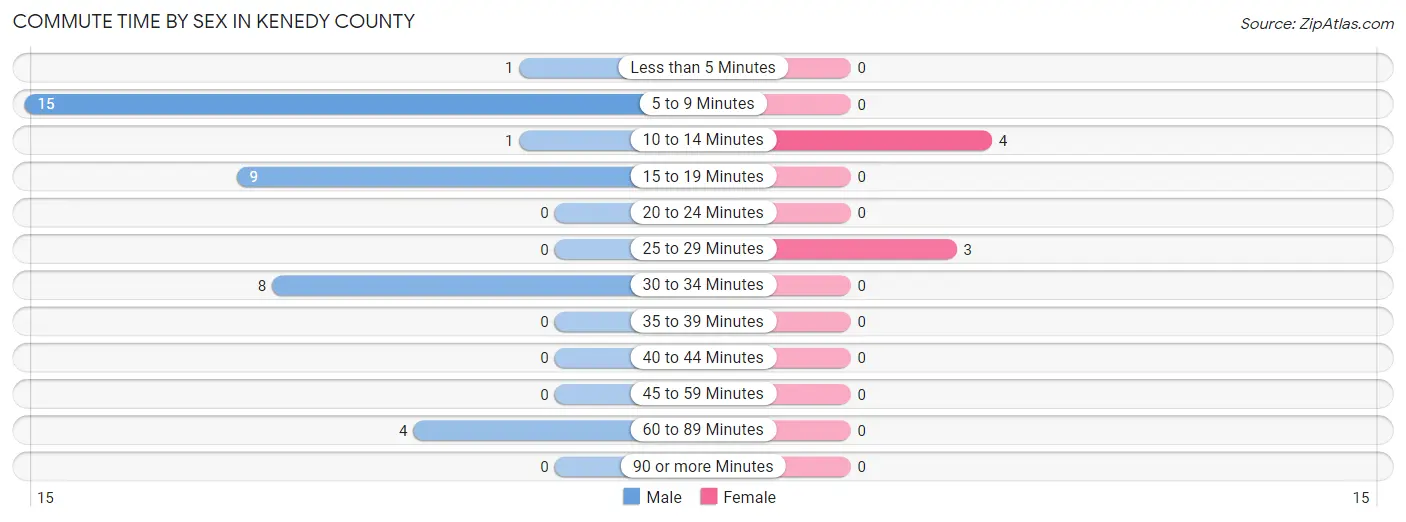
| Commute Time | Male | Female |
| Less than 5 Minutes | 1 (2.6%) | 0 (0.0%) |
| 5 to 9 Minutes | 15 (39.5%) | 0 (0.0%) |
| 10 to 14 Minutes | 1 (2.6%) | 4 (57.1%) |
| 15 to 19 Minutes | 9 (23.7%) | 0 (0.0%) |
| 20 to 24 Minutes | 0 (0.0%) | 0 (0.0%) |
| 25 to 29 Minutes | 0 (0.0%) | 3 (42.9%) |
| 30 to 34 Minutes | 8 (21.0%) | 0 (0.0%) |
| 35 to 39 Minutes | 0 (0.0%) | 0 (0.0%) |
| 40 to 44 Minutes | 0 (0.0%) | 0 (0.0%) |
| 45 to 59 Minutes | 0 (0.0%) | 0 (0.0%) |
| 60 to 89 Minutes | 4 (10.5%) | 0 (0.0%) |
| 90 or more Minutes | 0 (0.0%) | 0 (0.0%) |
Time of Departure to Work by Sex in Kenedy County
The most frequent times of departure to work in Kenedy County are 6:30 AM to 6:59 AM (15, 39.5%) for males and 7:30 AM to 7:59 AM (7, 100.0%) for females.
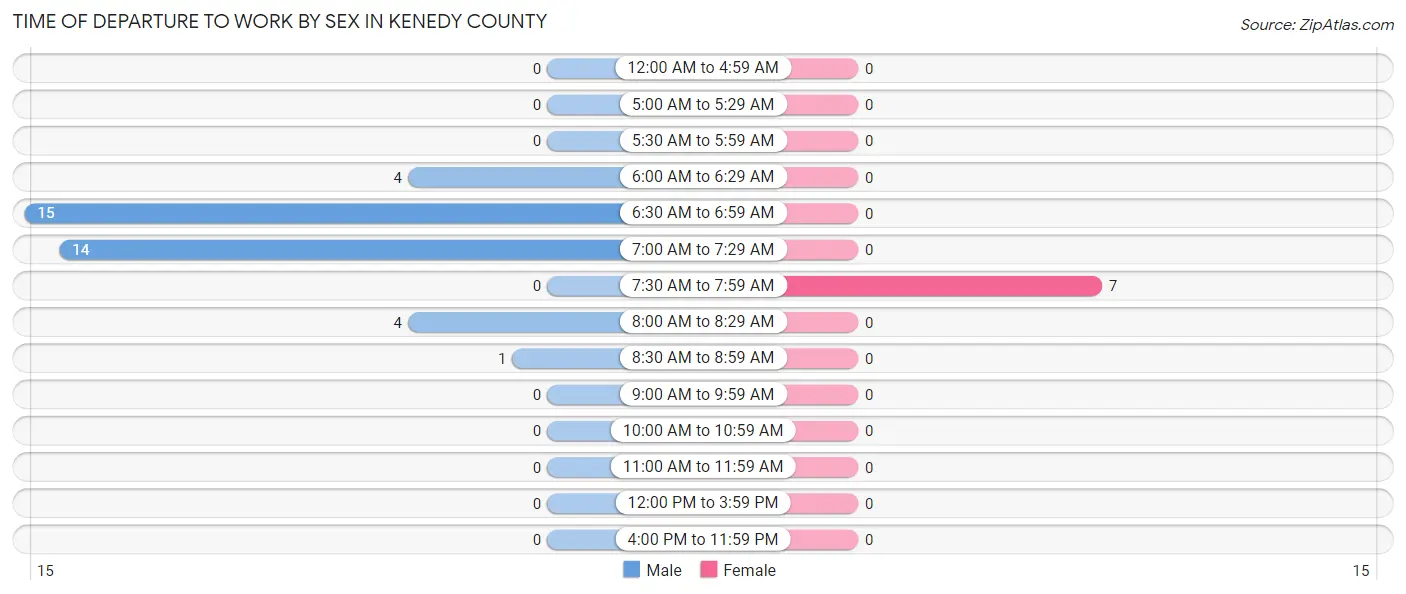
| Time of Departure | Male | Female |
| 12:00 AM to 4:59 AM | 0 (0.0%) | 0 (0.0%) |
| 5:00 AM to 5:29 AM | 0 (0.0%) | 0 (0.0%) |
| 5:30 AM to 5:59 AM | 0 (0.0%) | 0 (0.0%) |
| 6:00 AM to 6:29 AM | 4 (10.5%) | 0 (0.0%) |
| 6:30 AM to 6:59 AM | 15 (39.5%) | 0 (0.0%) |
| 7:00 AM to 7:29 AM | 14 (36.8%) | 0 (0.0%) |
| 7:30 AM to 7:59 AM | 0 (0.0%) | 7 (100.0%) |
| 8:00 AM to 8:29 AM | 4 (10.5%) | 0 (0.0%) |
| 8:30 AM to 8:59 AM | 1 (2.6%) | 0 (0.0%) |
| 9:00 AM to 9:59 AM | 0 (0.0%) | 0 (0.0%) |
| 10:00 AM to 10:59 AM | 0 (0.0%) | 0 (0.0%) |
| 11:00 AM to 11:59 AM | 0 (0.0%) | 0 (0.0%) |
| 12:00 PM to 3:59 PM | 0 (0.0%) | 0 (0.0%) |
| 4:00 PM to 11:59 PM | 0 (0.0%) | 0 (0.0%) |
| Total | 38 (100.0%) | 7 (100.0%) |
Housing Occupancy in Kenedy County
Occupancy by Ownership in Kenedy County
Of the total 38 dwellings in Kenedy County, owner-occupied units account for 6 (15.8%), while renter-occupied units make up 32 (84.2%).
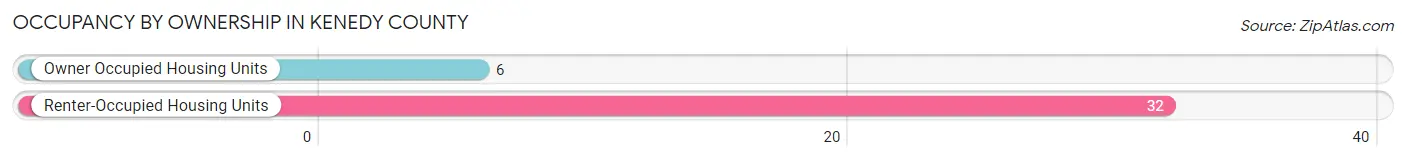
| Occupancy | # Housing Units | % Housing Units |
| Owner Occupied Housing Units | 6 | 15.8% |
| Renter-Occupied Housing Units | 32 | 84.2% |
| Total Occupied Housing Units | 38 | 100.0% |
Occupancy by Household Size in Kenedy County
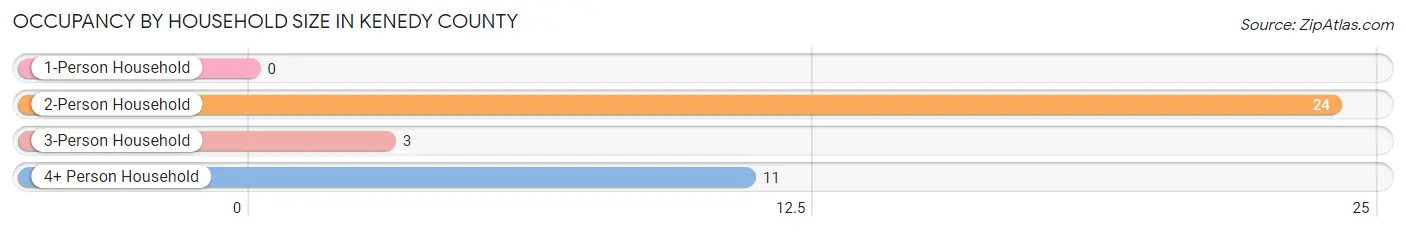
| Household Size | # Housing Units | % Housing Units |
| 1-Person Household | 0 | 0.0% |
| 2-Person Household | 24 | 63.2% |
| 3-Person Household | 3 | 7.9% |
| 4+ Person Household | 11 | 28.9% |
| Total Housing Units | 38 | 100.0% |
Occupancy by Ownership by Household Size in Kenedy County
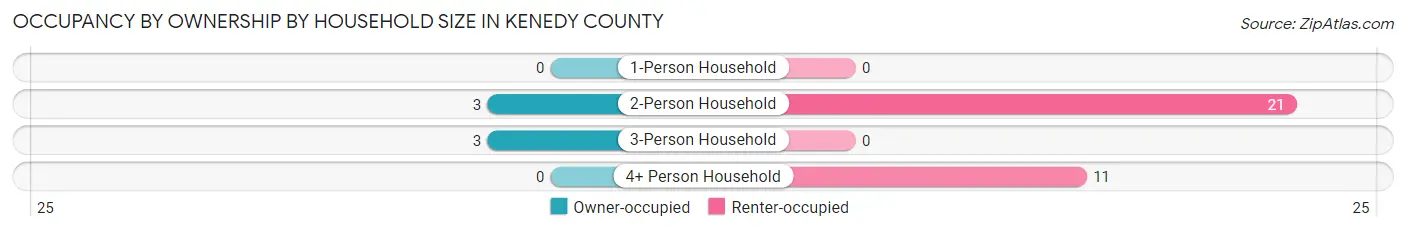
| Household Size | Owner-occupied | Renter-occupied |
| 1-Person Household | 0 (0.0%) | 0 (0.0%) |
| 2-Person Household | 3 (12.5%) | 21 (87.5%) |
| 3-Person Household | 3 (100.0%) | 0 (0.0%) |
| 4+ Person Household | 0 (0.0%) | 11 (100.0%) |
| Total Housing Units | 6 (15.8%) | 32 (84.2%) |
Occupancy by Educational Attainment in Kenedy County
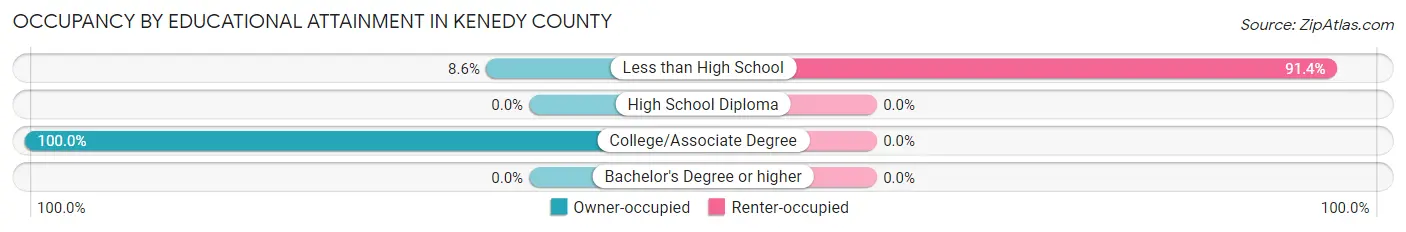
| Household Size | Owner-occupied | Renter-occupied |
| Less than High School | 3 (8.6%) | 32 (91.4%) |
| High School Diploma | 0 (0.0%) | 0 (0.0%) |
| College/Associate Degree | 3 (100.0%) | 0 (0.0%) |
| Bachelor's Degree or higher | 0 (0.0%) | 0 (0.0%) |
Occupancy by Age of Householder in Kenedy County
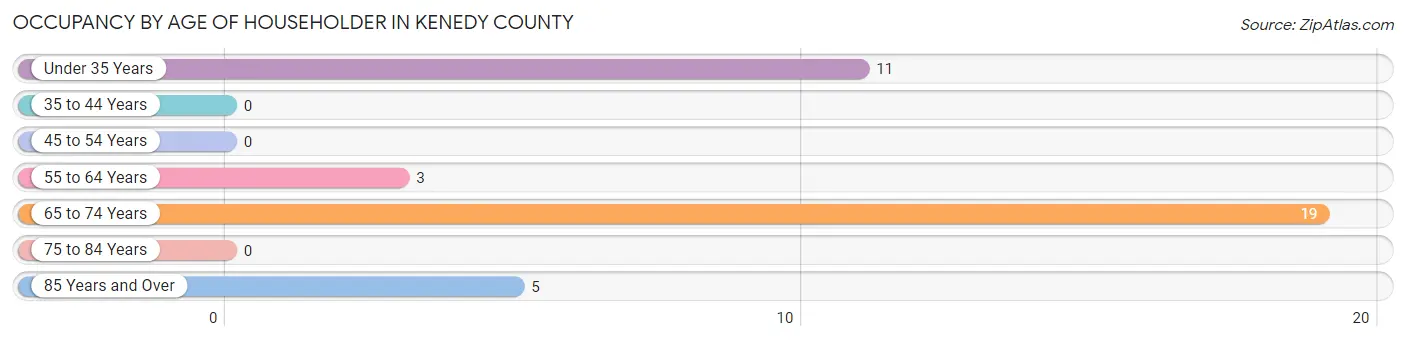
| Age Bracket | # Households | % Households |
| Under 35 Years | 11 | 28.9% |
| 35 to 44 Years | 0 | 0.0% |
| 45 to 54 Years | 0 | 0.0% |
| 55 to 64 Years | 3 | 7.9% |
| 65 to 74 Years | 19 | 50.0% |
| 75 to 84 Years | 0 | 0.0% |
| 85 Years and Over | 5 | 13.2% |
| Total | 38 | 100.0% |
Housing Finances in Kenedy County
Median Income by Occupancy in Kenedy County
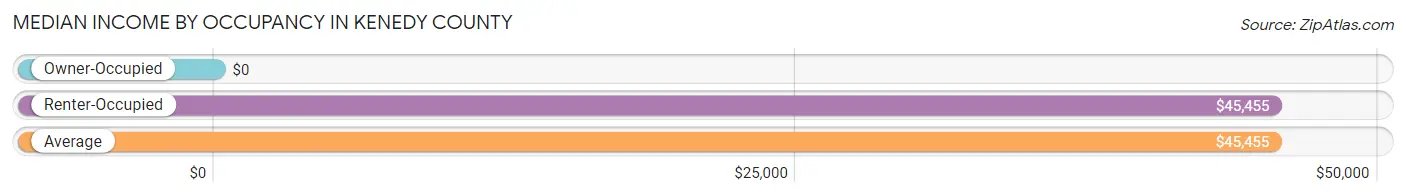
| Occupancy Type | # Households | Median Income |
| Owner-Occupied | 6 (15.8%) | $0 |
| Renter-Occupied | 32 (84.2%) | $45,455 |
| Average | 38 (100.0%) | $45,455 |
Occupancy by Householder Income Bracket in Kenedy County
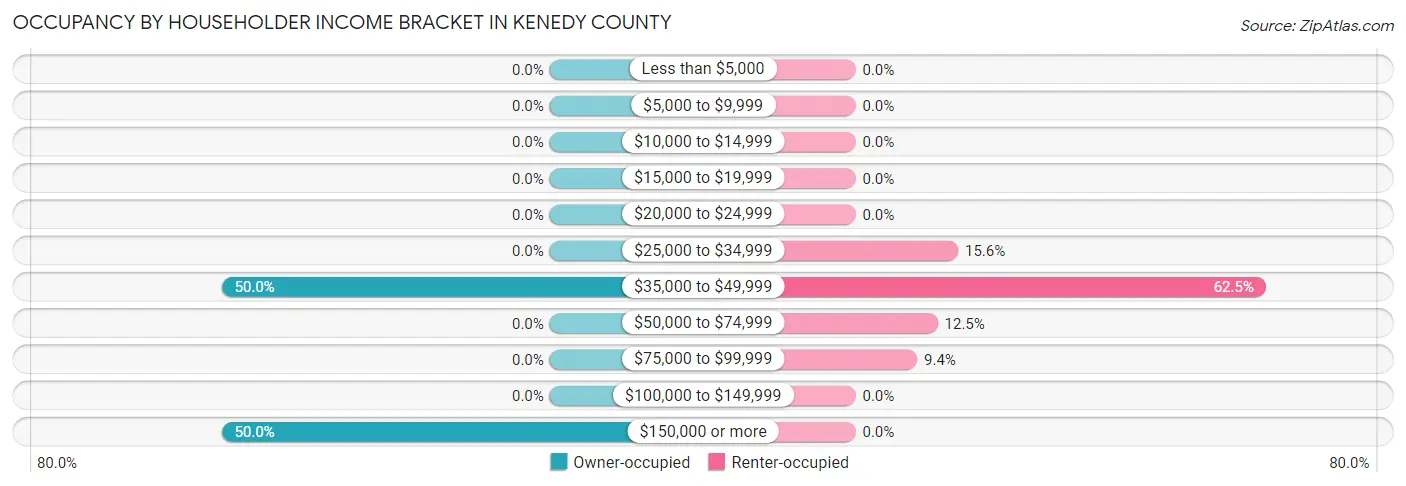
| Income Bracket | Owner-occupied | Renter-occupied |
| Less than $5,000 | 0 (0.0%) | 0 (0.0%) |
| $5,000 to $9,999 | 0 (0.0%) | 0 (0.0%) |
| $10,000 to $14,999 | 0 (0.0%) | 0 (0.0%) |
| $15,000 to $19,999 | 0 (0.0%) | 0 (0.0%) |
| $20,000 to $24,999 | 0 (0.0%) | 0 (0.0%) |
| $25,000 to $34,999 | 0 (0.0%) | 5 (15.6%) |
| $35,000 to $49,999 | 3 (50.0%) | 20 (62.5%) |
| $50,000 to $74,999 | 0 (0.0%) | 4 (12.5%) |
| $75,000 to $99,999 | 0 (0.0%) | 3 (9.4%) |
| $100,000 to $149,999 | 0 (0.0%) | 0 (0.0%) |
| $150,000 or more | 3 (50.0%) | 0 (0.0%) |
| Total | 6 (100.0%) | 32 (100.0%) |
Monthly Housing Cost Tiers in Kenedy County
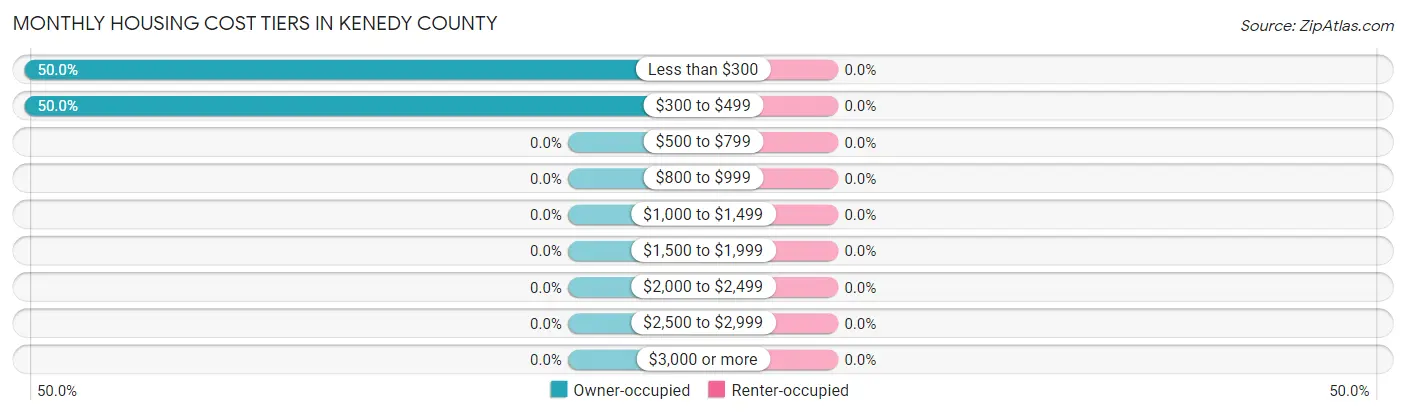
| Monthly Cost | Owner-occupied | Renter-occupied |
| Less than $300 | 3 (50.0%) | 0 (0.0%) |
| $300 to $499 | 3 (50.0%) | 0 (0.0%) |
| $500 to $799 | 0 (0.0%) | 0 (0.0%) |
| $800 to $999 | 0 (0.0%) | 0 (0.0%) |
| $1,000 to $1,499 | 0 (0.0%) | 0 (0.0%) |
| $1,500 to $1,999 | 0 (0.0%) | 0 (0.0%) |
| $2,000 to $2,499 | 0 (0.0%) | 0 (0.0%) |
| $2,500 to $2,999 | 0 (0.0%) | 0 (0.0%) |
| $3,000 or more | 0 (0.0%) | 0 (0.0%) |
| Total | 6 (100.0%) | 32 (100.0%) |
Physical Housing Characteristics in Kenedy County
Housing Structures in Kenedy County
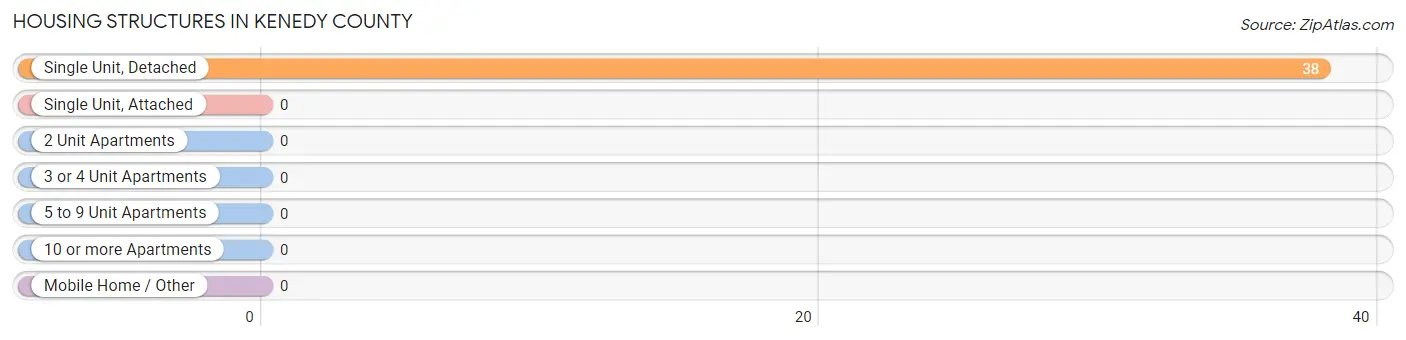
| Structure Type | # Housing Units | % Housing Units |
| Single Unit, Detached | 38 | 100.0% |
| Single Unit, Attached | 0 | 0.0% |
| 2 Unit Apartments | 0 | 0.0% |
| 3 or 4 Unit Apartments | 0 | 0.0% |
| 5 to 9 Unit Apartments | 0 | 0.0% |
| 10 or more Apartments | 0 | 0.0% |
| Mobile Home / Other | 0 | 0.0% |
| Total | 38 | 100.0% |
Housing Structures by Occupancy in Kenedy County
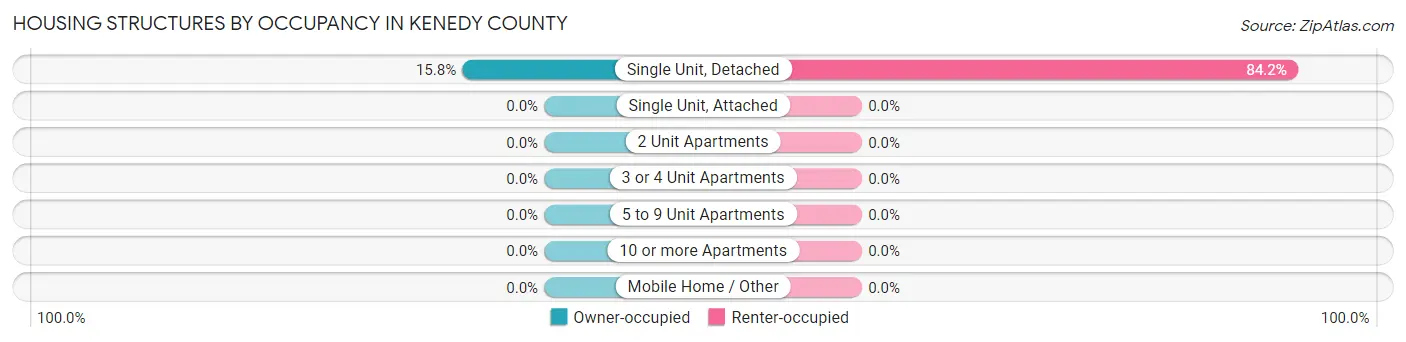
| Structure Type | Owner-occupied | Renter-occupied |
| Single Unit, Detached | 6 (15.8%) | 32 (84.2%) |
| Single Unit, Attached | 0 (0.0%) | 0 (0.0%) |
| 2 Unit Apartments | 0 (0.0%) | 0 (0.0%) |
| 3 or 4 Unit Apartments | 0 (0.0%) | 0 (0.0%) |
| 5 to 9 Unit Apartments | 0 (0.0%) | 0 (0.0%) |
| 10 or more Apartments | 0 (0.0%) | 0 (0.0%) |
| Mobile Home / Other | 0 (0.0%) | 0 (0.0%) |
| Total | 6 (15.8%) | 32 (84.2%) |
Housing Structures by Number of Rooms in Kenedy County
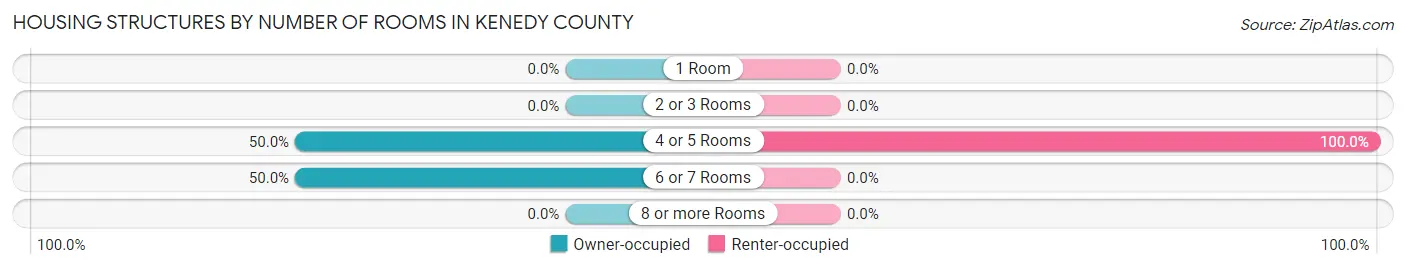
| Number of Rooms | Owner-occupied | Renter-occupied |
| 1 Room | 0 (0.0%) | 0 (0.0%) |
| 2 or 3 Rooms | 0 (0.0%) | 0 (0.0%) |
| 4 or 5 Rooms | 3 (50.0%) | 32 (100.0%) |
| 6 or 7 Rooms | 3 (50.0%) | 0 (0.0%) |
| 8 or more Rooms | 0 (0.0%) | 0 (0.0%) |
| Total | 6 (100.0%) | 32 (100.0%) |
Housing Structure by Heating Type in Kenedy County
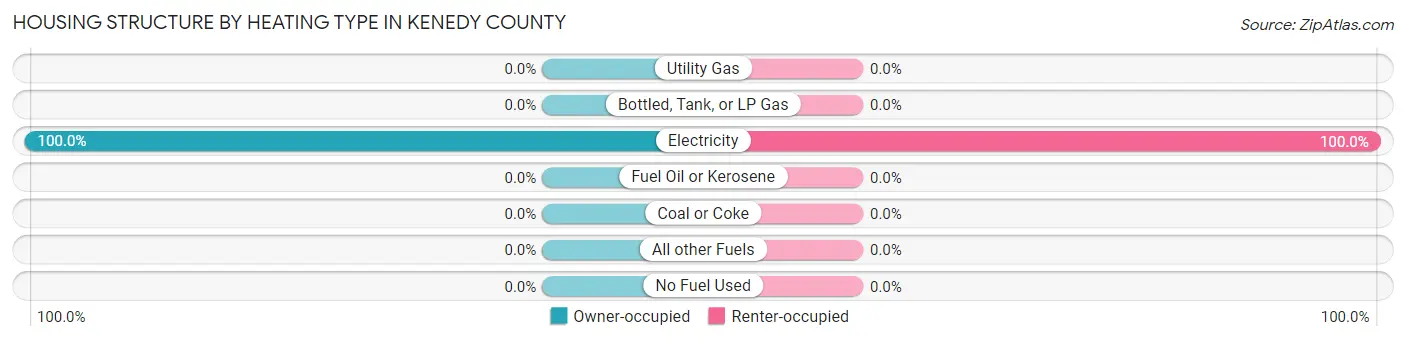
| Heating Type | Owner-occupied | Renter-occupied |
| Utility Gas | 0 (0.0%) | 0 (0.0%) |
| Bottled, Tank, or LP Gas | 0 (0.0%) | 0 (0.0%) |
| Electricity | 6 (100.0%) | 32 (100.0%) |
| Fuel Oil or Kerosene | 0 (0.0%) | 0 (0.0%) |
| Coal or Coke | 0 (0.0%) | 0 (0.0%) |
| All other Fuels | 0 (0.0%) | 0 (0.0%) |
| No Fuel Used | 0 (0.0%) | 0 (0.0%) |
| Total | 6 (100.0%) | 32 (100.0%) |
Household Vehicle Usage in Kenedy County
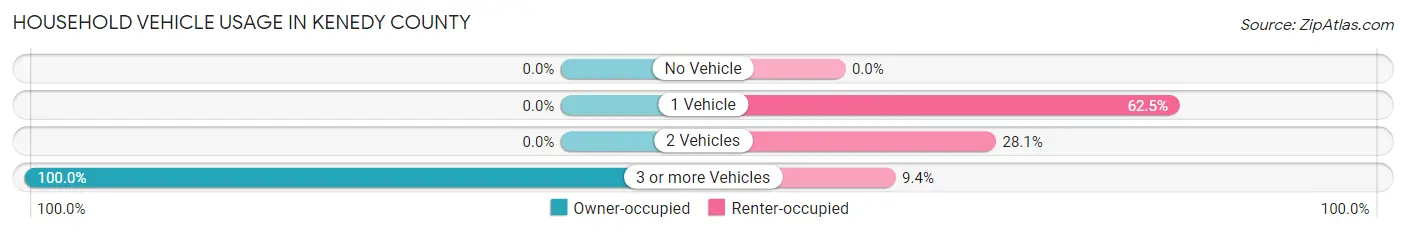
| Vehicles per Household | Owner-occupied | Renter-occupied |
| No Vehicle | 0 (0.0%) | 0 (0.0%) |
| 1 Vehicle | 0 (0.0%) | 20 (62.5%) |
| 2 Vehicles | 0 (0.0%) | 9 (28.1%) |
| 3 or more Vehicles | 6 (100.0%) | 3 (9.4%) |
| Total | 6 (100.0%) | 32 (100.0%) |
Real Estate & Mortgages in Kenedy County
Real Estate and Mortgage Overview in Kenedy County
| Characteristic | Without Mortgage | With Mortgage |
| Housing Units | 6 | 0 |
| Median Property Value | - | - |
| Median Household Income | - | - |
| Monthly Housing Costs | - | - |
| Real Estate Taxes | - | - |
Property Value by Mortgage Status in Kenedy County
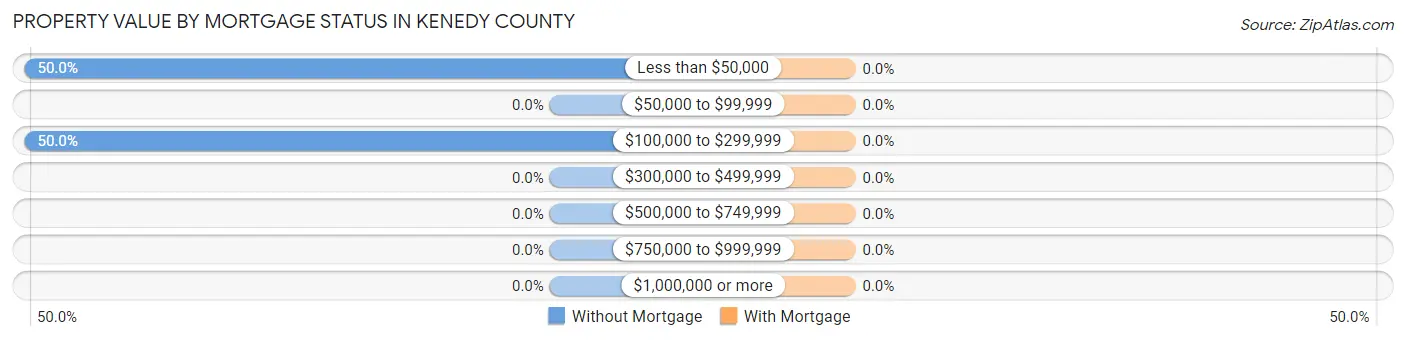
| Property Value | Without Mortgage | With Mortgage |
| Less than $50,000 | 3 (50.0%) | 0 (0.0%) |
| $50,000 to $99,999 | 0 (0.0%) | 0 (0.0%) |
| $100,000 to $299,999 | 3 (50.0%) | 0 (0.0%) |
| $300,000 to $499,999 | 0 (0.0%) | 0 (0.0%) |
| $500,000 to $749,999 | 0 (0.0%) | 0 (0.0%) |
| $750,000 to $999,999 | 0 (0.0%) | 0 (0.0%) |
| $1,000,000 or more | 0 (0.0%) | 0 (0.0%) |
| Total | 6 (100.0%) | 0 (0.0%) |
Household Income by Mortgage Status in Kenedy County
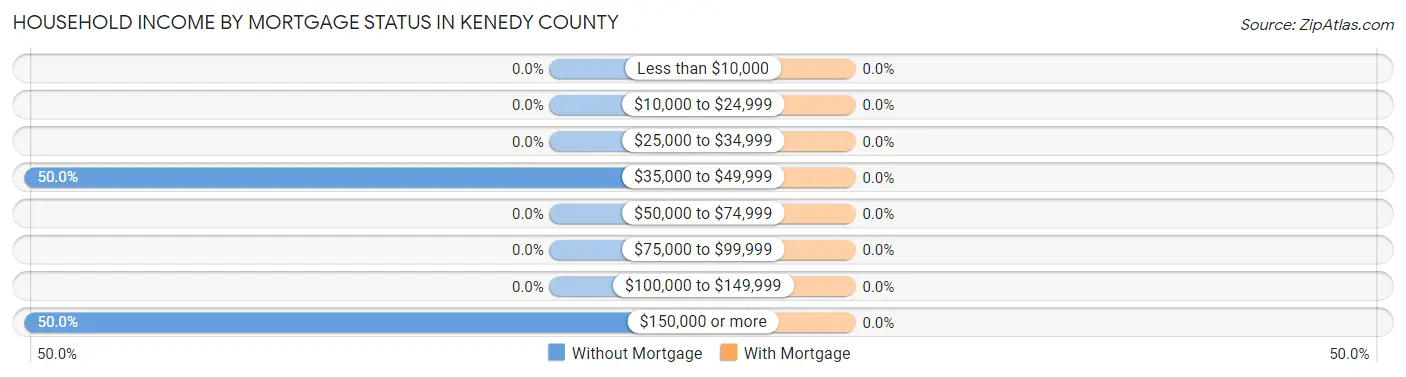
| Household Income | Without Mortgage | With Mortgage |
| Less than $10,000 | 0 (0.0%) | 0 (0.0%) |
| $10,000 to $24,999 | 0 (0.0%) | 0 (0.0%) |
| $25,000 to $34,999 | 0 (0.0%) | 0 (0.0%) |
| $35,000 to $49,999 | 3 (50.0%) | 0 (0.0%) |
| $50,000 to $74,999 | 0 (0.0%) | 0 (0.0%) |
| $75,000 to $99,999 | 0 (0.0%) | 0 (0.0%) |
| $100,000 to $149,999 | 0 (0.0%) | 0 (0.0%) |
| $150,000 or more | 3 (50.0%) | 0 (0.0%) |
| Total | 6 (100.0%) | 0 (0.0%) |
Property Value to Household Income Ratio in Kenedy County
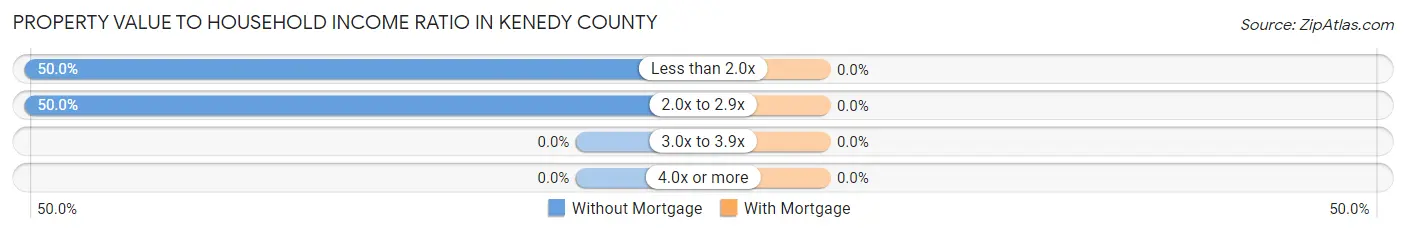
| Value-to-Income Ratio | Without Mortgage | With Mortgage |
| Less than 2.0x | 3 (50.0%) | 0 (0.0%) |
| 2.0x to 2.9x | 3 (50.0%) | 0 (0.0%) |
| 3.0x to 3.9x | 0 (0.0%) | 0 (0.0%) |
| 4.0x or more | 0 (0.0%) | 0 (0.0%) |
| Total | 6 (100.0%) | 0 (0.0%) |
Real Estate Taxes by Mortgage Status in Kenedy County
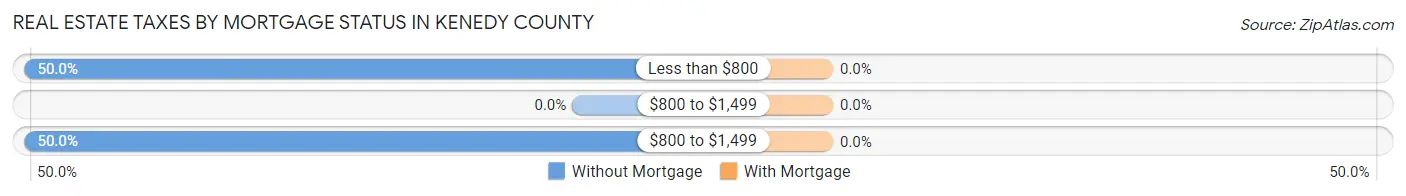
| Property Taxes | Without Mortgage | With Mortgage |
| Less than $800 | 3 (50.0%) | 0 (0.0%) |
| $800 to $1,499 | 0 (0.0%) | 0 (0.0%) |
| $800 to $1,499 | 3 (50.0%) | 0 (0.0%) |
| Total | 6 (100.0%) | 0 (0.0%) |
Health & Disability in Kenedy County
Health Insurance Coverage by Age in Kenedy County
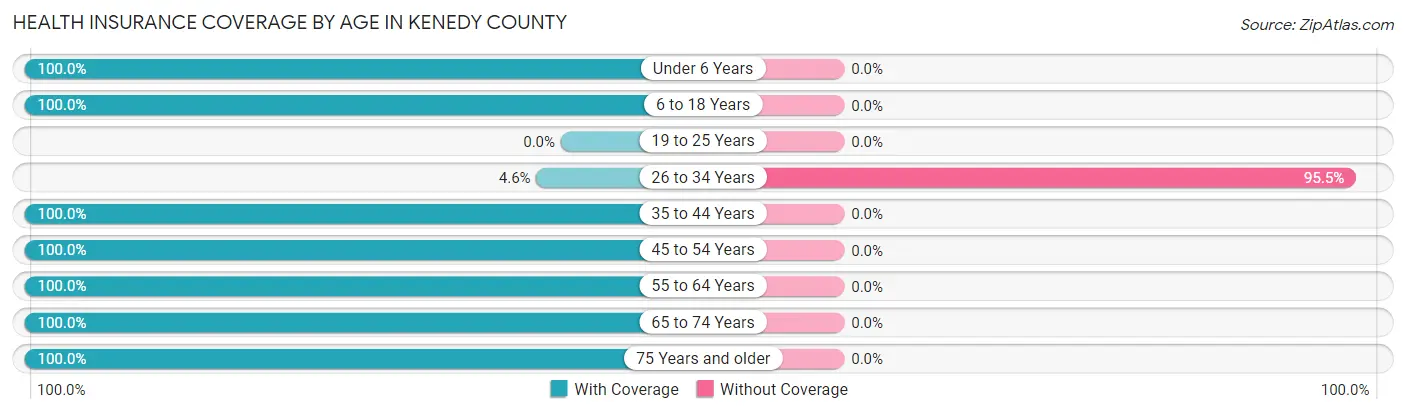
| Age Bracket | With Coverage | Without Coverage |
| Under 6 Years | 28 (100.0%) | 0 (0.0%) |
| 6 to 18 Years | 1 (100.0%) | 0 (0.0%) |
| 19 to 25 Years | 0 (0.0%) | 0 (0.0%) |
| 26 to 34 Years | 1 (4.5%) | 21 (95.5%) |
| 35 to 44 Years | 12 (100.0%) | 0 (0.0%) |
| 45 to 54 Years | 4 (100.0%) | 0 (0.0%) |
| 55 to 64 Years | 7 (100.0%) | 0 (0.0%) |
| 65 to 74 Years | 36 (100.0%) | 0 (0.0%) |
| 75 Years and older | 6 (100.0%) | 0 (0.0%) |
| Total | 95 (81.9%) | 21 (18.1%) |
Health Insurance Coverage by Citizenship Status in Kenedy County
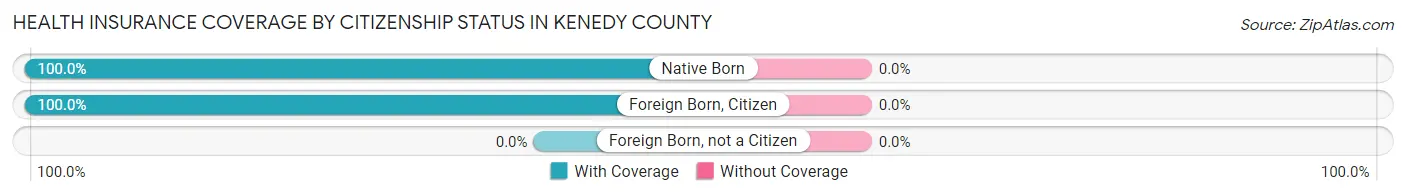
| Citizenship Status | With Coverage | Without Coverage |
| Native Born | 28 (100.0%) | 0 (0.0%) |
| Foreign Born, Citizen | 1 (100.0%) | 0 (0.0%) |
| Foreign Born, not a Citizen | 0 (0.0%) | 0 (0.0%) |
Health Insurance Coverage by Household Income in Kenedy County
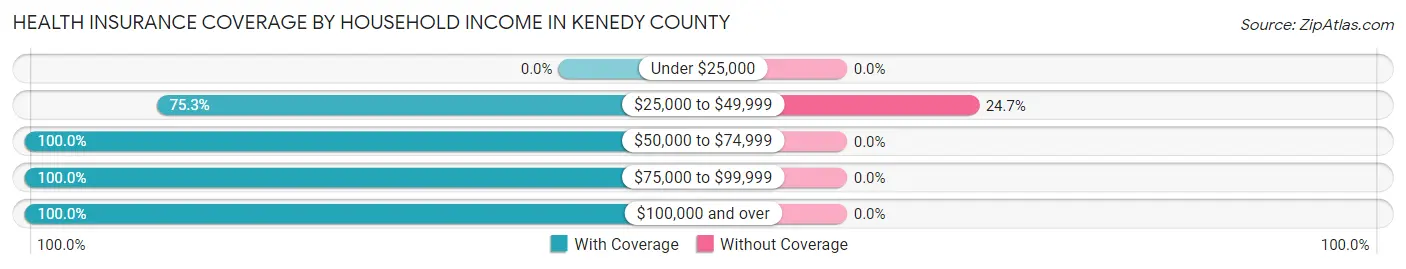
| Household Income | With Coverage | Without Coverage |
| Under $25,000 | 0 (0.0%) | 0 (0.0%) |
| $25,000 to $49,999 | 64 (75.3%) | 21 (24.7%) |
| $50,000 to $74,999 | 8 (100.0%) | 0 (0.0%) |
| $75,000 to $99,999 | 7 (100.0%) | 0 (0.0%) |
| $100,000 and over | 11 (100.0%) | 0 (0.0%) |
Public vs Private Health Insurance Coverage by Age in Kenedy County
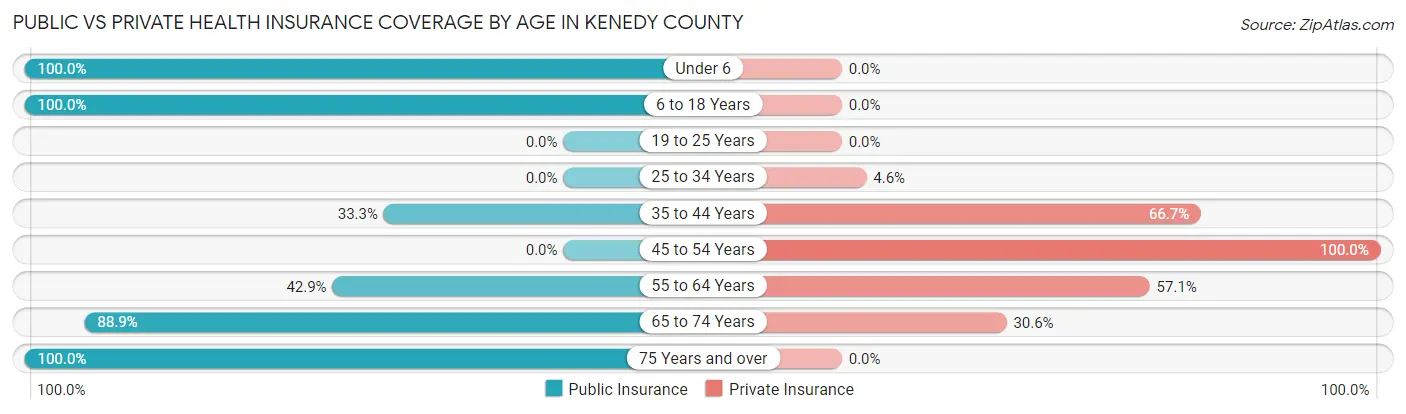
| Age Bracket | Public Insurance | Private Insurance |
| Under 6 | 28 (100.0%) | 0 (0.0%) |
| 6 to 18 Years | 1 (100.0%) | 0 (0.0%) |
| 19 to 25 Years | 0 (0.0%) | 0 (0.0%) |
| 25 to 34 Years | 0 (0.0%) | 1 (4.5%) |
| 35 to 44 Years | 4 (33.3%) | 8 (66.7%) |
| 45 to 54 Years | 0 (0.0%) | 4 (100.0%) |
| 55 to 64 Years | 3 (42.9%) | 4 (57.1%) |
| 65 to 74 Years | 32 (88.9%) | 11 (30.6%) |
| 75 Years and over | 6 (100.0%) | 0 (0.0%) |
| Total | 74 (63.8%) | 28 (24.1%) |
Disability Status by Sex by Age in Kenedy County
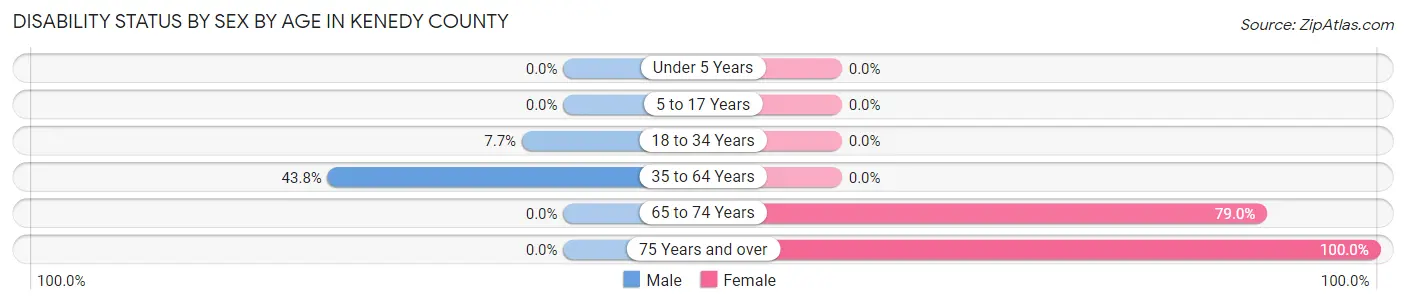
| Age Bracket | Male | Female |
| Under 5 Years | 0 (0.0%) | 0 (0.0%) |
| 5 to 17 Years | 0 (0.0%) | 0 (0.0%) |
| 18 to 34 Years | 1 (7.7%) | 0 (0.0%) |
| 35 to 64 Years | 7 (43.8%) | 0 (0.0%) |
| 65 to 74 Years | 0 (0.0%) | 15 (78.9%) |
| 75 Years and over | 0 (0.0%) | 6 (100.0%) |
Disability Class by Sex by Age in Kenedy County
Disability Class: Hearing Difficulty
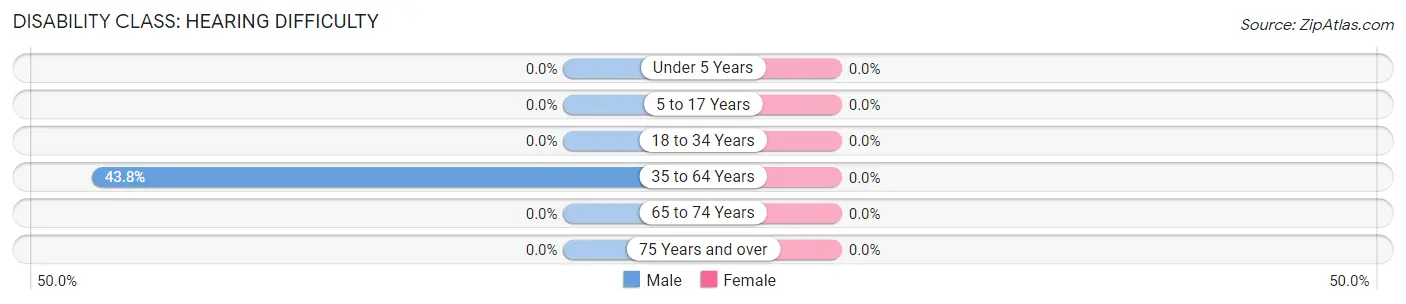
| Age Bracket | Male | Female |
| Under 5 Years | 0 (0.0%) | 0 (0.0%) |
| 5 to 17 Years | 0 (0.0%) | 0 (0.0%) |
| 18 to 34 Years | 0 (0.0%) | 0 (0.0%) |
| 35 to 64 Years | 7 (43.8%) | 0 (0.0%) |
| 65 to 74 Years | 0 (0.0%) | 0 (0.0%) |
| 75 Years and over | 0 (0.0%) | 0 (0.0%) |
Disability Class: Vision Difficulty
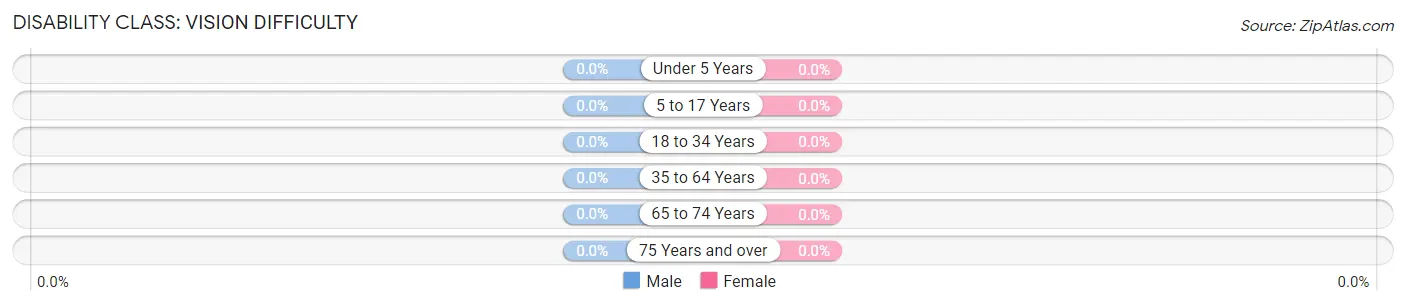
| Age Bracket | Male | Female |
| Under 5 Years | 0 (0.0%) | 0 (0.0%) |
| 5 to 17 Years | 0 (0.0%) | 0 (0.0%) |
| 18 to 34 Years | 0 (0.0%) | 0 (0.0%) |
| 35 to 64 Years | 0 (0.0%) | 0 (0.0%) |
| 65 to 74 Years | 0 (0.0%) | 0 (0.0%) |
| 75 Years and over | 0 (0.0%) | 0 (0.0%) |
Disability Class: Cognitive Difficulty
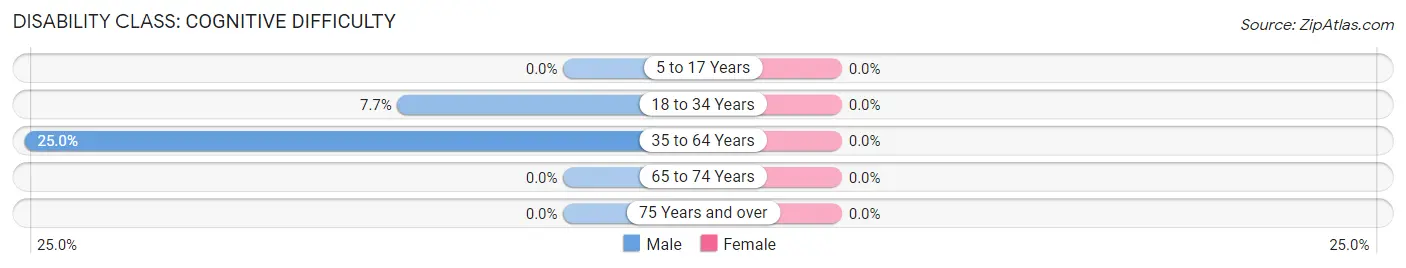
| Age Bracket | Male | Female |
| 5 to 17 Years | 0 (0.0%) | 0 (0.0%) |
| 18 to 34 Years | 1 (7.7%) | 0 (0.0%) |
| 35 to 64 Years | 4 (25.0%) | 0 (0.0%) |
| 65 to 74 Years | 0 (0.0%) | 0 (0.0%) |
| 75 Years and over | 0 (0.0%) | 0 (0.0%) |
Disability Class: Ambulatory Difficulty
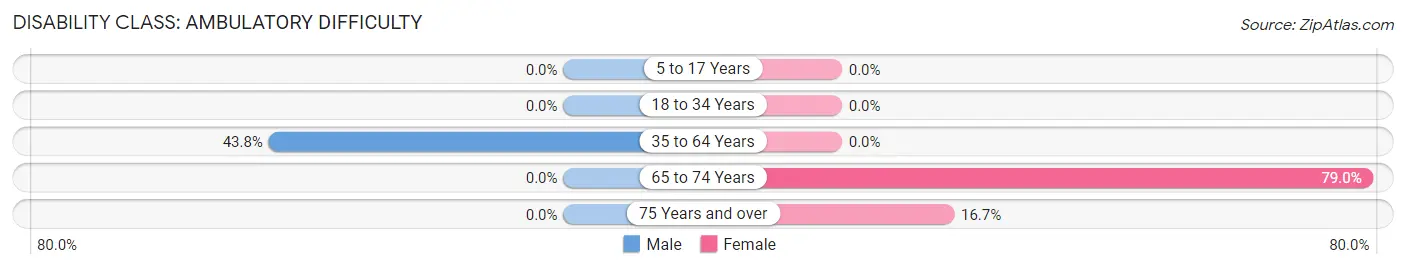
| Age Bracket | Male | Female |
| 5 to 17 Years | 0 (0.0%) | 0 (0.0%) |
| 18 to 34 Years | 0 (0.0%) | 0 (0.0%) |
| 35 to 64 Years | 7 (43.8%) | 0 (0.0%) |
| 65 to 74 Years | 0 (0.0%) | 15 (78.9%) |
| 75 Years and over | 0 (0.0%) | 1 (16.7%) |
Disability Class: Self-Care Difficulty
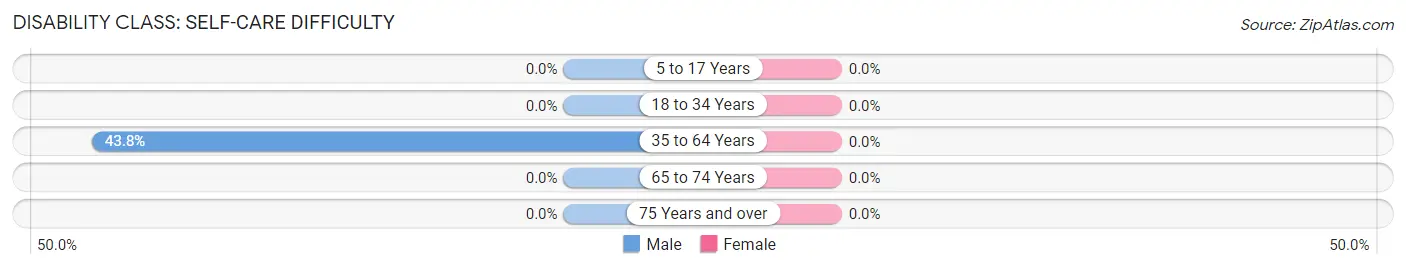
| Age Bracket | Male | Female |
| 5 to 17 Years | 0 (0.0%) | 0 (0.0%) |
| 18 to 34 Years | 0 (0.0%) | 0 (0.0%) |
| 35 to 64 Years | 7 (43.8%) | 0 (0.0%) |
| 65 to 74 Years | 0 (0.0%) | 0 (0.0%) |
| 75 Years and over | 0 (0.0%) | 0 (0.0%) |
Technology Access in Kenedy County
Computing Device Access in Kenedy County
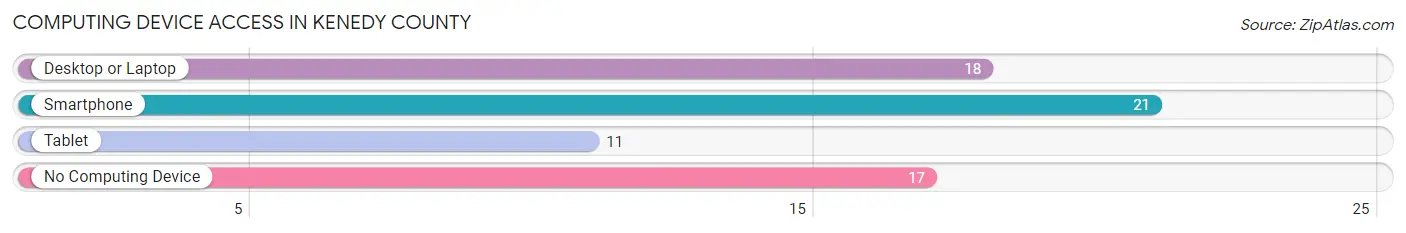
| Device Type | # Households | % Households |
| Desktop or Laptop | 18 | 47.4% |
| Smartphone | 21 | 55.3% |
| Tablet | 11 | 28.9% |
| No Computing Device | 17 | 44.7% |
| Total | 38 | 100.0% |
Internet Access in Kenedy County
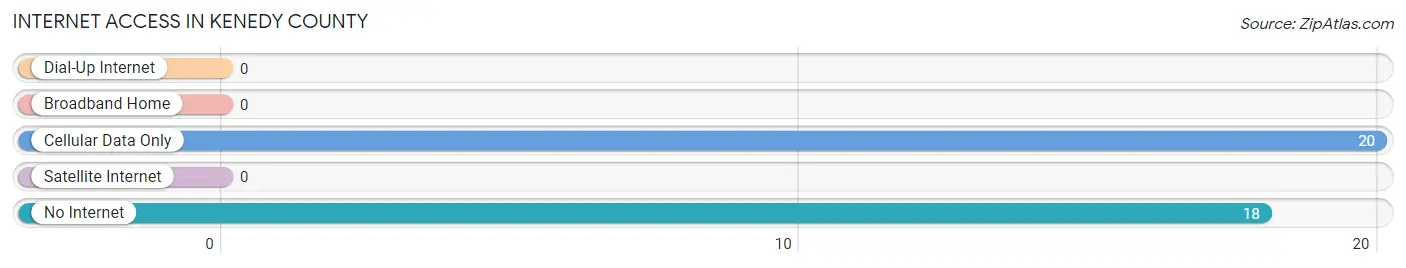
| Internet Type | # Households | % Households |
| Dial-Up Internet | 0 | 0.0% |
| Broadband Home | 0 | 0.0% |
| Cellular Data Only | 20 | 52.6% |
| Satellite Internet | 0 | 0.0% |
| No Internet | 18 | 47.4% |
| Total | 38 | 100.0% |
Kenedy County Summary
Kenedy County is located in the southern part of Texas, in the United States. It is bordered by Kleberg County to the north, Willacy County to the east, and Kenedy County to the south. The county seat is Sarita, and the largest city is Sarita. The county was named after Mifflin Kenedy, a rancher and steamboat operator who owned much of the land in the area.
Geography
Kenedy County is located in the Coastal Plains region of Texas. It is mostly flat, with some rolling hills in the northern part of the county. The terrain is mostly covered in grasslands, with some areas of brush and mesquite. The county is drained by the San Antonio River, which flows through the county from north to south. The climate is semi-arid, with hot summers and mild winters.
The total area of Kenedy County is 890 square miles, of which 887 square miles is land and 3 square miles is water. The county is located in the Central Time Zone.
Demographics
As of the 2010 census, the population of Kenedy County was 416, with a population density of 0.5 people per square mile. The racial makeup of the county was 79.3% White, 0.2% African American, 0.2% Native American, 0.2% Asian, 0.1% Pacific Islander, 19.2% from other races, and 0.9% from two or more races. Hispanic or Latino of any race were 57.3% of the population.
The median income for a household in the county was $25,938, and the median income for a family was $30,938. The per capita income for the county was $14,938. About 24.3% of the population was below the poverty line.
Economy
Kenedy County is primarily an agricultural county, with the main crops being cotton, sorghum, and corn. The county is also home to several oil and gas fields, which provide jobs for many of the county's residents. The county is also home to several wind farms, which provide renewable energy to the area.
The county is served by the Kenedy County Airport, which provides air service to the area. The county is also served by several highways, including US Highway 77, US Highway 77 Alternate, and State Highway 285.
Kenedy County is home to several tourist attractions, including the Kenedy County Historical Museum, the Kenedy County Courthouse, and the Kenedy County Fairgrounds. The county is also home to several parks, including the Kenedy County State Park, the Kenedy County Wildlife Management Area, and the Kenedy County Nature Preserve.
Conclusion
Kenedy County is a rural county located in the southern part of Texas. It is mostly flat, with some rolling hills in the northern part of the county. The county is primarily agricultural, with the main crops being cotton, sorghum, and corn. The county is also home to several oil and gas fields, wind farms, and tourist attractions. The county is served by the Kenedy County Airport, several highways, and several parks. The population of the county is 416, with a median income of $25,938.
Common Questions
What is Per Capita Income in Kenedy County?
Per Capita income in Kenedy County is $21,822.
What is the Median Family Income in Kenedy County?
Median Family Income in Kenedy County is $45,455.
What is the Median Household income in Kenedy County?
Median Household Income in Kenedy County is $45,455.
What is Inequality or Gini Index in Kenedy County?
Inequality or Gini Index in Kenedy County is 0.30.
What is the Total Population of Kenedy County?
Total Population of Kenedy County is 116.
What is the Total Male Population of Kenedy County?
Total Male Population of Kenedy County is 69.
What is the Total Female Population of Kenedy County?
Total Female Population of Kenedy County is 47.
What is the Ratio of Males per 100 Females in Kenedy County?
There are 146.81 Males per 100 Females in Kenedy County.
What is the Ratio of Females per 100 Males in Kenedy County?
There are 68.12 Females per 100 Males in Kenedy County.
What is the Median Population Age in Kenedy County?
Median Population Age in Kenedy County is 39.9 Years.
What is the Average Family Size in Kenedy County
Average Family Size in Kenedy County is 2.9 People.
What is the Average Household Size in Kenedy County
Average Household Size in Kenedy County is 2.9 People.
How Large is the Labor Force in Kenedy County?
There are 46 People in the Labor Forcein in Kenedy County.
What is the Percentage of People in the Labor Force in Kenedy County?
52.3% of People are in the Labor Force in Kenedy County.