Kendall County, TX Map & Demographics
Kendall County Map
Kendall County Overview
$56,063
PER CAPITA INCOME
$124,690
AVG FAMILY INCOME
$104,196
AVG HOUSEHOLD INCOME
42.7%
WAGE / INCOME GAP [ % ]
57.3¢/ $1
WAGE / INCOME GAP [ $ ]
$15,834
FAMILY INCOME DEFICIT
0.48
INEQUALITY / GINI INDEX
45,376
TOTAL POPULATION
22,351
MALE POPULATION
23,025
FEMALE POPULATION
97.07
MALES / 100 FEMALES
103.02
FEMALES / 100 MALES
42.6
MEDIAN AGE
3.1
AVG FAMILY SIZE
2.7
AVG HOUSEHOLD SIZE
22,509
LABOR FORCE [ PEOPLE ]
61.8%
PERCENT IN LABOR FORCE
4.8%
UNEMPLOYMENT RATE
Kendall County Area Codes
Income in Kendall County
Income Overview in Kendall County
Per Capita Income in Kendall County is $56,063, while median incomes of families and households are $124,690 and $104,196 respectively.
| Characteristic | Number | Measure |
| Per Capita Income | 45,376 | $56,063 |
| Median Family Income | 12,812 | $124,690 |
| Mean Family Income | 12,812 | $170,626 |
| Median Household Income | 16,763 | $104,196 |
| Mean Household Income | 16,763 | $152,380 |
| Income Deficit | 12,812 | $15,834 |
| Wage / Income Gap (%) | 45,376 | 42.72% |
| Wage / Income Gap ($) | 45,376 | 57.28¢ per $1 |
| Gini / Inequality Index | 45,376 | 0.48 |
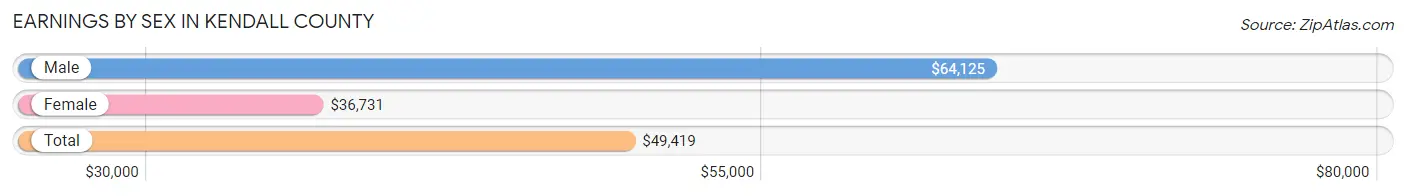
Earnings by Sex in Kendall County
Average Earnings in Kendall County are $49,419, $64,125 for men and $36,731 for women, a difference of 42.7%.
| Sex | Number | Average Earnings |
| Male | 12,858 (54.2%) | $64,125 |
| Female | 10,856 (45.8%) | $36,731 |
| Total | 23,714 (100.0%) | $49,419 |
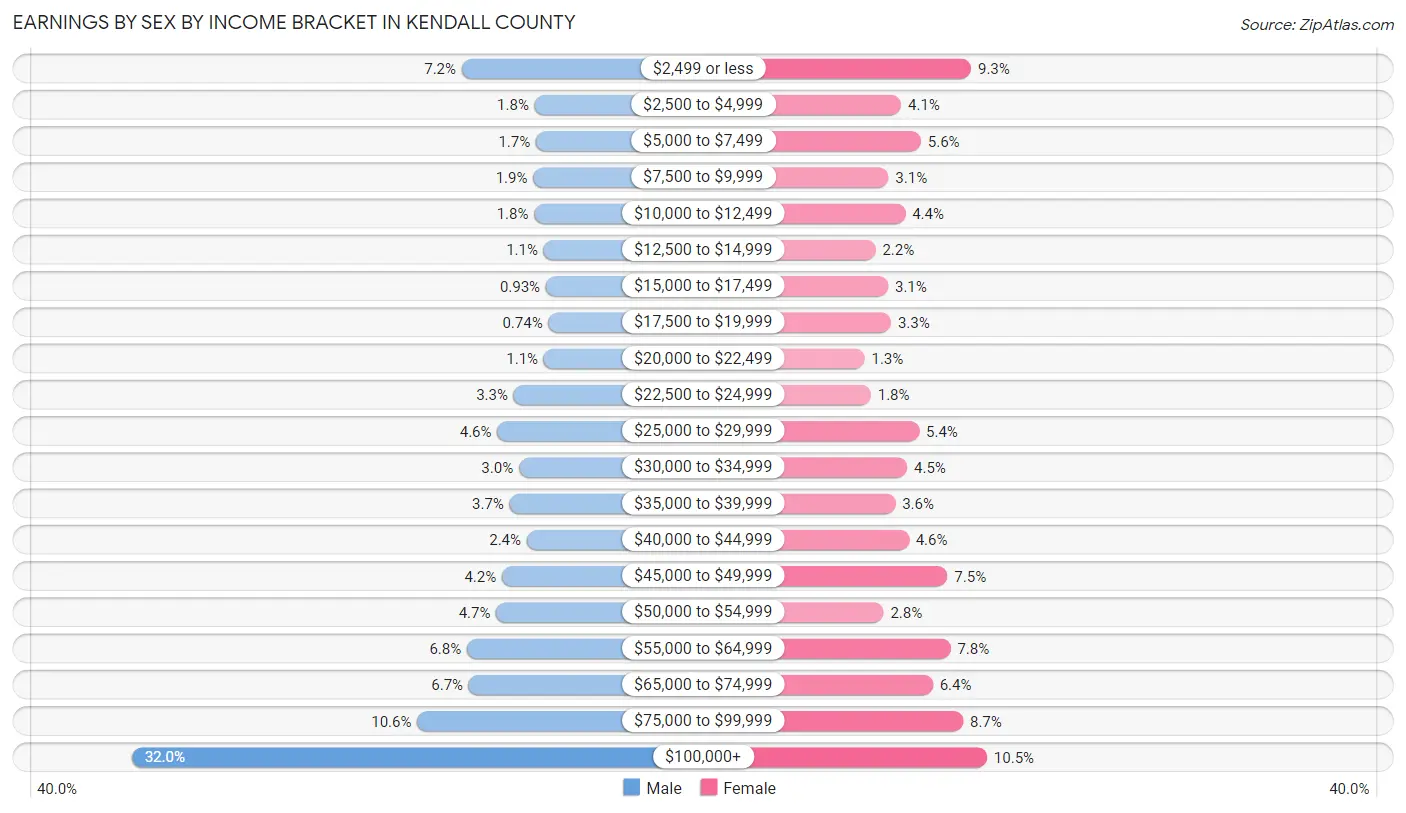
Earnings by Sex by Income Bracket in Kendall County
The most common earnings brackets in Kendall County are $100,000+ for men (4,111 | 32.0%) and $100,000+ for women (1,140 | 10.5%).
| Income | Male | Female |
| $2,499 or less | 930 (7.2%) | 1,011 (9.3%) |
| $2,500 to $4,999 | 228 (1.8%) | 442 (4.1%) |
| $5,000 to $7,499 | 215 (1.7%) | 602 (5.6%) |
| $7,500 to $9,999 | 242 (1.9%) | 339 (3.1%) |
| $10,000 to $12,499 | 231 (1.8%) | 475 (4.4%) |
| $12,500 to $14,999 | 140 (1.1%) | 233 (2.1%) |
| $15,000 to $17,499 | 119 (0.9%) | 335 (3.1%) |
| $17,500 to $19,999 | 95 (0.7%) | 359 (3.3%) |
| $20,000 to $22,499 | 139 (1.1%) | 144 (1.3%) |
| $22,500 to $24,999 | 430 (3.3%) | 195 (1.8%) |
| $25,000 to $29,999 | 587 (4.6%) | 588 (5.4%) |
| $30,000 to $34,999 | 379 (2.9%) | 491 (4.5%) |
| $35,000 to $39,999 | 469 (3.6%) | 394 (3.6%) |
| $40,000 to $44,999 | 304 (2.4%) | 504 (4.6%) |
| $45,000 to $49,999 | 542 (4.2%) | 818 (7.5%) |
| $50,000 to $54,999 | 598 (4.6%) | 298 (2.8%) |
| $55,000 to $64,999 | 879 (6.8%) | 843 (7.8%) |
| $65,000 to $74,999 | 861 (6.7%) | 699 (6.4%) |
| $75,000 to $99,999 | 1,359 (10.6%) | 946 (8.7%) |
| $100,000+ | 4,111 (32.0%) | 1,140 (10.5%) |
| Total | 12,858 (100.0%) | 10,856 (100.0%) |
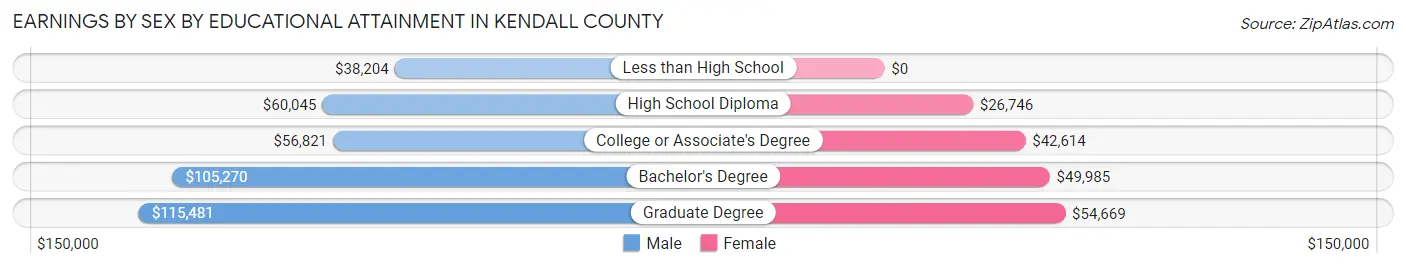
Earnings by Sex by Educational Attainment in Kendall County
Average earnings in Kendall County are $73,166 for men and $43,103 for women, a difference of 41.1%. Men with an educational attainment of graduate degree enjoy the highest average annual earnings of $115,481, while those with less than high school education earn the least with $38,204. Women with an educational attainment of graduate degree earn the most with the average annual earnings of $54,669, while those with high school diploma education have the smallest earnings of $26,746.
| Educational Attainment | Male Income | Female Income |
| Less than High School | $38,204 | $0 |
| High School Diploma | $60,045 | $26,746 |
| College or Associate's Degree | $56,821 | $42,614 |
| Bachelor's Degree | $105,270 | $49,985 |
| Graduate Degree | $115,481 | $54,669 |
| Total | $73,166 | $43,103 |
Family Income in Kendall County
Family Income Brackets in Kendall County
According to the Kendall County family income data, there are 3,395 families falling into the $200,000+ income range, which is the most common income bracket and makes up 26.5% of all families. Conversely, the $10,000 to $14,999 income bracket is the least frequent group with only 38 families (0.3%) belonging to this category.
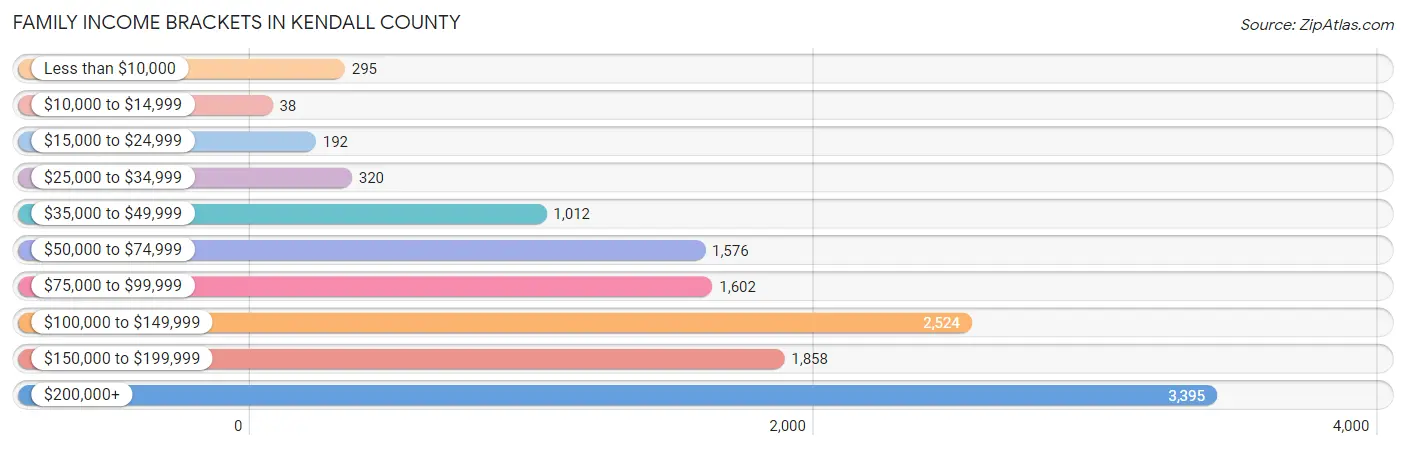
| Income Bracket | # Families | % Families |
| Less than $10,000 | 295 | 2.3% |
| $10,000 to $14,999 | 38 | 0.3% |
| $15,000 to $24,999 | 192 | 1.5% |
| $25,000 to $34,999 | 320 | 2.5% |
| $35,000 to $49,999 | 1,012 | 7.9% |
| $50,000 to $74,999 | 1,576 | 12.3% |
| $75,000 to $99,999 | 1,602 | 12.5% |
| $100,000 to $149,999 | 2,524 | 19.7% |
| $150,000 to $199,999 | 1,858 | 14.5% |
| $200,000+ | 3,395 | 26.5% |
Family Income by Famaliy Size in Kendall County
4-person families (2,272 | 17.7%) account for the highest median family income in Kendall County with $168,070 per family, while 2-person families (6,132 | 47.9%) have the highest median income of $58,062 per family member.
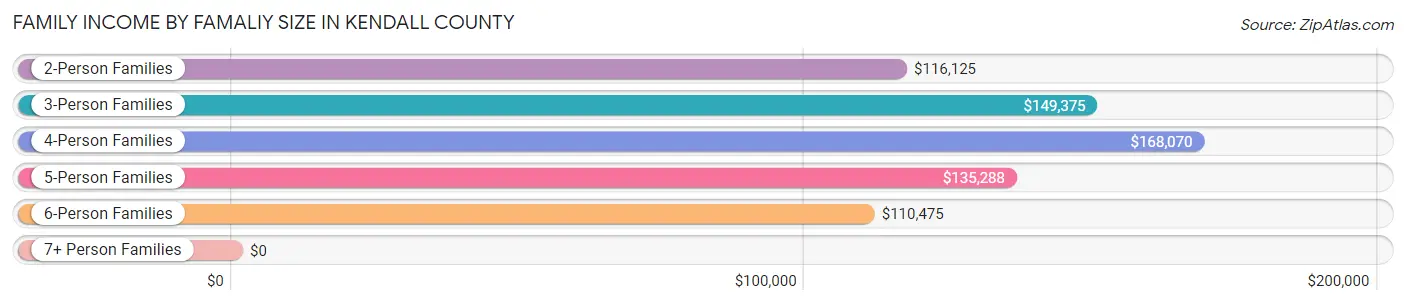
| Income Bracket | # Families | Median Income |
| 2-Person Families | 6,132 (47.9%) | $116,125 |
| 3-Person Families | 2,337 (18.2%) | $149,375 |
| 4-Person Families | 2,272 (17.7%) | $168,070 |
| 5-Person Families | 1,361 (10.6%) | $135,288 |
| 6-Person Families | 441 (3.4%) | $110,475 |
| 7+ Person Families | 269 (2.1%) | $0 |
| Total | 12,812 (100.0%) | $124,690 |
Family Income by Number of Earners in Kendall County
The median family income in Kendall County is $124,690, with families comprising 3+ earners (1,312) having the highest median family income of $171,061, while families with no earners (2,119) have the lowest median family income of $70,625, accounting for 10.2% and 16.5% of families, respectively.
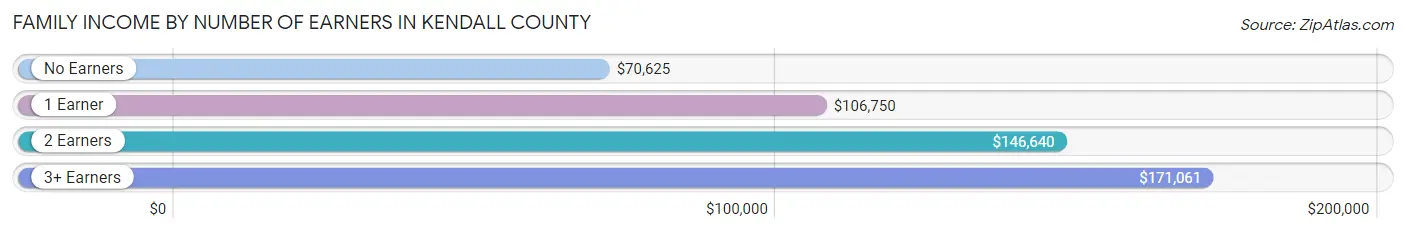
| Number of Earners | # Families | Median Income |
| No Earners | 2,119 (16.5%) | $70,625 |
| 1 Earner | 3,670 (28.6%) | $106,750 |
| 2 Earners | 5,711 (44.6%) | $146,640 |
| 3+ Earners | 1,312 (10.2%) | $171,061 |
| Total | 12,812 (100.0%) | $124,690 |
Household Income in Kendall County
Household Income Brackets in Kendall County
With 3,705 households falling in the category, the $200,000+ income range is the most frequent in Kendall County, accounting for 22.1% of all households. In contrast, only 201 households (1.2%) fall into the $10,000 to $14,999 income bracket, making it the least populous group.
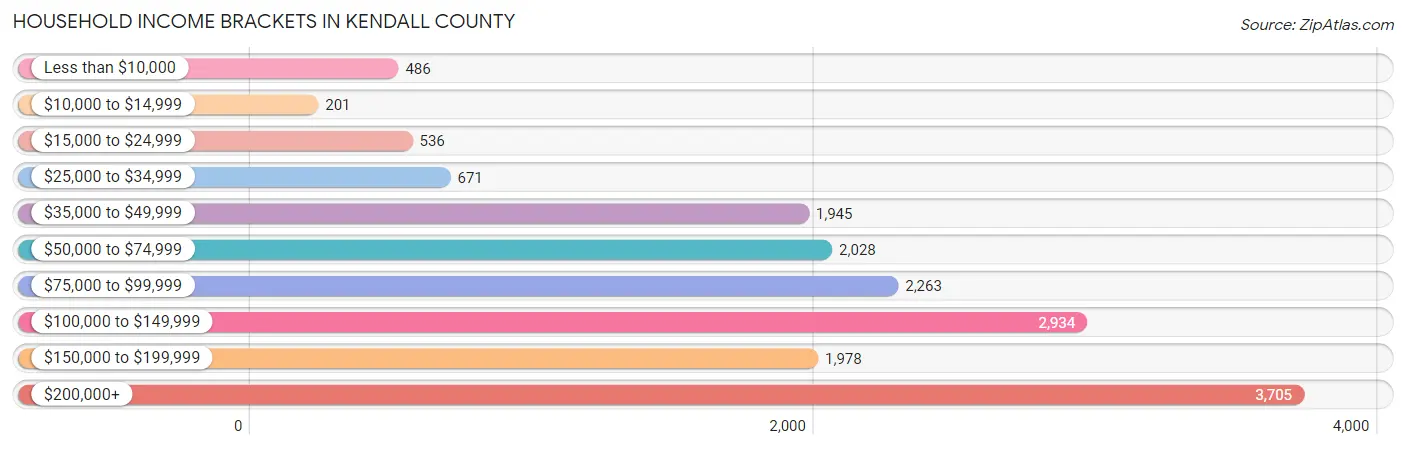
| Income Bracket | # Households | % Households |
| Less than $10,000 | 486 | 2.9% |
| $10,000 to $14,999 | 201 | 1.2% |
| $15,000 to $24,999 | 536 | 3.2% |
| $25,000 to $34,999 | 671 | 4.0% |
| $35,000 to $49,999 | 1,945 | 11.6% |
| $50,000 to $74,999 | 2,028 | 12.1% |
| $75,000 to $99,999 | 2,263 | 13.5% |
| $100,000 to $149,999 | 2,934 | 17.5% |
| $150,000 to $199,999 | 1,978 | 11.8% |
| $200,000+ | 3,705 | 22.1% |
Household Income by Householder Age in Kendall County
The median household income in Kendall County is $104,196, with the highest median household income of $133,187 found in the 45 to 64 years age bracket for the primary householder. A total of 6,758 households (40.3%) fall into this category. Meanwhile, the 15 to 24 years age bracket for the primary householder has the lowest median household income of $40,278, with 150 households (0.9%) in this group.
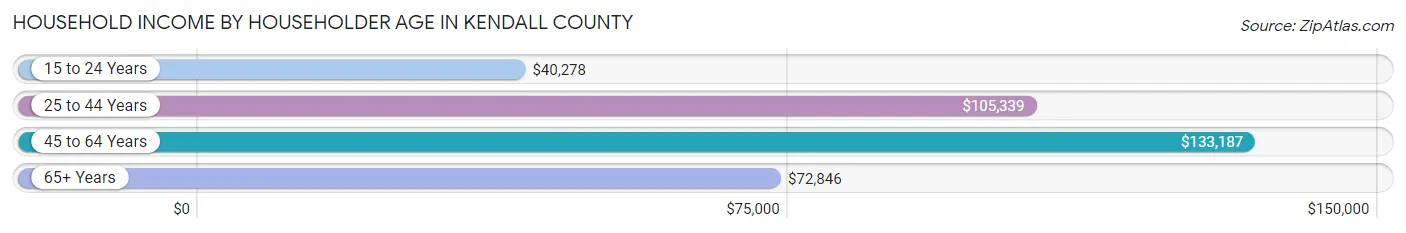
| Income Bracket | # Households | Median Income |
| 15 to 24 Years | 150 (0.9%) | $40,278 |
| 25 to 44 Years | 4,687 (28.0%) | $105,339 |
| 45 to 64 Years | 6,758 (40.3%) | $133,187 |
| 65+ Years | 5,168 (30.8%) | $72,846 |
| Total | 16,763 (100.0%) | $104,196 |
Poverty in Kendall County
Income Below Poverty by Sex and Age in Kendall County
With 4.2% poverty level for males and 5.9% for females among the residents of Kendall County, 5 year old males and 15 year old females are the most vulnerable to poverty, with 64 males (26.3%) and 56 females (15.3%) in their respective age groups living below the poverty level.
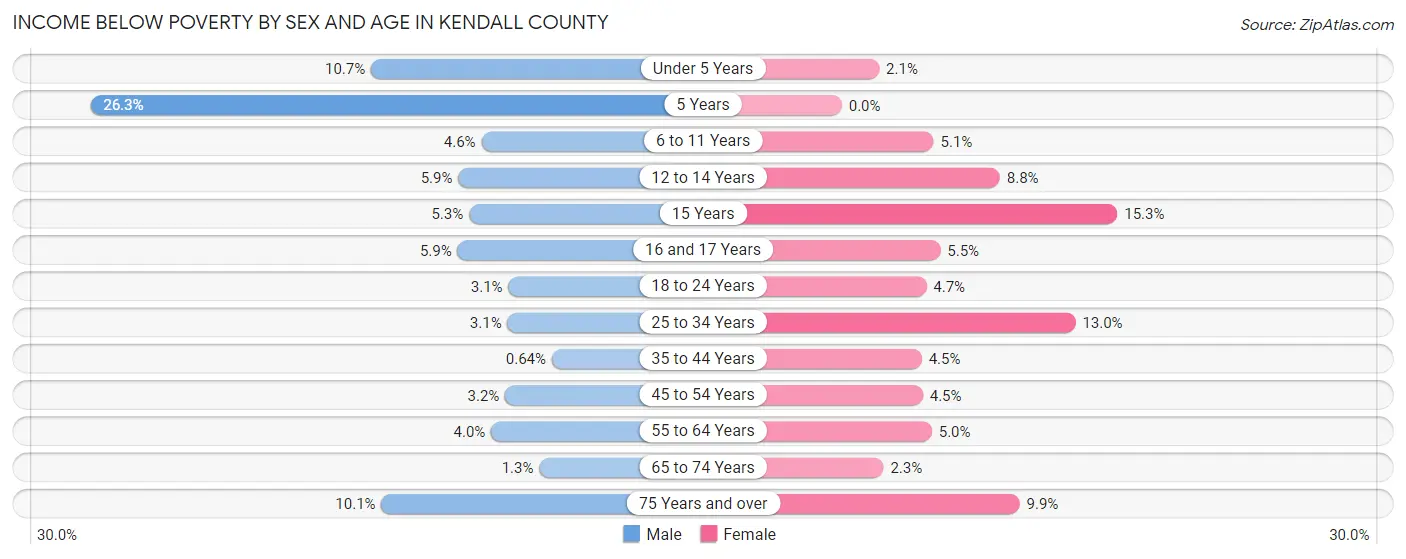
| Age Bracket | Male | Female |
| Under 5 Years | 115 (10.7%) | 20 (2.1%) |
| 5 Years | 64 (26.3%) | 0 (0.0%) |
| 6 to 11 Years | 82 (4.6%) | 101 (5.1%) |
| 12 to 14 Years | 56 (5.9%) | 80 (8.8%) |
| 15 Years | 20 (5.2%) | 56 (15.3%) |
| 16 and 17 Years | 48 (5.9%) | 28 (5.5%) |
| 18 to 24 Years | 59 (3.1%) | 74 (4.7%) |
| 25 to 34 Years | 64 (3.1%) | 288 (13.0%) |
| 35 to 44 Years | 18 (0.6%) | 140 (4.4%) |
| 45 to 54 Years | 96 (3.2%) | 138 (4.5%) |
| 55 to 64 Years | 123 (4.0%) | 160 (5.0%) |
| 65 to 74 Years | 32 (1.3%) | 61 (2.3%) |
| 75 Years and over | 159 (10.1%) | 198 (9.9%) |
| Total | 936 (4.2%) | 1,344 (5.9%) |
Income Above Poverty by Sex and Age in Kendall County
According to the poverty statistics in Kendall County, males aged 35 to 44 years and females aged 5 years are the age groups that are most secure financially, with 99.4% of males and 100.0% of females in these age groups living above the poverty line.
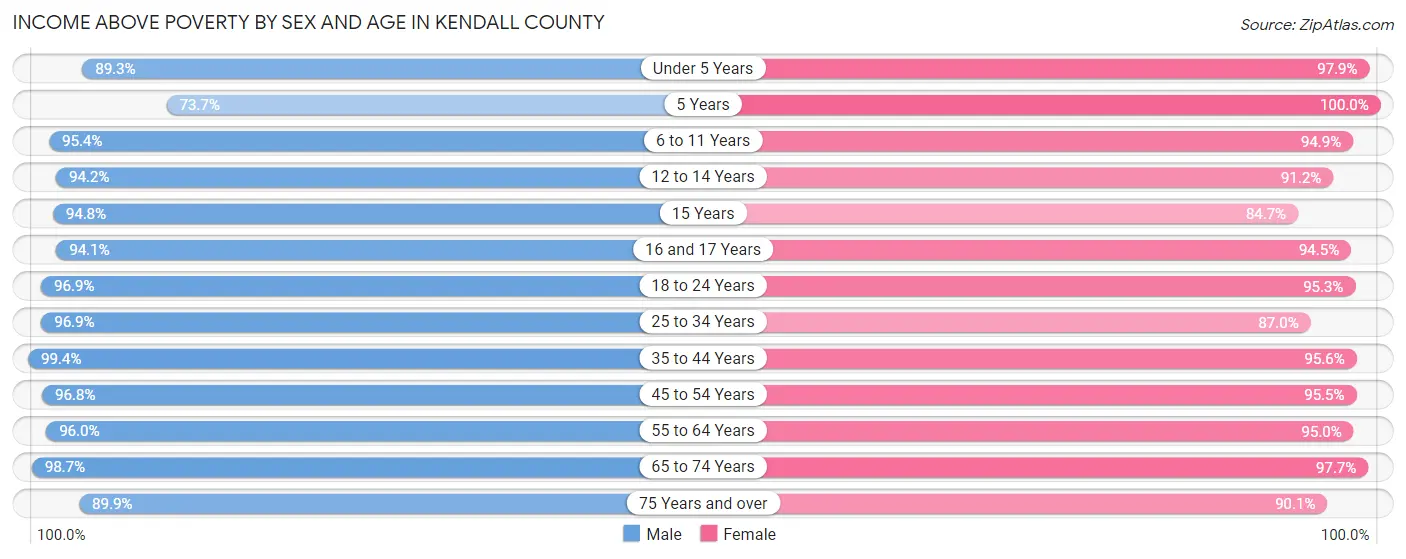
| Age Bracket | Male | Female |
| Under 5 Years | 959 (89.3%) | 942 (97.9%) |
| 5 Years | 179 (73.7%) | 152 (100.0%) |
| 6 to 11 Years | 1,718 (95.4%) | 1,876 (94.9%) |
| 12 to 14 Years | 901 (94.2%) | 829 (91.2%) |
| 15 Years | 361 (94.8%) | 309 (84.7%) |
| 16 and 17 Years | 767 (94.1%) | 482 (94.5%) |
| 18 to 24 Years | 1,869 (96.9%) | 1,498 (95.3%) |
| 25 to 34 Years | 1,997 (96.9%) | 1,925 (87.0%) |
| 35 to 44 Years | 2,808 (99.4%) | 3,003 (95.6%) |
| 45 to 54 Years | 2,871 (96.8%) | 2,923 (95.5%) |
| 55 to 64 Years | 2,939 (96.0%) | 3,035 (95.0%) |
| 65 to 74 Years | 2,362 (98.7%) | 2,564 (97.7%) |
| 75 Years and over | 1,411 (89.9%) | 1,802 (90.1%) |
| Total | 21,142 (95.8%) | 21,340 (94.1%) |
Income Below Poverty Among Married-Couple Families in Kendall County
The poverty statistics for married-couple families in Kendall County show that 1.9% or 204 of the total 10,994 families live below the poverty line. Families with 3 or 4 children have the highest poverty rate of 3.8%, comprising of 43 families. On the other hand, families with 5 or more children have the lowest poverty rate of 0.0%, which includes 0 families.
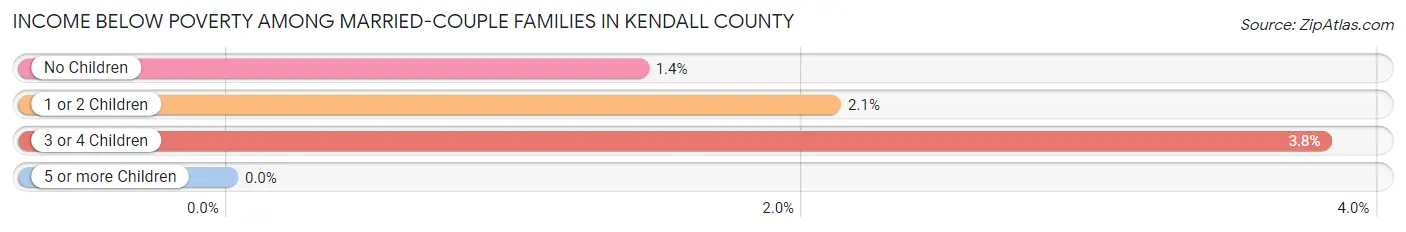
| Children | Above Poverty | Below Poverty |
| No Children | 6,399 (98.6%) | 93 (1.4%) |
| 1 or 2 Children | 3,168 (97.9%) | 68 (2.1%) |
| 3 or 4 Children | 1,087 (96.2%) | 43 (3.8%) |
| 5 or more Children | 136 (100.0%) | 0 (0.0%) |
| Total | 10,790 (98.1%) | 204 (1.9%) |
Income Below Poverty Among Single-Parent Households in Kendall County
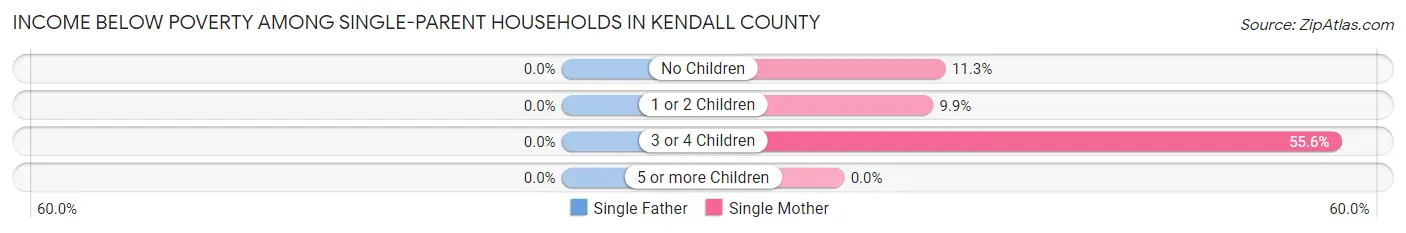
| Children | Single Father | Single Mother |
| No Children | 0 (0.0%) | 42 (11.3%) |
| 1 or 2 Children | 0 (0.0%) | 58 (9.9%) |
| 3 or 4 Children | 0 (0.0%) | 134 (55.6%) |
| 5 or more Children | 0 (0.0%) | 0 (0.0%) |
| Total | 0 (0.0%) | 234 (19.6%) |
Income Below Poverty Among Married-Couple vs Single-Parent Households in Kendall County
The poverty data for Kendall County shows that 204 of the married-couple family households (1.9%) and 234 of the single-parent households (12.9%) are living below the poverty level. Within the married-couple family households, those with 3 or 4 children have the highest poverty rate, with 43 households (3.8%) falling below the poverty line. Among the single-parent households, those with 3 or 4 children have the highest poverty rate, with 134 household (46.9%) living below poverty.
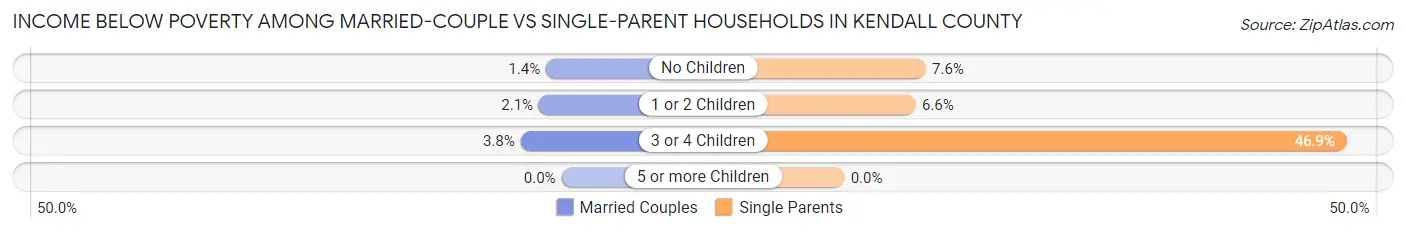
| Children | Married-Couple Families | Single-Parent Households |
| No Children | 93 (1.4%) | 42 (7.6%) |
| 1 or 2 Children | 68 (2.1%) | 58 (6.6%) |
| 3 or 4 Children | 43 (3.8%) | 134 (46.9%) |
| 5 or more Children | 0 (0.0%) | 0 (0.0%) |
| Total | 204 (1.9%) | 234 (12.9%) |
Race in Kendall County
The most populous races in Kendall County are White / Caucasian (36,565 | 80.6%), Hispanic or Latino (11,365 | 25.1%), and Two or more Races (4,993 | 11.0%).
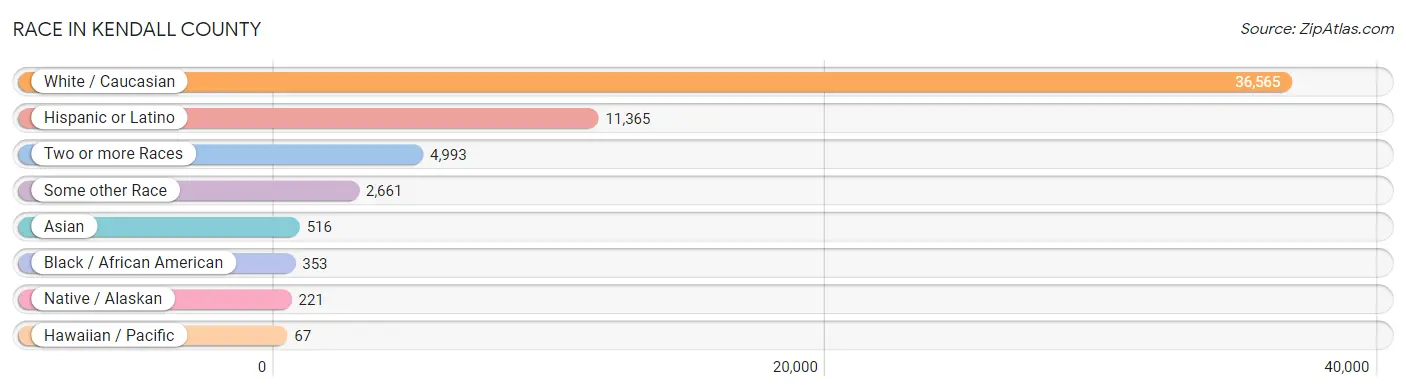
| Race | # Population | % Population |
| Asian | 516 | 1.1% |
| Black / African American | 353 | 0.8% |
| Hawaiian / Pacific | 67 | 0.2% |
| Hispanic or Latino | 11,365 | 25.1% |
| Native / Alaskan | 221 | 0.5% |
| White / Caucasian | 36,565 | 80.6% |
| Two or more Races | 4,993 | 11.0% |
| Some other Race | 2,661 | 5.9% |
| Total | 45,376 | 100.0% |
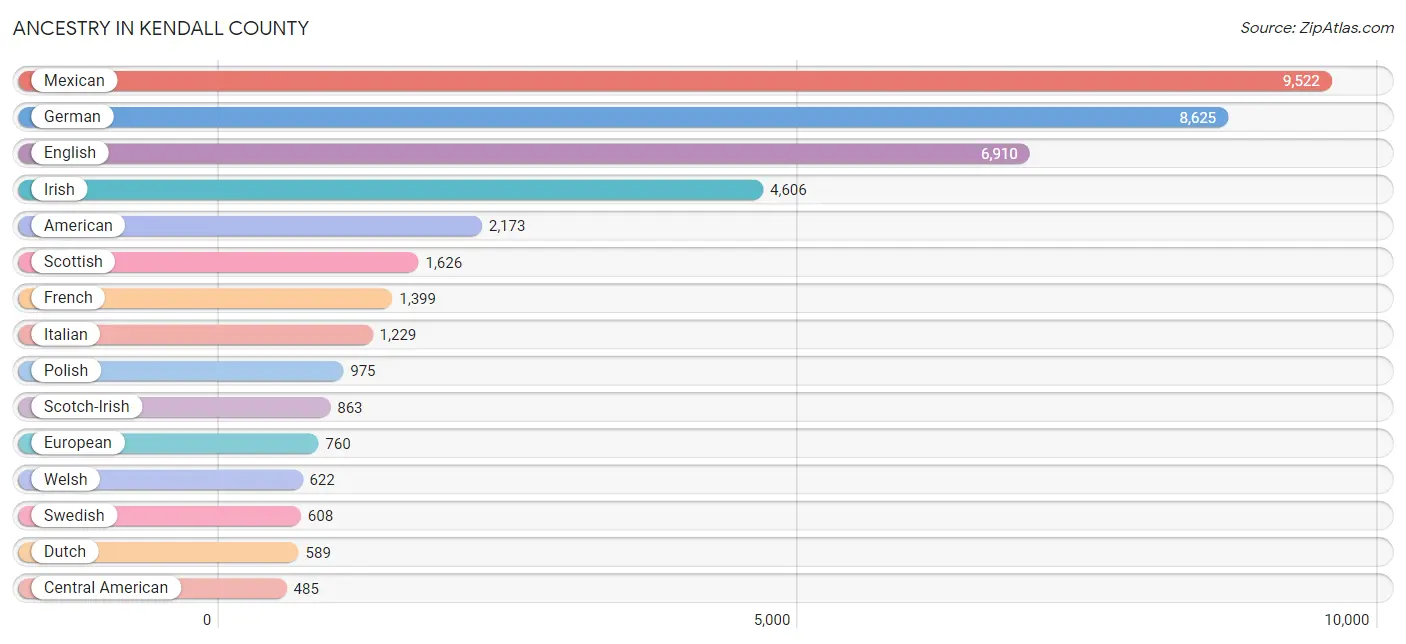
Ancestry in Kendall County
The most populous ancestries reported in Kendall County are Mexican (9,522 | 21.0%), German (8,625 | 19.0%), English (6,910 | 15.2%), Irish (4,606 | 10.2%), and American (2,173 | 4.8%), together accounting for 70.2% of all Kendall County residents.
| Ancestry | # Population | % Population |
| African | 3 | 0.0% |
| Alsatian | 26 | 0.1% |
| American | 2,173 | 4.8% |
| Apache | 116 | 0.3% |
| Arab | 410 | 0.9% |
| Argentinean | 26 | 0.1% |
| Armenian | 30 | 0.1% |
| Austrian | 61 | 0.1% |
| Belgian | 39 | 0.1% |
| Bhutanese | 58 | 0.1% |
| British | 383 | 0.8% |
| Bulgarian | 17 | 0.0% |
| Burmese | 195 | 0.4% |
| Canadian | 58 | 0.1% |
| Celtic | 64 | 0.1% |
| Central American | 485 | 1.1% |
| Central American Indian | 64 | 0.1% |
| Cherokee | 215 | 0.5% |
| Chickasaw | 15 | 0.0% |
| Chippewa | 83 | 0.2% |
| Choctaw | 53 | 0.1% |
| Colombian | 48 | 0.1% |
| Cree | 19 | 0.0% |
| Creek | 10 | 0.0% |
| Croatian | 22 | 0.1% |
| Cuban | 91 | 0.2% |
| Czech | 362 | 0.8% |
| Czechoslovakian | 203 | 0.4% |
| Danish | 133 | 0.3% |
| Dutch | 589 | 1.3% |
| Eastern European | 206 | 0.4% |
| Ecuadorian | 31 | 0.1% |
| Egyptian | 51 | 0.1% |
| English | 6,910 | 15.2% |
| Estonian | 7 | 0.0% |
| European | 760 | 1.7% |
| Finnish | 167 | 0.4% |
| French | 1,399 | 3.1% |
| French Canadian | 60 | 0.1% |
| German | 8,625 | 19.0% |
| Greek | 98 | 0.2% |
| Guatemalan | 3 | 0.0% |
| Honduran | 260 | 0.6% |
| Hungarian | 19 | 0.0% |
| Indian (Asian) | 383 | 0.8% |
| Irish | 4,606 | 10.2% |
| Italian | 1,229 | 2.7% |
| Jordanian | 58 | 0.1% |
| Korean | 325 | 0.7% |
| Latvian | 6 | 0.0% |
| Lebanese | 134 | 0.3% |
| Lithuanian | 20 | 0.0% |
| Mexican | 9,522 | 21.0% |
| Native Hawaiian | 140 | 0.3% |
| Navajo | 25 | 0.1% |
| Nicaraguan | 19 | 0.0% |
| Nigerian | 14 | 0.0% |
| Northern European | 94 | 0.2% |
| Norwegian | 221 | 0.5% |
| Osage | 25 | 0.1% |
| Ottawa | 83 | 0.2% |
| Paiute | 6 | 0.0% |
| Pakistani | 46 | 0.1% |
| Palestinian | 74 | 0.2% |
| Polish | 975 | 2.1% |
| Portuguese | 237 | 0.5% |
| Potawatomi | 14 | 0.0% |
| Puerto Rican | 211 | 0.5% |
| Romanian | 17 | 0.0% |
| Russian | 101 | 0.2% |
| Salvadoran | 203 | 0.4% |
| Samoan | 38 | 0.1% |
| Scandinavian | 186 | 0.4% |
| Scotch-Irish | 863 | 1.9% |
| Scottish | 1,626 | 3.6% |
| Serbian | 23 | 0.1% |
| Slavic | 90 | 0.2% |
| Slovak | 21 | 0.1% |
| South African | 50 | 0.1% |
| South American | 137 | 0.3% |
| Spaniard | 148 | 0.3% |
| Spanish | 418 | 0.9% |
| Spanish American | 15 | 0.0% |
| Sri Lankan | 10 | 0.0% |
| Subsaharan African | 67 | 0.2% |
| Swedish | 608 | 1.3% |
| Swiss | 265 | 0.6% |
| Syrian | 135 | 0.3% |
| Thai | 118 | 0.3% |
| Ukrainian | 127 | 0.3% |
| Uruguayan | 26 | 0.1% |
| Venezuelan | 6 | 0.0% |
| Welsh | 622 | 1.4% |
| West Indian | 3 | 0.0% |
| Yaqui | 10 | 0.0% | View All 95 Rows |
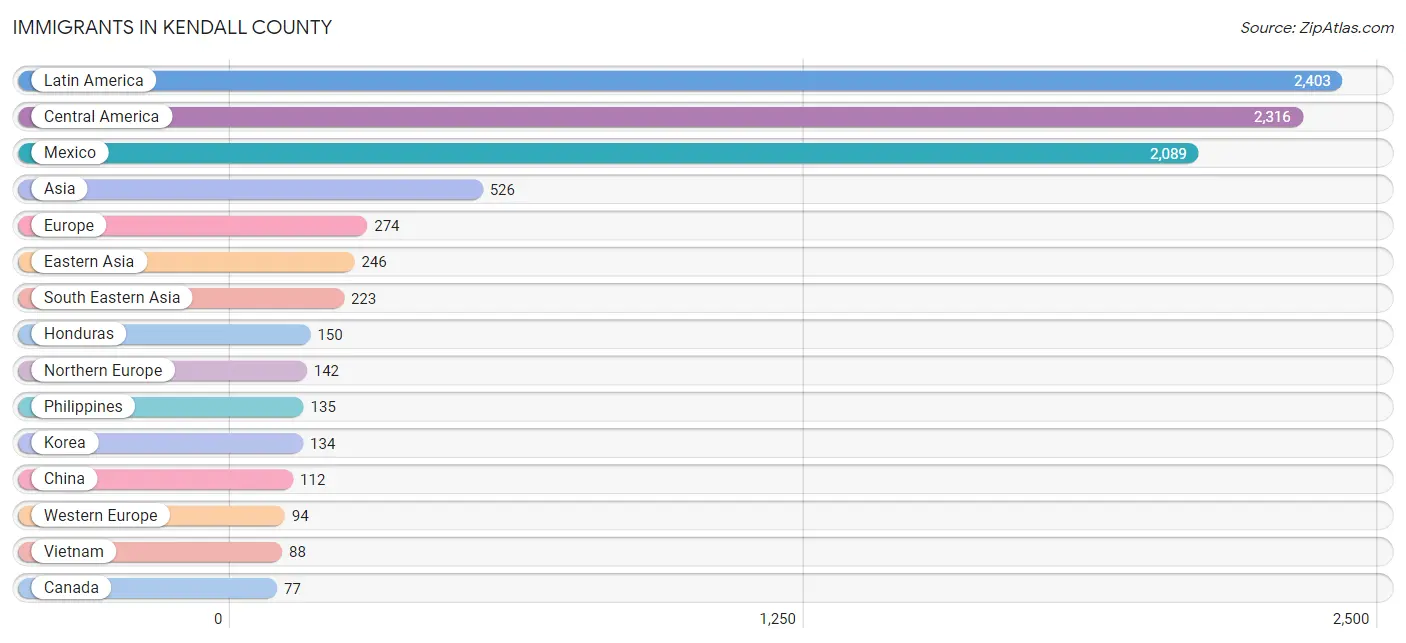
Immigrants in Kendall County
The most numerous immigrant groups reported in Kendall County came from Latin America (2,403 | 5.3%), Central America (2,316 | 5.1%), Mexico (2,089 | 4.6%), Asia (526 | 1.2%), and Europe (274 | 0.6%), together accounting for 16.8% of all Kendall County residents.
| Immigration Origin | # Population | % Population |
| Africa | 57 | 0.1% |
| Asia | 526 | 1.2% |
| Australia | 18 | 0.0% |
| Canada | 77 | 0.2% |
| Caribbean | 28 | 0.1% |
| Central America | 2,316 | 5.1% |
| China | 112 | 0.3% |
| Colombia | 9 | 0.0% |
| Cuba | 28 | 0.1% |
| Denmark | 37 | 0.1% |
| Eastern Asia | 246 | 0.5% |
| Eastern Europe | 21 | 0.1% |
| Ecuador | 18 | 0.0% |
| Egypt | 9 | 0.0% |
| El Salvador | 55 | 0.1% |
| England | 5 | 0.0% |
| Europe | 274 | 0.6% |
| Germany | 52 | 0.1% |
| Guatemala | 3 | 0.0% |
| Honduras | 150 | 0.3% |
| Ireland | 10 | 0.0% |
| Italy | 17 | 0.0% |
| Jordan | 40 | 0.1% |
| Korea | 134 | 0.3% |
| Latin America | 2,403 | 5.3% |
| Latvia | 6 | 0.0% |
| Mexico | 2,089 | 4.6% |
| Nicaragua | 19 | 0.0% |
| Nigeria | 35 | 0.1% |
| Northern Africa | 9 | 0.0% |
| Northern Europe | 142 | 0.3% |
| Oceania | 18 | 0.0% |
| Philippines | 135 | 0.3% |
| Poland | 15 | 0.0% |
| South Africa | 13 | 0.0% |
| South America | 59 | 0.1% |
| South Eastern Asia | 223 | 0.5% |
| Southern Europe | 17 | 0.0% |
| Sweden | 27 | 0.1% |
| Switzerland | 42 | 0.1% |
| Syria | 17 | 0.0% |
| Uruguay | 26 | 0.1% |
| Venezuela | 6 | 0.0% |
| Vietnam | 88 | 0.2% |
| Western Africa | 35 | 0.1% |
| Western Asia | 57 | 0.1% |
| Western Europe | 94 | 0.2% | View All 47 Rows |
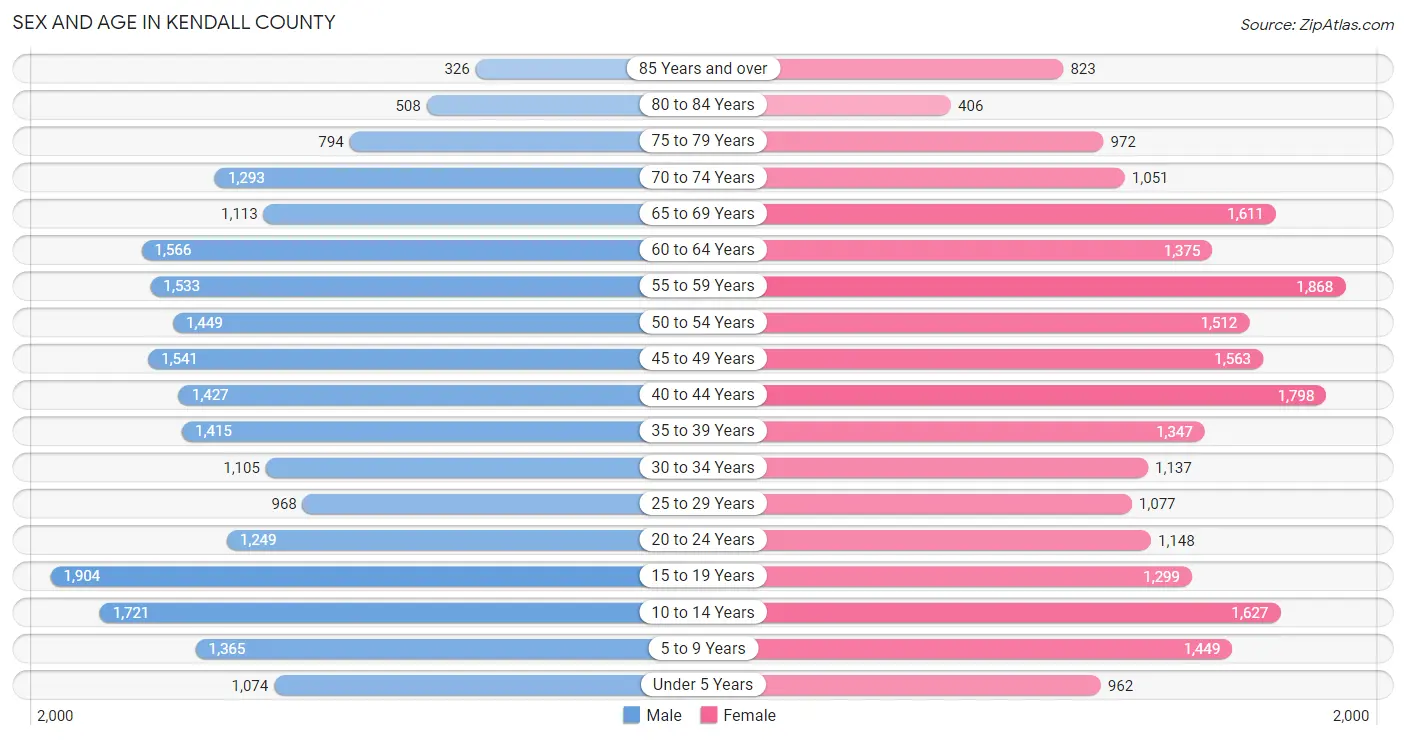
Sex and Age in Kendall County
Sex and Age in Kendall County
The most populous age groups in Kendall County are 15 to 19 Years (1,904 | 8.5%) for men and 55 to 59 Years (1,868 | 8.1%) for women.
| Age Bracket | Male | Female |
| Under 5 Years | 1,074 (4.8%) | 962 (4.2%) |
| 5 to 9 Years | 1,365 (6.1%) | 1,449 (6.3%) |
| 10 to 14 Years | 1,721 (7.7%) | 1,627 (7.1%) |
| 15 to 19 Years | 1,904 (8.5%) | 1,299 (5.6%) |
| 20 to 24 Years | 1,249 (5.6%) | 1,148 (5.0%) |
| 25 to 29 Years | 968 (4.3%) | 1,077 (4.7%) |
| 30 to 34 Years | 1,105 (4.9%) | 1,137 (4.9%) |
| 35 to 39 Years | 1,415 (6.3%) | 1,347 (5.9%) |
| 40 to 44 Years | 1,427 (6.4%) | 1,798 (7.8%) |
| 45 to 49 Years | 1,541 (6.9%) | 1,563 (6.8%) |
| 50 to 54 Years | 1,449 (6.5%) | 1,512 (6.6%) |
| 55 to 59 Years | 1,533 (6.9%) | 1,868 (8.1%) |
| 60 to 64 Years | 1,566 (7.0%) | 1,375 (6.0%) |
| 65 to 69 Years | 1,113 (5.0%) | 1,611 (7.0%) |
| 70 to 74 Years | 1,293 (5.8%) | 1,051 (4.6%) |
| 75 to 79 Years | 794 (3.5%) | 972 (4.2%) |
| 80 to 84 Years | 508 (2.3%) | 406 (1.8%) |
| 85 Years and over | 326 (1.5%) | 823 (3.6%) |
| Total | 22,351 (100.0%) | 23,025 (100.0%) |
Families and Households in Kendall County
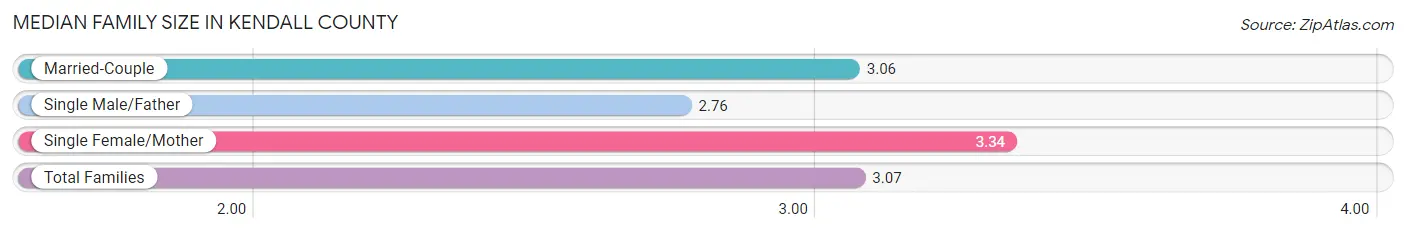
Median Family Size in Kendall County
The median family size in Kendall County is 3.07 persons per family, with single female/mother families (1,196 | 9.3%) accounting for the largest median family size of 3.34 persons per family. On the other hand, single male/father families (622 | 4.9%) represent the smallest median family size with 2.76 persons per family.
| Family Type | # Families | Family Size |
| Married-Couple | 10,994 (85.8%) | 3.06 |
| Single Male/Father | 622 (4.9%) | 2.76 |
| Single Female/Mother | 1,196 (9.3%) | 3.34 |
| Total Families | 12,812 (100.0%) | 3.07 |
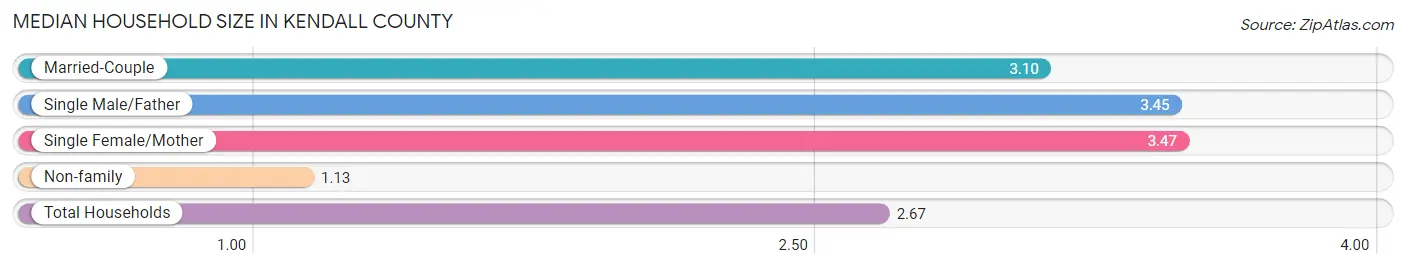
Median Household Size in Kendall County
The median household size in Kendall County is 2.67 persons per household, with single female/mother households (1,196 | 7.1%) accounting for the largest median household size of 3.47 persons per household. non-family households (3,951 | 23.6%) represent the smallest median household size with 1.13 persons per household.
| Household Type | # Households | Household Size |
| Married-Couple | 10,994 (65.6%) | 3.10 |
| Single Male/Father | 622 (3.7%) | 3.45 |
| Single Female/Mother | 1,196 (7.1%) | 3.47 |
| Non-family | 3,951 (23.6%) | 1.13 |
| Total Households | 16,763 (100.0%) | 2.67 |
Household Size by Marriage Status in Kendall County
Out of a total of 16,763 households in Kendall County, 12,812 (76.4%) are family households, while 3,951 (23.6%) are nonfamily households. The most numerous type of family households are 2-person households, comprising 5,839, and the most common type of nonfamily households are 1-person households, comprising 3,620.
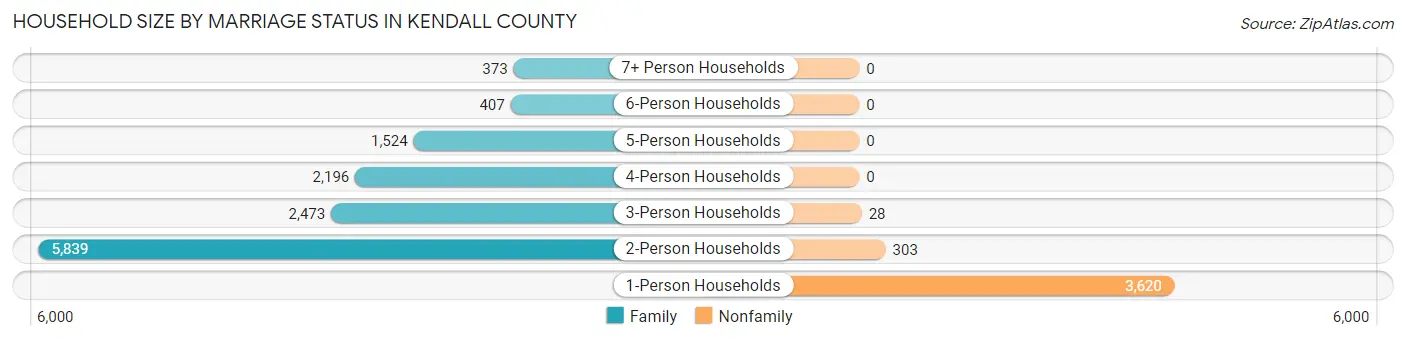
| Household Size | Family Households | Nonfamily Households |
| 1-Person Households | - | 3,620 (21.6%) |
| 2-Person Households | 5,839 (34.8%) | 303 (1.8%) |
| 3-Person Households | 2,473 (14.7%) | 28 (0.2%) |
| 4-Person Households | 2,196 (13.1%) | 0 (0.0%) |
| 5-Person Households | 1,524 (9.1%) | 0 (0.0%) |
| 6-Person Households | 407 (2.4%) | 0 (0.0%) |
| 7+ Person Households | 373 (2.2%) | 0 (0.0%) |
| Total | 12,812 (76.4%) | 3,951 (23.6%) |
Female Fertility in Kendall County
Fertility by Age in Kendall County
Average fertility rate in Kendall County is 51.0 births per 1,000 women. Women in the age bracket of 20 to 34 years have the highest fertility rate with 81.0 births per 1,000 women. Women in the age bracket of 20 to 34 years acount for 55.4% of all women with births.
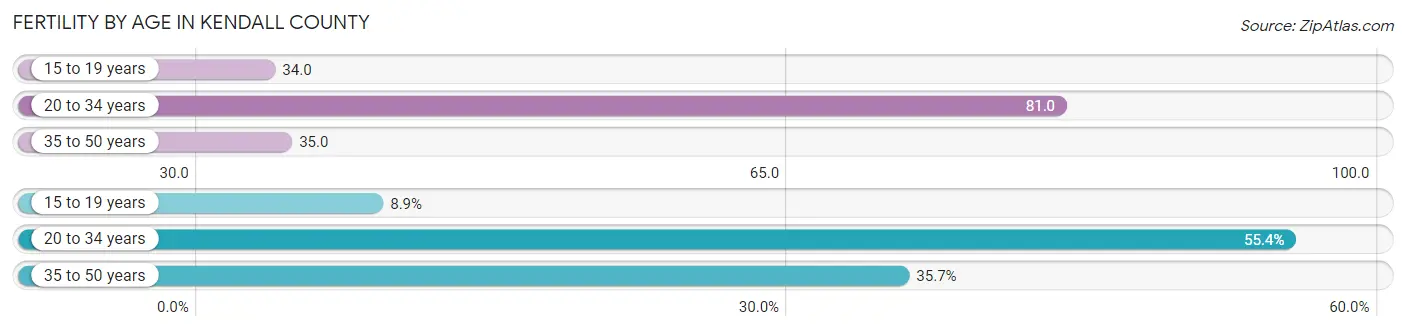
| Age Bracket | Women with Births | Births / 1,000 Women |
| 15 to 19 years | 44 (8.9%) | 34.0 |
| 20 to 34 years | 273 (55.4%) | 81.0 |
| 35 to 50 years | 176 (35.7%) | 35.0 |
| Total | 493 (100.0%) | 51.0 |
Fertility by Age by Marriage Status in Kendall County
54.6% of women with births (493) in Kendall County are married. The highest percentage of unmarried women with births falls into 15 to 19 years age bracket with 100.0% of them unmarried at the time of birth, while the lowest percentage of unmarried women with births belong to 35 to 50 years age bracket with 26.1% of them unmarried.
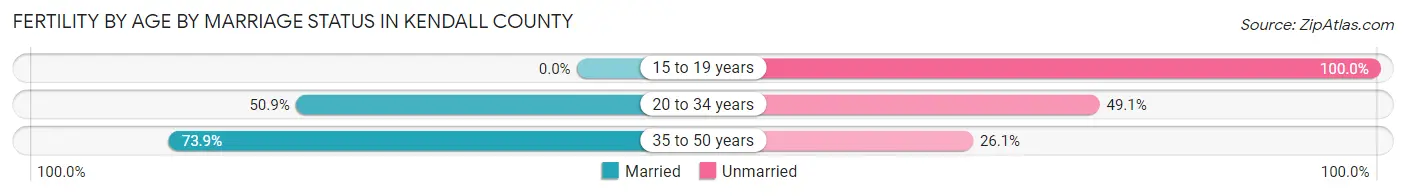
| Age Bracket | Married | Unmarried |
| 15 to 19 years | 0 (0.0%) | 44 (100.0%) |
| 20 to 34 years | 139 (50.9%) | 134 (49.1%) |
| 35 to 50 years | 130 (73.9%) | 46 (26.1%) |
| Total | 269 (54.6%) | 224 (45.4%) |
Fertility by Education in Kendall County
Average fertility rate in Kendall County is 51.0 births per 1,000 women. Women with the education attainment of less than high school have the highest fertility rate of 76.0 births per 1,000 women, while women with the education attainment of bachelor's degree have the lowest fertility at 28.0 births per 1,000 women. Women with the education attainment of less than high school represent 27.8% of all women with births.
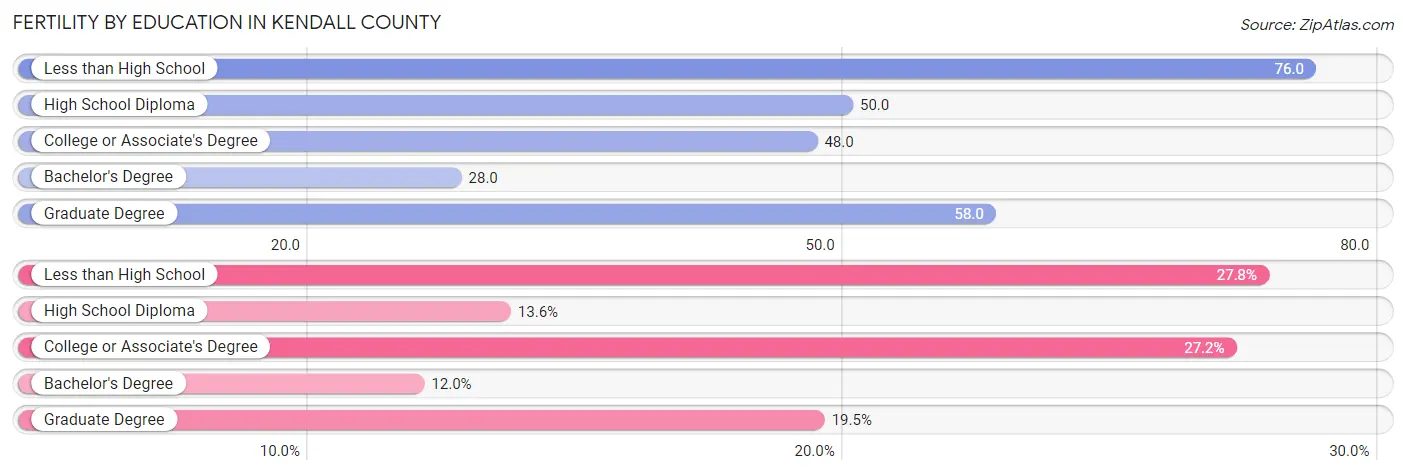
| Educational Attainment | Women with Births | Births / 1,000 Women |
| Less than High School | 137 (27.8%) | 76.0 |
| High School Diploma | 67 (13.6%) | 50.0 |
| College or Associate's Degree | 134 (27.2%) | 48.0 |
| Bachelor's Degree | 59 (12.0%) | 28.0 |
| Graduate Degree | 96 (19.5%) | 58.0 |
| Total | 493 (100.0%) | 51.0 |
Fertility by Education by Marriage Status in Kendall County
45.4% of women with births in Kendall County are unmarried. Women with the educational attainment of bachelor's degree are most likely to be married with 100.0% of them married at childbirth, while women with the educational attainment of less than high school are least likely to be married with 100.0% of them unmarried at childbirth.
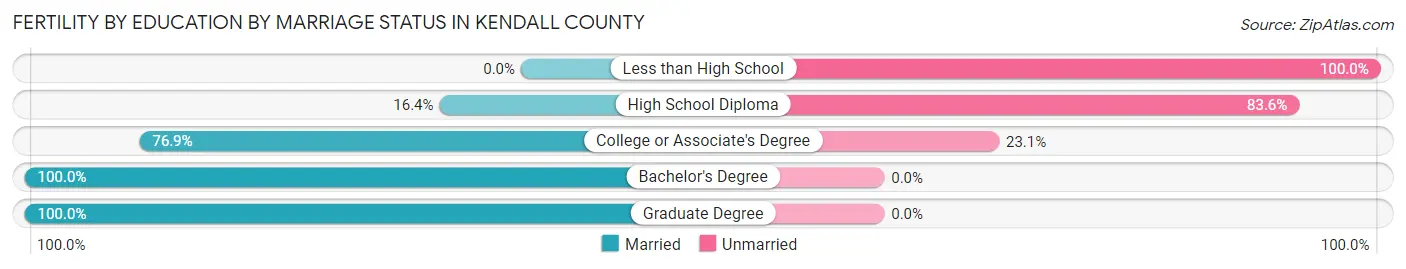
| Educational Attainment | Married | Unmarried |
| Less than High School | 0 (0.0%) | 137 (100.0%) |
| High School Diploma | 11 (16.4%) | 56 (83.6%) |
| College or Associate's Degree | 103 (76.9%) | 31 (23.1%) |
| Bachelor's Degree | 59 (100.0%) | 0 (0.0%) |
| Graduate Degree | 96 (100.0%) | 0 (0.0%) |
| Total | 269 (54.6%) | 224 (45.4%) |
Employment Characteristics in Kendall County
Employment by Class of Employer in Kendall County
Among the 21,045 employed individuals in Kendall County, private company employees (12,386 | 58.9%), self-employed (incorporated) (2,100 | 10.0%), and self-employed (not incorporated) (1,874 | 8.9%) make up the most common classes of employment.
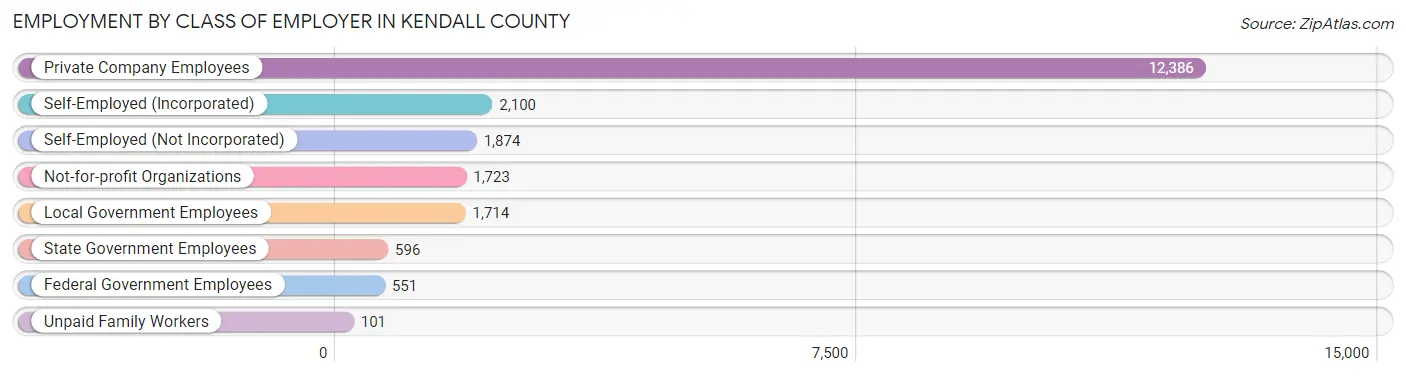
| Employer Class | # Employees | % Employees |
| Private Company Employees | 12,386 | 58.9% |
| Self-Employed (Incorporated) | 2,100 | 10.0% |
| Self-Employed (Not Incorporated) | 1,874 | 8.9% |
| Not-for-profit Organizations | 1,723 | 8.2% |
| Local Government Employees | 1,714 | 8.1% |
| State Government Employees | 596 | 2.8% |
| Federal Government Employees | 551 | 2.6% |
| Unpaid Family Workers | 101 | 0.5% |
| Total | 21,045 | 100.0% |
Employment Status by Age in Kendall County
According to the labor force statistics for Kendall County, out of the total population over 16 years of age (36,422), 61.8% or 22,509 individuals are in the labor force, with 4.8% or 1,080 of them unemployed. The age group with the highest labor force participation rate is 35 to 44 years, with 85.6% or 5,125 individuals in the labor force. Within the labor force, the 20 to 24 years age range has the highest percentage of unemployed individuals, with 25.8% or 456 of them being unemployed.
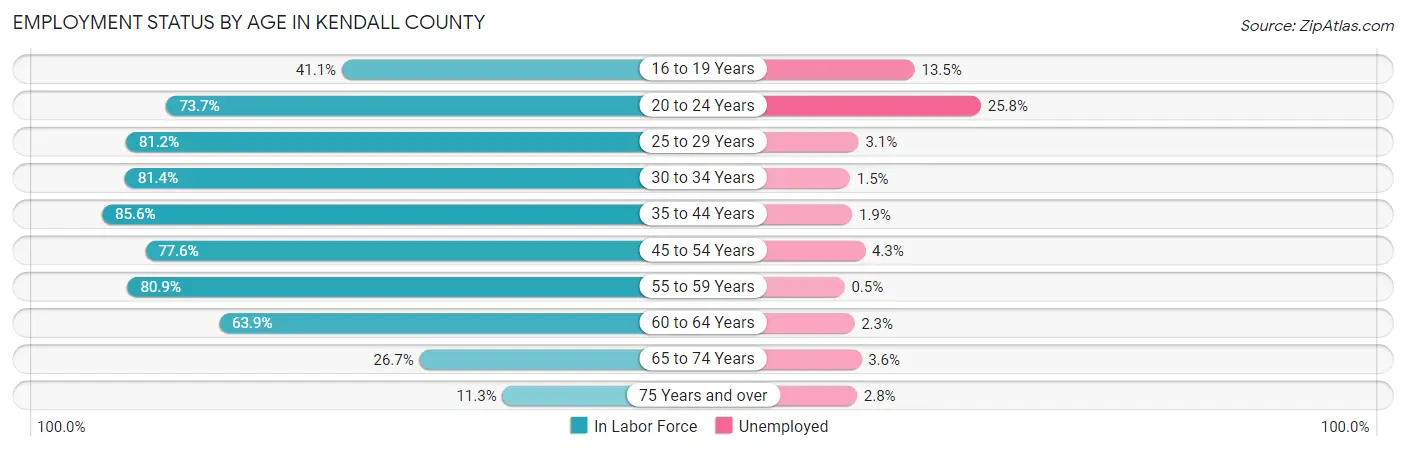
| Age Bracket | In Labor Force | Unemployed |
| 16 to 19 Years | 1,006 (41.1%) | 136 (13.5%) |
| 20 to 24 Years | 1,767 (73.7%) | 456 (25.8%) |
| 25 to 29 Years | 1,661 (81.2%) | 51 (3.1%) |
| 30 to 34 Years | 1,825 (81.4%) | 27 (1.5%) |
| 35 to 44 Years | 5,125 (85.6%) | 97 (1.9%) |
| 45 to 54 Years | 4,706 (77.6%) | 202 (4.3%) |
| 55 to 59 Years | 2,751 (80.9%) | 14 (0.5%) |
| 60 to 64 Years | 1,879 (63.9%) | 43 (2.3%) |
| 65 to 74 Years | 1,353 (26.7%) | 49 (3.6%) |
| 75 Years and over | 433 (11.3%) | 12 (2.8%) |
| Total | 22,509 (61.8%) | 1,080 (4.8%) |
Employment Status by Educational Attainment in Kendall County
According to labor force statistics for Kendall County, 79.1% of individuals (17,941) out of the total population between 25 and 64 years of age (22,681) are in the labor force, with 2.4% or 431 of them being unemployed. The group with the highest labor force participation rate are those with the educational attainment of bachelor's degree or higher, with 82.1% or 8,891 individuals in the labor force. Within the labor force, individuals with high school diploma education have the highest percentage of unemployment, with 3.8% or 84 of them being unemployed.
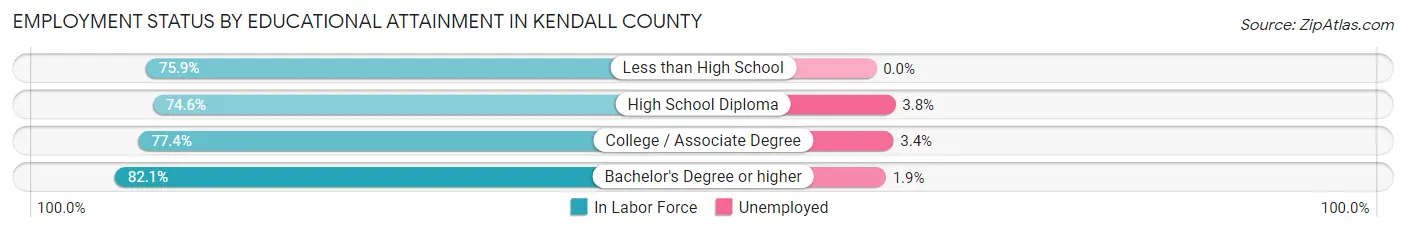
| Educational Attainment | In Labor Force | Unemployed |
| Less than High School | 1,441 (75.9%) | 0 (0.0%) |
| High School Diploma | 2,220 (74.6%) | 113 (3.8%) |
| College / Associate Degree | 5,400 (77.4%) | 237 (3.4%) |
| Bachelor's Degree or higher | 8,891 (82.1%) | 206 (1.9%) |
| Total | 17,941 (79.1%) | 544 (2.4%) |
Employment Occupations by Sex in Kendall County
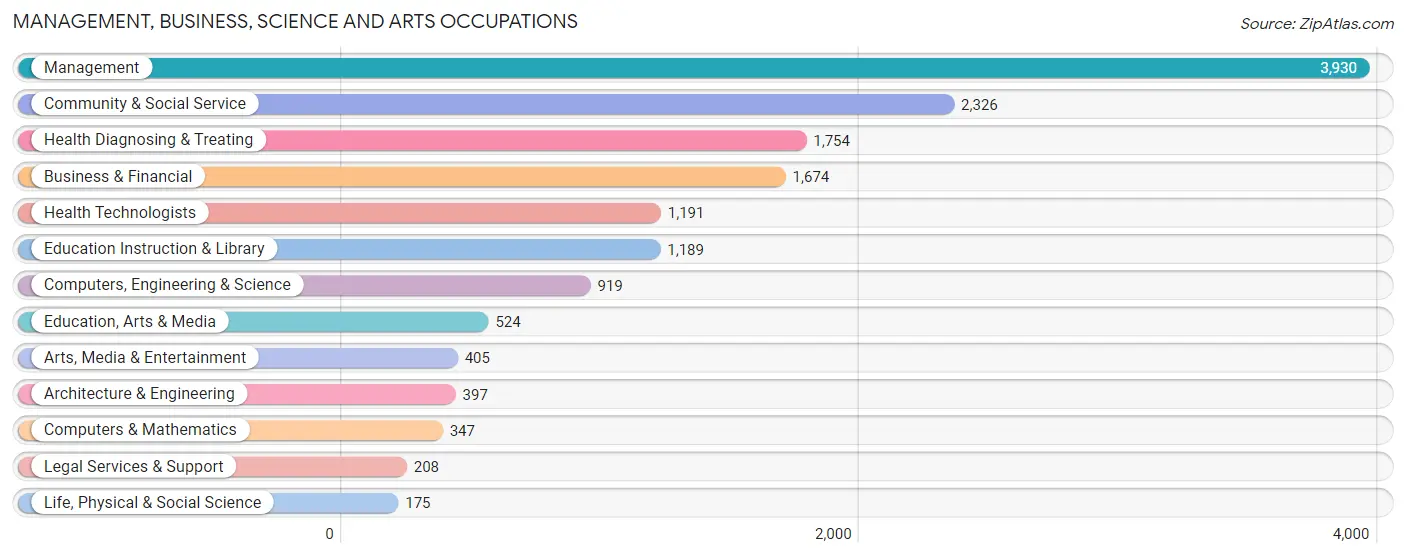
Management, Business, Science and Arts Occupations
The most common Management, Business, Science and Arts occupations in Kendall County are Management (3,930 | 18.4%), Community & Social Service (2,326 | 10.9%), Health Diagnosing & Treating (1,754 | 8.2%), Business & Financial (1,674 | 7.8%), and Health Technologists (1,191 | 5.6%).
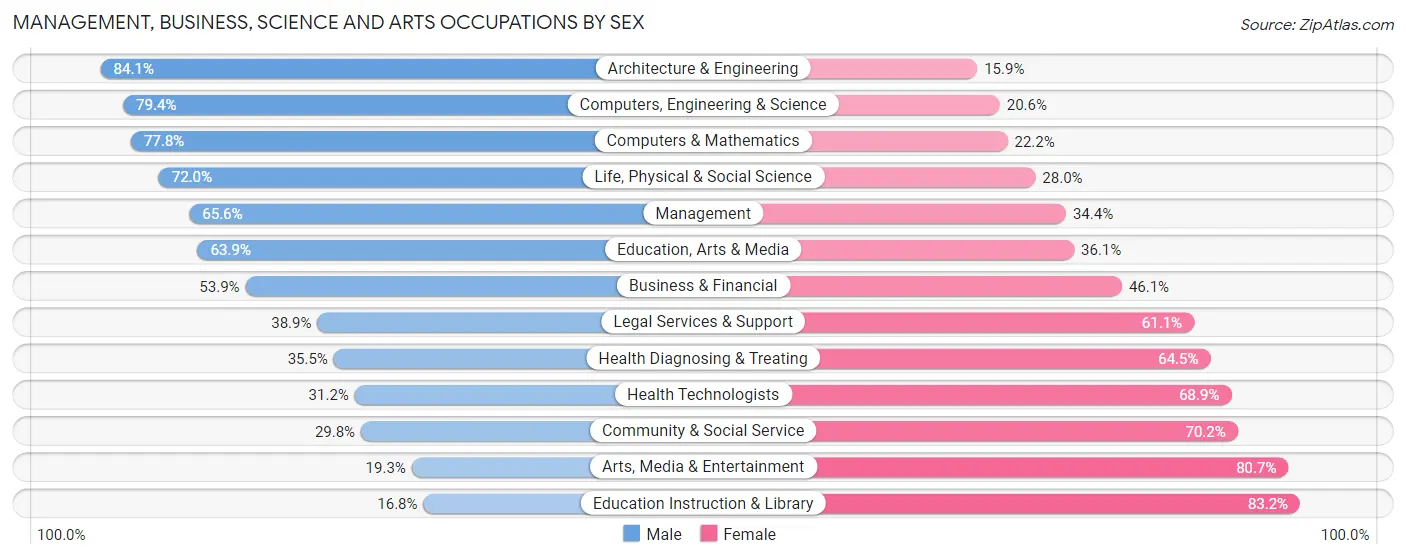
Management, Business, Science and Arts Occupations by Sex
Within the Management, Business, Science and Arts occupations in Kendall County, the most male-oriented occupations are Architecture & Engineering (84.1%), Computers, Engineering & Science (79.4%), and Computers & Mathematics (77.8%), while the most female-oriented occupations are Education Instruction & Library (83.2%), Arts, Media & Entertainment (80.7%), and Community & Social Service (70.2%).
| Occupation | Male | Female |
| Management | 2,579 (65.6%) | 1,351 (34.4%) |
| Business & Financial | 903 (53.9%) | 771 (46.1%) |
| Computers, Engineering & Science | 730 (79.4%) | 189 (20.6%) |
| Computers & Mathematics | 270 (77.8%) | 77 (22.2%) |
| Architecture & Engineering | 334 (84.1%) | 63 (15.9%) |
| Life, Physical & Social Science | 126 (72.0%) | 49 (28.0%) |
| Community & Social Service | 694 (29.8%) | 1,632 (70.2%) |
| Education, Arts & Media | 335 (63.9%) | 189 (36.1%) |
| Legal Services & Support | 81 (38.9%) | 127 (61.1%) |
| Education Instruction & Library | 200 (16.8%) | 989 (83.2%) |
| Arts, Media & Entertainment | 78 (19.3%) | 327 (80.7%) |
| Health Diagnosing & Treating | 623 (35.5%) | 1,131 (64.5%) |
| Health Technologists | 371 (31.1%) | 820 (68.9%) |
| Total (Category) | 5,529 (52.1%) | 5,074 (47.8%) |
| Total (Overall) | 11,676 (54.6%) | 9,706 (45.4%) |
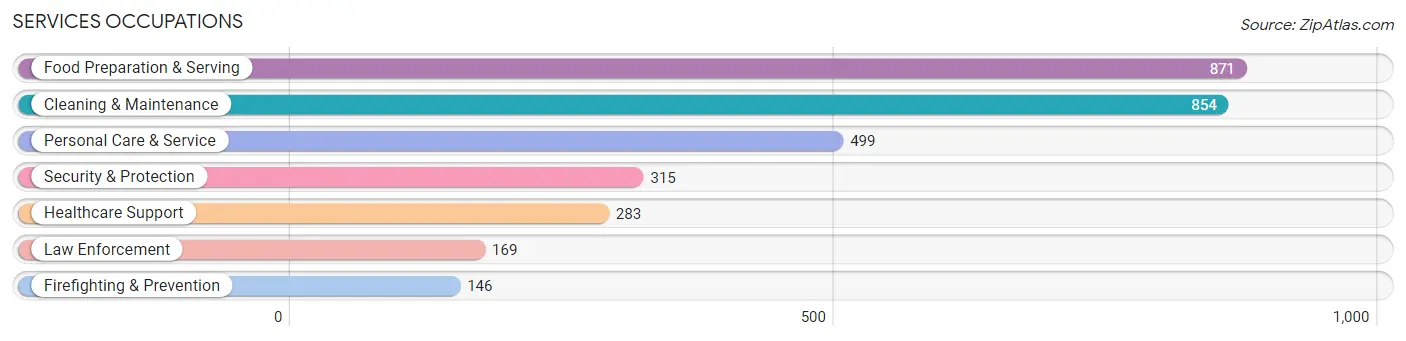
Services Occupations
The most common Services occupations in Kendall County are Food Preparation & Serving (871 | 4.1%), Cleaning & Maintenance (854 | 4.0%), Personal Care & Service (499 | 2.3%), Security & Protection (315 | 1.5%), and Healthcare Support (283 | 1.3%).
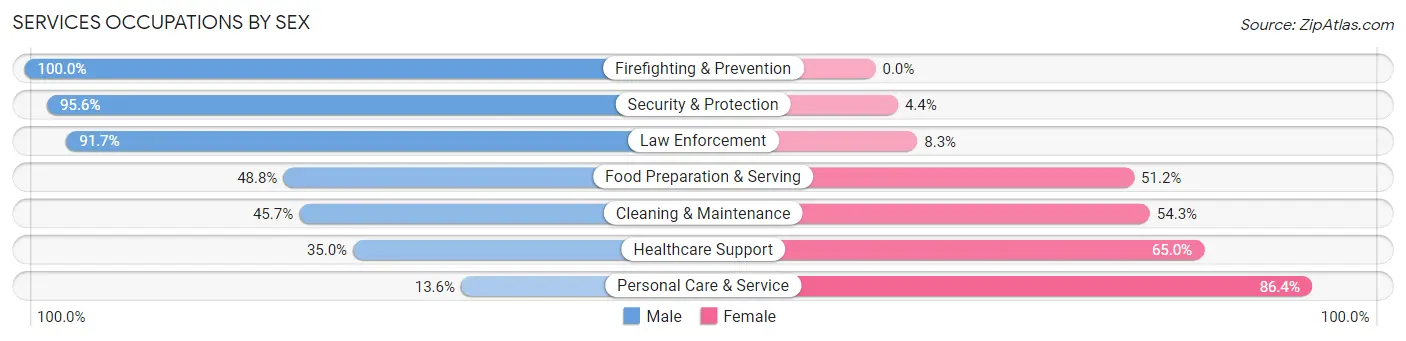
Services Occupations by Sex
Within the Services occupations in Kendall County, the most male-oriented occupations are Firefighting & Prevention (100.0%), Security & Protection (95.6%), and Law Enforcement (91.7%), while the most female-oriented occupations are Personal Care & Service (86.4%), Healthcare Support (65.0%), and Cleaning & Maintenance (54.3%).
| Occupation | Male | Female |
| Healthcare Support | 99 (35.0%) | 184 (65.0%) |
| Security & Protection | 301 (95.6%) | 14 (4.4%) |
| Firefighting & Prevention | 146 (100.0%) | 0 (0.0%) |
| Law Enforcement | 155 (91.7%) | 14 (8.3%) |
| Food Preparation & Serving | 425 (48.8%) | 446 (51.2%) |
| Cleaning & Maintenance | 390 (45.7%) | 464 (54.3%) |
| Personal Care & Service | 68 (13.6%) | 431 (86.4%) |
| Total (Category) | 1,283 (45.5%) | 1,539 (54.5%) |
| Total (Overall) | 11,676 (54.6%) | 9,706 (45.4%) |
Sales and Office Occupations
The most common Sales and Office occupations in Kendall County are Sales & Related (2,612 | 12.2%), and Office & Administration (2,182 | 10.2%).

Sales and Office Occupations by Sex
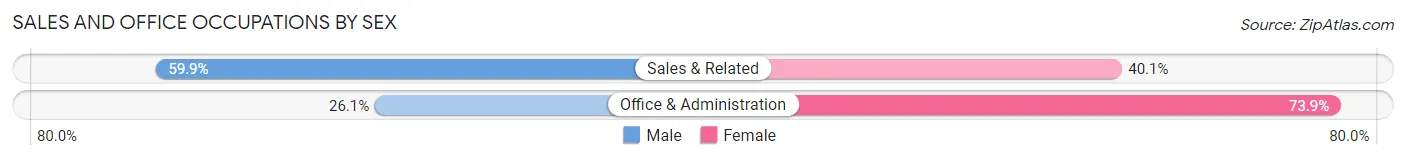
| Occupation | Male | Female |
| Sales & Related | 1,564 (59.9%) | 1,048 (40.1%) |
| Office & Administration | 569 (26.1%) | 1,613 (73.9%) |
| Total (Category) | 2,133 (44.5%) | 2,661 (55.5%) |
| Total (Overall) | 11,676 (54.6%) | 9,706 (45.4%) |
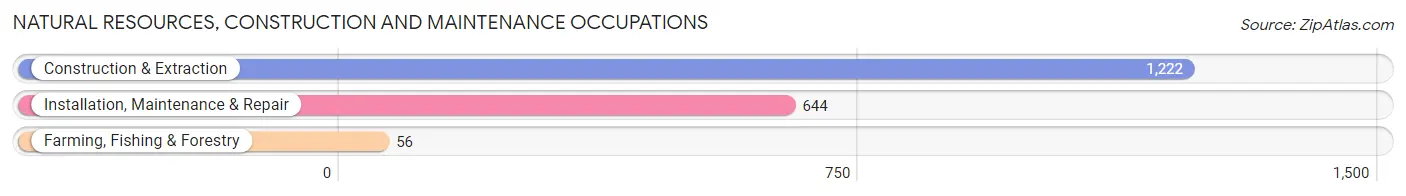
Natural Resources, Construction and Maintenance Occupations
The most common Natural Resources, Construction and Maintenance occupations in Kendall County are Construction & Extraction (1,222 | 5.7%), Installation, Maintenance & Repair (644 | 3.0%), and Farming, Fishing & Forestry (56 | 0.3%).
Natural Resources, Construction and Maintenance Occupations by Sex
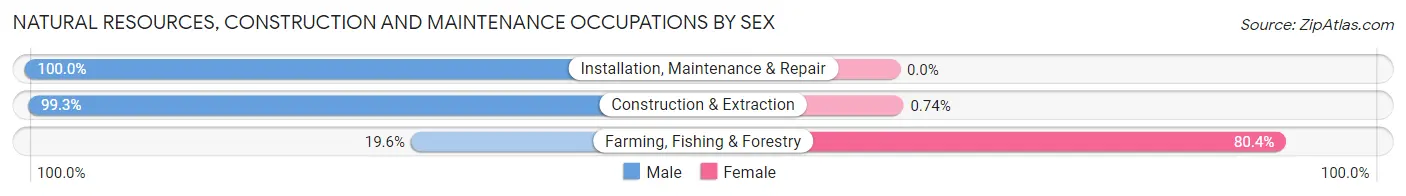
| Occupation | Male | Female |
| Farming, Fishing & Forestry | 11 (19.6%) | 45 (80.4%) |
| Construction & Extraction | 1,213 (99.3%) | 9 (0.7%) |
| Installation, Maintenance & Repair | 644 (100.0%) | 0 (0.0%) |
| Total (Category) | 1,868 (97.2%) | 54 (2.8%) |
| Total (Overall) | 11,676 (54.6%) | 9,706 (45.4%) |
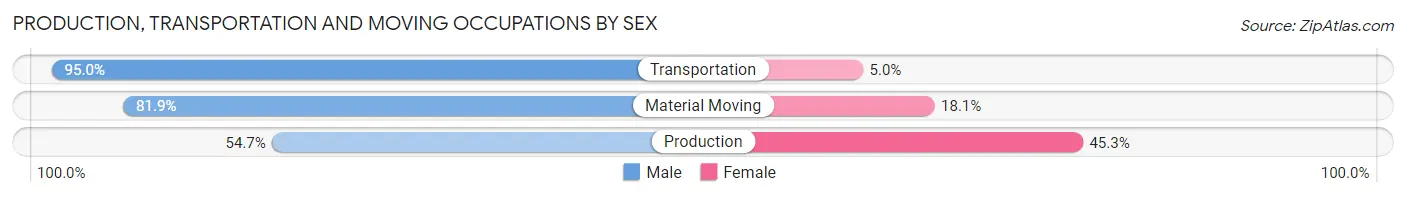
Production, Transportation and Moving Occupations
The most common Production, Transportation and Moving occupations in Kendall County are Production (651 | 3.0%), Material Moving (409 | 1.9%), and Transportation (181 | 0.9%).
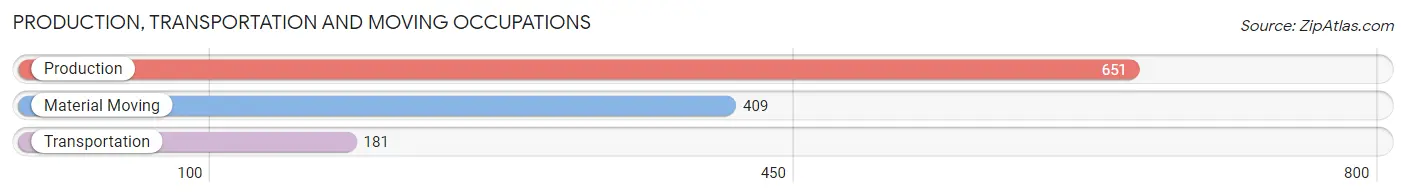
Production, Transportation and Moving Occupations by Sex
| Occupation | Male | Female |
| Production | 356 (54.7%) | 295 (45.3%) |
| Transportation | 172 (95.0%) | 9 (5.0%) |
| Material Moving | 335 (81.9%) | 74 (18.1%) |
| Total (Category) | 863 (69.5%) | 378 (30.5%) |
| Total (Overall) | 11,676 (54.6%) | 9,706 (45.4%) |
Employment Industries by Sex in Kendall County
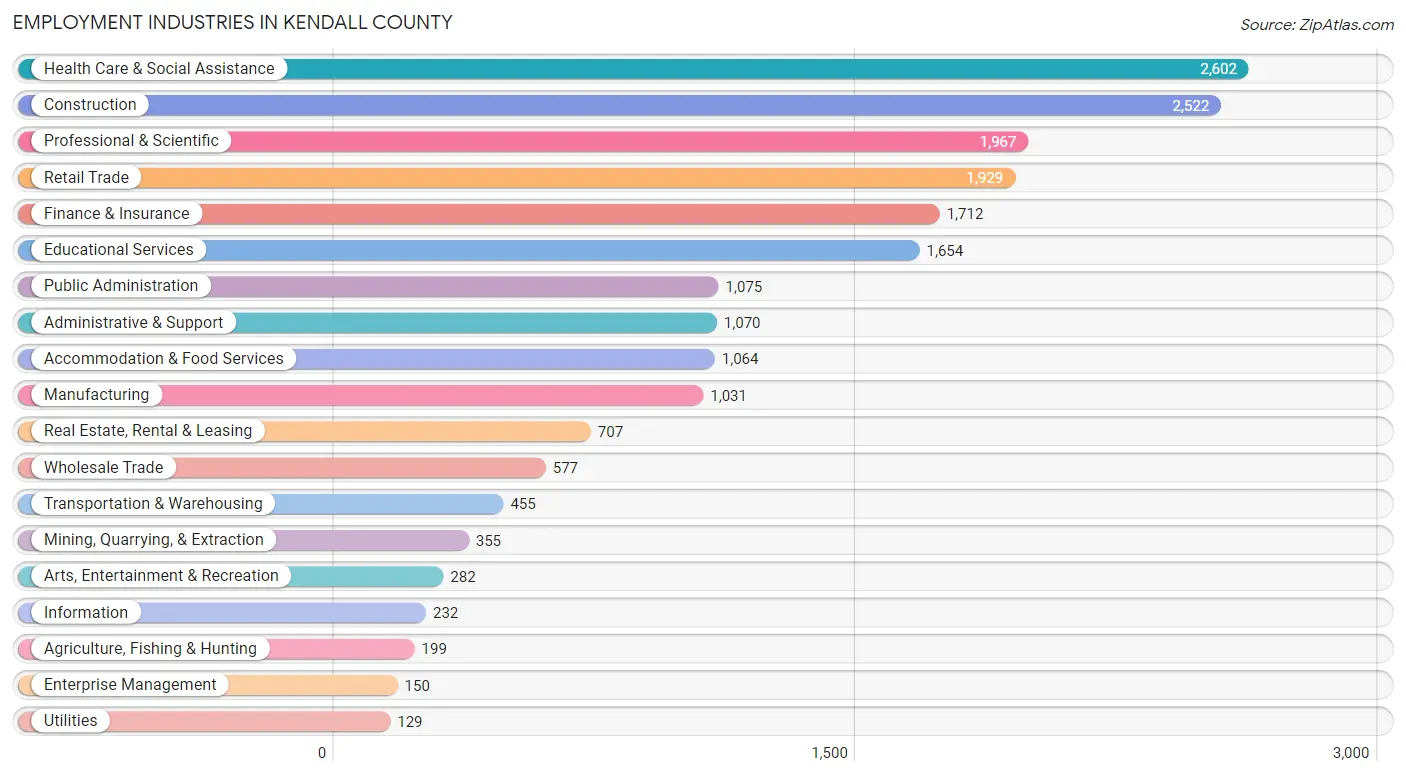
Employment Industries in Kendall County
The major employment industries in Kendall County include Health Care & Social Assistance (2,602 | 12.2%), Construction (2,522 | 11.8%), Professional & Scientific (1,967 | 9.2%), Retail Trade (1,929 | 9.0%), and Finance & Insurance (1,712 | 8.0%).
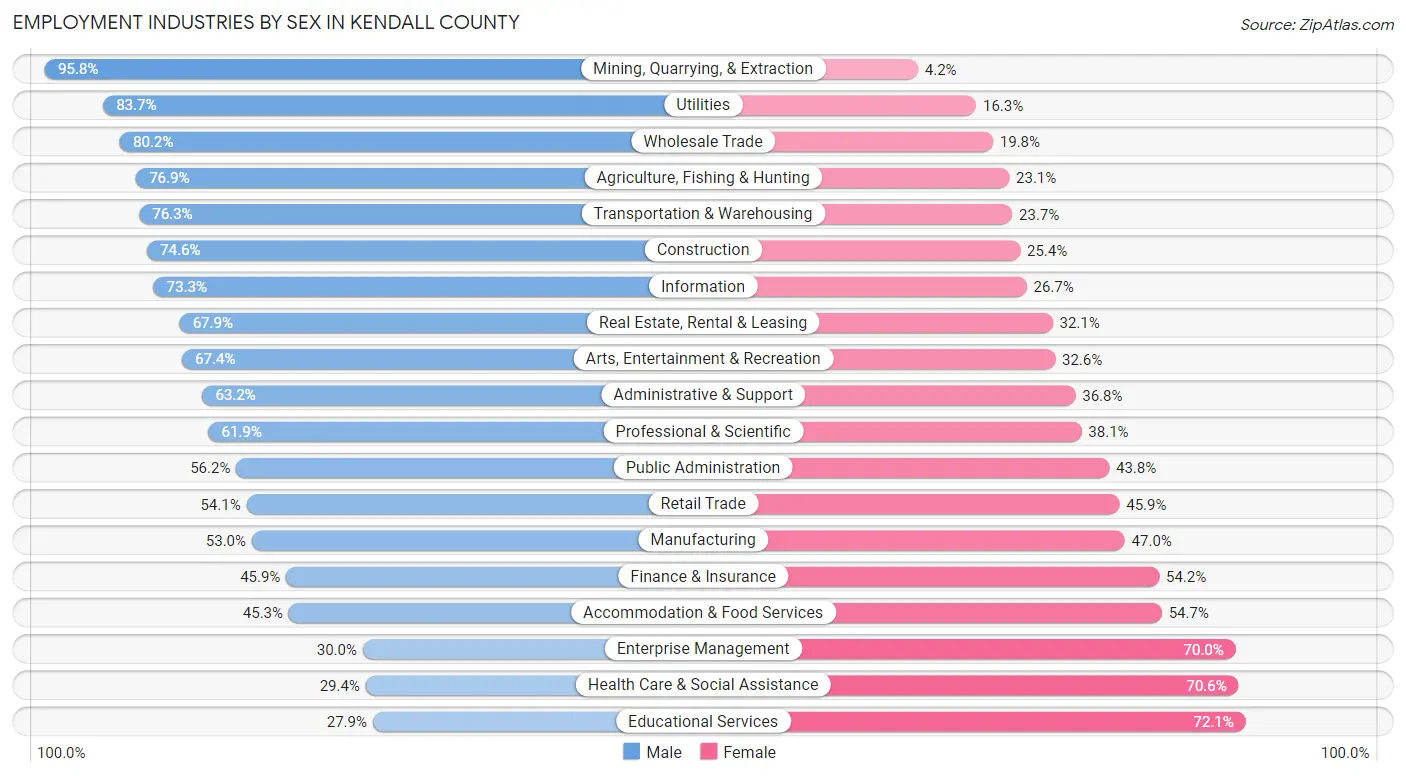
Employment Industries by Sex in Kendall County
The Kendall County industries that see more men than women are Mining, Quarrying, & Extraction (95.8%), Utilities (83.7%), and Wholesale Trade (80.2%), whereas the industries that tend to have a higher number of women are Educational Services (72.1%), Health Care & Social Assistance (70.6%), and Enterprise Management (70.0%).
| Industry | Male | Female |
| Agriculture, Fishing & Hunting | 153 (76.9%) | 46 (23.1%) |
| Mining, Quarrying, & Extraction | 340 (95.8%) | 15 (4.2%) |
| Construction | 1,882 (74.6%) | 640 (25.4%) |
| Manufacturing | 546 (53.0%) | 485 (47.0%) |
| Wholesale Trade | 463 (80.2%) | 114 (19.8%) |
| Retail Trade | 1,043 (54.1%) | 886 (45.9%) |
| Transportation & Warehousing | 347 (76.3%) | 108 (23.7%) |
| Utilities | 108 (83.7%) | 21 (16.3%) |
| Information | 170 (73.3%) | 62 (26.7%) |
| Finance & Insurance | 785 (45.9%) | 927 (54.1%) |
| Real Estate, Rental & Leasing | 480 (67.9%) | 227 (32.1%) |
| Professional & Scientific | 1,218 (61.9%) | 749 (38.1%) |
| Enterprise Management | 45 (30.0%) | 105 (70.0%) |
| Administrative & Support | 676 (63.2%) | 394 (36.8%) |
| Educational Services | 462 (27.9%) | 1,192 (72.1%) |
| Health Care & Social Assistance | 765 (29.4%) | 1,837 (70.6%) |
| Arts, Entertainment & Recreation | 190 (67.4%) | 92 (32.6%) |
| Accommodation & Food Services | 482 (45.3%) | 582 (54.7%) |
| Public Administration | 604 (56.2%) | 471 (43.8%) |
| Total | 11,676 (54.6%) | 9,706 (45.4%) |
Education in Kendall County
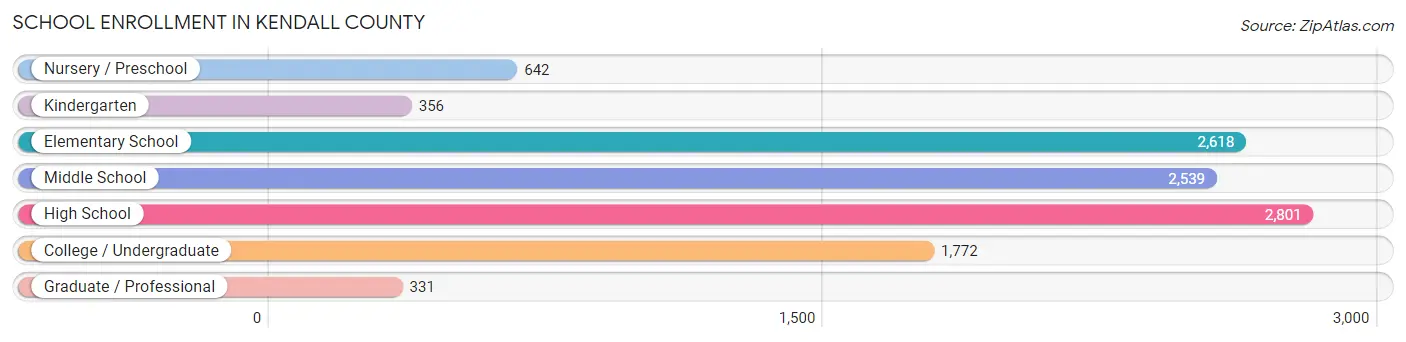
School Enrollment in Kendall County
The most common levels of schooling among the 11,059 students in Kendall County are high school (2,801 | 25.3%), elementary school (2,618 | 23.7%), and middle school (2,539 | 23.0%).
| School Level | # Students | % Students |
| Nursery / Preschool | 642 | 5.8% |
| Kindergarten | 356 | 3.2% |
| Elementary School | 2,618 | 23.7% |
| Middle School | 2,539 | 23.0% |
| High School | 2,801 | 25.3% |
| College / Undergraduate | 1,772 | 16.0% |
| Graduate / Professional | 331 | 3.0% |
| Total | 11,059 | 100.0% |
School Enrollment by Age by Funding Source in Kendall County
Out of a total of 11,059 students who are enrolled in schools in Kendall County, 1,891 (17.1%) attend a private institution, while the remaining 9,168 (82.9%) are enrolled in public schools. The age group of 3 to 4 year olds has the highest likelihood of being enrolled in private schools, with 222 (47.9% in the age bracket) enrolled. Conversely, the age group of 18 to 19 year olds has the lowest likelihood of being enrolled in a private school, with 813 (90.2% in the age bracket) attending a public institution.
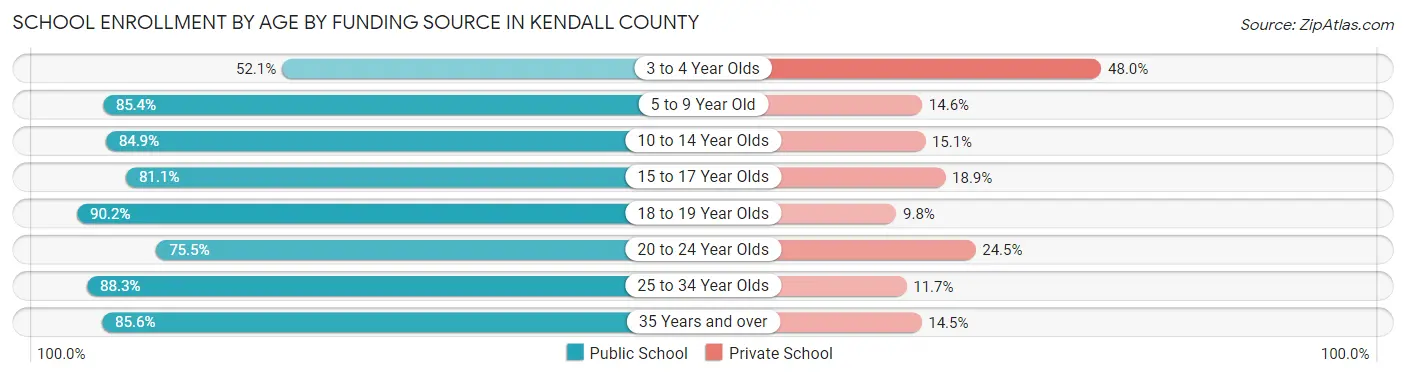
| Age Bracket | Public School | Private School |
| 3 to 4 Year Olds | 241 (52.0%) | 222 (47.9%) |
| 5 to 9 Year Old | 2,257 (85.4%) | 385 (14.6%) |
| 10 to 14 Year Olds | 2,797 (84.9%) | 499 (15.1%) |
| 15 to 17 Year Olds | 1,649 (81.1%) | 384 (18.9%) |
| 18 to 19 Year Olds | 813 (90.2%) | 88 (9.8%) |
| 20 to 24 Year Olds | 591 (75.5%) | 192 (24.5%) |
| 25 to 34 Year Olds | 379 (88.3%) | 50 (11.7%) |
| 35 Years and over | 438 (85.6%) | 74 (14.4%) |
| Total | 9,168 (82.9%) | 1,891 (17.1%) |
Educational Attainment by Field of Study in Kendall County
Business (3,975 | 24.3%), education (2,073 | 12.7%), science & technology (1,882 | 11.5%), bio, nature & agricultural (1,256 | 7.7%), and social sciences (1,103 | 6.7%) are the most common fields of study among 16,360 individuals in Kendall County who have obtained a bachelor's degree or higher.
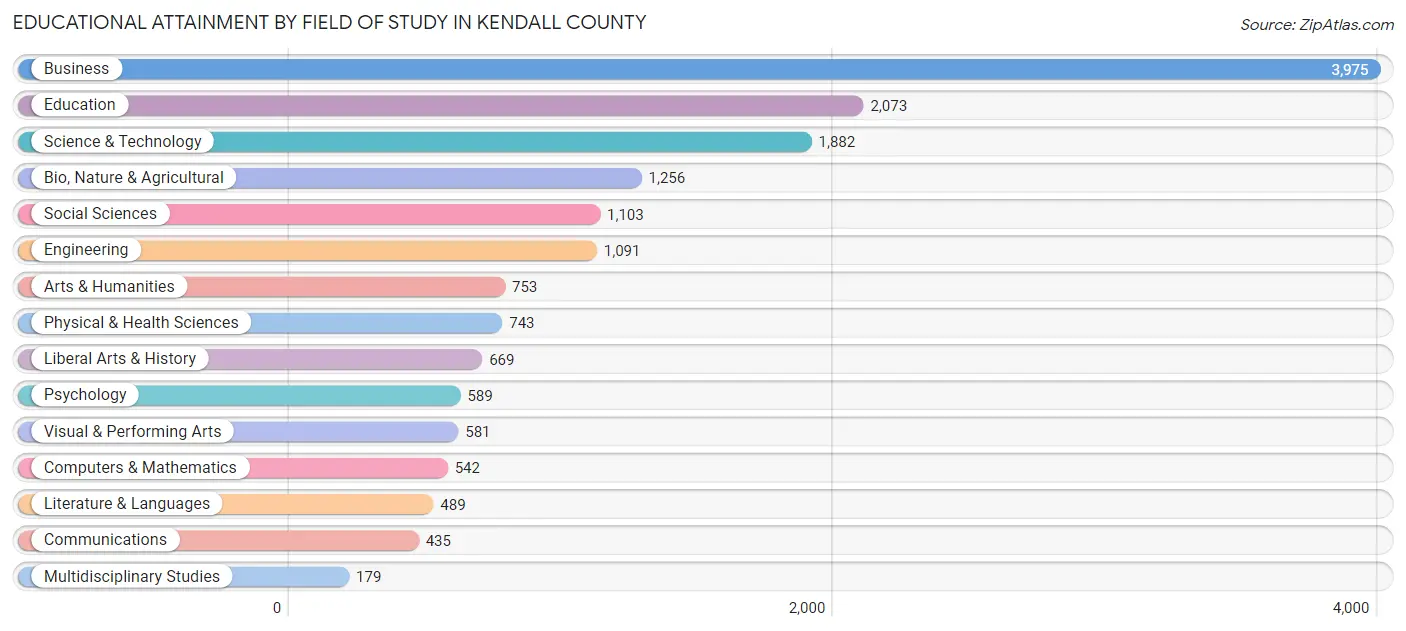
| Field of Study | # Graduates | % Graduates |
| Computers & Mathematics | 542 | 3.3% |
| Bio, Nature & Agricultural | 1,256 | 7.7% |
| Physical & Health Sciences | 743 | 4.5% |
| Psychology | 589 | 3.6% |
| Social Sciences | 1,103 | 6.7% |
| Engineering | 1,091 | 6.7% |
| Multidisciplinary Studies | 179 | 1.1% |
| Science & Technology | 1,882 | 11.5% |
| Business | 3,975 | 24.3% |
| Education | 2,073 | 12.7% |
| Literature & Languages | 489 | 3.0% |
| Liberal Arts & History | 669 | 4.1% |
| Visual & Performing Arts | 581 | 3.5% |
| Communications | 435 | 2.7% |
| Arts & Humanities | 753 | 4.6% |
| Total | 16,360 | 100.0% |
Transportation & Commute in Kendall County
Vehicle Availability by Sex in Kendall County
The most prevalent vehicle ownership categories in Kendall County are males with 2 vehicles (4,911, accounting for 42.6%) and females with 2 vehicles (4,080, making up 51.6%).
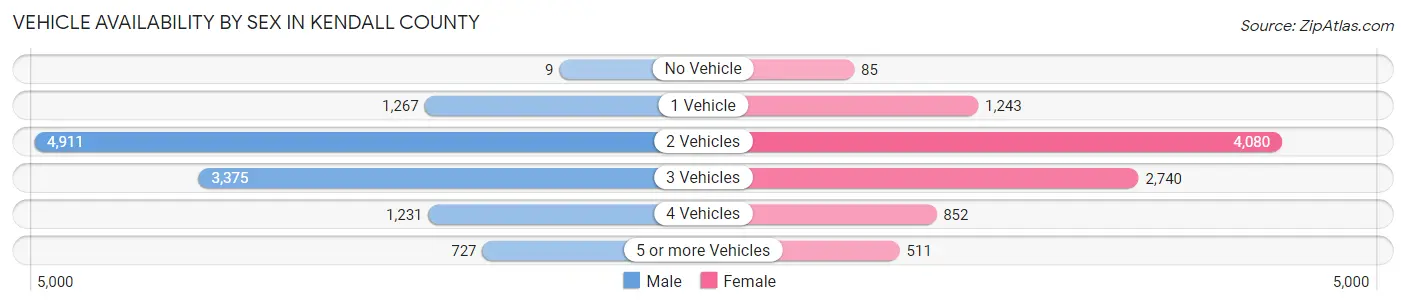
| Vehicles Available | Male | Female |
| No Vehicle | 9 (0.1%) | 85 (0.9%) |
| 1 Vehicle | 1,267 (11.0%) | 1,243 (13.1%) |
| 2 Vehicles | 4,911 (42.6%) | 4,080 (42.9%) |
| 3 Vehicles | 3,375 (29.3%) | 2,740 (28.8%) |
| 4 Vehicles | 1,231 (10.7%) | 852 (9.0%) |
| 5 or more Vehicles | 727 (6.3%) | 511 (5.4%) |
| Total | 11,520 (100.0%) | 9,511 (100.0%) |
Commute Time in Kendall County
The most frequently occuring commute durations in Kendall County are 30 to 34 minutes (2,603 commuters, 15.2%), 10 to 14 minutes (2,244 commuters, 13.1%), and 5 to 9 minutes (2,221 commuters, 13.0%).
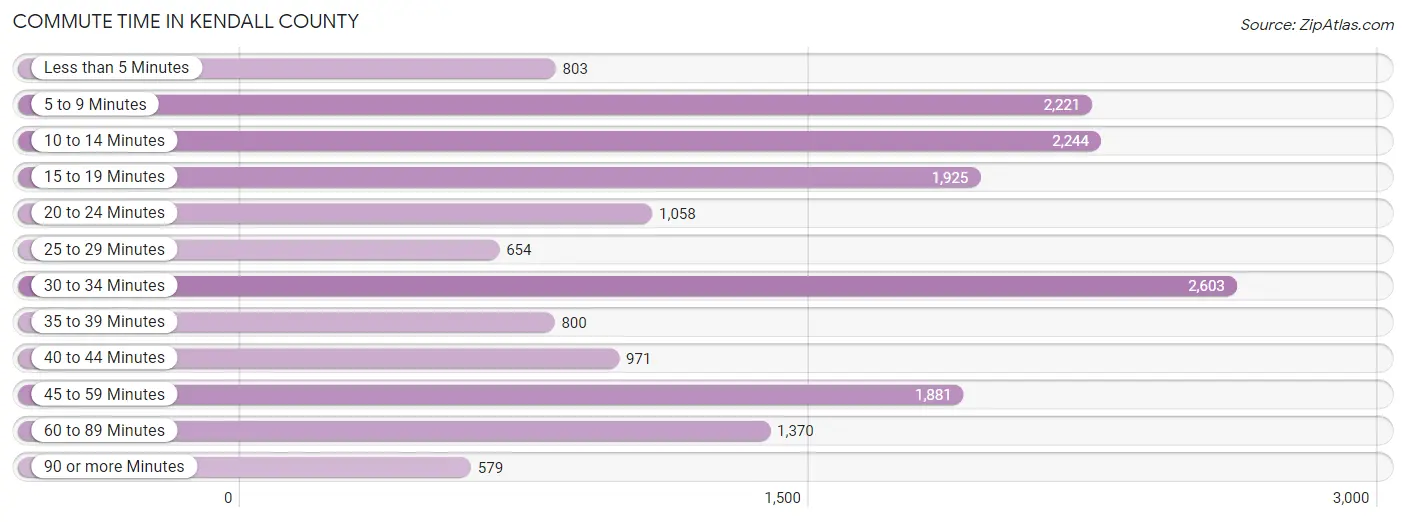
| Commute Time | # Commuters | % Commuters |
| Less than 5 Minutes | 803 | 4.7% |
| 5 to 9 Minutes | 2,221 | 13.0% |
| 10 to 14 Minutes | 2,244 | 13.1% |
| 15 to 19 Minutes | 1,925 | 11.3% |
| 20 to 24 Minutes | 1,058 | 6.2% |
| 25 to 29 Minutes | 654 | 3.8% |
| 30 to 34 Minutes | 2,603 | 15.2% |
| 35 to 39 Minutes | 800 | 4.7% |
| 40 to 44 Minutes | 971 | 5.7% |
| 45 to 59 Minutes | 1,881 | 11.0% |
| 60 to 89 Minutes | 1,370 | 8.0% |
| 90 or more Minutes | 579 | 3.4% |
Commute Time by Sex in Kendall County
The most common commute times in Kendall County are 30 to 34 minutes (1,451 commuters, 15.3%) for males and 10 to 14 minutes (1,209 commuters, 15.8%) for females.
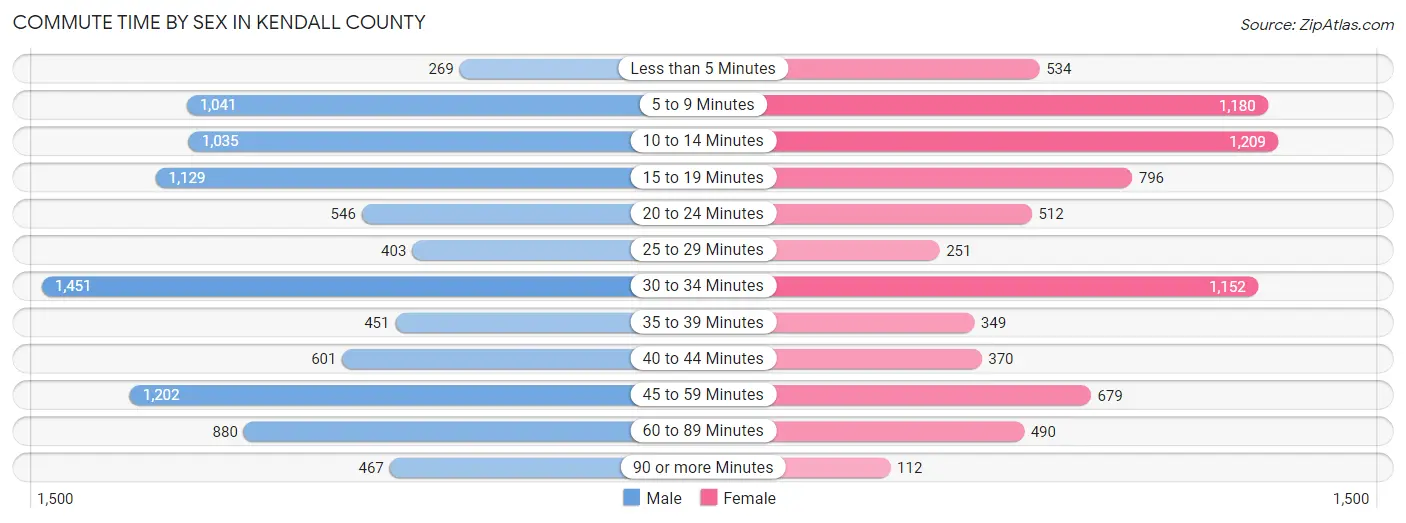
| Commute Time | Male | Female |
| Less than 5 Minutes | 269 (2.8%) | 534 (7.0%) |
| 5 to 9 Minutes | 1,041 (11.0%) | 1,180 (15.5%) |
| 10 to 14 Minutes | 1,035 (10.9%) | 1,209 (15.8%) |
| 15 to 19 Minutes | 1,129 (11.9%) | 796 (10.4%) |
| 20 to 24 Minutes | 546 (5.8%) | 512 (6.7%) |
| 25 to 29 Minutes | 403 (4.3%) | 251 (3.3%) |
| 30 to 34 Minutes | 1,451 (15.3%) | 1,152 (15.1%) |
| 35 to 39 Minutes | 451 (4.8%) | 349 (4.6%) |
| 40 to 44 Minutes | 601 (6.3%) | 370 (4.9%) |
| 45 to 59 Minutes | 1,202 (12.7%) | 679 (8.9%) |
| 60 to 89 Minutes | 880 (9.3%) | 490 (6.4%) |
| 90 or more Minutes | 467 (4.9%) | 112 (1.5%) |
Time of Departure to Work by Sex in Kendall County
The most frequent times of departure to work in Kendall County are 7:00 AM to 7:29 AM (1,616, 17.1%) for males and 7:30 AM to 7:59 AM (1,184, 15.5%) for females.
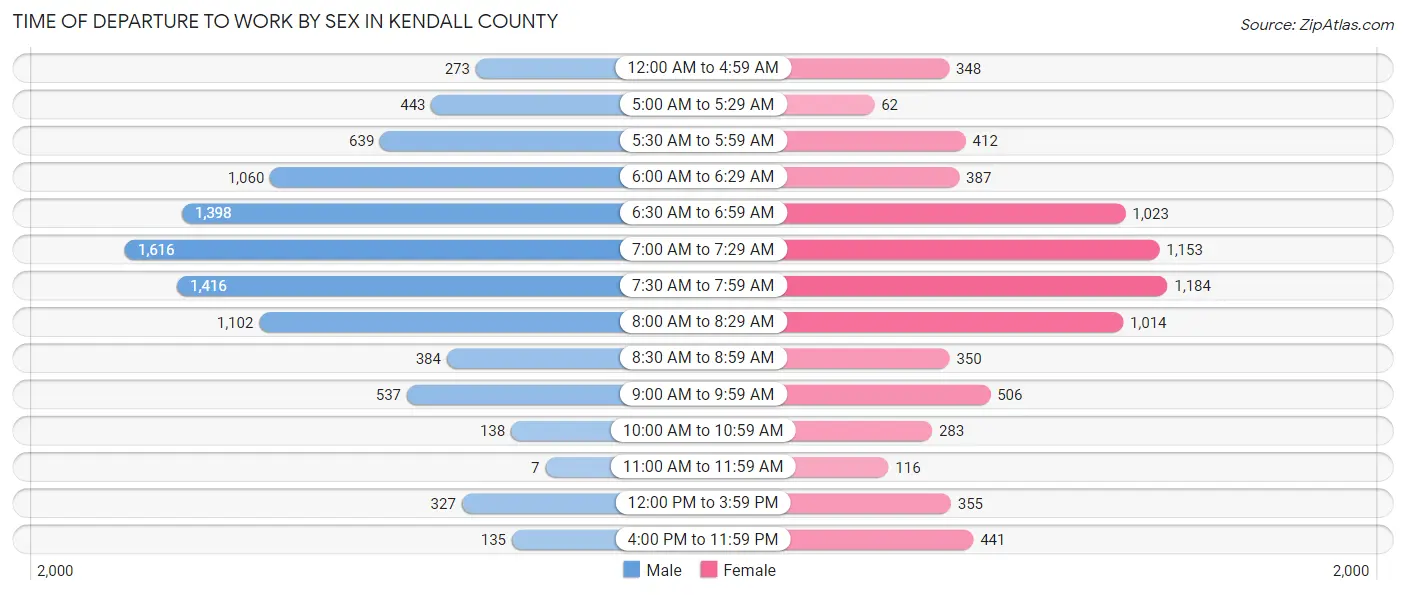
| Time of Departure | Male | Female |
| 12:00 AM to 4:59 AM | 273 (2.9%) | 348 (4.6%) |
| 5:00 AM to 5:29 AM | 443 (4.7%) | 62 (0.8%) |
| 5:30 AM to 5:59 AM | 639 (6.7%) | 412 (5.4%) |
| 6:00 AM to 6:29 AM | 1,060 (11.2%) | 387 (5.1%) |
| 6:30 AM to 6:59 AM | 1,398 (14.7%) | 1,023 (13.4%) |
| 7:00 AM to 7:29 AM | 1,616 (17.1%) | 1,153 (15.1%) |
| 7:30 AM to 7:59 AM | 1,416 (14.9%) | 1,184 (15.5%) |
| 8:00 AM to 8:29 AM | 1,102 (11.6%) | 1,014 (13.3%) |
| 8:30 AM to 8:59 AM | 384 (4.1%) | 350 (4.6%) |
| 9:00 AM to 9:59 AM | 537 (5.7%) | 506 (6.6%) |
| 10:00 AM to 10:59 AM | 138 (1.5%) | 283 (3.7%) |
| 11:00 AM to 11:59 AM | 7 (0.1%) | 116 (1.5%) |
| 12:00 PM to 3:59 PM | 327 (3.5%) | 355 (4.6%) |
| 4:00 PM to 11:59 PM | 135 (1.4%) | 441 (5.8%) |
| Total | 9,475 (100.0%) | 7,634 (100.0%) |
Housing Occupancy in Kendall County
Occupancy by Ownership in Kendall County
Of the total 16,763 dwellings in Kendall County, owner-occupied units account for 12,803 (76.4%), while renter-occupied units make up 3,960 (23.6%).
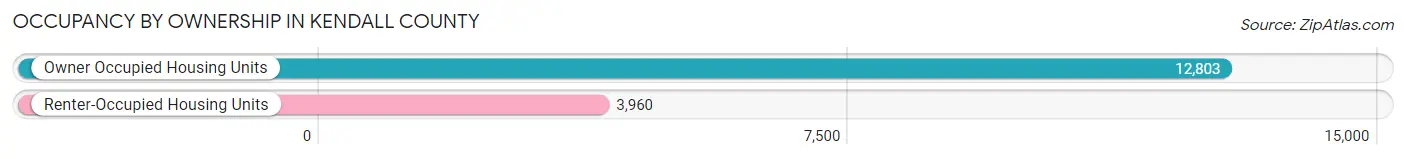
| Occupancy | # Housing Units | % Housing Units |
| Owner Occupied Housing Units | 12,803 | 76.4% |
| Renter-Occupied Housing Units | 3,960 | 23.6% |
| Total Occupied Housing Units | 16,763 | 100.0% |
Occupancy by Household Size in Kendall County
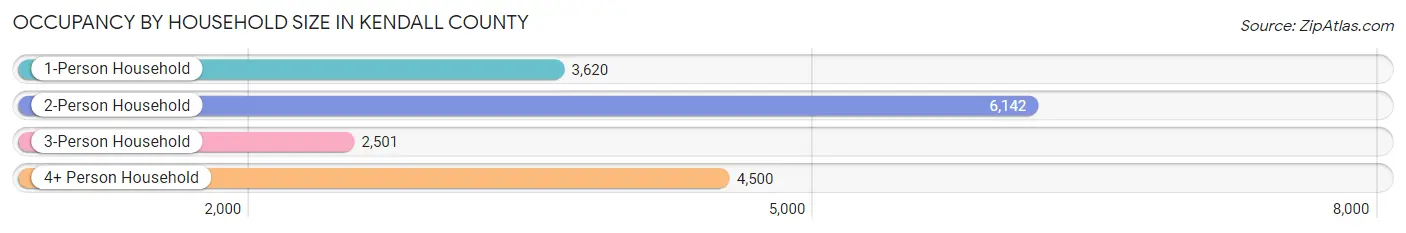
| Household Size | # Housing Units | % Housing Units |
| 1-Person Household | 3,620 | 21.6% |
| 2-Person Household | 6,142 | 36.6% |
| 3-Person Household | 2,501 | 14.9% |
| 4+ Person Household | 4,500 | 26.8% |
| Total Housing Units | 16,763 | 100.0% |
Occupancy by Ownership by Household Size in Kendall County
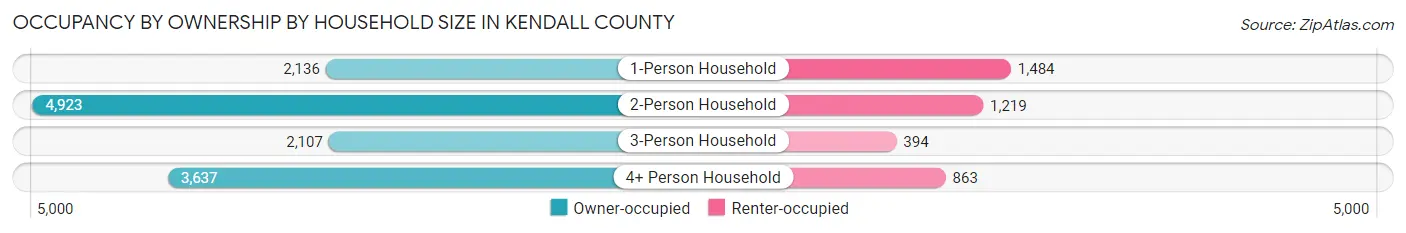
| Household Size | Owner-occupied | Renter-occupied |
| 1-Person Household | 2,136 (59.0%) | 1,484 (41.0%) |
| 2-Person Household | 4,923 (80.1%) | 1,219 (19.9%) |
| 3-Person Household | 2,107 (84.3%) | 394 (15.8%) |
| 4+ Person Household | 3,637 (80.8%) | 863 (19.2%) |
| Total Housing Units | 12,803 (76.4%) | 3,960 (23.6%) |
Occupancy by Educational Attainment in Kendall County
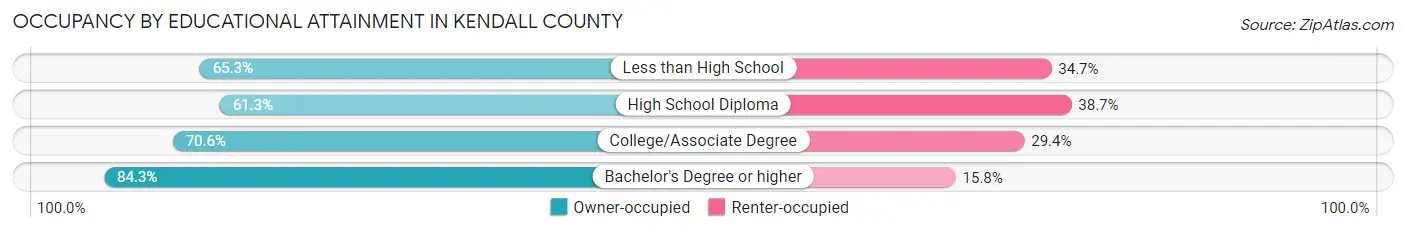
| Household Size | Owner-occupied | Renter-occupied |
| Less than High School | 515 (65.3%) | 274 (34.7%) |
| High School Diploma | 1,345 (61.3%) | 849 (38.7%) |
| College/Associate Degree | 3,456 (70.6%) | 1,437 (29.4%) |
| Bachelor's Degree or higher | 7,487 (84.3%) | 1,400 (15.8%) |
Occupancy by Age of Householder in Kendall County
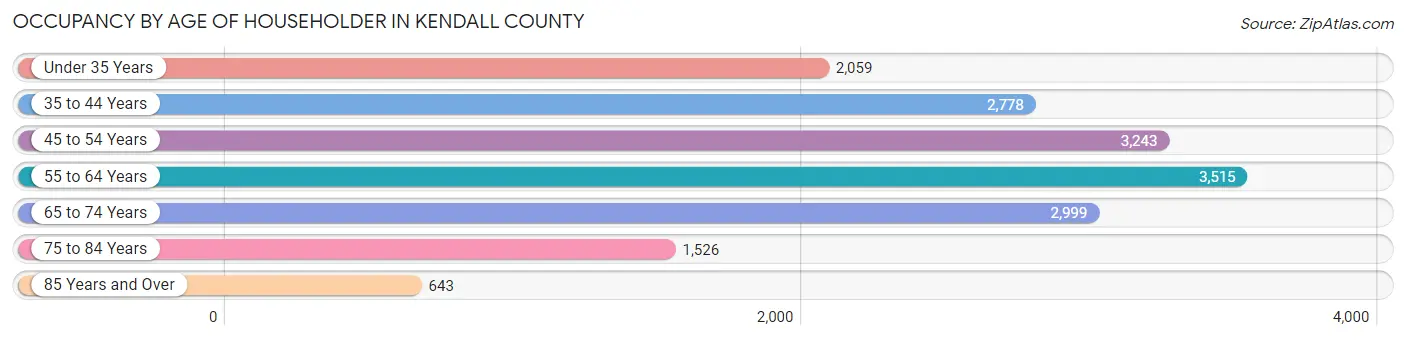
| Age Bracket | # Households | % Households |
| Under 35 Years | 2,059 | 12.3% |
| 35 to 44 Years | 2,778 | 16.6% |
| 45 to 54 Years | 3,243 | 19.4% |
| 55 to 64 Years | 3,515 | 21.0% |
| 65 to 74 Years | 2,999 | 17.9% |
| 75 to 84 Years | 1,526 | 9.1% |
| 85 Years and Over | 643 | 3.8% |
| Total | 16,763 | 100.0% |
Housing Finances in Kendall County
Median Income by Occupancy in Kendall County
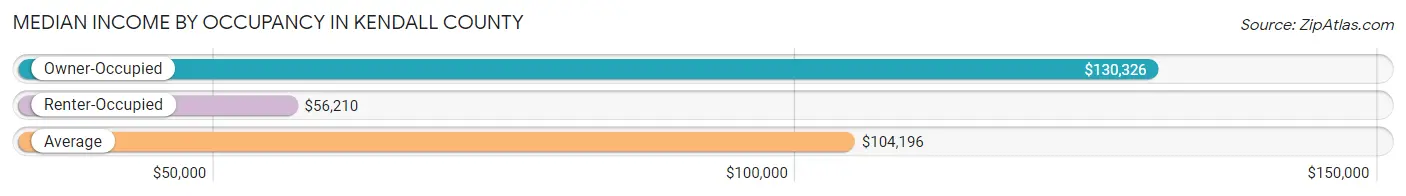
| Occupancy Type | # Households | Median Income |
| Owner-Occupied | 12,803 (76.4%) | $130,326 |
| Renter-Occupied | 3,960 (23.6%) | $56,210 |
| Average | 16,763 (100.0%) | $104,196 |
Occupancy by Householder Income Bracket in Kendall County
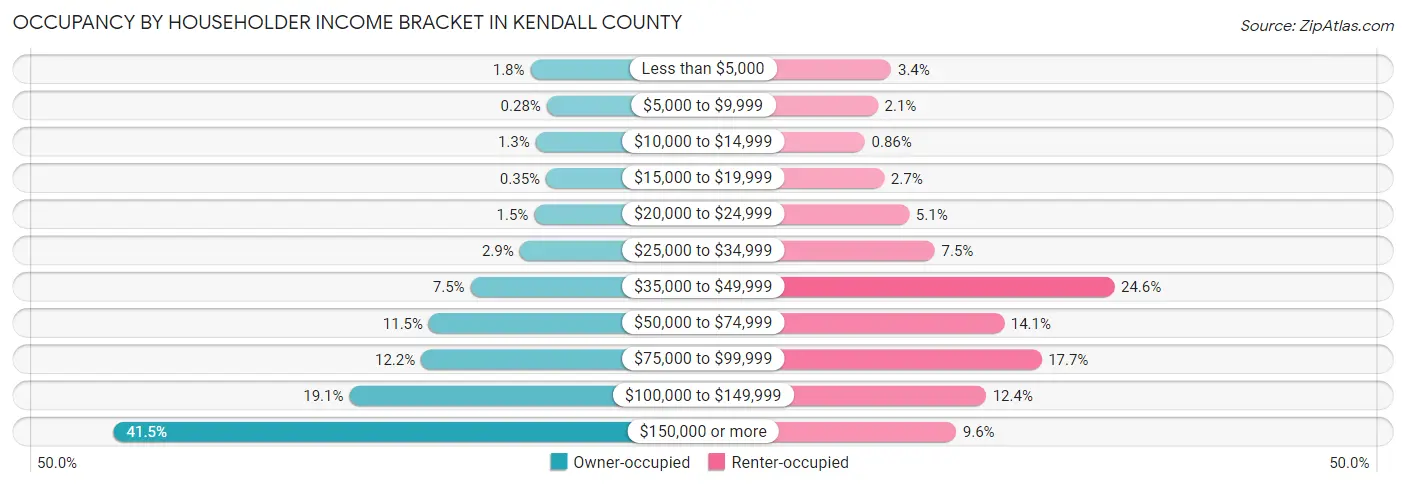
| Income Bracket | Owner-occupied | Renter-occupied |
| Less than $5,000 | 234 (1.8%) | 134 (3.4%) |
| $5,000 to $9,999 | 36 (0.3%) | 83 (2.1%) |
| $10,000 to $14,999 | 171 (1.3%) | 34 (0.9%) |
| $15,000 to $19,999 | 45 (0.4%) | 107 (2.7%) |
| $20,000 to $24,999 | 188 (1.5%) | 201 (5.1%) |
| $25,000 to $34,999 | 366 (2.9%) | 298 (7.5%) |
| $35,000 to $49,999 | 965 (7.5%) | 975 (24.6%) |
| $50,000 to $74,999 | 1,472 (11.5%) | 559 (14.1%) |
| $75,000 to $99,999 | 1,567 (12.2%) | 700 (17.7%) |
| $100,000 to $149,999 | 2,443 (19.1%) | 491 (12.4%) |
| $150,000 or more | 5,316 (41.5%) | 378 (9.6%) |
| Total | 12,803 (100.0%) | 3,960 (100.0%) |
Monthly Housing Cost Tiers in Kendall County
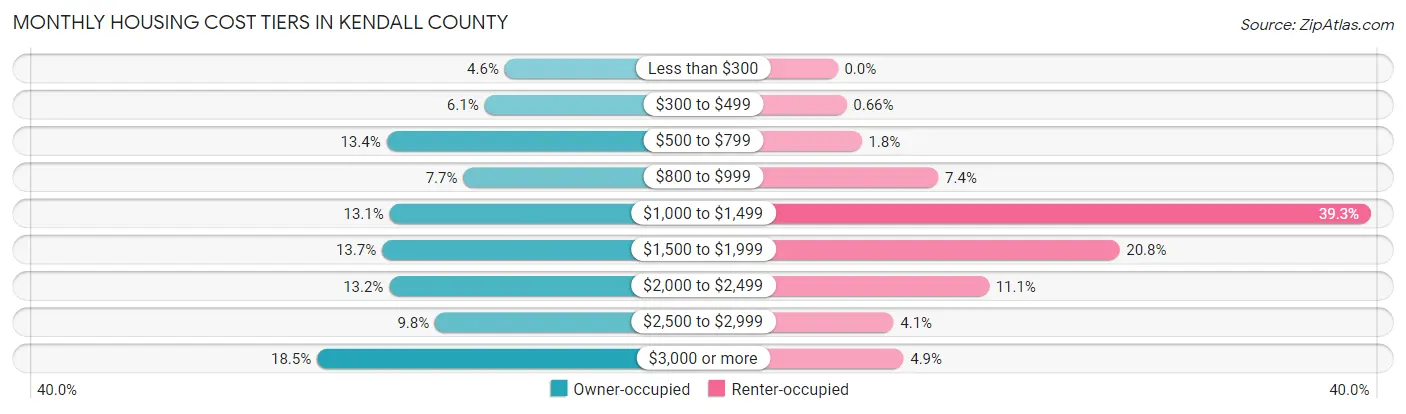
| Monthly Cost | Owner-occupied | Renter-occupied |
| Less than $300 | 594 (4.6%) | 0 (0.0%) |
| $300 to $499 | 785 (6.1%) | 26 (0.7%) |
| $500 to $799 | 1,709 (13.4%) | 70 (1.8%) |
| $800 to $999 | 985 (7.7%) | 294 (7.4%) |
| $1,000 to $1,499 | 1,680 (13.1%) | 1,556 (39.3%) |
| $1,500 to $1,999 | 1,752 (13.7%) | 822 (20.8%) |
| $2,000 to $2,499 | 1,684 (13.2%) | 441 (11.1%) |
| $2,500 to $2,999 | 1,251 (9.8%) | 163 (4.1%) |
| $3,000 or more | 2,363 (18.5%) | 192 (4.9%) |
| Total | 12,803 (100.0%) | 3,960 (100.0%) |
Physical Housing Characteristics in Kendall County
Housing Structures in Kendall County
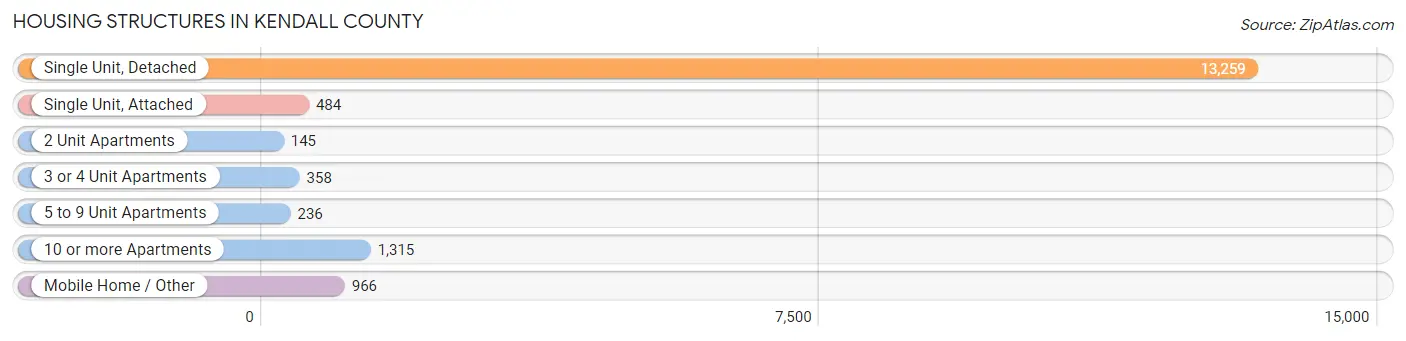
| Structure Type | # Housing Units | % Housing Units |
| Single Unit, Detached | 13,259 | 79.1% |
| Single Unit, Attached | 484 | 2.9% |
| 2 Unit Apartments | 145 | 0.9% |
| 3 or 4 Unit Apartments | 358 | 2.1% |
| 5 to 9 Unit Apartments | 236 | 1.4% |
| 10 or more Apartments | 1,315 | 7.8% |
| Mobile Home / Other | 966 | 5.8% |
| Total | 16,763 | 100.0% |
Housing Structures by Occupancy in Kendall County
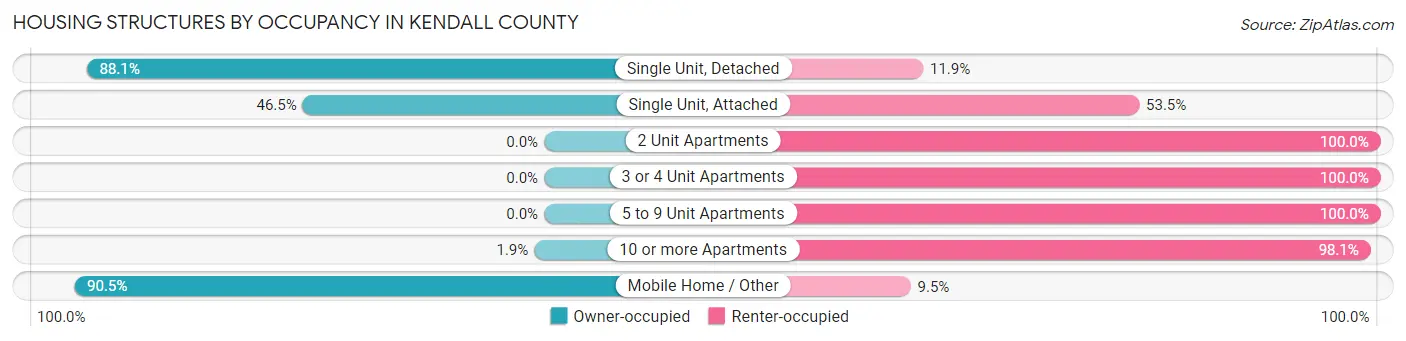
| Structure Type | Owner-occupied | Renter-occupied |
| Single Unit, Detached | 11,679 (88.1%) | 1,580 (11.9%) |
| Single Unit, Attached | 225 (46.5%) | 259 (53.5%) |
| 2 Unit Apartments | 0 (0.0%) | 145 (100.0%) |
| 3 or 4 Unit Apartments | 0 (0.0%) | 358 (100.0%) |
| 5 to 9 Unit Apartments | 0 (0.0%) | 236 (100.0%) |
| 10 or more Apartments | 25 (1.9%) | 1,290 (98.1%) |
| Mobile Home / Other | 874 (90.5%) | 92 (9.5%) |
| Total | 12,803 (76.4%) | 3,960 (23.6%) |
Housing Structures by Number of Rooms in Kendall County
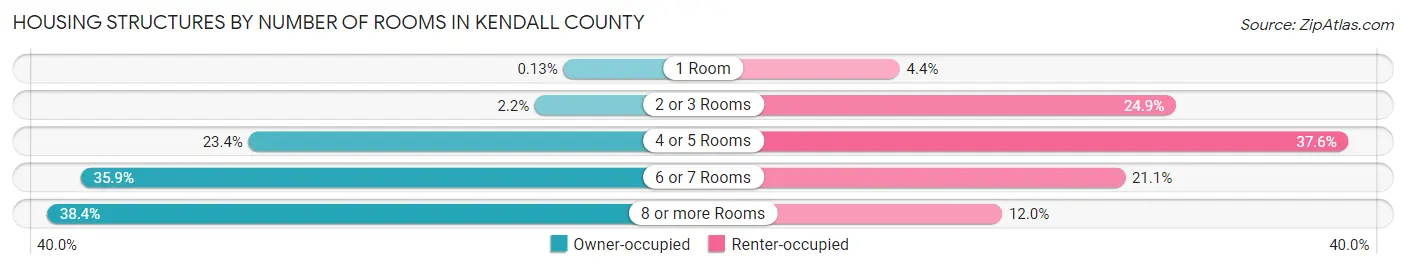
| Number of Rooms | Owner-occupied | Renter-occupied |
| 1 Room | 17 (0.1%) | 175 (4.4%) |
| 2 or 3 Rooms | 286 (2.2%) | 985 (24.9%) |
| 4 or 5 Rooms | 2,999 (23.4%) | 1,490 (37.6%) |
| 6 or 7 Rooms | 4,591 (35.9%) | 835 (21.1%) |
| 8 or more Rooms | 4,910 (38.4%) | 475 (12.0%) |
| Total | 12,803 (100.0%) | 3,960 (100.0%) |
Housing Structure by Heating Type in Kendall County
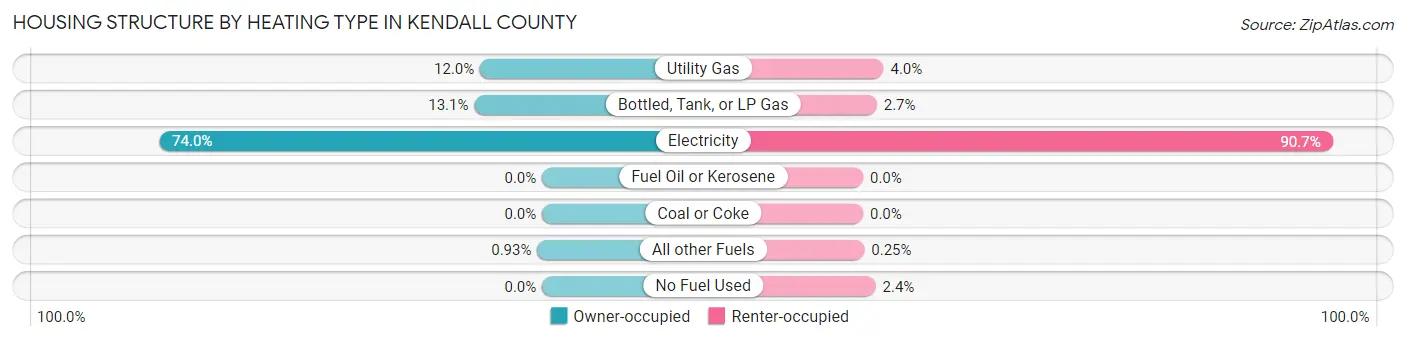
| Heating Type | Owner-occupied | Renter-occupied |
| Utility Gas | 1,534 (12.0%) | 157 (4.0%) |
| Bottled, Tank, or LP Gas | 1,677 (13.1%) | 105 (2.6%) |
| Electricity | 9,473 (74.0%) | 3,592 (90.7%) |
| Fuel Oil or Kerosene | 0 (0.0%) | 0 (0.0%) |
| Coal or Coke | 0 (0.0%) | 0 (0.0%) |
| All other Fuels | 119 (0.9%) | 10 (0.3%) |
| No Fuel Used | 0 (0.0%) | 96 (2.4%) |
| Total | 12,803 (100.0%) | 3,960 (100.0%) |
Household Vehicle Usage in Kendall County
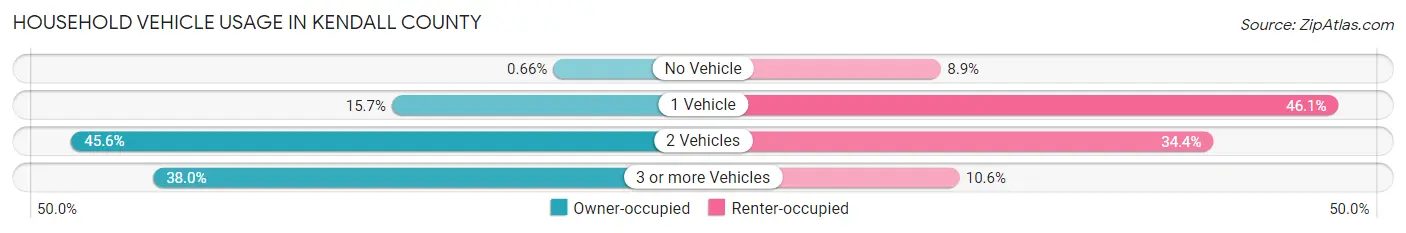
| Vehicles per Household | Owner-occupied | Renter-occupied |
| No Vehicle | 85 (0.7%) | 353 (8.9%) |
| 1 Vehicle | 2,012 (15.7%) | 1,824 (46.1%) |
| 2 Vehicles | 5,842 (45.6%) | 1,362 (34.4%) |
| 3 or more Vehicles | 4,864 (38.0%) | 421 (10.6%) |
| Total | 12,803 (100.0%) | 3,960 (100.0%) |
Real Estate & Mortgages in Kendall County
Real Estate and Mortgage Overview in Kendall County
| Characteristic | Without Mortgage | With Mortgage |
| Housing Units | 5,723 | 7,080 |
| Median Property Value | $468,600 | $460,600 |
| Median Household Income | $100,669 | $3,371 |
| Monthly Housing Costs | $806 | $2,219 |
| Real Estate Taxes | $4,524 | $336 |
Property Value by Mortgage Status in Kendall County
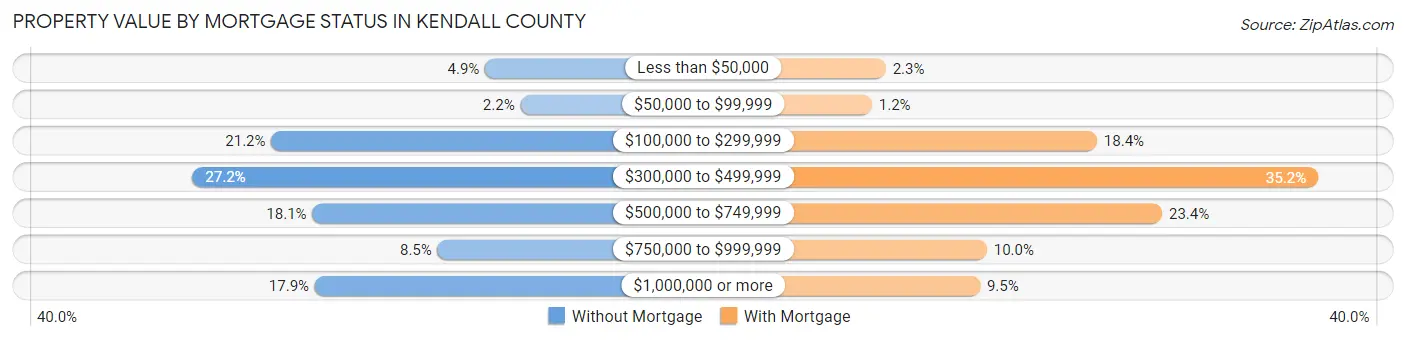
| Property Value | Without Mortgage | With Mortgage |
| Less than $50,000 | 281 (4.9%) | 163 (2.3%) |
| $50,000 to $99,999 | 127 (2.2%) | 88 (1.2%) |
| $100,000 to $299,999 | 1,213 (21.2%) | 1,302 (18.4%) |
| $300,000 to $499,999 | 1,557 (27.2%) | 2,495 (35.2%) |
| $500,000 to $749,999 | 1,034 (18.1%) | 1,653 (23.4%) |
| $750,000 to $999,999 | 488 (8.5%) | 708 (10.0%) |
| $1,000,000 or more | 1,023 (17.9%) | 671 (9.5%) |
| Total | 5,723 (100.0%) | 7,080 (100.0%) |
Household Income by Mortgage Status in Kendall County
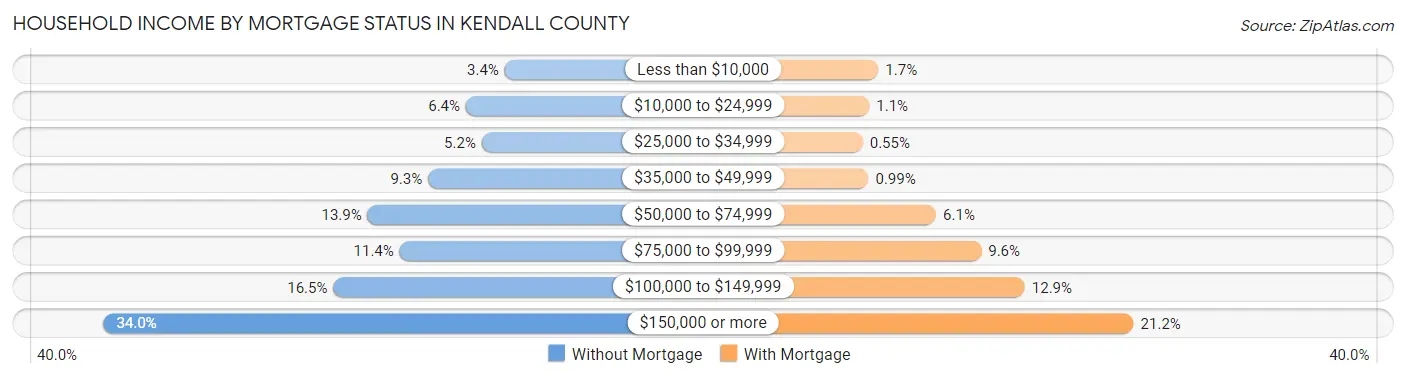
| Household Income | Without Mortgage | With Mortgage |
| Less than $10,000 | 196 (3.4%) | 123 (1.7%) |
| $10,000 to $24,999 | 365 (6.4%) | 74 (1.1%) |
| $25,000 to $34,999 | 296 (5.2%) | 39 (0.5%) |
| $35,000 to $49,999 | 530 (9.3%) | 70 (1.0%) |
| $50,000 to $74,999 | 794 (13.9%) | 435 (6.1%) |
| $75,000 to $99,999 | 654 (11.4%) | 678 (9.6%) |
| $100,000 to $149,999 | 943 (16.5%) | 913 (12.9%) |
| $150,000 or more | 1,945 (34.0%) | 1,500 (21.2%) |
| Total | 5,723 (100.0%) | 7,080 (100.0%) |
Property Value to Household Income Ratio in Kendall County
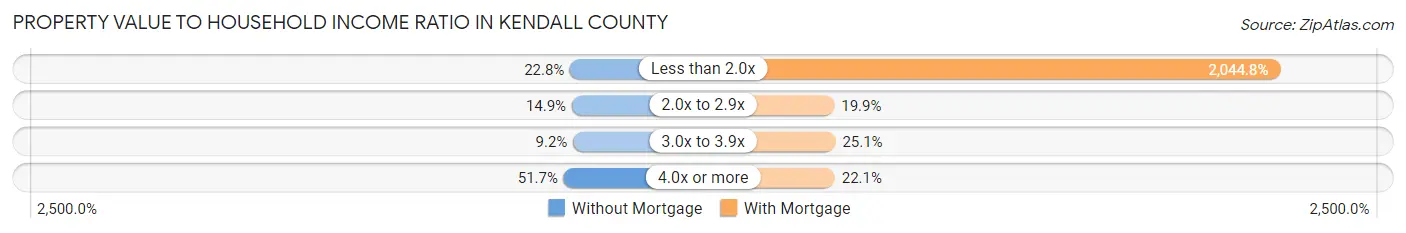
| Value-to-Income Ratio | Without Mortgage | With Mortgage |
| Less than 2.0x | 1,305 (22.8%) | 144,770 (2,044.8%) |
| 2.0x to 2.9x | 852 (14.9%) | 1,412 (19.9%) |
| 3.0x to 3.9x | 529 (9.2%) | 1,780 (25.1%) |
| 4.0x or more | 2,961 (51.7%) | 1,565 (22.1%) |
| Total | 5,723 (100.0%) | 7,080 (100.0%) |
Real Estate Taxes by Mortgage Status in Kendall County
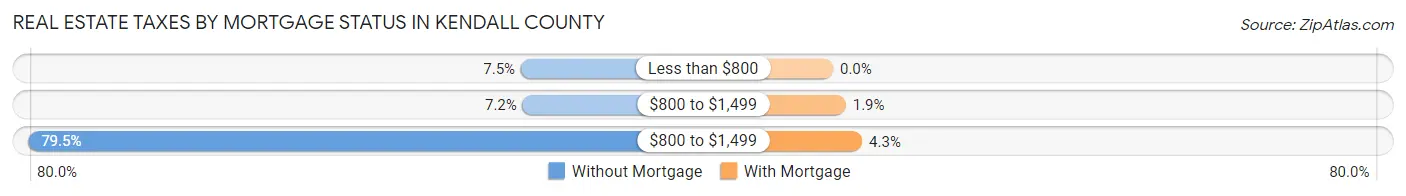
| Property Taxes | Without Mortgage | With Mortgage |
| Less than $800 | 428 (7.5%) | 0 (0.0%) |
| $800 to $1,499 | 414 (7.2%) | 132 (1.9%) |
| $800 to $1,499 | 4,548 (79.5%) | 301 (4.3%) |
| Total | 5,723 (100.0%) | 7,080 (100.0%) |
Health & Disability in Kendall County
Health Insurance Coverage by Age in Kendall County
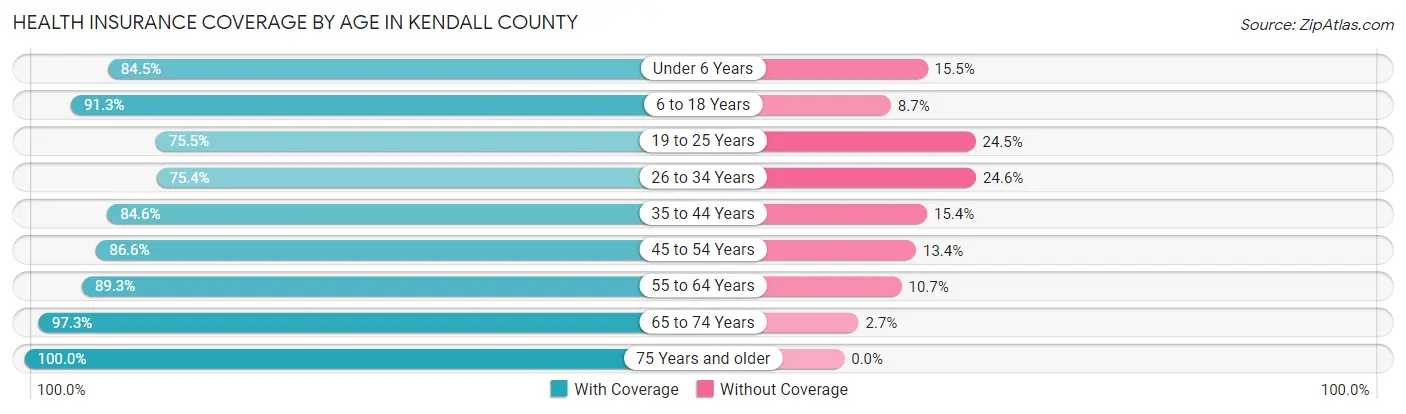
| Age Bracket | With Coverage | Without Coverage |
| Under 6 Years | 2,114 (84.5%) | 389 (15.5%) |
| 6 to 18 Years | 7,703 (91.3%) | 733 (8.7%) |
| 19 to 25 Years | 2,456 (75.5%) | 796 (24.5%) |
| 26 to 34 Years | 2,873 (75.4%) | 937 (24.6%) |
| 35 to 44 Years | 5,048 (84.6%) | 921 (15.4%) |
| 45 to 54 Years | 5,210 (86.6%) | 805 (13.4%) |
| 55 to 64 Years | 5,589 (89.3%) | 668 (10.7%) |
| 65 to 74 Years | 4,885 (97.3%) | 134 (2.7%) |
| 75 Years and older | 3,570 (100.0%) | 0 (0.0%) |
| Total | 39,448 (88.0%) | 5,383 (12.0%) |
Health Insurance Coverage by Citizenship Status in Kendall County
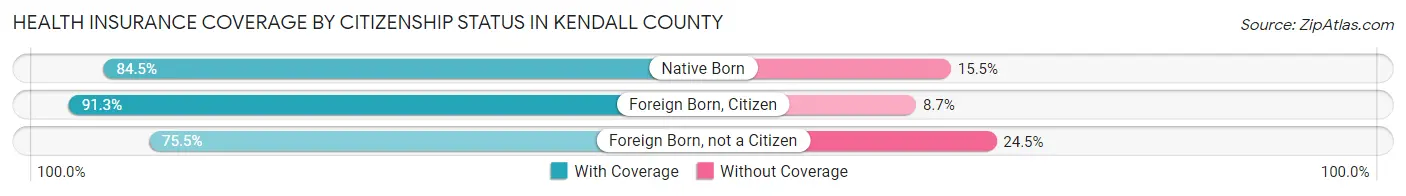
| Citizenship Status | With Coverage | Without Coverage |
| Native Born | 2,114 (84.5%) | 389 (15.5%) |
| Foreign Born, Citizen | 7,703 (91.3%) | 733 (8.7%) |
| Foreign Born, not a Citizen | 2,456 (75.5%) | 796 (24.5%) |
Health Insurance Coverage by Household Income in Kendall County
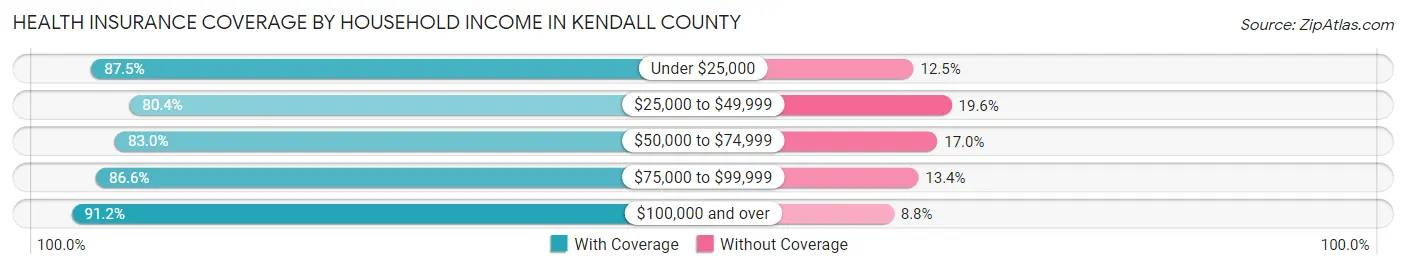
| Household Income | With Coverage | Without Coverage |
| Under $25,000 | 1,650 (87.5%) | 236 (12.5%) |
| $25,000 to $49,999 | 4,713 (80.4%) | 1,152 (19.6%) |
| $50,000 to $74,999 | 4,084 (83.0%) | 834 (17.0%) |
| $75,000 to $99,999 | 5,968 (86.6%) | 924 (13.4%) |
| $100,000 and over | 22,993 (91.2%) | 2,219 (8.8%) |
Public vs Private Health Insurance Coverage by Age in Kendall County
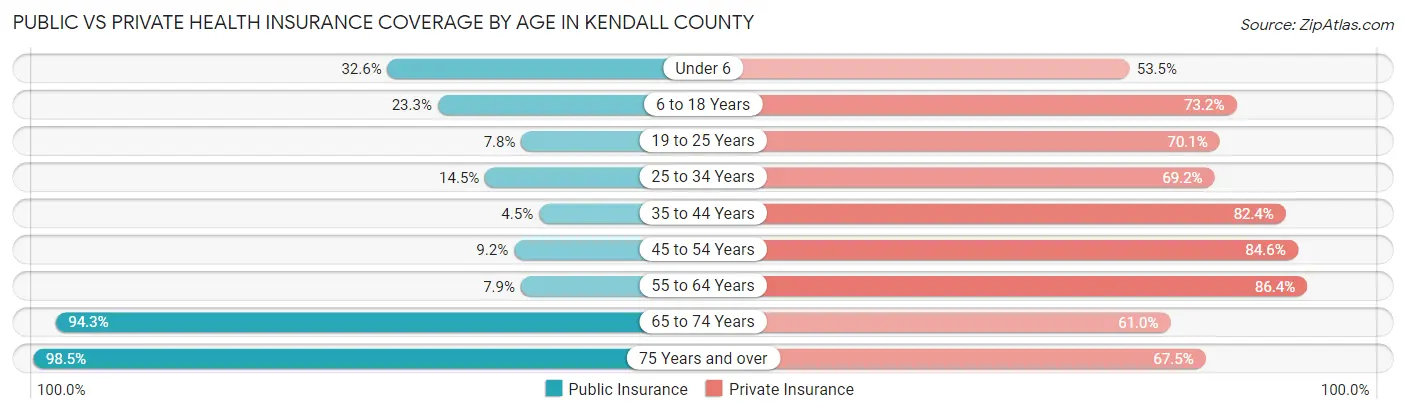
| Age Bracket | Public Insurance | Private Insurance |
| Under 6 | 817 (32.6%) | 1,338 (53.5%) |
| 6 to 18 Years | 1,967 (23.3%) | 6,176 (73.2%) |
| 19 to 25 Years | 254 (7.8%) | 2,280 (70.1%) |
| 25 to 34 Years | 553 (14.5%) | 2,635 (69.2%) |
| 35 to 44 Years | 270 (4.5%) | 4,918 (82.4%) |
| 45 to 54 Years | 551 (9.2%) | 5,088 (84.6%) |
| 55 to 64 Years | 494 (7.9%) | 5,403 (86.4%) |
| 65 to 74 Years | 4,733 (94.3%) | 3,060 (61.0%) |
| 75 Years and over | 3,515 (98.5%) | 2,410 (67.5%) |
| Total | 13,154 (29.3%) | 33,308 (74.3%) |
Disability Status by Sex by Age in Kendall County
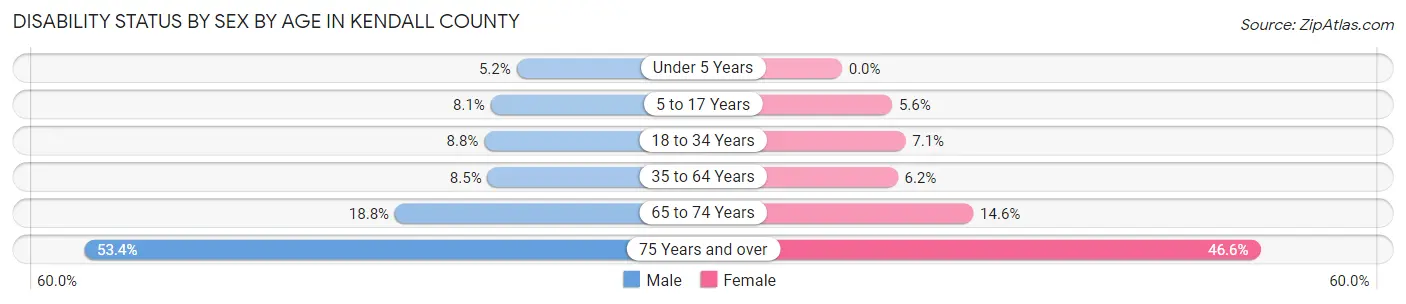
| Age Bracket | Male | Female |
| Under 5 Years | 56 (5.2%) | 0 (0.0%) |
| 5 to 17 Years | 345 (8.1%) | 221 (5.6%) |
| 18 to 34 Years | 350 (8.8%) | 268 (7.1%) |
| 35 to 64 Years | 747 (8.5%) | 584 (6.2%) |
| 65 to 74 Years | 449 (18.8%) | 384 (14.6%) |
| 75 Years and over | 838 (53.4%) | 932 (46.6%) |
Disability Class by Sex by Age in Kendall County
Disability Class: Hearing Difficulty
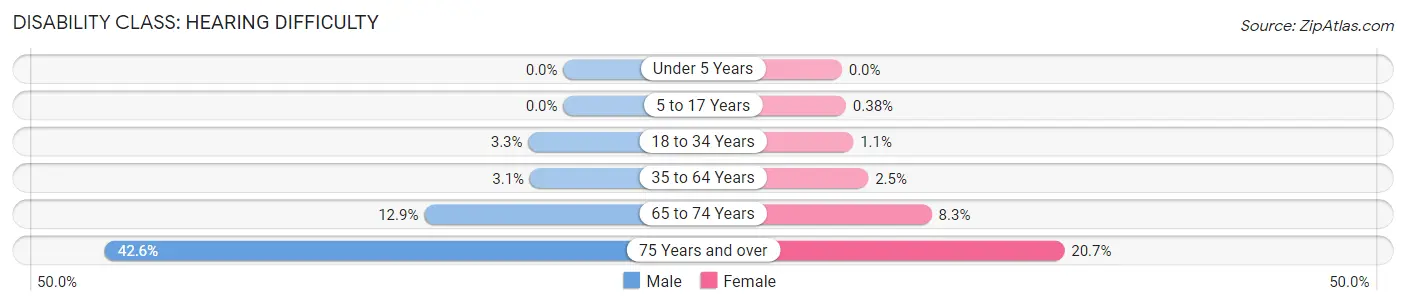
| Age Bracket | Male | Female |
| Under 5 Years | 0 (0.0%) | 0 (0.0%) |
| 5 to 17 Years | 0 (0.0%) | 15 (0.4%) |
| 18 to 34 Years | 129 (3.3%) | 40 (1.1%) |
| 35 to 64 Years | 274 (3.1%) | 230 (2.5%) |
| 65 to 74 Years | 309 (12.9%) | 219 (8.3%) |
| 75 Years and over | 668 (42.5%) | 413 (20.6%) |
Disability Class: Vision Difficulty
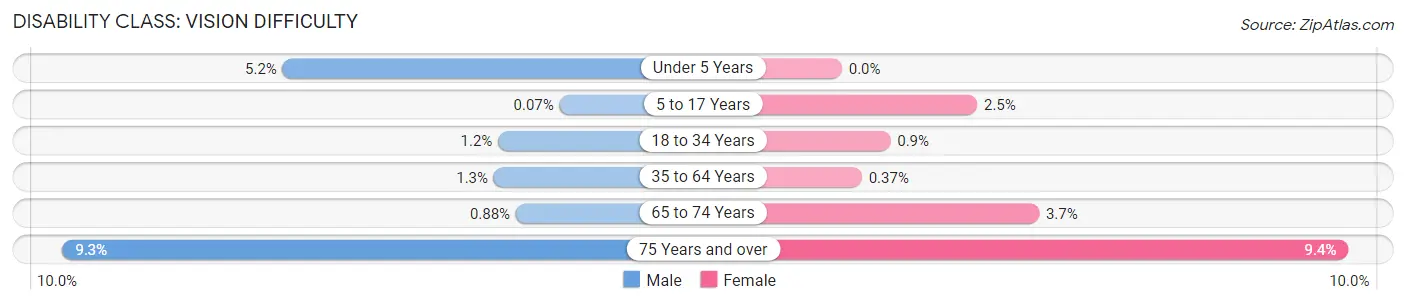
| Age Bracket | Male | Female |
| Under 5 Years | 56 (5.2%) | 0 (0.0%) |
| 5 to 17 Years | 3 (0.1%) | 99 (2.5%) |
| 18 to 34 Years | 48 (1.2%) | 34 (0.9%) |
| 35 to 64 Years | 114 (1.3%) | 35 (0.4%) |
| 65 to 74 Years | 21 (0.9%) | 96 (3.7%) |
| 75 Years and over | 146 (9.3%) | 188 (9.4%) |
Disability Class: Cognitive Difficulty
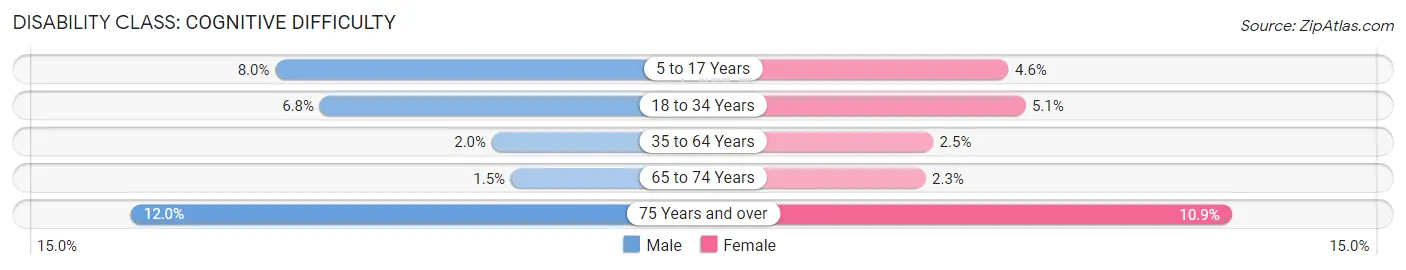
| Age Bracket | Male | Female |
| 5 to 17 Years | 342 (8.0%) | 183 (4.6%) |
| 18 to 34 Years | 269 (6.8%) | 193 (5.1%) |
| 35 to 64 Years | 176 (2.0%) | 238 (2.5%) |
| 65 to 74 Years | 35 (1.5%) | 61 (2.3%) |
| 75 Years and over | 189 (12.0%) | 217 (10.8%) |
Disability Class: Ambulatory Difficulty
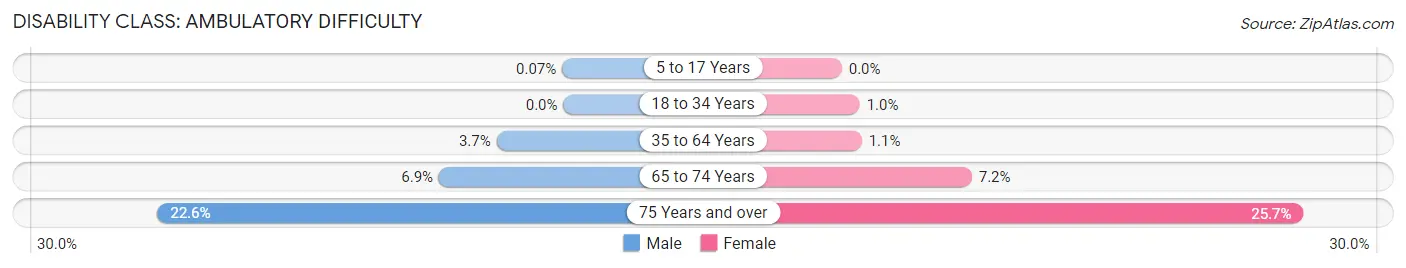
| Age Bracket | Male | Female |
| 5 to 17 Years | 3 (0.1%) | 0 (0.0%) |
| 18 to 34 Years | 0 (0.0%) | 38 (1.0%) |
| 35 to 64 Years | 329 (3.7%) | 104 (1.1%) |
| 65 to 74 Years | 166 (6.9%) | 190 (7.2%) |
| 75 Years and over | 355 (22.6%) | 514 (25.7%) |
Disability Class: Self-Care Difficulty
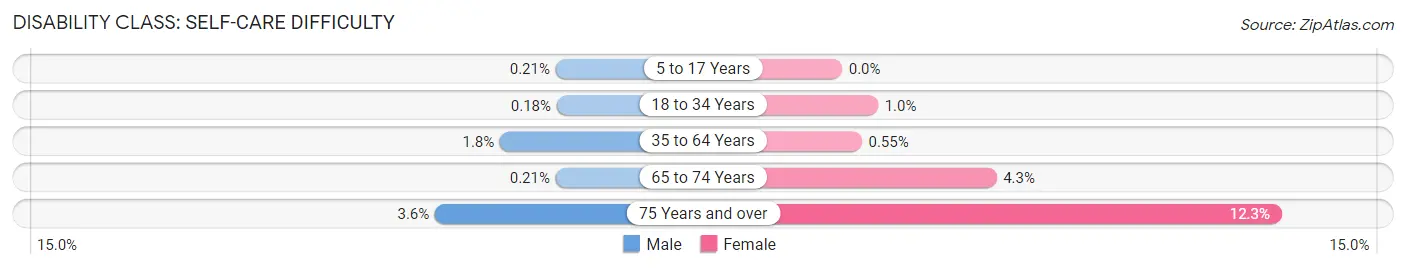
| Age Bracket | Male | Female |
| 5 to 17 Years | 9 (0.2%) | 0 (0.0%) |
| 18 to 34 Years | 7 (0.2%) | 38 (1.0%) |
| 35 to 64 Years | 156 (1.8%) | 52 (0.5%) |
| 65 to 74 Years | 5 (0.2%) | 113 (4.3%) |
| 75 Years and over | 56 (3.6%) | 245 (12.2%) |
Technology Access in Kendall County
Computing Device Access in Kendall County
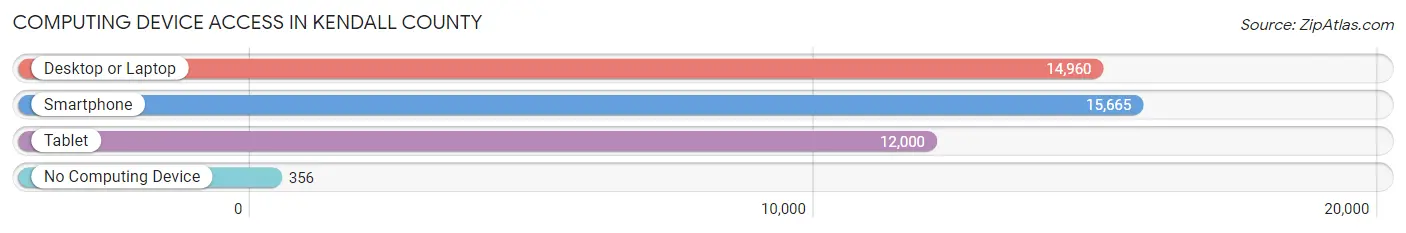
| Device Type | # Households | % Households |
| Desktop or Laptop | 14,960 | 89.2% |
| Smartphone | 15,665 | 93.4% |
| Tablet | 12,000 | 71.6% |
| No Computing Device | 356 | 2.1% |
| Total | 16,763 | 100.0% |
Internet Access in Kendall County
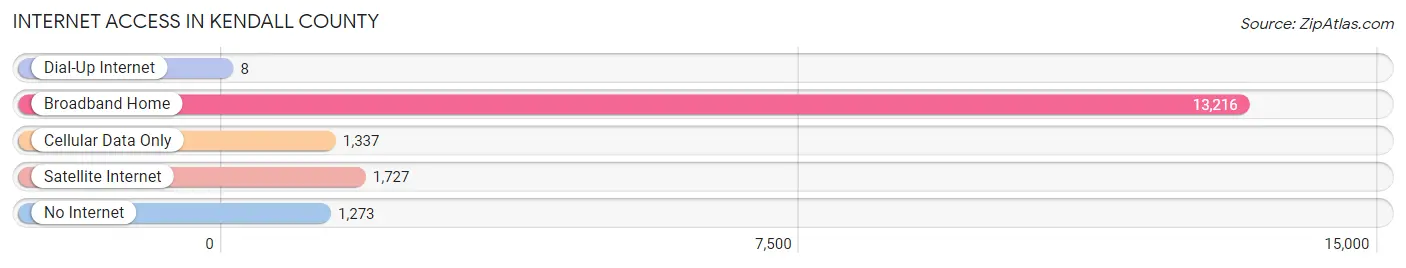
| Internet Type | # Households | % Households |
| Dial-Up Internet | 8 | 0.1% |
| Broadband Home | 13,216 | 78.8% |
| Cellular Data Only | 1,337 | 8.0% |
| Satellite Internet | 1,727 | 10.3% |
| No Internet | 1,273 | 7.6% |
| Total | 16,763 | 100.0% |
Kendall County Summary
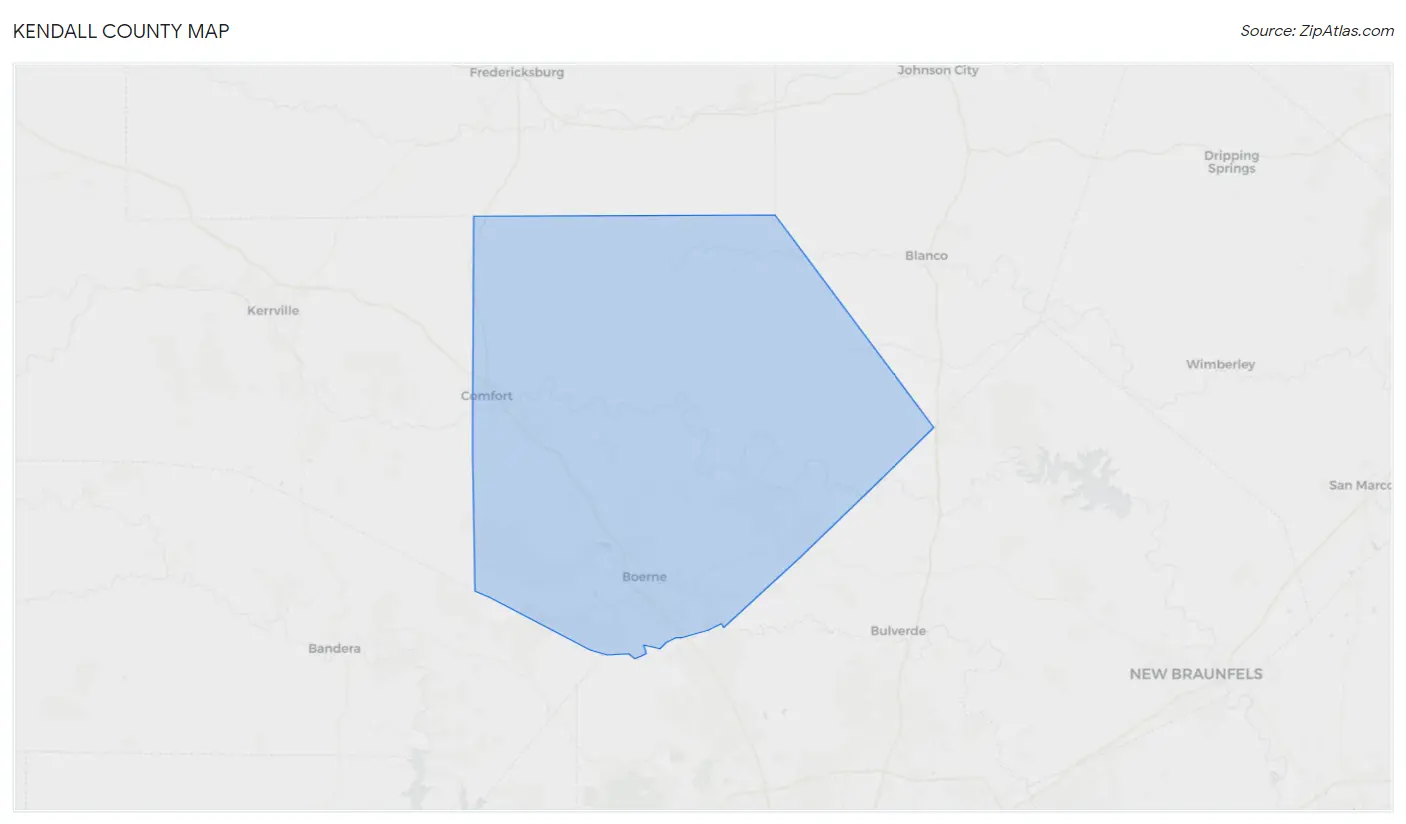
Kendall County is located in the Texas Hill Country, about 30 miles northwest of San Antonio. It is bordered by Blanco, Comal, Kerr, Bandera, and Gillespie counties. The county seat is Boerne, and the county is named after George Wilkins Kendall, a journalist and Mexican-American War correspondent.
Geography
Kendall County covers an area of 876 square miles, with a population density of about 40 people per square mile. The terrain is mostly hilly, with elevations ranging from 600 to 1,400 feet. The county is drained by the Guadalupe River, which forms its eastern boundary. The county is home to several state parks, including Guadalupe River State Park, Lost Maples State Natural Area, and Hill Country State Natural Area.
Economy
Kendall County has a diverse economy, with a mix of agriculture, manufacturing, and services. The county is home to several large employers, including the Boerne Independent School District, the City of Boerne, and the Kendall County Hospital. The county is also home to several wineries, breweries, and distilleries.
Agriculture is a major part of the county’s economy, with cattle, sheep, goats, and horses being the main livestock raised. The county is also home to several large farms, which produce hay, corn, wheat, and other crops.
Demographics
As of the 2010 census, Kendall County had a population of 33,410. The population is predominantly white (83.3%), with a small Hispanic population (14.2%). The median household income is $68,845, and the median home value is $223,000.
The county is home to several small towns, including Boerne, Comfort, and Bergheim. Boerne is the county seat and the largest town, with a population of 10,471. Comfort is the second-largest town, with a population of 2,363.
Conclusion
Kendall County is a diverse and vibrant county located in the Texas Hill Country. It is home to several large employers, and its economy is based on a mix of agriculture, manufacturing, and services. The county is predominantly white, with a small Hispanic population. It is home to several small towns, including Boerne, Comfort, and Bergheim. Kendall County is a great place to live, work, and play.
Common Questions
What is Per Capita Income in Kendall County?
Per Capita income in Kendall County is $56,063.
What is the Median Family Income in Kendall County?
Median Family Income in Kendall County is $124,690.
What is the Median Household income in Kendall County?
Median Household Income in Kendall County is $104,196.
What is Income or Wage Gap in Kendall County?
Income or Wage Gap in Kendall County is 42.7%.
Women in Kendall County earn 57.3 cents for every dollar earned by a man.
What is Family Income Deficit in Kendall County?
Family Income Deficit in Kendall County is $15,834.
Families that are below poverty line in Kendall County earn $15,834 less on average than the poverty threshold level.
What is Inequality or Gini Index in Kendall County?
Inequality or Gini Index in Kendall County is 0.48.
What is the Total Population of Kendall County?
Total Population of Kendall County is 45,376.
What is the Total Male Population of Kendall County?
Total Male Population of Kendall County is 22,351.
What is the Total Female Population of Kendall County?
Total Female Population of Kendall County is 23,025.
What is the Ratio of Males per 100 Females in Kendall County?
There are 97.07 Males per 100 Females in Kendall County.
What is the Ratio of Females per 100 Males in Kendall County?
There are 103.02 Females per 100 Males in Kendall County.
What is the Median Population Age in Kendall County?
Median Population Age in Kendall County is 42.6 Years.
What is the Average Family Size in Kendall County
Average Family Size in Kendall County is 3.1 People.
What is the Average Household Size in Kendall County
Average Household Size in Kendall County is 2.7 People.
How Large is the Labor Force in Kendall County?
There are 22,509 People in the Labor Forcein in Kendall County.
What is the Percentage of People in the Labor Force in Kendall County?
61.8% of People are in the Labor Force in Kendall County.
What is the Unemployment Rate in Kendall County?
Unemployment Rate in Kendall County is 4.8%.