Kaufman County, TX Map & Demographics
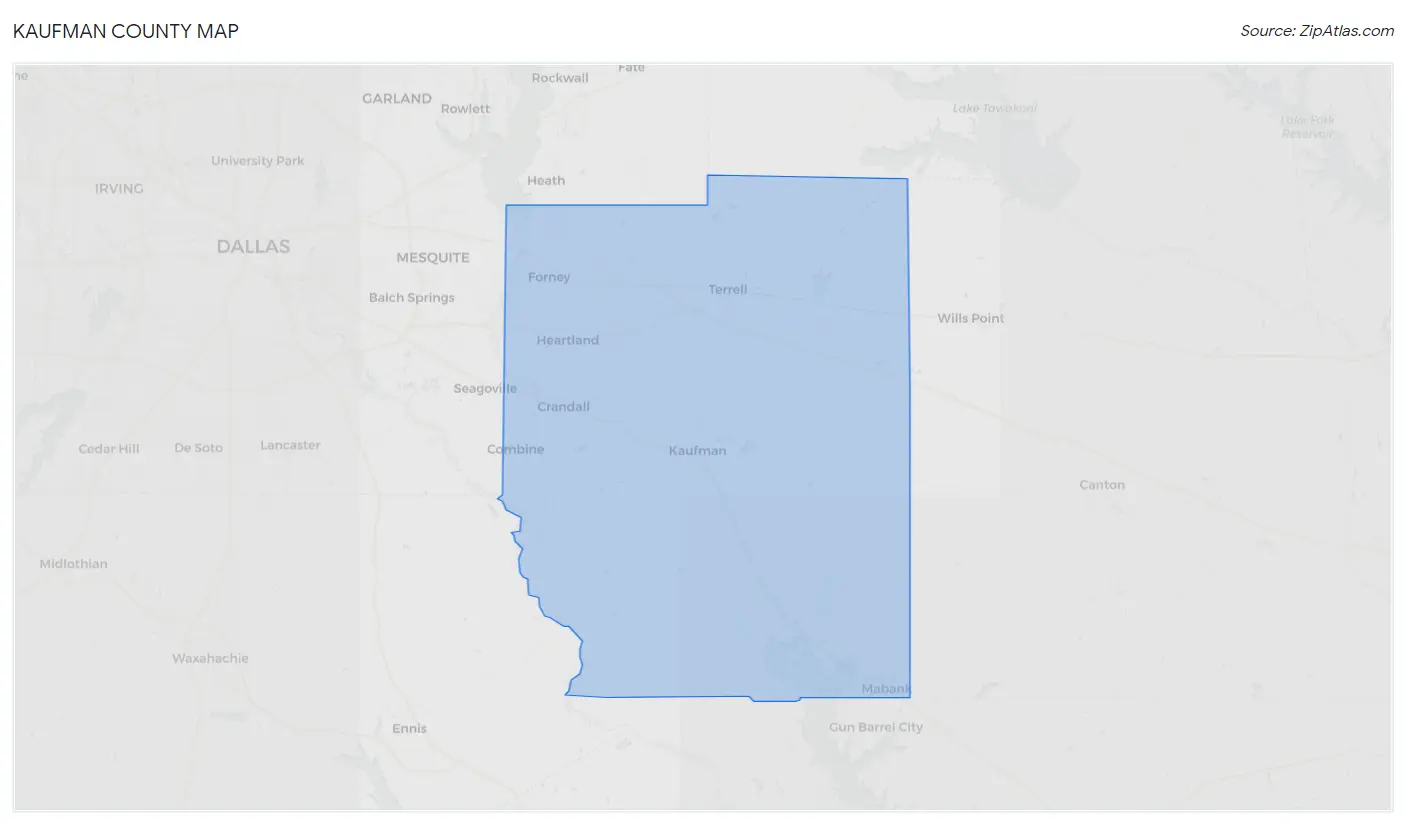
Kaufman County Map
Kaufman County Overview
$33,250
PER CAPITA INCOME
$95,129
AVG FAMILY INCOME
$84,075
AVG HOUSEHOLD INCOME
30.1%
WAGE / INCOME GAP [ % ]
69.9¢/ $1
WAGE / INCOME GAP [ $ ]
$12,584
FAMILY INCOME DEFICIT
0.39
INEQUALITY / GINI INDEX
149,773
TOTAL POPULATION
74,364
MALE POPULATION
75,409
FEMALE POPULATION
98.61
MALES / 100 FEMALES
101.41
FEMALES / 100 MALES
34.6
MEDIAN AGE
3.5
AVG FAMILY SIZE
3.1
AVG HOUSEHOLD SIZE
77,050
LABOR FORCE [ PEOPLE ]
68.5%
PERCENT IN LABOR FORCE
4.9%
UNEMPLOYMENT RATE
Income in Kaufman County
Income Overview in Kaufman County
Per Capita Income in Kaufman County is $33,250, while median incomes of families and households are $95,129 and $84,075 respectively.
| Characteristic | Number | Measure |
| Per Capita Income | 149,773 | $33,250 |
| Median Family Income | 37,245 | $95,129 |
| Mean Family Income | 37,245 | $109,229 |
| Median Household Income | 47,899 | $84,075 |
| Mean Household Income | 47,899 | $99,652 |
| Income Deficit | 37,245 | $12,584 |
| Wage / Income Gap (%) | 149,773 | 30.14% |
| Wage / Income Gap ($) | 149,773 | 69.86¢ per $1 |
| Gini / Inequality Index | 149,773 | 0.39 |
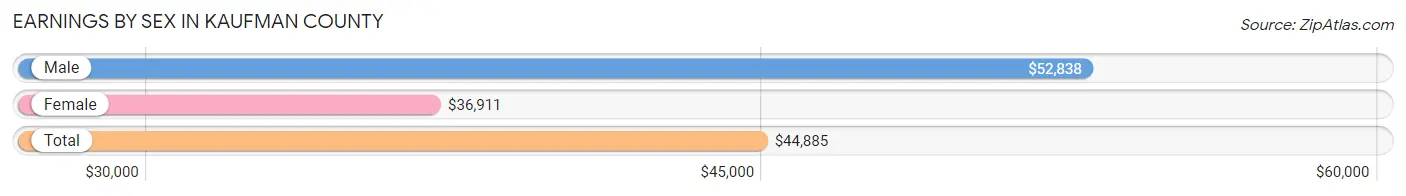
Earnings by Sex in Kaufman County
Average Earnings in Kaufman County are $44,885, $52,838 for men and $36,911 for women, a difference of 30.1%.
| Sex | Number | Average Earnings |
| Male | 42,590 (53.6%) | $52,838 |
| Female | 36,897 (46.4%) | $36,911 |
| Total | 79,487 (100.0%) | $44,885 |
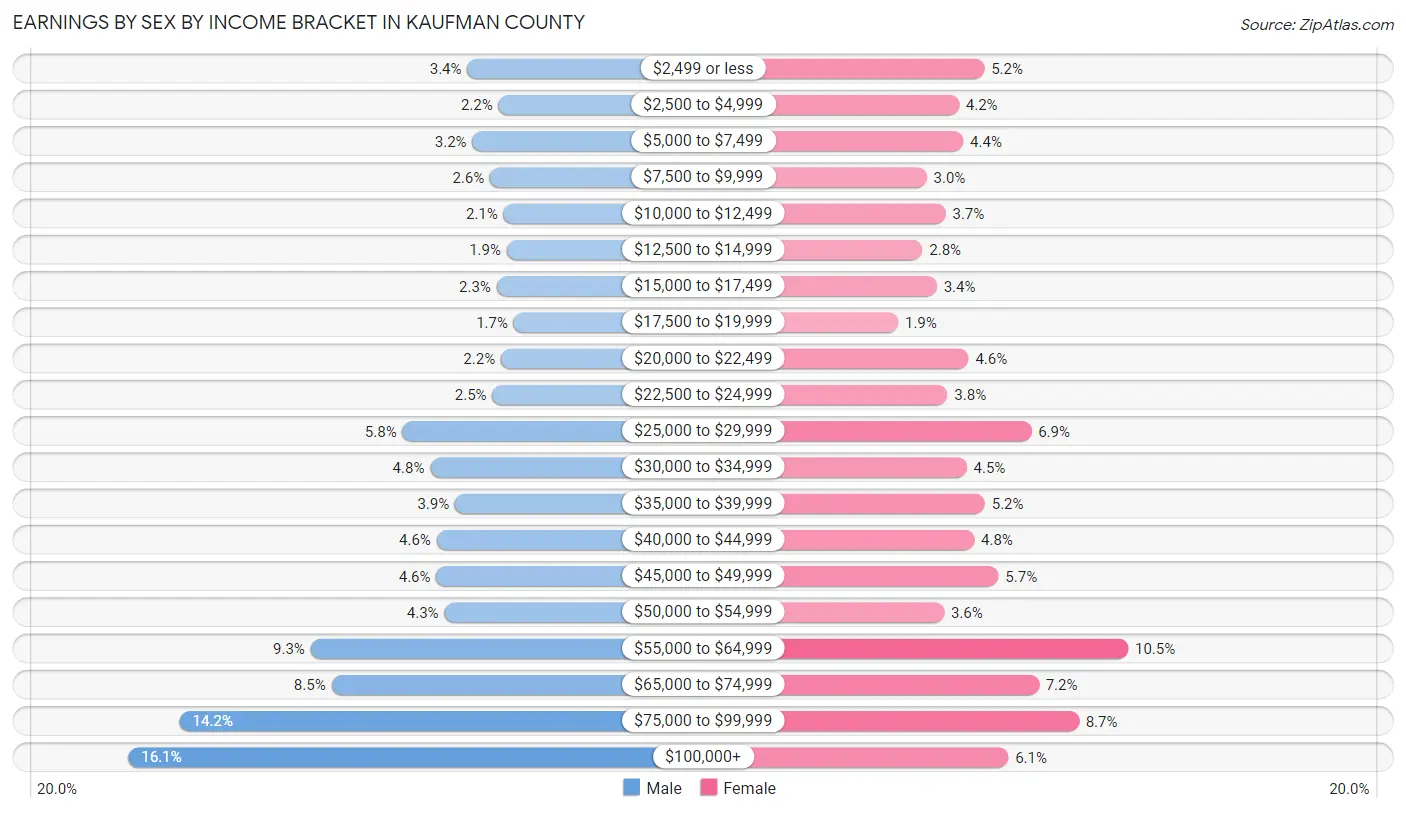
Earnings by Sex by Income Bracket in Kaufman County
The most common earnings brackets in Kaufman County are $100,000+ for men (6,861 | 16.1%) and $55,000 to $64,999 for women (3,888 | 10.5%).
| Income | Male | Female |
| $2,499 or less | 1,453 (3.4%) | 1,899 (5.1%) |
| $2,500 to $4,999 | 956 (2.2%) | 1,551 (4.2%) |
| $5,000 to $7,499 | 1,371 (3.2%) | 1,610 (4.4%) |
| $7,500 to $9,999 | 1,091 (2.6%) | 1,104 (3.0%) |
| $10,000 to $12,499 | 871 (2.1%) | 1,366 (3.7%) |
| $12,500 to $14,999 | 822 (1.9%) | 1,043 (2.8%) |
| $15,000 to $17,499 | 983 (2.3%) | 1,245 (3.4%) |
| $17,500 to $19,999 | 710 (1.7%) | 709 (1.9%) |
| $20,000 to $22,499 | 914 (2.1%) | 1,682 (4.6%) |
| $22,500 to $24,999 | 1,054 (2.5%) | 1,390 (3.8%) |
| $25,000 to $29,999 | 2,489 (5.8%) | 2,550 (6.9%) |
| $30,000 to $34,999 | 2,046 (4.8%) | 1,656 (4.5%) |
| $35,000 to $39,999 | 1,650 (3.9%) | 1,907 (5.2%) |
| $40,000 to $44,999 | 1,940 (4.6%) | 1,761 (4.8%) |
| $45,000 to $49,999 | 1,946 (4.6%) | 2,097 (5.7%) |
| $50,000 to $54,999 | 1,817 (4.3%) | 1,344 (3.6%) |
| $55,000 to $64,999 | 3,951 (9.3%) | 3,888 (10.5%) |
| $65,000 to $74,999 | 3,620 (8.5%) | 2,654 (7.2%) |
| $75,000 to $99,999 | 6,045 (14.2%) | 3,207 (8.7%) |
| $100,000+ | 6,861 (16.1%) | 2,234 (6.0%) |
| Total | 42,590 (100.0%) | 36,897 (100.0%) |
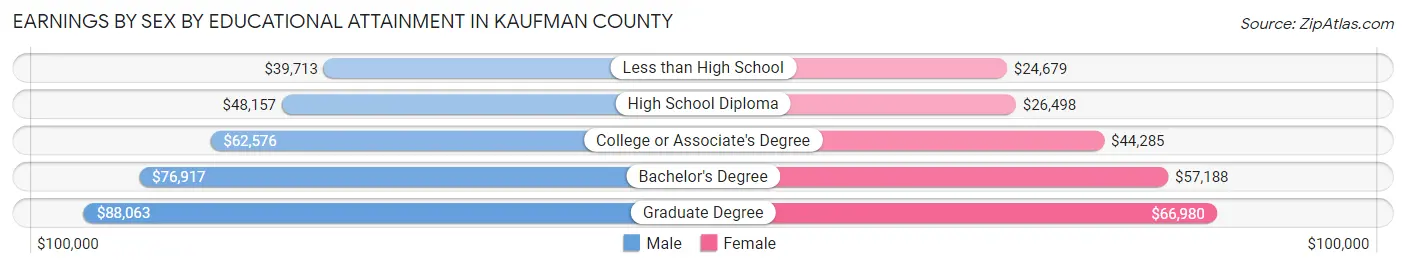
Earnings by Sex by Educational Attainment in Kaufman County
Average earnings in Kaufman County are $59,180 for men and $43,914 for women, a difference of 25.8%. Men with an educational attainment of graduate degree enjoy the highest average annual earnings of $88,063, while those with less than high school education earn the least with $39,713. Women with an educational attainment of graduate degree earn the most with the average annual earnings of $66,980, while those with less than high school education have the smallest earnings of $24,679.
| Educational Attainment | Male Income | Female Income |
| Less than High School | $39,713 | $24,679 |
| High School Diploma | $48,157 | $26,498 |
| College or Associate's Degree | $62,576 | $44,285 |
| Bachelor's Degree | $76,917 | $57,188 |
| Graduate Degree | $88,063 | $66,980 |
| Total | $59,180 | $43,914 |
Family Income in Kaufman County
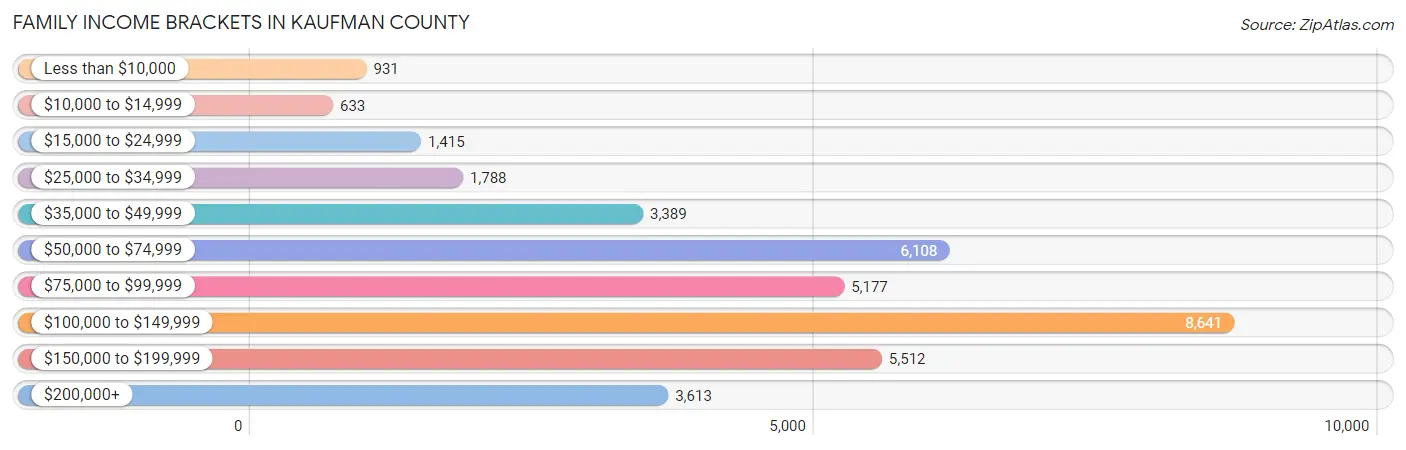
Family Income Brackets in Kaufman County
According to the Kaufman County family income data, there are 8,641 families falling into the $100,000 to $149,999 income range, which is the most common income bracket and makes up 23.2% of all families. Conversely, the $10,000 to $14,999 income bracket is the least frequent group with only 633 families (1.7%) belonging to this category.
| Income Bracket | # Families | % Families |
| Less than $10,000 | 931 | 2.5% |
| $10,000 to $14,999 | 633 | 1.7% |
| $15,000 to $24,999 | 1,415 | 3.8% |
| $25,000 to $34,999 | 1,788 | 4.8% |
| $35,000 to $49,999 | 3,389 | 9.1% |
| $50,000 to $74,999 | 6,108 | 16.4% |
| $75,000 to $99,999 | 5,177 | 13.9% |
| $100,000 to $149,999 | 8,641 | 23.2% |
| $150,000 to $199,999 | 5,512 | 14.8% |
| $200,000+ | 3,613 | 9.7% |
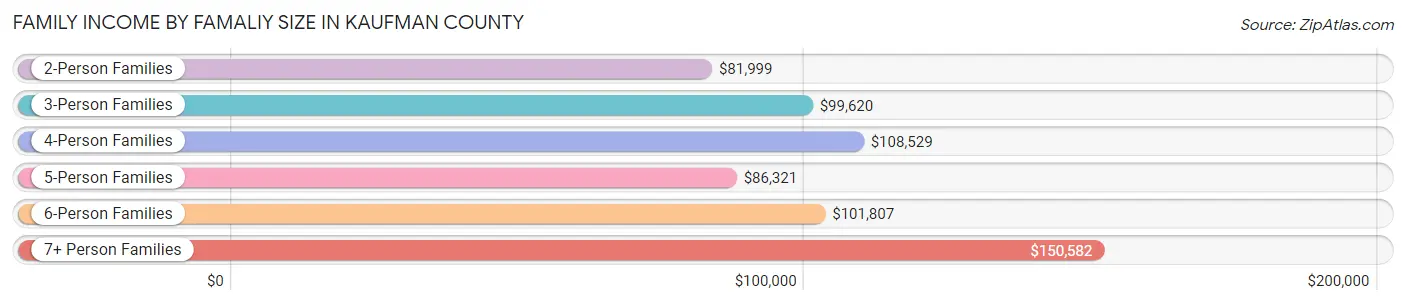
Family Income by Famaliy Size in Kaufman County
7+ person families (1,530 | 4.1%) account for the highest median family income in Kaufman County with $150,582 per family, while 2-person families (13,393 | 36.0%) have the highest median income of $41,000 per family member.
| Income Bracket | # Families | Median Income |
| 2-Person Families | 13,393 (36.0%) | $81,999 |
| 3-Person Families | 7,382 (19.8%) | $99,620 |
| 4-Person Families | 8,165 (21.9%) | $108,529 |
| 5-Person Families | 4,690 (12.6%) | $86,321 |
| 6-Person Families | 2,085 (5.6%) | $101,807 |
| 7+ Person Families | 1,530 (4.1%) | $150,582 |
| Total | 37,245 (100.0%) | $95,129 |
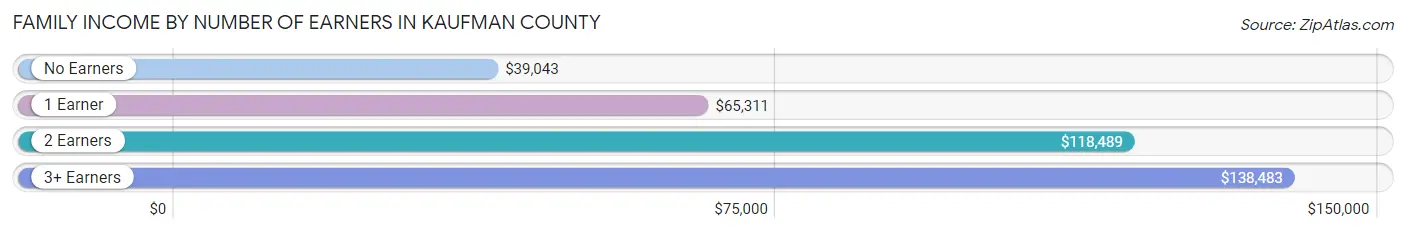
Family Income by Number of Earners in Kaufman County
The median family income in Kaufman County is $95,129, with families comprising 3+ earners (6,470) having the highest median family income of $138,483, while families with no earners (3,580) have the lowest median family income of $39,043, accounting for 17.4% and 9.6% of families, respectively.
| Number of Earners | # Families | Median Income |
| No Earners | 3,580 (9.6%) | $39,043 |
| 1 Earner | 11,737 (31.5%) | $65,311 |
| 2 Earners | 15,458 (41.5%) | $118,489 |
| 3+ Earners | 6,470 (17.4%) | $138,483 |
| Total | 37,245 (100.0%) | $95,129 |
Household Income in Kaufman County
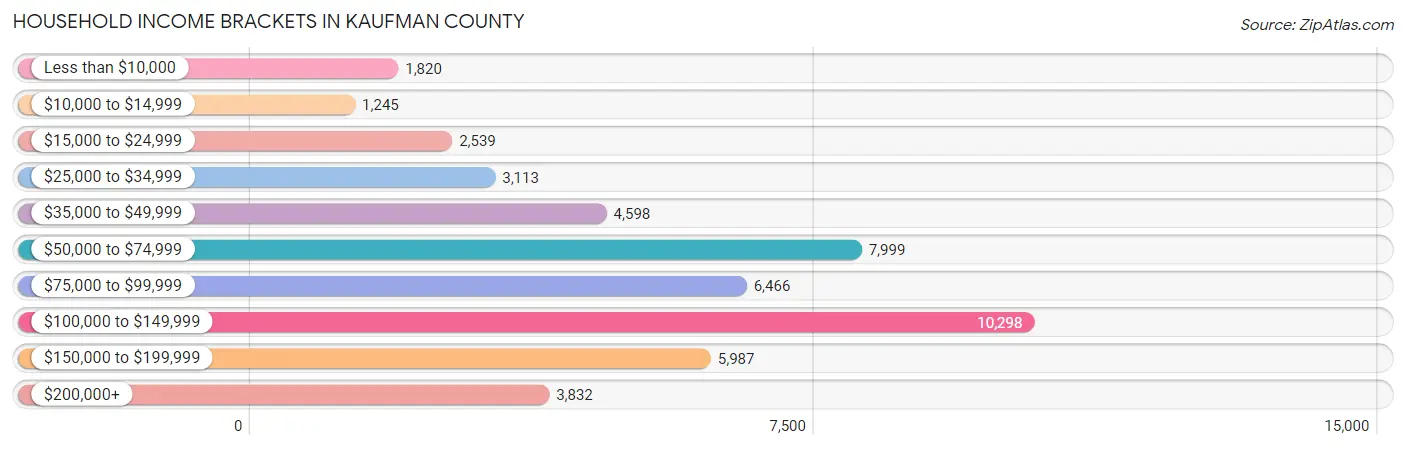
Household Income Brackets in Kaufman County
With 10,298 households falling in the category, the $100,000 to $149,999 income range is the most frequent in Kaufman County, accounting for 21.5% of all households. In contrast, only 1,245 households (2.6%) fall into the $10,000 to $14,999 income bracket, making it the least populous group.
| Income Bracket | # Households | % Households |
| Less than $10,000 | 1,820 | 3.8% |
| $10,000 to $14,999 | 1,245 | 2.6% |
| $15,000 to $24,999 | 2,539 | 5.3% |
| $25,000 to $34,999 | 3,113 | 6.5% |
| $35,000 to $49,999 | 4,598 | 9.6% |
| $50,000 to $74,999 | 7,999 | 16.7% |
| $75,000 to $99,999 | 6,466 | 13.5% |
| $100,000 to $149,999 | 10,298 | 21.5% |
| $150,000 to $199,999 | 5,987 | 12.5% |
| $200,000+ | 3,832 | 8.0% |
Household Income by Householder Age in Kaufman County
The median household income in Kaufman County is $84,075, with the highest median household income of $97,950 found in the 45 to 64 years age bracket for the primary householder. A total of 18,777 households (39.2%) fall into this category. Meanwhile, the 15 to 24 years age bracket for the primary householder has the lowest median household income of $55,858, with 783 households (1.6%) in this group.
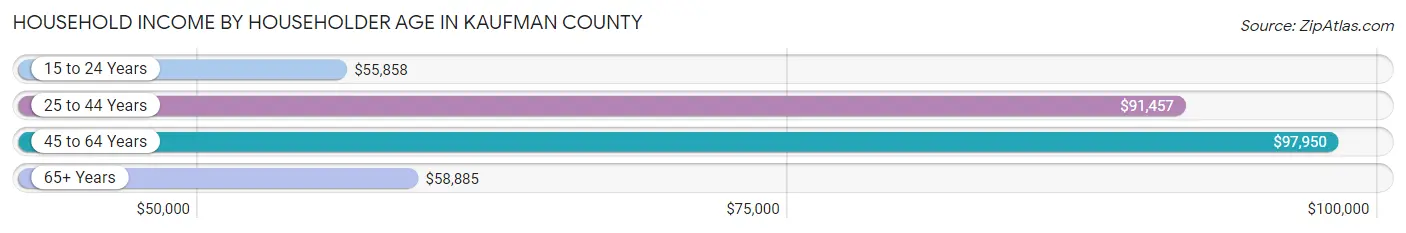
| Income Bracket | # Households | Median Income |
| 15 to 24 Years | 783 (1.6%) | $55,858 |
| 25 to 44 Years | 18,902 (39.5%) | $91,457 |
| 45 to 64 Years | 18,777 (39.2%) | $97,950 |
| 65+ Years | 9,437 (19.7%) | $58,885 |
| Total | 47,899 (100.0%) | $84,075 |
Poverty in Kaufman County
Income Below Poverty by Sex and Age in Kaufman County
With 8.0% poverty level for males and 11.5% for females among the residents of Kaufman County, 12 to 14 year old males and 16 and 17 year old females are the most vulnerable to poverty, with 558 males (14.6%) and 540 females (22.2%) in their respective age groups living below the poverty level.
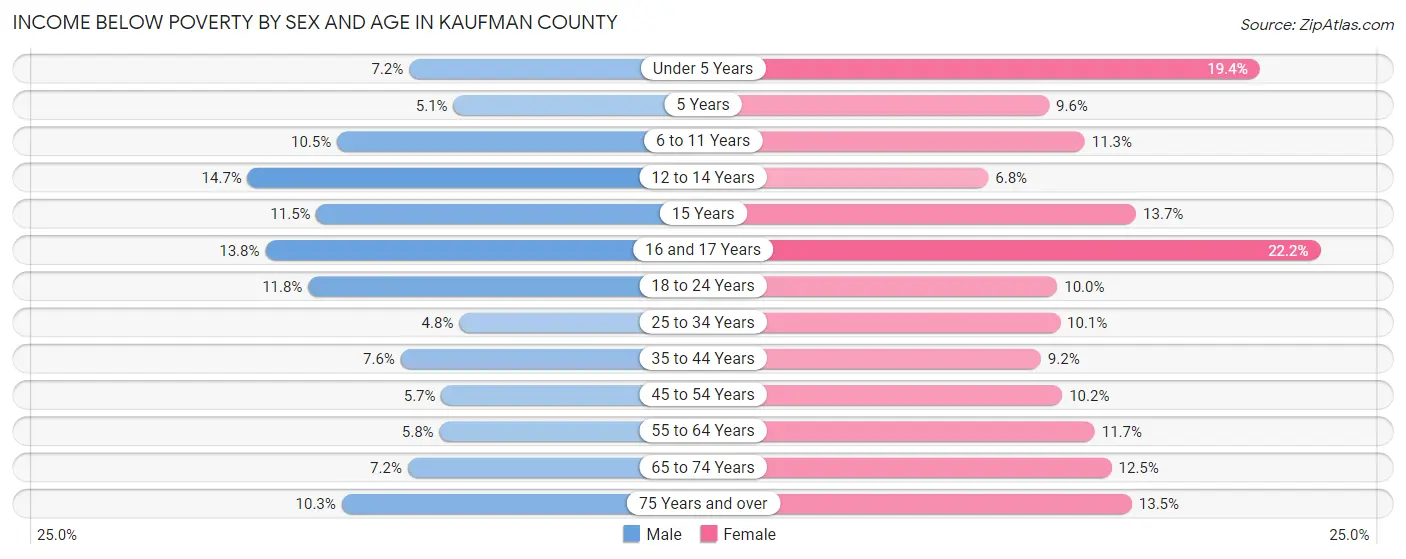
| Age Bracket | Male | Female |
| Under 5 Years | 393 (7.2%) | 981 (19.4%) |
| 5 Years | 69 (5.1%) | 115 (9.6%) |
| 6 to 11 Years | 705 (10.5%) | 795 (11.3%) |
| 12 to 14 Years | 558 (14.6%) | 244 (6.8%) |
| 15 Years | 162 (11.5%) | 147 (13.7%) |
| 16 and 17 Years | 326 (13.8%) | 540 (22.2%) |
| 18 to 24 Years | 758 (11.8%) | 621 (10.0%) |
| 25 to 34 Years | 481 (4.8%) | 1,076 (10.1%) |
| 35 to 44 Years | 823 (7.5%) | 1,030 (9.2%) |
| 45 to 54 Years | 523 (5.7%) | 943 (10.2%) |
| 55 to 64 Years | 470 (5.8%) | 971 (11.7%) |
| 65 to 74 Years | 365 (7.2%) | 689 (12.5%) |
| 75 Years and over | 250 (10.3%) | 451 (13.5%) |
| Total | 5,883 (8.0%) | 8,603 (11.5%) |
Income Above Poverty by Sex and Age in Kaufman County
According to the poverty statistics in Kaufman County, males aged 25 to 34 years and females aged 12 to 14 years are the age groups that are most secure financially, with 95.2% of males and 93.2% of females in these age groups living above the poverty line.
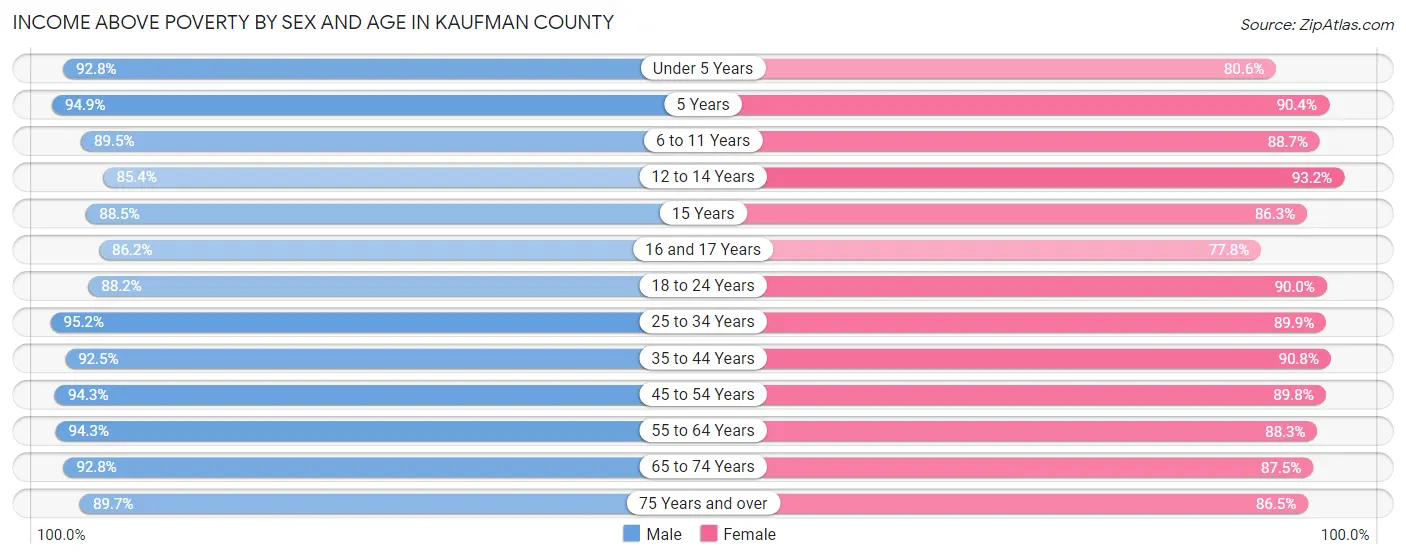
| Age Bracket | Male | Female |
| Under 5 Years | 5,098 (92.8%) | 4,082 (80.6%) |
| 5 Years | 1,283 (94.9%) | 1,080 (90.4%) |
| 6 to 11 Years | 6,007 (89.5%) | 6,251 (88.7%) |
| 12 to 14 Years | 3,252 (85.4%) | 3,345 (93.2%) |
| 15 Years | 1,252 (88.5%) | 929 (86.3%) |
| 16 and 17 Years | 2,031 (86.2%) | 1,892 (77.8%) |
| 18 to 24 Years | 5,643 (88.2%) | 5,586 (90.0%) |
| 25 to 34 Years | 9,484 (95.2%) | 9,544 (89.9%) |
| 35 to 44 Years | 10,083 (92.4%) | 10,118 (90.8%) |
| 45 to 54 Years | 8,717 (94.3%) | 8,271 (89.8%) |
| 55 to 64 Years | 7,710 (94.3%) | 7,299 (88.3%) |
| 65 to 74 Years | 4,692 (92.8%) | 4,815 (87.5%) |
| 75 Years and over | 2,180 (89.7%) | 2,899 (86.5%) |
| Total | 67,432 (92.0%) | 66,111 (88.5%) |
Income Below Poverty Among Married-Couple Families in Kaufman County
The poverty statistics for married-couple families in Kaufman County show that 4.4% or 1,232 of the total 27,826 families live below the poverty line. Families with 5 or more children have the highest poverty rate of 8.5%, comprising of 38 families. On the other hand, families with no children have the lowest poverty rate of 3.4%, which includes 442 families.
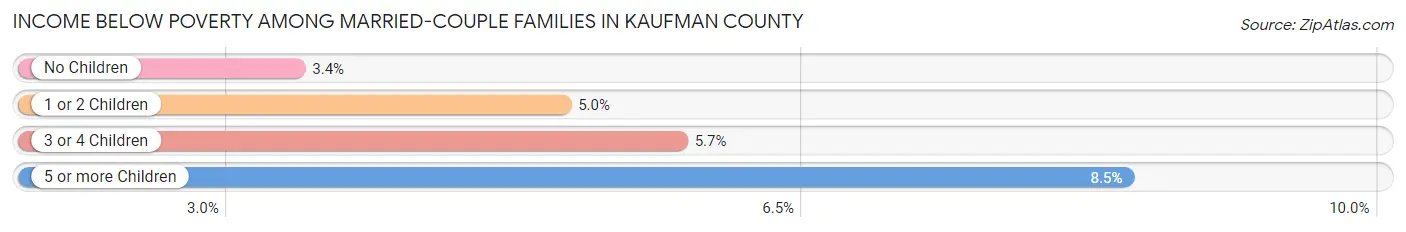
| Children | Above Poverty | Below Poverty |
| No Children | 12,525 (96.6%) | 442 (3.4%) |
| 1 or 2 Children | 9,977 (95.0%) | 528 (5.0%) |
| 3 or 4 Children | 3,681 (94.3%) | 224 (5.7%) |
| 5 or more Children | 411 (91.5%) | 38 (8.5%) |
| Total | 26,594 (95.6%) | 1,232 (4.4%) |
Income Below Poverty Among Single-Parent Households in Kaufman County
According to the poverty data in Kaufman County, 8.9% or 226 single-father households and 20.9% or 1,436 single-mother households are living below the poverty line. Among single-father households, those with 3 or 4 children have the highest poverty rate, with 21 households (12.4%) experiencing poverty. Likewise, among single-mother households, those with 5 or more children have the highest poverty rate, with 115 households (46.6%) falling below the poverty line.
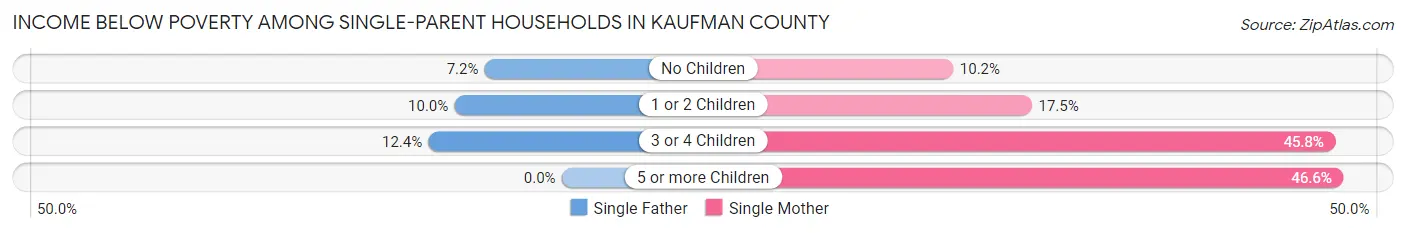
| Children | Single Father | Single Mother |
| No Children | 73 (7.2%) | 191 (10.2%) |
| 1 or 2 Children | 132 (10.0%) | 648 (17.5%) |
| 3 or 4 Children | 21 (12.4%) | 482 (45.8%) |
| 5 or more Children | 0 (0.0%) | 115 (46.6%) |
| Total | 226 (8.9%) | 1,436 (20.9%) |
Income Below Poverty Among Married-Couple vs Single-Parent Households in Kaufman County
The poverty data for Kaufman County shows that 1,232 of the married-couple family households (4.4%) and 1,662 of the single-parent households (17.6%) are living below the poverty level. Within the married-couple family households, those with 5 or more children have the highest poverty rate, with 38 households (8.5%) falling below the poverty line. Among the single-parent households, those with 3 or 4 children have the highest poverty rate, with 503 household (41.2%) living below poverty.
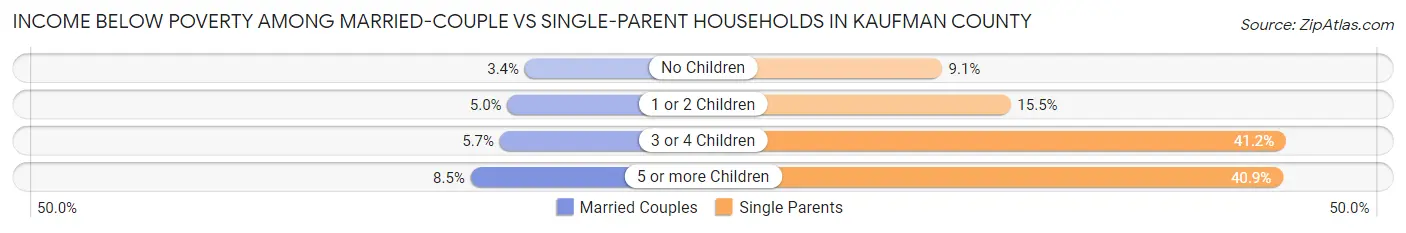
| Children | Married-Couple Families | Single-Parent Households |
| No Children | 442 (3.4%) | 264 (9.1%) |
| 1 or 2 Children | 528 (5.0%) | 780 (15.5%) |
| 3 or 4 Children | 224 (5.7%) | 503 (41.2%) |
| 5 or more Children | 38 (8.5%) | 115 (40.9%) |
| Total | 1,232 (4.4%) | 1,662 (17.6%) |
Race in Kaufman County
The most populous races in Kaufman County are White / Caucasian (98,892 | 66.0%), Hispanic or Latino (37,072 | 24.7%), and Black / African American (22,755 | 15.2%).
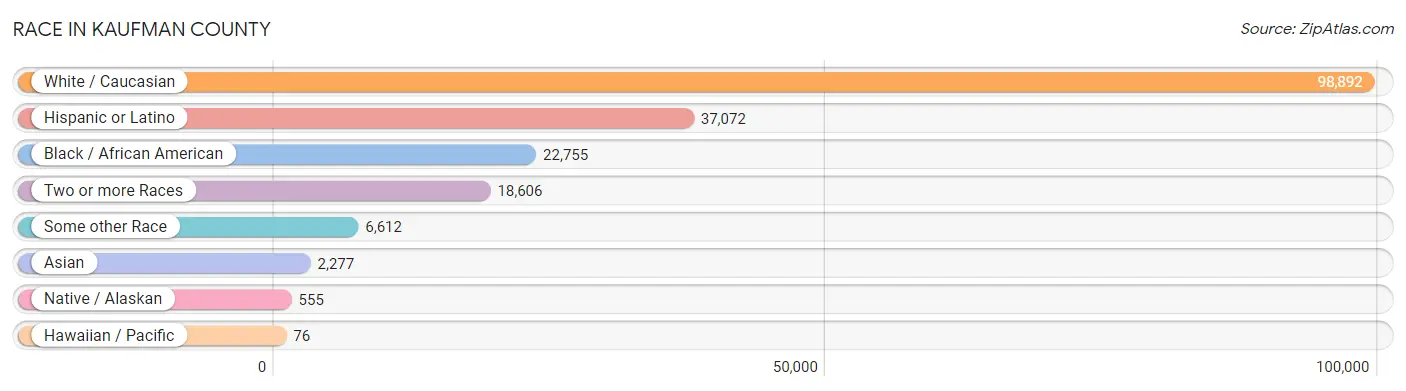
| Race | # Population | % Population |
| Asian | 2,277 | 1.5% |
| Black / African American | 22,755 | 15.2% |
| Hawaiian / Pacific | 76 | 0.1% |
| Hispanic or Latino | 37,072 | 24.7% |
| Native / Alaskan | 555 | 0.4% |
| White / Caucasian | 98,892 | 66.0% |
| Two or more Races | 18,606 | 12.4% |
| Some other Race | 6,612 | 4.4% |
| Total | 149,773 | 100.0% |
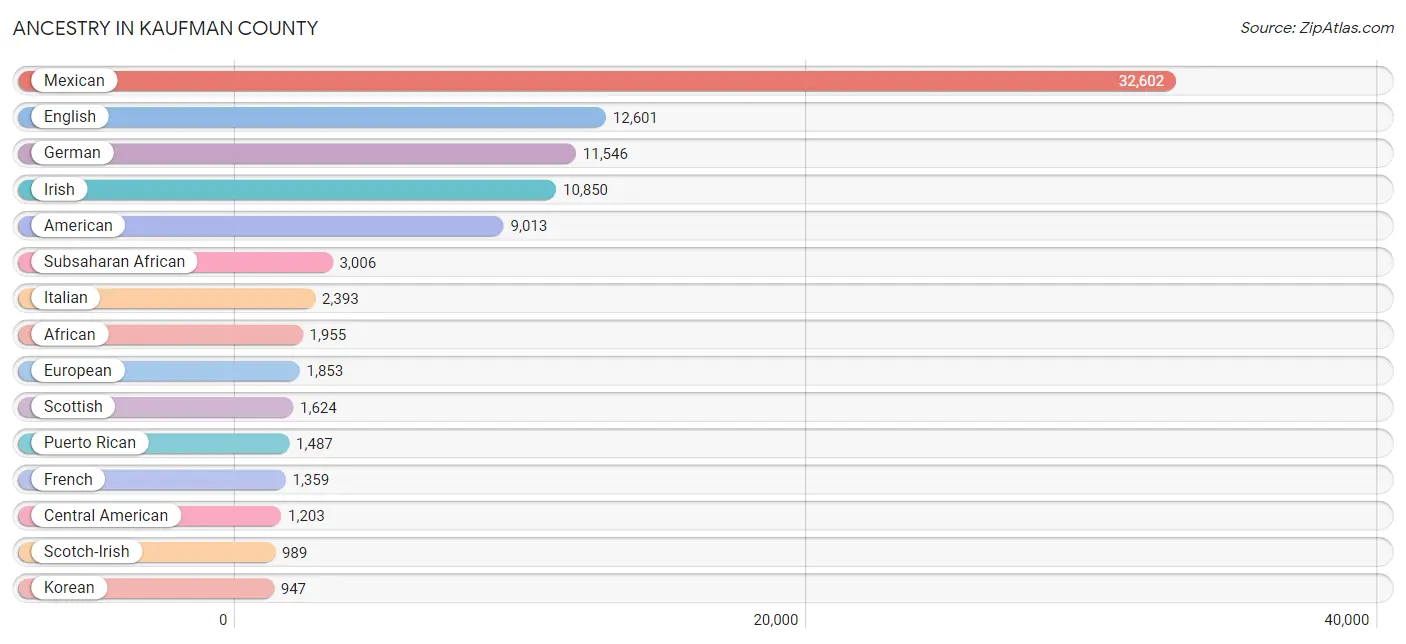
Ancestry in Kaufman County
The most populous ancestries reported in Kaufman County are Mexican (32,602 | 21.8%), English (12,601 | 8.4%), German (11,546 | 7.7%), Irish (10,850 | 7.2%), and American (9,013 | 6.0%), together accounting for 51.2% of all Kaufman County residents.
| Ancestry | # Population | % Population |
| African | 1,955 | 1.3% |
| Alsatian | 19 | 0.0% |
| American | 9,013 | 6.0% |
| Apache | 150 | 0.1% |
| Arab | 543 | 0.4% |
| Armenian | 8 | 0.0% |
| Australian | 2 | 0.0% |
| Austrian | 86 | 0.1% |
| Barbadian | 6 | 0.0% |
| Belgian | 49 | 0.0% |
| Bhutanese | 326 | 0.2% |
| Blackfeet | 28 | 0.0% |
| British | 508 | 0.3% |
| British West Indian | 17 | 0.0% |
| Burmese | 130 | 0.1% |
| Cajun | 33 | 0.0% |
| Canadian | 39 | 0.0% |
| Central American | 1,203 | 0.8% |
| Central American Indian | 165 | 0.1% |
| Cherokee | 585 | 0.4% |
| Chickasaw | 216 | 0.1% |
| Chilean | 62 | 0.0% |
| Chippewa | 16 | 0.0% |
| Choctaw | 241 | 0.2% |
| Colombian | 10 | 0.0% |
| Comanche | 45 | 0.0% |
| Costa Rican | 20 | 0.0% |
| Creek | 142 | 0.1% |
| Croatian | 13 | 0.0% |
| Cuban | 495 | 0.3% |
| Czech | 617 | 0.4% |
| Czechoslovakian | 184 | 0.1% |
| Danish | 248 | 0.2% |
| Delaware | 11 | 0.0% |
| Dutch | 638 | 0.4% |
| Dutch West Indian | 5 | 0.0% |
| Eastern European | 213 | 0.1% |
| Ecuadorian | 45 | 0.0% |
| Egyptian | 59 | 0.0% |
| English | 12,601 | 8.4% |
| Ethiopian | 80 | 0.1% |
| European | 1,853 | 1.2% |
| Filipino | 60 | 0.0% |
| Finnish | 1 | 0.0% |
| French | 1,359 | 0.9% |
| French American Indian | 21 | 0.0% |
| French Canadian | 382 | 0.3% |
| German | 11,546 | 7.7% |
| Ghanaian | 99 | 0.1% |
| Greek | 65 | 0.0% |
| Guamanian / Chamorro | 35 | 0.0% |
| Guatemalan | 175 | 0.1% |
| Guyanese | 98 | 0.1% |
| Haitian | 50 | 0.0% |
| Honduran | 203 | 0.1% |
| Hungarian | 79 | 0.1% |
| Indian (Asian) | 406 | 0.3% |
| Iranian | 21 | 0.0% |
| Iraqi | 9 | 0.0% |
| Irish | 10,850 | 7.2% |
| Iroquois | 17 | 0.0% |
| Italian | 2,393 | 1.6% |
| Jamaican | 46 | 0.0% |
| Japanese | 102 | 0.1% |
| Jordanian | 323 | 0.2% |
| Kenyan | 70 | 0.1% |
| Korean | 947 | 0.6% |
| Lebanese | 81 | 0.1% |
| Luxembourger | 8 | 0.0% |
| Malaysian | 108 | 0.1% |
| Mexican | 32,602 | 21.8% |
| Mexican American Indian | 104 | 0.1% |
| Moroccan | 41 | 0.0% |
| Native Hawaiian | 212 | 0.1% |
| Navajo | 25 | 0.0% |
| Nigerian | 260 | 0.2% |
| Northern European | 209 | 0.1% |
| Norwegian | 806 | 0.5% |
| Paiute | 256 | 0.2% |
| Pakistani | 8 | 0.0% |
| Panamanian | 58 | 0.0% |
| Pennsylvania German | 57 | 0.0% |
| Peruvian | 165 | 0.1% |
| Polish | 491 | 0.3% |
| Portuguese | 85 | 0.1% |
| Potawatomi | 11 | 0.0% |
| Puerto Rican | 1,487 | 1.0% |
| Romanian | 68 | 0.1% |
| Russian | 293 | 0.2% |
| Salvadoran | 747 | 0.5% |
| Samoan | 2 | 0.0% |
| Scandinavian | 354 | 0.2% |
| Scotch-Irish | 989 | 0.7% |
| Scottish | 1,624 | 1.1% |
| Seminole | 10 | 0.0% |
| Sierra Leonean | 226 | 0.2% |
| Sioux | 22 | 0.0% |
| Slavic | 14 | 0.0% |
| Slovak | 28 | 0.0% |
| Slovene | 54 | 0.0% |
| South American | 425 | 0.3% |
| South American Indian | 21 | 0.0% |
| Spaniard | 167 | 0.1% |
| Spanish | 37 | 0.0% |
| Sri Lankan | 316 | 0.2% |
| Subsaharan African | 3,006 | 2.0% |
| Swedish | 376 | 0.3% |
| Swiss | 401 | 0.3% |
| Syrian | 30 | 0.0% |
| Thai | 601 | 0.4% |
| Trinidadian and Tobagonian | 3 | 0.0% |
| Turkish | 11 | 0.0% |
| Ugandan | 137 | 0.1% |
| Ukrainian | 16 | 0.0% |
| Venezuelan | 143 | 0.1% |
| Welsh | 461 | 0.3% |
| West Indian | 82 | 0.1% |
| Yaqui | 12 | 0.0% |
| Yugoslavian | 14 | 0.0% | View All 119 Rows |
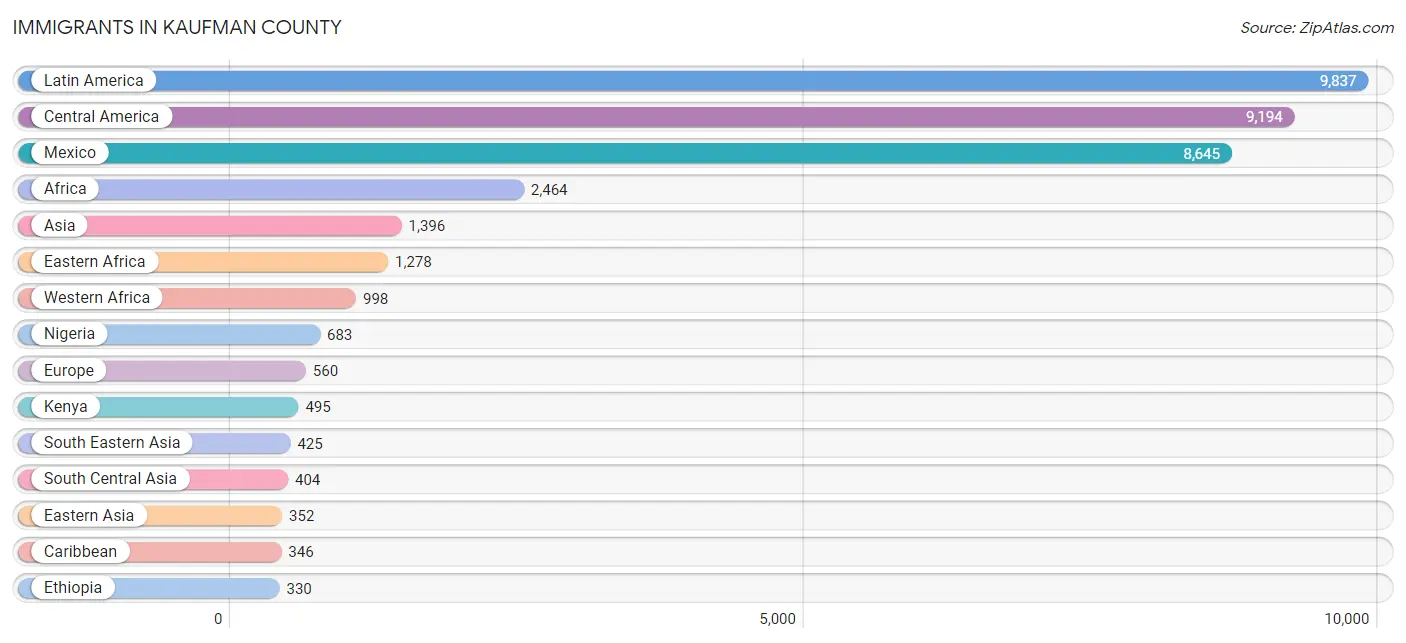
Immigrants in Kaufman County
The most numerous immigrant groups reported in Kaufman County came from Latin America (9,837 | 6.6%), Central America (9,194 | 6.1%), Mexico (8,645 | 5.8%), Africa (2,464 | 1.7%), and Asia (1,396 | 0.9%), together accounting for 21.1% of all Kaufman County residents.
| Immigration Origin | # Population | % Population |
| Africa | 2,464 | 1.7% |
| Asia | 1,396 | 0.9% |
| Belgium | 14 | 0.0% |
| Brazil | 83 | 0.1% |
| Cameroon | 145 | 0.1% |
| Canada | 96 | 0.1% |
| Caribbean | 346 | 0.2% |
| Central America | 9,194 | 6.1% |
| Chile | 36 | 0.0% |
| China | 238 | 0.2% |
| Colombia | 3 | 0.0% |
| Costa Rica | 20 | 0.0% |
| Cuba | 223 | 0.2% |
| Czechoslovakia | 11 | 0.0% |
| Eastern Africa | 1,278 | 0.9% |
| Eastern Asia | 352 | 0.2% |
| Eastern Europe | 62 | 0.0% |
| Ecuador | 22 | 0.0% |
| Egypt | 21 | 0.0% |
| El Salvador | 272 | 0.2% |
| England | 92 | 0.1% |
| Eritrea | 171 | 0.1% |
| Ethiopia | 330 | 0.2% |
| Europe | 560 | 0.4% |
| France | 13 | 0.0% |
| Germany | 228 | 0.2% |
| Ghana | 109 | 0.1% |
| Guatemala | 95 | 0.1% |
| Haiti | 29 | 0.0% |
| Honduras | 161 | 0.1% |
| Hong Kong | 42 | 0.0% |
| India | 311 | 0.2% |
| Indonesia | 38 | 0.0% |
| Iraq | 9 | 0.0% |
| Ireland | 5 | 0.0% |
| Jamaica | 37 | 0.0% |
| Japan | 74 | 0.1% |
| Jordan | 74 | 0.1% |
| Kenya | 495 | 0.3% |
| Korea | 40 | 0.0% |
| Kuwait | 51 | 0.0% |
| Latin America | 9,837 | 6.6% |
| Mexico | 8,645 | 5.8% |
| Middle Africa | 145 | 0.1% |
| Morocco | 22 | 0.0% |
| Nigeria | 683 | 0.5% |
| Northern Africa | 43 | 0.0% |
| Northern Europe | 200 | 0.1% |
| Pakistan | 93 | 0.1% |
| Panama | 1 | 0.0% |
| Peru | 90 | 0.1% |
| Philippines | 219 | 0.2% |
| Romania | 12 | 0.0% |
| Russia | 25 | 0.0% |
| Saudi Arabia | 70 | 0.1% |
| Sierra Leone | 181 | 0.1% |
| Singapore | 27 | 0.0% |
| South America | 297 | 0.2% |
| South Central Asia | 404 | 0.3% |
| South Eastern Asia | 425 | 0.3% |
| Southern Europe | 43 | 0.0% |
| Spain | 43 | 0.0% |
| St. Vincent and the Grenadines | 12 | 0.0% |
| Thailand | 27 | 0.0% |
| Trinidad and Tobago | 13 | 0.0% |
| Turkey | 11 | 0.0% |
| Uganda | 137 | 0.1% |
| Ukraine | 14 | 0.0% |
| Venezuela | 63 | 0.0% |
| Vietnam | 114 | 0.1% |
| Western Africa | 998 | 0.7% |
| Western Asia | 215 | 0.1% |
| Western Europe | 255 | 0.2% |
| Zimbabwe | 130 | 0.1% | View All 74 Rows |
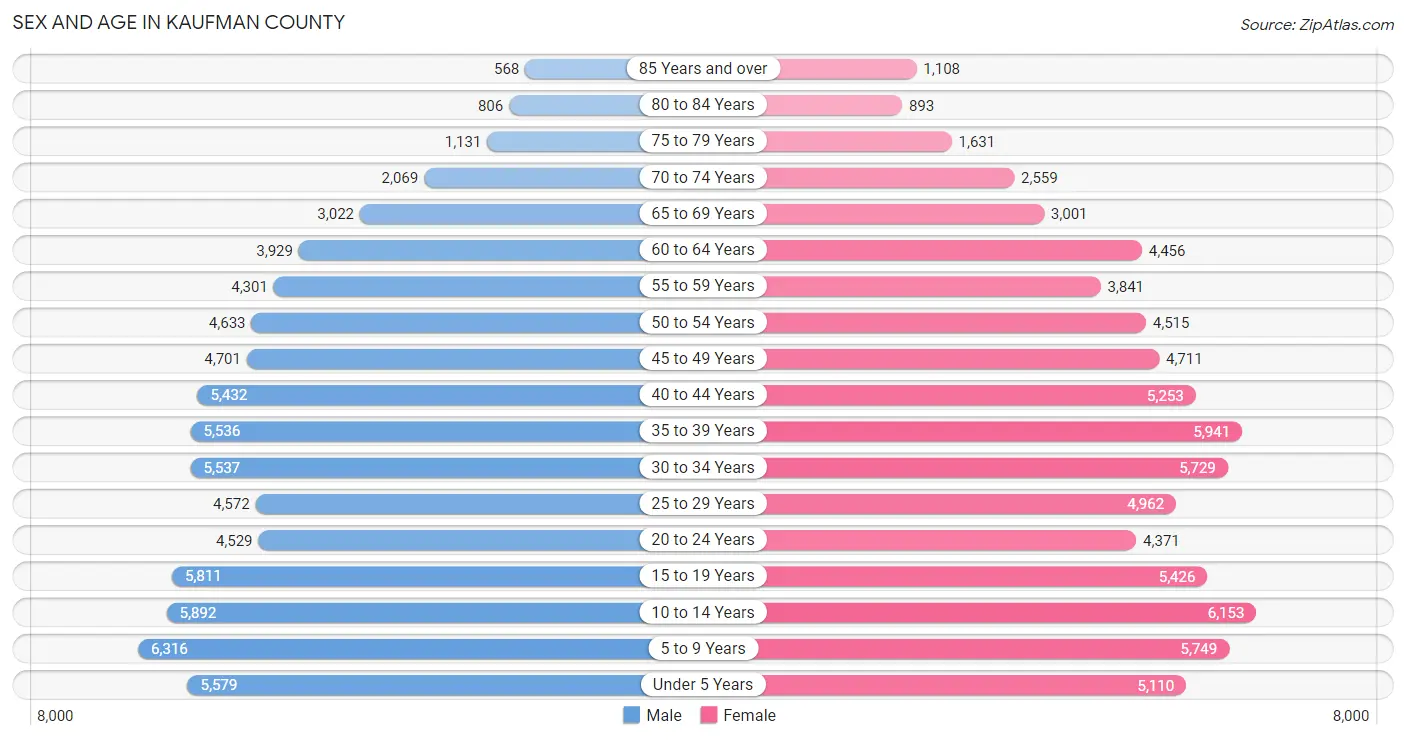
Sex and Age in Kaufman County
Sex and Age in Kaufman County
The most populous age groups in Kaufman County are 5 to 9 Years (6,316 | 8.5%) for men and 10 to 14 Years (6,153 | 8.2%) for women.
| Age Bracket | Male | Female |
| Under 5 Years | 5,579 (7.5%) | 5,110 (6.8%) |
| 5 to 9 Years | 6,316 (8.5%) | 5,749 (7.6%) |
| 10 to 14 Years | 5,892 (7.9%) | 6,153 (8.2%) |
| 15 to 19 Years | 5,811 (7.8%) | 5,426 (7.2%) |
| 20 to 24 Years | 4,529 (6.1%) | 4,371 (5.8%) |
| 25 to 29 Years | 4,572 (6.1%) | 4,962 (6.6%) |
| 30 to 34 Years | 5,537 (7.4%) | 5,729 (7.6%) |
| 35 to 39 Years | 5,536 (7.4%) | 5,941 (7.9%) |
| 40 to 44 Years | 5,432 (7.3%) | 5,253 (7.0%) |
| 45 to 49 Years | 4,701 (6.3%) | 4,711 (6.2%) |
| 50 to 54 Years | 4,633 (6.2%) | 4,515 (6.0%) |
| 55 to 59 Years | 4,301 (5.8%) | 3,841 (5.1%) |
| 60 to 64 Years | 3,929 (5.3%) | 4,456 (5.9%) |
| 65 to 69 Years | 3,022 (4.1%) | 3,001 (4.0%) |
| 70 to 74 Years | 2,069 (2.8%) | 2,559 (3.4%) |
| 75 to 79 Years | 1,131 (1.5%) | 1,631 (2.2%) |
| 80 to 84 Years | 806 (1.1%) | 893 (1.2%) |
| 85 Years and over | 568 (0.8%) | 1,108 (1.5%) |
| Total | 74,364 (100.0%) | 75,409 (100.0%) |
Families and Households in Kaufman County
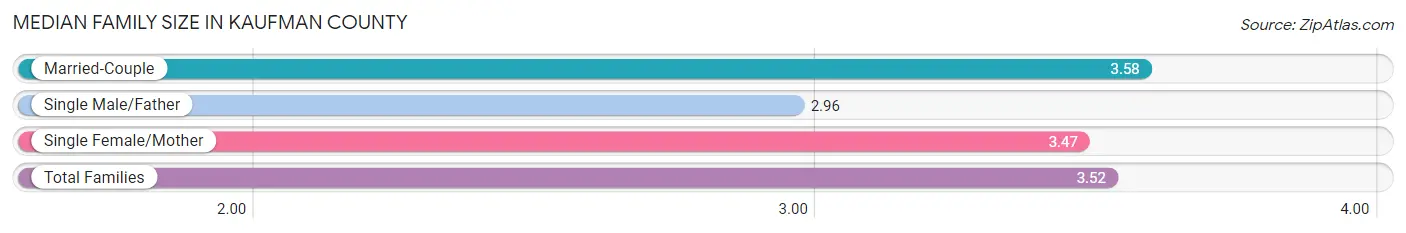
Median Family Size in Kaufman County
The median family size in Kaufman County is 3.52 persons per family, with married-couple families (27,826 | 74.7%) accounting for the largest median family size of 3.58 persons per family. On the other hand, single male/father families (2,539 | 6.8%) represent the smallest median family size with 2.96 persons per family.
| Family Type | # Families | Family Size |
| Married-Couple | 27,826 (74.7%) | 3.58 |
| Single Male/Father | 2,539 (6.8%) | 2.96 |
| Single Female/Mother | 6,880 (18.5%) | 3.47 |
| Total Families | 37,245 (100.0%) | 3.52 |
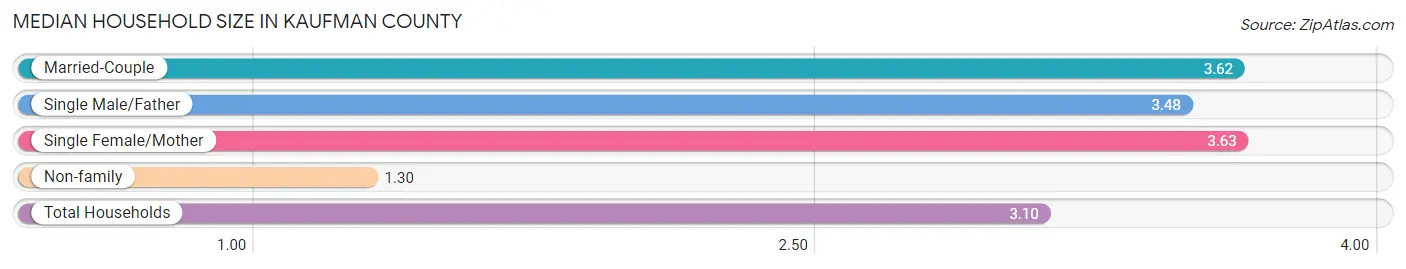
Median Household Size in Kaufman County
The median household size in Kaufman County is 3.10 persons per household, with single female/mother households (6,880 | 14.4%) accounting for the largest median household size of 3.63 persons per household. non-family households (10,654 | 22.2%) represent the smallest median household size with 1.30 persons per household.
| Household Type | # Households | Household Size |
| Married-Couple | 27,826 (58.1%) | 3.62 |
| Single Male/Father | 2,539 (5.3%) | 3.48 |
| Single Female/Mother | 6,880 (14.4%) | 3.63 |
| Non-family | 10,654 (22.2%) | 1.30 |
| Total Households | 47,899 (100.0%) | 3.10 |
Household Size by Marriage Status in Kaufman County
Out of a total of 47,899 households in Kaufman County, 37,245 (77.8%) are family households, while 10,654 (22.2%) are nonfamily households. The most numerous type of family households are 2-person households, comprising 12,558, and the most common type of nonfamily households are 1-person households, comprising 8,530.
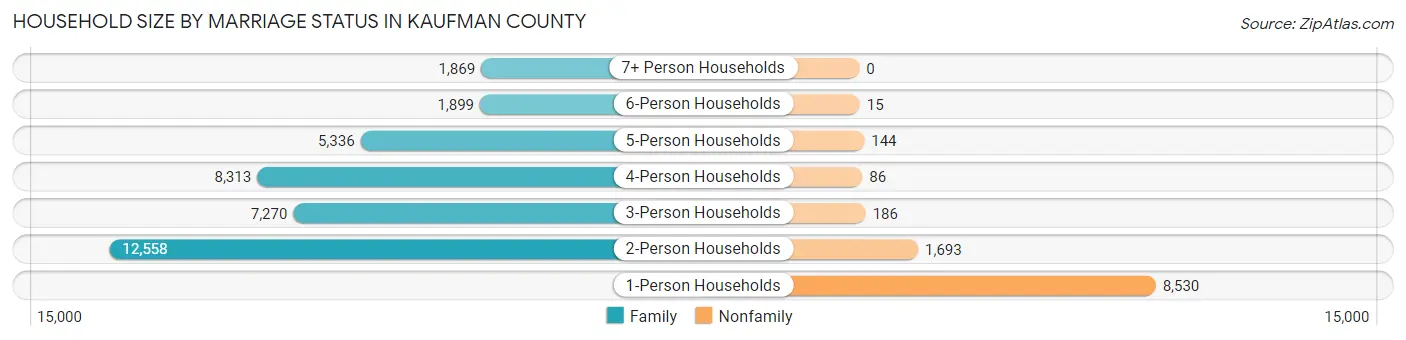
| Household Size | Family Households | Nonfamily Households |
| 1-Person Households | - | 8,530 (17.8%) |
| 2-Person Households | 12,558 (26.2%) | 1,693 (3.5%) |
| 3-Person Households | 7,270 (15.2%) | 186 (0.4%) |
| 4-Person Households | 8,313 (17.4%) | 86 (0.2%) |
| 5-Person Households | 5,336 (11.1%) | 144 (0.3%) |
| 6-Person Households | 1,899 (4.0%) | 15 (0.0%) |
| 7+ Person Households | 1,869 (3.9%) | 0 (0.0%) |
| Total | 37,245 (77.8%) | 10,654 (22.2%) |
Female Fertility in Kaufman County
Fertility by Age in Kaufman County
Average fertility rate in Kaufman County is 58.0 births per 1,000 women. Women in the age bracket of 20 to 34 years have the highest fertility rate with 107.0 births per 1,000 women. Women in the age bracket of 20 to 34 years acount for 74.0% of all women with births.
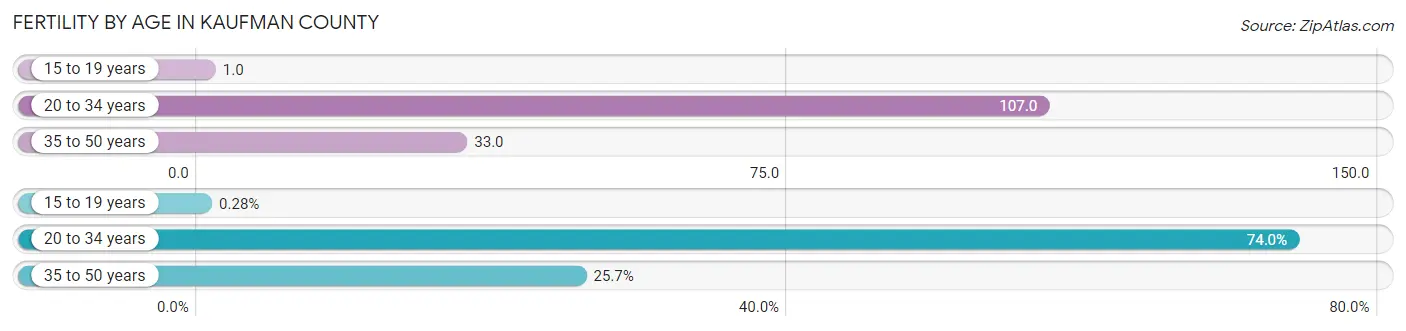
| Age Bracket | Women with Births | Births / 1,000 Women |
| 15 to 19 years | 6 (0.3%) | 1.0 |
| 20 to 34 years | 1,611 (74.0%) | 107.0 |
| 35 to 50 years | 559 (25.7%) | 33.0 |
| Total | 2,176 (100.0%) | 58.0 |
Fertility by Age by Marriage Status in Kaufman County
66.9% of women with births (2,176) in Kaufman County are married. The highest percentage of unmarried women with births falls into 15 to 19 years age bracket with 100.0% of them unmarried at the time of birth, while the lowest percentage of unmarried women with births belong to 35 to 50 years age bracket with 5.5% of them unmarried.
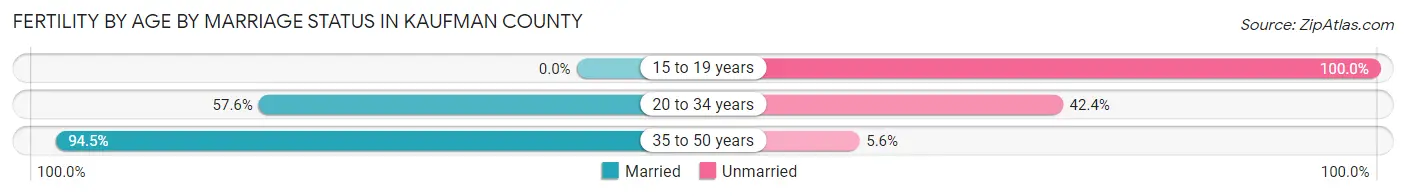
| Age Bracket | Married | Unmarried |
| 15 to 19 years | 0 (0.0%) | 6 (100.0%) |
| 20 to 34 years | 928 (57.6%) | 683 (42.4%) |
| 35 to 50 years | 528 (94.5%) | 31 (5.6%) |
| Total | 1,456 (66.9%) | 720 (33.1%) |
Fertility by Education in Kaufman County
Average fertility rate in Kaufman County is 58.0 births per 1,000 women. Women with the education attainment of bachelor's degree have the highest fertility rate of 104.0 births per 1,000 women, while women with the education attainment of less than high school have the lowest fertility at 13.0 births per 1,000 women. Women with the education attainment of high school diploma represent 33.2% of all women with births.
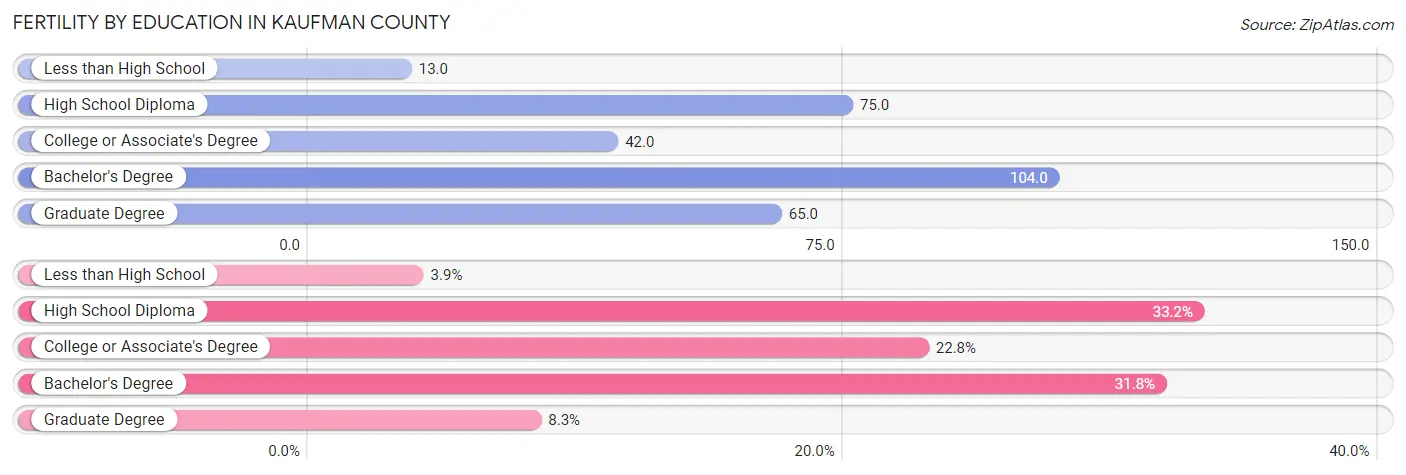
| Educational Attainment | Women with Births | Births / 1,000 Women |
| Less than High School | 85 (3.9%) | 13.0 |
| High School Diploma | 722 (33.2%) | 75.0 |
| College or Associate's Degree | 497 (22.8%) | 42.0 |
| Bachelor's Degree | 691 (31.8%) | 104.0 |
| Graduate Degree | 181 (8.3%) | 65.0 |
| Total | 2,176 (100.0%) | 58.0 |
Fertility by Education by Marriage Status in Kaufman County
33.1% of women with births in Kaufman County are unmarried. Women with the educational attainment of less than high school are most likely to be married with 89.4% of them married at childbirth, while women with the educational attainment of graduate degree are least likely to be married with 52.5% of them unmarried at childbirth.
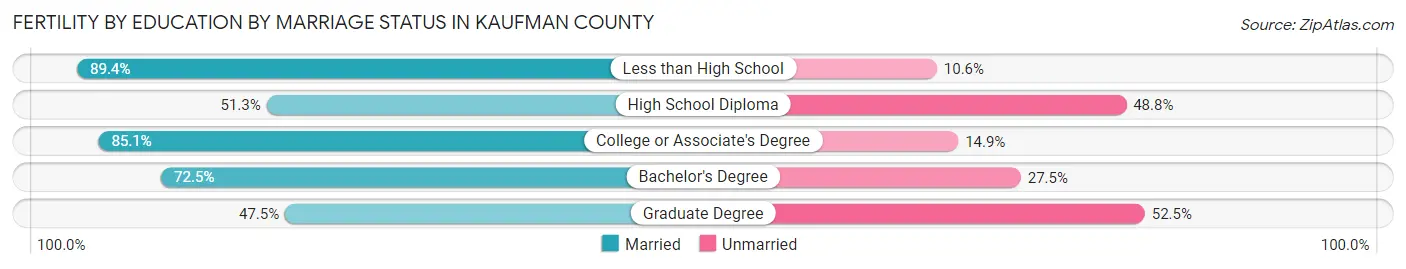
| Educational Attainment | Married | Unmarried |
| Less than High School | 76 (89.4%) | 9 (10.6%) |
| High School Diploma | 370 (51.2%) | 352 (48.7%) |
| College or Associate's Degree | 423 (85.1%) | 74 (14.9%) |
| Bachelor's Degree | 501 (72.5%) | 190 (27.5%) |
| Graduate Degree | 86 (47.5%) | 95 (52.5%) |
| Total | 1,456 (66.9%) | 720 (33.1%) |
Employment Characteristics in Kaufman County
Employment by Class of Employer in Kaufman County
Among the 71,908 employed individuals in Kaufman County, private company employees (48,415 | 67.3%), local government employees (7,764 | 10.8%), and self-employed (not incorporated) (4,711 | 6.6%) make up the most common classes of employment.
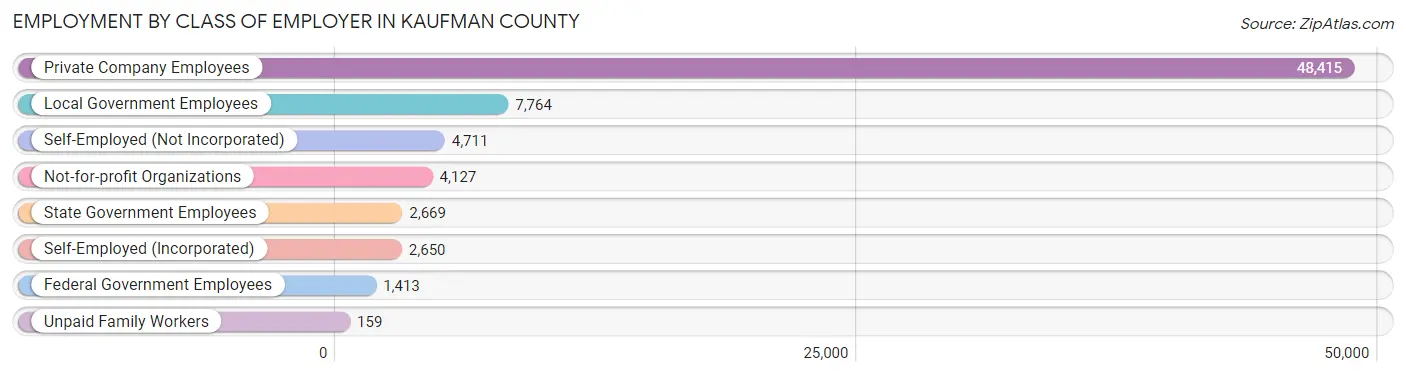
| Employer Class | # Employees | % Employees |
| Private Company Employees | 48,415 | 67.3% |
| Self-Employed (Incorporated) | 2,650 | 3.7% |
| Self-Employed (Not Incorporated) | 4,711 | 6.6% |
| Not-for-profit Organizations | 4,127 | 5.7% |
| Local Government Employees | 7,764 | 10.8% |
| State Government Employees | 2,669 | 3.7% |
| Federal Government Employees | 1,413 | 2.0% |
| Unpaid Family Workers | 159 | 0.2% |
| Total | 71,908 | 100.0% |
Employment Status by Age in Kaufman County
According to the labor force statistics for Kaufman County, out of the total population over 16 years of age (112,482), 68.5% or 77,050 individuals are in the labor force, with 4.9% or 3,775 of them unemployed. The age group with the highest labor force participation rate is 25 to 29 years, with 86.8% or 8,276 individuals in the labor force. Within the labor force, the 16 to 19 years age range has the highest percentage of unemployed individuals, with 11.8% or 385 of them being unemployed.
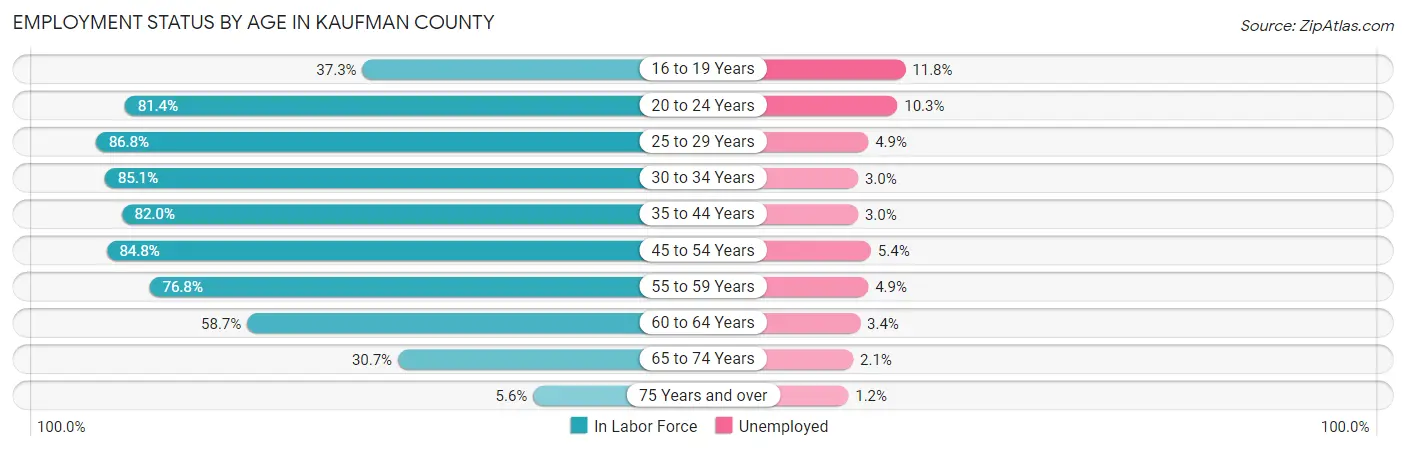
| Age Bracket | In Labor Force | Unemployed |
| 16 to 19 Years | 3,262 (37.3%) | 385 (11.8%) |
| 20 to 24 Years | 7,245 (81.4%) | 746 (10.3%) |
| 25 to 29 Years | 8,276 (86.8%) | 406 (4.9%) |
| 30 to 34 Years | 9,587 (85.1%) | 288 (3.0%) |
| 35 to 44 Years | 18,173 (82.0%) | 545 (3.0%) |
| 45 to 54 Years | 15,739 (84.8%) | 850 (5.4%) |
| 55 to 59 Years | 6,253 (76.8%) | 306 (4.9%) |
| 60 to 64 Years | 4,922 (58.7%) | 167 (3.4%) |
| 65 to 74 Years | 3,270 (30.7%) | 69 (2.1%) |
| 75 Years and over | 344 (5.6%) | 4 (1.2%) |
| Total | 77,050 (68.5%) | 3,775 (4.9%) |
Employment Status by Educational Attainment in Kaufman County
According to labor force statistics for Kaufman County, 80.6% of individuals (62,907) out of the total population between 25 and 64 years of age (78,049) are in the labor force, with 4.1% or 2,579 of them being unemployed. The group with the highest labor force participation rate are those with the educational attainment of bachelor's degree or higher, with 86.9% or 16,845 individuals in the labor force. Within the labor force, individuals with less than high school education have the highest percentage of unemployment, with 7.1% or 461 of them being unemployed.
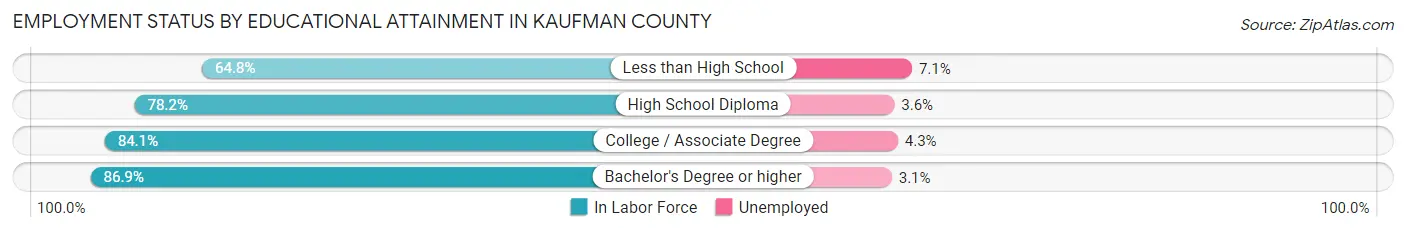
| Educational Attainment | In Labor Force | Unemployed |
| Less than High School | 6,496 (64.8%) | 712 (7.1%) |
| High School Diploma | 17,169 (78.2%) | 790 (3.6%) |
| College / Associate Degree | 22,442 (84.1%) | 1,147 (4.3%) |
| Bachelor's Degree or higher | 16,845 (86.9%) | 601 (3.1%) |
| Total | 62,907 (80.6%) | 3,200 (4.1%) |
Employment Occupations by Sex in Kaufman County
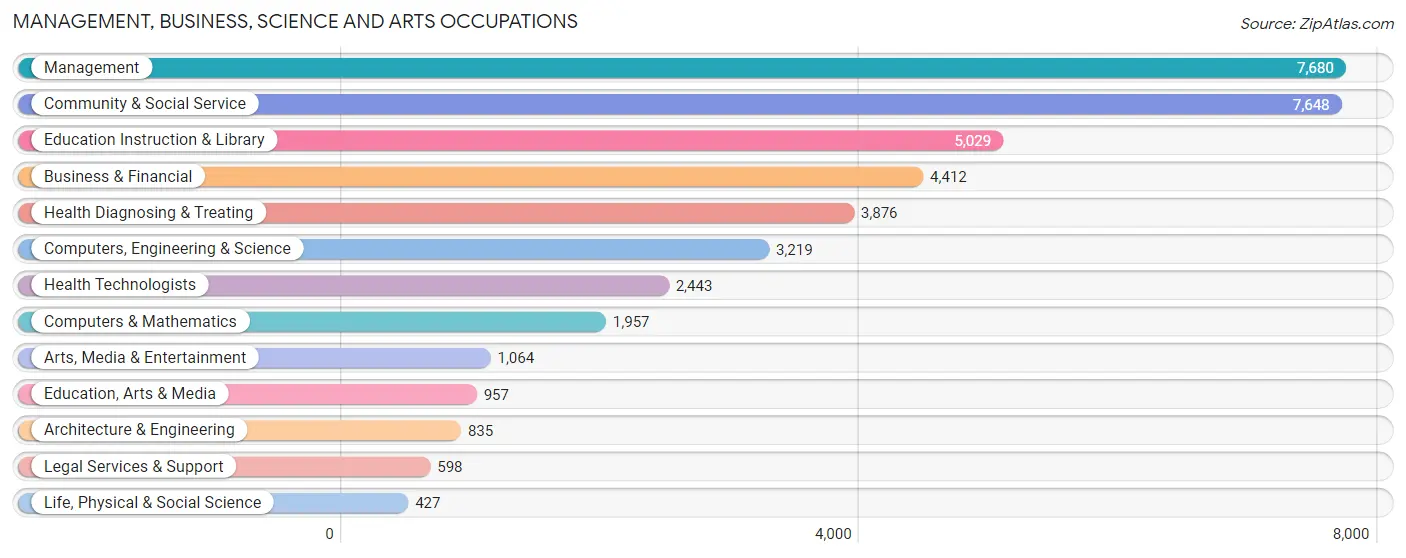
Management, Business, Science and Arts Occupations
The most common Management, Business, Science and Arts occupations in Kaufman County are Management (7,680 | 10.5%), Community & Social Service (7,648 | 10.4%), Education Instruction & Library (5,029 | 6.9%), Business & Financial (4,412 | 6.0%), and Health Diagnosing & Treating (3,876 | 5.3%).
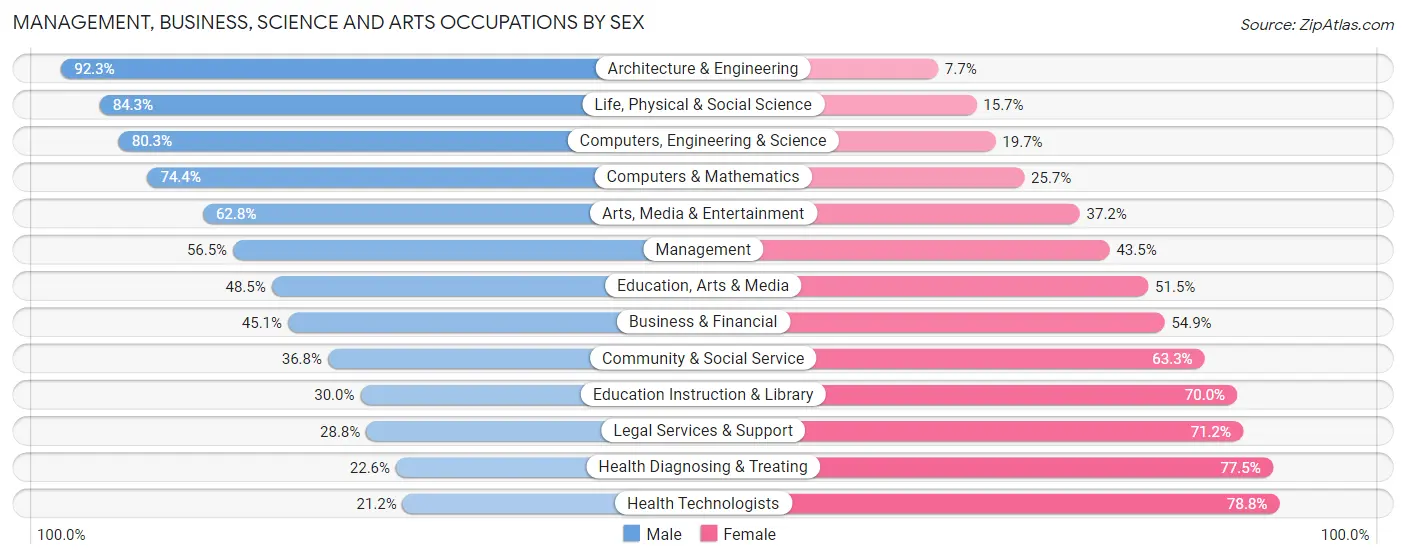
Management, Business, Science and Arts Occupations by Sex
Within the Management, Business, Science and Arts occupations in Kaufman County, the most male-oriented occupations are Architecture & Engineering (92.3%), Life, Physical & Social Science (84.3%), and Computers, Engineering & Science (80.3%), while the most female-oriented occupations are Health Technologists (78.8%), Health Diagnosing & Treating (77.4%), and Legal Services & Support (71.2%).
| Occupation | Male | Female |
| Management | 4,342 (56.5%) | 3,338 (43.5%) |
| Business & Financial | 1,989 (45.1%) | 2,423 (54.9%) |
| Computers, Engineering & Science | 2,586 (80.3%) | 633 (19.7%) |
| Computers & Mathematics | 1,455 (74.4%) | 502 (25.7%) |
| Architecture & Engineering | 771 (92.3%) | 64 (7.7%) |
| Life, Physical & Social Science | 360 (84.3%) | 67 (15.7%) |
| Community & Social Service | 2,811 (36.7%) | 4,837 (63.2%) |
| Education, Arts & Media | 464 (48.5%) | 493 (51.5%) |
| Legal Services & Support | 172 (28.8%) | 426 (71.2%) |
| Education Instruction & Library | 1,507 (30.0%) | 3,522 (70.0%) |
| Arts, Media & Entertainment | 668 (62.8%) | 396 (37.2%) |
| Health Diagnosing & Treating | 874 (22.6%) | 3,002 (77.4%) |
| Health Technologists | 517 (21.2%) | 1,926 (78.8%) |
| Total (Category) | 12,602 (47.0%) | 14,233 (53.0%) |
| Total (Overall) | 39,637 (54.2%) | 33,516 (45.8%) |
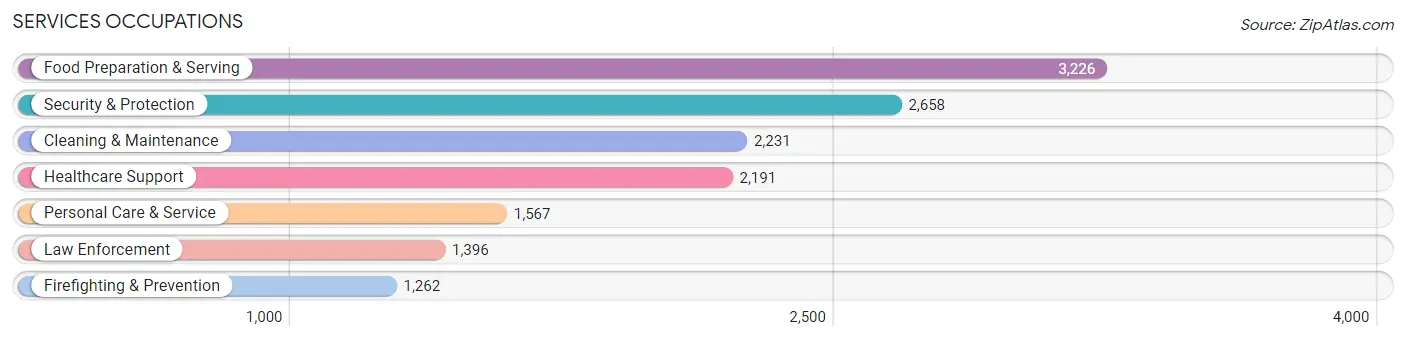
Services Occupations
The most common Services occupations in Kaufman County are Food Preparation & Serving (3,226 | 4.4%), Security & Protection (2,658 | 3.6%), Cleaning & Maintenance (2,231 | 3.0%), Healthcare Support (2,191 | 3.0%), and Personal Care & Service (1,567 | 2.1%).
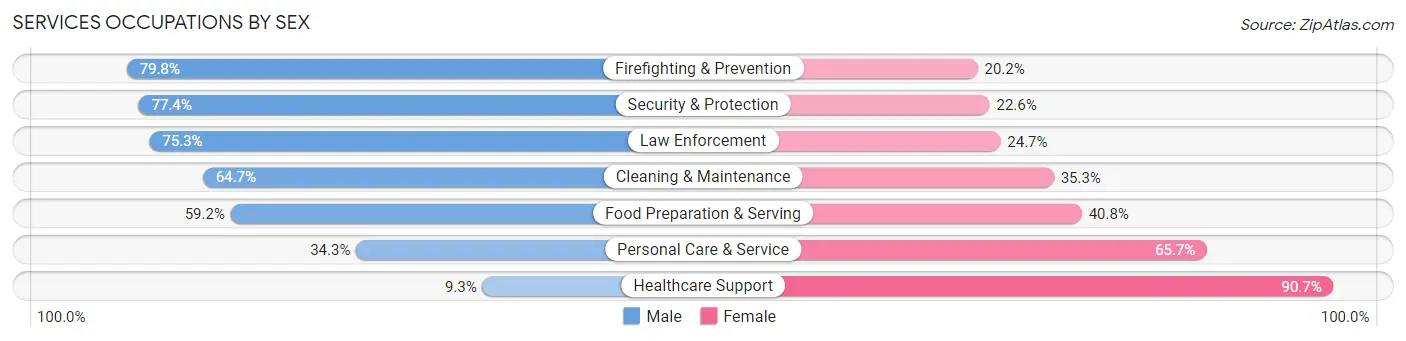
Services Occupations by Sex
Within the Services occupations in Kaufman County, the most male-oriented occupations are Firefighting & Prevention (79.8%), Security & Protection (77.4%), and Law Enforcement (75.3%), while the most female-oriented occupations are Healthcare Support (90.7%), Personal Care & Service (65.7%), and Food Preparation & Serving (40.8%).
| Occupation | Male | Female |
| Healthcare Support | 204 (9.3%) | 1,987 (90.7%) |
| Security & Protection | 2,058 (77.4%) | 600 (22.6%) |
| Firefighting & Prevention | 1,007 (79.8%) | 255 (20.2%) |
| Law Enforcement | 1,051 (75.3%) | 345 (24.7%) |
| Food Preparation & Serving | 1,909 (59.2%) | 1,317 (40.8%) |
| Cleaning & Maintenance | 1,444 (64.7%) | 787 (35.3%) |
| Personal Care & Service | 538 (34.3%) | 1,029 (65.7%) |
| Total (Category) | 6,153 (51.8%) | 5,720 (48.2%) |
| Total (Overall) | 39,637 (54.2%) | 33,516 (45.8%) |
Sales and Office Occupations
The most common Sales and Office occupations in Kaufman County are Office & Administration (9,685 | 13.2%), and Sales & Related (6,417 | 8.8%).
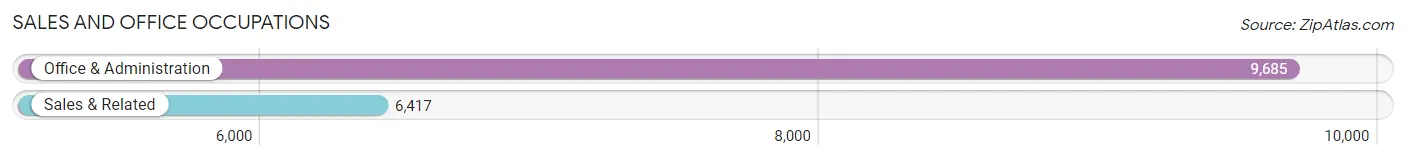
Sales and Office Occupations by Sex

| Occupation | Male | Female |
| Sales & Related | 3,114 (48.5%) | 3,303 (51.5%) |
| Office & Administration | 1,775 (18.3%) | 7,910 (81.7%) |
| Total (Category) | 4,889 (30.4%) | 11,213 (69.6%) |
| Total (Overall) | 39,637 (54.2%) | 33,516 (45.8%) |
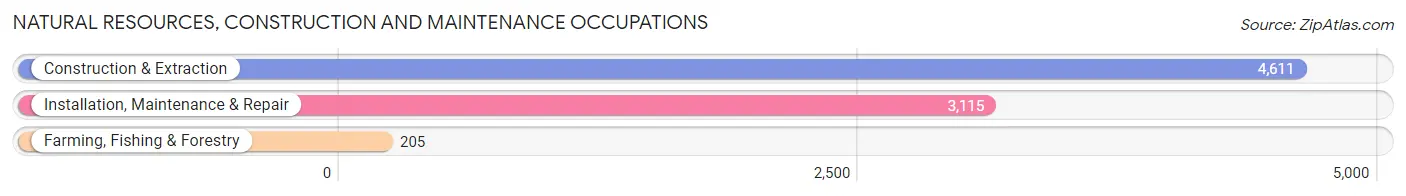
Natural Resources, Construction and Maintenance Occupations
The most common Natural Resources, Construction and Maintenance occupations in Kaufman County are Construction & Extraction (4,611 | 6.3%), Installation, Maintenance & Repair (3,115 | 4.3%), and Farming, Fishing & Forestry (205 | 0.3%).
Natural Resources, Construction and Maintenance Occupations by Sex
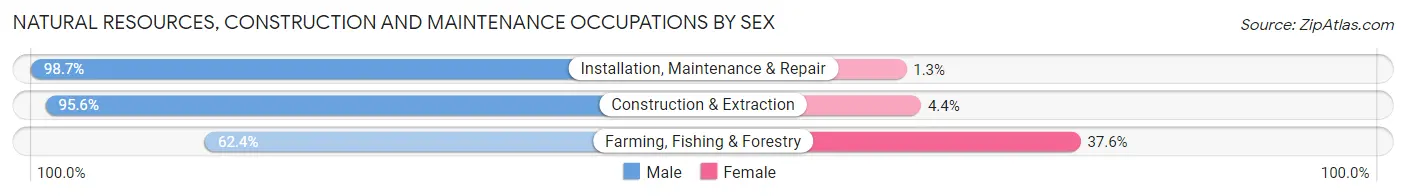
| Occupation | Male | Female |
| Farming, Fishing & Forestry | 128 (62.4%) | 77 (37.6%) |
| Construction & Extraction | 4,409 (95.6%) | 202 (4.4%) |
| Installation, Maintenance & Repair | 3,074 (98.7%) | 41 (1.3%) |
| Total (Category) | 7,611 (96.0%) | 320 (4.0%) |
| Total (Overall) | 39,637 (54.2%) | 33,516 (45.8%) |
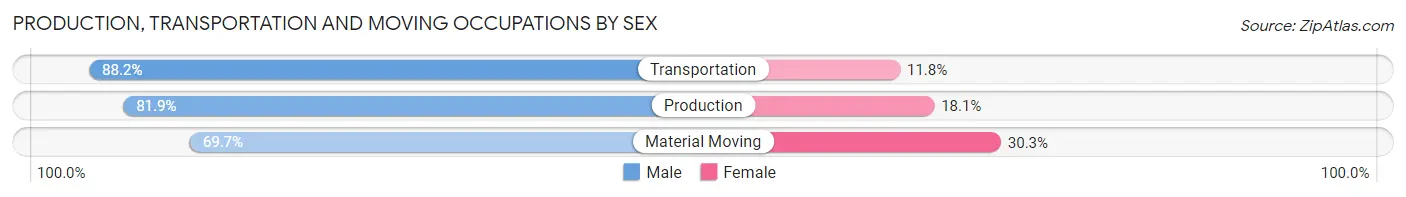
Production, Transportation and Moving Occupations
The most common Production, Transportation and Moving occupations in Kaufman County are Transportation (3,833 | 5.2%), Production (3,430 | 4.7%), and Material Moving (3,149 | 4.3%).
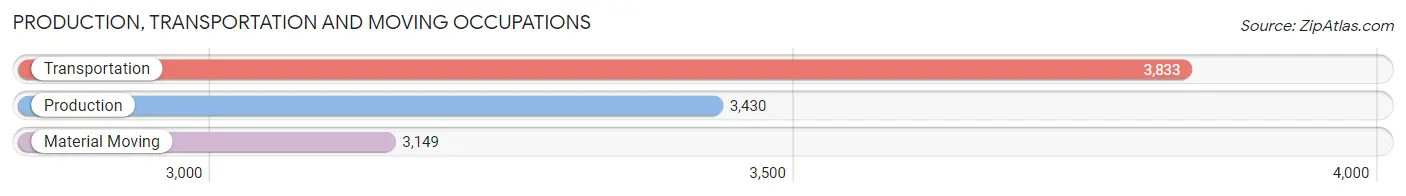
Production, Transportation and Moving Occupations by Sex
| Occupation | Male | Female |
| Production | 2,809 (81.9%) | 621 (18.1%) |
| Transportation | 3,379 (88.2%) | 454 (11.8%) |
| Material Moving | 2,194 (69.7%) | 955 (30.3%) |
| Total (Category) | 8,382 (80.5%) | 2,030 (19.5%) |
| Total (Overall) | 39,637 (54.2%) | 33,516 (45.8%) |
Employment Industries by Sex in Kaufman County
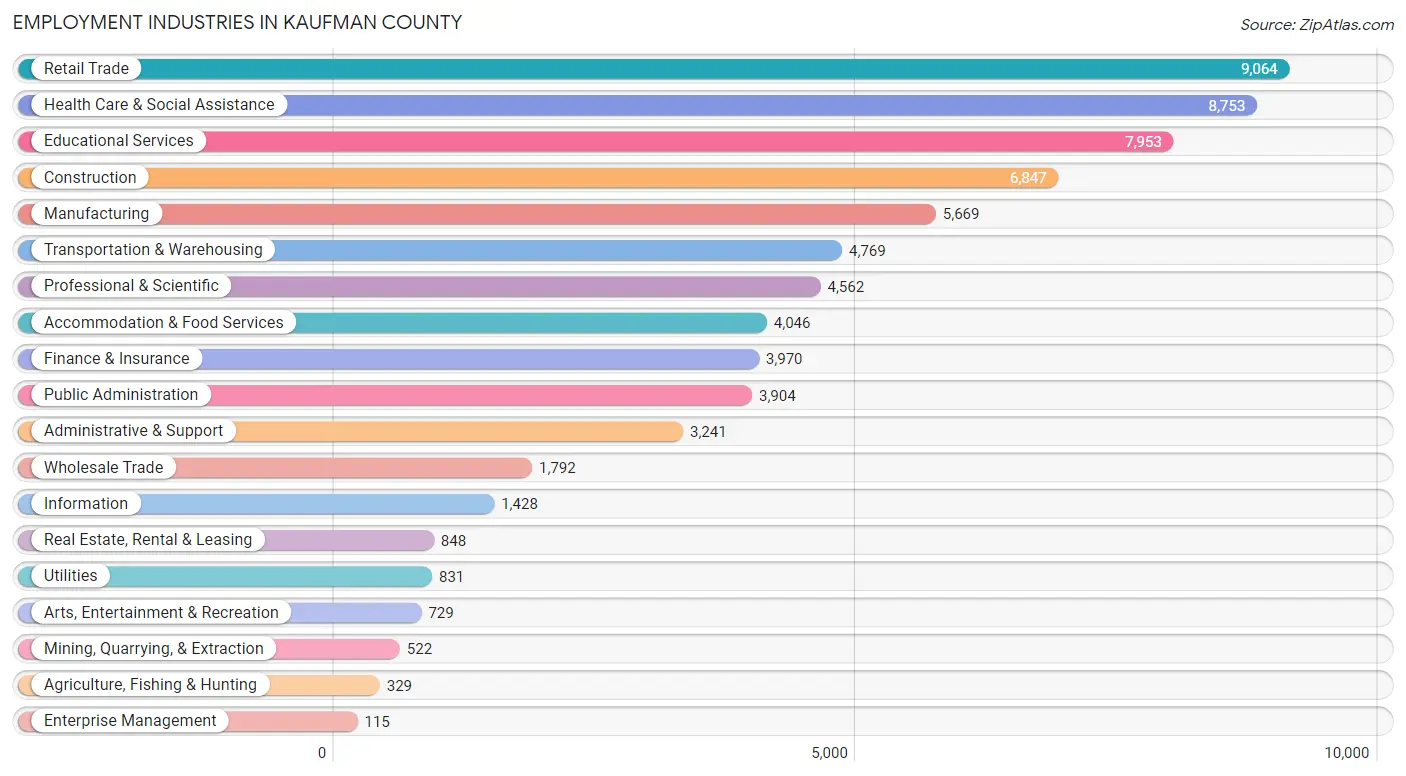
Employment Industries in Kaufman County
The major employment industries in Kaufman County include Retail Trade (9,064 | 12.4%), Health Care & Social Assistance (8,753 | 12.0%), Educational Services (7,953 | 10.9%), Construction (6,847 | 9.4%), and Manufacturing (5,669 | 7.7%).
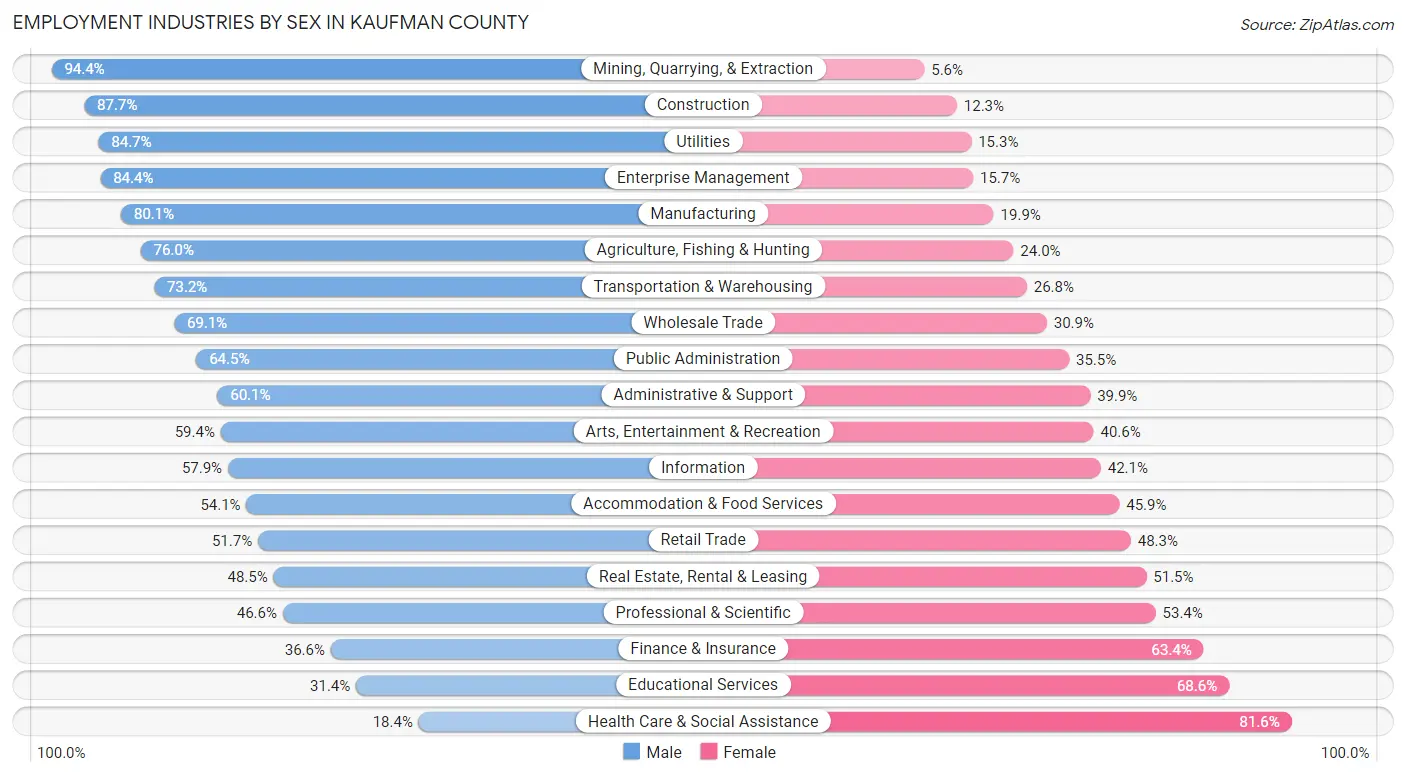
Employment Industries by Sex in Kaufman County
The Kaufman County industries that see more men than women are Mining, Quarrying, & Extraction (94.4%), Construction (87.7%), and Utilities (84.7%), whereas the industries that tend to have a higher number of women are Health Care & Social Assistance (81.6%), Educational Services (68.6%), and Finance & Insurance (63.4%).
| Industry | Male | Female |
| Agriculture, Fishing & Hunting | 250 (76.0%) | 79 (24.0%) |
| Mining, Quarrying, & Extraction | 493 (94.4%) | 29 (5.6%) |
| Construction | 6,005 (87.7%) | 842 (12.3%) |
| Manufacturing | 4,540 (80.1%) | 1,129 (19.9%) |
| Wholesale Trade | 1,238 (69.1%) | 554 (30.9%) |
| Retail Trade | 4,685 (51.7%) | 4,379 (48.3%) |
| Transportation & Warehousing | 3,492 (73.2%) | 1,277 (26.8%) |
| Utilities | 704 (84.7%) | 127 (15.3%) |
| Information | 827 (57.9%) | 601 (42.1%) |
| Finance & Insurance | 1,454 (36.6%) | 2,516 (63.4%) |
| Real Estate, Rental & Leasing | 411 (48.5%) | 437 (51.5%) |
| Professional & Scientific | 2,124 (46.6%) | 2,438 (53.4%) |
| Enterprise Management | 97 (84.4%) | 18 (15.7%) |
| Administrative & Support | 1,948 (60.1%) | 1,293 (39.9%) |
| Educational Services | 2,496 (31.4%) | 5,457 (68.6%) |
| Health Care & Social Assistance | 1,612 (18.4%) | 7,141 (81.6%) |
| Arts, Entertainment & Recreation | 433 (59.4%) | 296 (40.6%) |
| Accommodation & Food Services | 2,188 (54.1%) | 1,858 (45.9%) |
| Public Administration | 2,517 (64.5%) | 1,387 (35.5%) |
| Total | 39,637 (54.2%) | 33,516 (45.8%) |
Education in Kaufman County
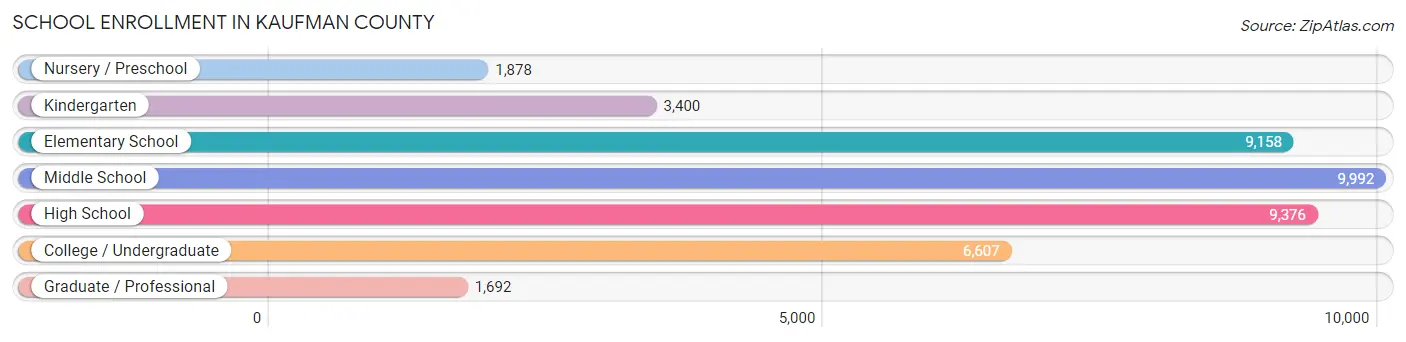
School Enrollment in Kaufman County
The most common levels of schooling among the 42,103 students in Kaufman County are middle school (9,992 | 23.7%), high school (9,376 | 22.3%), and elementary school (9,158 | 21.7%).
| School Level | # Students | % Students |
| Nursery / Preschool | 1,878 | 4.5% |
| Kindergarten | 3,400 | 8.1% |
| Elementary School | 9,158 | 21.7% |
| Middle School | 9,992 | 23.7% |
| High School | 9,376 | 22.3% |
| College / Undergraduate | 6,607 | 15.7% |
| Graduate / Professional | 1,692 | 4.0% |
| Total | 42,103 | 100.0% |
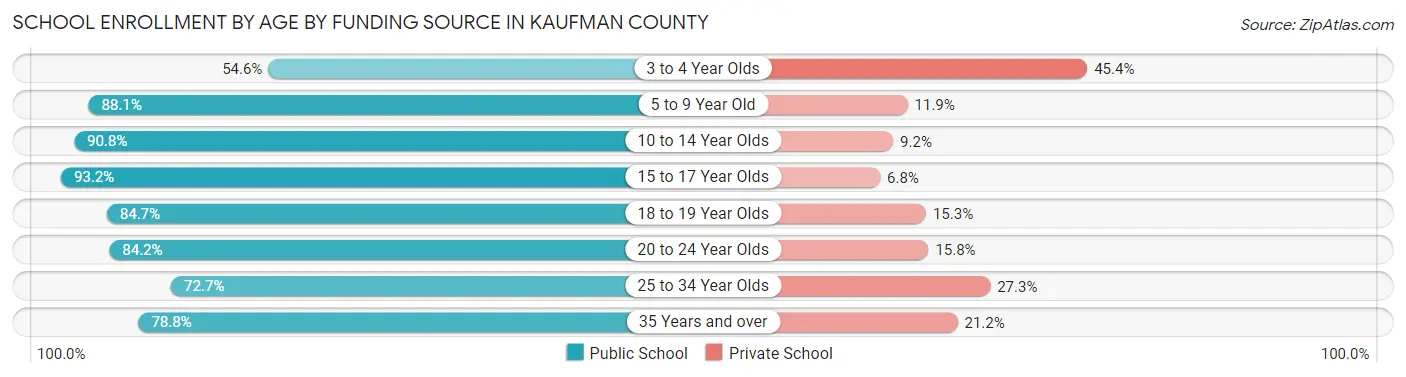
School Enrollment by Age by Funding Source in Kaufman County
Out of a total of 42,103 students who are enrolled in schools in Kaufman County, 5,684 (13.5%) attend a private institution, while the remaining 36,419 (86.5%) are enrolled in public schools. The age group of 3 to 4 year olds has the highest likelihood of being enrolled in private schools, with 837 (45.4% in the age bracket) enrolled. Conversely, the age group of 15 to 17 year olds has the lowest likelihood of being enrolled in a private school, with 6,629 (93.2% in the age bracket) attending a public institution.
| Age Bracket | Public School | Private School |
| 3 to 4 Year Olds | 1,008 (54.6%) | 837 (45.4%) |
| 5 to 9 Year Old | 10,227 (88.1%) | 1,383 (11.9%) |
| 10 to 14 Year Olds | 10,752 (90.8%) | 1,092 (9.2%) |
| 15 to 17 Year Olds | 6,629 (93.2%) | 482 (6.8%) |
| 18 to 19 Year Olds | 2,370 (84.7%) | 429 (15.3%) |
| 20 to 24 Year Olds | 1,995 (84.2%) | 374 (15.8%) |
| 25 to 34 Year Olds | 1,579 (72.7%) | 593 (27.3%) |
| 35 Years and over | 1,854 (78.8%) | 499 (21.2%) |
| Total | 36,419 (86.5%) | 5,684 (13.5%) |
Educational Attainment by Field of Study in Kaufman County
Business (5,666 | 23.8%), education (4,277 | 17.9%), science & technology (2,538 | 10.6%), arts & humanities (2,002 | 8.4%), and engineering (1,429 | 6.0%) are the most common fields of study among 23,839 individuals in Kaufman County who have obtained a bachelor's degree or higher.
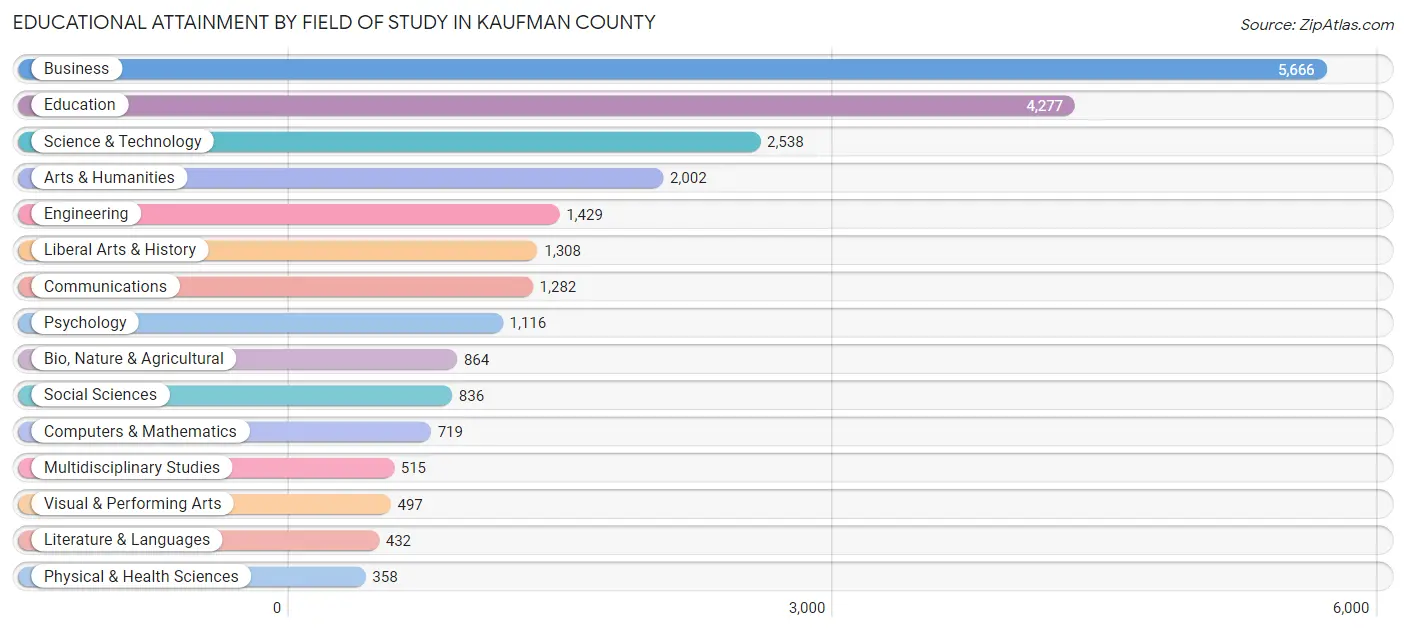
| Field of Study | # Graduates | % Graduates |
| Computers & Mathematics | 719 | 3.0% |
| Bio, Nature & Agricultural | 864 | 3.6% |
| Physical & Health Sciences | 358 | 1.5% |
| Psychology | 1,116 | 4.7% |
| Social Sciences | 836 | 3.5% |
| Engineering | 1,429 | 6.0% |
| Multidisciplinary Studies | 515 | 2.2% |
| Science & Technology | 2,538 | 10.6% |
| Business | 5,666 | 23.8% |
| Education | 4,277 | 17.9% |
| Literature & Languages | 432 | 1.8% |
| Liberal Arts & History | 1,308 | 5.5% |
| Visual & Performing Arts | 497 | 2.1% |
| Communications | 1,282 | 5.4% |
| Arts & Humanities | 2,002 | 8.4% |
| Total | 23,839 | 100.0% |
Transportation & Commute in Kaufman County
Vehicle Availability by Sex in Kaufman County
The most prevalent vehicle ownership categories in Kaufman County are males with 2 vehicles (15,519, accounting for 39.8%) and females with 2 vehicles (12,340, making up 47.3%).
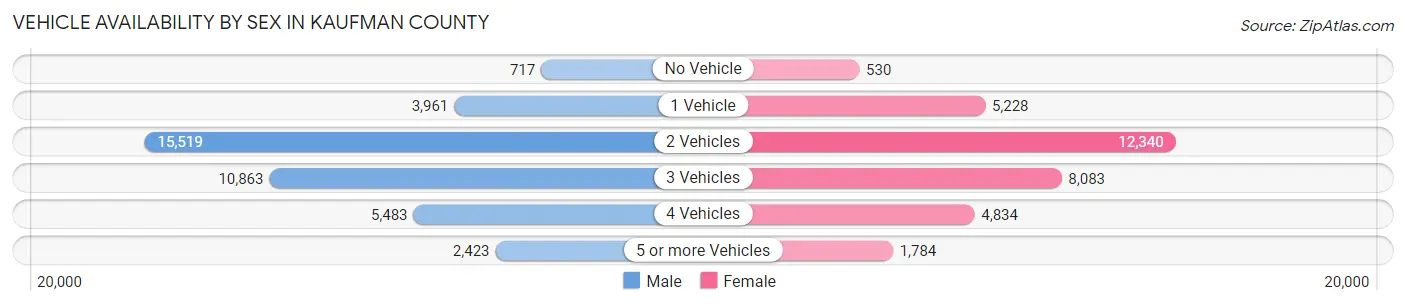
| Vehicles Available | Male | Female |
| No Vehicle | 717 (1.8%) | 530 (1.6%) |
| 1 Vehicle | 3,961 (10.2%) | 5,228 (15.9%) |
| 2 Vehicles | 15,519 (39.8%) | 12,340 (37.6%) |
| 3 Vehicles | 10,863 (27.9%) | 8,083 (24.6%) |
| 4 Vehicles | 5,483 (14.1%) | 4,834 (14.7%) |
| 5 or more Vehicles | 2,423 (6.2%) | 1,784 (5.4%) |
| Total | 38,966 (100.0%) | 32,799 (100.0%) |
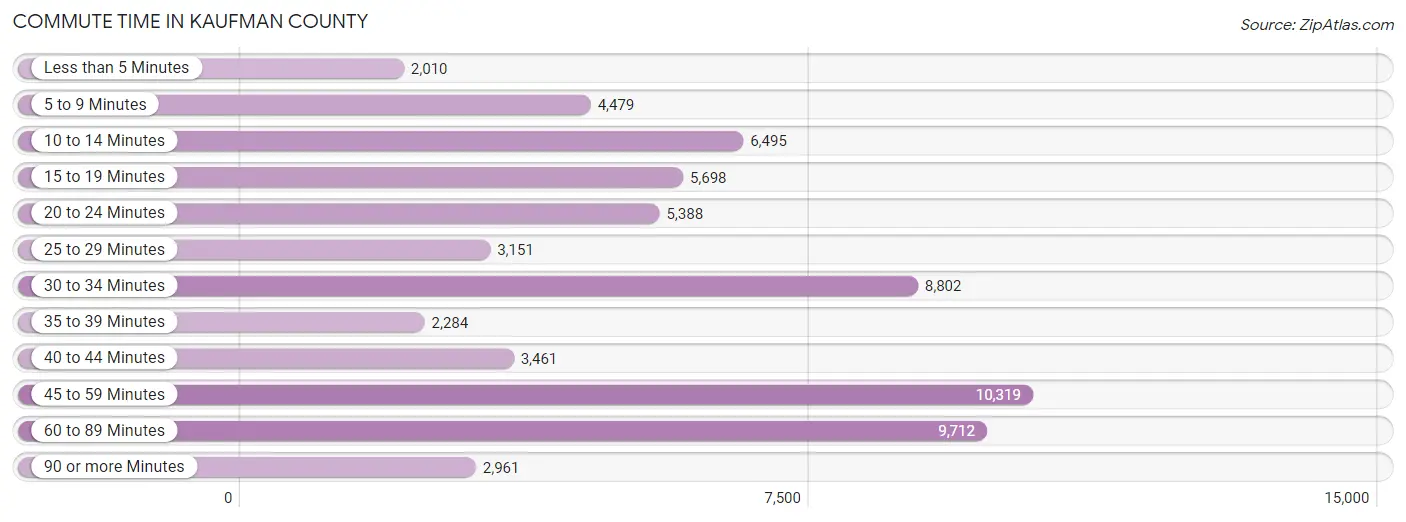
Commute Time in Kaufman County
The most frequently occuring commute durations in Kaufman County are 45 to 59 minutes (10,319 commuters, 15.9%), 60 to 89 minutes (9,712 commuters, 15.0%), and 30 to 34 minutes (8,802 commuters, 13.6%).
| Commute Time | # Commuters | % Commuters |
| Less than 5 Minutes | 2,010 | 3.1% |
| 5 to 9 Minutes | 4,479 | 6.9% |
| 10 to 14 Minutes | 6,495 | 10.0% |
| 15 to 19 Minutes | 5,698 | 8.8% |
| 20 to 24 Minutes | 5,388 | 8.3% |
| 25 to 29 Minutes | 3,151 | 4.9% |
| 30 to 34 Minutes | 8,802 | 13.6% |
| 35 to 39 Minutes | 2,284 | 3.5% |
| 40 to 44 Minutes | 3,461 | 5.3% |
| 45 to 59 Minutes | 10,319 | 15.9% |
| 60 to 89 Minutes | 9,712 | 15.0% |
| 90 or more Minutes | 2,961 | 4.6% |
Commute Time by Sex in Kaufman County
The most common commute times in Kaufman County are 45 to 59 minutes (6,485 commuters, 18.2%) for males and 30 to 34 minutes (3,946 commuters, 13.5%) for females.
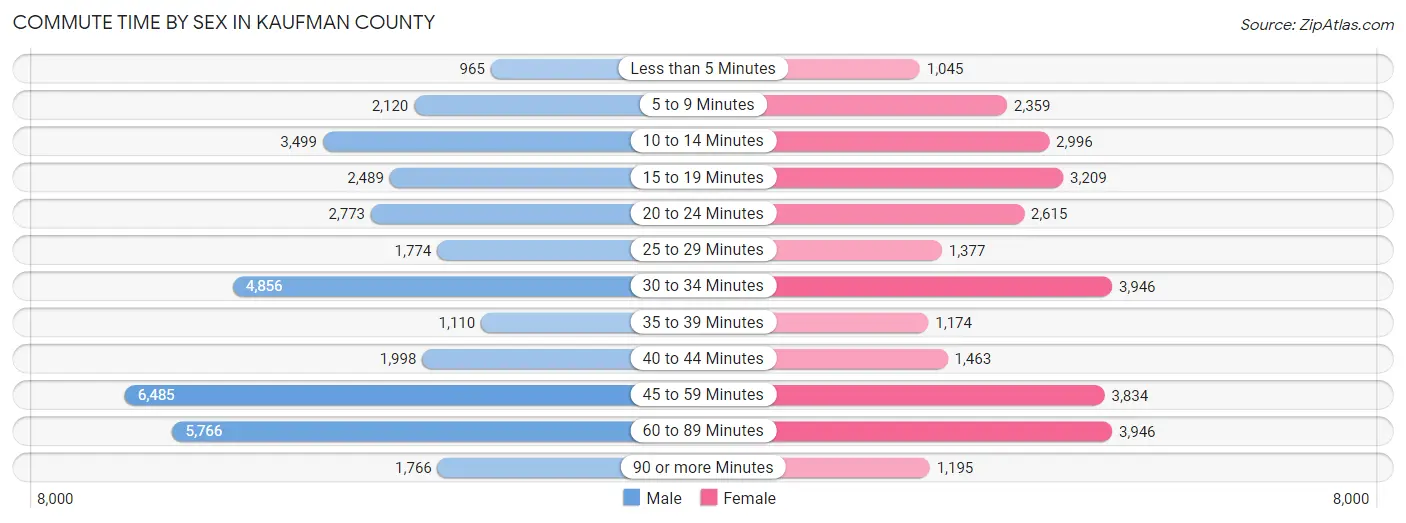
| Commute Time | Male | Female |
| Less than 5 Minutes | 965 (2.7%) | 1,045 (3.6%) |
| 5 to 9 Minutes | 2,120 (5.9%) | 2,359 (8.1%) |
| 10 to 14 Minutes | 3,499 (9.8%) | 2,996 (10.3%) |
| 15 to 19 Minutes | 2,489 (7.0%) | 3,209 (11.0%) |
| 20 to 24 Minutes | 2,773 (7.8%) | 2,615 (9.0%) |
| 25 to 29 Minutes | 1,774 (5.0%) | 1,377 (4.7%) |
| 30 to 34 Minutes | 4,856 (13.6%) | 3,946 (13.5%) |
| 35 to 39 Minutes | 1,110 (3.1%) | 1,174 (4.0%) |
| 40 to 44 Minutes | 1,998 (5.6%) | 1,463 (5.0%) |
| 45 to 59 Minutes | 6,485 (18.2%) | 3,834 (13.2%) |
| 60 to 89 Minutes | 5,766 (16.2%) | 3,946 (13.5%) |
| 90 or more Minutes | 1,766 (5.0%) | 1,195 (4.1%) |
Time of Departure to Work by Sex in Kaufman County
The most frequent times of departure to work in Kaufman County are 7:00 AM to 7:29 AM (4,998, 14.0%) for males and 7:00 AM to 7:29 AM (5,398, 18.5%) for females.
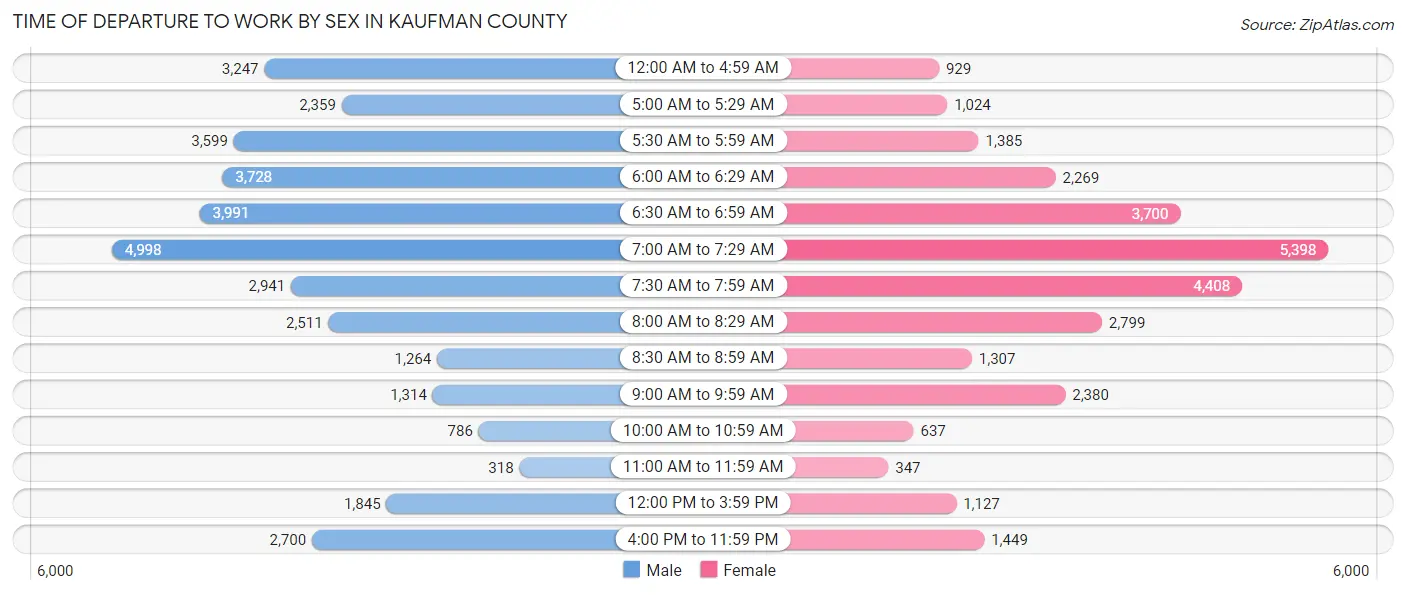
| Time of Departure | Male | Female |
| 12:00 AM to 4:59 AM | 3,247 (9.1%) | 929 (3.2%) |
| 5:00 AM to 5:29 AM | 2,359 (6.6%) | 1,024 (3.5%) |
| 5:30 AM to 5:59 AM | 3,599 (10.1%) | 1,385 (4.8%) |
| 6:00 AM to 6:29 AM | 3,728 (10.5%) | 2,269 (7.8%) |
| 6:30 AM to 6:59 AM | 3,991 (11.2%) | 3,700 (12.7%) |
| 7:00 AM to 7:29 AM | 4,998 (14.0%) | 5,398 (18.5%) |
| 7:30 AM to 7:59 AM | 2,941 (8.3%) | 4,408 (15.1%) |
| 8:00 AM to 8:29 AM | 2,511 (7.0%) | 2,799 (9.6%) |
| 8:30 AM to 8:59 AM | 1,264 (3.5%) | 1,307 (4.5%) |
| 9:00 AM to 9:59 AM | 1,314 (3.7%) | 2,380 (8.2%) |
| 10:00 AM to 10:59 AM | 786 (2.2%) | 637 (2.2%) |
| 11:00 AM to 11:59 AM | 318 (0.9%) | 347 (1.2%) |
| 12:00 PM to 3:59 PM | 1,845 (5.2%) | 1,127 (3.9%) |
| 4:00 PM to 11:59 PM | 2,700 (7.6%) | 1,449 (5.0%) |
| Total | 35,601 (100.0%) | 29,159 (100.0%) |
Housing Occupancy in Kaufman County
Occupancy by Ownership in Kaufman County
Of the total 47,899 dwellings in Kaufman County, owner-occupied units account for 37,065 (77.4%), while renter-occupied units make up 10,834 (22.6%).
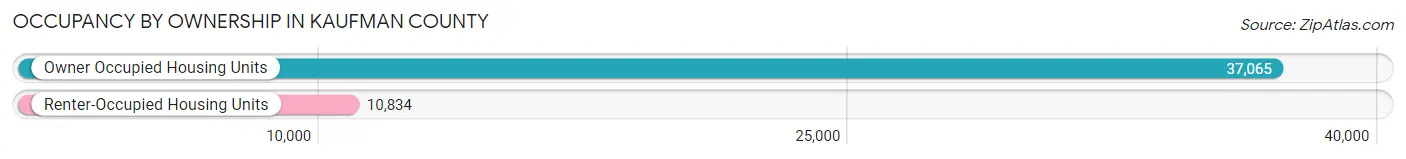
| Occupancy | # Housing Units | % Housing Units |
| Owner Occupied Housing Units | 37,065 | 77.4% |
| Renter-Occupied Housing Units | 10,834 | 22.6% |
| Total Occupied Housing Units | 47,899 | 100.0% |
Occupancy by Household Size in Kaufman County
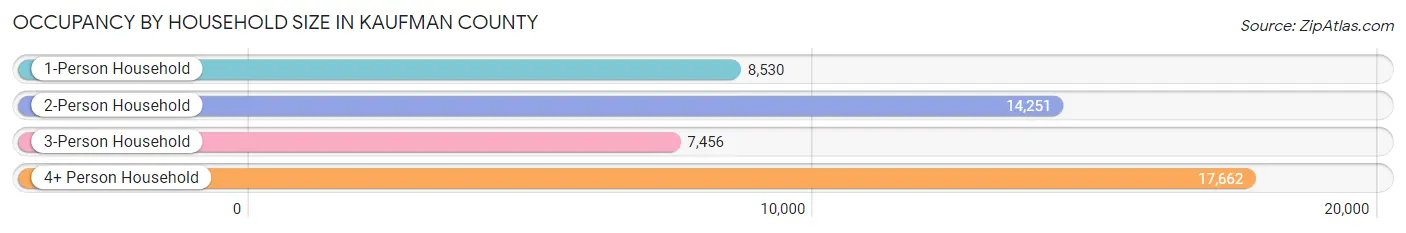
| Household Size | # Housing Units | % Housing Units |
| 1-Person Household | 8,530 | 17.8% |
| 2-Person Household | 14,251 | 29.7% |
| 3-Person Household | 7,456 | 15.6% |
| 4+ Person Household | 17,662 | 36.9% |
| Total Housing Units | 47,899 | 100.0% |
Occupancy by Ownership by Household Size in Kaufman County
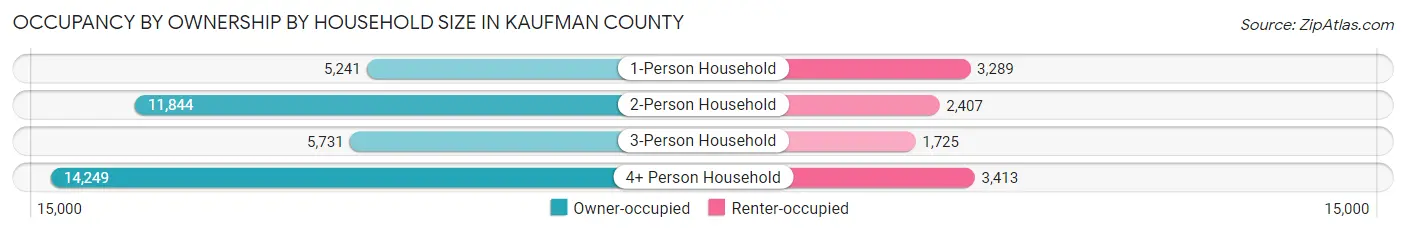
| Household Size | Owner-occupied | Renter-occupied |
| 1-Person Household | 5,241 (61.4%) | 3,289 (38.6%) |
| 2-Person Household | 11,844 (83.1%) | 2,407 (16.9%) |
| 3-Person Household | 5,731 (76.9%) | 1,725 (23.1%) |
| 4+ Person Household | 14,249 (80.7%) | 3,413 (19.3%) |
| Total Housing Units | 37,065 (77.4%) | 10,834 (22.6%) |
Occupancy by Educational Attainment in Kaufman County
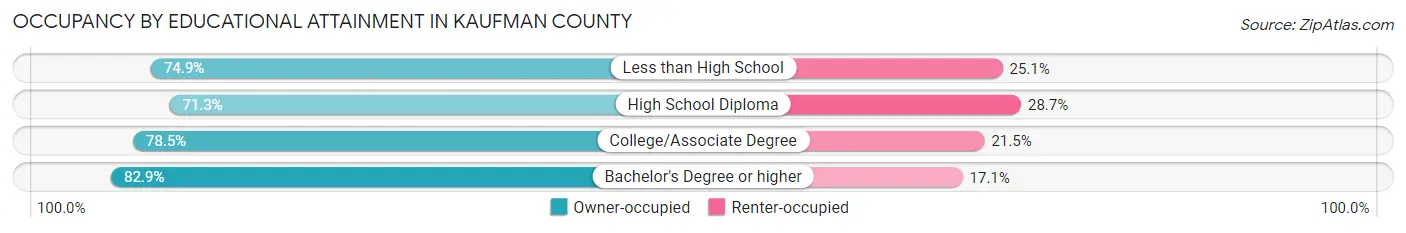
| Household Size | Owner-occupied | Renter-occupied |
| Less than High School | 4,046 (74.9%) | 1,353 (25.1%) |
| High School Diploma | 8,802 (71.3%) | 3,547 (28.7%) |
| College/Associate Degree | 13,856 (78.5%) | 3,791 (21.5%) |
| Bachelor's Degree or higher | 10,361 (82.9%) | 2,143 (17.1%) |
Occupancy by Age of Householder in Kaufman County
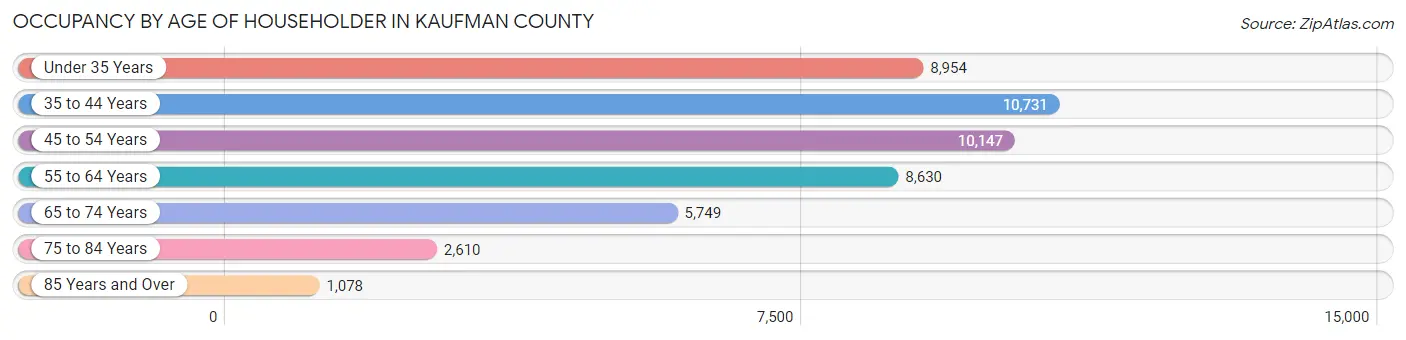
| Age Bracket | # Households | % Households |
| Under 35 Years | 8,954 | 18.7% |
| 35 to 44 Years | 10,731 | 22.4% |
| 45 to 54 Years | 10,147 | 21.2% |
| 55 to 64 Years | 8,630 | 18.0% |
| 65 to 74 Years | 5,749 | 12.0% |
| 75 to 84 Years | 2,610 | 5.4% |
| 85 Years and Over | 1,078 | 2.2% |
| Total | 47,899 | 100.0% |
Housing Finances in Kaufman County
Median Income by Occupancy in Kaufman County
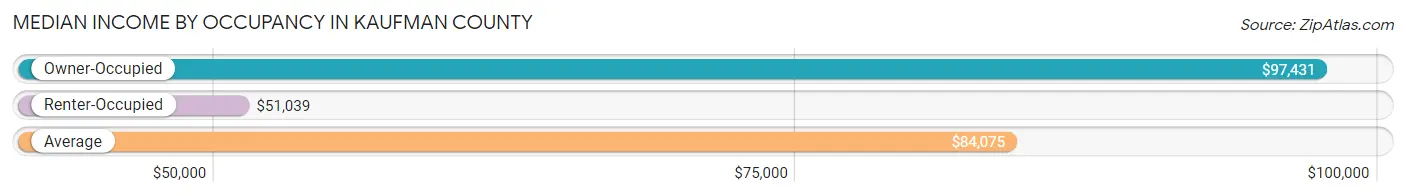
| Occupancy Type | # Households | Median Income |
| Owner-Occupied | 37,065 (77.4%) | $97,431 |
| Renter-Occupied | 10,834 (22.6%) | $51,039 |
| Average | 47,899 (100.0%) | $84,075 |
Occupancy by Householder Income Bracket in Kaufman County
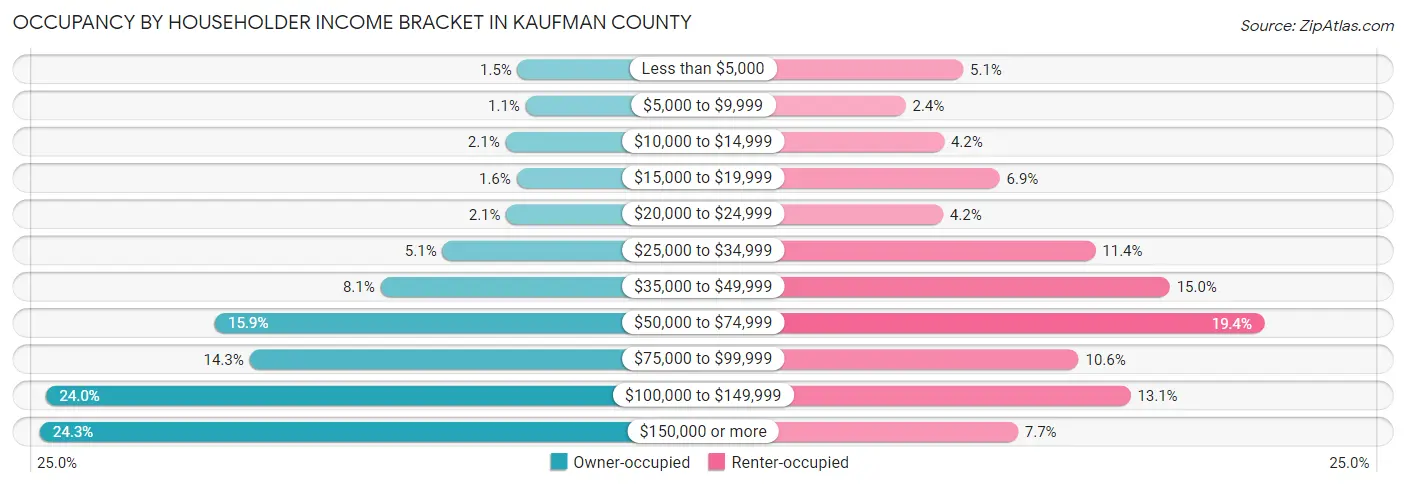
| Income Bracket | Owner-occupied | Renter-occupied |
| Less than $5,000 | 565 (1.5%) | 555 (5.1%) |
| $5,000 to $9,999 | 423 (1.1%) | 258 (2.4%) |
| $10,000 to $14,999 | 778 (2.1%) | 456 (4.2%) |
| $15,000 to $19,999 | 583 (1.6%) | 743 (6.9%) |
| $20,000 to $24,999 | 763 (2.1%) | 451 (4.2%) |
| $25,000 to $34,999 | 1,890 (5.1%) | 1,237 (11.4%) |
| $35,000 to $49,999 | 2,985 (8.1%) | 1,621 (15.0%) |
| $50,000 to $74,999 | 5,906 (15.9%) | 2,106 (19.4%) |
| $75,000 to $99,999 | 5,298 (14.3%) | 1,151 (10.6%) |
| $100,000 to $149,999 | 8,880 (24.0%) | 1,418 (13.1%) |
| $150,000 or more | 8,994 (24.3%) | 838 (7.7%) |
| Total | 37,065 (100.0%) | 10,834 (100.0%) |
Monthly Housing Cost Tiers in Kaufman County
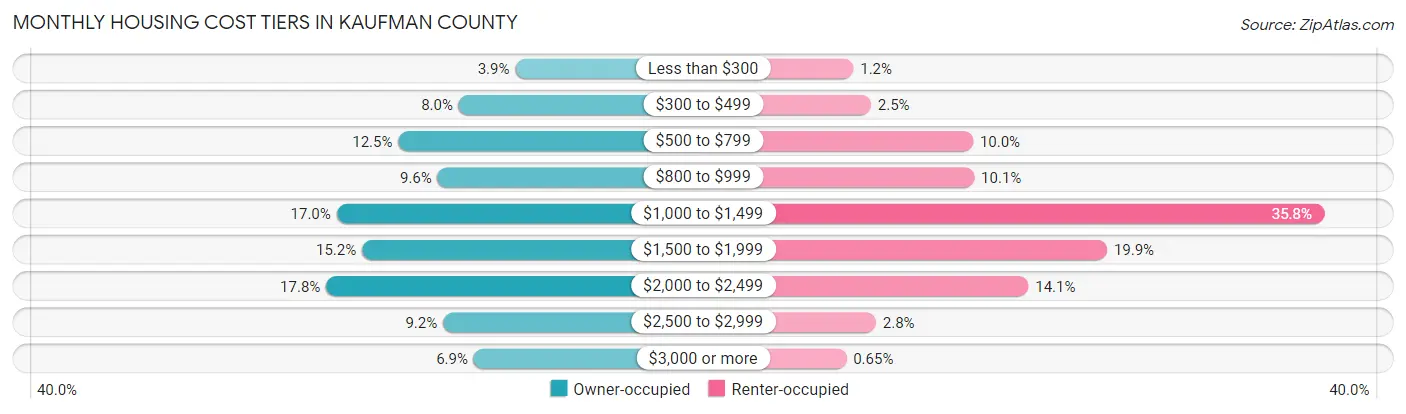
| Monthly Cost | Owner-occupied | Renter-occupied |
| Less than $300 | 1,430 (3.9%) | 127 (1.2%) |
| $300 to $499 | 2,973 (8.0%) | 266 (2.5%) |
| $500 to $799 | 4,627 (12.5%) | 1,081 (10.0%) |
| $800 to $999 | 3,549 (9.6%) | 1,091 (10.1%) |
| $1,000 to $1,499 | 6,307 (17.0%) | 3,881 (35.8%) |
| $1,500 to $1,999 | 5,616 (15.1%) | 2,151 (19.9%) |
| $2,000 to $2,499 | 6,595 (17.8%) | 1,523 (14.1%) |
| $2,500 to $2,999 | 3,404 (9.2%) | 307 (2.8%) |
| $3,000 or more | 2,564 (6.9%) | 70 (0.6%) |
| Total | 37,065 (100.0%) | 10,834 (100.0%) |
Physical Housing Characteristics in Kaufman County
Housing Structures in Kaufman County
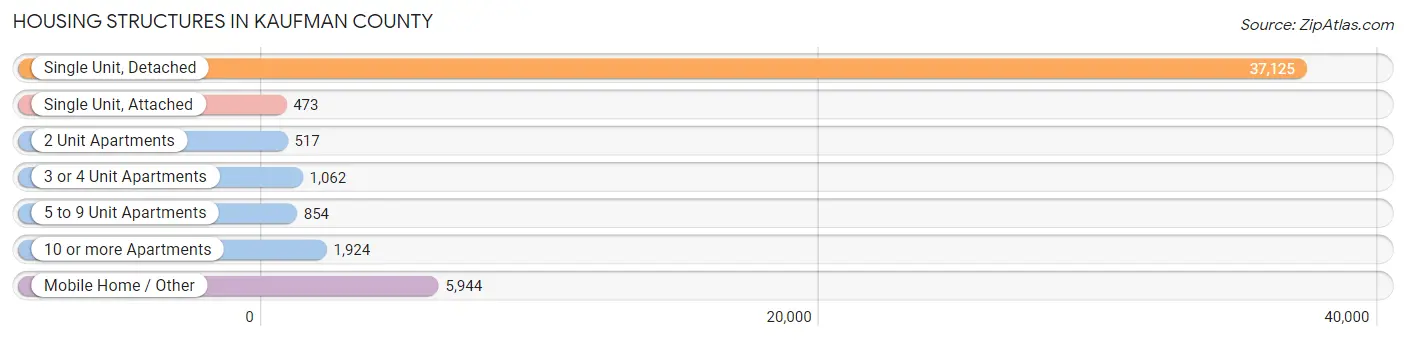
| Structure Type | # Housing Units | % Housing Units |
| Single Unit, Detached | 37,125 | 77.5% |
| Single Unit, Attached | 473 | 1.0% |
| 2 Unit Apartments | 517 | 1.1% |
| 3 or 4 Unit Apartments | 1,062 | 2.2% |
| 5 to 9 Unit Apartments | 854 | 1.8% |
| 10 or more Apartments | 1,924 | 4.0% |
| Mobile Home / Other | 5,944 | 12.4% |
| Total | 47,899 | 100.0% |
Housing Structures by Occupancy in Kaufman County
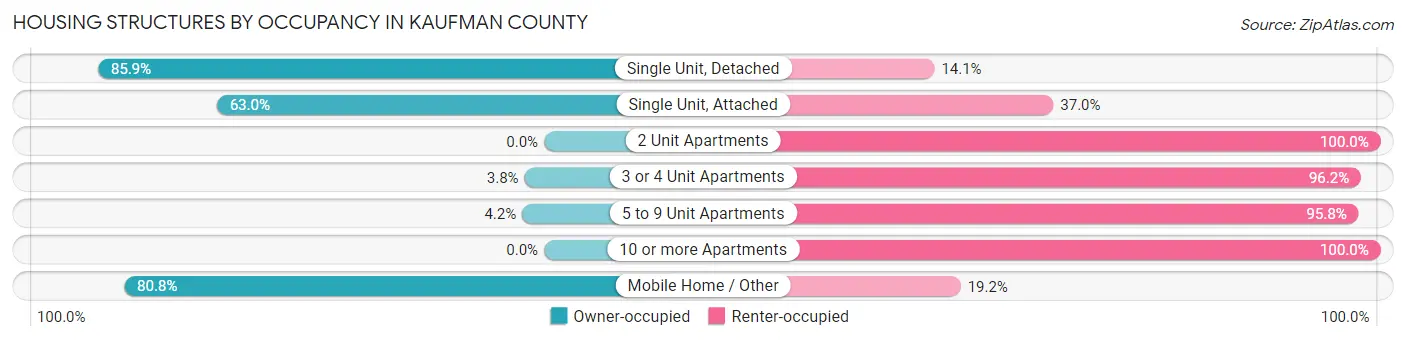
| Structure Type | Owner-occupied | Renter-occupied |
| Single Unit, Detached | 31,886 (85.9%) | 5,239 (14.1%) |
| Single Unit, Attached | 298 (63.0%) | 175 (37.0%) |
| 2 Unit Apartments | 0 (0.0%) | 517 (100.0%) |
| 3 or 4 Unit Apartments | 40 (3.8%) | 1,022 (96.2%) |
| 5 to 9 Unit Apartments | 36 (4.2%) | 818 (95.8%) |
| 10 or more Apartments | 0 (0.0%) | 1,924 (100.0%) |
| Mobile Home / Other | 4,805 (80.8%) | 1,139 (19.2%) |
| Total | 37,065 (77.4%) | 10,834 (22.6%) |
Housing Structures by Number of Rooms in Kaufman County
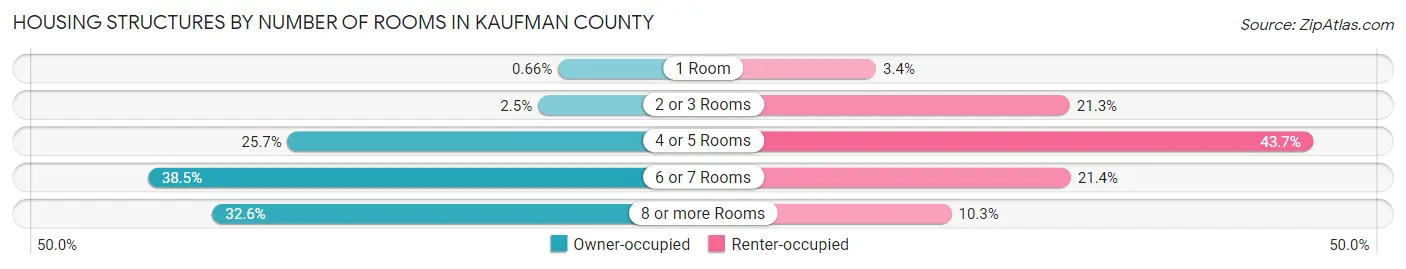
| Number of Rooms | Owner-occupied | Renter-occupied |
| 1 Room | 244 (0.7%) | 363 (3.4%) |
| 2 or 3 Rooms | 935 (2.5%) | 2,304 (21.3%) |
| 4 or 5 Rooms | 9,520 (25.7%) | 4,735 (43.7%) |
| 6 or 7 Rooms | 14,273 (38.5%) | 2,314 (21.4%) |
| 8 or more Rooms | 12,093 (32.6%) | 1,118 (10.3%) |
| Total | 37,065 (100.0%) | 10,834 (100.0%) |
Housing Structure by Heating Type in Kaufman County
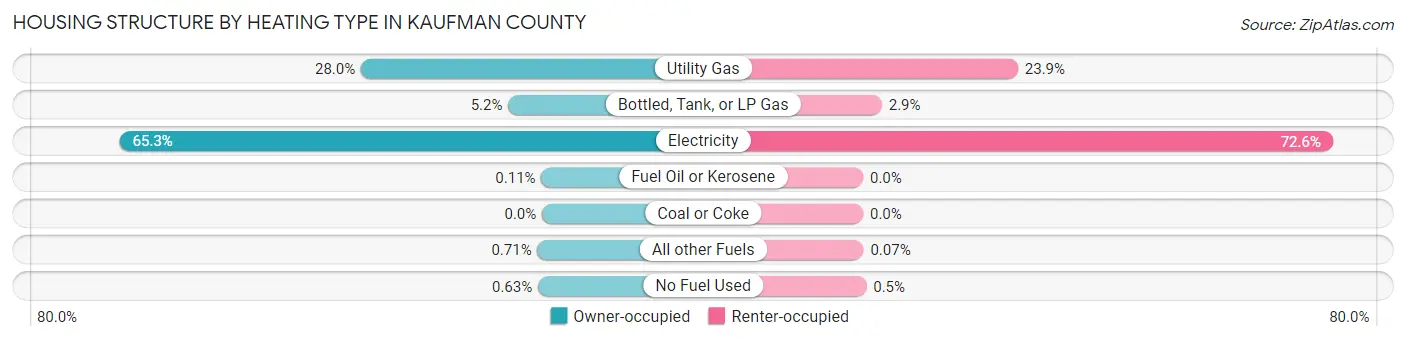
| Heating Type | Owner-occupied | Renter-occupied |
| Utility Gas | 10,373 (28.0%) | 2,593 (23.9%) |
| Bottled, Tank, or LP Gas | 1,938 (5.2%) | 314 (2.9%) |
| Electricity | 24,216 (65.3%) | 7,865 (72.6%) |
| Fuel Oil or Kerosene | 41 (0.1%) | 0 (0.0%) |
| Coal or Coke | 0 (0.0%) | 0 (0.0%) |
| All other Fuels | 263 (0.7%) | 8 (0.1%) |
| No Fuel Used | 234 (0.6%) | 54 (0.5%) |
| Total | 37,065 (100.0%) | 10,834 (100.0%) |
Household Vehicle Usage in Kaufman County
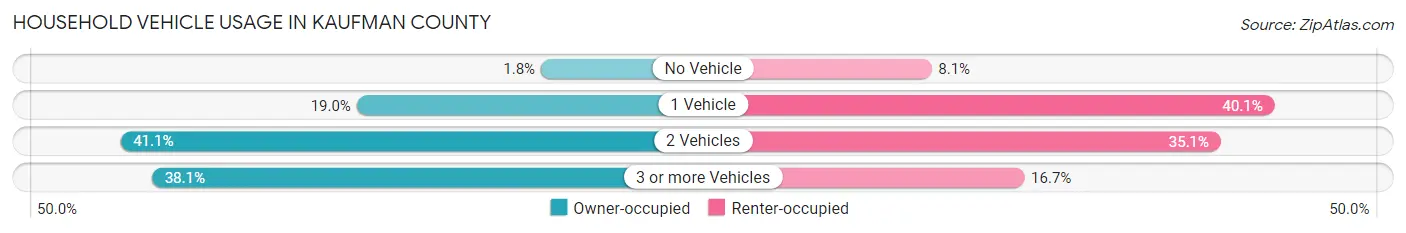
| Vehicles per Household | Owner-occupied | Renter-occupied |
| No Vehicle | 668 (1.8%) | 874 (8.1%) |
| 1 Vehicle | 7,041 (19.0%) | 4,346 (40.1%) |
| 2 Vehicles | 15,223 (41.1%) | 3,802 (35.1%) |
| 3 or more Vehicles | 14,133 (38.1%) | 1,812 (16.7%) |
| Total | 37,065 (100.0%) | 10,834 (100.0%) |
Real Estate & Mortgages in Kaufman County
Real Estate and Mortgage Overview in Kaufman County
| Characteristic | Without Mortgage | With Mortgage |
| Housing Units | 13,825 | 23,240 |
| Median Property Value | $207,600 | $278,600 |
| Median Household Income | $69,005 | $7,115 |
| Monthly Housing Costs | $681 | $2,364 |
| Real Estate Taxes | $2,706 | $753 |
Property Value by Mortgage Status in Kaufman County
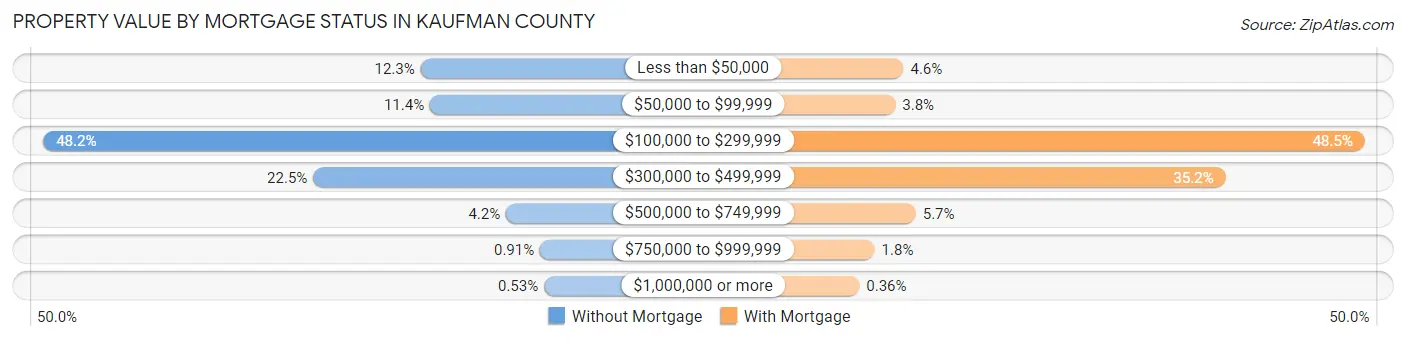
| Property Value | Without Mortgage | With Mortgage |
| Less than $50,000 | 1,699 (12.3%) | 1,062 (4.6%) |
| $50,000 to $99,999 | 1,574 (11.4%) | 881 (3.8%) |
| $100,000 to $299,999 | 6,666 (48.2%) | 11,269 (48.5%) |
| $300,000 to $499,999 | 3,113 (22.5%) | 8,189 (35.2%) |
| $500,000 to $749,999 | 574 (4.2%) | 1,334 (5.7%) |
| $750,000 to $999,999 | 126 (0.9%) | 422 (1.8%) |
| $1,000,000 or more | 73 (0.5%) | 83 (0.4%) |
| Total | 13,825 (100.0%) | 23,240 (100.0%) |
Household Income by Mortgage Status in Kaufman County
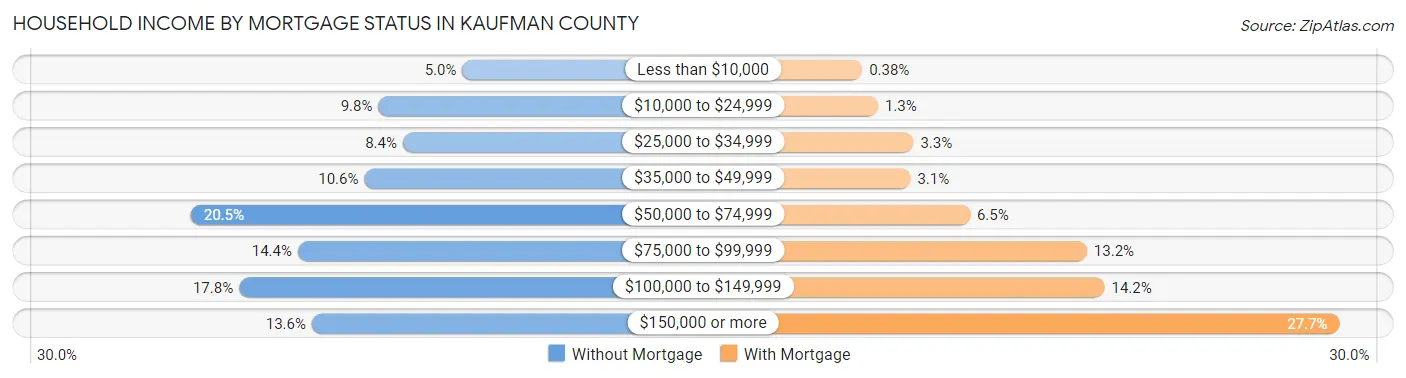
| Household Income | Without Mortgage | With Mortgage |
| Less than $10,000 | 690 (5.0%) | 88 (0.4%) |
| $10,000 to $24,999 | 1,354 (9.8%) | 298 (1.3%) |
| $25,000 to $34,999 | 1,160 (8.4%) | 770 (3.3%) |
| $35,000 to $49,999 | 1,464 (10.6%) | 730 (3.1%) |
| $50,000 to $74,999 | 2,834 (20.5%) | 1,521 (6.5%) |
| $75,000 to $99,999 | 1,990 (14.4%) | 3,072 (13.2%) |
| $100,000 to $149,999 | 2,454 (17.7%) | 3,308 (14.2%) |
| $150,000 or more | 1,879 (13.6%) | 6,426 (27.7%) |
| Total | 13,825 (100.0%) | 23,240 (100.0%) |
Property Value to Household Income Ratio in Kaufman County
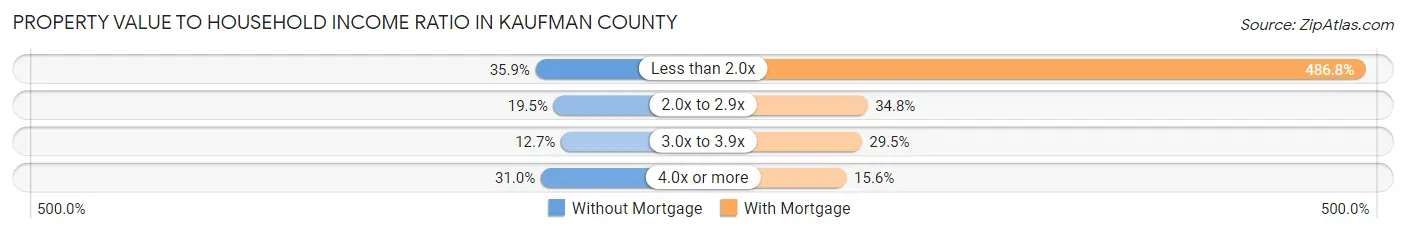
| Value-to-Income Ratio | Without Mortgage | With Mortgage |
| Less than 2.0x | 4,960 (35.9%) | 113,136 (486.8%) |
| 2.0x to 2.9x | 2,691 (19.5%) | 8,078 (34.8%) |
| 3.0x to 3.9x | 1,760 (12.7%) | 6,849 (29.5%) |
| 4.0x or more | 4,289 (31.0%) | 3,630 (15.6%) |
| Total | 13,825 (100.0%) | 23,240 (100.0%) |
Real Estate Taxes by Mortgage Status in Kaufman County
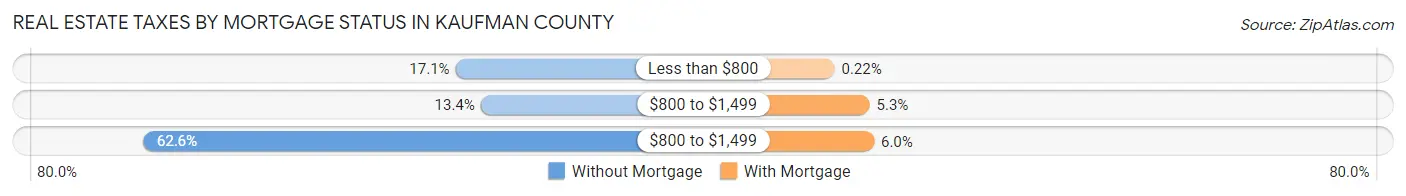
| Property Taxes | Without Mortgage | With Mortgage |
| Less than $800 | 2,357 (17.1%) | 52 (0.2%) |
| $800 to $1,499 | 1,848 (13.4%) | 1,242 (5.3%) |
| $800 to $1,499 | 8,650 (62.6%) | 1,392 (6.0%) |
| Total | 13,825 (100.0%) | 23,240 (100.0%) |
Health & Disability in Kaufman County
Health Insurance Coverage by Age in Kaufman County
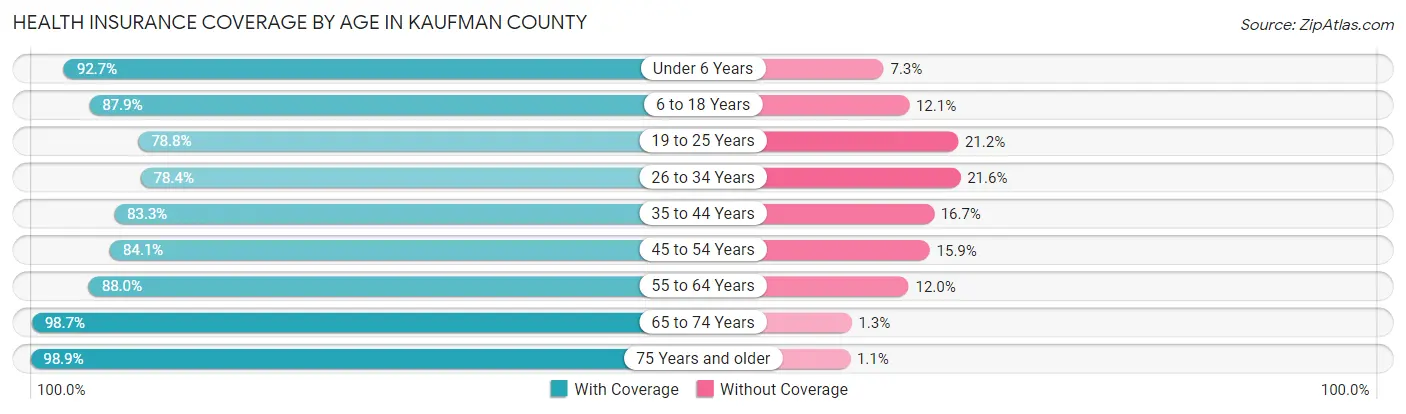
| Age Bracket | With Coverage | Without Coverage |
| Under 6 Years | 12,269 (92.7%) | 969 (7.3%) |
| 6 to 18 Years | 27,324 (87.9%) | 3,746 (12.1%) |
| 19 to 25 Years | 9,729 (78.8%) | 2,617 (21.2%) |
| 26 to 34 Years | 14,689 (78.4%) | 4,051 (21.6%) |
| 35 to 44 Years | 18,338 (83.3%) | 3,669 (16.7%) |
| 45 to 54 Years | 15,510 (84.1%) | 2,935 (15.9%) |
| 55 to 64 Years | 14,480 (88.0%) | 1,970 (12.0%) |
| 65 to 74 Years | 10,421 (98.7%) | 140 (1.3%) |
| 75 Years and older | 5,719 (98.9%) | 61 (1.1%) |
| Total | 128,479 (86.4%) | 20,158 (13.6%) |
Health Insurance Coverage by Citizenship Status in Kaufman County
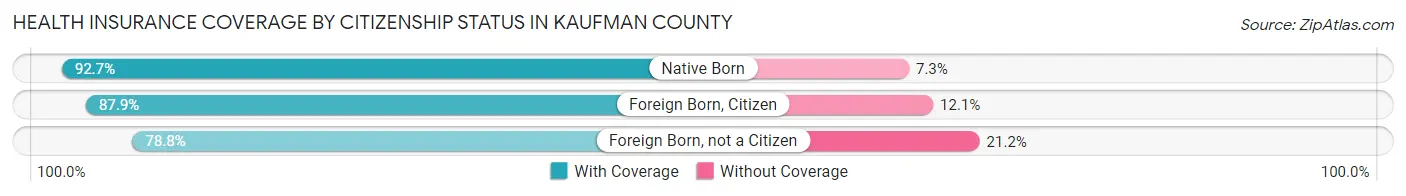
| Citizenship Status | With Coverage | Without Coverage |
| Native Born | 12,269 (92.7%) | 969 (7.3%) |
| Foreign Born, Citizen | 27,324 (87.9%) | 3,746 (12.1%) |
| Foreign Born, not a Citizen | 9,729 (78.8%) | 2,617 (21.2%) |
Health Insurance Coverage by Household Income in Kaufman County
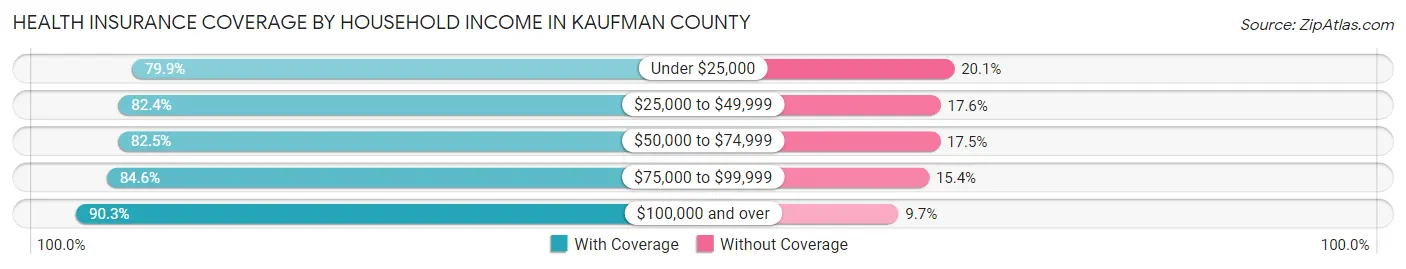
| Household Income | With Coverage | Without Coverage |
| Under $25,000 | 9,791 (79.9%) | 2,466 (20.1%) |
| $25,000 to $49,999 | 16,102 (82.4%) | 3,435 (17.6%) |
| $50,000 to $74,999 | 19,057 (82.5%) | 4,039 (17.5%) |
| $75,000 to $99,999 | 16,472 (84.6%) | 2,997 (15.4%) |
| $100,000 and over | 66,694 (90.3%) | 7,143 (9.7%) |
Public vs Private Health Insurance Coverage by Age in Kaufman County
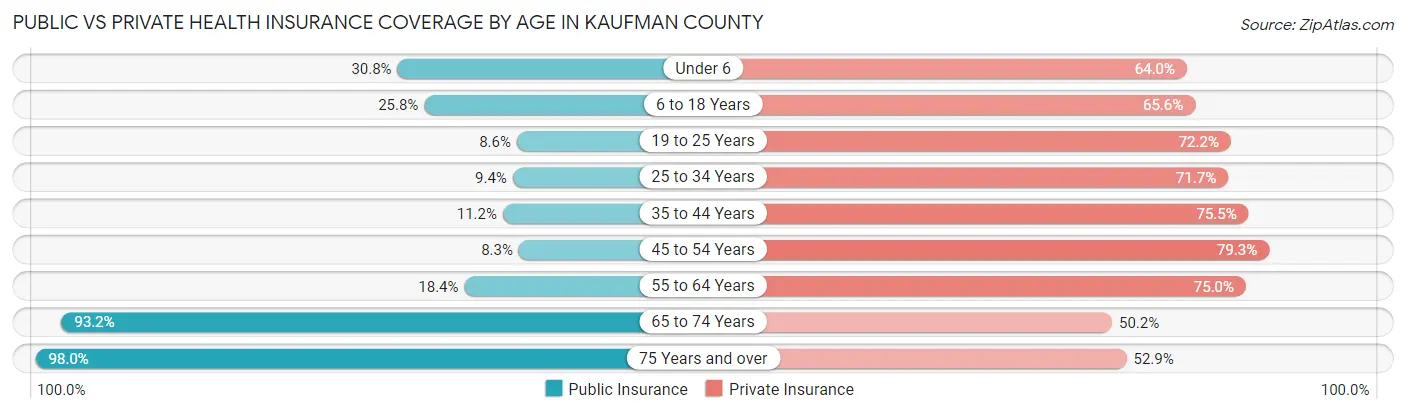
| Age Bracket | Public Insurance | Private Insurance |
| Under 6 | 4,076 (30.8%) | 8,477 (64.0%) |
| 6 to 18 Years | 8,025 (25.8%) | 20,373 (65.6%) |
| 19 to 25 Years | 1,067 (8.6%) | 8,913 (72.2%) |
| 25 to 34 Years | 1,761 (9.4%) | 13,435 (71.7%) |
| 35 to 44 Years | 2,474 (11.2%) | 16,614 (75.5%) |
| 45 to 54 Years | 1,526 (8.3%) | 14,625 (79.3%) |
| 55 to 64 Years | 3,024 (18.4%) | 12,336 (75.0%) |
| 65 to 74 Years | 9,840 (93.2%) | 5,297 (50.2%) |
| 75 Years and over | 5,663 (98.0%) | 3,055 (52.8%) |
| Total | 37,456 (25.2%) | 103,125 (69.4%) |
Disability Status by Sex by Age in Kaufman County
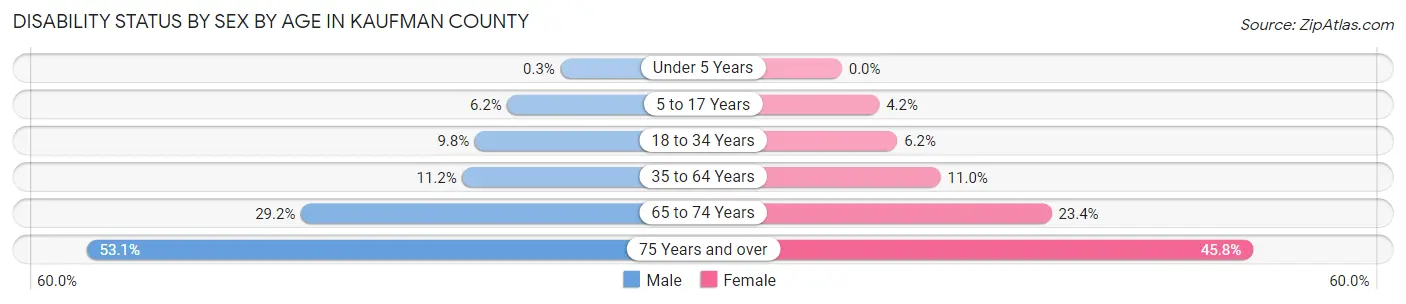
| Age Bracket | Male | Female |
| Under 5 Years | 17 (0.3%) | 0 (0.0%) |
| 5 to 17 Years | 990 (6.2%) | 643 (4.2%) |
| 18 to 34 Years | 1,614 (9.8%) | 1,044 (6.2%) |
| 35 to 64 Years | 3,171 (11.2%) | 3,153 (11.0%) |
| 65 to 74 Years | 1,476 (29.2%) | 1,285 (23.4%) |
| 75 Years and over | 1,290 (53.1%) | 1,534 (45.8%) |
Disability Class by Sex by Age in Kaufman County
Disability Class: Hearing Difficulty
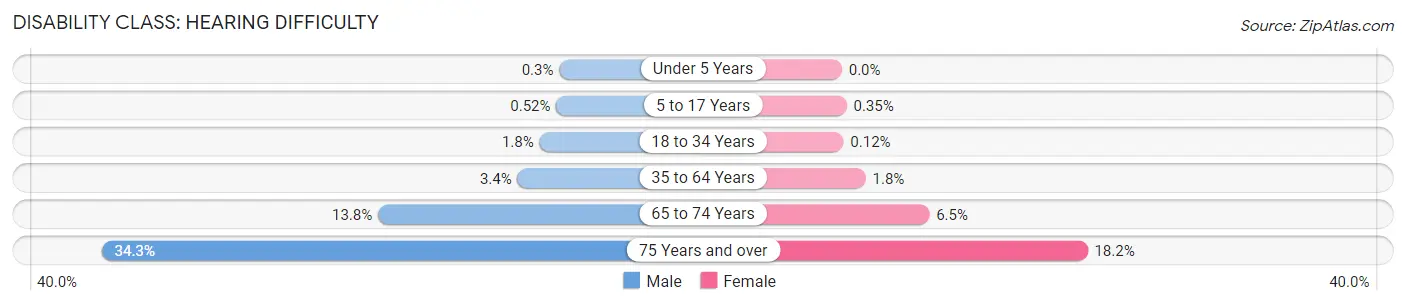
| Age Bracket | Male | Female |
| Under 5 Years | 17 (0.3%) | 0 (0.0%) |
| 5 to 17 Years | 83 (0.5%) | 54 (0.4%) |
| 18 to 34 Years | 290 (1.8%) | 20 (0.1%) |
| 35 to 64 Years | 960 (3.4%) | 506 (1.8%) |
| 65 to 74 Years | 696 (13.8%) | 357 (6.5%) |
| 75 Years and over | 833 (34.3%) | 611 (18.2%) |
Disability Class: Vision Difficulty
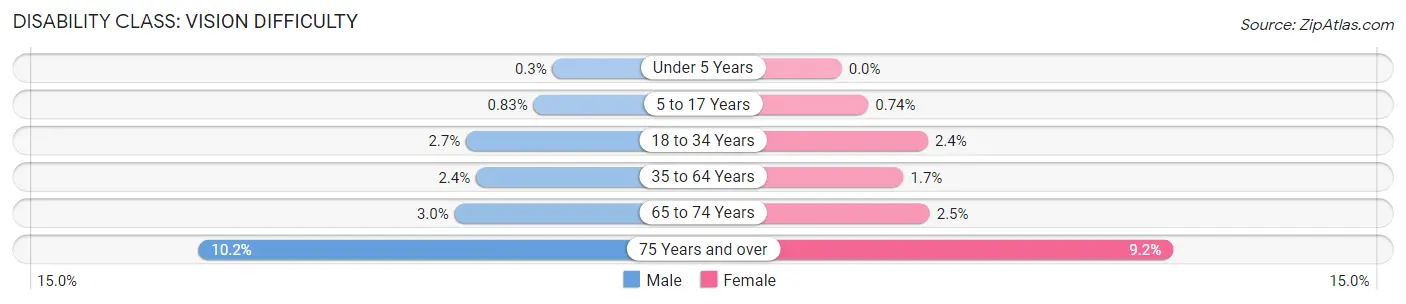
| Age Bracket | Male | Female |
| Under 5 Years | 17 (0.3%) | 0 (0.0%) |
| 5 to 17 Years | 133 (0.8%) | 114 (0.7%) |
| 18 to 34 Years | 444 (2.7%) | 405 (2.4%) |
| 35 to 64 Years | 687 (2.4%) | 492 (1.7%) |
| 65 to 74 Years | 153 (3.0%) | 135 (2.5%) |
| 75 Years and over | 247 (10.2%) | 309 (9.2%) |
Disability Class: Cognitive Difficulty
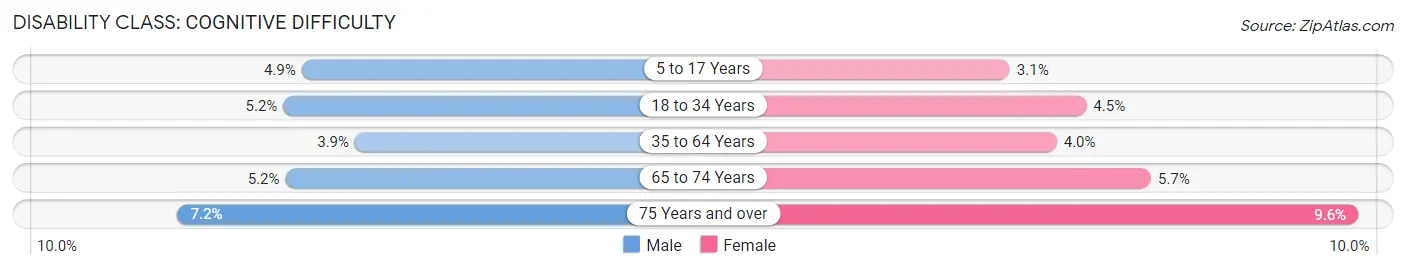
| Age Bracket | Male | Female |
| 5 to 17 Years | 777 (4.9%) | 481 (3.1%) |
| 18 to 34 Years | 854 (5.2%) | 768 (4.5%) |
| 35 to 64 Years | 1,094 (3.9%) | 1,143 (4.0%) |
| 65 to 74 Years | 261 (5.2%) | 316 (5.7%) |
| 75 Years and over | 174 (7.2%) | 321 (9.6%) |
Disability Class: Ambulatory Difficulty
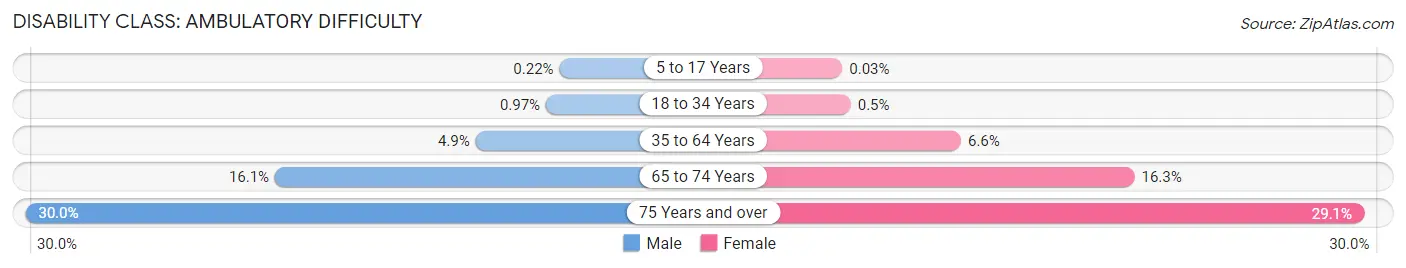
| Age Bracket | Male | Female |
| 5 to 17 Years | 35 (0.2%) | 4 (0.0%) |
| 18 to 34 Years | 160 (1.0%) | 84 (0.5%) |
| 35 to 64 Years | 1,383 (4.9%) | 1,902 (6.6%) |
| 65 to 74 Years | 812 (16.1%) | 897 (16.3%) |
| 75 Years and over | 728 (30.0%) | 974 (29.1%) |
Disability Class: Self-Care Difficulty
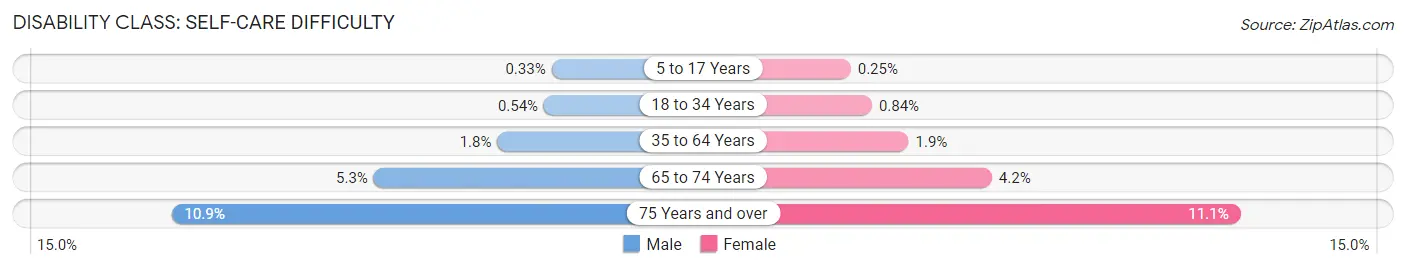
| Age Bracket | Male | Female |
| 5 to 17 Years | 52 (0.3%) | 39 (0.3%) |
| 18 to 34 Years | 88 (0.5%) | 142 (0.8%) |
| 35 to 64 Years | 520 (1.8%) | 532 (1.9%) |
| 65 to 74 Years | 267 (5.3%) | 230 (4.2%) |
| 75 Years and over | 265 (10.9%) | 372 (11.1%) |
Technology Access in Kaufman County
Computing Device Access in Kaufman County
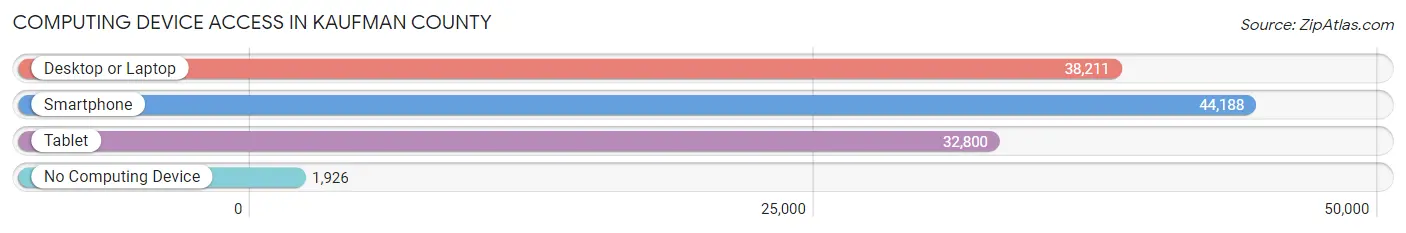
| Device Type | # Households | % Households |
| Desktop or Laptop | 38,211 | 79.8% |
| Smartphone | 44,188 | 92.2% |
| Tablet | 32,800 | 68.5% |
| No Computing Device | 1,926 | 4.0% |
| Total | 47,899 | 100.0% |
Internet Access in Kaufman County
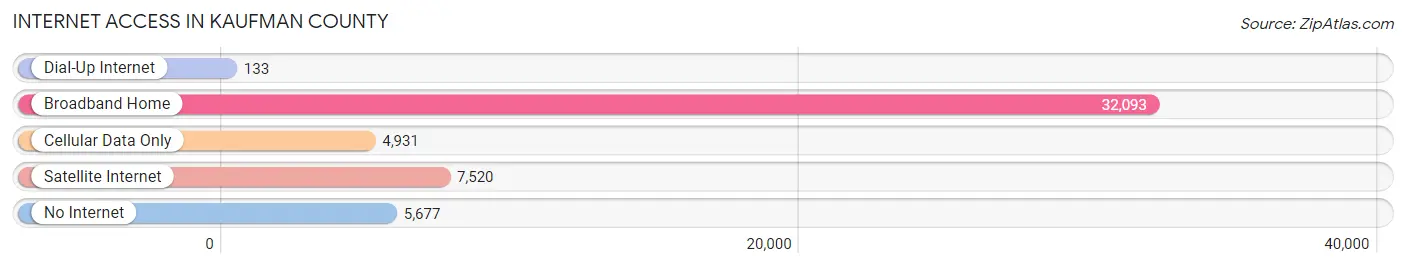
| Internet Type | # Households | % Households |
| Dial-Up Internet | 133 | 0.3% |
| Broadband Home | 32,093 | 67.0% |
| Cellular Data Only | 4,931 | 10.3% |
| Satellite Internet | 7,520 | 15.7% |
| No Internet | 5,677 | 11.8% |
| Total | 47,899 | 100.0% |
Kaufman County Summary
Kaufman County is located in the northeastern part of Texas, and is part of the Dallas-Fort Worth-Arlington metropolitan area. The county is bordered by Van Zandt County to the north, Henderson County to the east, Anderson County to the south, and Dallas and Rockwall counties to the west. Kaufman County covers an area of 837 square miles and has a population of approximately 103,350 people, as of the 2020 census.
History
Kaufman County was established in 1848 and named after David S. Kaufman, a Texas politician and signer of the Texas Declaration of Independence. The county was originally part of the Peters Colony, a land grant given to settlers by the Republic of Texas in 1841. The county was initially populated by settlers from the United States, but by the late 19th century, the population had become more diverse, with immigrants from Germany, Ireland, and other countries.
The county was largely rural until the 1950s, when the population began to grow rapidly due to the expansion of the Dallas-Fort Worth metropolitan area. The county's population doubled between 1950 and 1960, and continued to grow steadily throughout the 20th century.
Geography
Kaufman County is located in the northeastern part of Texas, and is part of the Dallas-Fort Worth-Arlington metropolitan area. The county is bordered by Van Zandt County to the north, Henderson County to the east, Anderson County to the south, and Dallas and Rockwall counties to the west. Kaufman County covers an area of 837 square miles and has a population of approximately 103,350 people, as of the 2020 census.
The county is mostly flat, with some rolling hills in the western part of the county. The terrain is mostly covered in grasslands, with some wooded areas in the eastern part of the county. The county is drained by the Trinity River, which flows through the western part of the county.
Economy
Kaufman County has a diverse economy, with a mix of manufacturing, retail, and service industries. The county is home to several large manufacturing companies, including a steel mill, a paper mill, and a plastics plant. The county is also home to several retail stores, including a Walmart Supercenter, a Home Depot, and a Lowe's.
The county is also home to several service industries, including healthcare, education, and finance. The county is home to several hospitals, including Kaufman Regional Medical Center and Kaufman County Medical Center. The county is also home to several colleges and universities, including Texas A&M University-Commerce and Navarro College.
Demographics
Kaufman County is home to a diverse population, with a mix of races and ethnicities. The county's population is approximately 73.3% White, 15.2% Hispanic or Latino, 8.2% African American, and 3.3% Asian, as of the 2020 census. The county's median household income is $60,945, and the median home value is $179,400. The county's poverty rate is 11.3%, and the unemployment rate is 4.2%.
Common Questions
What is Per Capita Income in Kaufman County?
Per Capita income in Kaufman County is $33,250.
What is the Median Family Income in Kaufman County?
Median Family Income in Kaufman County is $95,129.
What is the Median Household income in Kaufman County?
Median Household Income in Kaufman County is $84,075.
What is Income or Wage Gap in Kaufman County?
Income or Wage Gap in Kaufman County is 30.1%.
Women in Kaufman County earn 69.9 cents for every dollar earned by a man.
What is Family Income Deficit in Kaufman County?
Family Income Deficit in Kaufman County is $12,584.
Families that are below poverty line in Kaufman County earn $12,584 less on average than the poverty threshold level.
What is Inequality or Gini Index in Kaufman County?
Inequality or Gini Index in Kaufman County is 0.39.
What is the Total Population of Kaufman County?
Total Population of Kaufman County is 149,773.
What is the Total Male Population of Kaufman County?
Total Male Population of Kaufman County is 74,364.
What is the Total Female Population of Kaufman County?
Total Female Population of Kaufman County is 75,409.
What is the Ratio of Males per 100 Females in Kaufman County?
There are 98.61 Males per 100 Females in Kaufman County.
What is the Ratio of Females per 100 Males in Kaufman County?
There are 101.41 Females per 100 Males in Kaufman County.
What is the Median Population Age in Kaufman County?
Median Population Age in Kaufman County is 34.6 Years.
What is the Average Family Size in Kaufman County
Average Family Size in Kaufman County is 3.5 People.
What is the Average Household Size in Kaufman County
Average Household Size in Kaufman County is 3.1 People.
How Large is the Labor Force in Kaufman County?
There are 77,050 People in the Labor Forcein in Kaufman County.
What is the Percentage of People in the Labor Force in Kaufman County?
68.5% of People are in the Labor Force in Kaufman County.
What is the Unemployment Rate in Kaufman County?
Unemployment Rate in Kaufman County is 4.9%.