Jones County, TX Map & Demographics
Jones County Map
Jones County Overview
$21,173
PER CAPITA INCOME
$66,532
AVG FAMILY INCOME
$59,361
AVG HOUSEHOLD INCOME
27.2%
WAGE / INCOME GAP [ % ]
72.8¢/ $1
WAGE / INCOME GAP [ $ ]
$9,413
FAMILY INCOME DEFICIT
0.41
INEQUALITY / GINI INDEX
19,758
TOTAL POPULATION
12,581
MALE POPULATION
7,177
FEMALE POPULATION
175.30
MALES / 100 FEMALES
57.05
FEMALES / 100 MALES
38.4
MEDIAN AGE
2.7
AVG FAMILY SIZE
2.3
AVG HOUSEHOLD SIZE
6,689
LABOR FORCE [ PEOPLE ]
39.5%
PERCENT IN LABOR FORCE
4.7%
UNEMPLOYMENT RATE
Jones County Area Codes
Income in Jones County
Income Overview in Jones County
Per Capita Income in Jones County is $21,173, while median incomes of families and households are $66,532 and $59,361 respectively.
| Characteristic | Number | Measure |
| Per Capita Income | 19,758 | $21,173 |
| Median Family Income | 4,078 | $66,532 |
| Mean Family Income | 4,078 | $80,500 |
| Median Household Income | 5,917 | $59,361 |
| Mean Household Income | 5,917 | $70,243 |
| Income Deficit | 4,078 | $9,413 |
| Wage / Income Gap (%) | 19,758 | 27.15% |
| Wage / Income Gap ($) | 19,758 | 72.85¢ per $1 |
| Gini / Inequality Index | 19,758 | 0.41 |
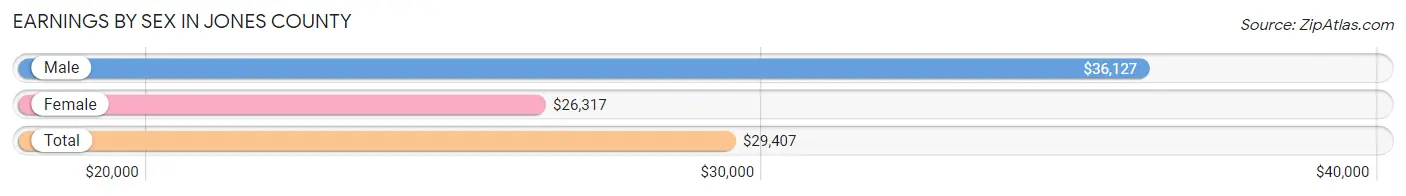
Earnings by Sex in Jones County
Average Earnings in Jones County are $29,407, $36,127 for men and $26,317 for women, a difference of 27.2%.
| Sex | Number | Average Earnings |
| Male | 4,302 (55.7%) | $36,127 |
| Female | 3,416 (44.3%) | $26,317 |
| Total | 7,718 (100.0%) | $29,407 |
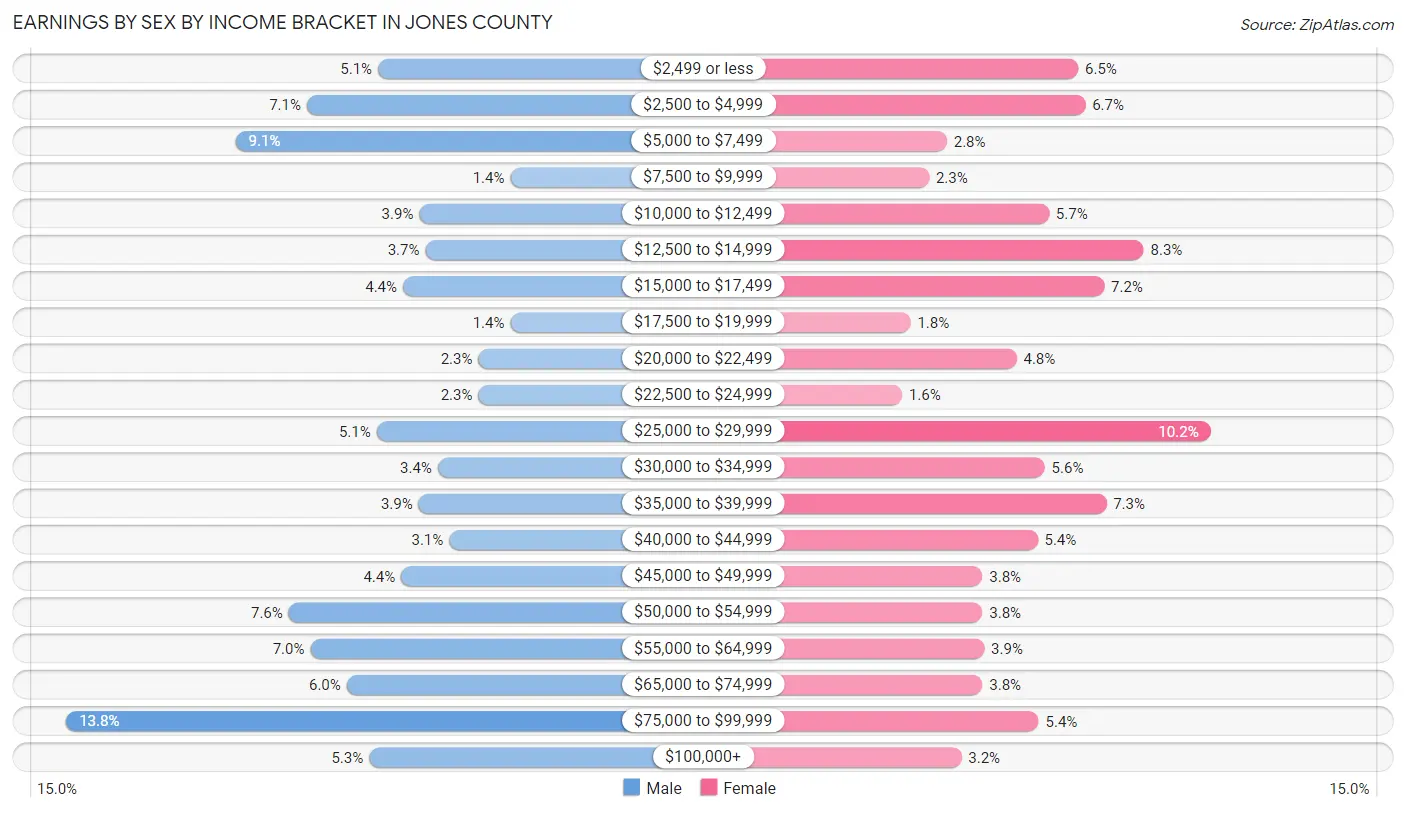
Earnings by Sex by Income Bracket in Jones County
The most common earnings brackets in Jones County are $75,000 to $99,999 for men (595 | 13.8%) and $25,000 to $29,999 for women (349 | 10.2%).
| Income | Male | Female |
| $2,499 or less | 218 (5.1%) | 222 (6.5%) |
| $2,500 to $4,999 | 304 (7.1%) | 229 (6.7%) |
| $5,000 to $7,499 | 390 (9.1%) | 96 (2.8%) |
| $7,500 to $9,999 | 58 (1.3%) | 79 (2.3%) |
| $10,000 to $12,499 | 168 (3.9%) | 194 (5.7%) |
| $12,500 to $14,999 | 161 (3.7%) | 285 (8.3%) |
| $15,000 to $17,499 | 188 (4.4%) | 247 (7.2%) |
| $17,500 to $19,999 | 58 (1.3%) | 61 (1.8%) |
| $20,000 to $22,499 | 97 (2.2%) | 163 (4.8%) |
| $22,500 to $24,999 | 97 (2.2%) | 53 (1.5%) |
| $25,000 to $29,999 | 220 (5.1%) | 349 (10.2%) |
| $30,000 to $34,999 | 146 (3.4%) | 190 (5.6%) |
| $35,000 to $39,999 | 169 (3.9%) | 249 (7.3%) |
| $40,000 to $44,999 | 132 (3.1%) | 183 (5.4%) |
| $45,000 to $49,999 | 190 (4.4%) | 130 (3.8%) |
| $50,000 to $54,999 | 326 (7.6%) | 130 (3.8%) |
| $55,000 to $64,999 | 300 (7.0%) | 132 (3.9%) |
| $65,000 to $74,999 | 256 (5.9%) | 130 (3.8%) |
| $75,000 to $99,999 | 595 (13.8%) | 184 (5.4%) |
| $100,000+ | 229 (5.3%) | 110 (3.2%) |
| Total | 4,302 (100.0%) | 3,416 (100.0%) |
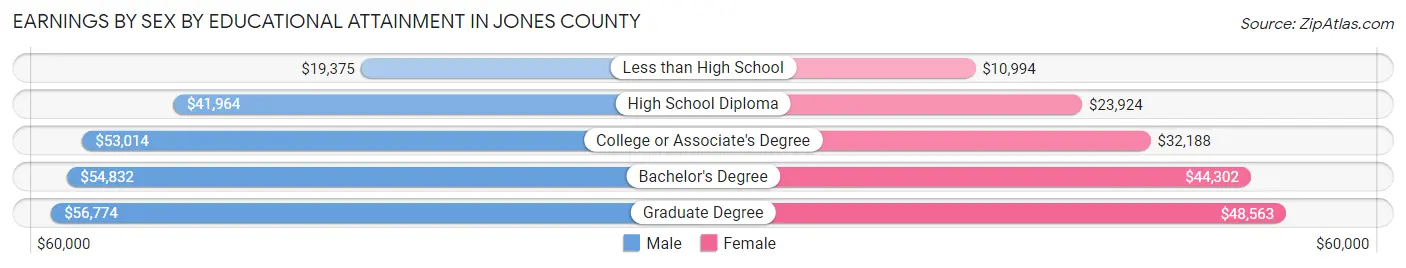
Earnings by Sex by Educational Attainment in Jones County
Average earnings in Jones County are $46,148 for men and $28,695 for women, a difference of 37.8%. Men with an educational attainment of graduate degree enjoy the highest average annual earnings of $56,774, while those with less than high school education earn the least with $19,375. Women with an educational attainment of graduate degree earn the most with the average annual earnings of $48,563, while those with less than high school education have the smallest earnings of $10,994.
| Educational Attainment | Male Income | Female Income |
| Less than High School | $19,375 | $10,994 |
| High School Diploma | $41,964 | $23,924 |
| College or Associate's Degree | $53,014 | $32,188 |
| Bachelor's Degree | $54,832 | $44,302 |
| Graduate Degree | $56,774 | $48,563 |
| Total | $46,148 | $28,695 |
Family Income in Jones County
Family Income Brackets in Jones County
According to the Jones County family income data, there are 1,048 families falling into the $50,000 to $74,999 income range, which is the most common income bracket and makes up 25.7% of all families. Conversely, the $200,000+ income bracket is the least frequent group with only 110 families (2.7%) belonging to this category.
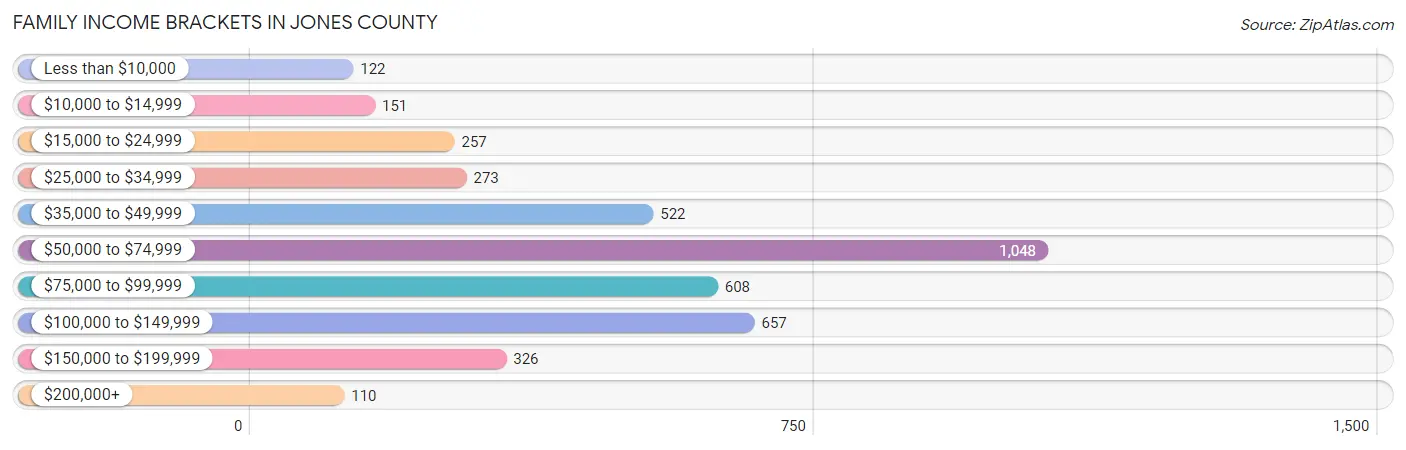
| Income Bracket | # Families | % Families |
| Less than $10,000 | 122 | 3.0% |
| $10,000 to $14,999 | 151 | 3.7% |
| $15,000 to $24,999 | 257 | 6.3% |
| $25,000 to $34,999 | 273 | 6.7% |
| $35,000 to $49,999 | 522 | 12.8% |
| $50,000 to $74,999 | 1,048 | 25.7% |
| $75,000 to $99,999 | 608 | 14.9% |
| $100,000 to $149,999 | 657 | 16.1% |
| $150,000 to $199,999 | 326 | 8.0% |
| $200,000+ | 110 | 2.7% |
Family Income by Famaliy Size in Jones County
4-person families (801 | 19.6%) account for the highest median family income in Jones County with $80,114 per family, while 2-person families (2,056 | 50.4%) have the highest median income of $30,682 per family member.
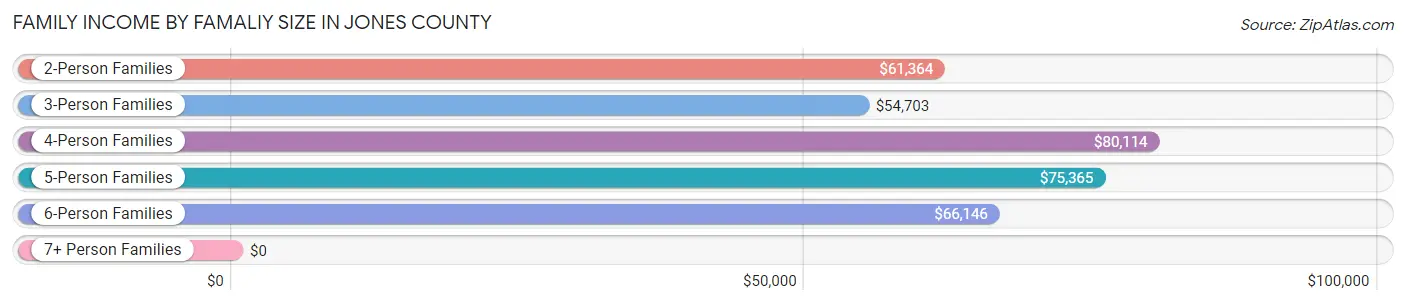
| Income Bracket | # Families | Median Income |
| 2-Person Families | 2,056 (50.4%) | $61,364 |
| 3-Person Families | 799 (19.6%) | $54,703 |
| 4-Person Families | 801 (19.6%) | $80,114 |
| 5-Person Families | 239 (5.9%) | $75,365 |
| 6-Person Families | 110 (2.7%) | $66,146 |
| 7+ Person Families | 73 (1.8%) | $0 |
| Total | 4,078 (100.0%) | $66,532 |
Family Income by Number of Earners in Jones County
The median family income in Jones County is $66,532, with families comprising 3+ earners (451) having the highest median family income of $97,083, while families with no earners (674) have the lowest median family income of $50,301, accounting for 11.1% and 16.5% of families, respectively.
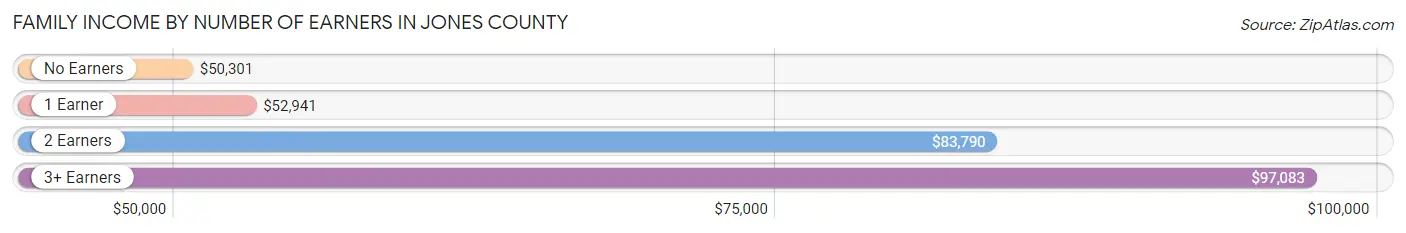
| Number of Earners | # Families | Median Income |
| No Earners | 674 (16.5%) | $50,301 |
| 1 Earner | 1,216 (29.8%) | $52,941 |
| 2 Earners | 1,737 (42.6%) | $83,790 |
| 3+ Earners | 451 (11.1%) | $97,083 |
| Total | 4,078 (100.0%) | $66,532 |
Household Income in Jones County
Household Income Brackets in Jones County
With 1,509 households falling in the category, the $50,000 to $74,999 income range is the most frequent in Jones County, accounting for 25.5% of all households. In contrast, only 112 households (1.9%) fall into the $200,000+ income bracket, making it the least populous group.
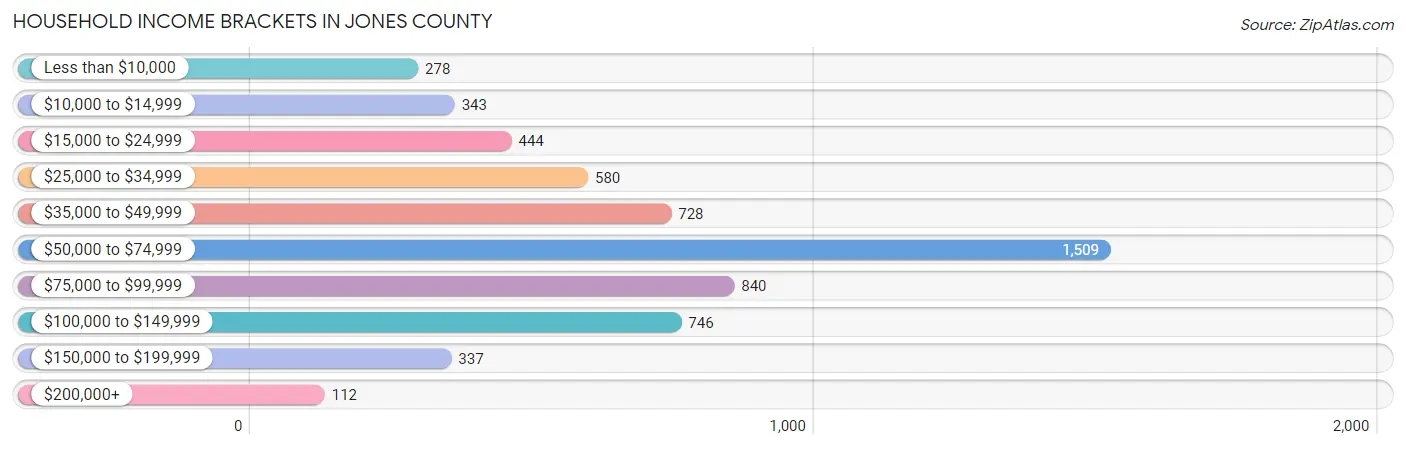
| Income Bracket | # Households | % Households |
| Less than $10,000 | 278 | 4.7% |
| $10,000 to $14,999 | 343 | 5.8% |
| $15,000 to $24,999 | 444 | 7.5% |
| $25,000 to $34,999 | 580 | 9.8% |
| $35,000 to $49,999 | 728 | 12.3% |
| $50,000 to $74,999 | 1,509 | 25.5% |
| $75,000 to $99,999 | 840 | 14.2% |
| $100,000 to $149,999 | 746 | 12.6% |
| $150,000 to $199,999 | 337 | 5.7% |
| $200,000+ | 112 | 1.9% |
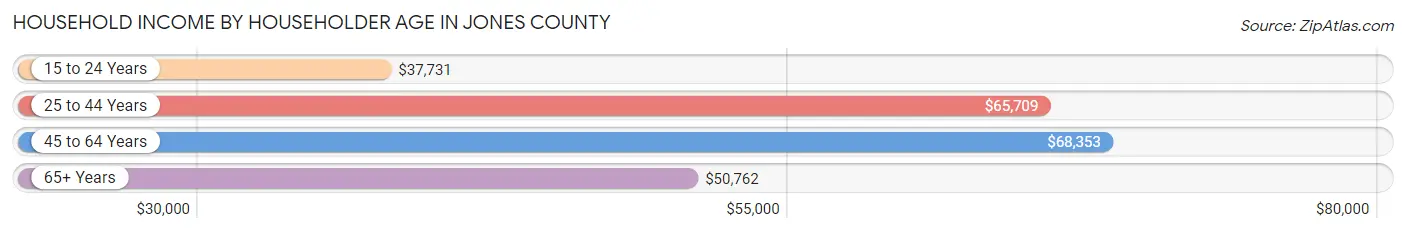
Household Income by Householder Age in Jones County
The median household income in Jones County is $59,361, with the highest median household income of $68,353 found in the 45 to 64 years age bracket for the primary householder. A total of 2,019 households (34.1%) fall into this category. Meanwhile, the 15 to 24 years age bracket for the primary householder has the lowest median household income of $37,731, with 449 households (7.6%) in this group.
| Income Bracket | # Households | Median Income |
| 15 to 24 Years | 449 (7.6%) | $37,731 |
| 25 to 44 Years | 1,567 (26.5%) | $65,709 |
| 45 to 64 Years | 2,019 (34.1%) | $68,353 |
| 65+ Years | 1,882 (31.8%) | $50,762 |
| Total | 5,917 (100.0%) | $59,361 |
Poverty in Jones County
Income Below Poverty by Sex and Age in Jones County
With 13.4% poverty level for males and 14.9% for females among the residents of Jones County, 5 year old males and 25 to 34 year old females are the most vulnerable to poverty, with 34 males (52.3%) and 257 females (30.3%) in their respective age groups living below the poverty level.
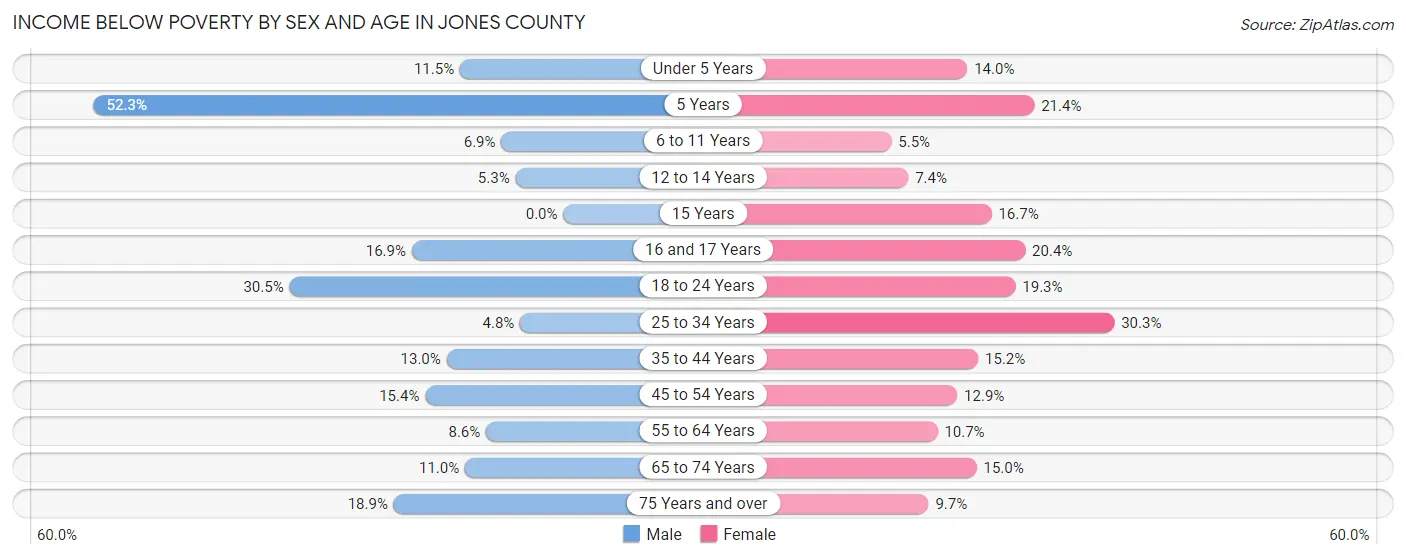
| Age Bracket | Male | Female |
| Under 5 Years | 35 (11.5%) | 64 (14.0%) |
| 5 Years | 34 (52.3%) | 6 (21.4%) |
| 6 to 11 Years | 41 (6.9%) | 29 (5.5%) |
| 12 to 14 Years | 13 (5.3%) | 25 (7.4%) |
| 15 Years | 0 (0.0%) | 12 (16.7%) |
| 16 and 17 Years | 27 (16.9%) | 49 (20.4%) |
| 18 to 24 Years | 219 (30.5%) | 92 (19.3%) |
| 25 to 34 Years | 31 (4.8%) | 257 (30.3%) |
| 35 to 44 Years | 78 (13.0%) | 116 (15.2%) |
| 45 to 54 Years | 123 (15.4%) | 106 (12.9%) |
| 55 to 64 Years | 66 (8.6%) | 108 (10.6%) |
| 65 to 74 Years | 101 (11.0%) | 128 (15.0%) |
| 75 Years and over | 106 (18.9%) | 58 (9.7%) |
| Total | 874 (13.4%) | 1,050 (14.9%) |
Income Above Poverty by Sex and Age in Jones County
According to the poverty statistics in Jones County, males aged 15 years and females aged 6 to 11 years are the age groups that are most secure financially, with 100.0% of males and 94.5% of females in these age groups living above the poverty line.
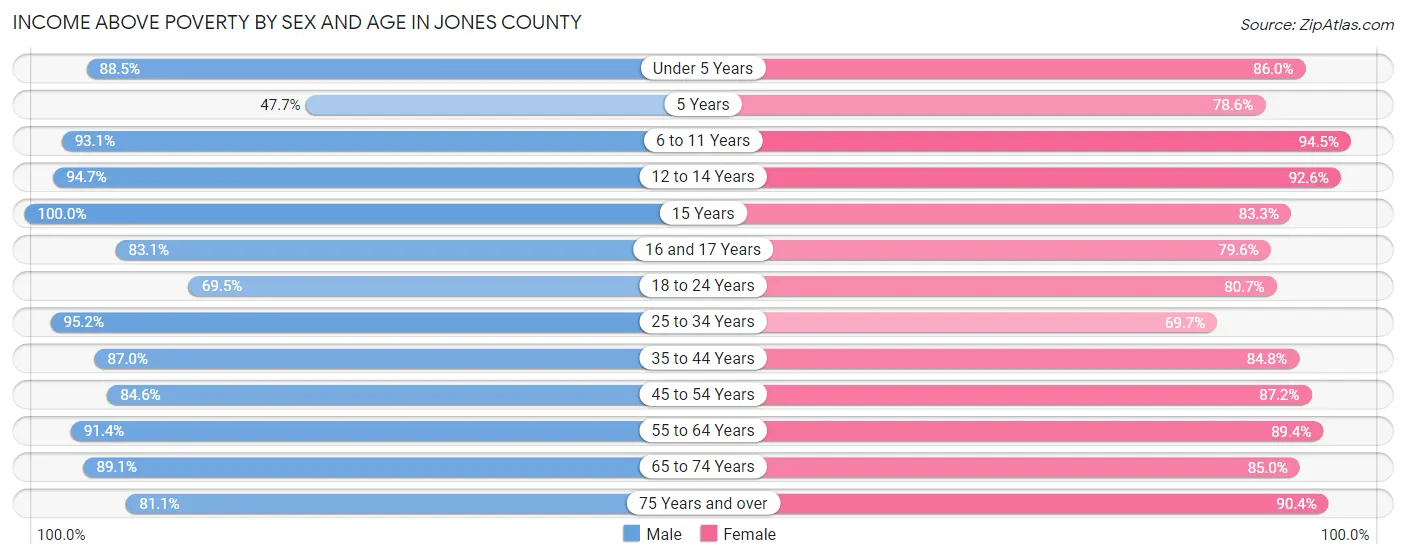
| Age Bracket | Male | Female |
| Under 5 Years | 269 (88.5%) | 394 (86.0%) |
| 5 Years | 31 (47.7%) | 22 (78.6%) |
| 6 to 11 Years | 553 (93.1%) | 496 (94.5%) |
| 12 to 14 Years | 231 (94.7%) | 313 (92.6%) |
| 15 Years | 132 (100.0%) | 60 (83.3%) |
| 16 and 17 Years | 133 (83.1%) | 191 (79.6%) |
| 18 to 24 Years | 499 (69.5%) | 384 (80.7%) |
| 25 to 34 Years | 614 (95.2%) | 590 (69.7%) |
| 35 to 44 Years | 522 (87.0%) | 648 (84.8%) |
| 45 to 54 Years | 677 (84.6%) | 719 (87.2%) |
| 55 to 64 Years | 701 (91.4%) | 906 (89.3%) |
| 65 to 74 Years | 821 (89.0%) | 725 (85.0%) |
| 75 Years and over | 455 (81.1%) | 543 (90.3%) |
| Total | 5,638 (86.6%) | 5,991 (85.1%) |
Income Below Poverty Among Married-Couple Families in Jones County
The poverty statistics for married-couple families in Jones County show that 11.7% or 385 of the total 3,306 families live below the poverty line. Families with 1 or 2 children have the highest poverty rate of 16.1%, comprising of 165 families. On the other hand, families with 5 or more children have the lowest poverty rate of 0.0%, which includes 0 families.
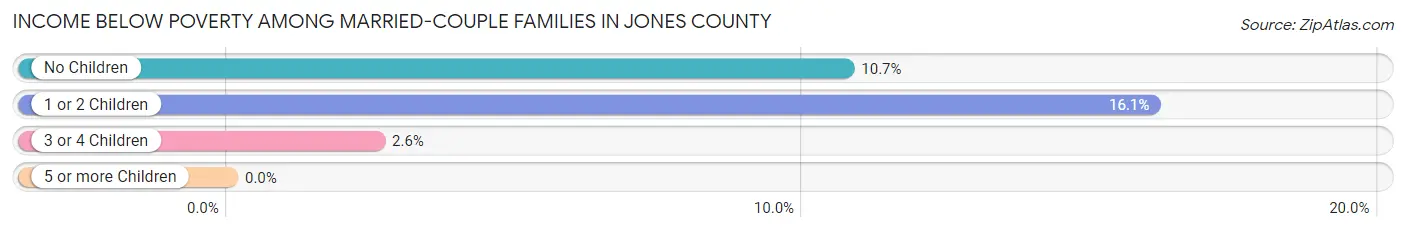
| Children | Above Poverty | Below Poverty |
| No Children | 1,773 (89.3%) | 213 (10.7%) |
| 1 or 2 Children | 862 (83.9%) | 165 (16.1%) |
| 3 or 4 Children | 266 (97.4%) | 7 (2.6%) |
| 5 or more Children | 20 (100.0%) | 0 (0.0%) |
| Total | 2,921 (88.3%) | 385 (11.7%) |
Income Below Poverty Among Single-Parent Households in Jones County
According to the poverty data in Jones County, 16.8% or 34 single-father households and 16.1% or 92 single-mother households are living below the poverty line. Among single-father households, those with 3 or 4 children have the highest poverty rate, with 4 households (100.0%) experiencing poverty. Likewise, among single-mother households, those with 5 or more children have the highest poverty rate, with 7 households (100.0%) falling below the poverty line.
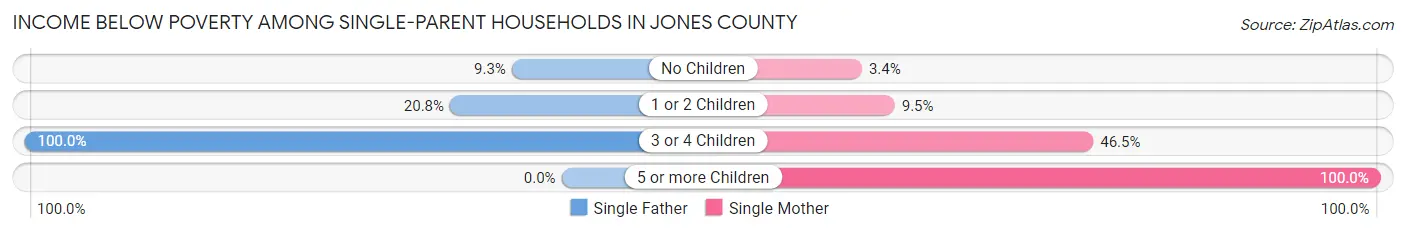
| Children | Single Father | Single Mother |
| No Children | 9 (9.3%) | 6 (3.4%) |
| 1 or 2 Children | 21 (20.8%) | 26 (9.5%) |
| 3 or 4 Children | 4 (100.0%) | 53 (46.5%) |
| 5 or more Children | 0 (0.0%) | 7 (100.0%) |
| Total | 34 (16.8%) | 92 (16.1%) |
Income Below Poverty Among Married-Couple vs Single-Parent Households in Jones County
The poverty data for Jones County shows that 385 of the married-couple family households (11.7%) and 126 of the single-parent households (16.3%) are living below the poverty level. Within the married-couple family households, those with 1 or 2 children have the highest poverty rate, with 165 households (16.1%) falling below the poverty line. Among the single-parent households, those with 5 or more children have the highest poverty rate, with 7 household (100.0%) living below poverty.
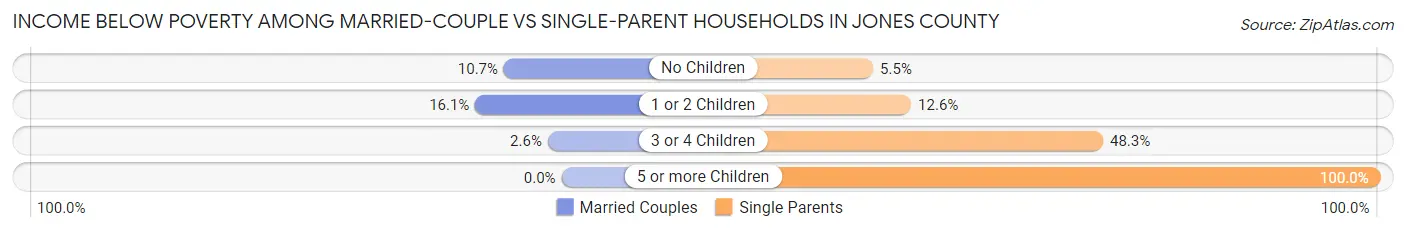
| Children | Married-Couple Families | Single-Parent Households |
| No Children | 213 (10.7%) | 15 (5.5%) |
| 1 or 2 Children | 165 (16.1%) | 47 (12.6%) |
| 3 or 4 Children | 7 (2.6%) | 57 (48.3%) |
| 5 or more Children | 0 (0.0%) | 7 (100.0%) |
| Total | 385 (11.7%) | 126 (16.3%) |
Race in Jones County
The most populous races in Jones County are White / Caucasian (13,649 | 69.1%), Hispanic or Latino (5,603 | 28.4%), and Two or more Races (2,324 | 11.8%).
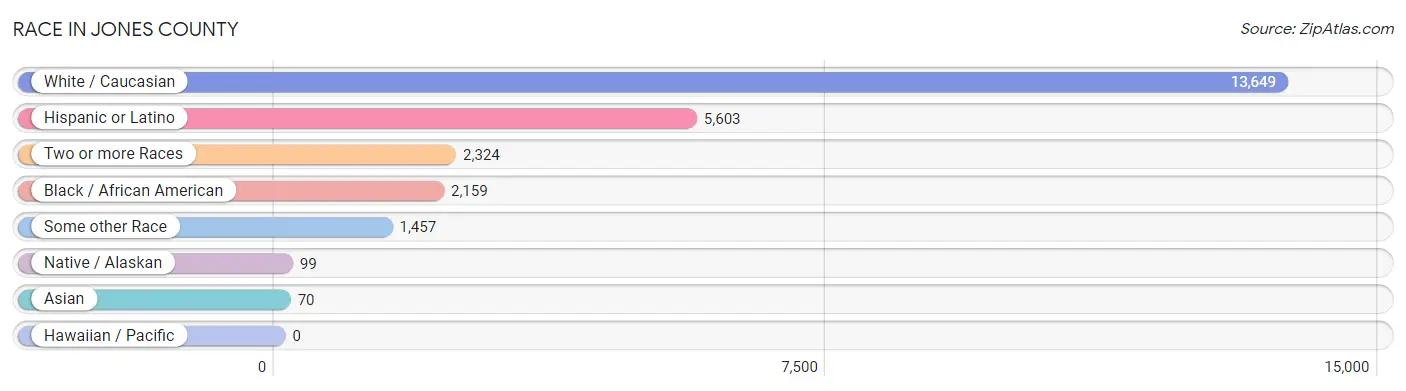
| Race | # Population | % Population |
| Asian | 70 | 0.4% |
| Black / African American | 2,159 | 10.9% |
| Hawaiian / Pacific | 0 | 0.0% |
| Hispanic or Latino | 5,603 | 28.4% |
| Native / Alaskan | 99 | 0.5% |
| White / Caucasian | 13,649 | 69.1% |
| Two or more Races | 2,324 | 11.8% |
| Some other Race | 1,457 | 7.4% |
| Total | 19,758 | 100.0% |
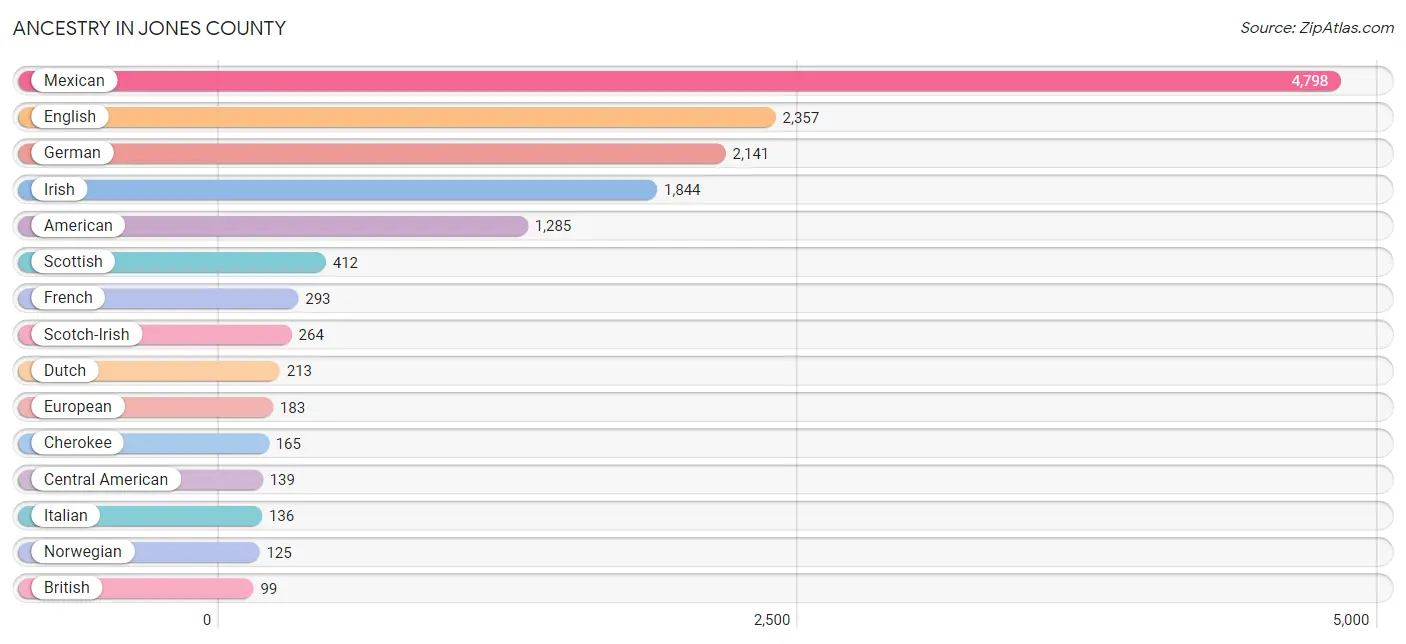
Ancestry in Jones County
The most populous ancestries reported in Jones County are Mexican (4,798 | 24.3%), English (2,357 | 11.9%), German (2,141 | 10.8%), Irish (1,844 | 9.3%), and American (1,285 | 6.5%), together accounting for 62.9% of all Jones County residents.
| Ancestry | # Population | % Population |
| African | 59 | 0.3% |
| Albanian | 17 | 0.1% |
| American | 1,285 | 6.5% |
| Apache | 21 | 0.1% |
| Arab | 35 | 0.2% |
| Argentinean | 19 | 0.1% |
| Austrian | 37 | 0.2% |
| Belgian | 14 | 0.1% |
| Bhutanese | 8 | 0.0% |
| Blackfeet | 71 | 0.4% |
| British | 99 | 0.5% |
| Burmese | 8 | 0.0% |
| Cajun | 40 | 0.2% |
| Central American | 139 | 0.7% |
| Central American Indian | 9 | 0.1% |
| Cherokee | 165 | 0.8% |
| Choctaw | 43 | 0.2% |
| Comanche | 33 | 0.2% |
| Crow | 5 | 0.0% |
| Cuban | 51 | 0.3% |
| Czech | 48 | 0.2% |
| Czechoslovakian | 19 | 0.1% |
| Danish | 23 | 0.1% |
| Delaware | 2 | 0.0% |
| Dominican | 6 | 0.0% |
| Dutch | 213 | 1.1% |
| Dutch West Indian | 37 | 0.2% |
| English | 2,357 | 11.9% |
| European | 183 | 0.9% |
| French | 293 | 1.5% |
| French Canadian | 20 | 0.1% |
| German | 2,141 | 10.8% |
| Guatemalan | 6 | 0.0% |
| Haitian | 15 | 0.1% |
| Honduran | 77 | 0.4% |
| Hungarian | 4 | 0.0% |
| Irish | 1,844 | 9.3% |
| Iroquois | 2 | 0.0% |
| Italian | 136 | 0.7% |
| Jamaican | 3 | 0.0% |
| Kiowa | 3 | 0.0% |
| Korean | 71 | 0.4% |
| Laotian | 3 | 0.0% |
| Lebanese | 8 | 0.0% |
| Lithuanian | 31 | 0.2% |
| Macedonian | 14 | 0.1% |
| Mexican | 4,798 | 24.3% |
| Mexican American Indian | 61 | 0.3% |
| Moroccan | 22 | 0.1% |
| Native Hawaiian | 48 | 0.2% |
| Nigerian | 25 | 0.1% |
| Norwegian | 125 | 0.6% |
| Pakistani | 23 | 0.1% |
| Polish | 76 | 0.4% |
| Puerto Rican | 91 | 0.5% |
| Russian | 52 | 0.3% |
| Salvadoran | 56 | 0.3% |
| Scandinavian | 30 | 0.2% |
| Scotch-Irish | 264 | 1.3% |
| Scottish | 412 | 2.1% |
| Serbian | 36 | 0.2% |
| Sioux | 16 | 0.1% |
| South American | 22 | 0.1% |
| Spaniard | 55 | 0.3% |
| Spanish | 76 | 0.4% |
| Sri Lankan | 31 | 0.2% |
| Subsaharan African | 92 | 0.5% |
| Sudanese | 22 | 0.1% |
| Swedish | 99 | 0.5% |
| Swiss | 77 | 0.4% |
| Thai | 15 | 0.1% |
| Trinidadian and Tobagonian | 24 | 0.1% |
| Ukrainian | 48 | 0.2% |
| Venezuelan | 3 | 0.0% |
| Welsh | 88 | 0.4% |
| West Indian | 7 | 0.0% | View All 76 Rows |
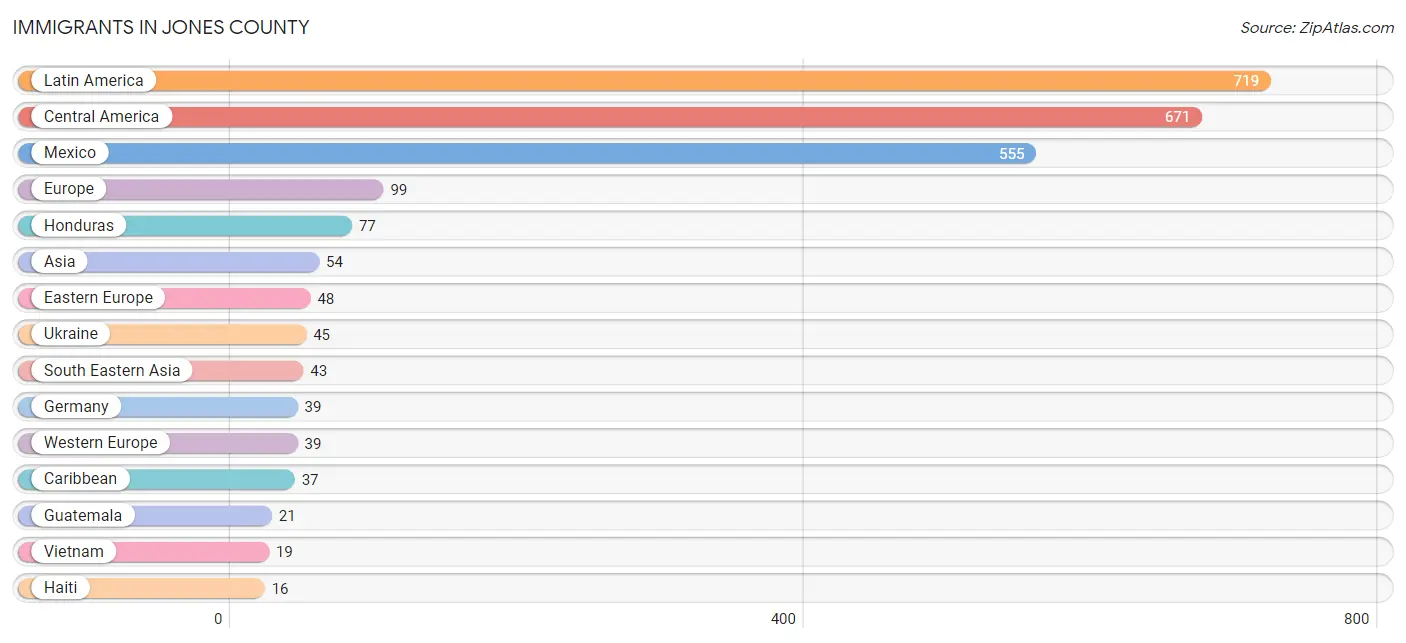
Immigrants in Jones County
The most numerous immigrant groups reported in Jones County came from Latin America (719 | 3.6%), Central America (671 | 3.4%), Mexico (555 | 2.8%), Europe (99 | 0.5%), and Honduras (77 | 0.4%), together accounting for 10.7% of all Jones County residents.
| Immigration Origin | # Population | % Population |
| Africa | 15 | 0.1% |
| Albania | 3 | 0.0% |
| Asia | 54 | 0.3% |
| Caribbean | 37 | 0.2% |
| Central America | 671 | 3.4% |
| Dominican Republic | 6 | 0.0% |
| Eastern Europe | 48 | 0.2% |
| El Salvador | 10 | 0.1% |
| Europe | 99 | 0.5% |
| Germany | 39 | 0.2% |
| Guatemala | 21 | 0.1% |
| Haiti | 16 | 0.1% |
| Honduras | 77 | 0.4% |
| India | 3 | 0.0% |
| Indonesia | 1 | 0.0% |
| Jamaica | 3 | 0.0% |
| Latin America | 719 | 3.6% |
| Mexico | 555 | 2.8% |
| Nigeria | 3 | 0.0% |
| Northern Europe | 12 | 0.1% |
| Pakistan | 8 | 0.0% |
| Panama | 8 | 0.0% |
| Philippines | 9 | 0.1% |
| South America | 11 | 0.1% |
| South Central Asia | 11 | 0.1% |
| South Eastern Asia | 43 | 0.2% |
| Thailand | 14 | 0.1% |
| Trinidad and Tobago | 12 | 0.1% |
| Ukraine | 45 | 0.2% |
| Venezuela | 11 | 0.1% |
| Vietnam | 19 | 0.1% |
| Western Africa | 3 | 0.0% |
| Western Europe | 39 | 0.2% | View All 33 Rows |
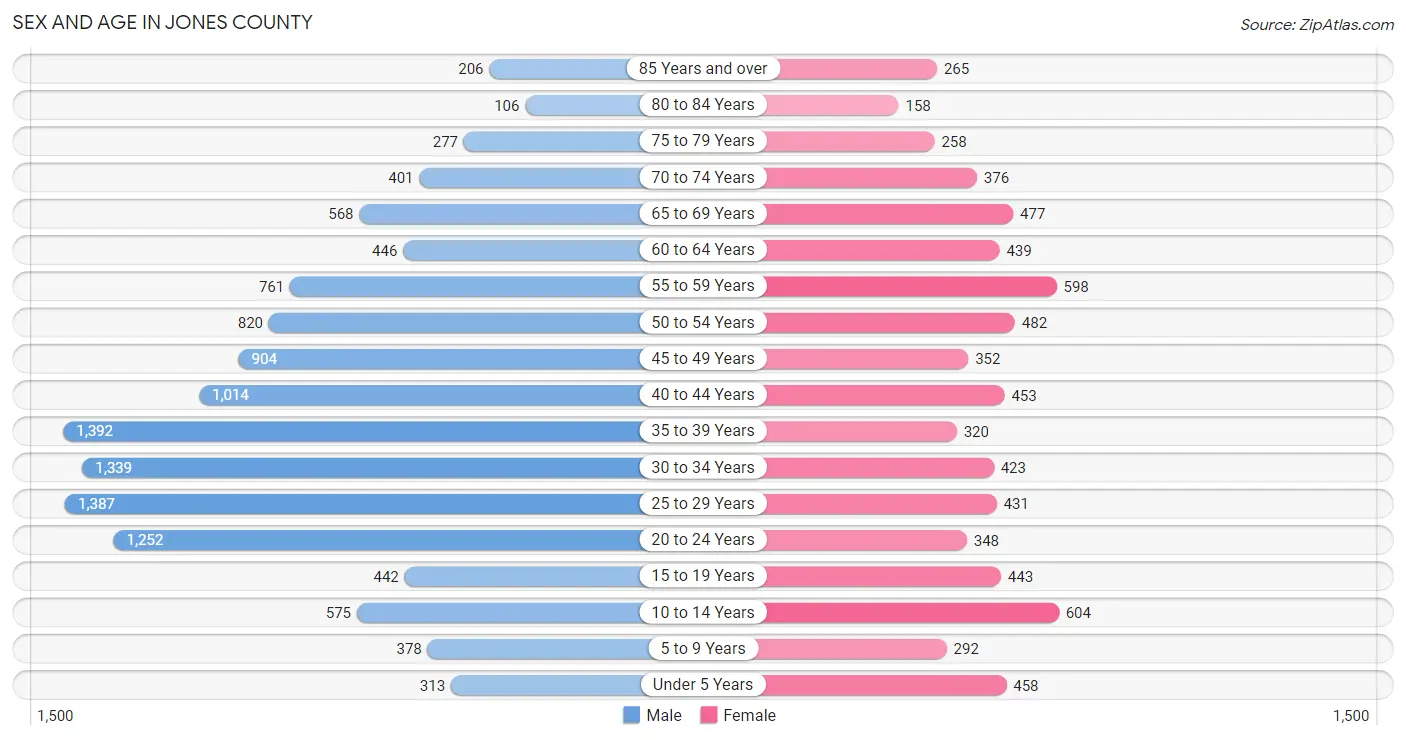
Sex and Age in Jones County
Sex and Age in Jones County
The most populous age groups in Jones County are 35 to 39 Years (1,392 | 11.1%) for men and 10 to 14 Years (604 | 8.4%) for women.
| Age Bracket | Male | Female |
| Under 5 Years | 313 (2.5%) | 458 (6.4%) |
| 5 to 9 Years | 378 (3.0%) | 292 (4.1%) |
| 10 to 14 Years | 575 (4.6%) | 604 (8.4%) |
| 15 to 19 Years | 442 (3.5%) | 443 (6.2%) |
| 20 to 24 Years | 1,252 (10.0%) | 348 (4.9%) |
| 25 to 29 Years | 1,387 (11.0%) | 431 (6.0%) |
| 30 to 34 Years | 1,339 (10.6%) | 423 (5.9%) |
| 35 to 39 Years | 1,392 (11.1%) | 320 (4.5%) |
| 40 to 44 Years | 1,014 (8.1%) | 453 (6.3%) |
| 45 to 49 Years | 904 (7.2%) | 352 (4.9%) |
| 50 to 54 Years | 820 (6.5%) | 482 (6.7%) |
| 55 to 59 Years | 761 (6.0%) | 598 (8.3%) |
| 60 to 64 Years | 446 (3.5%) | 439 (6.1%) |
| 65 to 69 Years | 568 (4.5%) | 477 (6.7%) |
| 70 to 74 Years | 401 (3.2%) | 376 (5.2%) |
| 75 to 79 Years | 277 (2.2%) | 258 (3.6%) |
| 80 to 84 Years | 106 (0.8%) | 158 (2.2%) |
| 85 Years and over | 206 (1.6%) | 265 (3.7%) |
| Total | 12,581 (100.0%) | 7,177 (100.0%) |
Families and Households in Jones County
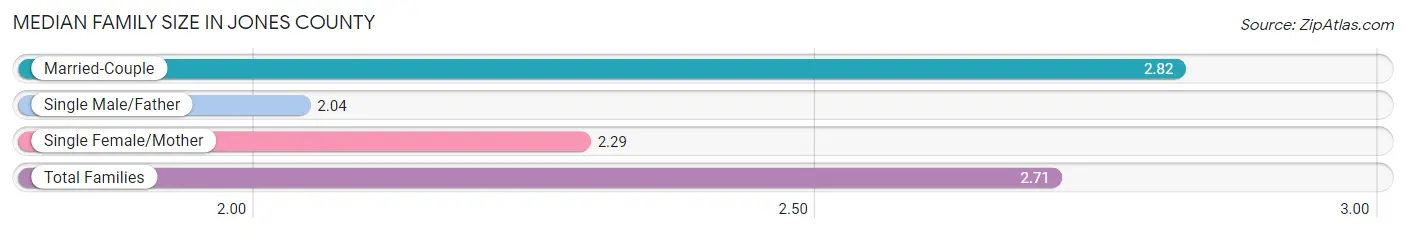
Median Family Size in Jones County
The median family size in Jones County is 2.71 persons per family, with married-couple families (3,306 | 81.1%) accounting for the largest median family size of 2.82 persons per family. On the other hand, single male/father families (202 | 5.0%) represent the smallest median family size with 2.04 persons per family.
| Family Type | # Families | Family Size |
| Married-Couple | 3,306 (81.1%) | 2.82 |
| Single Male/Father | 202 (5.0%) | 2.04 |
| Single Female/Mother | 570 (14.0%) | 2.29 |
| Total Families | 4,078 (100.0%) | 2.71 |
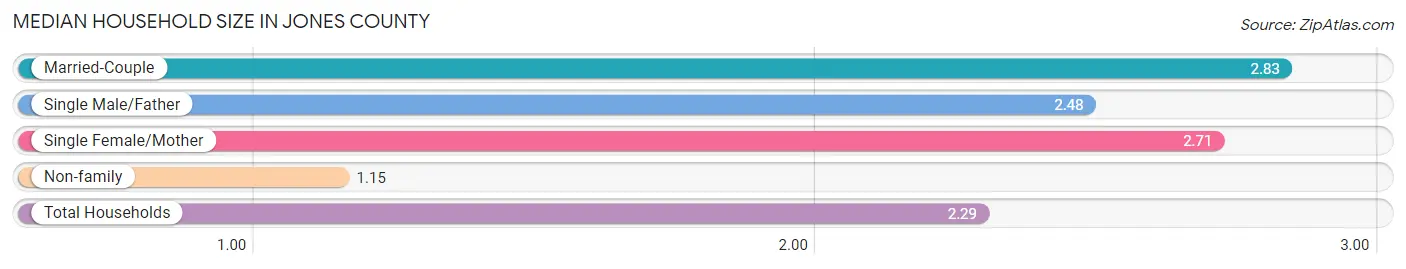
Median Household Size in Jones County
The median household size in Jones County is 2.29 persons per household, with married-couple households (3,306 | 55.9%) accounting for the largest median household size of 2.83 persons per household. non-family households (1,839 | 31.1%) represent the smallest median household size with 1.15 persons per household.
| Household Type | # Households | Household Size |
| Married-Couple | 3,306 (55.9%) | 2.83 |
| Single Male/Father | 202 (3.4%) | 2.48 |
| Single Female/Mother | 570 (9.6%) | 2.71 |
| Non-family | 1,839 (31.1%) | 1.15 |
| Total Households | 5,917 (100.0%) | 2.29 |
Household Size by Marriage Status in Jones County
Out of a total of 5,917 households in Jones County, 4,078 (68.9%) are family households, while 1,839 (31.1%) are nonfamily households. The most numerous type of family households are 2-person households, comprising 1,973, and the most common type of nonfamily households are 1-person households, comprising 1,545.
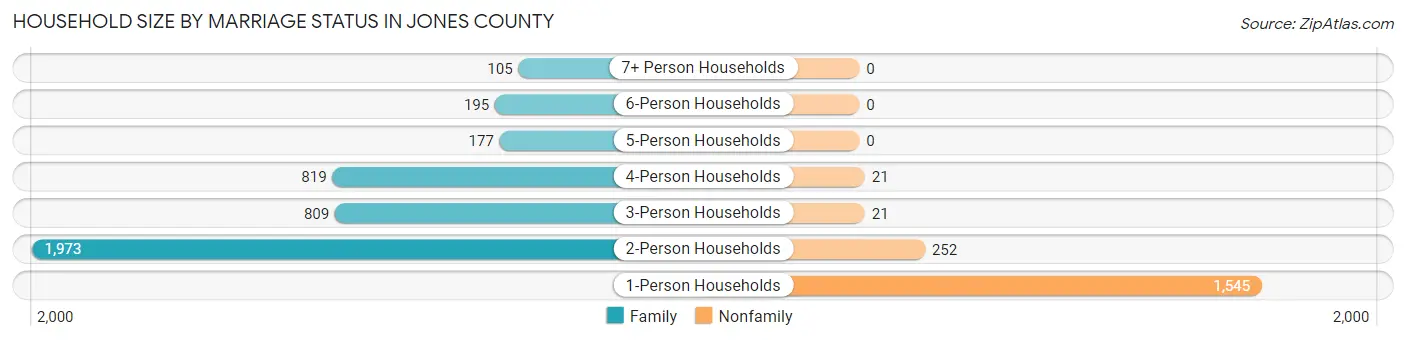
| Household Size | Family Households | Nonfamily Households |
| 1-Person Households | - | 1,545 (26.1%) |
| 2-Person Households | 1,973 (33.3%) | 252 (4.3%) |
| 3-Person Households | 809 (13.7%) | 21 (0.4%) |
| 4-Person Households | 819 (13.8%) | 21 (0.4%) |
| 5-Person Households | 177 (3.0%) | 0 (0.0%) |
| 6-Person Households | 195 (3.3%) | 0 (0.0%) |
| 7+ Person Households | 105 (1.8%) | 0 (0.0%) |
| Total | 4,078 (68.9%) | 1,839 (31.1%) |
Female Fertility in Jones County
Fertility by Age in Jones County
Average fertility rate in Jones County is 59.0 births per 1,000 women. Women in the age bracket of 20 to 34 years have the highest fertility rate with 113.0 births per 1,000 women. Women in the age bracket of 20 to 34 years acount for 80.0% of all women with births.
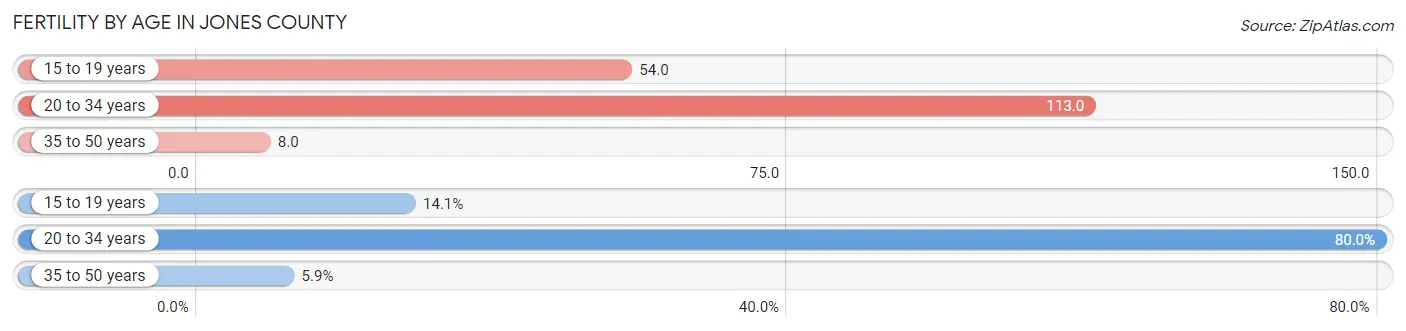
| Age Bracket | Women with Births | Births / 1,000 Women |
| 15 to 19 years | 24 (14.1%) | 54.0 |
| 20 to 34 years | 136 (80.0%) | 113.0 |
| 35 to 50 years | 10 (5.9%) | 8.0 |
| Total | 170 (100.0%) | 59.0 |
Fertility by Age by Marriage Status in Jones County
39.4% of women with births (170) in Jones County are married. The highest percentage of unmarried women with births falls into 15 to 19 years age bracket with 100.0% of them unmarried at the time of birth, while the lowest percentage of unmarried women with births belong to 35 to 50 years age bracket with 0.0% of them unmarried.
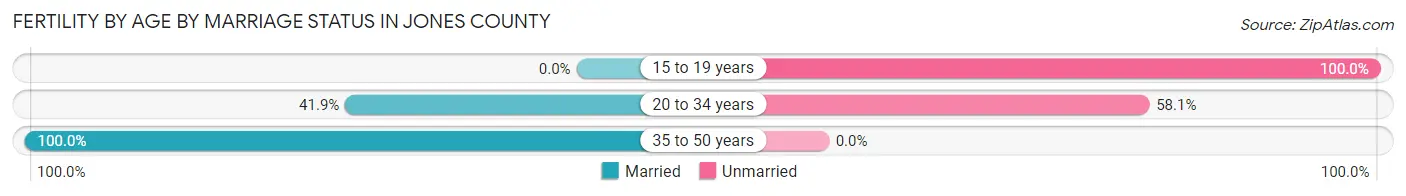
| Age Bracket | Married | Unmarried |
| 15 to 19 years | 0 (0.0%) | 24 (100.0%) |
| 20 to 34 years | 57 (41.9%) | 79 (58.1%) |
| 35 to 50 years | 10 (100.0%) | 0 (0.0%) |
| Total | 67 (39.4%) | 103 (60.6%) |
Fertility by Education in Jones County
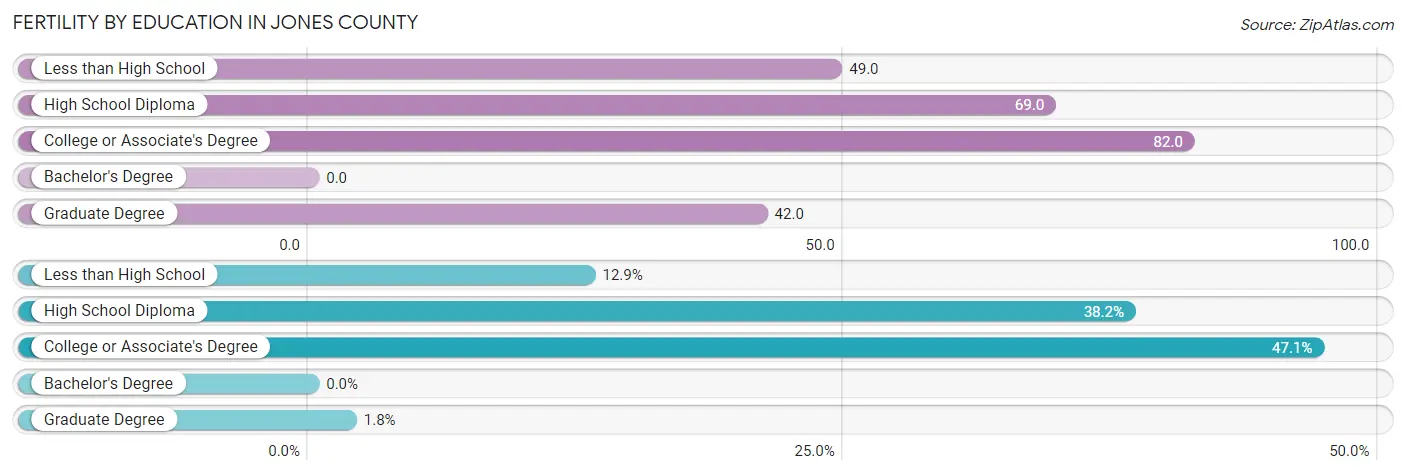
| Educational Attainment | Women with Births | Births / 1,000 Women |
| Less than High School | 22 (12.9%) | 49.0 |
| High School Diploma | 65 (38.2%) | 69.0 |
| College or Associate's Degree | 80 (47.1%) | 82.0 |
| Bachelor's Degree | 0 (0.0%) | 0.0 |
| Graduate Degree | 3 (1.8%) | 42.0 |
| Total | 170 (100.0%) | 59.0 |
Fertility by Education by Marriage Status in Jones County
60.6% of women with births in Jones County are unmarried. Women with the educational attainment of graduate degree are most likely to be married with 100.0% of them married at childbirth, while women with the educational attainment of less than high school are least likely to be married with 100.0% of them unmarried at childbirth.
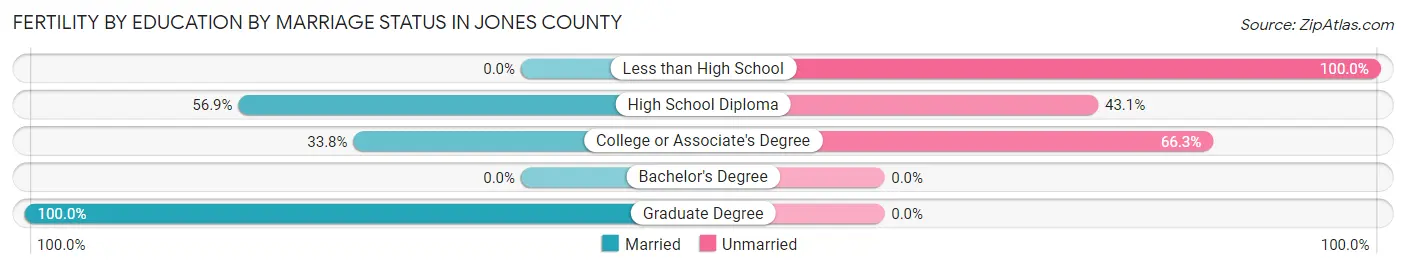
| Educational Attainment | Married | Unmarried |
| Less than High School | 0 (0.0%) | 22 (100.0%) |
| High School Diploma | 37 (56.9%) | 28 (43.1%) |
| College or Associate's Degree | 27 (33.8%) | 53 (66.2%) |
| Bachelor's Degree | 0 (0.0%) | 0 (0.0%) |
| Graduate Degree | 3 (100.0%) | 0 (0.0%) |
| Total | 67 (39.4%) | 103 (60.6%) |
Employment Characteristics in Jones County
Employment by Class of Employer in Jones County
Among the 6,338 employed individuals in Jones County, private company employees (3,877 | 61.2%), self-employed (not incorporated) (732 | 11.6%), and local government employees (650 | 10.3%) make up the most common classes of employment.
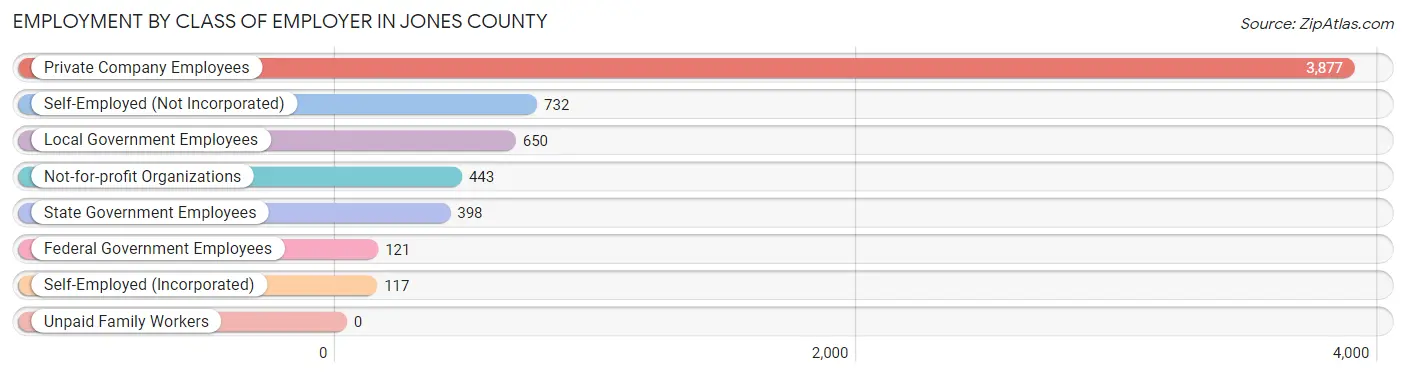
| Employer Class | # Employees | % Employees |
| Private Company Employees | 3,877 | 61.2% |
| Self-Employed (Incorporated) | 117 | 1.8% |
| Self-Employed (Not Incorporated) | 732 | 11.6% |
| Not-for-profit Organizations | 443 | 7.0% |
| Local Government Employees | 650 | 10.3% |
| State Government Employees | 398 | 6.3% |
| Federal Government Employees | 121 | 1.9% |
| Unpaid Family Workers | 0 | 0.0% |
| Total | 6,338 | 100.0% |
Employment Status by Age in Jones County
According to the labor force statistics for Jones County, out of the total population over 16 years of age (16,934), 39.5% or 6,689 individuals are in the labor force, with 4.7% or 314 of them unemployed. The age group with the highest labor force participation rate is 55 to 59 years, with 60.3% or 819 individuals in the labor force. Within the labor force, the 55 to 59 years age range has the highest percentage of unemployed individuals, with 20.1% or 165 of them being unemployed.
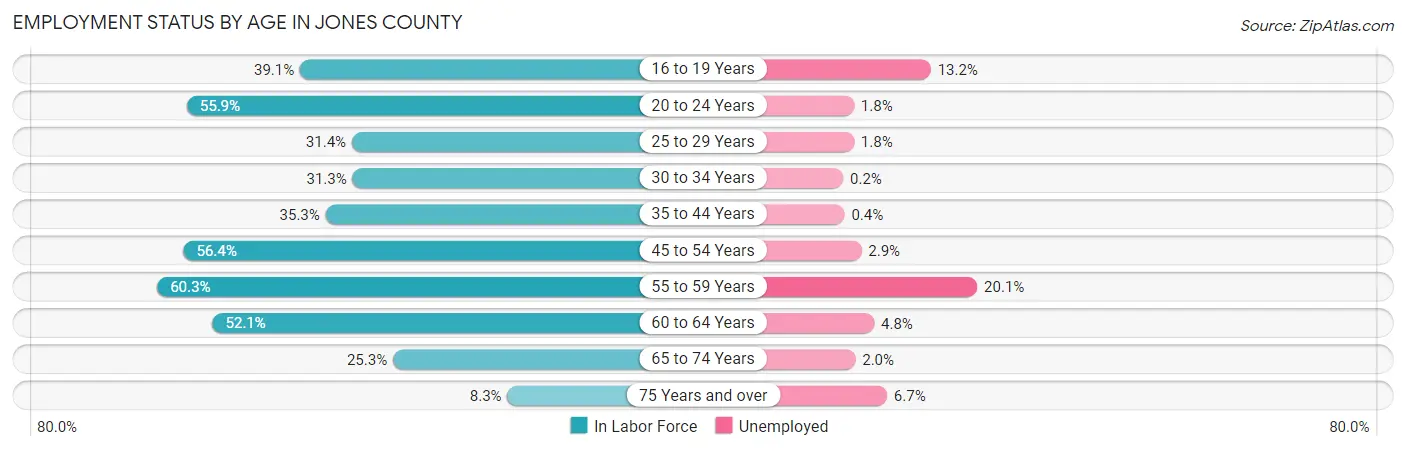
| Age Bracket | In Labor Force | Unemployed |
| 16 to 19 Years | 266 (39.1%) | 35 (13.2%) |
| 20 to 24 Years | 894 (55.9%) | 16 (1.8%) |
| 25 to 29 Years | 571 (31.4%) | 10 (1.8%) |
| 30 to 34 Years | 552 (31.3%) | 1 (0.2%) |
| 35 to 44 Years | 1,122 (35.3%) | 4 (0.4%) |
| 45 to 54 Years | 1,443 (56.4%) | 42 (2.9%) |
| 55 to 59 Years | 819 (60.3%) | 165 (20.1%) |
| 60 to 64 Years | 461 (52.1%) | 22 (4.8%) |
| 65 to 74 Years | 461 (25.3%) | 9 (2.0%) |
| 75 Years and over | 105 (8.3%) | 7 (6.7%) |
| Total | 6,689 (39.5%) | 314 (4.7%) |
Employment Status by Educational Attainment in Jones County
According to labor force statistics for Jones County, 42.9% of individuals (4,960) out of the total population between 25 and 64 years of age (11,561) are in the labor force, with 4.9% or 243 of them being unemployed. The group with the highest labor force participation rate are those with the educational attainment of bachelor's degree or higher, with 77.5% or 912 individuals in the labor force. Within the labor force, individuals with high school diploma education have the highest percentage of unemployment, with 6.1% or 118 of them being unemployed.
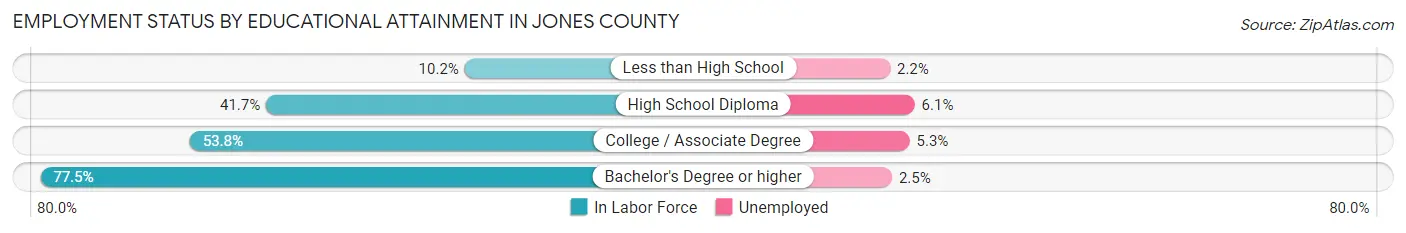
| Educational Attainment | In Labor Force | Unemployed |
| Less than High School | 228 (10.2%) | 49 (2.2%) |
| High School Diploma | 1,931 (41.7%) | 282 (6.1%) |
| College / Associate Degree | 1,893 (53.8%) | 187 (5.3%) |
| Bachelor's Degree or higher | 912 (77.5%) | 29 (2.5%) |
| Total | 4,960 (42.9%) | 566 (4.9%) |
Employment Occupations by Sex in Jones County
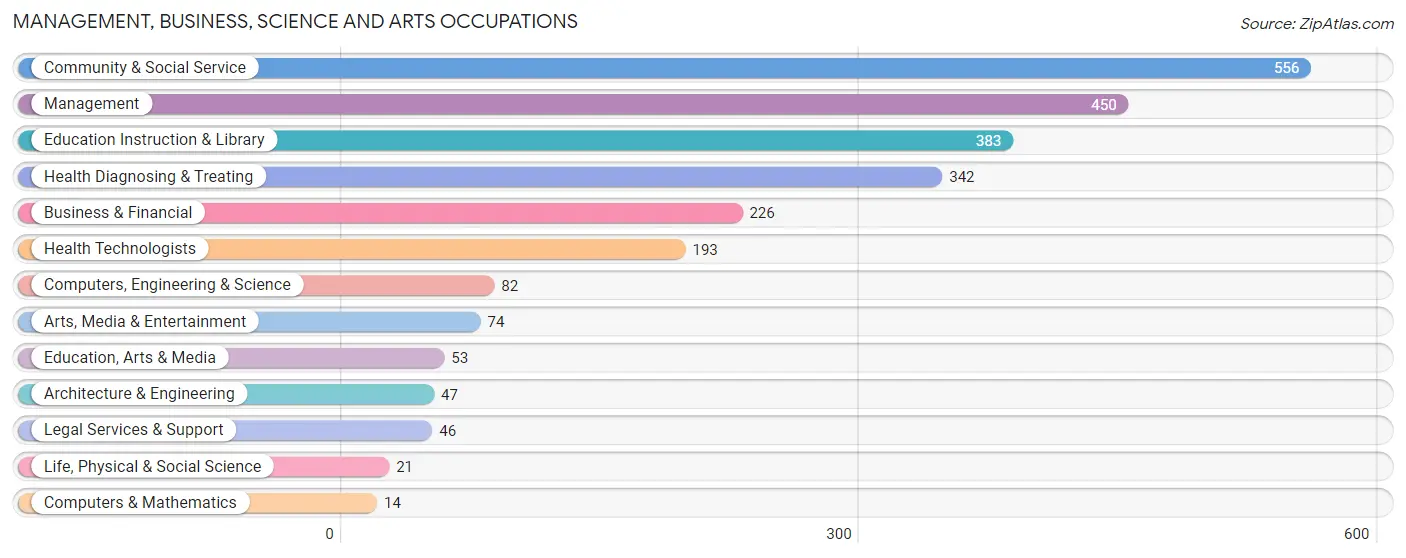
Management, Business, Science and Arts Occupations
The most common Management, Business, Science and Arts occupations in Jones County are Community & Social Service (556 | 8.7%), Management (450 | 7.1%), Education Instruction & Library (383 | 6.0%), Health Diagnosing & Treating (342 | 5.4%), and Business & Financial (226 | 3.5%).
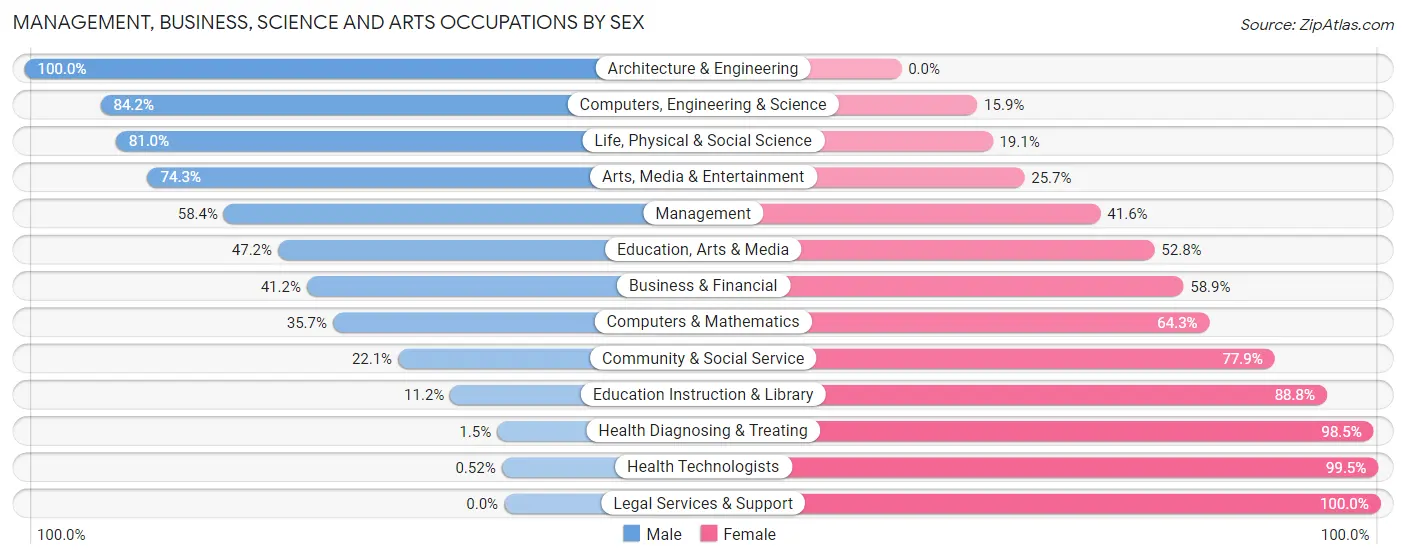
Management, Business, Science and Arts Occupations by Sex
Within the Management, Business, Science and Arts occupations in Jones County, the most male-oriented occupations are Architecture & Engineering (100.0%), Computers, Engineering & Science (84.2%), and Life, Physical & Social Science (80.9%), while the most female-oriented occupations are Legal Services & Support (100.0%), Health Technologists (99.5%), and Health Diagnosing & Treating (98.5%).
| Occupation | Male | Female |
| Management | 263 (58.4%) | 187 (41.6%) |
| Business & Financial | 93 (41.1%) | 133 (58.9%) |
| Computers, Engineering & Science | 69 (84.2%) | 13 (15.9%) |
| Computers & Mathematics | 5 (35.7%) | 9 (64.3%) |
| Architecture & Engineering | 47 (100.0%) | 0 (0.0%) |
| Life, Physical & Social Science | 17 (80.9%) | 4 (19.1%) |
| Community & Social Service | 123 (22.1%) | 433 (77.9%) |
| Education, Arts & Media | 25 (47.2%) | 28 (52.8%) |
| Legal Services & Support | 0 (0.0%) | 46 (100.0%) |
| Education Instruction & Library | 43 (11.2%) | 340 (88.8%) |
| Arts, Media & Entertainment | 55 (74.3%) | 19 (25.7%) |
| Health Diagnosing & Treating | 5 (1.5%) | 337 (98.5%) |
| Health Technologists | 1 (0.5%) | 192 (99.5%) |
| Total (Category) | 553 (33.4%) | 1,103 (66.6%) |
| Total (Overall) | 3,285 (51.6%) | 3,076 (48.4%) |
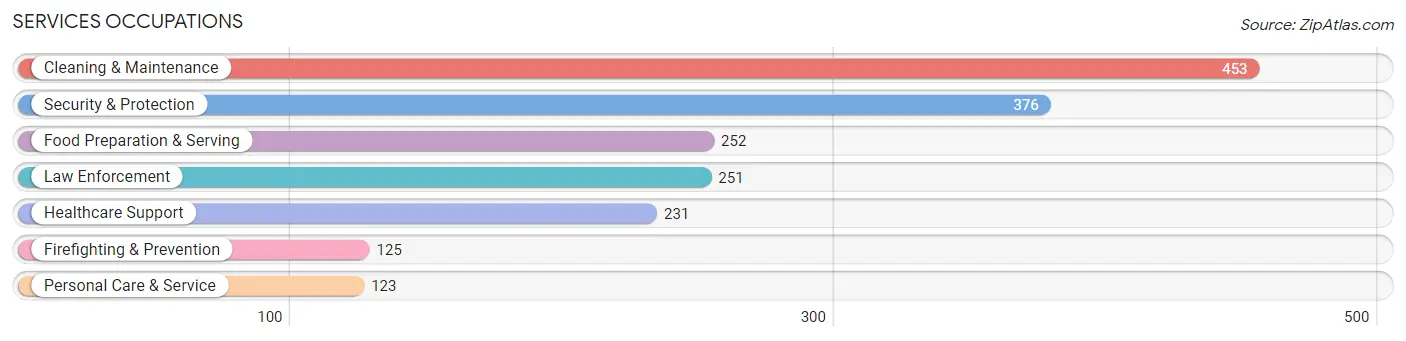
Services Occupations
The most common Services occupations in Jones County are Cleaning & Maintenance (453 | 7.1%), Security & Protection (376 | 5.9%), Food Preparation & Serving (252 | 4.0%), Law Enforcement (251 | 4.0%), and Healthcare Support (231 | 3.6%).
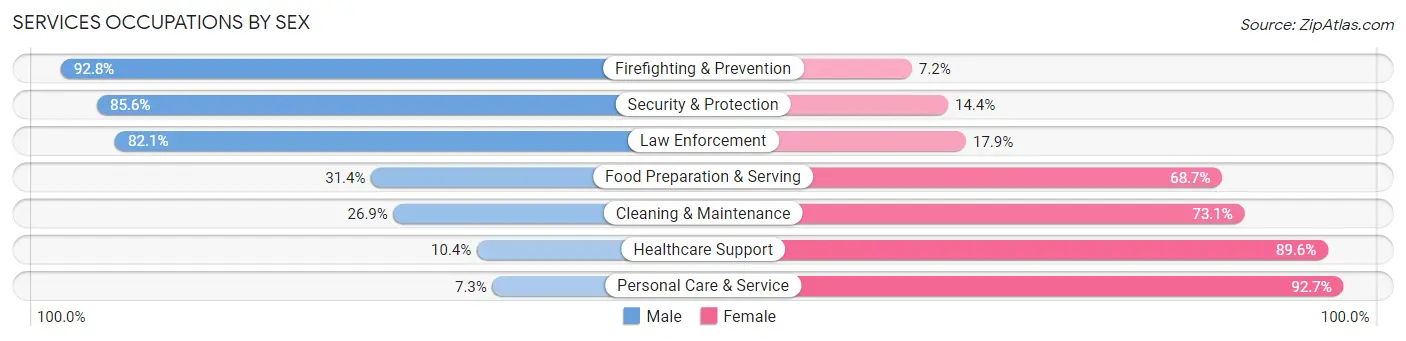
Services Occupations by Sex
Within the Services occupations in Jones County, the most male-oriented occupations are Firefighting & Prevention (92.8%), Security & Protection (85.6%), and Law Enforcement (82.1%), while the most female-oriented occupations are Personal Care & Service (92.7%), Healthcare Support (89.6%), and Cleaning & Maintenance (73.1%).
| Occupation | Male | Female |
| Healthcare Support | 24 (10.4%) | 207 (89.6%) |
| Security & Protection | 322 (85.6%) | 54 (14.4%) |
| Firefighting & Prevention | 116 (92.8%) | 9 (7.2%) |
| Law Enforcement | 206 (82.1%) | 45 (17.9%) |
| Food Preparation & Serving | 79 (31.4%) | 173 (68.6%) |
| Cleaning & Maintenance | 122 (26.9%) | 331 (73.1%) |
| Personal Care & Service | 9 (7.3%) | 114 (92.7%) |
| Total (Category) | 556 (38.8%) | 879 (61.3%) |
| Total (Overall) | 3,285 (51.6%) | 3,076 (48.4%) |
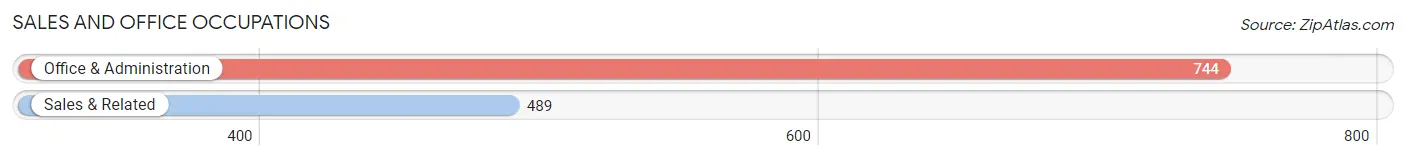
Sales and Office Occupations
The most common Sales and Office occupations in Jones County are Office & Administration (744 | 11.7%), and Sales & Related (489 | 7.7%).
Sales and Office Occupations by Sex
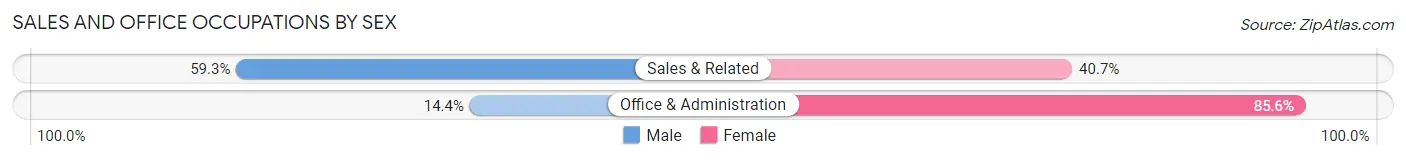
| Occupation | Male | Female |
| Sales & Related | 290 (59.3%) | 199 (40.7%) |
| Office & Administration | 107 (14.4%) | 637 (85.6%) |
| Total (Category) | 397 (32.2%) | 836 (67.8%) |
| Total (Overall) | 3,285 (51.6%) | 3,076 (48.4%) |
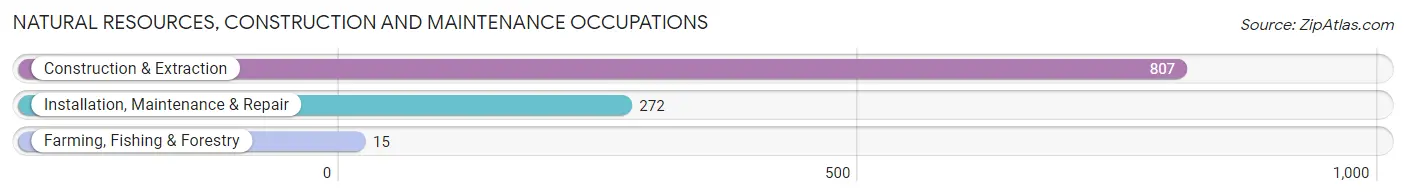
Natural Resources, Construction and Maintenance Occupations
The most common Natural Resources, Construction and Maintenance occupations in Jones County are Construction & Extraction (807 | 12.7%), Installation, Maintenance & Repair (272 | 4.3%), and Farming, Fishing & Forestry (15 | 0.2%).
Natural Resources, Construction and Maintenance Occupations by Sex
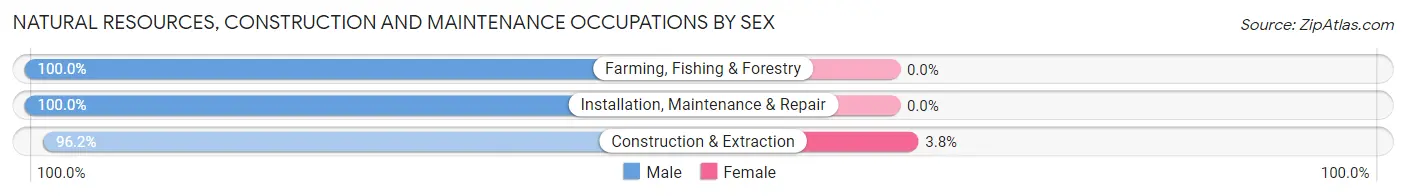
| Occupation | Male | Female |
| Farming, Fishing & Forestry | 15 (100.0%) | 0 (0.0%) |
| Construction & Extraction | 776 (96.2%) | 31 (3.8%) |
| Installation, Maintenance & Repair | 272 (100.0%) | 0 (0.0%) |
| Total (Category) | 1,063 (97.2%) | 31 (2.8%) |
| Total (Overall) | 3,285 (51.6%) | 3,076 (48.4%) |
Production, Transportation and Moving Occupations
The most common Production, Transportation and Moving occupations in Jones County are Material Moving (332 | 5.2%), Transportation (313 | 4.9%), and Production (298 | 4.7%).
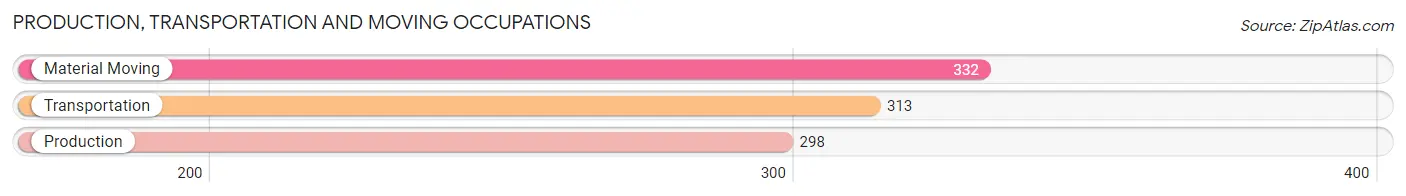
Production, Transportation and Moving Occupations by Sex
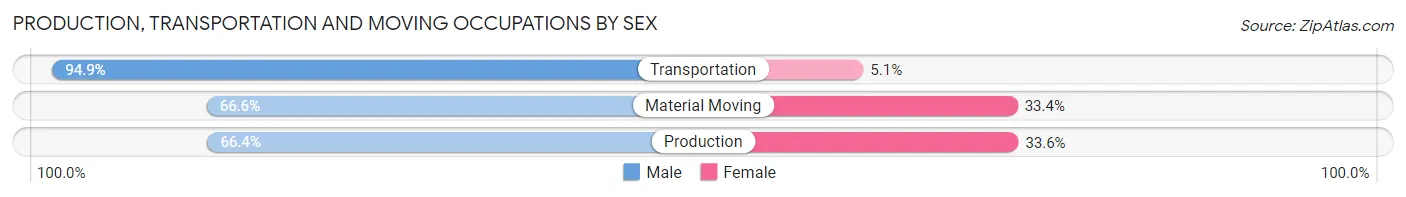
| Occupation | Male | Female |
| Production | 198 (66.4%) | 100 (33.6%) |
| Transportation | 297 (94.9%) | 16 (5.1%) |
| Material Moving | 221 (66.6%) | 111 (33.4%) |
| Total (Category) | 716 (75.9%) | 227 (24.1%) |
| Total (Overall) | 3,285 (51.6%) | 3,076 (48.4%) |
Employment Industries by Sex in Jones County
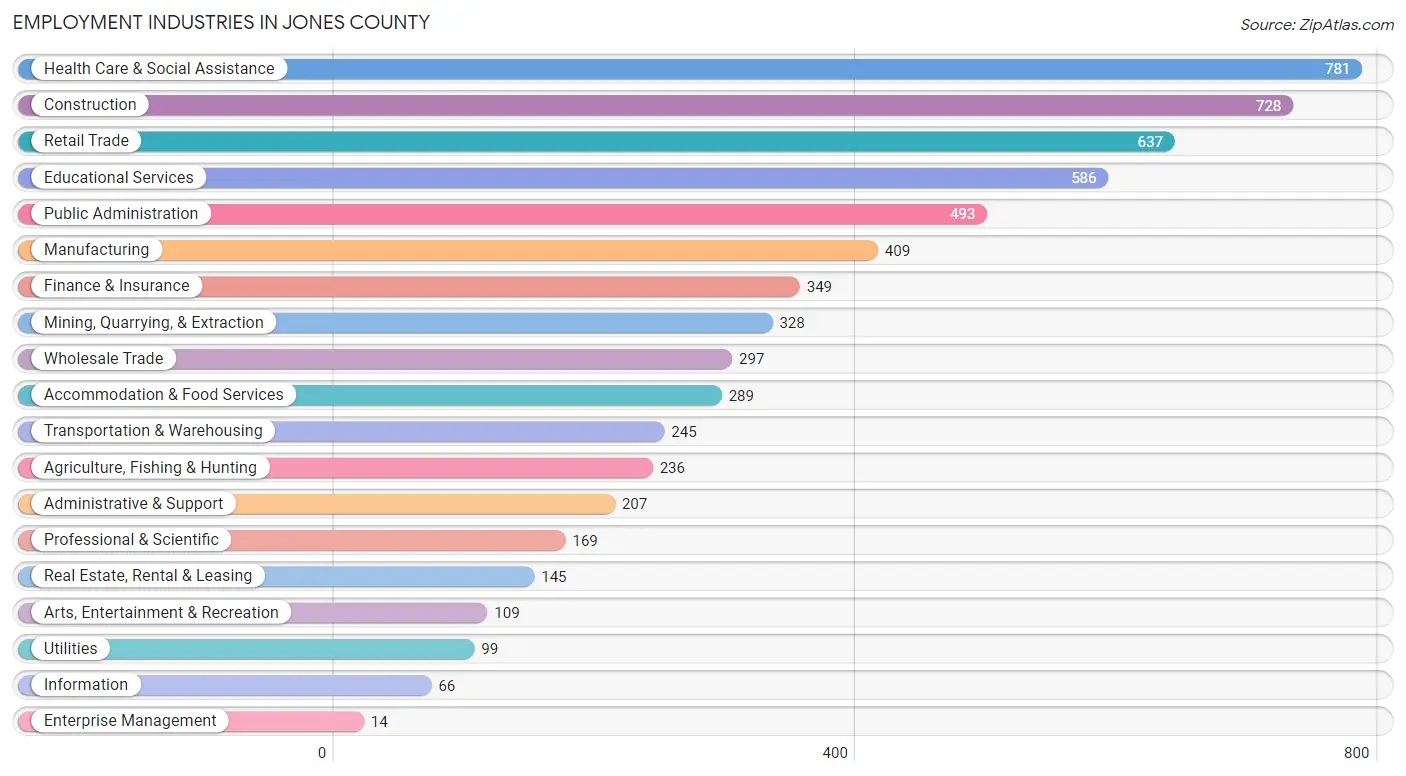
Employment Industries in Jones County
The major employment industries in Jones County include Health Care & Social Assistance (781 | 12.3%), Construction (728 | 11.4%), Retail Trade (637 | 10.0%), Educational Services (586 | 9.2%), and Public Administration (493 | 7.7%).
Employment Industries by Sex in Jones County
The Jones County industries that see more men than women are Agriculture, Fishing & Hunting (100.0%), Mining, Quarrying, & Extraction (99.1%), and Wholesale Trade (94.3%), whereas the industries that tend to have a higher number of women are Enterprise Management (100.0%), Health Care & Social Assistance (94.1%), and Educational Services (88.6%).
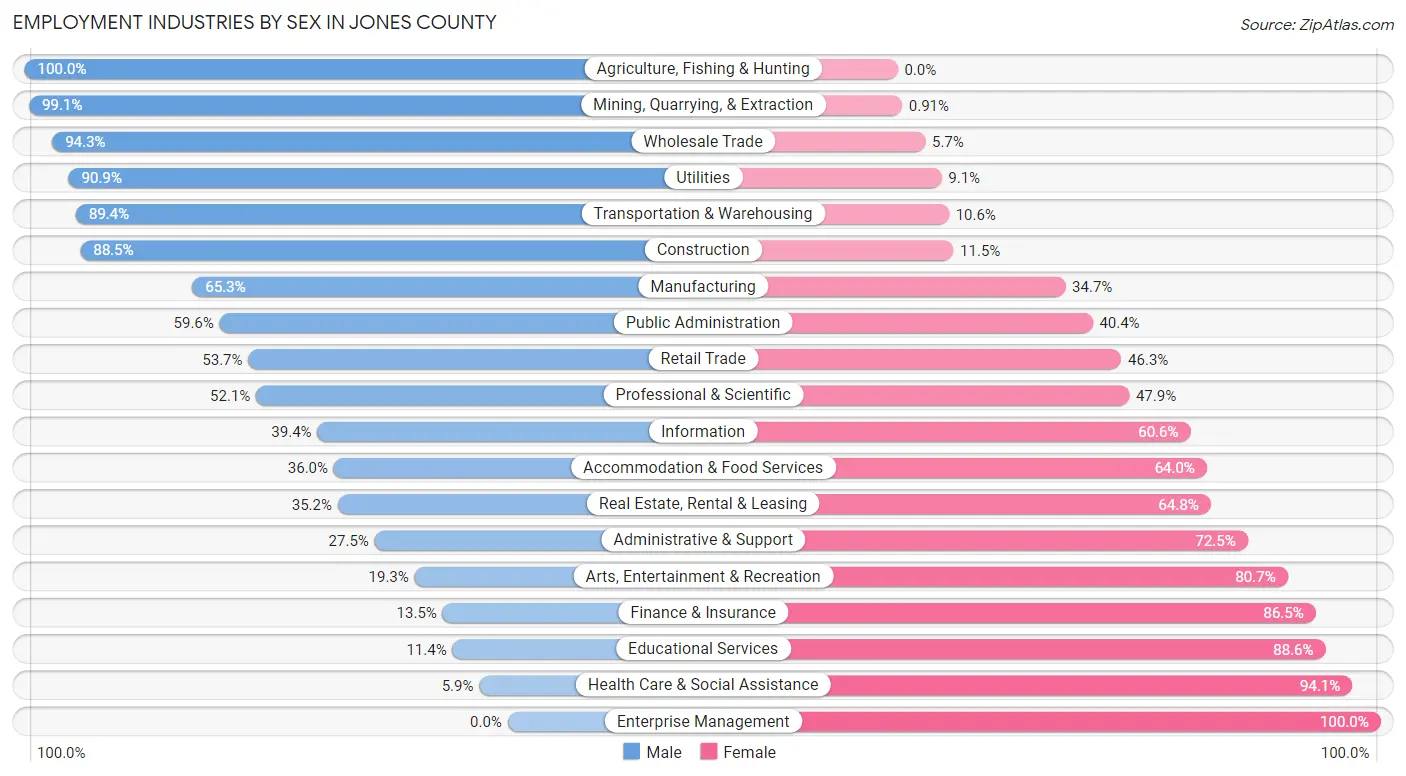
| Industry | Male | Female |
| Agriculture, Fishing & Hunting | 236 (100.0%) | 0 (0.0%) |
| Mining, Quarrying, & Extraction | 325 (99.1%) | 3 (0.9%) |
| Construction | 644 (88.5%) | 84 (11.5%) |
| Manufacturing | 267 (65.3%) | 142 (34.7%) |
| Wholesale Trade | 280 (94.3%) | 17 (5.7%) |
| Retail Trade | 342 (53.7%) | 295 (46.3%) |
| Transportation & Warehousing | 219 (89.4%) | 26 (10.6%) |
| Utilities | 90 (90.9%) | 9 (9.1%) |
| Information | 26 (39.4%) | 40 (60.6%) |
| Finance & Insurance | 47 (13.5%) | 302 (86.5%) |
| Real Estate, Rental & Leasing | 51 (35.2%) | 94 (64.8%) |
| Professional & Scientific | 88 (52.1%) | 81 (47.9%) |
| Enterprise Management | 0 (0.0%) | 14 (100.0%) |
| Administrative & Support | 57 (27.5%) | 150 (72.5%) |
| Educational Services | 67 (11.4%) | 519 (88.6%) |
| Health Care & Social Assistance | 46 (5.9%) | 735 (94.1%) |
| Arts, Entertainment & Recreation | 21 (19.3%) | 88 (80.7%) |
| Accommodation & Food Services | 104 (36.0%) | 185 (64.0%) |
| Public Administration | 294 (59.6%) | 199 (40.4%) |
| Total | 3,285 (51.6%) | 3,076 (48.4%) |
Education in Jones County
School Enrollment in Jones County
The most common levels of schooling among the 3,030 students in Jones County are high school (906 | 29.9%), middle school (849 | 28.0%), and elementary school (706 | 23.3%).
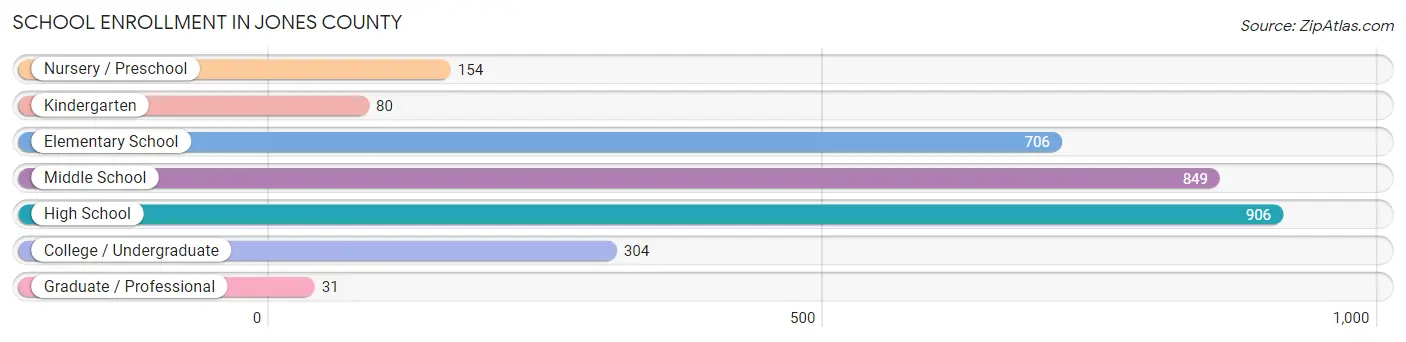
| School Level | # Students | % Students |
| Nursery / Preschool | 154 | 5.1% |
| Kindergarten | 80 | 2.6% |
| Elementary School | 706 | 23.3% |
| Middle School | 849 | 28.0% |
| High School | 906 | 29.9% |
| College / Undergraduate | 304 | 10.0% |
| Graduate / Professional | 31 | 1.0% |
| Total | 3,030 | 100.0% |
School Enrollment by Age by Funding Source in Jones County
Out of a total of 3,030 students who are enrolled in schools in Jones County, 442 (14.6%) attend a private institution, while the remaining 2,588 (85.4%) are enrolled in public schools. The age group of 35 years and over has the highest likelihood of being enrolled in private schools, with 102 (37.9% in the age bracket) enrolled. Conversely, the age group of 5 to 9 year old has the lowest likelihood of being enrolled in a private school, with 607 (93.2% in the age bracket) attending a public institution.
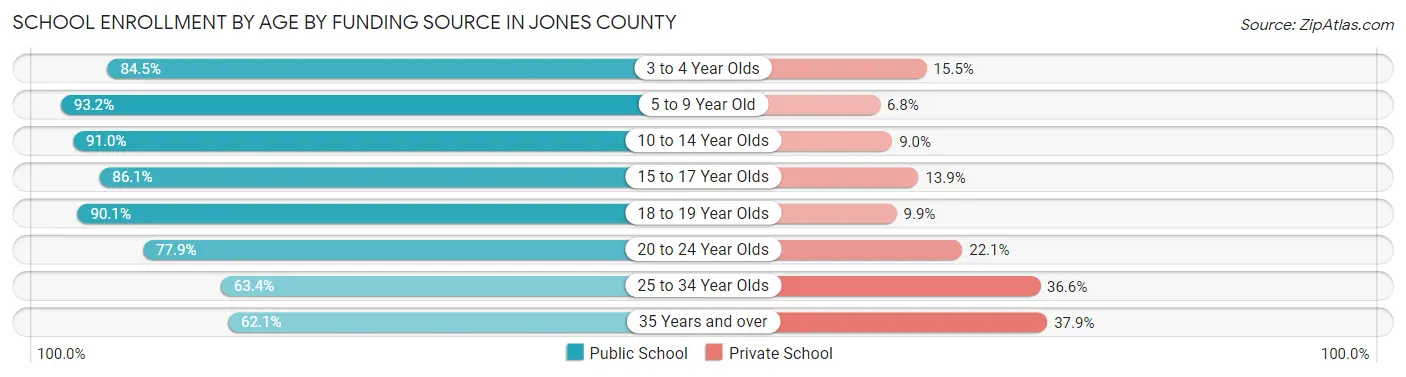
| Age Bracket | Public School | Private School |
| 3 to 4 Year Olds | 82 (84.5%) | 15 (15.5%) |
| 5 to 9 Year Old | 607 (93.2%) | 44 (6.8%) |
| 10 to 14 Year Olds | 976 (91.0%) | 97 (9.0%) |
| 15 to 17 Year Olds | 488 (86.1%) | 79 (13.9%) |
| 18 to 19 Year Olds | 64 (90.1%) | 7 (9.9%) |
| 20 to 24 Year Olds | 67 (77.9%) | 19 (22.1%) |
| 25 to 34 Year Olds | 137 (63.4%) | 79 (36.6%) |
| 35 Years and over | 167 (62.1%) | 102 (37.9%) |
| Total | 2,588 (85.4%) | 442 (14.6%) |
Educational Attainment by Field of Study in Jones County
Education (344 | 19.5%), business (266 | 15.1%), arts & humanities (223 | 12.7%), bio, nature & agricultural (167 | 9.5%), and science & technology (120 | 6.8%) are the most common fields of study among 1,763 individuals in Jones County who have obtained a bachelor's degree or higher.
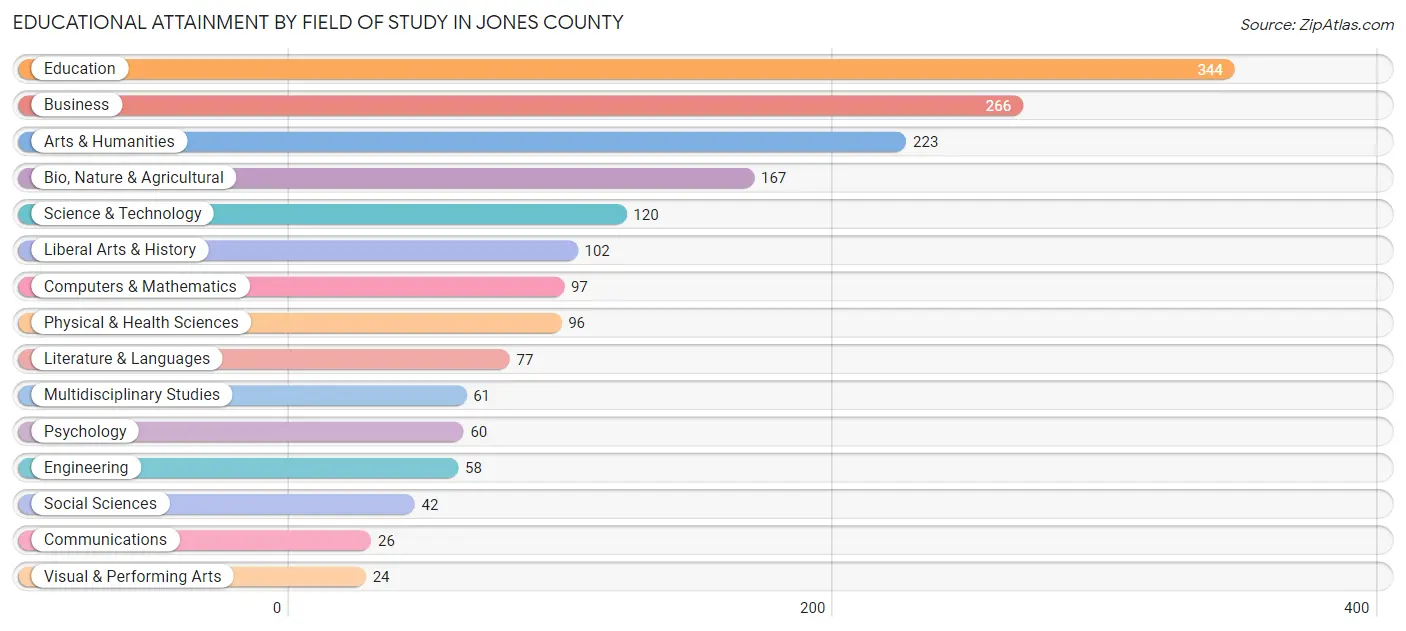
| Field of Study | # Graduates | % Graduates |
| Computers & Mathematics | 97 | 5.5% |
| Bio, Nature & Agricultural | 167 | 9.5% |
| Physical & Health Sciences | 96 | 5.4% |
| Psychology | 60 | 3.4% |
| Social Sciences | 42 | 2.4% |
| Engineering | 58 | 3.3% |
| Multidisciplinary Studies | 61 | 3.5% |
| Science & Technology | 120 | 6.8% |
| Business | 266 | 15.1% |
| Education | 344 | 19.5% |
| Literature & Languages | 77 | 4.4% |
| Liberal Arts & History | 102 | 5.8% |
| Visual & Performing Arts | 24 | 1.4% |
| Communications | 26 | 1.5% |
| Arts & Humanities | 223 | 12.7% |
| Total | 1,763 | 100.0% |
Transportation & Commute in Jones County
Vehicle Availability by Sex in Jones County
The most prevalent vehicle ownership categories in Jones County are males with 2 vehicles (1,371, accounting for 41.8%) and females with 2 vehicles (1,066, making up 44.9%).
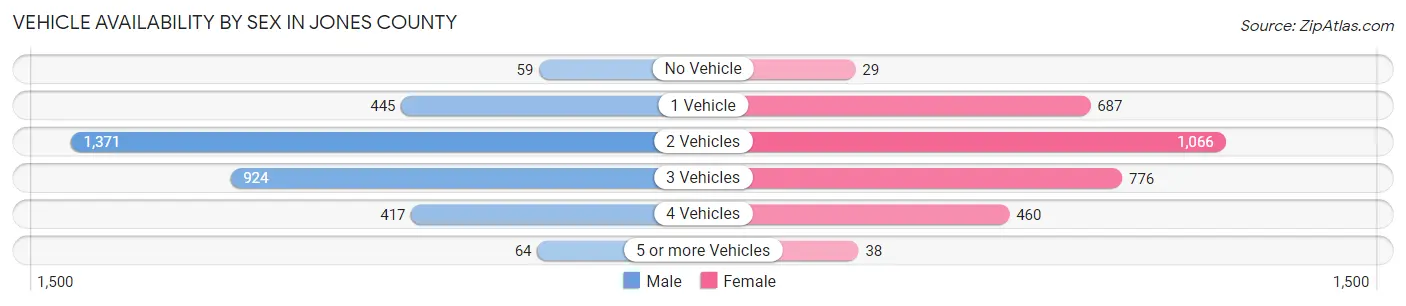
| Vehicles Available | Male | Female |
| No Vehicle | 59 (1.8%) | 29 (0.9%) |
| 1 Vehicle | 445 (13.6%) | 687 (22.5%) |
| 2 Vehicles | 1,371 (41.8%) | 1,066 (34.9%) |
| 3 Vehicles | 924 (28.2%) | 776 (25.4%) |
| 4 Vehicles | 417 (12.7%) | 460 (15.0%) |
| 5 or more Vehicles | 64 (1.9%) | 38 (1.2%) |
| Total | 3,280 (100.0%) | 3,056 (100.0%) |
Commute Time in Jones County
The most frequently occuring commute durations in Jones County are 5 to 9 minutes (866 commuters, 14.8%), 20 to 24 minutes (864 commuters, 14.7%), and 30 to 34 minutes (789 commuters, 13.5%).
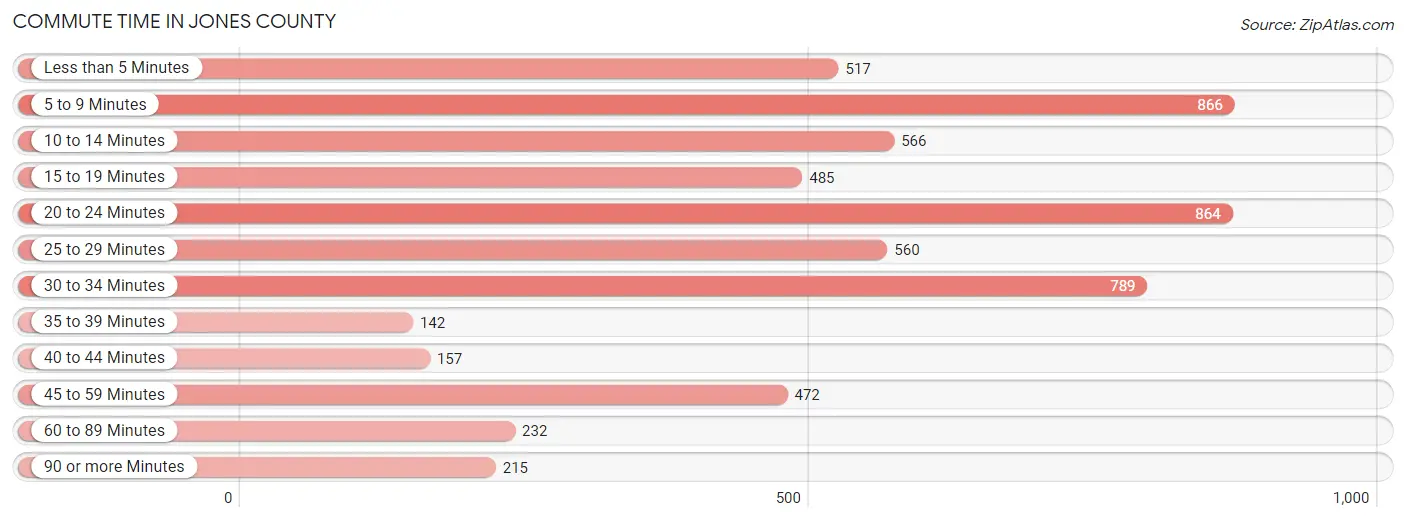
| Commute Time | # Commuters | % Commuters |
| Less than 5 Minutes | 517 | 8.8% |
| 5 to 9 Minutes | 866 | 14.8% |
| 10 to 14 Minutes | 566 | 9.7% |
| 15 to 19 Minutes | 485 | 8.3% |
| 20 to 24 Minutes | 864 | 14.7% |
| 25 to 29 Minutes | 560 | 9.6% |
| 30 to 34 Minutes | 789 | 13.5% |
| 35 to 39 Minutes | 142 | 2.4% |
| 40 to 44 Minutes | 157 | 2.7% |
| 45 to 59 Minutes | 472 | 8.1% |
| 60 to 89 Minutes | 232 | 4.0% |
| 90 or more Minutes | 215 | 3.7% |
Commute Time by Sex in Jones County
The most common commute times in Jones County are 20 to 24 minutes (429 commuters, 14.2%) for males and 5 to 9 minutes (514 commuters, 18.0%) for females.
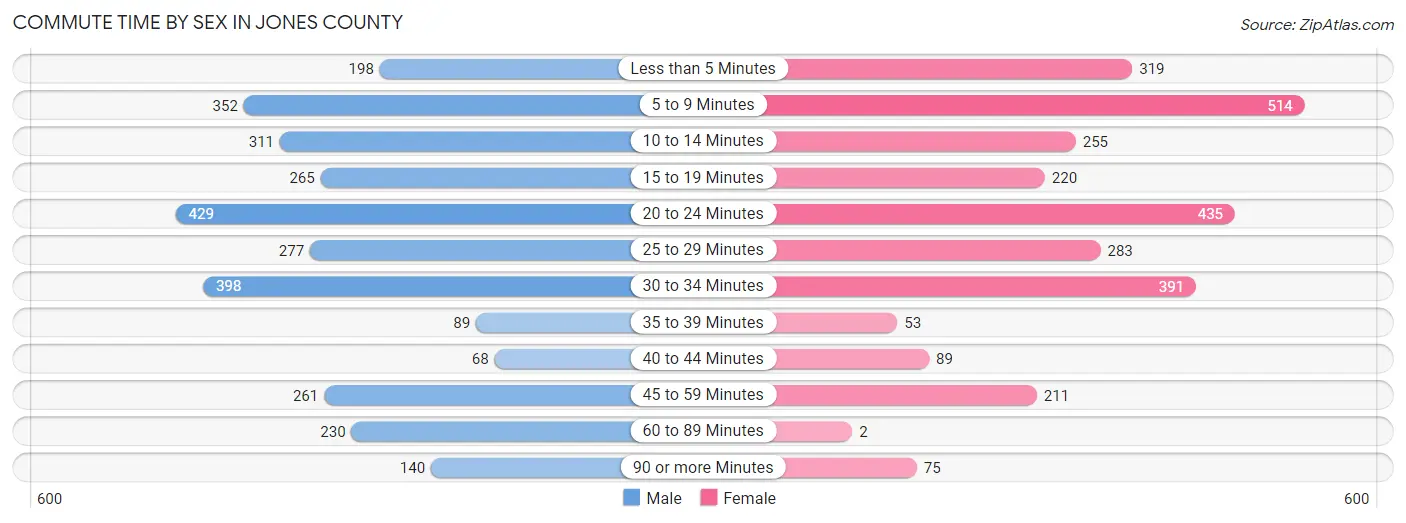
| Commute Time | Male | Female |
| Less than 5 Minutes | 198 (6.6%) | 319 (11.2%) |
| 5 to 9 Minutes | 352 (11.7%) | 514 (18.0%) |
| 10 to 14 Minutes | 311 (10.3%) | 255 (9.0%) |
| 15 to 19 Minutes | 265 (8.8%) | 220 (7.7%) |
| 20 to 24 Minutes | 429 (14.2%) | 435 (15.3%) |
| 25 to 29 Minutes | 277 (9.2%) | 283 (9.9%) |
| 30 to 34 Minutes | 398 (13.2%) | 391 (13.7%) |
| 35 to 39 Minutes | 89 (2.9%) | 53 (1.9%) |
| 40 to 44 Minutes | 68 (2.2%) | 89 (3.1%) |
| 45 to 59 Minutes | 261 (8.6%) | 211 (7.4%) |
| 60 to 89 Minutes | 230 (7.6%) | 2 (0.1%) |
| 90 or more Minutes | 140 (4.6%) | 75 (2.6%) |
Time of Departure to Work by Sex in Jones County
The most frequent times of departure to work in Jones County are 7:00 AM to 7:29 AM (528, 17.5%) for males and 7:30 AM to 7:59 AM (505, 17.7%) for females.
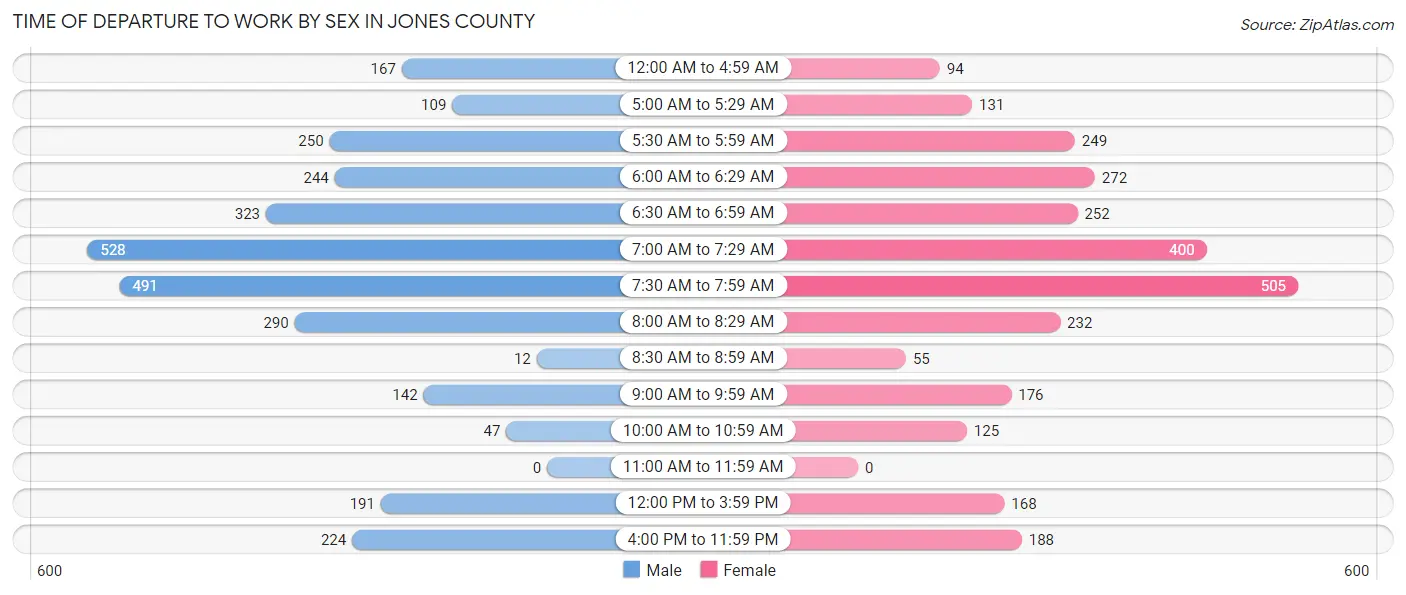
| Time of Departure | Male | Female |
| 12:00 AM to 4:59 AM | 167 (5.5%) | 94 (3.3%) |
| 5:00 AM to 5:29 AM | 109 (3.6%) | 131 (4.6%) |
| 5:30 AM to 5:59 AM | 250 (8.3%) | 249 (8.7%) |
| 6:00 AM to 6:29 AM | 244 (8.1%) | 272 (9.6%) |
| 6:30 AM to 6:59 AM | 323 (10.7%) | 252 (8.8%) |
| 7:00 AM to 7:29 AM | 528 (17.5%) | 400 (14.1%) |
| 7:30 AM to 7:59 AM | 491 (16.3%) | 505 (17.7%) |
| 8:00 AM to 8:29 AM | 290 (9.6%) | 232 (8.2%) |
| 8:30 AM to 8:59 AM | 12 (0.4%) | 55 (1.9%) |
| 9:00 AM to 9:59 AM | 142 (4.7%) | 176 (6.2%) |
| 10:00 AM to 10:59 AM | 47 (1.6%) | 125 (4.4%) |
| 11:00 AM to 11:59 AM | 0 (0.0%) | 0 (0.0%) |
| 12:00 PM to 3:59 PM | 191 (6.3%) | 168 (5.9%) |
| 4:00 PM to 11:59 PM | 224 (7.4%) | 188 (6.6%) |
| Total | 3,018 (100.0%) | 2,847 (100.0%) |
Housing Occupancy in Jones County
Occupancy by Ownership in Jones County
Of the total 5,917 dwellings in Jones County, owner-occupied units account for 4,862 (82.2%), while renter-occupied units make up 1,055 (17.8%).
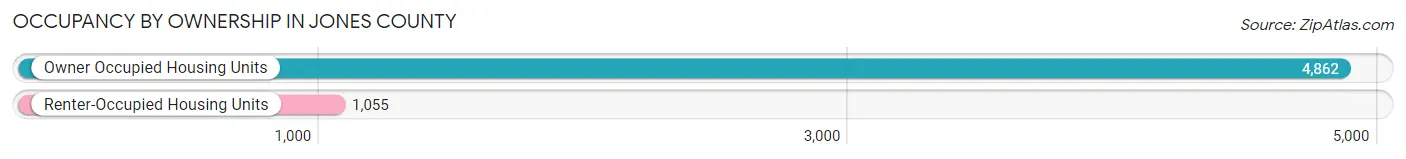
| Occupancy | # Housing Units | % Housing Units |
| Owner Occupied Housing Units | 4,862 | 82.2% |
| Renter-Occupied Housing Units | 1,055 | 17.8% |
| Total Occupied Housing Units | 5,917 | 100.0% |
Occupancy by Household Size in Jones County
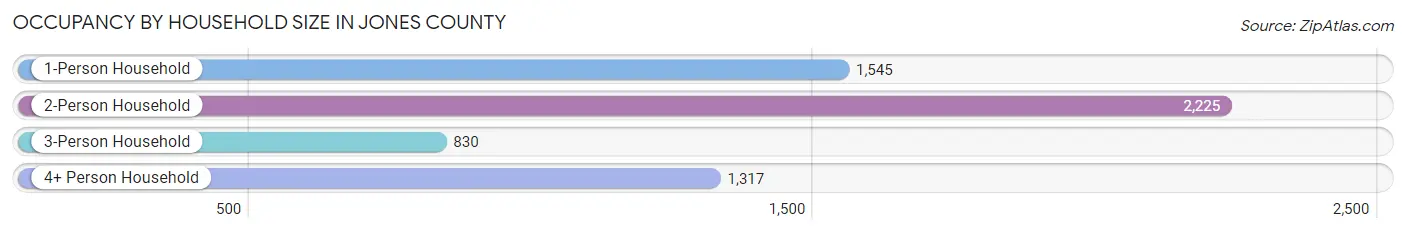
| Household Size | # Housing Units | % Housing Units |
| 1-Person Household | 1,545 | 26.1% |
| 2-Person Household | 2,225 | 37.6% |
| 3-Person Household | 830 | 14.0% |
| 4+ Person Household | 1,317 | 22.3% |
| Total Housing Units | 5,917 | 100.0% |
Occupancy by Ownership by Household Size in Jones County
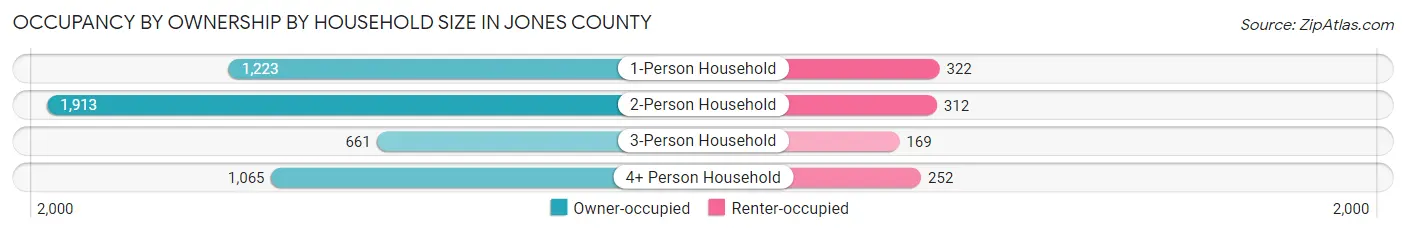
| Household Size | Owner-occupied | Renter-occupied |
| 1-Person Household | 1,223 (79.2%) | 322 (20.8%) |
| 2-Person Household | 1,913 (86.0%) | 312 (14.0%) |
| 3-Person Household | 661 (79.6%) | 169 (20.4%) |
| 4+ Person Household | 1,065 (80.9%) | 252 (19.1%) |
| Total Housing Units | 4,862 (82.2%) | 1,055 (17.8%) |
Occupancy by Educational Attainment in Jones County
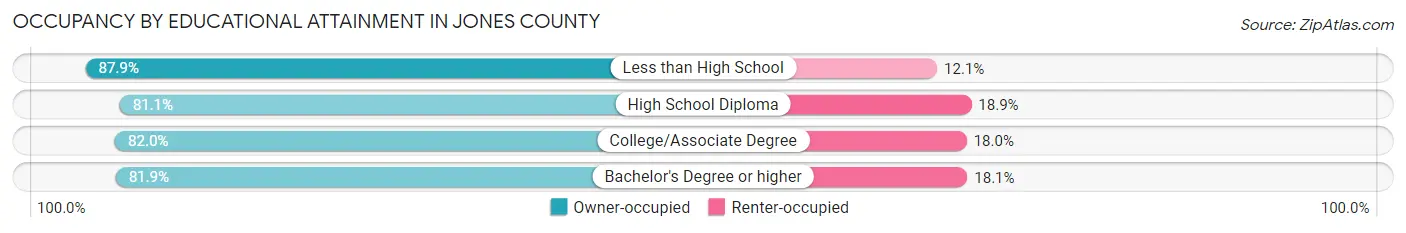
| Household Size | Owner-occupied | Renter-occupied |
| Less than High School | 429 (87.9%) | 59 (12.1%) |
| High School Diploma | 1,736 (81.1%) | 404 (18.9%) |
| College/Associate Degree | 1,854 (82.0%) | 406 (18.0%) |
| Bachelor's Degree or higher | 843 (81.9%) | 186 (18.1%) |
Occupancy by Age of Householder in Jones County
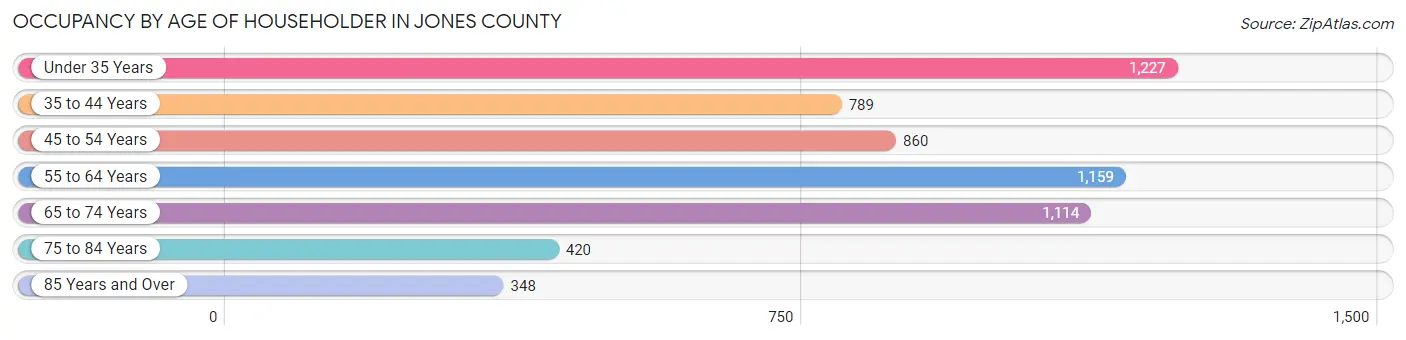
| Age Bracket | # Households | % Households |
| Under 35 Years | 1,227 | 20.7% |
| 35 to 44 Years | 789 | 13.3% |
| 45 to 54 Years | 860 | 14.5% |
| 55 to 64 Years | 1,159 | 19.6% |
| 65 to 74 Years | 1,114 | 18.8% |
| 75 to 84 Years | 420 | 7.1% |
| 85 Years and Over | 348 | 5.9% |
| Total | 5,917 | 100.0% |
Housing Finances in Jones County
Median Income by Occupancy in Jones County
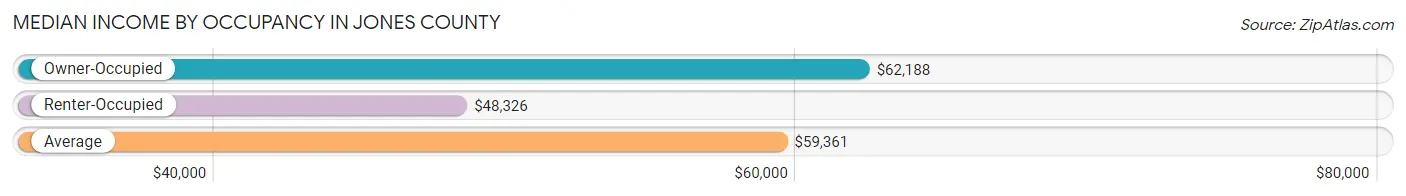
| Occupancy Type | # Households | Median Income |
| Owner-Occupied | 4,862 (82.2%) | $62,188 |
| Renter-Occupied | 1,055 (17.8%) | $48,326 |
| Average | 5,917 (100.0%) | $59,361 |
Occupancy by Householder Income Bracket in Jones County
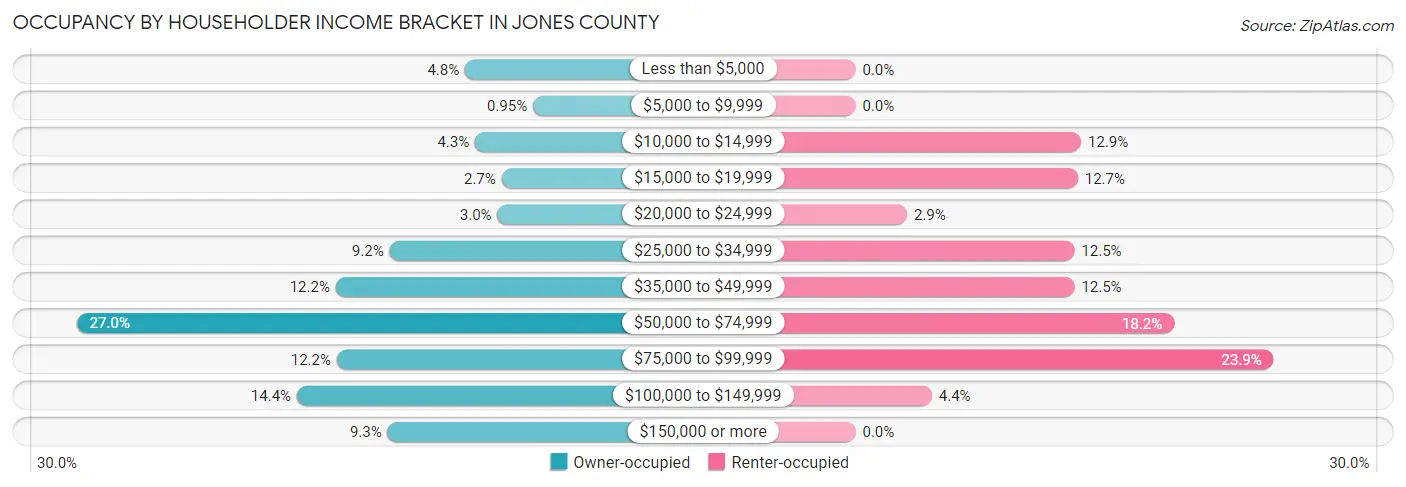
| Income Bracket | Owner-occupied | Renter-occupied |
| Less than $5,000 | 235 (4.8%) | 0 (0.0%) |
| $5,000 to $9,999 | 46 (0.9%) | 0 (0.0%) |
| $10,000 to $14,999 | 207 (4.3%) | 136 (12.9%) |
| $15,000 to $19,999 | 133 (2.7%) | 134 (12.7%) |
| $20,000 to $24,999 | 145 (3.0%) | 31 (2.9%) |
| $25,000 to $34,999 | 445 (9.1%) | 132 (12.5%) |
| $35,000 to $49,999 | 594 (12.2%) | 132 (12.5%) |
| $50,000 to $74,999 | 1,314 (27.0%) | 192 (18.2%) |
| $75,000 to $99,999 | 591 (12.2%) | 252 (23.9%) |
| $100,000 to $149,999 | 702 (14.4%) | 46 (4.4%) |
| $150,000 or more | 450 (9.3%) | 0 (0.0%) |
| Total | 4,862 (100.0%) | 1,055 (100.0%) |
Monthly Housing Cost Tiers in Jones County
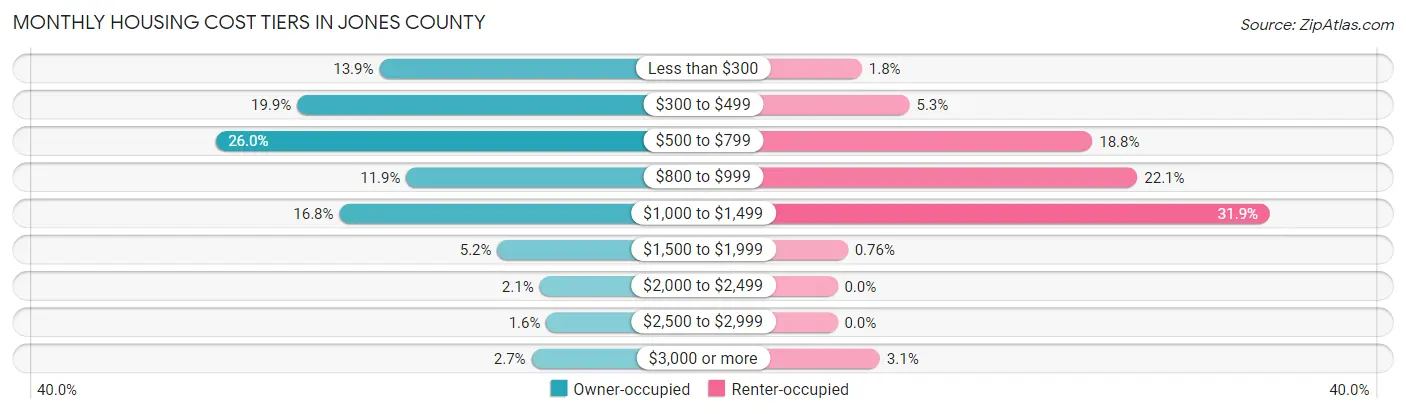
| Monthly Cost | Owner-occupied | Renter-occupied |
| Less than $300 | 675 (13.9%) | 19 (1.8%) |
| $300 to $499 | 969 (19.9%) | 56 (5.3%) |
| $500 to $799 | 1,262 (26.0%) | 198 (18.8%) |
| $800 to $999 | 578 (11.9%) | 233 (22.1%) |
| $1,000 to $1,499 | 818 (16.8%) | 336 (31.9%) |
| $1,500 to $1,999 | 252 (5.2%) | 8 (0.8%) |
| $2,000 to $2,499 | 101 (2.1%) | 0 (0.0%) |
| $2,500 to $2,999 | 77 (1.6%) | 0 (0.0%) |
| $3,000 or more | 130 (2.7%) | 33 (3.1%) |
| Total | 4,862 (100.0%) | 1,055 (100.0%) |
Physical Housing Characteristics in Jones County
Housing Structures in Jones County
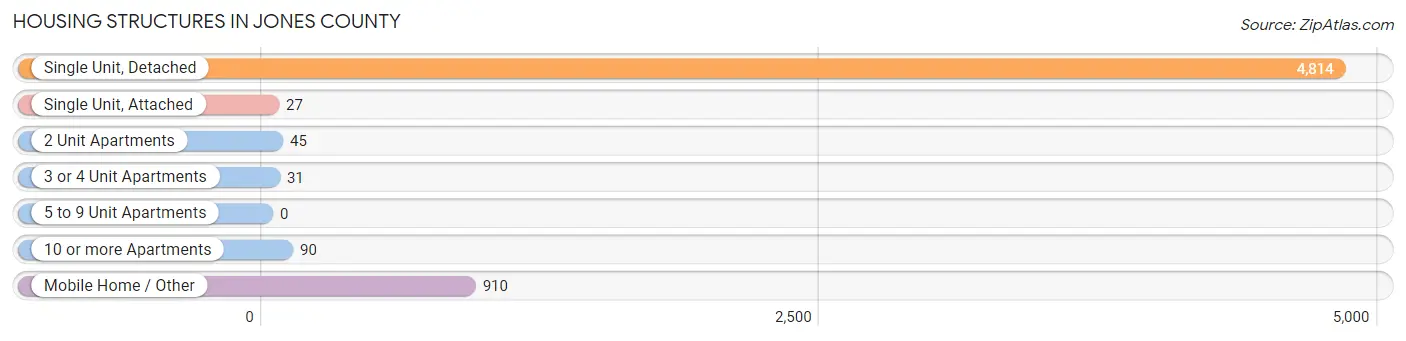
| Structure Type | # Housing Units | % Housing Units |
| Single Unit, Detached | 4,814 | 81.4% |
| Single Unit, Attached | 27 | 0.5% |
| 2 Unit Apartments | 45 | 0.8% |
| 3 or 4 Unit Apartments | 31 | 0.5% |
| 5 to 9 Unit Apartments | 0 | 0.0% |
| 10 or more Apartments | 90 | 1.5% |
| Mobile Home / Other | 910 | 15.4% |
| Total | 5,917 | 100.0% |
Housing Structures by Occupancy in Jones County
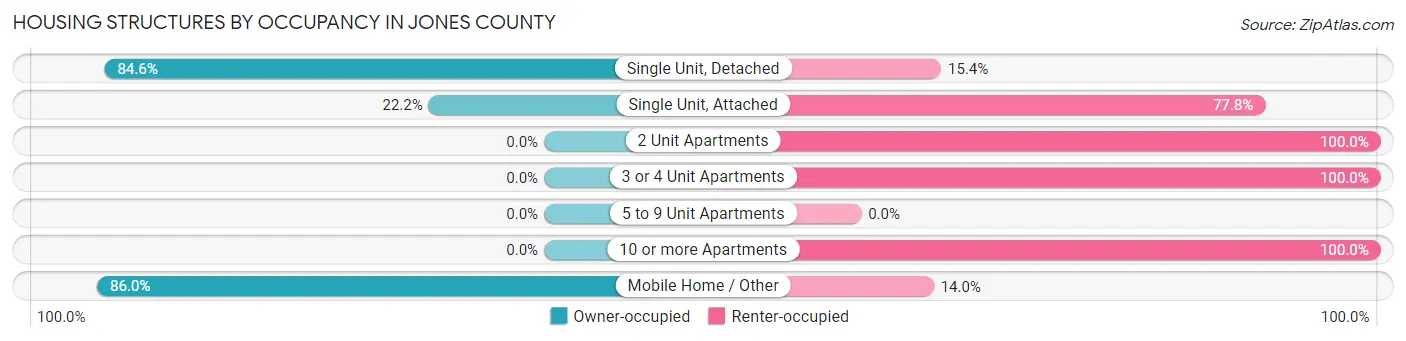
| Structure Type | Owner-occupied | Renter-occupied |
| Single Unit, Detached | 4,073 (84.6%) | 741 (15.4%) |
| Single Unit, Attached | 6 (22.2%) | 21 (77.8%) |
| 2 Unit Apartments | 0 (0.0%) | 45 (100.0%) |
| 3 or 4 Unit Apartments | 0 (0.0%) | 31 (100.0%) |
| 5 to 9 Unit Apartments | 0 (0.0%) | 0 (0.0%) |
| 10 or more Apartments | 0 (0.0%) | 90 (100.0%) |
| Mobile Home / Other | 783 (86.0%) | 127 (14.0%) |
| Total | 4,862 (82.2%) | 1,055 (17.8%) |
Housing Structures by Number of Rooms in Jones County
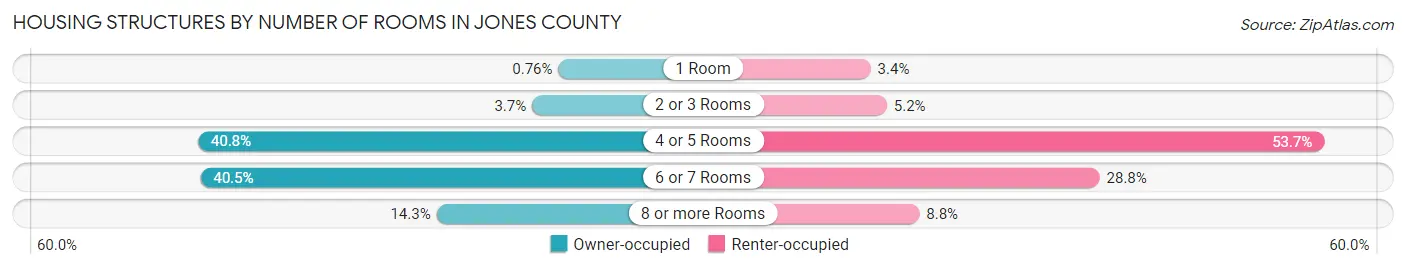
| Number of Rooms | Owner-occupied | Renter-occupied |
| 1 Room | 37 (0.8%) | 36 (3.4%) |
| 2 or 3 Rooms | 179 (3.7%) | 55 (5.2%) |
| 4 or 5 Rooms | 1,982 (40.8%) | 567 (53.7%) |
| 6 or 7 Rooms | 1,969 (40.5%) | 304 (28.8%) |
| 8 or more Rooms | 695 (14.3%) | 93 (8.8%) |
| Total | 4,862 (100.0%) | 1,055 (100.0%) |
Housing Structure by Heating Type in Jones County
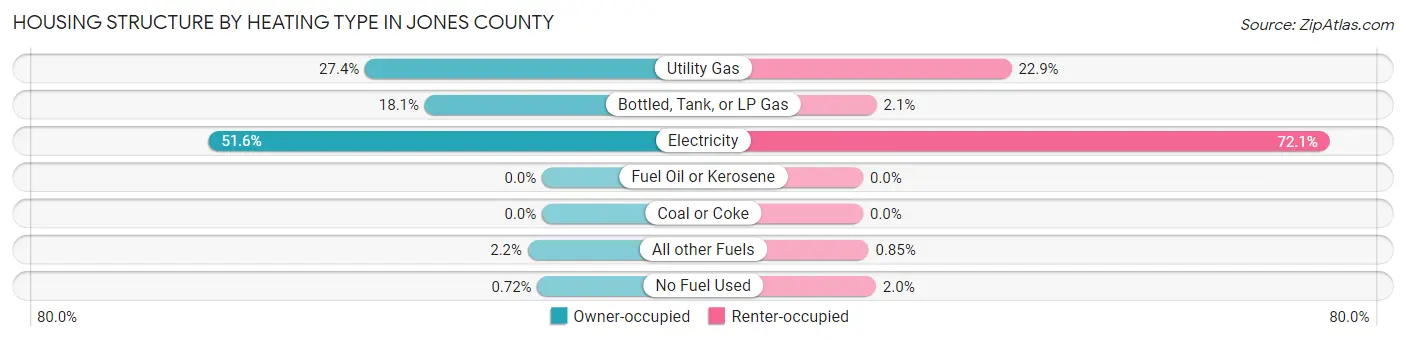
| Heating Type | Owner-occupied | Renter-occupied |
| Utility Gas | 1,330 (27.4%) | 242 (22.9%) |
| Bottled, Tank, or LP Gas | 881 (18.1%) | 22 (2.1%) |
| Electricity | 2,509 (51.6%) | 761 (72.1%) |
| Fuel Oil or Kerosene | 0 (0.0%) | 0 (0.0%) |
| Coal or Coke | 0 (0.0%) | 0 (0.0%) |
| All other Fuels | 107 (2.2%) | 9 (0.9%) |
| No Fuel Used | 35 (0.7%) | 21 (2.0%) |
| Total | 4,862 (100.0%) | 1,055 (100.0%) |
Household Vehicle Usage in Jones County
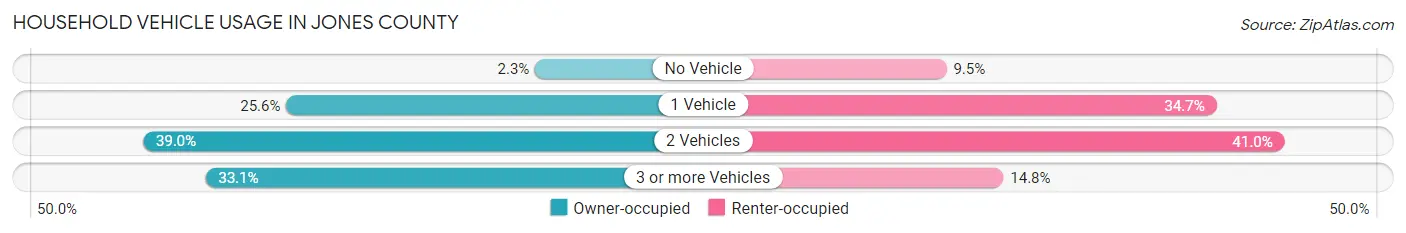
| Vehicles per Household | Owner-occupied | Renter-occupied |
| No Vehicle | 114 (2.3%) | 100 (9.5%) |
| 1 Vehicle | 1,243 (25.6%) | 366 (34.7%) |
| 2 Vehicles | 1,894 (39.0%) | 433 (41.0%) |
| 3 or more Vehicles | 1,611 (33.1%) | 156 (14.8%) |
| Total | 4,862 (100.0%) | 1,055 (100.0%) |
Real Estate & Mortgages in Jones County
Real Estate and Mortgage Overview in Jones County
| Characteristic | Without Mortgage | With Mortgage |
| Housing Units | 3,054 | 1,808 |
| Median Property Value | $76,900 | $109,200 |
| Median Household Income | $51,353 | $300 |
| Monthly Housing Costs | $485 | $130 |
| Real Estate Taxes | $1,203 | $65 |
Property Value by Mortgage Status in Jones County
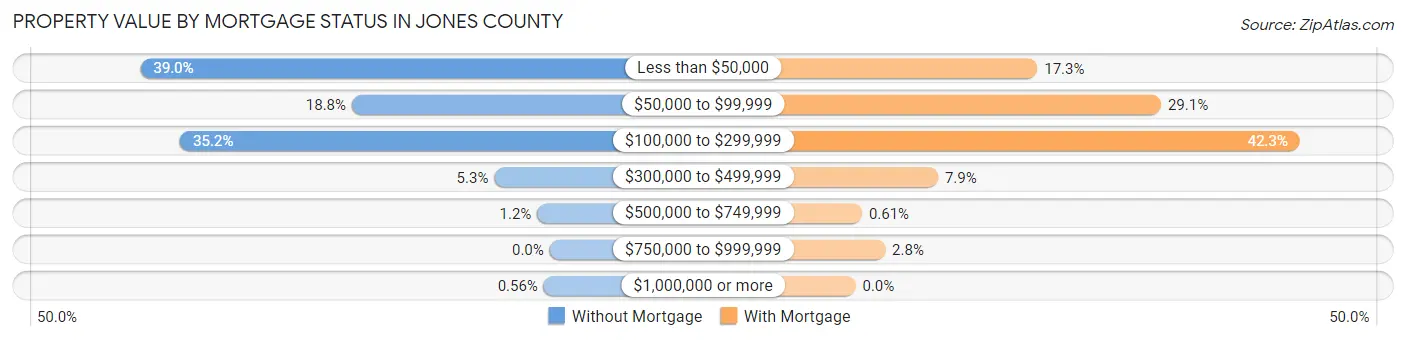
| Property Value | Without Mortgage | With Mortgage |
| Less than $50,000 | 1,190 (39.0%) | 313 (17.3%) |
| $50,000 to $99,999 | 575 (18.8%) | 526 (29.1%) |
| $100,000 to $299,999 | 1,075 (35.2%) | 765 (42.3%) |
| $300,000 to $499,999 | 161 (5.3%) | 142 (7.9%) |
| $500,000 to $749,999 | 36 (1.2%) | 11 (0.6%) |
| $750,000 to $999,999 | 0 (0.0%) | 51 (2.8%) |
| $1,000,000 or more | 17 (0.6%) | 0 (0.0%) |
| Total | 3,054 (100.0%) | 1,808 (100.0%) |
Household Income by Mortgage Status in Jones County
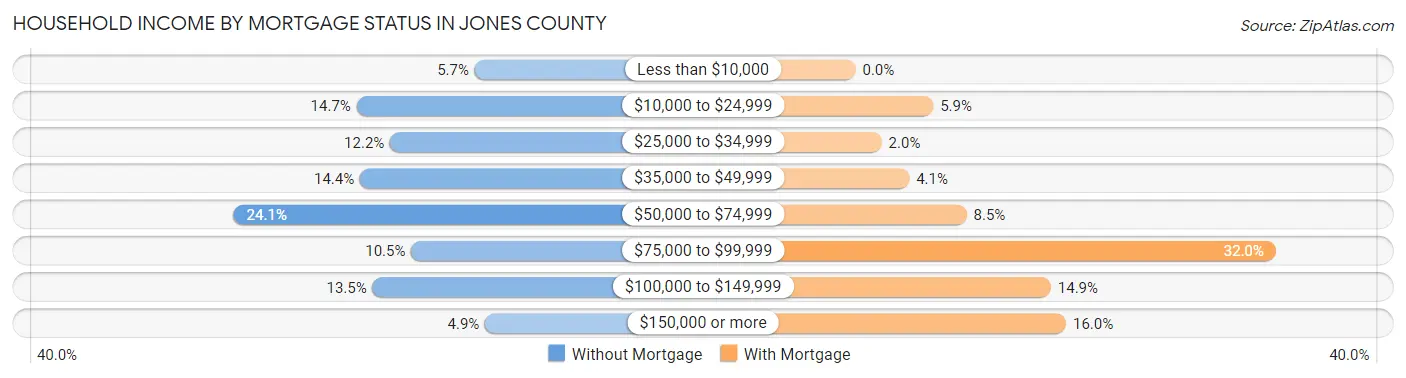
| Household Income | Without Mortgage | With Mortgage |
| Less than $10,000 | 174 (5.7%) | 0 (0.0%) |
| $10,000 to $24,999 | 449 (14.7%) | 107 (5.9%) |
| $25,000 to $34,999 | 371 (12.1%) | 36 (2.0%) |
| $35,000 to $49,999 | 441 (14.4%) | 74 (4.1%) |
| $50,000 to $74,999 | 735 (24.1%) | 153 (8.5%) |
| $75,000 to $99,999 | 322 (10.5%) | 579 (32.0%) |
| $100,000 to $149,999 | 412 (13.5%) | 269 (14.9%) |
| $150,000 or more | 150 (4.9%) | 290 (16.0%) |
| Total | 3,054 (100.0%) | 1,808 (100.0%) |
Property Value to Household Income Ratio in Jones County
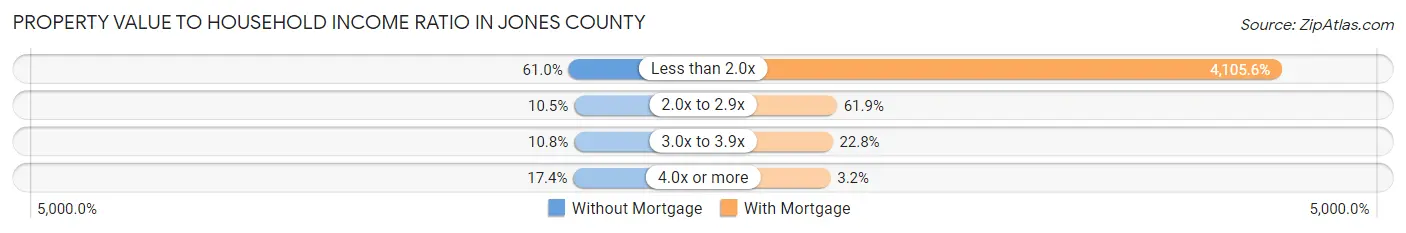
| Value-to-Income Ratio | Without Mortgage | With Mortgage |
| Less than 2.0x | 1,863 (61.0%) | 74,229 (4,105.6%) |
| 2.0x to 2.9x | 322 (10.5%) | 1,119 (61.9%) |
| 3.0x to 3.9x | 329 (10.8%) | 413 (22.8%) |
| 4.0x or more | 531 (17.4%) | 58 (3.2%) |
| Total | 3,054 (100.0%) | 1,808 (100.0%) |
Real Estate Taxes by Mortgage Status in Jones County
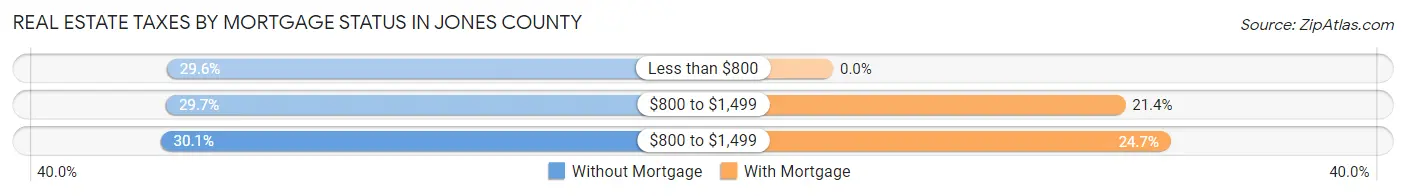
| Property Taxes | Without Mortgage | With Mortgage |
| Less than $800 | 904 (29.6%) | 0 (0.0%) |
| $800 to $1,499 | 906 (29.7%) | 386 (21.3%) |
| $800 to $1,499 | 918 (30.1%) | 446 (24.7%) |
| Total | 3,054 (100.0%) | 1,808 (100.0%) |
Health & Disability in Jones County
Health Insurance Coverage by Age in Jones County
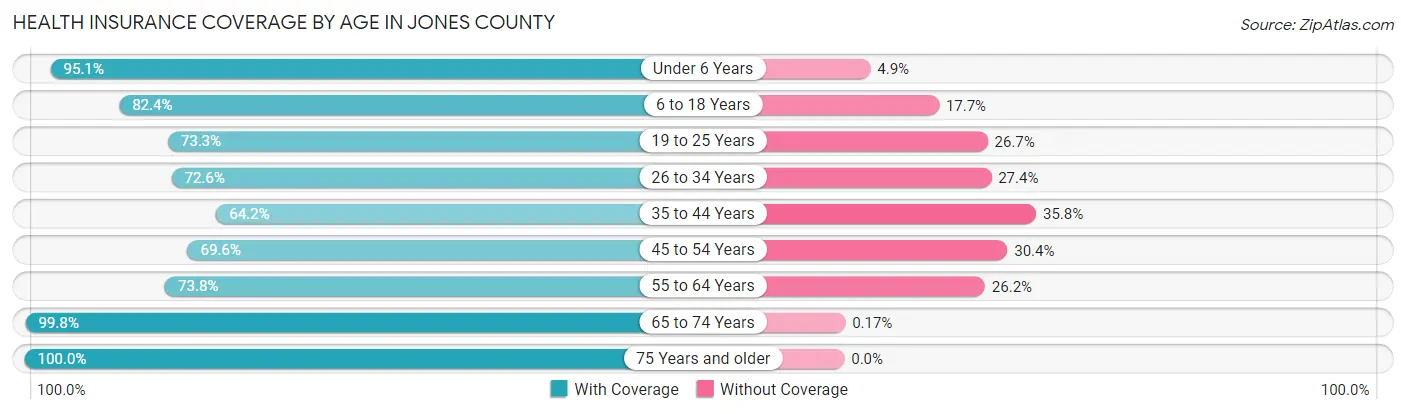
| Age Bracket | With Coverage | Without Coverage |
| Under 6 Years | 822 (95.1%) | 42 (4.9%) |
| 6 to 18 Years | 2,034 (82.4%) | 436 (17.6%) |
| 19 to 25 Years | 905 (73.3%) | 330 (26.7%) |
| 26 to 34 Years | 959 (72.6%) | 362 (27.4%) |
| 35 to 44 Years | 873 (64.2%) | 486 (35.8%) |
| 45 to 54 Years | 1,131 (69.6%) | 494 (30.4%) |
| 55 to 64 Years | 1,314 (73.8%) | 467 (26.2%) |
| 65 to 74 Years | 1,772 (99.8%) | 3 (0.2%) |
| 75 Years and older | 1,162 (100.0%) | 0 (0.0%) |
| Total | 10,972 (80.7%) | 2,620 (19.3%) |
Health Insurance Coverage by Citizenship Status in Jones County
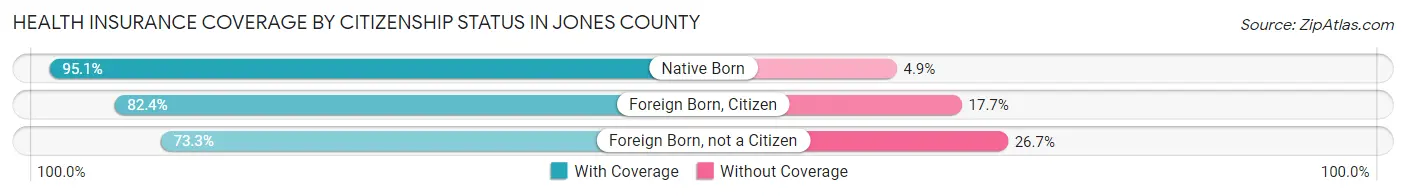
| Citizenship Status | With Coverage | Without Coverage |
| Native Born | 822 (95.1%) | 42 (4.9%) |
| Foreign Born, Citizen | 2,034 (82.4%) | 436 (17.6%) |
| Foreign Born, not a Citizen | 905 (73.3%) | 330 (26.7%) |
Health Insurance Coverage by Household Income in Jones County
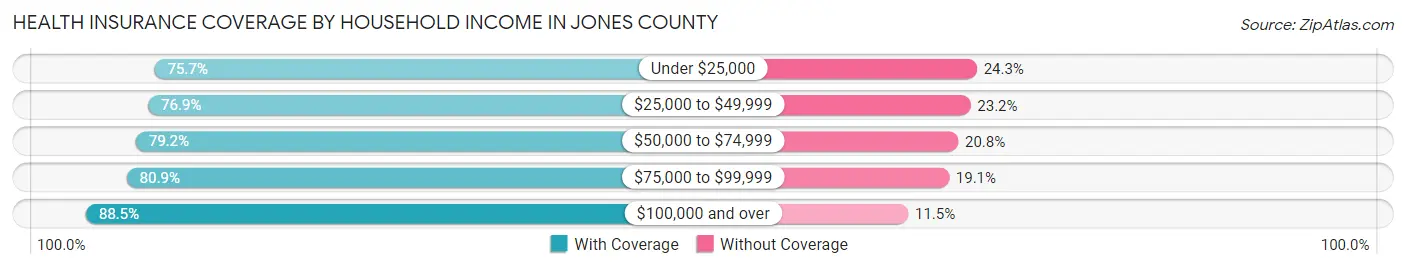
| Household Income | With Coverage | Without Coverage |
| Under $25,000 | 1,200 (75.7%) | 386 (24.3%) |
| $25,000 to $49,999 | 2,407 (76.8%) | 725 (23.2%) |
| $50,000 to $74,999 | 2,590 (79.2%) | 682 (20.8%) |
| $75,000 to $99,999 | 1,755 (80.9%) | 415 (19.1%) |
| $100,000 and over | 2,973 (88.5%) | 385 (11.5%) |
Public vs Private Health Insurance Coverage by Age in Jones County
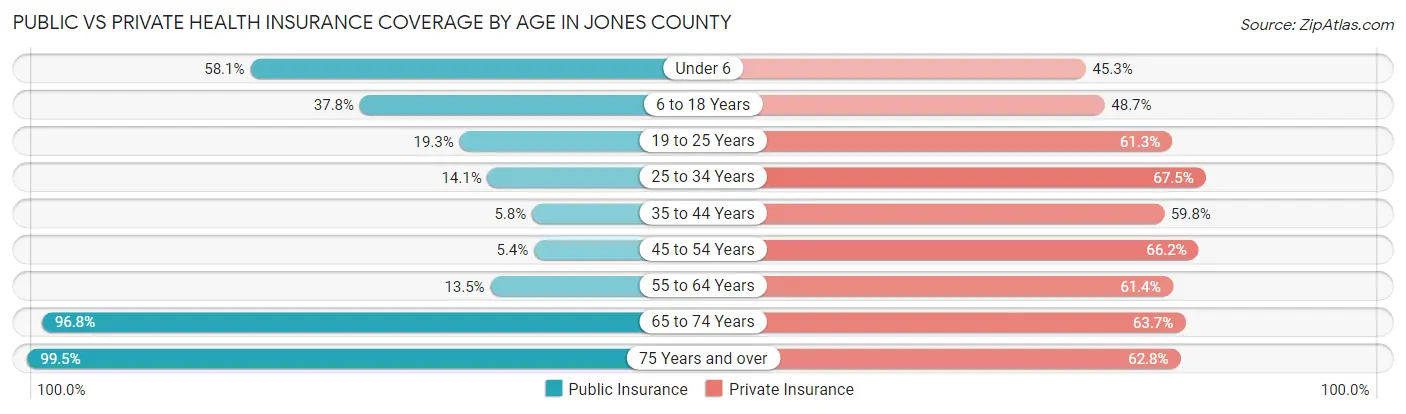
| Age Bracket | Public Insurance | Private Insurance |
| Under 6 | 502 (58.1%) | 391 (45.3%) |
| 6 to 18 Years | 933 (37.8%) | 1,204 (48.7%) |
| 19 to 25 Years | 238 (19.3%) | 757 (61.3%) |
| 25 to 34 Years | 186 (14.1%) | 892 (67.5%) |
| 35 to 44 Years | 79 (5.8%) | 812 (59.8%) |
| 45 to 54 Years | 88 (5.4%) | 1,076 (66.2%) |
| 55 to 64 Years | 241 (13.5%) | 1,093 (61.4%) |
| 65 to 74 Years | 1,718 (96.8%) | 1,131 (63.7%) |
| 75 Years and over | 1,156 (99.5%) | 730 (62.8%) |
| Total | 5,141 (37.8%) | 8,086 (59.5%) |
Disability Status by Sex by Age in Jones County
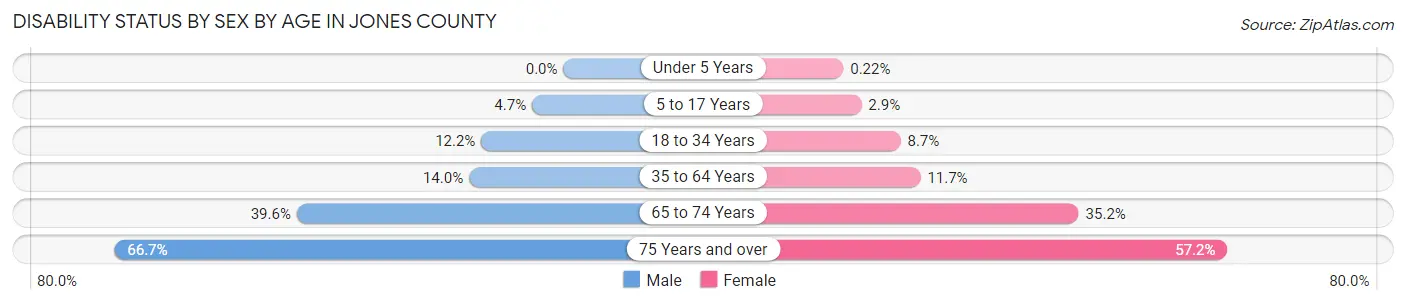
| Age Bracket | Male | Female |
| Under 5 Years | 0 (0.0%) | 1 (0.2%) |
| 5 to 17 Years | 58 (4.7%) | 35 (2.9%) |
| 18 to 34 Years | 165 (12.2%) | 115 (8.7%) |
| 35 to 64 Years | 303 (14.0%) | 304 (11.7%) |
| 65 to 74 Years | 365 (39.6%) | 300 (35.2%) |
| 75 Years and over | 374 (66.7%) | 344 (57.2%) |
Disability Class by Sex by Age in Jones County
Disability Class: Hearing Difficulty
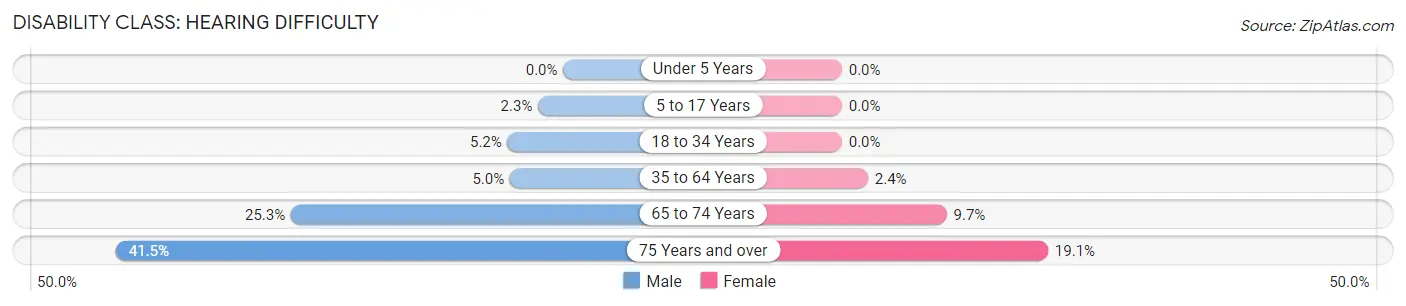
| Age Bracket | Male | Female |
| Under 5 Years | 0 (0.0%) | 0 (0.0%) |
| 5 to 17 Years | 29 (2.3%) | 0 (0.0%) |
| 18 to 34 Years | 70 (5.2%) | 0 (0.0%) |
| 35 to 64 Years | 107 (5.0%) | 63 (2.4%) |
| 65 to 74 Years | 233 (25.3%) | 83 (9.7%) |
| 75 Years and over | 233 (41.5%) | 115 (19.1%) |
Disability Class: Vision Difficulty
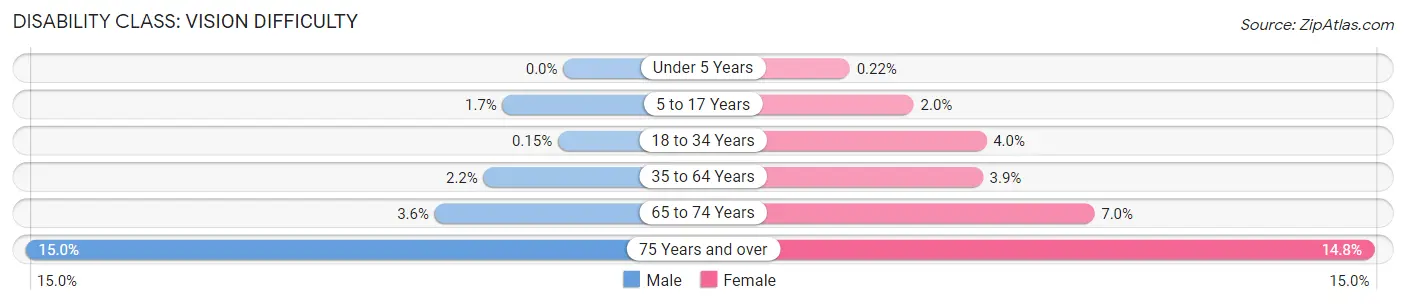
| Age Bracket | Male | Female |
| Under 5 Years | 0 (0.0%) | 1 (0.2%) |
| 5 to 17 Years | 21 (1.7%) | 24 (2.0%) |
| 18 to 34 Years | 2 (0.2%) | 53 (4.0%) |
| 35 to 64 Years | 48 (2.2%) | 102 (3.9%) |
| 65 to 74 Years | 33 (3.6%) | 60 (7.0%) |
| 75 Years and over | 84 (15.0%) | 89 (14.8%) |
Disability Class: Cognitive Difficulty
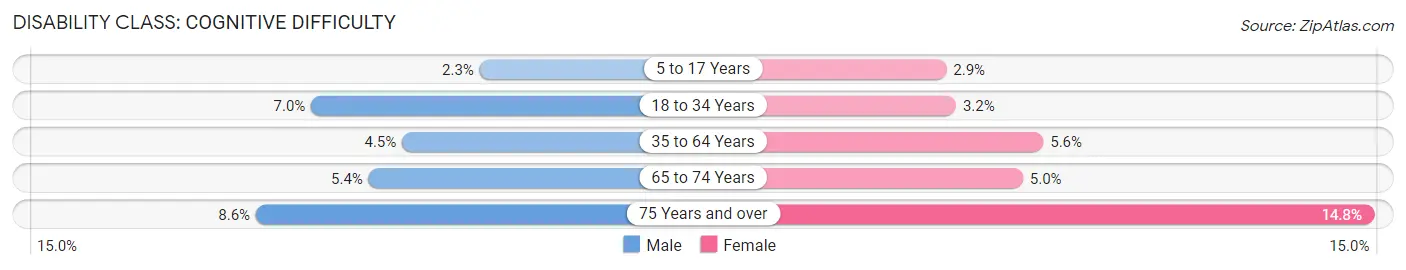
| Age Bracket | Male | Female |
| 5 to 17 Years | 29 (2.3%) | 35 (2.9%) |
| 18 to 34 Years | 95 (7.0%) | 42 (3.2%) |
| 35 to 64 Years | 97 (4.5%) | 146 (5.6%) |
| 65 to 74 Years | 50 (5.4%) | 43 (5.0%) |
| 75 Years and over | 48 (8.6%) | 89 (14.8%) |
Disability Class: Ambulatory Difficulty
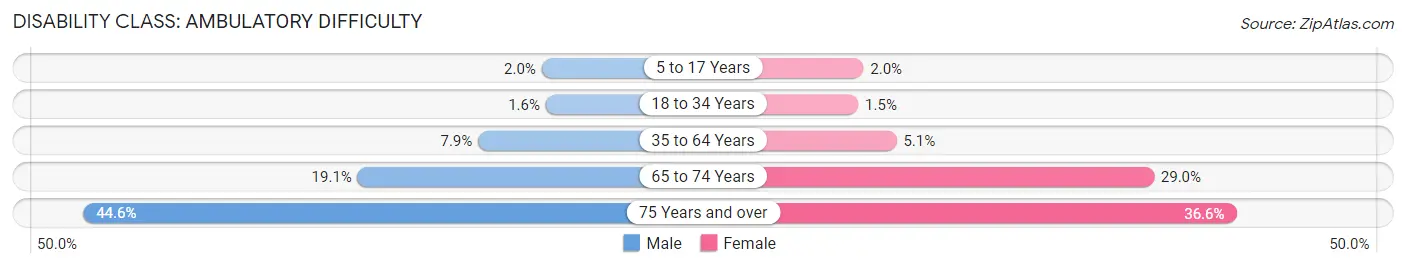
| Age Bracket | Male | Female |
| 5 to 17 Years | 25 (2.0%) | 24 (2.0%) |
| 18 to 34 Years | 22 (1.6%) | 20 (1.5%) |
| 35 to 64 Years | 171 (7.9%) | 132 (5.1%) |
| 65 to 74 Years | 176 (19.1%) | 247 (29.0%) |
| 75 Years and over | 250 (44.6%) | 220 (36.6%) |
Disability Class: Self-Care Difficulty
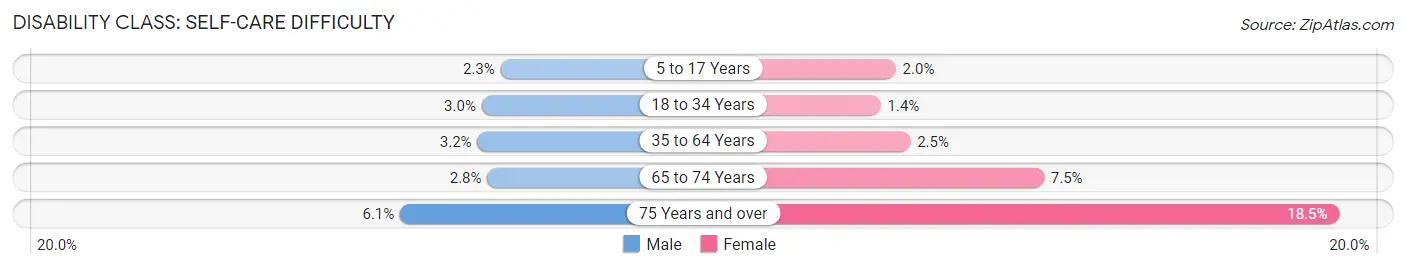
| Age Bracket | Male | Female |
| 5 to 17 Years | 29 (2.3%) | 24 (2.0%) |
| 18 to 34 Years | 41 (3.0%) | 19 (1.4%) |
| 35 to 64 Years | 69 (3.2%) | 66 (2.5%) |
| 65 to 74 Years | 26 (2.8%) | 64 (7.5%) |
| 75 Years and over | 34 (6.1%) | 111 (18.5%) |
Technology Access in Jones County
Computing Device Access in Jones County
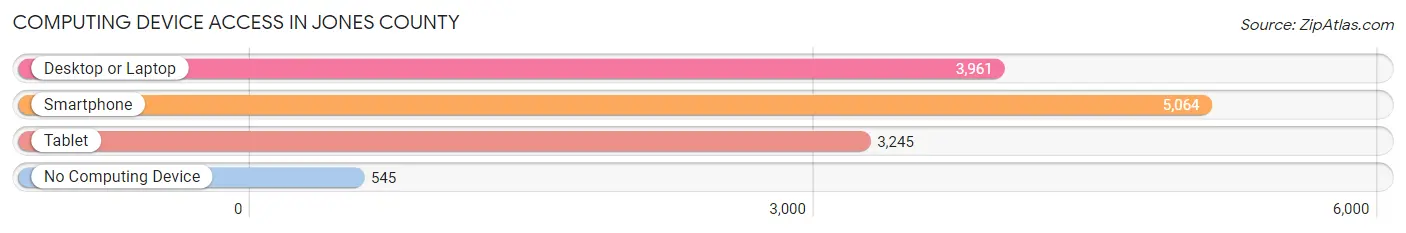
| Device Type | # Households | % Households |
| Desktop or Laptop | 3,961 | 66.9% |
| Smartphone | 5,064 | 85.6% |
| Tablet | 3,245 | 54.8% |
| No Computing Device | 545 | 9.2% |
| Total | 5,917 | 100.0% |
Internet Access in Jones County
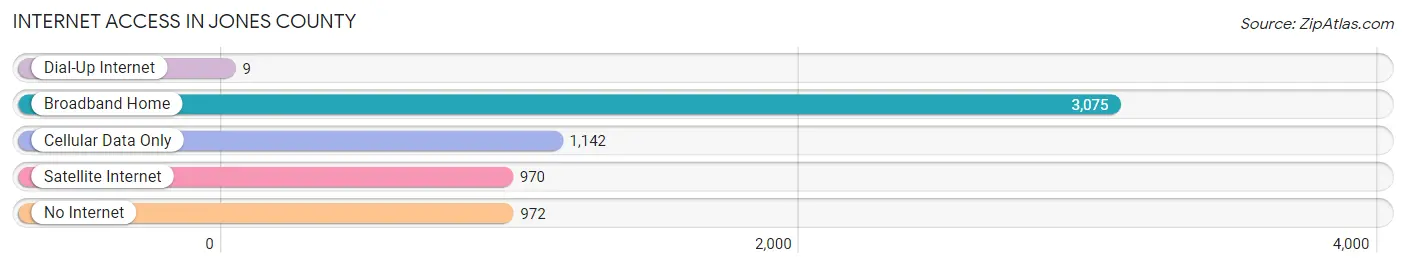
| Internet Type | # Households | % Households |
| Dial-Up Internet | 9 | 0.2% |
| Broadband Home | 3,075 | 52.0% |
| Cellular Data Only | 1,142 | 19.3% |
| Satellite Internet | 970 | 16.4% |
| No Internet | 972 | 16.4% |
| Total | 5,917 | 100.0% |
Jones County Summary
Jones County is located in the north-central region of Texas, and is part of the Abilene Metropolitan Statistical Area. The county is bordered by Fisher, Haskell, Shackelford, Taylor, and Callahan counties. The county seat is Anson, and the largest city is Abilene. As of the 2010 census, the population of Jones County was 20,202.
Geography
Jones County is located in the Rolling Plains region of Texas. The county is mostly flat, with some rolling hills in the western part of the county. The terrain is mostly covered in grasslands, with some areas of mesquite and juniper trees. The county is drained by the Clear Fork of the Brazos River, which runs through the center of the county. The county is also home to several small lakes, including Lake Fort Phantom Hill, Lake Kirby, and Lake Abilene.
The county has a total area of 902 square miles, of which 899 square miles is land and 3 square miles is water.
History
Jones County was established in 1858 and was named for Anson Jones, the last president of the Republic of Texas. The county was originally part of Bexar County, but was later divided into several smaller counties. The county seat was originally located in Hamby, but was moved to Anson in 1882.
The county was largely rural until the early 20th century, when the Santa Fe Railroad was built through the county. This led to the development of several small towns, including Abilene, which became the county seat in 1883.
Economy
The economy of Jones County is largely based on agriculture and oil and gas production. The county is home to several large ranches, and is a major producer of beef, cotton, and wheat. Oil and gas production is also a major industry in the county, and the county is home to several large oil and gas fields.
The county is also home to several manufacturing companies, including a large paper mill in Abilene. The county is also home to several retail stores, restaurants, and other businesses.
Demographics
As of the 2010 census, there were 20,202 people, 7,845 households, and 5,541 families living in Jones County. The population density was 22.4 people per square mile. The racial makeup of the county was 81.2% White, 11.7% African American, 0.7% Native American, 0.5% Asian, 0.1% Pacific Islander, 4.2% from other races, and 1.7% from two or more races. Hispanic or Latino of any race were 11.3% of the population.
The median income for a household in the county was $37,945, and the median income for a family was $45,945. The per capita income for the county was $19,845. About 15.2% of families and 19.2% of the population were below the poverty line, including 25.2% of those under age 18 and 11.7% of those age 65 or over.
Common Questions
What is Per Capita Income in Jones County?
Per Capita income in Jones County is $21,173.
What is the Median Family Income in Jones County?
Median Family Income in Jones County is $66,532.
What is the Median Household income in Jones County?
Median Household Income in Jones County is $59,361.
What is Income or Wage Gap in Jones County?
Income or Wage Gap in Jones County is 27.2%.
Women in Jones County earn 72.8 cents for every dollar earned by a man.
What is Family Income Deficit in Jones County?
Family Income Deficit in Jones County is $9,413.
Families that are below poverty line in Jones County earn $9,413 less on average than the poverty threshold level.
What is Inequality or Gini Index in Jones County?
Inequality or Gini Index in Jones County is 0.41.
What is the Total Population of Jones County?
Total Population of Jones County is 19,758.
What is the Total Male Population of Jones County?
Total Male Population of Jones County is 12,581.
What is the Total Female Population of Jones County?
Total Female Population of Jones County is 7,177.
What is the Ratio of Males per 100 Females in Jones County?
There are 175.30 Males per 100 Females in Jones County.
What is the Ratio of Females per 100 Males in Jones County?
There are 57.05 Females per 100 Males in Jones County.
What is the Median Population Age in Jones County?
Median Population Age in Jones County is 38.4 Years.
What is the Average Family Size in Jones County
Average Family Size in Jones County is 2.7 People.
What is the Average Household Size in Jones County
Average Household Size in Jones County is 2.3 People.
How Large is the Labor Force in Jones County?
There are 6,689 People in the Labor Forcein in Jones County.
What is the Percentage of People in the Labor Force in Jones County?
39.5% of People are in the Labor Force in Jones County.
What is the Unemployment Rate in Jones County?
Unemployment Rate in Jones County is 4.7%.