Jim Wells County, TX Map & Demographics
Jim Wells County Overview
$25,030
PER CAPITA INCOME
$58,764
AVG FAMILY INCOME
$46,626
AVG HOUSEHOLD INCOME
31.9%
WAGE / INCOME GAP [ % ]
68.1¢/ $1
WAGE / INCOME GAP [ $ ]
$12,679
FAMILY INCOME DEFICIT
0.47
INEQUALITY / GINI INDEX
39,060
TOTAL POPULATION
19,461
MALE POPULATION
19,599
FEMALE POPULATION
99.30
MALES / 100 FEMALES
100.71
FEMALES / 100 MALES
35.6
MEDIAN AGE
3.5
AVG FAMILY SIZE
3.0
AVG HOUSEHOLD SIZE
15,853
LABOR FORCE [ PEOPLE ]
53.7%
PERCENT IN LABOR FORCE
5.2%
UNEMPLOYMENT RATE
Jim Wells County Area Codes
Income in Jim Wells County
Income Overview in Jim Wells County
Per Capita Income in Jim Wells County is $25,030, while median incomes of families and households are $58,764 and $46,626 respectively.
| Characteristic | Number | Measure |
| Per Capita Income | 39,060 | $25,030 |
| Median Family Income | 9,761 | $58,764 |
| Mean Family Income | 9,761 | $78,931 |
| Median Household Income | 12,914 | $46,626 |
| Mean Household Income | 12,914 | $69,066 |
| Income Deficit | 9,761 | $12,679 |
| Wage / Income Gap (%) | 39,060 | 31.91% |
| Wage / Income Gap ($) | 39,060 | 68.09¢ per $1 |
| Gini / Inequality Index | 39,060 | 0.47 |
Earnings by Sex in Jim Wells County
Average Earnings in Jim Wells County are $35,367, $41,351 for men and $28,155 for women, a difference of 31.9%.
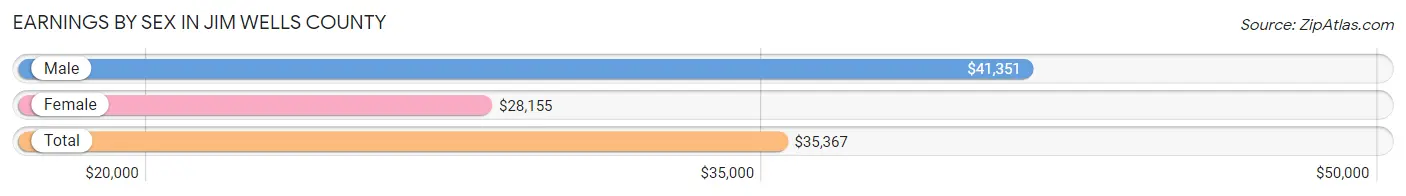
| Sex | Number | Average Earnings |
| Male | 8,752 (53.1%) | $41,351 |
| Female | 7,734 (46.9%) | $28,155 |
| Total | 16,486 (100.0%) | $35,367 |
Earnings by Sex by Income Bracket in Jim Wells County
The most common earnings brackets in Jim Wells County are $100,000+ for men (1,358 | 15.5%) and $25,000 to $29,999 for women (768 | 9.9%).
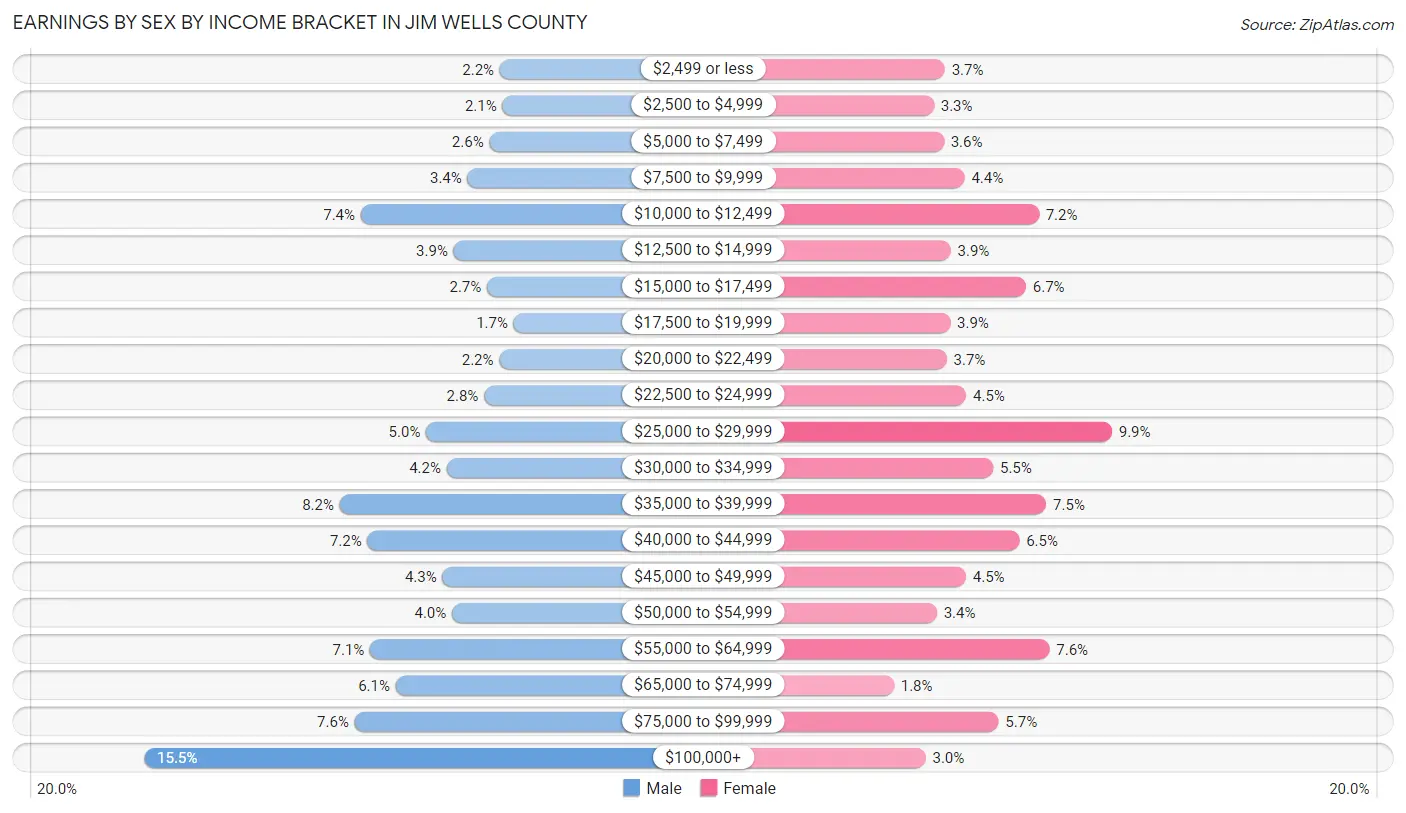
| Income | Male | Female |
| $2,499 or less | 192 (2.2%) | 284 (3.7%) |
| $2,500 to $4,999 | 183 (2.1%) | 252 (3.3%) |
| $5,000 to $7,499 | 226 (2.6%) | 281 (3.6%) |
| $7,500 to $9,999 | 298 (3.4%) | 341 (4.4%) |
| $10,000 to $12,499 | 648 (7.4%) | 556 (7.2%) |
| $12,500 to $14,999 | 343 (3.9%) | 301 (3.9%) |
| $15,000 to $17,499 | 234 (2.7%) | 519 (6.7%) |
| $17,500 to $19,999 | 146 (1.7%) | 299 (3.9%) |
| $20,000 to $22,499 | 193 (2.2%) | 289 (3.7%) |
| $22,500 to $24,999 | 243 (2.8%) | 346 (4.5%) |
| $25,000 to $29,999 | 433 (5.0%) | 768 (9.9%) |
| $30,000 to $34,999 | 366 (4.2%) | 424 (5.5%) |
| $35,000 to $39,999 | 717 (8.2%) | 578 (7.5%) |
| $40,000 to $44,999 | 626 (7.1%) | 500 (6.5%) |
| $45,000 to $49,999 | 380 (4.3%) | 345 (4.5%) |
| $50,000 to $54,999 | 348 (4.0%) | 261 (3.4%) |
| $55,000 to $64,999 | 617 (7.0%) | 587 (7.6%) |
| $65,000 to $74,999 | 533 (6.1%) | 136 (1.8%) |
| $75,000 to $99,999 | 668 (7.6%) | 439 (5.7%) |
| $100,000+ | 1,358 (15.5%) | 228 (2.9%) |
| Total | 8,752 (100.0%) | 7,734 (100.0%) |
Earnings by Sex by Educational Attainment in Jim Wells County
Average earnings in Jim Wells County are $44,976 for men and $29,008 for women, a difference of 35.5%. Men with an educational attainment of bachelor's degree enjoy the highest average annual earnings of $71,463, while those with less than high school education earn the least with $36,108. Women with an educational attainment of graduate degree earn the most with the average annual earnings of $62,552, while those with less than high school education have the smallest earnings of $17,083.
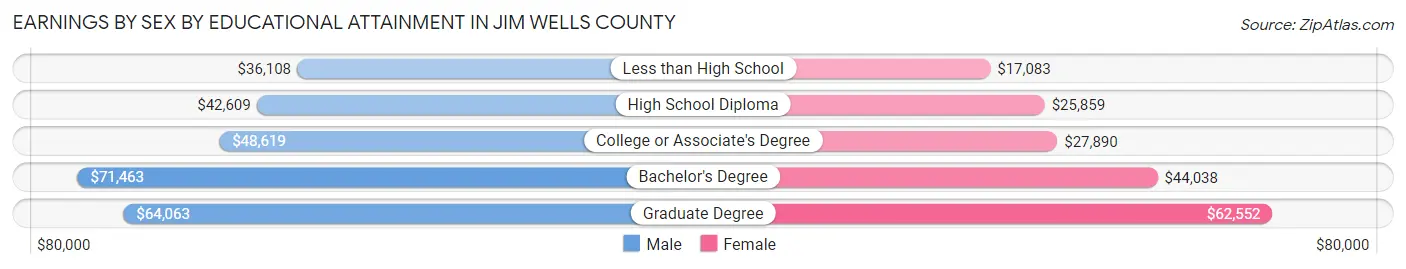
| Educational Attainment | Male Income | Female Income |
| Less than High School | $36,108 | $17,083 |
| High School Diploma | $42,609 | $25,859 |
| College or Associate's Degree | $48,619 | $27,890 |
| Bachelor's Degree | $71,463 | $44,038 |
| Graduate Degree | $64,063 | $62,552 |
| Total | $44,976 | $29,008 |
Family Income in Jim Wells County
Family Income Brackets in Jim Wells County
According to the Jim Wells County family income data, there are 1,728 families falling into the $35,000 to $49,999 income range, which is the most common income bracket and makes up 17.7% of all families. Conversely, the $10,000 to $14,999 income bracket is the least frequent group with only 361 families (3.7%) belonging to this category.
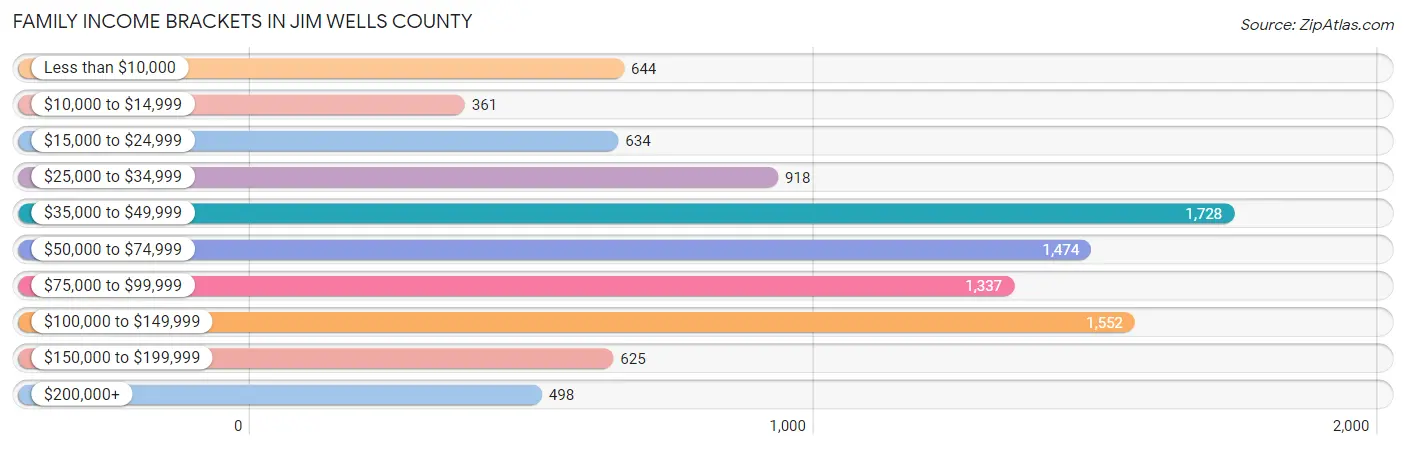
| Income Bracket | # Families | % Families |
| Less than $10,000 | 644 | 6.6% |
| $10,000 to $14,999 | 361 | 3.7% |
| $15,000 to $24,999 | 634 | 6.5% |
| $25,000 to $34,999 | 918 | 9.4% |
| $35,000 to $49,999 | 1,728 | 17.7% |
| $50,000 to $74,999 | 1,474 | 15.1% |
| $75,000 to $99,999 | 1,337 | 13.7% |
| $100,000 to $149,999 | 1,552 | 15.9% |
| $150,000 to $199,999 | 625 | 6.4% |
| $200,000+ | 498 | 5.1% |
Family Income by Famaliy Size in Jim Wells County
5-person families (1,258 | 12.9%) account for the highest median family income in Jim Wells County with $98,764 per family, while 2-person families (3,951 | 40.5%) have the highest median income of $26,854 per family member.
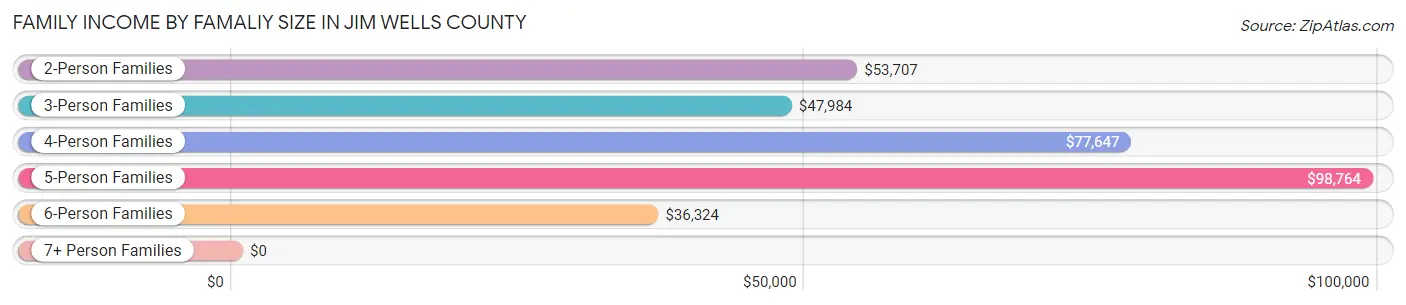
| Income Bracket | # Families | Median Income |
| 2-Person Families | 3,951 (40.5%) | $53,707 |
| 3-Person Families | 2,220 (22.7%) | $47,984 |
| 4-Person Families | 1,516 (15.5%) | $77,647 |
| 5-Person Families | 1,258 (12.9%) | $98,764 |
| 6-Person Families | 525 (5.4%) | $36,324 |
| 7+ Person Families | 291 (3.0%) | $0 |
| Total | 9,761 (100.0%) | $58,764 |
Family Income by Number of Earners in Jim Wells County
The median family income in Jim Wells County is $58,764, with families comprising 3+ earners (798) having the highest median family income of $128,561, while families with no earners (1,565) have the lowest median family income of $36,223, accounting for 8.2% and 16.0% of families, respectively.
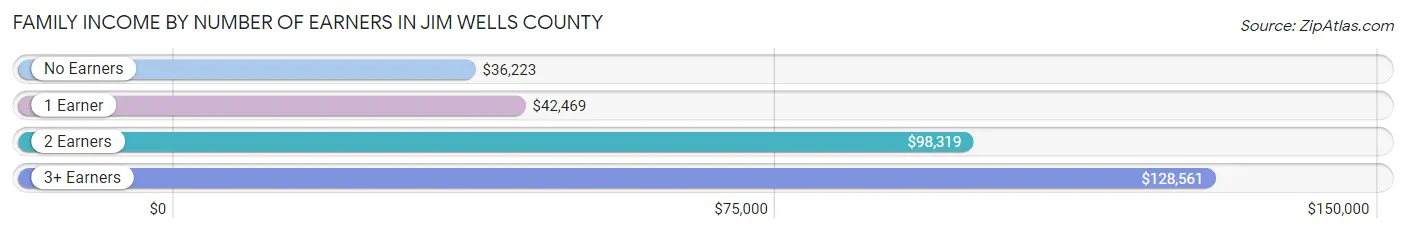
| Number of Earners | # Families | Median Income |
| No Earners | 1,565 (16.0%) | $36,223 |
| 1 Earner | 4,507 (46.2%) | $42,469 |
| 2 Earners | 2,891 (29.6%) | $98,319 |
| 3+ Earners | 798 (8.2%) | $128,561 |
| Total | 9,761 (100.0%) | $58,764 |
Household Income in Jim Wells County
Household Income Brackets in Jim Wells County
With 2,079 households falling in the category, the $35,000 to $49,999 income range is the most frequent in Jim Wells County, accounting for 16.1% of all households. In contrast, only 529 households (4.1%) fall into the $200,000+ income bracket, making it the least populous group.
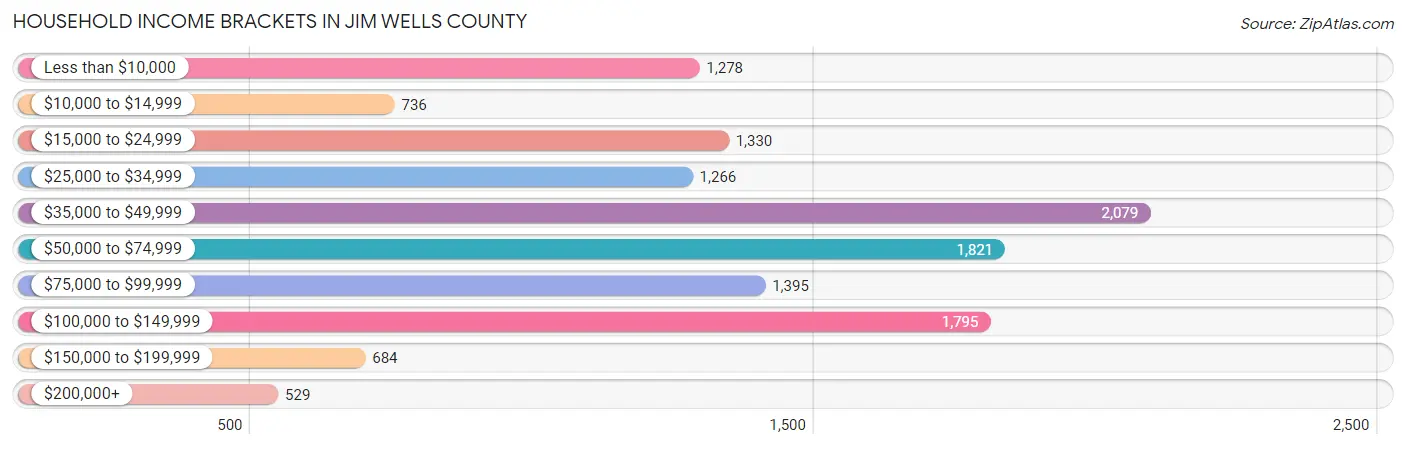
| Income Bracket | # Households | % Households |
| Less than $10,000 | 1,278 | 9.9% |
| $10,000 to $14,999 | 736 | 5.7% |
| $15,000 to $24,999 | 1,330 | 10.3% |
| $25,000 to $34,999 | 1,266 | 9.8% |
| $35,000 to $49,999 | 2,079 | 16.1% |
| $50,000 to $74,999 | 1,821 | 14.1% |
| $75,000 to $99,999 | 1,395 | 10.8% |
| $100,000 to $149,999 | 1,795 | 13.9% |
| $150,000 to $199,999 | 684 | 5.3% |
| $200,000+ | 529 | 4.1% |
Household Income by Householder Age in Jim Wells County
The median household income in Jim Wells County is $46,626, with the highest median household income of $58,228 found in the 45 to 64 years age bracket for the primary householder. A total of 4,668 households (36.1%) fall into this category. Meanwhile, the 15 to 24 years age bracket for the primary householder has the lowest median household income of $28,277, with 397 households (3.1%) in this group.
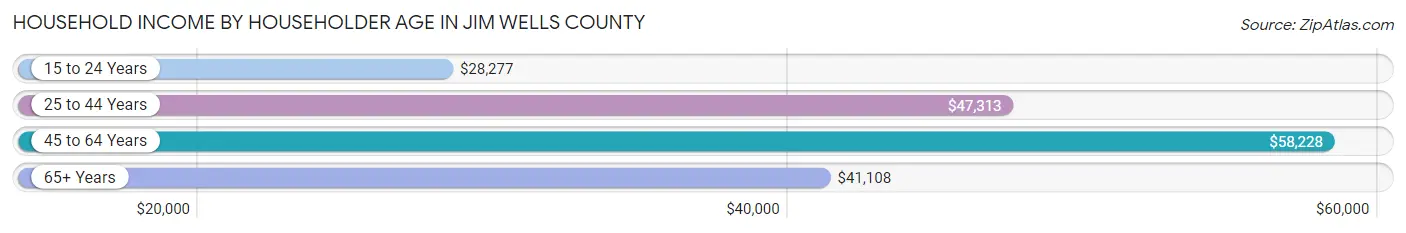
| Income Bracket | # Households | Median Income |
| 15 to 24 Years | 397 (3.1%) | $28,277 |
| 25 to 44 Years | 4,245 (32.9%) | $47,313 |
| 45 to 64 Years | 4,668 (36.1%) | $58,228 |
| 65+ Years | 3,604 (27.9%) | $41,108 |
| Total | 12,914 (100.0%) | $46,626 |
Poverty in Jim Wells County
Income Below Poverty by Sex and Age in Jim Wells County
With 18.7% poverty level for males and 26.6% for females among the residents of Jim Wells County, 16 and 17 year old males and 15 year old females are the most vulnerable to poverty, with 225 males (42.3%) and 283 females (75.9%) in their respective age groups living below the poverty level.
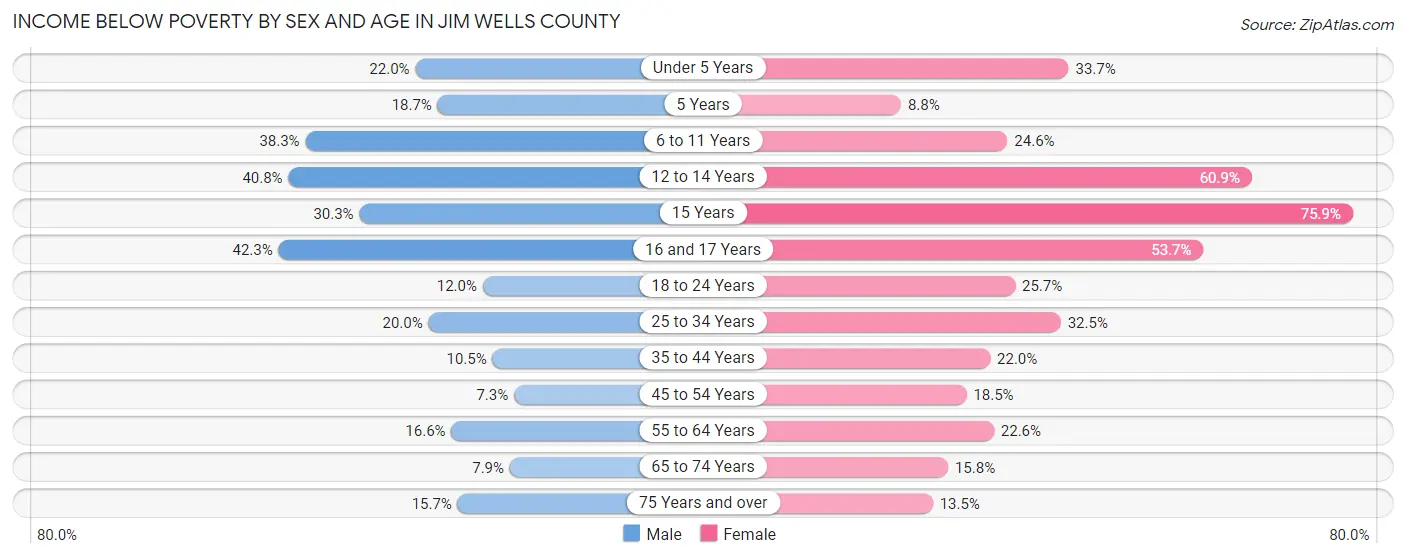
| Age Bracket | Male | Female |
| Under 5 Years | 283 (22.0%) | 463 (33.7%) |
| 5 Years | 53 (18.7%) | 16 (8.8%) |
| 6 to 11 Years | 707 (38.3%) | 469 (24.6%) |
| 12 to 14 Years | 398 (40.8%) | 501 (60.9%) |
| 15 Years | 119 (30.3%) | 283 (75.9%) |
| 16 and 17 Years | 225 (42.3%) | 256 (53.7%) |
| 18 to 24 Years | 225 (12.0%) | 454 (25.7%) |
| 25 to 34 Years | 502 (20.0%) | 775 (32.5%) |
| 35 to 44 Years | 268 (10.5%) | 548 (22.0%) |
| 45 to 54 Years | 150 (7.3%) | 396 (18.5%) |
| 55 to 64 Years | 366 (16.6%) | 503 (22.6%) |
| 65 to 74 Years | 136 (7.9%) | 288 (15.8%) |
| 75 Years and over | 161 (15.7%) | 186 (13.5%) |
| Total | 3,593 (18.7%) | 5,138 (26.6%) |
Income Above Poverty by Sex and Age in Jim Wells County
According to the poverty statistics in Jim Wells County, males aged 45 to 54 years and females aged 5 years are the age groups that are most secure financially, with 92.7% of males and 91.2% of females in these age groups living above the poverty line.
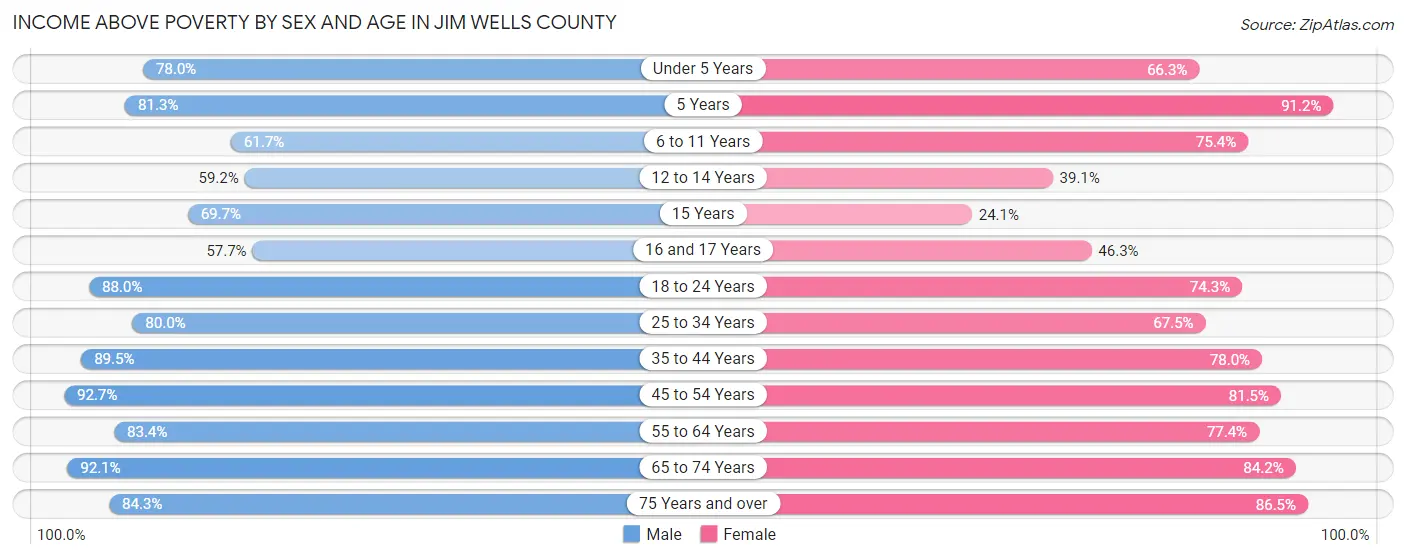
| Age Bracket | Male | Female |
| Under 5 Years | 1,005 (78.0%) | 912 (66.3%) |
| 5 Years | 231 (81.3%) | 166 (91.2%) |
| 6 to 11 Years | 1,139 (61.7%) | 1,438 (75.4%) |
| 12 to 14 Years | 577 (59.2%) | 322 (39.1%) |
| 15 Years | 274 (69.7%) | 90 (24.1%) |
| 16 and 17 Years | 307 (57.7%) | 221 (46.3%) |
| 18 to 24 Years | 1,656 (88.0%) | 1,311 (74.3%) |
| 25 to 34 Years | 2,006 (80.0%) | 1,609 (67.5%) |
| 35 to 44 Years | 2,283 (89.5%) | 1,941 (78.0%) |
| 45 to 54 Years | 1,899 (92.7%) | 1,743 (81.5%) |
| 55 to 64 Years | 1,836 (83.4%) | 1,725 (77.4%) |
| 65 to 74 Years | 1,577 (92.1%) | 1,538 (84.2%) |
| 75 Years and over | 865 (84.3%) | 1,192 (86.5%) |
| Total | 15,655 (81.3%) | 14,208 (73.4%) |
Income Below Poverty Among Married-Couple Families in Jim Wells County
The poverty statistics for married-couple families in Jim Wells County show that 8.9% or 591 of the total 6,612 families live below the poverty line. Families with 5 or more children have the highest poverty rate of 45.2%, comprising of 52 families. On the other hand, families with no children have the lowest poverty rate of 4.6%, which includes 165 families.
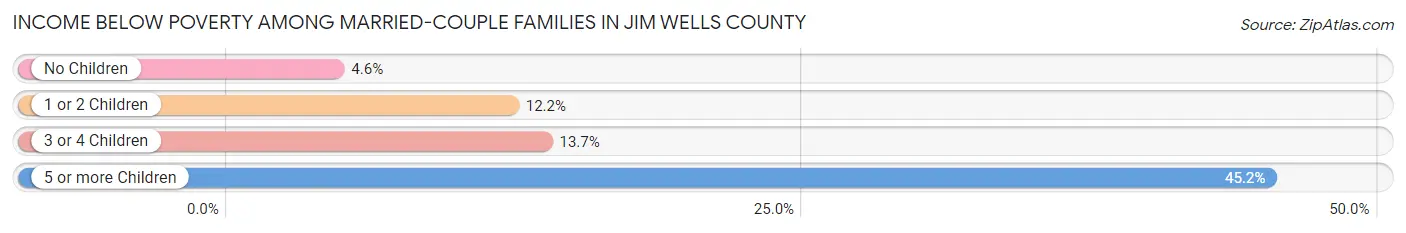
| Children | Above Poverty | Below Poverty |
| No Children | 3,397 (95.4%) | 165 (4.6%) |
| 1 or 2 Children | 1,666 (87.8%) | 232 (12.2%) |
| 3 or 4 Children | 895 (86.3%) | 142 (13.7%) |
| 5 or more Children | 63 (54.8%) | 52 (45.2%) |
| Total | 6,021 (91.1%) | 591 (8.9%) |
Income Below Poverty Among Single-Parent Households in Jim Wells County
According to the poverty data in Jim Wells County, 3.4% or 29 single-father households and 47.6% or 1,094 single-mother households are living below the poverty line. Among single-father households, those with 3 or 4 children have the highest poverty rate, with 10 households (100.0%) experiencing poverty. Likewise, among single-mother households, those with 5 or more children have the highest poverty rate, with 198 households (100.0%) falling below the poverty line.
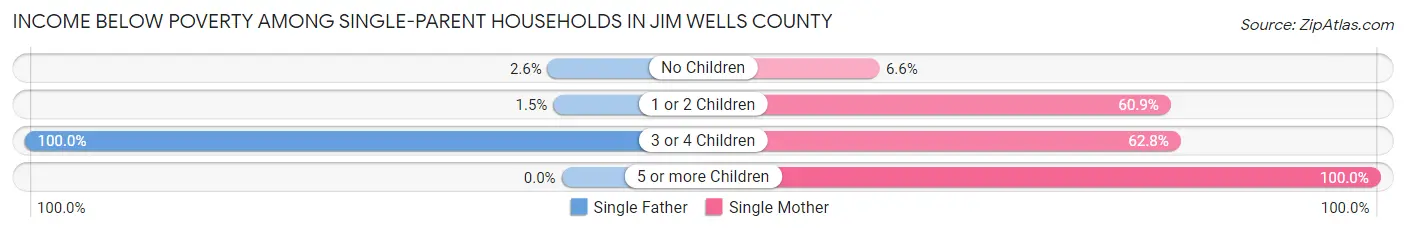
| Children | Single Father | Single Mother |
| No Children | 15 (2.6%) | 47 (6.6%) |
| 1 or 2 Children | 4 (1.5%) | 721 (60.9%) |
| 3 or 4 Children | 10 (100.0%) | 128 (62.7%) |
| 5 or more Children | 0 (0.0%) | 198 (100.0%) |
| Total | 29 (3.4%) | 1,094 (47.6%) |
Income Below Poverty Among Married-Couple vs Single-Parent Households in Jim Wells County
The poverty data for Jim Wells County shows that 591 of the married-couple family households (8.9%) and 1,123 of the single-parent households (35.7%) are living below the poverty level. Within the married-couple family households, those with 5 or more children have the highest poverty rate, with 52 households (45.2%) falling below the poverty line. Among the single-parent households, those with 5 or more children have the highest poverty rate, with 198 household (100.0%) living below poverty.
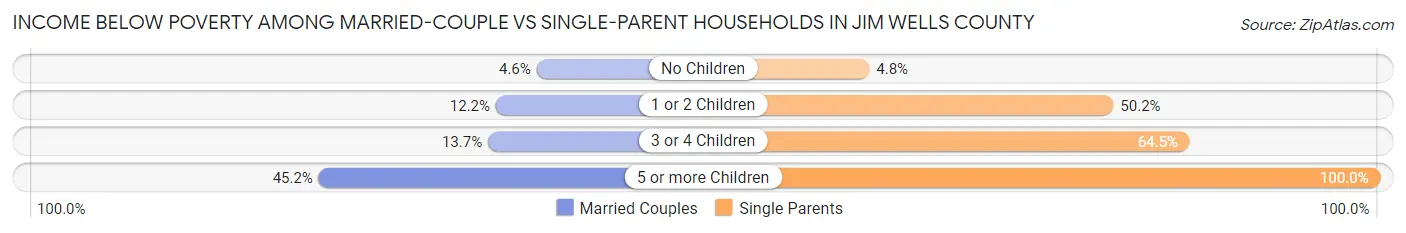
| Children | Married-Couple Families | Single-Parent Households |
| No Children | 165 (4.6%) | 62 (4.8%) |
| 1 or 2 Children | 232 (12.2%) | 725 (50.2%) |
| 3 or 4 Children | 142 (13.7%) | 138 (64.5%) |
| 5 or more Children | 52 (45.2%) | 198 (100.0%) |
| Total | 591 (8.9%) | 1,123 (35.7%) |
Race in Jim Wells County
The most populous races in Jim Wells County are White / Caucasian (31,976 | 81.9%), Hispanic or Latino (31,371 | 80.3%), and Two or more Races (4,874 | 12.5%).
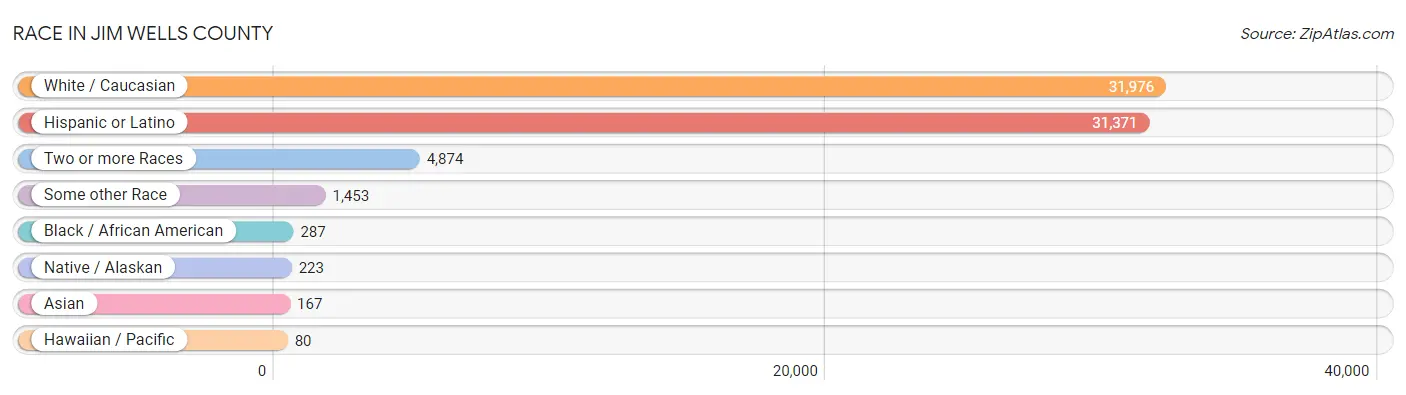
| Race | # Population | % Population |
| Asian | 167 | 0.4% |
| Black / African American | 287 | 0.7% |
| Hawaiian / Pacific | 80 | 0.2% |
| Hispanic or Latino | 31,371 | 80.3% |
| Native / Alaskan | 223 | 0.6% |
| White / Caucasian | 31,976 | 81.9% |
| Two or more Races | 4,874 | 12.5% |
| Some other Race | 1,453 | 3.7% |
| Total | 39,060 | 100.0% |
Ancestry in Jim Wells County
The most populous ancestries reported in Jim Wells County are Mexican (28,531 | 73.0%), German (2,116 | 5.4%), English (1,297 | 3.3%), Irish (1,212 | 3.1%), and American (572 | 1.5%), together accounting for 86.3% of all Jim Wells County residents.
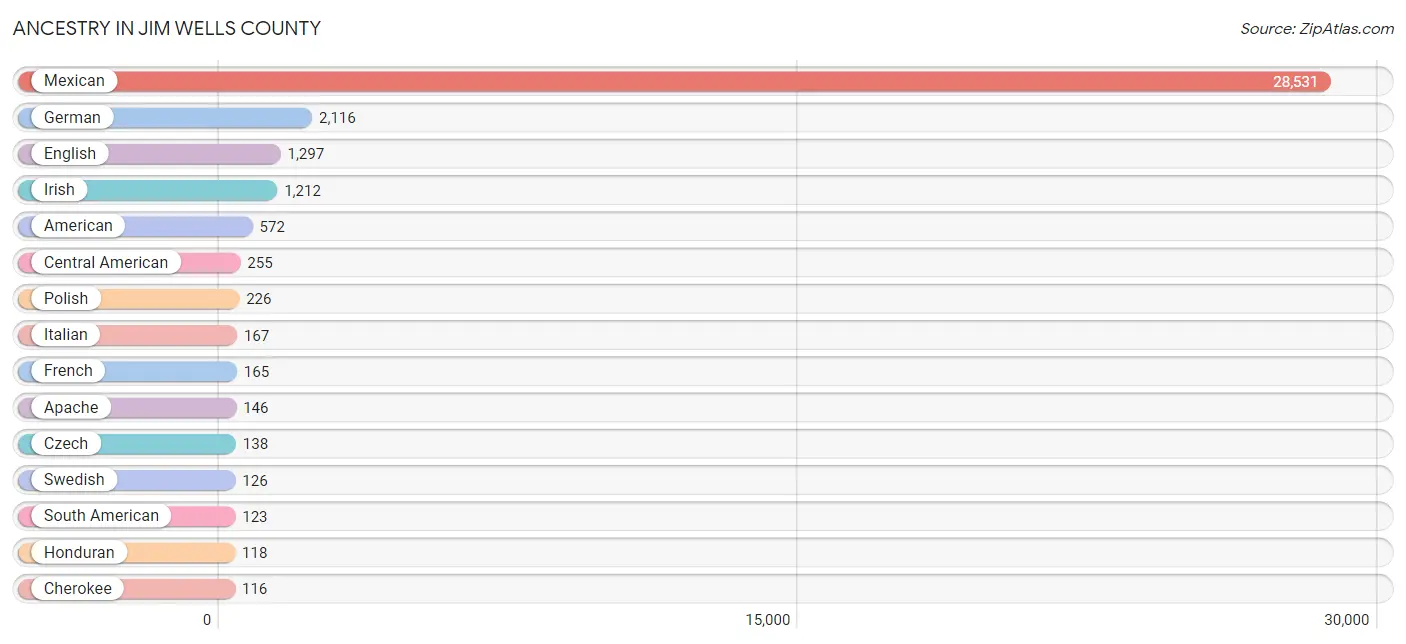
| Ancestry | # Population | % Population |
| Albanian | 8 | 0.0% |
| American | 572 | 1.5% |
| Apache | 146 | 0.4% |
| Arab | 114 | 0.3% |
| Argentinean | 6 | 0.0% |
| Armenian | 63 | 0.2% |
| Bhutanese | 62 | 0.2% |
| British | 35 | 0.1% |
| Canadian | 11 | 0.0% |
| Central American | 255 | 0.6% |
| Cherokee | 116 | 0.3% |
| Colombian | 76 | 0.2% |
| Comanche | 20 | 0.1% |
| Czech | 138 | 0.4% |
| Czechoslovakian | 41 | 0.1% |
| Dutch | 110 | 0.3% |
| Eastern European | 47 | 0.1% |
| English | 1,297 | 3.3% |
| European | 19 | 0.1% |
| French | 165 | 0.4% |
| French Canadian | 28 | 0.1% |
| German | 2,116 | 5.4% |
| Greek | 21 | 0.1% |
| Guatemalan | 77 | 0.2% |
| Honduran | 118 | 0.3% |
| Iraqi | 109 | 0.3% |
| Irish | 1,212 | 3.1% |
| Iroquois | 5 | 0.0% |
| Italian | 167 | 0.4% |
| Korean | 17 | 0.0% |
| Lebanese | 5 | 0.0% |
| Mexican | 28,531 | 73.0% |
| Native Hawaiian | 80 | 0.2% |
| Osage | 85 | 0.2% |
| Paraguayan | 13 | 0.0% |
| Pennsylvania German | 33 | 0.1% |
| Polish | 226 | 0.6% |
| Puerto Rican | 5 | 0.0% |
| Russian | 12 | 0.0% |
| Salvadoran | 60 | 0.2% |
| Scotch-Irish | 33 | 0.1% |
| Scottish | 101 | 0.3% |
| Seminole | 14 | 0.0% |
| Serbian | 18 | 0.1% |
| South American | 123 | 0.3% |
| Spaniard | 85 | 0.2% |
| Spanish | 35 | 0.1% |
| Sri Lankan | 10 | 0.0% |
| Swedish | 126 | 0.3% |
| Venezuelan | 28 | 0.1% |
| Welsh | 19 | 0.1% | View All 51 Rows |
Immigrants in Jim Wells County
The most numerous immigrant groups reported in Jim Wells County came from Latin America (1,479 | 3.8%), Central America (1,410 | 3.6%), Mexico (1,203 | 3.1%), Asia (274 | 0.7%), and Iraq (176 | 0.4%), together accounting for 11.6% of all Jim Wells County residents.
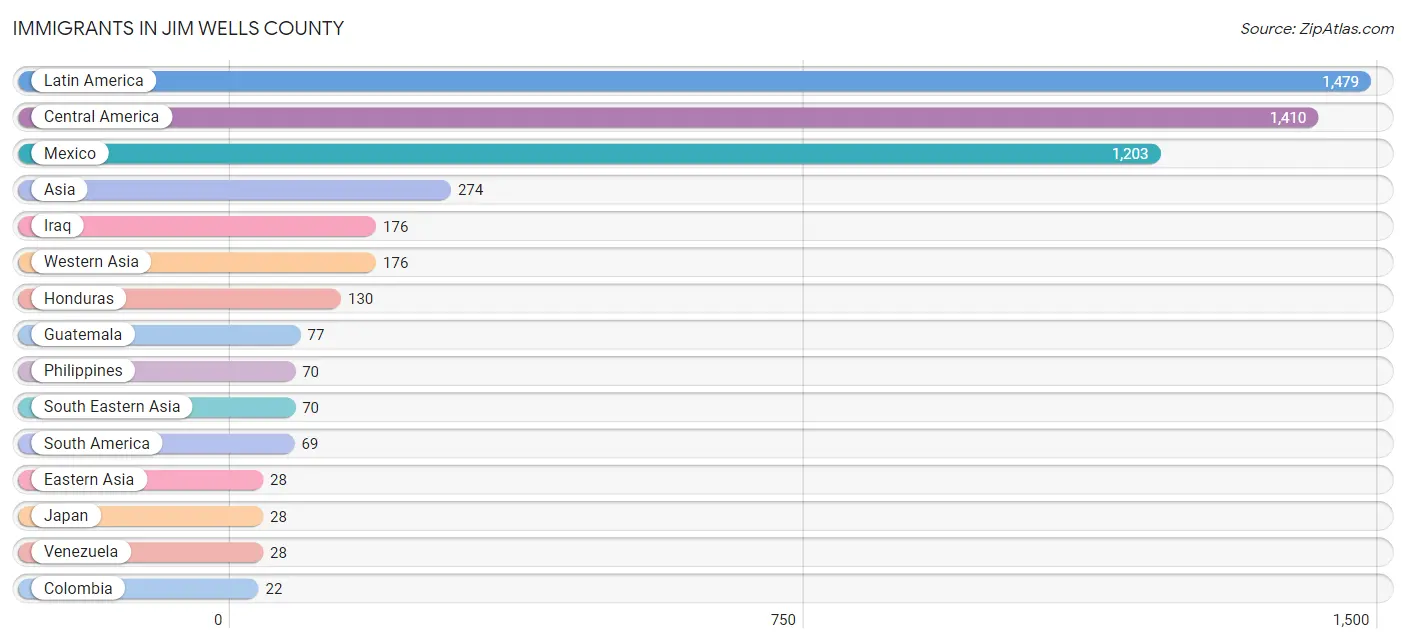
| Immigration Origin | # Population | % Population |
| Argentina | 6 | 0.0% |
| Asia | 274 | 0.7% |
| Central America | 1,410 | 3.6% |
| Colombia | 22 | 0.1% |
| Eastern Asia | 28 | 0.1% |
| Eastern Europe | 8 | 0.0% |
| Europe | 13 | 0.0% |
| Germany | 5 | 0.0% |
| Guatemala | 77 | 0.2% |
| Honduras | 130 | 0.3% |
| Iraq | 176 | 0.4% |
| Japan | 28 | 0.1% |
| Latin America | 1,479 | 3.8% |
| Mexico | 1,203 | 3.1% |
| Philippines | 70 | 0.2% |
| South America | 69 | 0.2% |
| South Eastern Asia | 70 | 0.2% |
| Venezuela | 28 | 0.1% |
| Western Asia | 176 | 0.4% |
| Western Europe | 5 | 0.0% | View All 20 Rows |
Sex and Age in Jim Wells County
Sex and Age in Jim Wells County
The most populous age groups in Jim Wells County are 10 to 14 Years (1,668 | 8.6%) for men and 5 to 9 Years (1,554 | 7.9%) for women.
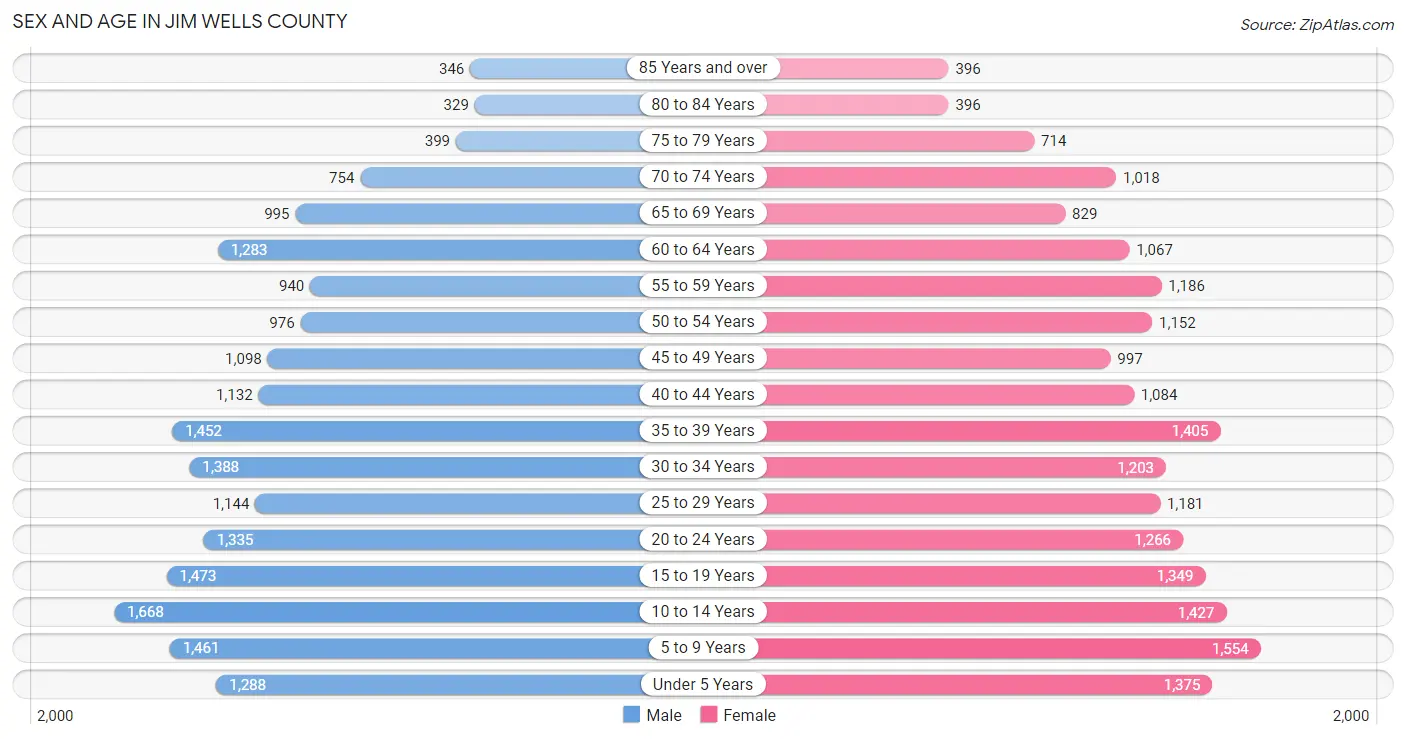
| Age Bracket | Male | Female |
| Under 5 Years | 1,288 (6.6%) | 1,375 (7.0%) |
| 5 to 9 Years | 1,461 (7.5%) | 1,554 (7.9%) |
| 10 to 14 Years | 1,668 (8.6%) | 1,427 (7.3%) |
| 15 to 19 Years | 1,473 (7.6%) | 1,349 (6.9%) |
| 20 to 24 Years | 1,335 (6.9%) | 1,266 (6.5%) |
| 25 to 29 Years | 1,144 (5.9%) | 1,181 (6.0%) |
| 30 to 34 Years | 1,388 (7.1%) | 1,203 (6.1%) |
| 35 to 39 Years | 1,452 (7.5%) | 1,405 (7.2%) |
| 40 to 44 Years | 1,132 (5.8%) | 1,084 (5.5%) |
| 45 to 49 Years | 1,098 (5.6%) | 997 (5.1%) |
| 50 to 54 Years | 976 (5.0%) | 1,152 (5.9%) |
| 55 to 59 Years | 940 (4.8%) | 1,186 (6.0%) |
| 60 to 64 Years | 1,283 (6.6%) | 1,067 (5.4%) |
| 65 to 69 Years | 995 (5.1%) | 829 (4.2%) |
| 70 to 74 Years | 754 (3.9%) | 1,018 (5.2%) |
| 75 to 79 Years | 399 (2.1%) | 714 (3.6%) |
| 80 to 84 Years | 329 (1.7%) | 396 (2.0%) |
| 85 Years and over | 346 (1.8%) | 396 (2.0%) |
| Total | 19,461 (100.0%) | 19,599 (100.0%) |
Families and Households in Jim Wells County
Median Family Size in Jim Wells County
The median family size in Jim Wells County is 3.49 persons per family, with single female/mother families (2,300 | 23.6%) accounting for the largest median family size of 3.8 persons per family. On the other hand, single male/father families (849 | 8.7%) represent the smallest median family size with 2.36 persons per family.
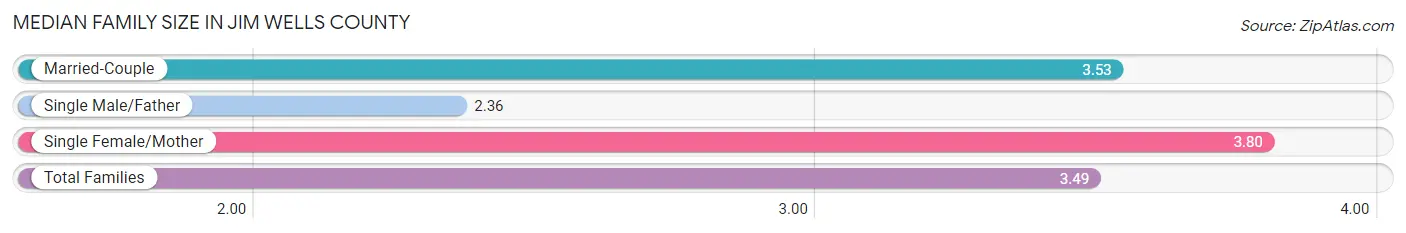
| Family Type | # Families | Family Size |
| Married-Couple | 6,612 (67.7%) | 3.53 |
| Single Male/Father | 849 (8.7%) | 2.36 |
| Single Female/Mother | 2,300 (23.6%) | 3.80 |
| Total Families | 9,761 (100.0%) | 3.49 |
Median Household Size in Jim Wells County
The median household size in Jim Wells County is 2.99 persons per household, with single female/mother households (2,300 | 17.8%) accounting for the largest median household size of 3.95 persons per household. non-family households (3,153 | 24.4%) represent the smallest median household size with 1.21 persons per household.
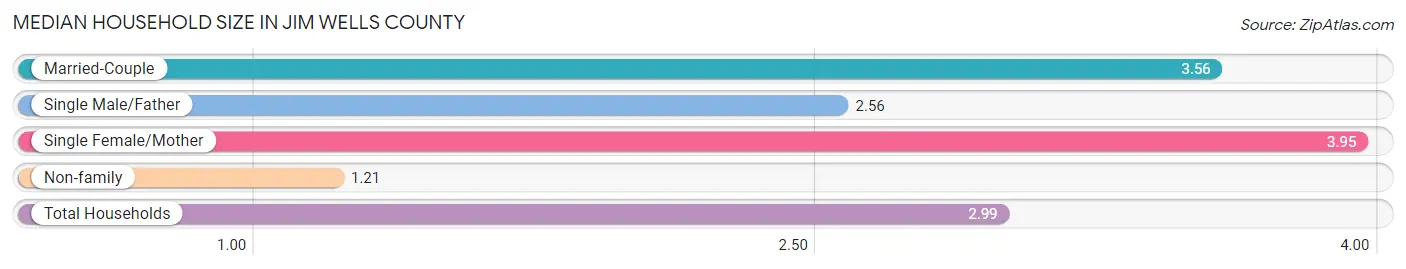
| Household Type | # Households | Household Size |
| Married-Couple | 6,612 (51.2%) | 3.56 |
| Single Male/Father | 849 (6.6%) | 2.56 |
| Single Female/Mother | 2,300 (17.8%) | 3.95 |
| Non-family | 3,153 (24.4%) | 1.21 |
| Total Households | 12,914 (100.0%) | 2.99 |
Household Size by Marriage Status in Jim Wells County
Out of a total of 12,914 households in Jim Wells County, 9,761 (75.6%) are family households, while 3,153 (24.4%) are nonfamily households. The most numerous type of family households are 2-person households, comprising 3,870, and the most common type of nonfamily households are 1-person households, comprising 2,551.
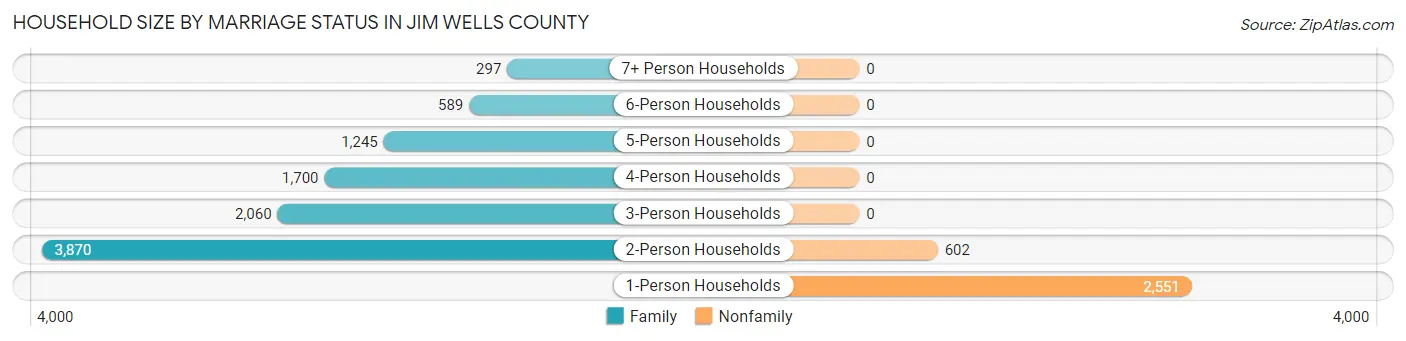
| Household Size | Family Households | Nonfamily Households |
| 1-Person Households | - | 2,551 (19.8%) |
| 2-Person Households | 3,870 (30.0%) | 602 (4.7%) |
| 3-Person Households | 2,060 (16.0%) | 0 (0.0%) |
| 4-Person Households | 1,700 (13.2%) | 0 (0.0%) |
| 5-Person Households | 1,245 (9.6%) | 0 (0.0%) |
| 6-Person Households | 589 (4.6%) | 0 (0.0%) |
| 7+ Person Households | 297 (2.3%) | 0 (0.0%) |
| Total | 9,761 (75.6%) | 3,153 (24.4%) |
Female Fertility in Jim Wells County
Fertility by Age in Jim Wells County
Average fertility rate in Jim Wells County is 75.0 births per 1,000 women. Women in the age bracket of 15 to 19 years have the highest fertility rate with 153.0 births per 1,000 women. Women in the age bracket of 20 to 34 years acount for 47.5% of all women with births.
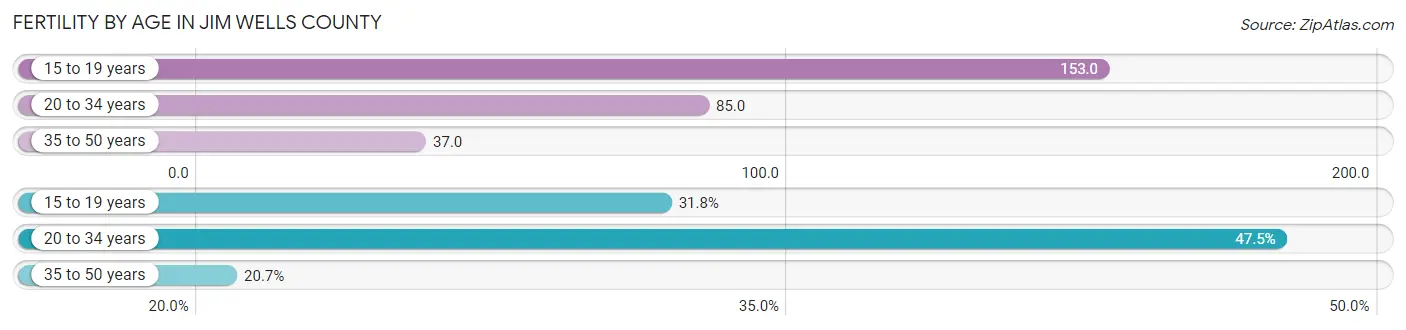
| Age Bracket | Women with Births | Births / 1,000 Women |
| 15 to 19 years | 207 (31.8%) | 153.0 |
| 20 to 34 years | 309 (47.5%) | 85.0 |
| 35 to 50 years | 135 (20.7%) | 37.0 |
| Total | 651 (100.0%) | 75.0 |
Fertility by Age by Marriage Status in Jim Wells County
40.2% of women with births (651) in Jim Wells County are married. The highest percentage of unmarried women with births falls into 15 to 19 years age bracket with 100.0% of them unmarried at the time of birth, while the lowest percentage of unmarried women with births belong to 35 to 50 years age bracket with 0.0% of them unmarried.
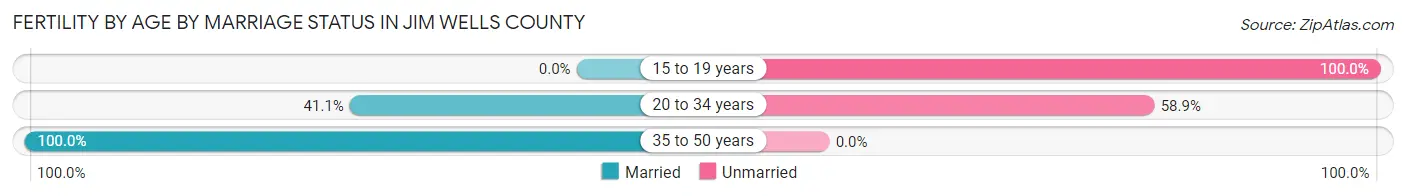
| Age Bracket | Married | Unmarried |
| 15 to 19 years | 0 (0.0%) | 207 (100.0%) |
| 20 to 34 years | 127 (41.1%) | 182 (58.9%) |
| 35 to 50 years | 135 (100.0%) | 0 (0.0%) |
| Total | 262 (40.3%) | 389 (59.8%) |
Fertility by Education in Jim Wells County
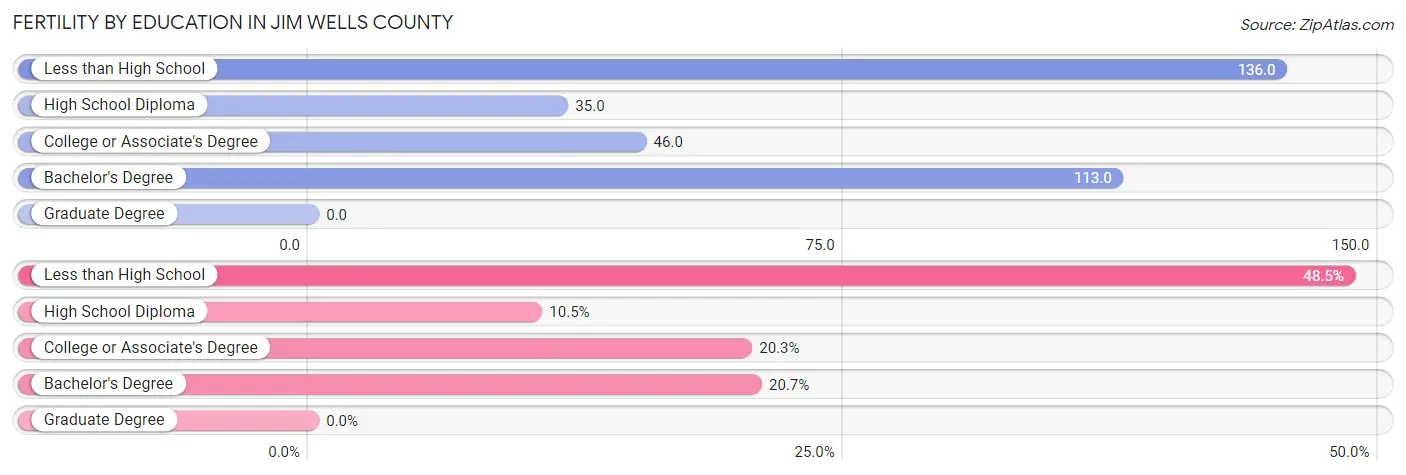
| Educational Attainment | Women with Births | Births / 1,000 Women |
| Less than High School | 316 (48.5%) | 136.0 |
| High School Diploma | 68 (10.4%) | 35.0 |
| College or Associate's Degree | 132 (20.3%) | 46.0 |
| Bachelor's Degree | 135 (20.7%) | 113.0 |
| Graduate Degree | 0 (0.0%) | 0.0 |
| Total | 651 (100.0%) | 75.0 |
Fertility by Education by Marriage Status in Jim Wells County
59.8% of women with births in Jim Wells County are unmarried. Women with the educational attainment of bachelor's degree are most likely to be married with 100.0% of them married at childbirth, while women with the educational attainment of less than high school are least likely to be married with 85.1% of them unmarried at childbirth.
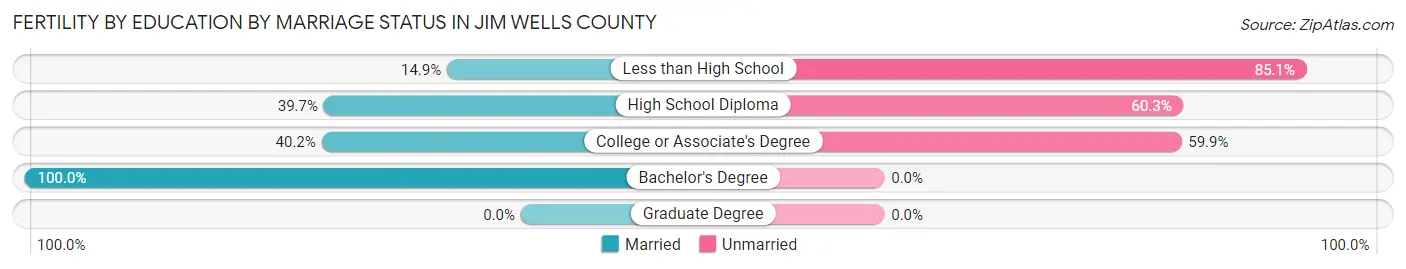
| Educational Attainment | Married | Unmarried |
| Less than High School | 47 (14.9%) | 269 (85.1%) |
| High School Diploma | 27 (39.7%) | 41 (60.3%) |
| College or Associate's Degree | 53 (40.2%) | 79 (59.9%) |
| Bachelor's Degree | 135 (100.0%) | 0 (0.0%) |
| Graduate Degree | 0 (0.0%) | 0 (0.0%) |
| Total | 262 (40.3%) | 389 (59.8%) |
Employment Characteristics in Jim Wells County
Employment by Class of Employer in Jim Wells County
Among the 14,790 employed individuals in Jim Wells County, private company employees (9,997 | 67.6%), local government employees (1,405 | 9.5%), and self-employed (not incorporated) (1,281 | 8.7%) make up the most common classes of employment.
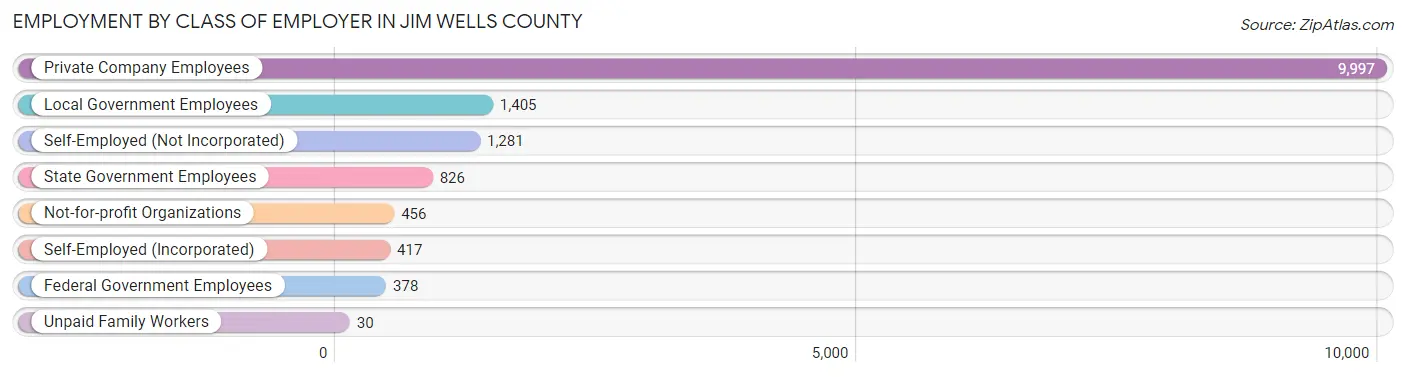
| Employer Class | # Employees | % Employees |
| Private Company Employees | 9,997 | 67.6% |
| Self-Employed (Incorporated) | 417 | 2.8% |
| Self-Employed (Not Incorporated) | 1,281 | 8.7% |
| Not-for-profit Organizations | 456 | 3.1% |
| Local Government Employees | 1,405 | 9.5% |
| State Government Employees | 826 | 5.6% |
| Federal Government Employees | 378 | 2.6% |
| Unpaid Family Workers | 30 | 0.2% |
| Total | 14,790 | 100.0% |
Employment Status by Age in Jim Wells County
According to the labor force statistics for Jim Wells County, out of the total population over 16 years of age (29,521), 53.7% or 15,853 individuals are in the labor force, with 5.2% or 824 of them unemployed. The age group with the highest labor force participation rate is 35 to 44 years, with 75.5% or 3,830 individuals in the labor force. Within the labor force, the 16 to 19 years age range has the highest percentage of unemployed individuals, with 15.8% or 45 of them being unemployed.
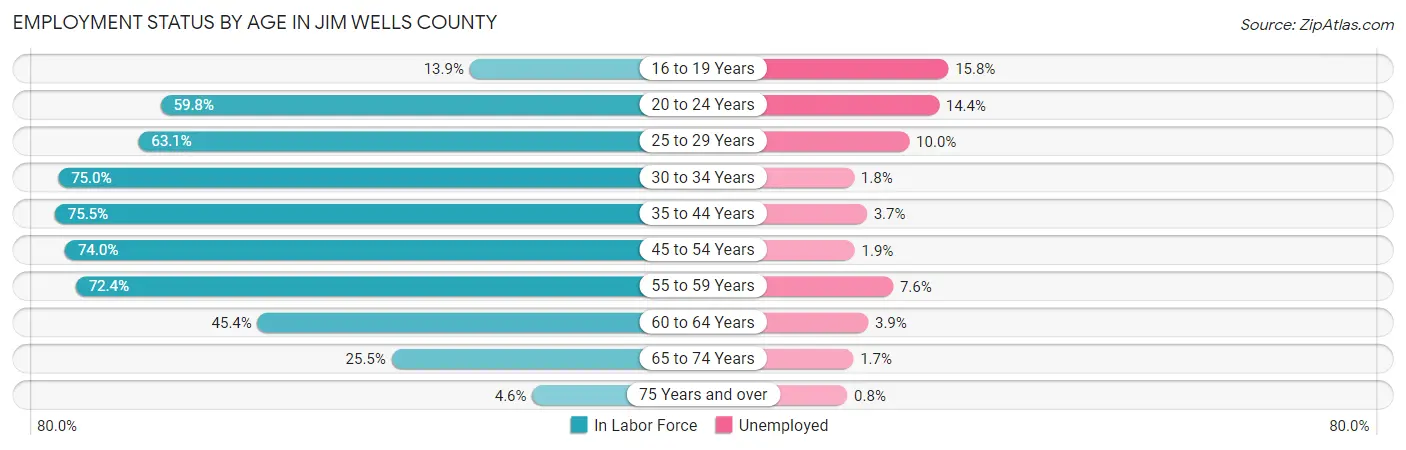
| Age Bracket | In Labor Force | Unemployed |
| 16 to 19 Years | 286 (13.9%) | 45 (15.8%) |
| 20 to 24 Years | 1,555 (59.8%) | 224 (14.4%) |
| 25 to 29 Years | 1,467 (63.1%) | 147 (10.0%) |
| 30 to 34 Years | 1,943 (75.0%) | 35 (1.8%) |
| 35 to 44 Years | 3,830 (75.5%) | 142 (3.7%) |
| 45 to 54 Years | 3,125 (74.0%) | 59 (1.9%) |
| 55 to 59 Years | 1,539 (72.4%) | 117 (7.6%) |
| 60 to 64 Years | 1,067 (45.4%) | 42 (3.9%) |
| 65 to 74 Years | 917 (25.5%) | 16 (1.7%) |
| 75 Years and over | 119 (4.6%) | 1 (0.8%) |
| Total | 15,853 (53.7%) | 824 (5.2%) |
Employment Status by Educational Attainment in Jim Wells County
According to labor force statistics for Jim Wells County, 69.4% of individuals (12,969) out of the total population between 25 and 64 years of age (18,688) are in the labor force, with 4.2% or 545 of them being unemployed. The group with the highest labor force participation rate are those with the educational attainment of bachelor's degree or higher, with 82.2% or 2,454 individuals in the labor force. Within the labor force, individuals with less than high school education have the highest percentage of unemployment, with 6.6% or 134 of them being unemployed.
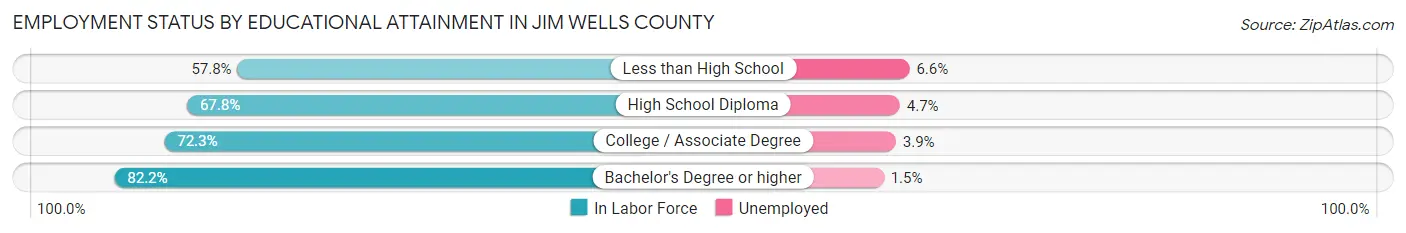
| Educational Attainment | In Labor Force | Unemployed |
| Less than High School | 2,033 (57.8%) | 232 (6.6%) |
| High School Diploma | 4,879 (67.8%) | 338 (4.7%) |
| College / Associate Degree | 3,607 (72.3%) | 195 (3.9%) |
| Bachelor's Degree or higher | 2,454 (82.2%) | 45 (1.5%) |
| Total | 12,969 (69.4%) | 785 (4.2%) |
Employment Occupations by Sex in Jim Wells County
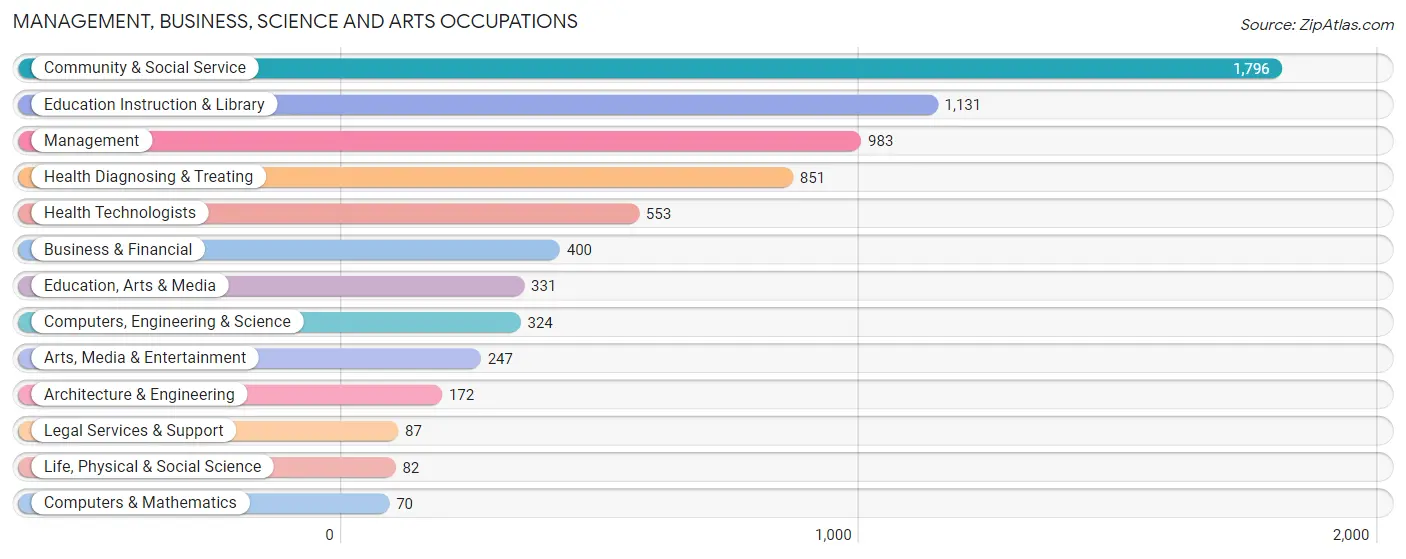
Management, Business, Science and Arts Occupations
The most common Management, Business, Science and Arts occupations in Jim Wells County are Community & Social Service (1,796 | 12.0%), Education Instruction & Library (1,131 | 7.5%), Management (983 | 6.5%), Health Diagnosing & Treating (851 | 5.7%), and Health Technologists (553 | 3.7%).
Management, Business, Science and Arts Occupations by Sex
Within the Management, Business, Science and Arts occupations in Jim Wells County, the most male-oriented occupations are Computers & Mathematics (100.0%), Architecture & Engineering (94.8%), and Computers, Engineering & Science (92.6%), while the most female-oriented occupations are Legal Services & Support (95.4%), Health Technologists (90.4%), and Health Diagnosing & Treating (85.1%).
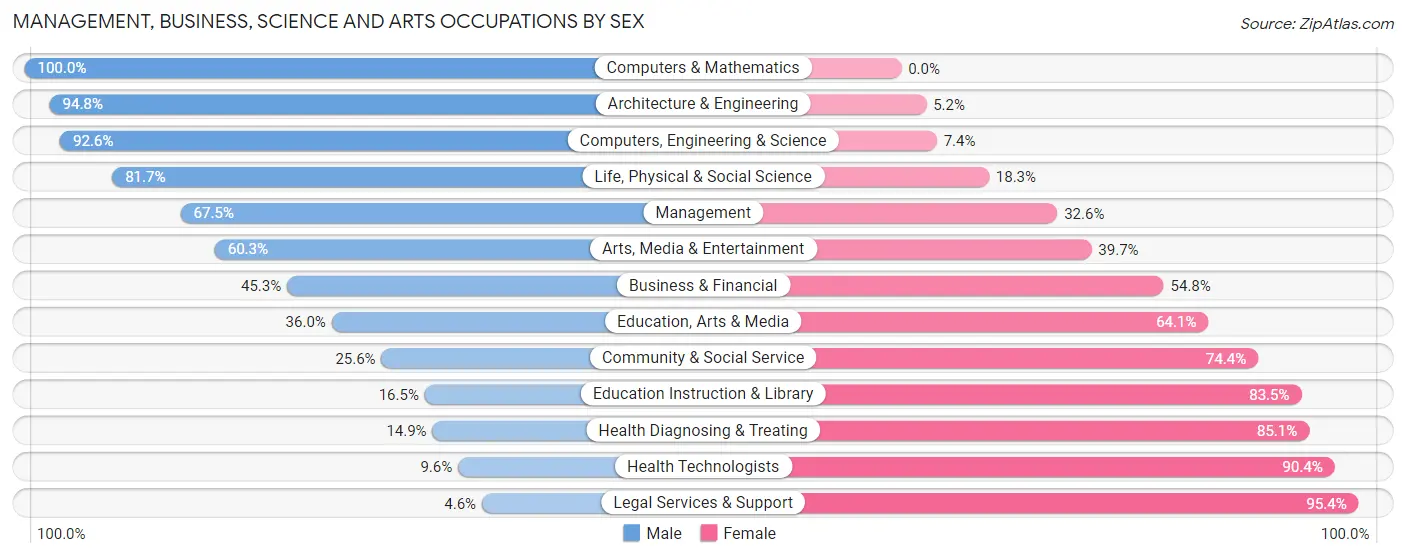
| Occupation | Male | Female |
| Management | 663 (67.4%) | 320 (32.6%) |
| Business & Financial | 181 (45.3%) | 219 (54.7%) |
| Computers, Engineering & Science | 300 (92.6%) | 24 (7.4%) |
| Computers & Mathematics | 70 (100.0%) | 0 (0.0%) |
| Architecture & Engineering | 163 (94.8%) | 9 (5.2%) |
| Life, Physical & Social Science | 67 (81.7%) | 15 (18.3%) |
| Community & Social Service | 459 (25.6%) | 1,337 (74.4%) |
| Education, Arts & Media | 119 (35.9%) | 212 (64.0%) |
| Legal Services & Support | 4 (4.6%) | 83 (95.4%) |
| Education Instruction & Library | 187 (16.5%) | 944 (83.5%) |
| Arts, Media & Entertainment | 149 (60.3%) | 98 (39.7%) |
| Health Diagnosing & Treating | 127 (14.9%) | 724 (85.1%) |
| Health Technologists | 53 (9.6%) | 500 (90.4%) |
| Total (Category) | 1,730 (39.7%) | 2,624 (60.3%) |
| Total (Overall) | 7,932 (52.8%) | 7,090 (47.2%) |
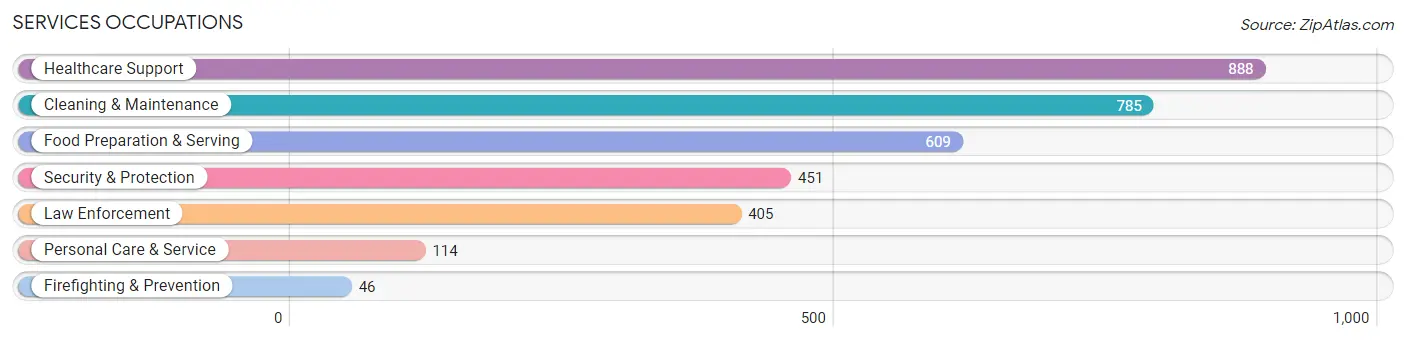
Services Occupations
The most common Services occupations in Jim Wells County are Healthcare Support (888 | 5.9%), Cleaning & Maintenance (785 | 5.2%), Food Preparation & Serving (609 | 4.1%), Security & Protection (451 | 3.0%), and Law Enforcement (405 | 2.7%).
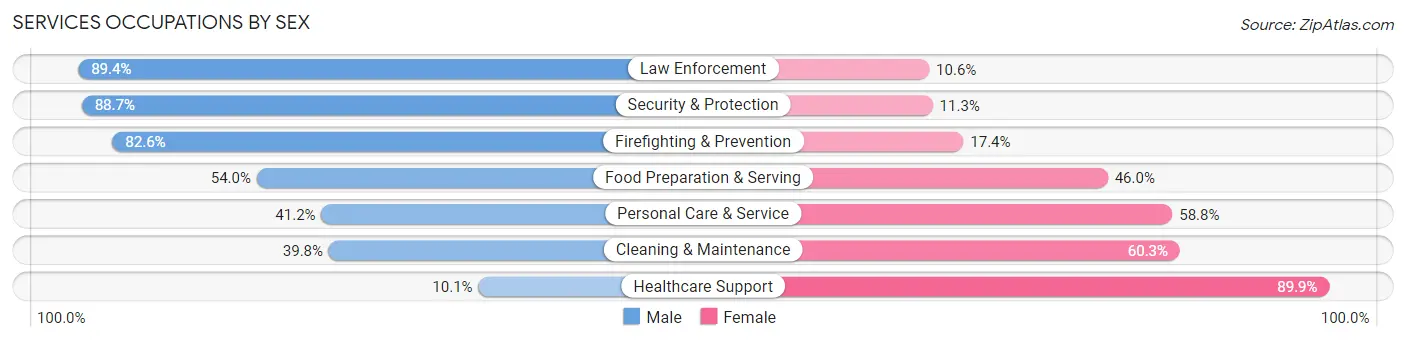
Services Occupations by Sex
Within the Services occupations in Jim Wells County, the most male-oriented occupations are Law Enforcement (89.4%), Security & Protection (88.7%), and Firefighting & Prevention (82.6%), while the most female-oriented occupations are Healthcare Support (89.9%), Cleaning & Maintenance (60.3%), and Personal Care & Service (58.8%).
| Occupation | Male | Female |
| Healthcare Support | 90 (10.1%) | 798 (89.9%) |
| Security & Protection | 400 (88.7%) | 51 (11.3%) |
| Firefighting & Prevention | 38 (82.6%) | 8 (17.4%) |
| Law Enforcement | 362 (89.4%) | 43 (10.6%) |
| Food Preparation & Serving | 329 (54.0%) | 280 (46.0%) |
| Cleaning & Maintenance | 312 (39.8%) | 473 (60.3%) |
| Personal Care & Service | 47 (41.2%) | 67 (58.8%) |
| Total (Category) | 1,178 (41.4%) | 1,669 (58.6%) |
| Total (Overall) | 7,932 (52.8%) | 7,090 (47.2%) |
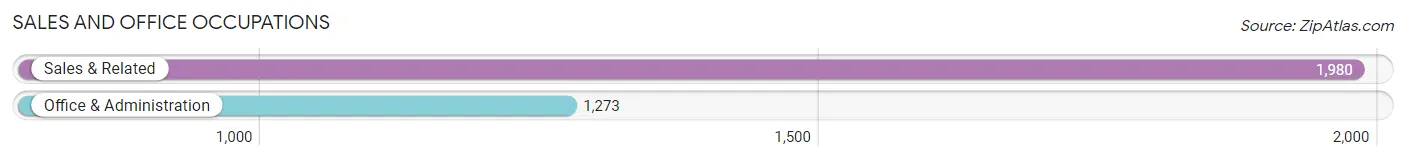
Sales and Office Occupations
The most common Sales and Office occupations in Jim Wells County are Sales & Related (1,980 | 13.2%), and Office & Administration (1,273 | 8.5%).
Sales and Office Occupations by Sex
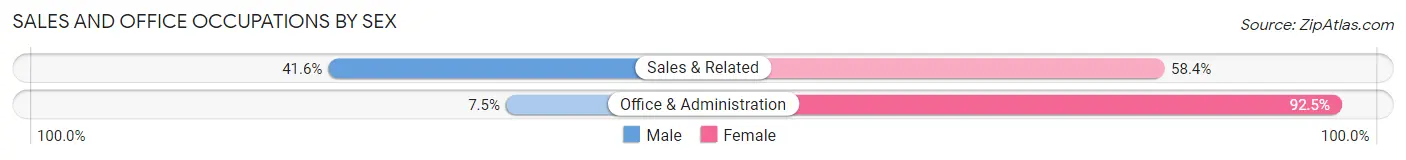
| Occupation | Male | Female |
| Sales & Related | 824 (41.6%) | 1,156 (58.4%) |
| Office & Administration | 95 (7.5%) | 1,178 (92.5%) |
| Total (Category) | 919 (28.2%) | 2,334 (71.8%) |
| Total (Overall) | 7,932 (52.8%) | 7,090 (47.2%) |
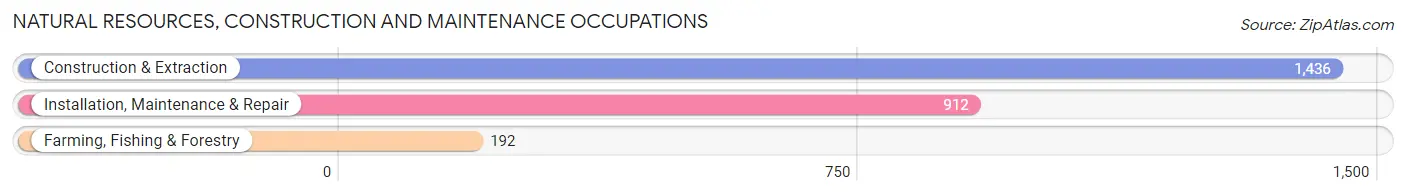
Natural Resources, Construction and Maintenance Occupations
The most common Natural Resources, Construction and Maintenance occupations in Jim Wells County are Construction & Extraction (1,436 | 9.6%), Installation, Maintenance & Repair (912 | 6.1%), and Farming, Fishing & Forestry (192 | 1.3%).
Natural Resources, Construction and Maintenance Occupations by Sex
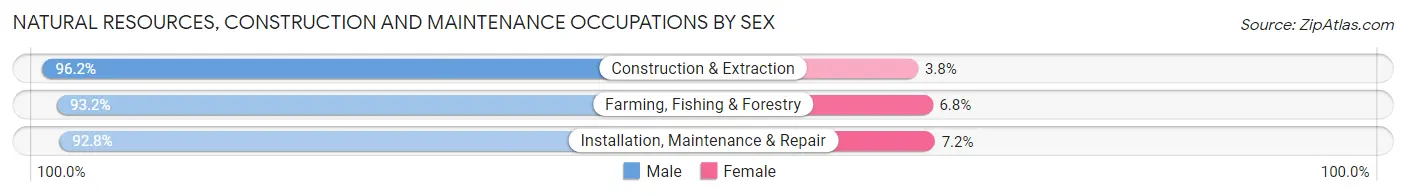
| Occupation | Male | Female |
| Farming, Fishing & Forestry | 179 (93.2%) | 13 (6.8%) |
| Construction & Extraction | 1,382 (96.2%) | 54 (3.8%) |
| Installation, Maintenance & Repair | 846 (92.8%) | 66 (7.2%) |
| Total (Category) | 2,407 (94.8%) | 133 (5.2%) |
| Total (Overall) | 7,932 (52.8%) | 7,090 (47.2%) |
Production, Transportation and Moving Occupations
The most common Production, Transportation and Moving occupations in Jim Wells County are Transportation (955 | 6.4%), Production (728 | 4.9%), and Material Moving (345 | 2.3%).
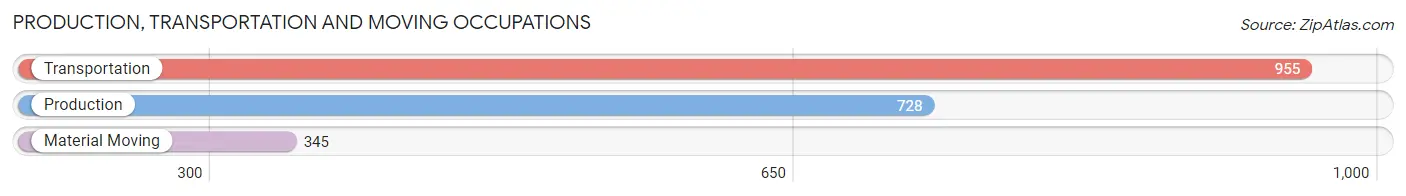
Production, Transportation and Moving Occupations by Sex
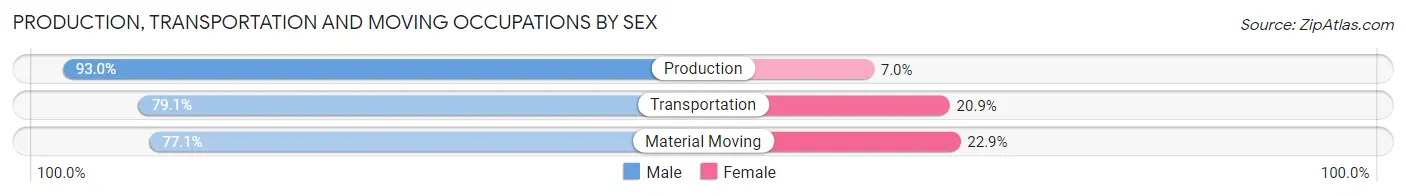
| Occupation | Male | Female |
| Production | 677 (93.0%) | 51 (7.0%) |
| Transportation | 755 (79.1%) | 200 (20.9%) |
| Material Moving | 266 (77.1%) | 79 (22.9%) |
| Total (Category) | 1,698 (83.7%) | 330 (16.3%) |
| Total (Overall) | 7,932 (52.8%) | 7,090 (47.2%) |
Employment Industries by Sex in Jim Wells County
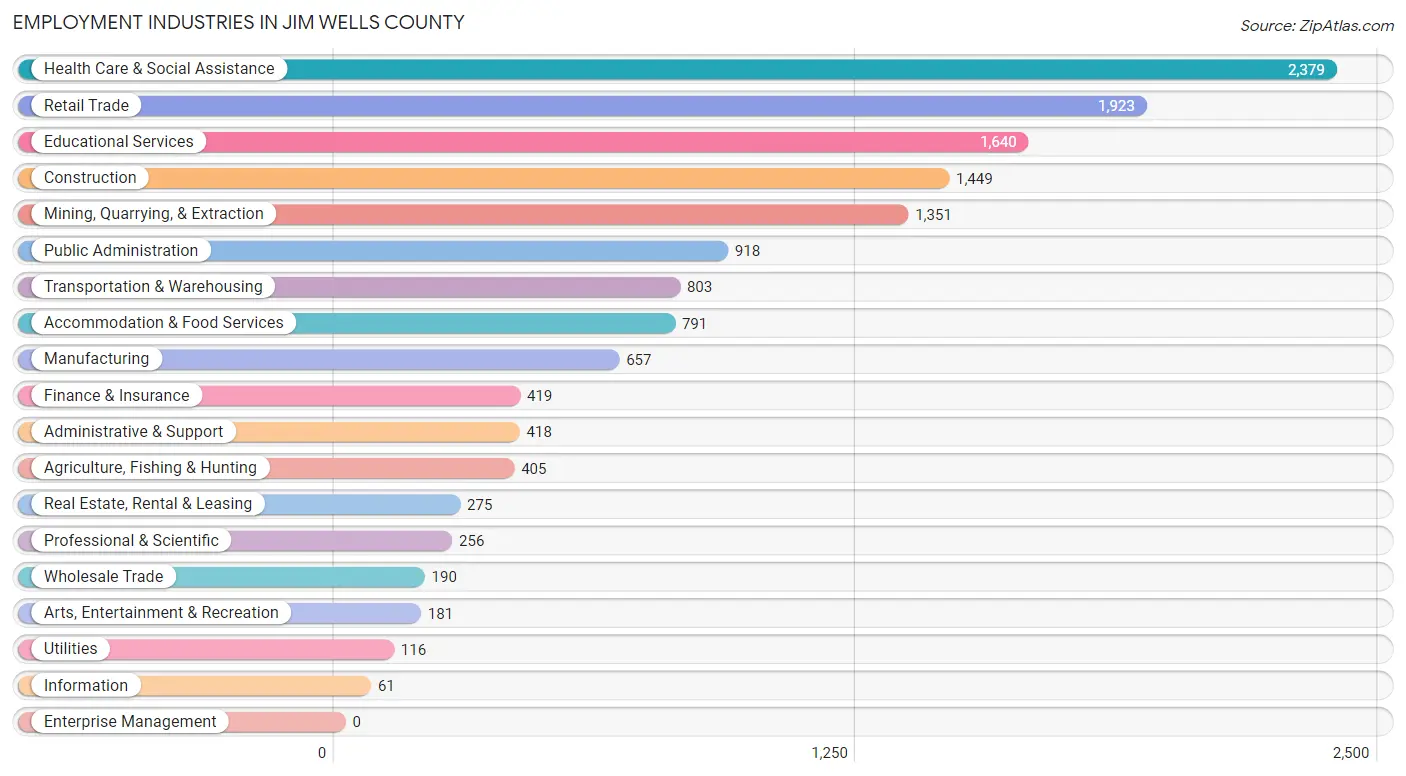
Employment Industries in Jim Wells County
The major employment industries in Jim Wells County include Health Care & Social Assistance (2,379 | 15.8%), Retail Trade (1,923 | 12.8%), Educational Services (1,640 | 10.9%), Construction (1,449 | 9.7%), and Mining, Quarrying, & Extraction (1,351 | 9.0%).
Employment Industries by Sex in Jim Wells County
The Jim Wells County industries that see more men than women are Information (100.0%), Real Estate, Rental & Leasing (94.2%), and Construction (93.1%), whereas the industries that tend to have a higher number of women are Finance & Insurance (99.5%), Health Care & Social Assistance (88.3%), and Educational Services (73.6%).
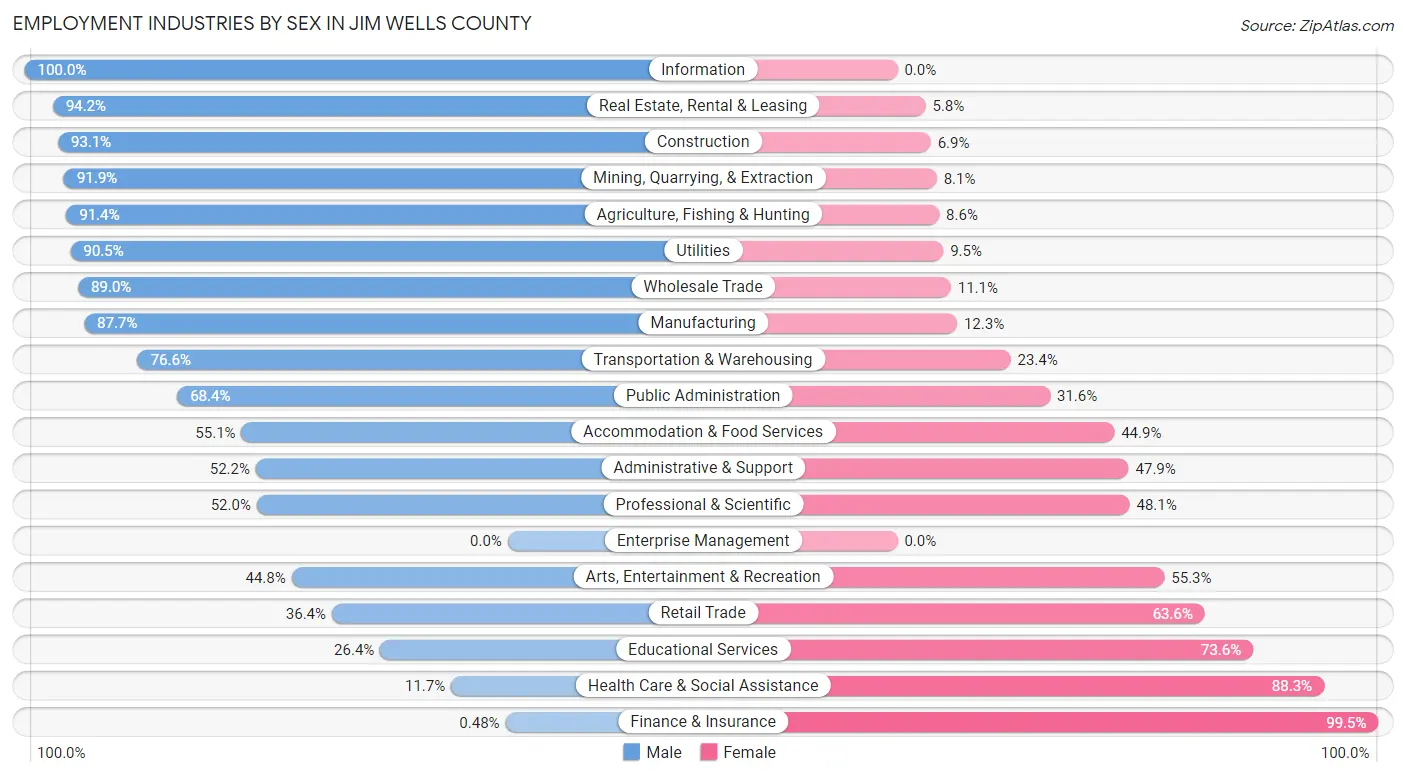
| Industry | Male | Female |
| Agriculture, Fishing & Hunting | 370 (91.4%) | 35 (8.6%) |
| Mining, Quarrying, & Extraction | 1,241 (91.9%) | 110 (8.1%) |
| Construction | 1,349 (93.1%) | 100 (6.9%) |
| Manufacturing | 576 (87.7%) | 81 (12.3%) |
| Wholesale Trade | 169 (88.9%) | 21 (11.1%) |
| Retail Trade | 700 (36.4%) | 1,223 (63.6%) |
| Transportation & Warehousing | 615 (76.6%) | 188 (23.4%) |
| Utilities | 105 (90.5%) | 11 (9.5%) |
| Information | 61 (100.0%) | 0 (0.0%) |
| Finance & Insurance | 2 (0.5%) | 417 (99.5%) |
| Real Estate, Rental & Leasing | 259 (94.2%) | 16 (5.8%) |
| Professional & Scientific | 133 (51.9%) | 123 (48.0%) |
| Enterprise Management | 0 (0.0%) | 0 (0.0%) |
| Administrative & Support | 218 (52.1%) | 200 (47.8%) |
| Educational Services | 433 (26.4%) | 1,207 (73.6%) |
| Health Care & Social Assistance | 279 (11.7%) | 2,100 (88.3%) |
| Arts, Entertainment & Recreation | 81 (44.8%) | 100 (55.2%) |
| Accommodation & Food Services | 436 (55.1%) | 355 (44.9%) |
| Public Administration | 628 (68.4%) | 290 (31.6%) |
| Total | 7,932 (52.8%) | 7,090 (47.2%) |
Education in Jim Wells County
School Enrollment in Jim Wells County
The most common levels of schooling among the 9,975 students in Jim Wells County are high school (2,719 | 27.3%), middle school (2,327 | 23.3%), and elementary school (2,075 | 20.8%).
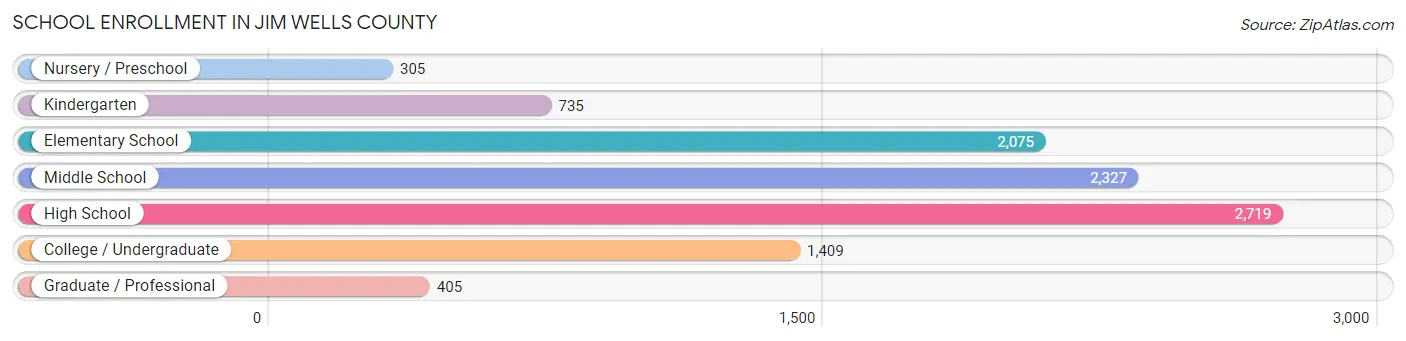
| School Level | # Students | % Students |
| Nursery / Preschool | 305 | 3.1% |
| Kindergarten | 735 | 7.4% |
| Elementary School | 2,075 | 20.8% |
| Middle School | 2,327 | 23.3% |
| High School | 2,719 | 27.3% |
| College / Undergraduate | 1,409 | 14.1% |
| Graduate / Professional | 405 | 4.1% |
| Total | 9,975 | 100.0% |
School Enrollment by Age by Funding Source in Jim Wells County
Out of a total of 9,975 students who are enrolled in schools in Jim Wells County, 1,716 (17.2%) attend a private institution, while the remaining 8,259 (82.8%) are enrolled in public schools. The age group of 3 to 4 year olds has the highest likelihood of being enrolled in private schools, with 114 (41.2% in the age bracket) enrolled. Conversely, the age group of 18 to 19 year olds has the lowest likelihood of being enrolled in a private school, with 567 (93.6% in the age bracket) attending a public institution.
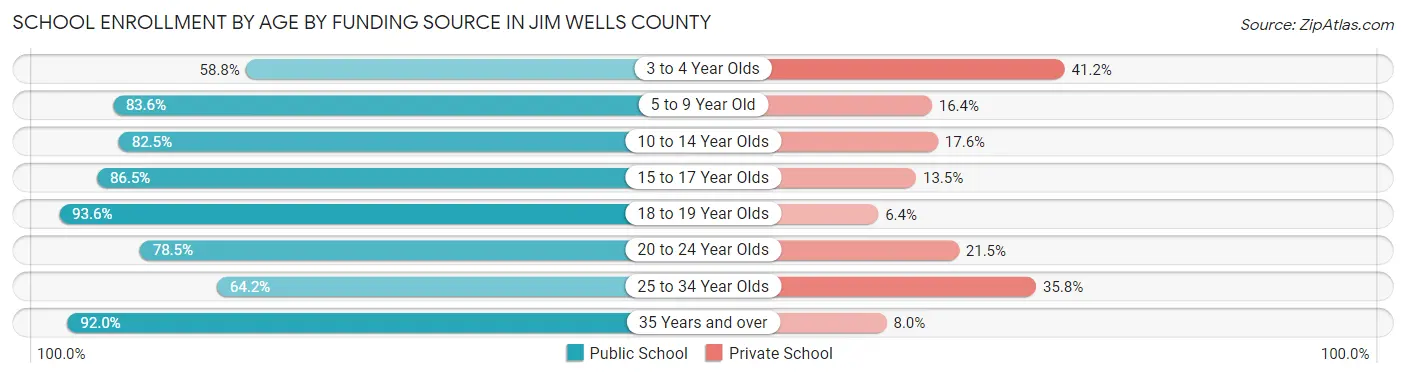
| Age Bracket | Public School | Private School |
| 3 to 4 Year Olds | 163 (58.8%) | 114 (41.2%) |
| 5 to 9 Year Old | 2,215 (83.6%) | 435 (16.4%) |
| 10 to 14 Year Olds | 2,467 (82.5%) | 525 (17.5%) |
| 15 to 17 Year Olds | 1,476 (86.5%) | 230 (13.5%) |
| 18 to 19 Year Olds | 567 (93.6%) | 39 (6.4%) |
| 20 to 24 Year Olds | 344 (78.5%) | 94 (21.5%) |
| 25 to 34 Year Olds | 412 (64.2%) | 230 (35.8%) |
| 35 Years and over | 611 (92.0%) | 53 (8.0%) |
| Total | 8,259 (82.8%) | 1,716 (17.2%) |
Educational Attainment by Field of Study in Jim Wells County
Education (1,134 | 28.1%), business (815 | 20.2%), science & technology (384 | 9.5%), engineering (343 | 8.5%), and bio, nature & agricultural (336 | 8.3%) are the most common fields of study among 4,043 individuals in Jim Wells County who have obtained a bachelor's degree or higher.
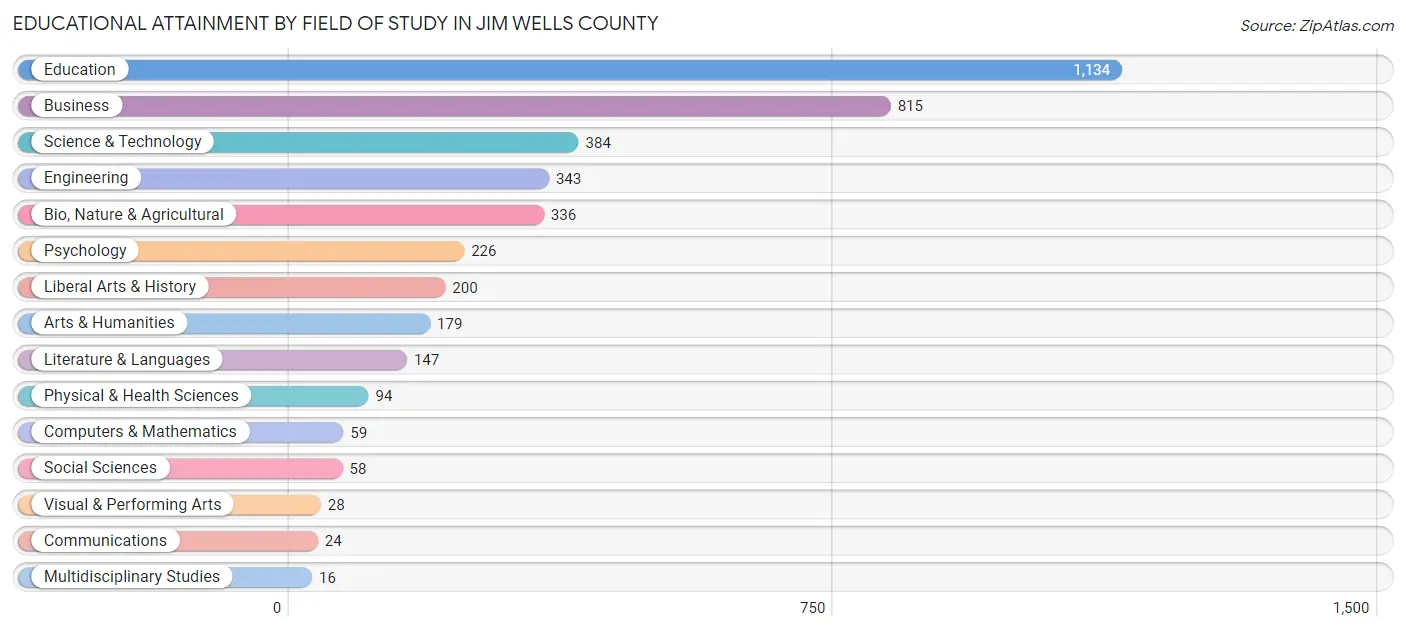
| Field of Study | # Graduates | % Graduates |
| Computers & Mathematics | 59 | 1.5% |
| Bio, Nature & Agricultural | 336 | 8.3% |
| Physical & Health Sciences | 94 | 2.3% |
| Psychology | 226 | 5.6% |
| Social Sciences | 58 | 1.4% |
| Engineering | 343 | 8.5% |
| Multidisciplinary Studies | 16 | 0.4% |
| Science & Technology | 384 | 9.5% |
| Business | 815 | 20.2% |
| Education | 1,134 | 28.1% |
| Literature & Languages | 147 | 3.6% |
| Liberal Arts & History | 200 | 5.0% |
| Visual & Performing Arts | 28 | 0.7% |
| Communications | 24 | 0.6% |
| Arts & Humanities | 179 | 4.4% |
| Total | 4,043 | 100.0% |
Transportation & Commute in Jim Wells County
Vehicle Availability by Sex in Jim Wells County
The most prevalent vehicle ownership categories in Jim Wells County are males with 2 vehicles (3,334, accounting for 42.6%) and females with 2 vehicles (2,584, making up 47.9%).
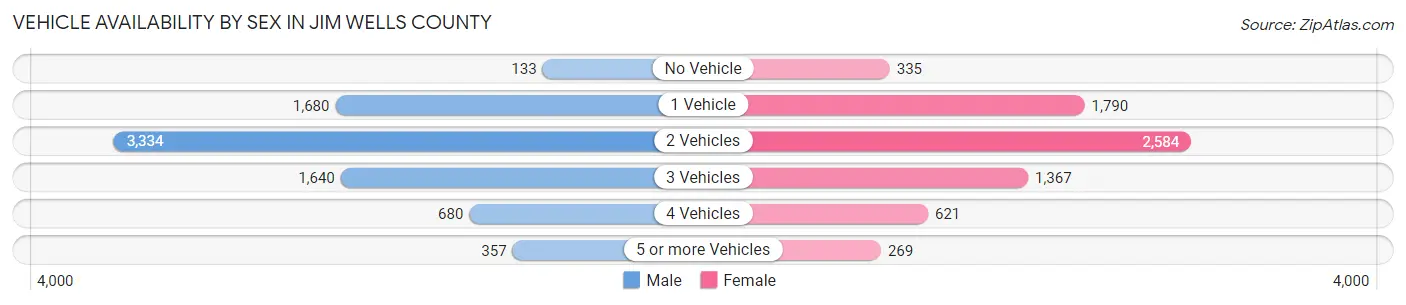
| Vehicles Available | Male | Female |
| No Vehicle | 133 (1.7%) | 335 (4.8%) |
| 1 Vehicle | 1,680 (21.5%) | 1,790 (25.7%) |
| 2 Vehicles | 3,334 (42.6%) | 2,584 (37.1%) |
| 3 Vehicles | 1,640 (21.0%) | 1,367 (19.6%) |
| 4 Vehicles | 680 (8.7%) | 621 (8.9%) |
| 5 or more Vehicles | 357 (4.6%) | 269 (3.9%) |
| Total | 7,824 (100.0%) | 6,966 (100.0%) |
Commute Time in Jim Wells County
The most frequently occuring commute durations in Jim Wells County are 15 to 19 minutes (2,860 commuters, 20.9%), 10 to 14 minutes (2,108 commuters, 15.4%), and 5 to 9 minutes (1,927 commuters, 14.1%).
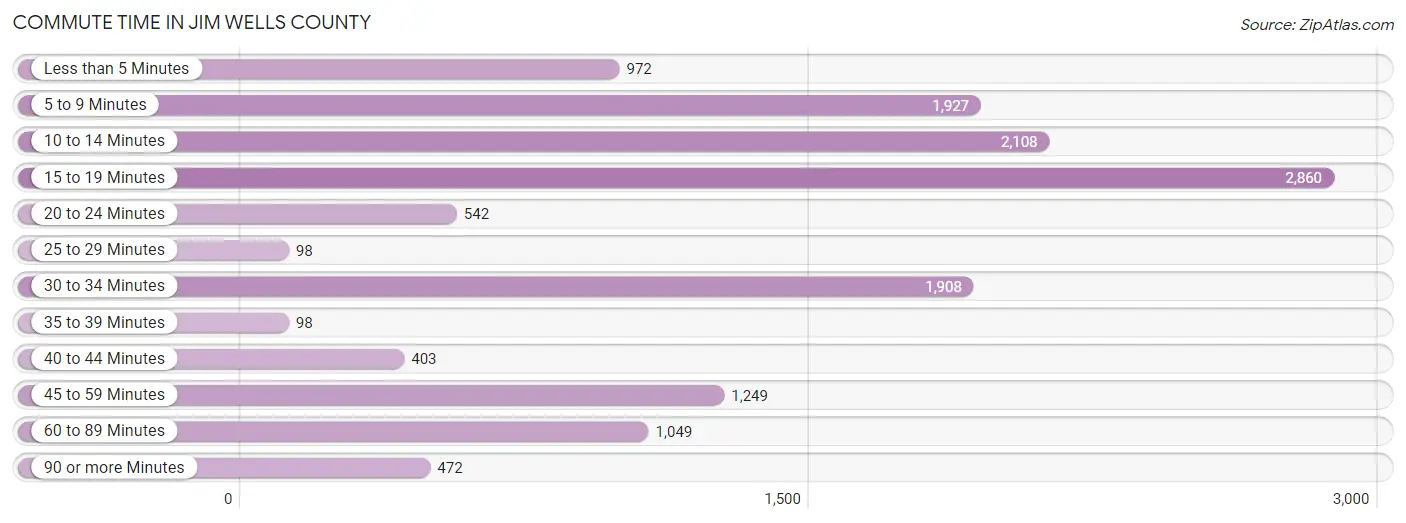
| Commute Time | # Commuters | % Commuters |
| Less than 5 Minutes | 972 | 7.1% |
| 5 to 9 Minutes | 1,927 | 14.1% |
| 10 to 14 Minutes | 2,108 | 15.4% |
| 15 to 19 Minutes | 2,860 | 20.9% |
| 20 to 24 Minutes | 542 | 4.0% |
| 25 to 29 Minutes | 98 | 0.7% |
| 30 to 34 Minutes | 1,908 | 13.9% |
| 35 to 39 Minutes | 98 | 0.7% |
| 40 to 44 Minutes | 403 | 2.9% |
| 45 to 59 Minutes | 1,249 | 9.1% |
| 60 to 89 Minutes | 1,049 | 7.7% |
| 90 or more Minutes | 472 | 3.5% |
Commute Time by Sex in Jim Wells County
The most common commute times in Jim Wells County are 15 to 19 minutes (1,181 commuters, 16.3%) for males and 15 to 19 minutes (1,679 commuters, 26.1%) for females.
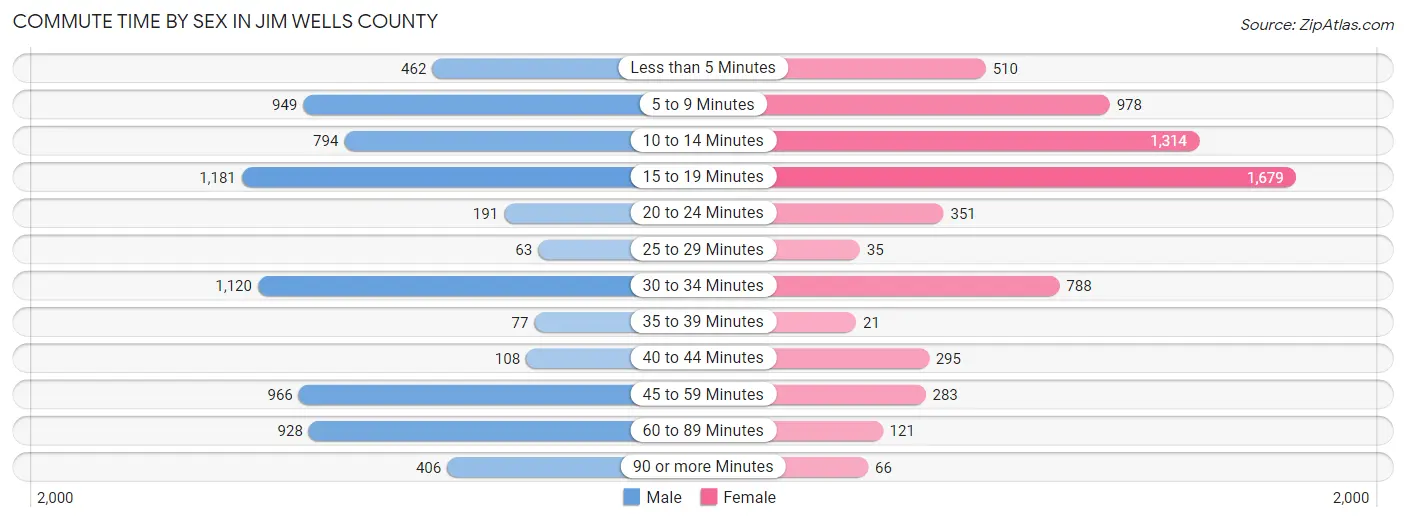
| Commute Time | Male | Female |
| Less than 5 Minutes | 462 (6.4%) | 510 (7.9%) |
| 5 to 9 Minutes | 949 (13.1%) | 978 (15.2%) |
| 10 to 14 Minutes | 794 (11.0%) | 1,314 (20.4%) |
| 15 to 19 Minutes | 1,181 (16.3%) | 1,679 (26.1%) |
| 20 to 24 Minutes | 191 (2.6%) | 351 (5.4%) |
| 25 to 29 Minutes | 63 (0.9%) | 35 (0.5%) |
| 30 to 34 Minutes | 1,120 (15.5%) | 788 (12.2%) |
| 35 to 39 Minutes | 77 (1.1%) | 21 (0.3%) |
| 40 to 44 Minutes | 108 (1.5%) | 295 (4.6%) |
| 45 to 59 Minutes | 966 (13.3%) | 283 (4.4%) |
| 60 to 89 Minutes | 928 (12.8%) | 121 (1.9%) |
| 90 or more Minutes | 406 (5.6%) | 66 (1.0%) |
Time of Departure to Work by Sex in Jim Wells County
The most frequent times of departure to work in Jim Wells County are 7:00 AM to 7:29 AM (1,263, 17.4%) for males and 7:30 AM to 7:59 AM (1,569, 24.4%) for females.
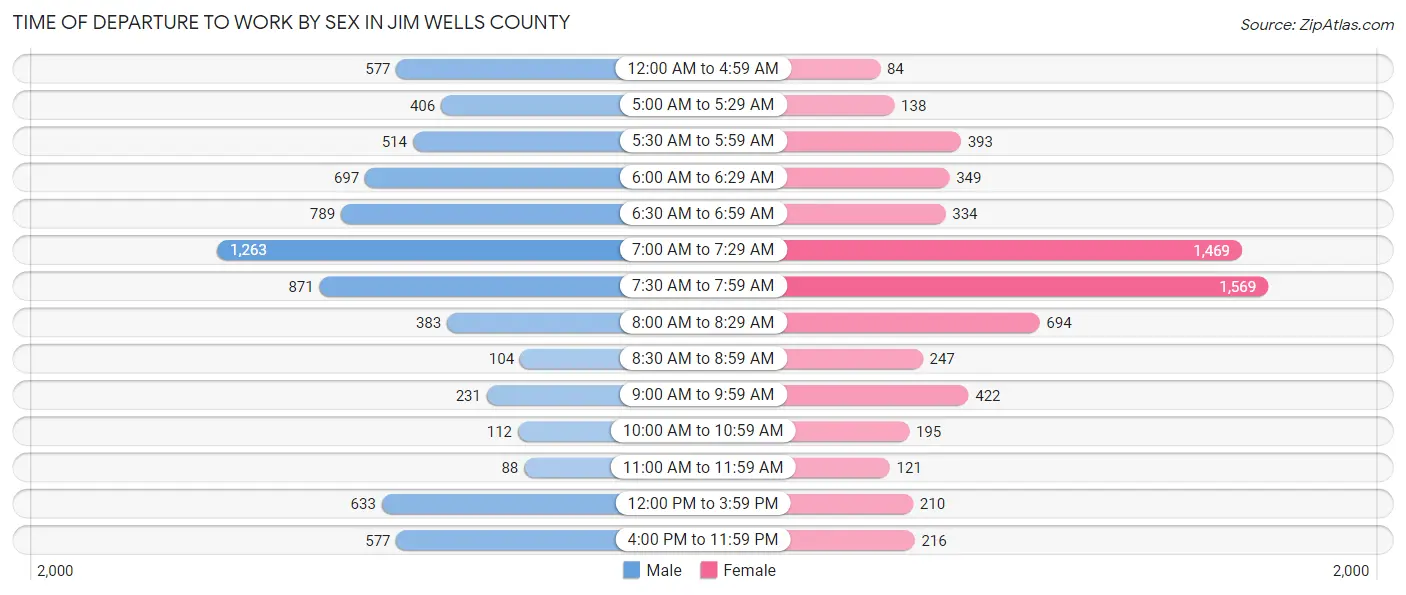
| Time of Departure | Male | Female |
| 12:00 AM to 4:59 AM | 577 (8.0%) | 84 (1.3%) |
| 5:00 AM to 5:29 AM | 406 (5.6%) | 138 (2.1%) |
| 5:30 AM to 5:59 AM | 514 (7.1%) | 393 (6.1%) |
| 6:00 AM to 6:29 AM | 697 (9.6%) | 349 (5.4%) |
| 6:30 AM to 6:59 AM | 789 (10.9%) | 334 (5.2%) |
| 7:00 AM to 7:29 AM | 1,263 (17.4%) | 1,469 (22.8%) |
| 7:30 AM to 7:59 AM | 871 (12.0%) | 1,569 (24.4%) |
| 8:00 AM to 8:29 AM | 383 (5.3%) | 694 (10.8%) |
| 8:30 AM to 8:59 AM | 104 (1.4%) | 247 (3.8%) |
| 9:00 AM to 9:59 AM | 231 (3.2%) | 422 (6.6%) |
| 10:00 AM to 10:59 AM | 112 (1.5%) | 195 (3.0%) |
| 11:00 AM to 11:59 AM | 88 (1.2%) | 121 (1.9%) |
| 12:00 PM to 3:59 PM | 633 (8.7%) | 210 (3.3%) |
| 4:00 PM to 11:59 PM | 577 (8.0%) | 216 (3.4%) |
| Total | 7,245 (100.0%) | 6,441 (100.0%) |
Housing Occupancy in Jim Wells County
Occupancy by Ownership in Jim Wells County
Of the total 12,914 dwellings in Jim Wells County, owner-occupied units account for 8,774 (67.9%), while renter-occupied units make up 4,140 (32.1%).
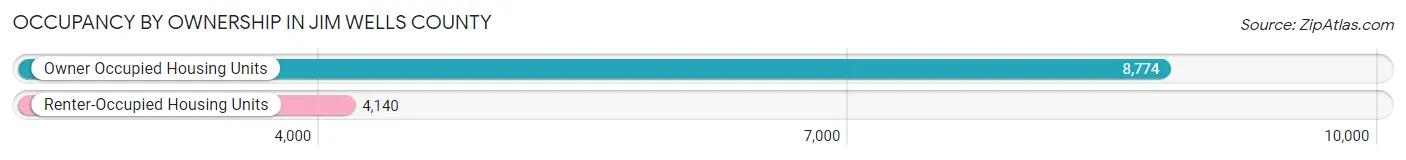
| Occupancy | # Housing Units | % Housing Units |
| Owner Occupied Housing Units | 8,774 | 67.9% |
| Renter-Occupied Housing Units | 4,140 | 32.1% |
| Total Occupied Housing Units | 12,914 | 100.0% |
Occupancy by Household Size in Jim Wells County
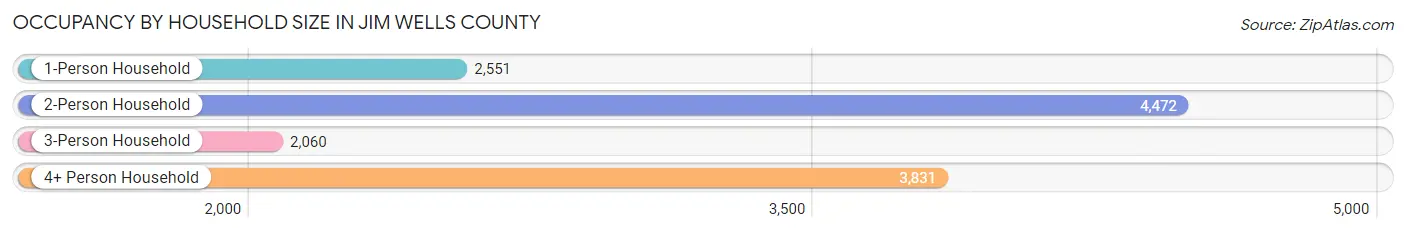
| Household Size | # Housing Units | % Housing Units |
| 1-Person Household | 2,551 | 19.8% |
| 2-Person Household | 4,472 | 34.6% |
| 3-Person Household | 2,060 | 16.0% |
| 4+ Person Household | 3,831 | 29.7% |
| Total Housing Units | 12,914 | 100.0% |
Occupancy by Ownership by Household Size in Jim Wells County
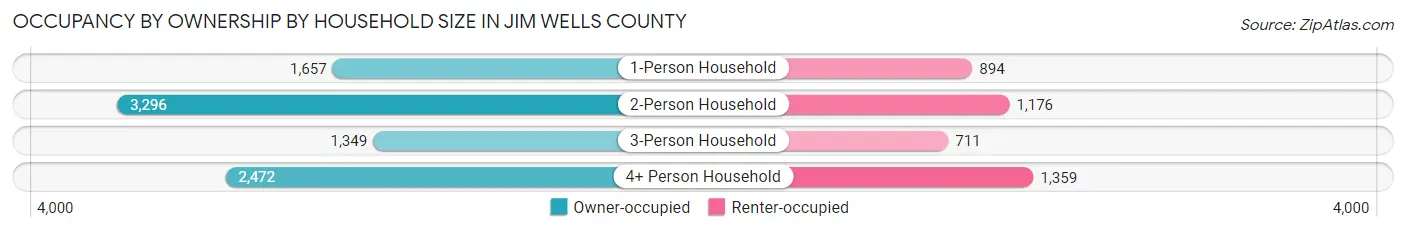
| Household Size | Owner-occupied | Renter-occupied |
| 1-Person Household | 1,657 (64.9%) | 894 (35.0%) |
| 2-Person Household | 3,296 (73.7%) | 1,176 (26.3%) |
| 3-Person Household | 1,349 (65.5%) | 711 (34.5%) |
| 4+ Person Household | 2,472 (64.5%) | 1,359 (35.5%) |
| Total Housing Units | 8,774 (67.9%) | 4,140 (32.1%) |
Occupancy by Educational Attainment in Jim Wells County
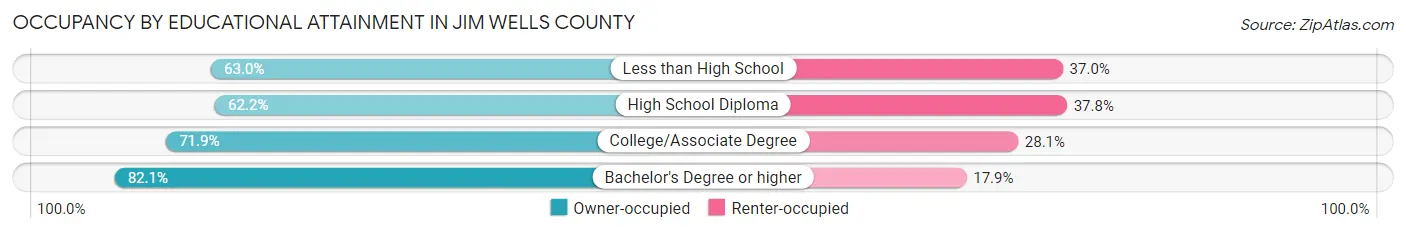
| Household Size | Owner-occupied | Renter-occupied |
| Less than High School | 2,078 (63.0%) | 1,219 (37.0%) |
| High School Diploma | 2,708 (62.2%) | 1,644 (37.8%) |
| College/Associate Degree | 2,366 (71.9%) | 924 (28.1%) |
| Bachelor's Degree or higher | 1,622 (82.1%) | 353 (17.9%) |
Occupancy by Age of Householder in Jim Wells County
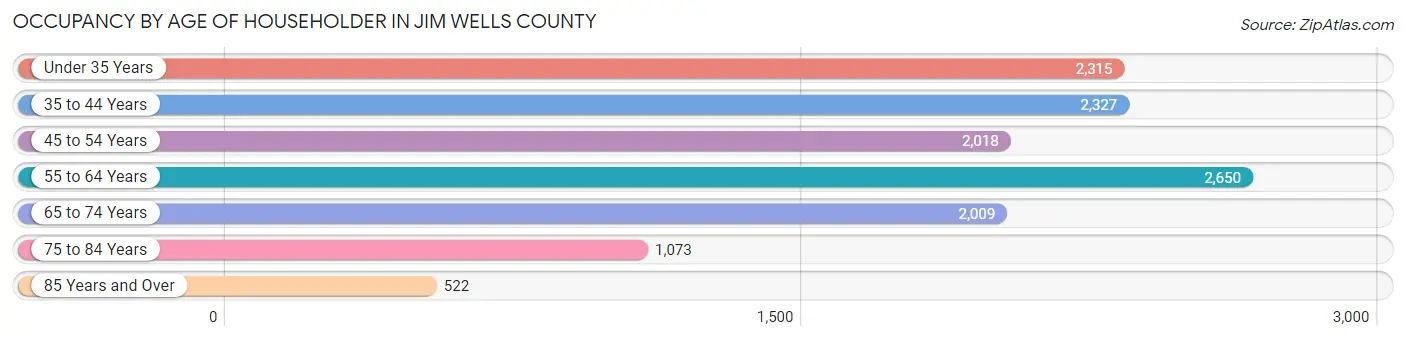
| Age Bracket | # Households | % Households |
| Under 35 Years | 2,315 | 17.9% |
| 35 to 44 Years | 2,327 | 18.0% |
| 45 to 54 Years | 2,018 | 15.6% |
| 55 to 64 Years | 2,650 | 20.5% |
| 65 to 74 Years | 2,009 | 15.6% |
| 75 to 84 Years | 1,073 | 8.3% |
| 85 Years and Over | 522 | 4.0% |
| Total | 12,914 | 100.0% |
Housing Finances in Jim Wells County
Median Income by Occupancy in Jim Wells County
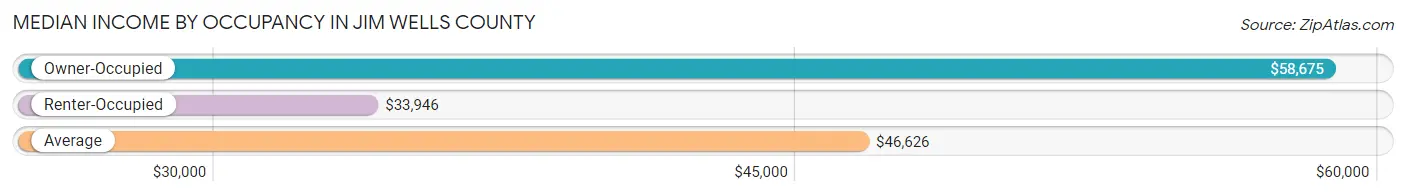
| Occupancy Type | # Households | Median Income |
| Owner-Occupied | 8,774 (67.9%) | $58,675 |
| Renter-Occupied | 4,140 (32.1%) | $33,946 |
| Average | 12,914 (100.0%) | $46,626 |
Occupancy by Householder Income Bracket in Jim Wells County
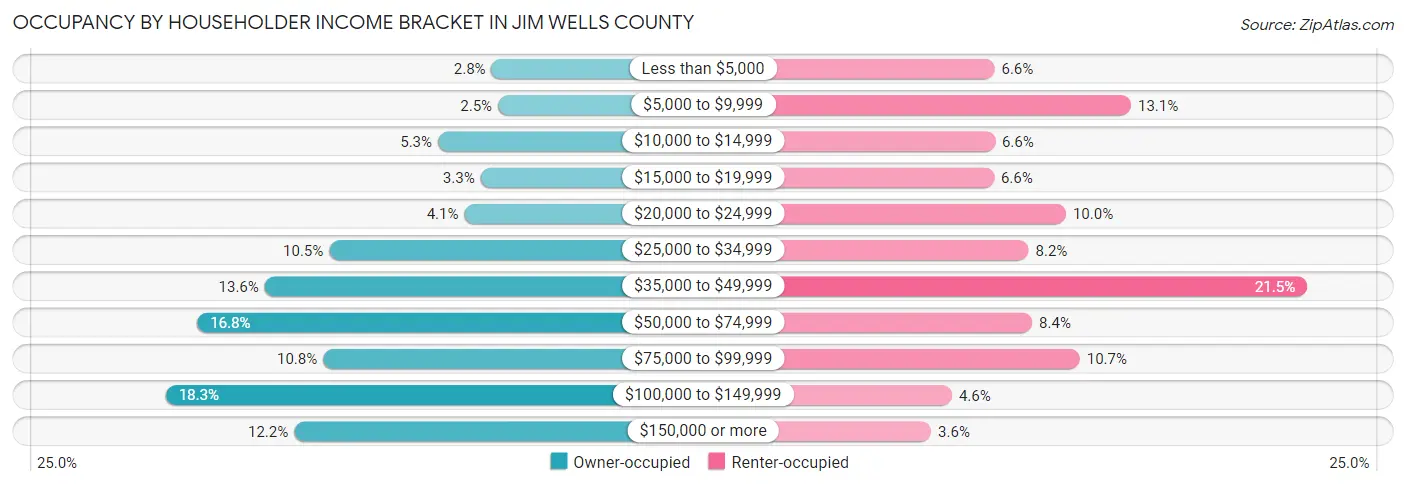
| Income Bracket | Owner-occupied | Renter-occupied |
| Less than $5,000 | 243 (2.8%) | 274 (6.6%) |
| $5,000 to $9,999 | 216 (2.5%) | 543 (13.1%) |
| $10,000 to $14,999 | 467 (5.3%) | 275 (6.6%) |
| $15,000 to $19,999 | 289 (3.3%) | 273 (6.6%) |
| $20,000 to $24,999 | 356 (4.1%) | 415 (10.0%) |
| $25,000 to $34,999 | 921 (10.5%) | 341 (8.2%) |
| $35,000 to $49,999 | 1,191 (13.6%) | 890 (21.5%) |
| $50,000 to $74,999 | 1,472 (16.8%) | 348 (8.4%) |
| $75,000 to $99,999 | 947 (10.8%) | 442 (10.7%) |
| $100,000 to $149,999 | 1,604 (18.3%) | 190 (4.6%) |
| $150,000 or more | 1,068 (12.2%) | 149 (3.6%) |
| Total | 8,774 (100.0%) | 4,140 (100.0%) |
Monthly Housing Cost Tiers in Jim Wells County
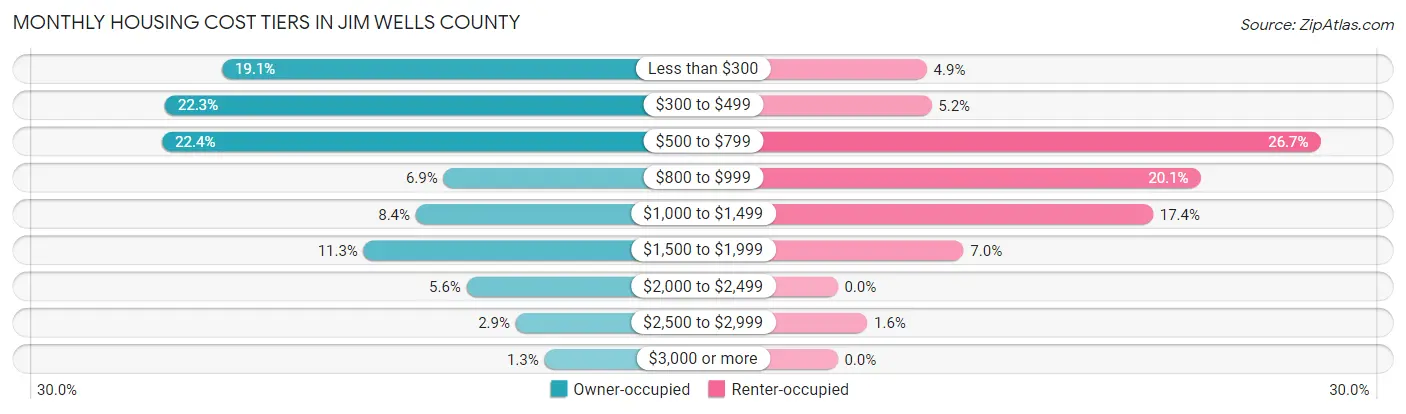
| Monthly Cost | Owner-occupied | Renter-occupied |
| Less than $300 | 1,676 (19.1%) | 204 (4.9%) |
| $300 to $499 | 1,952 (22.3%) | 215 (5.2%) |
| $500 to $799 | 1,965 (22.4%) | 1,104 (26.7%) |
| $800 to $999 | 602 (6.9%) | 830 (20.1%) |
| $1,000 to $1,499 | 736 (8.4%) | 721 (17.4%) |
| $1,500 to $1,999 | 989 (11.3%) | 288 (7.0%) |
| $2,000 to $2,499 | 490 (5.6%) | 0 (0.0%) |
| $2,500 to $2,999 | 252 (2.9%) | 68 (1.6%) |
| $3,000 or more | 112 (1.3%) | 0 (0.0%) |
| Total | 8,774 (100.0%) | 4,140 (100.0%) |
Physical Housing Characteristics in Jim Wells County
Housing Structures in Jim Wells County
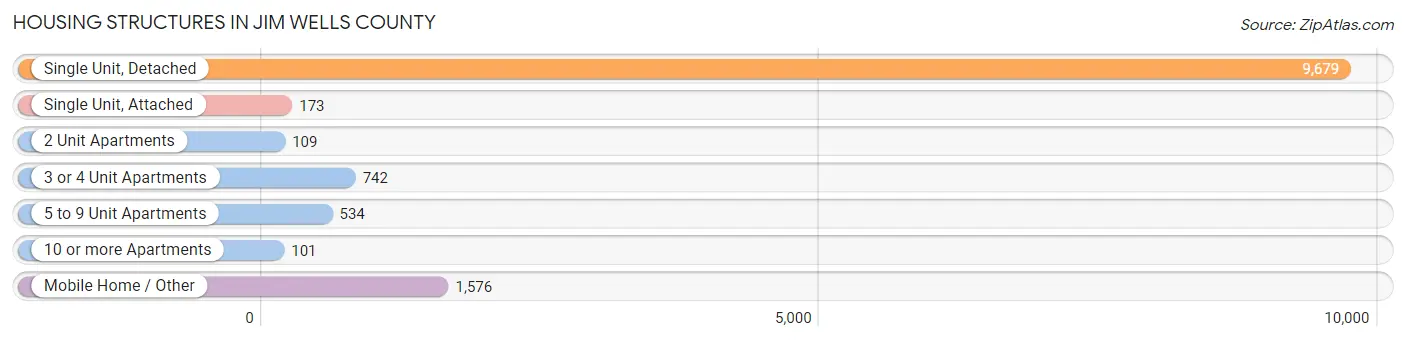
| Structure Type | # Housing Units | % Housing Units |
| Single Unit, Detached | 9,679 | 75.0% |
| Single Unit, Attached | 173 | 1.3% |
| 2 Unit Apartments | 109 | 0.8% |
| 3 or 4 Unit Apartments | 742 | 5.8% |
| 5 to 9 Unit Apartments | 534 | 4.1% |
| 10 or more Apartments | 101 | 0.8% |
| Mobile Home / Other | 1,576 | 12.2% |
| Total | 12,914 | 100.0% |
Housing Structures by Occupancy in Jim Wells County
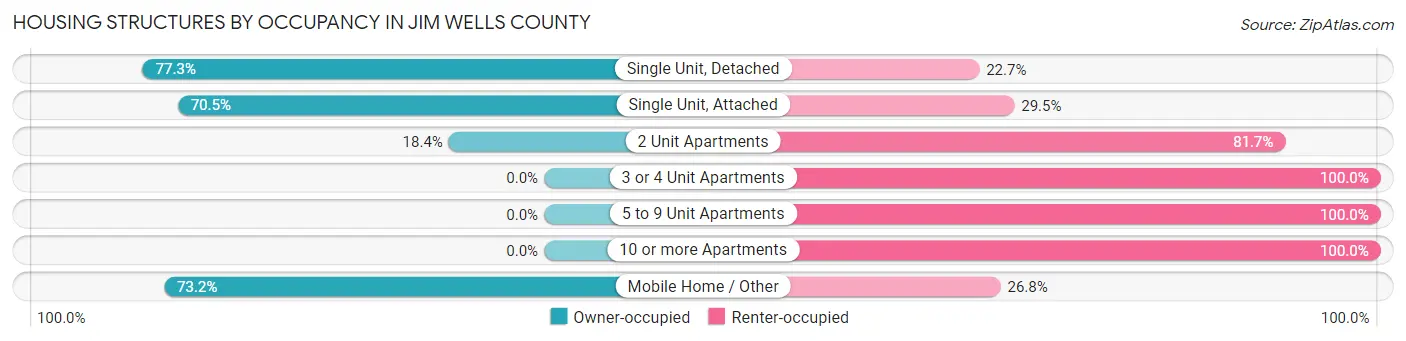
| Structure Type | Owner-occupied | Renter-occupied |
| Single Unit, Detached | 7,479 (77.3%) | 2,200 (22.7%) |
| Single Unit, Attached | 122 (70.5%) | 51 (29.5%) |
| 2 Unit Apartments | 20 (18.3%) | 89 (81.7%) |
| 3 or 4 Unit Apartments | 0 (0.0%) | 742 (100.0%) |
| 5 to 9 Unit Apartments | 0 (0.0%) | 534 (100.0%) |
| 10 or more Apartments | 0 (0.0%) | 101 (100.0%) |
| Mobile Home / Other | 1,153 (73.2%) | 423 (26.8%) |
| Total | 8,774 (67.9%) | 4,140 (32.1%) |
Housing Structures by Number of Rooms in Jim Wells County
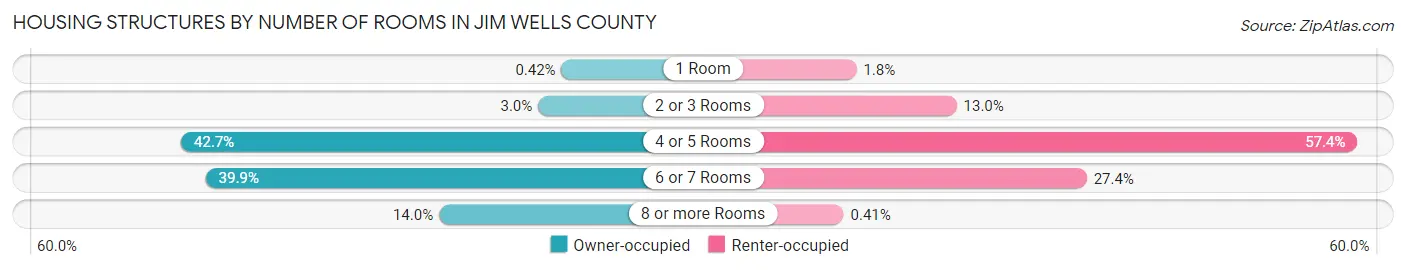
| Number of Rooms | Owner-occupied | Renter-occupied |
| 1 Room | 37 (0.4%) | 76 (1.8%) |
| 2 or 3 Rooms | 264 (3.0%) | 536 (13.0%) |
| 4 or 5 Rooms | 3,742 (42.6%) | 2,377 (57.4%) |
| 6 or 7 Rooms | 3,502 (39.9%) | 1,134 (27.4%) |
| 8 or more Rooms | 1,229 (14.0%) | 17 (0.4%) |
| Total | 8,774 (100.0%) | 4,140 (100.0%) |
Housing Structure by Heating Type in Jim Wells County
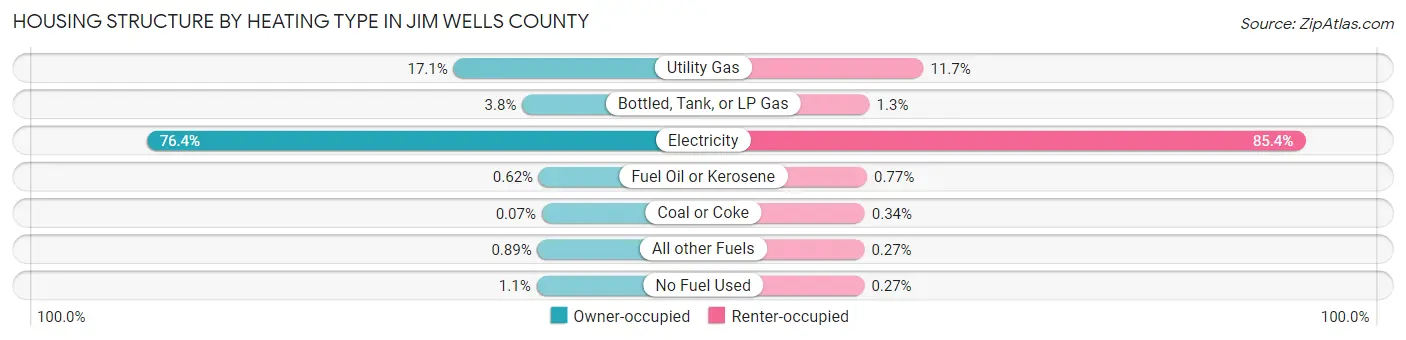
| Heating Type | Owner-occupied | Renter-occupied |
| Utility Gas | 1,501 (17.1%) | 484 (11.7%) |
| Bottled, Tank, or LP Gas | 337 (3.8%) | 53 (1.3%) |
| Electricity | 6,703 (76.4%) | 3,535 (85.4%) |
| Fuel Oil or Kerosene | 54 (0.6%) | 32 (0.8%) |
| Coal or Coke | 6 (0.1%) | 14 (0.3%) |
| All other Fuels | 78 (0.9%) | 11 (0.3%) |
| No Fuel Used | 95 (1.1%) | 11 (0.3%) |
| Total | 8,774 (100.0%) | 4,140 (100.0%) |
Household Vehicle Usage in Jim Wells County
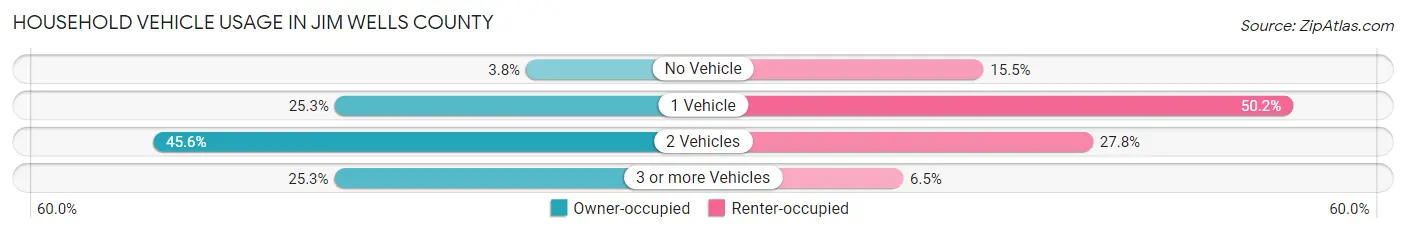
| Vehicles per Household | Owner-occupied | Renter-occupied |
| No Vehicle | 337 (3.8%) | 642 (15.5%) |
| 1 Vehicle | 2,216 (25.3%) | 2,078 (50.2%) |
| 2 Vehicles | 4,001 (45.6%) | 1,150 (27.8%) |
| 3 or more Vehicles | 2,220 (25.3%) | 270 (6.5%) |
| Total | 8,774 (100.0%) | 4,140 (100.0%) |
Real Estate & Mortgages in Jim Wells County
Real Estate and Mortgage Overview in Jim Wells County
| Characteristic | Without Mortgage | With Mortgage |
| Housing Units | 5,731 | 3,043 |
| Median Property Value | $72,300 | $162,100 |
| Median Household Income | $44,145 | $587 |
| Monthly Housing Costs | $421 | $112 |
| Real Estate Taxes | $768 | $355 |
Property Value by Mortgage Status in Jim Wells County
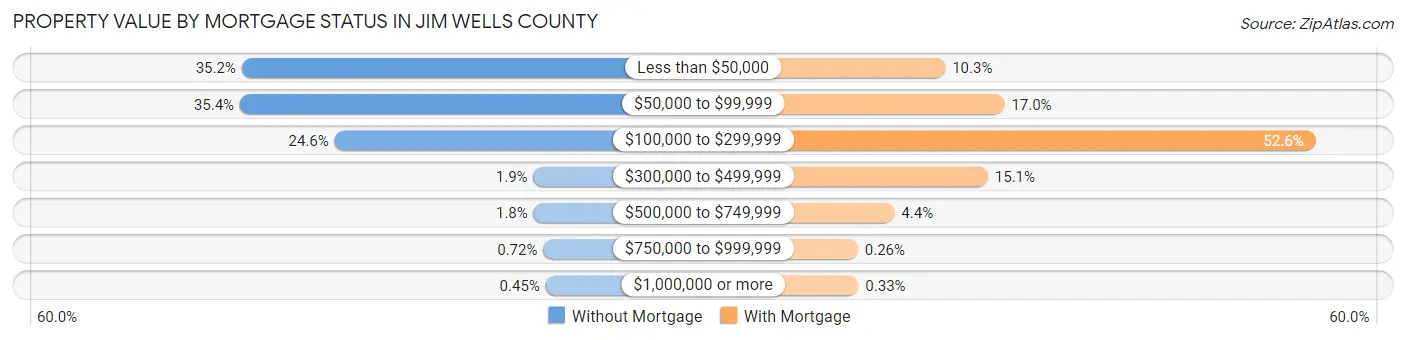
| Property Value | Without Mortgage | With Mortgage |
| Less than $50,000 | 2,017 (35.2%) | 312 (10.2%) |
| $50,000 to $99,999 | 2,028 (35.4%) | 518 (17.0%) |
| $100,000 to $299,999 | 1,408 (24.6%) | 1,600 (52.6%) |
| $300,000 to $499,999 | 106 (1.8%) | 460 (15.1%) |
| $500,000 to $749,999 | 105 (1.8%) | 135 (4.4%) |
| $750,000 to $999,999 | 41 (0.7%) | 8 (0.3%) |
| $1,000,000 or more | 26 (0.4%) | 10 (0.3%) |
| Total | 5,731 (100.0%) | 3,043 (100.0%) |
Household Income by Mortgage Status in Jim Wells County
| Household Income | Without Mortgage | With Mortgage |
| Less than $10,000 | 407 (7.1%) | 12 (0.4%) |
| $10,000 to $24,999 | 925 (16.1%) | 52 (1.7%) |
| $25,000 to $34,999 | 748 (13.1%) | 187 (6.1%) |
| $35,000 to $49,999 | 940 (16.4%) | 173 (5.7%) |
| $50,000 to $74,999 | 1,046 (18.2%) | 251 (8.3%) |
| $75,000 to $99,999 | 500 (8.7%) | 426 (14.0%) |
| $100,000 to $149,999 | 684 (11.9%) | 447 (14.7%) |
| $150,000 or more | 481 (8.4%) | 920 (30.2%) |
| Total | 5,731 (100.0%) | 3,043 (100.0%) |
Property Value to Household Income Ratio in Jim Wells County
| Value-to-Income Ratio | Without Mortgage | With Mortgage |
| Less than 2.0x | 3,377 (58.9%) | 98,902 (3,250.2%) |
| 2.0x to 2.9x | 952 (16.6%) | 1,891 (62.1%) |
| 3.0x to 3.9x | 429 (7.5%) | 570 (18.7%) |
| 4.0x or more | 828 (14.4%) | 173 (5.7%) |
| Total | 5,731 (100.0%) | 3,043 (100.0%) |
Real Estate Taxes by Mortgage Status in Jim Wells County
| Property Taxes | Without Mortgage | With Mortgage |
| Less than $800 | 2,840 (49.6%) | 52 (1.7%) |
| $800 to $1,499 | 1,161 (20.3%) | 552 (18.1%) |
| $800 to $1,499 | 1,507 (26.3%) | 323 (10.6%) |
| Total | 5,731 (100.0%) | 3,043 (100.0%) |
Health & Disability in Jim Wells County
Health Insurance Coverage by Age in Jim Wells County
| Age Bracket | With Coverage | Without Coverage |
| Under 6 Years | 2,874 (91.4%) | 271 (8.6%) |
| 6 to 18 Years | 6,917 (86.1%) | 1,113 (13.9%) |
| 19 to 25 Years | 2,425 (64.7%) | 1,320 (35.2%) |
| 26 to 34 Years | 2,576 (61.8%) | 1,590 (38.2%) |
| 35 to 44 Years | 3,501 (69.5%) | 1,539 (30.5%) |
| 45 to 54 Years | 3,275 (78.2%) | 913 (21.8%) |
| 55 to 64 Years | 3,461 (78.1%) | 969 (21.9%) |
| 65 to 74 Years | 3,420 (96.6%) | 119 (3.4%) |
| 75 Years and older | 2,404 (100.0%) | 0 (0.0%) |
| Total | 30,853 (79.7%) | 7,834 (20.3%) |
Health Insurance Coverage by Citizenship Status in Jim Wells County
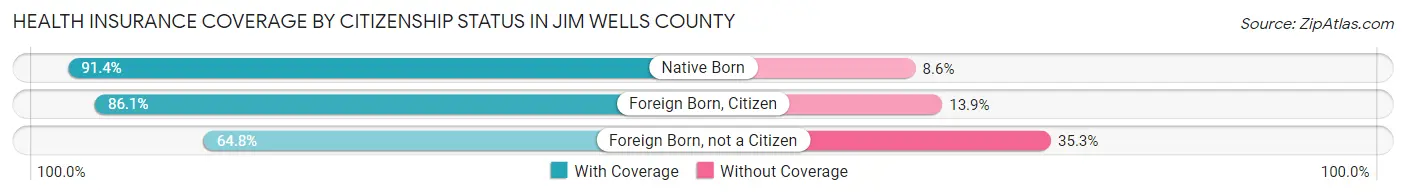
| Citizenship Status | With Coverage | Without Coverage |
| Native Born | 2,874 (91.4%) | 271 (8.6%) |
| Foreign Born, Citizen | 6,917 (86.1%) | 1,113 (13.9%) |
| Foreign Born, not a Citizen | 2,425 (64.7%) | 1,320 (35.2%) |
Health Insurance Coverage by Household Income in Jim Wells County
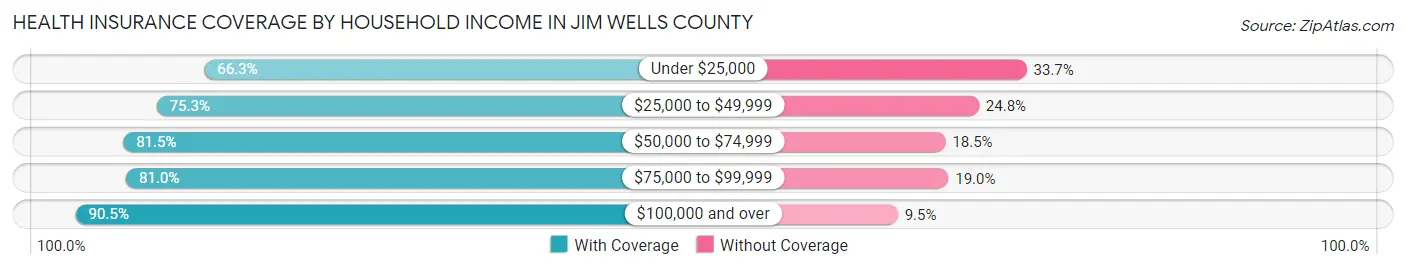
| Household Income | With Coverage | Without Coverage |
| Under $25,000 | 5,092 (66.3%) | 2,587 (33.7%) |
| $25,000 to $49,999 | 6,913 (75.2%) | 2,274 (24.7%) |
| $50,000 to $74,999 | 4,536 (81.5%) | 1,028 (18.5%) |
| $75,000 to $99,999 | 3,359 (81.0%) | 789 (19.0%) |
| $100,000 and over | 10,928 (90.5%) | 1,152 (9.5%) |
Public vs Private Health Insurance Coverage by Age in Jim Wells County
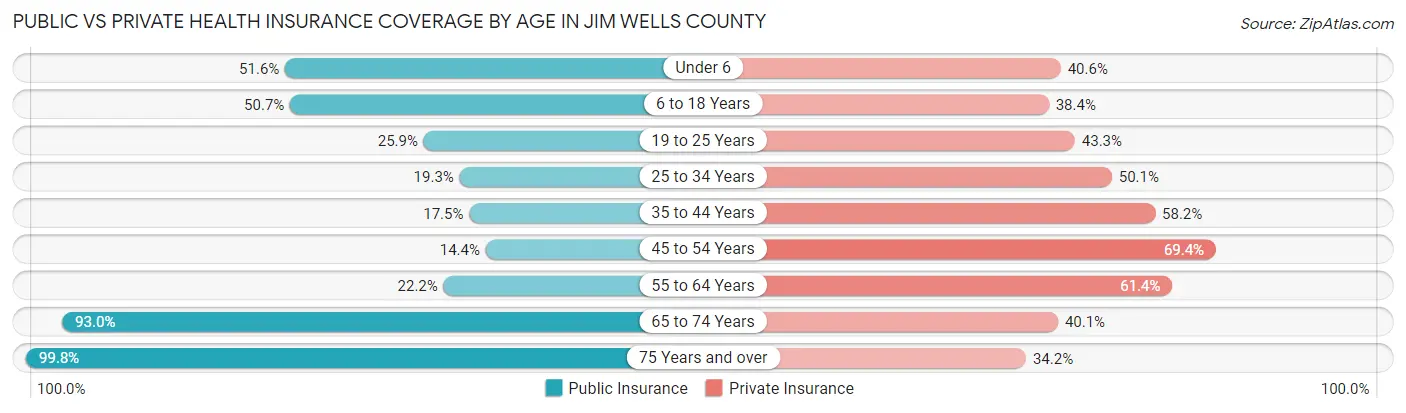
| Age Bracket | Public Insurance | Private Insurance |
| Under 6 | 1,624 (51.6%) | 1,278 (40.6%) |
| 6 to 18 Years | 4,072 (50.7%) | 3,084 (38.4%) |
| 19 to 25 Years | 970 (25.9%) | 1,620 (43.3%) |
| 25 to 34 Years | 802 (19.3%) | 2,088 (50.1%) |
| 35 to 44 Years | 880 (17.5%) | 2,931 (58.2%) |
| 45 to 54 Years | 603 (14.4%) | 2,908 (69.4%) |
| 55 to 64 Years | 985 (22.2%) | 2,718 (61.4%) |
| 65 to 74 Years | 3,292 (93.0%) | 1,420 (40.1%) |
| 75 Years and over | 2,398 (99.8%) | 822 (34.2%) |
| Total | 15,626 (40.4%) | 18,869 (48.8%) |
Disability Status by Sex by Age in Jim Wells County
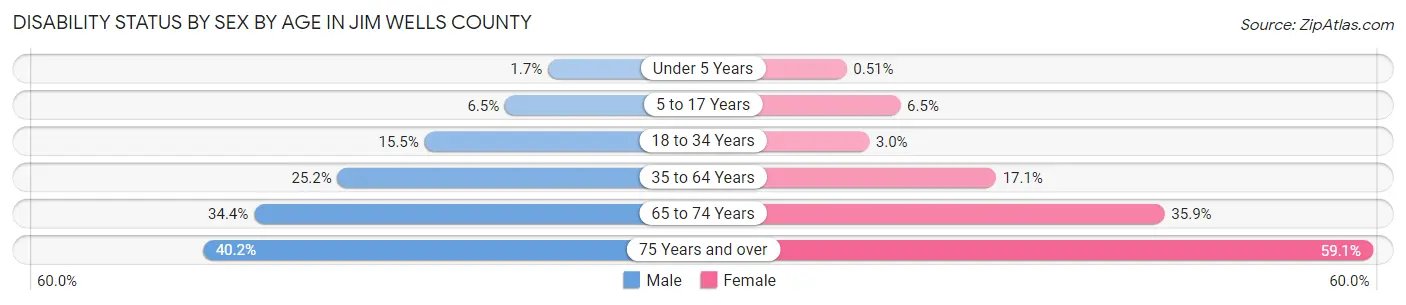
| Age Bracket | Male | Female |
| Under 5 Years | 22 (1.7%) | 7 (0.5%) |
| 5 to 17 Years | 263 (6.5%) | 249 (6.5%) |
| 18 to 34 Years | 678 (15.4%) | 125 (3.0%) |
| 35 to 64 Years | 1,711 (25.2%) | 1,175 (17.1%) |
| 65 to 74 Years | 590 (34.4%) | 656 (35.9%) |
| 75 Years and over | 412 (40.2%) | 815 (59.1%) |
Disability Class by Sex by Age in Jim Wells County
Disability Class: Hearing Difficulty
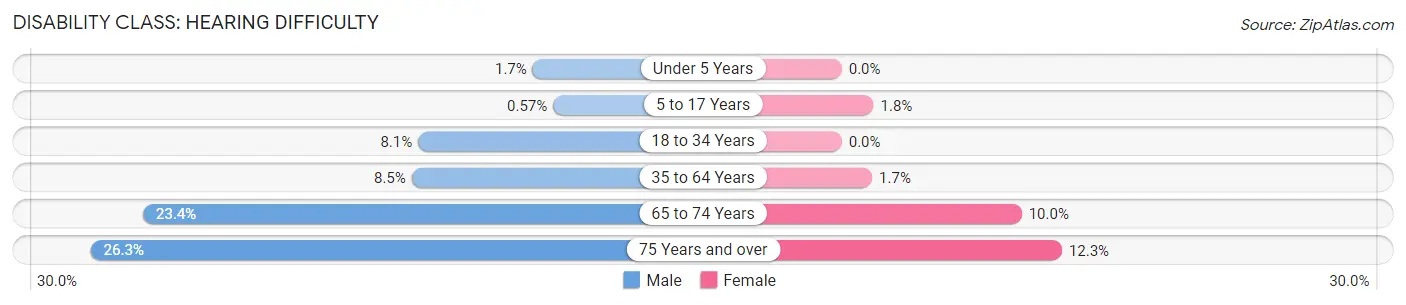
| Age Bracket | Male | Female |
| Under 5 Years | 22 (1.7%) | 0 (0.0%) |
| 5 to 17 Years | 23 (0.6%) | 68 (1.8%) |
| 18 to 34 Years | 355 (8.1%) | 0 (0.0%) |
| 35 to 64 Years | 575 (8.5%) | 116 (1.7%) |
| 65 to 74 Years | 401 (23.4%) | 183 (10.0%) |
| 75 Years and over | 270 (26.3%) | 169 (12.3%) |
Disability Class: Vision Difficulty
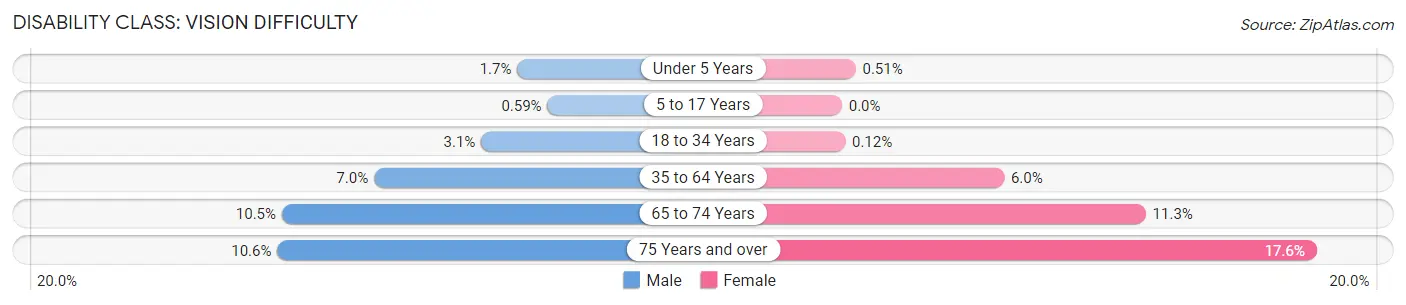
| Age Bracket | Male | Female |
| Under 5 Years | 22 (1.7%) | 7 (0.5%) |
| 5 to 17 Years | 24 (0.6%) | 0 (0.0%) |
| 18 to 34 Years | 134 (3.0%) | 5 (0.1%) |
| 35 to 64 Years | 478 (7.0%) | 413 (6.0%) |
| 65 to 74 Years | 179 (10.4%) | 206 (11.3%) |
| 75 Years and over | 109 (10.6%) | 243 (17.6%) |
Disability Class: Cognitive Difficulty
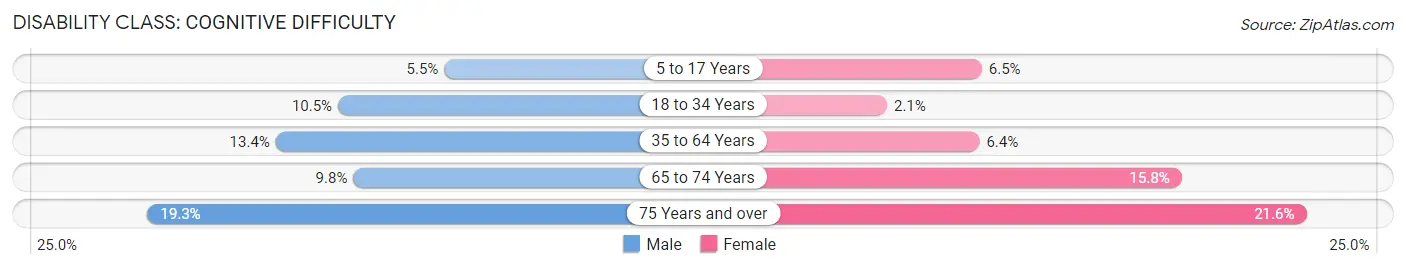
| Age Bracket | Male | Female |
| 5 to 17 Years | 224 (5.5%) | 249 (6.5%) |
| 18 to 34 Years | 459 (10.5%) | 87 (2.1%) |
| 35 to 64 Years | 908 (13.4%) | 438 (6.4%) |
| 65 to 74 Years | 167 (9.8%) | 288 (15.8%) |
| 75 Years and over | 198 (19.3%) | 297 (21.5%) |
Disability Class: Ambulatory Difficulty
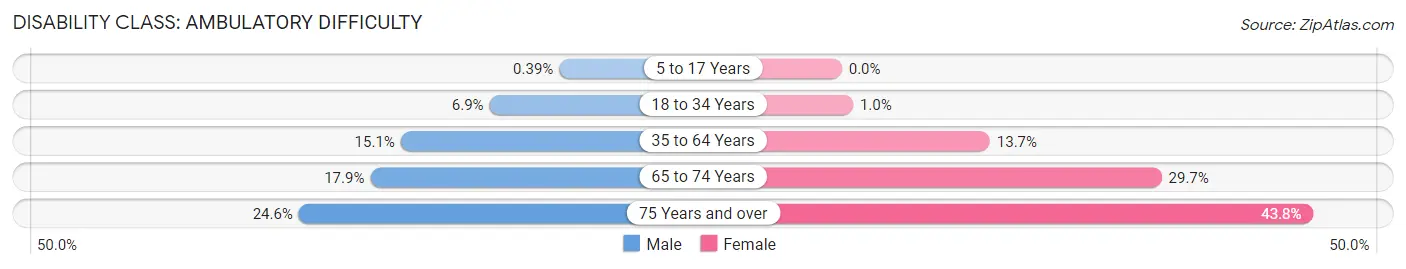
| Age Bracket | Male | Female |
| 5 to 17 Years | 16 (0.4%) | 0 (0.0%) |
| 18 to 34 Years | 301 (6.9%) | 43 (1.0%) |
| 35 to 64 Years | 1,027 (15.1%) | 942 (13.7%) |
| 65 to 74 Years | 307 (17.9%) | 542 (29.7%) |
| 75 Years and over | 252 (24.6%) | 603 (43.8%) |
Disability Class: Self-Care Difficulty
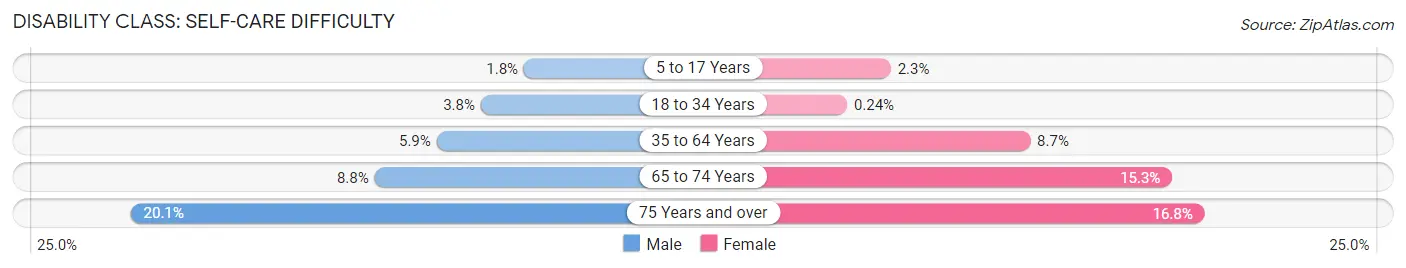
| Age Bracket | Male | Female |
| 5 to 17 Years | 74 (1.8%) | 87 (2.3%) |
| 18 to 34 Years | 168 (3.8%) | 10 (0.2%) |
| 35 to 64 Years | 400 (5.9%) | 599 (8.7%) |
| 65 to 74 Years | 150 (8.8%) | 280 (15.3%) |
| 75 Years and over | 206 (20.1%) | 232 (16.8%) |
Technology Access in Jim Wells County
Computing Device Access in Jim Wells County
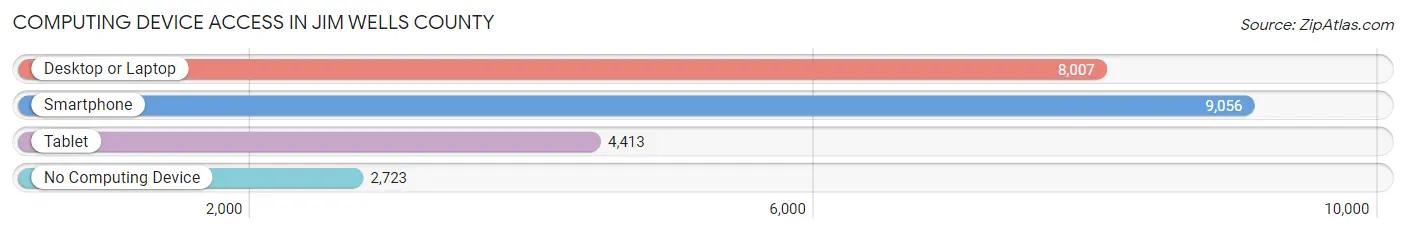
| Device Type | # Households | % Households |
| Desktop or Laptop | 8,007 | 62.0% |
| Smartphone | 9,056 | 70.1% |
| Tablet | 4,413 | 34.2% |
| No Computing Device | 2,723 | 21.1% |
| Total | 12,914 | 100.0% |
Internet Access in Jim Wells County
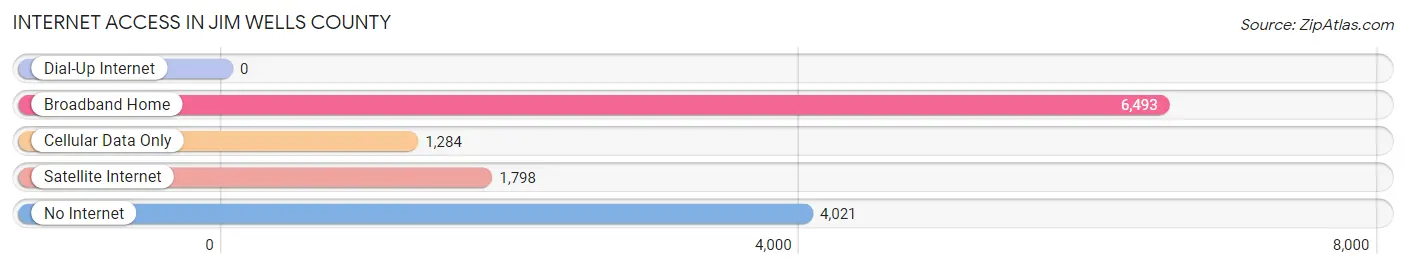
| Internet Type | # Households | % Households |
| Dial-Up Internet | 0 | 0.0% |
| Broadband Home | 6,493 | 50.3% |
| Cellular Data Only | 1,284 | 9.9% |
| Satellite Internet | 1,798 | 13.9% |
| No Internet | 4,021 | 31.1% |
| Total | 12,914 | 100.0% |
Jim Wells County Summary
Wells County, Texas is located in the South Texas Plains region of the state, and is bordered by Jim Hogg County to the north, Duval County to the east, Live Oak County to the south, and La Salle County to the west. The county seat is Alice, and the county is named for James B. Wells, Jr., a former Texas Chief Justice.
Geography
Wells County covers an area of 1,072 square miles, and is mostly flat with some rolling hills. The terrain is mostly covered in grasslands, with some areas of mesquite and cactus. The Nueces River forms the northern border of the county, and the San Diego River forms the eastern border. The county is also home to several small lakes, including Lake Corpus Christi, Lake Alice, and Lake Casa Blanca.
Climate
Wells County has a humid subtropical climate, with hot summers and mild winters. The average annual temperature is 70°F, and the average annual precipitation is 24 inches.
Demographics
As of the 2010 census, Wells County had a population of 20,824. The racial makeup of the county was 78.3% White, 0.7% African American, 0.5% Native American, 0.3% Asian, 0.1% Pacific Islander, 18.3% from other races, and 2.2% from two or more races. Hispanic or Latino of any race were 78.3% of the population.
Economy
Wells County is largely agricultural, with cotton, sorghum, and corn being the main crops. The county is also home to several oil and gas fields, and the economy is supplemented by tourism, retail, and manufacturing.
History
Wells County was established in 1876 from parts of Duval and Jim Hogg counties. The county was named for James B. Wells, Jr., a former Texas Chief Justice. The county seat was originally located in the town of Orange Grove, but was moved to Alice in 1883.
In the early 1900s, the county experienced a population boom due to the discovery of oil and gas in the area. The population peaked in 1930, when it reached 24,000. Since then, the population has steadily declined, and as of 2010, it was just over 20,000.
Today, Wells County is a largely rural area, with a focus on agriculture and oil and gas production. The county is also home to several small towns, including Alice, Orange Grove, and San Diego.
Common Questions
What is Per Capita Income in Jim Wells County?
Per Capita income in Jim Wells County is $25,030.
What is the Median Family Income in Jim Wells County?
Median Family Income in Jim Wells County is $58,764.
What is the Median Household income in Jim Wells County?
Median Household Income in Jim Wells County is $46,626.
What is Income or Wage Gap in Jim Wells County?
Income or Wage Gap in Jim Wells County is 31.9%.
Women in Jim Wells County earn 68.1 cents for every dollar earned by a man.
What is Family Income Deficit in Jim Wells County?
Family Income Deficit in Jim Wells County is $12,679.
Families that are below poverty line in Jim Wells County earn $12,679 less on average than the poverty threshold level.
What is Inequality or Gini Index in Jim Wells County?
Inequality or Gini Index in Jim Wells County is 0.47.
What is the Total Population of Jim Wells County?
Total Population of Jim Wells County is 39,060.
What is the Total Male Population of Jim Wells County?
Total Male Population of Jim Wells County is 19,461.
What is the Total Female Population of Jim Wells County?
Total Female Population of Jim Wells County is 19,599.
What is the Ratio of Males per 100 Females in Jim Wells County?
There are 99.30 Males per 100 Females in Jim Wells County.
What is the Ratio of Females per 100 Males in Jim Wells County?
There are 100.71 Females per 100 Males in Jim Wells County.
What is the Median Population Age in Jim Wells County?
Median Population Age in Jim Wells County is 35.6 Years.
What is the Average Family Size in Jim Wells County
Average Family Size in Jim Wells County is 3.5 People.
What is the Average Household Size in Jim Wells County
Average Household Size in Jim Wells County is 3.0 People.
How Large is the Labor Force in Jim Wells County?
There are 15,853 People in the Labor Forcein in Jim Wells County.
What is the Percentage of People in the Labor Force in Jim Wells County?
53.7% of People are in the Labor Force in Jim Wells County.
What is the Unemployment Rate in Jim Wells County?
Unemployment Rate in Jim Wells County is 5.2%.