Jim Hogg County, TX Map & Demographics
Jim Hogg County Map
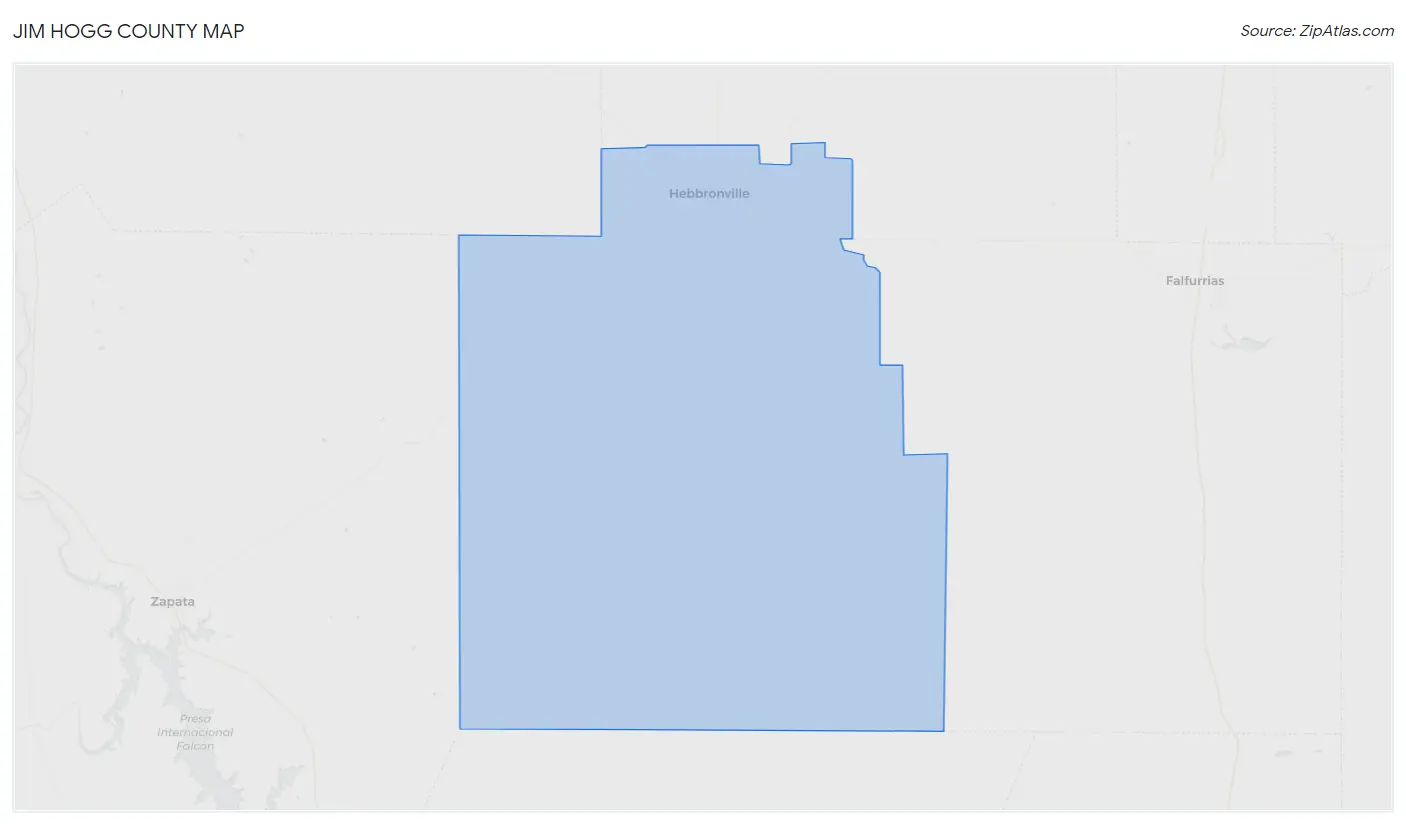
Jim Hogg County Overview
$18,366
PER CAPITA INCOME
$46,250
AVG FAMILY INCOME
$42,292
AVG HOUSEHOLD INCOME
60.0%
WAGE / INCOME GAP [ % ]
40.0¢/ $1
WAGE / INCOME GAP [ $ ]
$11,960
FAMILY INCOME DEFICIT
0.42
INEQUALITY / GINI INDEX
4,830
TOTAL POPULATION
2,515
MALE POPULATION
2,315
FEMALE POPULATION
108.64
MALES / 100 FEMALES
92.05
FEMALES / 100 MALES
25.2
MEDIAN AGE
4.3
AVG FAMILY SIZE
3.6
AVG HOUSEHOLD SIZE
2,187
LABOR FORCE [ PEOPLE ]
63.7%
PERCENT IN LABOR FORCE
4.5%
UNEMPLOYMENT RATE
Income in Jim Hogg County
Income Overview in Jim Hogg County
Per Capita Income in Jim Hogg County is $18,366, while median incomes of families and households are $46,250 and $42,292 respectively.
| Characteristic | Number | Measure |
| Per Capita Income | 4,830 | $18,366 |
| Median Family Income | 947 | $46,250 |
| Mean Family Income | 947 | $62,693 |
| Median Household Income | 1,342 | $42,292 |
| Mean Household Income | 1,342 | $59,372 |
| Income Deficit | 947 | $11,960 |
| Wage / Income Gap (%) | 4,830 | 60.00% |
| Wage / Income Gap ($) | 4,830 | 40.00¢ per $1 |
| Gini / Inequality Index | 4,830 | 0.42 |
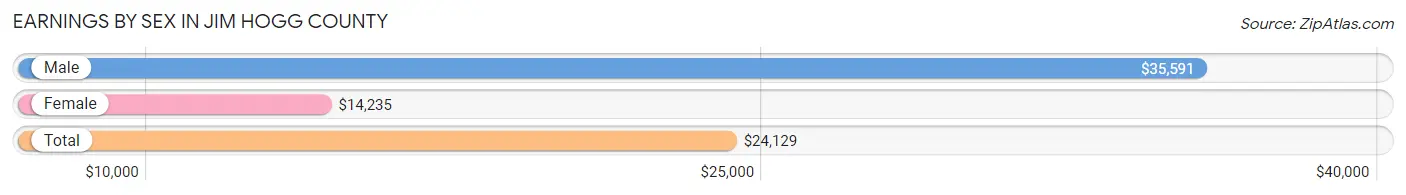
Earnings by Sex in Jim Hogg County
Average Earnings in Jim Hogg County are $24,129, $35,591 for men and $14,235 for women, a difference of 60.0%.
| Sex | Number | Average Earnings |
| Male | 1,343 (57.8%) | $35,591 |
| Female | 981 (42.2%) | $14,235 |
| Total | 2,324 (100.0%) | $24,129 |
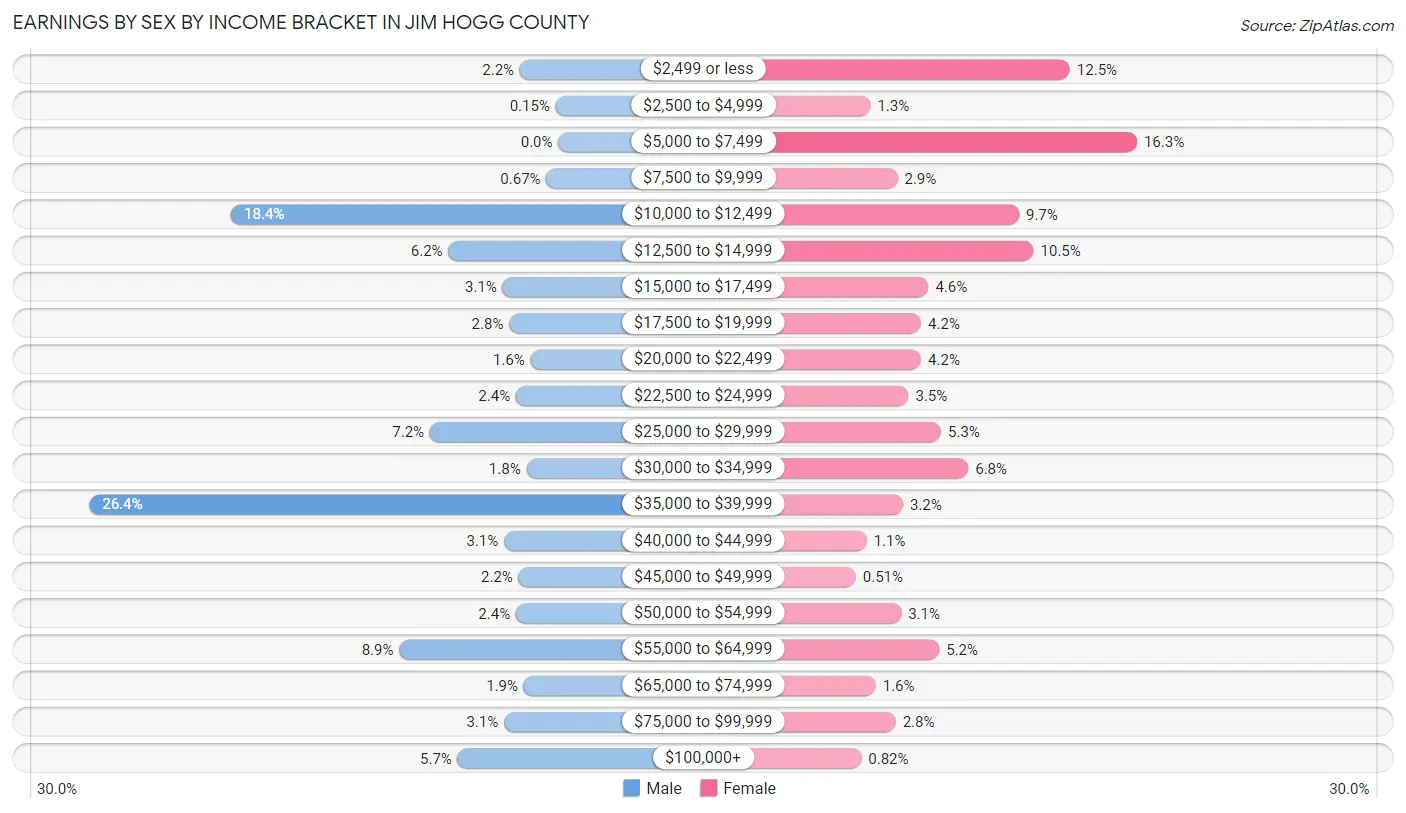
Earnings by Sex by Income Bracket in Jim Hogg County
The most common earnings brackets in Jim Hogg County are $35,000 to $39,999 for men (354 | 26.4%) and $5,000 to $7,499 for women (160 | 16.3%).
| Income | Male | Female |
| $2,499 or less | 29 (2.2%) | 123 (12.5%) |
| $2,500 to $4,999 | 2 (0.2%) | 13 (1.3%) |
| $5,000 to $7,499 | 0 (0.0%) | 160 (16.3%) |
| $7,500 to $9,999 | 9 (0.7%) | 28 (2.9%) |
| $10,000 to $12,499 | 247 (18.4%) | 95 (9.7%) |
| $12,500 to $14,999 | 83 (6.2%) | 103 (10.5%) |
| $15,000 to $17,499 | 42 (3.1%) | 45 (4.6%) |
| $17,500 to $19,999 | 37 (2.8%) | 41 (4.2%) |
| $20,000 to $22,499 | 21 (1.6%) | 41 (4.2%) |
| $22,500 to $24,999 | 32 (2.4%) | 34 (3.5%) |
| $25,000 to $29,999 | 97 (7.2%) | 52 (5.3%) |
| $30,000 to $34,999 | 24 (1.8%) | 67 (6.8%) |
| $35,000 to $39,999 | 354 (26.4%) | 31 (3.2%) |
| $40,000 to $44,999 | 41 (3.0%) | 11 (1.1%) |
| $45,000 to $49,999 | 30 (2.2%) | 5 (0.5%) |
| $50,000 to $54,999 | 32 (2.4%) | 30 (3.1%) |
| $55,000 to $64,999 | 120 (8.9%) | 51 (5.2%) |
| $65,000 to $74,999 | 26 (1.9%) | 16 (1.6%) |
| $75,000 to $99,999 | 41 (3.0%) | 27 (2.8%) |
| $100,000+ | 76 (5.7%) | 8 (0.8%) |
| Total | 1,343 (100.0%) | 981 (100.0%) |
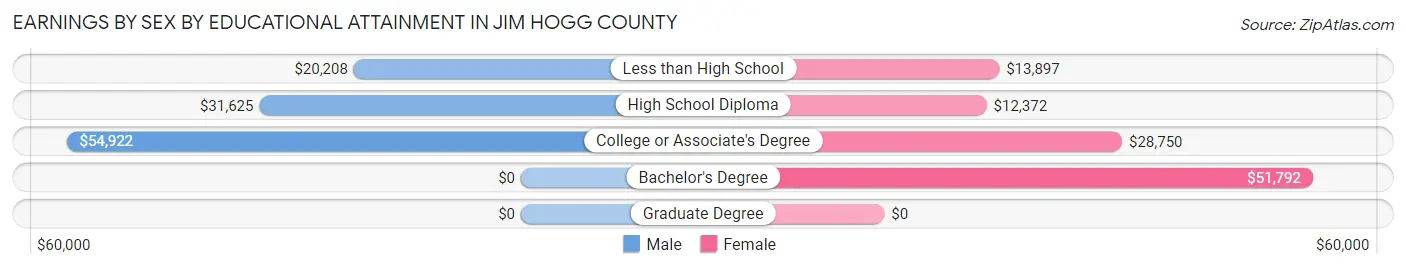
Earnings by Sex by Educational Attainment in Jim Hogg County
Average earnings in Jim Hogg County are $28,932 for men and $21,463 for women, a difference of 25.8%. Men with an educational attainment of college or associate's degree enjoy the highest average annual earnings of $54,922, while those with less than high school education earn the least with $20,208. Women with an educational attainment of bachelor's degree earn the most with the average annual earnings of $51,792, while those with high school diploma education have the smallest earnings of $12,372.
| Educational Attainment | Male Income | Female Income |
| Less than High School | $20,208 | $13,897 |
| High School Diploma | $31,625 | $12,372 |
| College or Associate's Degree | $54,922 | $28,750 |
| Bachelor's Degree | - | - |
| Graduate Degree | - | - |
| Total | $28,932 | $21,463 |
Family Income in Jim Hogg County
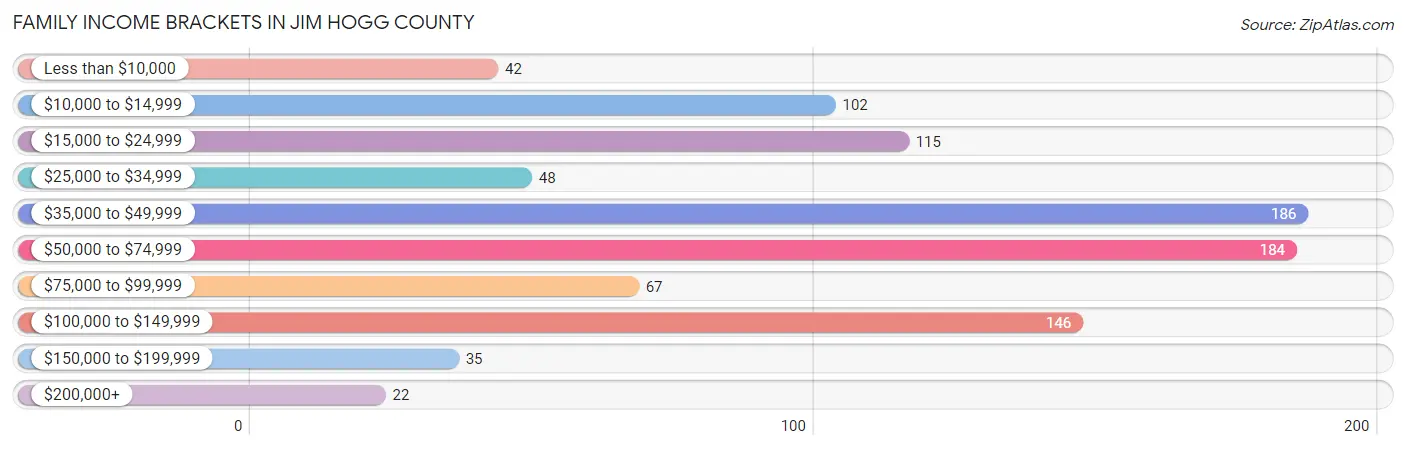
Family Income Brackets in Jim Hogg County
According to the Jim Hogg County family income data, there are 186 families falling into the $35,000 to $49,999 income range, which is the most common income bracket and makes up 19.6% of all families. Conversely, the $200,000+ income bracket is the least frequent group with only 22 families (2.3%) belonging to this category.
| Income Bracket | # Families | % Families |
| Less than $10,000 | 42 | 4.4% |
| $10,000 to $14,999 | 102 | 10.8% |
| $15,000 to $24,999 | 115 | 12.1% |
| $25,000 to $34,999 | 48 | 5.1% |
| $35,000 to $49,999 | 186 | 19.6% |
| $50,000 to $74,999 | 184 | 19.4% |
| $75,000 to $99,999 | 67 | 7.1% |
| $100,000 to $149,999 | 146 | 15.4% |
| $150,000 to $199,999 | 35 | 3.7% |
| $200,000+ | 22 | 2.3% |
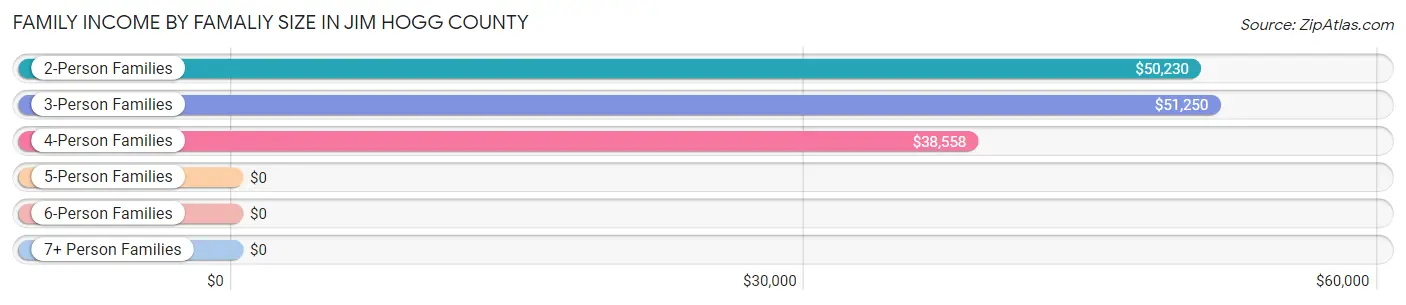
Family Income by Famaliy Size in Jim Hogg County
3-person families (190 | 20.1%) account for the highest median family income in Jim Hogg County with $51,250 per family, while 2-person families (363 | 38.3%) have the highest median income of $25,115 per family member.
| Income Bracket | # Families | Median Income |
| 2-Person Families | 363 (38.3%) | $50,230 |
| 3-Person Families | 190 (20.1%) | $51,250 |
| 4-Person Families | 203 (21.4%) | $38,558 |
| 5-Person Families | 103 (10.9%) | $0 |
| 6-Person Families | 54 (5.7%) | $0 |
| 7+ Person Families | 34 (3.6%) | $0 |
| Total | 947 (100.0%) | $46,250 |
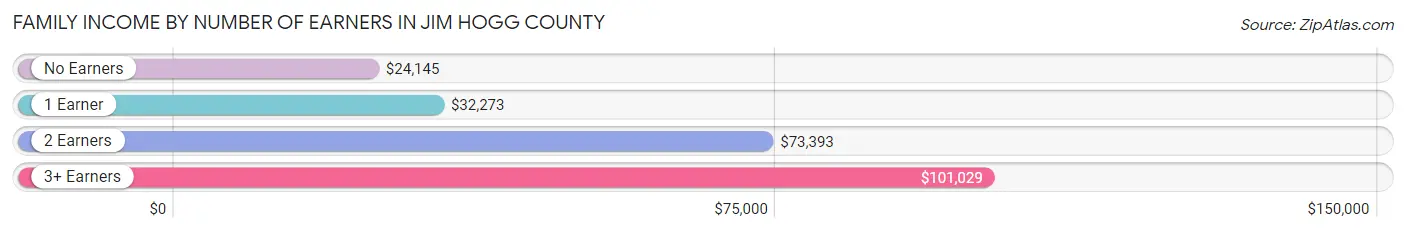
Family Income by Number of Earners in Jim Hogg County
The median family income in Jim Hogg County is $46,250, with families comprising 3+ earners (144) having the highest median family income of $101,029, while families with no earners (85) have the lowest median family income of $24,145, accounting for 15.2% and 9.0% of families, respectively.
| Number of Earners | # Families | Median Income |
| No Earners | 85 (9.0%) | $24,145 |
| 1 Earner | 484 (51.1%) | $32,273 |
| 2 Earners | 234 (24.7%) | $73,393 |
| 3+ Earners | 144 (15.2%) | $101,029 |
| Total | 947 (100.0%) | $46,250 |
Household Income in Jim Hogg County
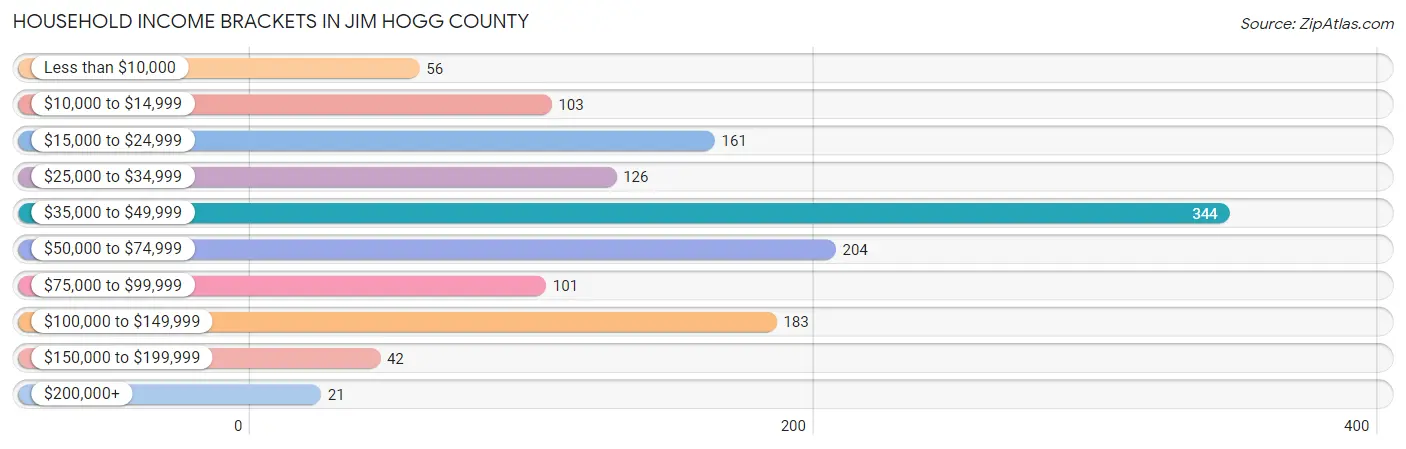
Household Income Brackets in Jim Hogg County
With 344 households falling in the category, the $35,000 to $49,999 income range is the most frequent in Jim Hogg County, accounting for 25.6% of all households. In contrast, only 21 households (1.6%) fall into the $200,000+ income bracket, making it the least populous group.
| Income Bracket | # Households | % Households |
| Less than $10,000 | 56 | 4.2% |
| $10,000 to $14,999 | 103 | 7.7% |
| $15,000 to $24,999 | 161 | 12.0% |
| $25,000 to $34,999 | 126 | 9.4% |
| $35,000 to $49,999 | 344 | 25.6% |
| $50,000 to $74,999 | 204 | 15.2% |
| $75,000 to $99,999 | 101 | 7.5% |
| $100,000 to $149,999 | 183 | 13.6% |
| $150,000 to $199,999 | 42 | 3.1% |
| $200,000+ | 21 | 1.6% |
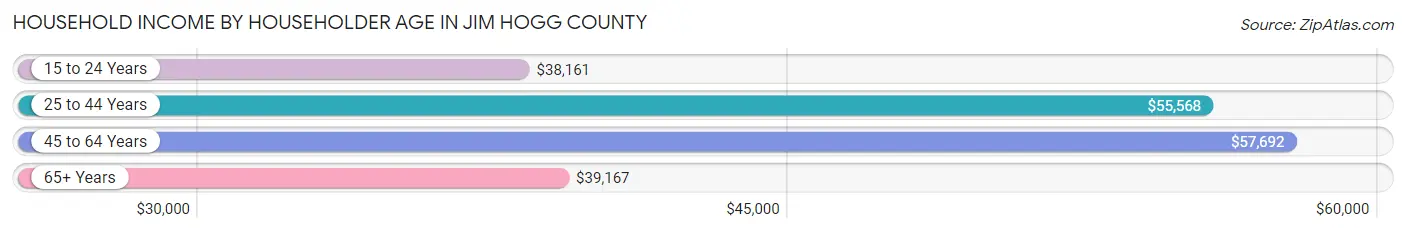
Household Income by Householder Age in Jim Hogg County
The median household income in Jim Hogg County is $42,292, with the highest median household income of $57,692 found in the 45 to 64 years age bracket for the primary householder. A total of 476 households (35.5%) fall into this category. Meanwhile, the 15 to 24 years age bracket for the primary householder has the lowest median household income of $38,161, with 181 households (13.5%) in this group.
| Income Bracket | # Households | Median Income |
| 15 to 24 Years | 181 (13.5%) | $38,161 |
| 25 to 44 Years | 425 (31.7%) | $55,568 |
| 45 to 64 Years | 476 (35.5%) | $57,692 |
| 65+ Years | 260 (19.4%) | $39,167 |
| Total | 1,342 (100.0%) | $42,292 |
Poverty in Jim Hogg County
Income Below Poverty by Sex and Age in Jim Hogg County
With 26.9% poverty level for males and 31.4% for females among the residents of Jim Hogg County, under 5 year old males and under 5 year old females are the most vulnerable to poverty, with 304 males (69.9%) and 145 females (62.8%) in their respective age groups living below the poverty level.
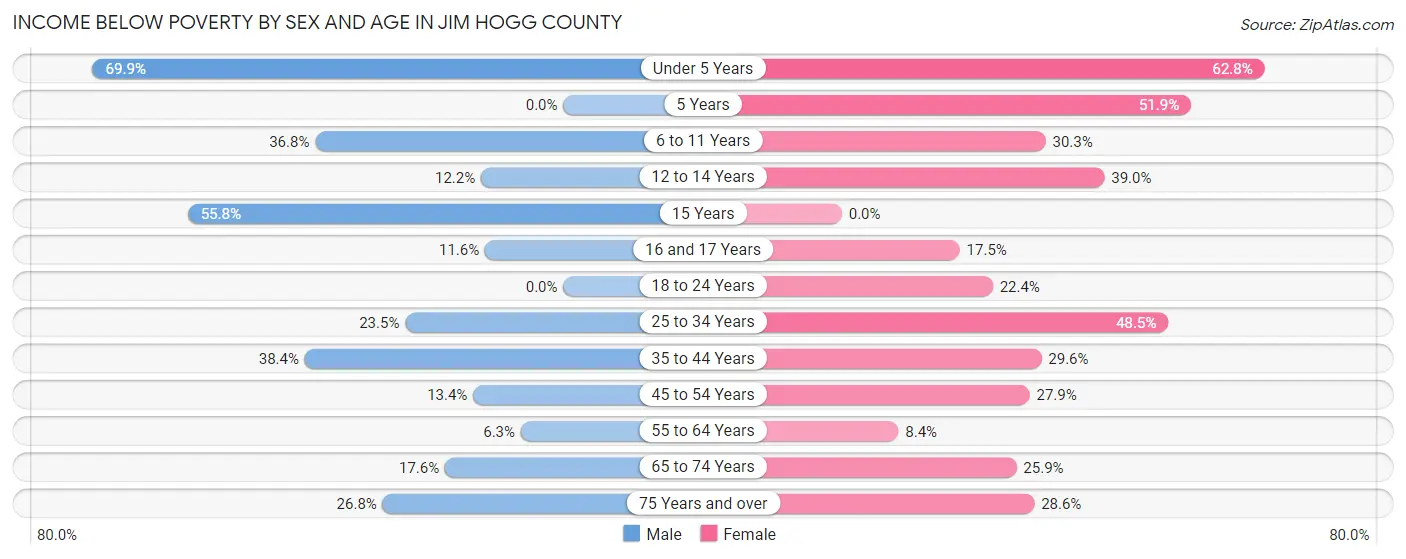
| Age Bracket | Male | Female |
| Under 5 Years | 304 (69.9%) | 145 (62.8%) |
| 5 Years | 0 (0.0%) | 14 (51.8%) |
| 6 to 11 Years | 70 (36.8%) | 59 (30.3%) |
| 12 to 14 Years | 11 (12.2%) | 23 (39.0%) |
| 15 Years | 29 (55.8%) | 0 (0.0%) |
| 16 and 17 Years | 5 (11.6%) | 21 (17.5%) |
| 18 to 24 Years | 0 (0.0%) | 91 (22.4%) |
| 25 to 34 Years | 85 (23.5%) | 143 (48.5%) |
| 35 to 44 Years | 81 (38.4%) | 56 (29.6%) |
| 45 to 54 Years | 34 (13.4%) | 63 (27.9%) |
| 55 to 64 Years | 13 (6.3%) | 21 (8.4%) |
| 65 to 74 Years | 26 (17.6%) | 35 (25.9%) |
| 75 Years and over | 11 (26.8%) | 24 (28.6%) |
| Total | 669 (26.9%) | 695 (31.4%) |
Income Above Poverty by Sex and Age in Jim Hogg County
According to the poverty statistics in Jim Hogg County, males aged 5 years and females aged 55 to 64 years are the age groups that are most secure financially, with 100.0% of males and 91.6% of females in these age groups living above the poverty line.
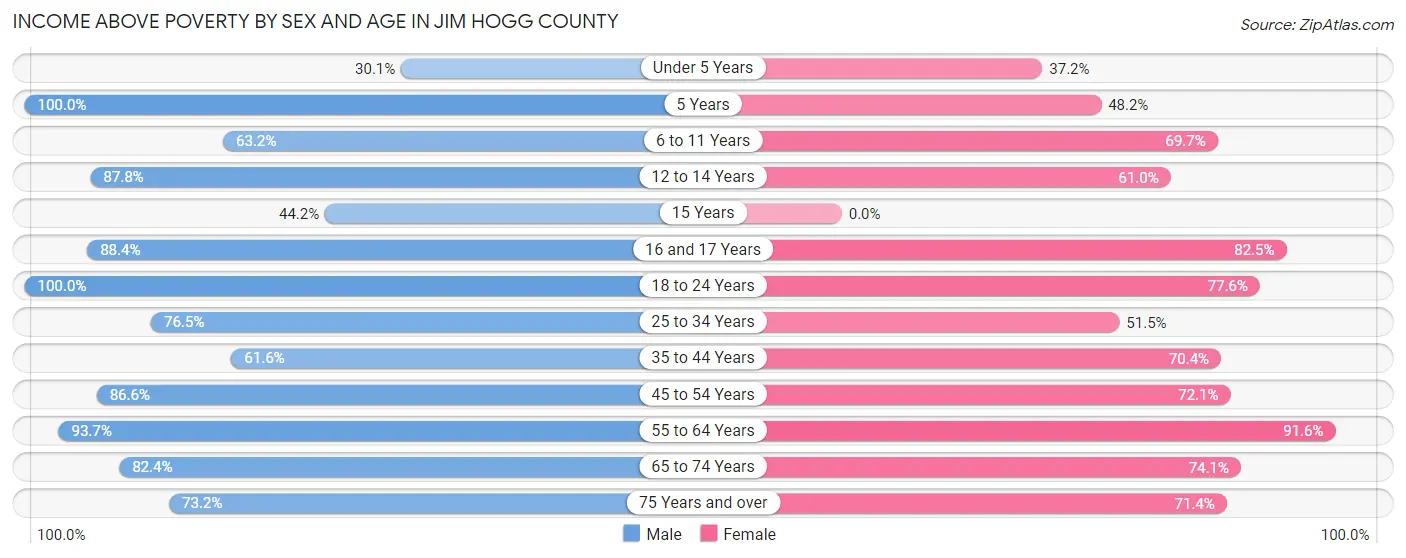
| Age Bracket | Male | Female |
| Under 5 Years | 131 (30.1%) | 86 (37.2%) |
| 5 Years | 34 (100.0%) | 13 (48.1%) |
| 6 to 11 Years | 120 (63.2%) | 136 (69.7%) |
| 12 to 14 Years | 79 (87.8%) | 36 (61.0%) |
| 15 Years | 23 (44.2%) | 0 (0.0%) |
| 16 and 17 Years | 38 (88.4%) | 99 (82.5%) |
| 18 to 24 Years | 420 (100.0%) | 315 (77.6%) |
| 25 to 34 Years | 277 (76.5%) | 152 (51.5%) |
| 35 to 44 Years | 130 (61.6%) | 133 (70.4%) |
| 45 to 54 Years | 220 (86.6%) | 163 (72.1%) |
| 55 to 64 Years | 193 (93.7%) | 229 (91.6%) |
| 65 to 74 Years | 122 (82.4%) | 100 (74.1%) |
| 75 Years and over | 30 (73.2%) | 60 (71.4%) |
| Total | 1,817 (73.1%) | 1,522 (68.6%) |
Income Below Poverty Among Married-Couple Families in Jim Hogg County
The poverty statistics for married-couple families in Jim Hogg County show that 11.4% or 73 of the total 641 families live below the poverty line. Families with 5 or more children have the highest poverty rate of 100.0%, comprising of 18 families. On the other hand, families with 3 or 4 children have the lowest poverty rate of 5.7%, which includes 2 families.
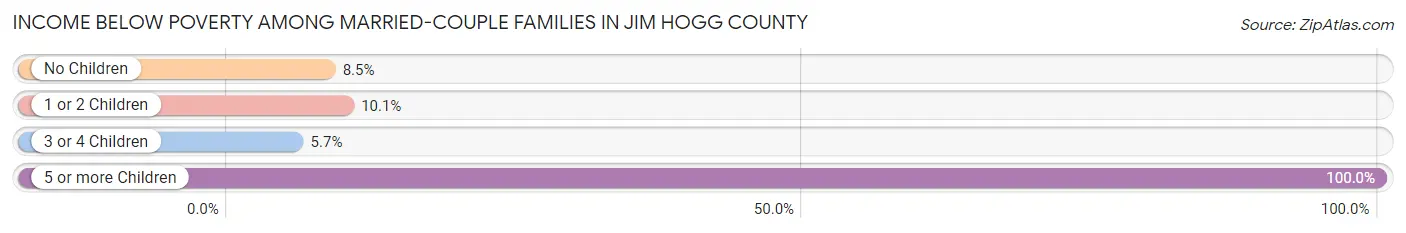
| Children | Above Poverty | Below Poverty |
| No Children | 366 (91.5%) | 34 (8.5%) |
| 1 or 2 Children | 169 (89.9%) | 19 (10.1%) |
| 3 or 4 Children | 33 (94.3%) | 2 (5.7%) |
| 5 or more Children | 0 (0.0%) | 18 (100.0%) |
| Total | 568 (88.6%) | 73 (11.4%) |
Income Below Poverty Among Single-Parent Households in Jim Hogg County
According to the poverty data in Jim Hogg County, 93.8% or 91 single-father households and 48.3% or 101 single-mother households are living below the poverty line. Among single-father households, those with 3 or 4 children have the highest poverty rate, with 64 households (100.0%) experiencing poverty. Likewise, among single-mother households, those with 3 or 4 children have the highest poverty rate, with 46 households (59.0%) falling below the poverty line.
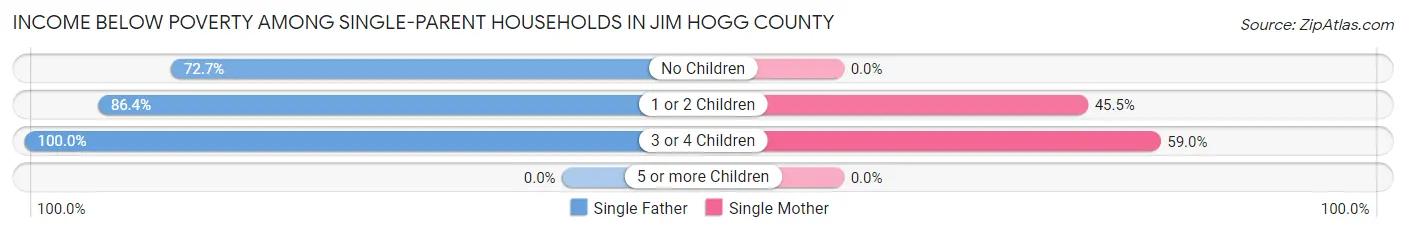
| Children | Single Father | Single Mother |
| No Children | 8 (72.7%) | 0 (0.0%) |
| 1 or 2 Children | 19 (86.4%) | 55 (45.5%) |
| 3 or 4 Children | 64 (100.0%) | 46 (59.0%) |
| 5 or more Children | 0 (0.0%) | 0 (0.0%) |
| Total | 91 (93.8%) | 101 (48.3%) |
Income Below Poverty Among Married-Couple vs Single-Parent Households in Jim Hogg County
The poverty data for Jim Hogg County shows that 73 of the married-couple family households (11.4%) and 192 of the single-parent households (62.7%) are living below the poverty level. Within the married-couple family households, those with 5 or more children have the highest poverty rate, with 18 households (100.0%) falling below the poverty line. Among the single-parent households, those with 3 or 4 children have the highest poverty rate, with 110 household (77.5%) living below poverty.
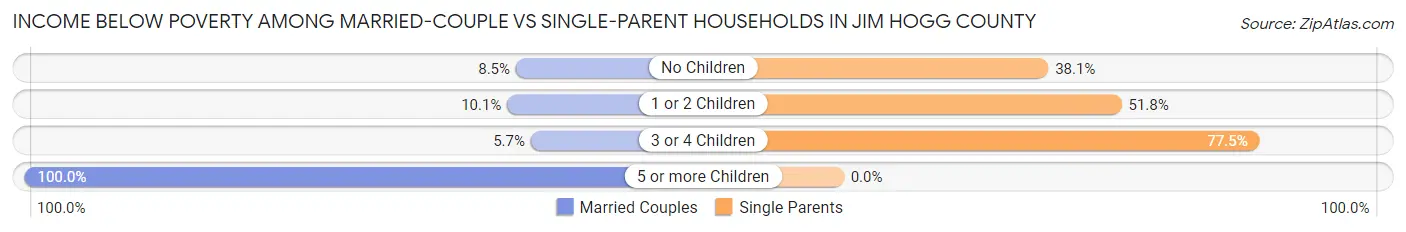
| Children | Married-Couple Families | Single-Parent Households |
| No Children | 34 (8.5%) | 8 (38.1%) |
| 1 or 2 Children | 19 (10.1%) | 74 (51.7%) |
| 3 or 4 Children | 2 (5.7%) | 110 (77.5%) |
| 5 or more Children | 18 (100.0%) | 0 (0.0%) |
| Total | 73 (11.4%) | 192 (62.7%) |
Race in Jim Hogg County
The most populous races in Jim Hogg County are Hispanic or Latino (4,334 | 89.7%), White / Caucasian (2,967 | 61.4%), and Two or more Races (1,614 | 33.4%).
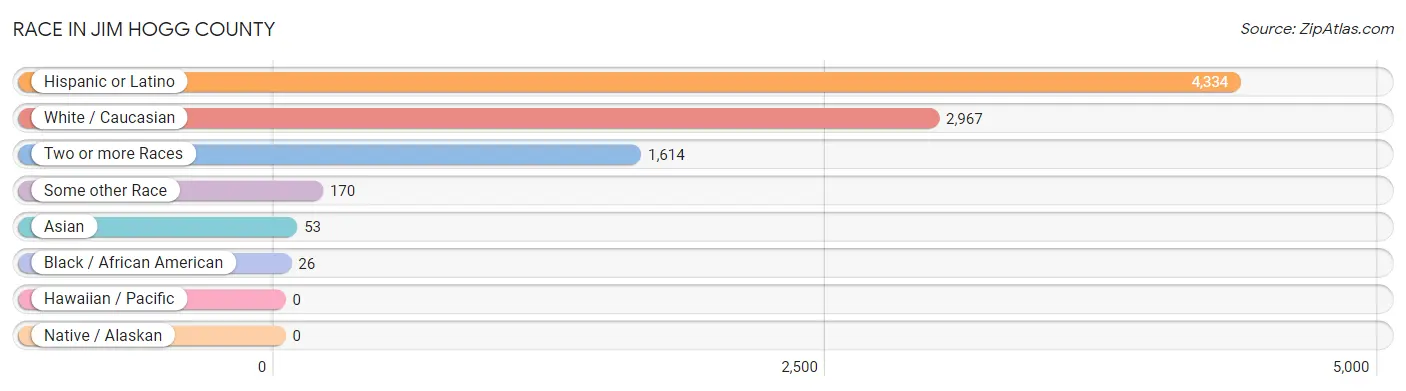
| Race | # Population | % Population |
| Asian | 53 | 1.1% |
| Black / African American | 26 | 0.5% |
| Hawaiian / Pacific | 0 | 0.0% |
| Hispanic or Latino | 4,334 | 89.7% |
| Native / Alaskan | 0 | 0.0% |
| White / Caucasian | 2,967 | 61.4% |
| Two or more Races | 1,614 | 33.4% |
| Some other Race | 170 | 3.5% |
| Total | 4,830 | 100.0% |
Ancestry in Jim Hogg County
The most populous ancestries reported in Jim Hogg County are Mexican (4,192 | 86.8%), Korean (247 | 5.1%), American (198 | 4.1%), English (155 | 3.2%), and German (145 | 3.0%), together accounting for 102.2% of all Jim Hogg County residents.
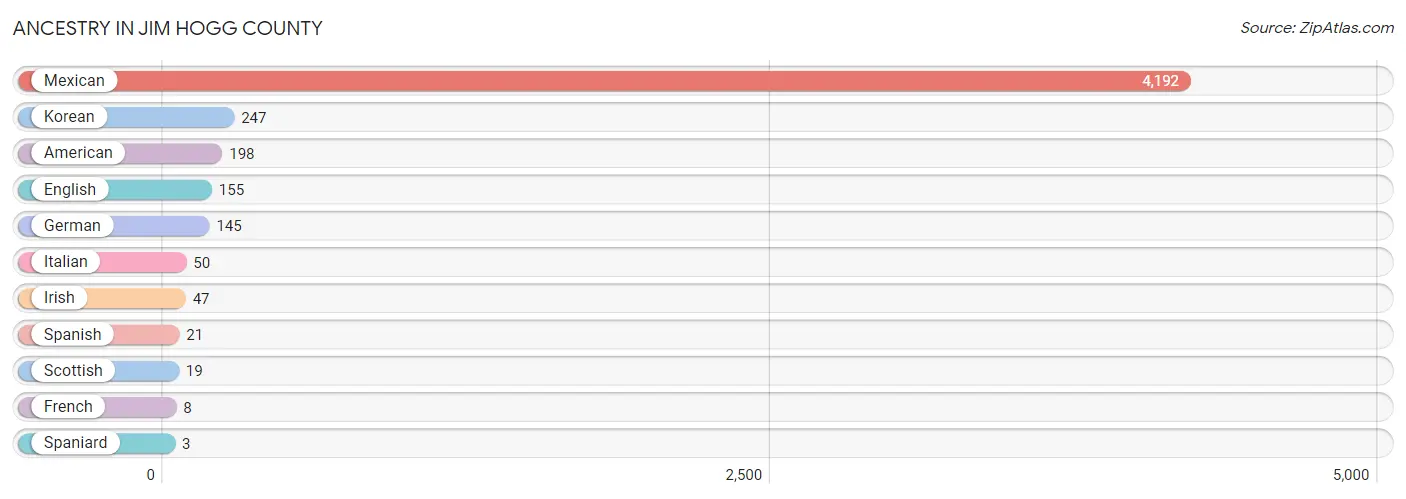
| Ancestry | # Population | % Population |
| American | 198 | 4.1% |
| English | 155 | 3.2% |
| French | 8 | 0.2% |
| German | 145 | 3.0% |
| Irish | 47 | 1.0% |
| Italian | 50 | 1.0% |
| Korean | 247 | 5.1% |
| Mexican | 4,192 | 86.8% |
| Scottish | 19 | 0.4% |
| Spaniard | 3 | 0.1% |
| Spanish | 21 | 0.4% | View All 11 Rows |
Immigrants in Jim Hogg County
The most numerous immigrant groups reported in Jim Hogg County came from Central America (70 | 1.5%), Latin America (70 | 1.5%), Mexico (70 | 1.5%), Asia (10 | 0.2%), and Philippines (10 | 0.2%), together accounting for 4.8% of all Jim Hogg County residents.
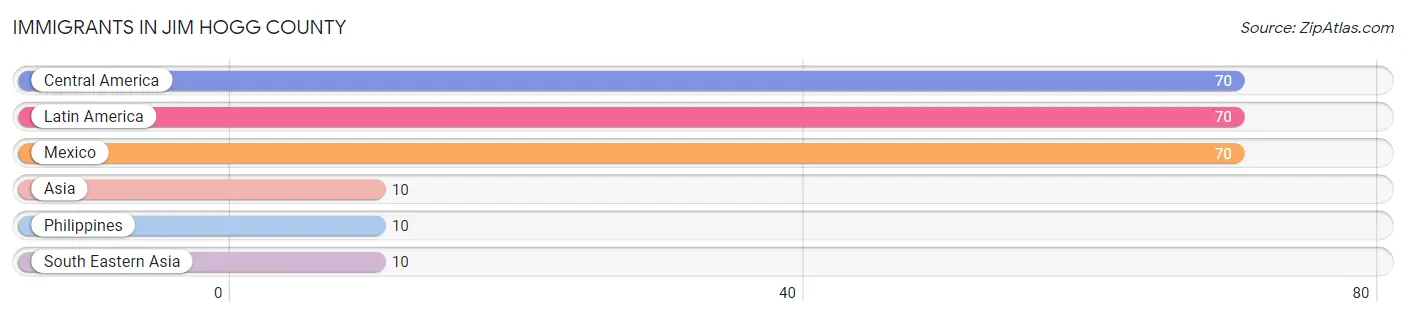
| Immigration Origin | # Population | % Population |
| Asia | 10 | 0.2% |
| Central America | 70 | 1.5% |
| Latin America | 70 | 1.5% |
| Mexico | 70 | 1.5% |
| Philippines | 10 | 0.2% |
| South Eastern Asia | 10 | 0.2% | View All 6 Rows |
Sex and Age in Jim Hogg County
Sex and Age in Jim Hogg County
The most populous age groups in Jim Hogg County are Under 5 Years (435 | 17.3%) for men and 15 to 19 Years (337 | 14.6%) for women.
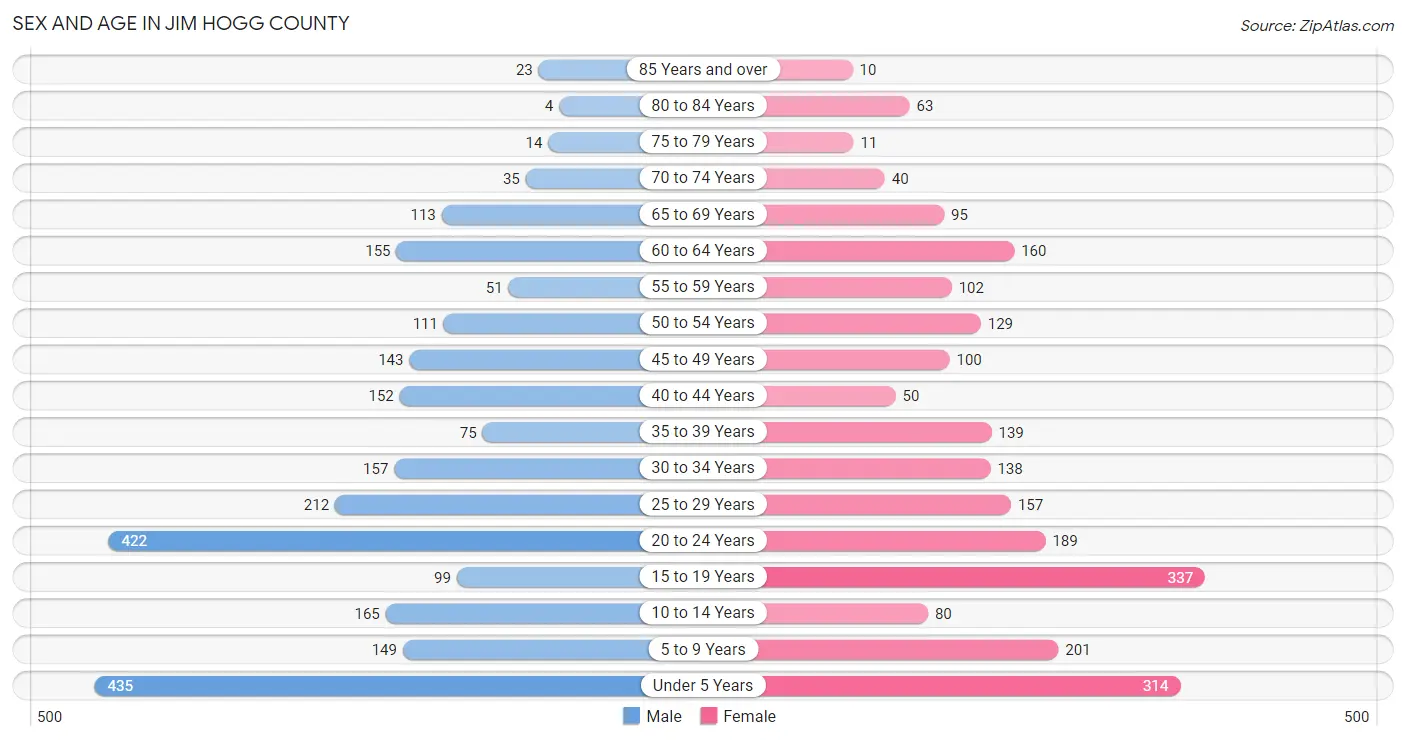
| Age Bracket | Male | Female |
| Under 5 Years | 435 (17.3%) | 314 (13.6%) |
| 5 to 9 Years | 149 (5.9%) | 201 (8.7%) |
| 10 to 14 Years | 165 (6.6%) | 80 (3.5%) |
| 15 to 19 Years | 99 (3.9%) | 337 (14.6%) |
| 20 to 24 Years | 422 (16.8%) | 189 (8.2%) |
| 25 to 29 Years | 212 (8.4%) | 157 (6.8%) |
| 30 to 34 Years | 157 (6.2%) | 138 (6.0%) |
| 35 to 39 Years | 75 (3.0%) | 139 (6.0%) |
| 40 to 44 Years | 152 (6.0%) | 50 (2.2%) |
| 45 to 49 Years | 143 (5.7%) | 100 (4.3%) |
| 50 to 54 Years | 111 (4.4%) | 129 (5.6%) |
| 55 to 59 Years | 51 (2.0%) | 102 (4.4%) |
| 60 to 64 Years | 155 (6.2%) | 160 (6.9%) |
| 65 to 69 Years | 113 (4.5%) | 95 (4.1%) |
| 70 to 74 Years | 35 (1.4%) | 40 (1.7%) |
| 75 to 79 Years | 14 (0.6%) | 11 (0.5%) |
| 80 to 84 Years | 4 (0.2%) | 63 (2.7%) |
| 85 Years and over | 23 (0.9%) | 10 (0.4%) |
| Total | 2,515 (100.0%) | 2,315 (100.0%) |
Families and Households in Jim Hogg County
Median Family Size in Jim Hogg County
The median family size in Jim Hogg County is 4.32 persons per family, with single female/mother families (209 | 22.1%) accounting for the largest median family size of 6.88 persons per family. On the other hand, married-couple families (641 | 67.7%) represent the smallest median family size with 3.39 persons per family.
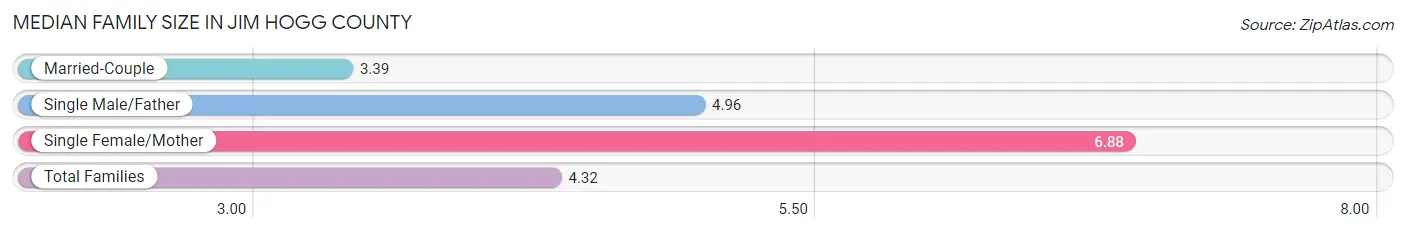
| Family Type | # Families | Family Size |
| Married-Couple | 641 (67.7%) | 3.39 |
| Single Male/Father | 97 (10.2%) | 4.96 |
| Single Female/Mother | 209 (22.1%) | 6.88 |
| Total Families | 947 (100.0%) | 4.32 |
Median Household Size in Jim Hogg County
The median household size in Jim Hogg County is 3.57 persons per household, with single female/mother households (209 | 15.6%) accounting for the largest median household size of 7.44 persons per household. non-family households (395 | 29.4%) represent the smallest median household size with 1.10 persons per household.
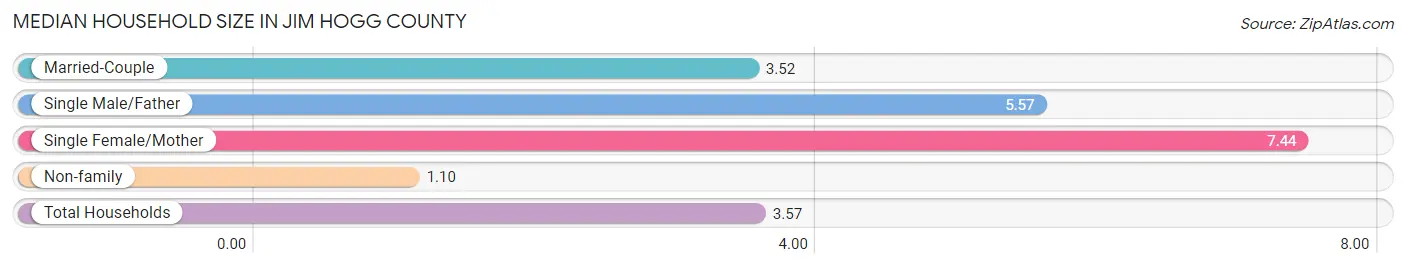
| Household Type | # Households | Household Size |
| Married-Couple | 641 (47.8%) | 3.52 |
| Single Male/Father | 97 (7.2%) | 5.57 |
| Single Female/Mother | 209 (15.6%) | 7.44 |
| Non-family | 395 (29.4%) | 1.10 |
| Total Households | 1,342 (100.0%) | 3.57 |
Household Size by Marriage Status in Jim Hogg County
Out of a total of 1,342 households in Jim Hogg County, 947 (70.6%) are family households, while 395 (29.4%) are nonfamily households. The most numerous type of family households are 2-person households, comprising 326, and the most common type of nonfamily households are 1-person households, comprising 362.
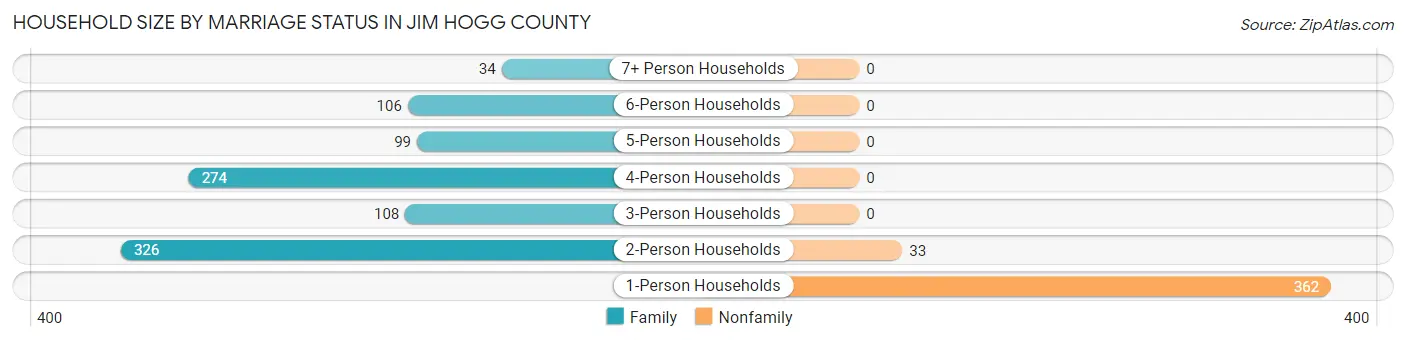
| Household Size | Family Households | Nonfamily Households |
| 1-Person Households | - | 362 (27.0%) |
| 2-Person Households | 326 (24.3%) | 33 (2.5%) |
| 3-Person Households | 108 (8.1%) | 0 (0.0%) |
| 4-Person Households | 274 (20.4%) | 0 (0.0%) |
| 5-Person Households | 99 (7.4%) | 0 (0.0%) |
| 6-Person Households | 106 (7.9%) | 0 (0.0%) |
| 7+ Person Households | 34 (2.5%) | 0 (0.0%) |
| Total | 947 (70.6%) | 395 (29.4%) |
Female Fertility in Jim Hogg County
Fertility by Age in Jim Hogg County
Average fertility rate in Jim Hogg County is 107.0 births per 1,000 women. Women in the age bracket of 15 to 19 years have the highest fertility rate with 199.0 births per 1,000 women. Women in the age bracket of 15 to 19 years acount for 55.4% of all women with births.
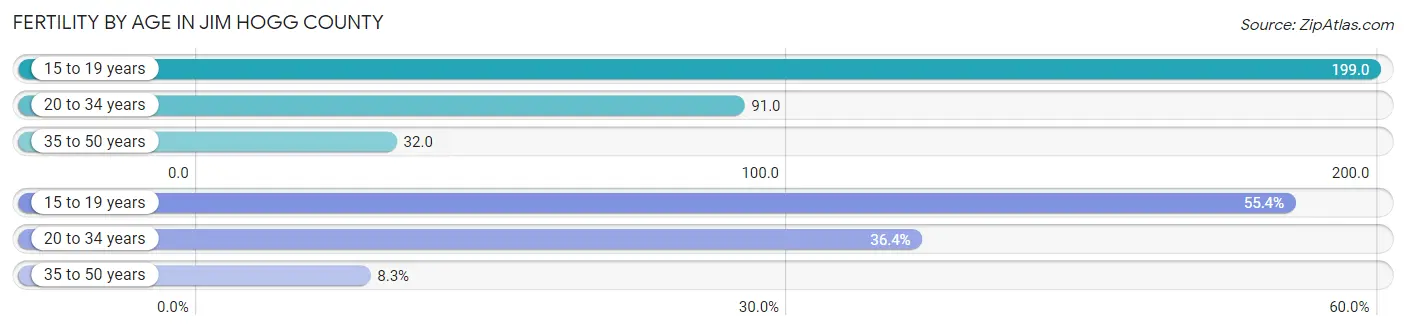
| Age Bracket | Women with Births | Births / 1,000 Women |
| 15 to 19 years | 67 (55.4%) | 199.0 |
| 20 to 34 years | 44 (36.4%) | 91.0 |
| 35 to 50 years | 10 (8.3%) | 32.0 |
| Total | 121 (100.0%) | 107.0 |
Fertility by Age by Marriage Status in Jim Hogg County
71.1% of women with births (121) in Jim Hogg County are married. The highest percentage of unmarried women with births falls into 35 to 50 years age bracket with 100.0% of them unmarried at the time of birth, while the lowest percentage of unmarried women with births belong to 15 to 19 years age bracket with 0.0% of them unmarried.
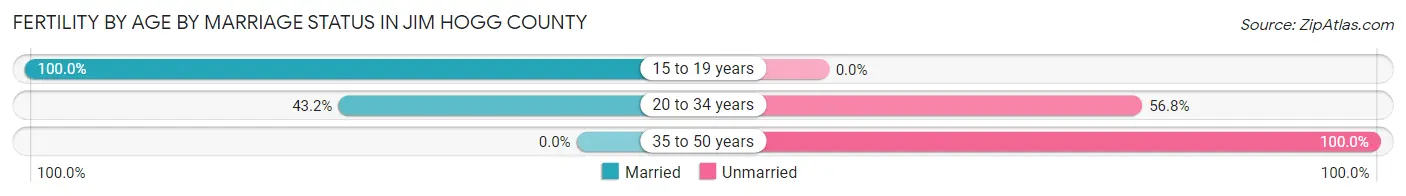
| Age Bracket | Married | Unmarried |
| 15 to 19 years | 67 (100.0%) | 0 (0.0%) |
| 20 to 34 years | 19 (43.2%) | 25 (56.8%) |
| 35 to 50 years | 0 (0.0%) | 10 (100.0%) |
| Total | 86 (71.1%) | 35 (28.9%) |
Fertility by Education in Jim Hogg County

| Educational Attainment | Women with Births | Births / 1,000 Women |
| Less than High School | 80 (66.1%) | 187.0 |
| High School Diploma | 22 (18.2%) | 65.0 |
| College or Associate's Degree | 14 (11.6%) | 51.0 |
| Bachelor's Degree | 0 (0.0%) | 0.0 |
| Graduate Degree | 5 (4.1%) | 172.0 |
| Total | 121 (100.0%) | 107.0 |
Fertility by Education by Marriage Status in Jim Hogg County
28.9% of women with births in Jim Hogg County are unmarried. Women with the educational attainment of college or associate's degree are most likely to be married with 100.0% of them married at childbirth, while women with the educational attainment of high school diploma are least likely to be married with 100.0% of them unmarried at childbirth.
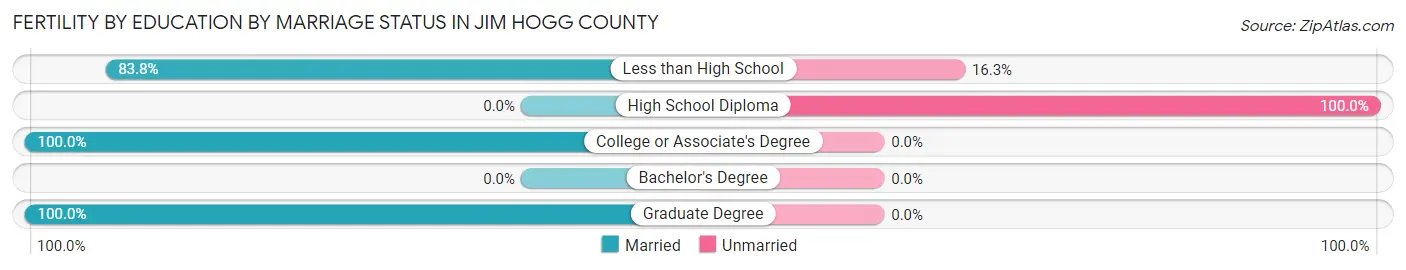
| Educational Attainment | Married | Unmarried |
| Less than High School | 67 (83.8%) | 13 (16.3%) |
| High School Diploma | 0 (0.0%) | 22 (100.0%) |
| College or Associate's Degree | 14 (100.0%) | 0 (0.0%) |
| Bachelor's Degree | 0 (0.0%) | 0 (0.0%) |
| Graduate Degree | 5 (100.0%) | 0 (0.0%) |
| Total | 86 (71.1%) | 35 (28.9%) |
Employment Characteristics in Jim Hogg County
Employment by Class of Employer in Jim Hogg County
Among the 2,042 employed individuals in Jim Hogg County, private company employees (1,506 | 73.8%), local government employees (164 | 8.0%), and self-employed (not incorporated) (127 | 6.2%) make up the most common classes of employment.
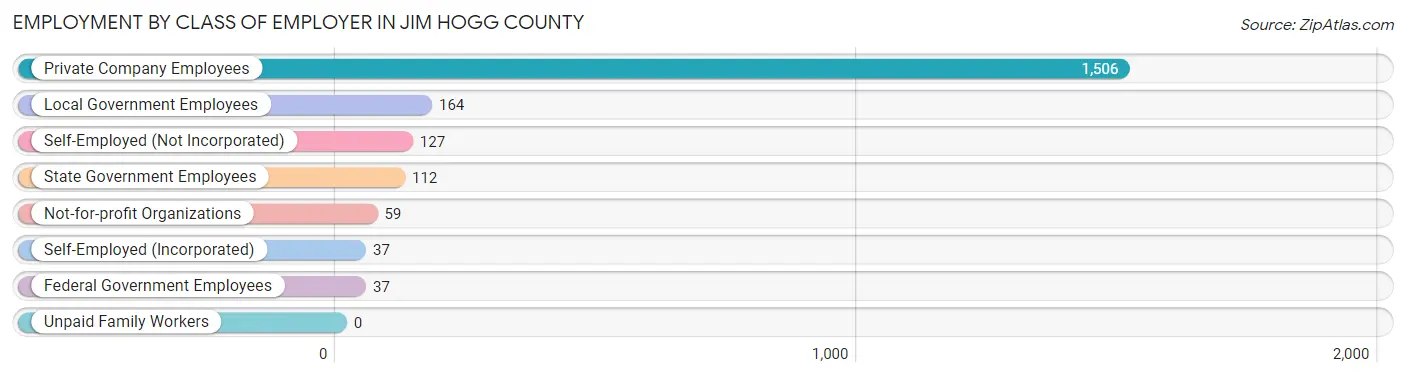
| Employer Class | # Employees | % Employees |
| Private Company Employees | 1,506 | 73.8% |
| Self-Employed (Incorporated) | 37 | 1.8% |
| Self-Employed (Not Incorporated) | 127 | 6.2% |
| Not-for-profit Organizations | 59 | 2.9% |
| Local Government Employees | 164 | 8.0% |
| State Government Employees | 112 | 5.5% |
| Federal Government Employees | 37 | 1.8% |
| Unpaid Family Workers | 0 | 0.0% |
| Total | 2,042 | 100.0% |
Employment Status by Age in Jim Hogg County
According to the labor force statistics for Jim Hogg County, out of the total population over 16 years of age (3,434), 63.7% or 2,187 individuals are in the labor force, with 4.5% or 98 of them unemployed. The age group with the highest labor force participation rate is 20 to 24 years, with 94.6% or 578 individuals in the labor force. Within the labor force, the 25 to 29 years age range has the highest percentage of unemployed individuals, with 31.3% or 45 of them being unemployed.
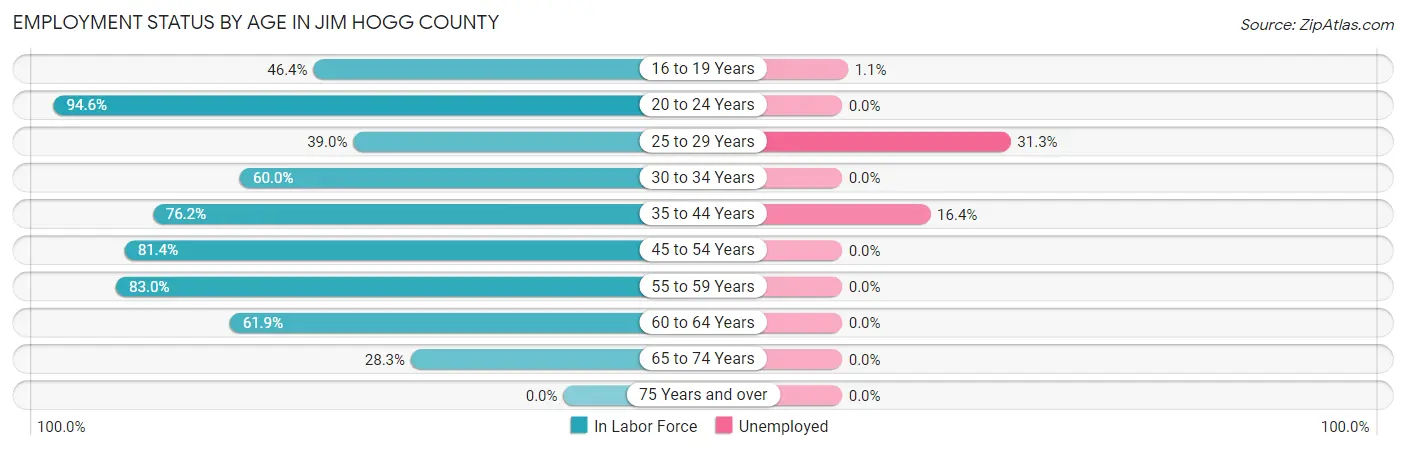
| Age Bracket | In Labor Force | Unemployed |
| 16 to 19 Years | 178 (46.4%) | 2 (1.1%) |
| 20 to 24 Years | 578 (94.6%) | 0 (0.0%) |
| 25 to 29 Years | 144 (39.0%) | 45 (31.3%) |
| 30 to 34 Years | 177 (60.0%) | 0 (0.0%) |
| 35 to 44 Years | 317 (76.2%) | 52 (16.4%) |
| 45 to 54 Years | 393 (81.4%) | 0 (0.0%) |
| 55 to 59 Years | 127 (83.0%) | 0 (0.0%) |
| 60 to 64 Years | 195 (61.9%) | 0 (0.0%) |
| 65 to 74 Years | 80 (28.3%) | 0 (0.0%) |
| 75 Years and over | 0 (0.0%) | 0 (0.0%) |
| Total | 2,187 (63.7%) | 98 (4.5%) |
Employment Status by Educational Attainment in Jim Hogg County
According to labor force statistics for Jim Hogg County, 66.6% of individuals (1,353) out of the total population between 25 and 64 years of age (2,031) are in the labor force, with 7.2% or 97 of them being unemployed. The group with the highest labor force participation rate are those with the educational attainment of bachelor's degree or higher, with 85.4% or 199 individuals in the labor force. Within the labor force, individuals with less than high school education have the highest percentage of unemployment, with 12.9% or 45 of them being unemployed.
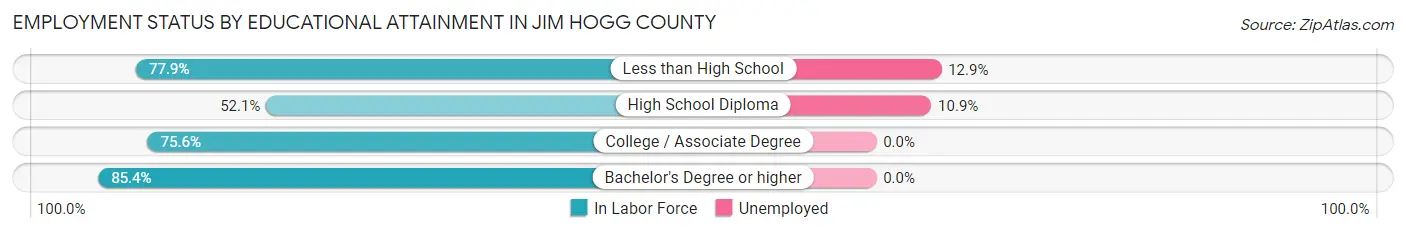
| Educational Attainment | In Labor Force | Unemployed |
| Less than High School | 349 (77.9%) | 58 (12.9%) |
| High School Diploma | 477 (52.1%) | 100 (10.9%) |
| College / Associate Degree | 328 (75.6%) | 0 (0.0%) |
| Bachelor's Degree or higher | 199 (85.4%) | 0 (0.0%) |
| Total | 1,353 (66.6%) | 146 (7.2%) |
Employment Occupations by Sex in Jim Hogg County
Management, Business, Science and Arts Occupations
The most common Management, Business, Science and Arts occupations in Jim Hogg County are Community & Social Service (192 | 9.2%), Education Instruction & Library (153 | 7.3%), Management (88 | 4.2%), Health Diagnosing & Treating (37 | 1.8%), and Education, Arts & Media (32 | 1.5%).
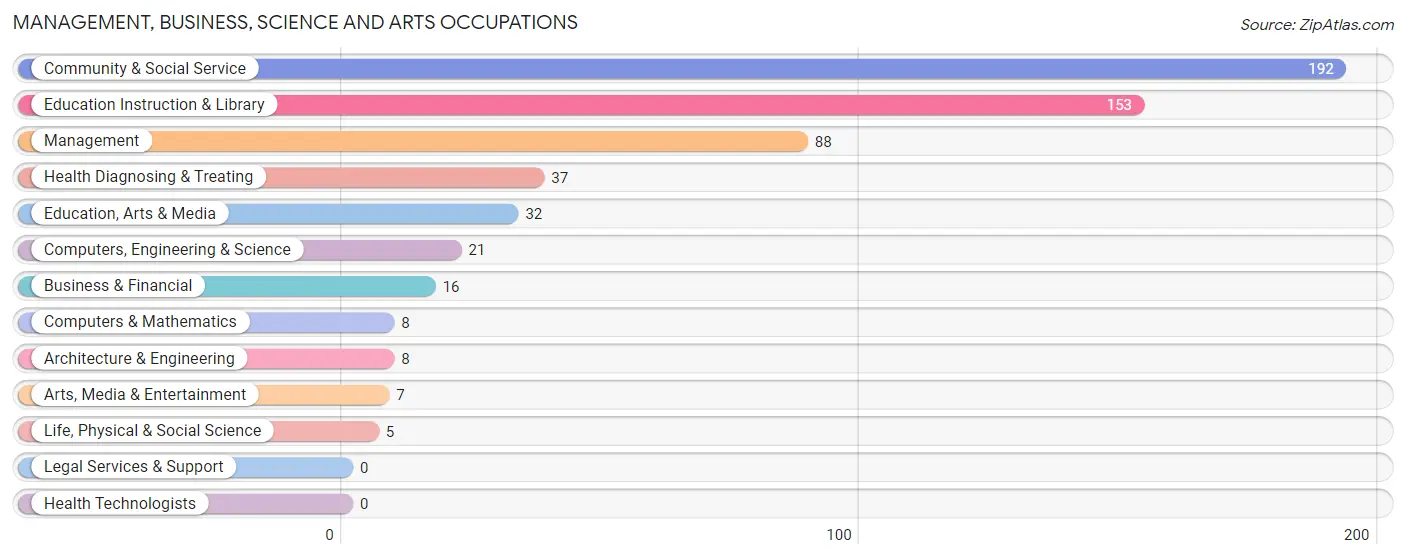
Management, Business, Science and Arts Occupations by Sex
Within the Management, Business, Science and Arts occupations in Jim Hogg County, the most male-oriented occupations are Computers, Engineering & Science (100.0%), Computers & Mathematics (100.0%), and Architecture & Engineering (100.0%), while the most female-oriented occupations are Education, Arts & Media (100.0%), Health Diagnosing & Treating (100.0%), and Education Instruction & Library (83.0%).
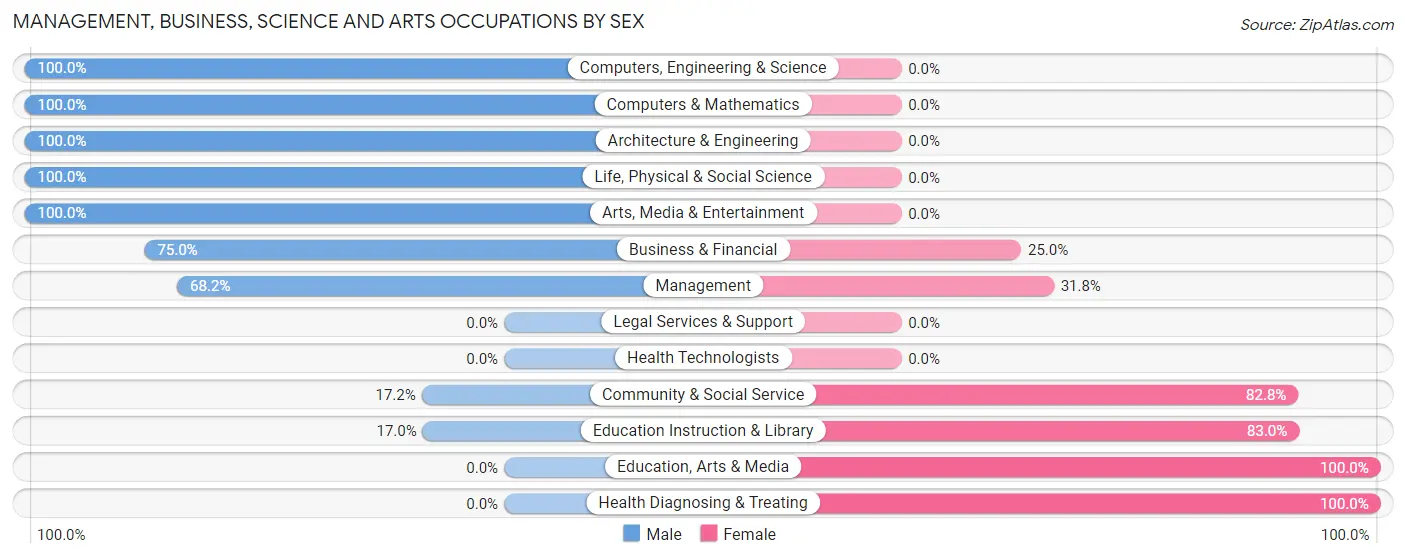
| Occupation | Male | Female |
| Management | 60 (68.2%) | 28 (31.8%) |
| Business & Financial | 12 (75.0%) | 4 (25.0%) |
| Computers, Engineering & Science | 21 (100.0%) | 0 (0.0%) |
| Computers & Mathematics | 8 (100.0%) | 0 (0.0%) |
| Architecture & Engineering | 8 (100.0%) | 0 (0.0%) |
| Life, Physical & Social Science | 5 (100.0%) | 0 (0.0%) |
| Community & Social Service | 33 (17.2%) | 159 (82.8%) |
| Education, Arts & Media | 0 (0.0%) | 32 (100.0%) |
| Legal Services & Support | 0 (0.0%) | 0 (0.0%) |
| Education Instruction & Library | 26 (17.0%) | 127 (83.0%) |
| Arts, Media & Entertainment | 7 (100.0%) | 0 (0.0%) |
| Health Diagnosing & Treating | 0 (0.0%) | 37 (100.0%) |
| Health Technologists | 0 (0.0%) | 0 (0.0%) |
| Total (Category) | 126 (35.6%) | 228 (64.4%) |
| Total (Overall) | 1,201 (57.5%) | 889 (42.5%) |
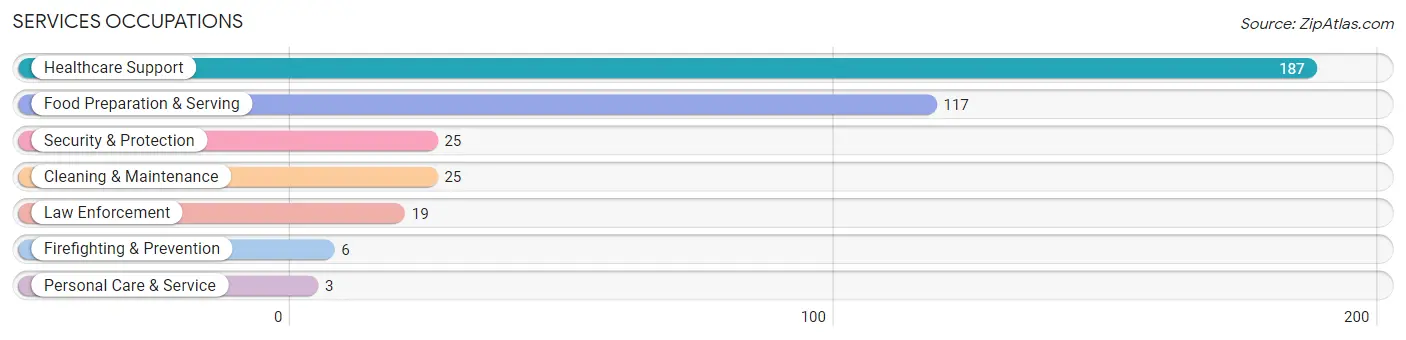
Services Occupations
The most common Services occupations in Jim Hogg County are Healthcare Support (187 | 8.9%), Food Preparation & Serving (117 | 5.6%), Security & Protection (25 | 1.2%), Cleaning & Maintenance (25 | 1.2%), and Law Enforcement (19 | 0.9%).
Services Occupations by Sex
Within the Services occupations in Jim Hogg County, the most male-oriented occupations are Firefighting & Prevention (100.0%), Cleaning & Maintenance (100.0%), and Food Preparation & Serving (52.1%), while the most female-oriented occupations are Healthcare Support (100.0%), Law Enforcement (100.0%), and Personal Care & Service (100.0%).
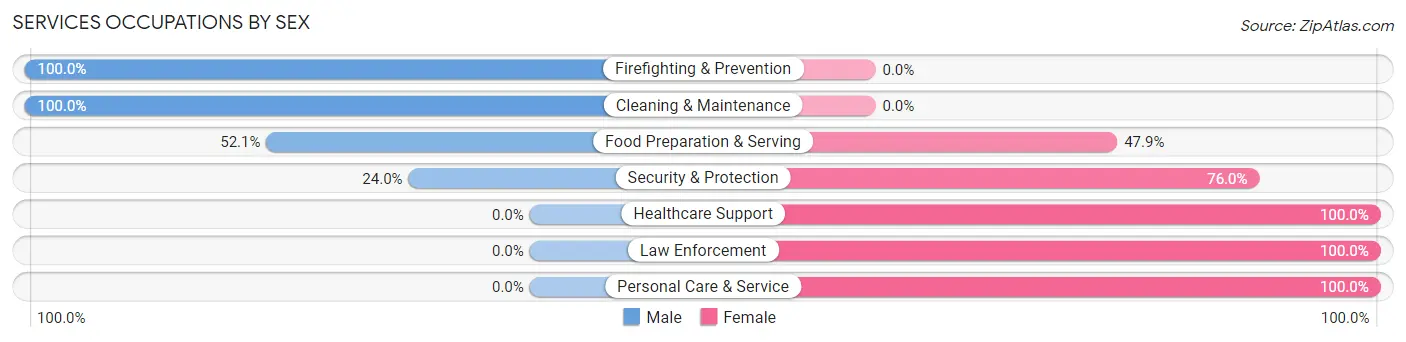
| Occupation | Male | Female |
| Healthcare Support | 0 (0.0%) | 187 (100.0%) |
| Security & Protection | 6 (24.0%) | 19 (76.0%) |
| Firefighting & Prevention | 6 (100.0%) | 0 (0.0%) |
| Law Enforcement | 0 (0.0%) | 19 (100.0%) |
| Food Preparation & Serving | 61 (52.1%) | 56 (47.9%) |
| Cleaning & Maintenance | 25 (100.0%) | 0 (0.0%) |
| Personal Care & Service | 0 (0.0%) | 3 (100.0%) |
| Total (Category) | 92 (25.8%) | 265 (74.2%) |
| Total (Overall) | 1,201 (57.5%) | 889 (42.5%) |
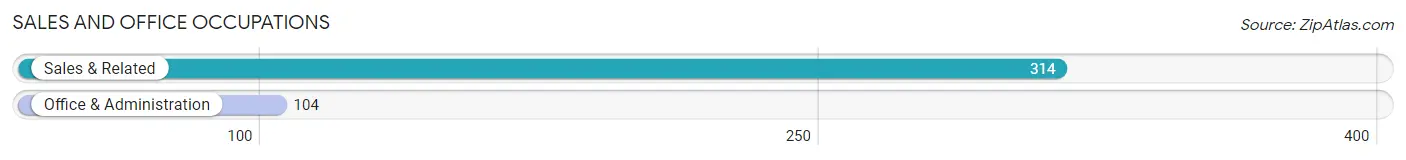
Sales and Office Occupations
The most common Sales and Office occupations in Jim Hogg County are Sales & Related (314 | 15.0%), and Office & Administration (104 | 5.0%).
Sales and Office Occupations by Sex
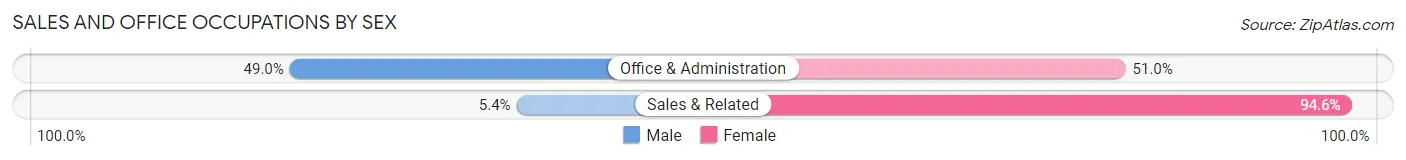
| Occupation | Male | Female |
| Sales & Related | 17 (5.4%) | 297 (94.6%) |
| Office & Administration | 51 (49.0%) | 53 (51.0%) |
| Total (Category) | 68 (16.3%) | 350 (83.7%) |
| Total (Overall) | 1,201 (57.5%) | 889 (42.5%) |
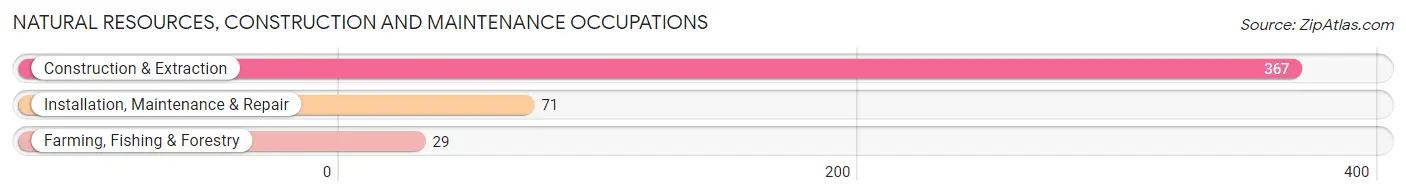
Natural Resources, Construction and Maintenance Occupations
The most common Natural Resources, Construction and Maintenance occupations in Jim Hogg County are Construction & Extraction (367 | 17.6%), Installation, Maintenance & Repair (71 | 3.4%), and Farming, Fishing & Forestry (29 | 1.4%).
Natural Resources, Construction and Maintenance Occupations by Sex
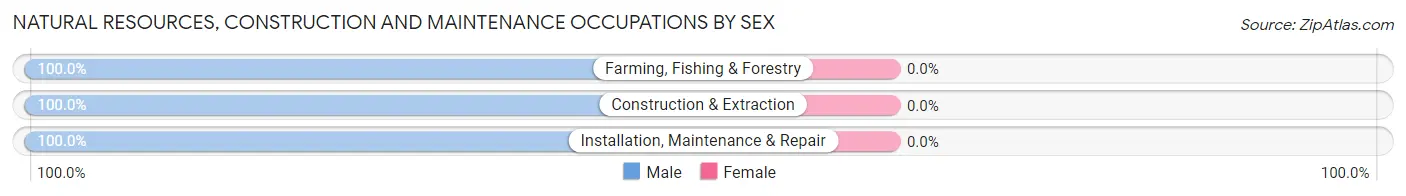
| Occupation | Male | Female |
| Farming, Fishing & Forestry | 29 (100.0%) | 0 (0.0%) |
| Construction & Extraction | 367 (100.0%) | 0 (0.0%) |
| Installation, Maintenance & Repair | 71 (100.0%) | 0 (0.0%) |
| Total (Category) | 467 (100.0%) | 0 (0.0%) |
| Total (Overall) | 1,201 (57.5%) | 889 (42.5%) |
Production, Transportation and Moving Occupations
The most common Production, Transportation and Moving occupations in Jim Hogg County are Production (399 | 19.1%), Transportation (78 | 3.7%), and Material Moving (17 | 0.8%).
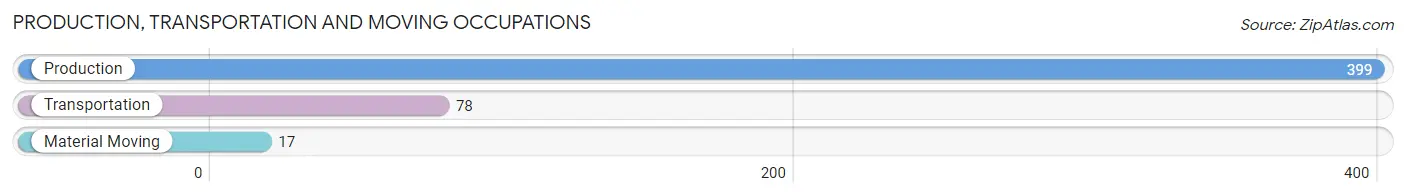
Production, Transportation and Moving Occupations by Sex
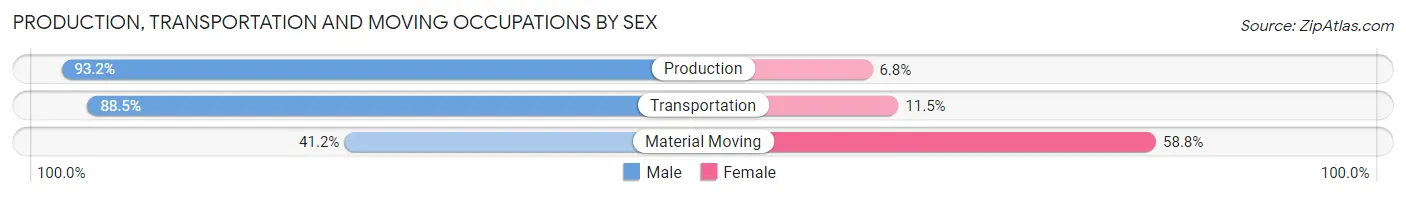
| Occupation | Male | Female |
| Production | 372 (93.2%) | 27 (6.8%) |
| Transportation | 69 (88.5%) | 9 (11.5%) |
| Material Moving | 7 (41.2%) | 10 (58.8%) |
| Total (Category) | 448 (90.7%) | 46 (9.3%) |
| Total (Overall) | 1,201 (57.5%) | 889 (42.5%) |
Employment Industries by Sex in Jim Hogg County
Employment Industries in Jim Hogg County
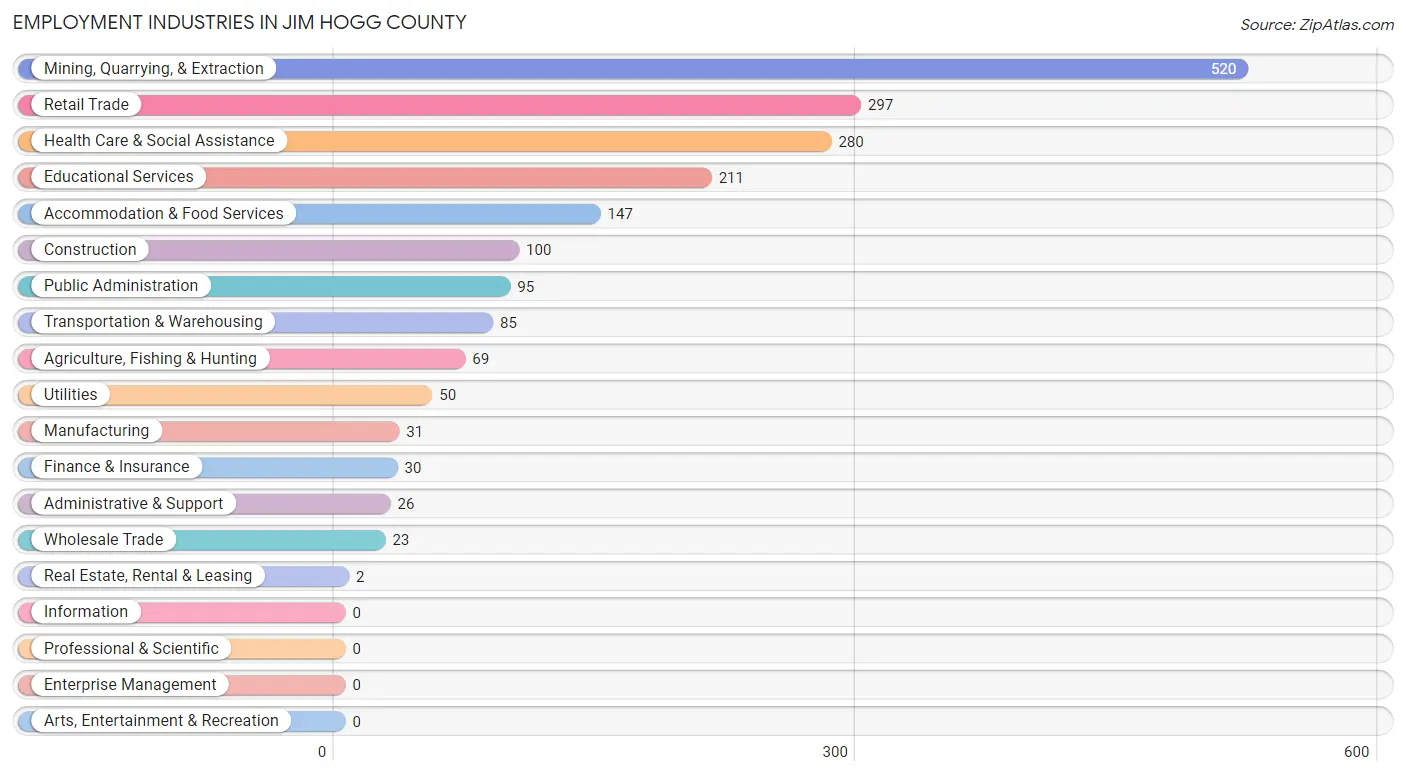
The major employment industries in Jim Hogg County include Mining, Quarrying, & Extraction (520 | 24.9%), Retail Trade (297 | 14.2%), Health Care & Social Assistance (280 | 13.4%), Educational Services (211 | 10.1%), and Accommodation & Food Services (147 | 7.0%).
Employment Industries by Sex in Jim Hogg County
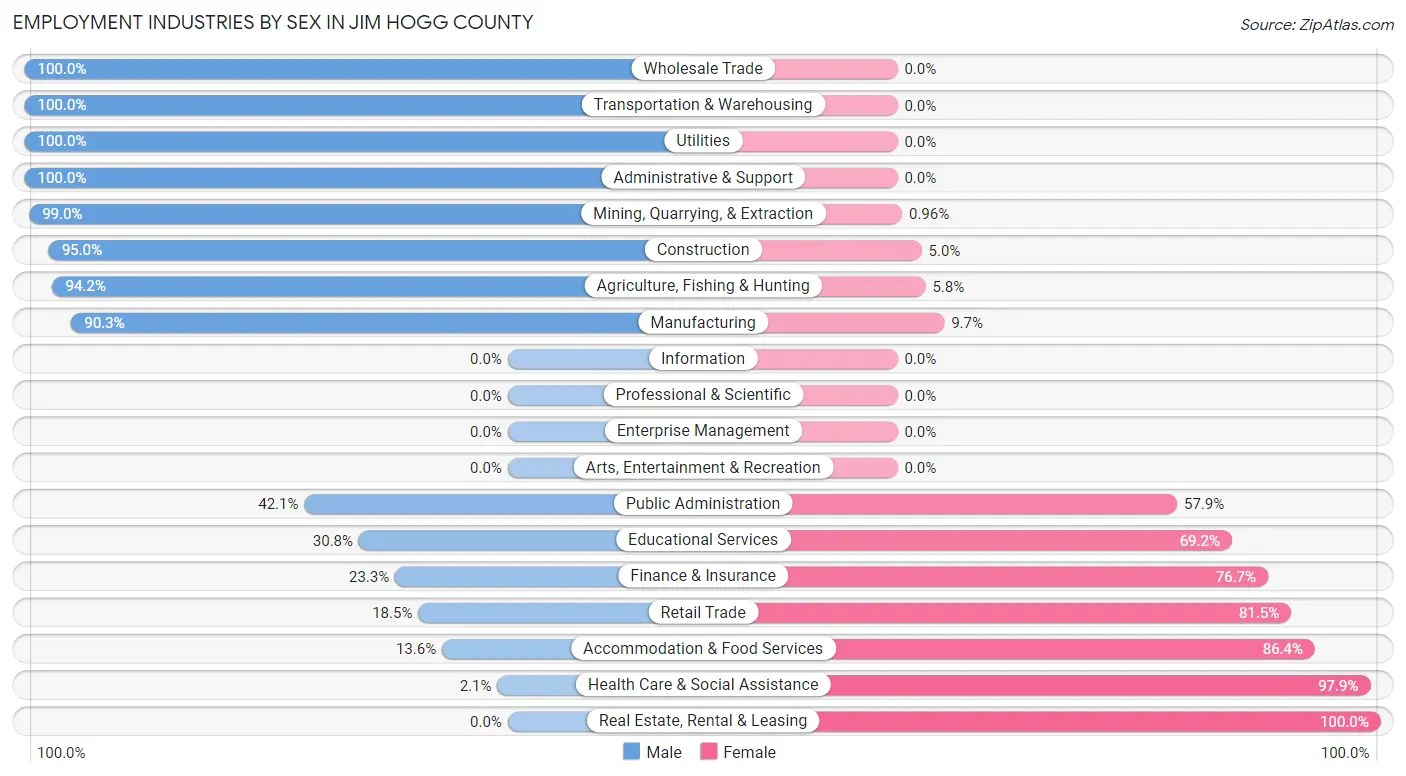
The Jim Hogg County industries that see more men than women are Wholesale Trade (100.0%), Transportation & Warehousing (100.0%), and Utilities (100.0%), whereas the industries that tend to have a higher number of women are Real Estate, Rental & Leasing (100.0%), Health Care & Social Assistance (97.9%), and Accommodation & Food Services (86.4%).
| Industry | Male | Female |
| Agriculture, Fishing & Hunting | 65 (94.2%) | 4 (5.8%) |
| Mining, Quarrying, & Extraction | 515 (99.0%) | 5 (1.0%) |
| Construction | 95 (95.0%) | 5 (5.0%) |
| Manufacturing | 28 (90.3%) | 3 (9.7%) |
| Wholesale Trade | 23 (100.0%) | 0 (0.0%) |
| Retail Trade | 55 (18.5%) | 242 (81.5%) |
| Transportation & Warehousing | 85 (100.0%) | 0 (0.0%) |
| Utilities | 50 (100.0%) | 0 (0.0%) |
| Information | 0 (0.0%) | 0 (0.0%) |
| Finance & Insurance | 7 (23.3%) | 23 (76.7%) |
| Real Estate, Rental & Leasing | 0 (0.0%) | 2 (100.0%) |
| Professional & Scientific | 0 (0.0%) | 0 (0.0%) |
| Enterprise Management | 0 (0.0%) | 0 (0.0%) |
| Administrative & Support | 26 (100.0%) | 0 (0.0%) |
| Educational Services | 65 (30.8%) | 146 (69.2%) |
| Health Care & Social Assistance | 6 (2.1%) | 274 (97.9%) |
| Arts, Entertainment & Recreation | 0 (0.0%) | 0 (0.0%) |
| Accommodation & Food Services | 20 (13.6%) | 127 (86.4%) |
| Public Administration | 40 (42.1%) | 55 (57.9%) |
| Total | 1,201 (57.5%) | 889 (42.5%) |
Education in Jim Hogg County
School Enrollment in Jim Hogg County
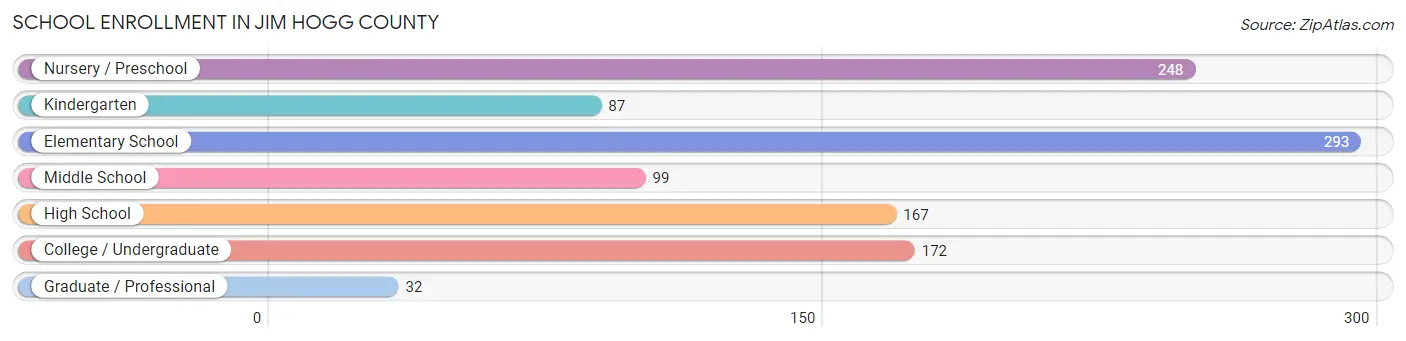
The most common levels of schooling among the 1,098 students in Jim Hogg County are elementary school (293 | 26.7%), nursery / preschool (248 | 22.6%), and college / undergraduate (172 | 15.7%).
| School Level | # Students | % Students |
| Nursery / Preschool | 248 | 22.6% |
| Kindergarten | 87 | 7.9% |
| Elementary School | 293 | 26.7% |
| Middle School | 99 | 9.0% |
| High School | 167 | 15.2% |
| College / Undergraduate | 172 | 15.7% |
| Graduate / Professional | 32 | 2.9% |
| Total | 1,098 | 100.0% |
School Enrollment by Age by Funding Source in Jim Hogg County
Out of a total of 1,098 students who are enrolled in schools in Jim Hogg County, 14 (1.3%) attend a private institution, while the remaining 1,084 (98.7%) are enrolled in public schools. The age group of 25 to 34 year olds has the highest likelihood of being enrolled in private schools, with 8 (30.8% in the age bracket) enrolled. Conversely, the age group of 3 to 4 year olds has the lowest likelihood of being enrolled in a private school, with 235 (100.0% in the age bracket) attending a public institution.
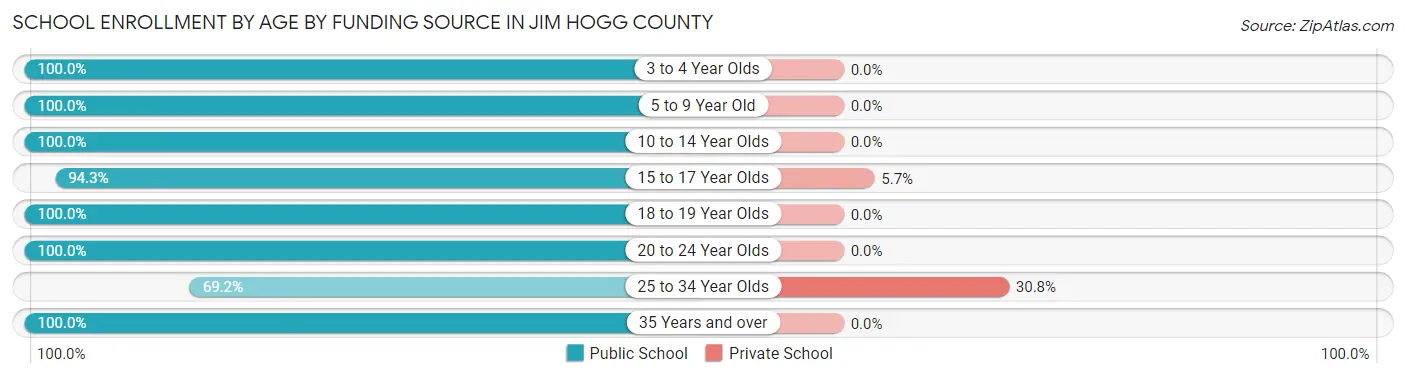
| Age Bracket | Public School | Private School |
| 3 to 4 Year Olds | 235 (100.0%) | 0 (0.0%) |
| 5 to 9 Year Old | 311 (100.0%) | 0 (0.0%) |
| 10 to 14 Year Olds | 210 (100.0%) | 0 (0.0%) |
| 15 to 17 Year Olds | 99 (94.3%) | 6 (5.7%) |
| 18 to 19 Year Olds | 86 (100.0%) | 0 (0.0%) |
| 20 to 24 Year Olds | 76 (100.0%) | 0 (0.0%) |
| 25 to 34 Year Olds | 18 (69.2%) | 8 (30.8%) |
| 35 Years and over | 49 (100.0%) | 0 (0.0%) |
| Total | 1,084 (98.7%) | 14 (1.3%) |
Educational Attainment by Field of Study in Jim Hogg County
Education (101 | 32.4%), business (37 | 11.9%), bio, nature & agricultural (35 | 11.2%), computers & mathematics (30 | 9.6%), and literature & languages (30 | 9.6%) are the most common fields of study among 312 individuals in Jim Hogg County who have obtained a bachelor's degree or higher.
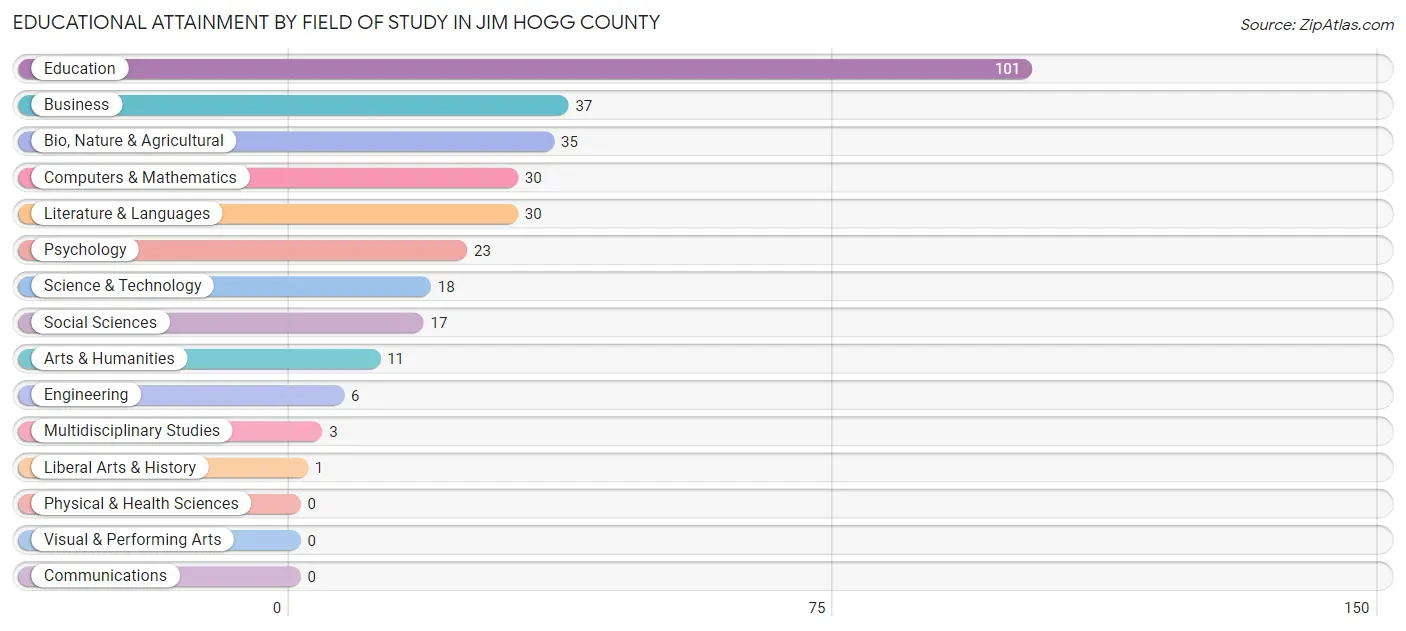
| Field of Study | # Graduates | % Graduates |
| Computers & Mathematics | 30 | 9.6% |
| Bio, Nature & Agricultural | 35 | 11.2% |
| Physical & Health Sciences | 0 | 0.0% |
| Psychology | 23 | 7.4% |
| Social Sciences | 17 | 5.4% |
| Engineering | 6 | 1.9% |
| Multidisciplinary Studies | 3 | 1.0% |
| Science & Technology | 18 | 5.8% |
| Business | 37 | 11.9% |
| Education | 101 | 32.4% |
| Literature & Languages | 30 | 9.6% |
| Liberal Arts & History | 1 | 0.3% |
| Visual & Performing Arts | 0 | 0.0% |
| Communications | 0 | 0.0% |
| Arts & Humanities | 11 | 3.5% |
| Total | 312 | 100.0% |
Transportation & Commute in Jim Hogg County
Vehicle Availability by Sex in Jim Hogg County
The most prevalent vehicle ownership categories in Jim Hogg County are males with 1 vehicle (503, accounting for 42.1%) and females with 1 vehicle (171, making up 59.3%).
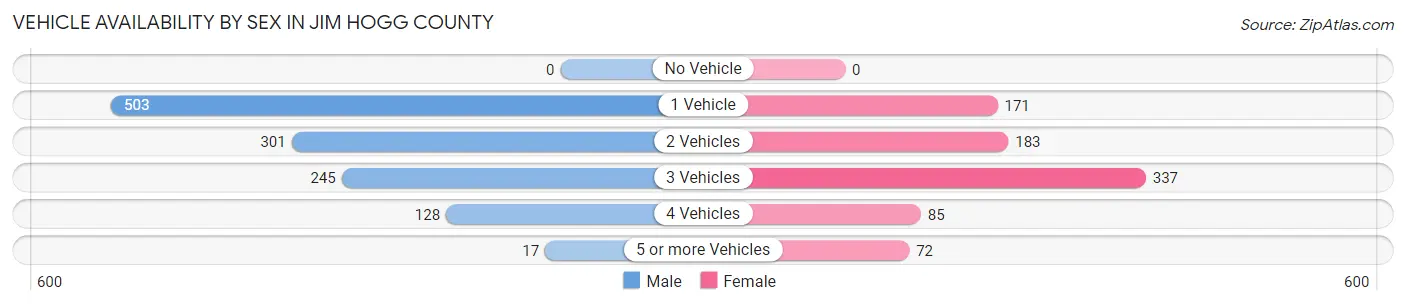
| Vehicles Available | Male | Female |
| No Vehicle | 0 (0.0%) | 0 (0.0%) |
| 1 Vehicle | 503 (42.1%) | 171 (20.2%) |
| 2 Vehicles | 301 (25.2%) | 183 (21.6%) |
| 3 Vehicles | 245 (20.5%) | 337 (39.7%) |
| 4 Vehicles | 128 (10.7%) | 85 (10.0%) |
| 5 or more Vehicles | 17 (1.4%) | 72 (8.5%) |
| Total | 1,194 (100.0%) | 848 (100.0%) |
Commute Time in Jim Hogg County
The most frequently occuring commute durations in Jim Hogg County are 5 to 9 minutes (509 commuters, 25.2%), 60 to 89 minutes (330 commuters, 16.4%), and 10 to 14 minutes (311 commuters, 15.4%).
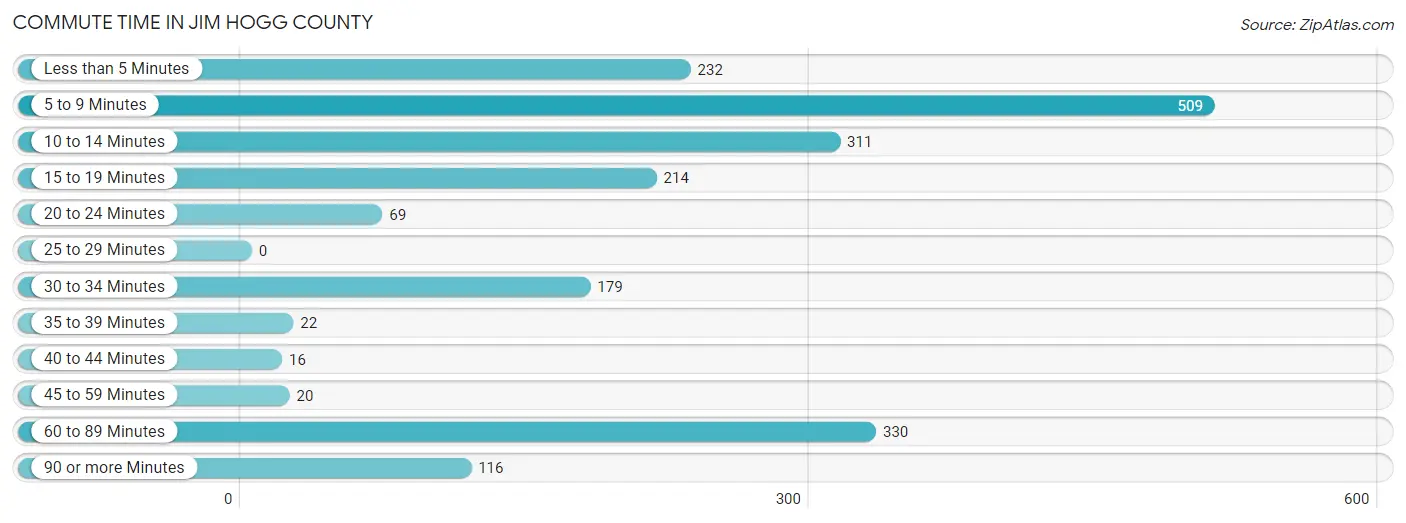
| Commute Time | # Commuters | % Commuters |
| Less than 5 Minutes | 232 | 11.5% |
| 5 to 9 Minutes | 509 | 25.2% |
| 10 to 14 Minutes | 311 | 15.4% |
| 15 to 19 Minutes | 214 | 10.6% |
| 20 to 24 Minutes | 69 | 3.4% |
| 25 to 29 Minutes | 0 | 0.0% |
| 30 to 34 Minutes | 179 | 8.9% |
| 35 to 39 Minutes | 22 | 1.1% |
| 40 to 44 Minutes | 16 | 0.8% |
| 45 to 59 Minutes | 20 | 1.0% |
| 60 to 89 Minutes | 330 | 16.4% |
| 90 or more Minutes | 116 | 5.8% |
Commute Time by Sex in Jim Hogg County
The most common commute times in Jim Hogg County are 60 to 89 minutes (263 commuters, 22.5%) for males and 5 to 9 minutes (281 commuters, 33.1%) for females.
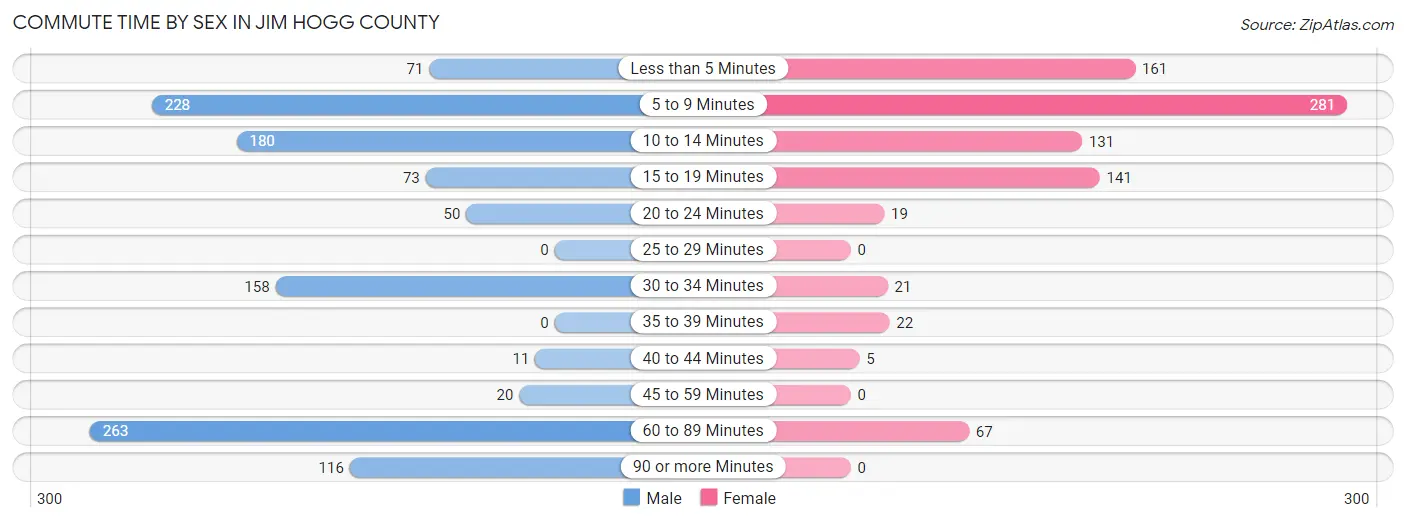
| Commute Time | Male | Female |
| Less than 5 Minutes | 71 (6.1%) | 161 (19.0%) |
| 5 to 9 Minutes | 228 (19.5%) | 281 (33.1%) |
| 10 to 14 Minutes | 180 (15.4%) | 131 (15.4%) |
| 15 to 19 Minutes | 73 (6.2%) | 141 (16.6%) |
| 20 to 24 Minutes | 50 (4.3%) | 19 (2.2%) |
| 25 to 29 Minutes | 0 (0.0%) | 0 (0.0%) |
| 30 to 34 Minutes | 158 (13.5%) | 21 (2.5%) |
| 35 to 39 Minutes | 0 (0.0%) | 22 (2.6%) |
| 40 to 44 Minutes | 11 (0.9%) | 5 (0.6%) |
| 45 to 59 Minutes | 20 (1.7%) | 0 (0.0%) |
| 60 to 89 Minutes | 263 (22.5%) | 67 (7.9%) |
| 90 or more Minutes | 116 (9.9%) | 0 (0.0%) |
Time of Departure to Work by Sex in Jim Hogg County
The most frequent times of departure to work in Jim Hogg County are 12:00 AM to 4:59 AM (243, 20.8%) for males and 8:00 AM to 8:29 AM (189, 22.3%) for females.
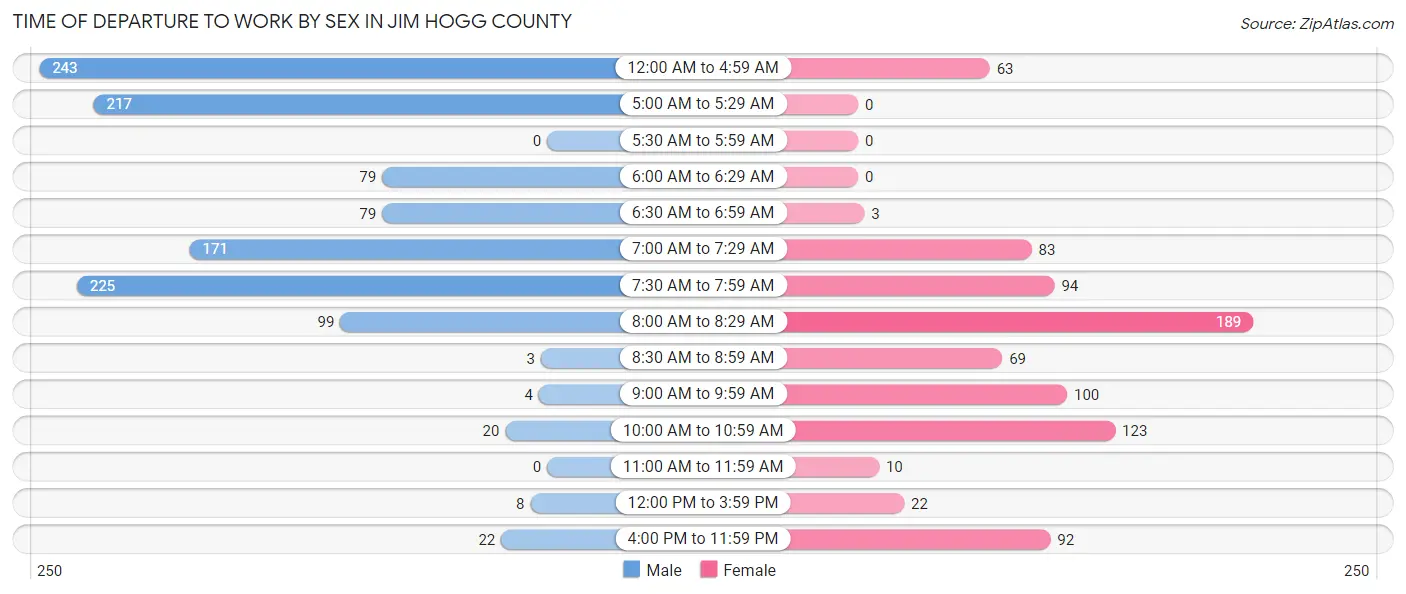
| Time of Departure | Male | Female |
| 12:00 AM to 4:59 AM | 243 (20.8%) | 63 (7.4%) |
| 5:00 AM to 5:29 AM | 217 (18.5%) | 0 (0.0%) |
| 5:30 AM to 5:59 AM | 0 (0.0%) | 0 (0.0%) |
| 6:00 AM to 6:29 AM | 79 (6.8%) | 0 (0.0%) |
| 6:30 AM to 6:59 AM | 79 (6.8%) | 3 (0.4%) |
| 7:00 AM to 7:29 AM | 171 (14.6%) | 83 (9.8%) |
| 7:30 AM to 7:59 AM | 225 (19.2%) | 94 (11.1%) |
| 8:00 AM to 8:29 AM | 99 (8.5%) | 189 (22.3%) |
| 8:30 AM to 8:59 AM | 3 (0.3%) | 69 (8.1%) |
| 9:00 AM to 9:59 AM | 4 (0.3%) | 100 (11.8%) |
| 10:00 AM to 10:59 AM | 20 (1.7%) | 123 (14.5%) |
| 11:00 AM to 11:59 AM | 0 (0.0%) | 10 (1.2%) |
| 12:00 PM to 3:59 PM | 8 (0.7%) | 22 (2.6%) |
| 4:00 PM to 11:59 PM | 22 (1.9%) | 92 (10.8%) |
| Total | 1,170 (100.0%) | 848 (100.0%) |
Housing Occupancy in Jim Hogg County
Occupancy by Ownership in Jim Hogg County
Of the total 1,342 dwellings in Jim Hogg County, owner-occupied units account for 855 (63.7%), while renter-occupied units make up 487 (36.3%).
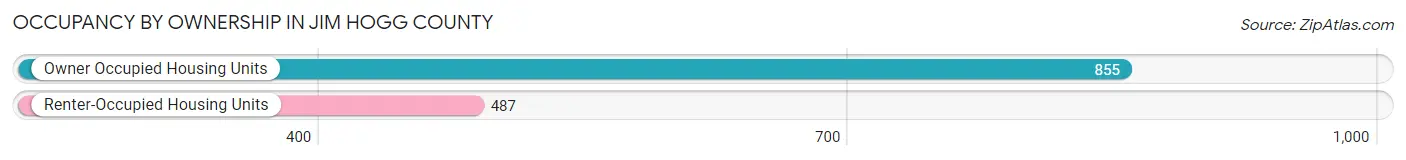
| Occupancy | # Housing Units | % Housing Units |
| Owner Occupied Housing Units | 855 | 63.7% |
| Renter-Occupied Housing Units | 487 | 36.3% |
| Total Occupied Housing Units | 1,342 | 100.0% |
Occupancy by Household Size in Jim Hogg County
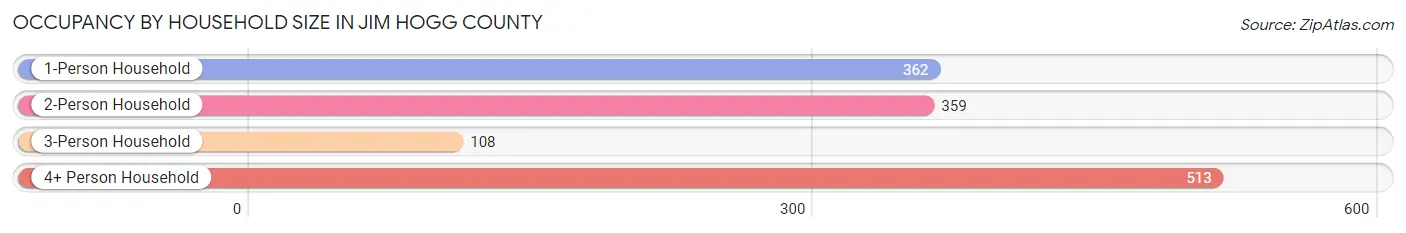
| Household Size | # Housing Units | % Housing Units |
| 1-Person Household | 362 | 27.0% |
| 2-Person Household | 359 | 26.8% |
| 3-Person Household | 108 | 8.1% |
| 4+ Person Household | 513 | 38.2% |
| Total Housing Units | 1,342 | 100.0% |
Occupancy by Ownership by Household Size in Jim Hogg County
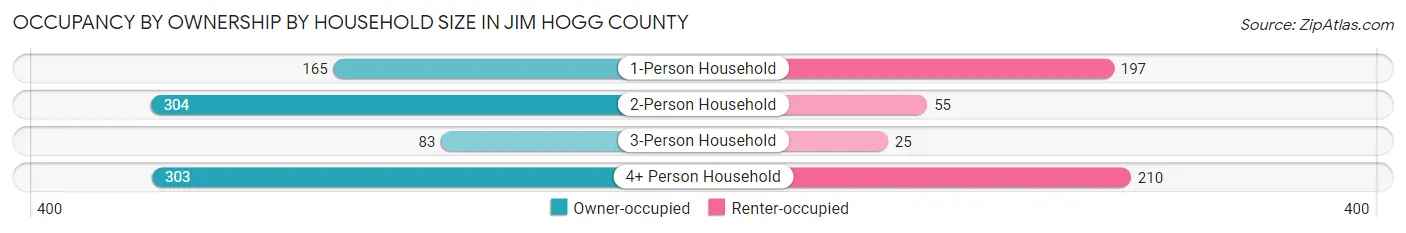
| Household Size | Owner-occupied | Renter-occupied |
| 1-Person Household | 165 (45.6%) | 197 (54.4%) |
| 2-Person Household | 304 (84.7%) | 55 (15.3%) |
| 3-Person Household | 83 (76.8%) | 25 (23.2%) |
| 4+ Person Household | 303 (59.1%) | 210 (40.9%) |
| Total Housing Units | 855 (63.7%) | 487 (36.3%) |
Occupancy by Educational Attainment in Jim Hogg County
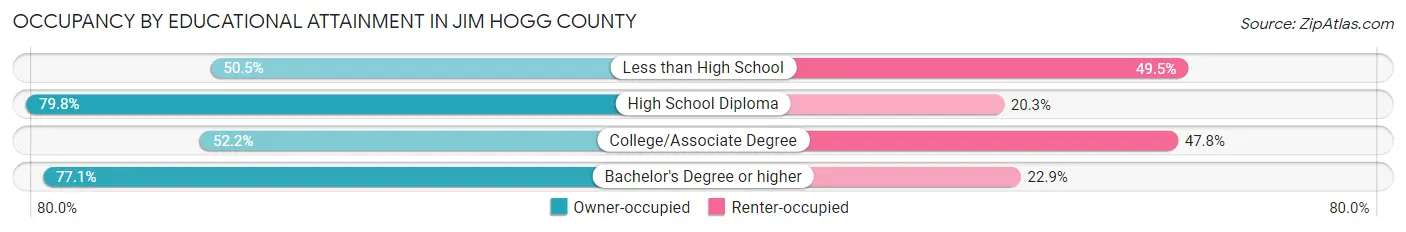
| Household Size | Owner-occupied | Renter-occupied |
| Less than High School | 142 (50.5%) | 139 (49.5%) |
| High School Diploma | 323 (79.7%) | 82 (20.3%) |
| College/Associate Degree | 242 (52.2%) | 222 (47.8%) |
| Bachelor's Degree or higher | 148 (77.1%) | 44 (22.9%) |
Occupancy by Age of Householder in Jim Hogg County
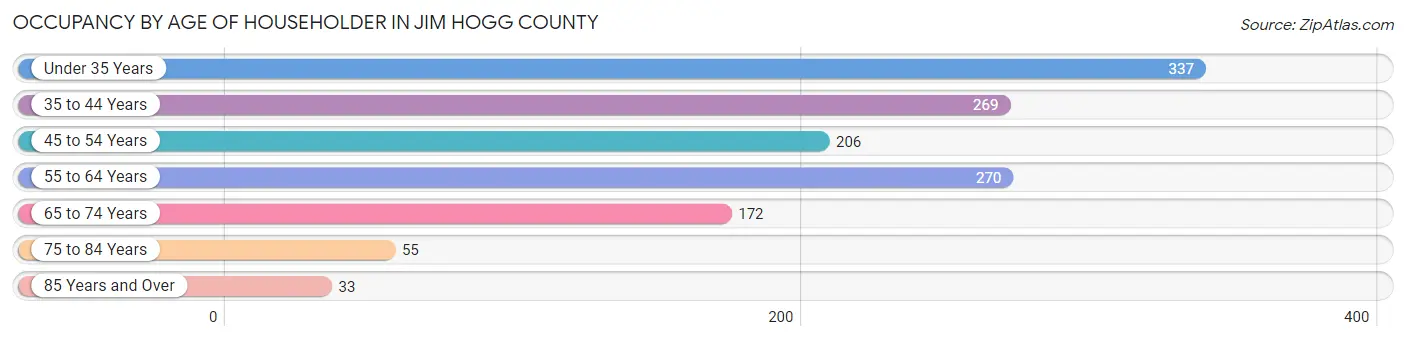
| Age Bracket | # Households | % Households |
| Under 35 Years | 337 | 25.1% |
| 35 to 44 Years | 269 | 20.0% |
| 45 to 54 Years | 206 | 15.3% |
| 55 to 64 Years | 270 | 20.1% |
| 65 to 74 Years | 172 | 12.8% |
| 75 to 84 Years | 55 | 4.1% |
| 85 Years and Over | 33 | 2.5% |
| Total | 1,342 | 100.0% |
Housing Finances in Jim Hogg County
Median Income by Occupancy in Jim Hogg County
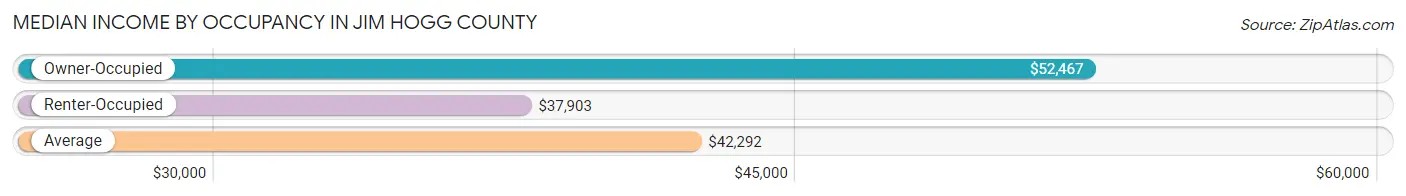
| Occupancy Type | # Households | Median Income |
| Owner-Occupied | 855 (63.7%) | $52,467 |
| Renter-Occupied | 487 (36.3%) | $37,903 |
| Average | 1,342 (100.0%) | $42,292 |
Occupancy by Householder Income Bracket in Jim Hogg County
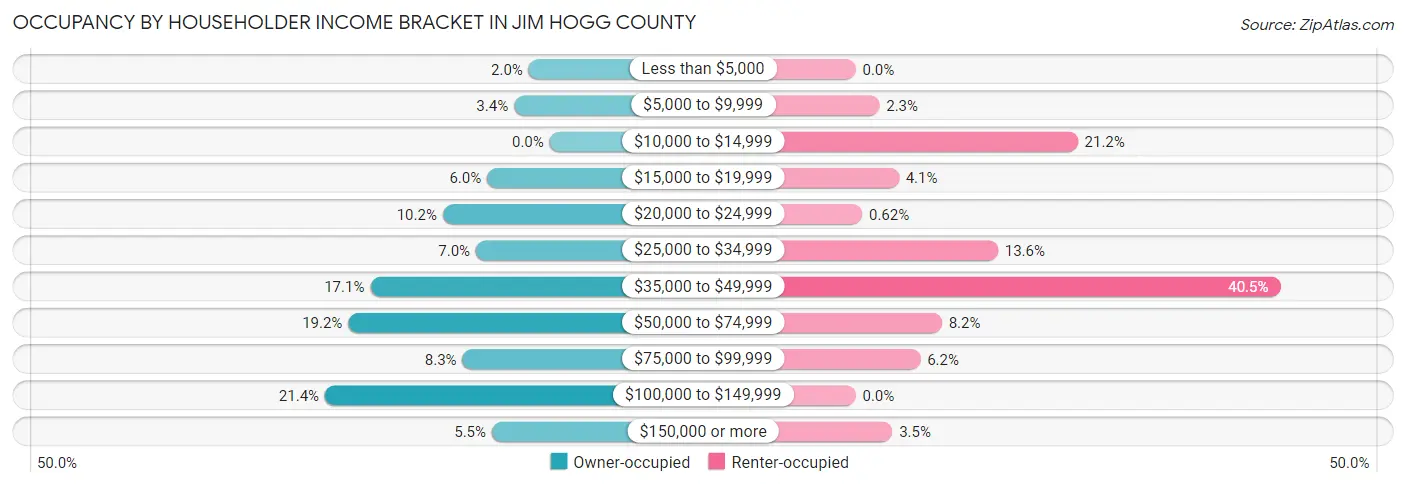
| Income Bracket | Owner-occupied | Renter-occupied |
| Less than $5,000 | 17 (2.0%) | 0 (0.0%) |
| $5,000 to $9,999 | 29 (3.4%) | 11 (2.3%) |
| $10,000 to $14,999 | 0 (0.0%) | 103 (21.1%) |
| $15,000 to $19,999 | 51 (6.0%) | 20 (4.1%) |
| $20,000 to $24,999 | 87 (10.2%) | 3 (0.6%) |
| $25,000 to $34,999 | 60 (7.0%) | 66 (13.6%) |
| $35,000 to $49,999 | 146 (17.1%) | 197 (40.5%) |
| $50,000 to $74,999 | 164 (19.2%) | 40 (8.2%) |
| $75,000 to $99,999 | 71 (8.3%) | 30 (6.2%) |
| $100,000 to $149,999 | 183 (21.4%) | 0 (0.0%) |
| $150,000 or more | 47 (5.5%) | 17 (3.5%) |
| Total | 855 (100.0%) | 487 (100.0%) |
Monthly Housing Cost Tiers in Jim Hogg County
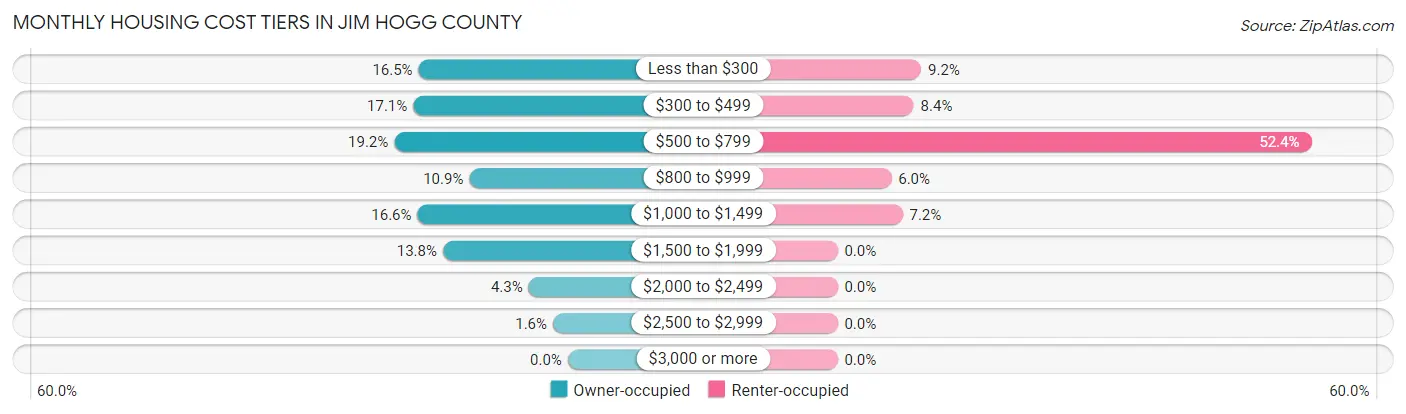
| Monthly Cost | Owner-occupied | Renter-occupied |
| Less than $300 | 141 (16.5%) | 45 (9.2%) |
| $300 to $499 | 146 (17.1%) | 41 (8.4%) |
| $500 to $799 | 164 (19.2%) | 255 (52.4%) |
| $800 to $999 | 93 (10.9%) | 29 (5.9%) |
| $1,000 to $1,499 | 142 (16.6%) | 35 (7.2%) |
| $1,500 to $1,999 | 118 (13.8%) | 0 (0.0%) |
| $2,000 to $2,499 | 37 (4.3%) | 0 (0.0%) |
| $2,500 to $2,999 | 14 (1.6%) | 0 (0.0%) |
| $3,000 or more | 0 (0.0%) | 0 (0.0%) |
| Total | 855 (100.0%) | 487 (100.0%) |
Physical Housing Characteristics in Jim Hogg County
Housing Structures in Jim Hogg County
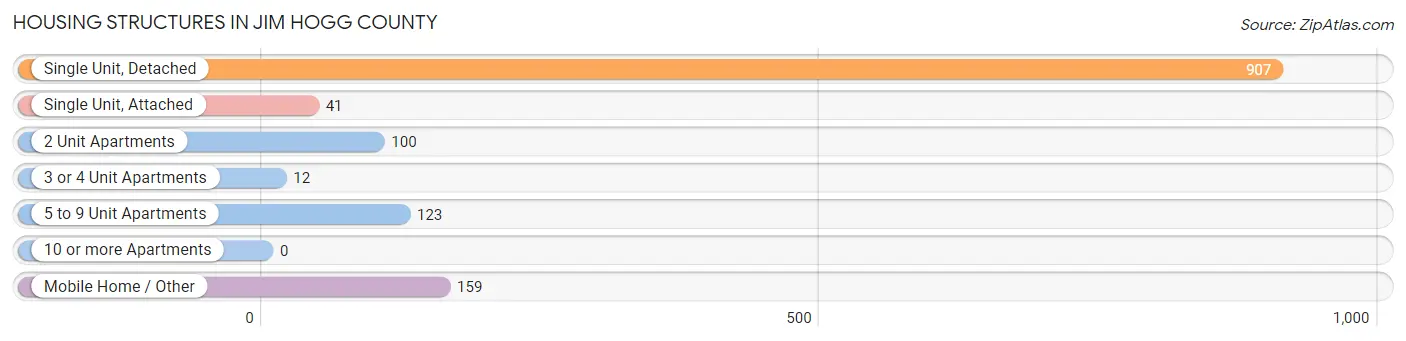
| Structure Type | # Housing Units | % Housing Units |
| Single Unit, Detached | 907 | 67.6% |
| Single Unit, Attached | 41 | 3.1% |
| 2 Unit Apartments | 100 | 7.4% |
| 3 or 4 Unit Apartments | 12 | 0.9% |
| 5 to 9 Unit Apartments | 123 | 9.2% |
| 10 or more Apartments | 0 | 0.0% |
| Mobile Home / Other | 159 | 11.8% |
| Total | 1,342 | 100.0% |
Housing Structures by Occupancy in Jim Hogg County
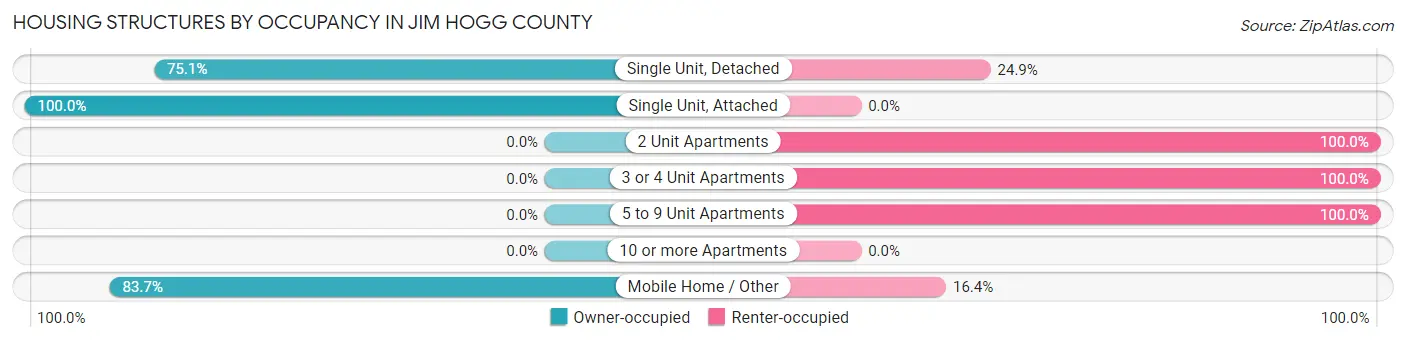
| Structure Type | Owner-occupied | Renter-occupied |
| Single Unit, Detached | 681 (75.1%) | 226 (24.9%) |
| Single Unit, Attached | 41 (100.0%) | 0 (0.0%) |
| 2 Unit Apartments | 0 (0.0%) | 100 (100.0%) |
| 3 or 4 Unit Apartments | 0 (0.0%) | 12 (100.0%) |
| 5 to 9 Unit Apartments | 0 (0.0%) | 123 (100.0%) |
| 10 or more Apartments | 0 (0.0%) | 0 (0.0%) |
| Mobile Home / Other | 133 (83.7%) | 26 (16.4%) |
| Total | 855 (63.7%) | 487 (36.3%) |
Housing Structures by Number of Rooms in Jim Hogg County
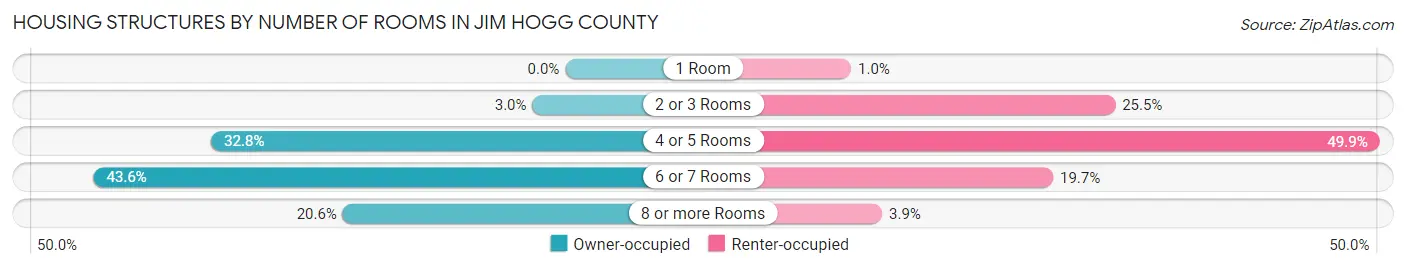
| Number of Rooms | Owner-occupied | Renter-occupied |
| 1 Room | 0 (0.0%) | 5 (1.0%) |
| 2 or 3 Rooms | 26 (3.0%) | 124 (25.5%) |
| 4 or 5 Rooms | 280 (32.8%) | 243 (49.9%) |
| 6 or 7 Rooms | 373 (43.6%) | 96 (19.7%) |
| 8 or more Rooms | 176 (20.6%) | 19 (3.9%) |
| Total | 855 (100.0%) | 487 (100.0%) |
Housing Structure by Heating Type in Jim Hogg County
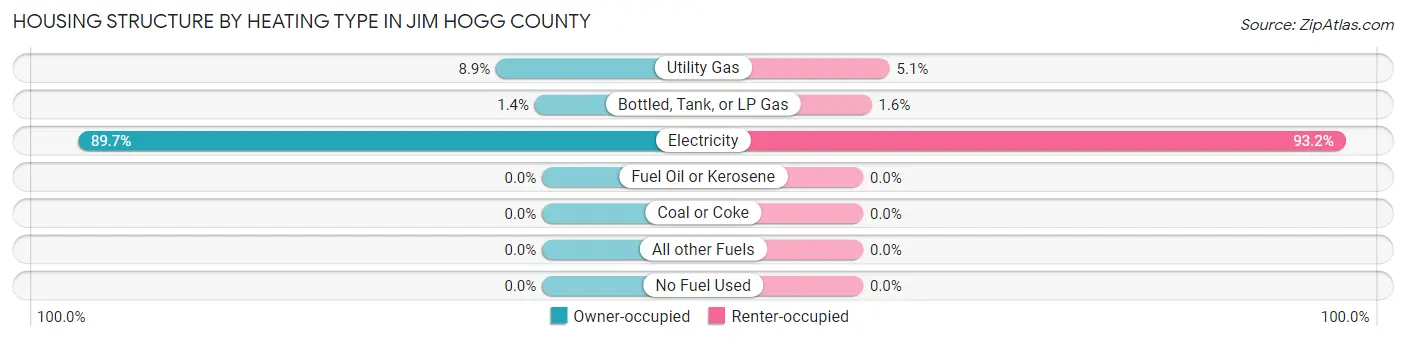
| Heating Type | Owner-occupied | Renter-occupied |
| Utility Gas | 76 (8.9%) | 25 (5.1%) |
| Bottled, Tank, or LP Gas | 12 (1.4%) | 8 (1.6%) |
| Electricity | 767 (89.7%) | 454 (93.2%) |
| Fuel Oil or Kerosene | 0 (0.0%) | 0 (0.0%) |
| Coal or Coke | 0 (0.0%) | 0 (0.0%) |
| All other Fuels | 0 (0.0%) | 0 (0.0%) |
| No Fuel Used | 0 (0.0%) | 0 (0.0%) |
| Total | 855 (100.0%) | 487 (100.0%) |
Household Vehicle Usage in Jim Hogg County
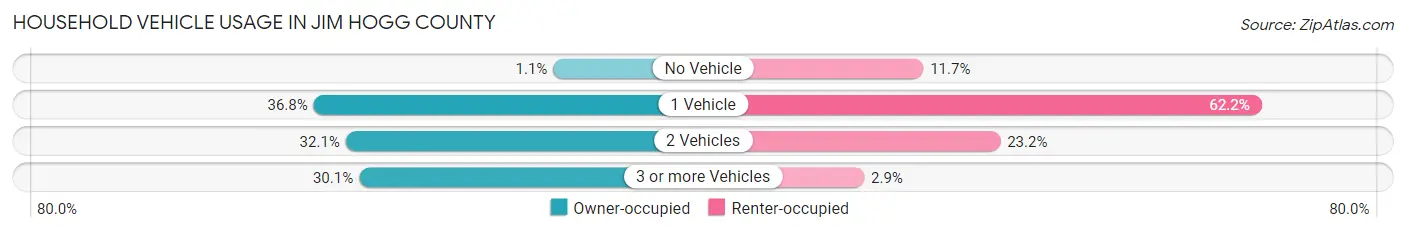
| Vehicles per Household | Owner-occupied | Renter-occupied |
| No Vehicle | 9 (1.1%) | 57 (11.7%) |
| 1 Vehicle | 315 (36.8%) | 303 (62.2%) |
| 2 Vehicles | 274 (32.1%) | 113 (23.2%) |
| 3 or more Vehicles | 257 (30.1%) | 14 (2.9%) |
| Total | 855 (100.0%) | 487 (100.0%) |
Real Estate & Mortgages in Jim Hogg County
Real Estate and Mortgage Overview in Jim Hogg County
| Characteristic | Without Mortgage | With Mortgage |
| Housing Units | 445 | 410 |
| Median Property Value | $66,200 | $143,200 |
| Median Household Income | $41,250 | $42 |
| Monthly Housing Costs | $378 | $0 |
| Real Estate Taxes | $906 | $41 |
Property Value by Mortgage Status in Jim Hogg County
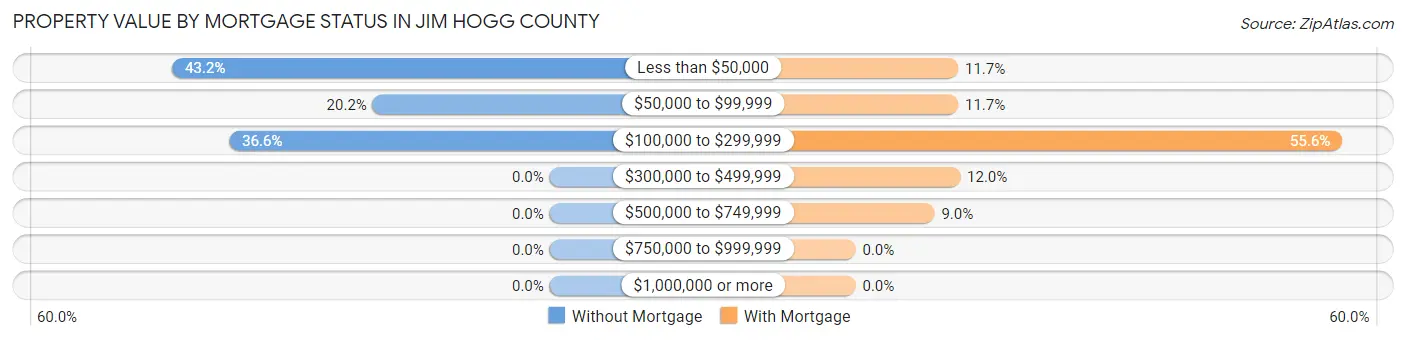
| Property Value | Without Mortgage | With Mortgage |
| Less than $50,000 | 192 (43.1%) | 48 (11.7%) |
| $50,000 to $99,999 | 90 (20.2%) | 48 (11.7%) |
| $100,000 to $299,999 | 163 (36.6%) | 228 (55.6%) |
| $300,000 to $499,999 | 0 (0.0%) | 49 (11.9%) |
| $500,000 to $749,999 | 0 (0.0%) | 37 (9.0%) |
| $750,000 to $999,999 | 0 (0.0%) | 0 (0.0%) |
| $1,000,000 or more | 0 (0.0%) | 0 (0.0%) |
| Total | 445 (100.0%) | 410 (100.0%) |
Household Income by Mortgage Status in Jim Hogg County
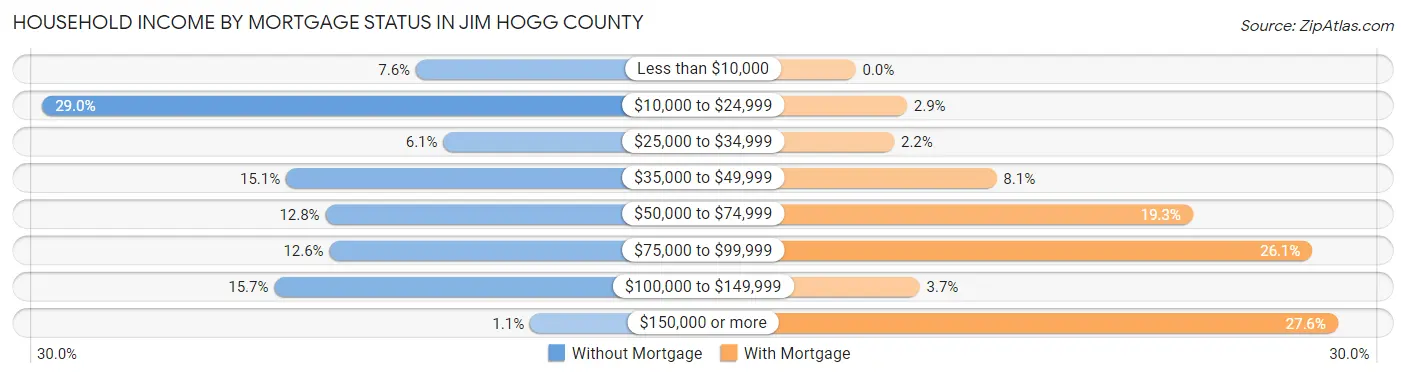
| Household Income | Without Mortgage | With Mortgage |
| Less than $10,000 | 34 (7.6%) | 0 (0.0%) |
| $10,000 to $24,999 | 129 (29.0%) | 12 (2.9%) |
| $25,000 to $34,999 | 27 (6.1%) | 9 (2.2%) |
| $35,000 to $49,999 | 67 (15.1%) | 33 (8.1%) |
| $50,000 to $74,999 | 57 (12.8%) | 79 (19.3%) |
| $75,000 to $99,999 | 56 (12.6%) | 107 (26.1%) |
| $100,000 to $149,999 | 70 (15.7%) | 15 (3.7%) |
| $150,000 or more | 5 (1.1%) | 113 (27.6%) |
| Total | 445 (100.0%) | 410 (100.0%) |
Property Value to Household Income Ratio in Jim Hogg County
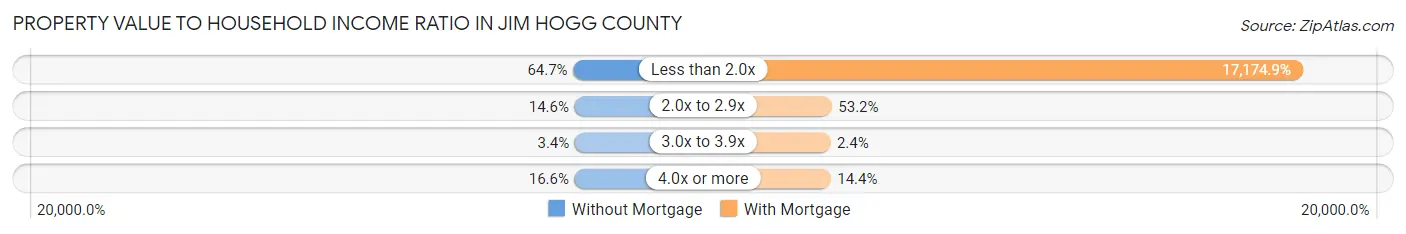
| Value-to-Income Ratio | Without Mortgage | With Mortgage |
| Less than 2.0x | 288 (64.7%) | 70,417 (17,174.9%) |
| 2.0x to 2.9x | 65 (14.6%) | 218 (53.2%) |
| 3.0x to 3.9x | 15 (3.4%) | 10 (2.4%) |
| 4.0x or more | 74 (16.6%) | 59 (14.4%) |
| Total | 445 (100.0%) | 410 (100.0%) |
Real Estate Taxes by Mortgage Status in Jim Hogg County
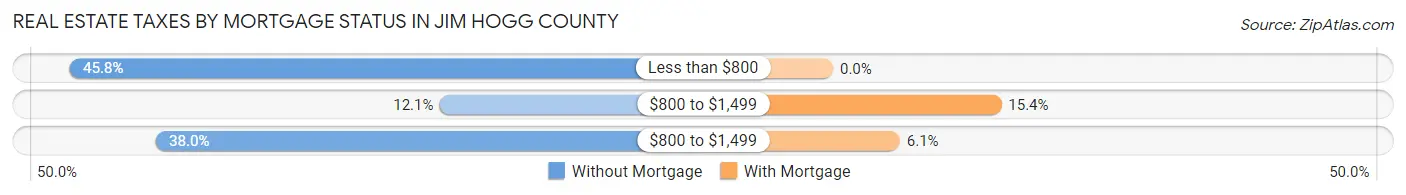
| Property Taxes | Without Mortgage | With Mortgage |
| Less than $800 | 204 (45.8%) | 0 (0.0%) |
| $800 to $1,499 | 54 (12.1%) | 63 (15.4%) |
| $800 to $1,499 | 169 (38.0%) | 25 (6.1%) |
| Total | 445 (100.0%) | 410 (100.0%) |
Health & Disability in Jim Hogg County
Health Insurance Coverage by Age in Jim Hogg County
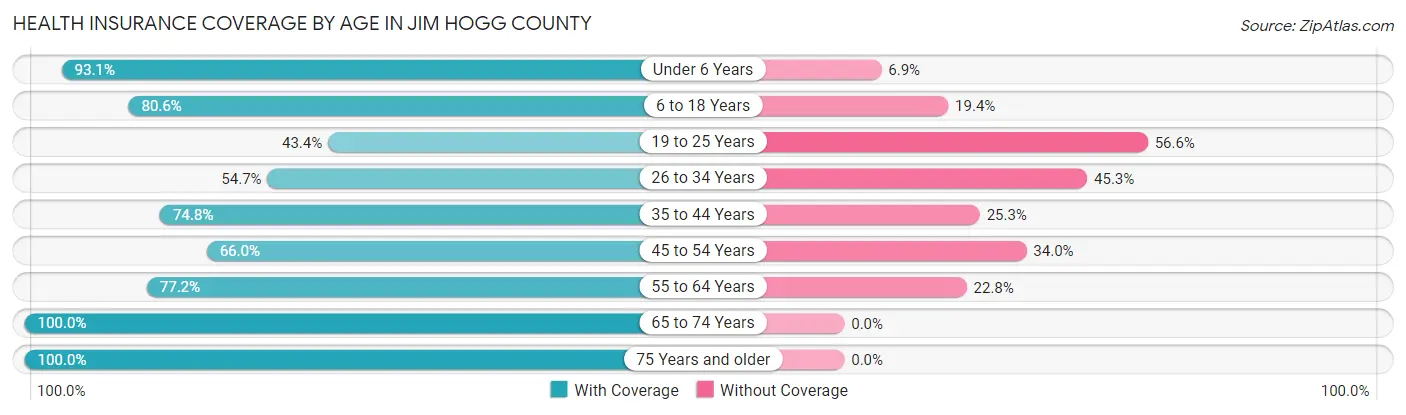
| Age Bracket | With Coverage | Without Coverage |
| Under 6 Years | 754 (93.1%) | 56 (6.9%) |
| 6 to 18 Years | 716 (80.6%) | 172 (19.4%) |
| 19 to 25 Years | 363 (43.4%) | 473 (56.6%) |
| 26 to 34 Years | 278 (54.7%) | 230 (45.3%) |
| 35 to 44 Years | 299 (74.8%) | 101 (25.3%) |
| 45 to 54 Years | 317 (66.0%) | 163 (34.0%) |
| 55 to 64 Years | 352 (77.2%) | 104 (22.8%) |
| 65 to 74 Years | 283 (100.0%) | 0 (0.0%) |
| 75 Years and older | 125 (100.0%) | 0 (0.0%) |
| Total | 3,487 (72.9%) | 1,299 (27.1%) |
Health Insurance Coverage by Citizenship Status in Jim Hogg County
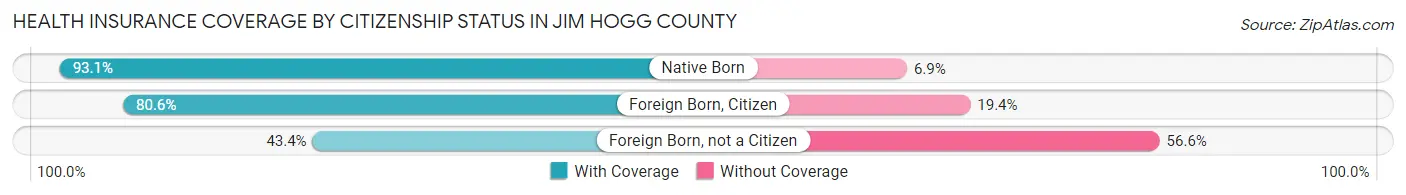
| Citizenship Status | With Coverage | Without Coverage |
| Native Born | 754 (93.1%) | 56 (6.9%) |
| Foreign Born, Citizen | 716 (80.6%) | 172 (19.4%) |
| Foreign Born, not a Citizen | 363 (43.4%) | 473 (56.6%) |
Health Insurance Coverage by Household Income in Jim Hogg County
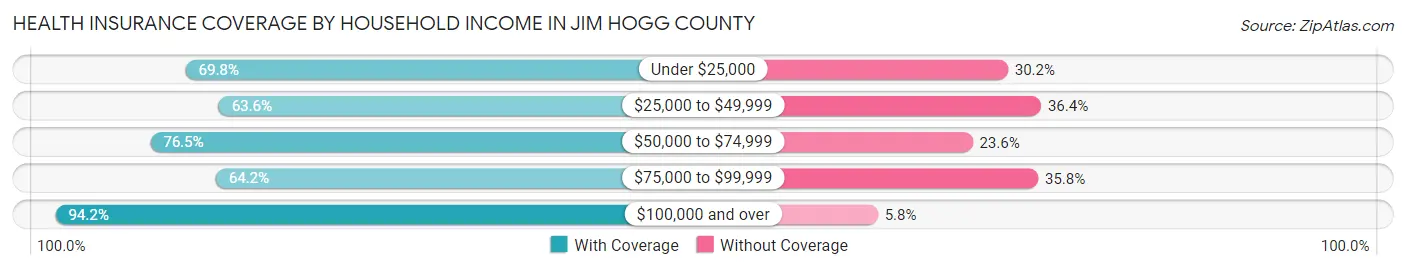
| Household Income | With Coverage | Without Coverage |
| Under $25,000 | 729 (69.8%) | 315 (30.2%) |
| $25,000 to $49,999 | 939 (63.6%) | 537 (36.4%) |
| $50,000 to $74,999 | 529 (76.4%) | 163 (23.5%) |
| $75,000 to $99,999 | 412 (64.2%) | 230 (35.8%) |
| $100,000 and over | 878 (94.2%) | 54 (5.8%) |
Public vs Private Health Insurance Coverage by Age in Jim Hogg County
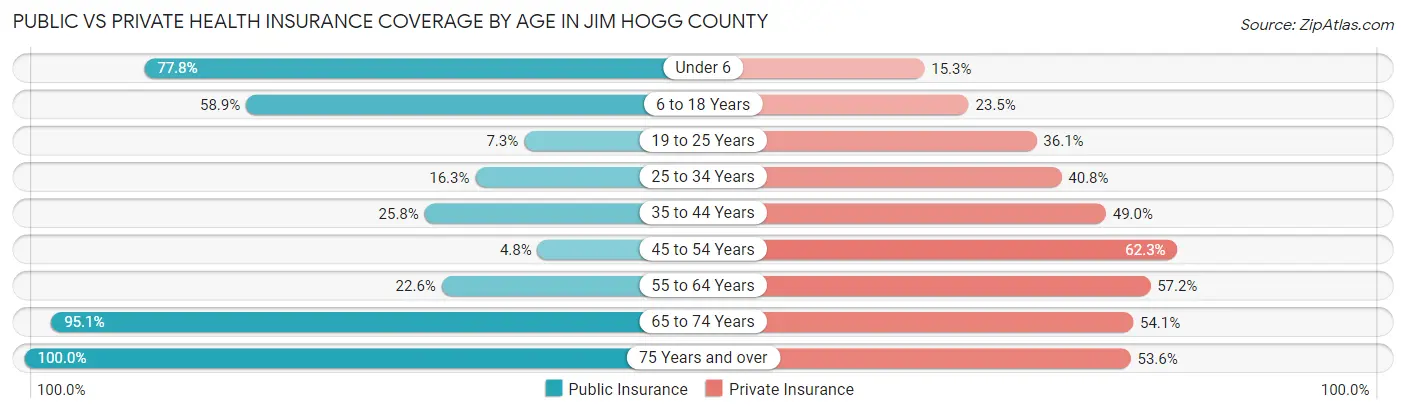
| Age Bracket | Public Insurance | Private Insurance |
| Under 6 | 630 (77.8%) | 124 (15.3%) |
| 6 to 18 Years | 523 (58.9%) | 209 (23.5%) |
| 19 to 25 Years | 61 (7.3%) | 302 (36.1%) |
| 25 to 34 Years | 83 (16.3%) | 207 (40.7%) |
| 35 to 44 Years | 103 (25.8%) | 196 (49.0%) |
| 45 to 54 Years | 23 (4.8%) | 299 (62.3%) |
| 55 to 64 Years | 103 (22.6%) | 261 (57.2%) |
| 65 to 74 Years | 269 (95.1%) | 153 (54.1%) |
| 75 Years and over | 125 (100.0%) | 67 (53.6%) |
| Total | 1,920 (40.1%) | 1,818 (38.0%) |
Disability Status by Sex by Age in Jim Hogg County
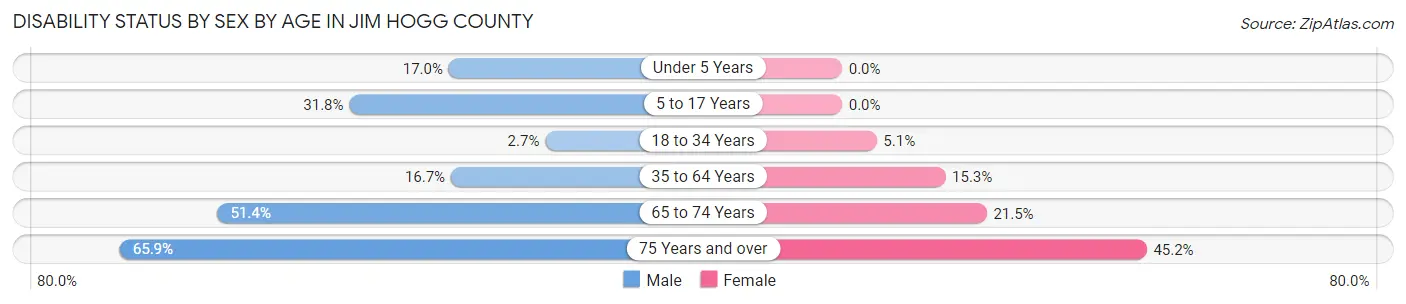
| Age Bracket | Male | Female |
| Under 5 Years | 74 (17.0%) | 0 (0.0%) |
| 5 to 17 Years | 130 (31.8%) | 0 (0.0%) |
| 18 to 34 Years | 21 (2.7%) | 36 (5.1%) |
| 35 to 64 Years | 112 (16.7%) | 102 (15.3%) |
| 65 to 74 Years | 76 (51.3%) | 29 (21.5%) |
| 75 Years and over | 27 (65.8%) | 38 (45.2%) |
Disability Class by Sex by Age in Jim Hogg County
Disability Class: Hearing Difficulty
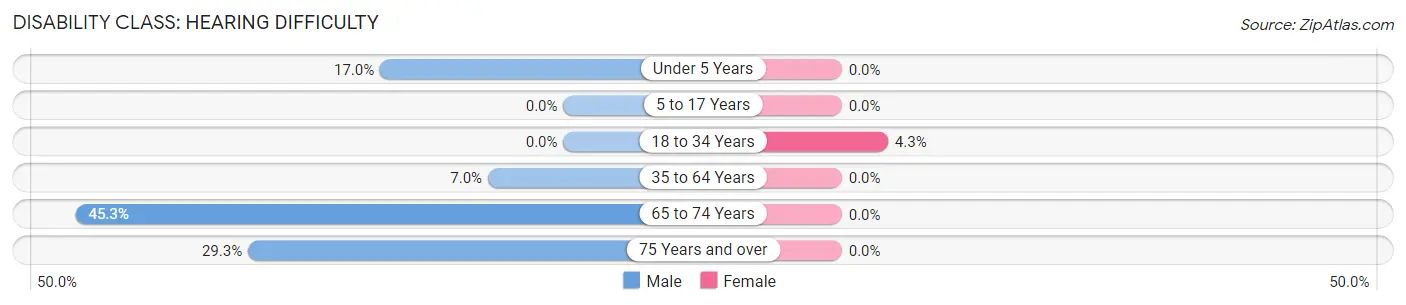
| Age Bracket | Male | Female |
| Under 5 Years | 74 (17.0%) | 0 (0.0%) |
| 5 to 17 Years | 0 (0.0%) | 0 (0.0%) |
| 18 to 34 Years | 0 (0.0%) | 30 (4.3%) |
| 35 to 64 Years | 47 (7.0%) | 0 (0.0%) |
| 65 to 74 Years | 67 (45.3%) | 0 (0.0%) |
| 75 Years and over | 12 (29.3%) | 0 (0.0%) |
Disability Class: Vision Difficulty
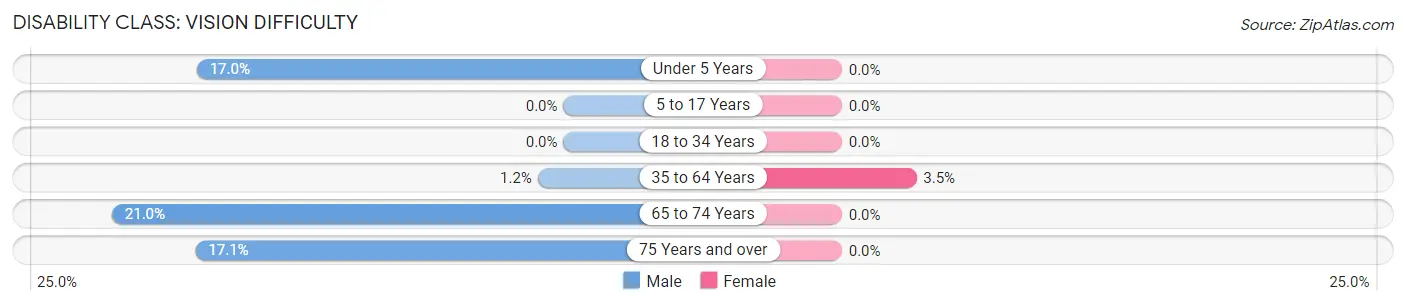
| Age Bracket | Male | Female |
| Under 5 Years | 74 (17.0%) | 0 (0.0%) |
| 5 to 17 Years | 0 (0.0%) | 0 (0.0%) |
| 18 to 34 Years | 0 (0.0%) | 0 (0.0%) |
| 35 to 64 Years | 8 (1.2%) | 23 (3.5%) |
| 65 to 74 Years | 31 (20.9%) | 0 (0.0%) |
| 75 Years and over | 7 (17.1%) | 0 (0.0%) |
Disability Class: Cognitive Difficulty
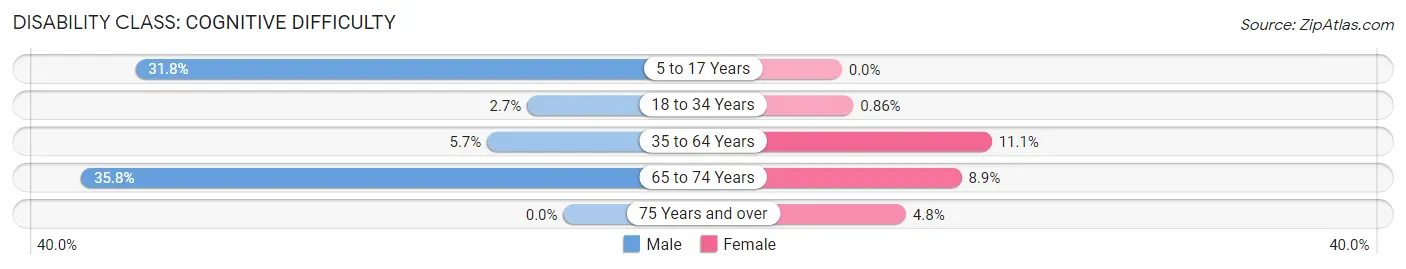
| Age Bracket | Male | Female |
| 5 to 17 Years | 130 (31.8%) | 0 (0.0%) |
| 18 to 34 Years | 21 (2.7%) | 6 (0.9%) |
| 35 to 64 Years | 38 (5.7%) | 74 (11.1%) |
| 65 to 74 Years | 53 (35.8%) | 12 (8.9%) |
| 75 Years and over | 0 (0.0%) | 4 (4.8%) |
Disability Class: Ambulatory Difficulty
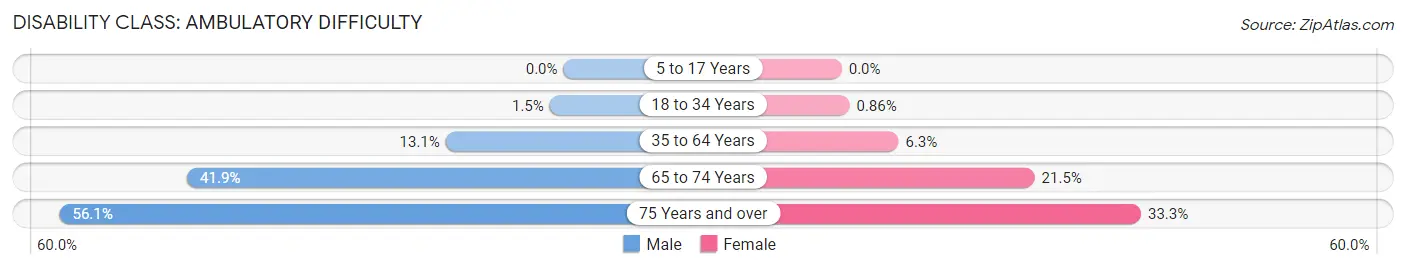
| Age Bracket | Male | Female |
| 5 to 17 Years | 0 (0.0%) | 0 (0.0%) |
| 18 to 34 Years | 12 (1.5%) | 6 (0.9%) |
| 35 to 64 Years | 88 (13.1%) | 42 (6.3%) |
| 65 to 74 Years | 62 (41.9%) | 29 (21.5%) |
| 75 Years and over | 23 (56.1%) | 28 (33.3%) |
Disability Class: Self-Care Difficulty
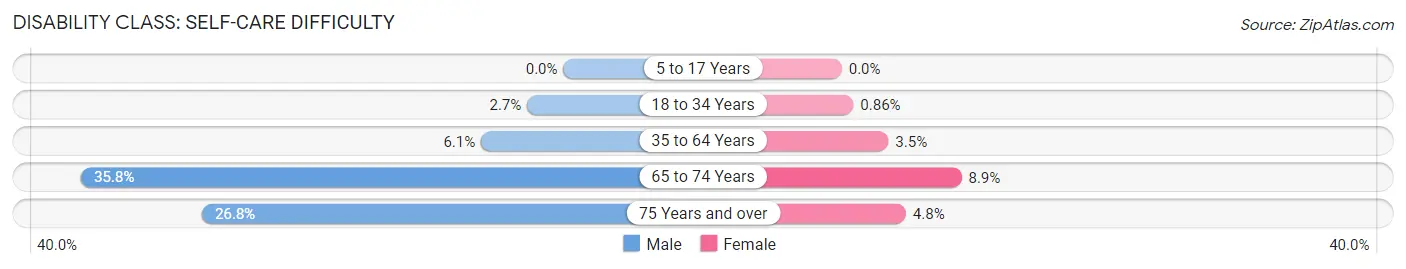
| Age Bracket | Male | Female |
| 5 to 17 Years | 0 (0.0%) | 0 (0.0%) |
| 18 to 34 Years | 21 (2.7%) | 6 (0.9%) |
| 35 to 64 Years | 41 (6.1%) | 23 (3.5%) |
| 65 to 74 Years | 53 (35.8%) | 12 (8.9%) |
| 75 Years and over | 11 (26.8%) | 4 (4.8%) |
Technology Access in Jim Hogg County
Computing Device Access in Jim Hogg County
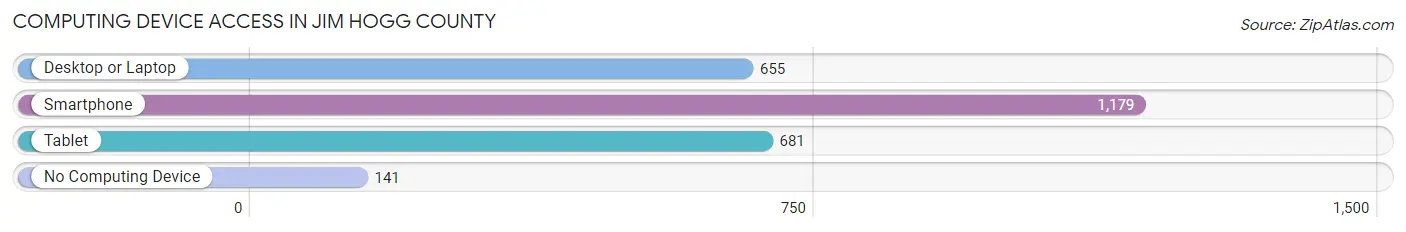
| Device Type | # Households | % Households |
| Desktop or Laptop | 655 | 48.8% |
| Smartphone | 1,179 | 87.8% |
| Tablet | 681 | 50.7% |
| No Computing Device | 141 | 10.5% |
| Total | 1,342 | 100.0% |
Internet Access in Jim Hogg County
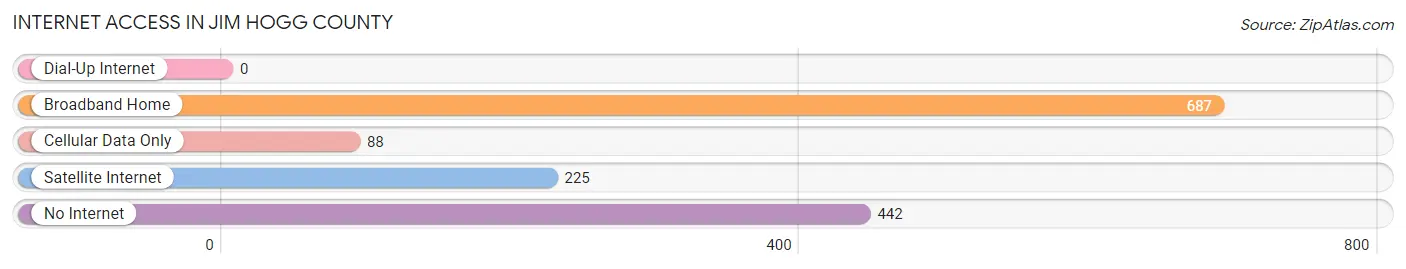
| Internet Type | # Households | % Households |
| Dial-Up Internet | 0 | 0.0% |
| Broadband Home | 687 | 51.2% |
| Cellular Data Only | 88 | 6.6% |
| Satellite Internet | 225 | 16.8% |
| No Internet | 442 | 32.9% |
| Total | 1,342 | 100.0% |
Jim Hogg County Summary
Jim Hogg County is located in the southern part of Texas, in the Rio Grande Valley. It is bordered by Starr County to the east, Brooks County to the south, and Zapata County to the west. The county seat is Hebbronville, and the county is named after James Stephen Hogg, the first native-born governor of Texas.
Geography
Jim Hogg County covers an area of 1,056 square miles, of which 1,053 square miles is land and 3 square miles is water. The terrain is mostly flat, with some rolling hills in the northern part of the county. The county is drained by the San Miguel River, which flows through the center of the county. The climate is semi-arid, with hot summers and mild winters.
Demographics
As of the 2010 census, Jim Hogg County had a population of 5,300. The racial makeup of the county was 81.3% White, 0.3% African American, 0.3% Native American, 0.2% Asian, 0.1% Pacific Islander, 16.2% from other races, and 1.8% from two or more races. Hispanic or Latino of any race were 97.2% of the population.
Economy
Agriculture is the main economic activity in Jim Hogg County. The county is home to a variety of crops, including cotton, corn, sorghum, wheat, and vegetables. Livestock production is also important, with cattle, hogs, and sheep being raised in the area.
The county is also home to several oil and gas fields, which provide jobs and revenue for the county. Tourism is also an important part of the economy, with visitors coming to the area to enjoy the natural beauty of the Rio Grande Valley.
History
Jim Hogg County was created in 1913 from parts of Starr and Zapata counties. The county was named after James Stephen Hogg, the first native-born governor of Texas.
The county was largely rural until the 1950s, when oil and gas production began to increase. This led to an influx of people and businesses, and the county's population began to grow.
In the 1970s, the county began to diversify its economy, with the development of tourism and agriculture. This has helped to create a more stable economy, and the county has continued to grow in recent years.
Today, Jim Hogg County is a vibrant and diverse community, with a strong economy and a rich cultural heritage. The county is home to a variety of attractions, including the historic Hebbronville Courthouse, the Jim Hogg County Museum, and the Jim Hogg County Historical Park. The county is also home to a number of festivals and events, including the Jim Hogg County Fair and the Jim Hogg County Rodeo.
Common Questions
What is Per Capita Income in Jim Hogg County?
Per Capita income in Jim Hogg County is $18,366.
What is the Median Family Income in Jim Hogg County?
Median Family Income in Jim Hogg County is $46,250.
What is the Median Household income in Jim Hogg County?
Median Household Income in Jim Hogg County is $42,292.
What is Income or Wage Gap in Jim Hogg County?
Income or Wage Gap in Jim Hogg County is 60.0%.
Women in Jim Hogg County earn 40.0 cents for every dollar earned by a man.
What is Family Income Deficit in Jim Hogg County?
Family Income Deficit in Jim Hogg County is $11,960.
Families that are below poverty line in Jim Hogg County earn $11,960 less on average than the poverty threshold level.
What is Inequality or Gini Index in Jim Hogg County?
Inequality or Gini Index in Jim Hogg County is 0.42.
What is the Total Population of Jim Hogg County?
Total Population of Jim Hogg County is 4,830.
What is the Total Male Population of Jim Hogg County?
Total Male Population of Jim Hogg County is 2,515.
What is the Total Female Population of Jim Hogg County?
Total Female Population of Jim Hogg County is 2,315.
What is the Ratio of Males per 100 Females in Jim Hogg County?
There are 108.64 Males per 100 Females in Jim Hogg County.
What is the Ratio of Females per 100 Males in Jim Hogg County?
There are 92.05 Females per 100 Males in Jim Hogg County.
What is the Median Population Age in Jim Hogg County?
Median Population Age in Jim Hogg County is 25.2 Years.
What is the Average Family Size in Jim Hogg County
Average Family Size in Jim Hogg County is 4.3 People.
What is the Average Household Size in Jim Hogg County
Average Household Size in Jim Hogg County is 3.6 People.
How Large is the Labor Force in Jim Hogg County?
There are 2,187 People in the Labor Forcein in Jim Hogg County.
What is the Percentage of People in the Labor Force in Jim Hogg County?
63.7% of People are in the Labor Force in Jim Hogg County.
What is the Unemployment Rate in Jim Hogg County?
Unemployment Rate in Jim Hogg County is 4.5%.