Jack County, TX Map & Demographics
Jack County Map
Jack County Overview
$28,626
PER CAPITA INCOME
$72,096
AVG FAMILY INCOME
$58,861
AVG HOUSEHOLD INCOME
30.7%
WAGE / INCOME GAP [ % ]
69.3¢/ $1
WAGE / INCOME GAP [ $ ]
0.48
INEQUALITY / GINI INDEX
8,588
TOTAL POPULATION
4,774
MALE POPULATION
3,814
FEMALE POPULATION
125.17
MALES / 100 FEMALES
79.89
FEMALES / 100 MALES
39.2
MEDIAN AGE
3.1
AVG FAMILY SIZE
2.5
AVG HOUSEHOLD SIZE
3,366
LABOR FORCE [ PEOPLE ]
48.7%
PERCENT IN LABOR FORCE
8.2%
UNEMPLOYMENT RATE
Jack County Area Codes
Income in Jack County
Income Overview in Jack County
Per Capita Income in Jack County is $28,626, while median incomes of families and households are $72,096 and $58,861 respectively.
| Characteristic | Number | Measure |
| Per Capita Income | 8,588 | $28,626 |
| Median Family Income | 2,081 | $72,096 |
| Mean Family Income | 2,081 | $95,015 |
| Median Household Income | 2,997 | $58,861 |
| Mean Household Income | 2,997 | $78,534 |
| Income Deficit | 2,081 | $0 |
| Wage / Income Gap (%) | 8,588 | 30.70% |
| Wage / Income Gap ($) | 8,588 | 69.30¢ per $1 |
| Gini / Inequality Index | 8,588 | 0.48 |
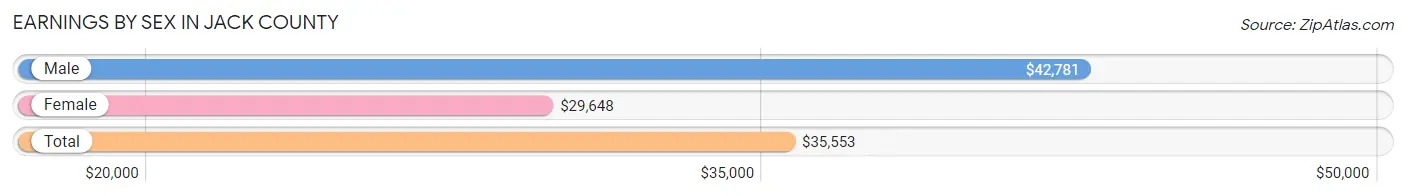
Earnings by Sex in Jack County
Average Earnings in Jack County are $35,553, $42,781 for men and $29,648 for women, a difference of 30.7%.
| Sex | Number | Average Earnings |
| Male | 2,193 (60.2%) | $42,781 |
| Female | 1,453 (39.9%) | $29,648 |
| Total | 3,646 (100.0%) | $35,553 |
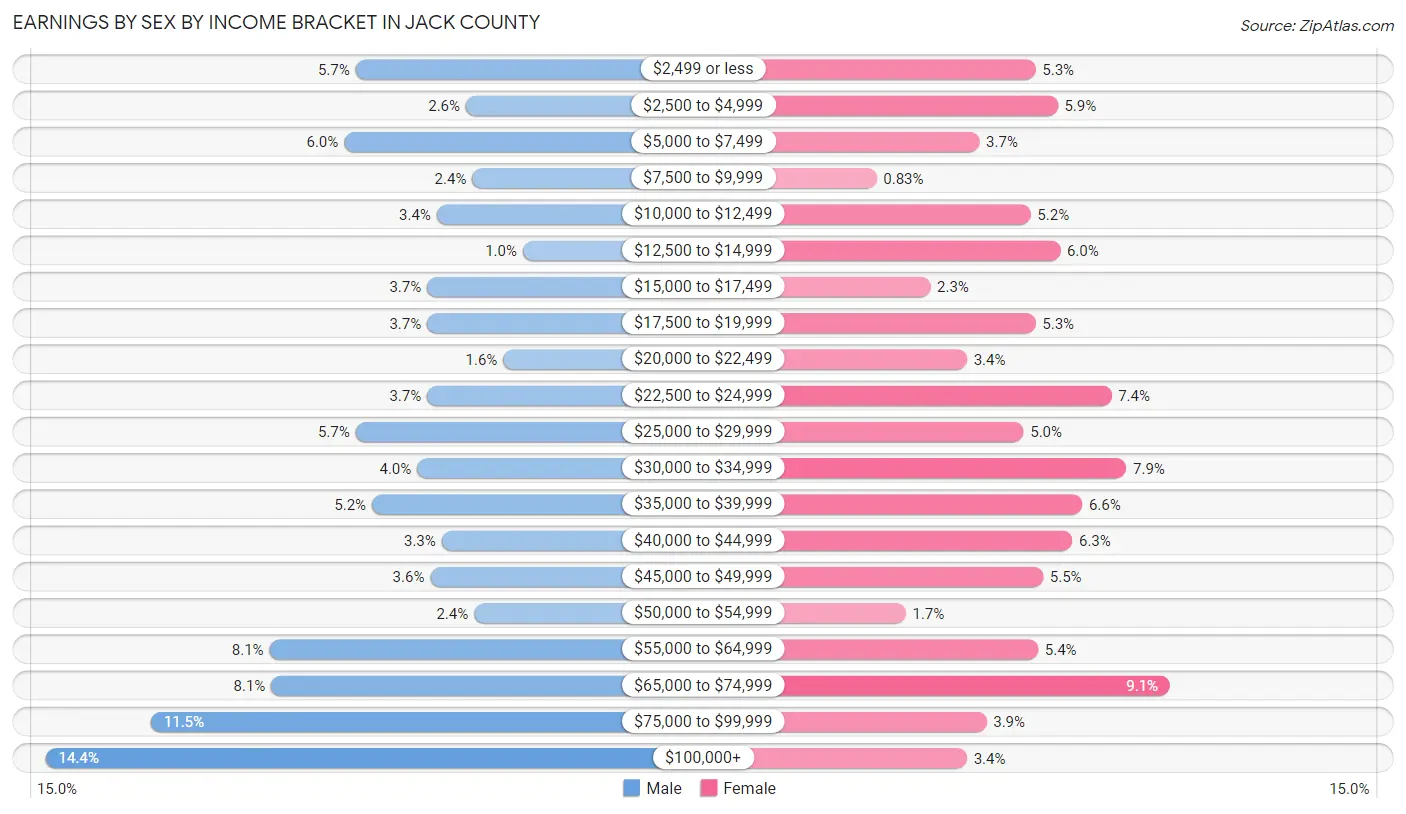
Earnings by Sex by Income Bracket in Jack County
The most common earnings brackets in Jack County are $100,000+ for men (316 | 14.4%) and $65,000 to $74,999 for women (132 | 9.1%).
| Income | Male | Female |
| $2,499 or less | 125 (5.7%) | 77 (5.3%) |
| $2,500 to $4,999 | 57 (2.6%) | 86 (5.9%) |
| $5,000 to $7,499 | 132 (6.0%) | 54 (3.7%) |
| $7,500 to $9,999 | 53 (2.4%) | 12 (0.8%) |
| $10,000 to $12,499 | 75 (3.4%) | 75 (5.2%) |
| $12,500 to $14,999 | 22 (1.0%) | 87 (6.0%) |
| $15,000 to $17,499 | 81 (3.7%) | 34 (2.3%) |
| $17,500 to $19,999 | 81 (3.7%) | 77 (5.3%) |
| $20,000 to $22,499 | 34 (1.5%) | 49 (3.4%) |
| $22,500 to $24,999 | 81 (3.7%) | 108 (7.4%) |
| $25,000 to $29,999 | 125 (5.7%) | 72 (5.0%) |
| $30,000 to $34,999 | 87 (4.0%) | 114 (7.9%) |
| $35,000 to $39,999 | 115 (5.2%) | 96 (6.6%) |
| $40,000 to $44,999 | 72 (3.3%) | 92 (6.3%) |
| $45,000 to $49,999 | 79 (3.6%) | 80 (5.5%) |
| $50,000 to $54,999 | 52 (2.4%) | 24 (1.7%) |
| $55,000 to $64,999 | 178 (8.1%) | 78 (5.4%) |
| $65,000 to $74,999 | 177 (8.1%) | 132 (9.1%) |
| $75,000 to $99,999 | 251 (11.5%) | 57 (3.9%) |
| $100,000+ | 316 (14.4%) | 49 (3.4%) |
| Total | 2,193 (100.0%) | 1,453 (100.0%) |
Earnings by Sex by Educational Attainment in Jack County
Average earnings in Jack County are $53,750 for men and $32,279 for women, a difference of 40.0%. Men with an educational attainment of bachelor's degree enjoy the highest average annual earnings of $92,594, while those with less than high school education earn the least with $24,712. Women with an educational attainment of bachelor's degree earn the most with the average annual earnings of $67,880, while those with high school diploma education have the smallest earnings of $21,372.

| Educational Attainment | Male Income | Female Income |
| Less than High School | $24,712 | $22,734 |
| High School Diploma | $37,120 | $21,372 |
| College or Associate's Degree | $59,808 | $36,316 |
| Bachelor's Degree | $92,594 | $67,880 |
| Graduate Degree | $80,677 | $45,903 |
| Total | $53,750 | $32,279 |
Family Income in Jack County
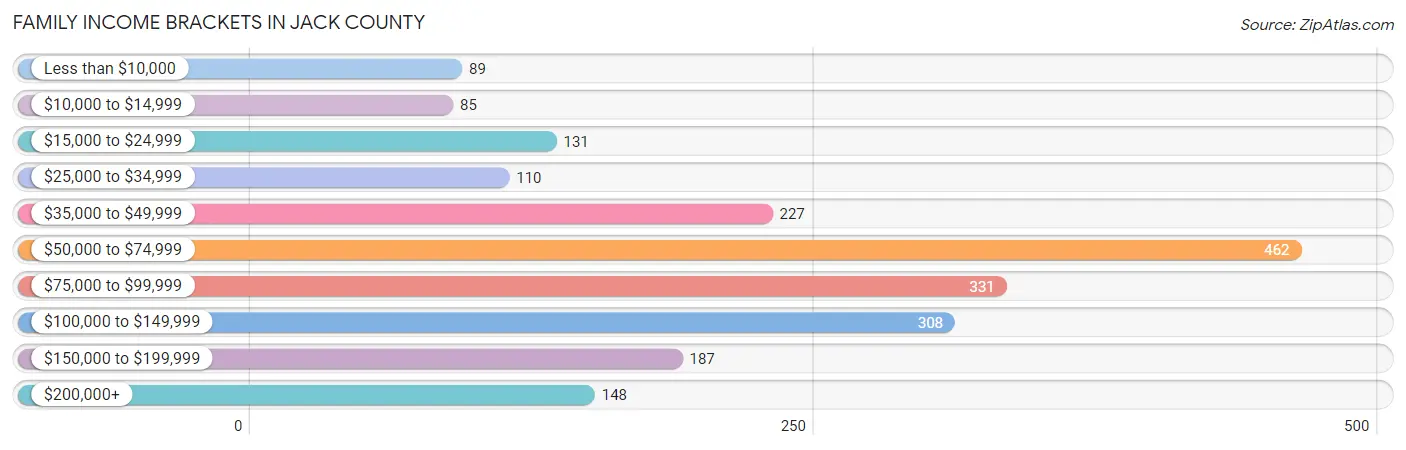
Family Income Brackets in Jack County
According to the Jack County family income data, there are 462 families falling into the $50,000 to $74,999 income range, which is the most common income bracket and makes up 22.2% of all families. Conversely, the $10,000 to $14,999 income bracket is the least frequent group with only 85 families (4.1%) belonging to this category.
| Income Bracket | # Families | % Families |
| Less than $10,000 | 89 | 4.3% |
| $10,000 to $14,999 | 85 | 4.1% |
| $15,000 to $24,999 | 131 | 6.3% |
| $25,000 to $34,999 | 110 | 5.3% |
| $35,000 to $49,999 | 227 | 10.9% |
| $50,000 to $74,999 | 462 | 22.2% |
| $75,000 to $99,999 | 331 | 15.9% |
| $100,000 to $149,999 | 308 | 14.8% |
| $150,000 to $199,999 | 187 | 9.0% |
| $200,000+ | 148 | 7.1% |
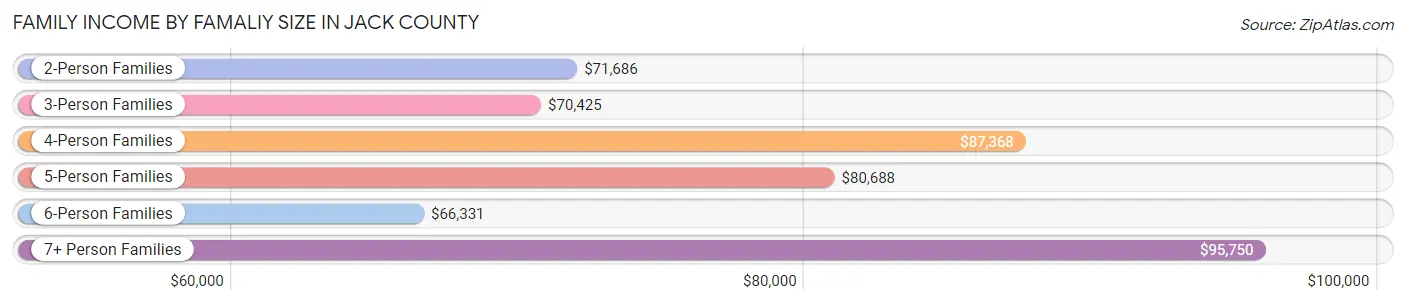
Family Income by Famaliy Size in Jack County
7+ person families (40 | 1.9%) account for the highest median family income in Jack County with $95,750 per family, while 2-person families (986 | 47.4%) have the highest median income of $35,843 per family member.
| Income Bracket | # Families | Median Income |
| 2-Person Families | 986 (47.4%) | $71,686 |
| 3-Person Families | 480 (23.1%) | $70,425 |
| 4-Person Families | 368 (17.7%) | $87,368 |
| 5-Person Families | 138 (6.6%) | $80,688 |
| 6-Person Families | 69 (3.3%) | $66,331 |
| 7+ Person Families | 40 (1.9%) | $95,750 |
| Total | 2,081 (100.0%) | $72,096 |
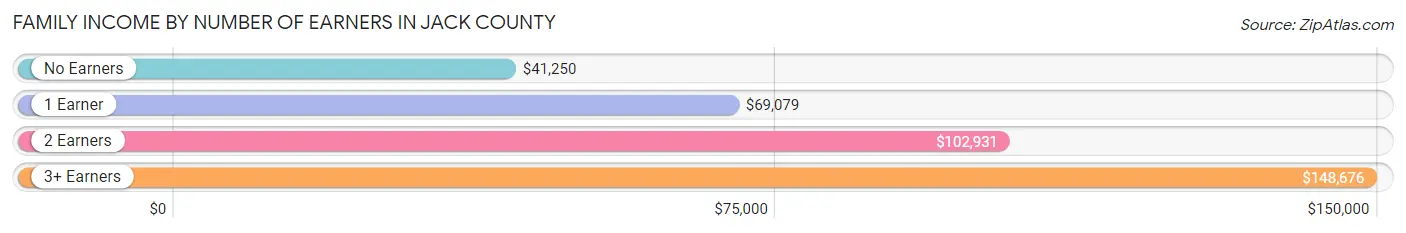
Family Income by Number of Earners in Jack County
The median family income in Jack County is $72,096, with families comprising 3+ earners (114) having the highest median family income of $148,676, while families with no earners (405) have the lowest median family income of $41,250, accounting for 5.5% and 19.5% of families, respectively.
| Number of Earners | # Families | Median Income |
| No Earners | 405 (19.5%) | $41,250 |
| 1 Earner | 832 (40.0%) | $69,079 |
| 2 Earners | 730 (35.1%) | $102,931 |
| 3+ Earners | 114 (5.5%) | $148,676 |
| Total | 2,081 (100.0%) | $72,096 |
Household Income in Jack County
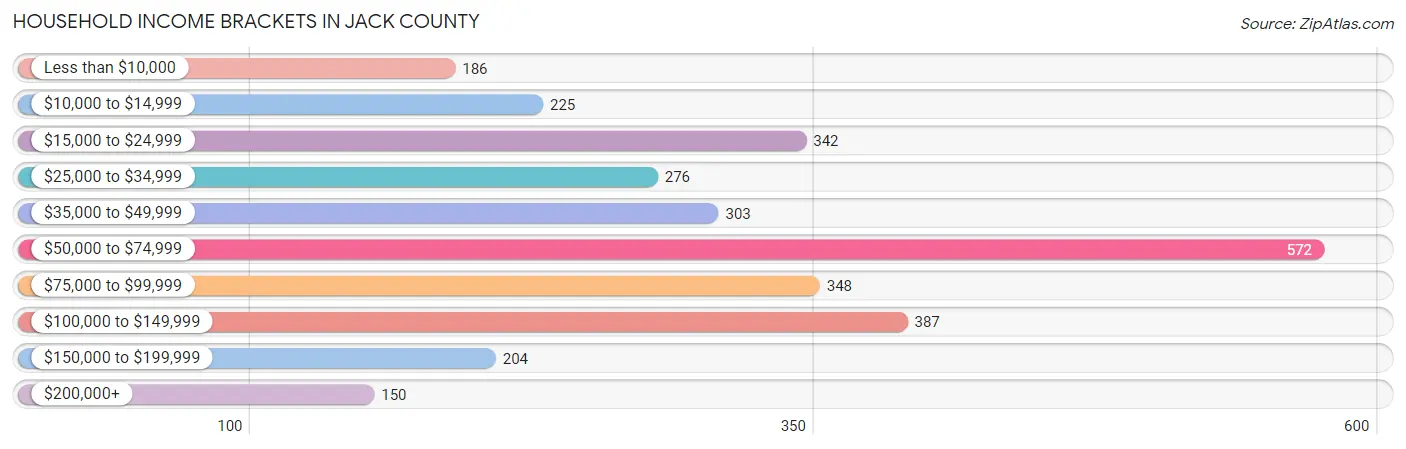
Household Income Brackets in Jack County
With 572 households falling in the category, the $50,000 to $74,999 income range is the most frequent in Jack County, accounting for 19.1% of all households. In contrast, only 150 households (5.0%) fall into the $200,000+ income bracket, making it the least populous group.
| Income Bracket | # Households | % Households |
| Less than $10,000 | 186 | 6.2% |
| $10,000 to $14,999 | 225 | 7.5% |
| $15,000 to $24,999 | 342 | 11.4% |
| $25,000 to $34,999 | 276 | 9.2% |
| $35,000 to $49,999 | 303 | 10.1% |
| $50,000 to $74,999 | 572 | 19.1% |
| $75,000 to $99,999 | 348 | 11.6% |
| $100,000 to $149,999 | 387 | 12.9% |
| $150,000 to $199,999 | 204 | 6.8% |
| $200,000+ | 150 | 5.0% |
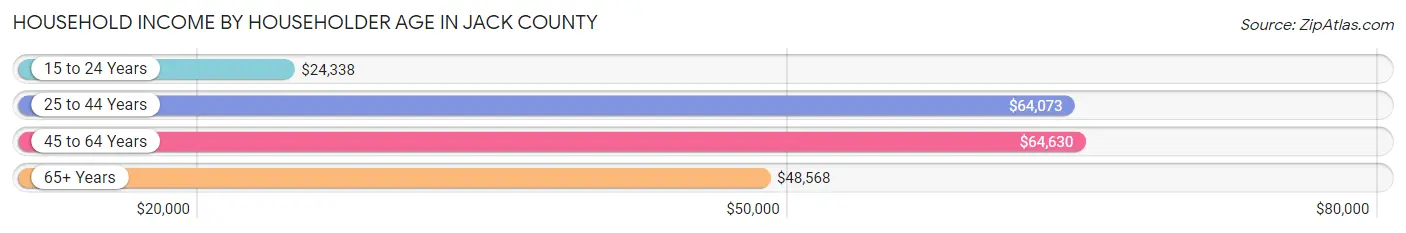
Household Income by Householder Age in Jack County
The median household income in Jack County is $58,861, with the highest median household income of $64,630 found in the 45 to 64 years age bracket for the primary householder. A total of 1,196 households (39.9%) fall into this category. Meanwhile, the 15 to 24 years age bracket for the primary householder has the lowest median household income of $24,338, with 87 households (2.9%) in this group.
| Income Bracket | # Households | Median Income |
| 15 to 24 Years | 87 (2.9%) | $24,338 |
| 25 to 44 Years | 899 (30.0%) | $64,073 |
| 45 to 64 Years | 1,196 (39.9%) | $64,630 |
| 65+ Years | 815 (27.2%) | $48,568 |
| Total | 2,997 (100.0%) | $58,861 |
Poverty in Jack County
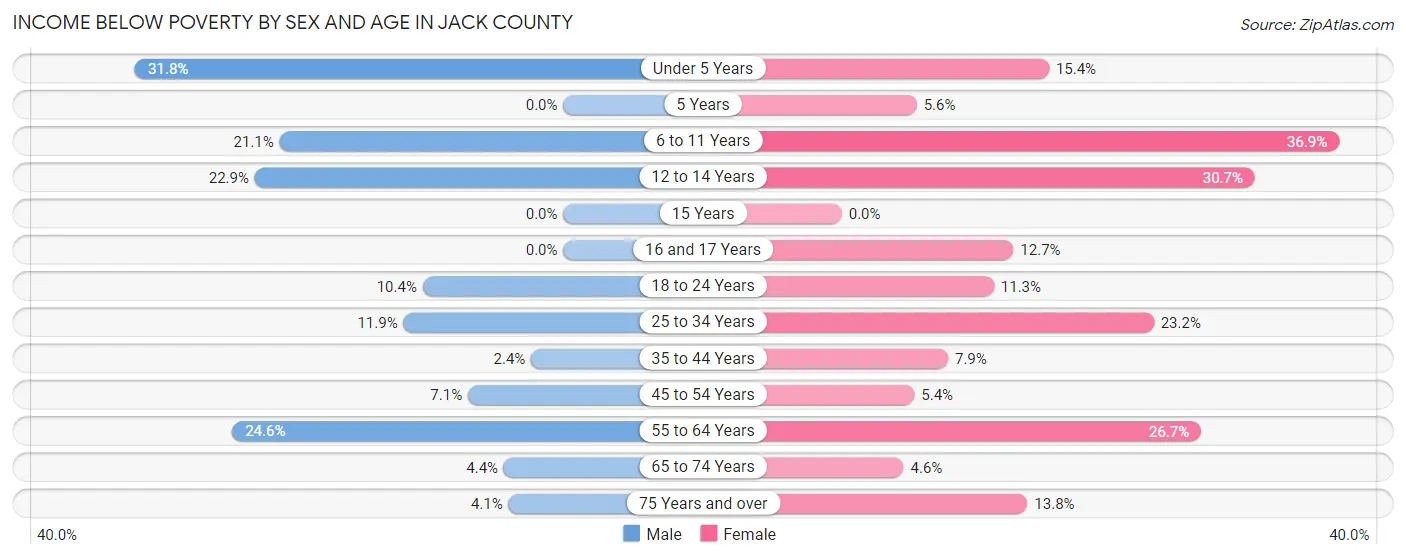
Income Below Poverty by Sex and Age in Jack County
With 12.8% poverty level for males and 16.2% for females among the residents of Jack County, under 5 year old males and 6 to 11 year old females are the most vulnerable to poverty, with 89 males (31.8%) and 96 females (36.9%) in their respective age groups living below the poverty level.
| Age Bracket | Male | Female |
| Under 5 Years | 89 (31.8%) | 24 (15.4%) |
| 5 Years | 0 (0.0%) | 3 (5.6%) |
| 6 to 11 Years | 55 (21.1%) | 96 (36.9%) |
| 12 to 14 Years | 52 (22.9%) | 84 (30.7%) |
| 15 Years | 0 (0.0%) | 0 (0.0%) |
| 16 and 17 Years | 0 (0.0%) | 20 (12.7%) |
| 18 to 24 Years | 45 (10.4%) | 28 (11.3%) |
| 25 to 34 Years | 45 (11.9%) | 110 (23.2%) |
| 35 to 44 Years | 10 (2.4%) | 33 (7.9%) |
| 45 to 54 Years | 30 (7.1%) | 26 (5.4%) |
| 55 to 64 Years | 131 (24.6%) | 124 (26.7%) |
| 65 to 74 Years | 16 (4.4%) | 20 (4.6%) |
| 75 Years and over | 12 (4.1%) | 43 (13.8%) |
| Total | 485 (12.8%) | 611 (16.2%) |
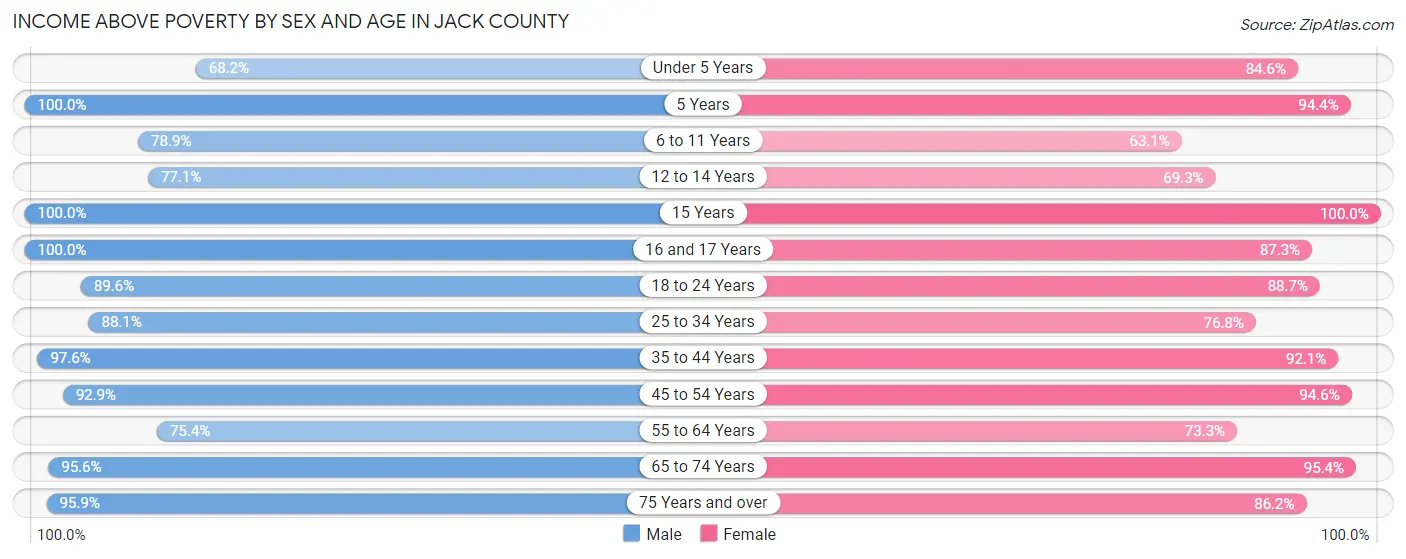
Income Above Poverty by Sex and Age in Jack County
According to the poverty statistics in Jack County, males aged 5 years and females aged 15 years are the age groups that are most secure financially, with 100.0% of males and 100.0% of females in these age groups living above the poverty line.
| Age Bracket | Male | Female |
| Under 5 Years | 191 (68.2%) | 132 (84.6%) |
| 5 Years | 63 (100.0%) | 51 (94.4%) |
| 6 to 11 Years | 206 (78.9%) | 164 (63.1%) |
| 12 to 14 Years | 175 (77.1%) | 190 (69.3%) |
| 15 Years | 74 (100.0%) | 28 (100.0%) |
| 16 and 17 Years | 45 (100.0%) | 137 (87.3%) |
| 18 to 24 Years | 386 (89.6%) | 220 (88.7%) |
| 25 to 34 Years | 334 (88.1%) | 365 (76.8%) |
| 35 to 44 Years | 409 (97.6%) | 385 (92.1%) |
| 45 to 54 Years | 394 (92.9%) | 456 (94.6%) |
| 55 to 64 Years | 402 (75.4%) | 341 (73.3%) |
| 65 to 74 Years | 347 (95.6%) | 416 (95.4%) |
| 75 Years and over | 283 (95.9%) | 269 (86.2%) |
| Total | 3,309 (87.2%) | 3,154 (83.8%) |
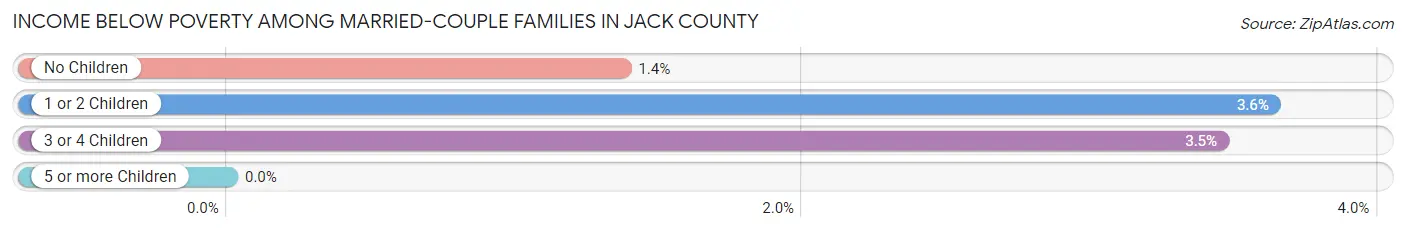
Income Below Poverty Among Married-Couple Families in Jack County
The poverty statistics for married-couple families in Jack County show that 2.2% or 35 of the total 1,584 families live below the poverty line. Families with 1 or 2 children have the highest poverty rate of 3.6%, comprising of 19 families. On the other hand, families with 5 or more children have the lowest poverty rate of 0.0%, which includes 0 families.
| Children | Above Poverty | Below Poverty |
| No Children | 934 (98.6%) | 13 (1.4%) |
| 1 or 2 Children | 504 (96.4%) | 19 (3.6%) |
| 3 or 4 Children | 84 (96.6%) | 3 (3.5%) |
| 5 or more Children | 27 (100.0%) | 0 (0.0%) |
| Total | 1,549 (97.8%) | 35 (2.2%) |
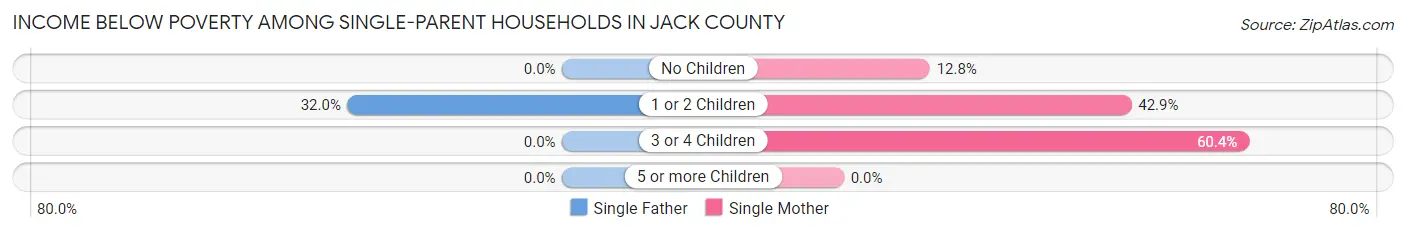
Income Below Poverty Among Single-Parent Households in Jack County
According to the poverty data in Jack County, 29.6% or 32 single-father households and 36.0% or 140 single-mother households are living below the poverty line. Among single-father households, those with 1 or 2 children have the highest poverty rate, with 32 households (32.0%) experiencing poverty. Likewise, among single-mother households, those with 3 or 4 children have the highest poverty rate, with 29 households (60.4%) falling below the poverty line.
| Children | Single Father | Single Mother |
| No Children | 0 (0.0%) | 15 (12.8%) |
| 1 or 2 Children | 32 (32.0%) | 96 (42.9%) |
| 3 or 4 Children | 0 (0.0%) | 29 (60.4%) |
| 5 or more Children | 0 (0.0%) | 0 (0.0%) |
| Total | 32 (29.6%) | 140 (36.0%) |
Income Below Poverty Among Married-Couple vs Single-Parent Households in Jack County
The poverty data for Jack County shows that 35 of the married-couple family households (2.2%) and 172 of the single-parent households (34.6%) are living below the poverty level. Within the married-couple family households, those with 1 or 2 children have the highest poverty rate, with 19 households (3.6%) falling below the poverty line. Among the single-parent households, those with 3 or 4 children have the highest poverty rate, with 29 household (60.4%) living below poverty.
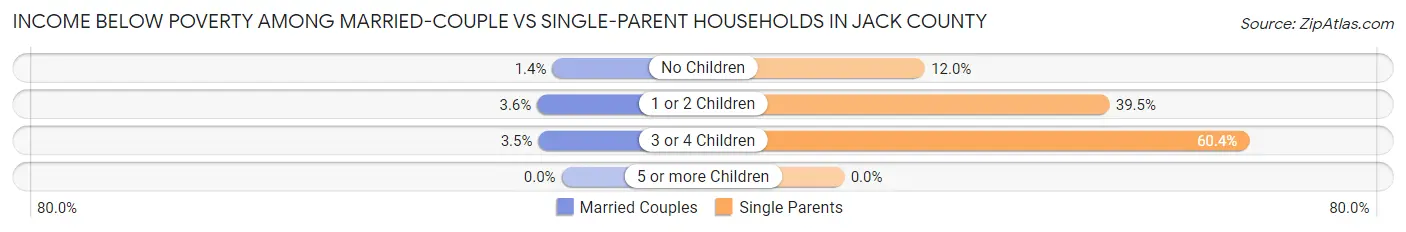
| Children | Married-Couple Families | Single-Parent Households |
| No Children | 13 (1.4%) | 15 (12.0%) |
| 1 or 2 Children | 19 (3.6%) | 128 (39.5%) |
| 3 or 4 Children | 3 (3.5%) | 29 (60.4%) |
| 5 or more Children | 0 (0.0%) | 0 (0.0%) |
| Total | 35 (2.2%) | 172 (34.6%) |
Race in Jack County
The most populous races in Jack County are White / Caucasian (7,666 | 89.3%), Hispanic or Latino (1,537 | 17.9%), and Two or more Races (376 | 4.4%).
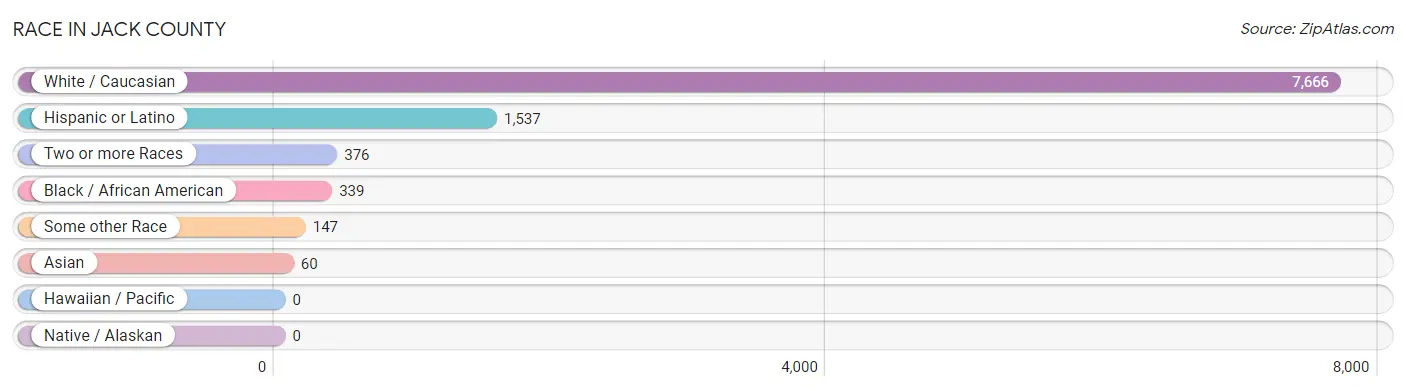
| Race | # Population | % Population |
| Asian | 60 | 0.7% |
| Black / African American | 339 | 4.0% |
| Hawaiian / Pacific | 0 | 0.0% |
| Hispanic or Latino | 1,537 | 17.9% |
| Native / Alaskan | 0 | 0.0% |
| White / Caucasian | 7,666 | 89.3% |
| Two or more Races | 376 | 4.4% |
| Some other Race | 147 | 1.7% |
| Total | 8,588 | 100.0% |
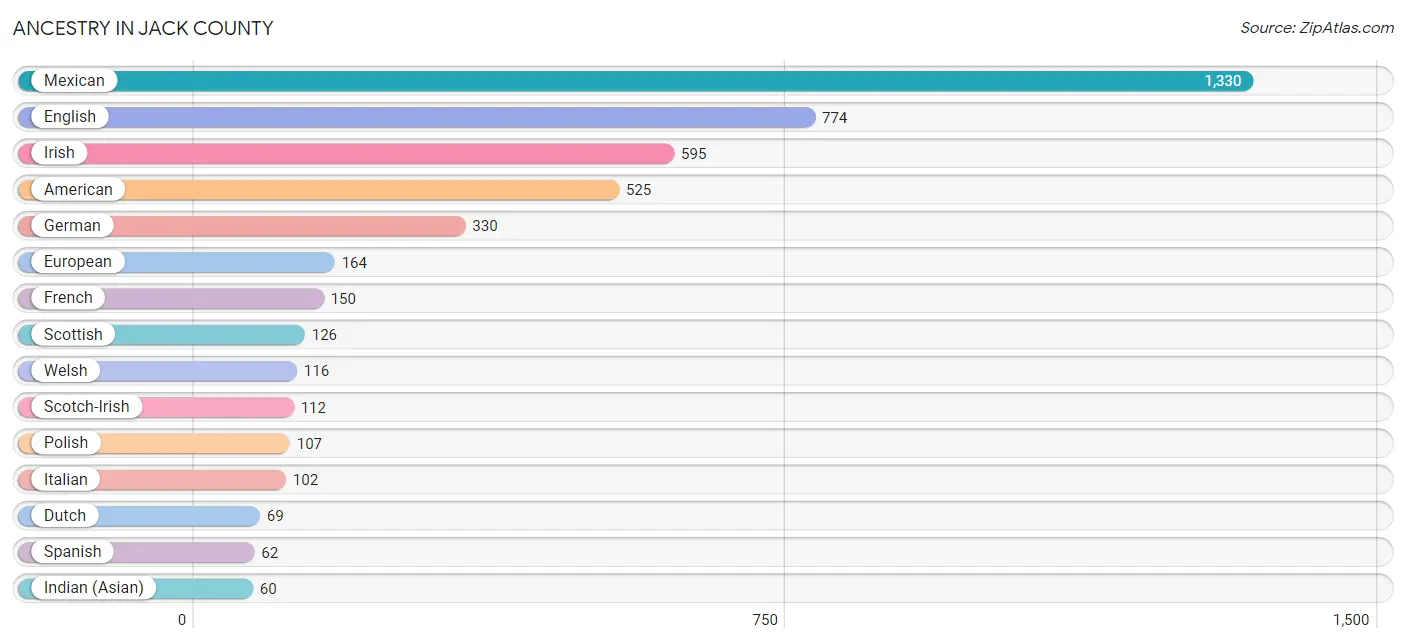
Ancestry in Jack County
The most populous ancestries reported in Jack County are Mexican (1,330 | 15.5%), English (774 | 9.0%), Irish (595 | 6.9%), American (525 | 6.1%), and German (330 | 3.8%), together accounting for 41.4% of all Jack County residents.
| Ancestry | # Population | % Population |
| American | 525 | 6.1% |
| Apache | 30 | 0.4% |
| British | 16 | 0.2% |
| Central American | 7 | 0.1% |
| Cherokee | 11 | 0.1% |
| Choctaw | 54 | 0.6% |
| Comanche | 1 | 0.0% |
| Cuban | 34 | 0.4% |
| Czech | 53 | 0.6% |
| Dominican | 31 | 0.4% |
| Dutch | 69 | 0.8% |
| English | 774 | 9.0% |
| European | 164 | 1.9% |
| French | 150 | 1.8% |
| French American Indian | 22 | 0.3% |
| French Canadian | 3 | 0.0% |
| German | 330 | 3.8% |
| Greek | 6 | 0.1% |
| Honduran | 7 | 0.1% |
| Indian (Asian) | 60 | 0.7% |
| Irish | 595 | 6.9% |
| Israeli | 5 | 0.1% |
| Italian | 102 | 1.2% |
| Mexican | 1,330 | 15.5% |
| Northern European | 6 | 0.1% |
| Norwegian | 4 | 0.1% |
| Polish | 107 | 1.3% |
| Puerto Rican | 35 | 0.4% |
| Romanian | 5 | 0.1% |
| Scandinavian | 14 | 0.2% |
| Scotch-Irish | 112 | 1.3% |
| Scottish | 126 | 1.5% |
| Spaniard | 25 | 0.3% |
| Spanish | 62 | 0.7% |
| Swedish | 14 | 0.2% |
| Ukrainian | 6 | 0.1% |
| Welsh | 116 | 1.3% | View All 37 Rows |
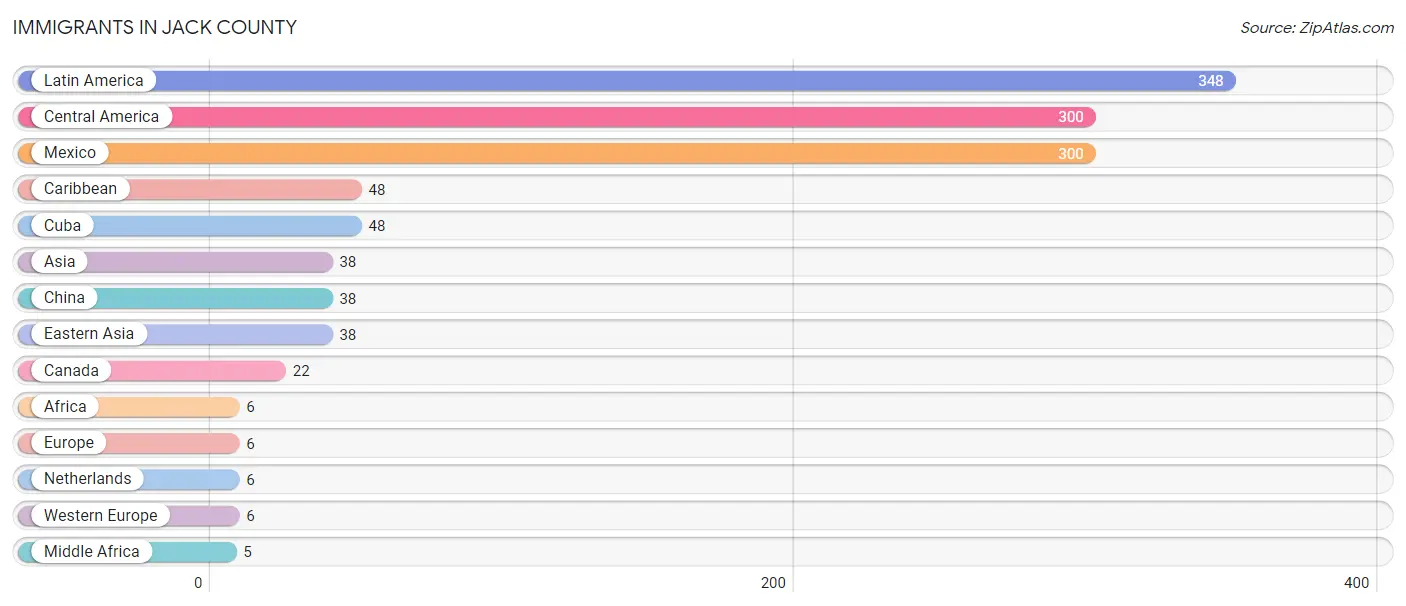
Immigrants in Jack County
The most numerous immigrant groups reported in Jack County came from Latin America (348 | 4.1%), Central America (300 | 3.5%), Mexico (300 | 3.5%), Caribbean (48 | 0.6%), and Cuba (48 | 0.6%), together accounting for 12.1% of all Jack County residents.
| Immigration Origin | # Population | % Population |
| Africa | 6 | 0.1% |
| Asia | 38 | 0.4% |
| Canada | 22 | 0.3% |
| Caribbean | 48 | 0.6% |
| Central America | 300 | 3.5% |
| China | 38 | 0.4% |
| Cuba | 48 | 0.6% |
| Eastern Asia | 38 | 0.4% |
| Europe | 6 | 0.1% |
| Latin America | 348 | 4.1% |
| Mexico | 300 | 3.5% |
| Middle Africa | 5 | 0.1% |
| Netherlands | 6 | 0.1% |
| Western Europe | 6 | 0.1% | View All 14 Rows |
Sex and Age in Jack County
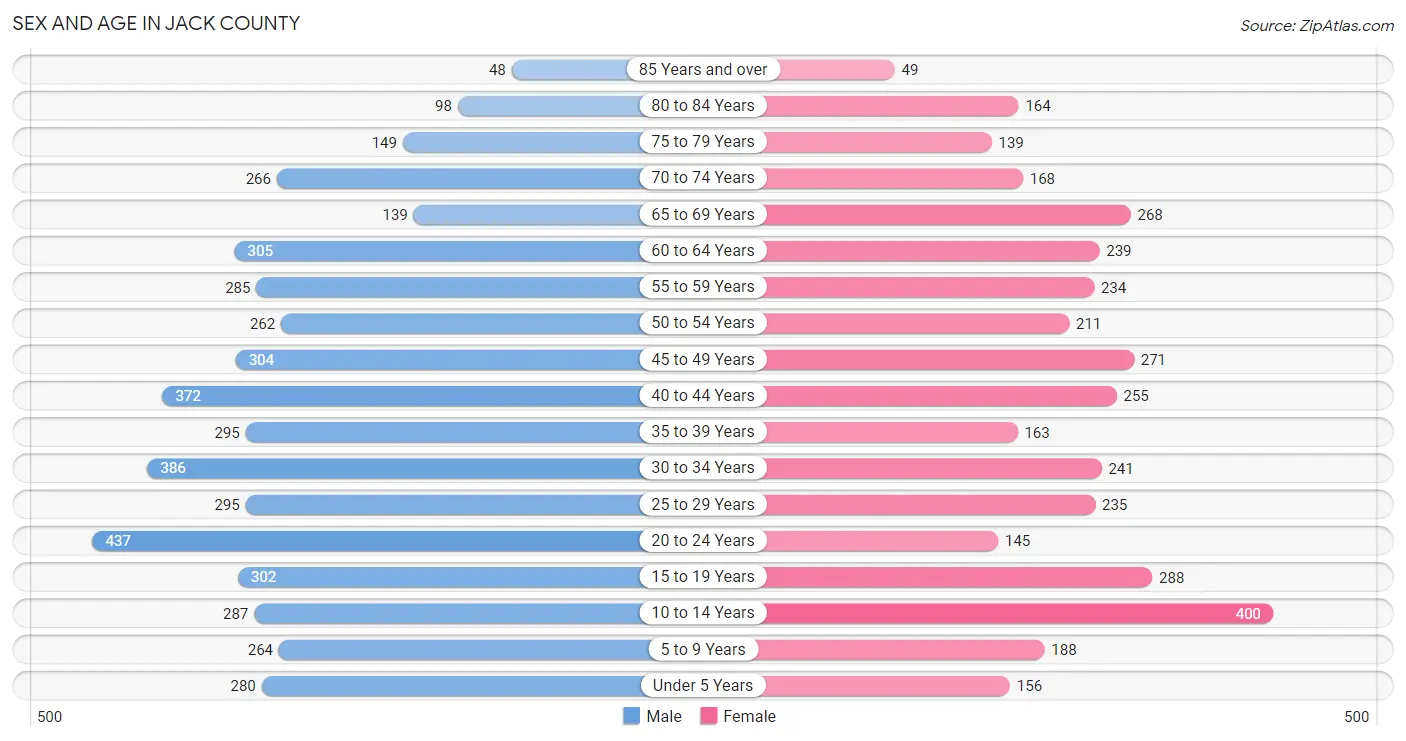
Sex and Age in Jack County
The most populous age groups in Jack County are 20 to 24 Years (437 | 9.1%) for men and 10 to 14 Years (400 | 10.5%) for women.
| Age Bracket | Male | Female |
| Under 5 Years | 280 (5.9%) | 156 (4.1%) |
| 5 to 9 Years | 264 (5.5%) | 188 (4.9%) |
| 10 to 14 Years | 287 (6.0%) | 400 (10.5%) |
| 15 to 19 Years | 302 (6.3%) | 288 (7.5%) |
| 20 to 24 Years | 437 (9.1%) | 145 (3.8%) |
| 25 to 29 Years | 295 (6.2%) | 235 (6.2%) |
| 30 to 34 Years | 386 (8.1%) | 241 (6.3%) |
| 35 to 39 Years | 295 (6.2%) | 163 (4.3%) |
| 40 to 44 Years | 372 (7.8%) | 255 (6.7%) |
| 45 to 49 Years | 304 (6.4%) | 271 (7.1%) |
| 50 to 54 Years | 262 (5.5%) | 211 (5.5%) |
| 55 to 59 Years | 285 (6.0%) | 234 (6.1%) |
| 60 to 64 Years | 305 (6.4%) | 239 (6.3%) |
| 65 to 69 Years | 139 (2.9%) | 268 (7.0%) |
| 70 to 74 Years | 266 (5.6%) | 168 (4.4%) |
| 75 to 79 Years | 149 (3.1%) | 139 (3.6%) |
| 80 to 84 Years | 98 (2.1%) | 164 (4.3%) |
| 85 Years and over | 48 (1.0%) | 49 (1.3%) |
| Total | 4,774 (100.0%) | 3,814 (100.0%) |
Families and Households in Jack County
Median Family Size in Jack County
The median family size in Jack County is 3.10 persons per family, with married-couple families (1,584 | 76.1%) accounting for the largest median family size of 3.18 persons per family. On the other hand, single male/father families (108 | 5.2%) represent the smallest median family size with 2.34 persons per family.
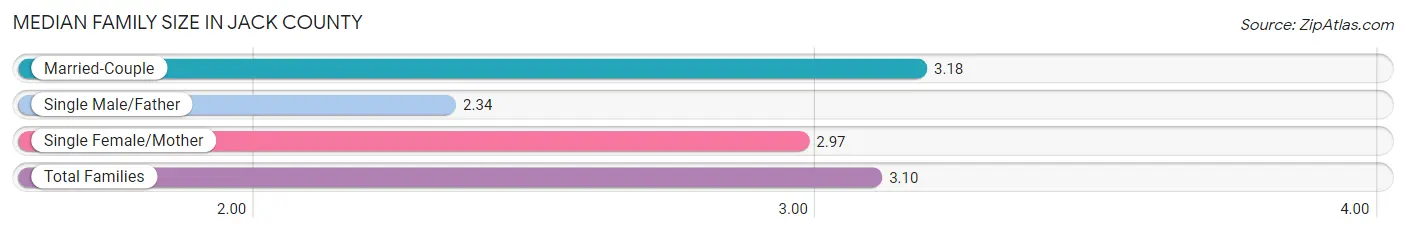
| Family Type | # Families | Family Size |
| Married-Couple | 1,584 (76.1%) | 3.18 |
| Single Male/Father | 108 (5.2%) | 2.34 |
| Single Female/Mother | 389 (18.7%) | 2.97 |
| Total Families | 2,081 (100.0%) | 3.10 |
Median Household Size in Jack County
The median household size in Jack County is 2.52 persons per household, with married-couple households (1,584 | 52.8%) accounting for the largest median household size of 3.19 persons per household. non-family households (916 | 30.6%) represent the smallest median household size with 1.11 persons per household.
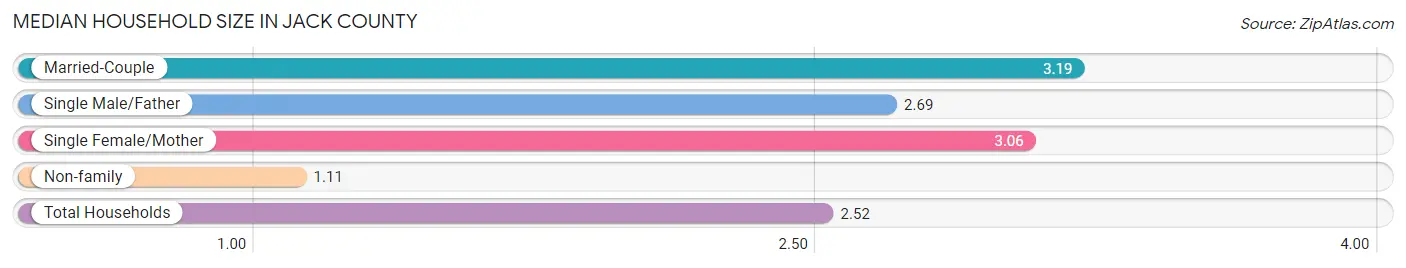
| Household Type | # Households | Household Size |
| Married-Couple | 1,584 (52.8%) | 3.19 |
| Single Male/Father | 108 (3.6%) | 2.69 |
| Single Female/Mother | 389 (13.0%) | 3.06 |
| Non-family | 916 (30.6%) | 1.11 |
| Total Households | 2,997 (100.0%) | 2.52 |
Household Size by Marriage Status in Jack County
Out of a total of 2,997 households in Jack County, 2,081 (69.4%) are family households, while 916 (30.6%) are nonfamily households. The most numerous type of family households are 2-person households, comprising 964, and the most common type of nonfamily households are 1-person households, comprising 824.
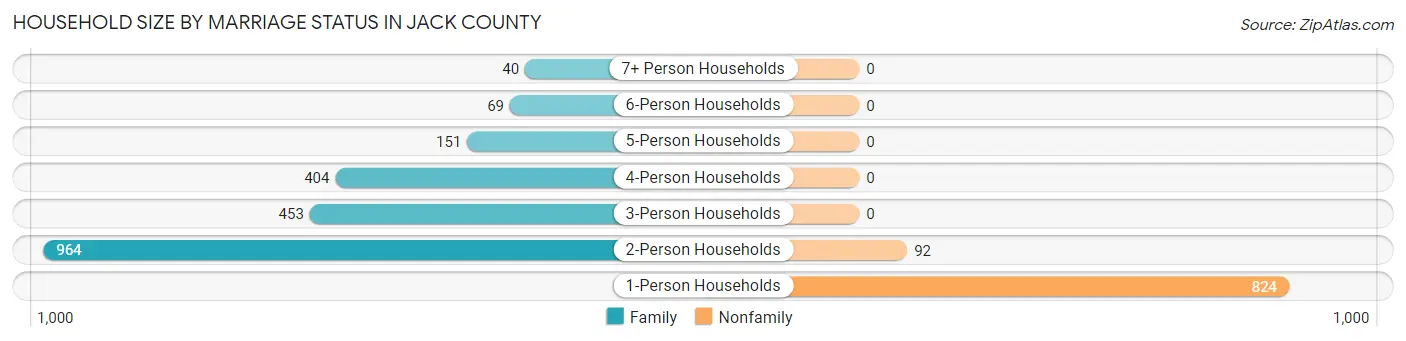
| Household Size | Family Households | Nonfamily Households |
| 1-Person Households | - | 824 (27.5%) |
| 2-Person Households | 964 (32.2%) | 92 (3.1%) |
| 3-Person Households | 453 (15.1%) | 0 (0.0%) |
| 4-Person Households | 404 (13.5%) | 0 (0.0%) |
| 5-Person Households | 151 (5.0%) | 0 (0.0%) |
| 6-Person Households | 69 (2.3%) | 0 (0.0%) |
| 7+ Person Households | 40 (1.3%) | 0 (0.0%) |
| Total | 2,081 (69.4%) | 916 (30.6%) |
Female Fertility in Jack County
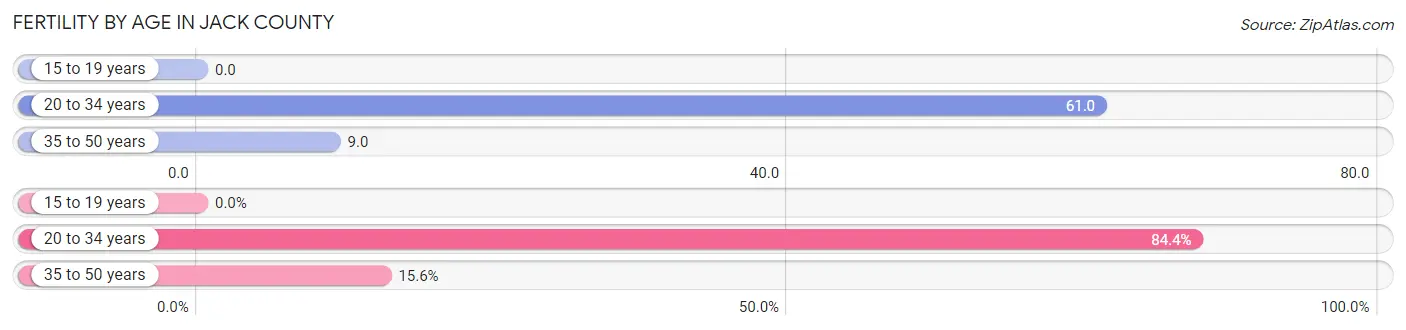
Fertility by Age in Jack County
Average fertility rate in Jack County is 27.0 births per 1,000 women. Women in the age bracket of 20 to 34 years have the highest fertility rate with 61.0 births per 1,000 women. Women in the age bracket of 20 to 34 years acount for 84.4% of all women with births.
| Age Bracket | Women with Births | Births / 1,000 Women |
| 15 to 19 years | 0 (0.0%) | 0.0 |
| 20 to 34 years | 38 (84.4%) | 61.0 |
| 35 to 50 years | 7 (15.6%) | 9.0 |
| Total | 45 (100.0%) | 27.0 |
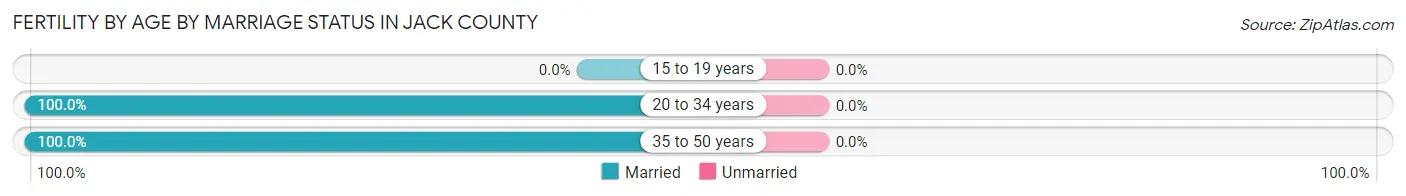
Fertility by Age by Marriage Status in Jack County
| Age Bracket | Married | Unmarried |
| 15 to 19 years | 0 (0.0%) | 0 (0.0%) |
| 20 to 34 years | 38 (100.0%) | 0 (0.0%) |
| 35 to 50 years | 7 (100.0%) | 0 (0.0%) |
| Total | 45 (100.0%) | 0 (0.0%) |
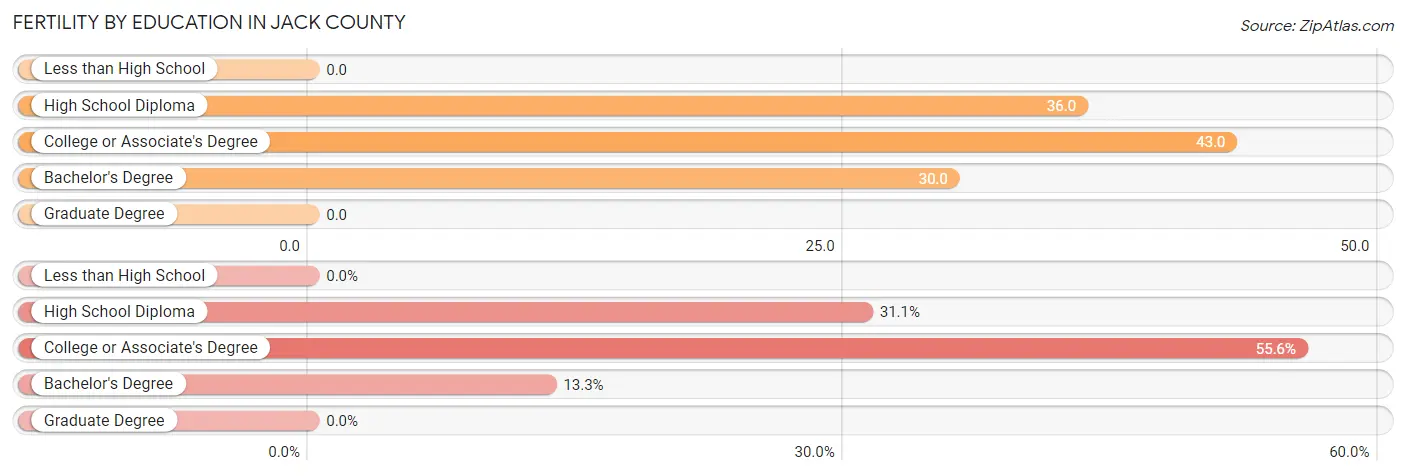
Fertility by Education in Jack County
| Educational Attainment | Women with Births | Births / 1,000 Women |
| Less than High School | 0 (0.0%) | 0.0 |
| High School Diploma | 14 (31.1%) | 36.0 |
| College or Associate's Degree | 25 (55.6%) | 43.0 |
| Bachelor's Degree | 6 (13.3%) | 30.0 |
| Graduate Degree | 0 (0.0%) | 0.0 |
| Total | 45 (100.0%) | 27.0 |
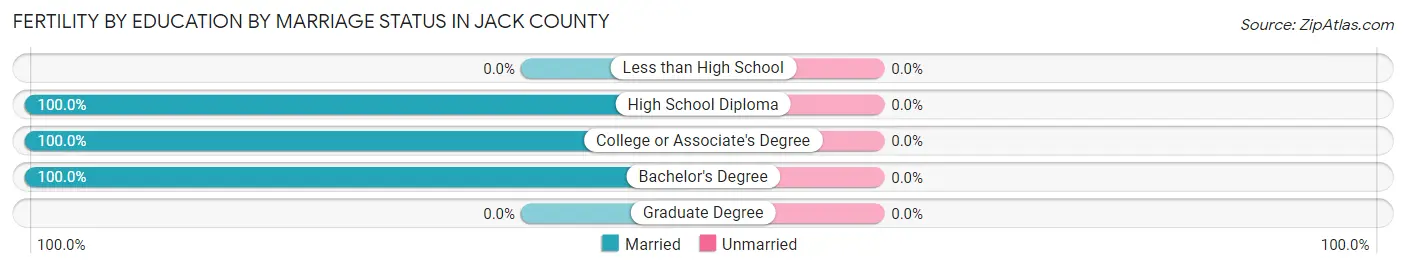
Fertility by Education by Marriage Status in Jack County
| Educational Attainment | Married | Unmarried |
| Less than High School | 0 (0.0%) | 0 (0.0%) |
| High School Diploma | 14 (100.0%) | 0 (0.0%) |
| College or Associate's Degree | 25 (100.0%) | 0 (0.0%) |
| Bachelor's Degree | 6 (100.0%) | 0 (0.0%) |
| Graduate Degree | 0 (0.0%) | 0 (0.0%) |
| Total | 45 (100.0%) | 0 (0.0%) |
Employment Characteristics in Jack County
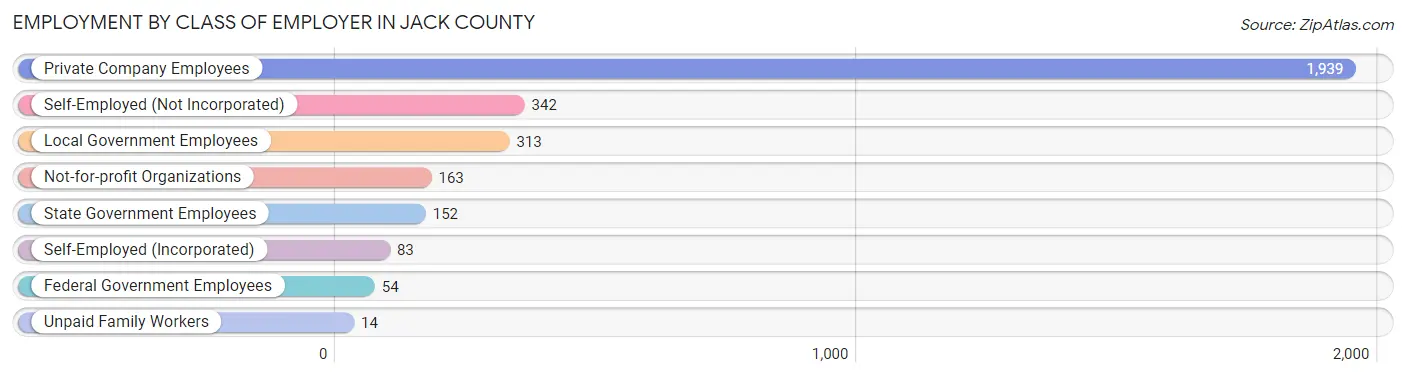
Employment by Class of Employer in Jack County
Among the 3,060 employed individuals in Jack County, private company employees (1,939 | 63.4%), self-employed (not incorporated) (342 | 11.2%), and local government employees (313 | 10.2%) make up the most common classes of employment.
| Employer Class | # Employees | % Employees |
| Private Company Employees | 1,939 | 63.4% |
| Self-Employed (Incorporated) | 83 | 2.7% |
| Self-Employed (Not Incorporated) | 342 | 11.2% |
| Not-for-profit Organizations | 163 | 5.3% |
| Local Government Employees | 313 | 10.2% |
| State Government Employees | 152 | 5.0% |
| Federal Government Employees | 54 | 1.8% |
| Unpaid Family Workers | 14 | 0.5% |
| Total | 3,060 | 100.0% |
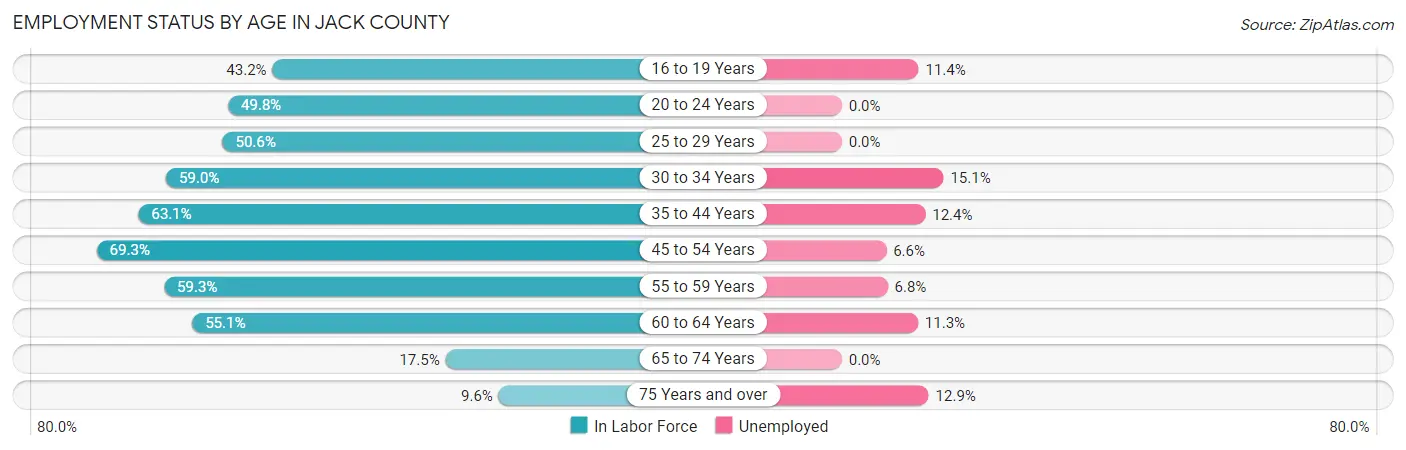
Employment Status by Age in Jack County
According to the labor force statistics for Jack County, out of the total population over 16 years of age (6,911), 48.7% or 3,366 individuals are in the labor force, with 8.2% or 276 of them unemployed. The age group with the highest labor force participation rate is 45 to 54 years, with 69.3% or 726 individuals in the labor force. Within the labor force, the 30 to 34 years age range has the highest percentage of unemployed individuals, with 15.1% or 56 of them being unemployed.
| Age Bracket | In Labor Force | Unemployed |
| 16 to 19 Years | 211 (43.2%) | 24 (11.4%) |
| 20 to 24 Years | 290 (49.8%) | 0 (0.0%) |
| 25 to 29 Years | 268 (50.6%) | 0 (0.0%) |
| 30 to 34 Years | 370 (59.0%) | 56 (15.1%) |
| 35 to 44 Years | 685 (63.1%) | 85 (12.4%) |
| 45 to 54 Years | 726 (69.3%) | 48 (6.6%) |
| 55 to 59 Years | 308 (59.3%) | 21 (6.8%) |
| 60 to 64 Years | 300 (55.1%) | 34 (11.3%) |
| 65 to 74 Years | 147 (17.5%) | 0 (0.0%) |
| 75 Years and over | 62 (9.6%) | 8 (12.9%) |
| Total | 3,366 (48.7%) | 276 (8.2%) |
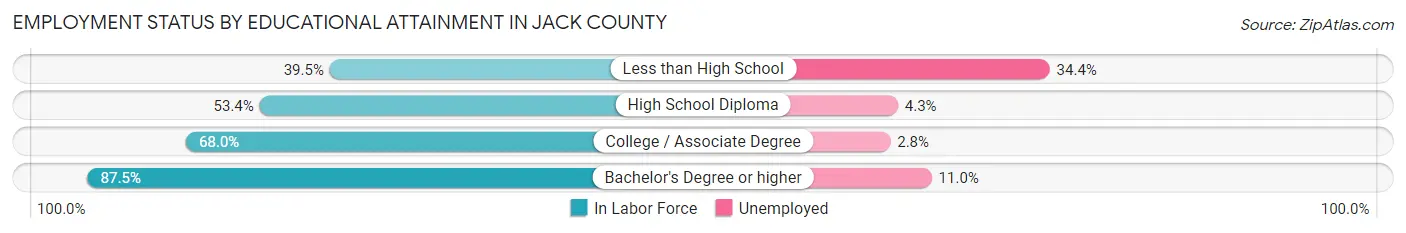
Employment Status by Educational Attainment in Jack County
According to labor force statistics for Jack County, 61.0% of individuals (2,655) out of the total population between 25 and 64 years of age (4,353) are in the labor force, with 9.2% or 244 of them being unemployed. The group with the highest labor force participation rate are those with the educational attainment of bachelor's degree or higher, with 87.5% or 629 individuals in the labor force. Within the labor force, individuals with less than high school education have the highest percentage of unemployment, with 34.4% or 117 of them being unemployed.
| Educational Attainment | In Labor Force | Unemployed |
| Less than High School | 340 (39.5%) | 296 (34.4%) |
| High School Diploma | 728 (53.4%) | 59 (4.3%) |
| College / Associate Degree | 959 (68.0%) | 39 (2.8%) |
| Bachelor's Degree or higher | 629 (87.5%) | 79 (11.0%) |
| Total | 2,655 (61.0%) | 400 (9.2%) |
Employment Occupations by Sex in Jack County
Management, Business, Science and Arts Occupations
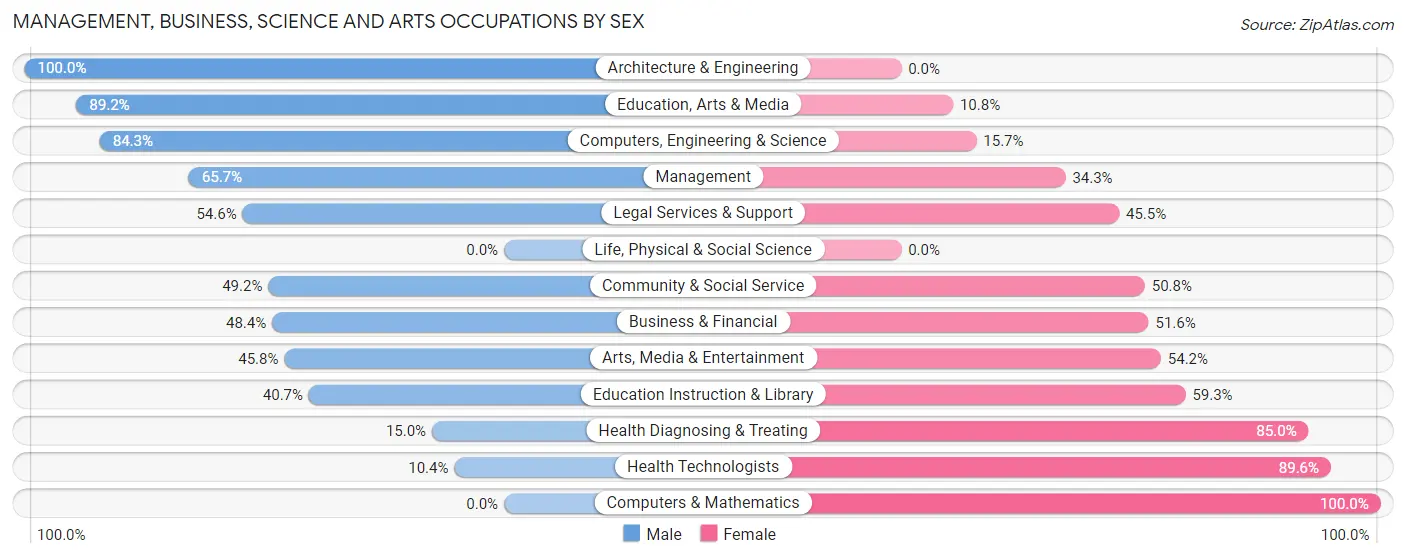
The most common Management, Business, Science and Arts occupations in Jack County are Community & Social Service (244 | 7.9%), Management (213 | 6.9%), Health Diagnosing & Treating (193 | 6.2%), Education Instruction & Library (172 | 5.6%), and Health Technologists (164 | 5.3%).
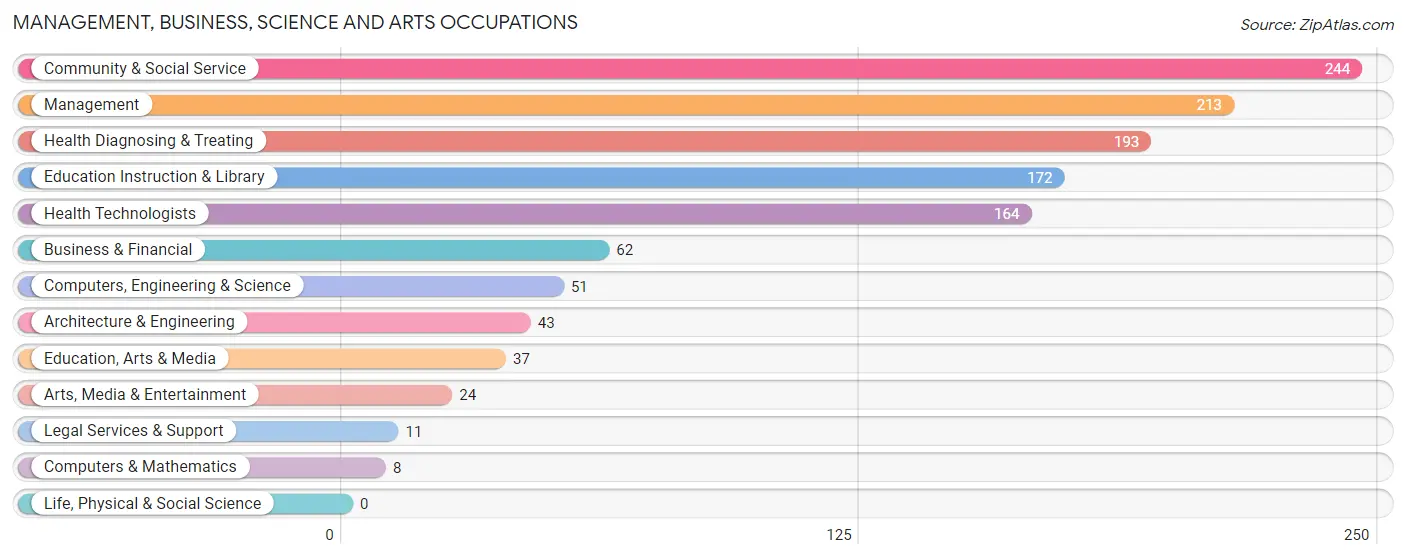
Management, Business, Science and Arts Occupations by Sex
Within the Management, Business, Science and Arts occupations in Jack County, the most male-oriented occupations are Architecture & Engineering (100.0%), Education, Arts & Media (89.2%), and Computers, Engineering & Science (84.3%), while the most female-oriented occupations are Computers & Mathematics (100.0%), Health Technologists (89.6%), and Health Diagnosing & Treating (85.0%).
| Occupation | Male | Female |
| Management | 140 (65.7%) | 73 (34.3%) |
| Business & Financial | 30 (48.4%) | 32 (51.6%) |
| Computers, Engineering & Science | 43 (84.3%) | 8 (15.7%) |
| Computers & Mathematics | 0 (0.0%) | 8 (100.0%) |
| Architecture & Engineering | 43 (100.0%) | 0 (0.0%) |
| Life, Physical & Social Science | 0 (0.0%) | 0 (0.0%) |
| Community & Social Service | 120 (49.2%) | 124 (50.8%) |
| Education, Arts & Media | 33 (89.2%) | 4 (10.8%) |
| Legal Services & Support | 6 (54.5%) | 5 (45.5%) |
| Education Instruction & Library | 70 (40.7%) | 102 (59.3%) |
| Arts, Media & Entertainment | 11 (45.8%) | 13 (54.2%) |
| Health Diagnosing & Treating | 29 (15.0%) | 164 (85.0%) |
| Health Technologists | 17 (10.4%) | 147 (89.6%) |
| Total (Category) | 362 (47.4%) | 401 (52.6%) |
| Total (Overall) | 1,788 (57.9%) | 1,303 (42.1%) |
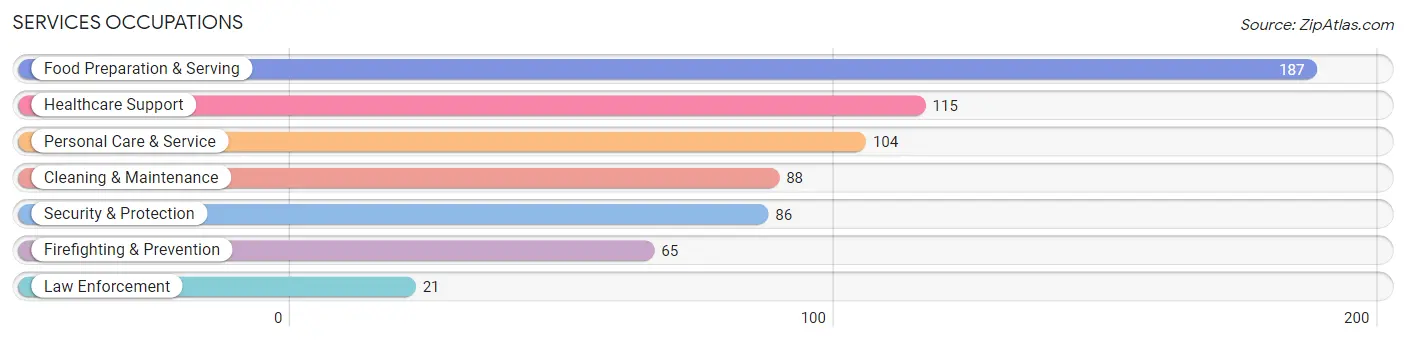
Services Occupations
The most common Services occupations in Jack County are Food Preparation & Serving (187 | 6.0%), Healthcare Support (115 | 3.7%), Personal Care & Service (104 | 3.4%), Cleaning & Maintenance (88 | 2.9%), and Security & Protection (86 | 2.8%).
Services Occupations by Sex
Within the Services occupations in Jack County, the most male-oriented occupations are Security & Protection (100.0%), Firefighting & Prevention (100.0%), and Law Enforcement (100.0%), while the most female-oriented occupations are Healthcare Support (100.0%), Personal Care & Service (76.0%), and Food Preparation & Serving (47.1%).
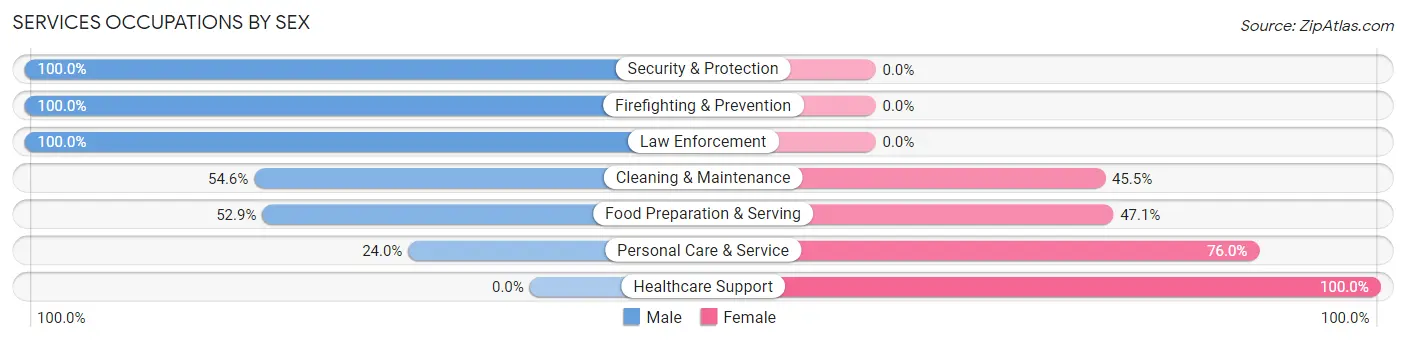
| Occupation | Male | Female |
| Healthcare Support | 0 (0.0%) | 115 (100.0%) |
| Security & Protection | 86 (100.0%) | 0 (0.0%) |
| Firefighting & Prevention | 65 (100.0%) | 0 (0.0%) |
| Law Enforcement | 21 (100.0%) | 0 (0.0%) |
| Food Preparation & Serving | 99 (52.9%) | 88 (47.1%) |
| Cleaning & Maintenance | 48 (54.5%) | 40 (45.5%) |
| Personal Care & Service | 25 (24.0%) | 79 (76.0%) |
| Total (Category) | 258 (44.5%) | 322 (55.5%) |
| Total (Overall) | 1,788 (57.9%) | 1,303 (42.1%) |
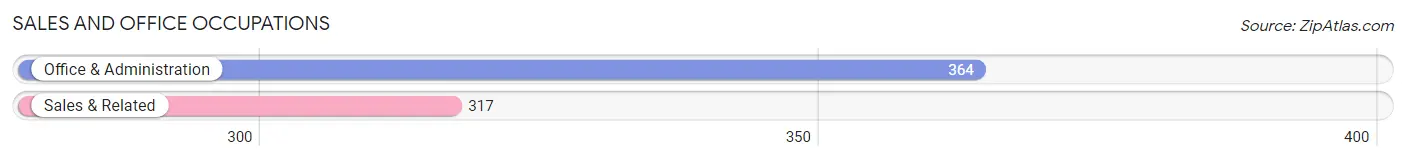
Sales and Office Occupations
The most common Sales and Office occupations in Jack County are Office & Administration (364 | 11.8%), and Sales & Related (317 | 10.3%).
Sales and Office Occupations by Sex
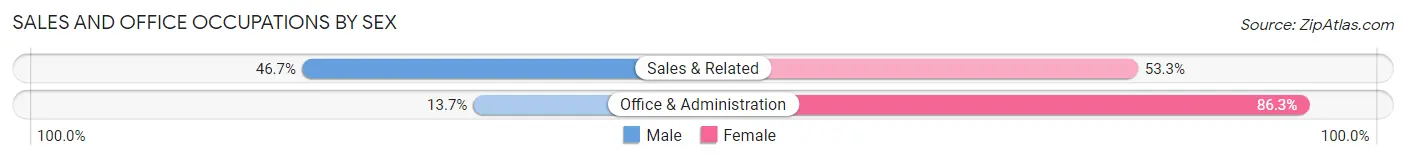
| Occupation | Male | Female |
| Sales & Related | 148 (46.7%) | 169 (53.3%) |
| Office & Administration | 50 (13.7%) | 314 (86.3%) |
| Total (Category) | 198 (29.1%) | 483 (70.9%) |
| Total (Overall) | 1,788 (57.9%) | 1,303 (42.1%) |
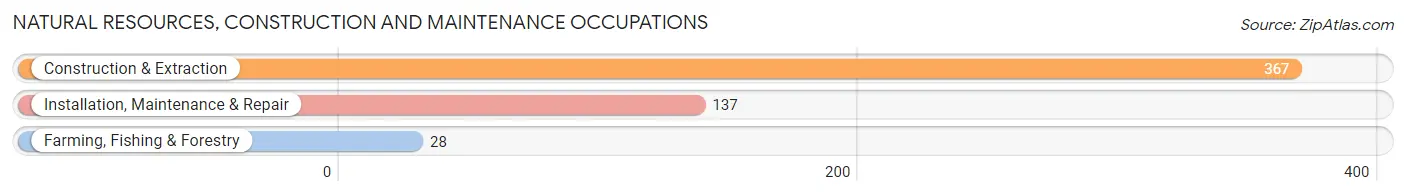
Natural Resources, Construction and Maintenance Occupations
The most common Natural Resources, Construction and Maintenance occupations in Jack County are Construction & Extraction (367 | 11.9%), Installation, Maintenance & Repair (137 | 4.4%), and Farming, Fishing & Forestry (28 | 0.9%).
Natural Resources, Construction and Maintenance Occupations by Sex
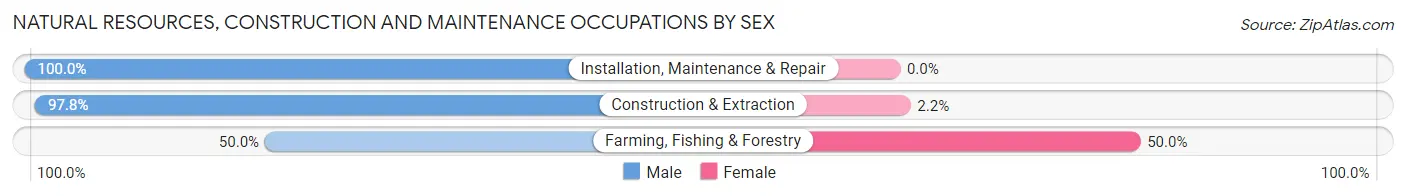
| Occupation | Male | Female |
| Farming, Fishing & Forestry | 14 (50.0%) | 14 (50.0%) |
| Construction & Extraction | 359 (97.8%) | 8 (2.2%) |
| Installation, Maintenance & Repair | 137 (100.0%) | 0 (0.0%) |
| Total (Category) | 510 (95.9%) | 22 (4.1%) |
| Total (Overall) | 1,788 (57.9%) | 1,303 (42.1%) |
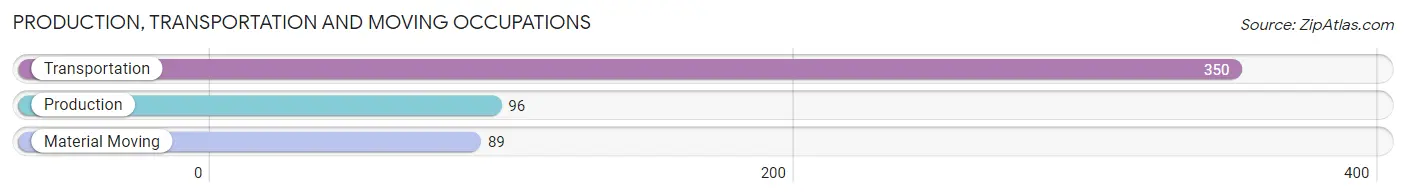
Production, Transportation and Moving Occupations
The most common Production, Transportation and Moving occupations in Jack County are Transportation (350 | 11.3%), Production (96 | 3.1%), and Material Moving (89 | 2.9%).
Production, Transportation and Moving Occupations by Sex
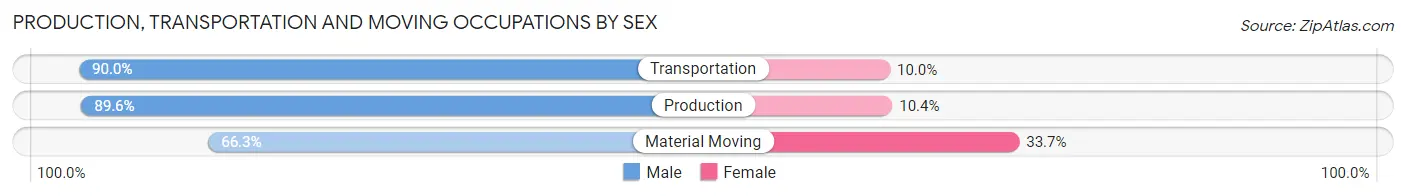
| Occupation | Male | Female |
| Production | 86 (89.6%) | 10 (10.4%) |
| Transportation | 315 (90.0%) | 35 (10.0%) |
| Material Moving | 59 (66.3%) | 30 (33.7%) |
| Total (Category) | 460 (86.0%) | 75 (14.0%) |
| Total (Overall) | 1,788 (57.9%) | 1,303 (42.1%) |
Employment Industries by Sex in Jack County
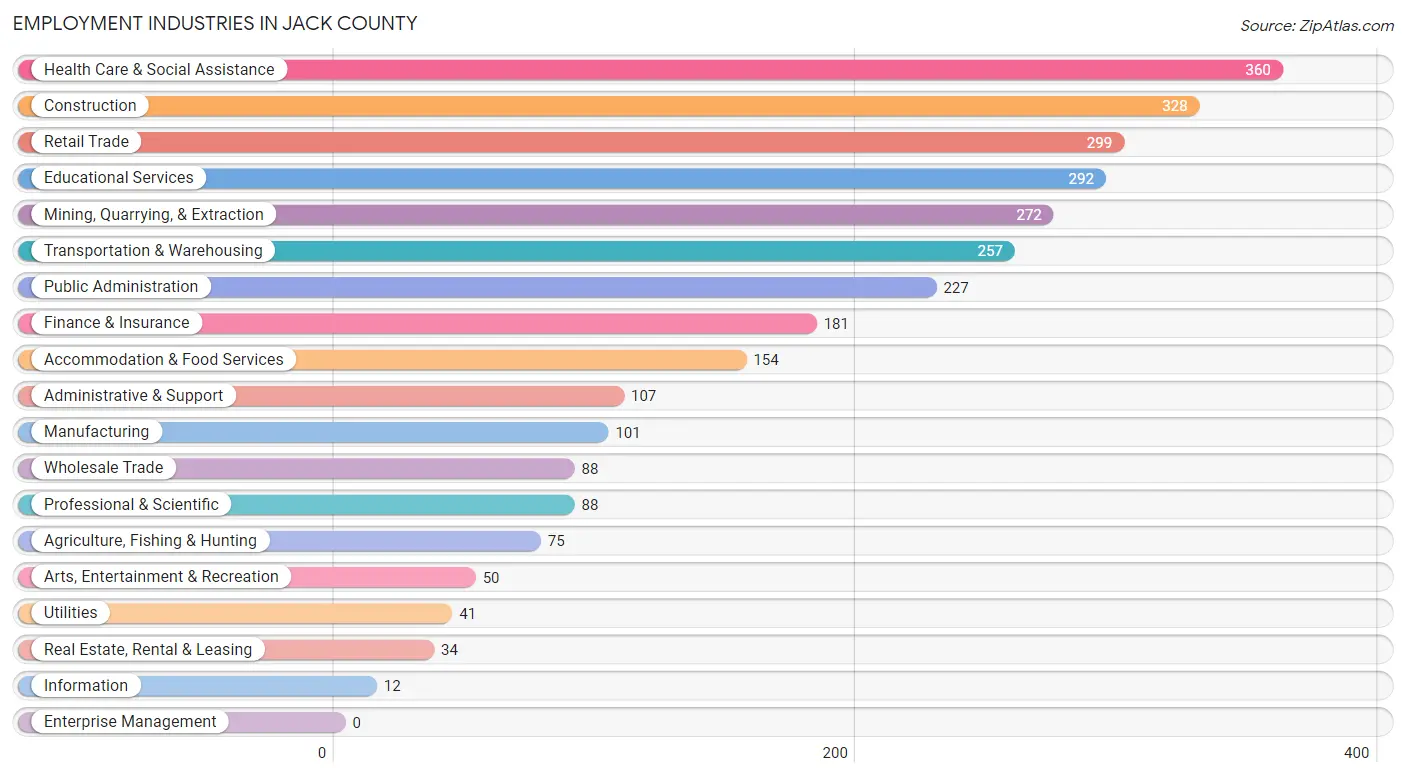
Employment Industries in Jack County
The major employment industries in Jack County include Health Care & Social Assistance (360 | 11.7%), Construction (328 | 10.6%), Retail Trade (299 | 9.7%), Educational Services (292 | 9.5%), and Mining, Quarrying, & Extraction (272 | 8.8%).
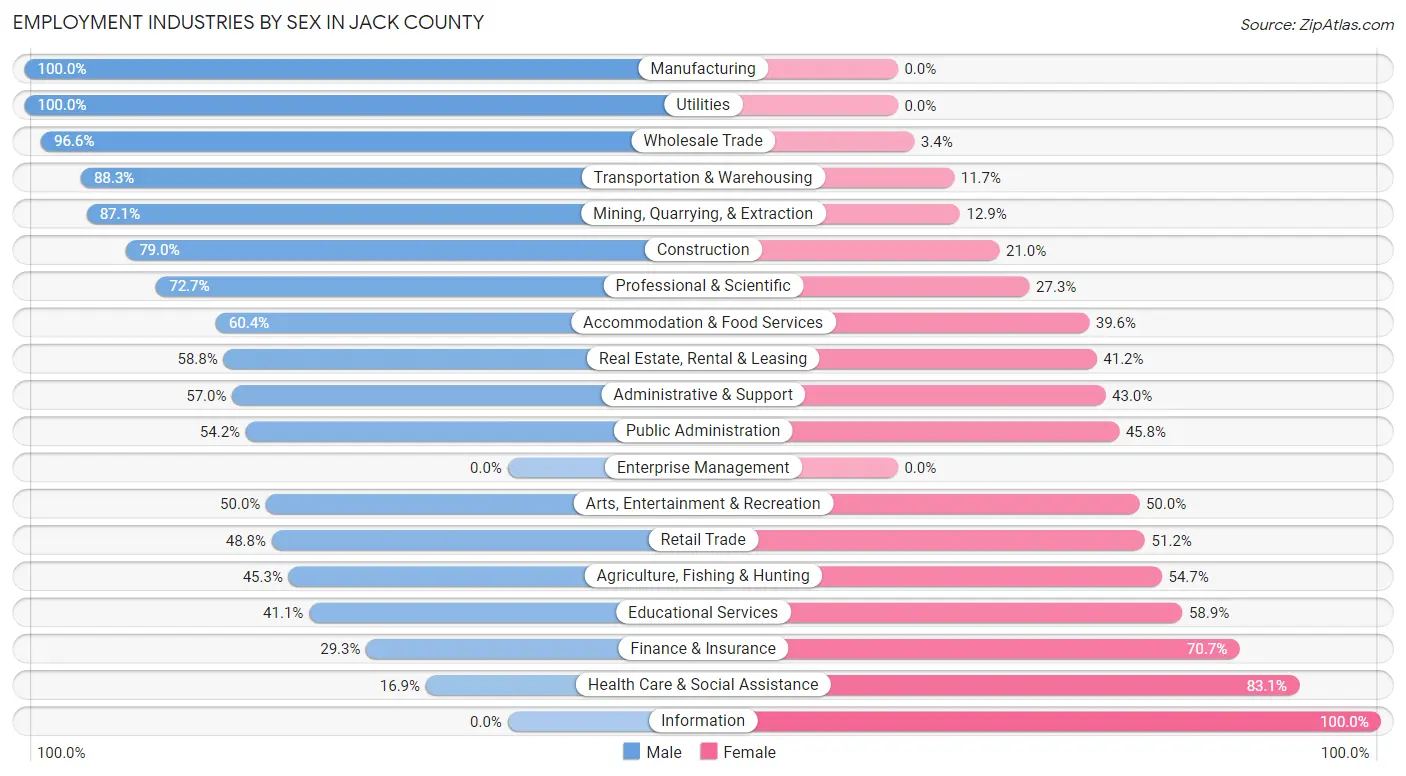
Employment Industries by Sex in Jack County
The Jack County industries that see more men than women are Manufacturing (100.0%), Utilities (100.0%), and Wholesale Trade (96.6%), whereas the industries that tend to have a higher number of women are Information (100.0%), Health Care & Social Assistance (83.1%), and Finance & Insurance (70.7%).
| Industry | Male | Female |
| Agriculture, Fishing & Hunting | 34 (45.3%) | 41 (54.7%) |
| Mining, Quarrying, & Extraction | 237 (87.1%) | 35 (12.9%) |
| Construction | 259 (79.0%) | 69 (21.0%) |
| Manufacturing | 101 (100.0%) | 0 (0.0%) |
| Wholesale Trade | 85 (96.6%) | 3 (3.4%) |
| Retail Trade | 146 (48.8%) | 153 (51.2%) |
| Transportation & Warehousing | 227 (88.3%) | 30 (11.7%) |
| Utilities | 41 (100.0%) | 0 (0.0%) |
| Information | 0 (0.0%) | 12 (100.0%) |
| Finance & Insurance | 53 (29.3%) | 128 (70.7%) |
| Real Estate, Rental & Leasing | 20 (58.8%) | 14 (41.2%) |
| Professional & Scientific | 64 (72.7%) | 24 (27.3%) |
| Enterprise Management | 0 (0.0%) | 0 (0.0%) |
| Administrative & Support | 61 (57.0%) | 46 (43.0%) |
| Educational Services | 120 (41.1%) | 172 (58.9%) |
| Health Care & Social Assistance | 61 (16.9%) | 299 (83.1%) |
| Arts, Entertainment & Recreation | 25 (50.0%) | 25 (50.0%) |
| Accommodation & Food Services | 93 (60.4%) | 61 (39.6%) |
| Public Administration | 123 (54.2%) | 104 (45.8%) |
| Total | 1,788 (57.9%) | 1,303 (42.1%) |
Education in Jack County
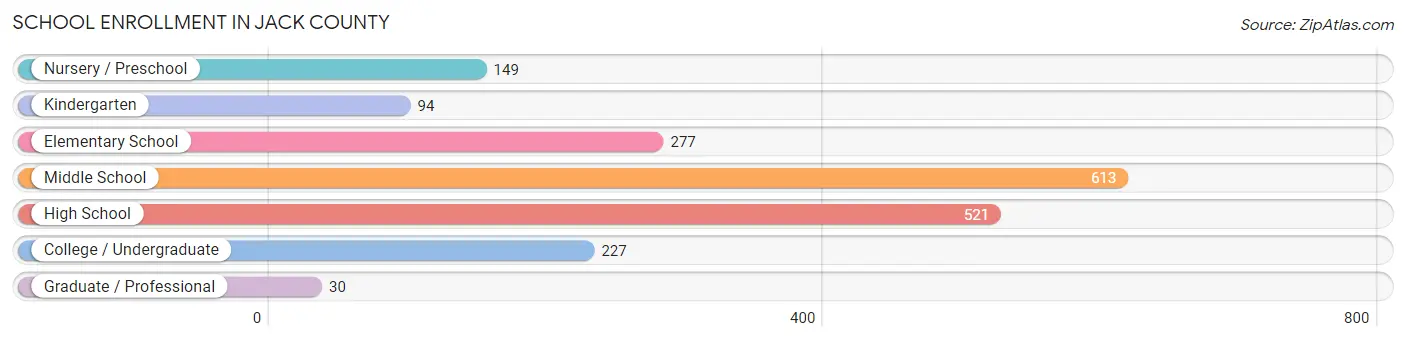
School Enrollment in Jack County
The most common levels of schooling among the 1,911 students in Jack County are middle school (613 | 32.1%), high school (521 | 27.3%), and elementary school (277 | 14.5%).
| School Level | # Students | % Students |
| Nursery / Preschool | 149 | 7.8% |
| Kindergarten | 94 | 4.9% |
| Elementary School | 277 | 14.5% |
| Middle School | 613 | 32.1% |
| High School | 521 | 27.3% |
| College / Undergraduate | 227 | 11.9% |
| Graduate / Professional | 30 | 1.6% |
| Total | 1,911 | 100.0% |
School Enrollment by Age by Funding Source in Jack County
Out of a total of 1,911 students who are enrolled in schools in Jack County, 155 (8.1%) attend a private institution, while the remaining 1,756 (91.9%) are enrolled in public schools. The age group of 3 to 4 year olds has the highest likelihood of being enrolled in private schools, with 45 (54.2% in the age bracket) enrolled. Conversely, the age group of 25 to 34 year olds has the lowest likelihood of being enrolled in a private school, with 83 (100.0% in the age bracket) attending a public institution.
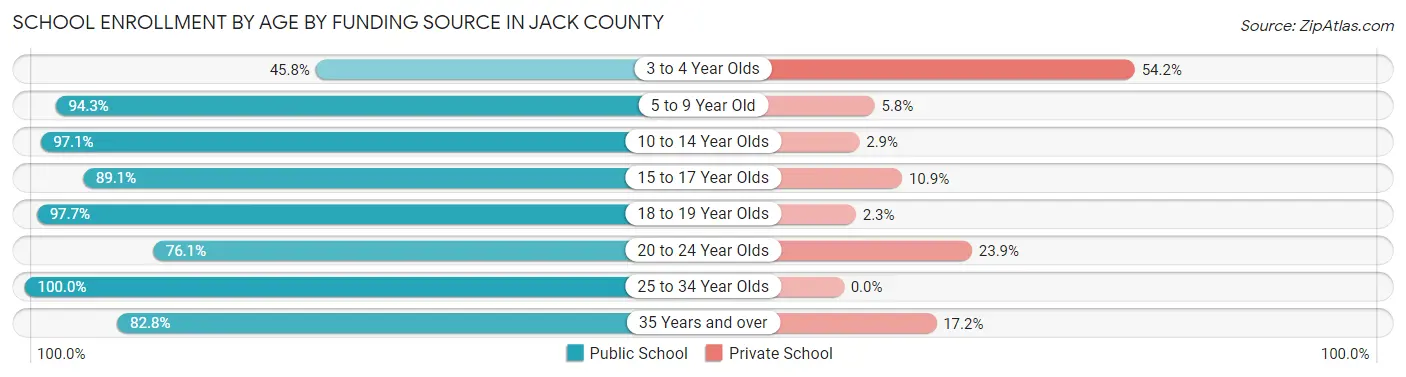
| Age Bracket | Public School | Private School |
| 3 to 4 Year Olds | 38 (45.8%) | 45 (54.2%) |
| 5 to 9 Year Old | 426 (94.3%) | 26 (5.8%) |
| 10 to 14 Year Olds | 667 (97.1%) | 20 (2.9%) |
| 15 to 17 Year Olds | 271 (89.1%) | 33 (10.9%) |
| 18 to 19 Year Olds | 173 (97.7%) | 4 (2.3%) |
| 20 to 24 Year Olds | 51 (76.1%) | 16 (23.9%) |
| 25 to 34 Year Olds | 83 (100.0%) | 0 (0.0%) |
| 35 Years and over | 48 (82.8%) | 10 (17.2%) |
| Total | 1,756 (91.9%) | 155 (8.1%) |
Educational Attainment by Field of Study in Jack County
Business (213 | 22.4%), education (182 | 19.1%), bio, nature & agricultural (158 | 16.6%), literature & languages (79 | 8.3%), and science & technology (67 | 7.0%) are the most common fields of study among 952 individuals in Jack County who have obtained a bachelor's degree or higher.
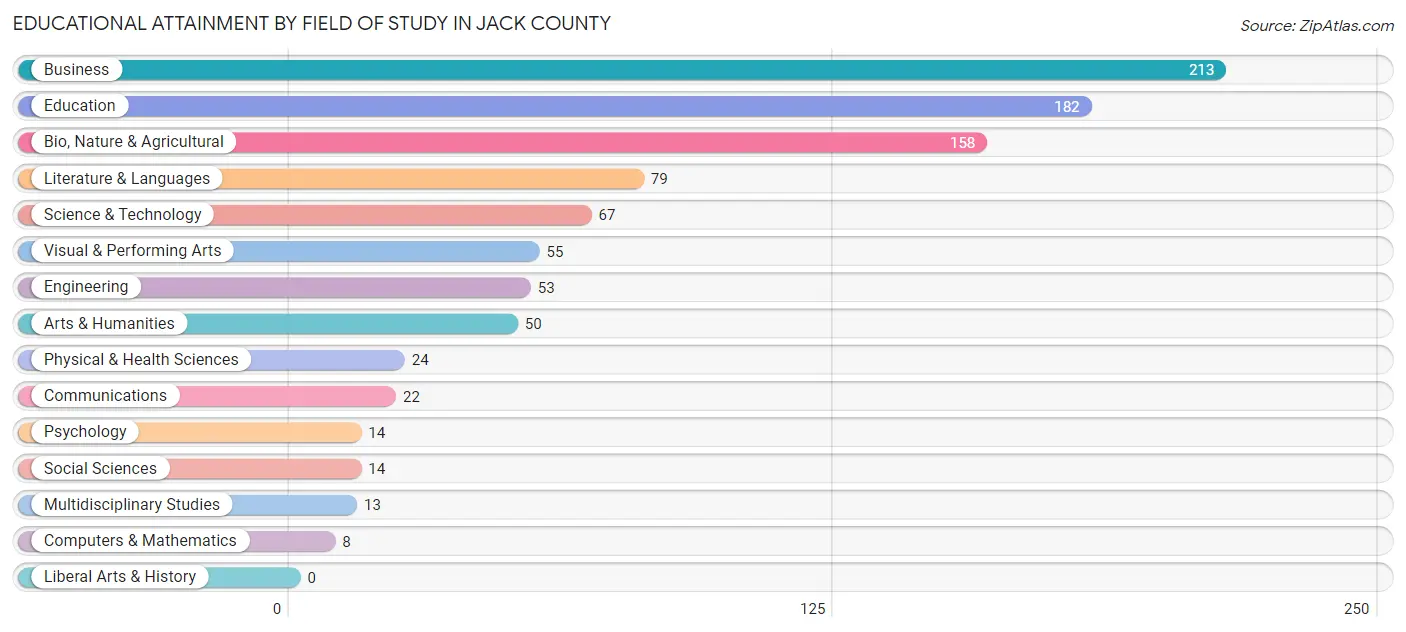
| Field of Study | # Graduates | % Graduates |
| Computers & Mathematics | 8 | 0.8% |
| Bio, Nature & Agricultural | 158 | 16.6% |
| Physical & Health Sciences | 24 | 2.5% |
| Psychology | 14 | 1.5% |
| Social Sciences | 14 | 1.5% |
| Engineering | 53 | 5.6% |
| Multidisciplinary Studies | 13 | 1.4% |
| Science & Technology | 67 | 7.0% |
| Business | 213 | 22.4% |
| Education | 182 | 19.1% |
| Literature & Languages | 79 | 8.3% |
| Liberal Arts & History | 0 | 0.0% |
| Visual & Performing Arts | 55 | 5.8% |
| Communications | 22 | 2.3% |
| Arts & Humanities | 50 | 5.2% |
| Total | 952 | 100.0% |
Transportation & Commute in Jack County
Vehicle Availability by Sex in Jack County
The most prevalent vehicle ownership categories in Jack County are males with 2 vehicles (746, accounting for 42.4%) and females with 2 vehicles (506, making up 57.4%).
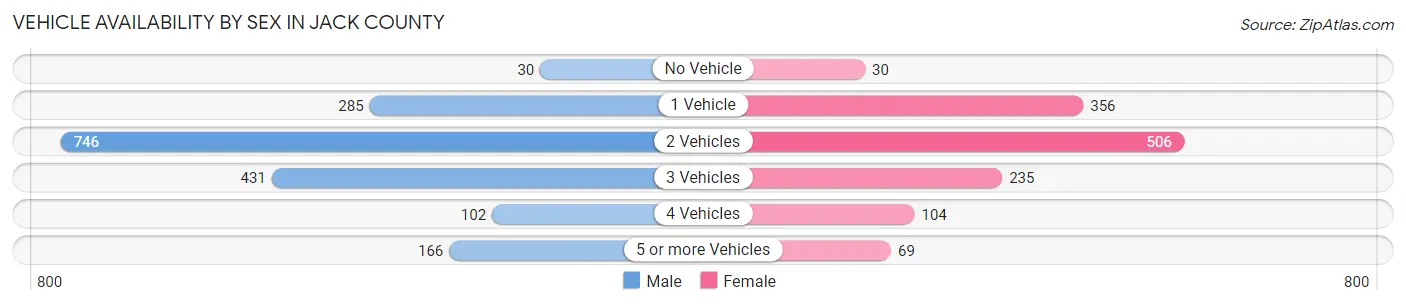
| Vehicles Available | Male | Female |
| No Vehicle | 30 (1.7%) | 30 (2.3%) |
| 1 Vehicle | 285 (16.2%) | 356 (27.4%) |
| 2 Vehicles | 746 (42.4%) | 506 (38.9%) |
| 3 Vehicles | 431 (24.5%) | 235 (18.1%) |
| 4 Vehicles | 102 (5.8%) | 104 (8.0%) |
| 5 or more Vehicles | 166 (9.4%) | 69 (5.3%) |
| Total | 1,760 (100.0%) | 1,300 (100.0%) |
Commute Time in Jack County
The most frequently occuring commute durations in Jack County are 5 to 9 minutes (546 commuters, 19.0%), 20 to 24 minutes (433 commuters, 15.1%), and 10 to 14 minutes (344 commuters, 12.0%).
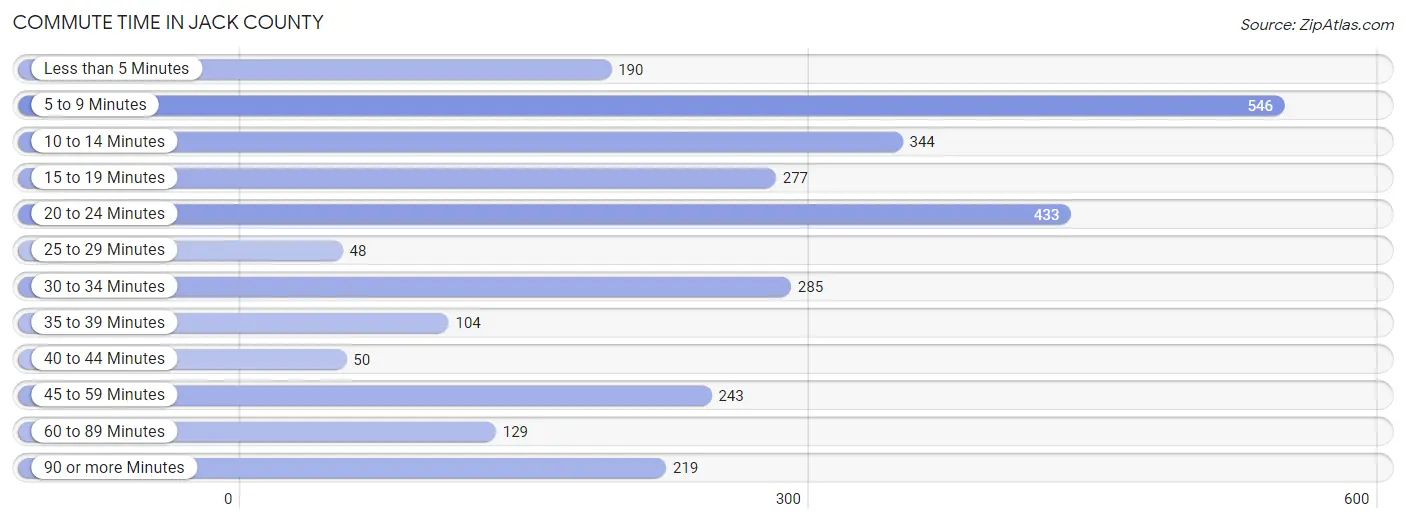
| Commute Time | # Commuters | % Commuters |
| Less than 5 Minutes | 190 | 6.6% |
| 5 to 9 Minutes | 546 | 19.0% |
| 10 to 14 Minutes | 344 | 12.0% |
| 15 to 19 Minutes | 277 | 9.7% |
| 20 to 24 Minutes | 433 | 15.1% |
| 25 to 29 Minutes | 48 | 1.7% |
| 30 to 34 Minutes | 285 | 9.9% |
| 35 to 39 Minutes | 104 | 3.6% |
| 40 to 44 Minutes | 50 | 1.7% |
| 45 to 59 Minutes | 243 | 8.5% |
| 60 to 89 Minutes | 129 | 4.5% |
| 90 or more Minutes | 219 | 7.6% |
Commute Time by Sex in Jack County
The most common commute times in Jack County are 5 to 9 minutes (337 commuters, 20.5%) for males and 20 to 24 minutes (223 commuters, 18.2%) for females.
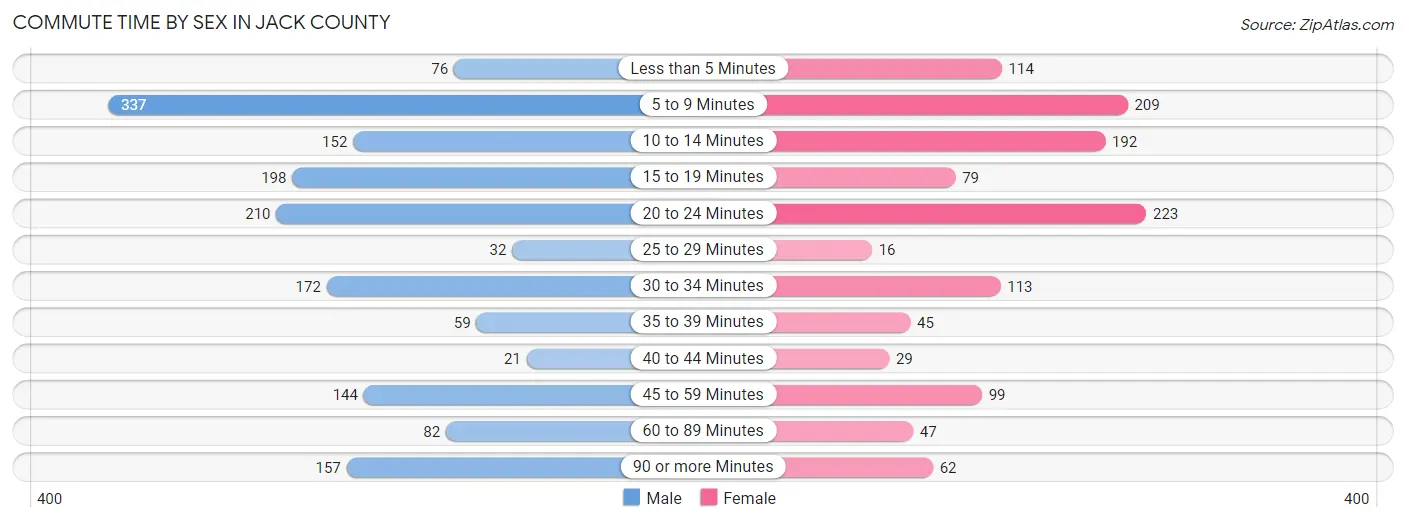
| Commute Time | Male | Female |
| Less than 5 Minutes | 76 (4.6%) | 114 (9.3%) |
| 5 to 9 Minutes | 337 (20.5%) | 209 (17.0%) |
| 10 to 14 Minutes | 152 (9.3%) | 192 (15.6%) |
| 15 to 19 Minutes | 198 (12.1%) | 79 (6.4%) |
| 20 to 24 Minutes | 210 (12.8%) | 223 (18.2%) |
| 25 to 29 Minutes | 32 (1.9%) | 16 (1.3%) |
| 30 to 34 Minutes | 172 (10.5%) | 113 (9.2%) |
| 35 to 39 Minutes | 59 (3.6%) | 45 (3.7%) |
| 40 to 44 Minutes | 21 (1.3%) | 29 (2.4%) |
| 45 to 59 Minutes | 144 (8.8%) | 99 (8.1%) |
| 60 to 89 Minutes | 82 (5.0%) | 47 (3.8%) |
| 90 or more Minutes | 157 (9.6%) | 62 (5.1%) |
Time of Departure to Work by Sex in Jack County
The most frequent times of departure to work in Jack County are 7:00 AM to 7:29 AM (340, 20.7%) for males and 7:00 AM to 7:29 AM (257, 20.9%) for females.
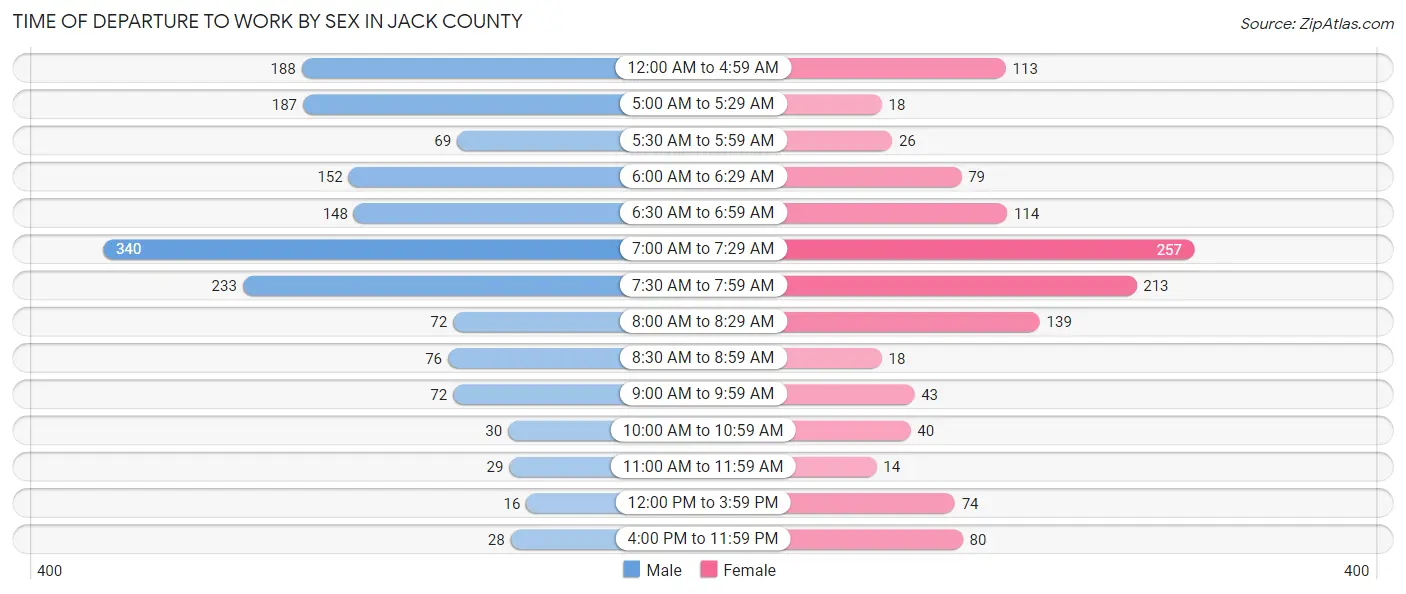
| Time of Departure | Male | Female |
| 12:00 AM to 4:59 AM | 188 (11.5%) | 113 (9.2%) |
| 5:00 AM to 5:29 AM | 187 (11.4%) | 18 (1.5%) |
| 5:30 AM to 5:59 AM | 69 (4.2%) | 26 (2.1%) |
| 6:00 AM to 6:29 AM | 152 (9.3%) | 79 (6.4%) |
| 6:30 AM to 6:59 AM | 148 (9.0%) | 114 (9.3%) |
| 7:00 AM to 7:29 AM | 340 (20.7%) | 257 (20.9%) |
| 7:30 AM to 7:59 AM | 233 (14.2%) | 213 (17.3%) |
| 8:00 AM to 8:29 AM | 72 (4.4%) | 139 (11.3%) |
| 8:30 AM to 8:59 AM | 76 (4.6%) | 18 (1.5%) |
| 9:00 AM to 9:59 AM | 72 (4.4%) | 43 (3.5%) |
| 10:00 AM to 10:59 AM | 30 (1.8%) | 40 (3.3%) |
| 11:00 AM to 11:59 AM | 29 (1.8%) | 14 (1.1%) |
| 12:00 PM to 3:59 PM | 16 (1.0%) | 74 (6.0%) |
| 4:00 PM to 11:59 PM | 28 (1.7%) | 80 (6.5%) |
| Total | 1,640 (100.0%) | 1,228 (100.0%) |
Housing Occupancy in Jack County
Occupancy by Ownership in Jack County
Of the total 2,997 dwellings in Jack County, owner-occupied units account for 2,183 (72.8%), while renter-occupied units make up 814 (27.2%).
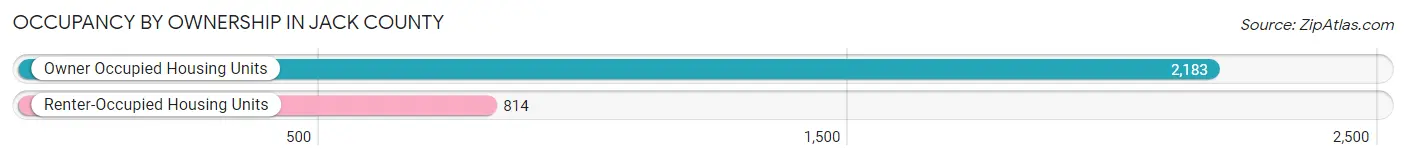
| Occupancy | # Housing Units | % Housing Units |
| Owner Occupied Housing Units | 2,183 | 72.8% |
| Renter-Occupied Housing Units | 814 | 27.2% |
| Total Occupied Housing Units | 2,997 | 100.0% |
Occupancy by Household Size in Jack County
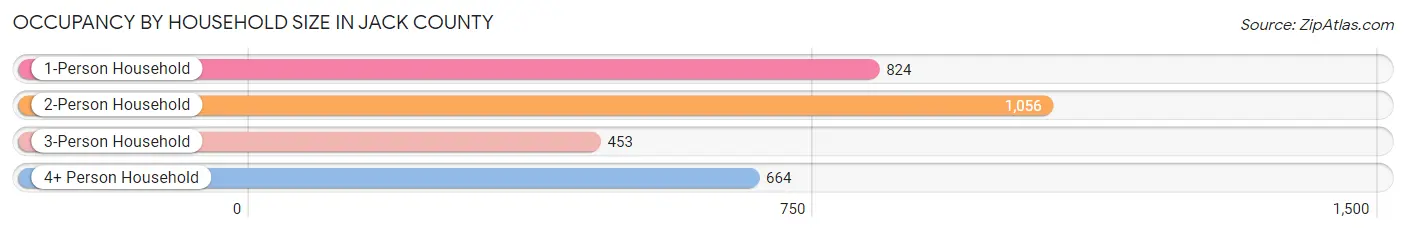
| Household Size | # Housing Units | % Housing Units |
| 1-Person Household | 824 | 27.5% |
| 2-Person Household | 1,056 | 35.2% |
| 3-Person Household | 453 | 15.1% |
| 4+ Person Household | 664 | 22.2% |
| Total Housing Units | 2,997 | 100.0% |
Occupancy by Ownership by Household Size in Jack County
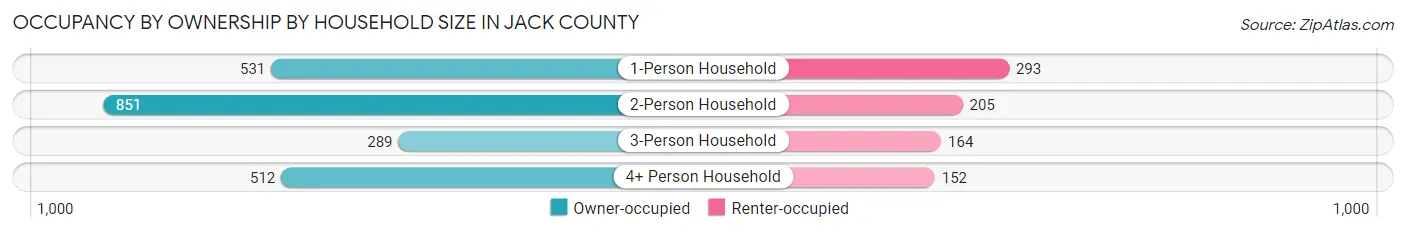
| Household Size | Owner-occupied | Renter-occupied |
| 1-Person Household | 531 (64.4%) | 293 (35.6%) |
| 2-Person Household | 851 (80.6%) | 205 (19.4%) |
| 3-Person Household | 289 (63.8%) | 164 (36.2%) |
| 4+ Person Household | 512 (77.1%) | 152 (22.9%) |
| Total Housing Units | 2,183 (72.8%) | 814 (27.2%) |
Occupancy by Educational Attainment in Jack County
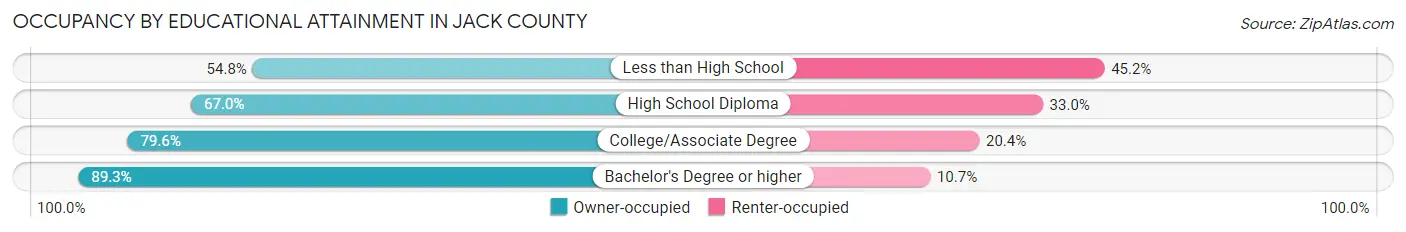
| Household Size | Owner-occupied | Renter-occupied |
| Less than High School | 309 (54.8%) | 255 (45.2%) |
| High School Diploma | 619 (67.0%) | 305 (33.0%) |
| College/Associate Degree | 761 (79.6%) | 195 (20.4%) |
| Bachelor's Degree or higher | 494 (89.3%) | 59 (10.7%) |
Occupancy by Age of Householder in Jack County
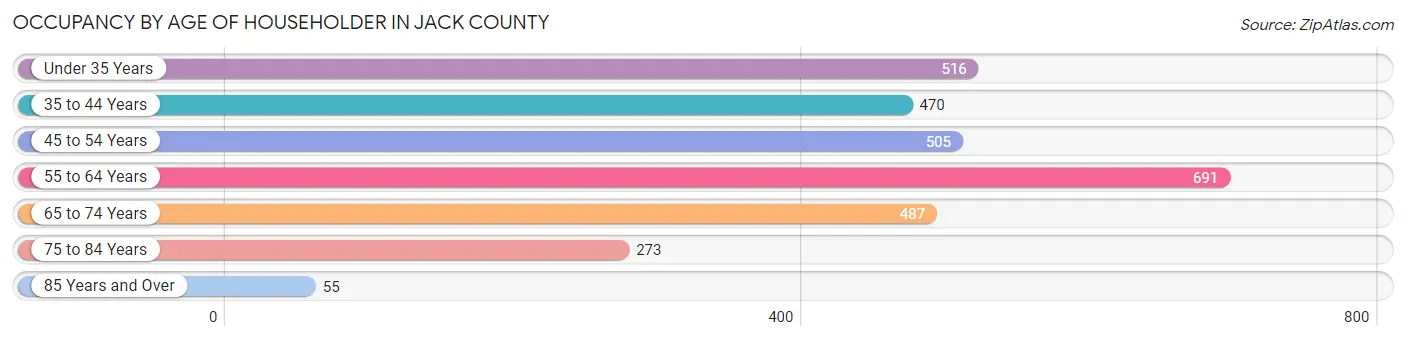
| Age Bracket | # Households | % Households |
| Under 35 Years | 516 | 17.2% |
| 35 to 44 Years | 470 | 15.7% |
| 45 to 54 Years | 505 | 16.9% |
| 55 to 64 Years | 691 | 23.1% |
| 65 to 74 Years | 487 | 16.3% |
| 75 to 84 Years | 273 | 9.1% |
| 85 Years and Over | 55 | 1.8% |
| Total | 2,997 | 100.0% |
Housing Finances in Jack County
Median Income by Occupancy in Jack County
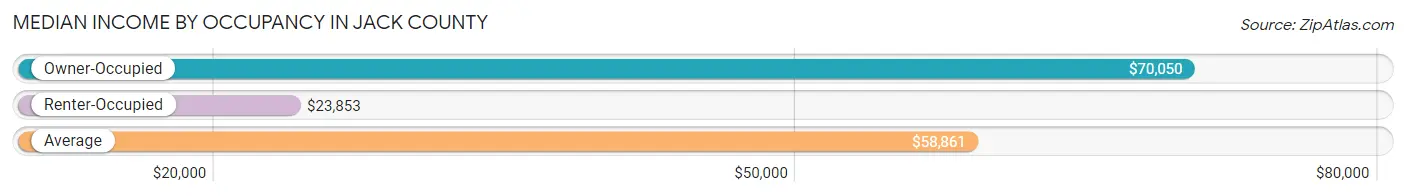
| Occupancy Type | # Households | Median Income |
| Owner-Occupied | 2,183 (72.8%) | $70,050 |
| Renter-Occupied | 814 (27.2%) | $23,853 |
| Average | 2,997 (100.0%) | $58,861 |
Occupancy by Householder Income Bracket in Jack County
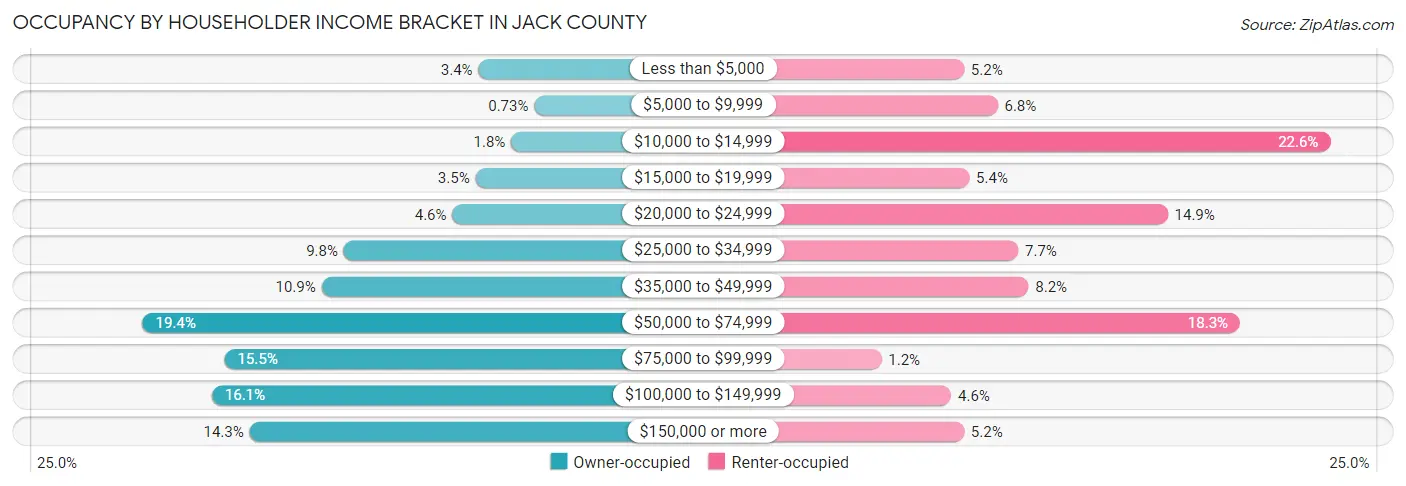
| Income Bracket | Owner-occupied | Renter-occupied |
| Less than $5,000 | 74 (3.4%) | 42 (5.2%) |
| $5,000 to $9,999 | 16 (0.7%) | 55 (6.8%) |
| $10,000 to $14,999 | 40 (1.8%) | 184 (22.6%) |
| $15,000 to $19,999 | 77 (3.5%) | 44 (5.4%) |
| $20,000 to $24,999 | 101 (4.6%) | 121 (14.9%) |
| $25,000 to $34,999 | 214 (9.8%) | 63 (7.7%) |
| $35,000 to $49,999 | 237 (10.9%) | 67 (8.2%) |
| $50,000 to $74,999 | 423 (19.4%) | 149 (18.3%) |
| $75,000 to $99,999 | 338 (15.5%) | 10 (1.2%) |
| $100,000 to $149,999 | 351 (16.1%) | 37 (4.5%) |
| $150,000 or more | 312 (14.3%) | 42 (5.2%) |
| Total | 2,183 (100.0%) | 814 (100.0%) |
Monthly Housing Cost Tiers in Jack County
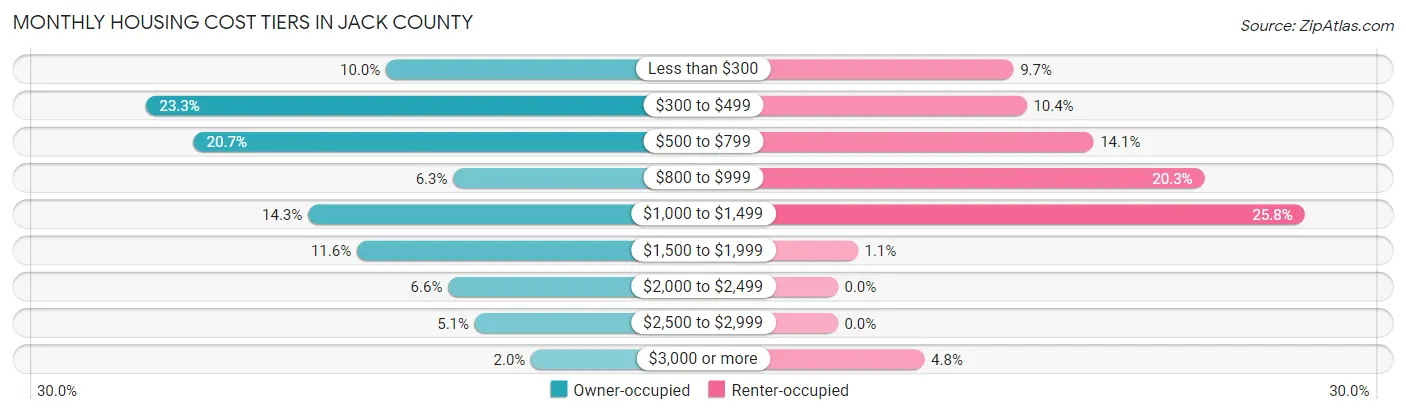
| Monthly Cost | Owner-occupied | Renter-occupied |
| Less than $300 | 219 (10.0%) | 79 (9.7%) |
| $300 to $499 | 508 (23.3%) | 85 (10.4%) |
| $500 to $799 | 451 (20.7%) | 115 (14.1%) |
| $800 to $999 | 138 (6.3%) | 165 (20.3%) |
| $1,000 to $1,499 | 313 (14.3%) | 210 (25.8%) |
| $1,500 to $1,999 | 254 (11.6%) | 9 (1.1%) |
| $2,000 to $2,499 | 144 (6.6%) | 0 (0.0%) |
| $2,500 to $2,999 | 112 (5.1%) | 0 (0.0%) |
| $3,000 or more | 44 (2.0%) | 39 (4.8%) |
| Total | 2,183 (100.0%) | 814 (100.0%) |
Physical Housing Characteristics in Jack County
Housing Structures in Jack County
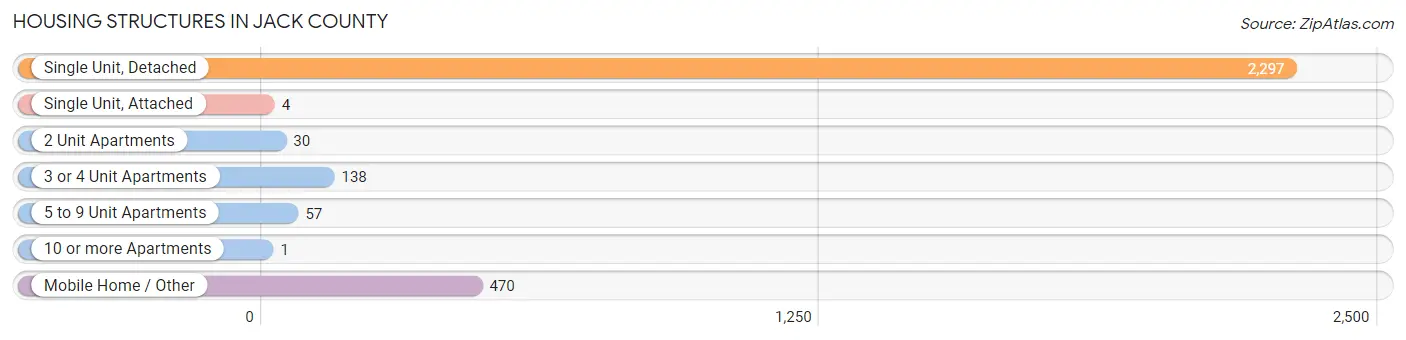
| Structure Type | # Housing Units | % Housing Units |
| Single Unit, Detached | 2,297 | 76.6% |
| Single Unit, Attached | 4 | 0.1% |
| 2 Unit Apartments | 30 | 1.0% |
| 3 or 4 Unit Apartments | 138 | 4.6% |
| 5 to 9 Unit Apartments | 57 | 1.9% |
| 10 or more Apartments | 1 | 0.0% |
| Mobile Home / Other | 470 | 15.7% |
| Total | 2,997 | 100.0% |
Housing Structures by Occupancy in Jack County
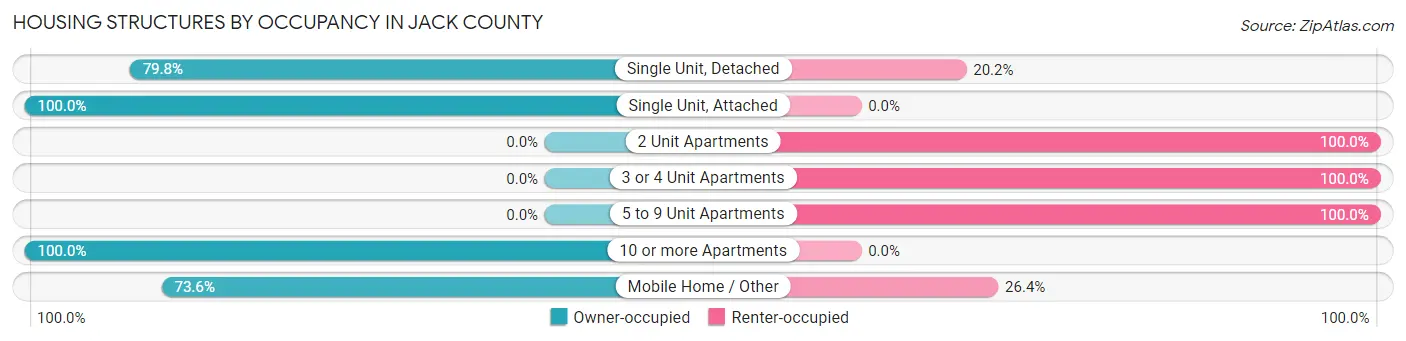
| Structure Type | Owner-occupied | Renter-occupied |
| Single Unit, Detached | 1,832 (79.8%) | 465 (20.2%) |
| Single Unit, Attached | 4 (100.0%) | 0 (0.0%) |
| 2 Unit Apartments | 0 (0.0%) | 30 (100.0%) |
| 3 or 4 Unit Apartments | 0 (0.0%) | 138 (100.0%) |
| 5 to 9 Unit Apartments | 0 (0.0%) | 57 (100.0%) |
| 10 or more Apartments | 1 (100.0%) | 0 (0.0%) |
| Mobile Home / Other | 346 (73.6%) | 124 (26.4%) |
| Total | 2,183 (72.8%) | 814 (27.2%) |
Housing Structures by Number of Rooms in Jack County
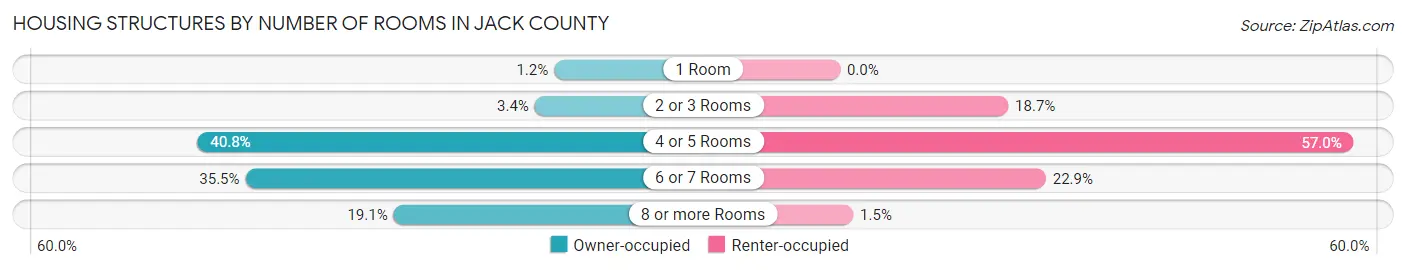
| Number of Rooms | Owner-occupied | Renter-occupied |
| 1 Room | 27 (1.2%) | 0 (0.0%) |
| 2 or 3 Rooms | 74 (3.4%) | 152 (18.7%) |
| 4 or 5 Rooms | 891 (40.8%) | 464 (57.0%) |
| 6 or 7 Rooms | 775 (35.5%) | 186 (22.9%) |
| 8 or more Rooms | 416 (19.1%) | 12 (1.5%) |
| Total | 2,183 (100.0%) | 814 (100.0%) |
Housing Structure by Heating Type in Jack County
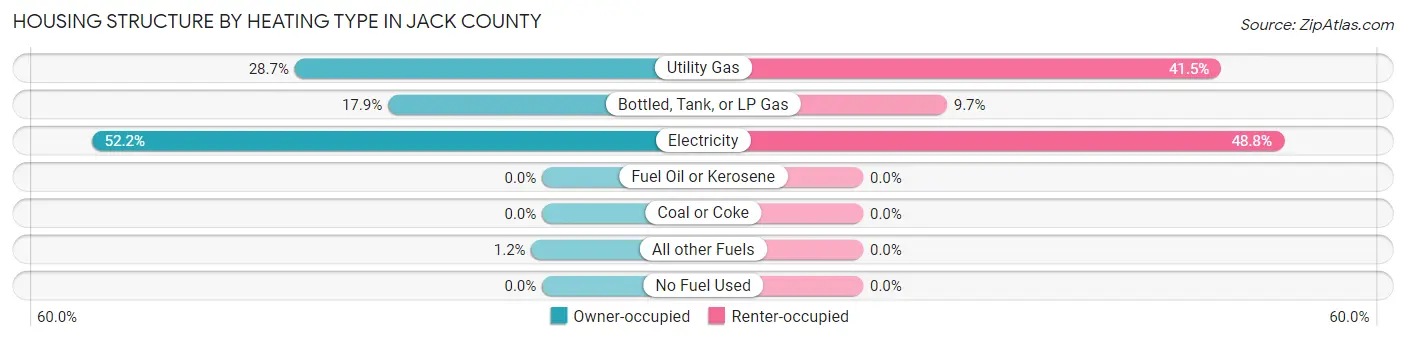
| Heating Type | Owner-occupied | Renter-occupied |
| Utility Gas | 626 (28.7%) | 338 (41.5%) |
| Bottled, Tank, or LP Gas | 390 (17.9%) | 79 (9.7%) |
| Electricity | 1,140 (52.2%) | 397 (48.8%) |
| Fuel Oil or Kerosene | 0 (0.0%) | 0 (0.0%) |
| Coal or Coke | 0 (0.0%) | 0 (0.0%) |
| All other Fuels | 27 (1.2%) | 0 (0.0%) |
| No Fuel Used | 0 (0.0%) | 0 (0.0%) |
| Total | 2,183 (100.0%) | 814 (100.0%) |
Household Vehicle Usage in Jack County
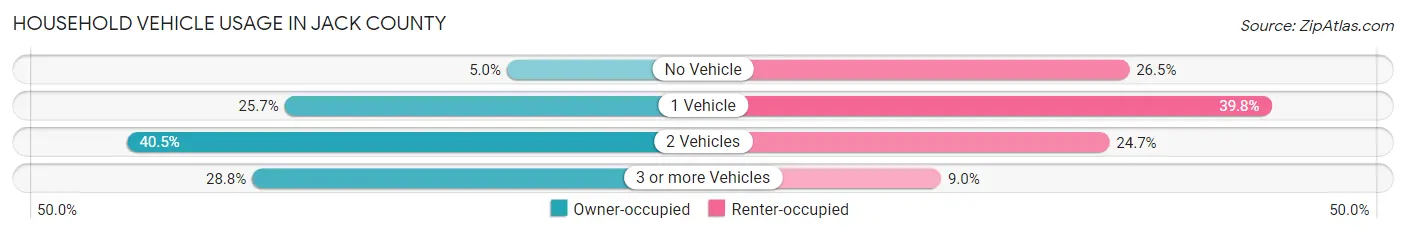
| Vehicles per Household | Owner-occupied | Renter-occupied |
| No Vehicle | 109 (5.0%) | 216 (26.5%) |
| 1 Vehicle | 562 (25.7%) | 324 (39.8%) |
| 2 Vehicles | 884 (40.5%) | 201 (24.7%) |
| 3 or more Vehicles | 628 (28.8%) | 73 (9.0%) |
| Total | 2,183 (100.0%) | 814 (100.0%) |
Real Estate & Mortgages in Jack County
Real Estate and Mortgage Overview in Jack County
| Characteristic | Without Mortgage | With Mortgage |
| Housing Units | 1,248 | 935 |
| Median Property Value | $103,300 | $172,600 |
| Median Household Income | $67,368 | $198 |
| Monthly Housing Costs | $469 | $44 |
| Real Estate Taxes | $1,415 | $39 |
Property Value by Mortgage Status in Jack County
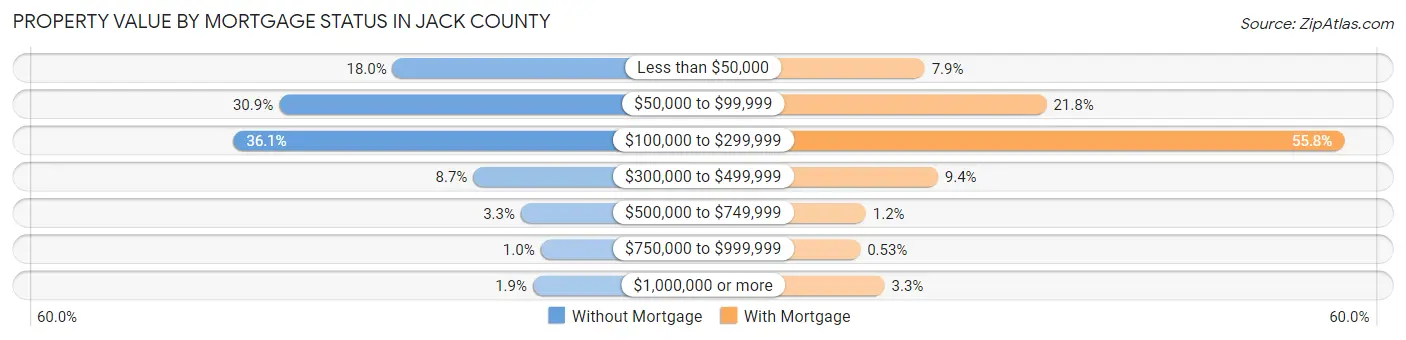
| Property Value | Without Mortgage | With Mortgage |
| Less than $50,000 | 224 (17.9%) | 74 (7.9%) |
| $50,000 to $99,999 | 386 (30.9%) | 204 (21.8%) |
| $100,000 to $299,999 | 451 (36.1%) | 522 (55.8%) |
| $300,000 to $499,999 | 109 (8.7%) | 88 (9.4%) |
| $500,000 to $749,999 | 41 (3.3%) | 11 (1.2%) |
| $750,000 to $999,999 | 13 (1.0%) | 5 (0.5%) |
| $1,000,000 or more | 24 (1.9%) | 31 (3.3%) |
| Total | 1,248 (100.0%) | 935 (100.0%) |
Household Income by Mortgage Status in Jack County
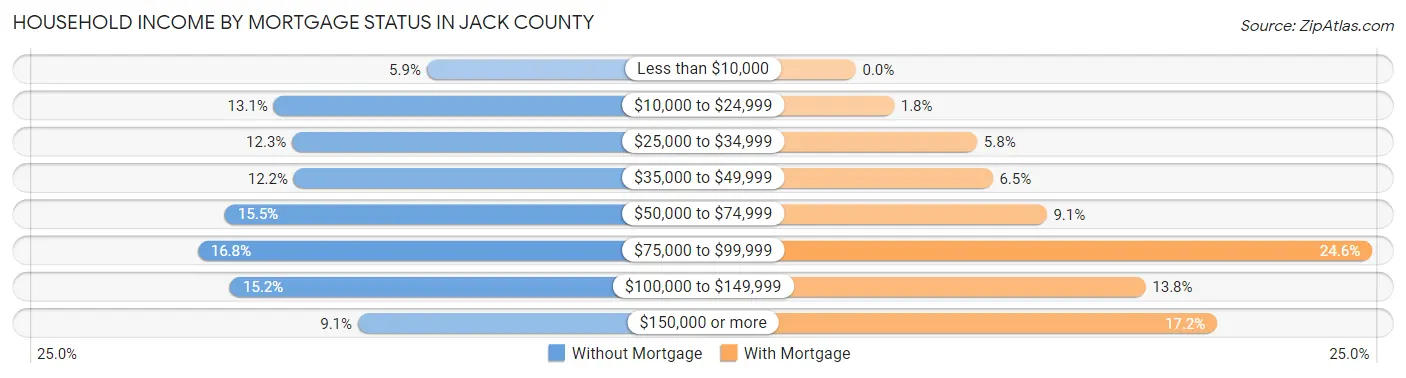
| Household Income | Without Mortgage | With Mortgage |
| Less than $10,000 | 73 (5.9%) | 0 (0.0%) |
| $10,000 to $24,999 | 164 (13.1%) | 17 (1.8%) |
| $25,000 to $34,999 | 153 (12.3%) | 54 (5.8%) |
| $35,000 to $49,999 | 152 (12.2%) | 61 (6.5%) |
| $50,000 to $74,999 | 193 (15.5%) | 85 (9.1%) |
| $75,000 to $99,999 | 209 (16.8%) | 230 (24.6%) |
| $100,000 to $149,999 | 190 (15.2%) | 129 (13.8%) |
| $150,000 or more | 114 (9.1%) | 161 (17.2%) |
| Total | 1,248 (100.0%) | 935 (100.0%) |
Property Value to Household Income Ratio in Jack County
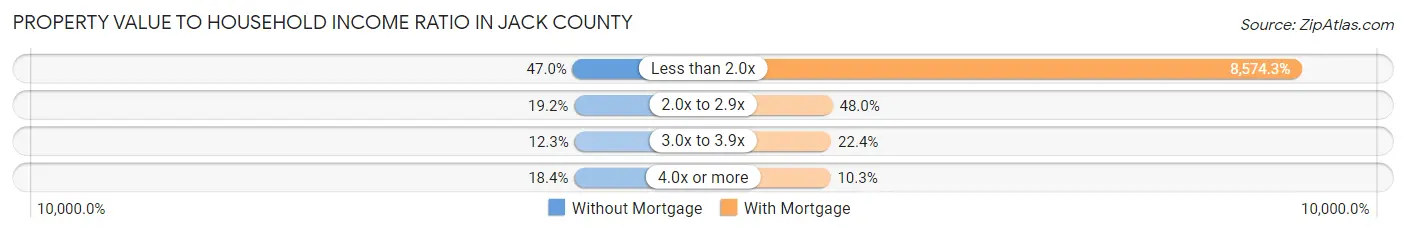
| Value-to-Income Ratio | Without Mortgage | With Mortgage |
| Less than 2.0x | 587 (47.0%) | 80,170 (8,574.3%) |
| 2.0x to 2.9x | 240 (19.2%) | 449 (48.0%) |
| 3.0x to 3.9x | 153 (12.3%) | 209 (22.4%) |
| 4.0x or more | 229 (18.3%) | 96 (10.3%) |
| Total | 1,248 (100.0%) | 935 (100.0%) |
Real Estate Taxes by Mortgage Status in Jack County
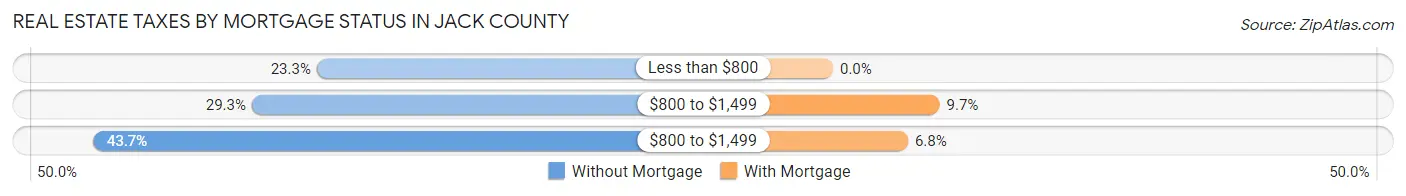
| Property Taxes | Without Mortgage | With Mortgage |
| Less than $800 | 291 (23.3%) | 0 (0.0%) |
| $800 to $1,499 | 365 (29.2%) | 91 (9.7%) |
| $800 to $1,499 | 545 (43.7%) | 64 (6.8%) |
| Total | 1,248 (100.0%) | 935 (100.0%) |
Health & Disability in Jack County
Health Insurance Coverage by Age in Jack County
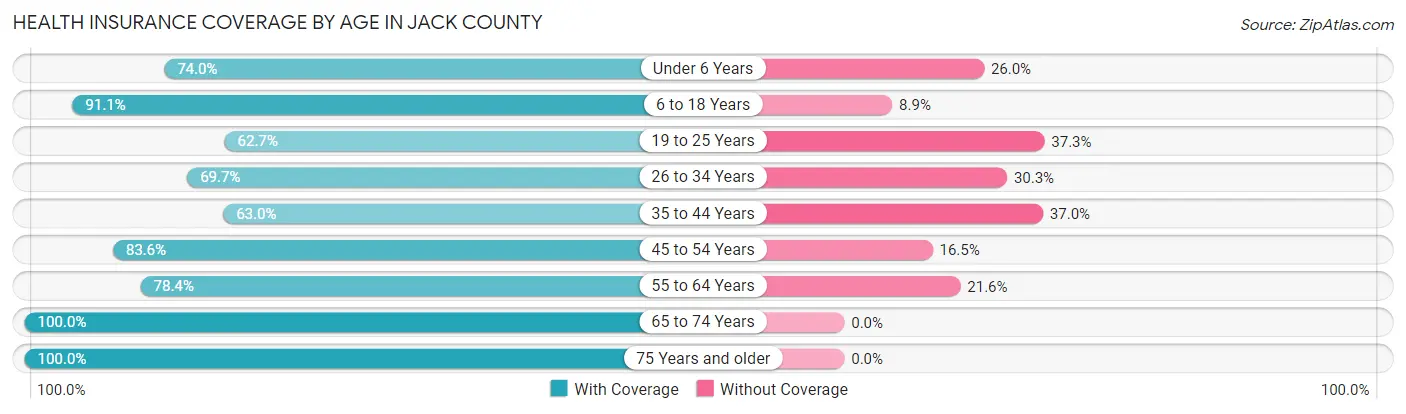
| Age Bracket | With Coverage | Without Coverage |
| Under 6 Years | 409 (74.0%) | 144 (26.0%) |
| 6 to 18 Years | 1,358 (91.1%) | 133 (8.9%) |
| 19 to 25 Years | 378 (62.7%) | 225 (37.3%) |
| 26 to 34 Years | 533 (69.7%) | 232 (30.3%) |
| 35 to 44 Years | 527 (63.0%) | 310 (37.0%) |
| 45 to 54 Years | 757 (83.6%) | 149 (16.5%) |
| 55 to 64 Years | 782 (78.4%) | 216 (21.6%) |
| 65 to 74 Years | 799 (100.0%) | 0 (0.0%) |
| 75 Years and older | 607 (100.0%) | 0 (0.0%) |
| Total | 6,150 (81.4%) | 1,409 (18.6%) |
Health Insurance Coverage by Citizenship Status in Jack County
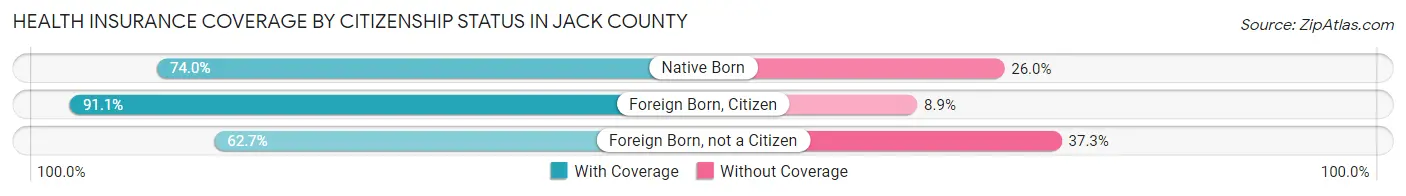
| Citizenship Status | With Coverage | Without Coverage |
| Native Born | 409 (74.0%) | 144 (26.0%) |
| Foreign Born, Citizen | 1,358 (91.1%) | 133 (8.9%) |
| Foreign Born, not a Citizen | 378 (62.7%) | 225 (37.3%) |
Health Insurance Coverage by Household Income in Jack County
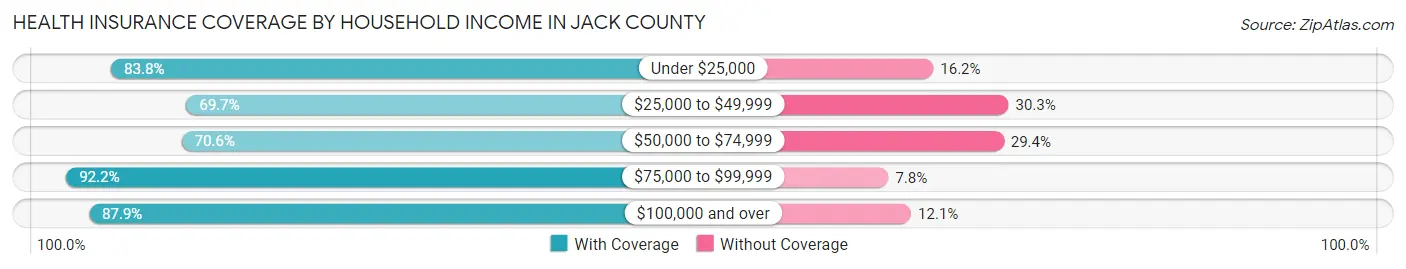
| Household Income | With Coverage | Without Coverage |
| Under $25,000 | 1,136 (83.8%) | 220 (16.2%) |
| $25,000 to $49,999 | 964 (69.7%) | 419 (30.3%) |
| $50,000 to $74,999 | 965 (70.6%) | 402 (29.4%) |
| $75,000 to $99,999 | 1,051 (92.2%) | 89 (7.8%) |
| $100,000 and over | 2,034 (87.9%) | 279 (12.1%) |
Public vs Private Health Insurance Coverage by Age in Jack County
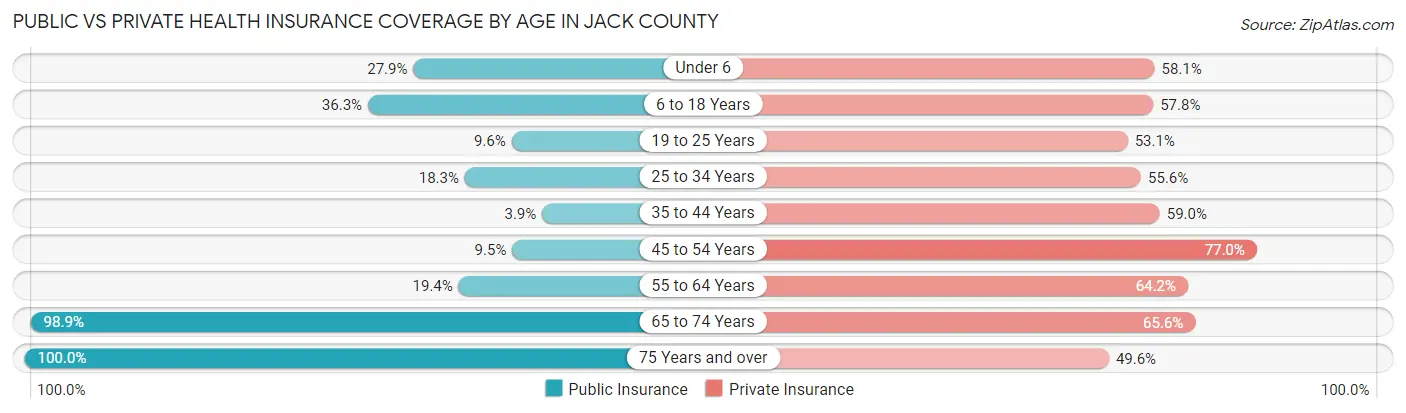
| Age Bracket | Public Insurance | Private Insurance |
| Under 6 | 154 (27.9%) | 321 (58.1%) |
| 6 to 18 Years | 541 (36.3%) | 862 (57.8%) |
| 19 to 25 Years | 58 (9.6%) | 320 (53.1%) |
| 25 to 34 Years | 140 (18.3%) | 425 (55.6%) |
| 35 to 44 Years | 33 (3.9%) | 494 (59.0%) |
| 45 to 54 Years | 86 (9.5%) | 698 (77.0%) |
| 55 to 64 Years | 194 (19.4%) | 641 (64.2%) |
| 65 to 74 Years | 790 (98.9%) | 524 (65.6%) |
| 75 Years and over | 607 (100.0%) | 301 (49.6%) |
| Total | 2,603 (34.4%) | 4,586 (60.7%) |
Disability Status by Sex by Age in Jack County
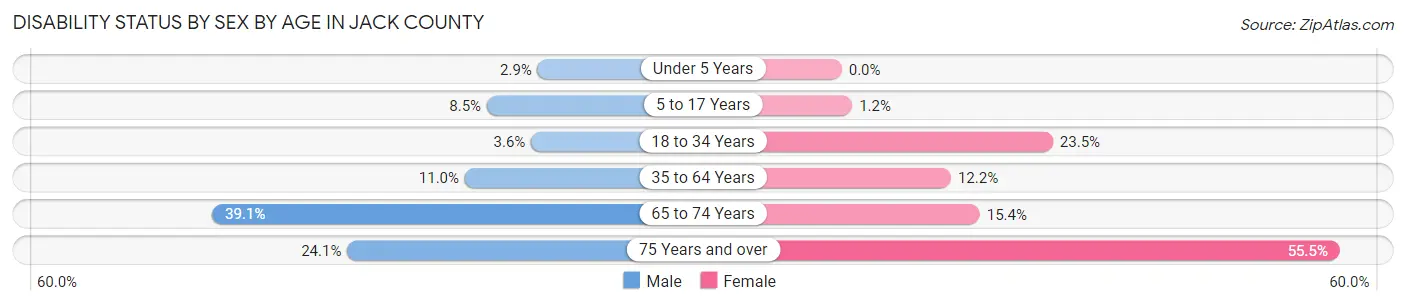
| Age Bracket | Male | Female |
| Under 5 Years | 8 (2.9%) | 0 (0.0%) |
| 5 to 17 Years | 57 (8.5%) | 9 (1.2%) |
| 18 to 34 Years | 29 (3.6%) | 170 (23.5%) |
| 35 to 64 Years | 151 (11.0%) | 166 (12.2%) |
| 65 to 74 Years | 142 (39.1%) | 67 (15.4%) |
| 75 Years and over | 71 (24.1%) | 173 (55.4%) |
Disability Class by Sex by Age in Jack County
Disability Class: Hearing Difficulty
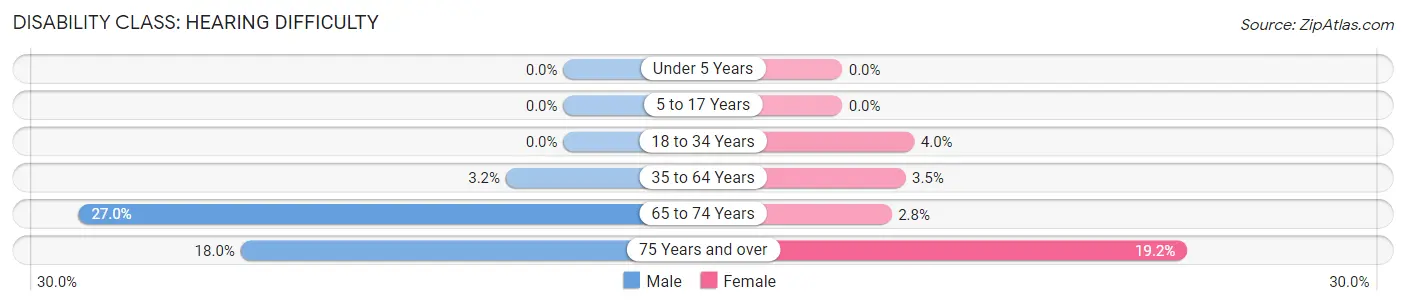
| Age Bracket | Male | Female |
| Under 5 Years | 0 (0.0%) | 0 (0.0%) |
| 5 to 17 Years | 0 (0.0%) | 0 (0.0%) |
| 18 to 34 Years | 0 (0.0%) | 29 (4.0%) |
| 35 to 64 Years | 44 (3.2%) | 48 (3.5%) |
| 65 to 74 Years | 98 (27.0%) | 12 (2.8%) |
| 75 Years and over | 53 (18.0%) | 60 (19.2%) |
Disability Class: Vision Difficulty
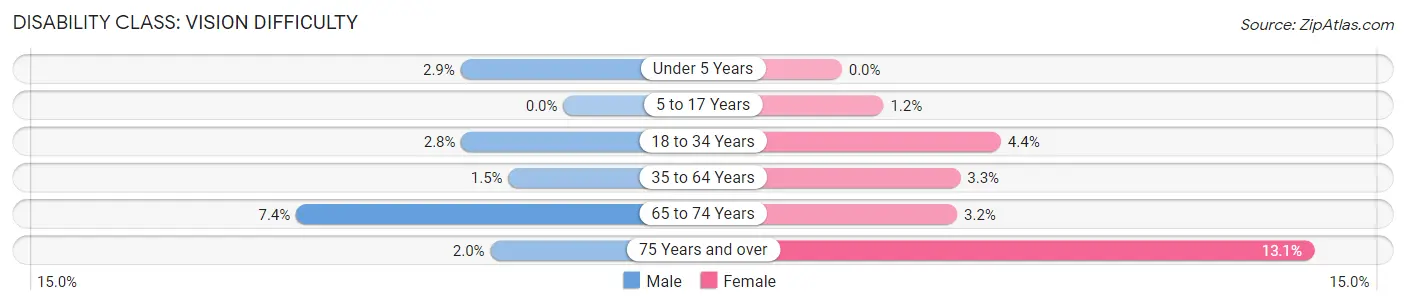
| Age Bracket | Male | Female |
| Under 5 Years | 8 (2.9%) | 0 (0.0%) |
| 5 to 17 Years | 0 (0.0%) | 9 (1.2%) |
| 18 to 34 Years | 23 (2.8%) | 32 (4.4%) |
| 35 to 64 Years | 21 (1.5%) | 45 (3.3%) |
| 65 to 74 Years | 27 (7.4%) | 14 (3.2%) |
| 75 Years and over | 6 (2.0%) | 41 (13.1%) |
Disability Class: Cognitive Difficulty
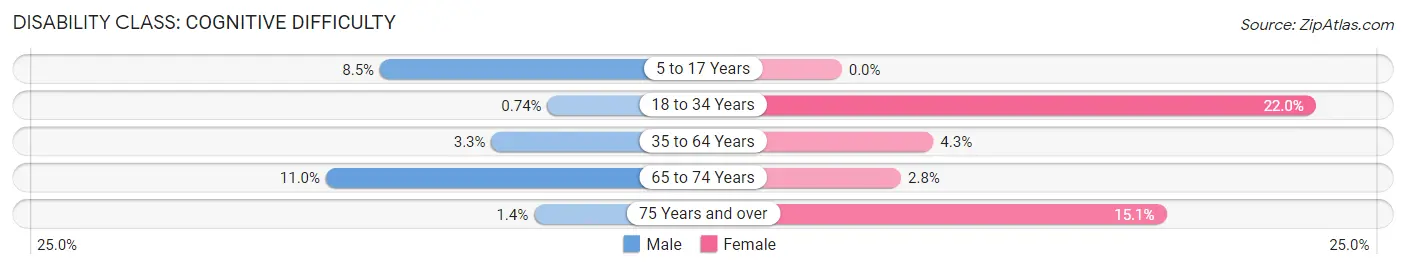
| Age Bracket | Male | Female |
| 5 to 17 Years | 57 (8.5%) | 0 (0.0%) |
| 18 to 34 Years | 6 (0.7%) | 159 (22.0%) |
| 35 to 64 Years | 46 (3.3%) | 58 (4.3%) |
| 65 to 74 Years | 40 (11.0%) | 12 (2.8%) |
| 75 Years and over | 4 (1.4%) | 47 (15.1%) |
Disability Class: Ambulatory Difficulty
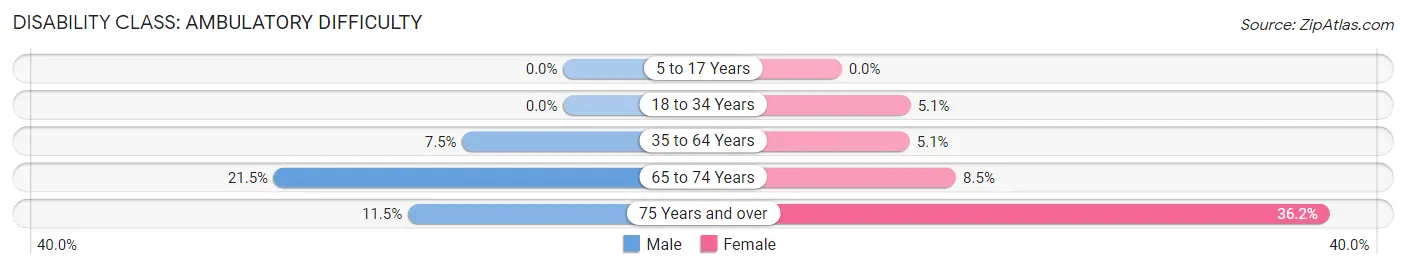
| Age Bracket | Male | Female |
| 5 to 17 Years | 0 (0.0%) | 0 (0.0%) |
| 18 to 34 Years | 0 (0.0%) | 37 (5.1%) |
| 35 to 64 Years | 103 (7.5%) | 69 (5.1%) |
| 65 to 74 Years | 78 (21.5%) | 37 (8.5%) |
| 75 Years and over | 34 (11.5%) | 113 (36.2%) |
Disability Class: Self-Care Difficulty
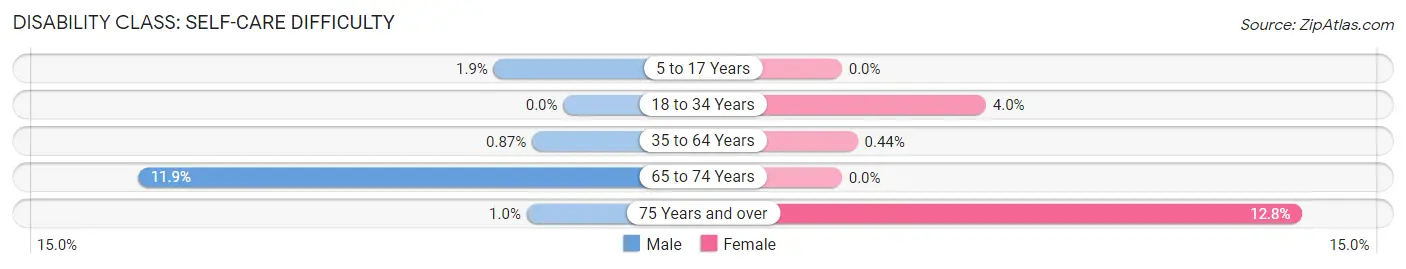
| Age Bracket | Male | Female |
| 5 to 17 Years | 13 (1.9%) | 0 (0.0%) |
| 18 to 34 Years | 0 (0.0%) | 29 (4.0%) |
| 35 to 64 Years | 12 (0.9%) | 6 (0.4%) |
| 65 to 74 Years | 43 (11.8%) | 0 (0.0%) |
| 75 Years and over | 3 (1.0%) | 40 (12.8%) |
Technology Access in Jack County
Computing Device Access in Jack County
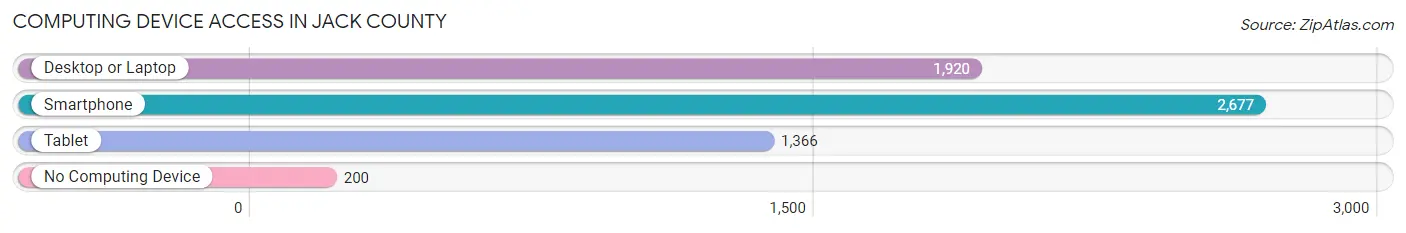
| Device Type | # Households | % Households |
| Desktop or Laptop | 1,920 | 64.1% |
| Smartphone | 2,677 | 89.3% |
| Tablet | 1,366 | 45.6% |
| No Computing Device | 200 | 6.7% |
| Total | 2,997 | 100.0% |
Internet Access in Jack County
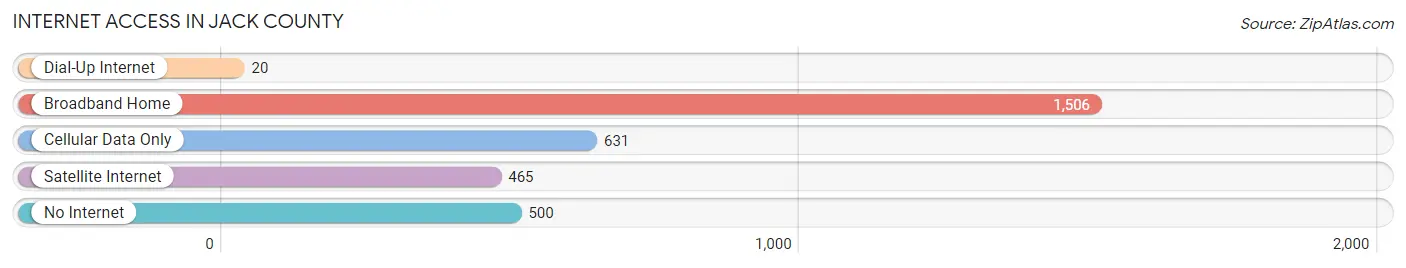
| Internet Type | # Households | % Households |
| Dial-Up Internet | 20 | 0.7% |
| Broadband Home | 1,506 | 50.2% |
| Cellular Data Only | 631 | 21.0% |
| Satellite Internet | 465 | 15.5% |
| No Internet | 500 | 16.7% |
| Total | 2,997 | 100.0% |
Jack County Summary
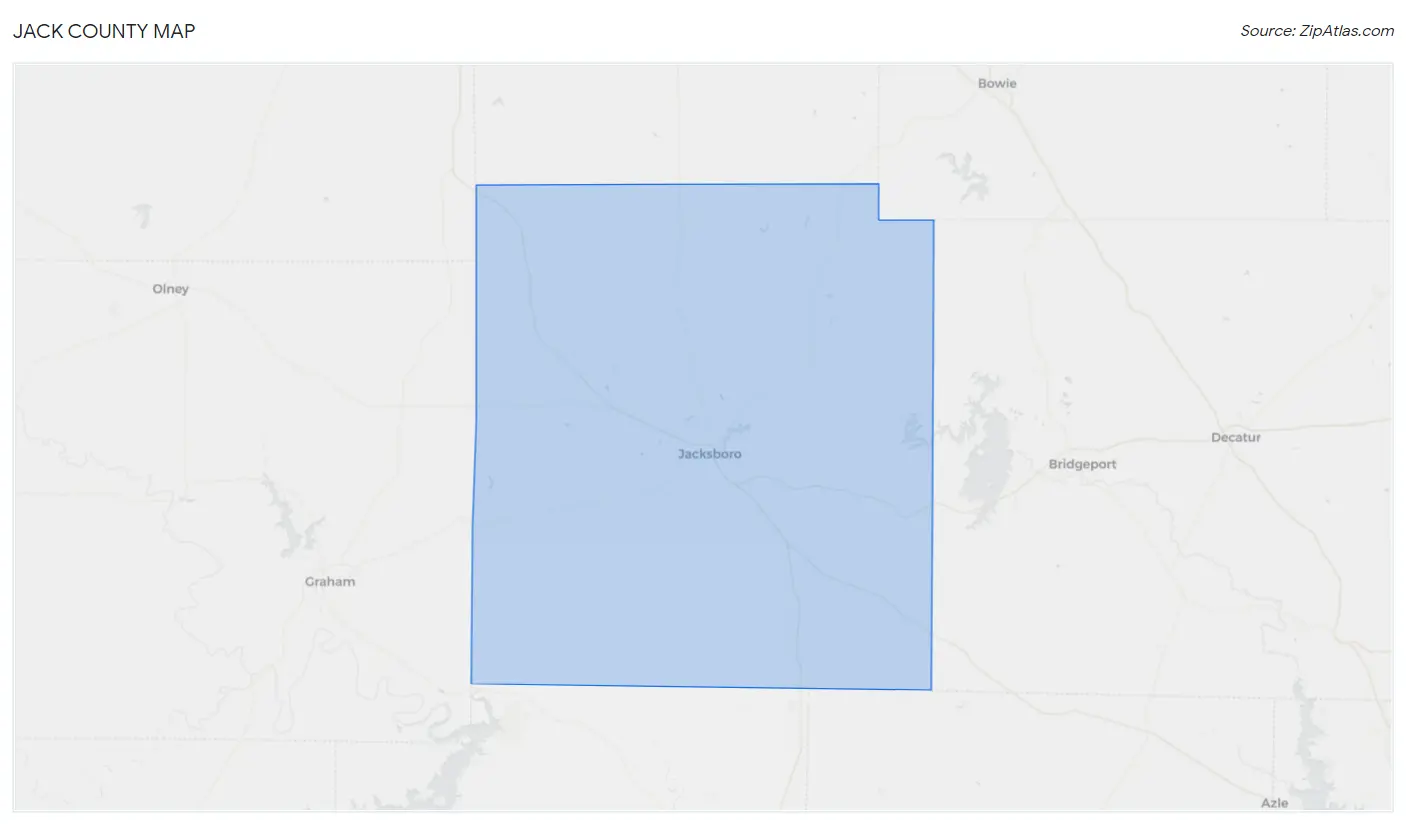
Jack County is located in the north-central region of Texas, and is part of the Wichita Falls Metropolitan Statistical Area. The county is bordered by Montague County to the north, Wise County to the east, Parker County to the south, and Young County to the west. The county seat is Jacksboro, and the county has a total area of 890 square miles.
History
Jack County was established in 1856 and was named after Patrick Jack, a signer of the Texas Declaration of Independence. The county was originally part of the Peters Colony, a land grant given to settlers by the Republic of Texas. The first settlers in the area were mostly farmers and ranchers, and the county quickly became known for its cattle and sheep production.
In the late 19th century, the county experienced a period of growth and development. The Fort Richardson military post was established in 1867, and the town of Jacksboro was founded in 1876. The county also saw the construction of several railroads, including the Texas and Pacific Railway, which connected Jacksboro to Fort Worth.
Geography
Jack County is located in the north-central region of Texas, and is part of the Wichita Falls Metropolitan Statistical Area. The county is bordered by Montague County to the north, Wise County to the east, Parker County to the south, and Young County to the west. The county has a total area of 890 square miles, and is mostly flat with rolling hills. The county is home to several bodies of water, including Lake Jacksboro, Lake Bridgeport, and Lake Amon G. Carter.
Economy
The economy of Jack County is largely based on agriculture and ranching. The county is home to several large ranches, and is known for its cattle and sheep production. The county also has a strong oil and gas industry, and is home to several oil and gas companies.
In addition to agriculture and ranching, Jack County also has a strong manufacturing sector. The county is home to several manufacturing companies, including a large paper mill and a large furniture factory. The county also has a strong tourism industry, and is home to several popular attractions, including the Fort Richardson State Park and the Jacksboro Historic District.
Demographics
As of the 2010 census, Jack County had a population of 8,936. The racial makeup of the county was 84.3% White, 8.2% Black or African American, 0.7% Native American, 0.3% Asian, and 4.5% from other races. Hispanic or Latino of any race were 11.3% of the population.
The median income for a household in the county was $37,945, and the median income for a family was $45,938. The per capita income for the county was $19,845. About 14.2% of families and 17.7% of the population were below the poverty line, including 24.2% of those under age 18 and 11.2% of those age 65 or over.
Common Questions
What is Per Capita Income in Jack County?
Per Capita income in Jack County is $28,626.
What is the Median Family Income in Jack County?
Median Family Income in Jack County is $72,096.
What is the Median Household income in Jack County?
Median Household Income in Jack County is $58,861.
What is Income or Wage Gap in Jack County?
Income or Wage Gap in Jack County is 30.7%.
Women in Jack County earn 69.3 cents for every dollar earned by a man.
What is Inequality or Gini Index in Jack County?
Inequality or Gini Index in Jack County is 0.48.
What is the Total Population of Jack County?
Total Population of Jack County is 8,588.
What is the Total Male Population of Jack County?
Total Male Population of Jack County is 4,774.
What is the Total Female Population of Jack County?
Total Female Population of Jack County is 3,814.
What is the Ratio of Males per 100 Females in Jack County?
There are 125.17 Males per 100 Females in Jack County.
What is the Ratio of Females per 100 Males in Jack County?
There are 79.89 Females per 100 Males in Jack County.
What is the Median Population Age in Jack County?
Median Population Age in Jack County is 39.2 Years.
What is the Average Family Size in Jack County
Average Family Size in Jack County is 3.1 People.
What is the Average Household Size in Jack County
Average Household Size in Jack County is 2.5 People.
How Large is the Labor Force in Jack County?
There are 3,366 People in the Labor Forcein in Jack County.
What is the Percentage of People in the Labor Force in Jack County?
48.7% of People are in the Labor Force in Jack County.
What is the Unemployment Rate in Jack County?
Unemployment Rate in Jack County is 8.2%.