Irion County, TX Map & Demographics
Irion County Map
Irion County Overview
$29,664
PER CAPITA INCOME
$74,844
AVG FAMILY INCOME
$54,708
AVG HOUSEHOLD INCOME
46.9%
WAGE / INCOME GAP [ % ]
53.1¢/ $1
WAGE / INCOME GAP [ $ ]
0.39
INEQUALITY / GINI INDEX
1,561
TOTAL POPULATION
748
MALE POPULATION
813
FEMALE POPULATION
92.00
MALES / 100 FEMALES
108.69
FEMALES / 100 MALES
39.5
MEDIAN AGE
3.3
AVG FAMILY SIZE
2.4
AVG HOUSEHOLD SIZE
721
LABOR FORCE [ PEOPLE ]
61.3%
PERCENT IN LABOR FORCE
1.3%
UNEMPLOYMENT RATE
Irion County Area Codes
Income in Irion County
Income Overview in Irion County
Per Capita Income in Irion County is $29,664, while median incomes of families and households are $74,844 and $54,708 respectively.
| Characteristic | Number | Measure |
| Per Capita Income | 1,561 | $29,664 |
| Median Family Income | 396 | $74,844 |
| Mean Family Income | 396 | $84,691 |
| Median Household Income | 647 | $54,708 |
| Mean Household Income | 647 | $68,513 |
| Income Deficit | 396 | $0 |
| Wage / Income Gap (%) | 1,561 | 46.94% |
| Wage / Income Gap ($) | 1,561 | 53.06¢ per $1 |
| Gini / Inequality Index | 1,561 | 0.39 |
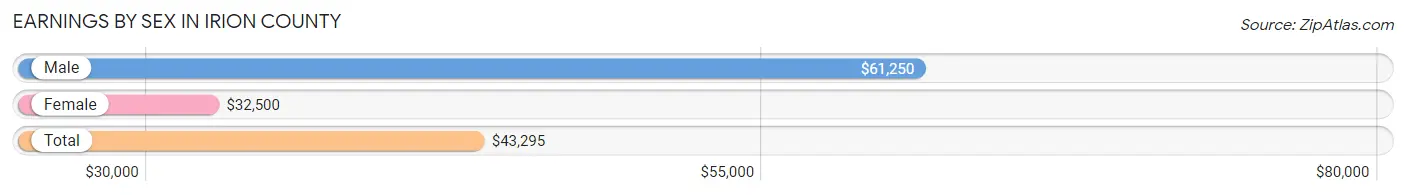
Earnings by Sex in Irion County
Average Earnings in Irion County are $43,295, $61,250 for men and $32,500 for women, a difference of 46.9%.
| Sex | Number | Average Earnings |
| Male | 401 (52.4%) | $61,250 |
| Female | 364 (47.6%) | $32,500 |
| Total | 765 (100.0%) | $43,295 |
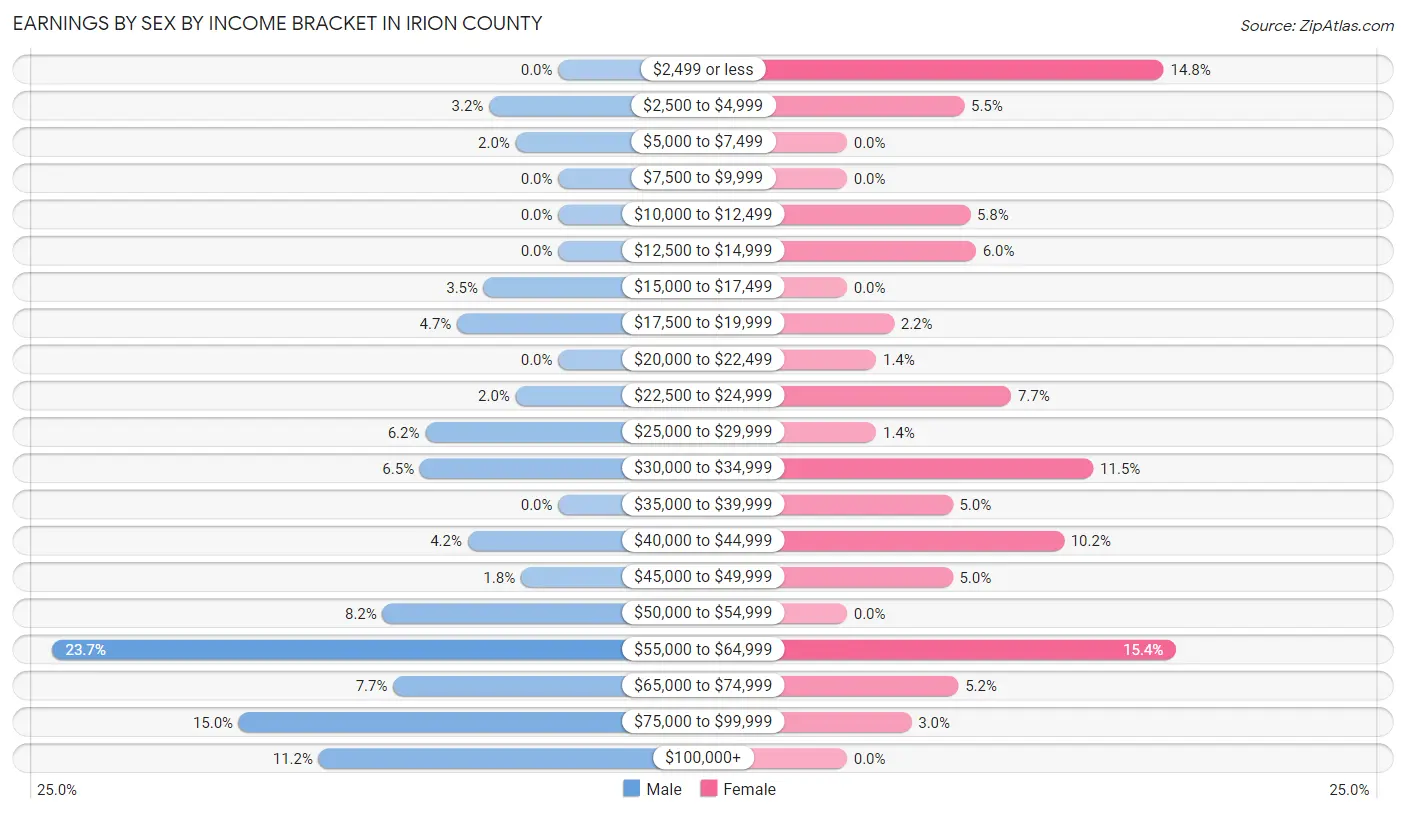
Earnings by Sex by Income Bracket in Irion County
The most common earnings brackets in Irion County are $55,000 to $64,999 for men (95 | 23.7%) and $55,000 to $64,999 for women (56 | 15.4%).
| Income | Male | Female |
| $2,499 or less | 0 (0.0%) | 54 (14.8%) |
| $2,500 to $4,999 | 13 (3.2%) | 20 (5.5%) |
| $5,000 to $7,499 | 8 (2.0%) | 0 (0.0%) |
| $7,500 to $9,999 | 0 (0.0%) | 0 (0.0%) |
| $10,000 to $12,499 | 0 (0.0%) | 21 (5.8%) |
| $12,500 to $14,999 | 0 (0.0%) | 22 (6.0%) |
| $15,000 to $17,499 | 14 (3.5%) | 0 (0.0%) |
| $17,500 to $19,999 | 19 (4.7%) | 8 (2.2%) |
| $20,000 to $22,499 | 0 (0.0%) | 5 (1.4%) |
| $22,500 to $24,999 | 8 (2.0%) | 28 (7.7%) |
| $25,000 to $29,999 | 25 (6.2%) | 5 (1.4%) |
| $30,000 to $34,999 | 26 (6.5%) | 42 (11.5%) |
| $35,000 to $39,999 | 0 (0.0%) | 18 (5.0%) |
| $40,000 to $44,999 | 17 (4.2%) | 37 (10.2%) |
| $45,000 to $49,999 | 7 (1.8%) | 18 (5.0%) |
| $50,000 to $54,999 | 33 (8.2%) | 0 (0.0%) |
| $55,000 to $64,999 | 95 (23.7%) | 56 (15.4%) |
| $65,000 to $74,999 | 31 (7.7%) | 19 (5.2%) |
| $75,000 to $99,999 | 60 (15.0%) | 11 (3.0%) |
| $100,000+ | 45 (11.2%) | 0 (0.0%) |
| Total | 401 (100.0%) | 364 (100.0%) |
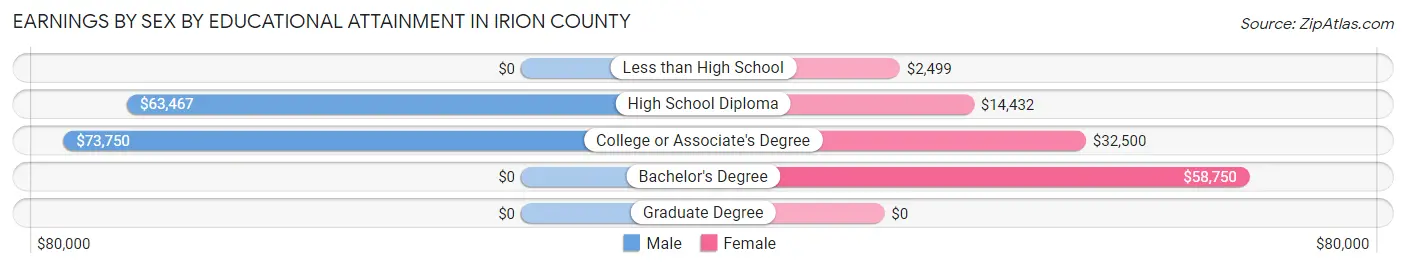
Earnings by Sex by Educational Attainment in Irion County
Average earnings in Irion County are $61,250 for men and $31,908 for women, a difference of 47.9%. Men with an educational attainment of college or associate's degree enjoy the highest average annual earnings of $73,750, while those with high school diploma education earn the least with $63,467. Women with an educational attainment of bachelor's degree earn the most with the average annual earnings of $58,750, while those with less than high school education have the smallest earnings of $2,499.
| Educational Attainment | Male Income | Female Income |
| Less than High School | - | - |
| High School Diploma | $63,467 | $14,432 |
| College or Associate's Degree | $73,750 | $32,500 |
| Bachelor's Degree | - | - |
| Graduate Degree | - | - |
| Total | $61,250 | $31,908 |
Family Income in Irion County
Family Income Brackets in Irion County
According to the Irion County family income data, there are 98 families falling into the $75,000 to $99,999 income range, which is the most common income bracket and makes up 24.7% of all families.
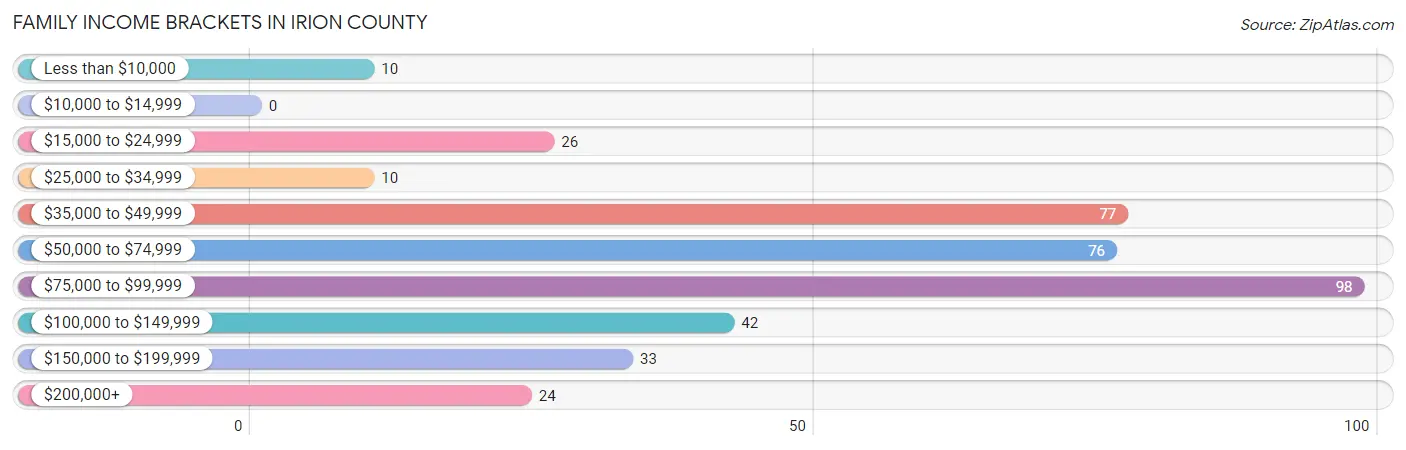
| Income Bracket | # Families | % Families |
| Less than $10,000 | 10 | 2.5% |
| $10,000 to $14,999 | 0 | 0.0% |
| $15,000 to $24,999 | 26 | 6.6% |
| $25,000 to $34,999 | 10 | 2.5% |
| $35,000 to $49,999 | 77 | 19.4% |
| $50,000 to $74,999 | 76 | 19.2% |
| $75,000 to $99,999 | 98 | 24.7% |
| $100,000 to $149,999 | 42 | 10.6% |
| $150,000 to $199,999 | 33 | 8.3% |
| $200,000+ | 24 | 6.1% |
Family Income by Famaliy Size in Irion County
4-person families (52 | 13.1%) account for the highest median family income in Irion County with $128,152 per family, while 4-person families (52 | 13.1%) have the highest median income of $32,038 per family member.
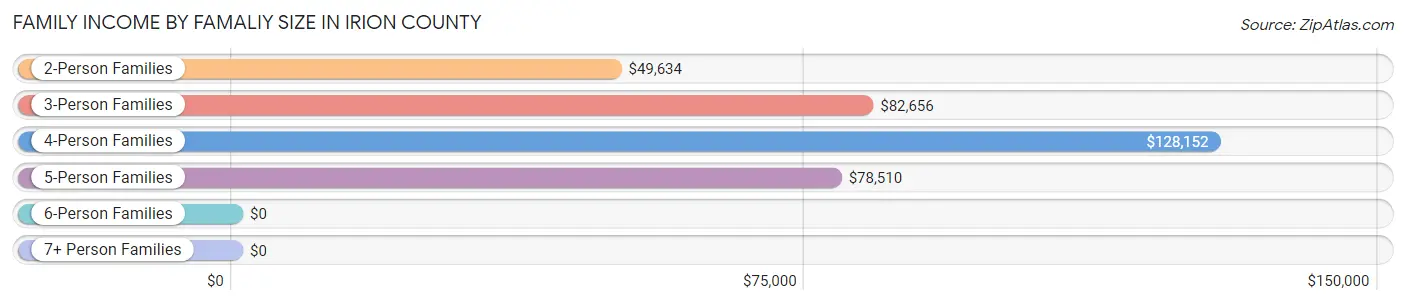
| Income Bracket | # Families | Median Income |
| 2-Person Families | 222 (56.1%) | $49,634 |
| 3-Person Families | 53 (13.4%) | $82,656 |
| 4-Person Families | 52 (13.1%) | $128,152 |
| 5-Person Families | 41 (10.3%) | $78,510 |
| 6-Person Families | 22 (5.6%) | $0 |
| 7+ Person Families | 6 (1.5%) | $0 |
| Total | 396 (100.0%) | $74,844 |
Family Income by Number of Earners in Irion County
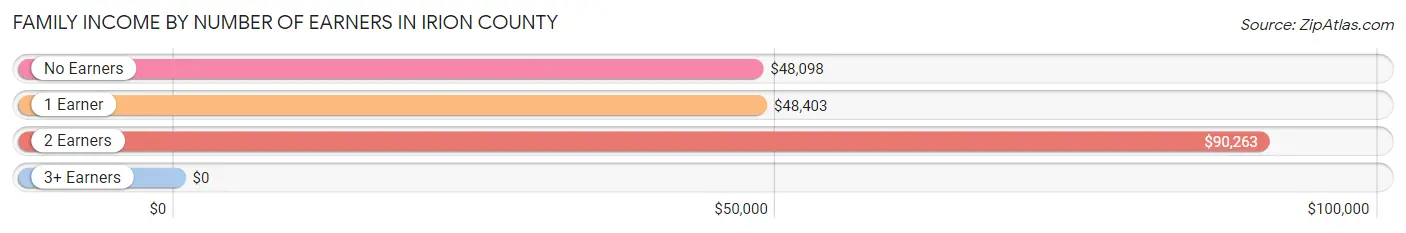
| Number of Earners | # Families | Median Income |
| No Earners | 83 (21.0%) | $48,098 |
| 1 Earner | 97 (24.5%) | $48,403 |
| 2 Earners | 210 (53.0%) | $90,263 |
| 3+ Earners | 6 (1.5%) | $0 |
| Total | 396 (100.0%) | $74,844 |
Household Income in Irion County
Household Income Brackets in Irion County
With 141 households falling in the category, the $50,000 to $74,999 income range is the most frequent in Irion County, accounting for 21.8% of all households. In contrast, only 9 households (1.4%) fall into the $10,000 to $14,999 income bracket, making it the least populous group.
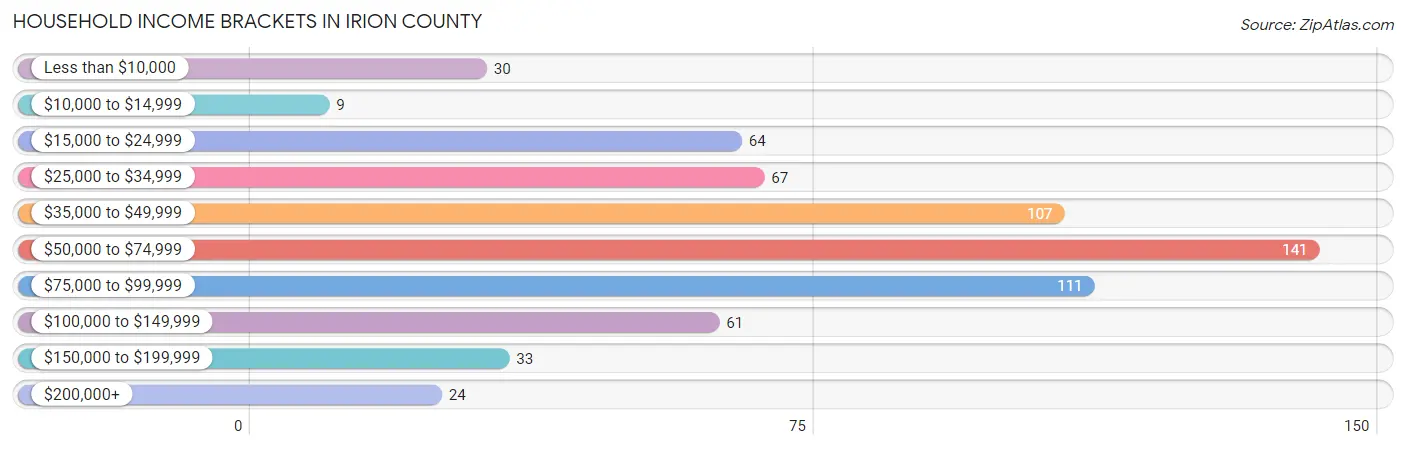
| Income Bracket | # Households | % Households |
| Less than $10,000 | 30 | 4.6% |
| $10,000 to $14,999 | 9 | 1.4% |
| $15,000 to $24,999 | 64 | 9.9% |
| $25,000 to $34,999 | 67 | 10.4% |
| $35,000 to $49,999 | 107 | 16.5% |
| $50,000 to $74,999 | 141 | 21.8% |
| $75,000 to $99,999 | 111 | 17.2% |
| $100,000 to $149,999 | 61 | 9.4% |
| $150,000 to $199,999 | 33 | 5.1% |
| $200,000+ | 24 | 3.7% |
Household Income by Householder Age in Irion County
The median household income in Irion County is $54,708, with the highest median household income of $79,952 found in the 25 to 44 years age bracket for the primary householder. A total of 187 households (28.9%) fall into this category. Meanwhile, the 15 to 24 years age bracket for the primary householder has the lowest median household income of $0, with 9 households (1.4%) in this group.
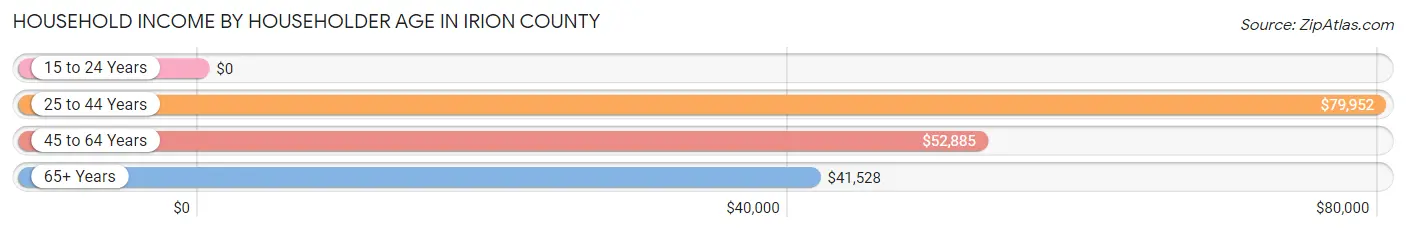
| Income Bracket | # Households | Median Income |
| 15 to 24 Years | 9 (1.4%) | $0 |
| 25 to 44 Years | 187 (28.9%) | $79,952 |
| 45 to 64 Years | 250 (38.6%) | $52,885 |
| 65+ Years | 201 (31.1%) | $41,528 |
| Total | 647 (100.0%) | $54,708 |
Poverty in Irion County
Income Below Poverty by Sex and Age in Irion County
With 6.8% poverty level for males and 8.0% for females among the residents of Irion County, 75 year old and over males and 45 to 54 year old females are the most vulnerable to poverty, with 9 males (34.6%) and 20 females (29.4%) in their respective age groups living below the poverty level.
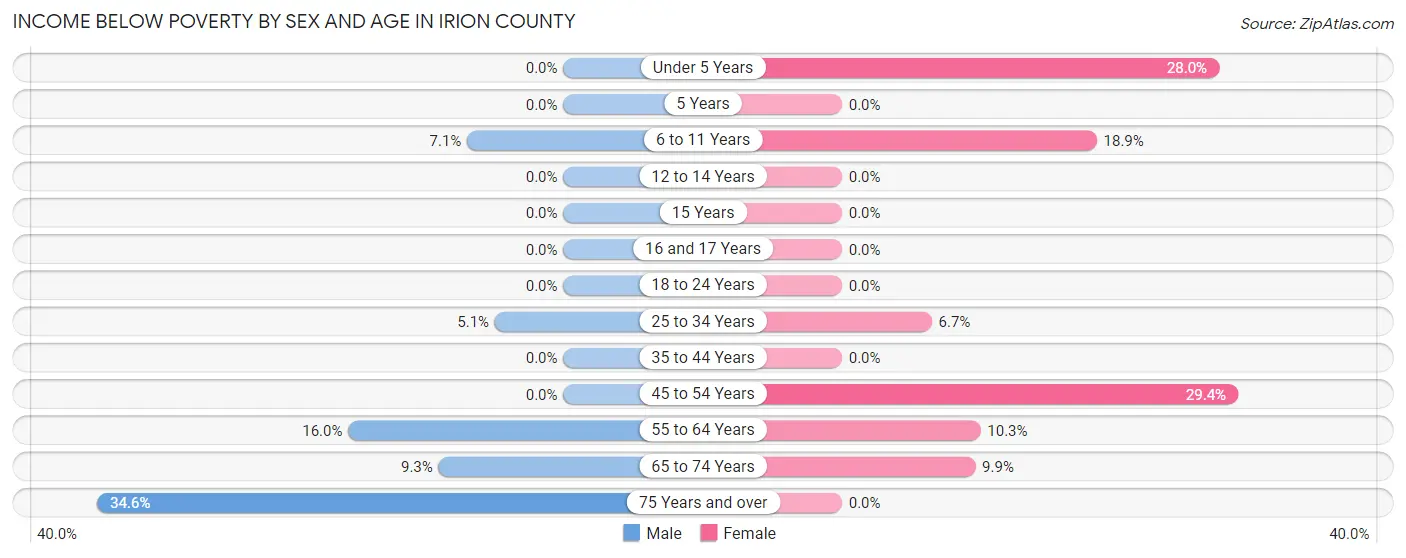
| Age Bracket | Male | Female |
| Under 5 Years | 0 (0.0%) | 7 (28.0%) |
| 5 Years | 0 (0.0%) | 0 (0.0%) |
| 6 to 11 Years | 7 (7.1%) | 7 (18.9%) |
| 12 to 14 Years | 0 (0.0%) | 0 (0.0%) |
| 15 Years | 0 (0.0%) | 0 (0.0%) |
| 16 and 17 Years | 0 (0.0%) | 0 (0.0%) |
| 18 to 24 Years | 0 (0.0%) | 0 (0.0%) |
| 25 to 34 Years | 6 (5.1%) | 7 (6.7%) |
| 35 to 44 Years | 0 (0.0%) | 0 (0.0%) |
| 45 to 54 Years | 0 (0.0%) | 20 (29.4%) |
| 55 to 64 Years | 19 (16.0%) | 14 (10.3%) |
| 65 to 74 Years | 10 (9.3%) | 10 (9.9%) |
| 75 Years and over | 9 (34.6%) | 0 (0.0%) |
| Total | 51 (6.8%) | 65 (8.0%) |
Income Above Poverty by Sex and Age in Irion County
According to the poverty statistics in Irion County, males aged under 5 years and females aged 5 years are the age groups that are most secure financially, with 100.0% of males and 100.0% of females in these age groups living above the poverty line.
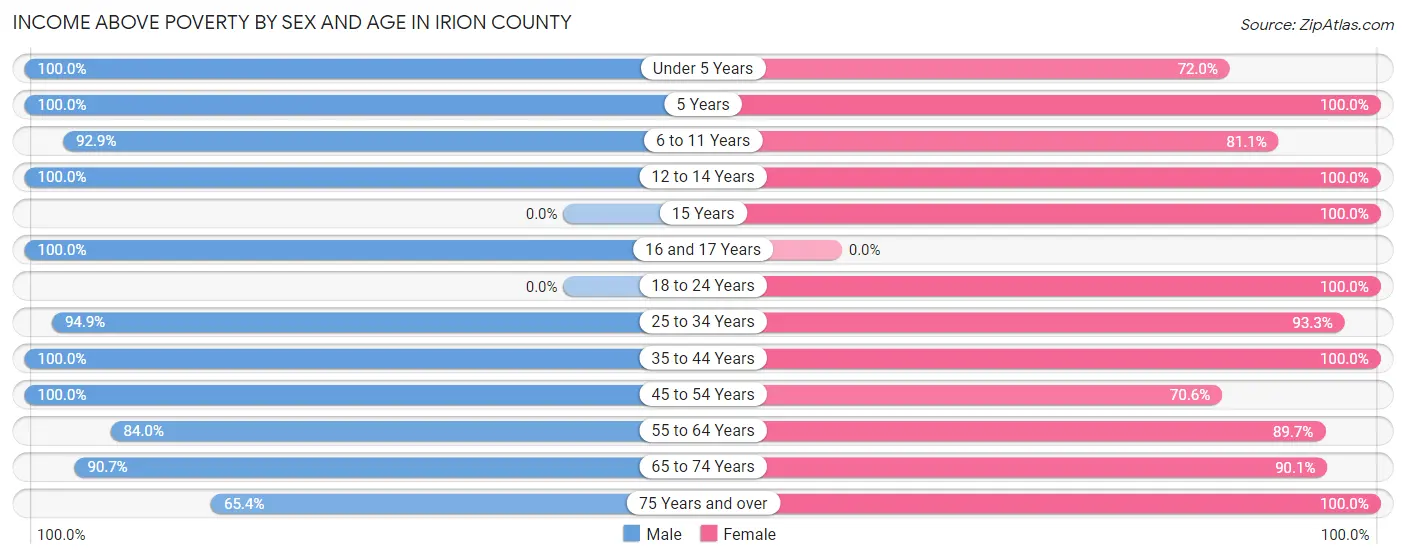
| Age Bracket | Male | Female |
| Under 5 Years | 21 (100.0%) | 18 (72.0%) |
| 5 Years | 13 (100.0%) | 52 (100.0%) |
| 6 to 11 Years | 91 (92.9%) | 30 (81.1%) |
| 12 to 14 Years | 50 (100.0%) | 69 (100.0%) |
| 15 Years | 0 (0.0%) | 20 (100.0%) |
| 16 and 17 Years | 16 (100.0%) | 0 (0.0%) |
| 18 to 24 Years | 0 (0.0%) | 33 (100.0%) |
| 25 to 34 Years | 112 (94.9%) | 98 (93.3%) |
| 35 to 44 Years | 82 (100.0%) | 99 (100.0%) |
| 45 to 54 Years | 97 (100.0%) | 48 (70.6%) |
| 55 to 64 Years | 100 (84.0%) | 122 (89.7%) |
| 65 to 74 Years | 98 (90.7%) | 91 (90.1%) |
| 75 Years and over | 17 (65.4%) | 68 (100.0%) |
| Total | 697 (93.2%) | 748 (92.0%) |
Income Below Poverty Among Married-Couple Families in Irion County
The poverty statistics for married-couple families in Irion County show that 5.1% or 16 of the total 315 families live below the poverty line. Families with 3 or 4 children have the highest poverty rate of 10.0%, comprising of 6 families. On the other hand, families with 1 or 2 children have the lowest poverty rate of 0.0%, which includes 0 families.
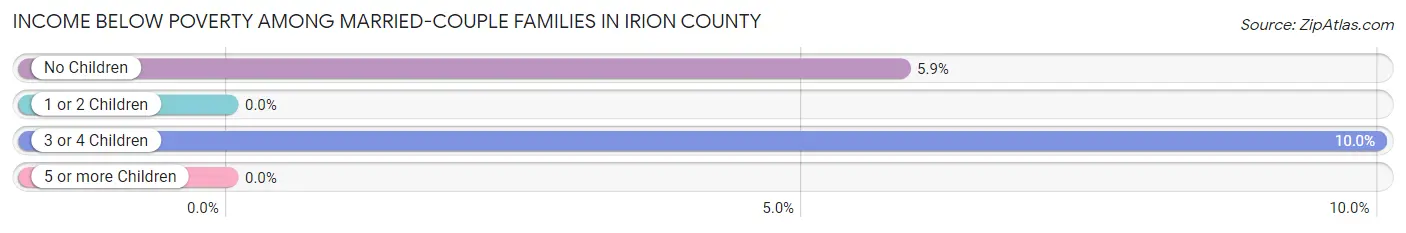
| Children | Above Poverty | Below Poverty |
| No Children | 161 (94.2%) | 10 (5.9%) |
| 1 or 2 Children | 84 (100.0%) | 0 (0.0%) |
| 3 or 4 Children | 54 (90.0%) | 6 (10.0%) |
| 5 or more Children | 0 (0.0%) | 0 (0.0%) |
| Total | 299 (94.9%) | 16 (5.1%) |
Income Below Poverty Among Single-Parent Households in Irion County
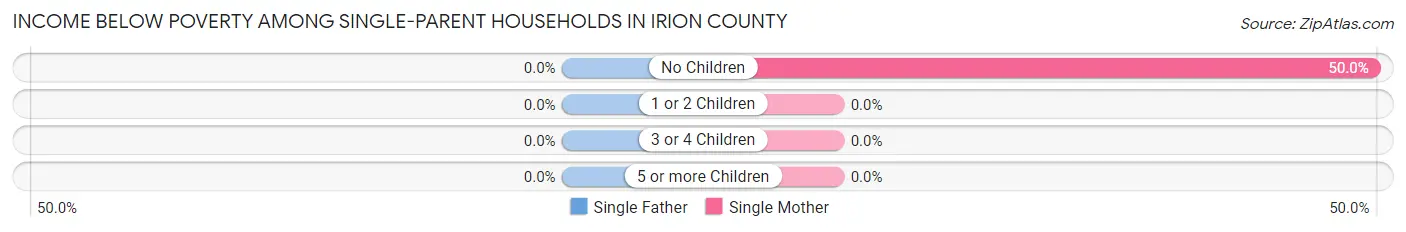
| Children | Single Father | Single Mother |
| No Children | 0 (0.0%) | 14 (50.0%) |
| 1 or 2 Children | 0 (0.0%) | 0 (0.0%) |
| 3 or 4 Children | 0 (0.0%) | 0 (0.0%) |
| 5 or more Children | 0 (0.0%) | 0 (0.0%) |
| Total | 0 (0.0%) | 14 (30.4%) |
Income Below Poverty Among Married-Couple vs Single-Parent Households in Irion County
The poverty data for Irion County shows that 16 of the married-couple family households (5.1%) and 14 of the single-parent households (17.3%) are living below the poverty level. Within the married-couple family households, those with 3 or 4 children have the highest poverty rate, with 6 households (10.0%) falling below the poverty line. Among the single-parent households, those with no children have the highest poverty rate, with 14 household (38.9%) living below poverty.
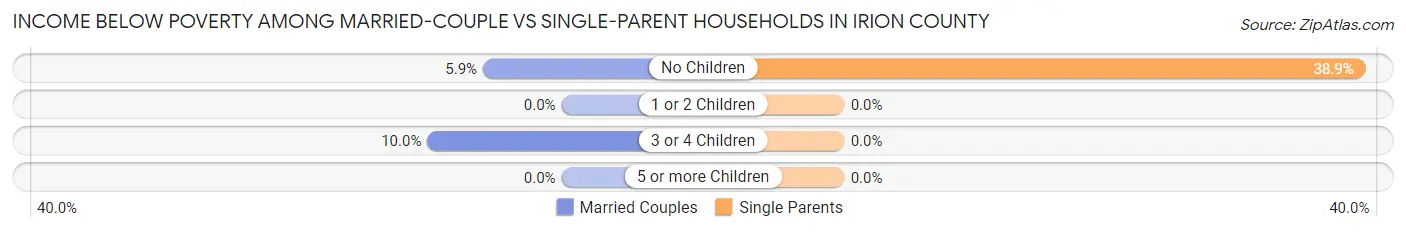
| Children | Married-Couple Families | Single-Parent Households |
| No Children | 10 (5.9%) | 14 (38.9%) |
| 1 or 2 Children | 0 (0.0%) | 0 (0.0%) |
| 3 or 4 Children | 6 (10.0%) | 0 (0.0%) |
| 5 or more Children | 0 (0.0%) | 0 (0.0%) |
| Total | 16 (5.1%) | 14 (17.3%) |
Race in Irion County
The most populous races in Irion County are White / Caucasian (1,143 | 73.2%), Hispanic or Latino (433 | 27.7%), and Some other Race (368 | 23.6%).
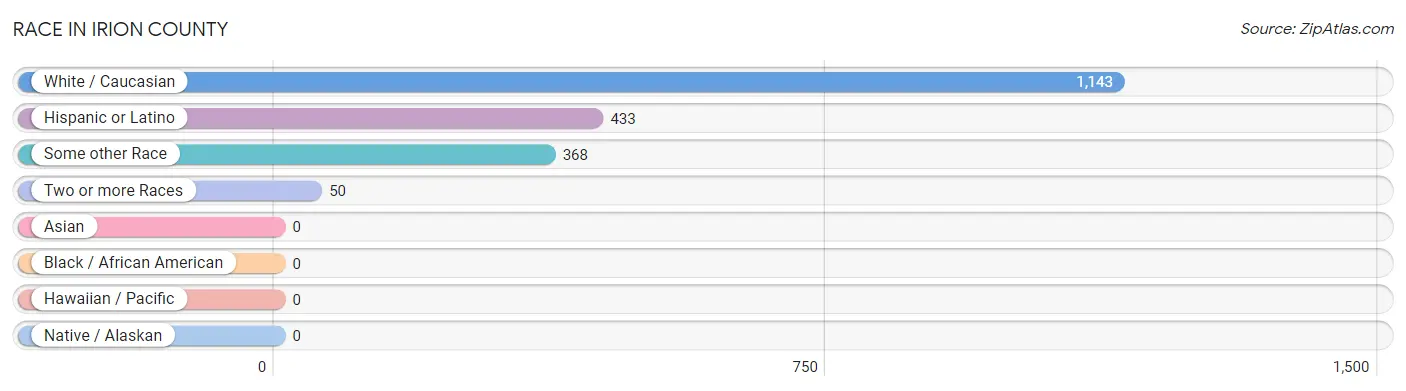
| Race | # Population | % Population |
| Asian | 0 | 0.0% |
| Black / African American | 0 | 0.0% |
| Hawaiian / Pacific | 0 | 0.0% |
| Hispanic or Latino | 433 | 27.7% |
| Native / Alaskan | 0 | 0.0% |
| White / Caucasian | 1,143 | 73.2% |
| Two or more Races | 50 | 3.2% |
| Some other Race | 368 | 23.6% |
| Total | 1,561 | 100.0% |
Ancestry in Irion County
The most populous ancestries reported in Irion County are Mexican (433 | 27.7%), English (302 | 19.4%), German (239 | 15.3%), Irish (94 | 6.0%), and Scottish (78 | 5.0%), together accounting for 73.4% of all Irion County residents.
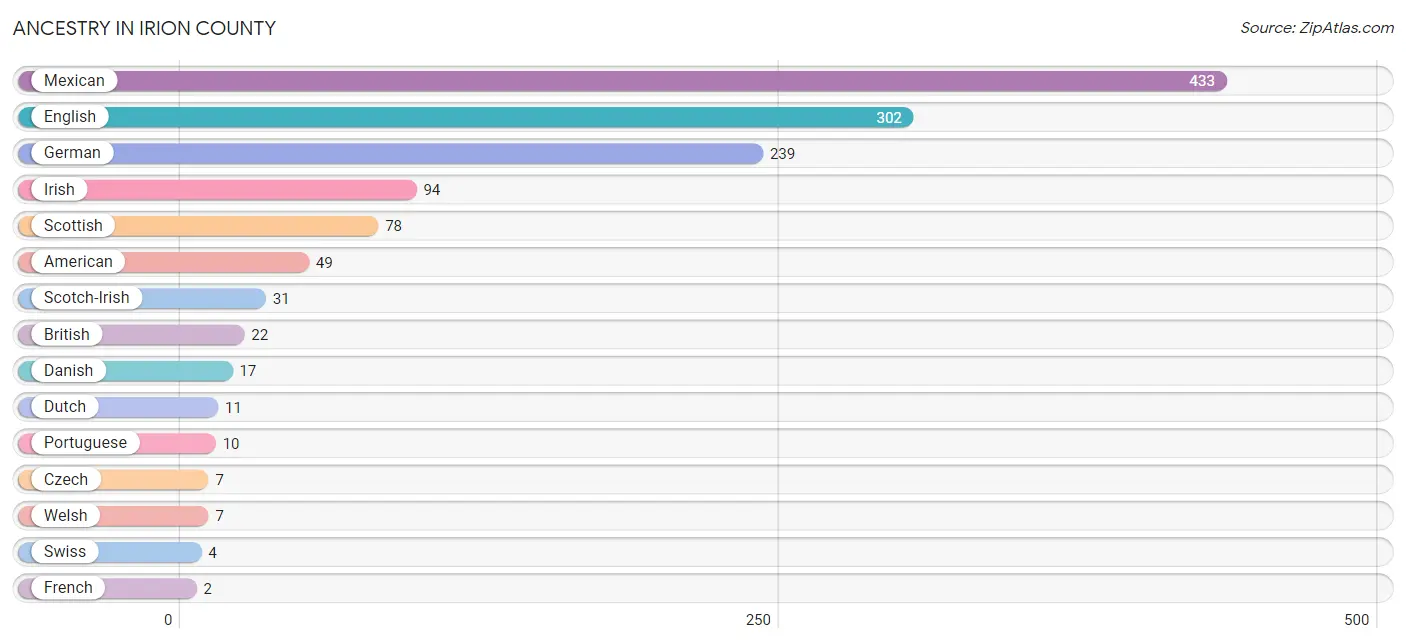
| Ancestry | # Population | % Population |
| American | 49 | 3.1% |
| British | 22 | 1.4% |
| Czech | 7 | 0.4% |
| Danish | 17 | 1.1% |
| Dutch | 11 | 0.7% |
| English | 302 | 19.4% |
| French | 2 | 0.1% |
| German | 239 | 15.3% |
| Irish | 94 | 6.0% |
| Italian | 1 | 0.1% |
| Mexican | 433 | 27.7% |
| Pennsylvania German | 1 | 0.1% |
| Portuguese | 10 | 0.6% |
| Scotch-Irish | 31 | 2.0% |
| Scottish | 78 | 5.0% |
| Swiss | 4 | 0.3% |
| Welsh | 7 | 0.4% | View All 17 Rows |
Immigrants in Irion County
The most numerous immigrant groups reported in Irion County came from Central America (60 | 3.8%), Latin America (60 | 3.8%), and Mexico (60 | 3.8%), together accounting for 11.5% of all Irion County residents.
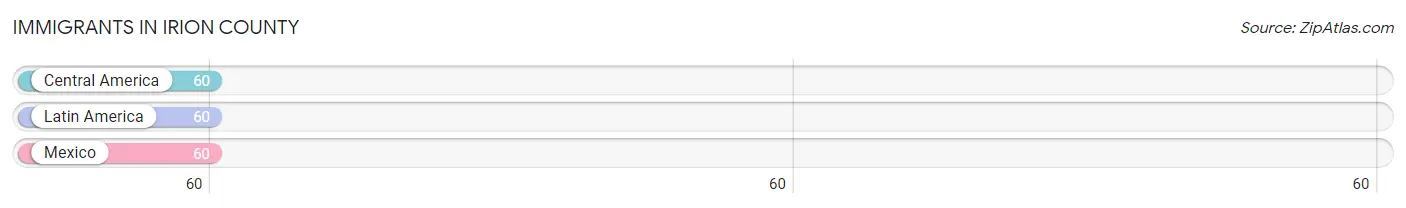
| Immigration Origin | # Population | % Population |
| Central America | 60 | 3.8% |
| Latin America | 60 | 3.8% |
| Mexico | 60 | 3.8% | View All 3 Rows |
Sex and Age in Irion County
Sex and Age in Irion County
The most populous age groups in Irion County are 10 to 14 Years (121 | 16.2%) for men and 10 to 14 Years (90 | 11.1%) for women.
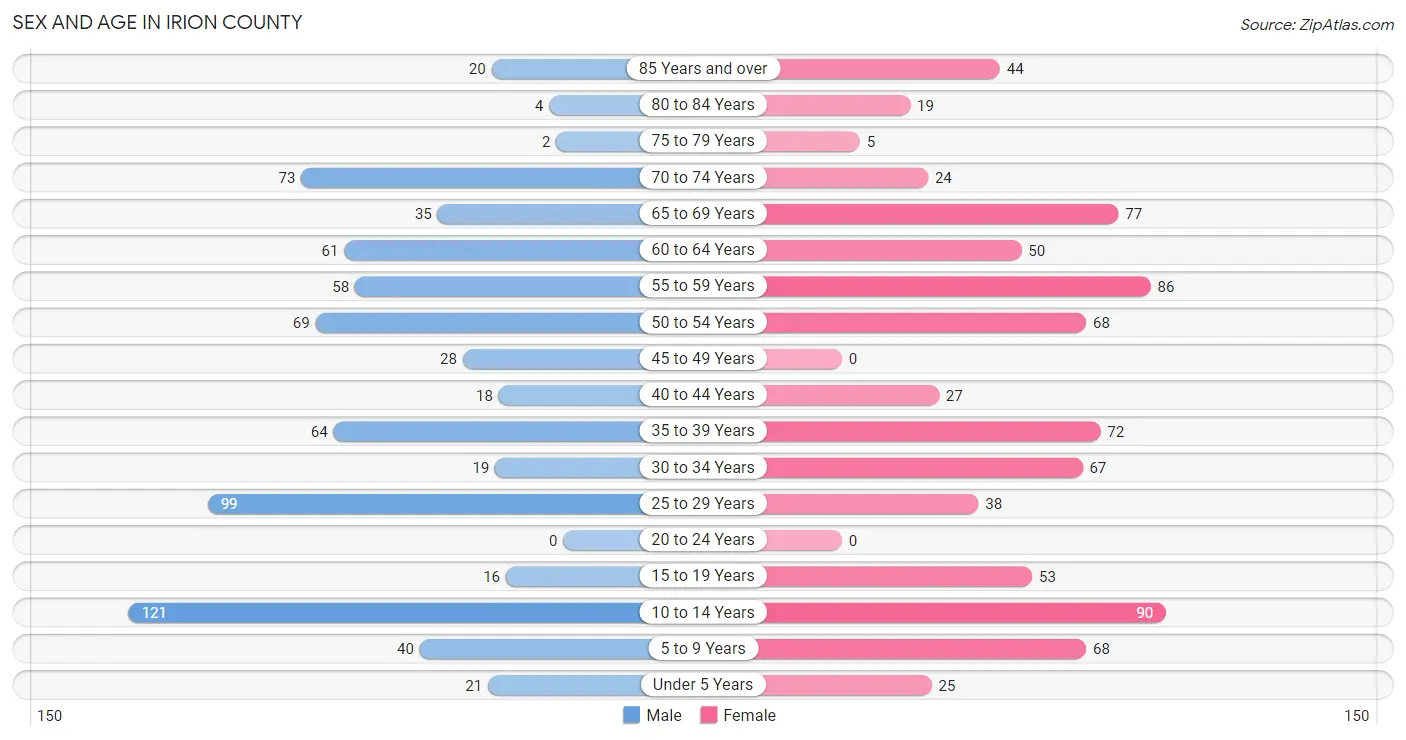
| Age Bracket | Male | Female |
| Under 5 Years | 21 (2.8%) | 25 (3.1%) |
| 5 to 9 Years | 40 (5.3%) | 68 (8.4%) |
| 10 to 14 Years | 121 (16.2%) | 90 (11.1%) |
| 15 to 19 Years | 16 (2.1%) | 53 (6.5%) |
| 20 to 24 Years | 0 (0.0%) | 0 (0.0%) |
| 25 to 29 Years | 99 (13.2%) | 38 (4.7%) |
| 30 to 34 Years | 19 (2.5%) | 67 (8.2%) |
| 35 to 39 Years | 64 (8.6%) | 72 (8.9%) |
| 40 to 44 Years | 18 (2.4%) | 27 (3.3%) |
| 45 to 49 Years | 28 (3.7%) | 0 (0.0%) |
| 50 to 54 Years | 69 (9.2%) | 68 (8.4%) |
| 55 to 59 Years | 58 (7.7%) | 86 (10.6%) |
| 60 to 64 Years | 61 (8.2%) | 50 (6.1%) |
| 65 to 69 Years | 35 (4.7%) | 77 (9.5%) |
| 70 to 74 Years | 73 (9.8%) | 24 (2.9%) |
| 75 to 79 Years | 2 (0.3%) | 5 (0.6%) |
| 80 to 84 Years | 4 (0.5%) | 19 (2.3%) |
| 85 Years and over | 20 (2.7%) | 44 (5.4%) |
| Total | 748 (100.0%) | 813 (100.0%) |
Families and Households in Irion County
Median Family Size in Irion County
The median family size in Irion County is 3.26 persons per family, with married-couple families (315 | 79.5%) accounting for the largest median family size of 3.46 persons per family. On the other hand, single female/mother families (46 | 11.6%) represent the smallest median family size with 2.48 persons per family.
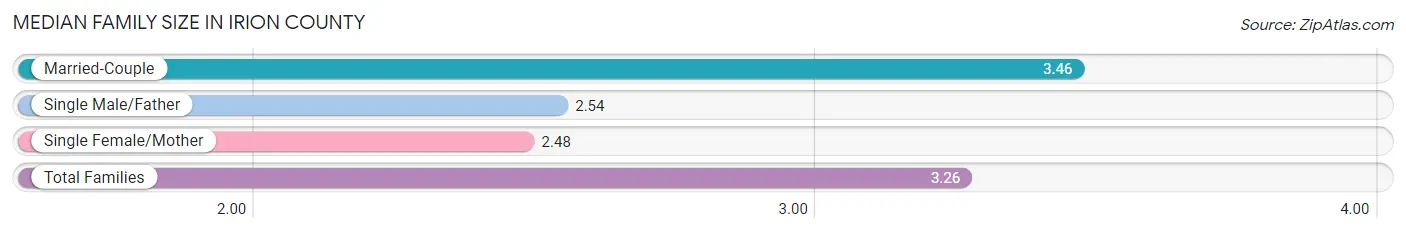
| Family Type | # Families | Family Size |
| Married-Couple | 315 (79.5%) | 3.46 |
| Single Male/Father | 35 (8.8%) | 2.54 |
| Single Female/Mother | 46 (11.6%) | 2.48 |
| Total Families | 396 (100.0%) | 3.26 |
Median Household Size in Irion County
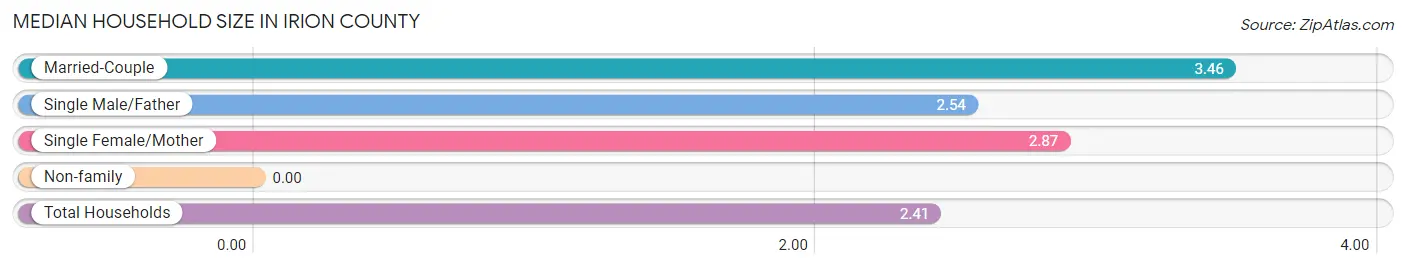
| Household Type | # Households | Household Size |
| Married-Couple | 315 (48.7%) | 3.46 |
| Single Male/Father | 35 (5.4%) | 2.54 |
| Single Female/Mother | 46 (7.1%) | 2.87 |
| Non-family | 251 (38.8%) | - |
| Total Households | 647 (100.0%) | 2.41 |
Household Size by Marriage Status in Irion County
Out of a total of 647 households in Irion County, 396 (61.2%) are family households, while 251 (38.8%) are nonfamily households. The most numerous type of family households are 2-person households, comprising 204, and the most common type of nonfamily households are 1-person households, comprising 251.
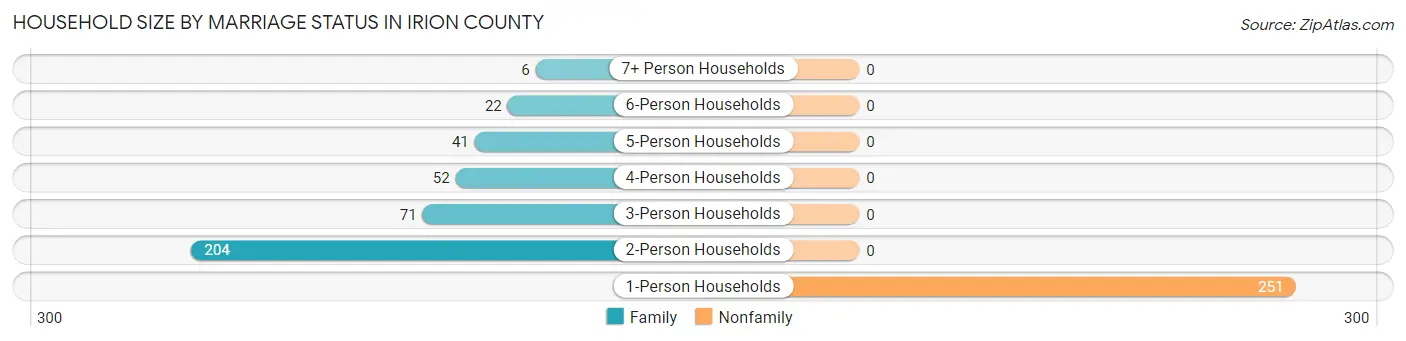
| Household Size | Family Households | Nonfamily Households |
| 1-Person Households | - | 251 (38.8%) |
| 2-Person Households | 204 (31.5%) | 0 (0.0%) |
| 3-Person Households | 71 (11.0%) | 0 (0.0%) |
| 4-Person Households | 52 (8.0%) | 0 (0.0%) |
| 5-Person Households | 41 (6.3%) | 0 (0.0%) |
| 6-Person Households | 22 (3.4%) | 0 (0.0%) |
| 7+ Person Households | 6 (0.9%) | 0 (0.0%) |
| Total | 396 (61.2%) | 251 (38.8%) |
Female Fertility in Irion County
Fertility by Age in Irion County
Average fertility rate in Irion County is 47.0 births per 1,000 women. Women in the age bracket of 20 to 34 years have the highest fertility rate with 124.0 births per 1,000 women. Women in the age bracket of 20 to 34 years acount for 100.0% of all women with births.
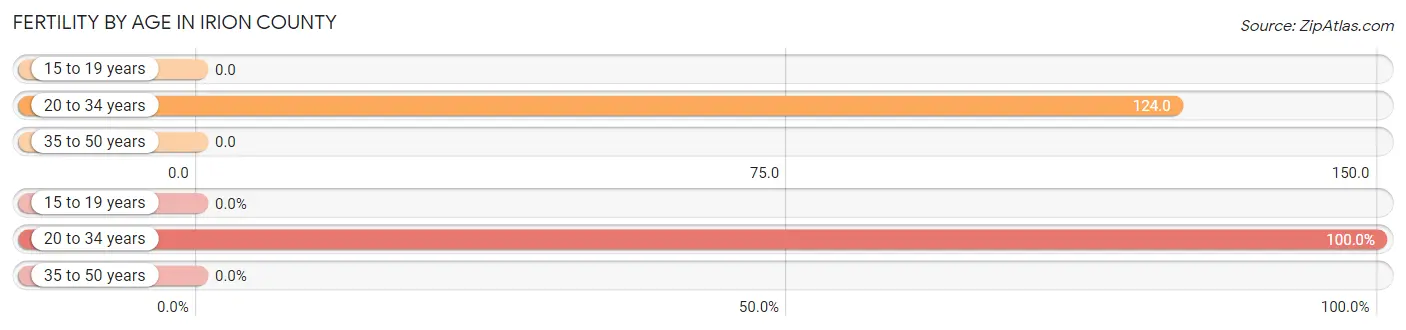
| Age Bracket | Women with Births | Births / 1,000 Women |
| 15 to 19 years | 0 (0.0%) | 0.0 |
| 20 to 34 years | 13 (100.0%) | 124.0 |
| 35 to 50 years | 0 (0.0%) | 0.0 |
| Total | 13 (100.0%) | 47.0 |
Fertility by Age by Marriage Status in Irion County
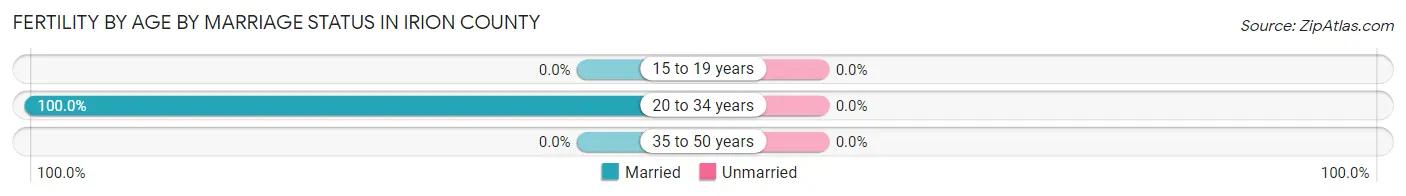
| Age Bracket | Married | Unmarried |
| 15 to 19 years | 0 (0.0%) | 0 (0.0%) |
| 20 to 34 years | 13 (100.0%) | 0 (0.0%) |
| 35 to 50 years | 0 (0.0%) | 0 (0.0%) |
| Total | 13 (100.0%) | 0 (0.0%) |
Fertility by Education in Irion County
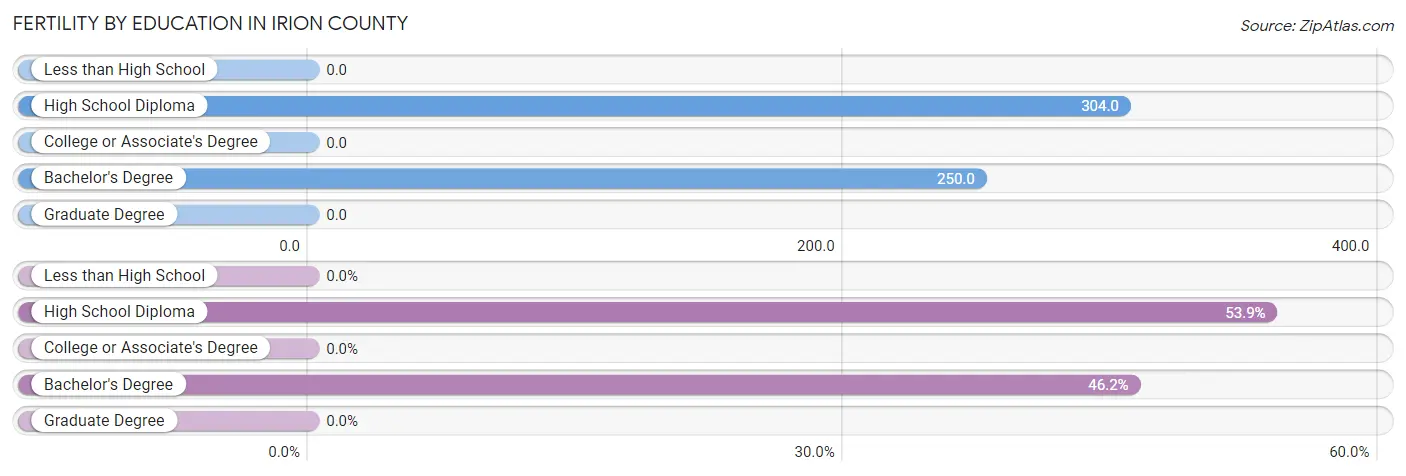
| Educational Attainment | Women with Births | Births / 1,000 Women |
| Less than High School | 0 (0.0%) | 0.0 |
| High School Diploma | 7 (53.8%) | 304.0 |
| College or Associate's Degree | 0 (0.0%) | 0.0 |
| Bachelor's Degree | 6 (46.2%) | 250.0 |
| Graduate Degree | 0 (0.0%) | 0.0 |
| Total | 13 (100.0%) | 47.0 |
Fertility by Education by Marriage Status in Irion County
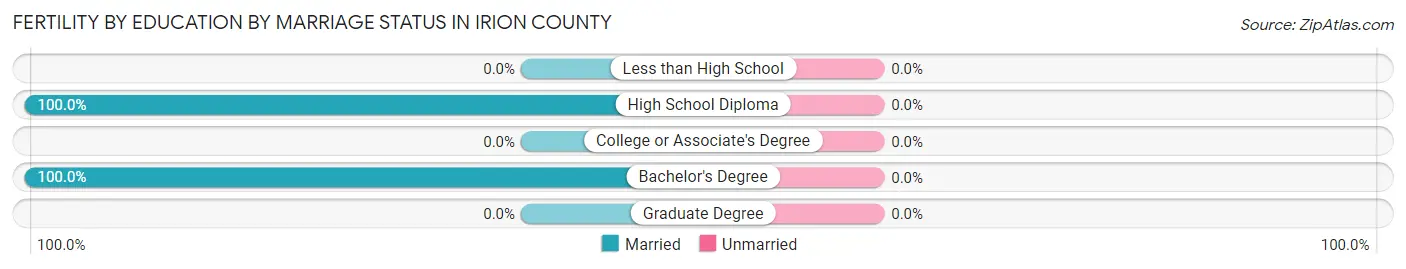
| Educational Attainment | Married | Unmarried |
| Less than High School | 0 (0.0%) | 0 (0.0%) |
| High School Diploma | 7 (100.0%) | 0 (0.0%) |
| College or Associate's Degree | 0 (0.0%) | 0 (0.0%) |
| Bachelor's Degree | 6 (100.0%) | 0 (0.0%) |
| Graduate Degree | 0 (0.0%) | 0 (0.0%) |
| Total | 13 (100.0%) | 0 (0.0%) |
Employment Characteristics in Irion County
Employment by Class of Employer in Irion County
Among the 689 employed individuals in Irion County, private company employees (503 | 73.0%), local government employees (97 | 14.1%), and state government employees (30 | 4.3%) make up the most common classes of employment.
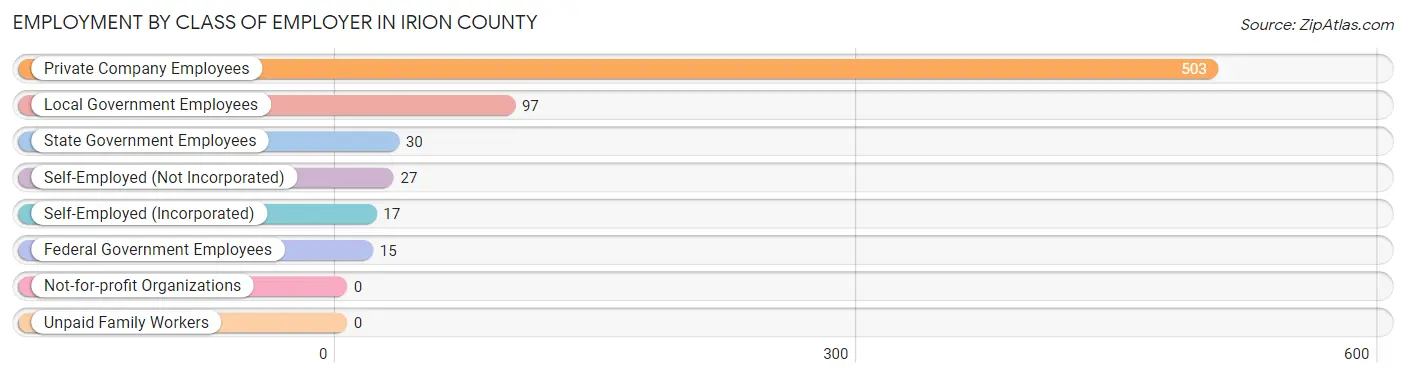
| Employer Class | # Employees | % Employees |
| Private Company Employees | 503 | 73.0% |
| Self-Employed (Incorporated) | 17 | 2.5% |
| Self-Employed (Not Incorporated) | 27 | 3.9% |
| Not-for-profit Organizations | 0 | 0.0% |
| Local Government Employees | 97 | 14.1% |
| State Government Employees | 30 | 4.3% |
| Federal Government Employees | 15 | 2.2% |
| Unpaid Family Workers | 0 | 0.0% |
| Total | 689 | 100.0% |
Employment Status by Age in Irion County
According to the labor force statistics for Irion County, out of the total population over 16 years of age (1,176), 61.3% or 721 individuals are in the labor force, with 1.3% or 9 of them unemployed. The age group with the highest labor force participation rate is 25 to 29 years, with 100.0% or 137 individuals in the labor force. Within the labor force, the 60 to 64 years age range has the highest percentage of unemployed individuals, with 17.0% or 9 of them being unemployed.
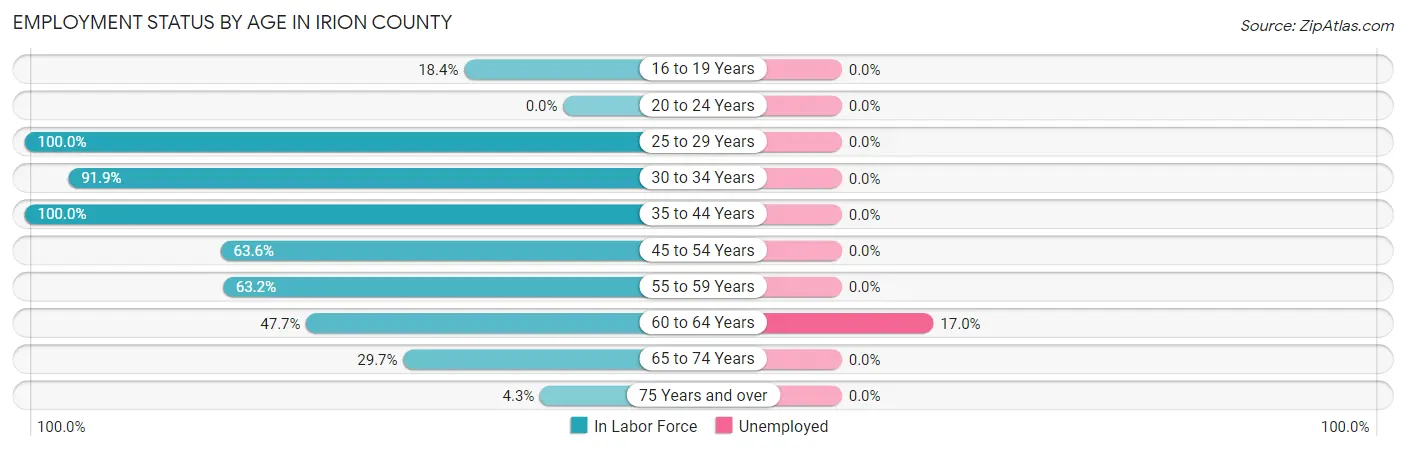
| Age Bracket | In Labor Force | Unemployed |
| 16 to 19 Years | 9 (18.4%) | 0 (0.0%) |
| 20 to 24 Years | 0 (0.0%) | 0 (0.0%) |
| 25 to 29 Years | 137 (100.0%) | 0 (0.0%) |
| 30 to 34 Years | 79 (91.9%) | 0 (0.0%) |
| 35 to 44 Years | 181 (100.0%) | 0 (0.0%) |
| 45 to 54 Years | 105 (63.6%) | 0 (0.0%) |
| 55 to 59 Years | 91 (63.2%) | 0 (0.0%) |
| 60 to 64 Years | 53 (47.7%) | 9 (17.0%) |
| 65 to 74 Years | 62 (29.7%) | 0 (0.0%) |
| 75 Years and over | 4 (4.3%) | 0 (0.0%) |
| Total | 721 (61.3%) | 9 (1.3%) |
Employment Status by Educational Attainment in Irion County
According to labor force statistics for Irion County, 78.4% of individuals (646) out of the total population between 25 and 64 years of age (824) are in the labor force, with 1.4% or 9 of them being unemployed. The group with the highest labor force participation rate are those with the educational attainment of bachelor's degree or higher, with 93.2% or 110 individuals in the labor force. Within the labor force, individuals with college / associate degree education have the highest percentage of unemployment, with 2.6% or 9 of them being unemployed.
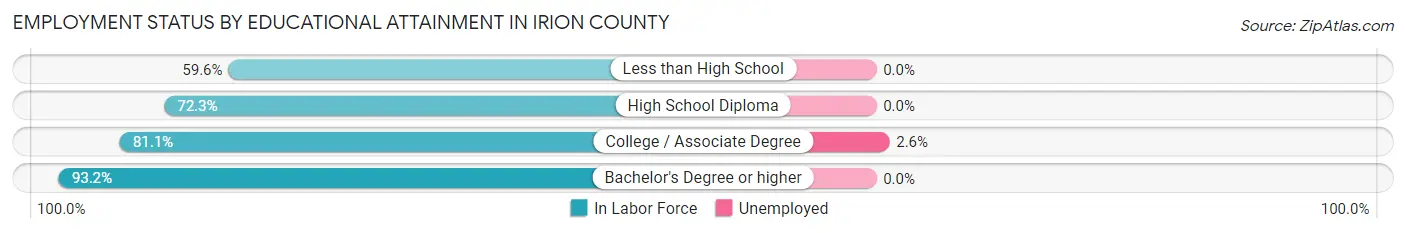
| Educational Attainment | In Labor Force | Unemployed |
| Less than High School | 56 (59.6%) | 0 (0.0%) |
| High School Diploma | 133 (72.3%) | 0 (0.0%) |
| College / Associate Degree | 347 (81.1%) | 11 (2.6%) |
| Bachelor's Degree or higher | 110 (93.2%) | 0 (0.0%) |
| Total | 646 (78.4%) | 12 (1.4%) |
Employment Occupations by Sex in Irion County
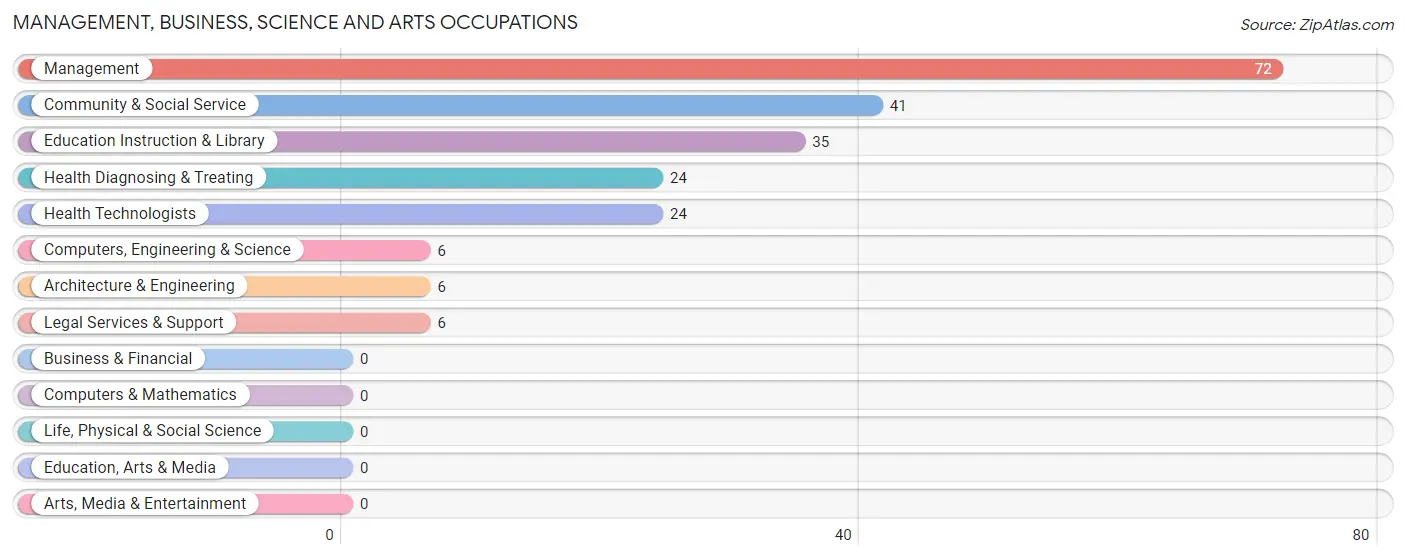
Management, Business, Science and Arts Occupations
The most common Management, Business, Science and Arts occupations in Irion County are Management (72 | 10.2%), Community & Social Service (41 | 5.8%), Education Instruction & Library (35 | 5.0%), Health Diagnosing & Treating (24 | 3.4%), and Health Technologists (24 | 3.4%).
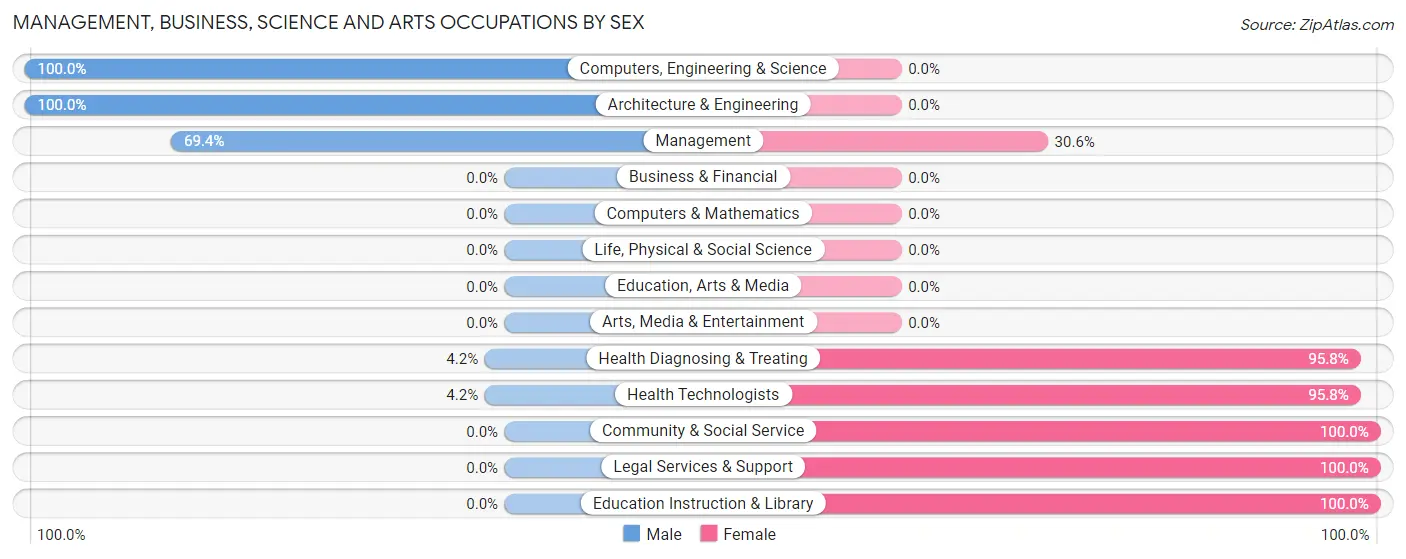
Management, Business, Science and Arts Occupations by Sex
Within the Management, Business, Science and Arts occupations in Irion County, the most male-oriented occupations are Computers, Engineering & Science (100.0%), Architecture & Engineering (100.0%), and Management (69.4%), while the most female-oriented occupations are Community & Social Service (100.0%), Legal Services & Support (100.0%), and Education Instruction & Library (100.0%).
| Occupation | Male | Female |
| Management | 50 (69.4%) | 22 (30.6%) |
| Business & Financial | 0 (0.0%) | 0 (0.0%) |
| Computers, Engineering & Science | 6 (100.0%) | 0 (0.0%) |
| Computers & Mathematics | 0 (0.0%) | 0 (0.0%) |
| Architecture & Engineering | 6 (100.0%) | 0 (0.0%) |
| Life, Physical & Social Science | 0 (0.0%) | 0 (0.0%) |
| Community & Social Service | 0 (0.0%) | 41 (100.0%) |
| Education, Arts & Media | 0 (0.0%) | 0 (0.0%) |
| Legal Services & Support | 0 (0.0%) | 6 (100.0%) |
| Education Instruction & Library | 0 (0.0%) | 35 (100.0%) |
| Arts, Media & Entertainment | 0 (0.0%) | 0 (0.0%) |
| Health Diagnosing & Treating | 1 (4.2%) | 23 (95.8%) |
| Health Technologists | 1 (4.2%) | 23 (95.8%) |
| Total (Category) | 57 (39.9%) | 86 (60.1%) |
| Total (Overall) | 393 (55.9%) | 310 (44.1%) |
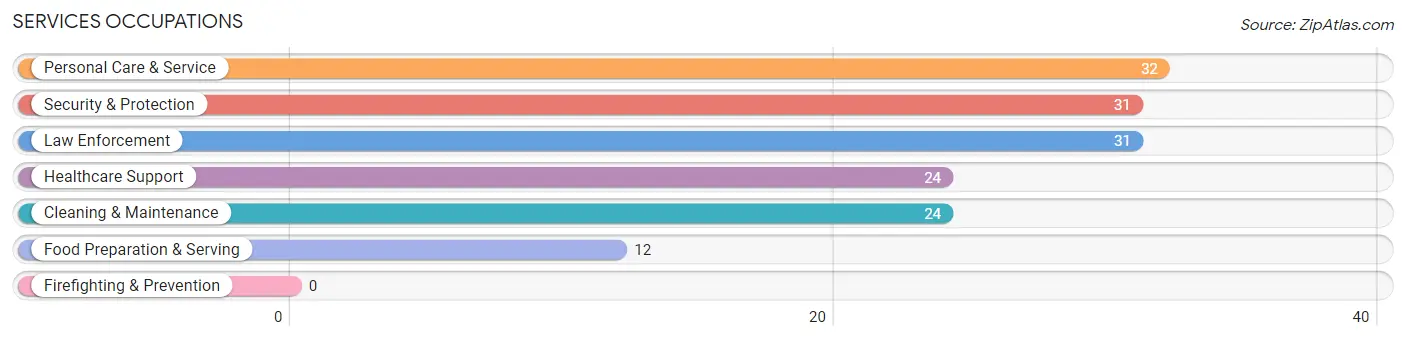
Services Occupations
The most common Services occupations in Irion County are Personal Care & Service (32 | 4.5%), Security & Protection (31 | 4.4%), Law Enforcement (31 | 4.4%), Healthcare Support (24 | 3.4%), and Cleaning & Maintenance (24 | 3.4%).
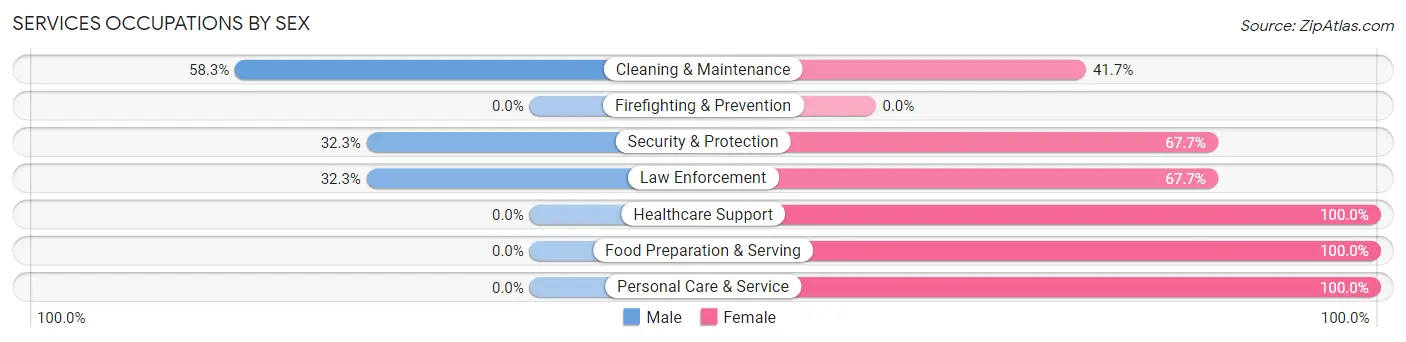
Services Occupations by Sex
Within the Services occupations in Irion County, the most male-oriented occupations are Cleaning & Maintenance (58.3%), Security & Protection (32.3%), and Law Enforcement (32.3%), while the most female-oriented occupations are Healthcare Support (100.0%), Food Preparation & Serving (100.0%), and Personal Care & Service (100.0%).
| Occupation | Male | Female |
| Healthcare Support | 0 (0.0%) | 24 (100.0%) |
| Security & Protection | 10 (32.3%) | 21 (67.7%) |
| Firefighting & Prevention | 0 (0.0%) | 0 (0.0%) |
| Law Enforcement | 10 (32.3%) | 21 (67.7%) |
| Food Preparation & Serving | 0 (0.0%) | 12 (100.0%) |
| Cleaning & Maintenance | 14 (58.3%) | 10 (41.7%) |
| Personal Care & Service | 0 (0.0%) | 32 (100.0%) |
| Total (Category) | 24 (19.5%) | 99 (80.5%) |
| Total (Overall) | 393 (55.9%) | 310 (44.1%) |
Sales and Office Occupations
The most common Sales and Office occupations in Irion County are Office & Administration (144 | 20.5%), and Sales & Related (9 | 1.3%).
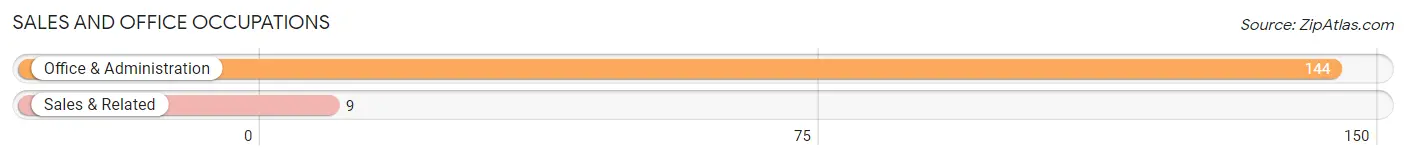
Sales and Office Occupations by Sex

| Occupation | Male | Female |
| Sales & Related | 4 (44.4%) | 5 (55.6%) |
| Office & Administration | 24 (16.7%) | 120 (83.3%) |
| Total (Category) | 28 (18.3%) | 125 (81.7%) |
| Total (Overall) | 393 (55.9%) | 310 (44.1%) |
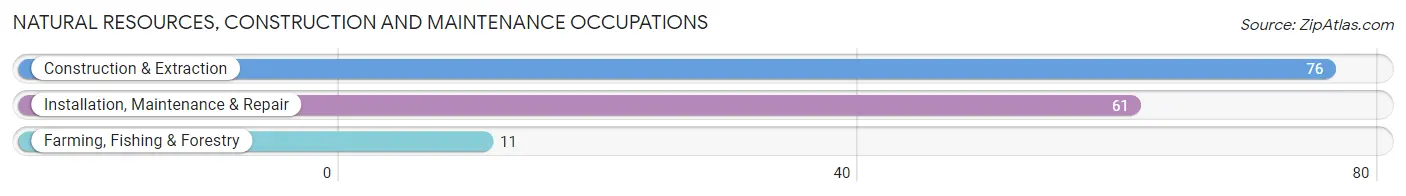
Natural Resources, Construction and Maintenance Occupations
The most common Natural Resources, Construction and Maintenance occupations in Irion County are Construction & Extraction (76 | 10.8%), Installation, Maintenance & Repair (61 | 8.7%), and Farming, Fishing & Forestry (11 | 1.6%).
Natural Resources, Construction and Maintenance Occupations by Sex
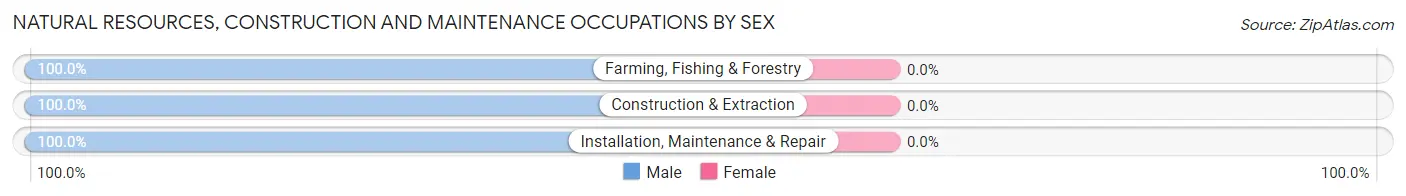
| Occupation | Male | Female |
| Farming, Fishing & Forestry | 11 (100.0%) | 0 (0.0%) |
| Construction & Extraction | 76 (100.0%) | 0 (0.0%) |
| Installation, Maintenance & Repair | 61 (100.0%) | 0 (0.0%) |
| Total (Category) | 148 (100.0%) | 0 (0.0%) |
| Total (Overall) | 393 (55.9%) | 310 (44.1%) |
Production, Transportation and Moving Occupations
The most common Production, Transportation and Moving occupations in Irion County are Material Moving (54 | 7.7%), Production (53 | 7.5%), and Transportation (29 | 4.1%).
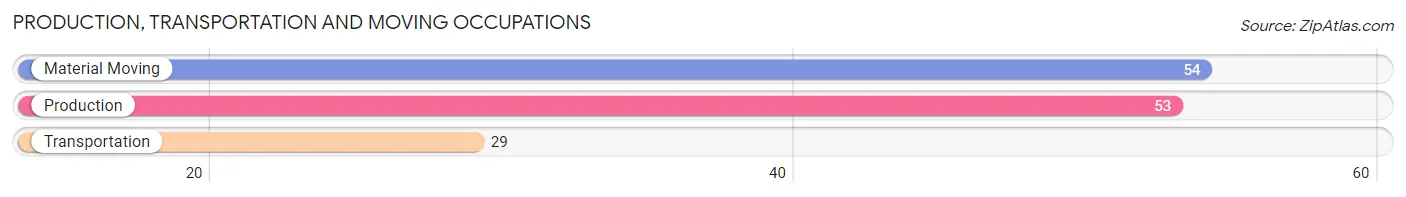
Production, Transportation and Moving Occupations by Sex
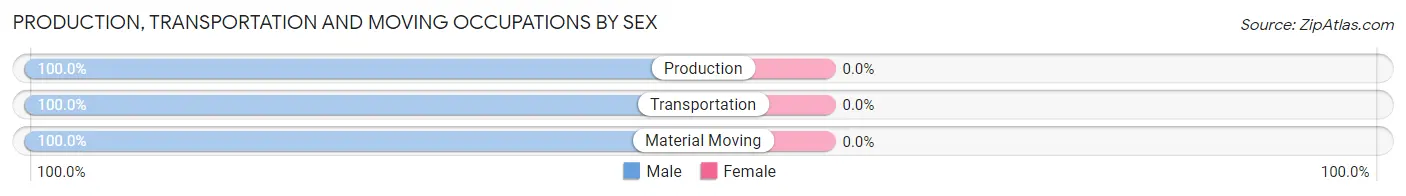
| Occupation | Male | Female |
| Production | 53 (100.0%) | 0 (0.0%) |
| Transportation | 29 (100.0%) | 0 (0.0%) |
| Material Moving | 54 (100.0%) | 0 (0.0%) |
| Total (Category) | 136 (100.0%) | 0 (0.0%) |
| Total (Overall) | 393 (55.9%) | 310 (44.1%) |
Employment Industries by Sex in Irion County
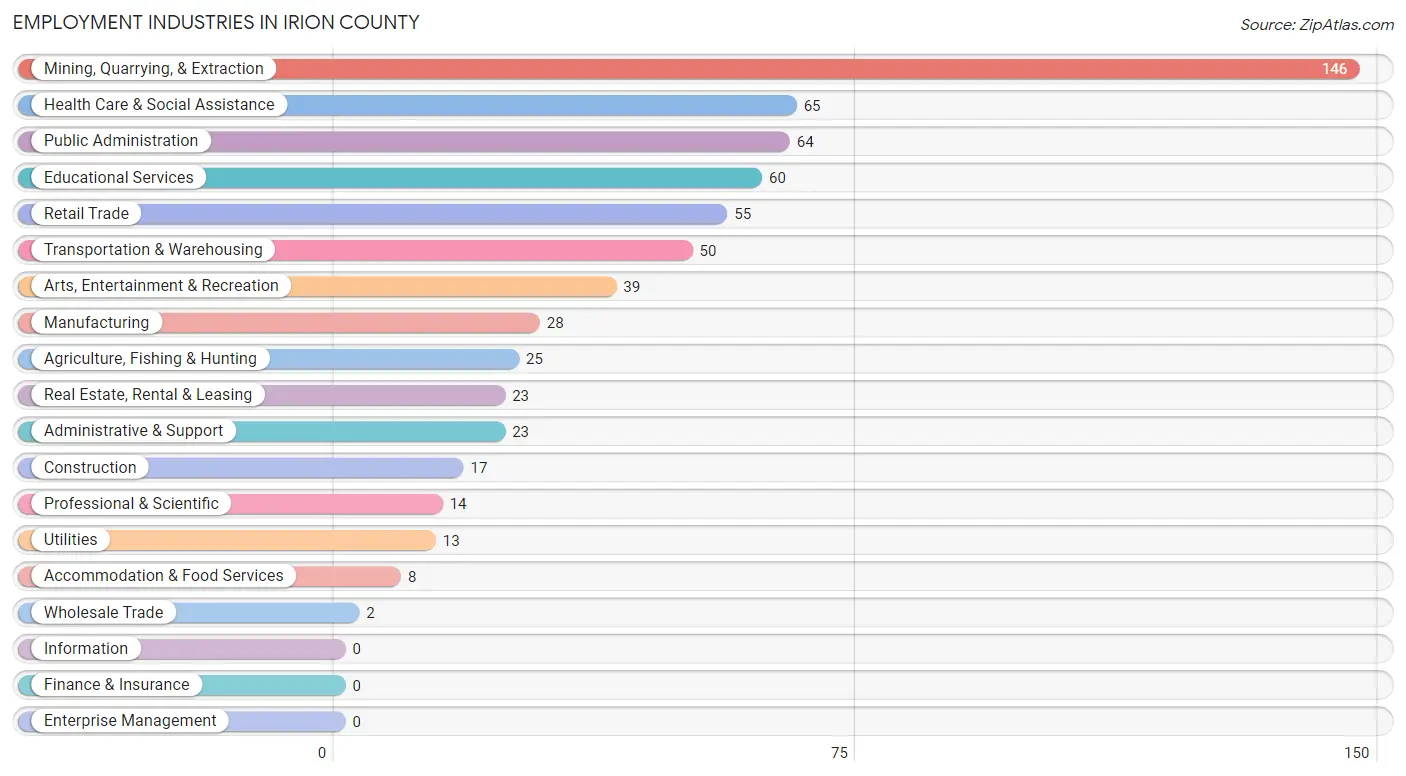
Employment Industries in Irion County
The major employment industries in Irion County include Mining, Quarrying, & Extraction (146 | 20.8%), Health Care & Social Assistance (65 | 9.2%), Public Administration (64 | 9.1%), Educational Services (60 | 8.5%), and Retail Trade (55 | 7.8%).
Employment Industries by Sex in Irion County
The Irion County industries that see more men than women are Construction (100.0%), Wholesale Trade (100.0%), and Utilities (100.0%), whereas the industries that tend to have a higher number of women are Educational Services (100.0%), Accommodation & Food Services (100.0%), and Public Administration (84.4%).
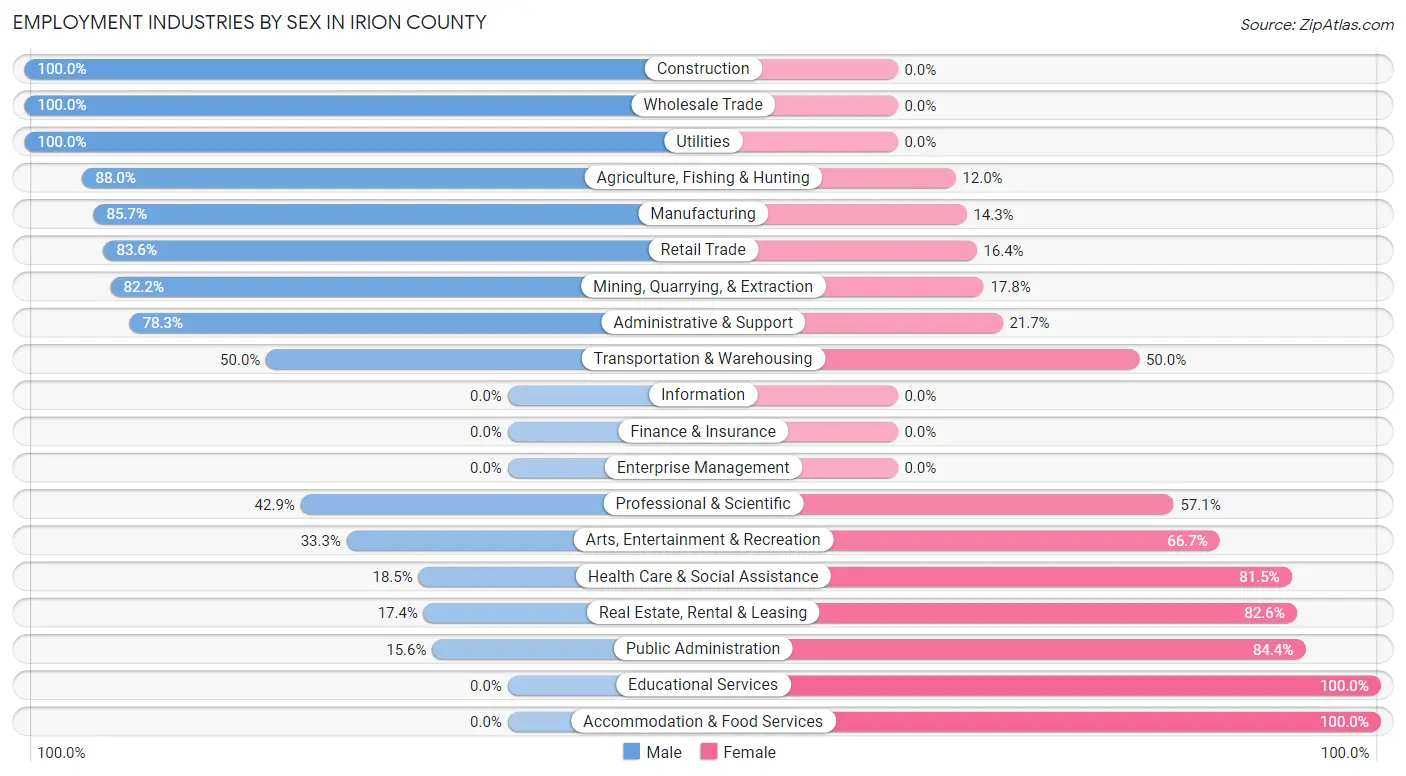
| Industry | Male | Female |
| Agriculture, Fishing & Hunting | 22 (88.0%) | 3 (12.0%) |
| Mining, Quarrying, & Extraction | 120 (82.2%) | 26 (17.8%) |
| Construction | 17 (100.0%) | 0 (0.0%) |
| Manufacturing | 24 (85.7%) | 4 (14.3%) |
| Wholesale Trade | 2 (100.0%) | 0 (0.0%) |
| Retail Trade | 46 (83.6%) | 9 (16.4%) |
| Transportation & Warehousing | 25 (50.0%) | 25 (50.0%) |
| Utilities | 13 (100.0%) | 0 (0.0%) |
| Information | 0 (0.0%) | 0 (0.0%) |
| Finance & Insurance | 0 (0.0%) | 0 (0.0%) |
| Real Estate, Rental & Leasing | 4 (17.4%) | 19 (82.6%) |
| Professional & Scientific | 6 (42.9%) | 8 (57.1%) |
| Enterprise Management | 0 (0.0%) | 0 (0.0%) |
| Administrative & Support | 18 (78.3%) | 5 (21.7%) |
| Educational Services | 0 (0.0%) | 60 (100.0%) |
| Health Care & Social Assistance | 12 (18.5%) | 53 (81.5%) |
| Arts, Entertainment & Recreation | 13 (33.3%) | 26 (66.7%) |
| Accommodation & Food Services | 0 (0.0%) | 8 (100.0%) |
| Public Administration | 10 (15.6%) | 54 (84.4%) |
| Total | 393 (55.9%) | 310 (44.1%) |
Education in Irion County
School Enrollment in Irion County
The most common levels of schooling among the 396 students in Irion County are middle school (168 | 42.4%), elementary school (69 | 17.4%), and nursery / preschool (68 | 17.2%).
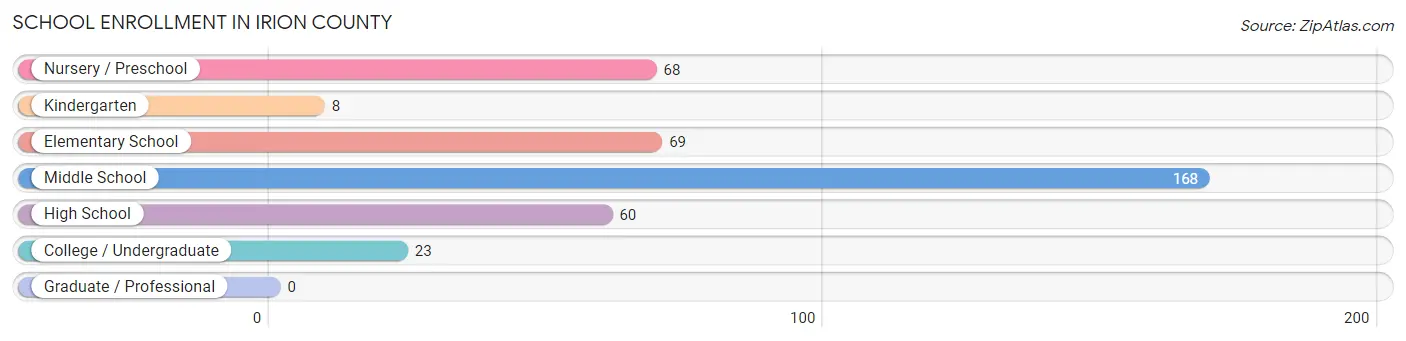
| School Level | # Students | % Students |
| Nursery / Preschool | 68 | 17.2% |
| Kindergarten | 8 | 2.0% |
| Elementary School | 69 | 17.4% |
| Middle School | 168 | 42.4% |
| High School | 60 | 15.1% |
| College / Undergraduate | 23 | 5.8% |
| Graduate / Professional | 0 | 0.0% |
| Total | 396 | 100.0% |
School Enrollment by Age by Funding Source in Irion County
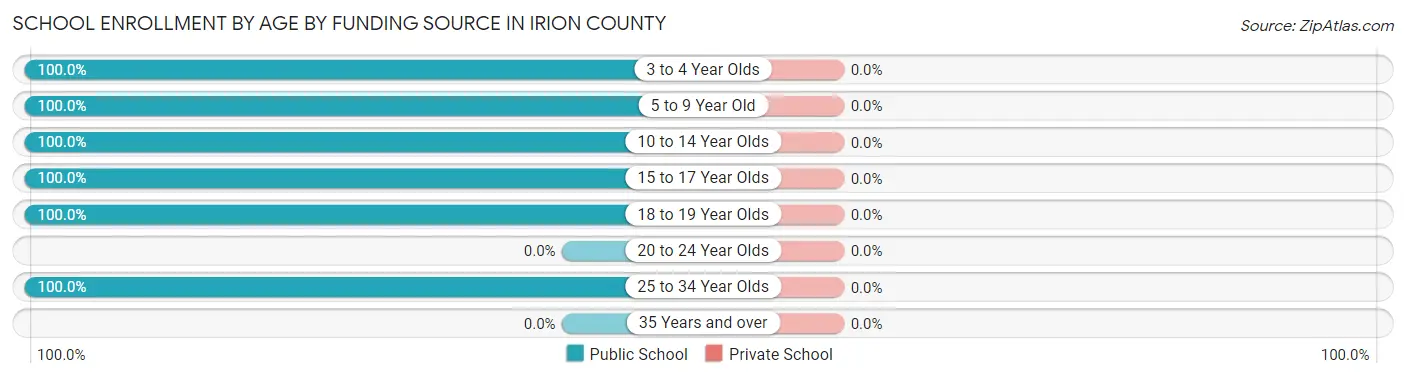
| Age Bracket | Public School | Private School |
| 3 to 4 Year Olds | 18 (100.0%) | 0 (0.0%) |
| 5 to 9 Year Old | 101 (100.0%) | 0 (0.0%) |
| 10 to 14 Year Olds | 194 (100.0%) | 0 (0.0%) |
| 15 to 17 Year Olds | 36 (100.0%) | 0 (0.0%) |
| 18 to 19 Year Olds | 24 (100.0%) | 0 (0.0%) |
| 20 to 24 Year Olds | 0 (0.0%) | 0 (0.0%) |
| 25 to 34 Year Olds | 23 (100.0%) | 0 (0.0%) |
| 35 Years and over | 0 (0.0%) | 0 (0.0%) |
| Total | 396 (100.0%) | 0 (0.0%) |
Educational Attainment by Field of Study in Irion County
Business (74 | 33.3%), bio, nature & agricultural (49 | 22.1%), education (38 | 17.1%), computers & mathematics (29 | 13.1%), and science & technology (10 | 4.5%) are the most common fields of study among 222 individuals in Irion County who have obtained a bachelor's degree or higher.
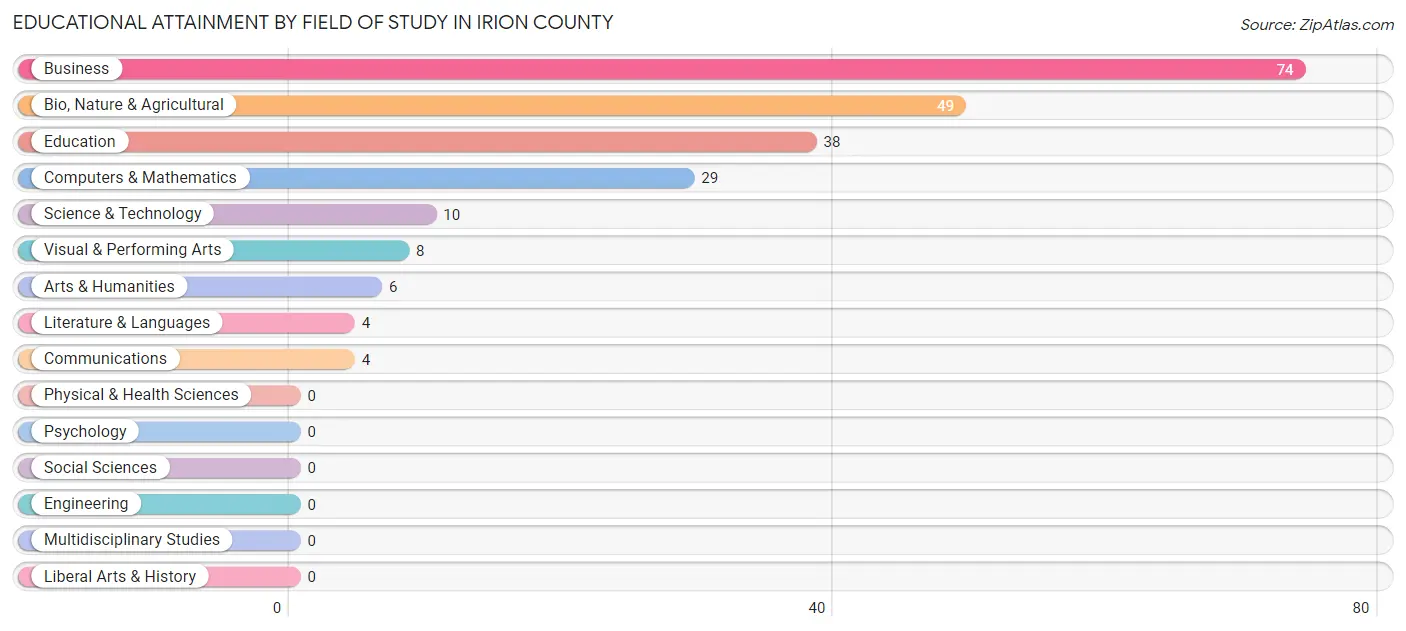
| Field of Study | # Graduates | % Graduates |
| Computers & Mathematics | 29 | 13.1% |
| Bio, Nature & Agricultural | 49 | 22.1% |
| Physical & Health Sciences | 0 | 0.0% |
| Psychology | 0 | 0.0% |
| Social Sciences | 0 | 0.0% |
| Engineering | 0 | 0.0% |
| Multidisciplinary Studies | 0 | 0.0% |
| Science & Technology | 10 | 4.5% |
| Business | 74 | 33.3% |
| Education | 38 | 17.1% |
| Literature & Languages | 4 | 1.8% |
| Liberal Arts & History | 0 | 0.0% |
| Visual & Performing Arts | 8 | 3.6% |
| Communications | 4 | 1.8% |
| Arts & Humanities | 6 | 2.7% |
| Total | 222 | 100.0% |
Transportation & Commute in Irion County
Vehicle Availability by Sex in Irion County
The most prevalent vehicle ownership categories in Irion County are males with 3 vehicles (170, accounting for 46.0%) and females with 3 vehicles (96, making up 53.3%).
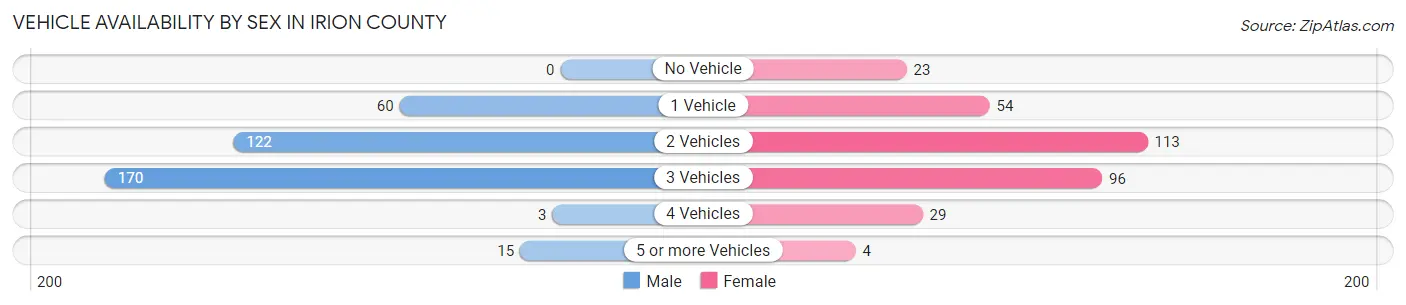
| Vehicles Available | Male | Female |
| No Vehicle | 0 (0.0%) | 23 (7.2%) |
| 1 Vehicle | 60 (16.2%) | 54 (16.9%) |
| 2 Vehicles | 122 (33.0%) | 113 (35.4%) |
| 3 Vehicles | 170 (46.0%) | 96 (30.1%) |
| 4 Vehicles | 3 (0.8%) | 29 (9.1%) |
| 5 or more Vehicles | 15 (4.1%) | 4 (1.3%) |
| Total | 370 (100.0%) | 319 (100.0%) |
Commute Time in Irion County
The most frequently occuring commute durations in Irion County are less than 5 minutes (222 commuters, 34.4%), 5 to 9 minutes (99 commuters, 15.3%), and 45 to 59 minutes (71 commuters, 11.0%).
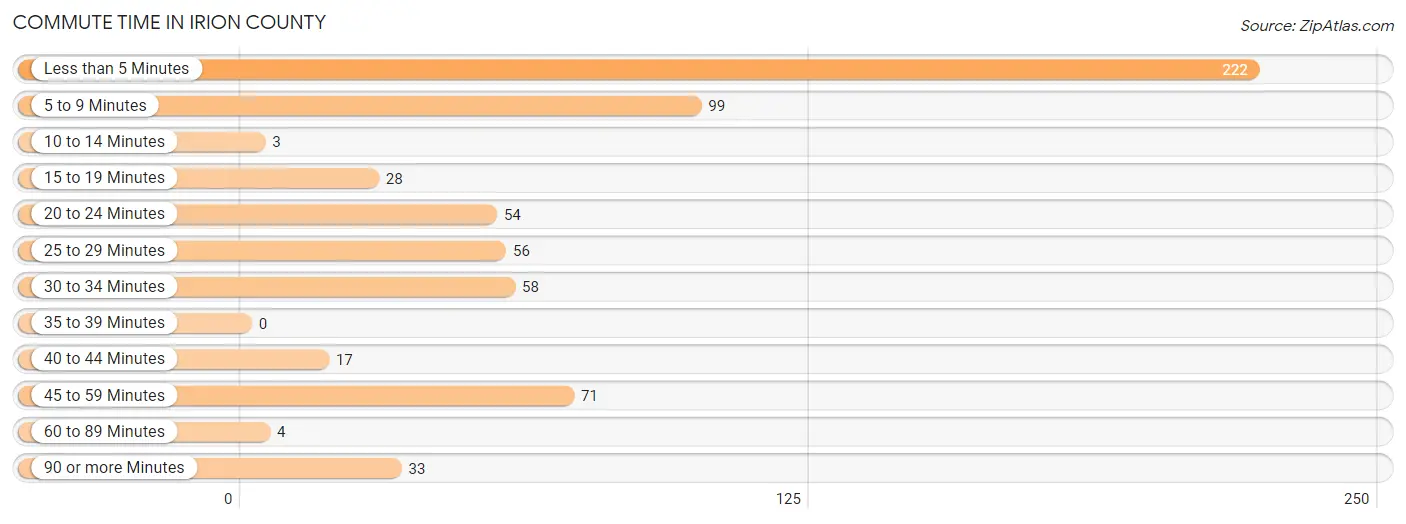
| Commute Time | # Commuters | % Commuters |
| Less than 5 Minutes | 222 | 34.4% |
| 5 to 9 Minutes | 99 | 15.3% |
| 10 to 14 Minutes | 3 | 0.5% |
| 15 to 19 Minutes | 28 | 4.3% |
| 20 to 24 Minutes | 54 | 8.4% |
| 25 to 29 Minutes | 56 | 8.7% |
| 30 to 34 Minutes | 58 | 9.0% |
| 35 to 39 Minutes | 0 | 0.0% |
| 40 to 44 Minutes | 17 | 2.6% |
| 45 to 59 Minutes | 71 | 11.0% |
| 60 to 89 Minutes | 4 | 0.6% |
| 90 or more Minutes | 33 | 5.1% |
Commute Time by Sex in Irion County
The most common commute times in Irion County are less than 5 minutes (109 commuters, 31.4%) for males and less than 5 minutes (113 commuters, 37.9%) for females.
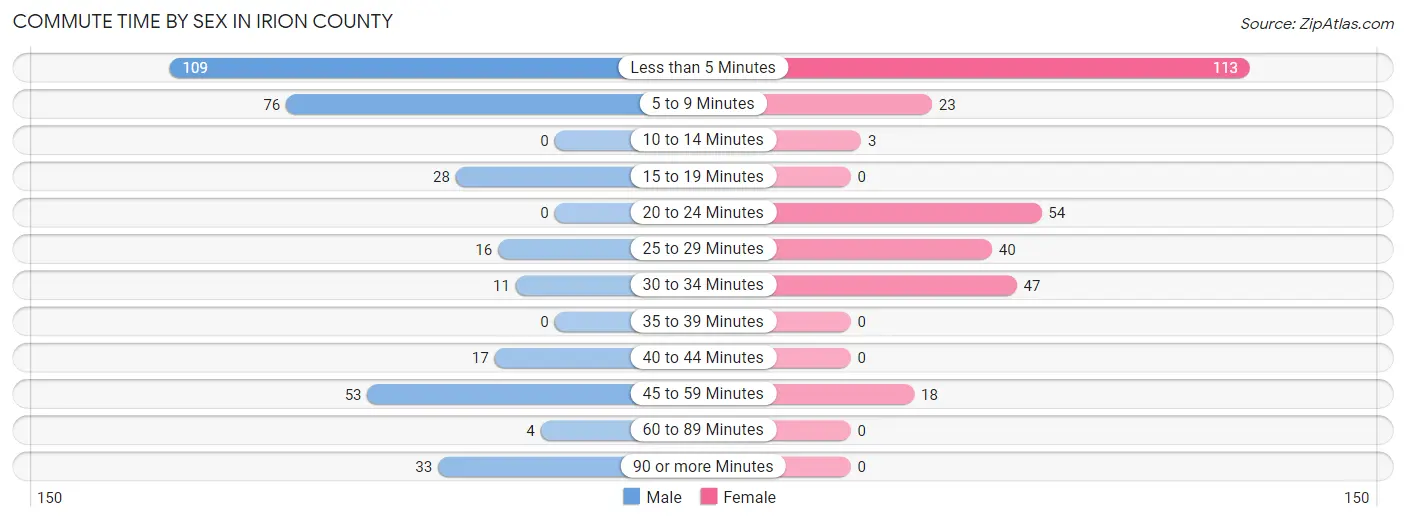
| Commute Time | Male | Female |
| Less than 5 Minutes | 109 (31.4%) | 113 (37.9%) |
| 5 to 9 Minutes | 76 (21.9%) | 23 (7.7%) |
| 10 to 14 Minutes | 0 (0.0%) | 3 (1.0%) |
| 15 to 19 Minutes | 28 (8.1%) | 0 (0.0%) |
| 20 to 24 Minutes | 0 (0.0%) | 54 (18.1%) |
| 25 to 29 Minutes | 16 (4.6%) | 40 (13.4%) |
| 30 to 34 Minutes | 11 (3.2%) | 47 (15.8%) |
| 35 to 39 Minutes | 0 (0.0%) | 0 (0.0%) |
| 40 to 44 Minutes | 17 (4.9%) | 0 (0.0%) |
| 45 to 59 Minutes | 53 (15.3%) | 18 (6.0%) |
| 60 to 89 Minutes | 4 (1.1%) | 0 (0.0%) |
| 90 or more Minutes | 33 (9.5%) | 0 (0.0%) |
Time of Departure to Work by Sex in Irion County
The most frequent times of departure to work in Irion County are 6:30 AM to 6:59 AM (77, 22.2%) for males and 7:30 AM to 7:59 AM (95, 31.9%) for females.
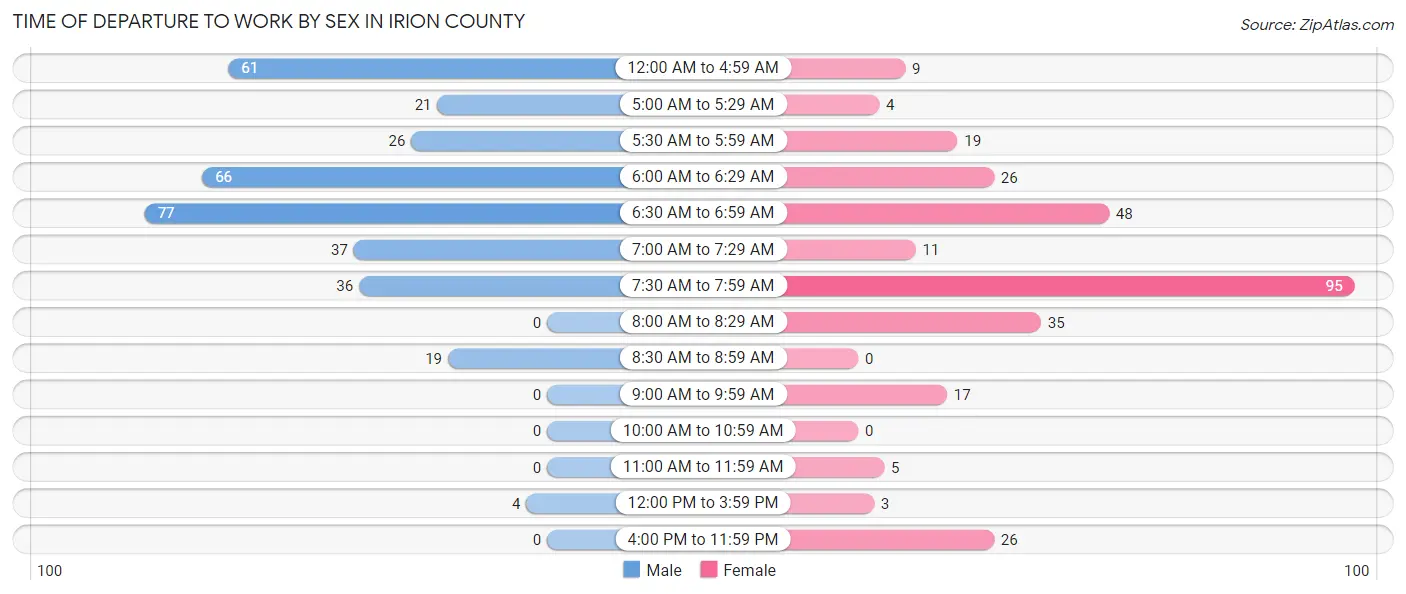
| Time of Departure | Male | Female |
| 12:00 AM to 4:59 AM | 61 (17.6%) | 9 (3.0%) |
| 5:00 AM to 5:29 AM | 21 (6.0%) | 4 (1.3%) |
| 5:30 AM to 5:59 AM | 26 (7.5%) | 19 (6.4%) |
| 6:00 AM to 6:29 AM | 66 (19.0%) | 26 (8.7%) |
| 6:30 AM to 6:59 AM | 77 (22.2%) | 48 (16.1%) |
| 7:00 AM to 7:29 AM | 37 (10.7%) | 11 (3.7%) |
| 7:30 AM to 7:59 AM | 36 (10.4%) | 95 (31.9%) |
| 8:00 AM to 8:29 AM | 0 (0.0%) | 35 (11.7%) |
| 8:30 AM to 8:59 AM | 19 (5.5%) | 0 (0.0%) |
| 9:00 AM to 9:59 AM | 0 (0.0%) | 17 (5.7%) |
| 10:00 AM to 10:59 AM | 0 (0.0%) | 0 (0.0%) |
| 11:00 AM to 11:59 AM | 0 (0.0%) | 5 (1.7%) |
| 12:00 PM to 3:59 PM | 4 (1.1%) | 3 (1.0%) |
| 4:00 PM to 11:59 PM | 0 (0.0%) | 26 (8.7%) |
| Total | 347 (100.0%) | 298 (100.0%) |
Housing Occupancy in Irion County
Occupancy by Ownership in Irion County
Of the total 647 dwellings in Irion County, owner-occupied units account for 571 (88.2%), while renter-occupied units make up 76 (11.7%).
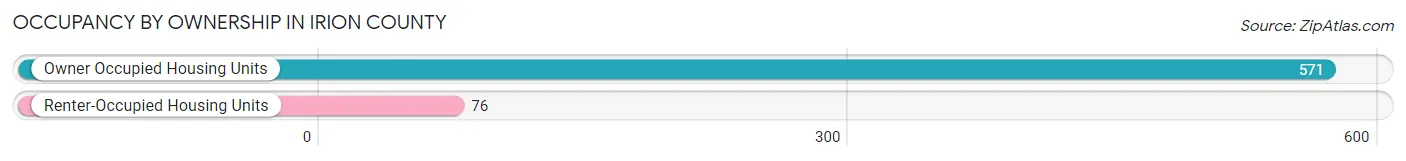
| Occupancy | # Housing Units | % Housing Units |
| Owner Occupied Housing Units | 571 | 88.2% |
| Renter-Occupied Housing Units | 76 | 11.7% |
| Total Occupied Housing Units | 647 | 100.0% |
Occupancy by Household Size in Irion County
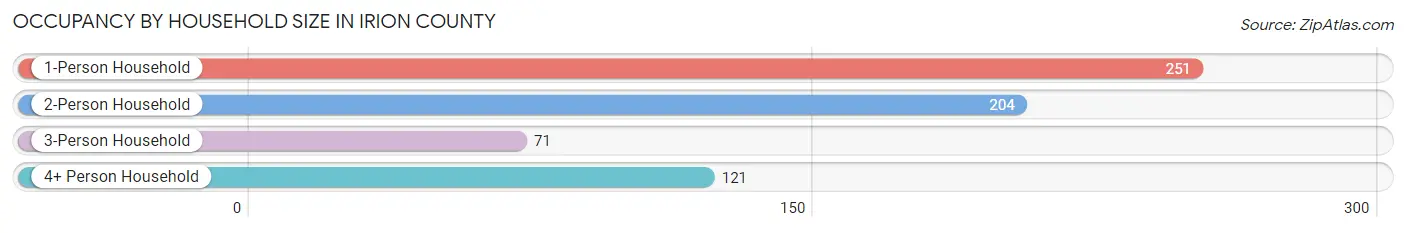
| Household Size | # Housing Units | % Housing Units |
| 1-Person Household | 251 | 38.8% |
| 2-Person Household | 204 | 31.5% |
| 3-Person Household | 71 | 11.0% |
| 4+ Person Household | 121 | 18.7% |
| Total Housing Units | 647 | 100.0% |
Occupancy by Ownership by Household Size in Irion County

| Household Size | Owner-occupied | Renter-occupied |
| 1-Person Household | 215 (85.7%) | 36 (14.3%) |
| 2-Person Household | 194 (95.1%) | 10 (4.9%) |
| 3-Person Household | 50 (70.4%) | 21 (29.6%) |
| 4+ Person Household | 112 (92.6%) | 9 (7.4%) |
| Total Housing Units | 571 (88.2%) | 76 (11.7%) |
Occupancy by Educational Attainment in Irion County
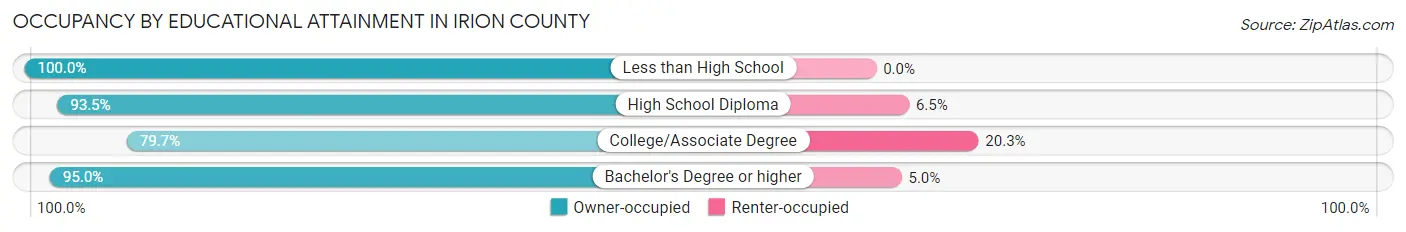
| Household Size | Owner-occupied | Renter-occupied |
| Less than High School | 69 (100.0%) | 0 (0.0%) |
| High School Diploma | 115 (93.5%) | 8 (6.5%) |
| College/Associate Degree | 236 (79.7%) | 60 (20.3%) |
| Bachelor's Degree or higher | 151 (95.0%) | 8 (5.0%) |
Occupancy by Age of Householder in Irion County
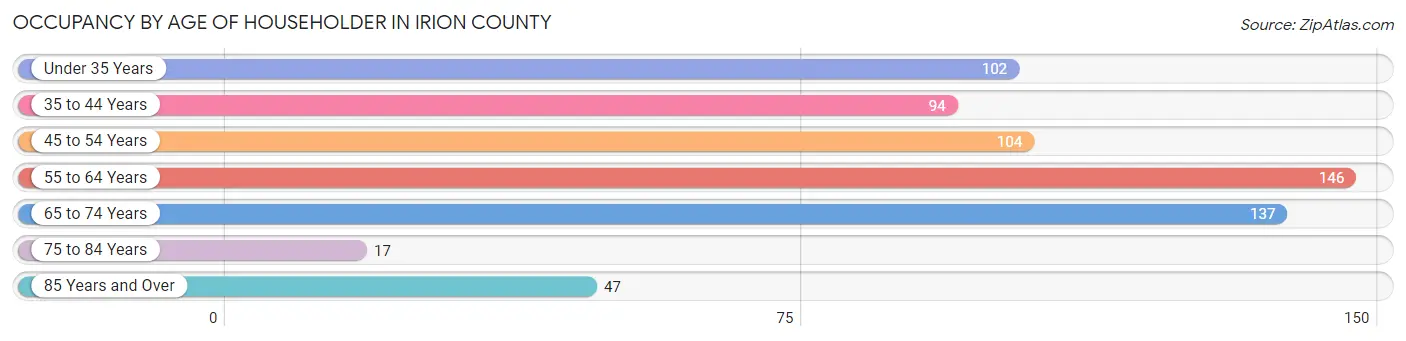
| Age Bracket | # Households | % Households |
| Under 35 Years | 102 | 15.8% |
| 35 to 44 Years | 94 | 14.5% |
| 45 to 54 Years | 104 | 16.1% |
| 55 to 64 Years | 146 | 22.6% |
| 65 to 74 Years | 137 | 21.2% |
| 75 to 84 Years | 17 | 2.6% |
| 85 Years and Over | 47 | 7.3% |
| Total | 647 | 100.0% |
Housing Finances in Irion County
Median Income by Occupancy in Irion County
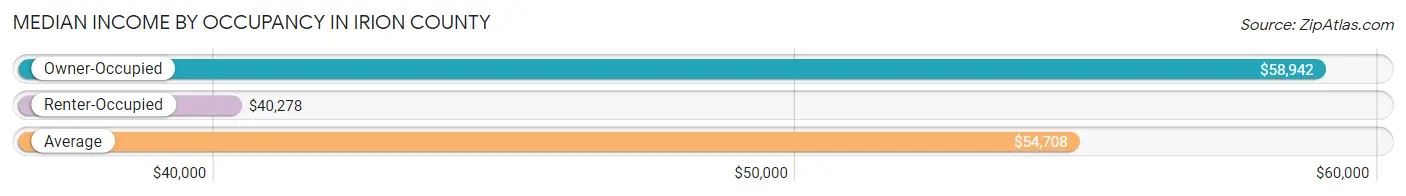
| Occupancy Type | # Households | Median Income |
| Owner-Occupied | 571 (88.2%) | $58,942 |
| Renter-Occupied | 76 (11.7%) | $40,278 |
| Average | 647 (100.0%) | $54,708 |
Occupancy by Householder Income Bracket in Irion County
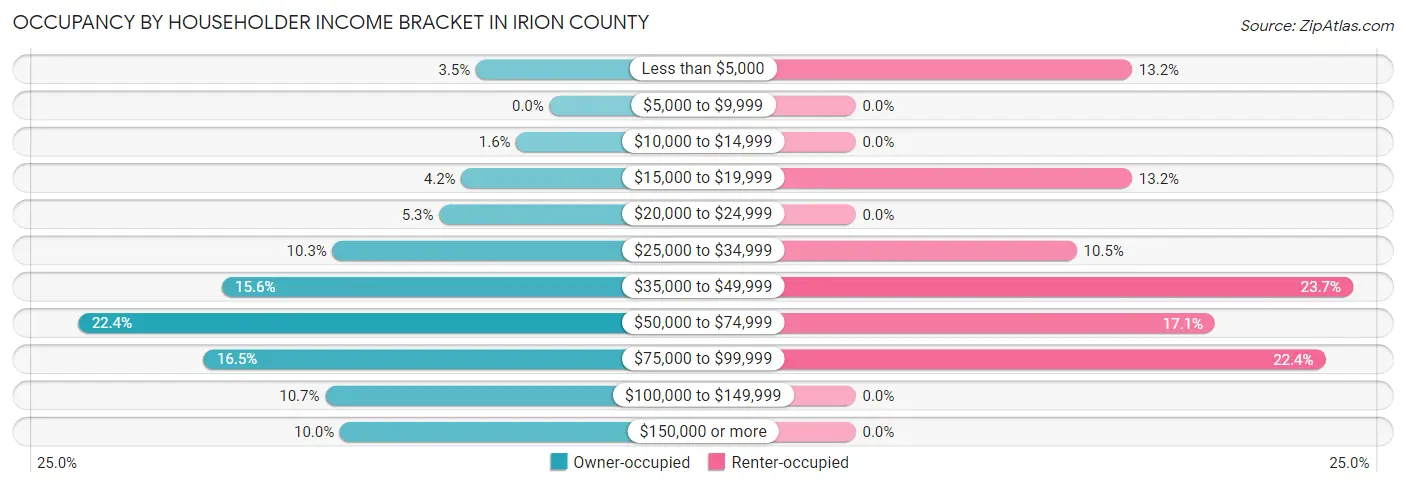
| Income Bracket | Owner-occupied | Renter-occupied |
| Less than $5,000 | 20 (3.5%) | 10 (13.2%) |
| $5,000 to $9,999 | 0 (0.0%) | 0 (0.0%) |
| $10,000 to $14,999 | 9 (1.6%) | 0 (0.0%) |
| $15,000 to $19,999 | 24 (4.2%) | 10 (13.2%) |
| $20,000 to $24,999 | 30 (5.2%) | 0 (0.0%) |
| $25,000 to $34,999 | 59 (10.3%) | 8 (10.5%) |
| $35,000 to $49,999 | 89 (15.6%) | 18 (23.7%) |
| $50,000 to $74,999 | 128 (22.4%) | 13 (17.1%) |
| $75,000 to $99,999 | 94 (16.5%) | 17 (22.4%) |
| $100,000 to $149,999 | 61 (10.7%) | 0 (0.0%) |
| $150,000 or more | 57 (10.0%) | 0 (0.0%) |
| Total | 571 (100.0%) | 76 (100.0%) |
Monthly Housing Cost Tiers in Irion County
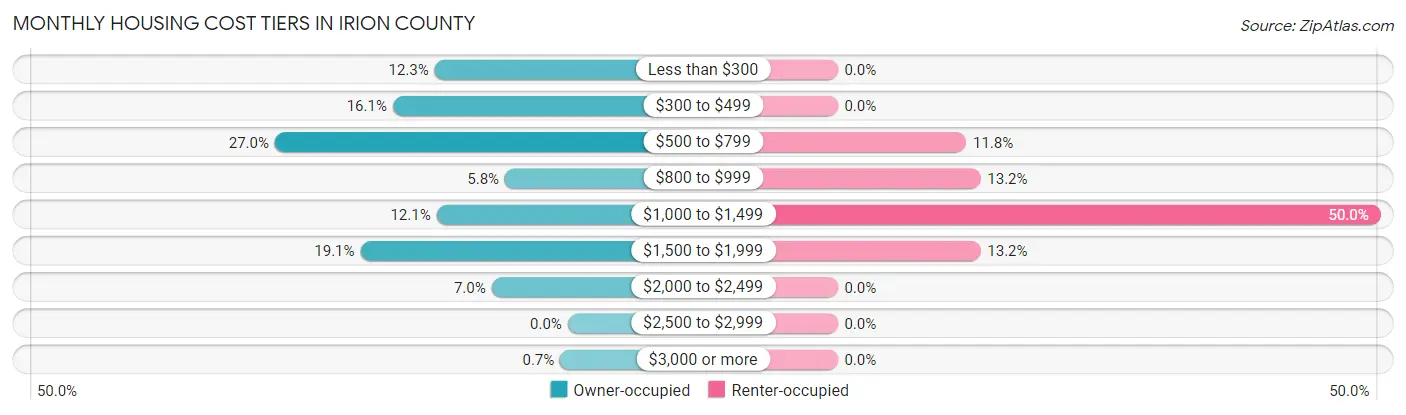
| Monthly Cost | Owner-occupied | Renter-occupied |
| Less than $300 | 70 (12.3%) | 0 (0.0%) |
| $300 to $499 | 92 (16.1%) | 0 (0.0%) |
| $500 to $799 | 154 (27.0%) | 9 (11.8%) |
| $800 to $999 | 33 (5.8%) | 10 (13.2%) |
| $1,000 to $1,499 | 69 (12.1%) | 38 (50.0%) |
| $1,500 to $1,999 | 109 (19.1%) | 10 (13.2%) |
| $2,000 to $2,499 | 40 (7.0%) | 0 (0.0%) |
| $2,500 to $2,999 | 0 (0.0%) | 0 (0.0%) |
| $3,000 or more | 4 (0.7%) | 0 (0.0%) |
| Total | 571 (100.0%) | 76 (100.0%) |
Physical Housing Characteristics in Irion County
Housing Structures in Irion County
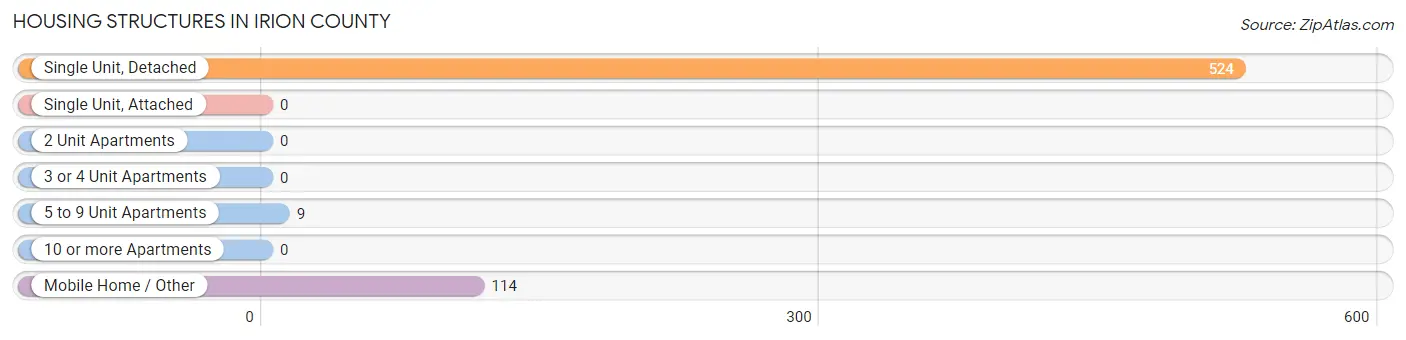
| Structure Type | # Housing Units | % Housing Units |
| Single Unit, Detached | 524 | 81.0% |
| Single Unit, Attached | 0 | 0.0% |
| 2 Unit Apartments | 0 | 0.0% |
| 3 or 4 Unit Apartments | 0 | 0.0% |
| 5 to 9 Unit Apartments | 9 | 1.4% |
| 10 or more Apartments | 0 | 0.0% |
| Mobile Home / Other | 114 | 17.6% |
| Total | 647 | 100.0% |
Housing Structures by Occupancy in Irion County
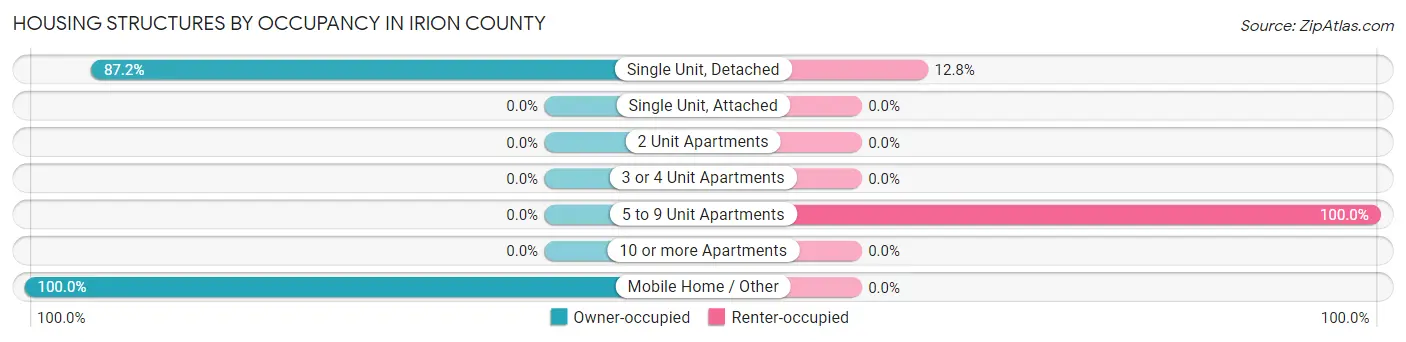
| Structure Type | Owner-occupied | Renter-occupied |
| Single Unit, Detached | 457 (87.2%) | 67 (12.8%) |
| Single Unit, Attached | 0 (0.0%) | 0 (0.0%) |
| 2 Unit Apartments | 0 (0.0%) | 0 (0.0%) |
| 3 or 4 Unit Apartments | 0 (0.0%) | 0 (0.0%) |
| 5 to 9 Unit Apartments | 0 (0.0%) | 9 (100.0%) |
| 10 or more Apartments | 0 (0.0%) | 0 (0.0%) |
| Mobile Home / Other | 114 (100.0%) | 0 (0.0%) |
| Total | 571 (88.2%) | 76 (11.7%) |
Housing Structures by Number of Rooms in Irion County
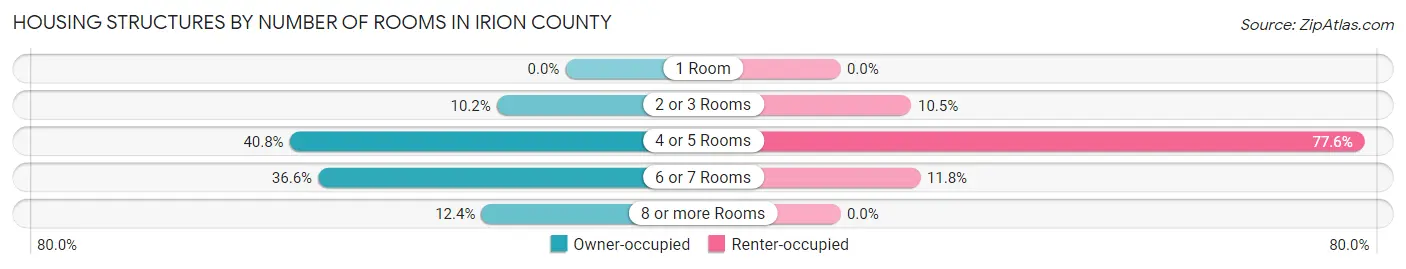
| Number of Rooms | Owner-occupied | Renter-occupied |
| 1 Room | 0 (0.0%) | 0 (0.0%) |
| 2 or 3 Rooms | 58 (10.2%) | 8 (10.5%) |
| 4 or 5 Rooms | 233 (40.8%) | 59 (77.6%) |
| 6 or 7 Rooms | 209 (36.6%) | 9 (11.8%) |
| 8 or more Rooms | 71 (12.4%) | 0 (0.0%) |
| Total | 571 (100.0%) | 76 (100.0%) |
Housing Structure by Heating Type in Irion County
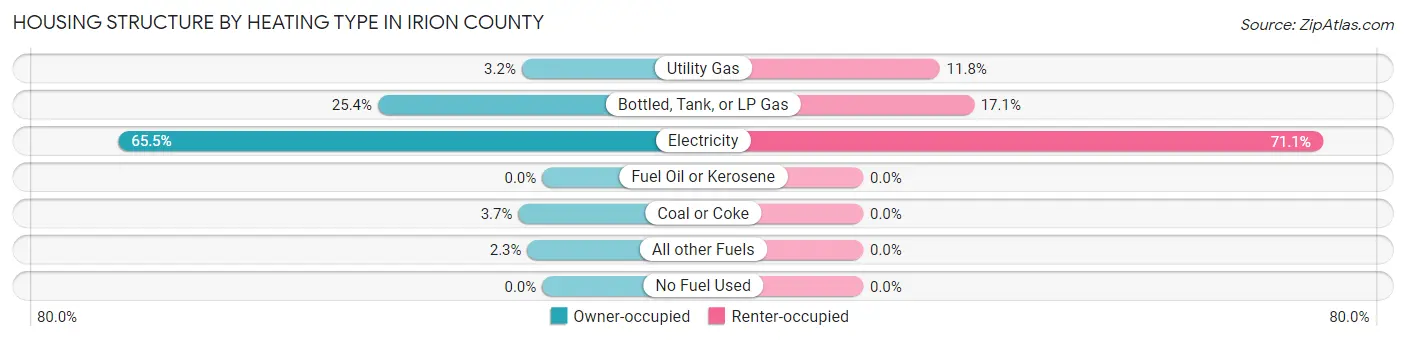
| Heating Type | Owner-occupied | Renter-occupied |
| Utility Gas | 18 (3.2%) | 9 (11.8%) |
| Bottled, Tank, or LP Gas | 145 (25.4%) | 13 (17.1%) |
| Electricity | 374 (65.5%) | 54 (71.1%) |
| Fuel Oil or Kerosene | 0 (0.0%) | 0 (0.0%) |
| Coal or Coke | 21 (3.7%) | 0 (0.0%) |
| All other Fuels | 13 (2.3%) | 0 (0.0%) |
| No Fuel Used | 0 (0.0%) | 0 (0.0%) |
| Total | 571 (100.0%) | 76 (100.0%) |
Household Vehicle Usage in Irion County
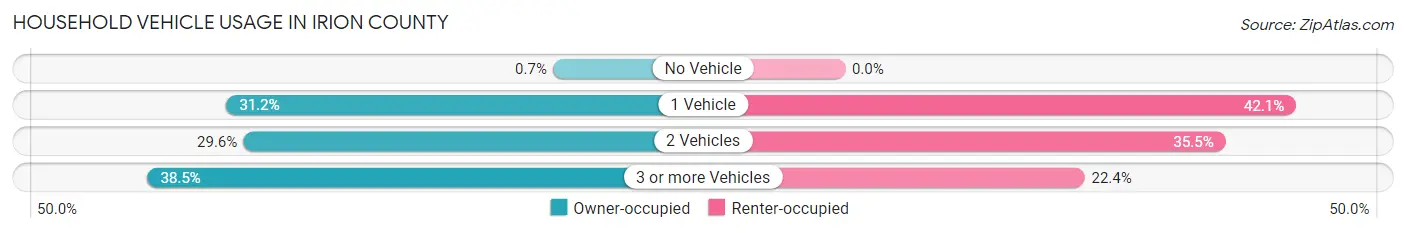
| Vehicles per Household | Owner-occupied | Renter-occupied |
| No Vehicle | 4 (0.7%) | 0 (0.0%) |
| 1 Vehicle | 178 (31.2%) | 32 (42.1%) |
| 2 Vehicles | 169 (29.6%) | 27 (35.5%) |
| 3 or more Vehicles | 220 (38.5%) | 17 (22.4%) |
| Total | 571 (100.0%) | 76 (100.0%) |
Real Estate & Mortgages in Irion County
Real Estate and Mortgage Overview in Irion County
| Characteristic | Without Mortgage | With Mortgage |
| Housing Units | 369 | 202 |
| Median Property Value | $113,100 | $205,600 |
| Median Household Income | $51,063 | $27 |
| Monthly Housing Costs | $548 | $4 |
| Real Estate Taxes | $1,108 | $0 |
Property Value by Mortgage Status in Irion County
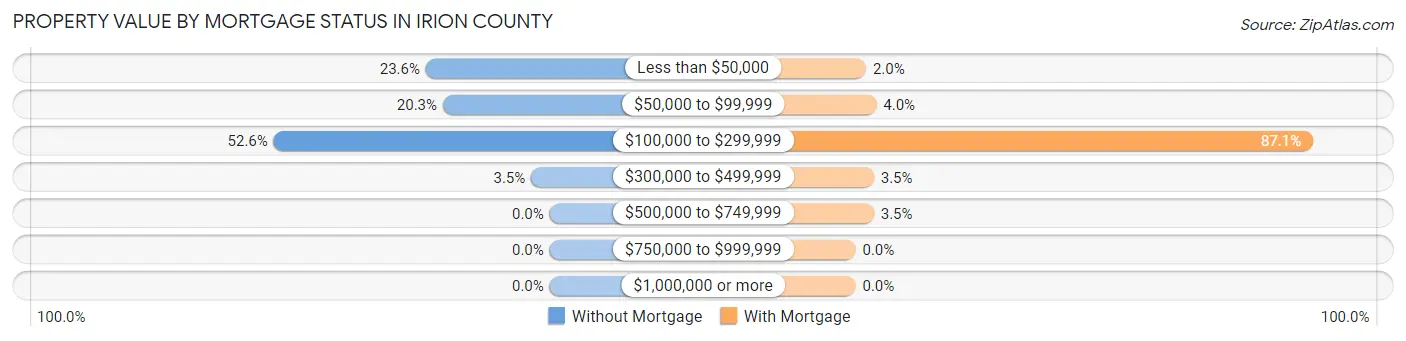
| Property Value | Without Mortgage | With Mortgage |
| Less than $50,000 | 87 (23.6%) | 4 (2.0%) |
| $50,000 to $99,999 | 75 (20.3%) | 8 (4.0%) |
| $100,000 to $299,999 | 194 (52.6%) | 176 (87.1%) |
| $300,000 to $499,999 | 13 (3.5%) | 7 (3.5%) |
| $500,000 to $749,999 | 0 (0.0%) | 7 (3.5%) |
| $750,000 to $999,999 | 0 (0.0%) | 0 (0.0%) |
| $1,000,000 or more | 0 (0.0%) | 0 (0.0%) |
| Total | 369 (100.0%) | 202 (100.0%) |
Household Income by Mortgage Status in Irion County
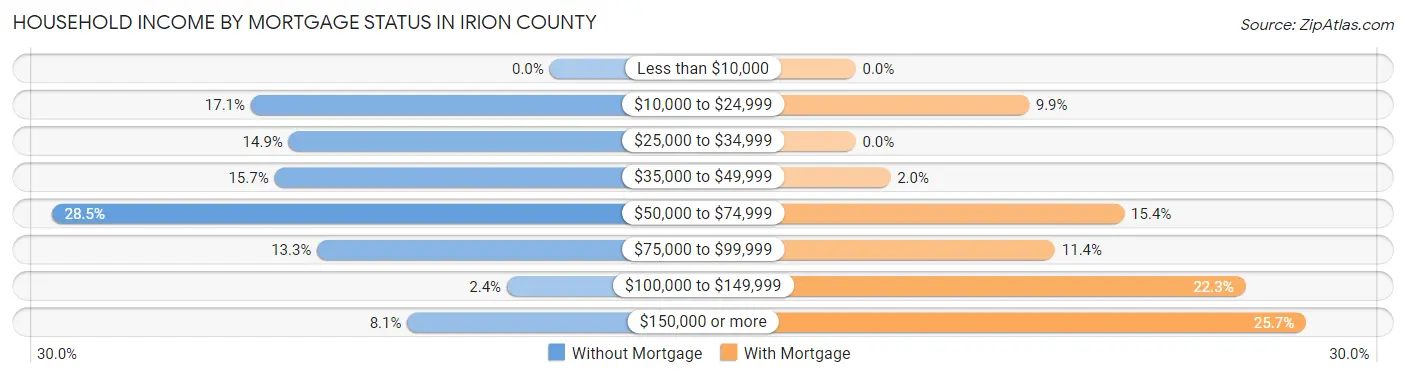
| Household Income | Without Mortgage | With Mortgage |
| Less than $10,000 | 0 (0.0%) | 0 (0.0%) |
| $10,000 to $24,999 | 63 (17.1%) | 20 (9.9%) |
| $25,000 to $34,999 | 55 (14.9%) | 0 (0.0%) |
| $35,000 to $49,999 | 58 (15.7%) | 4 (2.0%) |
| $50,000 to $74,999 | 105 (28.5%) | 31 (15.3%) |
| $75,000 to $99,999 | 49 (13.3%) | 23 (11.4%) |
| $100,000 to $149,999 | 9 (2.4%) | 45 (22.3%) |
| $150,000 or more | 30 (8.1%) | 52 (25.7%) |
| Total | 369 (100.0%) | 202 (100.0%) |
Property Value to Household Income Ratio in Irion County
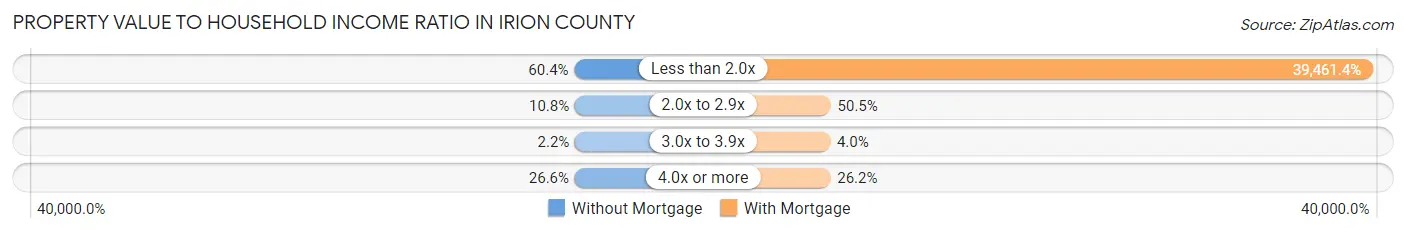
| Value-to-Income Ratio | Without Mortgage | With Mortgage |
| Less than 2.0x | 223 (60.4%) | 79,712 (39,461.4%) |
| 2.0x to 2.9x | 40 (10.8%) | 102 (50.5%) |
| 3.0x to 3.9x | 8 (2.2%) | 8 (4.0%) |
| 4.0x or more | 98 (26.6%) | 53 (26.2%) |
| Total | 369 (100.0%) | 202 (100.0%) |
Real Estate Taxes by Mortgage Status in Irion County
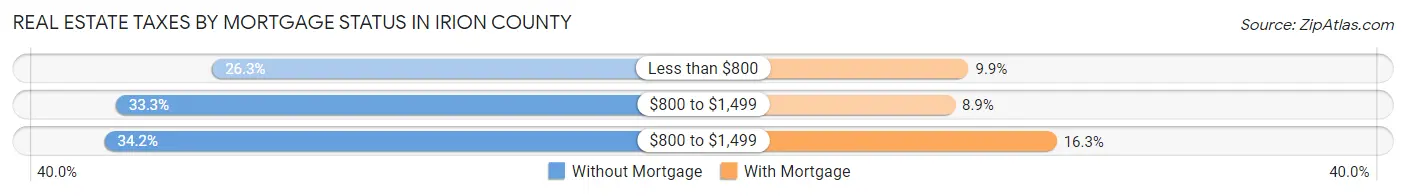
| Property Taxes | Without Mortgage | With Mortgage |
| Less than $800 | 97 (26.3%) | 20 (9.9%) |
| $800 to $1,499 | 123 (33.3%) | 18 (8.9%) |
| $800 to $1,499 | 126 (34.2%) | 33 (16.3%) |
| Total | 369 (100.0%) | 202 (100.0%) |
Health & Disability in Irion County
Health Insurance Coverage by Age in Irion County
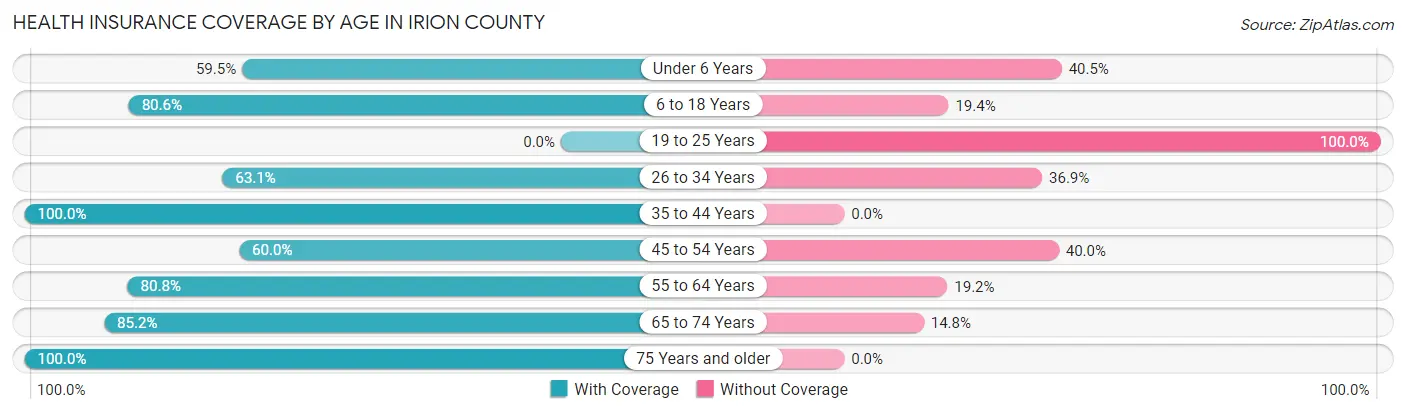
| Age Bracket | With Coverage | Without Coverage |
| Under 6 Years | 66 (59.5%) | 45 (40.5%) |
| 6 to 18 Years | 253 (80.6%) | 61 (19.4%) |
| 19 to 25 Years | 0 (0.0%) | 17 (100.0%) |
| 26 to 34 Years | 130 (63.1%) | 76 (36.9%) |
| 35 to 44 Years | 181 (100.0%) | 0 (0.0%) |
| 45 to 54 Years | 99 (60.0%) | 66 (40.0%) |
| 55 to 64 Years | 206 (80.8%) | 49 (19.2%) |
| 65 to 74 Years | 178 (85.2%) | 31 (14.8%) |
| 75 Years and older | 94 (100.0%) | 0 (0.0%) |
| Total | 1,207 (77.8%) | 345 (22.2%) |
Health Insurance Coverage by Citizenship Status in Irion County
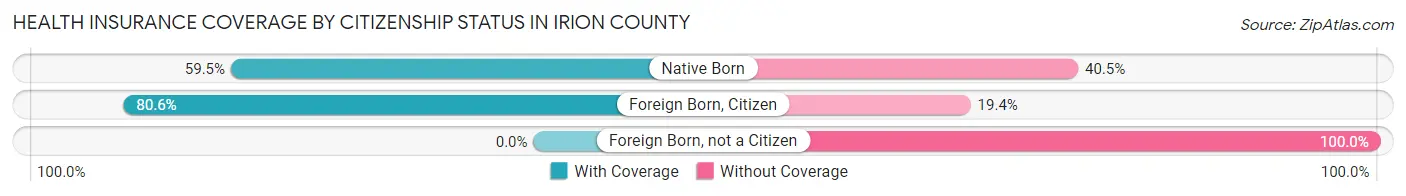
| Citizenship Status | With Coverage | Without Coverage |
| Native Born | 66 (59.5%) | 45 (40.5%) |
| Foreign Born, Citizen | 253 (80.6%) | 61 (19.4%) |
| Foreign Born, not a Citizen | 0 (0.0%) | 17 (100.0%) |
Health Insurance Coverage by Household Income in Irion County
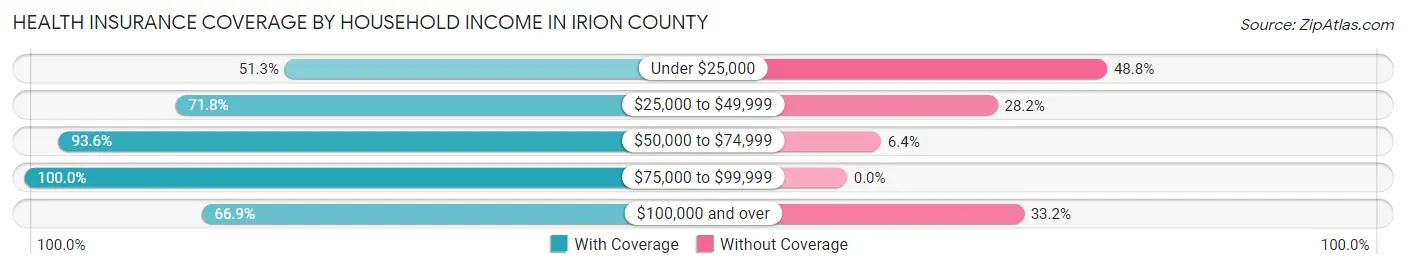
| Household Income | With Coverage | Without Coverage |
| Under $25,000 | 82 (51.2%) | 78 (48.7%) |
| $25,000 to $49,999 | 183 (71.8%) | 72 (28.2%) |
| $50,000 to $74,999 | 249 (93.6%) | 17 (6.4%) |
| $75,000 to $99,999 | 334 (100.0%) | 0 (0.0%) |
| $100,000 and over | 359 (66.8%) | 178 (33.2%) |
Public vs Private Health Insurance Coverage by Age in Irion County
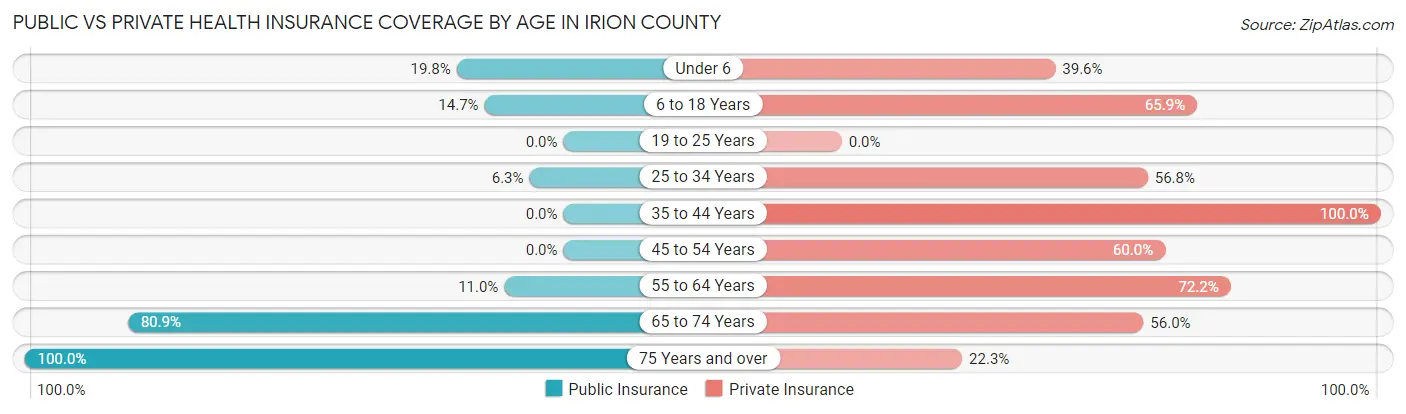
| Age Bracket | Public Insurance | Private Insurance |
| Under 6 | 22 (19.8%) | 44 (39.6%) |
| 6 to 18 Years | 46 (14.6%) | 207 (65.9%) |
| 19 to 25 Years | 0 (0.0%) | 0 (0.0%) |
| 25 to 34 Years | 13 (6.3%) | 117 (56.8%) |
| 35 to 44 Years | 0 (0.0%) | 181 (100.0%) |
| 45 to 54 Years | 0 (0.0%) | 99 (60.0%) |
| 55 to 64 Years | 28 (11.0%) | 184 (72.2%) |
| 65 to 74 Years | 169 (80.9%) | 117 (56.0%) |
| 75 Years and over | 94 (100.0%) | 21 (22.3%) |
| Total | 372 (24.0%) | 970 (62.5%) |
Disability Status by Sex by Age in Irion County
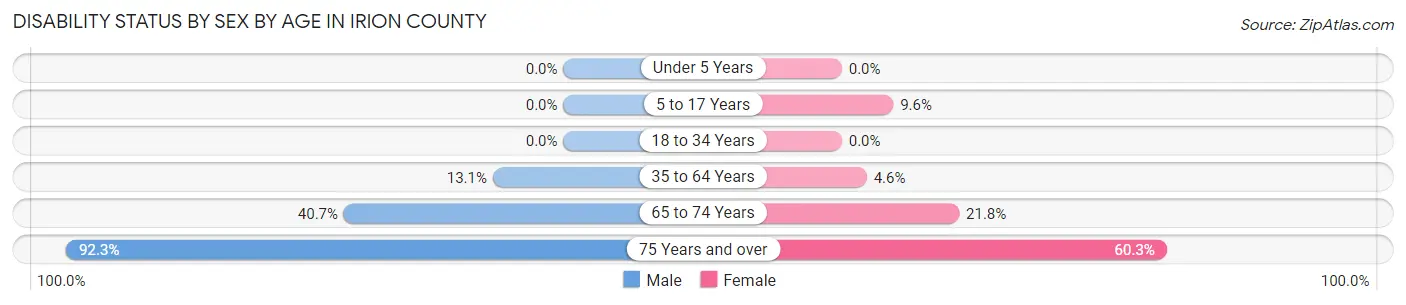
| Age Bracket | Male | Female |
| Under 5 Years | 0 (0.0%) | 0 (0.0%) |
| 5 to 17 Years | 0 (0.0%) | 17 (9.6%) |
| 18 to 34 Years | 0 (0.0%) | 0 (0.0%) |
| 35 to 64 Years | 39 (13.1%) | 14 (4.6%) |
| 65 to 74 Years | 44 (40.7%) | 22 (21.8%) |
| 75 Years and over | 24 (92.3%) | 41 (60.3%) |
Disability Class by Sex by Age in Irion County
Disability Class: Hearing Difficulty
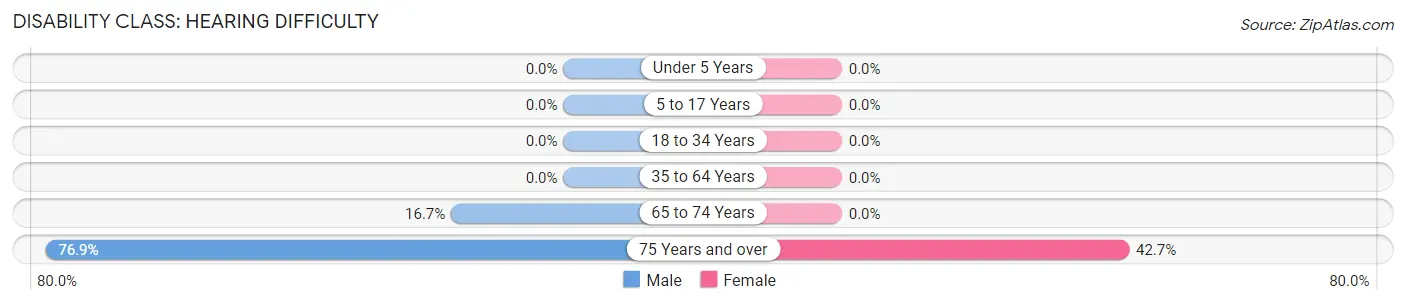
| Age Bracket | Male | Female |
| Under 5 Years | 0 (0.0%) | 0 (0.0%) |
| 5 to 17 Years | 0 (0.0%) | 0 (0.0%) |
| 18 to 34 Years | 0 (0.0%) | 0 (0.0%) |
| 35 to 64 Years | 0 (0.0%) | 0 (0.0%) |
| 65 to 74 Years | 18 (16.7%) | 0 (0.0%) |
| 75 Years and over | 20 (76.9%) | 29 (42.6%) |
Disability Class: Vision Difficulty
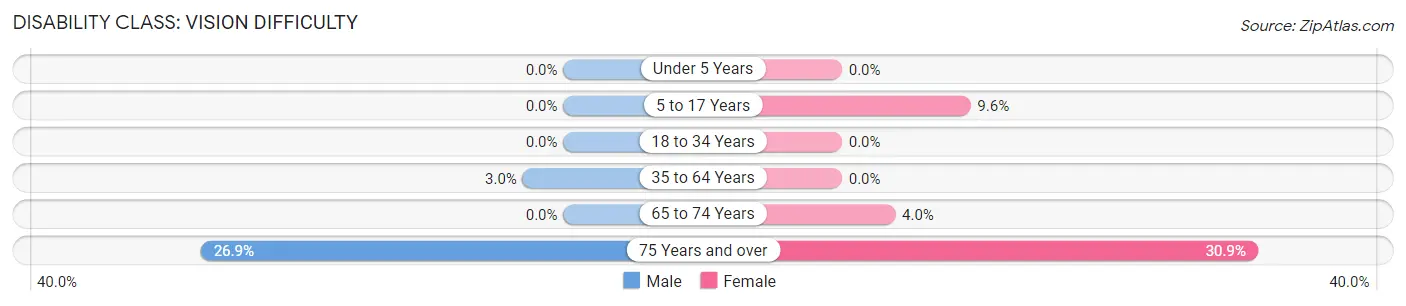
| Age Bracket | Male | Female |
| Under 5 Years | 0 (0.0%) | 0 (0.0%) |
| 5 to 17 Years | 0 (0.0%) | 17 (9.6%) |
| 18 to 34 Years | 0 (0.0%) | 0 (0.0%) |
| 35 to 64 Years | 9 (3.0%) | 0 (0.0%) |
| 65 to 74 Years | 0 (0.0%) | 4 (4.0%) |
| 75 Years and over | 7 (26.9%) | 21 (30.9%) |
Disability Class: Cognitive Difficulty
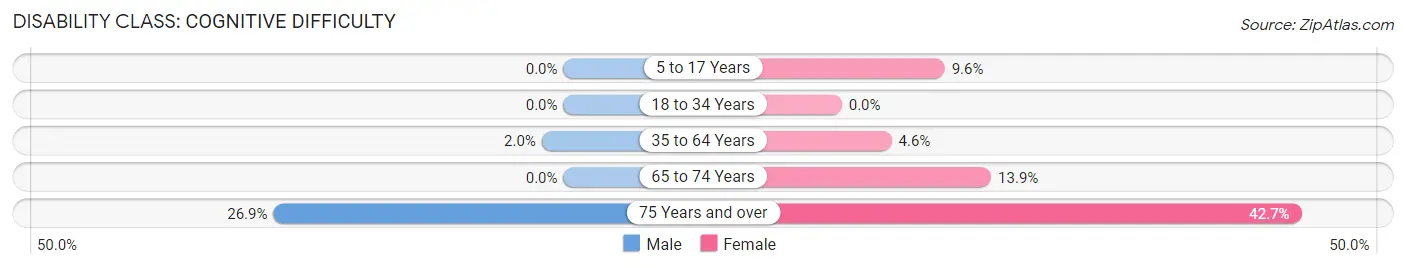
| Age Bracket | Male | Female |
| 5 to 17 Years | 0 (0.0%) | 17 (9.6%) |
| 18 to 34 Years | 0 (0.0%) | 0 (0.0%) |
| 35 to 64 Years | 6 (2.0%) | 14 (4.6%) |
| 65 to 74 Years | 0 (0.0%) | 14 (13.9%) |
| 75 Years and over | 7 (26.9%) | 29 (42.6%) |
Disability Class: Ambulatory Difficulty
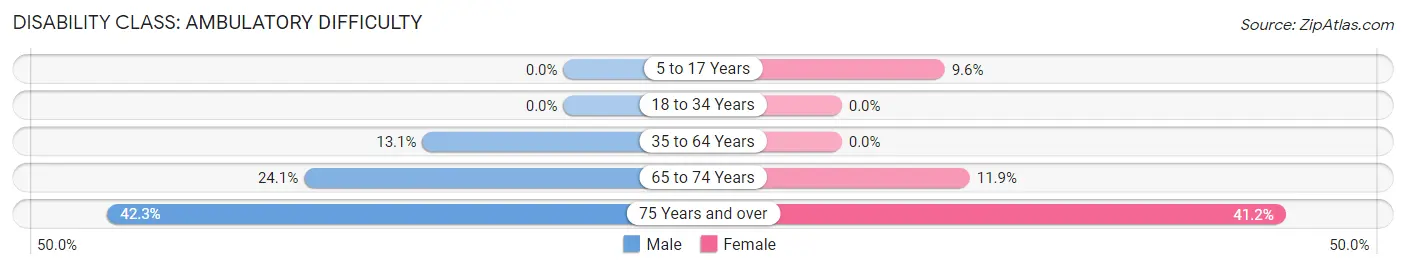
| Age Bracket | Male | Female |
| 5 to 17 Years | 0 (0.0%) | 17 (9.6%) |
| 18 to 34 Years | 0 (0.0%) | 0 (0.0%) |
| 35 to 64 Years | 39 (13.1%) | 0 (0.0%) |
| 65 to 74 Years | 26 (24.1%) | 12 (11.9%) |
| 75 Years and over | 11 (42.3%) | 28 (41.2%) |
Disability Class: Self-Care Difficulty
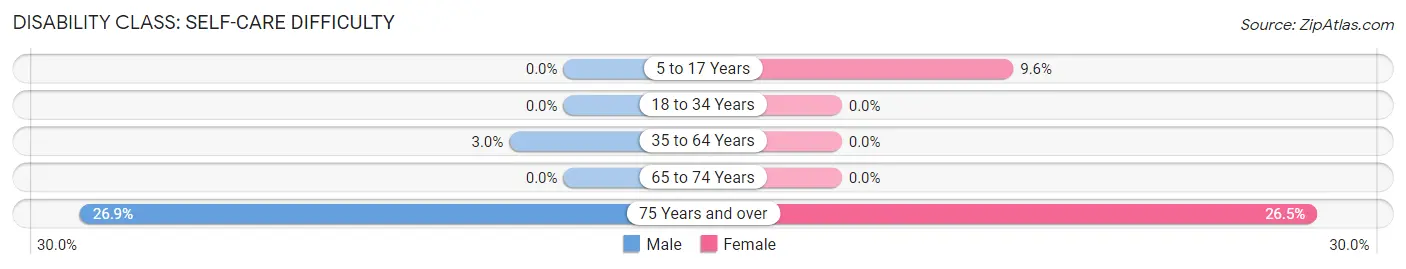
| Age Bracket | Male | Female |
| 5 to 17 Years | 0 (0.0%) | 17 (9.6%) |
| 18 to 34 Years | 0 (0.0%) | 0 (0.0%) |
| 35 to 64 Years | 9 (3.0%) | 0 (0.0%) |
| 65 to 74 Years | 0 (0.0%) | 0 (0.0%) |
| 75 Years and over | 7 (26.9%) | 18 (26.5%) |
Technology Access in Irion County
Computing Device Access in Irion County
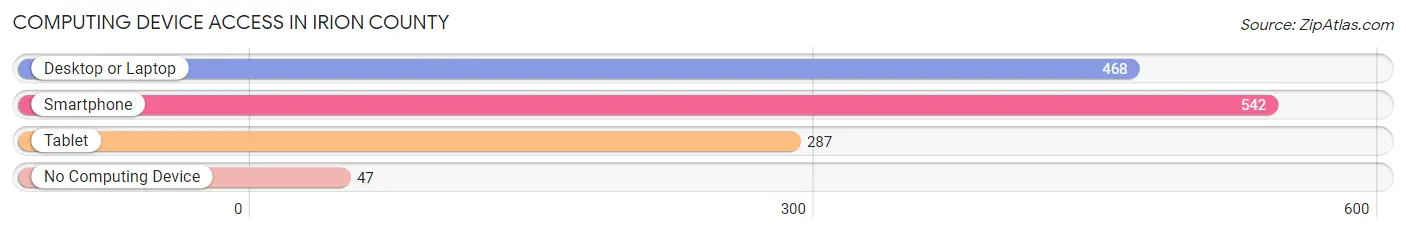
| Device Type | # Households | % Households |
| Desktop or Laptop | 468 | 72.3% |
| Smartphone | 542 | 83.8% |
| Tablet | 287 | 44.4% |
| No Computing Device | 47 | 7.3% |
| Total | 647 | 100.0% |
Internet Access in Irion County
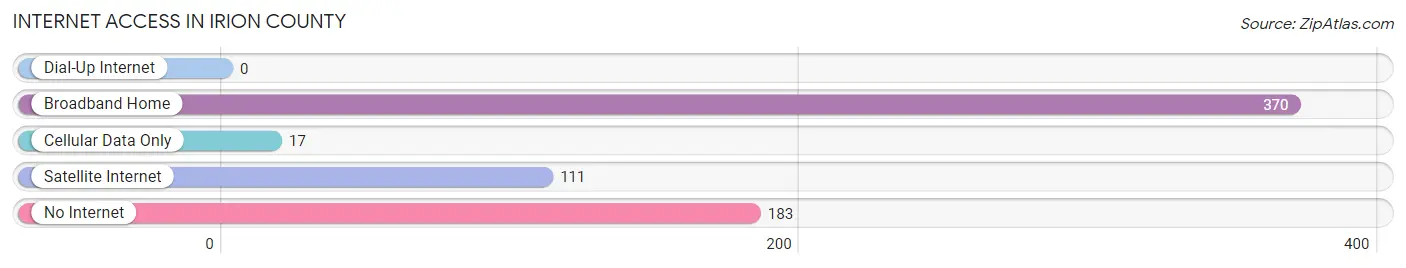
| Internet Type | # Households | % Households |
| Dial-Up Internet | 0 | 0.0% |
| Broadband Home | 370 | 57.2% |
| Cellular Data Only | 17 | 2.6% |
| Satellite Internet | 111 | 17.2% |
| No Internet | 183 | 28.3% |
| Total | 647 | 100.0% |
Irion County Summary
Irion County is located in the state of Texas, in the United States of America. It is situated in the Concho Valley region of the state, and is bordered by Tom Green County to the north, Reagan County to the east, Crockett County to the south, and Schleicher County to the west. The county seat is Mertzon, and the county has a total area of 902 square miles.
History
Irion County was established in 1876, and was named after Robert Anderson Irion, who was a signer of the Texas Declaration of Independence. The county was originally part of Tom Green County, but was later split off to form its own county. The first settlers in the area were ranchers, who were attracted to the area due to its abundance of grass and water. The first town in the county was Mertzon, which was established in 1881.
Geography
Irion County is located in the Concho Valley region of Texas. The terrain is mostly flat, with some rolling hills in the northern part of the county. The county is drained by the Concho River, which flows through the county from north to south. The county is also home to several small lakes, including Lake Spence and Lake O.H. Ivie.
The climate of Irion County is semi-arid, with hot summers and mild winters. The average annual temperature is around 68 degrees Fahrenheit, and the average annual precipitation is around 20 inches.
Economy
The economy of Irion County is largely based on agriculture and ranching. The county is home to several large ranches, and the main crops grown in the area are cotton, wheat, and sorghum. The county is also home to several oil and gas fields, and the oil and gas industry is a major contributor to the local economy.
Demographics
As of the 2010 census, the population of Irion County was 3,301. The population is spread out across the county, with the largest population centers being Mertzon and Barnhart. The racial makeup of the county is predominantly white, with a small Hispanic population. The median household income in the county is around $41,000, and the median home value is around $90,000.
Irion County is a rural county, and the majority of the population is employed in the agricultural and ranching industries. The county is also home to several small businesses, including restaurants, retail stores, and service providers.
Conclusion
Irion County is a rural county located in the Concho Valley region of Texas. The county has a long history, and is home to several large ranches and oil and gas fields. The population of the county is predominantly white, and the median household income is around $41,000. The economy of the county is largely based on agriculture and ranching, and the county is also home to several small businesses.
Common Questions
What is Per Capita Income in Irion County?
Per Capita income in Irion County is $29,664.
What is the Median Family Income in Irion County?
Median Family Income in Irion County is $74,844.
What is the Median Household income in Irion County?
Median Household Income in Irion County is $54,708.
What is Income or Wage Gap in Irion County?
Income or Wage Gap in Irion County is 46.9%.
Women in Irion County earn 53.1 cents for every dollar earned by a man.
What is Inequality or Gini Index in Irion County?
Inequality or Gini Index in Irion County is 0.39.
What is the Total Population of Irion County?
Total Population of Irion County is 1,561.
What is the Total Male Population of Irion County?
Total Male Population of Irion County is 748.
What is the Total Female Population of Irion County?
Total Female Population of Irion County is 813.
What is the Ratio of Males per 100 Females in Irion County?
There are 92.00 Males per 100 Females in Irion County.
What is the Ratio of Females per 100 Males in Irion County?
There are 108.69 Females per 100 Males in Irion County.
What is the Median Population Age in Irion County?
Median Population Age in Irion County is 39.5 Years.
What is the Average Family Size in Irion County
Average Family Size in Irion County is 3.3 People.
What is the Average Household Size in Irion County
Average Household Size in Irion County is 2.4 People.
How Large is the Labor Force in Irion County?
There are 721 People in the Labor Forcein in Irion County.
What is the Percentage of People in the Labor Force in Irion County?
61.3% of People are in the Labor Force in Irion County.
What is the Unemployment Rate in Irion County?
Unemployment Rate in Irion County is 1.3%.