Hutchinson County, TX Map & Demographics
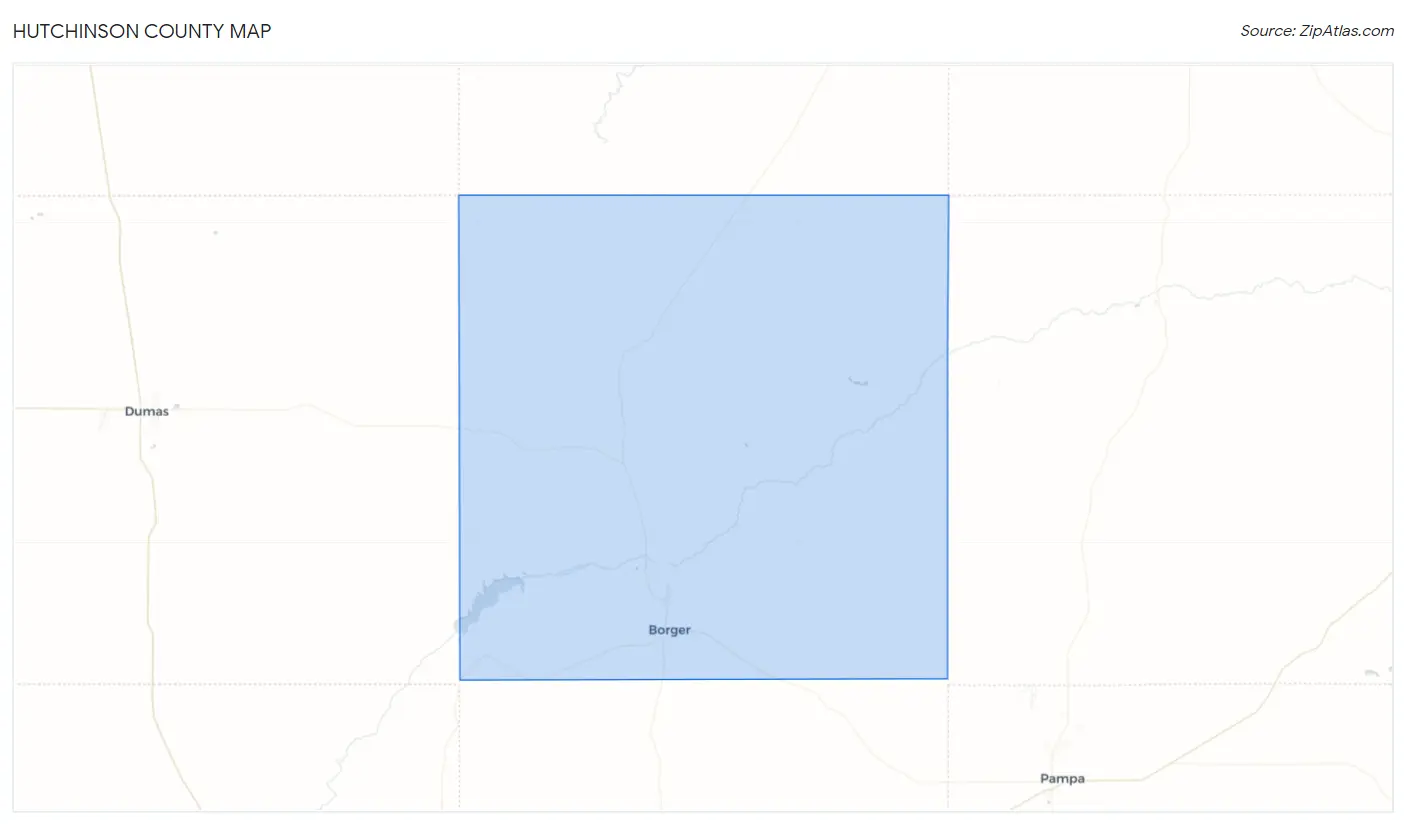
Hutchinson County Map
Hutchinson County Overview
$30,038
PER CAPITA INCOME
$80,865
AVG FAMILY INCOME
$62,211
AVG HOUSEHOLD INCOME
46.2%
WAGE / INCOME GAP [ % ]
53.8¢/ $1
WAGE / INCOME GAP [ $ ]
$10,157
FAMILY INCOME DEFICIT
0.42
INEQUALITY / GINI INDEX
20,595
TOTAL POPULATION
10,552
MALE POPULATION
10,043
FEMALE POPULATION
105.07
MALES / 100 FEMALES
95.18
FEMALES / 100 MALES
38.3
MEDIAN AGE
3.9
AVG FAMILY SIZE
3.0
AVG HOUSEHOLD SIZE
9,675
LABOR FORCE [ PEOPLE ]
60.3%
PERCENT IN LABOR FORCE
4.3%
UNEMPLOYMENT RATE
Hutchinson County Area Codes
Income in Hutchinson County
Income Overview in Hutchinson County
Per Capita Income in Hutchinson County is $30,038, while median incomes of families and households are $80,865 and $62,211 respectively.
| Characteristic | Number | Measure |
| Per Capita Income | 20,595 | $30,038 |
| Median Family Income | 4,492 | $80,865 |
| Mean Family Income | 4,492 | $96,504 |
| Median Household Income | 6,711 | $62,211 |
| Mean Household Income | 6,711 | $79,929 |
| Income Deficit | 4,492 | $10,157 |
| Wage / Income Gap (%) | 20,595 | 46.17% |
| Wage / Income Gap ($) | 20,595 | 53.83¢ per $1 |
| Gini / Inequality Index | 20,595 | 0.42 |
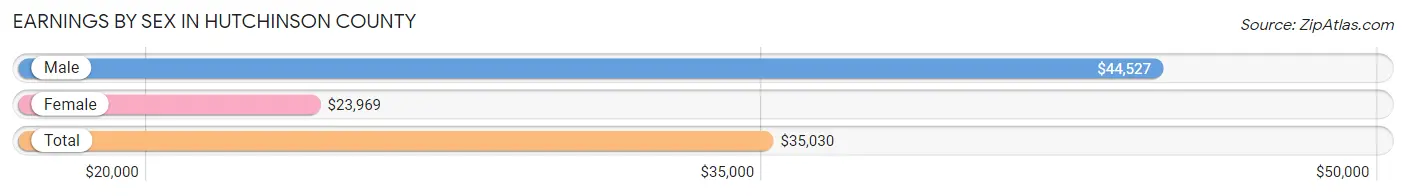
Earnings by Sex in Hutchinson County
Average Earnings in Hutchinson County are $35,030, $44,527 for men and $23,969 for women, a difference of 46.2%.
| Sex | Number | Average Earnings |
| Male | 5,743 (55.9%) | $44,527 |
| Female | 4,533 (44.1%) | $23,969 |
| Total | 10,276 (100.0%) | $35,030 |
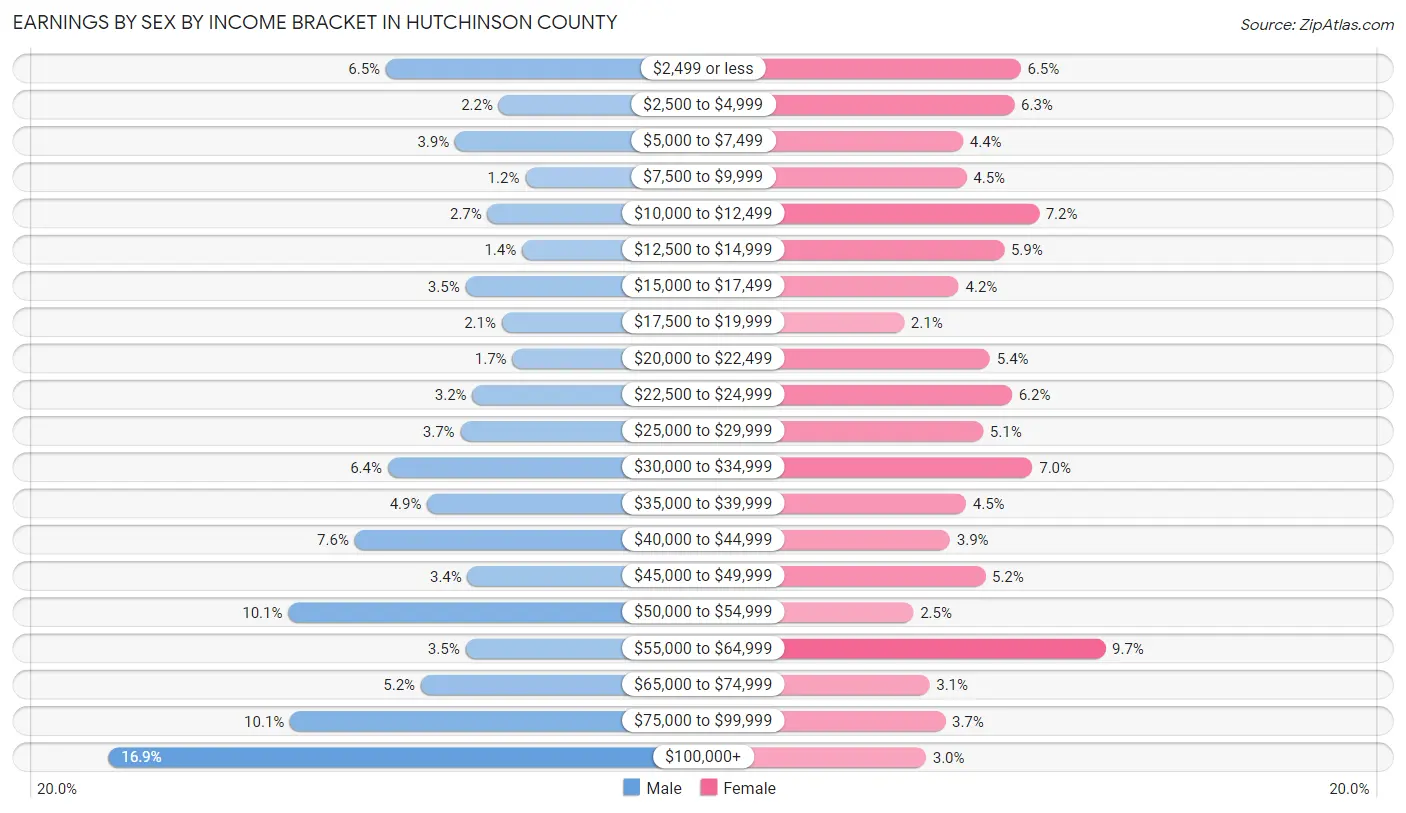
Earnings by Sex by Income Bracket in Hutchinson County
The most common earnings brackets in Hutchinson County are $100,000+ for men (968 | 16.9%) and $55,000 to $64,999 for women (439 | 9.7%).
| Income | Male | Female |
| $2,499 or less | 371 (6.5%) | 295 (6.5%) |
| $2,500 to $4,999 | 128 (2.2%) | 284 (6.3%) |
| $5,000 to $7,499 | 222 (3.9%) | 197 (4.3%) |
| $7,500 to $9,999 | 71 (1.2%) | 203 (4.5%) |
| $10,000 to $12,499 | 152 (2.6%) | 326 (7.2%) |
| $12,500 to $14,999 | 78 (1.4%) | 267 (5.9%) |
| $15,000 to $17,499 | 200 (3.5%) | 190 (4.2%) |
| $17,500 to $19,999 | 122 (2.1%) | 97 (2.1%) |
| $20,000 to $22,499 | 99 (1.7%) | 243 (5.4%) |
| $22,500 to $24,999 | 185 (3.2%) | 280 (6.2%) |
| $25,000 to $29,999 | 211 (3.7%) | 231 (5.1%) |
| $30,000 to $34,999 | 367 (6.4%) | 315 (7.0%) |
| $35,000 to $39,999 | 282 (4.9%) | 202 (4.5%) |
| $40,000 to $44,999 | 438 (7.6%) | 175 (3.9%) |
| $45,000 to $49,999 | 195 (3.4%) | 235 (5.2%) |
| $50,000 to $54,999 | 581 (10.1%) | 113 (2.5%) |
| $55,000 to $64,999 | 200 (3.5%) | 439 (9.7%) |
| $65,000 to $74,999 | 296 (5.1%) | 140 (3.1%) |
| $75,000 to $99,999 | 577 (10.1%) | 167 (3.7%) |
| $100,000+ | 968 (16.9%) | 134 (3.0%) |
| Total | 5,743 (100.0%) | 4,533 (100.0%) |
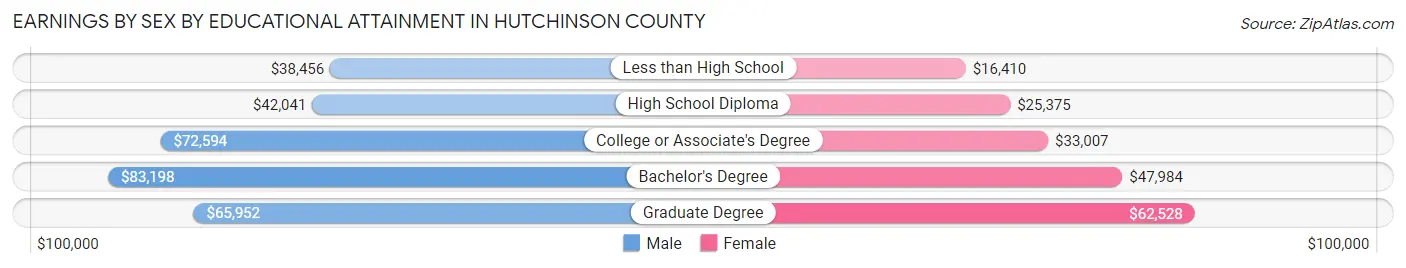
Earnings by Sex by Educational Attainment in Hutchinson County
Average earnings in Hutchinson County are $51,661 for men and $30,591 for women, a difference of 40.8%. Men with an educational attainment of bachelor's degree enjoy the highest average annual earnings of $83,198, while those with less than high school education earn the least with $38,456. Women with an educational attainment of graduate degree earn the most with the average annual earnings of $62,528, while those with less than high school education have the smallest earnings of $16,410.
| Educational Attainment | Male Income | Female Income |
| Less than High School | $38,456 | $16,410 |
| High School Diploma | $42,041 | $25,375 |
| College or Associate's Degree | $72,594 | $33,007 |
| Bachelor's Degree | $83,198 | $47,984 |
| Graduate Degree | $65,952 | $62,528 |
| Total | $51,661 | $30,591 |
Family Income in Hutchinson County
Family Income Brackets in Hutchinson County
According to the Hutchinson County family income data, there are 1,123 families falling into the $100,000 to $149,999 income range, which is the most common income bracket and makes up 25.0% of all families. Conversely, the $10,000 to $14,999 income bracket is the least frequent group with only 54 families (1.2%) belonging to this category.
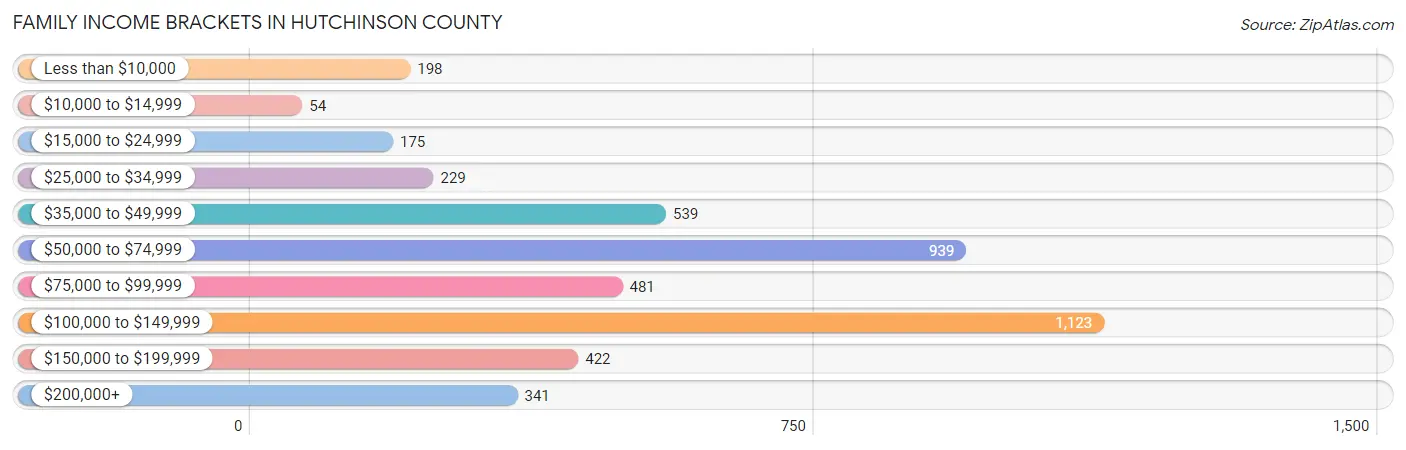
| Income Bracket | # Families | % Families |
| Less than $10,000 | 198 | 4.4% |
| $10,000 to $14,999 | 54 | 1.2% |
| $15,000 to $24,999 | 175 | 3.9% |
| $25,000 to $34,999 | 229 | 5.1% |
| $35,000 to $49,999 | 539 | 12.0% |
| $50,000 to $74,999 | 939 | 20.9% |
| $75,000 to $99,999 | 481 | 10.7% |
| $100,000 to $149,999 | 1,123 | 25.0% |
| $150,000 to $199,999 | 422 | 9.4% |
| $200,000+ | 341 | 7.6% |
Family Income by Famaliy Size in Hutchinson County
6-person families (89 | 2.0%) account for the highest median family income in Hutchinson County with $137,250 per family, while 2-person families (2,486 | 55.3%) have the highest median income of $35,224 per family member.
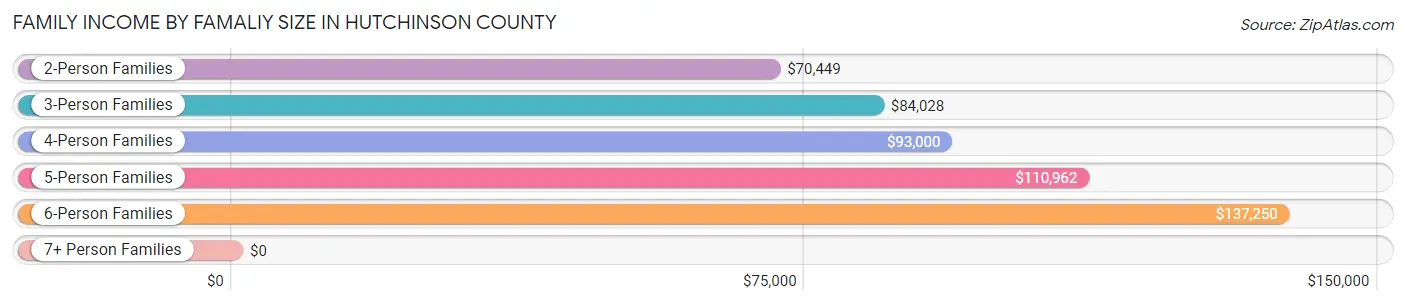
| Income Bracket | # Families | Median Income |
| 2-Person Families | 2,486 (55.3%) | $70,449 |
| 3-Person Families | 835 (18.6%) | $84,028 |
| 4-Person Families | 722 (16.1%) | $93,000 |
| 5-Person Families | 352 (7.8%) | $110,962 |
| 6-Person Families | 89 (2.0%) | $137,250 |
| 7+ Person Families | 8 (0.2%) | $0 |
| Total | 4,492 (100.0%) | $80,865 |
Family Income by Number of Earners in Hutchinson County
The median family income in Hutchinson County is $80,865, with families comprising 3+ earners (472) having the highest median family income of $156,833, while families with no earners (779) have the lowest median family income of $48,411, accounting for 10.5% and 17.3% of families, respectively.
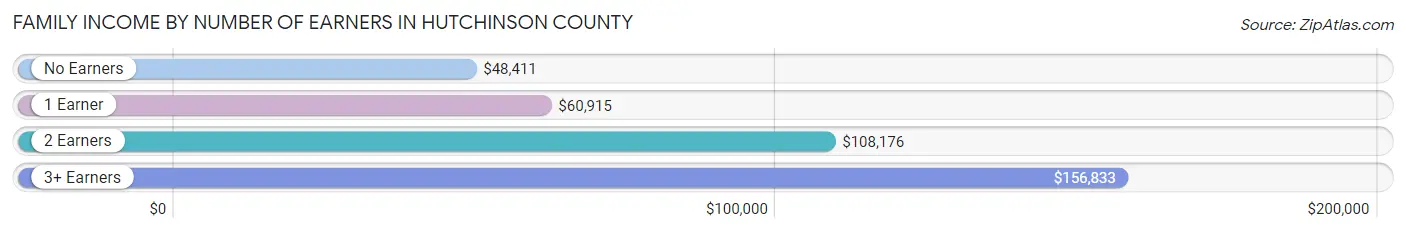
| Number of Earners | # Families | Median Income |
| No Earners | 779 (17.3%) | $48,411 |
| 1 Earner | 1,643 (36.6%) | $60,915 |
| 2 Earners | 1,598 (35.6%) | $108,176 |
| 3+ Earners | 472 (10.5%) | $156,833 |
| Total | 4,492 (100.0%) | $80,865 |
Household Income in Hutchinson County
Household Income Brackets in Hutchinson County
With 1,295 households falling in the category, the $100,000 to $149,999 income range is the most frequent in Hutchinson County, accounting for 19.3% of all households. In contrast, only 242 households (3.6%) fall into the $10,000 to $14,999 income bracket, making it the least populous group.
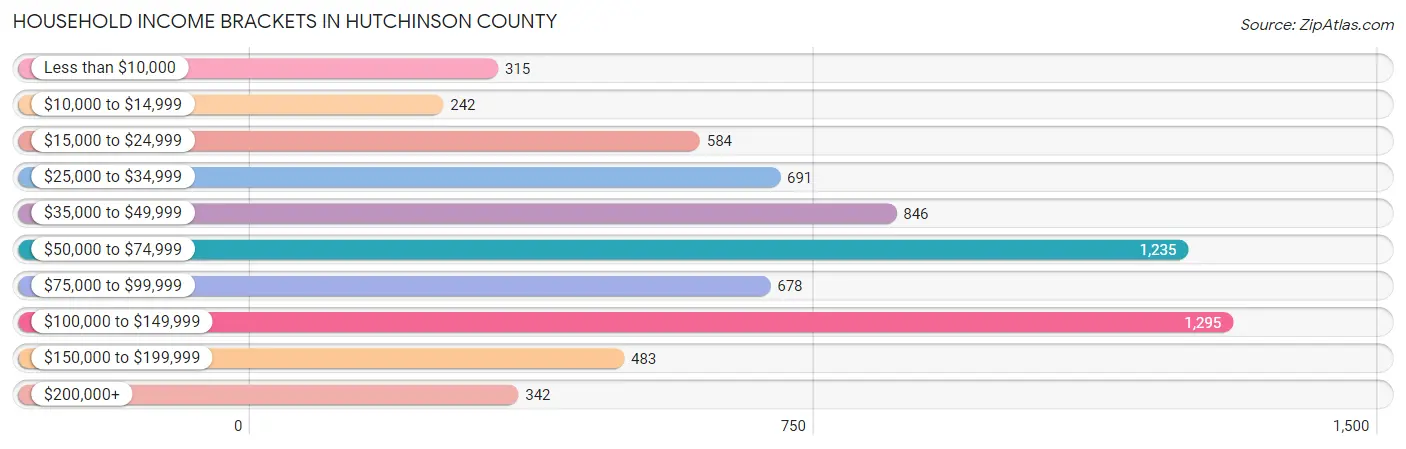
| Income Bracket | # Households | % Households |
| Less than $10,000 | 315 | 4.7% |
| $10,000 to $14,999 | 242 | 3.6% |
| $15,000 to $24,999 | 584 | 8.7% |
| $25,000 to $34,999 | 691 | 10.3% |
| $35,000 to $49,999 | 846 | 12.6% |
| $50,000 to $74,999 | 1,235 | 18.4% |
| $75,000 to $99,999 | 678 | 10.1% |
| $100,000 to $149,999 | 1,295 | 19.3% |
| $150,000 to $199,999 | 483 | 7.2% |
| $200,000+ | 342 | 5.1% |
Household Income by Householder Age in Hutchinson County
The median household income in Hutchinson County is $62,211, with the highest median household income of $90,114 found in the 25 to 44 years age bracket for the primary householder. A total of 1,801 households (26.8%) fall into this category. Meanwhile, the 15 to 24 years age bracket for the primary householder has the lowest median household income of $36,750, with 176 households (2.6%) in this group.
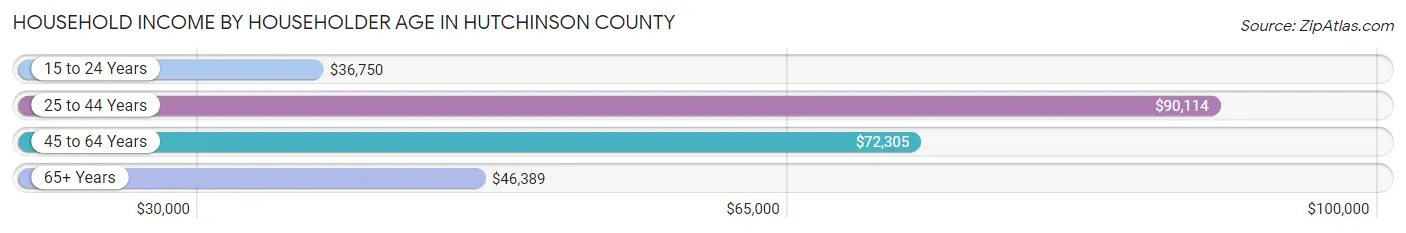
| Income Bracket | # Households | Median Income |
| 15 to 24 Years | 176 (2.6%) | $36,750 |
| 25 to 44 Years | 1,801 (26.8%) | $90,114 |
| 45 to 64 Years | 2,498 (37.2%) | $72,305 |
| 65+ Years | 2,236 (33.3%) | $46,389 |
| Total | 6,711 (100.0%) | $62,211 |
Poverty in Hutchinson County
Income Below Poverty by Sex and Age in Hutchinson County
With 8.8% poverty level for males and 12.0% for females among the residents of Hutchinson County, under 5 year old males and 6 to 11 year old females are the most vulnerable to poverty, with 180 males (28.3%) and 176 females (17.6%) in their respective age groups living below the poverty level.
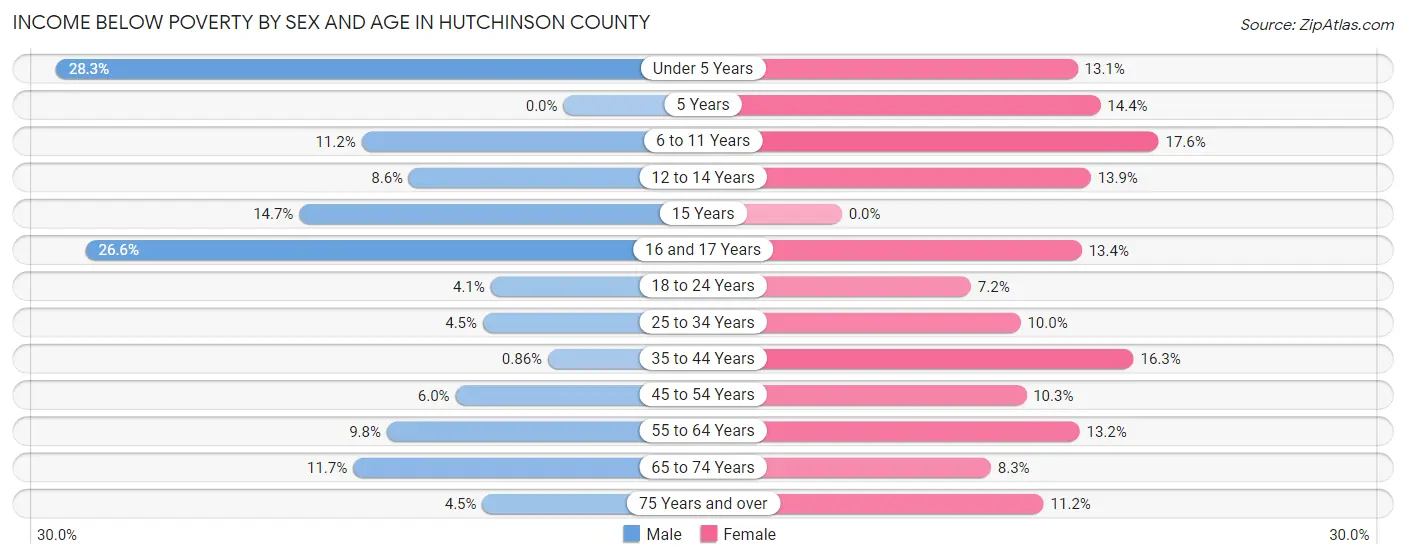
| Age Bracket | Male | Female |
| Under 5 Years | 180 (28.3%) | 76 (13.1%) |
| 5 Years | 0 (0.0%) | 18 (14.4%) |
| 6 to 11 Years | 110 (11.2%) | 176 (17.6%) |
| 12 to 14 Years | 40 (8.6%) | 47 (13.9%) |
| 15 Years | 25 (14.7%) | 0 (0.0%) |
| 16 and 17 Years | 100 (26.6%) | 31 (13.4%) |
| 18 to 24 Years | 41 (4.1%) | 60 (7.2%) |
| 25 to 34 Years | 63 (4.5%) | 106 (10.0%) |
| 35 to 44 Years | 11 (0.9%) | 223 (16.3%) |
| 45 to 54 Years | 65 (6.0%) | 114 (10.3%) |
| 55 to 64 Years | 131 (9.8%) | 168 (13.2%) |
| 65 to 74 Years | 128 (11.7%) | 85 (8.3%) |
| 75 Years and over | 26 (4.5%) | 90 (11.2%) |
| Total | 920 (8.8%) | 1,194 (12.0%) |
Income Above Poverty by Sex and Age in Hutchinson County
According to the poverty statistics in Hutchinson County, males aged 5 years and females aged 15 years are the age groups that are most secure financially, with 100.0% of males and 100.0% of females in these age groups living above the poverty line.
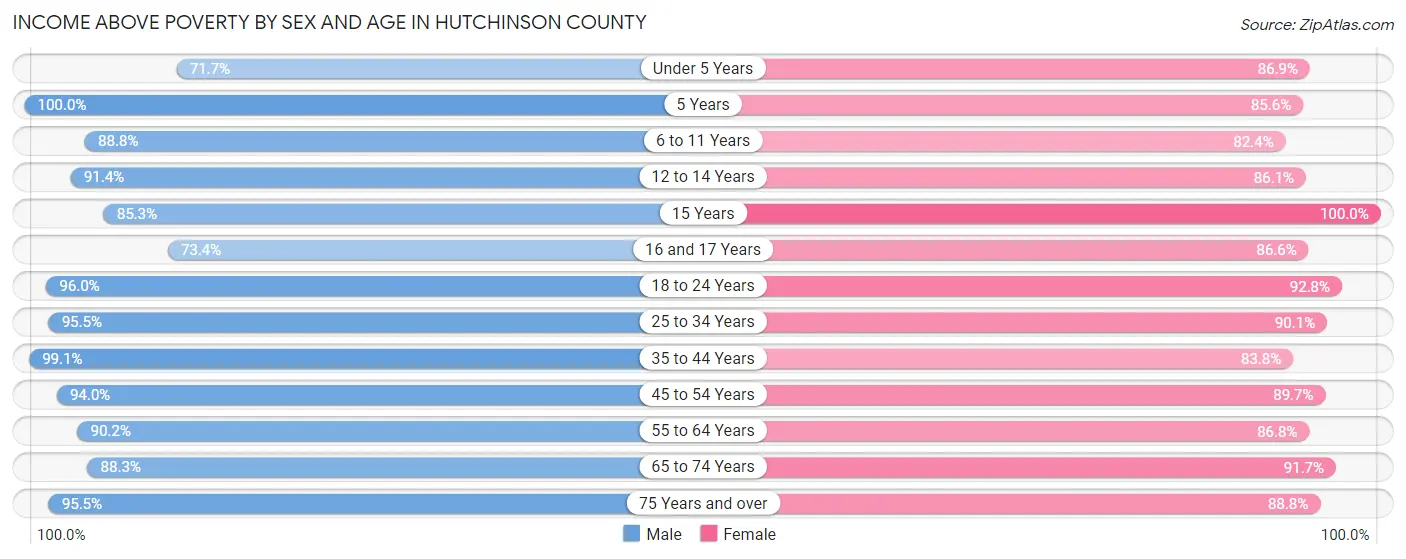
| Age Bracket | Male | Female |
| Under 5 Years | 457 (71.7%) | 503 (86.9%) |
| 5 Years | 61 (100.0%) | 107 (85.6%) |
| 6 to 11 Years | 869 (88.8%) | 822 (82.4%) |
| 12 to 14 Years | 425 (91.4%) | 292 (86.1%) |
| 15 Years | 145 (85.3%) | 183 (100.0%) |
| 16 and 17 Years | 276 (73.4%) | 201 (86.6%) |
| 18 to 24 Years | 972 (96.0%) | 774 (92.8%) |
| 25 to 34 Years | 1,342 (95.5%) | 959 (90.0%) |
| 35 to 44 Years | 1,271 (99.1%) | 1,149 (83.8%) |
| 45 to 54 Years | 1,017 (94.0%) | 996 (89.7%) |
| 55 to 64 Years | 1,202 (90.2%) | 1,101 (86.8%) |
| 65 to 74 Years | 965 (88.3%) | 939 (91.7%) |
| 75 Years and over | 551 (95.5%) | 711 (88.8%) |
| Total | 9,553 (91.2%) | 8,737 (88.0%) |
Income Below Poverty Among Married-Couple Families in Hutchinson County
The poverty statistics for married-couple families in Hutchinson County show that 3.4% or 121 of the total 3,587 families live below the poverty line. Families with no children have the highest poverty rate of 4.7%, comprising of 108 families. On the other hand, families with 1 or 2 children have the lowest poverty rate of 0.0%, which includes 0 families.
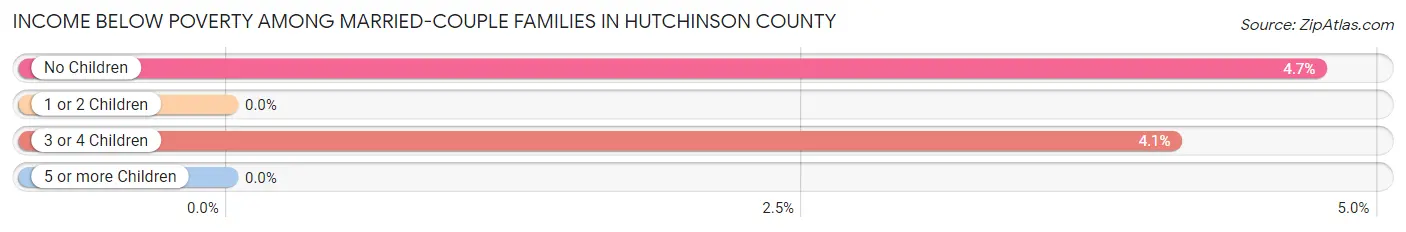
| Children | Above Poverty | Below Poverty |
| No Children | 2,172 (95.3%) | 108 (4.7%) |
| 1 or 2 Children | 983 (100.0%) | 0 (0.0%) |
| 3 or 4 Children | 303 (95.9%) | 13 (4.1%) |
| 5 or more Children | 8 (100.0%) | 0 (0.0%) |
| Total | 3,466 (96.6%) | 121 (3.4%) |
Income Below Poverty Among Single-Parent Households in Hutchinson County
According to the poverty data in Hutchinson County, 7.9% or 23 single-father households and 37.9% or 232 single-mother households are living below the poverty line. Among single-father households, those with 1 or 2 children have the highest poverty rate, with 17 households (10.1%) experiencing poverty. Likewise, among single-mother households, those with 3 or 4 children have the highest poverty rate, with 71 households (100.0%) falling below the poverty line.
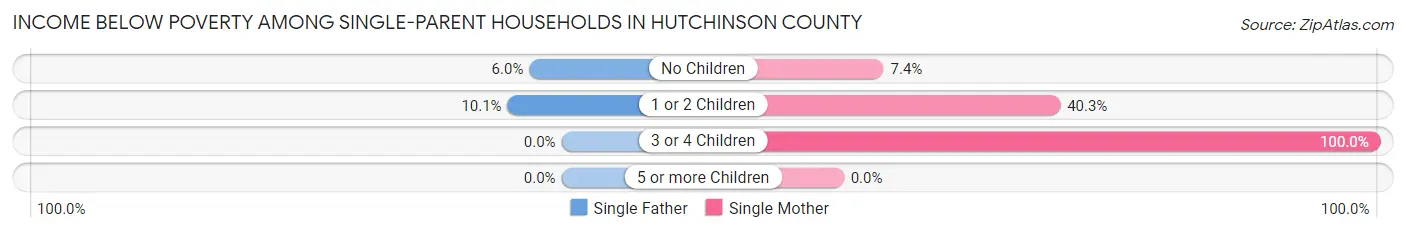
| Children | Single Father | Single Mother |
| No Children | 6 (6.0%) | 13 (7.4%) |
| 1 or 2 Children | 17 (10.1%) | 148 (40.3%) |
| 3 or 4 Children | 0 (0.0%) | 71 (100.0%) |
| 5 or more Children | 0 (0.0%) | 0 (0.0%) |
| Total | 23 (7.9%) | 232 (37.9%) |
Income Below Poverty Among Married-Couple vs Single-Parent Households in Hutchinson County
The poverty data for Hutchinson County shows that 121 of the married-couple family households (3.4%) and 255 of the single-parent households (28.2%) are living below the poverty level. Within the married-couple family households, those with no children have the highest poverty rate, with 108 households (4.7%) falling below the poverty line. Among the single-parent households, those with 3 or 4 children have the highest poverty rate, with 71 household (75.5%) living below poverty.
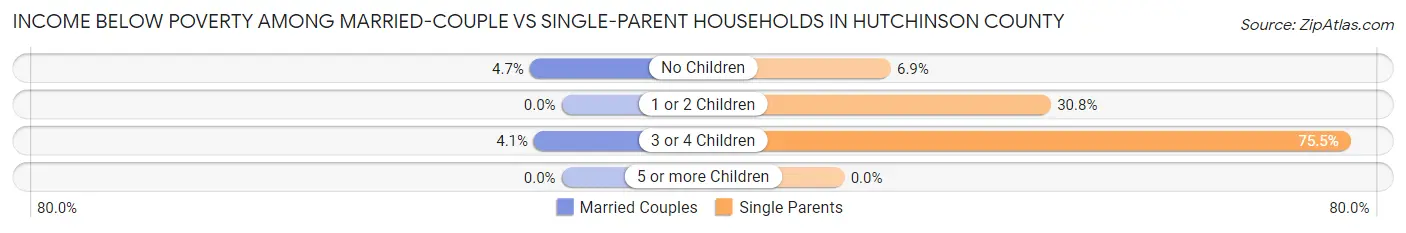
| Children | Married-Couple Families | Single-Parent Households |
| No Children | 108 (4.7%) | 19 (6.9%) |
| 1 or 2 Children | 0 (0.0%) | 165 (30.8%) |
| 3 or 4 Children | 13 (4.1%) | 71 (75.5%) |
| 5 or more Children | 0 (0.0%) | 0 (0.0%) |
| Total | 121 (3.4%) | 255 (28.2%) |
Race in Hutchinson County
The most populous races in Hutchinson County are White / Caucasian (16,033 | 77.8%), Hispanic or Latino (5,045 | 24.5%), and Two or more Races (2,578 | 12.5%).
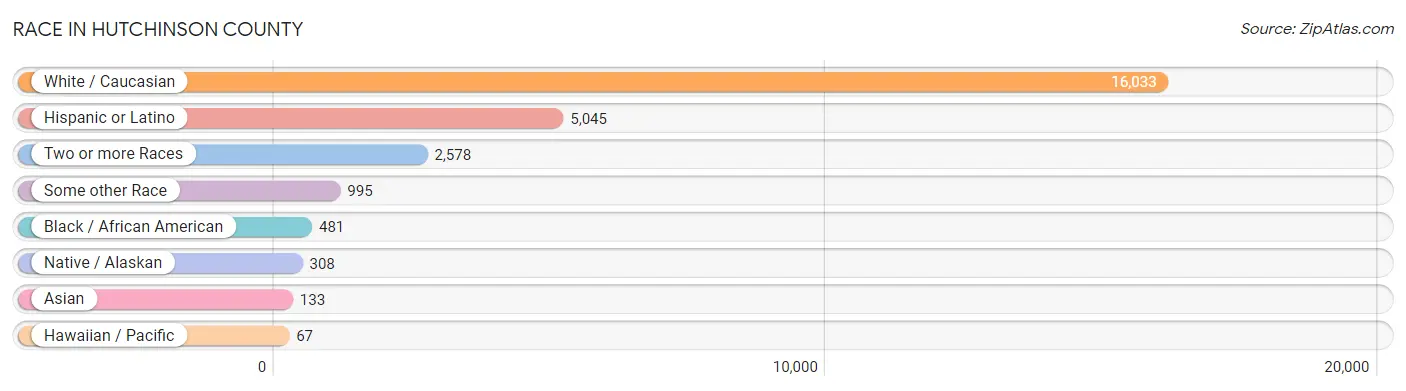
| Race | # Population | % Population |
| Asian | 133 | 0.6% |
| Black / African American | 481 | 2.3% |
| Hawaiian / Pacific | 67 | 0.3% |
| Hispanic or Latino | 5,045 | 24.5% |
| Native / Alaskan | 308 | 1.5% |
| White / Caucasian | 16,033 | 77.8% |
| Two or more Races | 2,578 | 12.5% |
| Some other Race | 995 | 4.8% |
| Total | 20,595 | 100.0% |
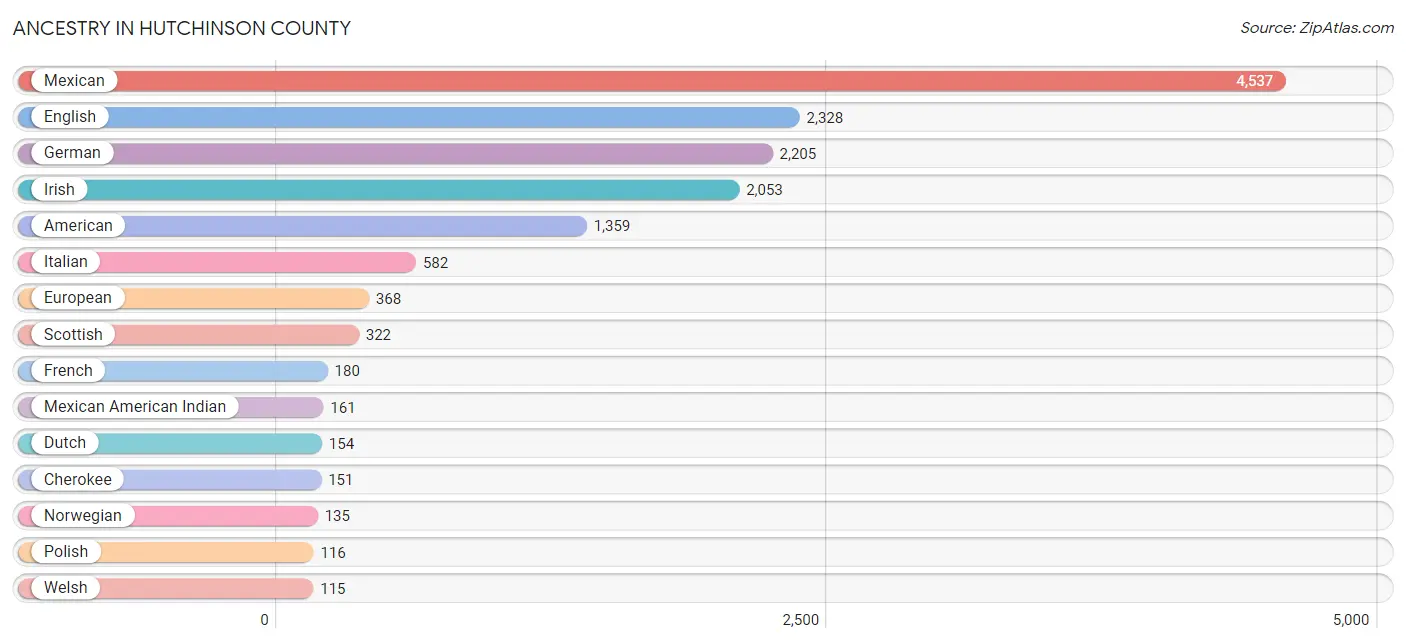
Ancestry in Hutchinson County
The most populous ancestries reported in Hutchinson County are Mexican (4,537 | 22.0%), English (2,328 | 11.3%), German (2,205 | 10.7%), Irish (2,053 | 10.0%), and American (1,359 | 6.6%), together accounting for 60.6% of all Hutchinson County residents.
| Ancestry | # Population | % Population |
| African | 9 | 0.0% |
| American | 1,359 | 6.6% |
| Apache | 101 | 0.5% |
| Arab | 1 | 0.0% |
| Austrian | 52 | 0.3% |
| Belgian | 20 | 0.1% |
| Bhutanese | 43 | 0.2% |
| Blackfeet | 36 | 0.2% |
| British | 94 | 0.5% |
| Burmese | 66 | 0.3% |
| Cajun | 12 | 0.1% |
| Canadian | 40 | 0.2% |
| Celtic | 13 | 0.1% |
| Central American | 89 | 0.4% |
| Central American Indian | 46 | 0.2% |
| Cherokee | 151 | 0.7% |
| Chickasaw | 75 | 0.4% |
| Choctaw | 62 | 0.3% |
| Comanche | 4 | 0.0% |
| Creek | 25 | 0.1% |
| Cuban | 2 | 0.0% |
| Czech | 98 | 0.5% |
| Danish | 3 | 0.0% |
| Delaware | 8 | 0.0% |
| Dutch | 154 | 0.7% |
| Dutch West Indian | 17 | 0.1% |
| Eastern European | 31 | 0.2% |
| English | 2,328 | 11.3% |
| European | 368 | 1.8% |
| French | 180 | 0.9% |
| French Canadian | 18 | 0.1% |
| German | 2,205 | 10.7% |
| Guamanian / Chamorro | 67 | 0.3% |
| Guatemalan | 1 | 0.0% |
| Honduran | 5 | 0.0% |
| Indian (Asian) | 6 | 0.0% |
| Irish | 2,053 | 10.0% |
| Italian | 582 | 2.8% |
| Korean | 45 | 0.2% |
| Mexican | 4,537 | 22.0% |
| Mexican American Indian | 161 | 0.8% |
| Navajo | 6 | 0.0% |
| Northern European | 29 | 0.1% |
| Norwegian | 135 | 0.7% |
| Polish | 116 | 0.6% |
| Portuguese | 18 | 0.1% |
| Pueblo | 110 | 0.5% |
| Puerto Rican | 74 | 0.4% |
| Romanian | 15 | 0.1% |
| Russian | 65 | 0.3% |
| Salvadoran | 83 | 0.4% |
| Scandinavian | 12 | 0.1% |
| Scotch-Irish | 75 | 0.4% |
| Scottish | 322 | 1.6% |
| Serbian | 36 | 0.2% |
| Slovene | 19 | 0.1% |
| Spaniard | 52 | 0.3% |
| Spanish | 11 | 0.1% |
| Sri Lankan | 13 | 0.1% |
| Subsaharan African | 9 | 0.0% |
| Swedish | 21 | 0.1% |
| Swiss | 18 | 0.1% |
| Thai | 6 | 0.0% |
| Welsh | 115 | 0.6% | View All 64 Rows |
Immigrants in Hutchinson County
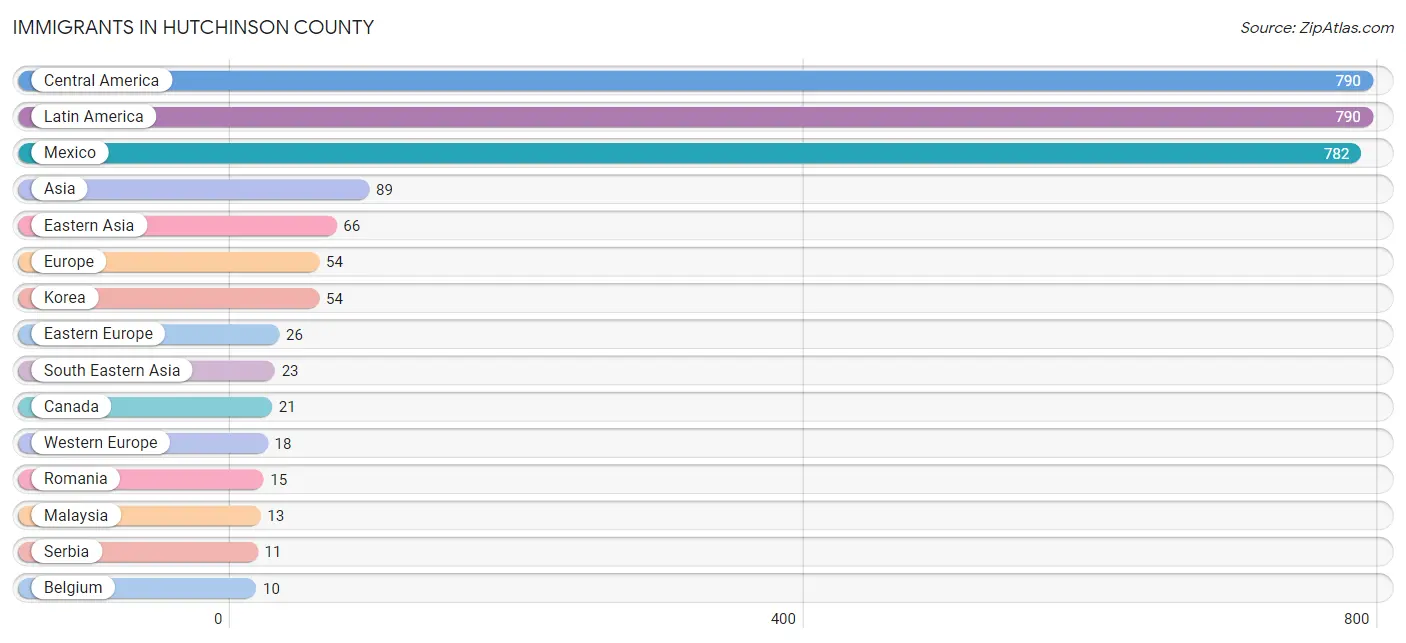
The most numerous immigrant groups reported in Hutchinson County came from Central America (790 | 3.8%), Latin America (790 | 3.8%), Mexico (782 | 3.8%), Asia (89 | 0.4%), and Eastern Asia (66 | 0.3%), together accounting for 12.2% of all Hutchinson County residents.
| Immigration Origin | # Population | % Population |
| Asia | 89 | 0.4% |
| Austria | 8 | 0.0% |
| Belgium | 10 | 0.1% |
| Canada | 21 | 0.1% |
| Central America | 790 | 3.8% |
| China | 6 | 0.0% |
| Eastern Asia | 66 | 0.3% |
| Eastern Europe | 26 | 0.1% |
| El Salvador | 8 | 0.0% |
| Europe | 54 | 0.3% |
| Japan | 6 | 0.0% |
| Korea | 54 | 0.3% |
| Latin America | 790 | 3.8% |
| Malaysia | 13 | 0.1% |
| Mexico | 782 | 3.8% |
| Northern Europe | 10 | 0.1% |
| Philippines | 10 | 0.1% |
| Romania | 15 | 0.1% |
| Serbia | 11 | 0.1% |
| South Eastern Asia | 23 | 0.1% |
| Taiwan | 6 | 0.0% |
| Western Europe | 18 | 0.1% | View All 22 Rows |
Sex and Age in Hutchinson County
Sex and Age in Hutchinson County
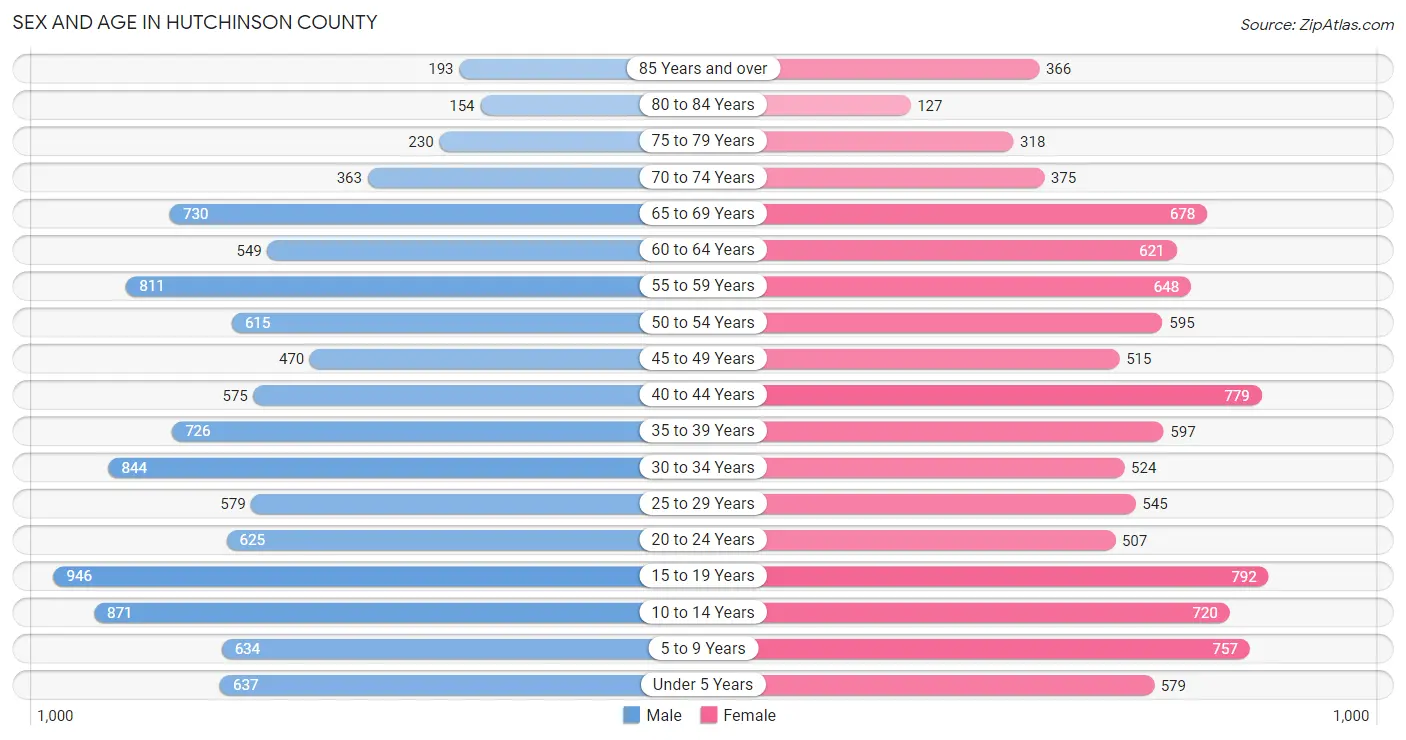
The most populous age groups in Hutchinson County are 15 to 19 Years (946 | 9.0%) for men and 15 to 19 Years (792 | 7.9%) for women.
| Age Bracket | Male | Female |
| Under 5 Years | 637 (6.0%) | 579 (5.8%) |
| 5 to 9 Years | 634 (6.0%) | 757 (7.5%) |
| 10 to 14 Years | 871 (8.3%) | 720 (7.2%) |
| 15 to 19 Years | 946 (9.0%) | 792 (7.9%) |
| 20 to 24 Years | 625 (5.9%) | 507 (5.1%) |
| 25 to 29 Years | 579 (5.5%) | 545 (5.4%) |
| 30 to 34 Years | 844 (8.0%) | 524 (5.2%) |
| 35 to 39 Years | 726 (6.9%) | 597 (5.9%) |
| 40 to 44 Years | 575 (5.4%) | 779 (7.8%) |
| 45 to 49 Years | 470 (4.4%) | 515 (5.1%) |
| 50 to 54 Years | 615 (5.8%) | 595 (5.9%) |
| 55 to 59 Years | 811 (7.7%) | 648 (6.5%) |
| 60 to 64 Years | 549 (5.2%) | 621 (6.2%) |
| 65 to 69 Years | 730 (6.9%) | 678 (6.8%) |
| 70 to 74 Years | 363 (3.4%) | 375 (3.7%) |
| 75 to 79 Years | 230 (2.2%) | 318 (3.2%) |
| 80 to 84 Years | 154 (1.5%) | 127 (1.3%) |
| 85 Years and over | 193 (1.8%) | 366 (3.6%) |
| Total | 10,552 (100.0%) | 10,043 (100.0%) |
Families and Households in Hutchinson County
Median Family Size in Hutchinson County
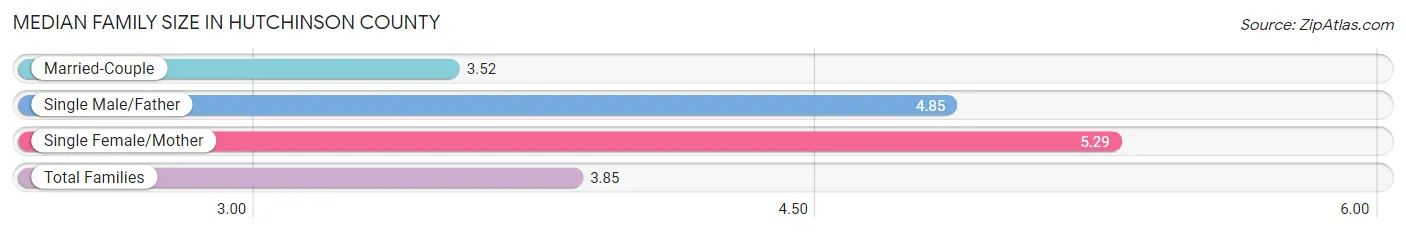
The median family size in Hutchinson County is 3.85 persons per family, with single female/mother families (613 | 13.7%) accounting for the largest median family size of 5.29 persons per family. On the other hand, married-couple families (3,587 | 79.8%) represent the smallest median family size with 3.52 persons per family.
| Family Type | # Families | Family Size |
| Married-Couple | 3,587 (79.8%) | 3.52 |
| Single Male/Father | 292 (6.5%) | 4.85 |
| Single Female/Mother | 613 (13.7%) | 5.29 |
| Total Families | 4,492 (100.0%) | 3.85 |
Median Household Size in Hutchinson County
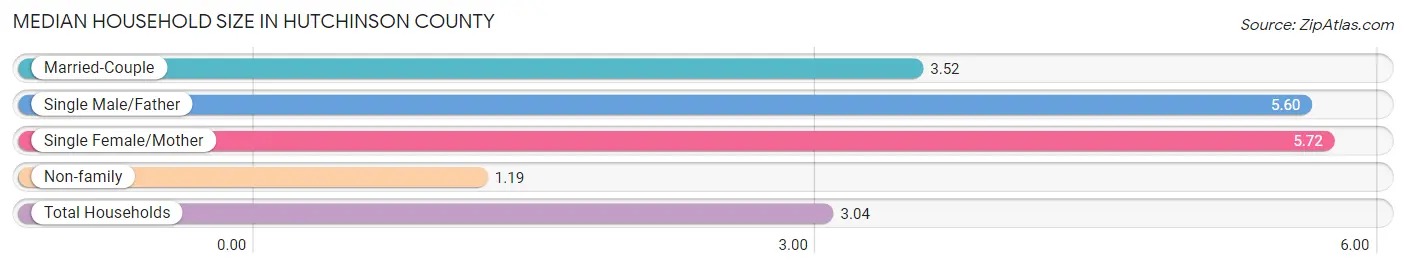
The median household size in Hutchinson County is 3.04 persons per household, with single female/mother households (613 | 9.1%) accounting for the largest median household size of 5.72 persons per household. non-family households (2,219 | 33.1%) represent the smallest median household size with 1.19 persons per household.
| Household Type | # Households | Household Size |
| Married-Couple | 3,587 (53.4%) | 3.52 |
| Single Male/Father | 292 (4.3%) | 5.60 |
| Single Female/Mother | 613 (9.1%) | 5.72 |
| Non-family | 2,219 (33.1%) | 1.19 |
| Total Households | 6,711 (100.0%) | 3.04 |
Household Size by Marriage Status in Hutchinson County
Out of a total of 6,711 households in Hutchinson County, 4,492 (66.9%) are family households, while 2,219 (33.1%) are nonfamily households. The most numerous type of family households are 2-person households, comprising 2,329, and the most common type of nonfamily households are 1-person households, comprising 2,013.
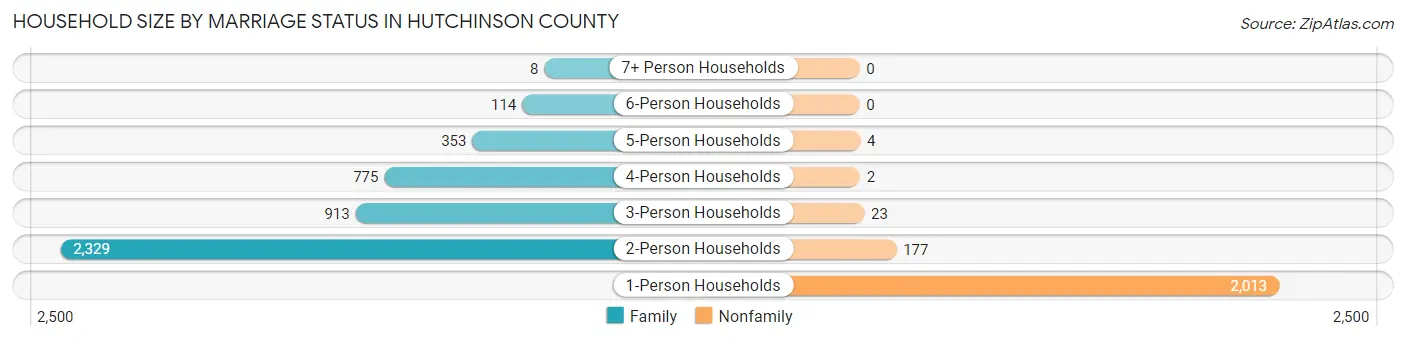
| Household Size | Family Households | Nonfamily Households |
| 1-Person Households | - | 2,013 (30.0%) |
| 2-Person Households | 2,329 (34.7%) | 177 (2.6%) |
| 3-Person Households | 913 (13.6%) | 23 (0.3%) |
| 4-Person Households | 775 (11.6%) | 2 (0.0%) |
| 5-Person Households | 353 (5.3%) | 4 (0.1%) |
| 6-Person Households | 114 (1.7%) | 0 (0.0%) |
| 7+ Person Households | 8 (0.1%) | 0 (0.0%) |
| Total | 4,492 (66.9%) | 2,219 (33.1%) |
Female Fertility in Hutchinson County
Fertility by Age in Hutchinson County
Average fertility rate in Hutchinson County is 32.0 births per 1,000 women. Women in the age bracket of 35 to 50 years have the highest fertility rate with 40.0 births per 1,000 women. Women in the age bracket of 35 to 50 years acount for 57.9% of all women with births.
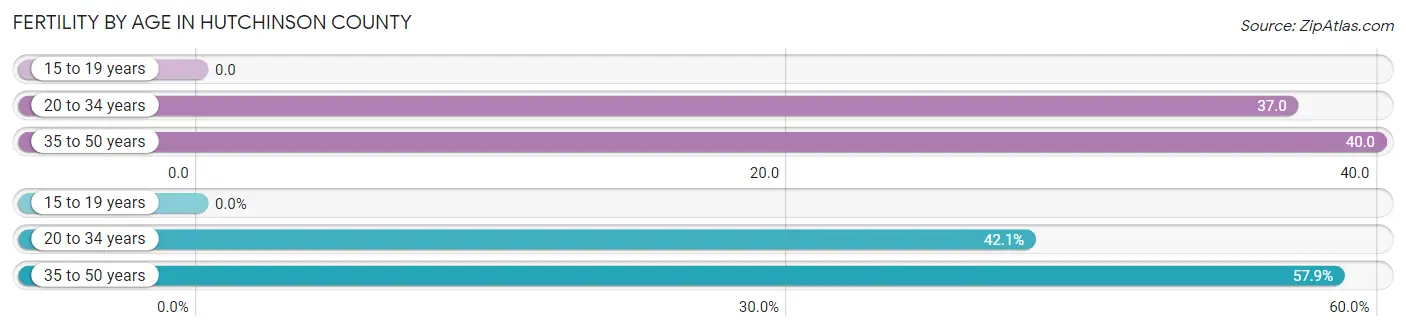
| Age Bracket | Women with Births | Births / 1,000 Women |
| 15 to 19 years | 0 (0.0%) | 0.0 |
| 20 to 34 years | 59 (42.1%) | 37.0 |
| 35 to 50 years | 81 (57.9%) | 40.0 |
| Total | 140 (100.0%) | 32.0 |
Fertility by Age by Marriage Status in Hutchinson County
35.7% of women with births (140) in Hutchinson County are married. The highest percentage of unmarried women with births falls into 35 to 50 years age bracket with 96.3% of them unmarried at the time of birth, while the lowest percentage of unmarried women with births belong to 20 to 34 years age bracket with 20.3% of them unmarried.
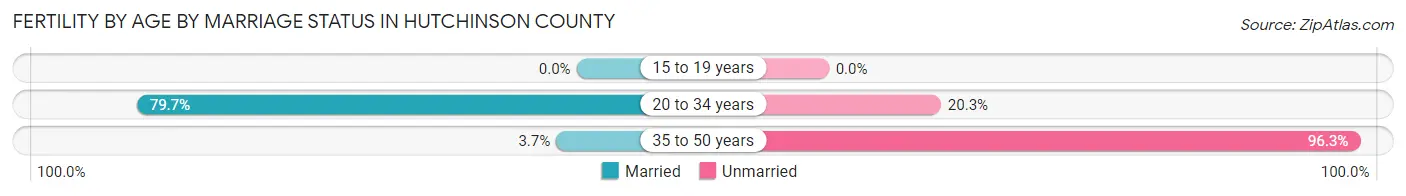
| Age Bracket | Married | Unmarried |
| 15 to 19 years | 0 (0.0%) | 0 (0.0%) |
| 20 to 34 years | 47 (79.7%) | 12 (20.3%) |
| 35 to 50 years | 3 (3.7%) | 78 (96.3%) |
| Total | 50 (35.7%) | 90 (64.3%) |
Fertility by Education in Hutchinson County
Average fertility rate in Hutchinson County is 32.0 births per 1,000 women. Women with the education attainment of graduate degree have the highest fertility rate of 112.0 births per 1,000 women, while women with the education attainment of high school diploma have the lowest fertility at 3.0 births per 1,000 women. Women with the education attainment of less than high school represent 62.1% of all women with births.
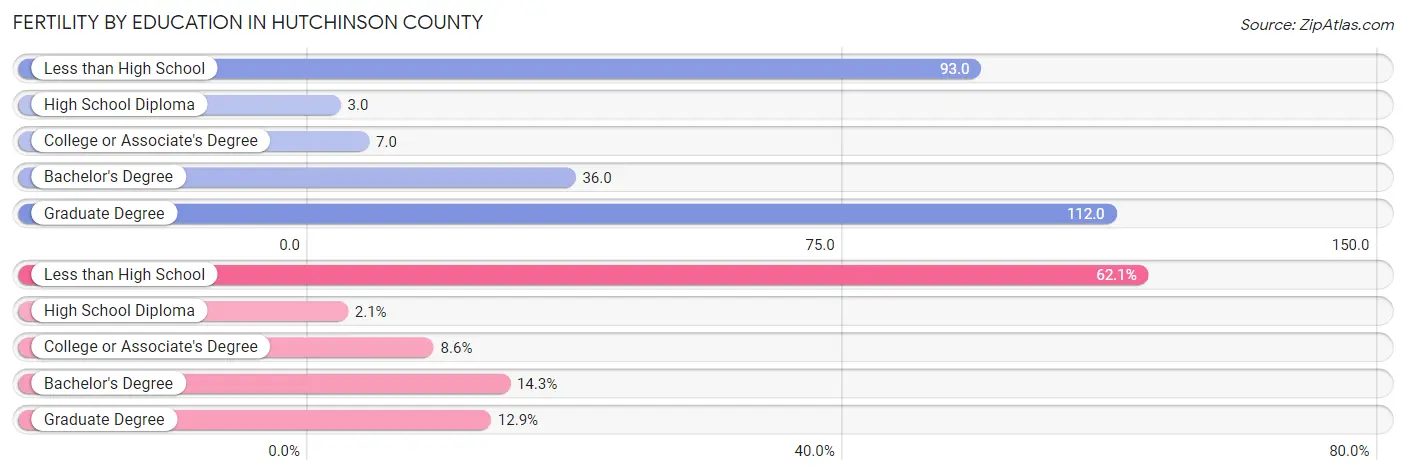
| Educational Attainment | Women with Births | Births / 1,000 Women |
| Less than High School | 87 (62.1%) | 93.0 |
| High School Diploma | 3 (2.1%) | 3.0 |
| College or Associate's Degree | 12 (8.6%) | 7.0 |
| Bachelor's Degree | 20 (14.3%) | 36.0 |
| Graduate Degree | 18 (12.9%) | 112.0 |
| Total | 140 (100.0%) | 32.0 |
Fertility by Education by Marriage Status in Hutchinson County
64.3% of women with births in Hutchinson County are unmarried. Women with the educational attainment of high school diploma are most likely to be married with 100.0% of them married at childbirth, while women with the educational attainment of less than high school are least likely to be married with 100.0% of them unmarried at childbirth.
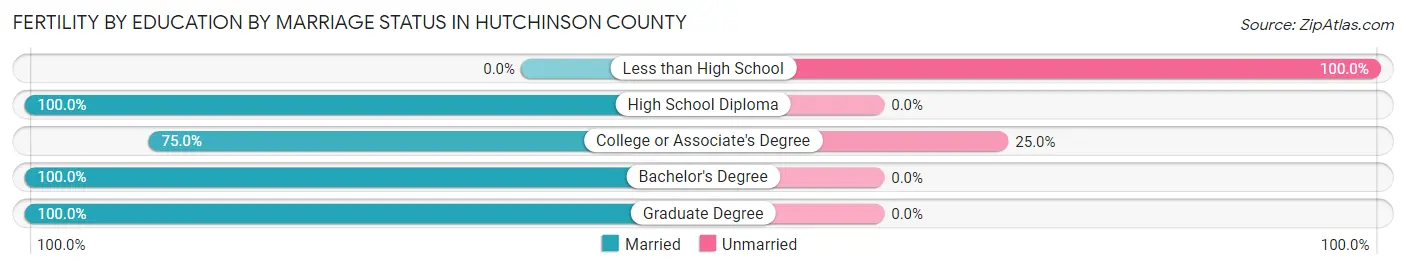
| Educational Attainment | Married | Unmarried |
| Less than High School | 0 (0.0%) | 87 (100.0%) |
| High School Diploma | 3 (100.0%) | 0 (0.0%) |
| College or Associate's Degree | 9 (75.0%) | 3 (25.0%) |
| Bachelor's Degree | 20 (100.0%) | 0 (0.0%) |
| Graduate Degree | 18 (100.0%) | 0 (0.0%) |
| Total | 50 (35.7%) | 90 (64.3%) |
Employment Characteristics in Hutchinson County
Employment by Class of Employer in Hutchinson County
Among the 8,999 employed individuals in Hutchinson County, private company employees (6,333 | 70.4%), local government employees (956 | 10.6%), and self-employed (not incorporated) (505 | 5.6%) make up the most common classes of employment.
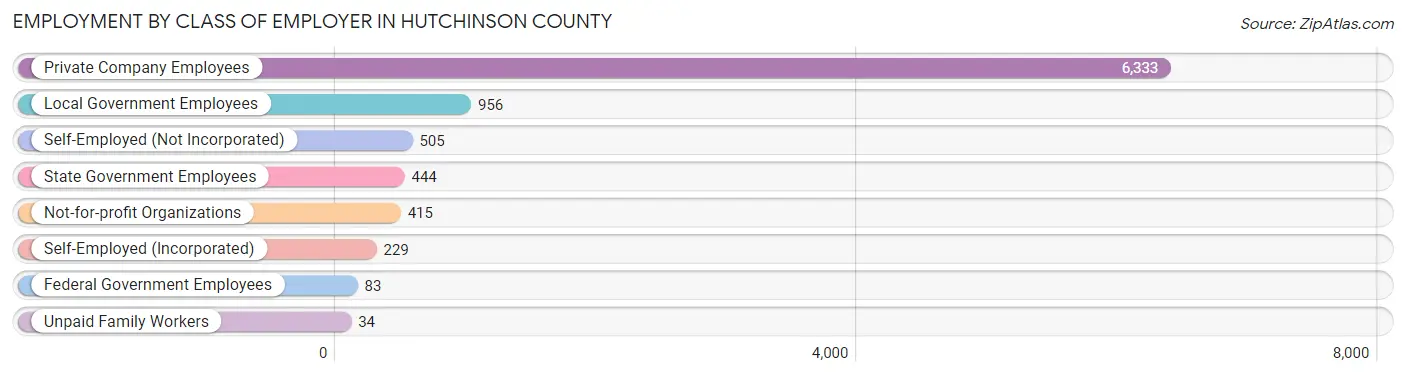
| Employer Class | # Employees | % Employees |
| Private Company Employees | 6,333 | 70.4% |
| Self-Employed (Incorporated) | 229 | 2.5% |
| Self-Employed (Not Incorporated) | 505 | 5.6% |
| Not-for-profit Organizations | 415 | 4.6% |
| Local Government Employees | 956 | 10.6% |
| State Government Employees | 444 | 4.9% |
| Federal Government Employees | 83 | 0.9% |
| Unpaid Family Workers | 34 | 0.4% |
| Total | 8,999 | 100.0% |
Employment Status by Age in Hutchinson County
According to the labor force statistics for Hutchinson County, out of the total population over 16 years of age (16,044), 60.3% or 9,675 individuals are in the labor force, with 4.3% or 416 of them unemployed. The age group with the highest labor force participation rate is 30 to 34 years, with 89.9% or 1,230 individuals in the labor force. Within the labor force, the 20 to 24 years age range has the highest percentage of unemployed individuals, with 11.6% or 111 of them being unemployed.
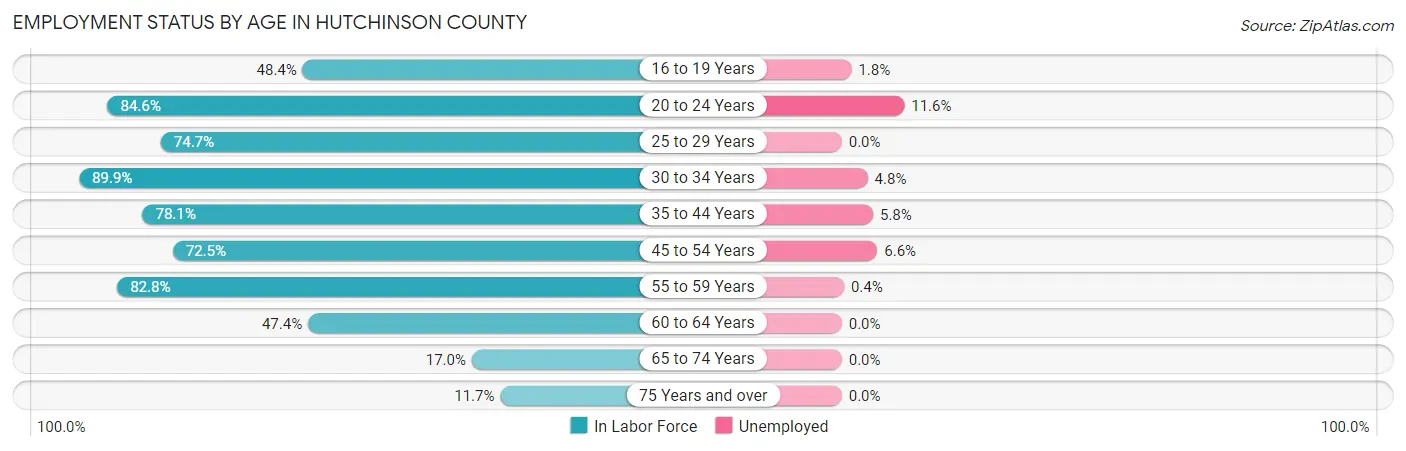
| Age Bracket | In Labor Force | Unemployed |
| 16 to 19 Years | 670 (48.4%) | 12 (1.8%) |
| 20 to 24 Years | 958 (84.6%) | 111 (11.6%) |
| 25 to 29 Years | 840 (74.7%) | 0 (0.0%) |
| 30 to 34 Years | 1,230 (89.9%) | 59 (4.8%) |
| 35 to 44 Years | 2,091 (78.1%) | 121 (5.8%) |
| 45 to 54 Years | 1,591 (72.5%) | 105 (6.6%) |
| 55 to 59 Years | 1,208 (82.8%) | 5 (0.4%) |
| 60 to 64 Years | 555 (47.4%) | 0 (0.0%) |
| 65 to 74 Years | 365 (17.0%) | 0 (0.0%) |
| 75 Years and over | 162 (11.7%) | 0 (0.0%) |
| Total | 9,675 (60.3%) | 416 (4.3%) |
Employment Status by Educational Attainment in Hutchinson County
According to labor force statistics for Hutchinson County, 75.2% of individuals (7,515) out of the total population between 25 and 64 years of age (9,993) are in the labor force, with 3.9% or 293 of them being unemployed. The group with the highest labor force participation rate are those with the educational attainment of bachelor's degree or higher, with 82.7% or 1,402 individuals in the labor force. Within the labor force, individuals with high school diploma education have the highest percentage of unemployment, with 5.6% or 130 of them being unemployed.
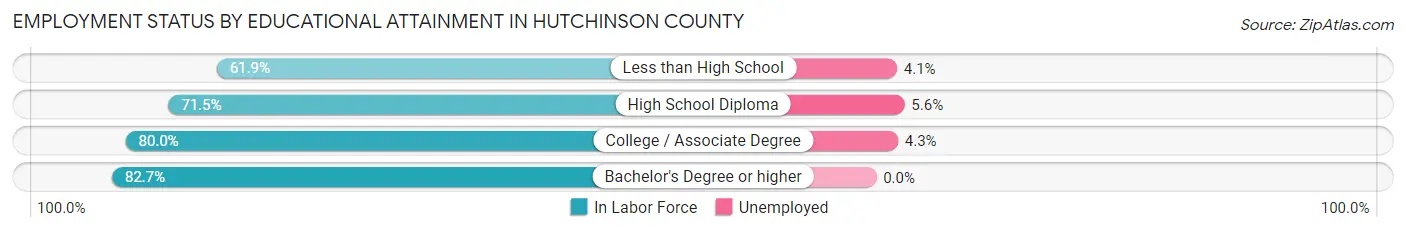
| Educational Attainment | In Labor Force | Unemployed |
| Less than High School | 859 (61.9%) | 57 (4.1%) |
| High School Diploma | 2,317 (71.5%) | 181 (5.6%) |
| College / Associate Degree | 2,937 (80.0%) | 158 (4.3%) |
| Bachelor's Degree or higher | 1,402 (82.7%) | 0 (0.0%) |
| Total | 7,515 (75.2%) | 390 (3.9%) |
Employment Occupations by Sex in Hutchinson County
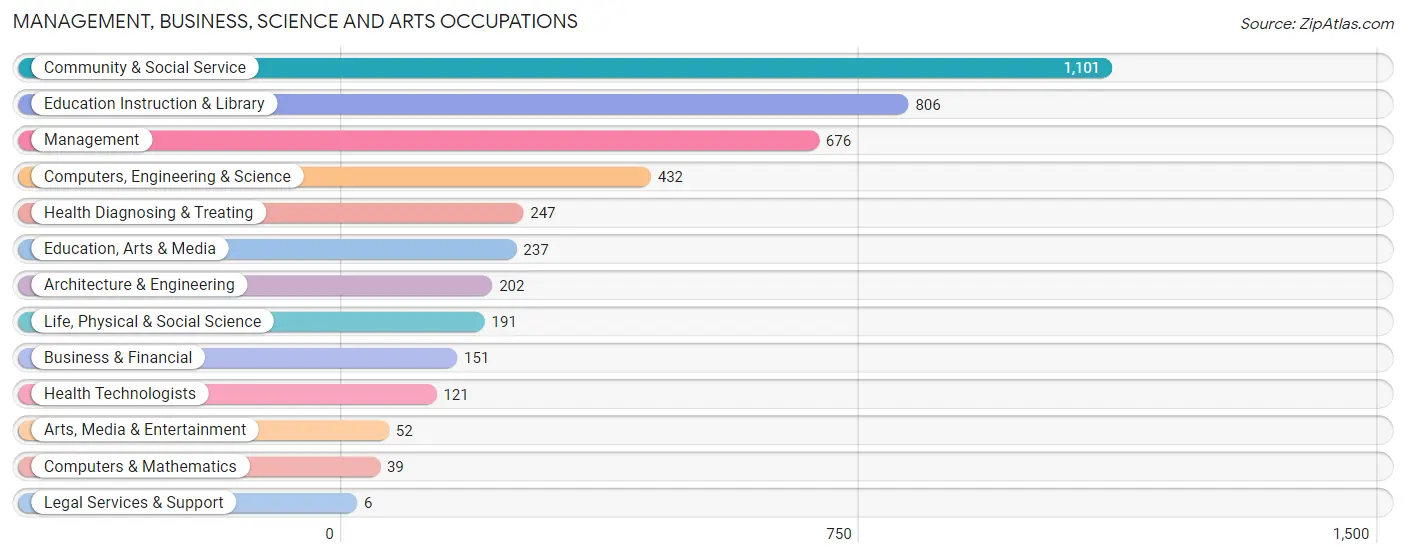
Management, Business, Science and Arts Occupations
The most common Management, Business, Science and Arts occupations in Hutchinson County are Community & Social Service (1,101 | 11.9%), Education Instruction & Library (806 | 8.7%), Management (676 | 7.3%), Computers, Engineering & Science (432 | 4.7%), and Health Diagnosing & Treating (247 | 2.7%).
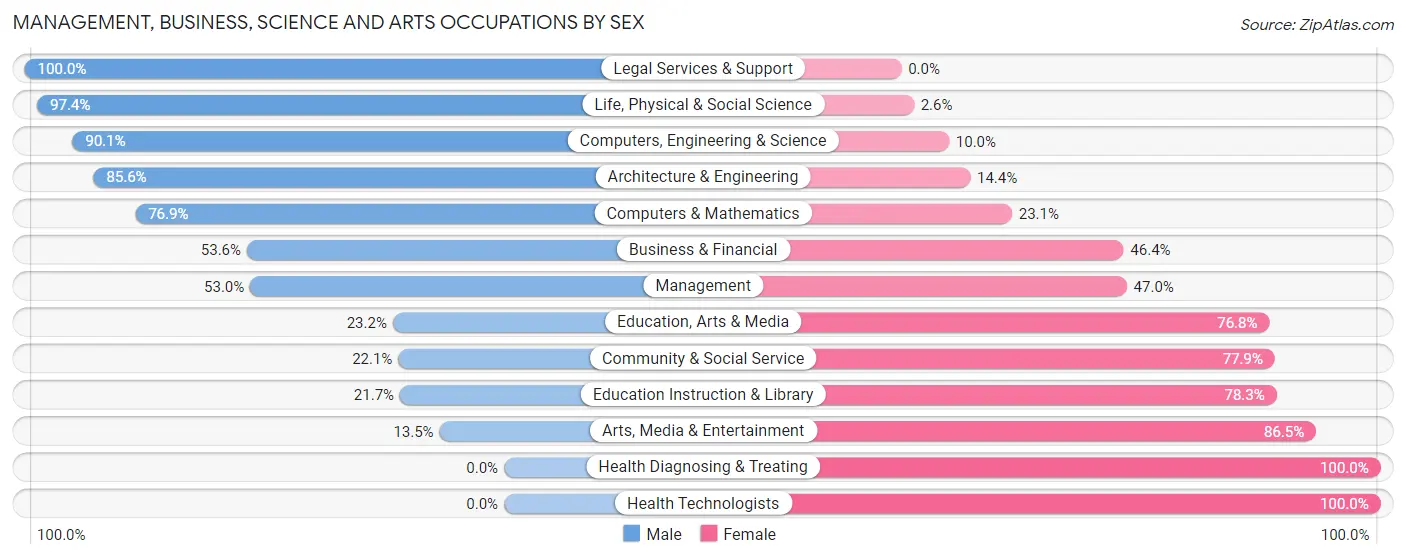
Management, Business, Science and Arts Occupations by Sex
Within the Management, Business, Science and Arts occupations in Hutchinson County, the most male-oriented occupations are Legal Services & Support (100.0%), Life, Physical & Social Science (97.4%), and Computers, Engineering & Science (90.0%), while the most female-oriented occupations are Health Diagnosing & Treating (100.0%), Health Technologists (100.0%), and Arts, Media & Entertainment (86.5%).
| Occupation | Male | Female |
| Management | 358 (53.0%) | 318 (47.0%) |
| Business & Financial | 81 (53.6%) | 70 (46.4%) |
| Computers, Engineering & Science | 389 (90.0%) | 43 (10.0%) |
| Computers & Mathematics | 30 (76.9%) | 9 (23.1%) |
| Architecture & Engineering | 173 (85.6%) | 29 (14.4%) |
| Life, Physical & Social Science | 186 (97.4%) | 5 (2.6%) |
| Community & Social Service | 243 (22.1%) | 858 (77.9%) |
| Education, Arts & Media | 55 (23.2%) | 182 (76.8%) |
| Legal Services & Support | 6 (100.0%) | 0 (0.0%) |
| Education Instruction & Library | 175 (21.7%) | 631 (78.3%) |
| Arts, Media & Entertainment | 7 (13.5%) | 45 (86.5%) |
| Health Diagnosing & Treating | 0 (0.0%) | 247 (100.0%) |
| Health Technologists | 0 (0.0%) | 121 (100.0%) |
| Total (Category) | 1,071 (41.1%) | 1,536 (58.9%) |
| Total (Overall) | 5,181 (56.0%) | 4,076 (44.0%) |
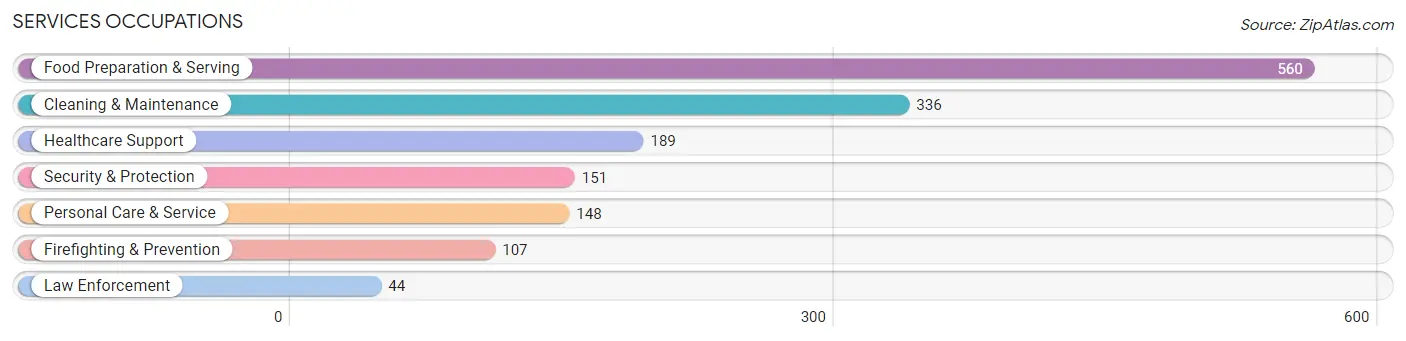
Services Occupations
The most common Services occupations in Hutchinson County are Food Preparation & Serving (560 | 6.0%), Cleaning & Maintenance (336 | 3.6%), Healthcare Support (189 | 2.0%), Security & Protection (151 | 1.6%), and Personal Care & Service (148 | 1.6%).
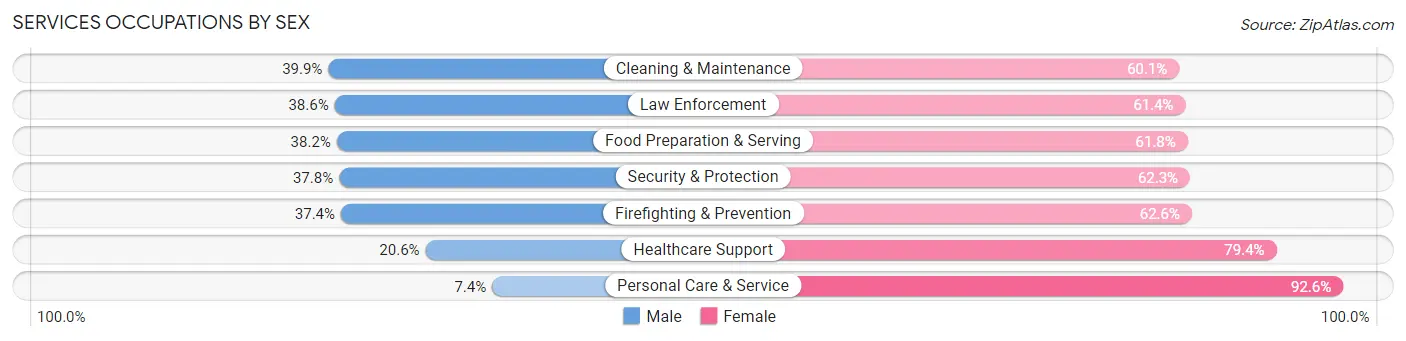
Services Occupations by Sex
Within the Services occupations in Hutchinson County, the most male-oriented occupations are Cleaning & Maintenance (39.9%), Law Enforcement (38.6%), and Food Preparation & Serving (38.2%), while the most female-oriented occupations are Personal Care & Service (92.6%), Healthcare Support (79.4%), and Firefighting & Prevention (62.6%).
| Occupation | Male | Female |
| Healthcare Support | 39 (20.6%) | 150 (79.4%) |
| Security & Protection | 57 (37.8%) | 94 (62.3%) |
| Firefighting & Prevention | 40 (37.4%) | 67 (62.6%) |
| Law Enforcement | 17 (38.6%) | 27 (61.4%) |
| Food Preparation & Serving | 214 (38.2%) | 346 (61.8%) |
| Cleaning & Maintenance | 134 (39.9%) | 202 (60.1%) |
| Personal Care & Service | 11 (7.4%) | 137 (92.6%) |
| Total (Category) | 455 (32.9%) | 929 (67.1%) |
| Total (Overall) | 5,181 (56.0%) | 4,076 (44.0%) |
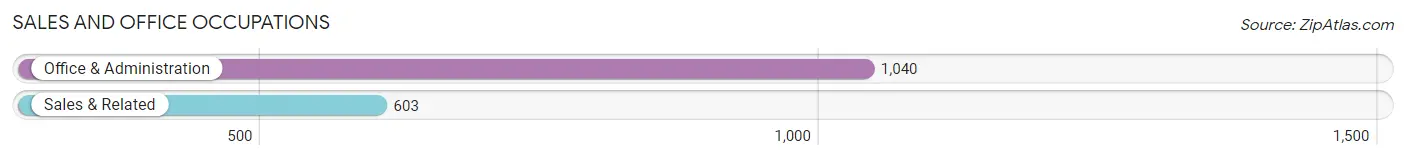
Sales and Office Occupations
The most common Sales and Office occupations in Hutchinson County are Office & Administration (1,040 | 11.2%), and Sales & Related (603 | 6.5%).
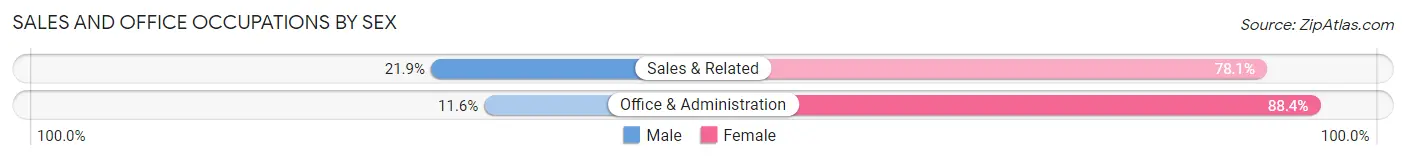
Sales and Office Occupations by Sex
| Occupation | Male | Female |
| Sales & Related | 132 (21.9%) | 471 (78.1%) |
| Office & Administration | 121 (11.6%) | 919 (88.4%) |
| Total (Category) | 253 (15.4%) | 1,390 (84.6%) |
| Total (Overall) | 5,181 (56.0%) | 4,076 (44.0%) |
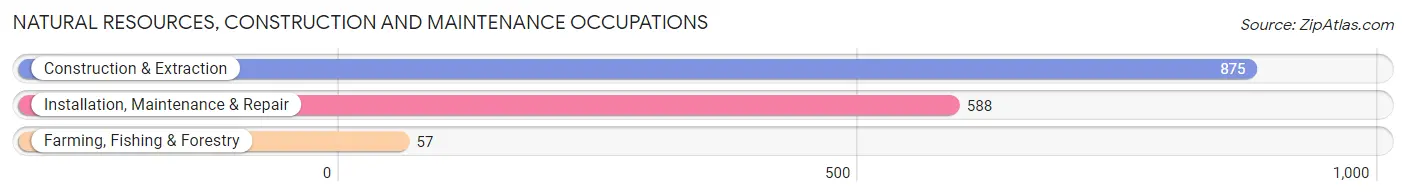
Natural Resources, Construction and Maintenance Occupations
The most common Natural Resources, Construction and Maintenance occupations in Hutchinson County are Construction & Extraction (875 | 9.5%), Installation, Maintenance & Repair (588 | 6.4%), and Farming, Fishing & Forestry (57 | 0.6%).
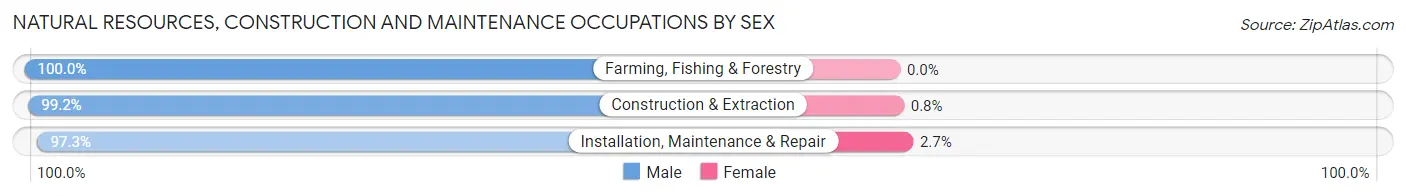
Natural Resources, Construction and Maintenance Occupations by Sex
| Occupation | Male | Female |
| Farming, Fishing & Forestry | 57 (100.0%) | 0 (0.0%) |
| Construction & Extraction | 868 (99.2%) | 7 (0.8%) |
| Installation, Maintenance & Repair | 572 (97.3%) | 16 (2.7%) |
| Total (Category) | 1,497 (98.5%) | 23 (1.5%) |
| Total (Overall) | 5,181 (56.0%) | 4,076 (44.0%) |
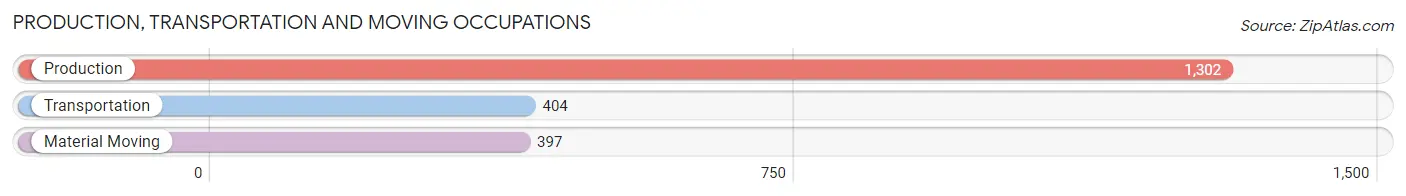
Production, Transportation and Moving Occupations
The most common Production, Transportation and Moving occupations in Hutchinson County are Production (1,302 | 14.1%), Transportation (404 | 4.4%), and Material Moving (397 | 4.3%).
Production, Transportation and Moving Occupations by Sex
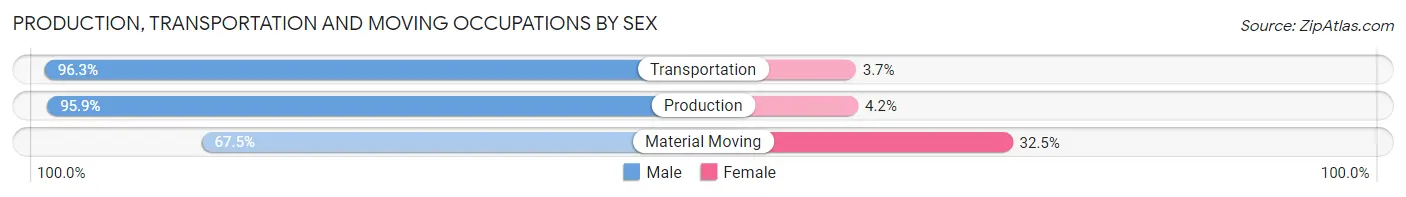
| Occupation | Male | Female |
| Production | 1,248 (95.9%) | 54 (4.2%) |
| Transportation | 389 (96.3%) | 15 (3.7%) |
| Material Moving | 268 (67.5%) | 129 (32.5%) |
| Total (Category) | 1,905 (90.6%) | 198 (9.4%) |
| Total (Overall) | 5,181 (56.0%) | 4,076 (44.0%) |
Employment Industries by Sex in Hutchinson County
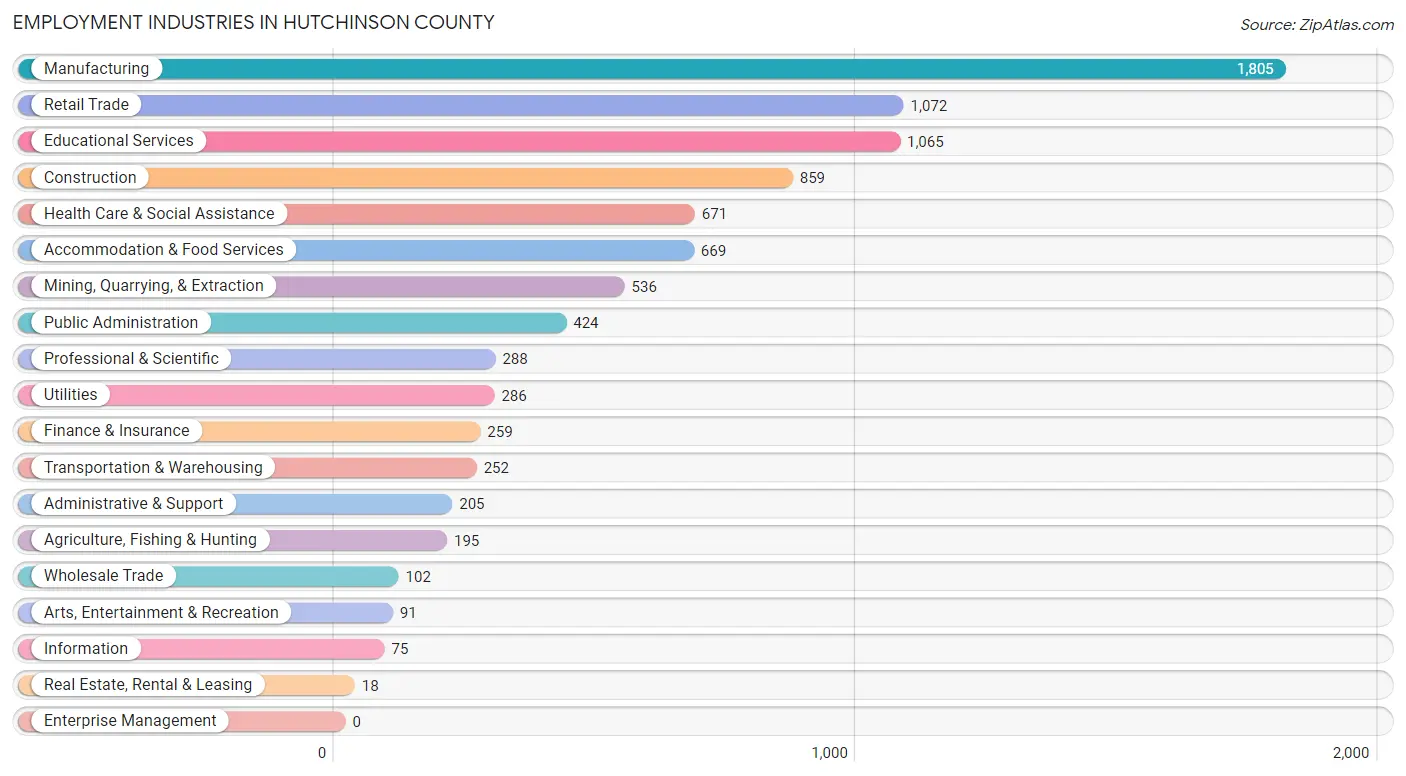
Employment Industries in Hutchinson County
The major employment industries in Hutchinson County include Manufacturing (1,805 | 19.5%), Retail Trade (1,072 | 11.6%), Educational Services (1,065 | 11.5%), Construction (859 | 9.3%), and Health Care & Social Assistance (671 | 7.2%).
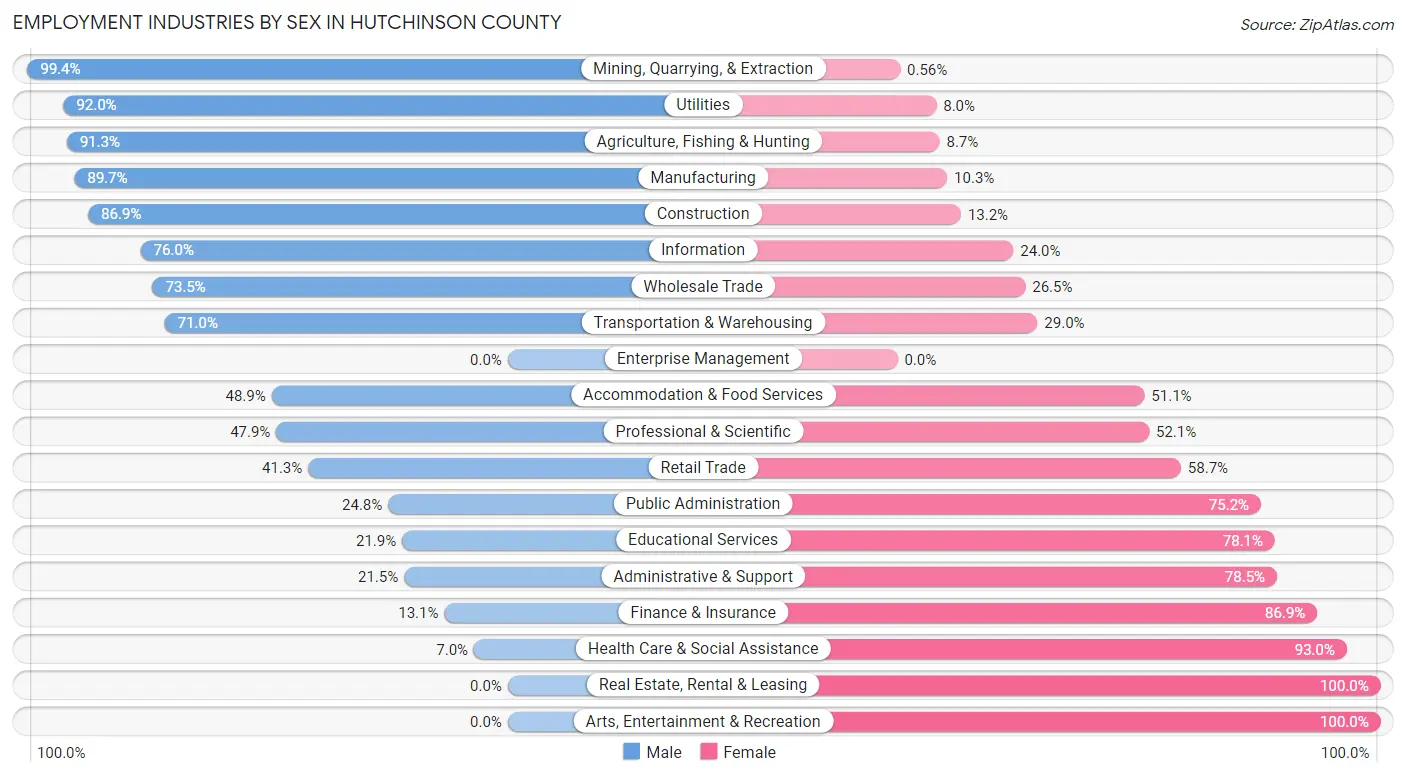
Employment Industries by Sex in Hutchinson County
The Hutchinson County industries that see more men than women are Mining, Quarrying, & Extraction (99.4%), Utilities (92.0%), and Agriculture, Fishing & Hunting (91.3%), whereas the industries that tend to have a higher number of women are Real Estate, Rental & Leasing (100.0%), Arts, Entertainment & Recreation (100.0%), and Health Care & Social Assistance (93.0%).
| Industry | Male | Female |
| Agriculture, Fishing & Hunting | 178 (91.3%) | 17 (8.7%) |
| Mining, Quarrying, & Extraction | 533 (99.4%) | 3 (0.6%) |
| Construction | 746 (86.9%) | 113 (13.2%) |
| Manufacturing | 1,619 (89.7%) | 186 (10.3%) |
| Wholesale Trade | 75 (73.5%) | 27 (26.5%) |
| Retail Trade | 443 (41.3%) | 629 (58.7%) |
| Transportation & Warehousing | 179 (71.0%) | 73 (29.0%) |
| Utilities | 263 (92.0%) | 23 (8.0%) |
| Information | 57 (76.0%) | 18 (24.0%) |
| Finance & Insurance | 34 (13.1%) | 225 (86.9%) |
| Real Estate, Rental & Leasing | 0 (0.0%) | 18 (100.0%) |
| Professional & Scientific | 138 (47.9%) | 150 (52.1%) |
| Enterprise Management | 0 (0.0%) | 0 (0.0%) |
| Administrative & Support | 44 (21.5%) | 161 (78.5%) |
| Educational Services | 233 (21.9%) | 832 (78.1%) |
| Health Care & Social Assistance | 47 (7.0%) | 624 (93.0%) |
| Arts, Entertainment & Recreation | 0 (0.0%) | 91 (100.0%) |
| Accommodation & Food Services | 327 (48.9%) | 342 (51.1%) |
| Public Administration | 105 (24.8%) | 319 (75.2%) |
| Total | 5,181 (56.0%) | 4,076 (44.0%) |
Education in Hutchinson County
School Enrollment in Hutchinson County
The most common levels of schooling among the 5,188 students in Hutchinson County are elementary school (1,280 | 24.7%), middle school (1,254 | 24.2%), and high school (1,184 | 22.8%).
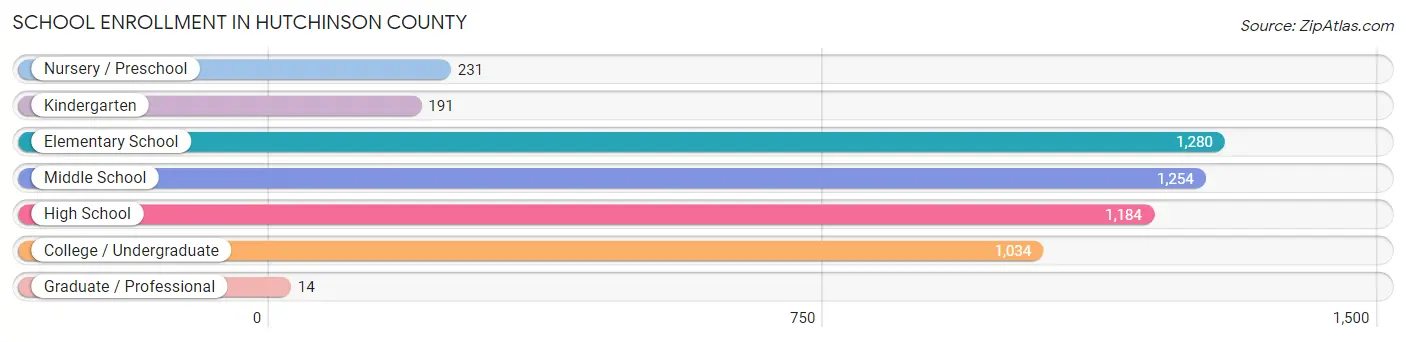
| School Level | # Students | % Students |
| Nursery / Preschool | 231 | 4.4% |
| Kindergarten | 191 | 3.7% |
| Elementary School | 1,280 | 24.7% |
| Middle School | 1,254 | 24.2% |
| High School | 1,184 | 22.8% |
| College / Undergraduate | 1,034 | 19.9% |
| Graduate / Professional | 14 | 0.3% |
| Total | 5,188 | 100.0% |
School Enrollment by Age by Funding Source in Hutchinson County
Out of a total of 5,188 students who are enrolled in schools in Hutchinson County, 368 (7.1%) attend a private institution, while the remaining 4,820 (92.9%) are enrolled in public schools. The age group of 20 to 24 year olds has the highest likelihood of being enrolled in private schools, with 112 (51.8% in the age bracket) enrolled. Conversely, the age group of 25 to 34 year olds has the lowest likelihood of being enrolled in a private school, with 214 (100.0% in the age bracket) attending a public institution.
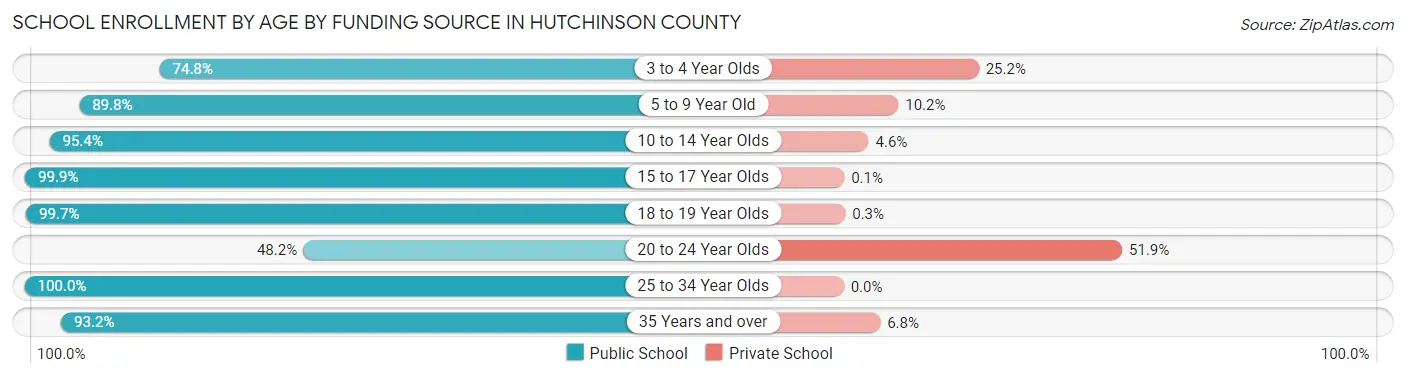
| Age Bracket | Public School | Private School |
| 3 to 4 Year Olds | 119 (74.8%) | 40 (25.2%) |
| 5 to 9 Year Old | 1,165 (89.8%) | 132 (10.2%) |
| 10 to 14 Year Olds | 1,500 (95.4%) | 73 (4.6%) |
| 15 to 17 Year Olds | 960 (99.9%) | 1 (0.1%) |
| 18 to 19 Year Olds | 663 (99.7%) | 2 (0.3%) |
| 20 to 24 Year Olds | 104 (48.1%) | 112 (51.8%) |
| 25 to 34 Year Olds | 214 (100.0%) | 0 (0.0%) |
| 35 Years and over | 96 (93.2%) | 7 (6.8%) |
| Total | 4,820 (92.9%) | 368 (7.1%) |
Educational Attainment by Field of Study in Hutchinson County
Education (399 | 16.4%), bio, nature & agricultural (302 | 12.4%), business (302 | 12.4%), engineering (238 | 9.8%), and science & technology (195 | 8.0%) are the most common fields of study among 2,434 individuals in Hutchinson County who have obtained a bachelor's degree or higher.
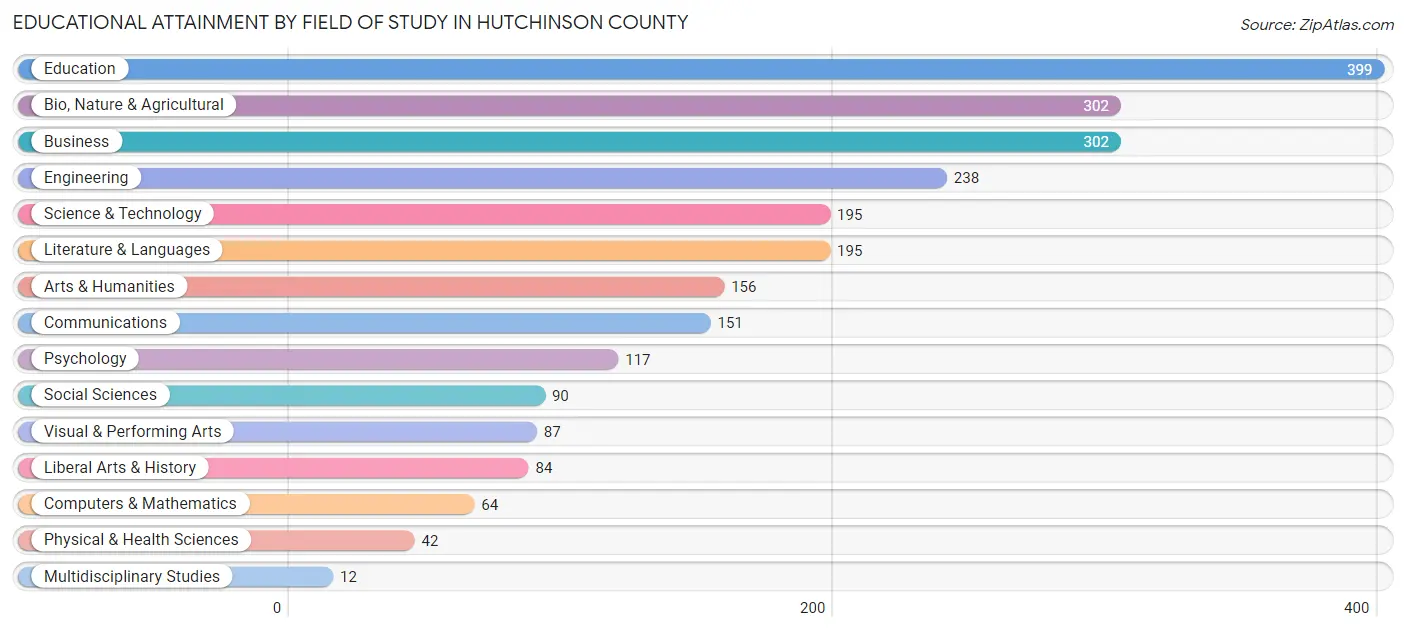
| Field of Study | # Graduates | % Graduates |
| Computers & Mathematics | 64 | 2.6% |
| Bio, Nature & Agricultural | 302 | 12.4% |
| Physical & Health Sciences | 42 | 1.7% |
| Psychology | 117 | 4.8% |
| Social Sciences | 90 | 3.7% |
| Engineering | 238 | 9.8% |
| Multidisciplinary Studies | 12 | 0.5% |
| Science & Technology | 195 | 8.0% |
| Business | 302 | 12.4% |
| Education | 399 | 16.4% |
| Literature & Languages | 195 | 8.0% |
| Liberal Arts & History | 84 | 3.5% |
| Visual & Performing Arts | 87 | 3.6% |
| Communications | 151 | 6.2% |
| Arts & Humanities | 156 | 6.4% |
| Total | 2,434 | 100.0% |
Transportation & Commute in Hutchinson County
Vehicle Availability by Sex in Hutchinson County
The most prevalent vehicle ownership categories in Hutchinson County are males with 2 vehicles (1,764, accounting for 35.2%) and females with 2 vehicles (1,449, making up 44.2%).
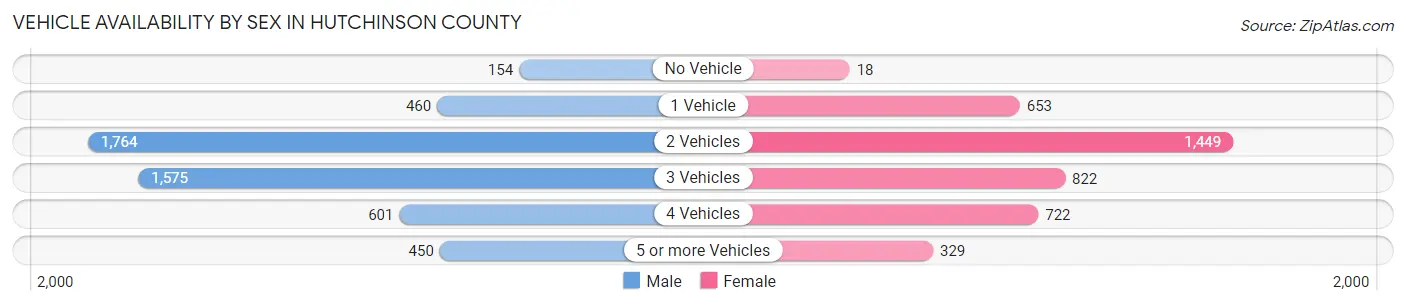
| Vehicles Available | Male | Female |
| No Vehicle | 154 (3.1%) | 18 (0.4%) |
| 1 Vehicle | 460 (9.2%) | 653 (16.4%) |
| 2 Vehicles | 1,764 (35.2%) | 1,449 (36.3%) |
| 3 Vehicles | 1,575 (31.5%) | 822 (20.6%) |
| 4 Vehicles | 601 (12.0%) | 722 (18.1%) |
| 5 or more Vehicles | 450 (9.0%) | 329 (8.2%) |
| Total | 5,004 (100.0%) | 3,993 (100.0%) |
Commute Time in Hutchinson County
The most frequently occuring commute durations in Hutchinson County are 5 to 9 minutes (2,343 commuters, 26.7%), 10 to 14 minutes (1,469 commuters, 16.8%), and 15 to 19 minutes (1,349 commuters, 15.4%).
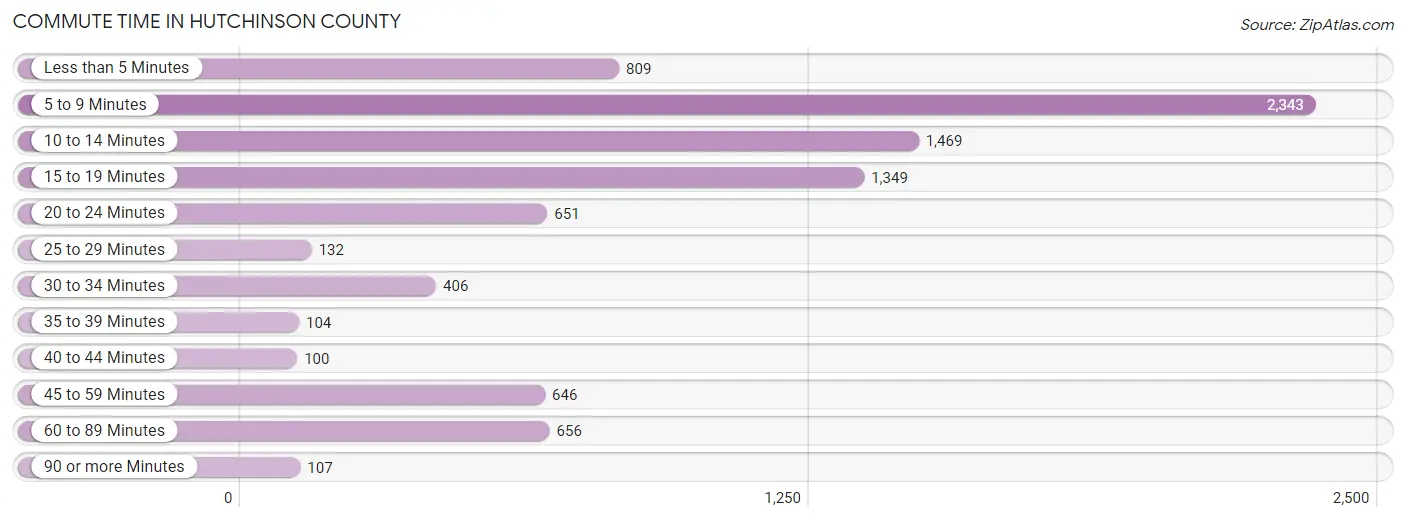
| Commute Time | # Commuters | % Commuters |
| Less than 5 Minutes | 809 | 9.2% |
| 5 to 9 Minutes | 2,343 | 26.7% |
| 10 to 14 Minutes | 1,469 | 16.8% |
| 15 to 19 Minutes | 1,349 | 15.4% |
| 20 to 24 Minutes | 651 | 7.4% |
| 25 to 29 Minutes | 132 | 1.5% |
| 30 to 34 Minutes | 406 | 4.6% |
| 35 to 39 Minutes | 104 | 1.2% |
| 40 to 44 Minutes | 100 | 1.1% |
| 45 to 59 Minutes | 646 | 7.4% |
| 60 to 89 Minutes | 656 | 7.5% |
| 90 or more Minutes | 107 | 1.2% |
Commute Time by Sex in Hutchinson County
The most common commute times in Hutchinson County are 5 to 9 minutes (1,107 commuters, 22.3%) for males and 5 to 9 minutes (1,236 commuters, 32.5%) for females.
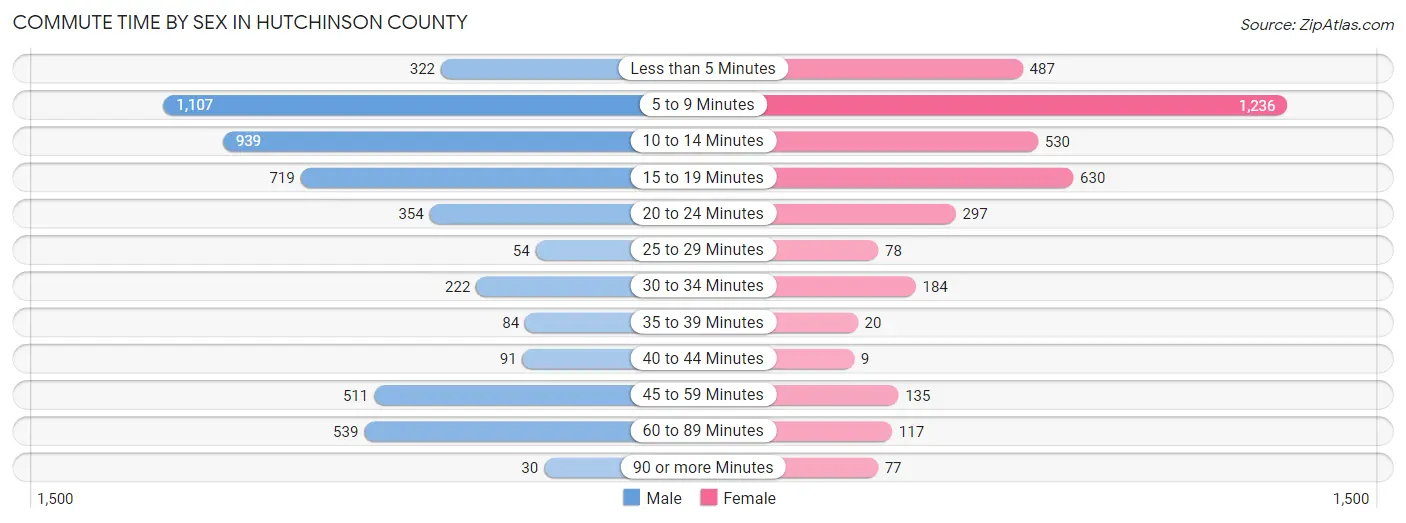
| Commute Time | Male | Female |
| Less than 5 Minutes | 322 (6.5%) | 487 (12.8%) |
| 5 to 9 Minutes | 1,107 (22.3%) | 1,236 (32.5%) |
| 10 to 14 Minutes | 939 (18.9%) | 530 (14.0%) |
| 15 to 19 Minutes | 719 (14.5%) | 630 (16.6%) |
| 20 to 24 Minutes | 354 (7.1%) | 297 (7.8%) |
| 25 to 29 Minutes | 54 (1.1%) | 78 (2.1%) |
| 30 to 34 Minutes | 222 (4.5%) | 184 (4.8%) |
| 35 to 39 Minutes | 84 (1.7%) | 20 (0.5%) |
| 40 to 44 Minutes | 91 (1.8%) | 9 (0.2%) |
| 45 to 59 Minutes | 511 (10.3%) | 135 (3.5%) |
| 60 to 89 Minutes | 539 (10.8%) | 117 (3.1%) |
| 90 or more Minutes | 30 (0.6%) | 77 (2.0%) |
Time of Departure to Work by Sex in Hutchinson County
The most frequent times of departure to work in Hutchinson County are 6:30 AM to 6:59 AM (683, 13.7%) for males and 7:00 AM to 7:29 AM (788, 20.7%) for females.
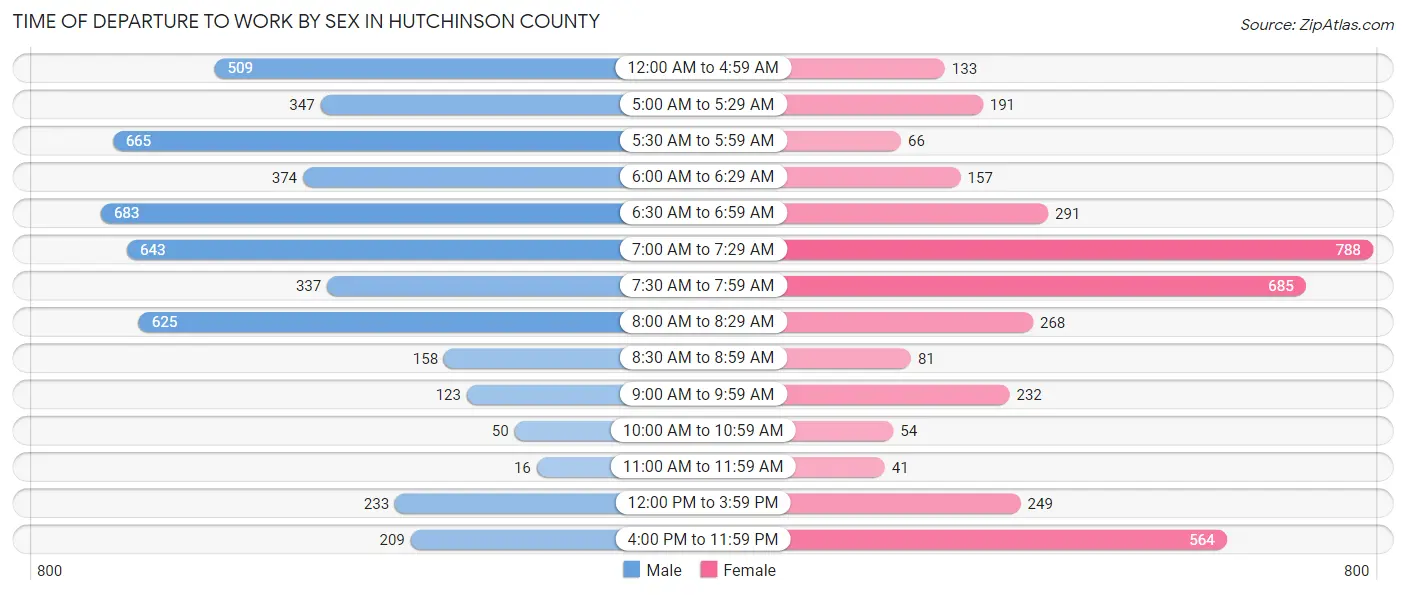
| Time of Departure | Male | Female |
| 12:00 AM to 4:59 AM | 509 (10.2%) | 133 (3.5%) |
| 5:00 AM to 5:29 AM | 347 (7.0%) | 191 (5.0%) |
| 5:30 AM to 5:59 AM | 665 (13.4%) | 66 (1.7%) |
| 6:00 AM to 6:29 AM | 374 (7.5%) | 157 (4.1%) |
| 6:30 AM to 6:59 AM | 683 (13.7%) | 291 (7.7%) |
| 7:00 AM to 7:29 AM | 643 (12.9%) | 788 (20.7%) |
| 7:30 AM to 7:59 AM | 337 (6.8%) | 685 (18.0%) |
| 8:00 AM to 8:29 AM | 625 (12.6%) | 268 (7.0%) |
| 8:30 AM to 8:59 AM | 158 (3.2%) | 81 (2.1%) |
| 9:00 AM to 9:59 AM | 123 (2.5%) | 232 (6.1%) |
| 10:00 AM to 10:59 AM | 50 (1.0%) | 54 (1.4%) |
| 11:00 AM to 11:59 AM | 16 (0.3%) | 41 (1.1%) |
| 12:00 PM to 3:59 PM | 233 (4.7%) | 249 (6.6%) |
| 4:00 PM to 11:59 PM | 209 (4.2%) | 564 (14.8%) |
| Total | 4,972 (100.0%) | 3,800 (100.0%) |
Housing Occupancy in Hutchinson County
Occupancy by Ownership in Hutchinson County
Of the total 6,711 dwellings in Hutchinson County, owner-occupied units account for 5,497 (81.9%), while renter-occupied units make up 1,214 (18.1%).
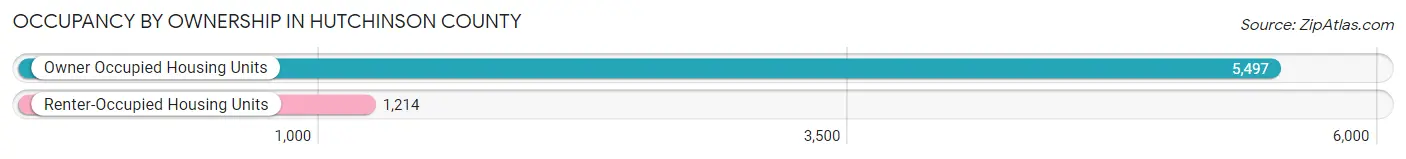
| Occupancy | # Housing Units | % Housing Units |
| Owner Occupied Housing Units | 5,497 | 81.9% |
| Renter-Occupied Housing Units | 1,214 | 18.1% |
| Total Occupied Housing Units | 6,711 | 100.0% |
Occupancy by Household Size in Hutchinson County
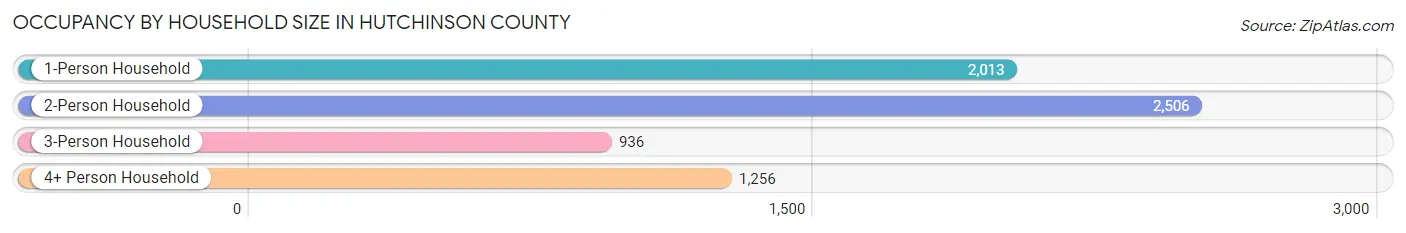
| Household Size | # Housing Units | % Housing Units |
| 1-Person Household | 2,013 | 30.0% |
| 2-Person Household | 2,506 | 37.3% |
| 3-Person Household | 936 | 14.0% |
| 4+ Person Household | 1,256 | 18.7% |
| Total Housing Units | 6,711 | 100.0% |
Occupancy by Ownership by Household Size in Hutchinson County
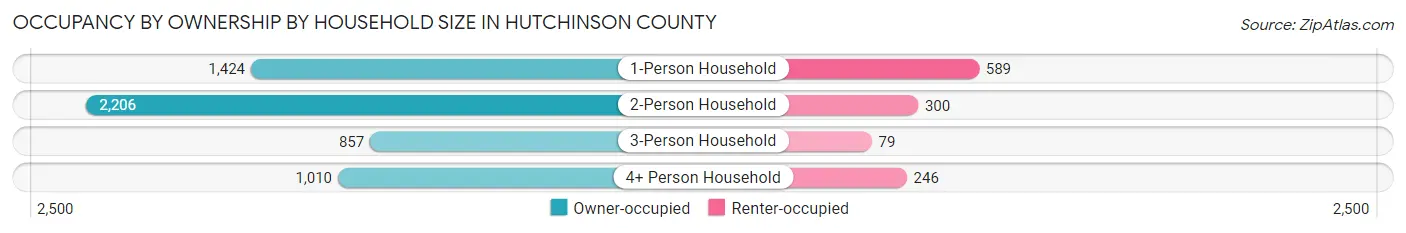
| Household Size | Owner-occupied | Renter-occupied |
| 1-Person Household | 1,424 (70.7%) | 589 (29.3%) |
| 2-Person Household | 2,206 (88.0%) | 300 (12.0%) |
| 3-Person Household | 857 (91.6%) | 79 (8.4%) |
| 4+ Person Household | 1,010 (80.4%) | 246 (19.6%) |
| Total Housing Units | 5,497 (81.9%) | 1,214 (18.1%) |
Occupancy by Educational Attainment in Hutchinson County
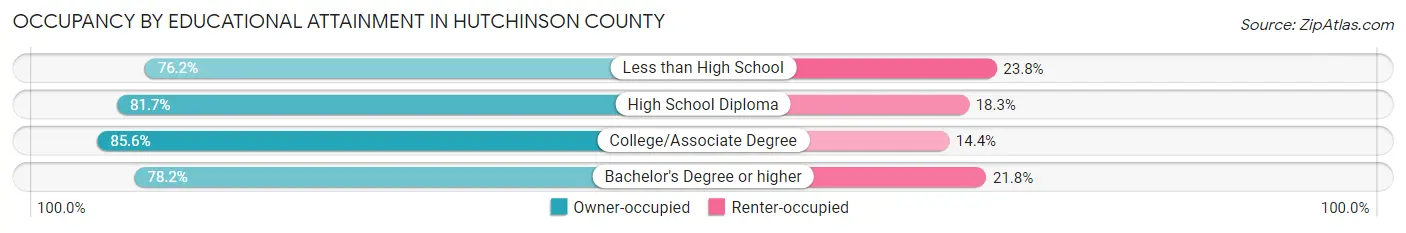
| Household Size | Owner-occupied | Renter-occupied |
| Less than High School | 623 (76.2%) | 195 (23.8%) |
| High School Diploma | 1,736 (81.7%) | 390 (18.3%) |
| College/Associate Degree | 2,226 (85.6%) | 375 (14.4%) |
| Bachelor's Degree or higher | 912 (78.2%) | 254 (21.8%) |
Occupancy by Age of Householder in Hutchinson County
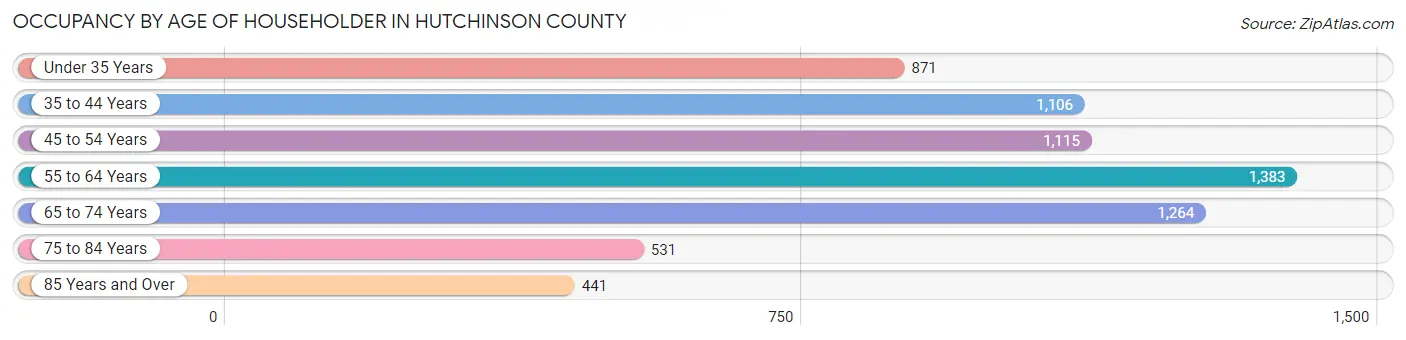
| Age Bracket | # Households | % Households |
| Under 35 Years | 871 | 13.0% |
| 35 to 44 Years | 1,106 | 16.5% |
| 45 to 54 Years | 1,115 | 16.6% |
| 55 to 64 Years | 1,383 | 20.6% |
| 65 to 74 Years | 1,264 | 18.8% |
| 75 to 84 Years | 531 | 7.9% |
| 85 Years and Over | 441 | 6.6% |
| Total | 6,711 | 100.0% |
Housing Finances in Hutchinson County
Median Income by Occupancy in Hutchinson County
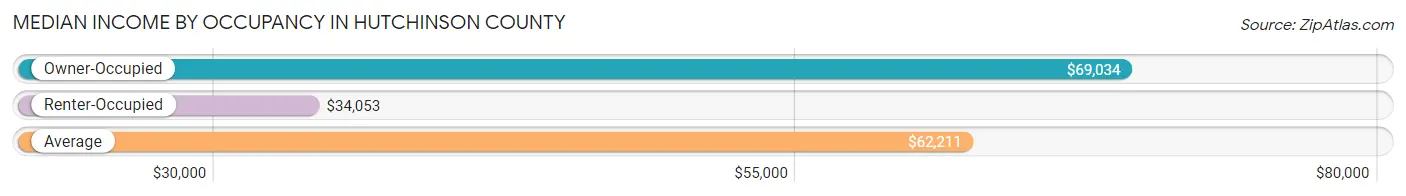
| Occupancy Type | # Households | Median Income |
| Owner-Occupied | 5,497 (81.9%) | $69,034 |
| Renter-Occupied | 1,214 (18.1%) | $34,053 |
| Average | 6,711 (100.0%) | $62,211 |
Occupancy by Householder Income Bracket in Hutchinson County
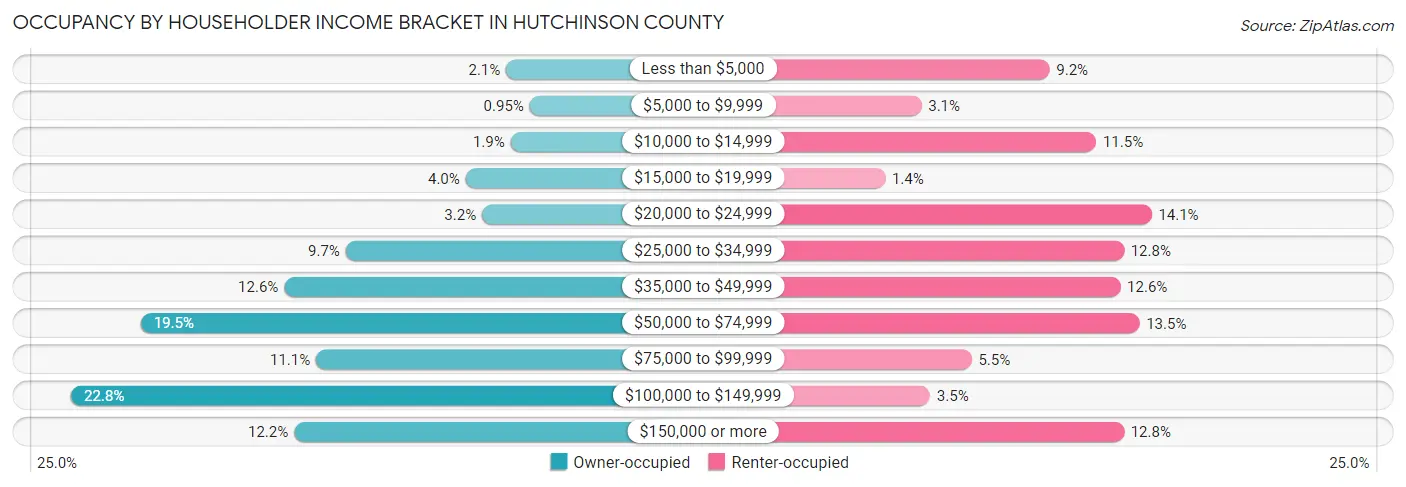
| Income Bracket | Owner-occupied | Renter-occupied |
| Less than $5,000 | 114 (2.1%) | 112 (9.2%) |
| $5,000 to $9,999 | 52 (0.9%) | 38 (3.1%) |
| $10,000 to $14,999 | 102 (1.9%) | 139 (11.5%) |
| $15,000 to $19,999 | 220 (4.0%) | 17 (1.4%) |
| $20,000 to $24,999 | 177 (3.2%) | 171 (14.1%) |
| $25,000 to $34,999 | 534 (9.7%) | 155 (12.8%) |
| $35,000 to $49,999 | 695 (12.6%) | 153 (12.6%) |
| $50,000 to $74,999 | 1,070 (19.5%) | 164 (13.5%) |
| $75,000 to $99,999 | 611 (11.1%) | 67 (5.5%) |
| $100,000 to $149,999 | 1,253 (22.8%) | 43 (3.5%) |
| $150,000 or more | 669 (12.2%) | 155 (12.8%) |
| Total | 5,497 (100.0%) | 1,214 (100.0%) |
Monthly Housing Cost Tiers in Hutchinson County
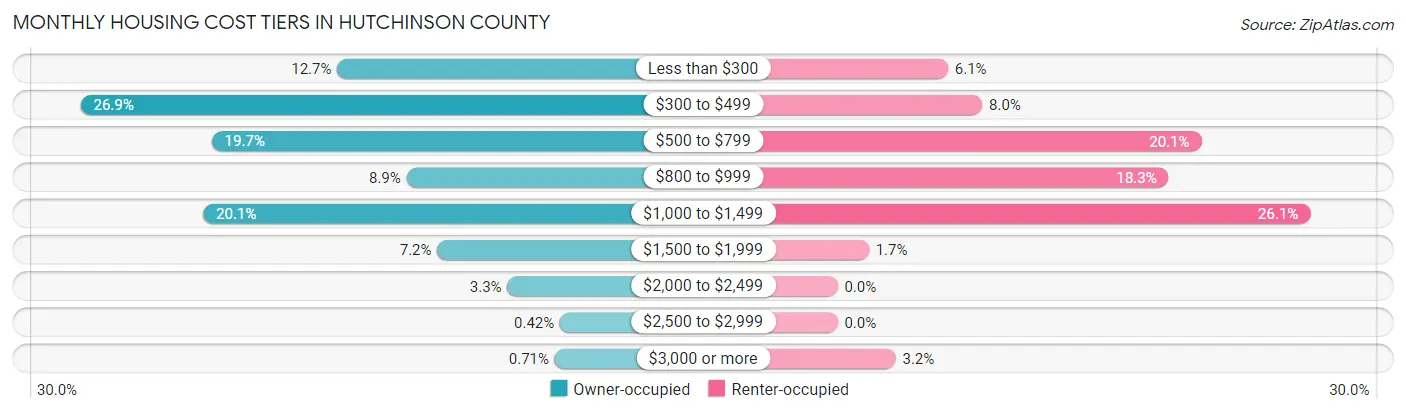
| Monthly Cost | Owner-occupied | Renter-occupied |
| Less than $300 | 700 (12.7%) | 74 (6.1%) |
| $300 to $499 | 1,479 (26.9%) | 97 (8.0%) |
| $500 to $799 | 1,081 (19.7%) | 244 (20.1%) |
| $800 to $999 | 489 (8.9%) | 222 (18.3%) |
| $1,000 to $1,499 | 1,107 (20.1%) | 317 (26.1%) |
| $1,500 to $1,999 | 396 (7.2%) | 21 (1.7%) |
| $2,000 to $2,499 | 183 (3.3%) | 0 (0.0%) |
| $2,500 to $2,999 | 23 (0.4%) | 0 (0.0%) |
| $3,000 or more | 39 (0.7%) | 39 (3.2%) |
| Total | 5,497 (100.0%) | 1,214 (100.0%) |
Physical Housing Characteristics in Hutchinson County
Housing Structures in Hutchinson County
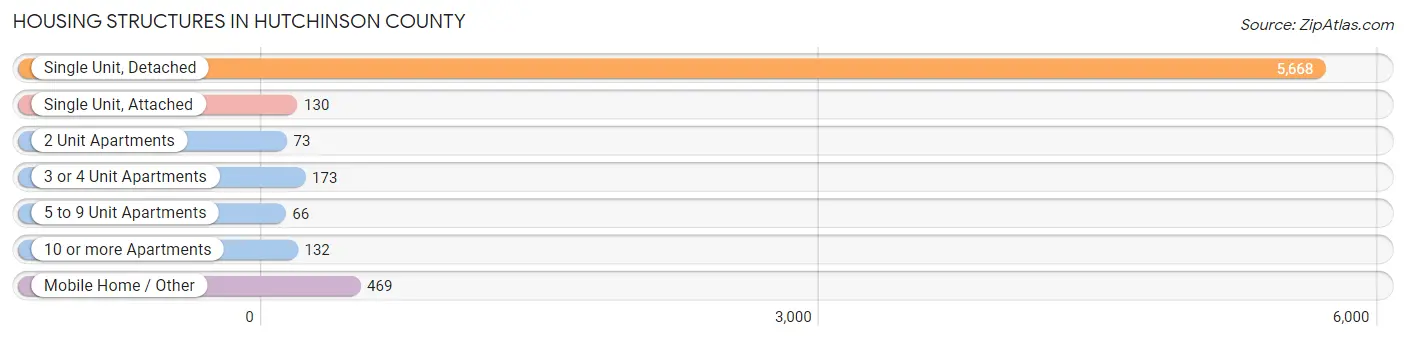
| Structure Type | # Housing Units | % Housing Units |
| Single Unit, Detached | 5,668 | 84.5% |
| Single Unit, Attached | 130 | 1.9% |
| 2 Unit Apartments | 73 | 1.1% |
| 3 or 4 Unit Apartments | 173 | 2.6% |
| 5 to 9 Unit Apartments | 66 | 1.0% |
| 10 or more Apartments | 132 | 2.0% |
| Mobile Home / Other | 469 | 7.0% |
| Total | 6,711 | 100.0% |
Housing Structures by Occupancy in Hutchinson County
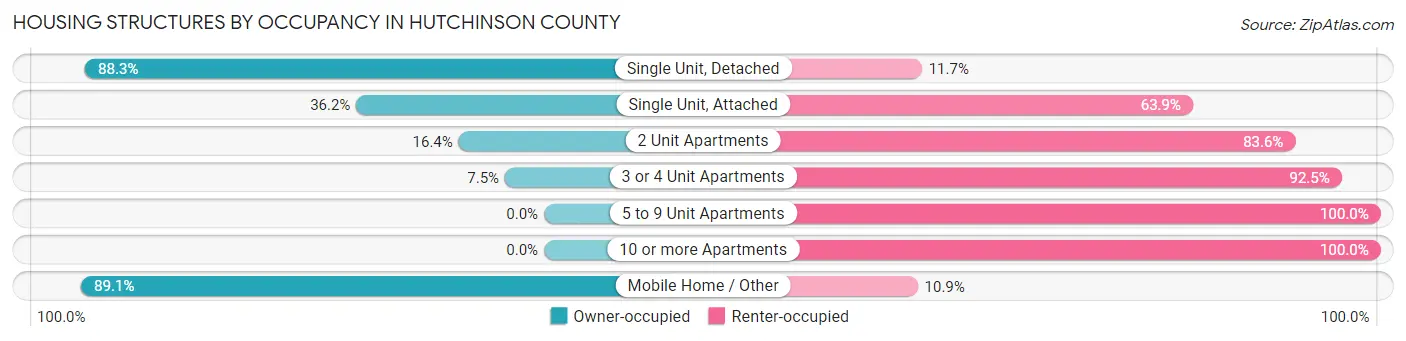
| Structure Type | Owner-occupied | Renter-occupied |
| Single Unit, Detached | 5,007 (88.3%) | 661 (11.7%) |
| Single Unit, Attached | 47 (36.1%) | 83 (63.8%) |
| 2 Unit Apartments | 12 (16.4%) | 61 (83.6%) |
| 3 or 4 Unit Apartments | 13 (7.5%) | 160 (92.5%) |
| 5 to 9 Unit Apartments | 0 (0.0%) | 66 (100.0%) |
| 10 or more Apartments | 0 (0.0%) | 132 (100.0%) |
| Mobile Home / Other | 418 (89.1%) | 51 (10.9%) |
| Total | 5,497 (81.9%) | 1,214 (18.1%) |
Housing Structures by Number of Rooms in Hutchinson County
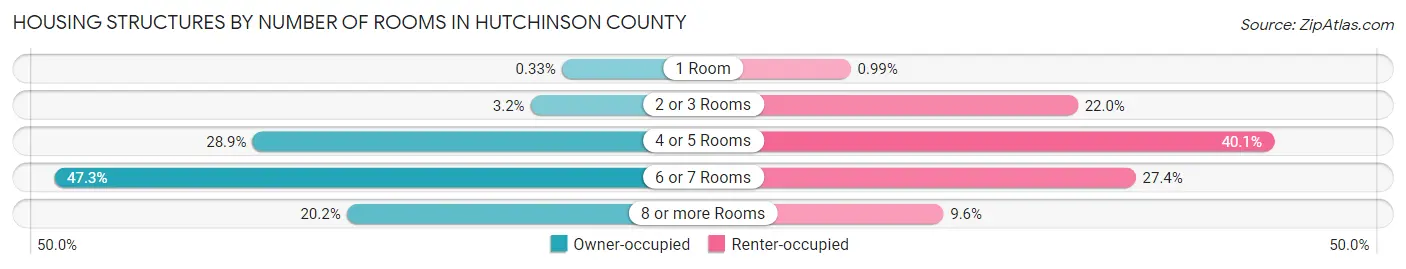
| Number of Rooms | Owner-occupied | Renter-occupied |
| 1 Room | 18 (0.3%) | 12 (1.0%) |
| 2 or 3 Rooms | 177 (3.2%) | 267 (22.0%) |
| 4 or 5 Rooms | 1,591 (28.9%) | 487 (40.1%) |
| 6 or 7 Rooms | 2,599 (47.3%) | 332 (27.4%) |
| 8 or more Rooms | 1,112 (20.2%) | 116 (9.6%) |
| Total | 5,497 (100.0%) | 1,214 (100.0%) |
Housing Structure by Heating Type in Hutchinson County
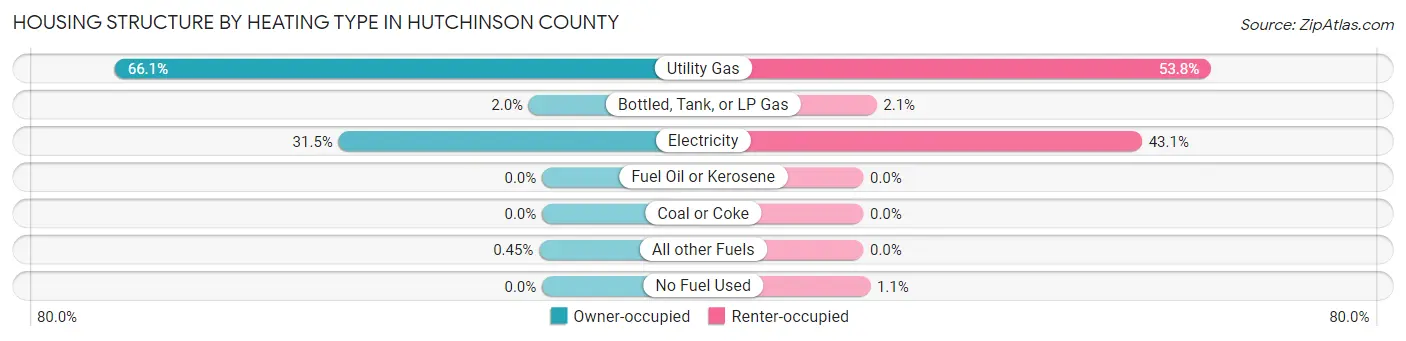
| Heating Type | Owner-occupied | Renter-occupied |
| Utility Gas | 3,631 (66.0%) | 653 (53.8%) |
| Bottled, Tank, or LP Gas | 112 (2.0%) | 25 (2.1%) |
| Electricity | 1,729 (31.5%) | 523 (43.1%) |
| Fuel Oil or Kerosene | 0 (0.0%) | 0 (0.0%) |
| Coal or Coke | 0 (0.0%) | 0 (0.0%) |
| All other Fuels | 25 (0.4%) | 0 (0.0%) |
| No Fuel Used | 0 (0.0%) | 13 (1.1%) |
| Total | 5,497 (100.0%) | 1,214 (100.0%) |
Household Vehicle Usage in Hutchinson County
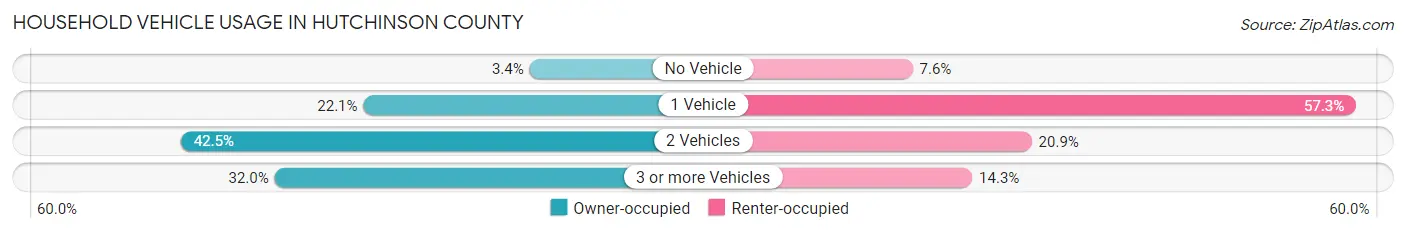
| Vehicles per Household | Owner-occupied | Renter-occupied |
| No Vehicle | 189 (3.4%) | 92 (7.6%) |
| 1 Vehicle | 1,212 (22.1%) | 695 (57.3%) |
| 2 Vehicles | 2,337 (42.5%) | 254 (20.9%) |
| 3 or more Vehicles | 1,759 (32.0%) | 173 (14.2%) |
| Total | 5,497 (100.0%) | 1,214 (100.0%) |
Real Estate & Mortgages in Hutchinson County
Real Estate and Mortgage Overview in Hutchinson County
| Characteristic | Without Mortgage | With Mortgage |
| Housing Units | 3,420 | 2,077 |
| Median Property Value | $85,800 | $127,300 |
| Median Household Income | $60,211 | $358 |
| Monthly Housing Costs | $433 | $39 |
| Real Estate Taxes | $1,243 | $145 |
Property Value by Mortgage Status in Hutchinson County
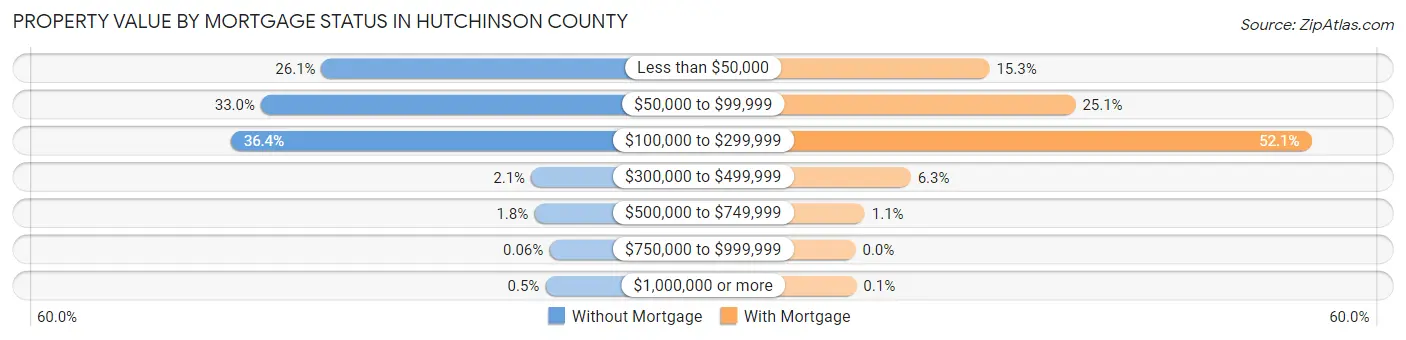
| Property Value | Without Mortgage | With Mortgage |
| Less than $50,000 | 892 (26.1%) | 318 (15.3%) |
| $50,000 to $99,999 | 1,129 (33.0%) | 522 (25.1%) |
| $100,000 to $299,999 | 1,246 (36.4%) | 1,082 (52.1%) |
| $300,000 to $499,999 | 73 (2.1%) | 131 (6.3%) |
| $500,000 to $749,999 | 61 (1.8%) | 22 (1.1%) |
| $750,000 to $999,999 | 2 (0.1%) | 0 (0.0%) |
| $1,000,000 or more | 17 (0.5%) | 2 (0.1%) |
| Total | 3,420 (100.0%) | 2,077 (100.0%) |
Household Income by Mortgage Status in Hutchinson County
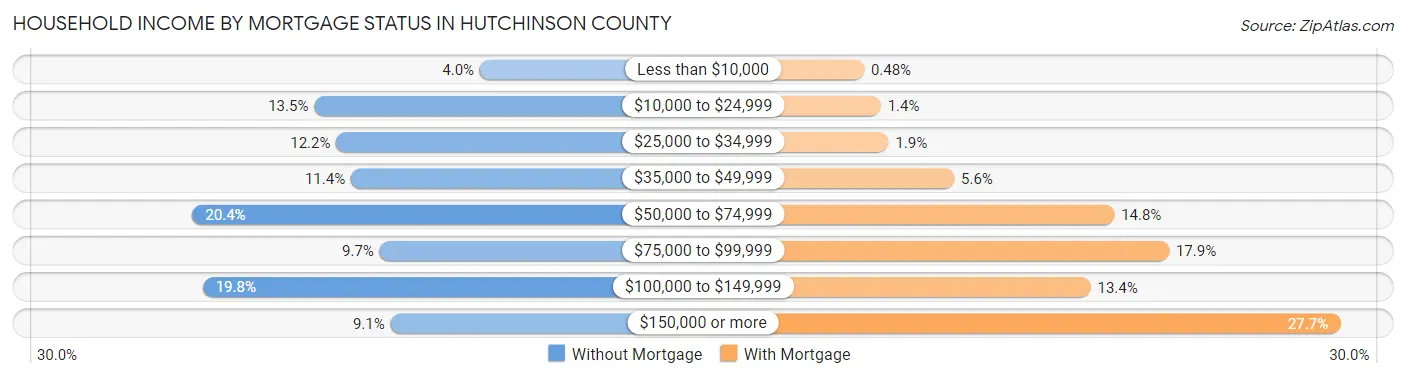
| Household Income | Without Mortgage | With Mortgage |
| Less than $10,000 | 136 (4.0%) | 10 (0.5%) |
| $10,000 to $24,999 | 460 (13.5%) | 30 (1.4%) |
| $25,000 to $34,999 | 417 (12.2%) | 39 (1.9%) |
| $35,000 to $49,999 | 388 (11.4%) | 117 (5.6%) |
| $50,000 to $74,999 | 698 (20.4%) | 307 (14.8%) |
| $75,000 to $99,999 | 332 (9.7%) | 372 (17.9%) |
| $100,000 to $149,999 | 678 (19.8%) | 279 (13.4%) |
| $150,000 or more | 311 (9.1%) | 575 (27.7%) |
| Total | 3,420 (100.0%) | 2,077 (100.0%) |
Property Value to Household Income Ratio in Hutchinson County
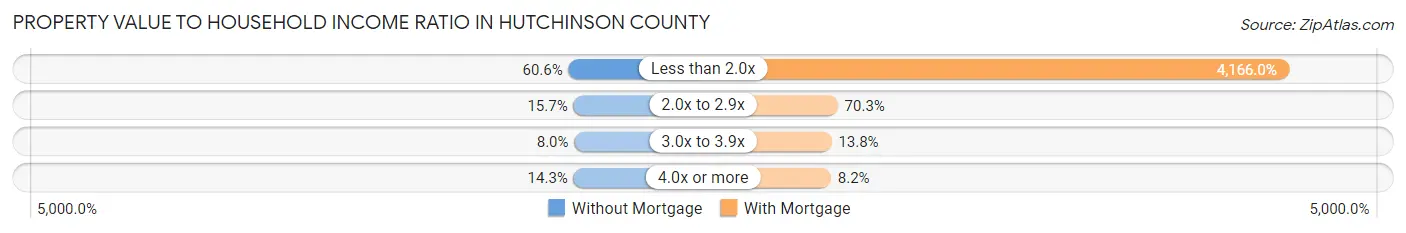
| Value-to-Income Ratio | Without Mortgage | With Mortgage |
| Less than 2.0x | 2,074 (60.6%) | 86,528 (4,166.0%) |
| 2.0x to 2.9x | 536 (15.7%) | 1,459 (70.3%) |
| 3.0x to 3.9x | 273 (8.0%) | 286 (13.8%) |
| 4.0x or more | 489 (14.3%) | 171 (8.2%) |
| Total | 3,420 (100.0%) | 2,077 (100.0%) |
Real Estate Taxes by Mortgage Status in Hutchinson County
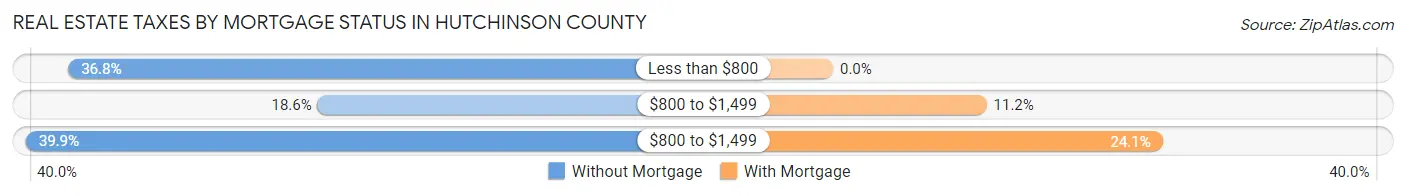
| Property Taxes | Without Mortgage | With Mortgage |
| Less than $800 | 1,259 (36.8%) | 0 (0.0%) |
| $800 to $1,499 | 636 (18.6%) | 233 (11.2%) |
| $800 to $1,499 | 1,365 (39.9%) | 500 (24.1%) |
| Total | 3,420 (100.0%) | 2,077 (100.0%) |
Health & Disability in Hutchinson County
Health Insurance Coverage by Age in Hutchinson County
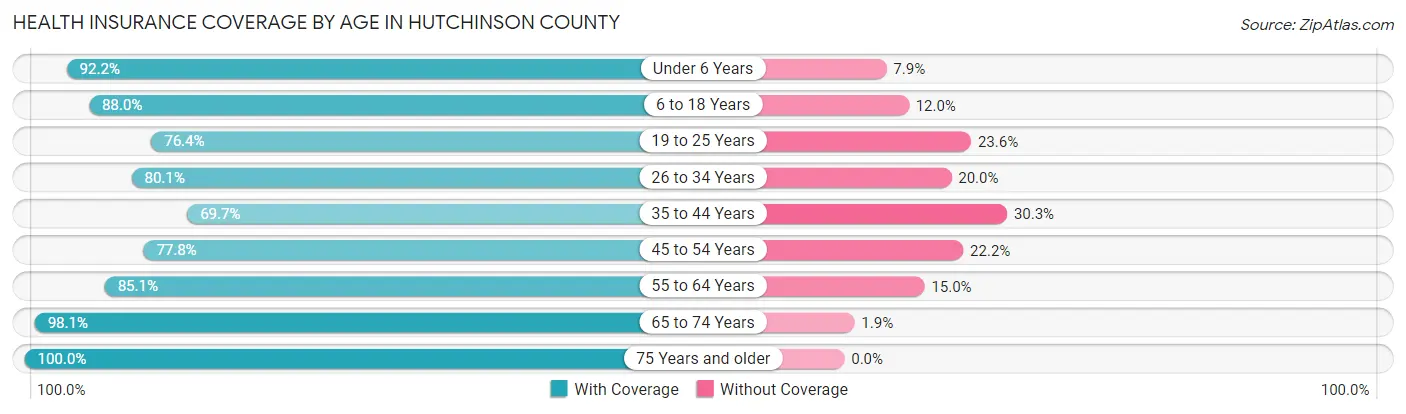
| Age Bracket | With Coverage | Without Coverage |
| Under 6 Years | 1,292 (92.1%) | 110 (7.9%) |
| 6 to 18 Years | 3,568 (88.0%) | 487 (12.0%) |
| 19 to 25 Years | 1,464 (76.4%) | 453 (23.6%) |
| 26 to 34 Years | 1,725 (80.0%) | 430 (20.0%) |
| 35 to 44 Years | 1,849 (69.7%) | 805 (30.3%) |
| 45 to 54 Years | 1,706 (77.8%) | 486 (22.2%) |
| 55 to 64 Years | 2,213 (85.1%) | 389 (14.9%) |
| 65 to 74 Years | 2,077 (98.1%) | 40 (1.9%) |
| 75 Years and older | 1,378 (100.0%) | 0 (0.0%) |
| Total | 17,272 (84.4%) | 3,200 (15.6%) |
Health Insurance Coverage by Citizenship Status in Hutchinson County
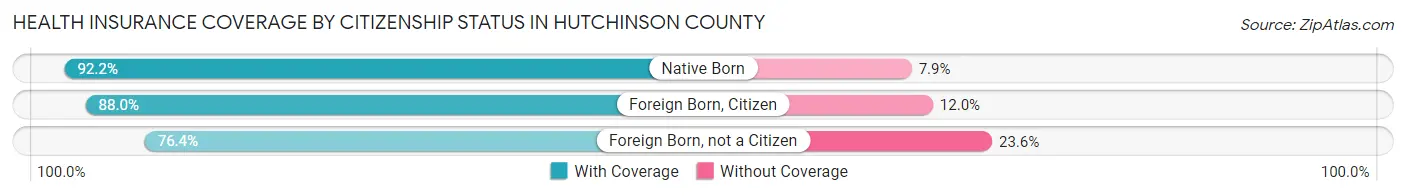
| Citizenship Status | With Coverage | Without Coverage |
| Native Born | 1,292 (92.1%) | 110 (7.9%) |
| Foreign Born, Citizen | 3,568 (88.0%) | 487 (12.0%) |
| Foreign Born, not a Citizen | 1,464 (76.4%) | 453 (23.6%) |
Health Insurance Coverage by Household Income in Hutchinson County
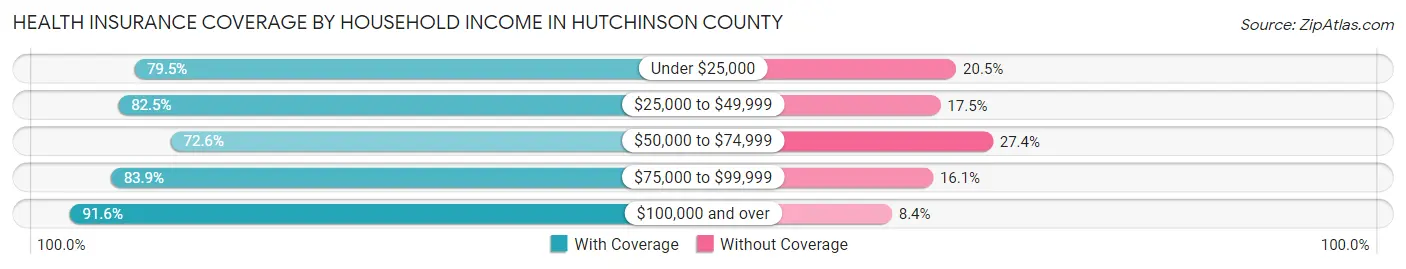
| Household Income | With Coverage | Without Coverage |
| Under $25,000 | 1,568 (79.5%) | 404 (20.5%) |
| $25,000 to $49,999 | 2,905 (82.5%) | 618 (17.5%) |
| $50,000 to $74,999 | 2,872 (72.6%) | 1,082 (27.4%) |
| $75,000 to $99,999 | 1,834 (83.9%) | 353 (16.1%) |
| $100,000 and over | 8,028 (91.6%) | 739 (8.4%) |
Public vs Private Health Insurance Coverage by Age in Hutchinson County
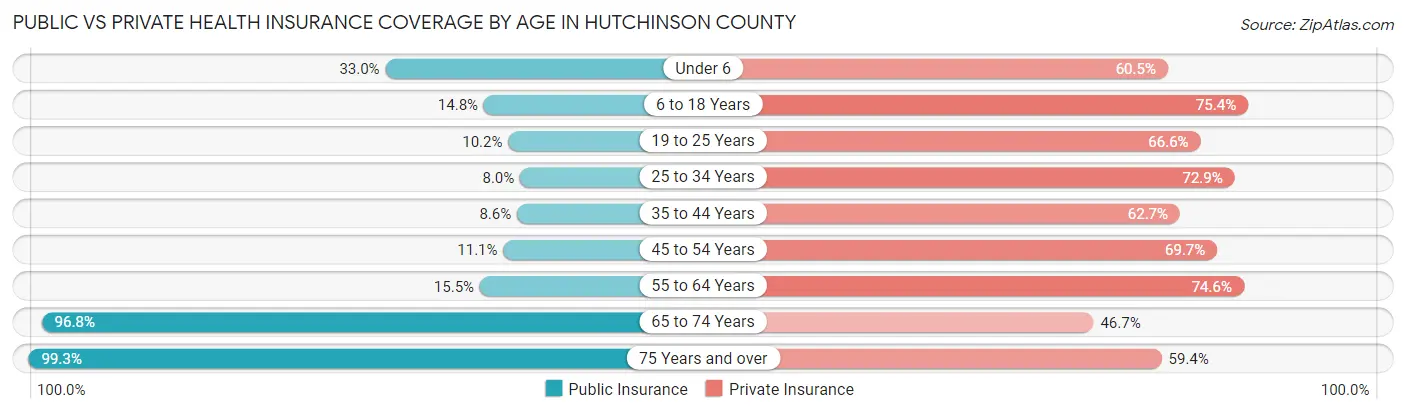
| Age Bracket | Public Insurance | Private Insurance |
| Under 6 | 463 (33.0%) | 848 (60.5%) |
| 6 to 18 Years | 598 (14.7%) | 3,057 (75.4%) |
| 19 to 25 Years | 196 (10.2%) | 1,276 (66.6%) |
| 25 to 34 Years | 173 (8.0%) | 1,571 (72.9%) |
| 35 to 44 Years | 228 (8.6%) | 1,665 (62.7%) |
| 45 to 54 Years | 244 (11.1%) | 1,527 (69.7%) |
| 55 to 64 Years | 403 (15.5%) | 1,941 (74.6%) |
| 65 to 74 Years | 2,050 (96.8%) | 989 (46.7%) |
| 75 Years and over | 1,368 (99.3%) | 818 (59.4%) |
| Total | 5,723 (28.0%) | 13,692 (66.9%) |
Disability Status by Sex by Age in Hutchinson County
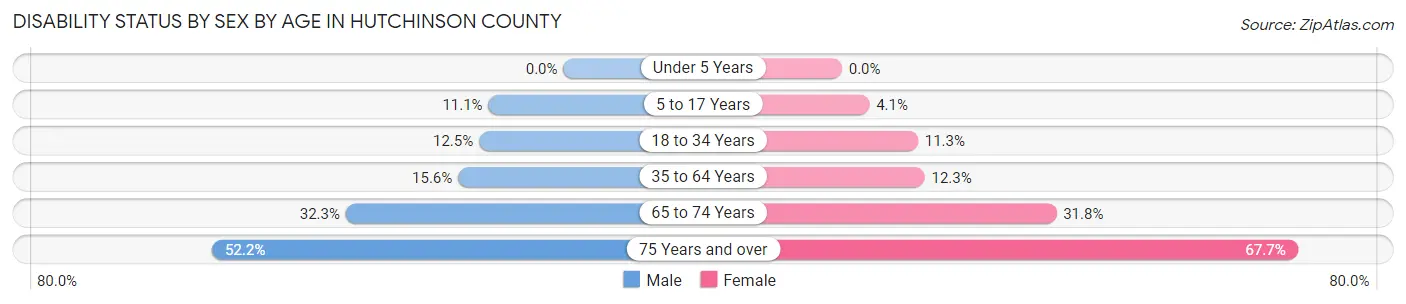
| Age Bracket | Male | Female |
| Under 5 Years | 0 (0.0%) | 0 (0.0%) |
| 5 to 17 Years | 228 (11.1%) | 77 (4.1%) |
| 18 to 34 Years | 303 (12.5%) | 220 (11.3%) |
| 35 to 64 Years | 578 (15.6%) | 461 (12.3%) |
| 65 to 74 Years | 353 (32.3%) | 326 (31.8%) |
| 75 Years and over | 301 (52.2%) | 542 (67.7%) |
Disability Class by Sex by Age in Hutchinson County
Disability Class: Hearing Difficulty
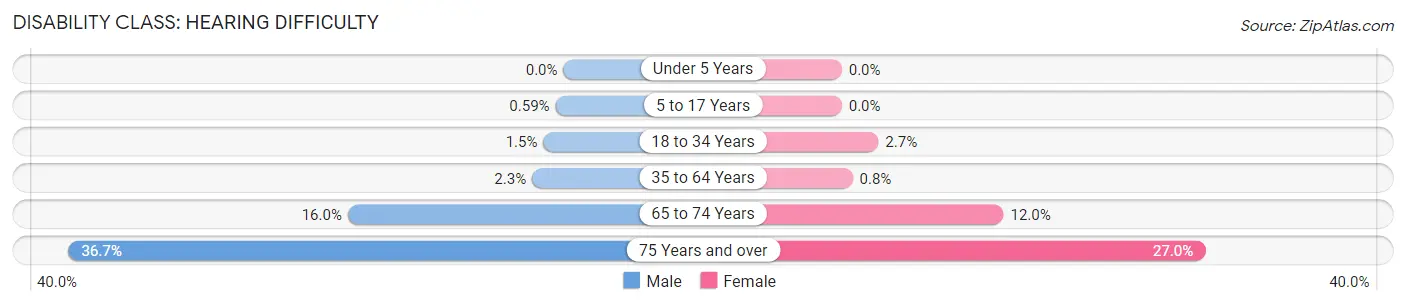
| Age Bracket | Male | Female |
| Under 5 Years | 0 (0.0%) | 0 (0.0%) |
| 5 to 17 Years | 12 (0.6%) | 0 (0.0%) |
| 18 to 34 Years | 36 (1.5%) | 53 (2.7%) |
| 35 to 64 Years | 86 (2.3%) | 30 (0.8%) |
| 65 to 74 Years | 175 (16.0%) | 123 (12.0%) |
| 75 Years and over | 212 (36.7%) | 216 (27.0%) |
Disability Class: Vision Difficulty
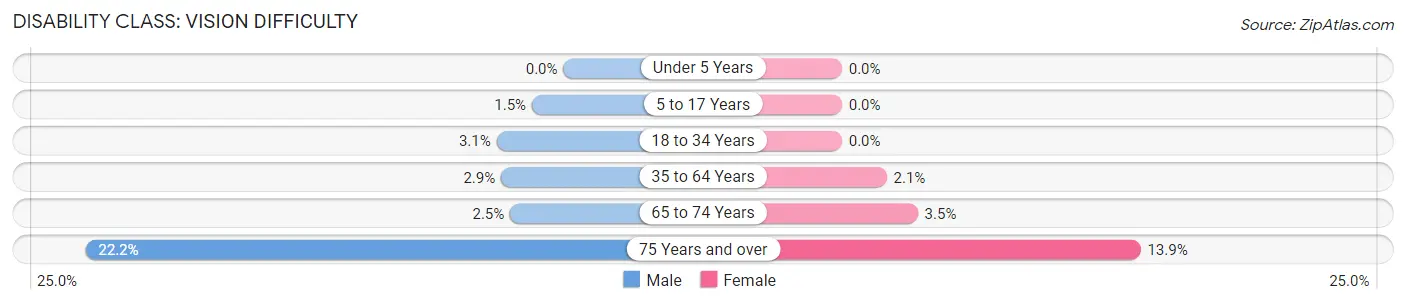
| Age Bracket | Male | Female |
| Under 5 Years | 0 (0.0%) | 0 (0.0%) |
| 5 to 17 Years | 30 (1.5%) | 0 (0.0%) |
| 18 to 34 Years | 75 (3.1%) | 0 (0.0%) |
| 35 to 64 Years | 107 (2.9%) | 78 (2.1%) |
| 65 to 74 Years | 27 (2.5%) | 36 (3.5%) |
| 75 Years and over | 128 (22.2%) | 111 (13.9%) |
Disability Class: Cognitive Difficulty
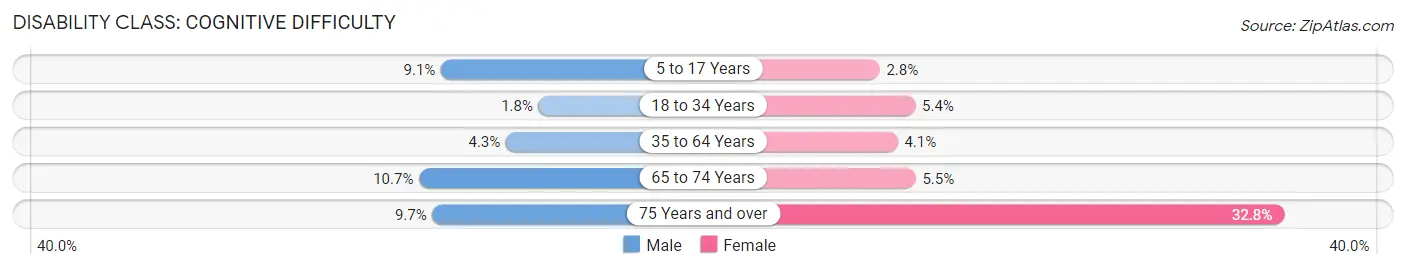
| Age Bracket | Male | Female |
| 5 to 17 Years | 186 (9.1%) | 53 (2.8%) |
| 18 to 34 Years | 44 (1.8%) | 106 (5.4%) |
| 35 to 64 Years | 157 (4.3%) | 155 (4.1%) |
| 65 to 74 Years | 117 (10.7%) | 56 (5.5%) |
| 75 Years and over | 56 (9.7%) | 263 (32.8%) |
Disability Class: Ambulatory Difficulty
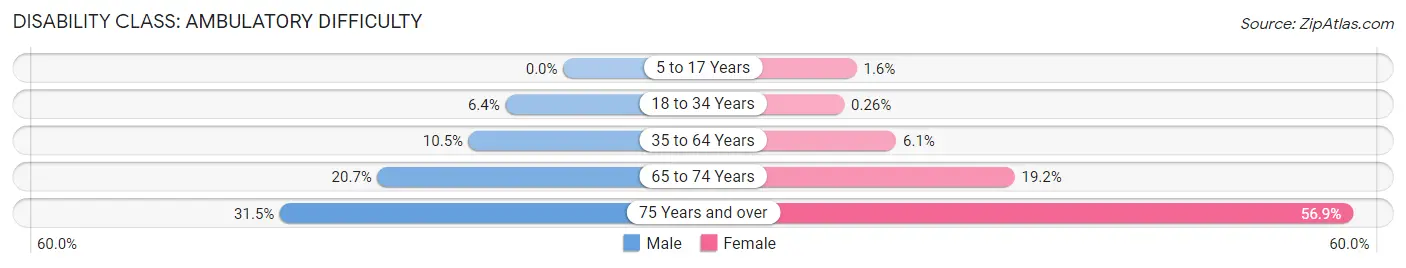
| Age Bracket | Male | Female |
| 5 to 17 Years | 0 (0.0%) | 31 (1.6%) |
| 18 to 34 Years | 156 (6.4%) | 5 (0.3%) |
| 35 to 64 Years | 389 (10.5%) | 227 (6.0%) |
| 65 to 74 Years | 226 (20.7%) | 197 (19.2%) |
| 75 Years and over | 182 (31.5%) | 456 (56.9%) |
Disability Class: Self-Care Difficulty
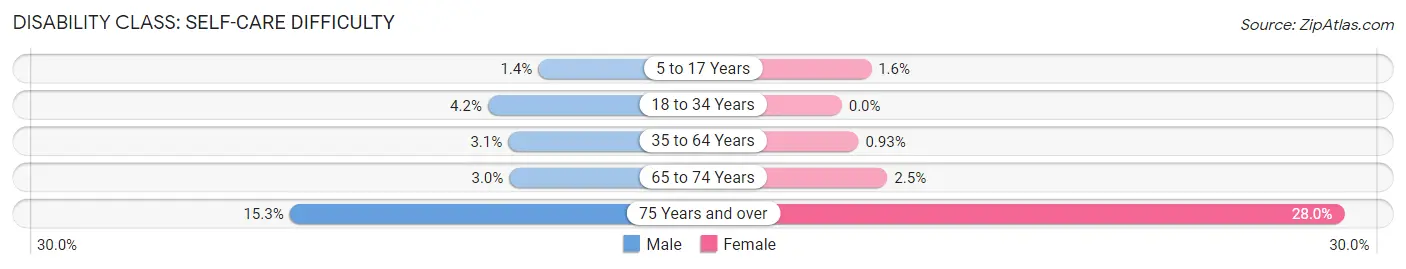
| Age Bracket | Male | Female |
| 5 to 17 Years | 29 (1.4%) | 31 (1.6%) |
| 18 to 34 Years | 102 (4.2%) | 0 (0.0%) |
| 35 to 64 Years | 114 (3.1%) | 35 (0.9%) |
| 65 to 74 Years | 33 (3.0%) | 26 (2.5%) |
| 75 Years and over | 88 (15.2%) | 224 (28.0%) |
Technology Access in Hutchinson County
Computing Device Access in Hutchinson County
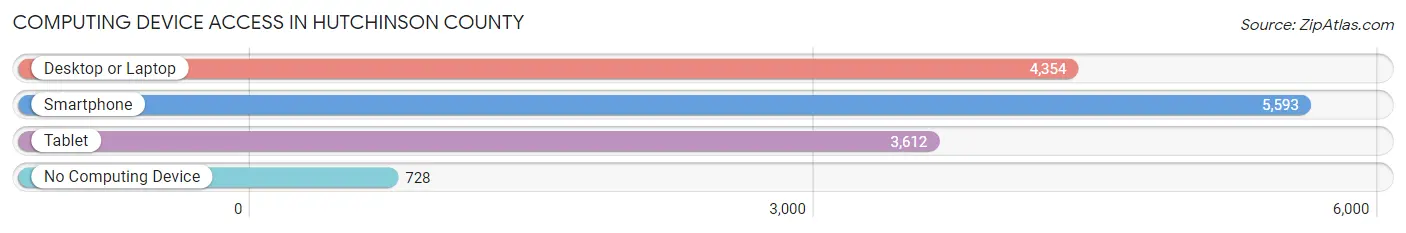
| Device Type | # Households | % Households |
| Desktop or Laptop | 4,354 | 64.9% |
| Smartphone | 5,593 | 83.3% |
| Tablet | 3,612 | 53.8% |
| No Computing Device | 728 | 10.8% |
| Total | 6,711 | 100.0% |
Internet Access in Hutchinson County
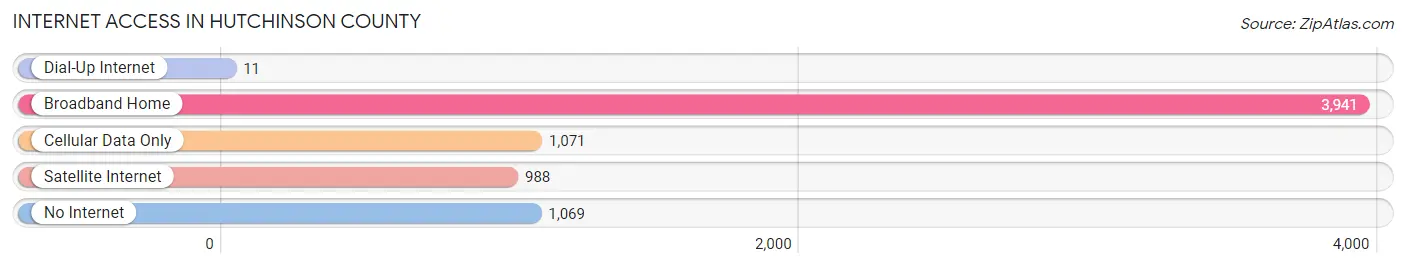
| Internet Type | # Households | % Households |
| Dial-Up Internet | 11 | 0.2% |
| Broadband Home | 3,941 | 58.7% |
| Cellular Data Only | 1,071 | 16.0% |
| Satellite Internet | 988 | 14.7% |
| No Internet | 1,069 | 15.9% |
| Total | 6,711 | 100.0% |
Hutchinson County Summary
Hutchinson County, Texas is located in the northern part of the state, in the Texas Panhandle. It is bordered by Moore County to the north, Hansford County to the east, Roberts County to the south, and Dallam County to the west. The county seat is Stinnett, and the largest city is Borger. Hutchinson County covers an area of 902 square miles and has a population of 22,150, as of the 2020 census.
History
Hutchinson County was established in 1876, and was named for Andrew Hutchinson, a Texas Ranger who fought in the Battle of San Jacinto. The county was originally part of Bexar County, and was later part of Young County. In 1876, it was organized as its own county.
The first settlers in the area were ranchers, who were attracted by the abundance of grass and water. The first town in the county was Stinnett, which was established in 1891. The town was named after a local rancher, William Stinnett.
In the early 1900s, oil was discovered in the county, and the area quickly became a major oil-producing region. The discovery of oil led to a population boom, and the county's population grew from 4,000 in 1910 to over 20,000 by 1930.
Geography
Hutchinson County is located in the Texas Panhandle, and is bordered by Moore County to the north, Hansford County to the east, Roberts County to the south, and Dallam County to the west. The county covers an area of 902 square miles, and is mostly flat, with some rolling hills in the western part of the county.
The county is home to several lakes, including Lake Meredith, Lake Greenbelt, and Lake McClellan. The Canadian River runs through the county, and is a popular spot for fishing and boating.
Economy
Hutchinson County's economy is largely based on oil and gas production. The county is home to several oil and gas companies, including Chevron, ExxonMobil, and ConocoPhillips. The county is also home to several manufacturing companies, including Borger Refinery, which produces gasoline and other petroleum products.
Agriculture is also an important part of the county's economy. The county is home to several farms, which produce wheat, corn, cotton, and other crops.
Demographics
As of the 2020 census, Hutchinson County had a population of 22,150. The population is mostly white (83.3%), with smaller percentages of Hispanic (11.2%), African American (2.7%), and Native American (1.2%) residents.
The median household income in the county is $50,945, and the median home value is $90,400. The unemployment rate is 4.2%.
Conclusion
Hutchinson County, Texas is located in the northern part of the state, in the Texas Panhandle. It was established in 1876, and is named for Andrew Hutchinson, a Texas Ranger who fought in the Battle of San Jacinto. The county is home to several oil and gas companies, and is also an important agricultural region. The population of the county is mostly white, with smaller percentages of Hispanic, African American, and Native American residents. The median household income is $50,945, and the median home value is $90,400.
Common Questions
What is Per Capita Income in Hutchinson County?
Per Capita income in Hutchinson County is $30,038.
What is the Median Family Income in Hutchinson County?
Median Family Income in Hutchinson County is $80,865.
What is the Median Household income in Hutchinson County?
Median Household Income in Hutchinson County is $62,211.
What is Income or Wage Gap in Hutchinson County?
Income or Wage Gap in Hutchinson County is 46.2%.
Women in Hutchinson County earn 53.8 cents for every dollar earned by a man.
What is Family Income Deficit in Hutchinson County?
Family Income Deficit in Hutchinson County is $10,157.
Families that are below poverty line in Hutchinson County earn $10,157 less on average than the poverty threshold level.
What is Inequality or Gini Index in Hutchinson County?
Inequality or Gini Index in Hutchinson County is 0.42.
What is the Total Population of Hutchinson County?
Total Population of Hutchinson County is 20,595.
What is the Total Male Population of Hutchinson County?
Total Male Population of Hutchinson County is 10,552.
What is the Total Female Population of Hutchinson County?
Total Female Population of Hutchinson County is 10,043.
What is the Ratio of Males per 100 Females in Hutchinson County?
There are 105.07 Males per 100 Females in Hutchinson County.
What is the Ratio of Females per 100 Males in Hutchinson County?
There are 95.18 Females per 100 Males in Hutchinson County.
What is the Median Population Age in Hutchinson County?
Median Population Age in Hutchinson County is 38.3 Years.
What is the Average Family Size in Hutchinson County
Average Family Size in Hutchinson County is 3.9 People.
What is the Average Household Size in Hutchinson County
Average Household Size in Hutchinson County is 3.0 People.
How Large is the Labor Force in Hutchinson County?
There are 9,675 People in the Labor Forcein in Hutchinson County.
What is the Percentage of People in the Labor Force in Hutchinson County?
60.3% of People are in the Labor Force in Hutchinson County.
What is the Unemployment Rate in Hutchinson County?
Unemployment Rate in Hutchinson County is 4.3%.