Hunt County, TX Map & Demographics
Hunt County Map
Hunt County Overview
$31,362
PER CAPITA INCOME
$79,132
AVG FAMILY INCOME
$66,885
AVG HOUSEHOLD INCOME
31.8%
WAGE / INCOME GAP [ % ]
68.2¢/ $1
WAGE / INCOME GAP [ $ ]
$9,892
FAMILY INCOME DEFICIT
0.43
INEQUALITY / GINI INDEX
101,596
TOTAL POPULATION
50,144
MALE POPULATION
51,452
FEMALE POPULATION
97.46
MALES / 100 FEMALES
102.61
FEMALES / 100 MALES
37.6
MEDIAN AGE
3.2
AVG FAMILY SIZE
2.7
AVG HOUSEHOLD SIZE
48,946
LABOR FORCE [ PEOPLE ]
61.1%
PERCENT IN LABOR FORCE
5.8%
UNEMPLOYMENT RATE
Income in Hunt County
Income Overview in Hunt County
Per Capita Income in Hunt County is $31,362, while median incomes of families and households are $79,132 and $66,885 respectively.
| Characteristic | Number | Measure |
| Per Capita Income | 101,596 | $31,362 |
| Median Family Income | 25,979 | $79,132 |
| Mean Family Income | 25,979 | $97,757 |
| Median Household Income | 36,560 | $66,885 |
| Mean Household Income | 36,560 | $84,800 |
| Income Deficit | 25,979 | $9,892 |
| Wage / Income Gap (%) | 101,596 | 31.84% |
| Wage / Income Gap ($) | 101,596 | 68.16¢ per $1 |
| Gini / Inequality Index | 101,596 | 0.43 |
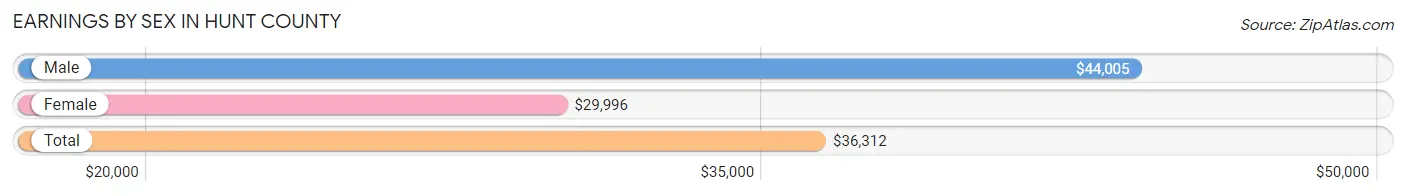
Earnings by Sex in Hunt County
Average Earnings in Hunt County are $36,312, $44,005 for men and $29,996 for women, a difference of 31.8%.
| Sex | Number | Average Earnings |
| Male | 28,153 (54.4%) | $44,005 |
| Female | 23,601 (45.6%) | $29,996 |
| Total | 51,754 (100.0%) | $36,312 |
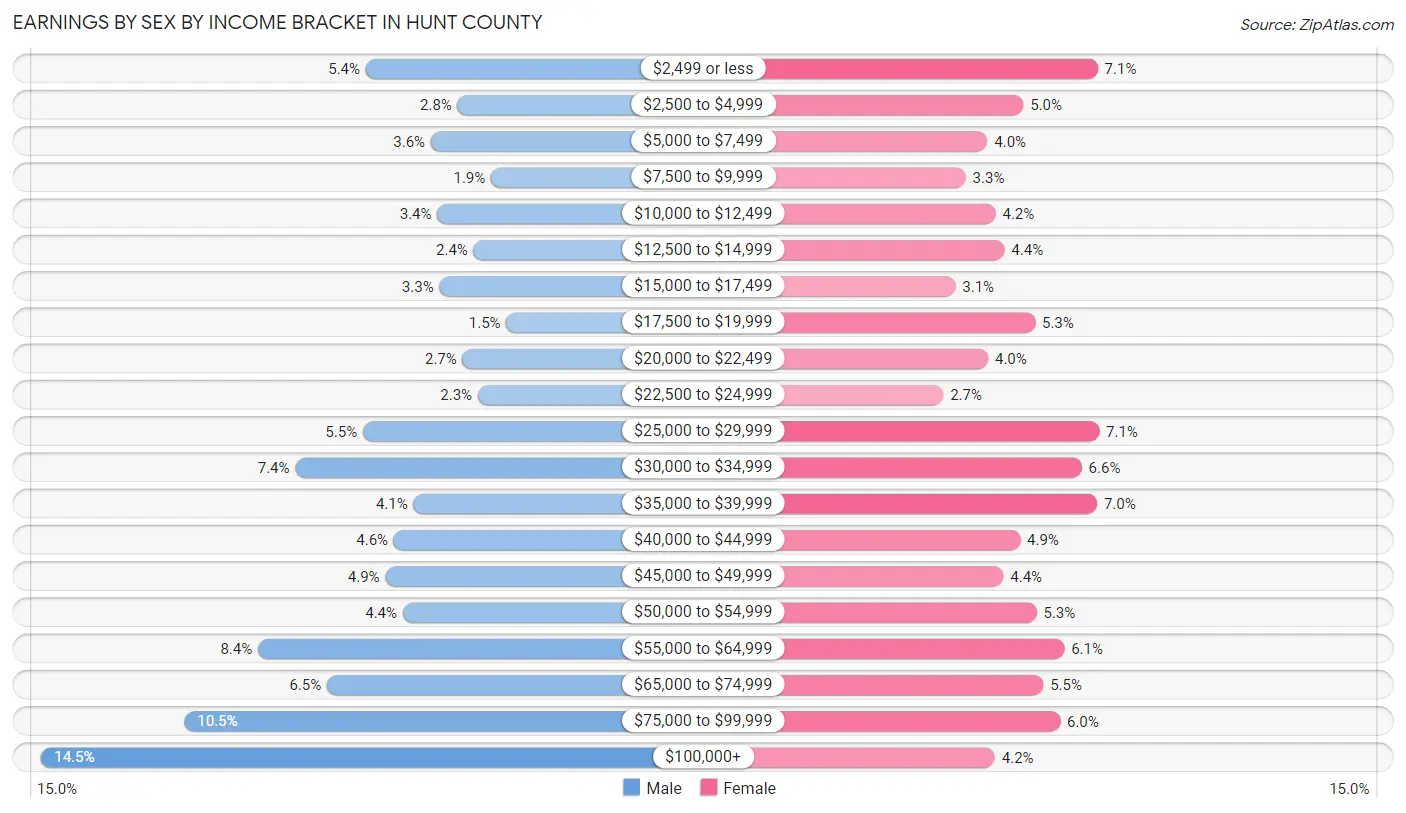
Earnings by Sex by Income Bracket in Hunt County
The most common earnings brackets in Hunt County are $100,000+ for men (4,090 | 14.5%) and $25,000 to $29,999 for women (1,673 | 7.1%).
| Income | Male | Female |
| $2,499 or less | 1,523 (5.4%) | 1,663 (7.0%) |
| $2,500 to $4,999 | 796 (2.8%) | 1,170 (5.0%) |
| $5,000 to $7,499 | 1,009 (3.6%) | 932 (4.0%) |
| $7,500 to $9,999 | 531 (1.9%) | 788 (3.3%) |
| $10,000 to $12,499 | 957 (3.4%) | 986 (4.2%) |
| $12,500 to $14,999 | 669 (2.4%) | 1,046 (4.4%) |
| $15,000 to $17,499 | 940 (3.3%) | 721 (3.0%) |
| $17,500 to $19,999 | 410 (1.5%) | 1,248 (5.3%) |
| $20,000 to $22,499 | 758 (2.7%) | 936 (4.0%) |
| $22,500 to $24,999 | 637 (2.3%) | 639 (2.7%) |
| $25,000 to $29,999 | 1,545 (5.5%) | 1,673 (7.1%) |
| $30,000 to $34,999 | 2,080 (7.4%) | 1,558 (6.6%) |
| $35,000 to $39,999 | 1,146 (4.1%) | 1,658 (7.0%) |
| $40,000 to $44,999 | 1,300 (4.6%) | 1,150 (4.9%) |
| $45,000 to $49,999 | 1,369 (4.9%) | 1,038 (4.4%) |
| $50,000 to $54,999 | 1,230 (4.4%) | 1,257 (5.3%) |
| $55,000 to $64,999 | 2,375 (8.4%) | 1,442 (6.1%) |
| $65,000 to $74,999 | 1,829 (6.5%) | 1,302 (5.5%) |
| $75,000 to $99,999 | 2,959 (10.5%) | 1,413 (6.0%) |
| $100,000+ | 4,090 (14.5%) | 981 (4.2%) |
| Total | 28,153 (100.0%) | 23,601 (100.0%) |
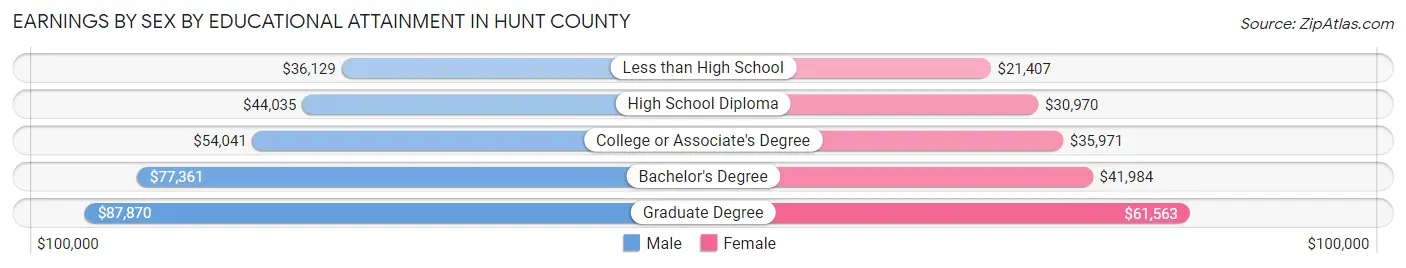
Earnings by Sex by Educational Attainment in Hunt County
Average earnings in Hunt County are $50,557 for men and $35,785 for women, a difference of 29.2%. Men with an educational attainment of graduate degree enjoy the highest average annual earnings of $87,870, while those with less than high school education earn the least with $36,129. Women with an educational attainment of graduate degree earn the most with the average annual earnings of $61,563, while those with less than high school education have the smallest earnings of $21,407.
| Educational Attainment | Male Income | Female Income |
| Less than High School | $36,129 | $21,407 |
| High School Diploma | $44,035 | $30,970 |
| College or Associate's Degree | $54,041 | $35,971 |
| Bachelor's Degree | $77,361 | $41,984 |
| Graduate Degree | $87,870 | $61,563 |
| Total | $50,557 | $35,785 |
Family Income in Hunt County
Family Income Brackets in Hunt County
According to the Hunt County family income data, there are 5,144 families falling into the $100,000 to $149,999 income range, which is the most common income bracket and makes up 19.8% of all families. Conversely, the $10,000 to $14,999 income bracket is the least frequent group with only 468 families (1.8%) belonging to this category.
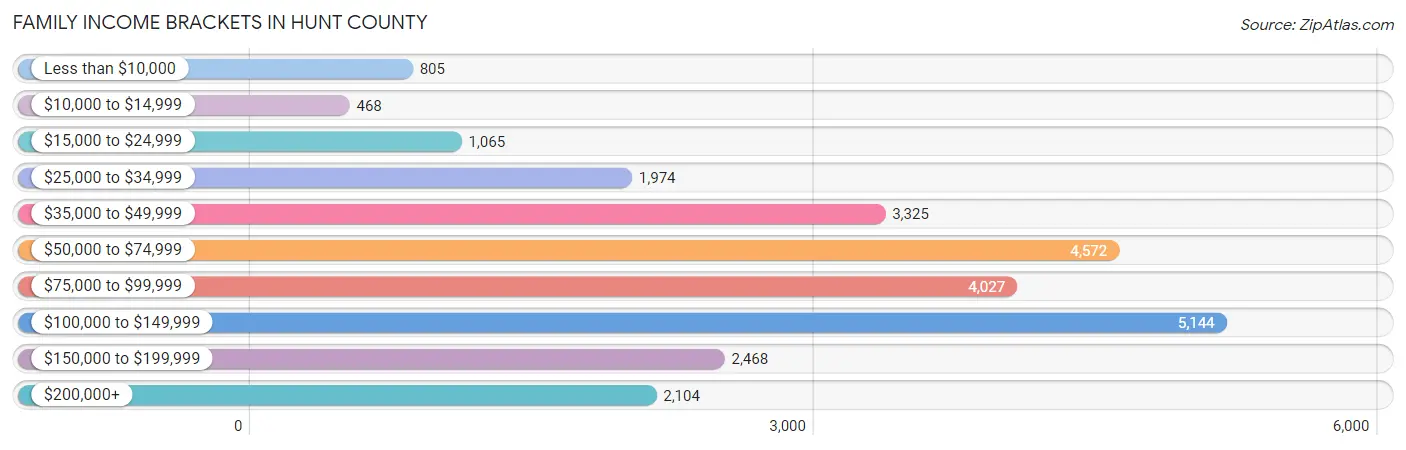
| Income Bracket | # Families | % Families |
| Less than $10,000 | 805 | 3.1% |
| $10,000 to $14,999 | 468 | 1.8% |
| $15,000 to $24,999 | 1,065 | 4.1% |
| $25,000 to $34,999 | 1,974 | 7.6% |
| $35,000 to $49,999 | 3,325 | 12.8% |
| $50,000 to $74,999 | 4,572 | 17.6% |
| $75,000 to $99,999 | 4,027 | 15.5% |
| $100,000 to $149,999 | 5,144 | 19.8% |
| $150,000 to $199,999 | 2,468 | 9.5% |
| $200,000+ | 2,104 | 8.1% |
Family Income by Famaliy Size in Hunt County
7+ person families (400 | 1.5%) account for the highest median family income in Hunt County with $99,450 per family, while 2-person families (11,957 | 46.0%) have the highest median income of $32,802 per family member.
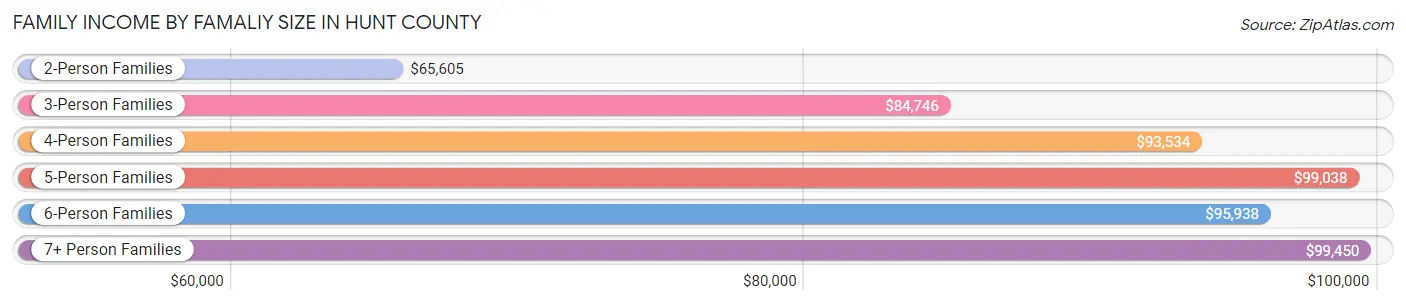
| Income Bracket | # Families | Median Income |
| 2-Person Families | 11,957 (46.0%) | $65,605 |
| 3-Person Families | 5,734 (22.1%) | $84,746 |
| 4-Person Families | 4,137 (15.9%) | $93,534 |
| 5-Person Families | 2,881 (11.1%) | $99,038 |
| 6-Person Families | 870 (3.4%) | $95,938 |
| 7+ Person Families | 400 (1.5%) | $99,450 |
| Total | 25,979 (100.0%) | $79,132 |
Family Income by Number of Earners in Hunt County
The median family income in Hunt County is $79,132, with families comprising 3+ earners (3,404) having the highest median family income of $137,207, while families with no earners (3,507) have the lowest median family income of $42,286, accounting for 13.1% and 13.5% of families, respectively.
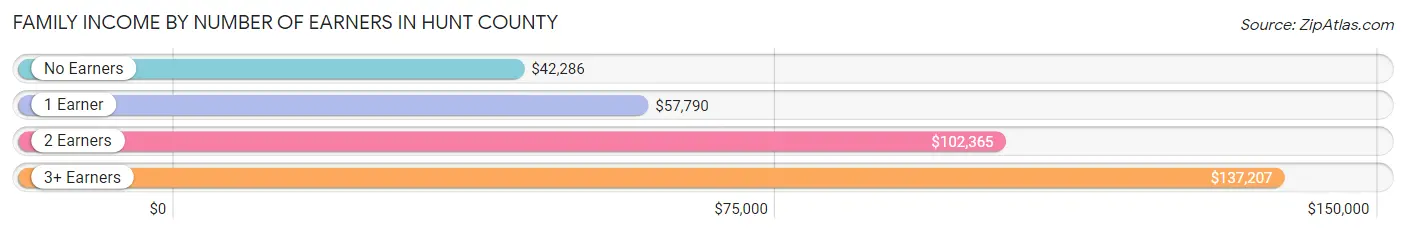
| Number of Earners | # Families | Median Income |
| No Earners | 3,507 (13.5%) | $42,286 |
| 1 Earner | 8,964 (34.5%) | $57,790 |
| 2 Earners | 10,104 (38.9%) | $102,365 |
| 3+ Earners | 3,404 (13.1%) | $137,207 |
| Total | 25,979 (100.0%) | $79,132 |
Household Income in Hunt County
Household Income Brackets in Hunt County
With 6,069 households falling in the category, the $50,000 to $74,999 income range is the most frequent in Hunt County, accounting for 16.6% of all households. In contrast, only 1,097 households (3.0%) fall into the $10,000 to $14,999 income bracket, making it the least populous group.
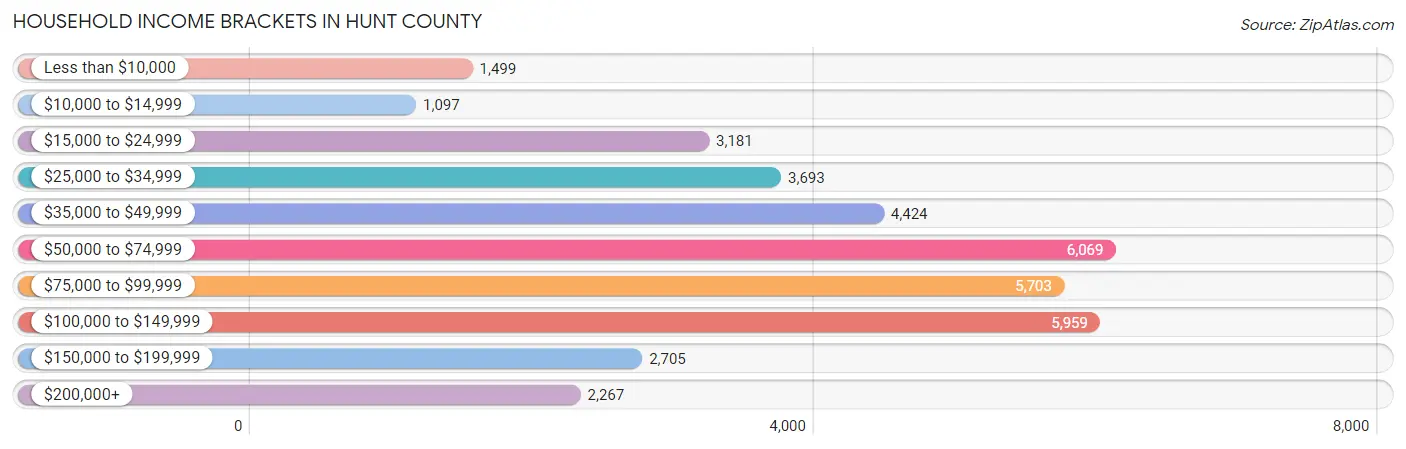
| Income Bracket | # Households | % Households |
| Less than $10,000 | 1,499 | 4.1% |
| $10,000 to $14,999 | 1,097 | 3.0% |
| $15,000 to $24,999 | 3,181 | 8.7% |
| $25,000 to $34,999 | 3,693 | 10.1% |
| $35,000 to $49,999 | 4,424 | 12.1% |
| $50,000 to $74,999 | 6,069 | 16.6% |
| $75,000 to $99,999 | 5,703 | 15.6% |
| $100,000 to $149,999 | 5,959 | 16.3% |
| $150,000 to $199,999 | 2,705 | 7.4% |
| $200,000+ | 2,267 | 6.2% |
Household Income by Householder Age in Hunt County
The median household income in Hunt County is $66,885, with the highest median household income of $86,205 found in the 45 to 64 years age bracket for the primary householder. A total of 13,408 households (36.7%) fall into this category. Meanwhile, the 15 to 24 years age bracket for the primary householder has the lowest median household income of $40,058, with 1,870 households (5.1%) in this group.
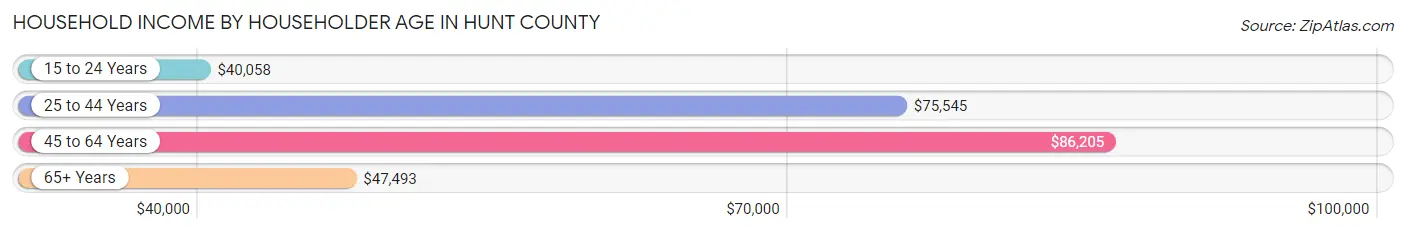
| Income Bracket | # Households | Median Income |
| 15 to 24 Years | 1,870 (5.1%) | $40,058 |
| 25 to 44 Years | 11,326 (31.0%) | $75,545 |
| 45 to 64 Years | 13,408 (36.7%) | $86,205 |
| 65+ Years | 9,956 (27.2%) | $47,493 |
| Total | 36,560 (100.0%) | $66,885 |
Poverty in Hunt County
Income Below Poverty by Sex and Age in Hunt County
With 11.0% poverty level for males and 13.4% for females among the residents of Hunt County, 5 year old males and 5 year old females are the most vulnerable to poverty, with 203 males (28.6%) and 231 females (29.8%) in their respective age groups living below the poverty level.
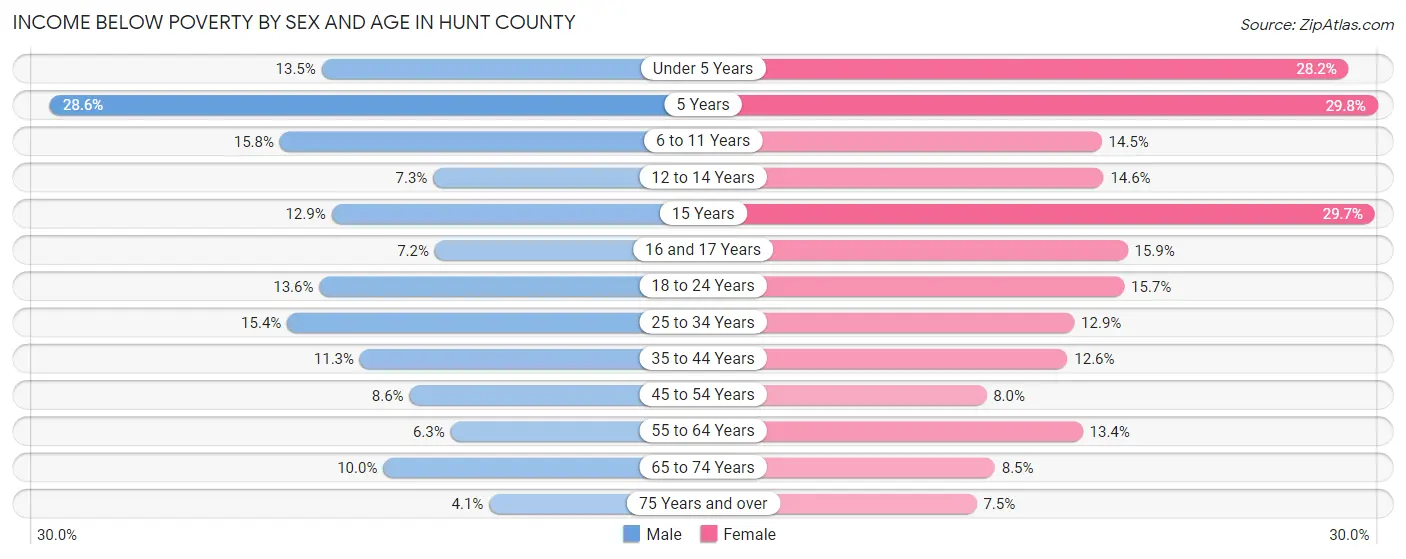
| Age Bracket | Male | Female |
| Under 5 Years | 415 (13.5%) | 900 (28.2%) |
| 5 Years | 203 (28.6%) | 231 (29.8%) |
| 6 to 11 Years | 659 (15.8%) | 524 (14.5%) |
| 12 to 14 Years | 146 (7.2%) | 334 (14.6%) |
| 15 Years | 102 (12.9%) | 179 (29.7%) |
| 16 and 17 Years | 95 (7.2%) | 211 (15.9%) |
| 18 to 24 Years | 604 (13.6%) | 634 (15.7%) |
| 25 to 34 Years | 984 (15.4%) | 853 (12.9%) |
| 35 to 44 Years | 663 (11.3%) | 741 (12.6%) |
| 45 to 54 Years | 535 (8.6%) | 516 (8.0%) |
| 55 to 64 Years | 410 (6.3%) | 894 (13.4%) |
| 65 to 74 Years | 450 (10.0%) | 426 (8.5%) |
| 75 Years and over | 114 (4.1%) | 259 (7.5%) |
| Total | 5,380 (11.0%) | 6,702 (13.4%) |
Income Above Poverty by Sex and Age in Hunt County
According to the poverty statistics in Hunt County, males aged 75 years and over and females aged 75 years and over are the age groups that are most secure financially, with 95.9% of males and 92.5% of females in these age groups living above the poverty line.
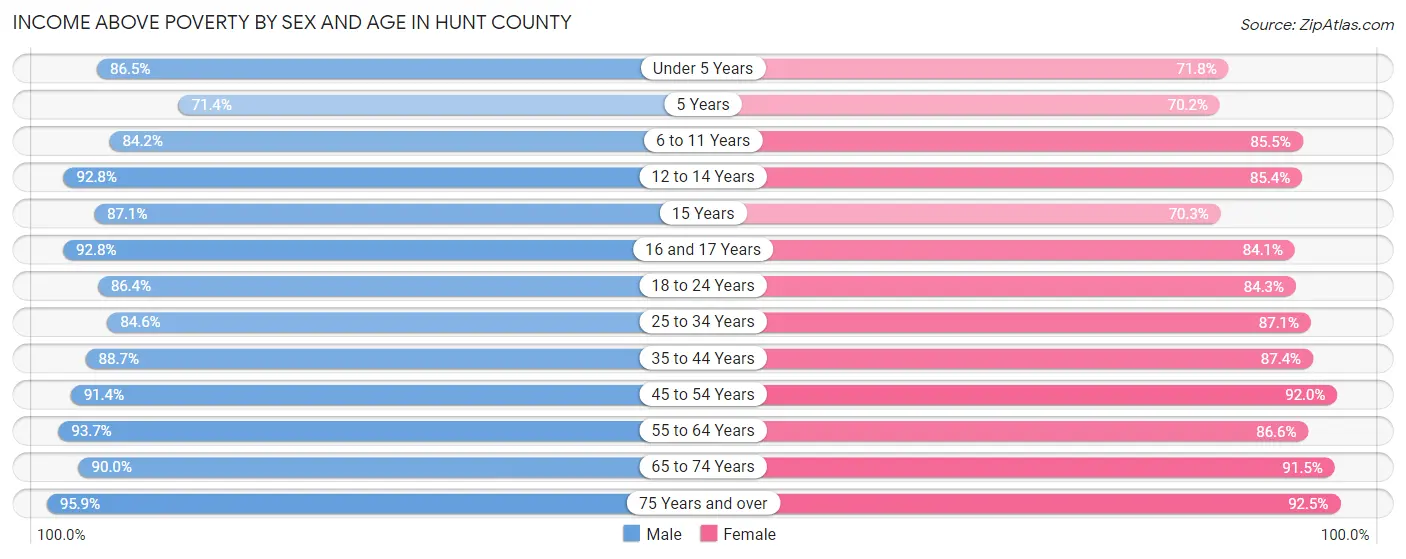
| Age Bracket | Male | Female |
| Under 5 Years | 2,669 (86.5%) | 2,289 (71.8%) |
| 5 Years | 507 (71.4%) | 543 (70.2%) |
| 6 to 11 Years | 3,515 (84.2%) | 3,098 (85.5%) |
| 12 to 14 Years | 1,869 (92.7%) | 1,959 (85.4%) |
| 15 Years | 688 (87.1%) | 424 (70.3%) |
| 16 and 17 Years | 1,232 (92.8%) | 1,115 (84.1%) |
| 18 to 24 Years | 3,842 (86.4%) | 3,399 (84.3%) |
| 25 to 34 Years | 5,414 (84.6%) | 5,737 (87.1%) |
| 35 to 44 Years | 5,190 (88.7%) | 5,159 (87.4%) |
| 45 to 54 Years | 5,711 (91.4%) | 5,902 (92.0%) |
| 55 to 64 Years | 6,116 (93.7%) | 5,775 (86.6%) |
| 65 to 74 Years | 4,038 (90.0%) | 4,575 (91.5%) |
| 75 Years and over | 2,646 (95.9%) | 3,194 (92.5%) |
| Total | 43,437 (89.0%) | 43,169 (86.6%) |
Income Below Poverty Among Married-Couple Families in Hunt County
The poverty statistics for married-couple families in Hunt County show that 5.9% or 1,126 of the total 19,207 families live below the poverty line. Families with 5 or more children have the highest poverty rate of 25.9%, comprising of 66 families. On the other hand, families with no children have the lowest poverty rate of 5.1%, which includes 570 families.
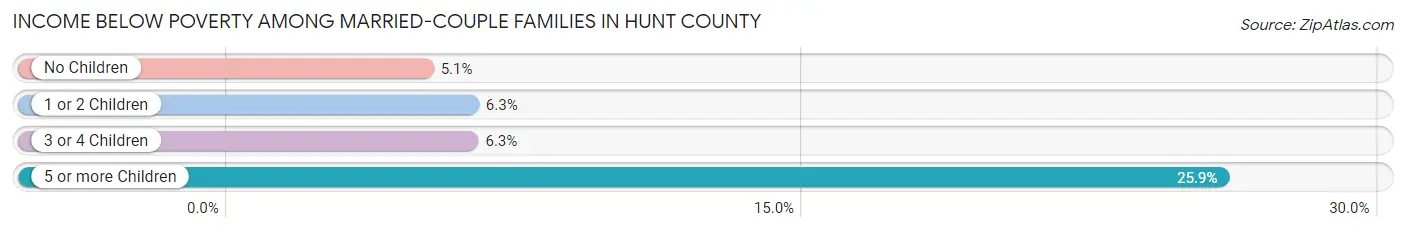
| Children | Above Poverty | Below Poverty |
| No Children | 10,588 (94.9%) | 570 (5.1%) |
| 1 or 2 Children | 5,542 (93.7%) | 372 (6.3%) |
| 3 or 4 Children | 1,762 (93.7%) | 118 (6.3%) |
| 5 or more Children | 189 (74.1%) | 66 (25.9%) |
| Total | 18,081 (94.1%) | 1,126 (5.9%) |
Income Below Poverty Among Single-Parent Households in Hunt County
According to the poverty data in Hunt County, 9.0% or 184 single-father households and 21.7% or 1,026 single-mother households are living below the poverty line. Among single-father households, those with 3 or 4 children have the highest poverty rate, with 5 households (29.4%) experiencing poverty. Likewise, among single-mother households, those with 5 or more children have the highest poverty rate, with 13 households (86.7%) falling below the poverty line.
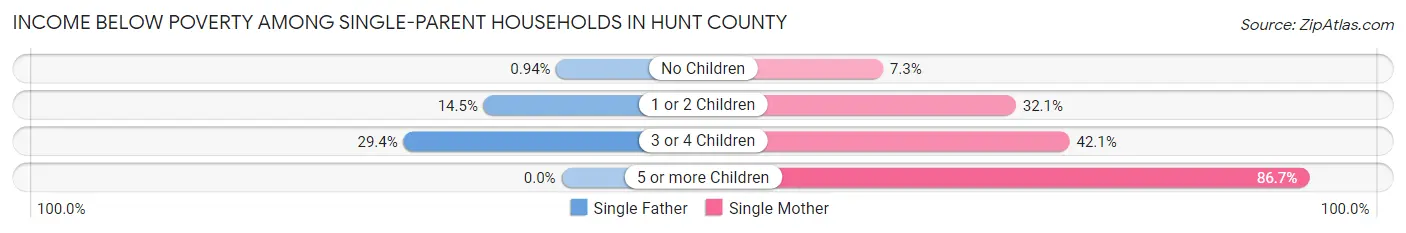
| Children | Single Father | Single Mother |
| No Children | 8 (0.9%) | 159 (7.3%) |
| 1 or 2 Children | 171 (14.5%) | 671 (32.1%) |
| 3 or 4 Children | 5 (29.4%) | 183 (42.1%) |
| 5 or more Children | 0 (0.0%) | 13 (86.7%) |
| Total | 184 (9.0%) | 1,026 (21.7%) |
Income Below Poverty Among Married-Couple vs Single-Parent Households in Hunt County
The poverty data for Hunt County shows that 1,126 of the married-couple family households (5.9%) and 1,210 of the single-parent households (17.9%) are living below the poverty level. Within the married-couple family households, those with 5 or more children have the highest poverty rate, with 66 households (25.9%) falling below the poverty line. Among the single-parent households, those with 5 or more children have the highest poverty rate, with 13 household (61.9%) living below poverty.
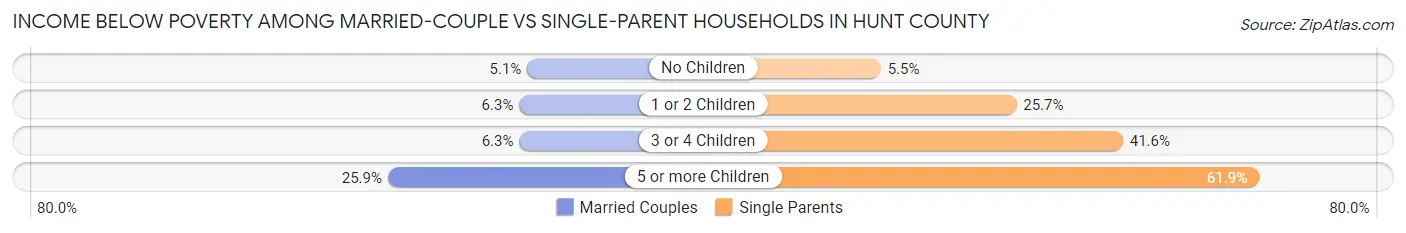
| Children | Married-Couple Families | Single-Parent Households |
| No Children | 570 (5.1%) | 167 (5.5%) |
| 1 or 2 Children | 372 (6.3%) | 842 (25.7%) |
| 3 or 4 Children | 118 (6.3%) | 188 (41.6%) |
| 5 or more Children | 66 (25.9%) | 13 (61.9%) |
| Total | 1,126 (5.9%) | 1,210 (17.9%) |
Race in Hunt County
The most populous races in Hunt County are White / Caucasian (77,750 | 76.5%), Hispanic or Latino (18,869 | 18.6%), and Black / African American (7,953 | 7.8%).
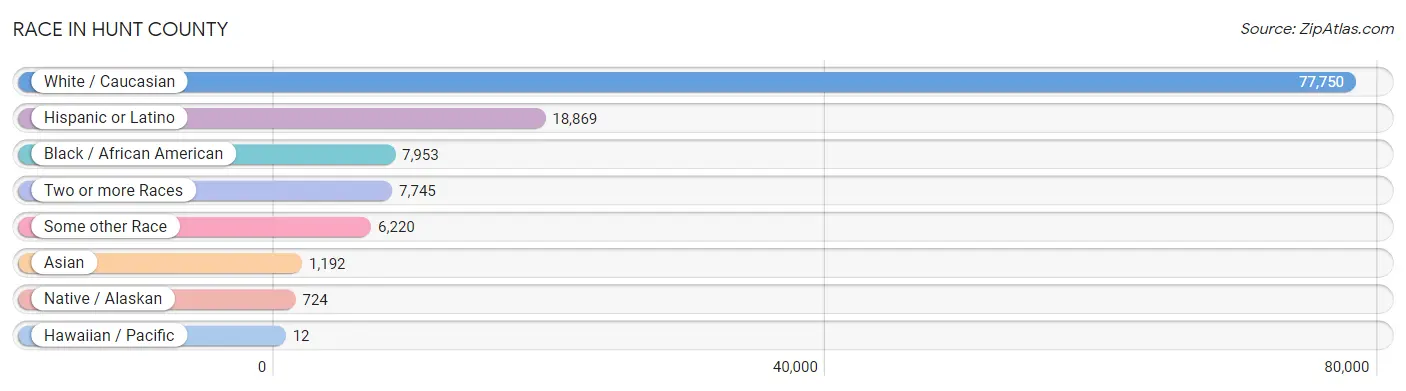
| Race | # Population | % Population |
| Asian | 1,192 | 1.2% |
| Black / African American | 7,953 | 7.8% |
| Hawaiian / Pacific | 12 | 0.0% |
| Hispanic or Latino | 18,869 | 18.6% |
| Native / Alaskan | 724 | 0.7% |
| White / Caucasian | 77,750 | 76.5% |
| Two or more Races | 7,745 | 7.6% |
| Some other Race | 6,220 | 6.1% |
| Total | 101,596 | 100.0% |
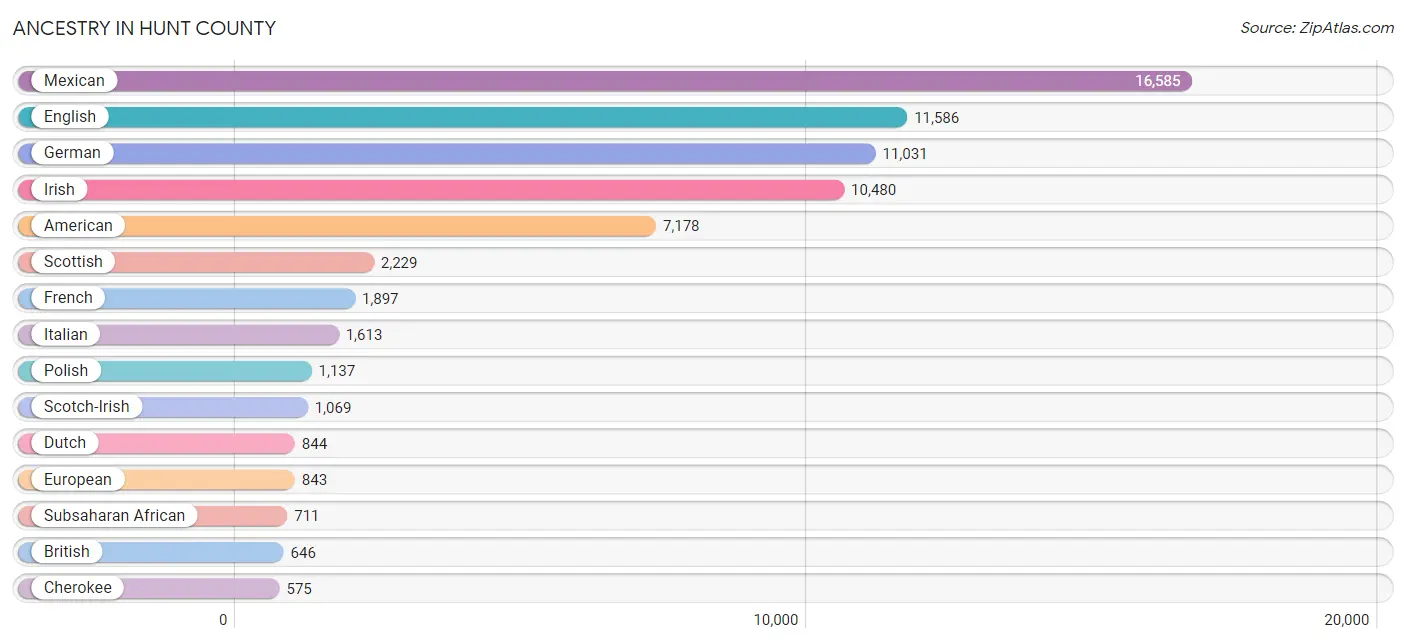
Ancestry in Hunt County
The most populous ancestries reported in Hunt County are Mexican (16,585 | 16.3%), English (11,586 | 11.4%), German (11,031 | 10.9%), Irish (10,480 | 10.3%), and American (7,178 | 7.1%), together accounting for 56.0% of all Hunt County residents.
| Ancestry | # Population | % Population |
| African | 392 | 0.4% |
| American | 7,178 | 7.1% |
| Apache | 34 | 0.0% |
| Arab | 216 | 0.2% |
| Argentinean | 23 | 0.0% |
| Armenian | 7 | 0.0% |
| Australian | 6 | 0.0% |
| Austrian | 104 | 0.1% |
| Bahamian | 3 | 0.0% |
| Bangladeshi | 46 | 0.1% |
| Basque | 23 | 0.0% |
| Belgian | 133 | 0.1% |
| Belizean | 5 | 0.0% |
| Bhutanese | 150 | 0.2% |
| Blackfeet | 31 | 0.0% |
| British | 646 | 0.6% |
| Bulgarian | 46 | 0.1% |
| Burmese | 228 | 0.2% |
| Cajun | 21 | 0.0% |
| Canadian | 58 | 0.1% |
| Central American | 445 | 0.4% |
| Central American Indian | 47 | 0.1% |
| Cherokee | 575 | 0.6% |
| Cheyenne | 2 | 0.0% |
| Chickasaw | 18 | 0.0% |
| Chippewa | 15 | 0.0% |
| Choctaw | 378 | 0.4% |
| Colombian | 51 | 0.1% |
| Costa Rican | 40 | 0.0% |
| Creek | 26 | 0.0% |
| Croatian | 24 | 0.0% |
| Cuban | 181 | 0.2% |
| Czech | 377 | 0.4% |
| Czechoslovakian | 17 | 0.0% |
| Danish | 18 | 0.0% |
| Dutch | 844 | 0.8% |
| Dutch West Indian | 72 | 0.1% |
| Eastern European | 112 | 0.1% |
| Ecuadorian | 18 | 0.0% |
| Egyptian | 65 | 0.1% |
| English | 11,586 | 11.4% |
| Estonian | 4 | 0.0% |
| Ethiopian | 113 | 0.1% |
| European | 843 | 0.8% |
| Filipino | 80 | 0.1% |
| French | 1,897 | 1.9% |
| French Canadian | 222 | 0.2% |
| German | 11,031 | 10.9% |
| Greek | 242 | 0.2% |
| Guamanian / Chamorro | 13 | 0.0% |
| Guatemalan | 22 | 0.0% |
| Honduran | 57 | 0.1% |
| Hungarian | 8 | 0.0% |
| Indian (Asian) | 294 | 0.3% |
| Iranian | 10 | 0.0% |
| Iraqi | 9 | 0.0% |
| Irish | 10,480 | 10.3% |
| Iroquois | 12 | 0.0% |
| Italian | 1,613 | 1.6% |
| Japanese | 78 | 0.1% |
| Kiowa | 28 | 0.0% |
| Korean | 322 | 0.3% |
| Laotian | 9 | 0.0% |
| Lebanese | 12 | 0.0% |
| Lithuanian | 22 | 0.0% |
| Luxembourger | 44 | 0.0% |
| Mexican | 16,585 | 16.3% |
| Mexican American Indian | 32 | 0.0% |
| Moroccan | 31 | 0.0% |
| Native Hawaiian | 34 | 0.0% |
| Navajo | 38 | 0.0% |
| Nicaraguan | 52 | 0.1% |
| Nigerian | 98 | 0.1% |
| Northern European | 128 | 0.1% |
| Norwegian | 518 | 0.5% |
| Osage | 4 | 0.0% |
| Pakistani | 180 | 0.2% |
| Palestinian | 62 | 0.1% |
| Panamanian | 15 | 0.0% |
| Paraguayan | 6 | 0.0% |
| Pennsylvania German | 14 | 0.0% |
| Peruvian | 19 | 0.0% |
| Polish | 1,137 | 1.1% |
| Portuguese | 285 | 0.3% |
| Potawatomi | 2 | 0.0% |
| Puerto Rican | 479 | 0.5% |
| Romanian | 6 | 0.0% |
| Russian | 193 | 0.2% |
| Salvadoran | 224 | 0.2% |
| Samoan | 19 | 0.0% |
| Scandinavian | 359 | 0.4% |
| Scotch-Irish | 1,069 | 1.1% |
| Scottish | 2,229 | 2.2% |
| Seminole | 97 | 0.1% |
| Sioux | 22 | 0.0% |
| Slavic | 17 | 0.0% |
| Slovak | 12 | 0.0% |
| South African | 64 | 0.1% |
| South American | 284 | 0.3% |
| Spaniard | 313 | 0.3% |
| Spanish | 70 | 0.1% |
| Sri Lankan | 313 | 0.3% |
| Subsaharan African | 711 | 0.7% |
| Swedish | 442 | 0.4% |
| Swiss | 54 | 0.1% |
| Thai | 233 | 0.2% |
| Tongan | 8 | 0.0% |
| Ukrainian | 23 | 0.0% |
| Uruguayan | 15 | 0.0% |
| Venezuelan | 122 | 0.1% |
| Welsh | 457 | 0.4% |
| West Indian | 5 | 0.0% |
| Yugoslavian | 12 | 0.0% |
| Yuman | 21 | 0.0% |
| Zimbabwean | 5 | 0.0% | View All 115 Rows |
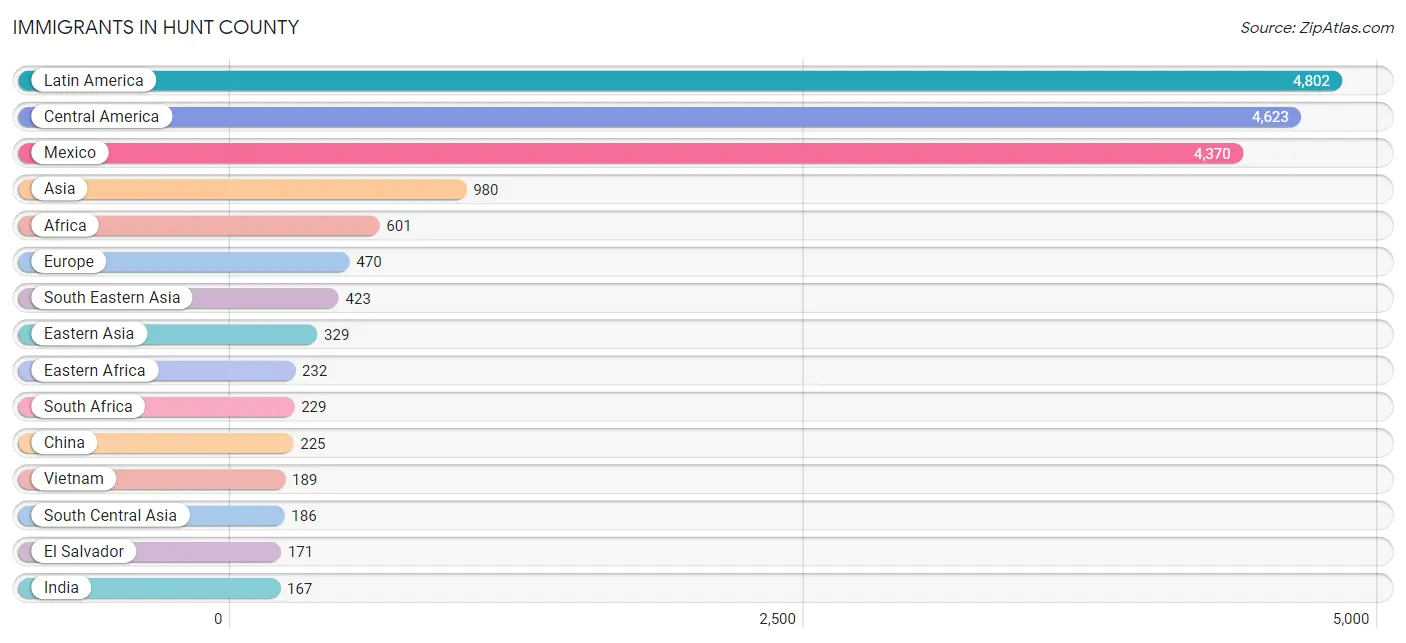
Immigrants in Hunt County
The most numerous immigrant groups reported in Hunt County came from Latin America (4,802 | 4.7%), Central America (4,623 | 4.5%), Mexico (4,370 | 4.3%), Asia (980 | 1.0%), and Africa (601 | 0.6%), together accounting for 15.1% of all Hunt County residents.
| Immigration Origin | # Population | % Population |
| Africa | 601 | 0.6% |
| Argentina | 23 | 0.0% |
| Asia | 980 | 1.0% |
| Australia | 6 | 0.0% |
| Bahamas | 3 | 0.0% |
| Bangladesh | 6 | 0.0% |
| Cambodia | 16 | 0.0% |
| Canada | 78 | 0.1% |
| Caribbean | 22 | 0.0% |
| Central America | 4,623 | 4.5% |
| China | 225 | 0.2% |
| Colombia | 34 | 0.0% |
| Cuba | 19 | 0.0% |
| Czechoslovakia | 19 | 0.0% |
| Eastern Africa | 232 | 0.2% |
| Eastern Asia | 329 | 0.3% |
| Eastern Europe | 150 | 0.2% |
| Ecuador | 4 | 0.0% |
| El Salvador | 171 | 0.2% |
| England | 43 | 0.0% |
| Ethiopia | 113 | 0.1% |
| Europe | 470 | 0.5% |
| France | 9 | 0.0% |
| Germany | 125 | 0.1% |
| Guatemala | 56 | 0.1% |
| Guyana | 6 | 0.0% |
| Honduras | 18 | 0.0% |
| Hong Kong | 5 | 0.0% |
| India | 167 | 0.2% |
| Iran | 10 | 0.0% |
| Iraq | 9 | 0.0% |
| Ireland | 2 | 0.0% |
| Israel | 31 | 0.0% |
| Italy | 17 | 0.0% |
| Japan | 14 | 0.0% |
| Jordan | 2 | 0.0% |
| Kazakhstan | 3 | 0.0% |
| Korea | 90 | 0.1% |
| Latin America | 4,802 | 4.7% |
| Mexico | 4,370 | 4.3% |
| Nigeria | 109 | 0.1% |
| Northern Africa | 31 | 0.0% |
| Northern Europe | 119 | 0.1% |
| Oceania | 6 | 0.0% |
| Panama | 8 | 0.0% |
| Philippines | 140 | 0.1% |
| Poland | 121 | 0.1% |
| Portugal | 30 | 0.0% |
| Romania | 6 | 0.0% |
| Russia | 4 | 0.0% |
| South Africa | 229 | 0.2% |
| South America | 157 | 0.2% |
| South Central Asia | 186 | 0.2% |
| South Eastern Asia | 423 | 0.4% |
| Southern Europe | 67 | 0.1% |
| Spain | 20 | 0.0% |
| Sudan | 31 | 0.0% |
| Taiwan | 13 | 0.0% |
| Thailand | 78 | 0.1% |
| Uganda | 1 | 0.0% |
| Uruguay | 42 | 0.0% |
| Venezuela | 32 | 0.0% |
| Vietnam | 189 | 0.2% |
| Western Africa | 109 | 0.1% |
| Western Asia | 42 | 0.0% |
| Western Europe | 134 | 0.1% |
| Zimbabwe | 8 | 0.0% | View All 67 Rows |
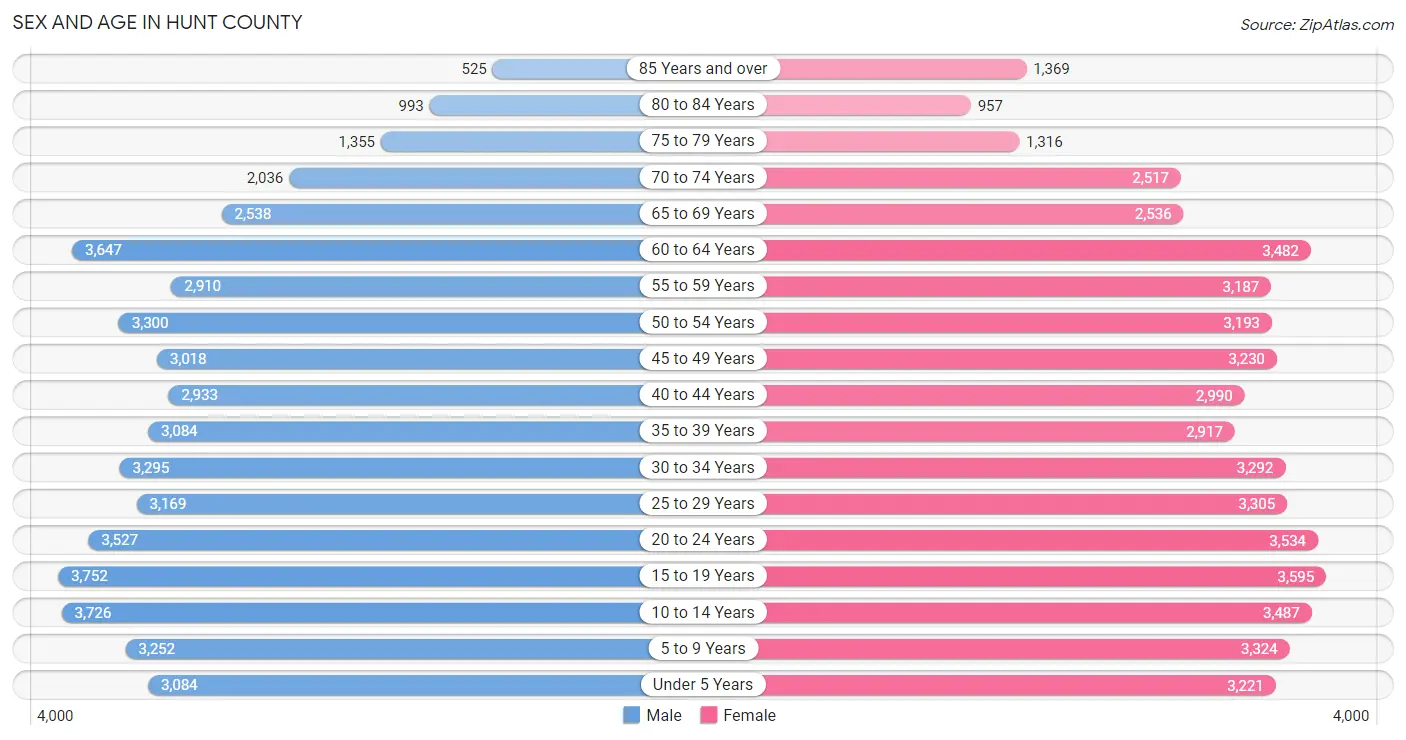
Sex and Age in Hunt County
Sex and Age in Hunt County
The most populous age groups in Hunt County are 15 to 19 Years (3,752 | 7.5%) for men and 15 to 19 Years (3,595 | 7.0%) for women.
| Age Bracket | Male | Female |
| Under 5 Years | 3,084 (6.1%) | 3,221 (6.3%) |
| 5 to 9 Years | 3,252 (6.5%) | 3,324 (6.5%) |
| 10 to 14 Years | 3,726 (7.4%) | 3,487 (6.8%) |
| 15 to 19 Years | 3,752 (7.5%) | 3,595 (7.0%) |
| 20 to 24 Years | 3,527 (7.0%) | 3,534 (6.9%) |
| 25 to 29 Years | 3,169 (6.3%) | 3,305 (6.4%) |
| 30 to 34 Years | 3,295 (6.6%) | 3,292 (6.4%) |
| 35 to 39 Years | 3,084 (6.1%) | 2,917 (5.7%) |
| 40 to 44 Years | 2,933 (5.9%) | 2,990 (5.8%) |
| 45 to 49 Years | 3,018 (6.0%) | 3,230 (6.3%) |
| 50 to 54 Years | 3,300 (6.6%) | 3,193 (6.2%) |
| 55 to 59 Years | 2,910 (5.8%) | 3,187 (6.2%) |
| 60 to 64 Years | 3,647 (7.3%) | 3,482 (6.8%) |
| 65 to 69 Years | 2,538 (5.1%) | 2,536 (4.9%) |
| 70 to 74 Years | 2,036 (4.1%) | 2,517 (4.9%) |
| 75 to 79 Years | 1,355 (2.7%) | 1,316 (2.6%) |
| 80 to 84 Years | 993 (2.0%) | 957 (1.9%) |
| 85 Years and over | 525 (1.1%) | 1,369 (2.7%) |
| Total | 50,144 (100.0%) | 51,452 (100.0%) |
Families and Households in Hunt County
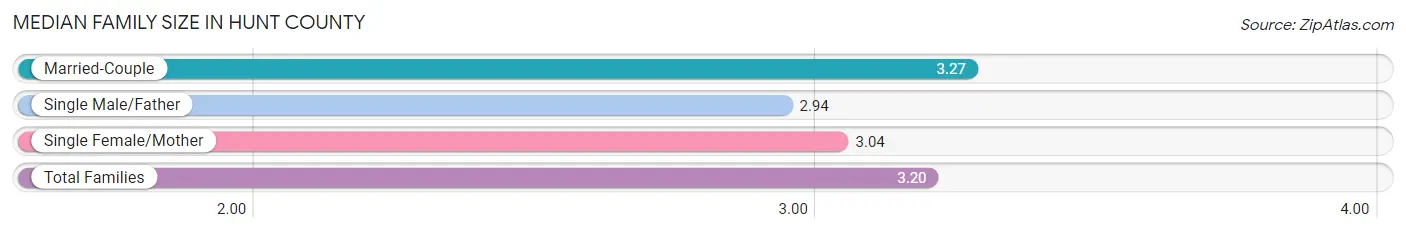
Median Family Size in Hunt County
The median family size in Hunt County is 3.20 persons per family, with married-couple families (19,207 | 73.9%) accounting for the largest median family size of 3.27 persons per family. On the other hand, single male/father families (2,054 | 7.9%) represent the smallest median family size with 2.94 persons per family.
| Family Type | # Families | Family Size |
| Married-Couple | 19,207 (73.9%) | 3.27 |
| Single Male/Father | 2,054 (7.9%) | 2.94 |
| Single Female/Mother | 4,718 (18.2%) | 3.04 |
| Total Families | 25,979 (100.0%) | 3.20 |
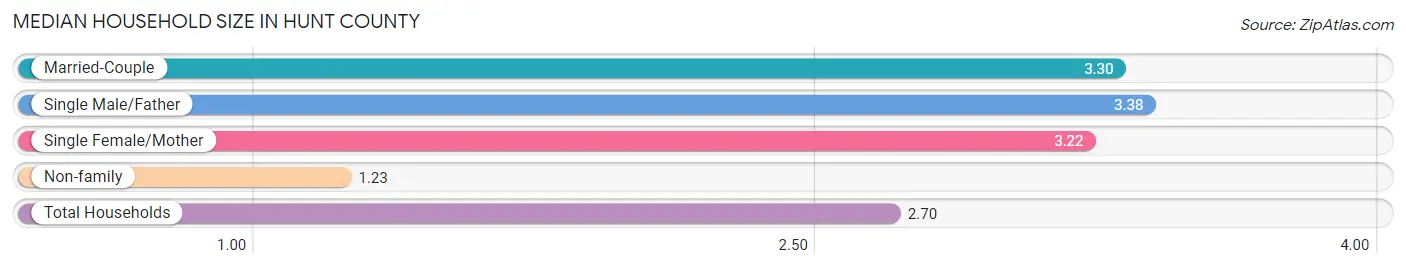
Median Household Size in Hunt County
The median household size in Hunt County is 2.70 persons per household, with single male/father households (2,054 | 5.6%) accounting for the largest median household size of 3.38 persons per household. non-family households (10,581 | 28.9%) represent the smallest median household size with 1.23 persons per household.
| Household Type | # Households | Household Size |
| Married-Couple | 19,207 (52.5%) | 3.30 |
| Single Male/Father | 2,054 (5.6%) | 3.38 |
| Single Female/Mother | 4,718 (12.9%) | 3.22 |
| Non-family | 10,581 (28.9%) | 1.23 |
| Total Households | 36,560 (100.0%) | 2.70 |
Household Size by Marriage Status in Hunt County
Out of a total of 36,560 households in Hunt County, 25,979 (71.1%) are family households, while 10,581 (28.9%) are nonfamily households. The most numerous type of family households are 2-person households, comprising 11,183, and the most common type of nonfamily households are 1-person households, comprising 8,646.
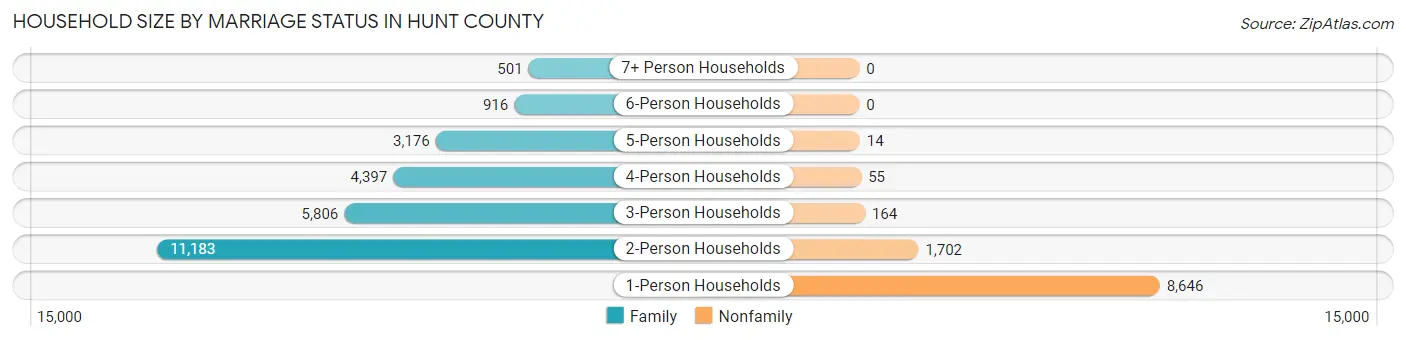
| Household Size | Family Households | Nonfamily Households |
| 1-Person Households | - | 8,646 (23.6%) |
| 2-Person Households | 11,183 (30.6%) | 1,702 (4.7%) |
| 3-Person Households | 5,806 (15.9%) | 164 (0.4%) |
| 4-Person Households | 4,397 (12.0%) | 55 (0.2%) |
| 5-Person Households | 3,176 (8.7%) | 14 (0.0%) |
| 6-Person Households | 916 (2.5%) | 0 (0.0%) |
| 7+ Person Households | 501 (1.4%) | 0 (0.0%) |
| Total | 25,979 (71.1%) | 10,581 (28.9%) |
Female Fertility in Hunt County
Fertility by Age in Hunt County
Average fertility rate in Hunt County is 67.0 births per 1,000 women. Women in the age bracket of 20 to 34 years have the highest fertility rate with 115.0 births per 1,000 women. Women in the age bracket of 20 to 34 years acount for 73.8% of all women with births.
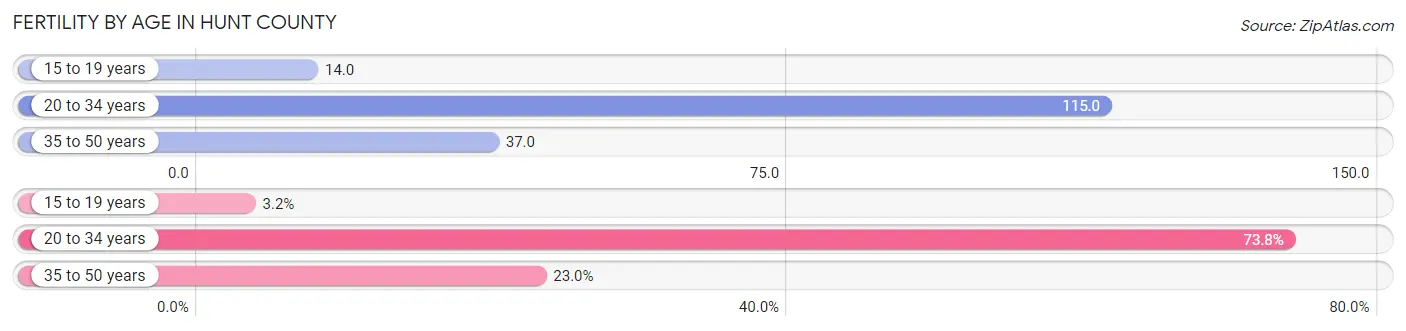
| Age Bracket | Women with Births | Births / 1,000 Women |
| 15 to 19 years | 51 (3.2%) | 14.0 |
| 20 to 34 years | 1,167 (73.8%) | 115.0 |
| 35 to 50 years | 363 (23.0%) | 37.0 |
| Total | 1,581 (100.0%) | 67.0 |
Fertility by Age by Marriage Status in Hunt County
73.7% of women with births (1,581) in Hunt County are married. The highest percentage of unmarried women with births falls into 15 to 19 years age bracket with 45.1% of them unmarried at the time of birth, while the lowest percentage of unmarried women with births belong to 35 to 50 years age bracket with 8.8% of them unmarried.
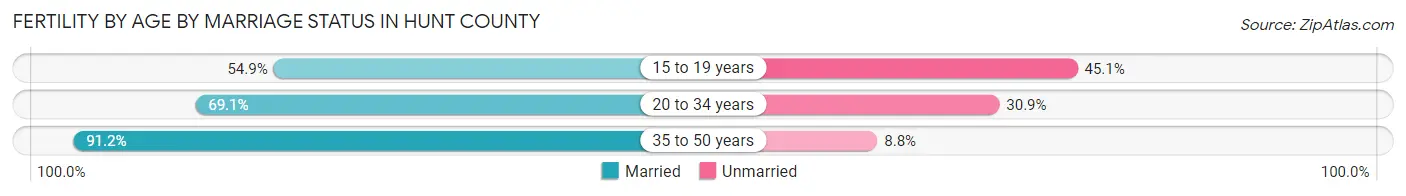
| Age Bracket | Married | Unmarried |
| 15 to 19 years | 28 (54.9%) | 23 (45.1%) |
| 20 to 34 years | 806 (69.1%) | 361 (30.9%) |
| 35 to 50 years | 331 (91.2%) | 32 (8.8%) |
| Total | 1,165 (73.7%) | 416 (26.3%) |
Fertility by Education in Hunt County
Average fertility rate in Hunt County is 67.0 births per 1,000 women. Women with the education attainment of less than high school have the highest fertility rate of 91.0 births per 1,000 women, while women with the education attainment of college or associate's degree have the lowest fertility at 56.0 births per 1,000 women. Women with the education attainment of college or associate's degree represent 29.7% of all women with births.
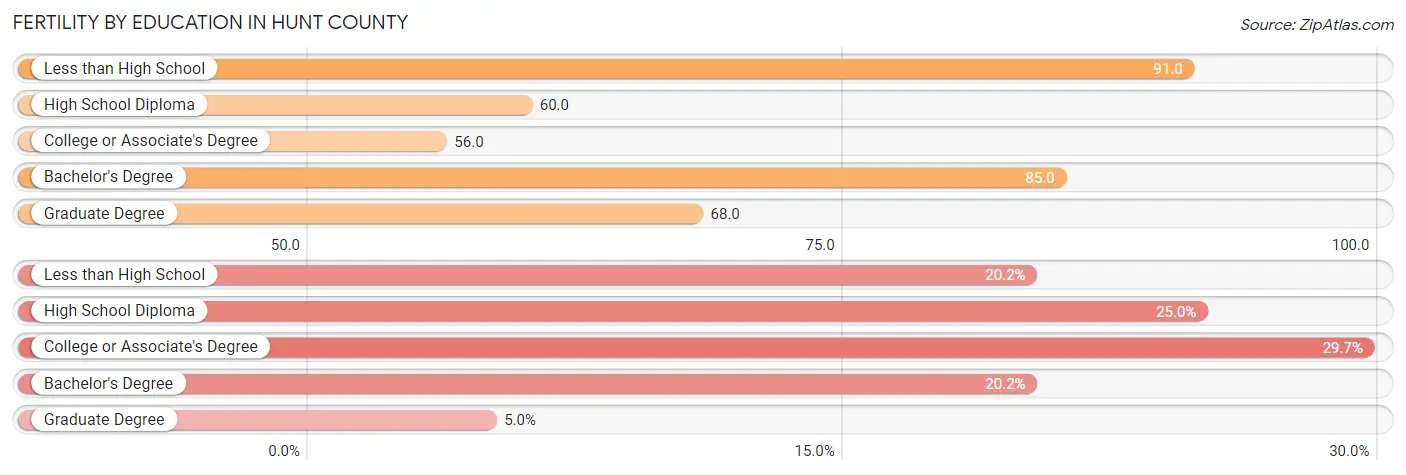
| Educational Attainment | Women with Births | Births / 1,000 Women |
| Less than High School | 319 (20.2%) | 91.0 |
| High School Diploma | 395 (25.0%) | 60.0 |
| College or Associate's Degree | 469 (29.7%) | 56.0 |
| Bachelor's Degree | 319 (20.2%) | 85.0 |
| Graduate Degree | 79 (5.0%) | 68.0 |
| Total | 1,581 (100.0%) | 67.0 |
Fertility by Education by Marriage Status in Hunt County
26.3% of women with births in Hunt County are unmarried. Women with the educational attainment of graduate degree are most likely to be married with 100.0% of them married at childbirth, while women with the educational attainment of less than high school are least likely to be married with 36.7% of them unmarried at childbirth.
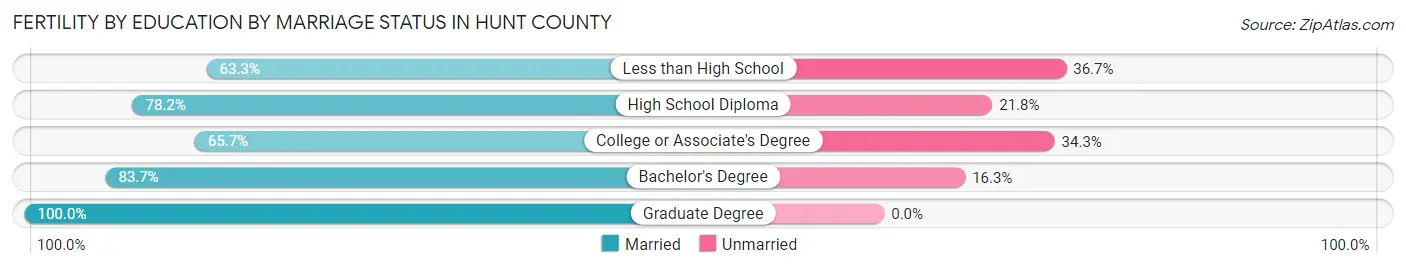
| Educational Attainment | Married | Unmarried |
| Less than High School | 202 (63.3%) | 117 (36.7%) |
| High School Diploma | 309 (78.2%) | 86 (21.8%) |
| College or Associate's Degree | 308 (65.7%) | 161 (34.3%) |
| Bachelor's Degree | 267 (83.7%) | 52 (16.3%) |
| Graduate Degree | 79 (100.0%) | 0 (0.0%) |
| Total | 1,165 (73.7%) | 416 (26.3%) |
Employment Characteristics in Hunt County
Employment by Class of Employer in Hunt County
Among the 44,966 employed individuals in Hunt County, private company employees (30,628 | 68.1%), local government employees (3,430 | 7.6%), and self-employed (not incorporated) (3,152 | 7.0%) make up the most common classes of employment.
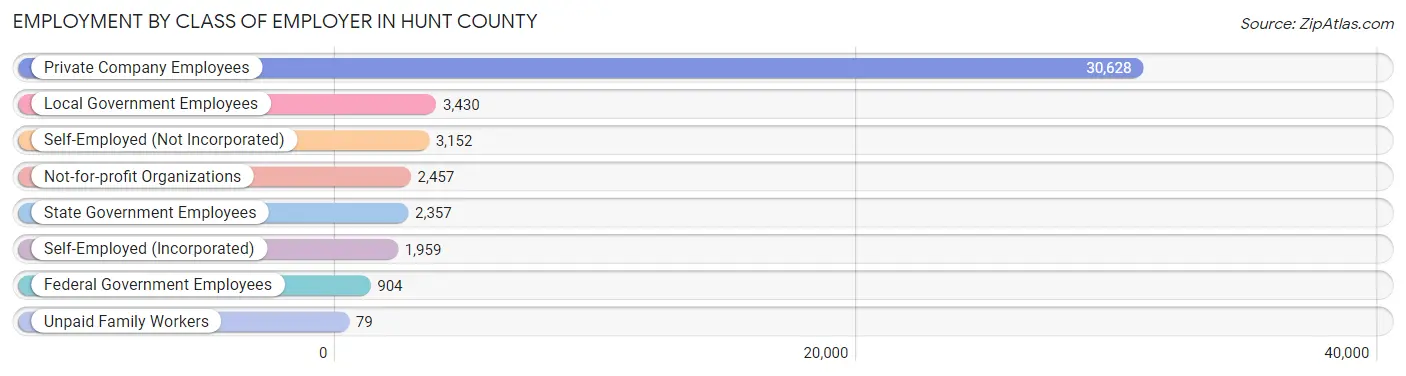
| Employer Class | # Employees | % Employees |
| Private Company Employees | 30,628 | 68.1% |
| Self-Employed (Incorporated) | 1,959 | 4.4% |
| Self-Employed (Not Incorporated) | 3,152 | 7.0% |
| Not-for-profit Organizations | 2,457 | 5.5% |
| Local Government Employees | 3,430 | 7.6% |
| State Government Employees | 2,357 | 5.2% |
| Federal Government Employees | 904 | 2.0% |
| Unpaid Family Workers | 79 | 0.2% |
| Total | 44,966 | 100.0% |
Employment Status by Age in Hunt County
According to the labor force statistics for Hunt County, out of the total population over 16 years of age (80,108), 61.1% or 48,946 individuals are in the labor force, with 5.8% or 2,839 of them unemployed. The age group with the highest labor force participation rate is 35 to 44 years, with 81.0% or 9,658 individuals in the labor force. Within the labor force, the 16 to 19 years age range has the highest percentage of unemployed individuals, with 15.2% or 329 of them being unemployed.
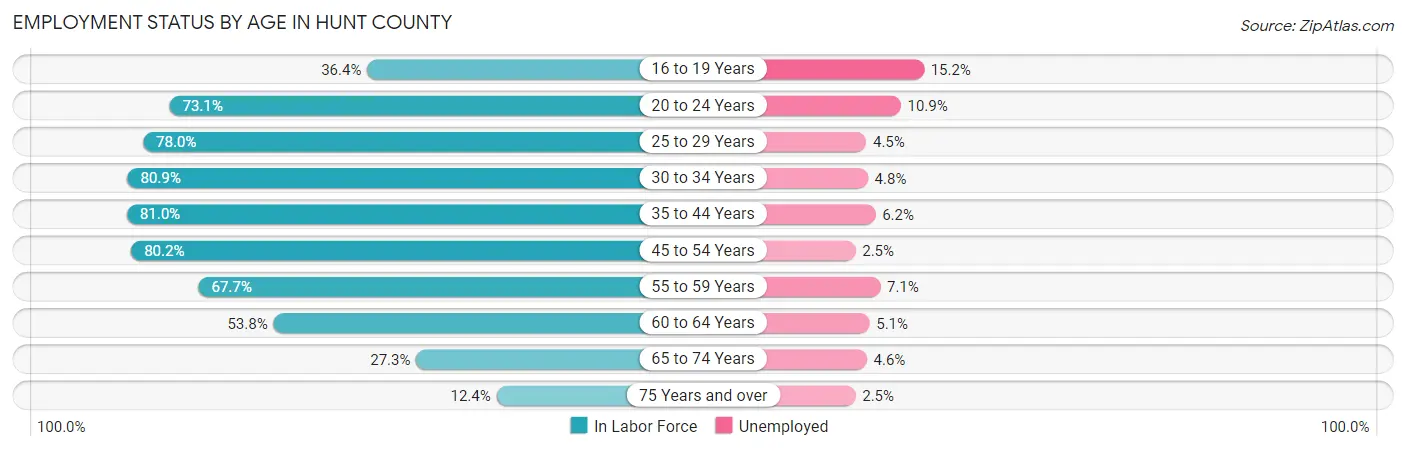
| Age Bracket | In Labor Force | Unemployed |
| 16 to 19 Years | 2,167 (36.4%) | 329 (15.2%) |
| 20 to 24 Years | 5,162 (73.1%) | 563 (10.9%) |
| 25 to 29 Years | 5,050 (78.0%) | 227 (4.5%) |
| 30 to 34 Years | 5,329 (80.9%) | 256 (4.8%) |
| 35 to 44 Years | 9,658 (81.0%) | 599 (6.2%) |
| 45 to 54 Years | 10,218 (80.2%) | 255 (2.5%) |
| 55 to 59 Years | 4,128 (67.7%) | 293 (7.1%) |
| 60 to 64 Years | 3,835 (53.8%) | 196 (5.1%) |
| 65 to 74 Years | 2,628 (27.3%) | 121 (4.6%) |
| 75 Years and over | 808 (12.4%) | 20 (2.5%) |
| Total | 48,946 (61.1%) | 2,839 (5.8%) |
Employment Status by Educational Attainment in Hunt County
According to labor force statistics for Hunt County, 75.0% of individuals (38,214) out of the total population between 25 and 64 years of age (50,952) are in the labor force, with 4.8% or 1,834 of them being unemployed. The group with the highest labor force participation rate are those with the educational attainment of bachelor's degree or higher, with 86.4% or 9,571 individuals in the labor force. Within the labor force, individuals with high school diploma education have the highest percentage of unemployment, with 6.3% or 788 of them being unemployed.
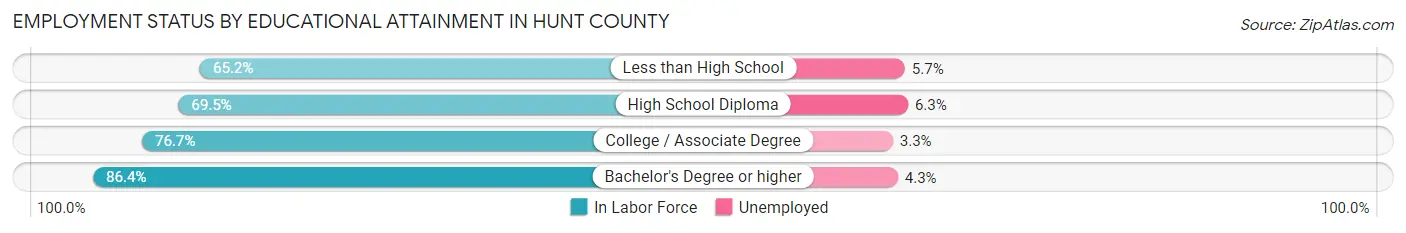
| Educational Attainment | In Labor Force | Unemployed |
| Less than High School | 3,688 (65.2%) | 322 (5.7%) |
| High School Diploma | 12,502 (69.5%) | 1,133 (6.3%) |
| College / Associate Degree | 12,448 (76.7%) | 536 (3.3%) |
| Bachelor's Degree or higher | 9,571 (86.4%) | 476 (4.3%) |
| Total | 38,214 (75.0%) | 2,446 (4.8%) |
Employment Occupations by Sex in Hunt County
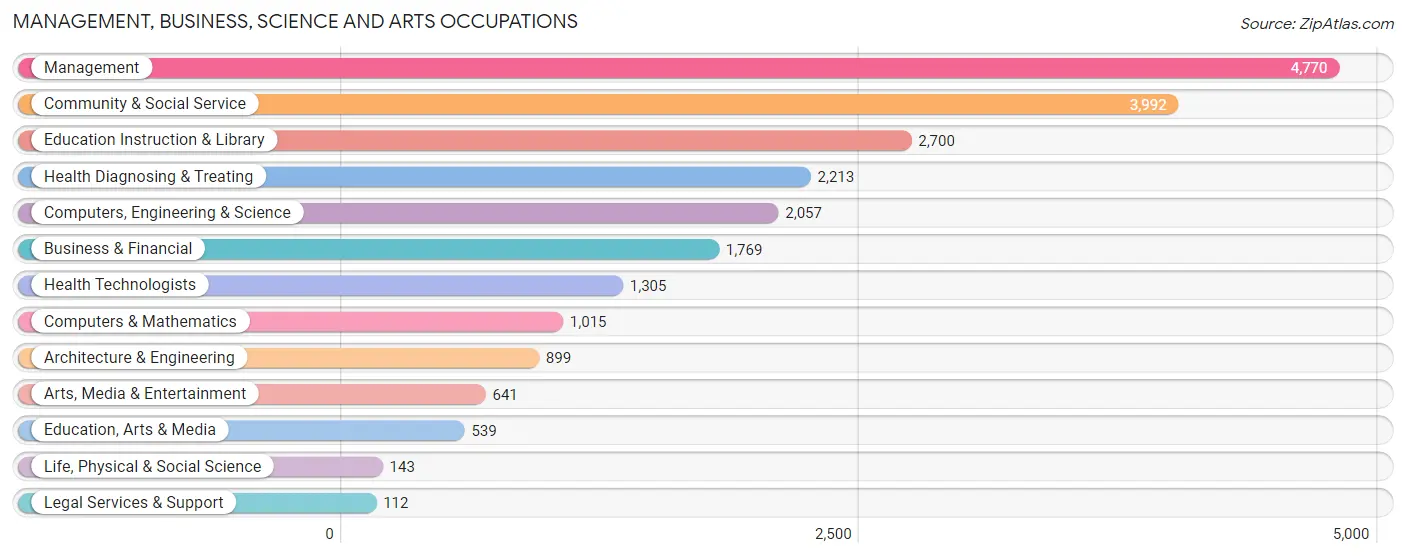
Management, Business, Science and Arts Occupations
The most common Management, Business, Science and Arts occupations in Hunt County are Management (4,770 | 10.3%), Community & Social Service (3,992 | 8.7%), Education Instruction & Library (2,700 | 5.9%), Health Diagnosing & Treating (2,213 | 4.8%), and Computers, Engineering & Science (2,057 | 4.5%).
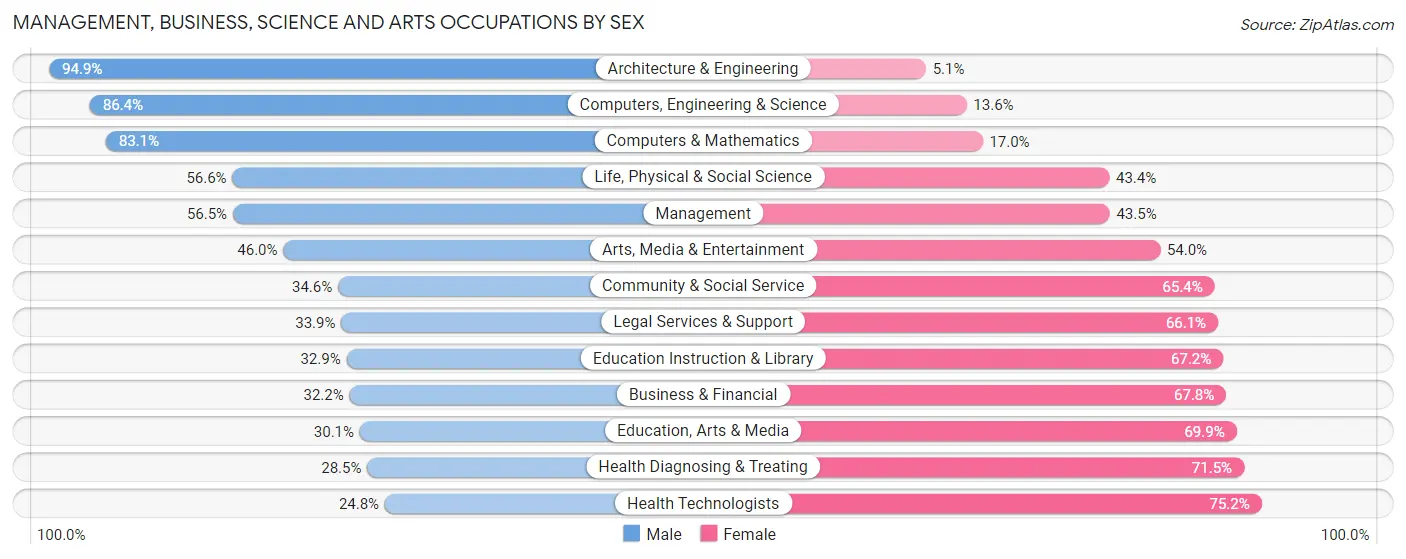
Management, Business, Science and Arts Occupations by Sex
Within the Management, Business, Science and Arts occupations in Hunt County, the most male-oriented occupations are Architecture & Engineering (94.9%), Computers, Engineering & Science (86.4%), and Computers & Mathematics (83.1%), while the most female-oriented occupations are Health Technologists (75.2%), Health Diagnosing & Treating (71.5%), and Education, Arts & Media (69.9%).
| Occupation | Male | Female |
| Management | 2,697 (56.5%) | 2,073 (43.5%) |
| Business & Financial | 570 (32.2%) | 1,199 (67.8%) |
| Computers, Engineering & Science | 1,777 (86.4%) | 280 (13.6%) |
| Computers & Mathematics | 843 (83.1%) | 172 (17.0%) |
| Architecture & Engineering | 853 (94.9%) | 46 (5.1%) |
| Life, Physical & Social Science | 81 (56.6%) | 62 (43.4%) |
| Community & Social Service | 1,382 (34.6%) | 2,610 (65.4%) |
| Education, Arts & Media | 162 (30.1%) | 377 (69.9%) |
| Legal Services & Support | 38 (33.9%) | 74 (66.1%) |
| Education Instruction & Library | 887 (32.9%) | 1,813 (67.1%) |
| Arts, Media & Entertainment | 295 (46.0%) | 346 (54.0%) |
| Health Diagnosing & Treating | 631 (28.5%) | 1,582 (71.5%) |
| Health Technologists | 324 (24.8%) | 981 (75.2%) |
| Total (Category) | 7,057 (47.7%) | 7,744 (52.3%) |
| Total (Overall) | 25,402 (55.1%) | 20,672 (44.9%) |
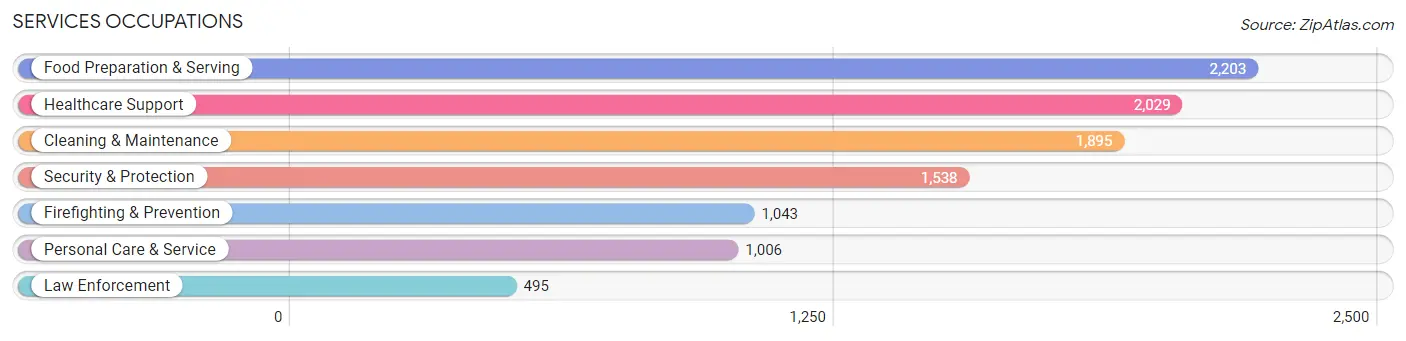
Services Occupations
The most common Services occupations in Hunt County are Food Preparation & Serving (2,203 | 4.8%), Healthcare Support (2,029 | 4.4%), Cleaning & Maintenance (1,895 | 4.1%), Security & Protection (1,538 | 3.3%), and Firefighting & Prevention (1,043 | 2.3%).
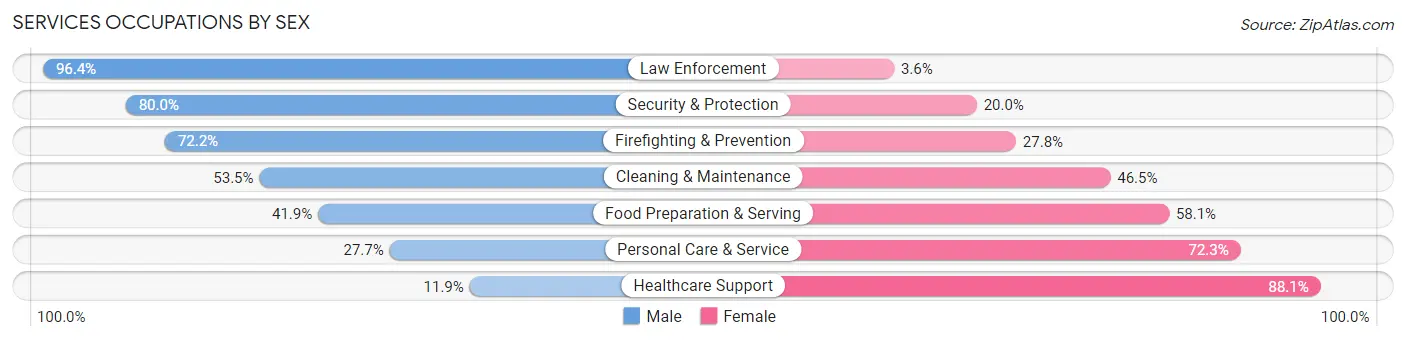
Services Occupations by Sex
Within the Services occupations in Hunt County, the most male-oriented occupations are Law Enforcement (96.4%), Security & Protection (80.0%), and Firefighting & Prevention (72.2%), while the most female-oriented occupations are Healthcare Support (88.1%), Personal Care & Service (72.3%), and Food Preparation & Serving (58.1%).
| Occupation | Male | Female |
| Healthcare Support | 241 (11.9%) | 1,788 (88.1%) |
| Security & Protection | 1,230 (80.0%) | 308 (20.0%) |
| Firefighting & Prevention | 753 (72.2%) | 290 (27.8%) |
| Law Enforcement | 477 (96.4%) | 18 (3.6%) |
| Food Preparation & Serving | 923 (41.9%) | 1,280 (58.1%) |
| Cleaning & Maintenance | 1,014 (53.5%) | 881 (46.5%) |
| Personal Care & Service | 279 (27.7%) | 727 (72.3%) |
| Total (Category) | 3,687 (42.5%) | 4,984 (57.5%) |
| Total (Overall) | 25,402 (55.1%) | 20,672 (44.9%) |
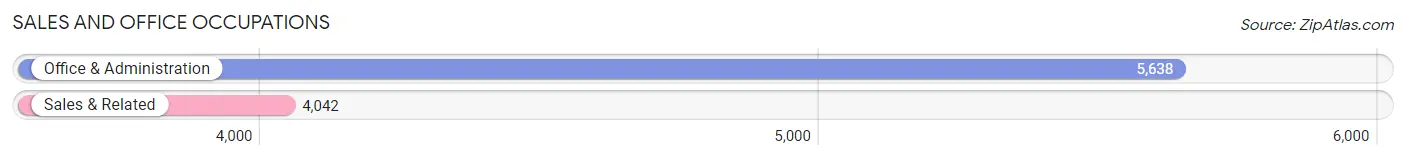
Sales and Office Occupations
The most common Sales and Office occupations in Hunt County are Office & Administration (5,638 | 12.2%), and Sales & Related (4,042 | 8.8%).
Sales and Office Occupations by Sex
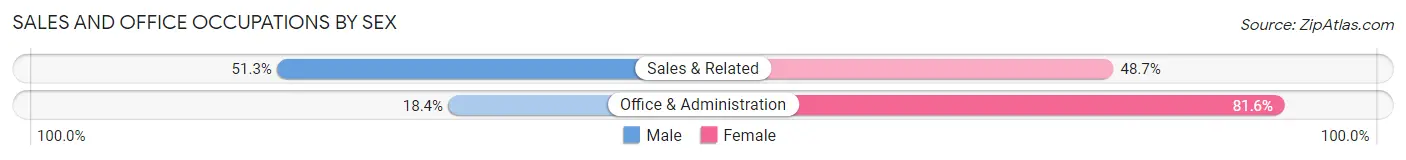
| Occupation | Male | Female |
| Sales & Related | 2,075 (51.3%) | 1,967 (48.7%) |
| Office & Administration | 1,038 (18.4%) | 4,600 (81.6%) |
| Total (Category) | 3,113 (32.2%) | 6,567 (67.8%) |
| Total (Overall) | 25,402 (55.1%) | 20,672 (44.9%) |
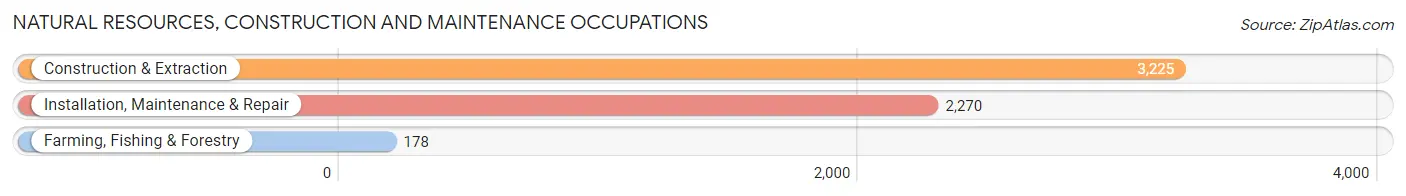
Natural Resources, Construction and Maintenance Occupations
The most common Natural Resources, Construction and Maintenance occupations in Hunt County are Construction & Extraction (3,225 | 7.0%), Installation, Maintenance & Repair (2,270 | 4.9%), and Farming, Fishing & Forestry (178 | 0.4%).
Natural Resources, Construction and Maintenance Occupations by Sex
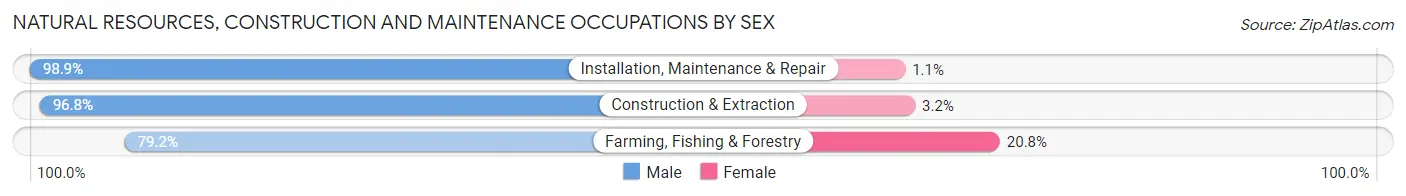
| Occupation | Male | Female |
| Farming, Fishing & Forestry | 141 (79.2%) | 37 (20.8%) |
| Construction & Extraction | 3,123 (96.8%) | 102 (3.2%) |
| Installation, Maintenance & Repair | 2,245 (98.9%) | 25 (1.1%) |
| Total (Category) | 5,509 (97.1%) | 164 (2.9%) |
| Total (Overall) | 25,402 (55.1%) | 20,672 (44.9%) |
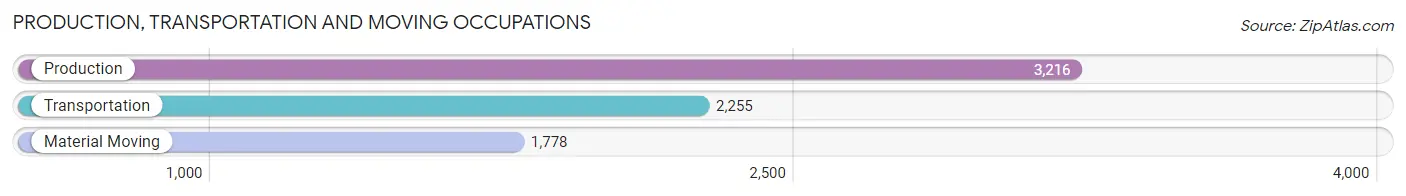
Production, Transportation and Moving Occupations
The most common Production, Transportation and Moving occupations in Hunt County are Production (3,216 | 7.0%), Transportation (2,255 | 4.9%), and Material Moving (1,778 | 3.9%).
Production, Transportation and Moving Occupations by Sex
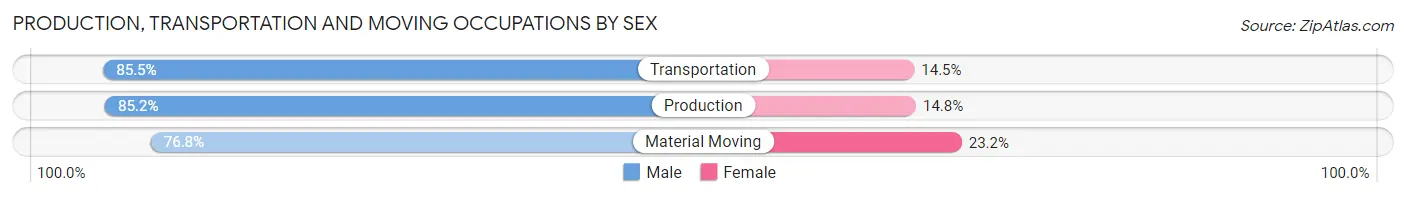
| Occupation | Male | Female |
| Production | 2,741 (85.2%) | 475 (14.8%) |
| Transportation | 1,929 (85.5%) | 326 (14.5%) |
| Material Moving | 1,366 (76.8%) | 412 (23.2%) |
| Total (Category) | 6,036 (83.3%) | 1,213 (16.7%) |
| Total (Overall) | 25,402 (55.1%) | 20,672 (44.9%) |
Employment Industries by Sex in Hunt County
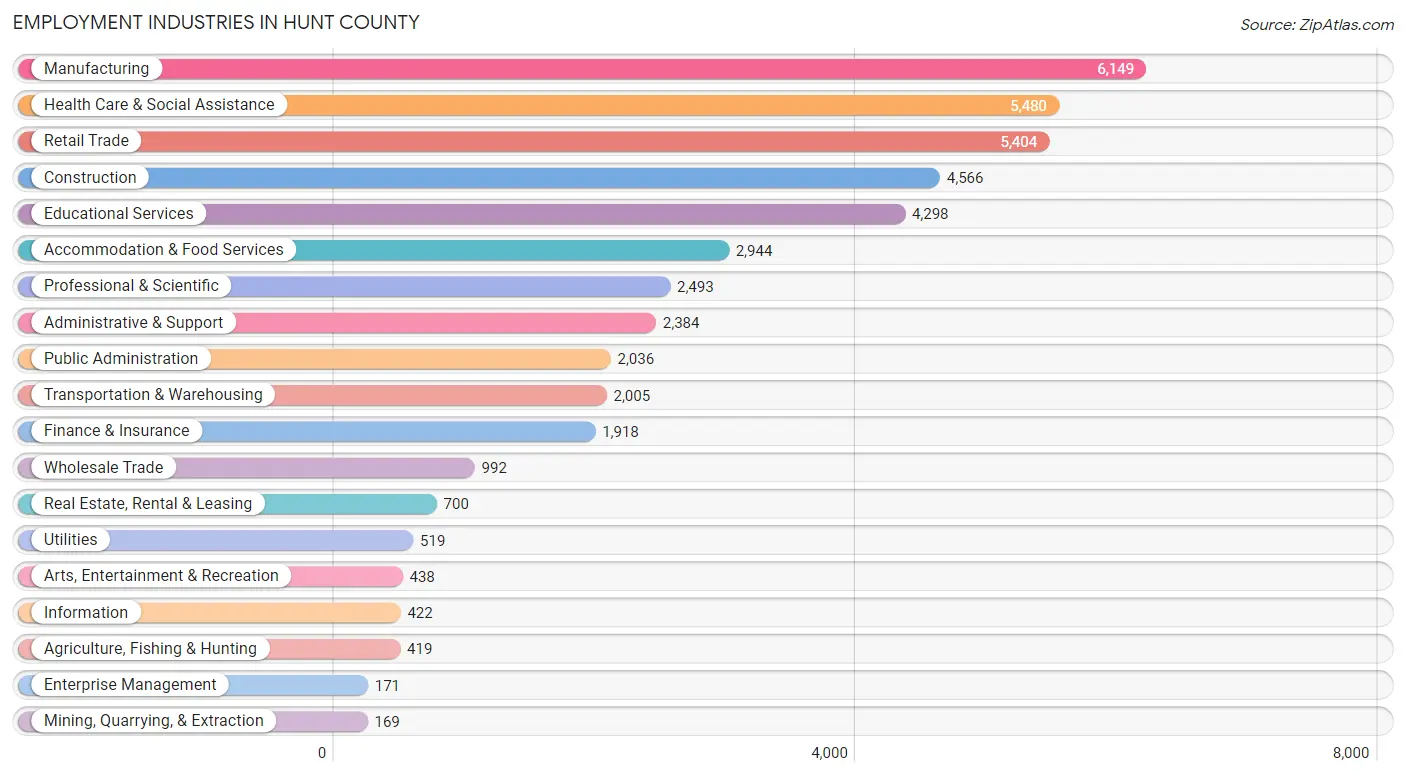
Employment Industries in Hunt County
The major employment industries in Hunt County include Manufacturing (6,149 | 13.4%), Health Care & Social Assistance (5,480 | 11.9%), Retail Trade (5,404 | 11.7%), Construction (4,566 | 9.9%), and Educational Services (4,298 | 9.3%).
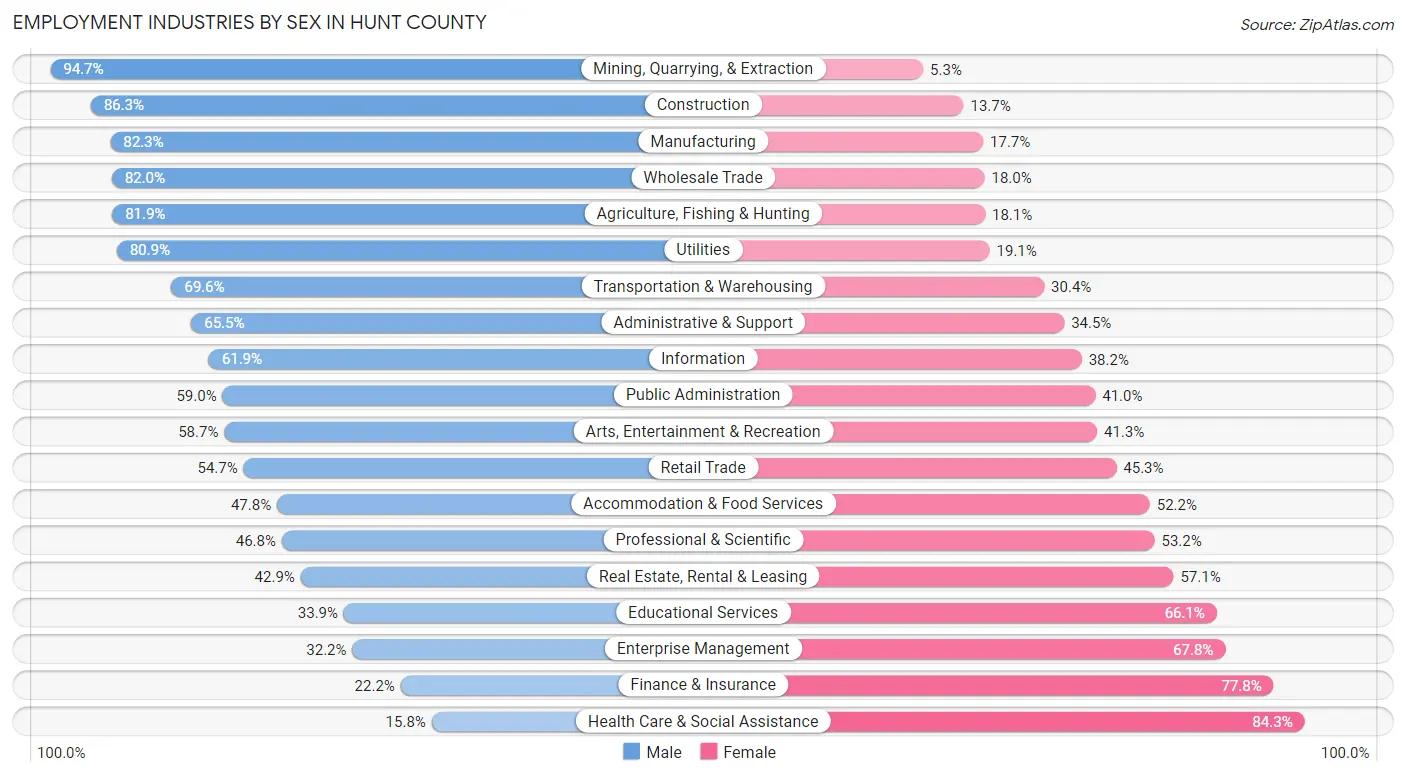
Employment Industries by Sex in Hunt County
The Hunt County industries that see more men than women are Mining, Quarrying, & Extraction (94.7%), Construction (86.3%), and Manufacturing (82.3%), whereas the industries that tend to have a higher number of women are Health Care & Social Assistance (84.3%), Finance & Insurance (77.8%), and Enterprise Management (67.8%).
| Industry | Male | Female |
| Agriculture, Fishing & Hunting | 343 (81.9%) | 76 (18.1%) |
| Mining, Quarrying, & Extraction | 160 (94.7%) | 9 (5.3%) |
| Construction | 3,941 (86.3%) | 625 (13.7%) |
| Manufacturing | 5,058 (82.3%) | 1,091 (17.7%) |
| Wholesale Trade | 813 (82.0%) | 179 (18.0%) |
| Retail Trade | 2,955 (54.7%) | 2,449 (45.3%) |
| Transportation & Warehousing | 1,396 (69.6%) | 609 (30.4%) |
| Utilities | 420 (80.9%) | 99 (19.1%) |
| Information | 261 (61.9%) | 161 (38.2%) |
| Finance & Insurance | 425 (22.2%) | 1,493 (77.8%) |
| Real Estate, Rental & Leasing | 300 (42.9%) | 400 (57.1%) |
| Professional & Scientific | 1,166 (46.8%) | 1,327 (53.2%) |
| Enterprise Management | 55 (32.2%) | 116 (67.8%) |
| Administrative & Support | 1,561 (65.5%) | 823 (34.5%) |
| Educational Services | 1,458 (33.9%) | 2,840 (66.1%) |
| Health Care & Social Assistance | 863 (15.8%) | 4,617 (84.3%) |
| Arts, Entertainment & Recreation | 257 (58.7%) | 181 (41.3%) |
| Accommodation & Food Services | 1,406 (47.8%) | 1,538 (52.2%) |
| Public Administration | 1,202 (59.0%) | 834 (41.0%) |
| Total | 25,402 (55.1%) | 20,672 (44.9%) |
Education in Hunt County
School Enrollment in Hunt County
The most common levels of schooling among the 25,208 students in Hunt County are middle school (5,645 | 22.4%), high school (5,521 | 21.9%), and elementary school (5,212 | 20.7%).
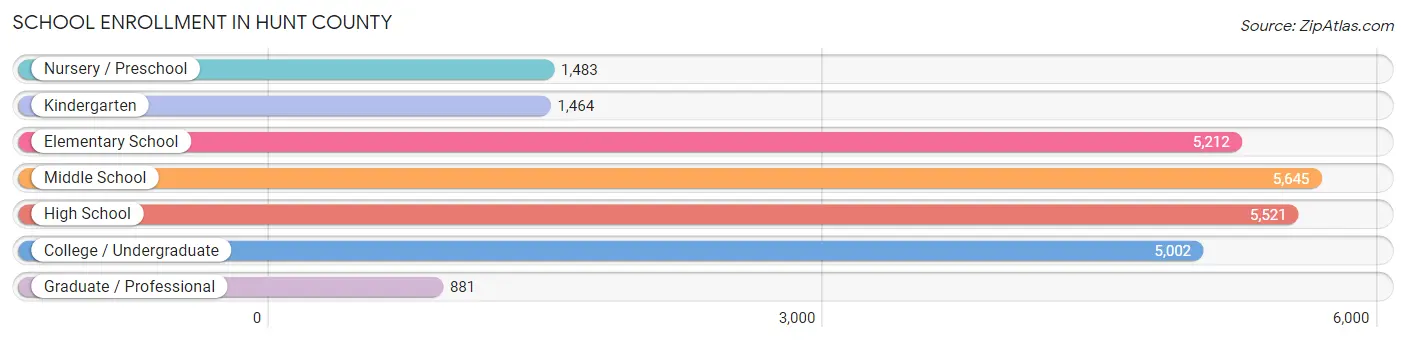
| School Level | # Students | % Students |
| Nursery / Preschool | 1,483 | 5.9% |
| Kindergarten | 1,464 | 5.8% |
| Elementary School | 5,212 | 20.7% |
| Middle School | 5,645 | 22.4% |
| High School | 5,521 | 21.9% |
| College / Undergraduate | 5,002 | 19.8% |
| Graduate / Professional | 881 | 3.5% |
| Total | 25,208 | 100.0% |
School Enrollment by Age by Funding Source in Hunt County
Out of a total of 25,208 students who are enrolled in schools in Hunt County, 3,126 (12.4%) attend a private institution, while the remaining 22,082 (87.6%) are enrolled in public schools. The age group of 3 to 4 year olds has the highest likelihood of being enrolled in private schools, with 299 (26.3% in the age bracket) enrolled. Conversely, the age group of 25 to 34 year olds has the lowest likelihood of being enrolled in a private school, with 744 (90.3% in the age bracket) attending a public institution.
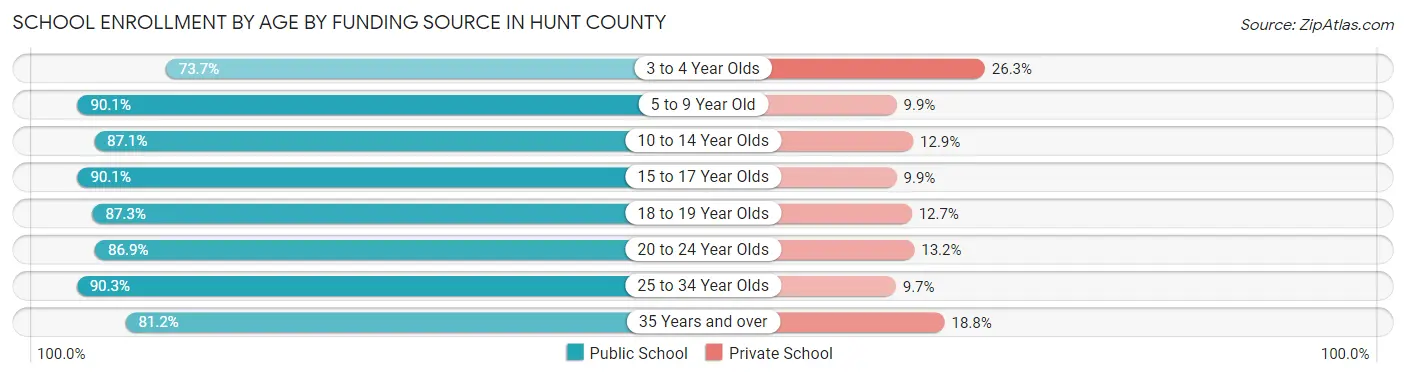
| Age Bracket | Public School | Private School |
| 3 to 4 Year Olds | 838 (73.7%) | 299 (26.3%) |
| 5 to 9 Year Old | 5,565 (90.1%) | 609 (9.9%) |
| 10 to 14 Year Olds | 6,250 (87.1%) | 929 (12.9%) |
| 15 to 17 Year Olds | 3,611 (90.1%) | 395 (9.9%) |
| 18 to 19 Year Olds | 2,074 (87.3%) | 301 (12.7%) |
| 20 to 24 Year Olds | 2,404 (86.9%) | 364 (13.2%) |
| 25 to 34 Year Olds | 744 (90.3%) | 80 (9.7%) |
| 35 Years and over | 605 (81.2%) | 140 (18.8%) |
| Total | 22,082 (87.6%) | 3,126 (12.4%) |
Educational Attainment by Field of Study in Hunt County
Business (2,909 | 19.1%), education (2,392 | 15.7%), arts & humanities (1,211 | 7.9%), engineering (1,027 | 6.7%), and science & technology (1,003 | 6.6%) are the most common fields of study among 15,263 individuals in Hunt County who have obtained a bachelor's degree or higher.
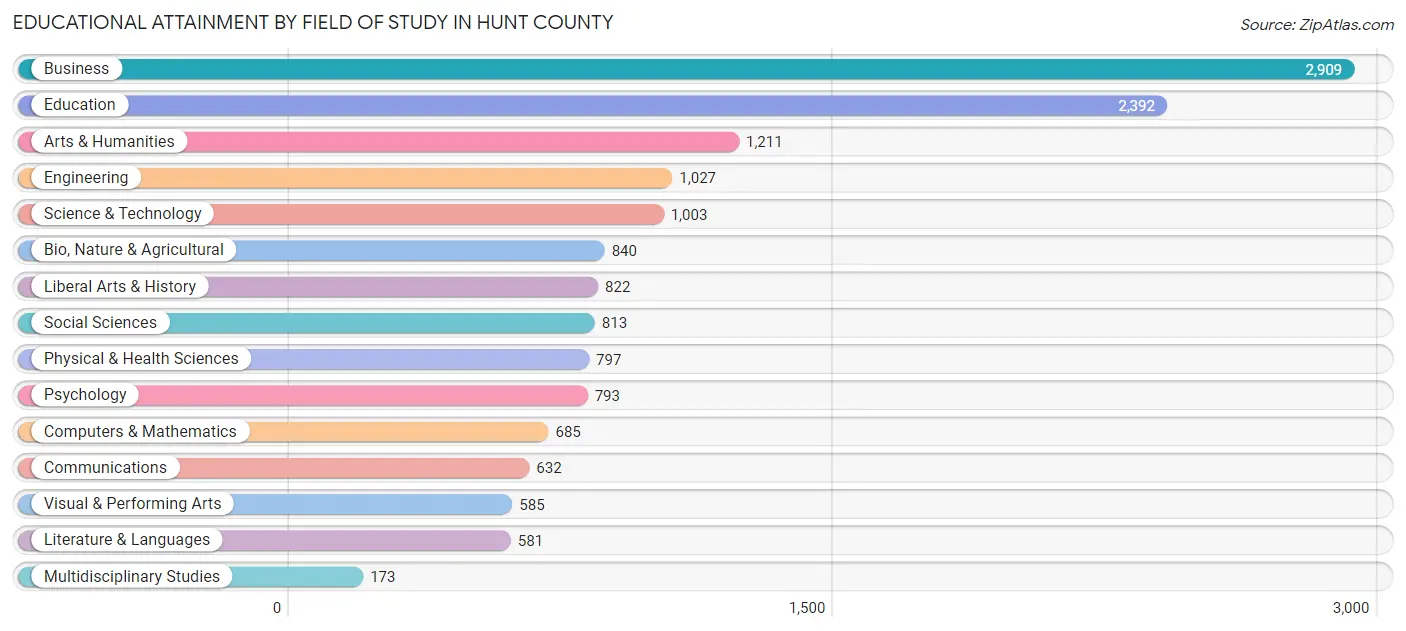
| Field of Study | # Graduates | % Graduates |
| Computers & Mathematics | 685 | 4.5% |
| Bio, Nature & Agricultural | 840 | 5.5% |
| Physical & Health Sciences | 797 | 5.2% |
| Psychology | 793 | 5.2% |
| Social Sciences | 813 | 5.3% |
| Engineering | 1,027 | 6.7% |
| Multidisciplinary Studies | 173 | 1.1% |
| Science & Technology | 1,003 | 6.6% |
| Business | 2,909 | 19.1% |
| Education | 2,392 | 15.7% |
| Literature & Languages | 581 | 3.8% |
| Liberal Arts & History | 822 | 5.4% |
| Visual & Performing Arts | 585 | 3.8% |
| Communications | 632 | 4.1% |
| Arts & Humanities | 1,211 | 7.9% |
| Total | 15,263 | 100.0% |
Transportation & Commute in Hunt County
Vehicle Availability by Sex in Hunt County
The most prevalent vehicle ownership categories in Hunt County are males with 2 vehicles (9,552, accounting for 39.2%) and females with 2 vehicles (7,756, making up 48.3%).
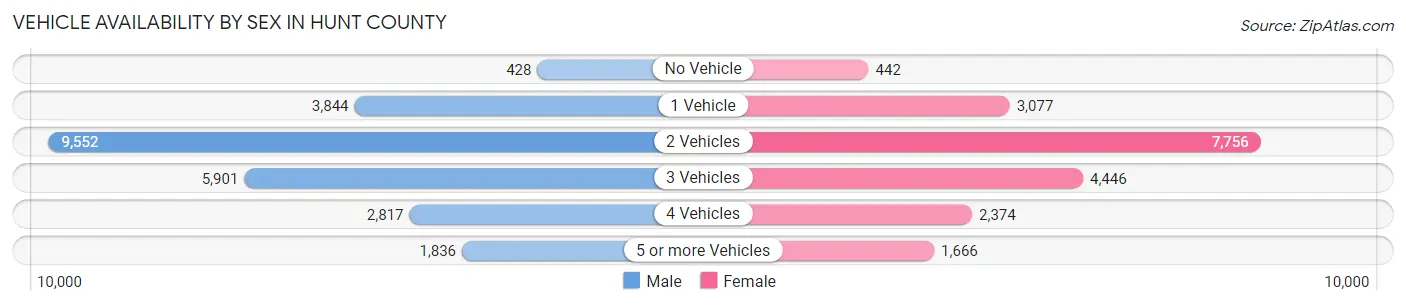
| Vehicles Available | Male | Female |
| No Vehicle | 428 (1.8%) | 442 (2.2%) |
| 1 Vehicle | 3,844 (15.8%) | 3,077 (15.6%) |
| 2 Vehicles | 9,552 (39.2%) | 7,756 (39.3%) |
| 3 Vehicles | 5,901 (24.2%) | 4,446 (22.5%) |
| 4 Vehicles | 2,817 (11.6%) | 2,374 (12.0%) |
| 5 or more Vehicles | 1,836 (7.5%) | 1,666 (8.4%) |
| Total | 24,378 (100.0%) | 19,761 (100.0%) |
Commute Time in Hunt County
The most frequently occuring commute durations in Hunt County are 60 to 89 minutes (5,761 commuters, 13.9%), 10 to 14 minutes (5,453 commuters, 13.1%), and 15 to 19 minutes (5,438 commuters, 13.1%).
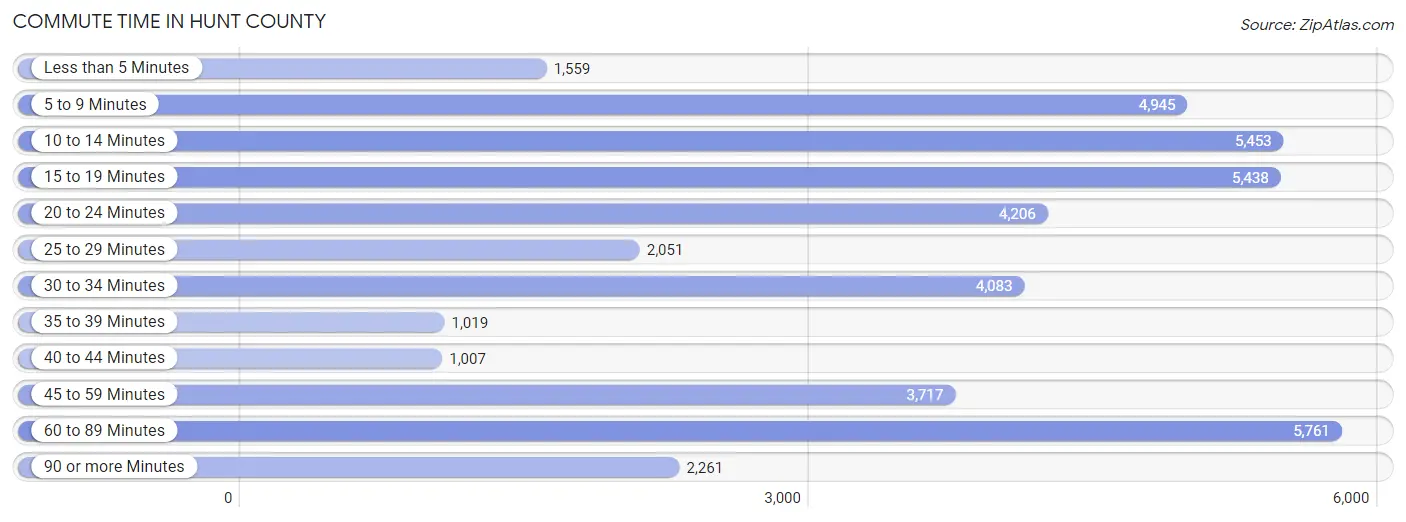
| Commute Time | # Commuters | % Commuters |
| Less than 5 Minutes | 1,559 | 3.8% |
| 5 to 9 Minutes | 4,945 | 11.9% |
| 10 to 14 Minutes | 5,453 | 13.1% |
| 15 to 19 Minutes | 5,438 | 13.1% |
| 20 to 24 Minutes | 4,206 | 10.1% |
| 25 to 29 Minutes | 2,051 | 4.9% |
| 30 to 34 Minutes | 4,083 | 9.8% |
| 35 to 39 Minutes | 1,019 | 2.5% |
| 40 to 44 Minutes | 1,007 | 2.4% |
| 45 to 59 Minutes | 3,717 | 9.0% |
| 60 to 89 Minutes | 5,761 | 13.9% |
| 90 or more Minutes | 2,261 | 5.4% |
Commute Time by Sex in Hunt County
The most common commute times in Hunt County are 60 to 89 minutes (4,152 commuters, 17.7%) for males and 5 to 9 minutes (2,550 commuters, 14.2%) for females.
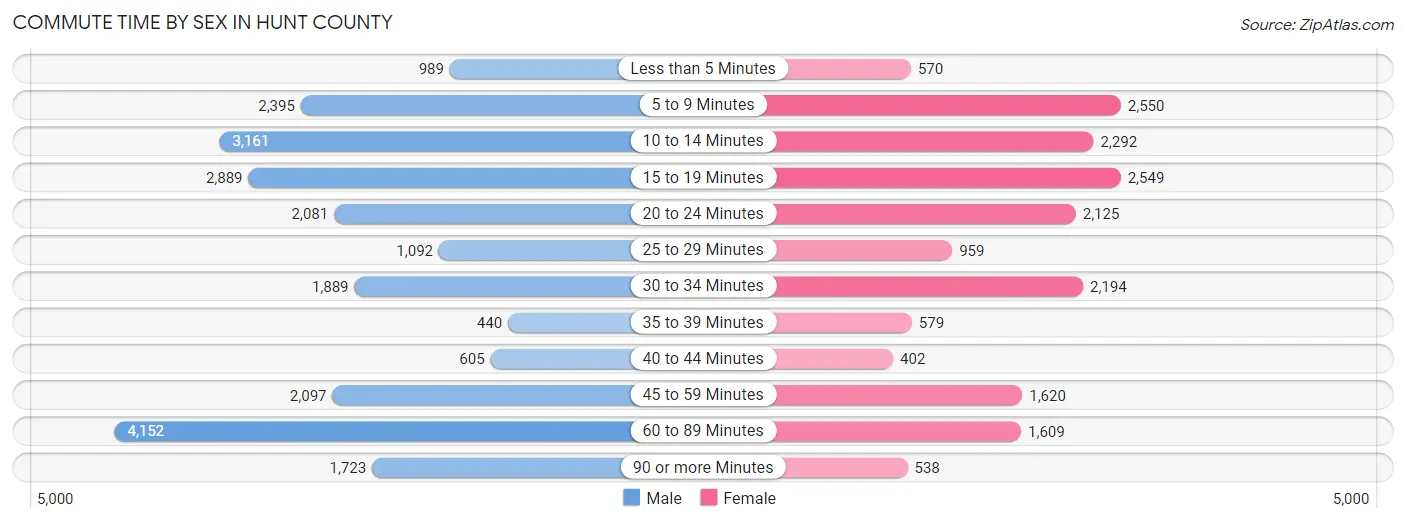
| Commute Time | Male | Female |
| Less than 5 Minutes | 989 (4.2%) | 570 (3.2%) |
| 5 to 9 Minutes | 2,395 (10.2%) | 2,550 (14.2%) |
| 10 to 14 Minutes | 3,161 (13.4%) | 2,292 (12.7%) |
| 15 to 19 Minutes | 2,889 (12.3%) | 2,549 (14.2%) |
| 20 to 24 Minutes | 2,081 (8.8%) | 2,125 (11.8%) |
| 25 to 29 Minutes | 1,092 (4.6%) | 959 (5.3%) |
| 30 to 34 Minutes | 1,889 (8.0%) | 2,194 (12.2%) |
| 35 to 39 Minutes | 440 (1.9%) | 579 (3.2%) |
| 40 to 44 Minutes | 605 (2.6%) | 402 (2.2%) |
| 45 to 59 Minutes | 2,097 (8.9%) | 1,620 (9.0%) |
| 60 to 89 Minutes | 4,152 (17.7%) | 1,609 (8.9%) |
| 90 or more Minutes | 1,723 (7.3%) | 538 (3.0%) |
Time of Departure to Work by Sex in Hunt County
The most frequent times of departure to work in Hunt County are 7:00 AM to 7:29 AM (3,315, 14.1%) for males and 7:00 AM to 7:29 AM (3,436, 19.1%) for females.
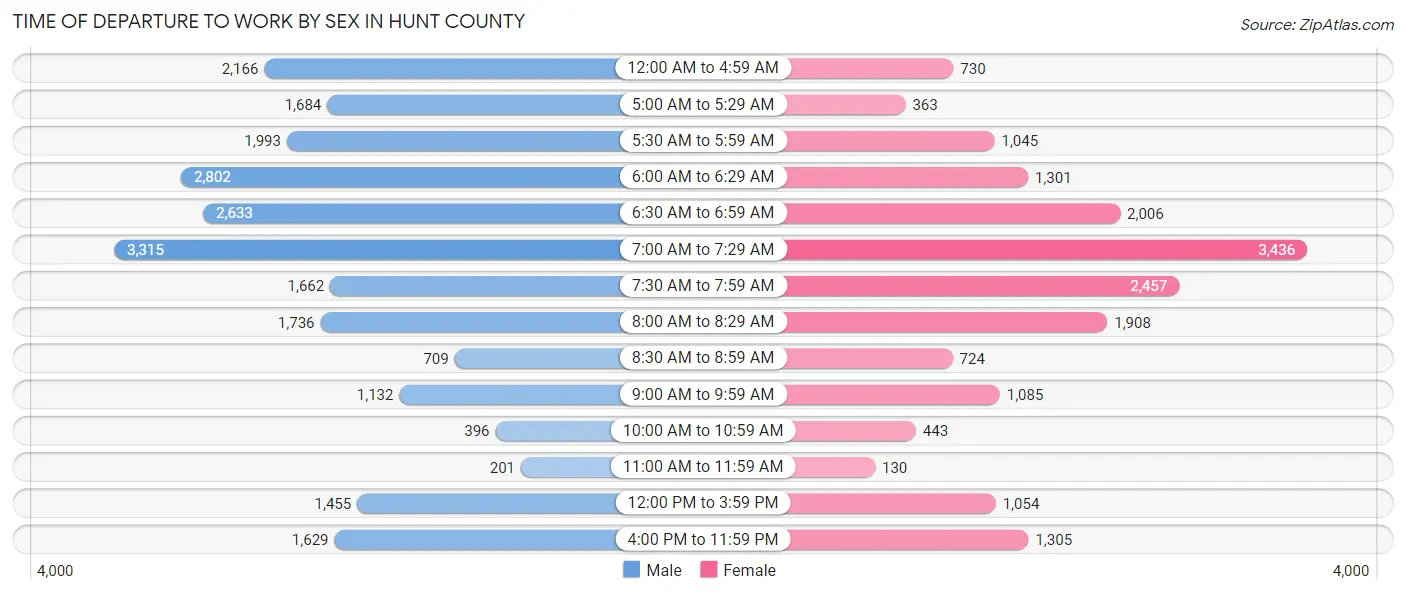
| Time of Departure | Male | Female |
| 12:00 AM to 4:59 AM | 2,166 (9.2%) | 730 (4.1%) |
| 5:00 AM to 5:29 AM | 1,684 (7.2%) | 363 (2.0%) |
| 5:30 AM to 5:59 AM | 1,993 (8.5%) | 1,045 (5.8%) |
| 6:00 AM to 6:29 AM | 2,802 (11.9%) | 1,301 (7.2%) |
| 6:30 AM to 6:59 AM | 2,633 (11.2%) | 2,006 (11.2%) |
| 7:00 AM to 7:29 AM | 3,315 (14.1%) | 3,436 (19.1%) |
| 7:30 AM to 7:59 AM | 1,662 (7.1%) | 2,457 (13.7%) |
| 8:00 AM to 8:29 AM | 1,736 (7.4%) | 1,908 (10.6%) |
| 8:30 AM to 8:59 AM | 709 (3.0%) | 724 (4.0%) |
| 9:00 AM to 9:59 AM | 1,132 (4.8%) | 1,085 (6.0%) |
| 10:00 AM to 10:59 AM | 396 (1.7%) | 443 (2.5%) |
| 11:00 AM to 11:59 AM | 201 (0.9%) | 130 (0.7%) |
| 12:00 PM to 3:59 PM | 1,455 (6.2%) | 1,054 (5.9%) |
| 4:00 PM to 11:59 PM | 1,629 (6.9%) | 1,305 (7.3%) |
| Total | 23,513 (100.0%) | 17,987 (100.0%) |
Housing Occupancy in Hunt County
Occupancy by Ownership in Hunt County
Of the total 36,560 dwellings in Hunt County, owner-occupied units account for 25,573 (70.0%), while renter-occupied units make up 10,987 (30.0%).
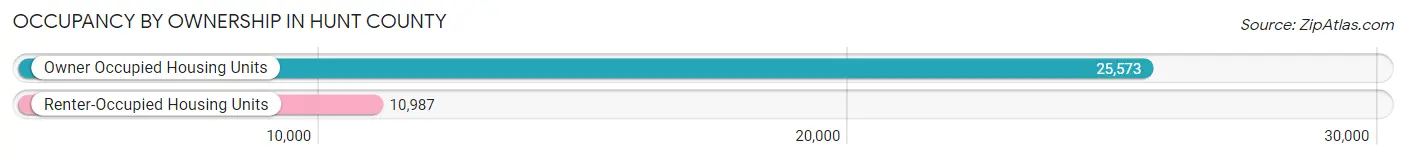
| Occupancy | # Housing Units | % Housing Units |
| Owner Occupied Housing Units | 25,573 | 70.0% |
| Renter-Occupied Housing Units | 10,987 | 30.0% |
| Total Occupied Housing Units | 36,560 | 100.0% |
Occupancy by Household Size in Hunt County
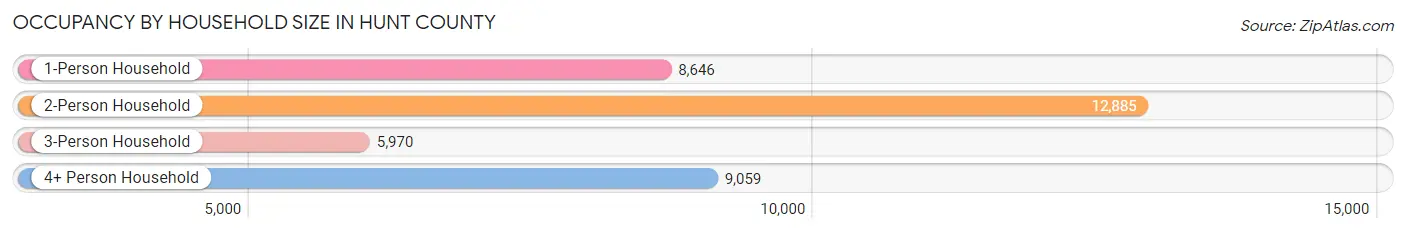
| Household Size | # Housing Units | % Housing Units |
| 1-Person Household | 8,646 | 23.6% |
| 2-Person Household | 12,885 | 35.2% |
| 3-Person Household | 5,970 | 16.3% |
| 4+ Person Household | 9,059 | 24.8% |
| Total Housing Units | 36,560 | 100.0% |
Occupancy by Ownership by Household Size in Hunt County
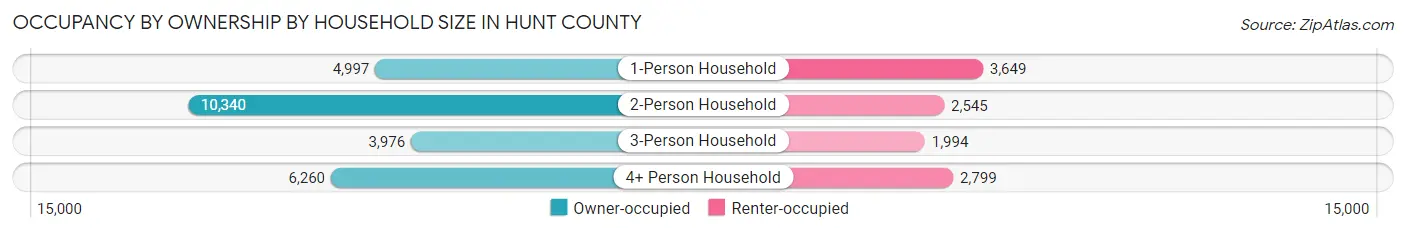
| Household Size | Owner-occupied | Renter-occupied |
| 1-Person Household | 4,997 (57.8%) | 3,649 (42.2%) |
| 2-Person Household | 10,340 (80.2%) | 2,545 (19.8%) |
| 3-Person Household | 3,976 (66.6%) | 1,994 (33.4%) |
| 4+ Person Household | 6,260 (69.1%) | 2,799 (30.9%) |
| Total Housing Units | 25,573 (70.0%) | 10,987 (30.0%) |
Occupancy by Educational Attainment in Hunt County
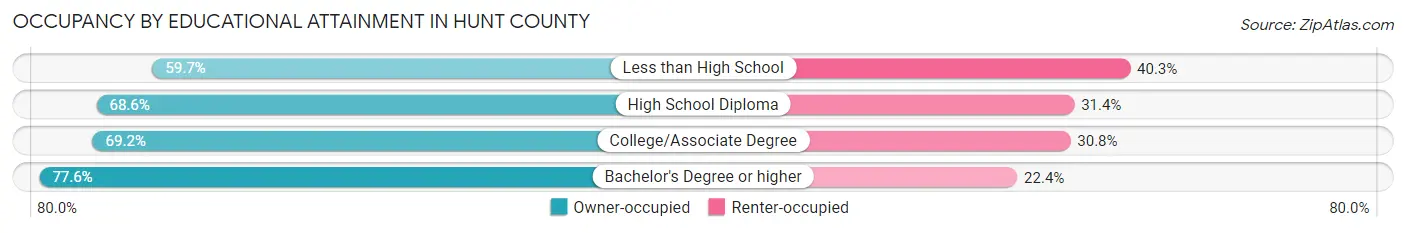
| Household Size | Owner-occupied | Renter-occupied |
| Less than High School | 2,555 (59.7%) | 1,723 (40.3%) |
| High School Diploma | 7,743 (68.6%) | 3,545 (31.4%) |
| College/Associate Degree | 8,404 (69.2%) | 3,740 (30.8%) |
| Bachelor's Degree or higher | 6,871 (77.6%) | 1,979 (22.4%) |
Occupancy by Age of Householder in Hunt County
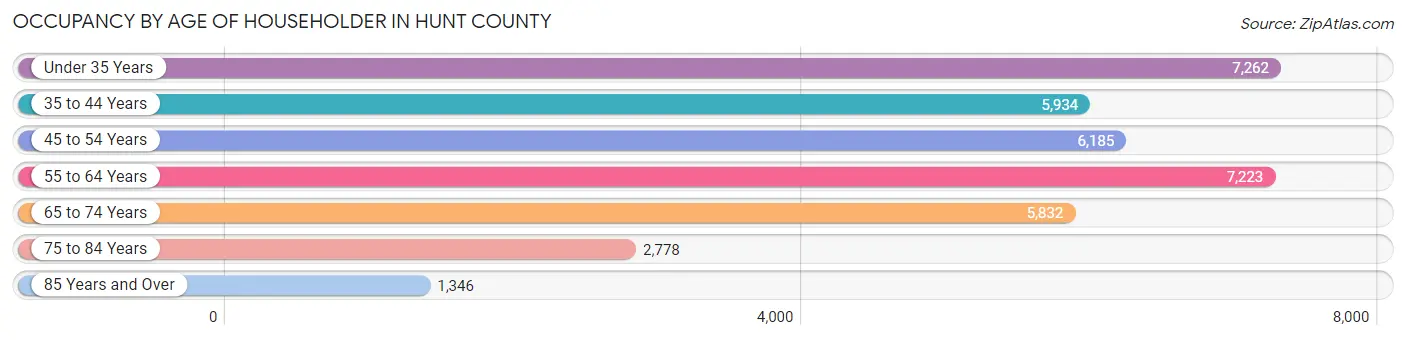
| Age Bracket | # Households | % Households |
| Under 35 Years | 7,262 | 19.9% |
| 35 to 44 Years | 5,934 | 16.2% |
| 45 to 54 Years | 6,185 | 16.9% |
| 55 to 64 Years | 7,223 | 19.8% |
| 65 to 74 Years | 5,832 | 16.0% |
| 75 to 84 Years | 2,778 | 7.6% |
| 85 Years and Over | 1,346 | 3.7% |
| Total | 36,560 | 100.0% |
Housing Finances in Hunt County
Median Income by Occupancy in Hunt County
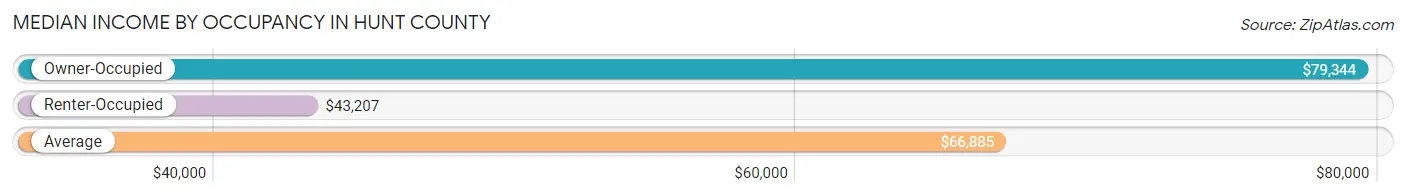
| Occupancy Type | # Households | Median Income |
| Owner-Occupied | 25,573 (70.0%) | $79,344 |
| Renter-Occupied | 10,987 (30.0%) | $43,207 |
| Average | 36,560 (100.0%) | $66,885 |
Occupancy by Householder Income Bracket in Hunt County
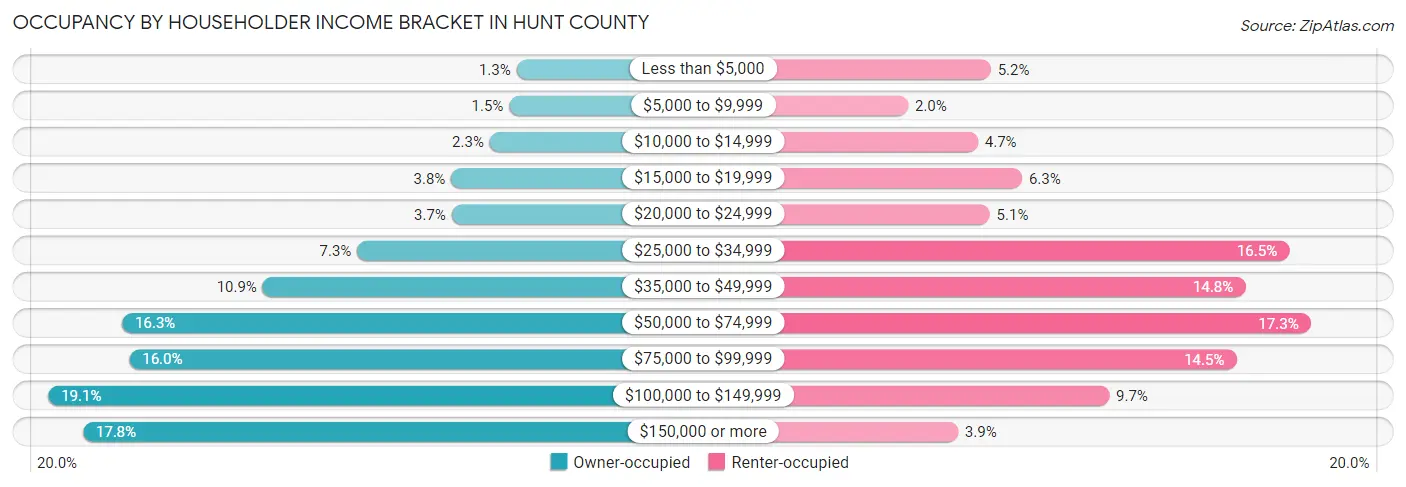
| Income Bracket | Owner-occupied | Renter-occupied |
| Less than $5,000 | 323 (1.3%) | 566 (5.1%) |
| $5,000 to $9,999 | 395 (1.5%) | 220 (2.0%) |
| $10,000 to $14,999 | 584 (2.3%) | 512 (4.7%) |
| $15,000 to $19,999 | 958 (3.7%) | 697 (6.3%) |
| $20,000 to $24,999 | 954 (3.7%) | 561 (5.1%) |
| $25,000 to $34,999 | 1,875 (7.3%) | 1,814 (16.5%) |
| $35,000 to $49,999 | 2,796 (10.9%) | 1,631 (14.8%) |
| $50,000 to $74,999 | 4,165 (16.3%) | 1,904 (17.3%) |
| $75,000 to $99,999 | 4,093 (16.0%) | 1,593 (14.5%) |
| $100,000 to $149,999 | 4,884 (19.1%) | 1,061 (9.7%) |
| $150,000 or more | 4,546 (17.8%) | 428 (3.9%) |
| Total | 25,573 (100.0%) | 10,987 (100.0%) |
Monthly Housing Cost Tiers in Hunt County
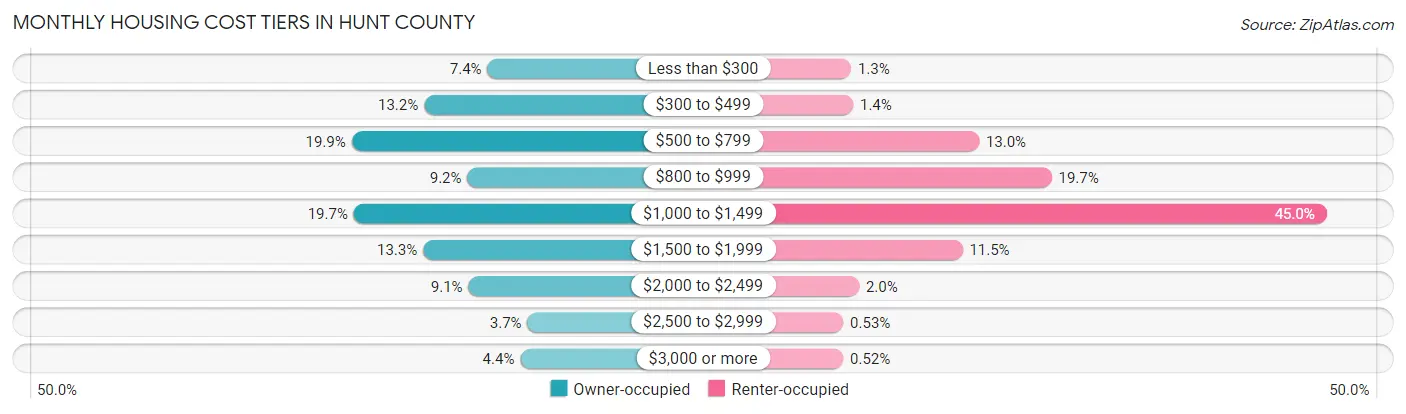
| Monthly Cost | Owner-occupied | Renter-occupied |
| Less than $300 | 1,890 (7.4%) | 137 (1.3%) |
| $300 to $499 | 3,383 (13.2%) | 158 (1.4%) |
| $500 to $799 | 5,090 (19.9%) | 1,432 (13.0%) |
| $800 to $999 | 2,362 (9.2%) | 2,166 (19.7%) |
| $1,000 to $1,499 | 5,039 (19.7%) | 4,949 (45.0%) |
| $1,500 to $1,999 | 3,407 (13.3%) | 1,265 (11.5%) |
| $2,000 to $2,499 | 2,337 (9.1%) | 218 (2.0%) |
| $2,500 to $2,999 | 948 (3.7%) | 58 (0.5%) |
| $3,000 or more | 1,117 (4.4%) | 57 (0.5%) |
| Total | 25,573 (100.0%) | 10,987 (100.0%) |
Physical Housing Characteristics in Hunt County
Housing Structures in Hunt County
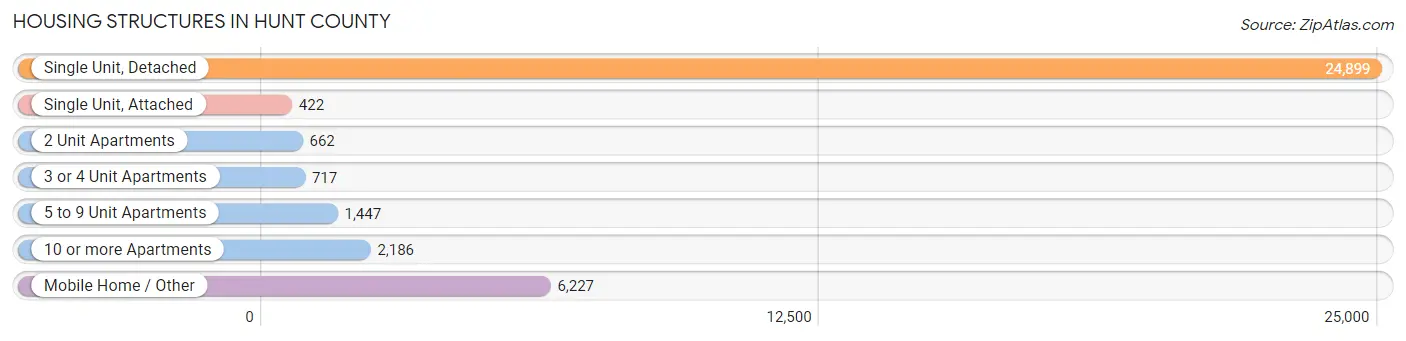
| Structure Type | # Housing Units | % Housing Units |
| Single Unit, Detached | 24,899 | 68.1% |
| Single Unit, Attached | 422 | 1.1% |
| 2 Unit Apartments | 662 | 1.8% |
| 3 or 4 Unit Apartments | 717 | 2.0% |
| 5 to 9 Unit Apartments | 1,447 | 4.0% |
| 10 or more Apartments | 2,186 | 6.0% |
| Mobile Home / Other | 6,227 | 17.0% |
| Total | 36,560 | 100.0% |
Housing Structures by Occupancy in Hunt County
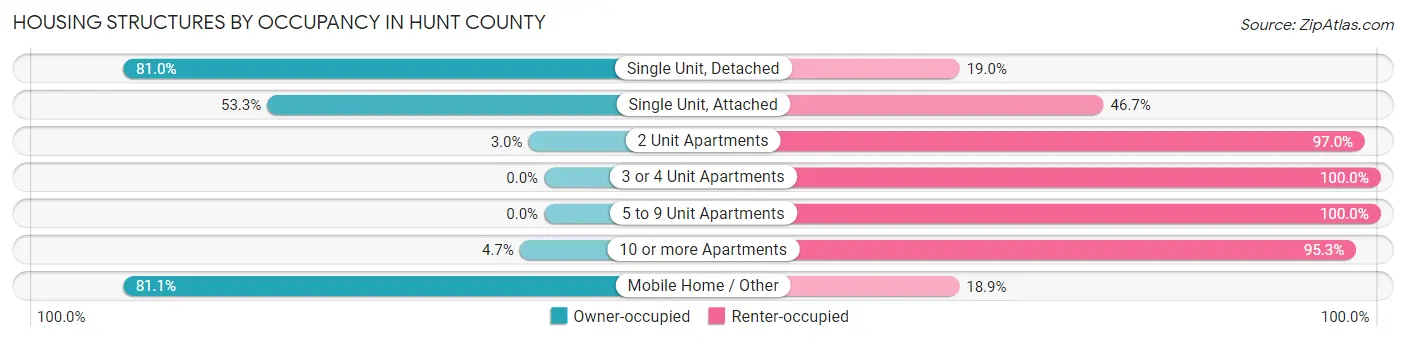
| Structure Type | Owner-occupied | Renter-occupied |
| Single Unit, Detached | 20,174 (81.0%) | 4,725 (19.0%) |
| Single Unit, Attached | 225 (53.3%) | 197 (46.7%) |
| 2 Unit Apartments | 20 (3.0%) | 642 (97.0%) |
| 3 or 4 Unit Apartments | 0 (0.0%) | 717 (100.0%) |
| 5 to 9 Unit Apartments | 0 (0.0%) | 1,447 (100.0%) |
| 10 or more Apartments | 103 (4.7%) | 2,083 (95.3%) |
| Mobile Home / Other | 5,051 (81.1%) | 1,176 (18.9%) |
| Total | 25,573 (70.0%) | 10,987 (30.0%) |
Housing Structures by Number of Rooms in Hunt County
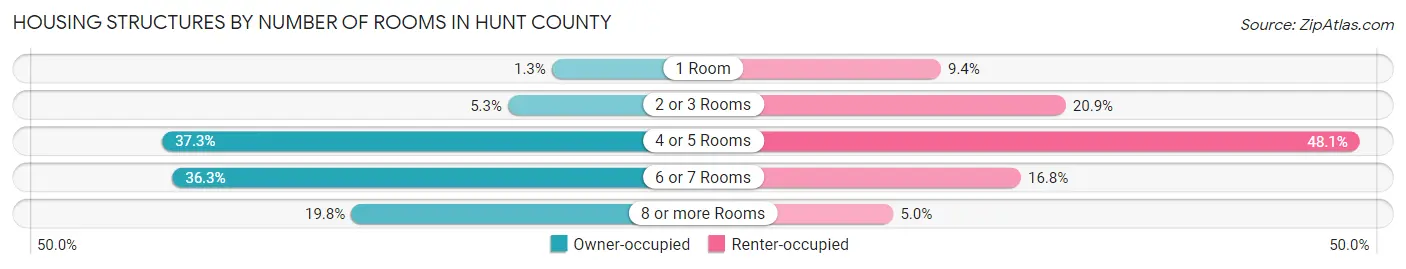
| Number of Rooms | Owner-occupied | Renter-occupied |
| 1 Room | 321 (1.3%) | 1,027 (9.3%) |
| 2 or 3 Rooms | 1,358 (5.3%) | 2,296 (20.9%) |
| 4 or 5 Rooms | 9,535 (37.3%) | 5,280 (48.1%) |
| 6 or 7 Rooms | 9,292 (36.3%) | 1,840 (16.8%) |
| 8 or more Rooms | 5,067 (19.8%) | 544 (5.0%) |
| Total | 25,573 (100.0%) | 10,987 (100.0%) |
Housing Structure by Heating Type in Hunt County
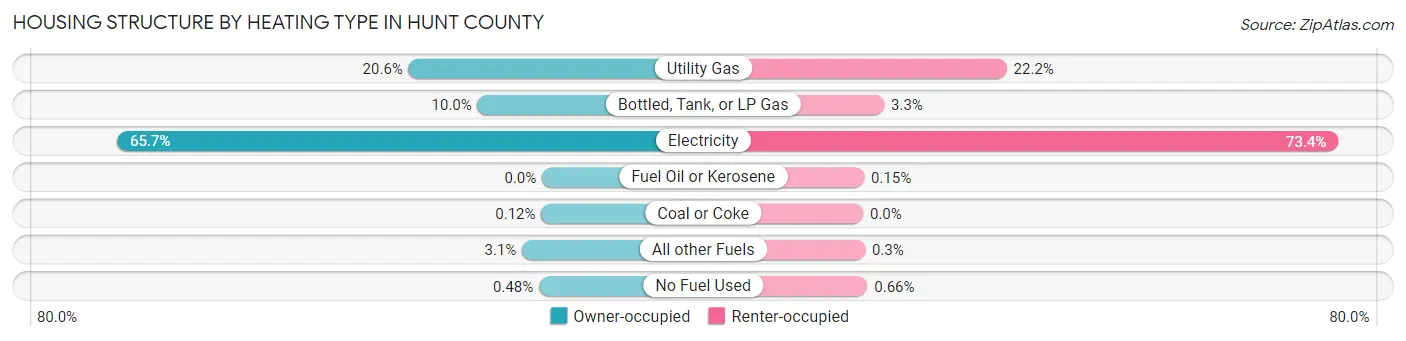
| Heating Type | Owner-occupied | Renter-occupied |
| Utility Gas | 5,276 (20.6%) | 2,439 (22.2%) |
| Bottled, Tank, or LP Gas | 2,553 (10.0%) | 358 (3.3%) |
| Electricity | 16,803 (65.7%) | 8,069 (73.4%) |
| Fuel Oil or Kerosene | 0 (0.0%) | 16 (0.2%) |
| Coal or Coke | 31 (0.1%) | 0 (0.0%) |
| All other Fuels | 788 (3.1%) | 33 (0.3%) |
| No Fuel Used | 122 (0.5%) | 72 (0.7%) |
| Total | 25,573 (100.0%) | 10,987 (100.0%) |
Household Vehicle Usage in Hunt County
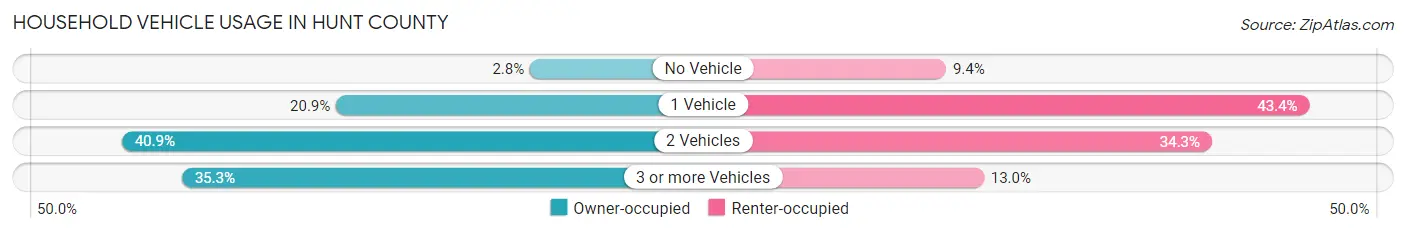
| Vehicles per Household | Owner-occupied | Renter-occupied |
| No Vehicle | 720 (2.8%) | 1,036 (9.4%) |
| 1 Vehicle | 5,351 (20.9%) | 4,764 (43.4%) |
| 2 Vehicles | 10,467 (40.9%) | 3,763 (34.3%) |
| 3 or more Vehicles | 9,035 (35.3%) | 1,424 (13.0%) |
| Total | 25,573 (100.0%) | 10,987 (100.0%) |
Real Estate & Mortgages in Hunt County
Real Estate and Mortgage Overview in Hunt County
| Characteristic | Without Mortgage | With Mortgage |
| Housing Units | 12,675 | 12,898 |
| Median Property Value | $144,100 | $227,400 |
| Median Household Income | $59,443 | $3,162 |
| Monthly Housing Costs | $568 | $1,112 |
| Real Estate Taxes | $1,811 | $724 |
Property Value by Mortgage Status in Hunt County
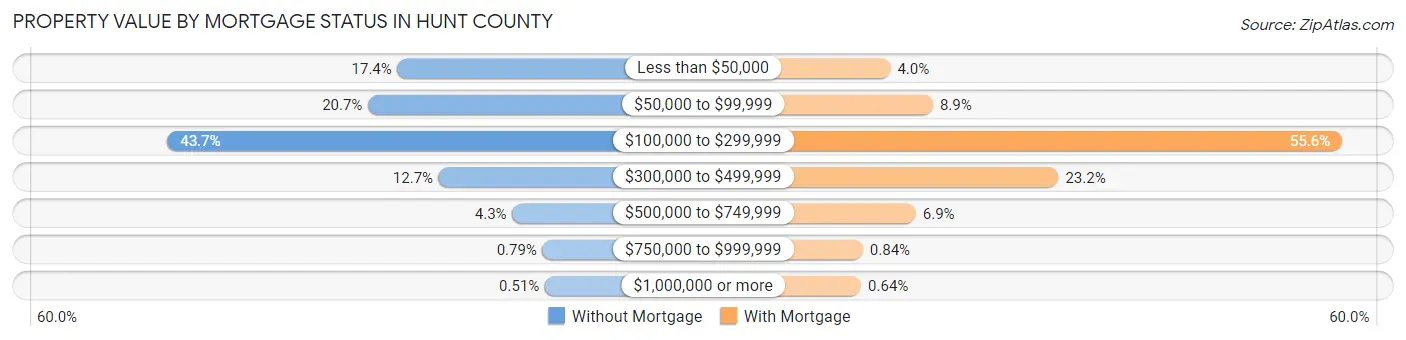
| Property Value | Without Mortgage | With Mortgage |
| Less than $50,000 | 2,202 (17.4%) | 515 (4.0%) |
| $50,000 to $99,999 | 2,628 (20.7%) | 1,142 (8.8%) |
| $100,000 to $299,999 | 5,538 (43.7%) | 7,171 (55.6%) |
| $300,000 to $499,999 | 1,603 (12.7%) | 2,991 (23.2%) |
| $500,000 to $749,999 | 539 (4.3%) | 889 (6.9%) |
| $750,000 to $999,999 | 100 (0.8%) | 108 (0.8%) |
| $1,000,000 or more | 65 (0.5%) | 82 (0.6%) |
| Total | 12,675 (100.0%) | 12,898 (100.0%) |
Household Income by Mortgage Status in Hunt County
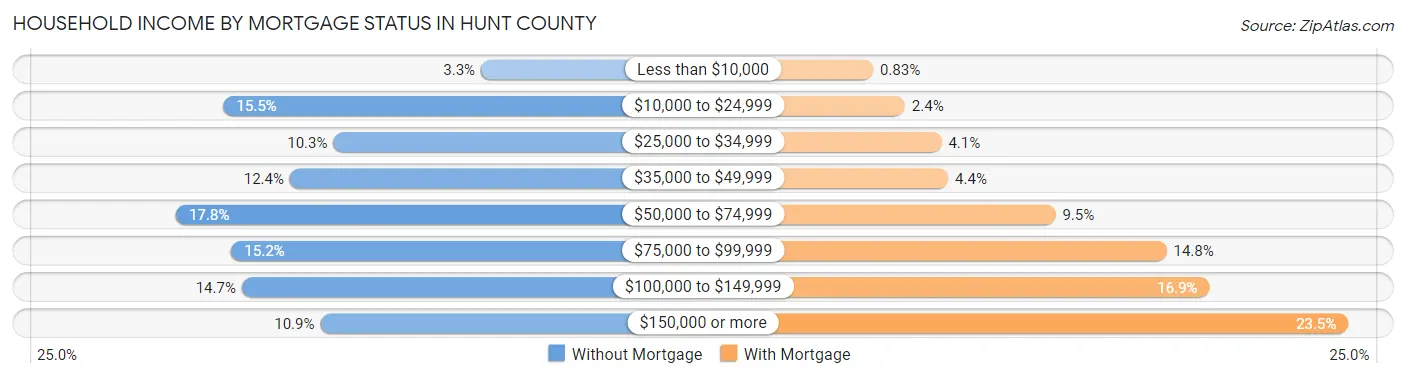
| Household Income | Without Mortgage | With Mortgage |
| Less than $10,000 | 415 (3.3%) | 107 (0.8%) |
| $10,000 to $24,999 | 1,969 (15.5%) | 303 (2.4%) |
| $25,000 to $34,999 | 1,306 (10.3%) | 527 (4.1%) |
| $35,000 to $49,999 | 1,568 (12.4%) | 569 (4.4%) |
| $50,000 to $74,999 | 2,255 (17.8%) | 1,228 (9.5%) |
| $75,000 to $99,999 | 1,920 (15.1%) | 1,910 (14.8%) |
| $100,000 to $149,999 | 1,858 (14.7%) | 2,173 (16.9%) |
| $150,000 or more | 1,384 (10.9%) | 3,026 (23.5%) |
| Total | 12,675 (100.0%) | 12,898 (100.0%) |
Property Value to Household Income Ratio in Hunt County
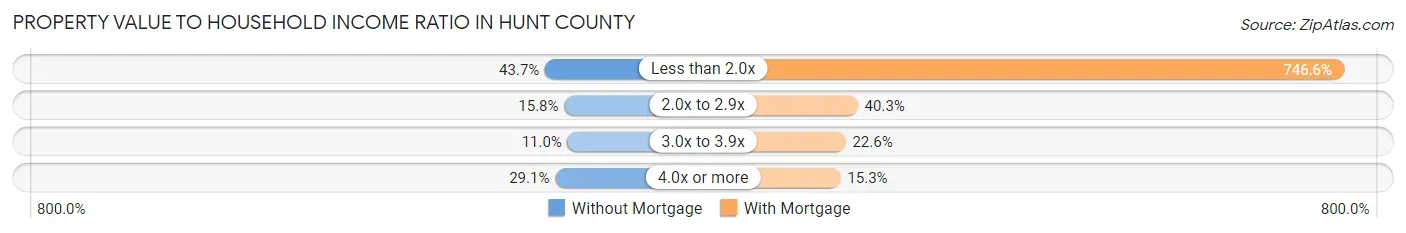
| Value-to-Income Ratio | Without Mortgage | With Mortgage |
| Less than 2.0x | 5,540 (43.7%) | 96,302 (746.6%) |
| 2.0x to 2.9x | 2,004 (15.8%) | 5,197 (40.3%) |
| 3.0x to 3.9x | 1,388 (11.0%) | 2,917 (22.6%) |
| 4.0x or more | 3,682 (29.0%) | 1,973 (15.3%) |
| Total | 12,675 (100.0%) | 12,898 (100.0%) |
Real Estate Taxes by Mortgage Status in Hunt County
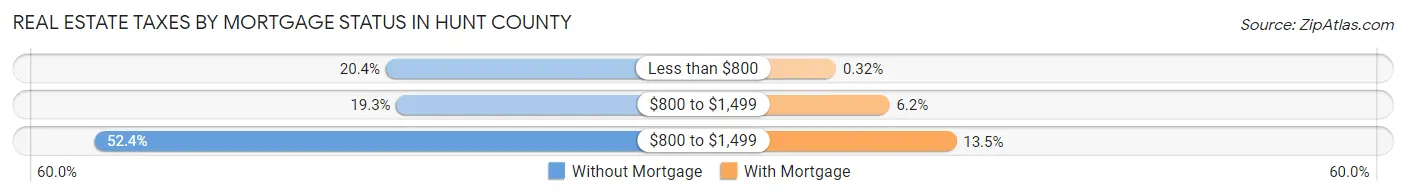
| Property Taxes | Without Mortgage | With Mortgage |
| Less than $800 | 2,587 (20.4%) | 41 (0.3%) |
| $800 to $1,499 | 2,440 (19.3%) | 797 (6.2%) |
| $800 to $1,499 | 6,639 (52.4%) | 1,742 (13.5%) |
| Total | 12,675 (100.0%) | 12,898 (100.0%) |
Health & Disability in Hunt County
Health Insurance Coverage by Age in Hunt County
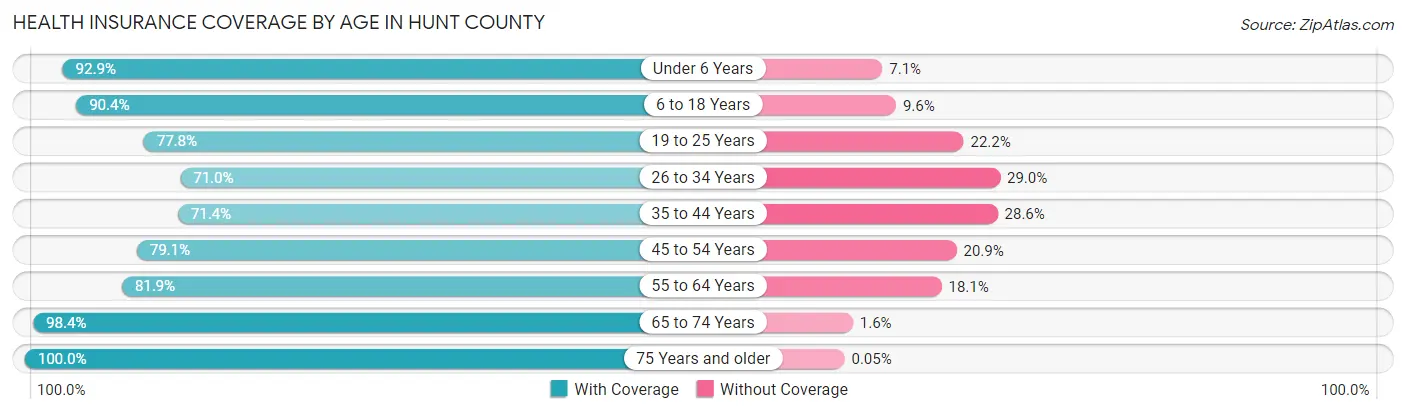
| Age Bracket | With Coverage | Without Coverage |
| Under 6 Years | 7,236 (92.9%) | 553 (7.1%) |
| 6 to 18 Years | 16,332 (90.4%) | 1,743 (9.6%) |
| 19 to 25 Years | 7,432 (77.8%) | 2,126 (22.2%) |
| 26 to 34 Years | 8,505 (71.0%) | 3,481 (29.0%) |
| 35 to 44 Years | 8,411 (71.4%) | 3,368 (28.6%) |
| 45 to 54 Years | 10,029 (79.1%) | 2,655 (20.9%) |
| 55 to 64 Years | 10,801 (81.9%) | 2,394 (18.1%) |
| 65 to 74 Years | 9,337 (98.4%) | 152 (1.6%) |
| 75 Years and older | 6,210 (100.0%) | 3 (0.1%) |
| Total | 84,293 (83.7%) | 16,475 (16.4%) |
Health Insurance Coverage by Citizenship Status in Hunt County
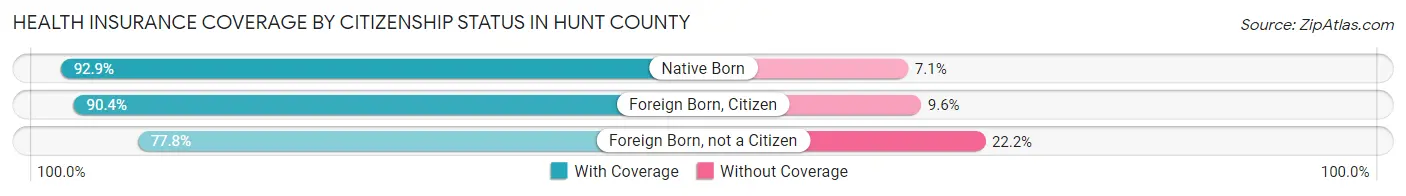
| Citizenship Status | With Coverage | Without Coverage |
| Native Born | 7,236 (92.9%) | 553 (7.1%) |
| Foreign Born, Citizen | 16,332 (90.4%) | 1,743 (9.6%) |
| Foreign Born, not a Citizen | 7,432 (77.8%) | 2,126 (22.2%) |
Health Insurance Coverage by Household Income in Hunt County
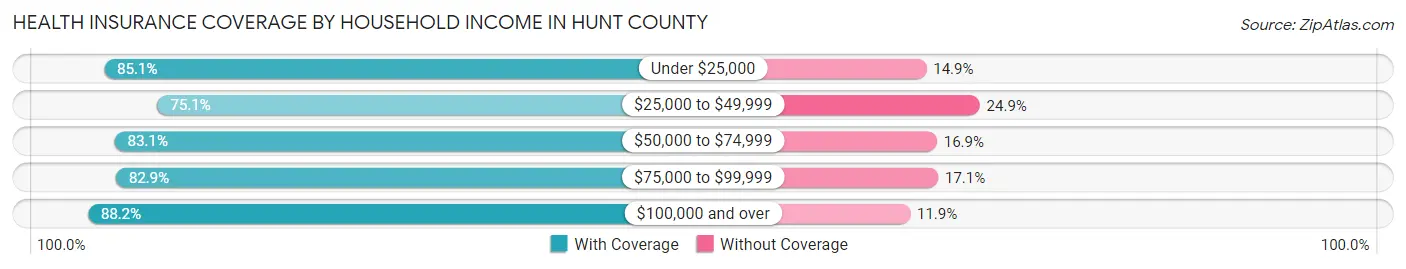
| Household Income | With Coverage | Without Coverage |
| Under $25,000 | 8,701 (85.1%) | 1,522 (14.9%) |
| $25,000 to $49,999 | 13,739 (75.1%) | 4,553 (24.9%) |
| $50,000 to $74,999 | 13,059 (83.1%) | 2,648 (16.9%) |
| $75,000 to $99,999 | 14,744 (82.9%) | 3,040 (17.1%) |
| $100,000 and over | 32,190 (88.1%) | 4,327 (11.8%) |
Public vs Private Health Insurance Coverage by Age in Hunt County
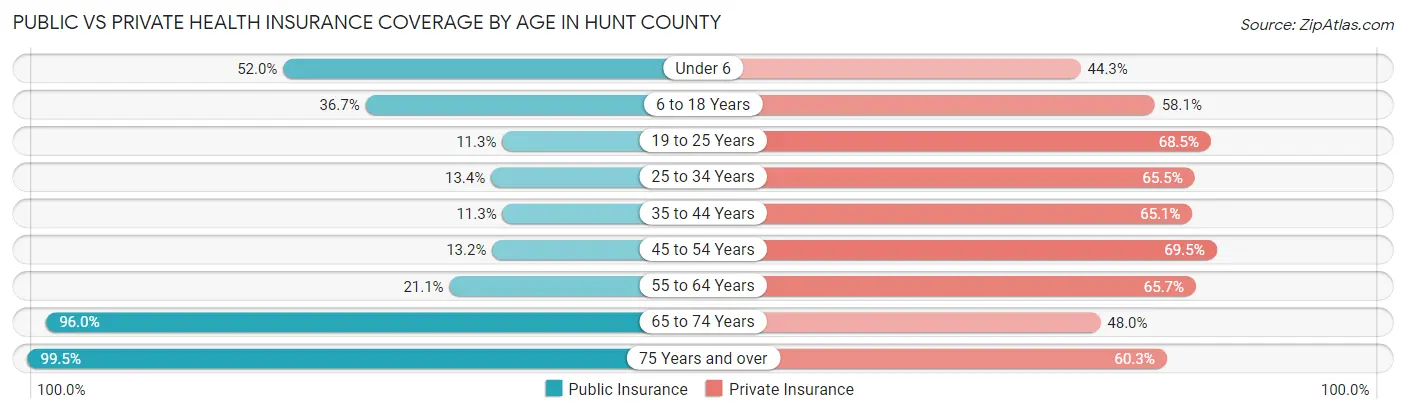
| Age Bracket | Public Insurance | Private Insurance |
| Under 6 | 4,050 (52.0%) | 3,453 (44.3%) |
| 6 to 18 Years | 6,639 (36.7%) | 10,499 (58.1%) |
| 19 to 25 Years | 1,084 (11.3%) | 6,545 (68.5%) |
| 25 to 34 Years | 1,608 (13.4%) | 7,847 (65.5%) |
| 35 to 44 Years | 1,331 (11.3%) | 7,663 (65.1%) |
| 45 to 54 Years | 1,674 (13.2%) | 8,820 (69.5%) |
| 55 to 64 Years | 2,789 (21.1%) | 8,670 (65.7%) |
| 65 to 74 Years | 9,108 (96.0%) | 4,554 (48.0%) |
| 75 Years and over | 6,179 (99.5%) | 3,745 (60.3%) |
| Total | 34,462 (34.2%) | 61,796 (61.3%) |
Disability Status by Sex by Age in Hunt County
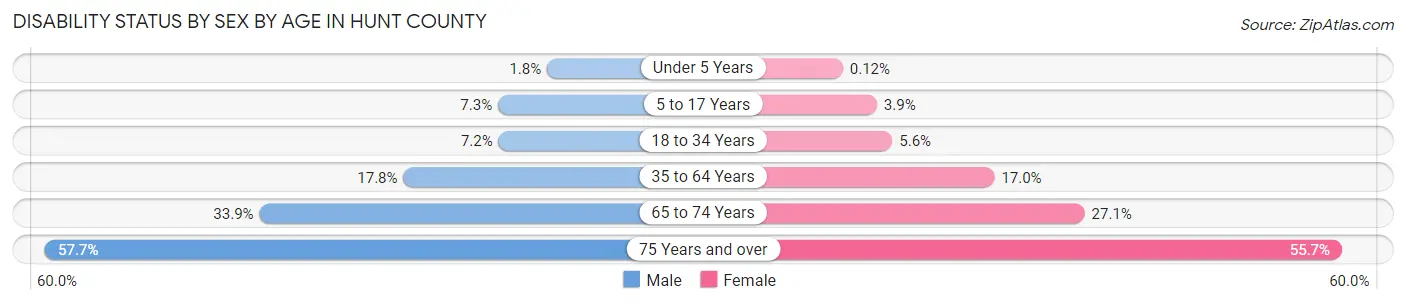
| Age Bracket | Male | Female |
| Under 5 Years | 56 (1.8%) | 4 (0.1%) |
| 5 to 17 Years | 661 (7.3%) | 343 (3.9%) |
| 18 to 34 Years | 830 (7.2%) | 661 (5.6%) |
| 35 to 64 Years | 3,327 (17.8%) | 3,228 (17.0%) |
| 65 to 74 Years | 1,519 (33.9%) | 1,353 (27.1%) |
| 75 Years and over | 1,593 (57.7%) | 1,923 (55.7%) |
Disability Class by Sex by Age in Hunt County
Disability Class: Hearing Difficulty
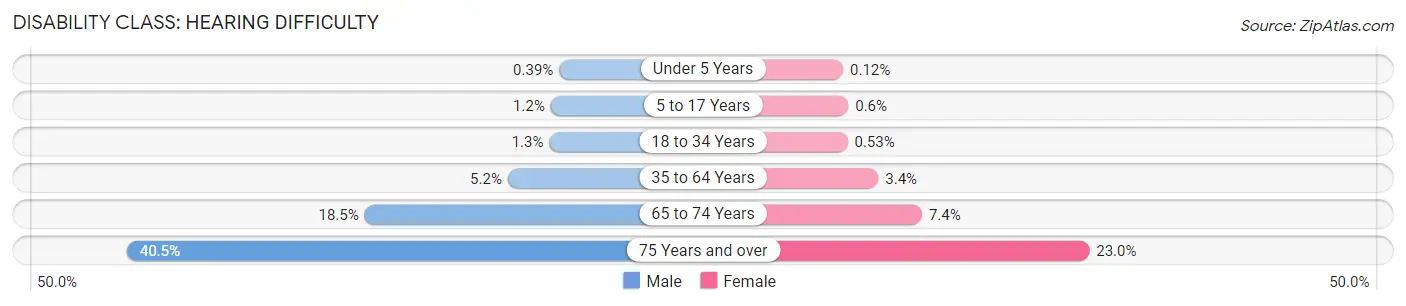
| Age Bracket | Male | Female |
| Under 5 Years | 12 (0.4%) | 4 (0.1%) |
| 5 to 17 Years | 106 (1.2%) | 53 (0.6%) |
| 18 to 34 Years | 150 (1.3%) | 62 (0.5%) |
| 35 to 64 Years | 963 (5.2%) | 643 (3.4%) |
| 65 to 74 Years | 828 (18.4%) | 372 (7.4%) |
| 75 Years and over | 1,118 (40.5%) | 793 (23.0%) |
Disability Class: Vision Difficulty
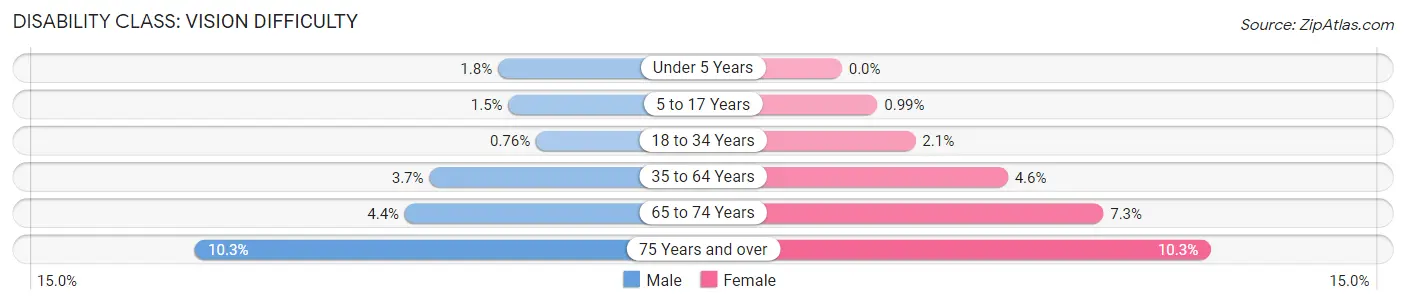
| Age Bracket | Male | Female |
| Under 5 Years | 56 (1.8%) | 0 (0.0%) |
| 5 to 17 Years | 139 (1.5%) | 87 (1.0%) |
| 18 to 34 Years | 87 (0.8%) | 241 (2.1%) |
| 35 to 64 Years | 696 (3.7%) | 878 (4.6%) |
| 65 to 74 Years | 198 (4.4%) | 364 (7.3%) |
| 75 Years and over | 283 (10.2%) | 354 (10.2%) |
Disability Class: Cognitive Difficulty
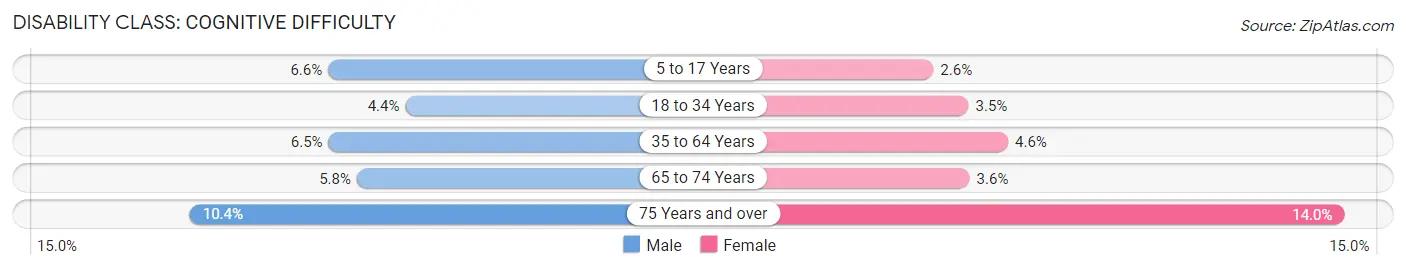
| Age Bracket | Male | Female |
| 5 to 17 Years | 595 (6.6%) | 224 (2.5%) |
| 18 to 34 Years | 506 (4.4%) | 414 (3.5%) |
| 35 to 64 Years | 1,222 (6.5%) | 879 (4.6%) |
| 65 to 74 Years | 258 (5.8%) | 178 (3.6%) |
| 75 Years and over | 287 (10.4%) | 483 (14.0%) |
Disability Class: Ambulatory Difficulty
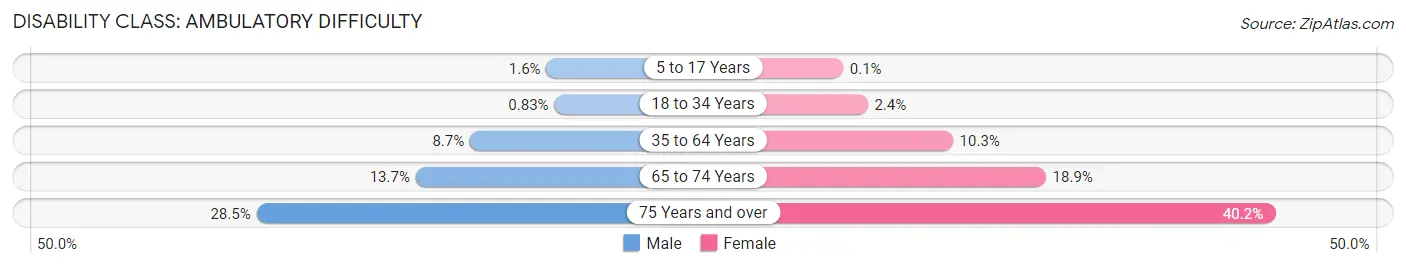
| Age Bracket | Male | Female |
| 5 to 17 Years | 143 (1.6%) | 9 (0.1%) |
| 18 to 34 Years | 96 (0.8%) | 280 (2.4%) |
| 35 to 64 Years | 1,617 (8.7%) | 1,954 (10.3%) |
| 65 to 74 Years | 615 (13.7%) | 946 (18.9%) |
| 75 Years and over | 786 (28.5%) | 1,388 (40.2%) |
Disability Class: Self-Care Difficulty
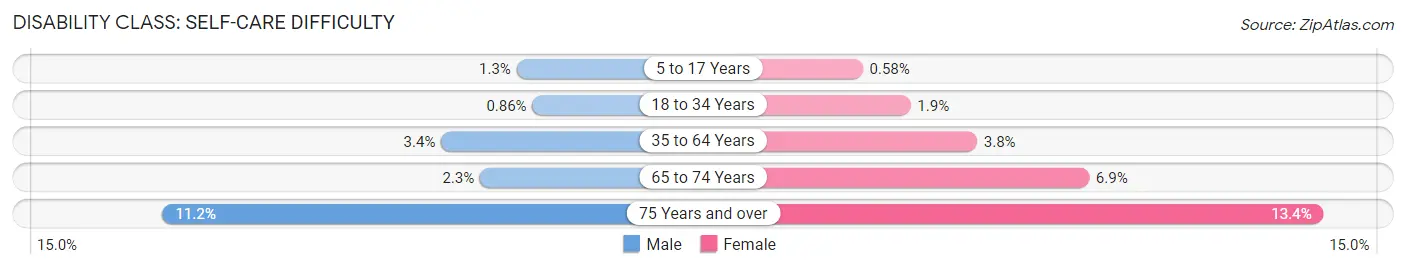
| Age Bracket | Male | Female |
| 5 to 17 Years | 118 (1.3%) | 51 (0.6%) |
| 18 to 34 Years | 99 (0.9%) | 224 (1.9%) |
| 35 to 64 Years | 634 (3.4%) | 713 (3.8%) |
| 65 to 74 Years | 104 (2.3%) | 344 (6.9%) |
| 75 Years and over | 308 (11.2%) | 463 (13.4%) |
Technology Access in Hunt County
Computing Device Access in Hunt County
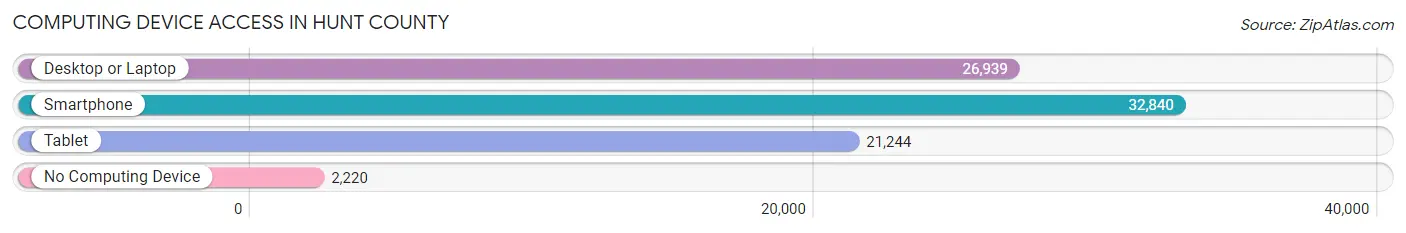
| Device Type | # Households | % Households |
| Desktop or Laptop | 26,939 | 73.7% |
| Smartphone | 32,840 | 89.8% |
| Tablet | 21,244 | 58.1% |
| No Computing Device | 2,220 | 6.1% |
| Total | 36,560 | 100.0% |
Internet Access in Hunt County
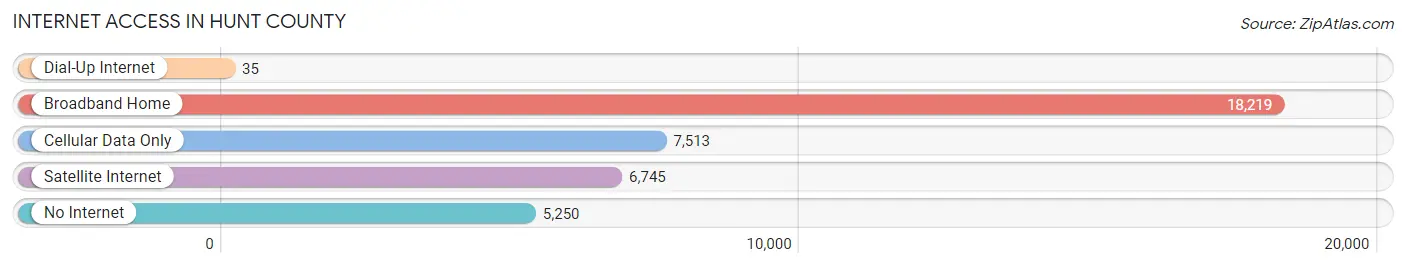
| Internet Type | # Households | % Households |
| Dial-Up Internet | 35 | 0.1% |
| Broadband Home | 18,219 | 49.8% |
| Cellular Data Only | 7,513 | 20.5% |
| Satellite Internet | 6,745 | 18.4% |
| No Internet | 5,250 | 14.4% |
| Total | 36,560 | 100.0% |
Hunt County Summary
History
Hunt County, Texas is located in the northeastern part of the state and is part of the Dallas-Fort Worth-Arlington metropolitan area. It was established in 1846 and named after Memucan Hunt, Jr., a soldier in the Texas Revolution. The county seat is Greenville, which was founded in 1846 and is the largest city in the county.
The area that is now Hunt County was originally inhabited by the Caddo Indians. The first European settlers arrived in the area in the early 1840s, and the county was officially established in 1846. The county was largely agricultural in its early years, with cotton and corn being the main crops.
In the late 19th century, the county began to experience an economic boom due to the discovery of oil and natural gas. This led to the development of several towns, including Commerce, Wolfe City, and Campbell. The county also experienced a population boom, with the population increasing from 8,000 in 1900 to over 20,000 by 1930.
The county continued to experience growth in the 20th century, with the population reaching over 50,000 by the year 2000. The county has also seen an increase in industry, with several manufacturing plants located in the area.
Geography
Hunt County is located in the northeastern part of Texas and is bordered by Collin County to the north, Rockwall County to the east, Kaufman County to the south, and Delta County to the west. The county covers an area of 845 square miles and is home to several small towns and cities, including Greenville, Commerce, Wolfe City, Campbell, and Quinlan.
The terrain of Hunt County is mostly flat, with some rolling hills in the western part of the county. The county is drained by the Sabine River, which forms the western border of the county. The county also contains several small lakes, including Lake Tawakoni, Lake Fork, and Lake Ray Hubbard.
Economy
Hunt County has a diverse economy, with a mix of agriculture, manufacturing, and services. The county is home to several large manufacturing plants, including a General Motors plant in Greenville and a Tyson Foods plant in Commerce.
Agriculture is also an important part of the county’s economy, with cotton, corn, and hay being the main crops. The county also has a thriving tourism industry, with several popular attractions, including Lake Tawakoni State Park and the Audie Murphy American Cotton Museum.
Demographics
As of the 2010 census, Hunt County had a population of 86,129. The population is fairly evenly split between men and women, with 49.3% male and 50.7% female. The median age is 36.2 years, and the median household income is $50,845.
The racial makeup of the county is 79.2% White, 15.2% Hispanic or Latino, 3.2% African American, 0.7% Asian, and 1.7% other. The largest ancestry groups are English (25.2%), German (17.2%), Irish (14.2%), and Mexican (13.2%).
The county is served by several school districts, including Greenville Independent School District, Commerce Independent School District, and Wolfe City Independent School District. The county is also home to several higher education institutions, including Texas A&M University-Commerce, East Texas Baptist University, and Paris Junior College.
Common Questions
What is Per Capita Income in Hunt County?
Per Capita income in Hunt County is $31,362.
What is the Median Family Income in Hunt County?
Median Family Income in Hunt County is $79,132.
What is the Median Household income in Hunt County?
Median Household Income in Hunt County is $66,885.
What is Income or Wage Gap in Hunt County?
Income or Wage Gap in Hunt County is 31.8%.
Women in Hunt County earn 68.2 cents for every dollar earned by a man.
What is Family Income Deficit in Hunt County?
Family Income Deficit in Hunt County is $9,892.
Families that are below poverty line in Hunt County earn $9,892 less on average than the poverty threshold level.
What is Inequality or Gini Index in Hunt County?
Inequality or Gini Index in Hunt County is 0.43.
What is the Total Population of Hunt County?
Total Population of Hunt County is 101,596.
What is the Total Male Population of Hunt County?
Total Male Population of Hunt County is 50,144.
What is the Total Female Population of Hunt County?
Total Female Population of Hunt County is 51,452.
What is the Ratio of Males per 100 Females in Hunt County?
There are 97.46 Males per 100 Females in Hunt County.
What is the Ratio of Females per 100 Males in Hunt County?
There are 102.61 Females per 100 Males in Hunt County.
What is the Median Population Age in Hunt County?
Median Population Age in Hunt County is 37.6 Years.
What is the Average Family Size in Hunt County
Average Family Size in Hunt County is 3.2 People.
What is the Average Household Size in Hunt County
Average Household Size in Hunt County is 2.7 People.
How Large is the Labor Force in Hunt County?
There are 48,946 People in the Labor Forcein in Hunt County.
What is the Percentage of People in the Labor Force in Hunt County?
61.1% of People are in the Labor Force in Hunt County.
What is the Unemployment Rate in Hunt County?
Unemployment Rate in Hunt County is 5.8%.