Hudspeth County, TX Map & Demographics
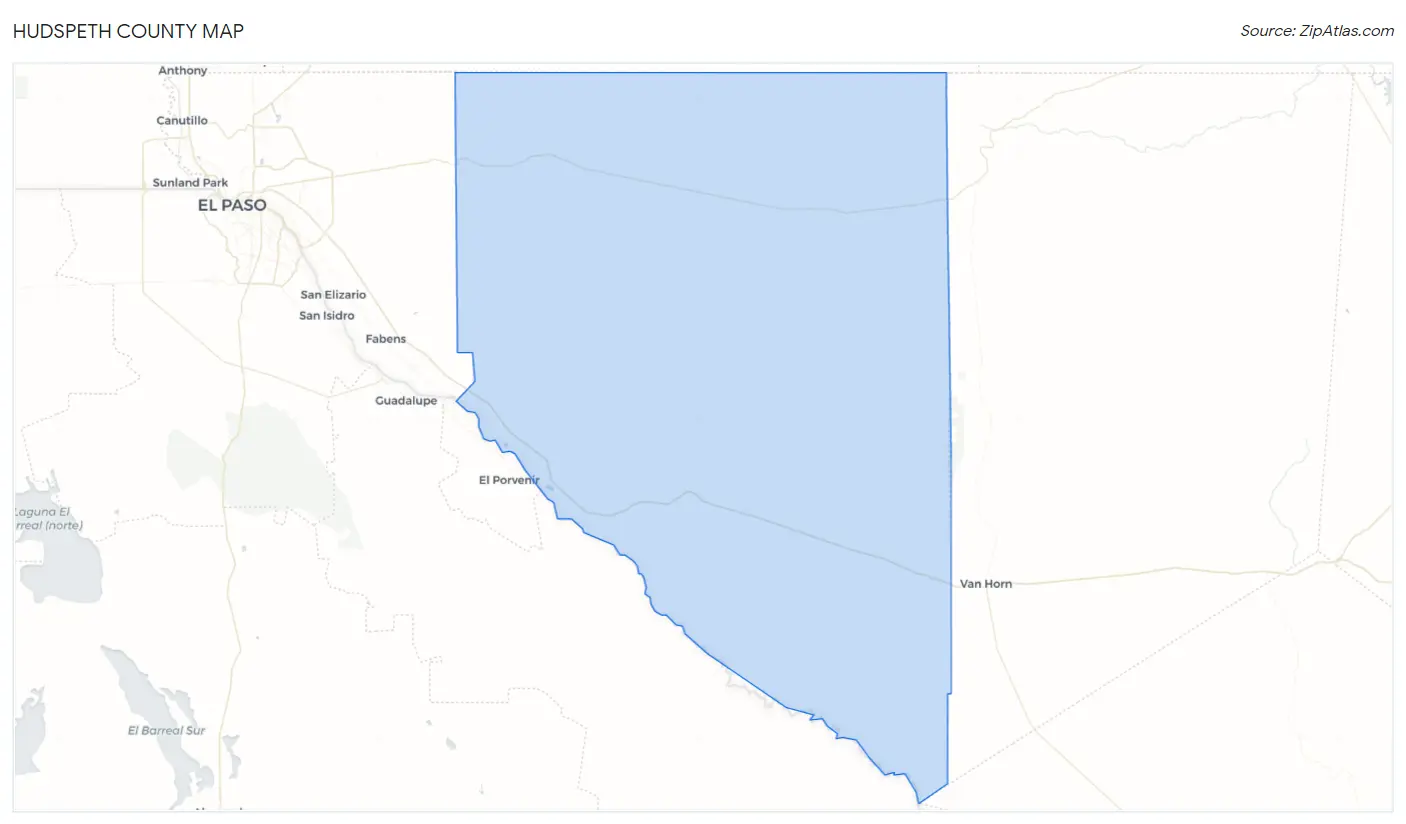
Hudspeth County Map
Hudspeth County Overview
$16,368
PER CAPITA INCOME
$50,125
AVG FAMILY INCOME
$35,163
AVG HOUSEHOLD INCOME
57.3%
WAGE / INCOME GAP [ % ]
42.7¢/ $1
WAGE / INCOME GAP [ $ ]
0.41
INEQUALITY / GINI INDEX
3,329
TOTAL POPULATION
2,027
MALE POPULATION
1,302
FEMALE POPULATION
155.68
MALES / 100 FEMALES
64.23
FEMALES / 100 MALES
32.1
MEDIAN AGE
3.4
AVG FAMILY SIZE
2.7
AVG HOUSEHOLD SIZE
1,053
LABOR FORCE [ PEOPLE ]
36.6%
PERCENT IN LABOR FORCE
8.2%
UNEMPLOYMENT RATE
Hudspeth County Area Codes
Income in Hudspeth County
Income Overview in Hudspeth County
Per Capita Income in Hudspeth County is $16,368, while median incomes of families and households are $50,125 and $35,163 respectively.
| Characteristic | Number | Measure |
| Per Capita Income | 3,329 | $16,368 |
| Median Family Income | 629 | $50,125 |
| Mean Family Income | 629 | $54,864 |
| Median Household Income | 890 | $35,163 |
| Mean Household Income | 890 | $45,286 |
| Income Deficit | 629 | $0 |
| Wage / Income Gap (%) | 3,329 | 57.28% |
| Wage / Income Gap ($) | 3,329 | 42.72¢ per $1 |
| Gini / Inequality Index | 3,329 | 0.41 |
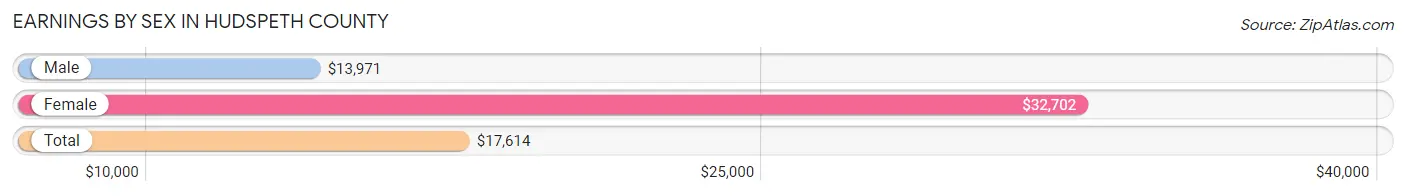
Earnings by Sex in Hudspeth County
Average Earnings in Hudspeth County are $17,614, $13,971 for men and $32,702 for women, a difference of 57.3%.
| Sex | Number | Average Earnings |
| Male | 1,186 (69.6%) | $13,971 |
| Female | 517 (30.4%) | $32,702 |
| Total | 1,703 (100.0%) | $17,614 |
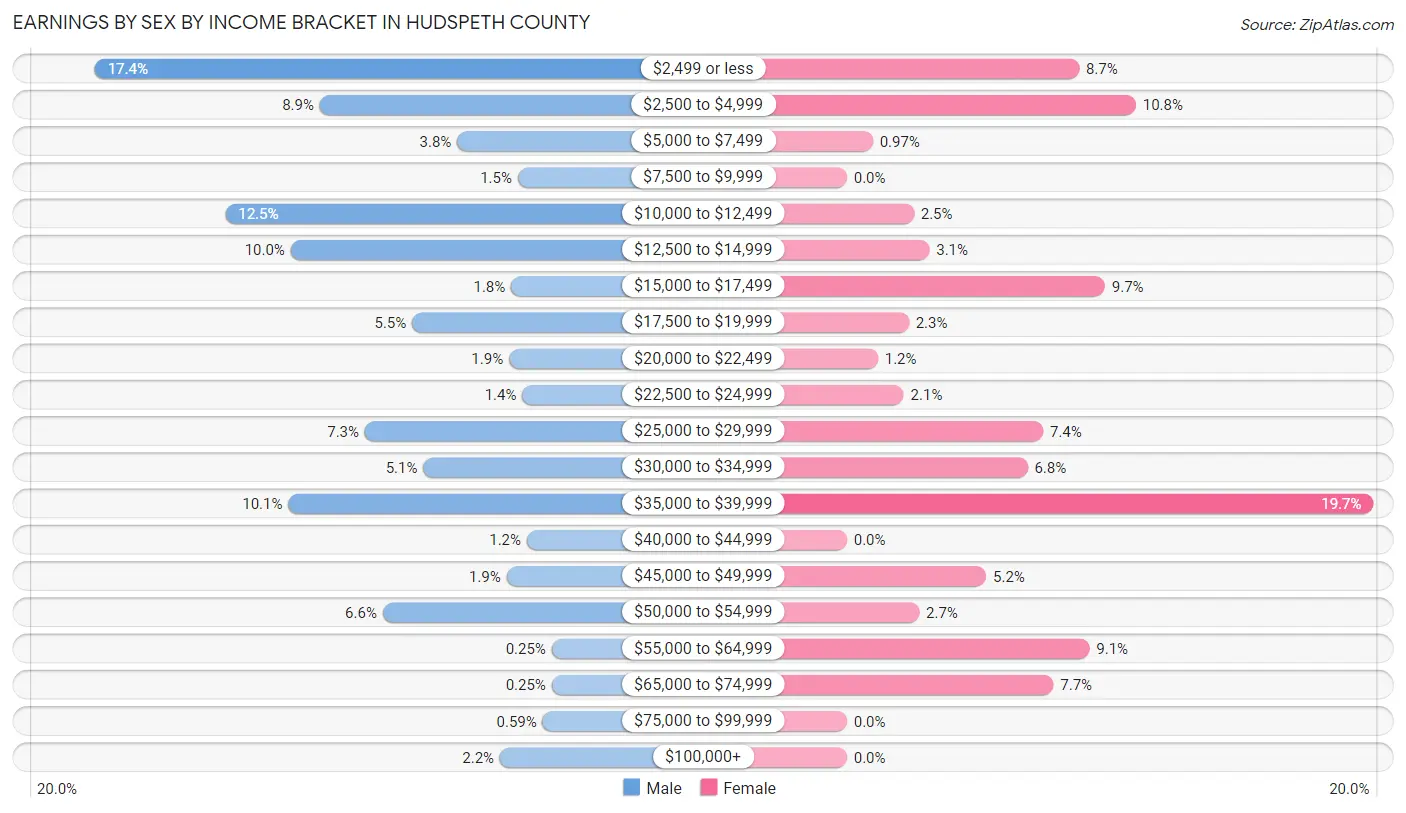
Earnings by Sex by Income Bracket in Hudspeth County
The most common earnings brackets in Hudspeth County are $2,499 or less for men (206 | 17.4%) and $35,000 to $39,999 for women (102 | 19.7%).
| Income | Male | Female |
| $2,499 or less | 206 (17.4%) | 45 (8.7%) |
| $2,500 to $4,999 | 106 (8.9%) | 56 (10.8%) |
| $5,000 to $7,499 | 45 (3.8%) | 5 (1.0%) |
| $7,500 to $9,999 | 18 (1.5%) | 0 (0.0%) |
| $10,000 to $12,499 | 148 (12.5%) | 13 (2.5%) |
| $12,500 to $14,999 | 119 (10.0%) | 16 (3.1%) |
| $15,000 to $17,499 | 21 (1.8%) | 50 (9.7%) |
| $17,500 to $19,999 | 65 (5.5%) | 12 (2.3%) |
| $20,000 to $22,499 | 22 (1.8%) | 6 (1.2%) |
| $22,500 to $24,999 | 16 (1.3%) | 11 (2.1%) |
| $25,000 to $29,999 | 86 (7.2%) | 38 (7.3%) |
| $30,000 to $34,999 | 60 (5.1%) | 35 (6.8%) |
| $35,000 to $39,999 | 120 (10.1%) | 102 (19.7%) |
| $40,000 to $44,999 | 14 (1.2%) | 0 (0.0%) |
| $45,000 to $49,999 | 23 (1.9%) | 27 (5.2%) |
| $50,000 to $54,999 | 78 (6.6%) | 14 (2.7%) |
| $55,000 to $64,999 | 3 (0.3%) | 47 (9.1%) |
| $65,000 to $74,999 | 3 (0.3%) | 40 (7.7%) |
| $75,000 to $99,999 | 7 (0.6%) | 0 (0.0%) |
| $100,000+ | 26 (2.2%) | 0 (0.0%) |
| Total | 1,186 (100.0%) | 517 (100.0%) |
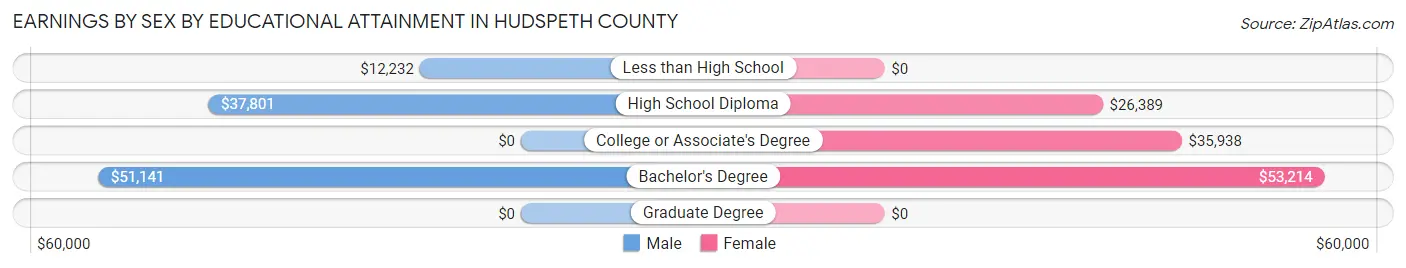
Earnings by Sex by Educational Attainment in Hudspeth County
Average earnings in Hudspeth County are $18,365 for men and $27,368 for women, a difference of 32.9%. Men with an educational attainment of bachelor's degree enjoy the highest average annual earnings of $51,141, while those with less than high school education earn the least with $12,232. Women with an educational attainment of bachelor's degree earn the most with the average annual earnings of $53,214, while those with high school diploma education have the smallest earnings of $26,389.
| Educational Attainment | Male Income | Female Income |
| Less than High School | $12,232 | $0 |
| High School Diploma | $37,801 | $26,389 |
| College or Associate's Degree | - | - |
| Bachelor's Degree | $51,141 | $53,214 |
| Graduate Degree | - | - |
| Total | $18,365 | $27,368 |
Family Income in Hudspeth County
Family Income Brackets in Hudspeth County
According to the Hudspeth County family income data, there are 208 families falling into the $50,000 to $74,999 income range, which is the most common income bracket and makes up 33.1% of all families.
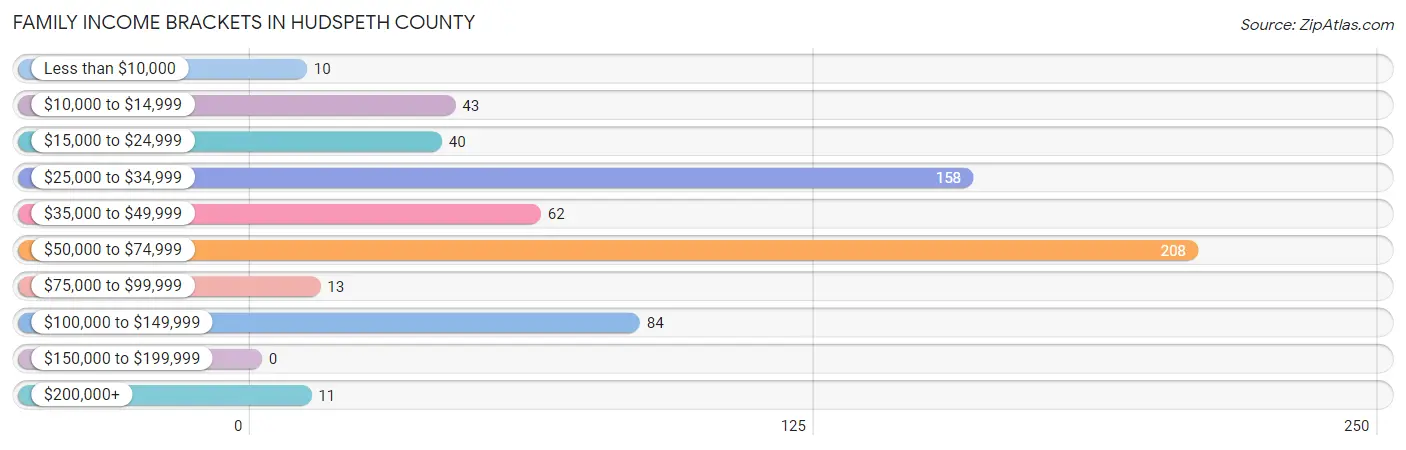
| Income Bracket | # Families | % Families |
| Less than $10,000 | 10 | 1.6% |
| $10,000 to $14,999 | 43 | 6.8% |
| $15,000 to $24,999 | 40 | 6.4% |
| $25,000 to $34,999 | 158 | 25.1% |
| $35,000 to $49,999 | 62 | 9.9% |
| $50,000 to $74,999 | 208 | 33.1% |
| $75,000 to $99,999 | 13 | 2.1% |
| $100,000 to $149,999 | 84 | 13.4% |
| $150,000 to $199,999 | 0 | 0.0% |
| $200,000+ | 11 | 1.7% |
Family Income by Famaliy Size in Hudspeth County
2-person families (314 | 49.9%) account for the highest median family income in Hudspeth County with $52,917 per family, while 2-person families (314 | 49.9%) have the highest median income of $26,458 per family member.
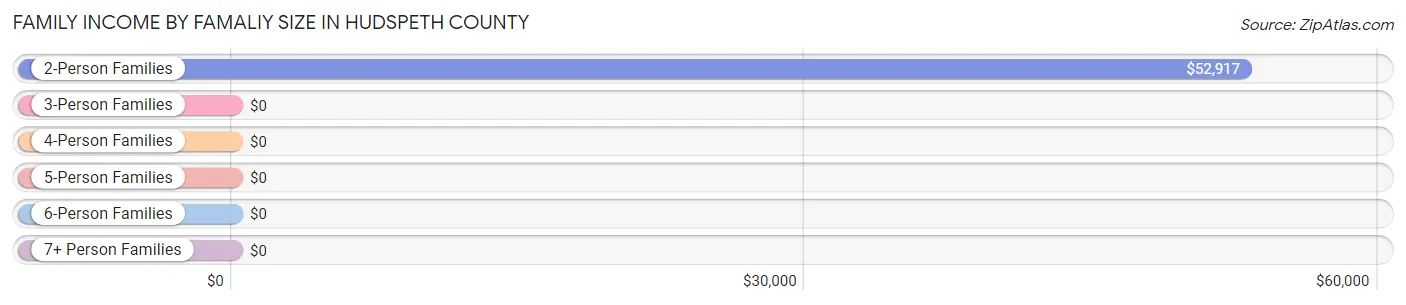
| Income Bracket | # Families | Median Income |
| 2-Person Families | 314 (49.9%) | $52,917 |
| 3-Person Families | 116 (18.4%) | $0 |
| 4-Person Families | 138 (21.9%) | $0 |
| 5-Person Families | 53 (8.4%) | $0 |
| 6-Person Families | 8 (1.3%) | $0 |
| 7+ Person Families | 0 (0.0%) | $0 |
| Total | 629 (100.0%) | $50,125 |
Family Income by Number of Earners in Hudspeth County
The median family income in Hudspeth County is $50,125, with families comprising 2 earners (171) having the highest median family income of $89,250, while families with no earners (135) have the lowest median family income of $32,917, accounting for 27.2% and 21.5% of families, respectively.
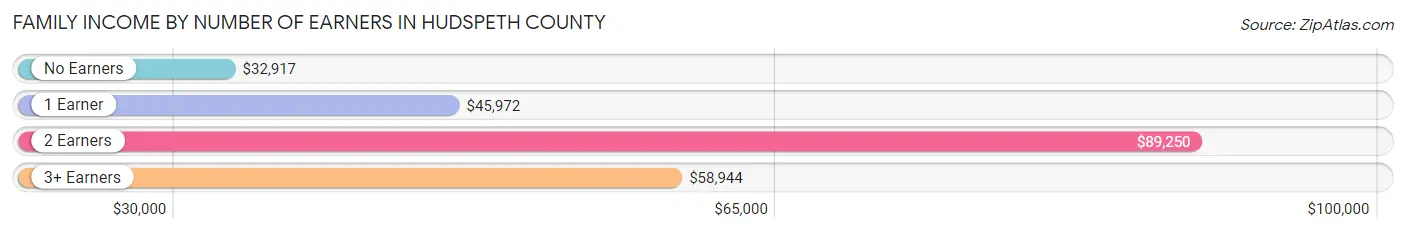
| Number of Earners | # Families | Median Income |
| No Earners | 135 (21.5%) | $32,917 |
| 1 Earner | 271 (43.1%) | $45,972 |
| 2 Earners | 171 (27.2%) | $89,250 |
| 3+ Earners | 52 (8.3%) | $58,944 |
| Total | 629 (100.0%) | $50,125 |
Household Income in Hudspeth County
Household Income Brackets in Hudspeth County
With 233 households falling in the category, the $50,000 to $74,999 income range is the most frequent in Hudspeth County, accounting for 26.2% of all households. In contrast, only 1 households (0.1%) fall into the $150,000 to $199,999 income bracket, making it the least populous group.
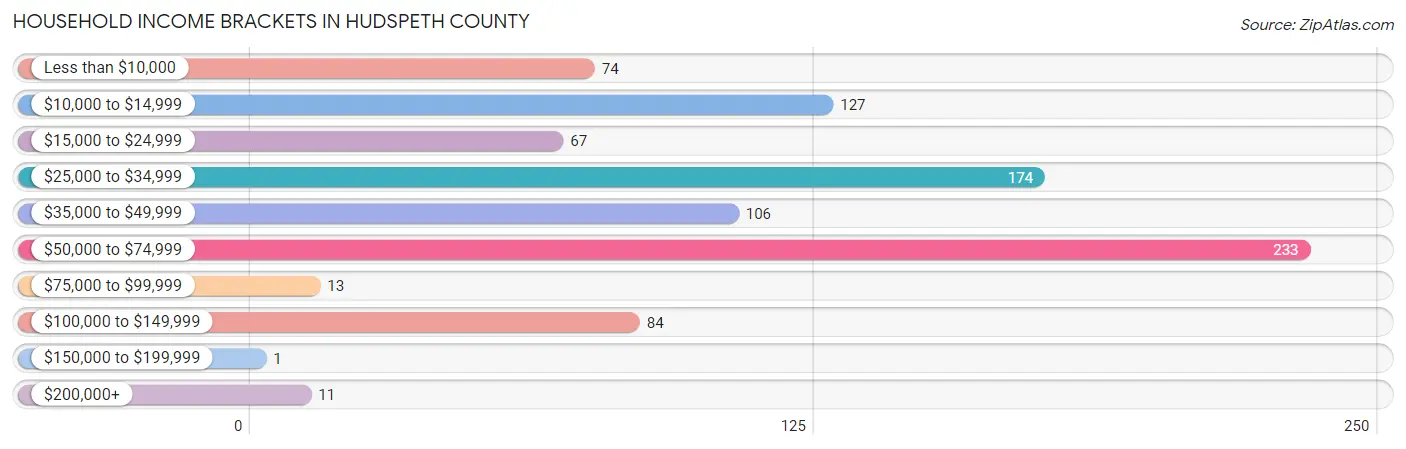
| Income Bracket | # Households | % Households |
| Less than $10,000 | 74 | 8.3% |
| $10,000 to $14,999 | 127 | 14.3% |
| $15,000 to $24,999 | 67 | 7.5% |
| $25,000 to $34,999 | 174 | 19.6% |
| $35,000 to $49,999 | 106 | 11.9% |
| $50,000 to $74,999 | 233 | 26.2% |
| $75,000 to $99,999 | 13 | 1.5% |
| $100,000 to $149,999 | 84 | 9.4% |
| $150,000 to $199,999 | 1 | 0.1% |
| $200,000+ | 11 | 1.2% |
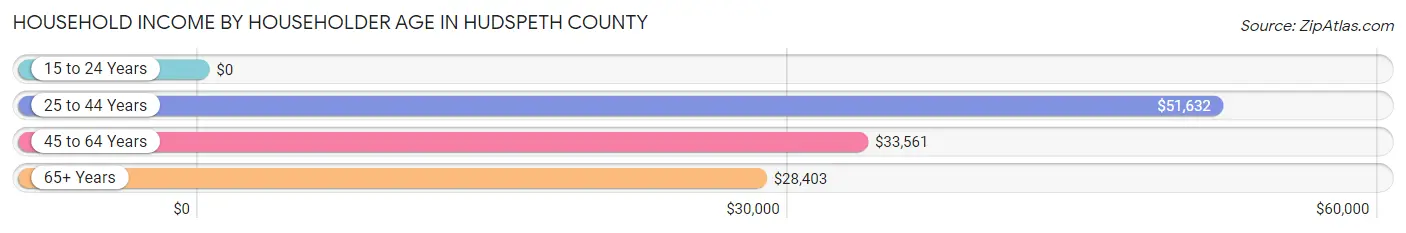
Household Income by Householder Age in Hudspeth County
The median household income in Hudspeth County is $35,163, with the highest median household income of $51,632 found in the 25 to 44 years age bracket for the primary householder. A total of 275 households (30.9%) fall into this category. Meanwhile, the 15 to 24 years age bracket for the primary householder has the lowest median household income of $0, with 78 households (8.8%) in this group.
| Income Bracket | # Households | Median Income |
| 15 to 24 Years | 78 (8.8%) | $0 |
| 25 to 44 Years | 275 (30.9%) | $51,632 |
| 45 to 64 Years | 288 (32.4%) | $33,561 |
| 65+ Years | 249 (28.0%) | $28,403 |
| Total | 890 (100.0%) | $35,163 |
Poverty in Hudspeth County
Income Below Poverty by Sex and Age in Hudspeth County
With 28.3% poverty level for males and 22.4% for females among the residents of Hudspeth County, 18 to 24 year old males and 15 year old females are the most vulnerable to poverty, with 197 males (72.2%) and 21 females (91.3%) in their respective age groups living below the poverty level.
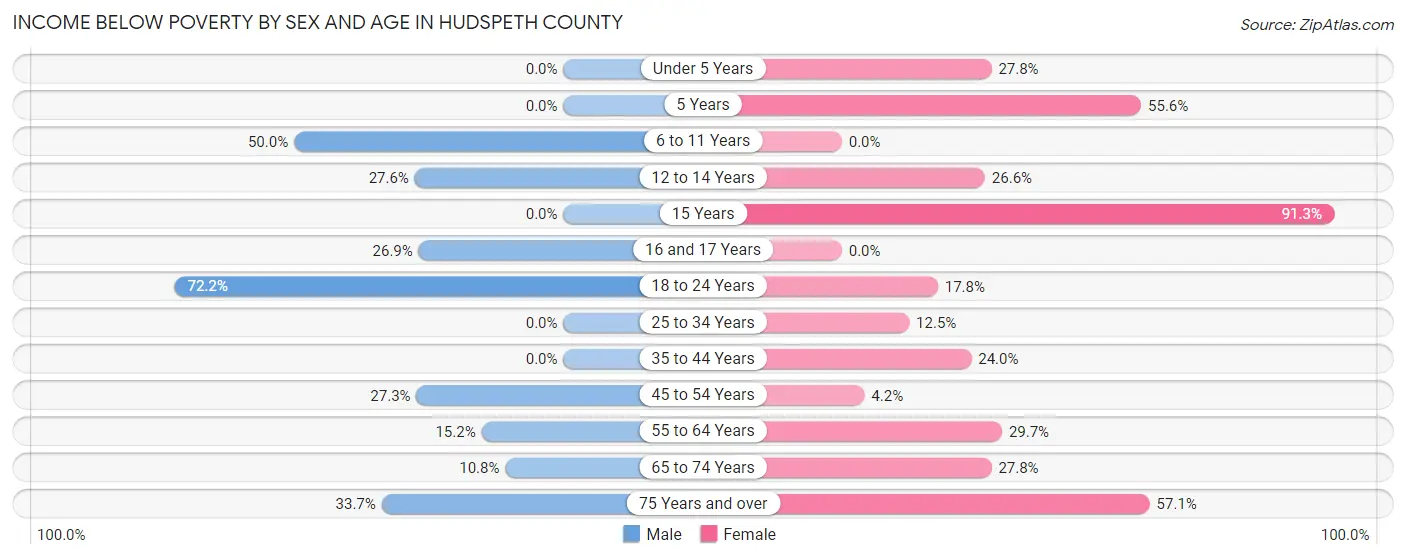
| Age Bracket | Male | Female |
| Under 5 Years | 0 (0.0%) | 30 (27.8%) |
| 5 Years | 0 (0.0%) | 15 (55.6%) |
| 6 to 11 Years | 32 (50.0%) | 0 (0.0%) |
| 12 to 14 Years | 16 (27.6%) | 17 (26.6%) |
| 15 Years | 0 (0.0%) | 21 (91.3%) |
| 16 and 17 Years | 18 (26.9%) | 0 (0.0%) |
| 18 to 24 Years | 197 (72.2%) | 18 (17.8%) |
| 25 to 34 Years | 0 (0.0%) | 17 (12.5%) |
| 35 to 44 Years | 0 (0.0%) | 37 (24.0%) |
| 45 to 54 Years | 45 (27.3%) | 6 (4.2%) |
| 55 to 64 Years | 12 (15.2%) | 33 (29.7%) |
| 65 to 74 Years | 11 (10.8%) | 35 (27.8%) |
| 75 Years and over | 28 (33.7%) | 32 (57.1%) |
| Total | 359 (28.3%) | 261 (22.4%) |
Income Above Poverty by Sex and Age in Hudspeth County
According to the poverty statistics in Hudspeth County, males aged under 5 years and females aged 6 to 11 years are the age groups that are most secure financially, with 100.0% of males and 100.0% of females in these age groups living above the poverty line.
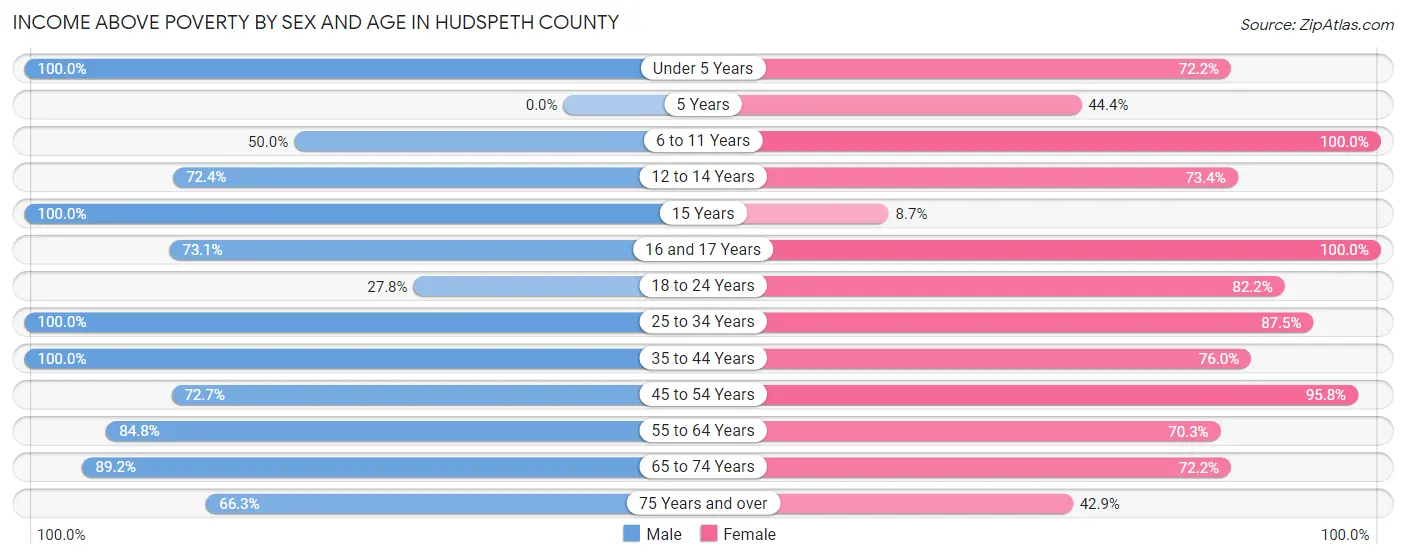
| Age Bracket | Male | Female |
| Under 5 Years | 17 (100.0%) | 78 (72.2%) |
| 5 Years | 0 (0.0%) | 12 (44.4%) |
| 6 to 11 Years | 32 (50.0%) | 72 (100.0%) |
| 12 to 14 Years | 42 (72.4%) | 47 (73.4%) |
| 15 Years | 20 (100.0%) | 2 (8.7%) |
| 16 and 17 Years | 49 (73.1%) | 46 (100.0%) |
| 18 to 24 Years | 76 (27.8%) | 83 (82.2%) |
| 25 to 34 Years | 212 (100.0%) | 119 (87.5%) |
| 35 to 44 Years | 130 (100.0%) | 117 (76.0%) |
| 45 to 54 Years | 120 (72.7%) | 137 (95.8%) |
| 55 to 64 Years | 67 (84.8%) | 78 (70.3%) |
| 65 to 74 Years | 91 (89.2%) | 91 (72.2%) |
| 75 Years and over | 55 (66.3%) | 24 (42.9%) |
| Total | 911 (71.7%) | 906 (77.6%) |
Income Below Poverty Among Married-Couple Families in Hudspeth County
The poverty statistics for married-couple families in Hudspeth County show that 12.0% or 48 of the total 401 families live below the poverty line. Families with 1 or 2 children have the highest poverty rate of 23.0%, comprising of 29 families. On the other hand, families with 3 or 4 children have the lowest poverty rate of 0.0%, which includes 0 families.
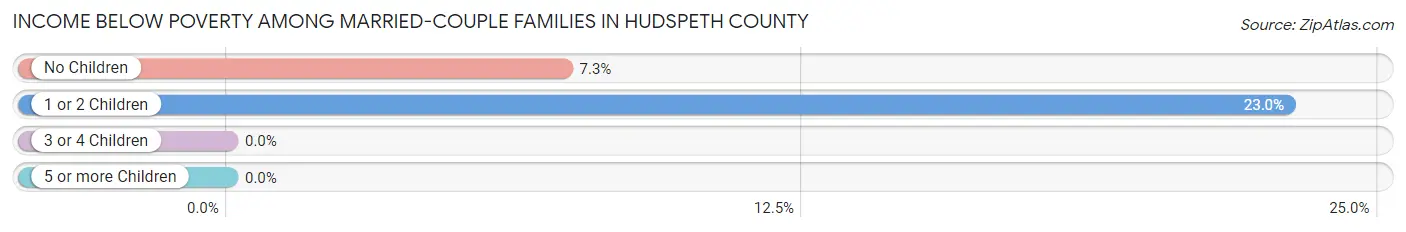
| Children | Above Poverty | Below Poverty |
| No Children | 242 (92.7%) | 19 (7.3%) |
| 1 or 2 Children | 97 (77.0%) | 29 (23.0%) |
| 3 or 4 Children | 14 (100.0%) | 0 (0.0%) |
| 5 or more Children | 0 (0.0%) | 0 (0.0%) |
| Total | 353 (88.0%) | 48 (12.0%) |
Income Below Poverty Among Single-Parent Households in Hudspeth County
According to the poverty data in Hudspeth County, 64.5% or 49 single-father households and 29.6% or 45 single-mother households are living below the poverty line. Among single-father households, those with 1 or 2 children have the highest poverty rate, with 49 households (75.4%) experiencing poverty. Likewise, among single-mother households, those with 3 or 4 children have the highest poverty rate, with 31 households (100.0%) falling below the poverty line.
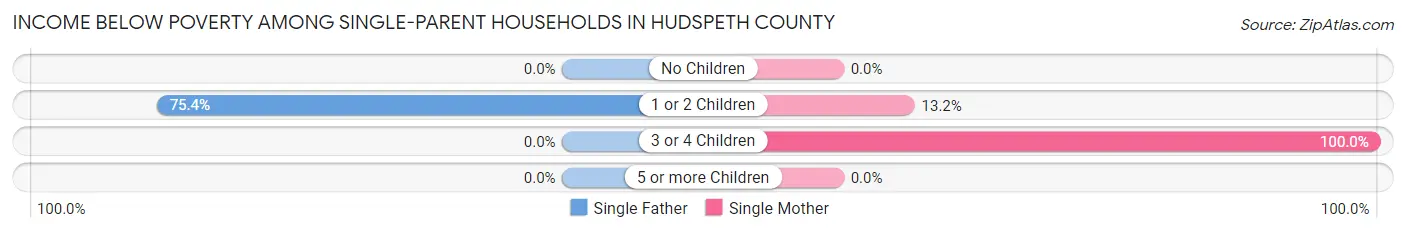
| Children | Single Father | Single Mother |
| No Children | 0 (0.0%) | 0 (0.0%) |
| 1 or 2 Children | 49 (75.4%) | 14 (13.2%) |
| 3 or 4 Children | 0 (0.0%) | 31 (100.0%) |
| 5 or more Children | 0 (0.0%) | 0 (0.0%) |
| Total | 49 (64.5%) | 45 (29.6%) |
Income Below Poverty Among Married-Couple vs Single-Parent Households in Hudspeth County
The poverty data for Hudspeth County shows that 48 of the married-couple family households (12.0%) and 94 of the single-parent households (41.2%) are living below the poverty level. Within the married-couple family households, those with 1 or 2 children have the highest poverty rate, with 29 households (23.0%) falling below the poverty line. Among the single-parent households, those with 3 or 4 children have the highest poverty rate, with 31 household (100.0%) living below poverty.
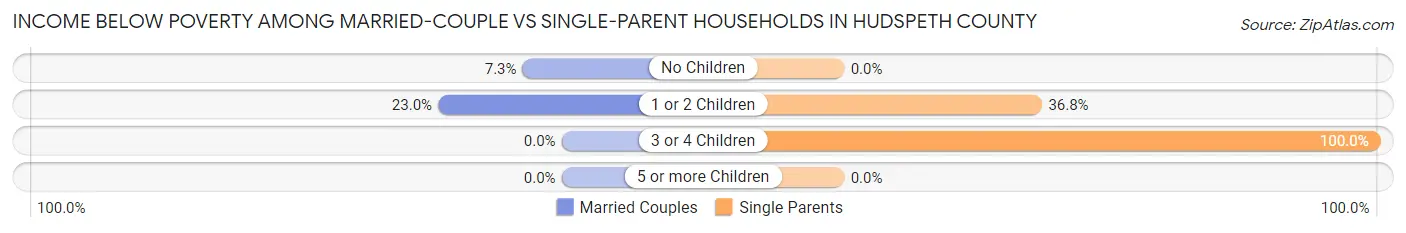
| Children | Married-Couple Families | Single-Parent Households |
| No Children | 19 (7.3%) | 0 (0.0%) |
| 1 or 2 Children | 29 (23.0%) | 63 (36.8%) |
| 3 or 4 Children | 0 (0.0%) | 31 (100.0%) |
| 5 or more Children | 0 (0.0%) | 0 (0.0%) |
| Total | 48 (12.0%) | 94 (41.2%) |
Race in Hudspeth County
The most populous races in Hudspeth County are Hispanic or Latino (2,651 | 79.6%), Two or more Races (1,509 | 45.3%), and White / Caucasian (1,235 | 37.1%).
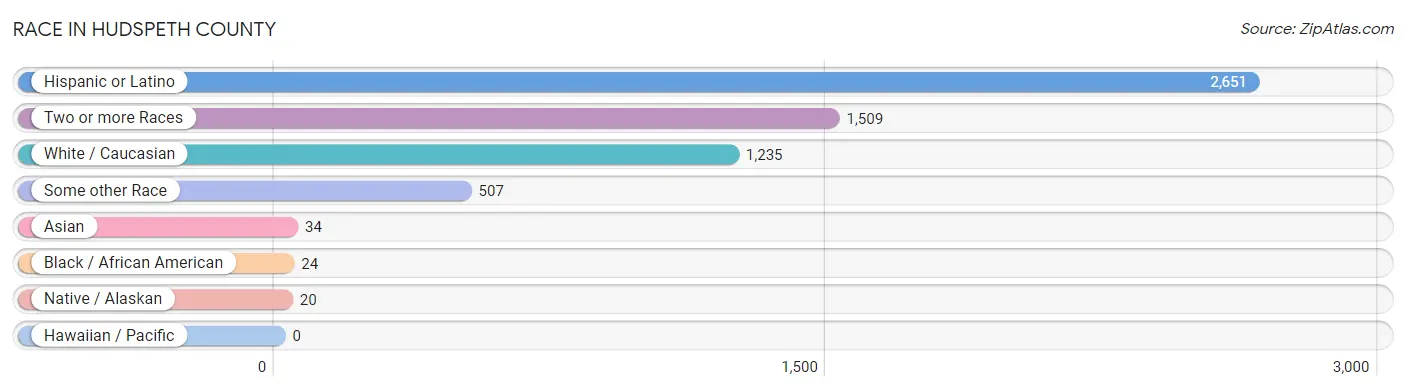
| Race | # Population | % Population |
| Asian | 34 | 1.0% |
| Black / African American | 24 | 0.7% |
| Hawaiian / Pacific | 0 | 0.0% |
| Hispanic or Latino | 2,651 | 79.6% |
| Native / Alaskan | 20 | 0.6% |
| White / Caucasian | 1,235 | 37.1% |
| Two or more Races | 1,509 | 45.3% |
| Some other Race | 507 | 15.2% |
| Total | 3,329 | 100.0% |
Ancestry in Hudspeth County
The most populous ancestries reported in Hudspeth County are Mexican (2,320 | 69.7%), Central American (247 | 7.4%), American (197 | 5.9%), Guatemalan (129 | 3.9%), and Irish (98 | 2.9%), together accounting for 89.8% of all Hudspeth County residents.
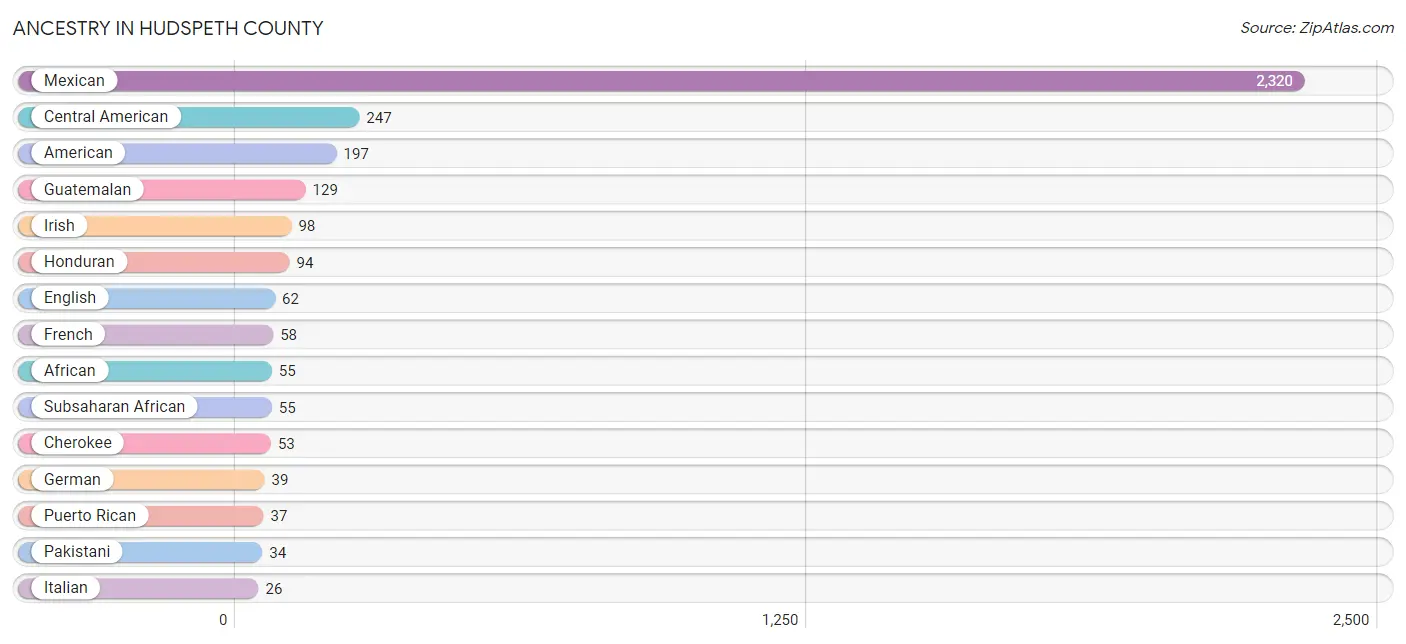
| Ancestry | # Population | % Population |
| African | 55 | 1.7% |
| American | 197 | 5.9% |
| Apache | 5 | 0.2% |
| British | 3 | 0.1% |
| Canadian | 3 | 0.1% |
| Central American | 247 | 7.4% |
| Central American Indian | 19 | 0.6% |
| Cherokee | 53 | 1.6% |
| Crow | 3 | 0.1% |
| Dutch | 14 | 0.4% |
| English | 62 | 1.9% |
| European | 2 | 0.1% |
| French | 58 | 1.7% |
| German | 39 | 1.2% |
| Greek | 2 | 0.1% |
| Guatemalan | 129 | 3.9% |
| Honduran | 94 | 2.8% |
| Irish | 98 | 2.9% |
| Italian | 26 | 0.8% |
| Korean | 3 | 0.1% |
| Mexican | 2,320 | 69.7% |
| Pakistani | 34 | 1.0% |
| Puerto Rican | 37 | 1.1% |
| Salvadoran | 24 | 0.7% |
| Scotch-Irish | 2 | 0.1% |
| Scottish | 2 | 0.1% |
| Spaniard | 7 | 0.2% |
| Spanish | 3 | 0.1% |
| Subsaharan African | 55 | 1.7% |
| Welsh | 10 | 0.3% | View All 30 Rows |
Immigrants in Hudspeth County
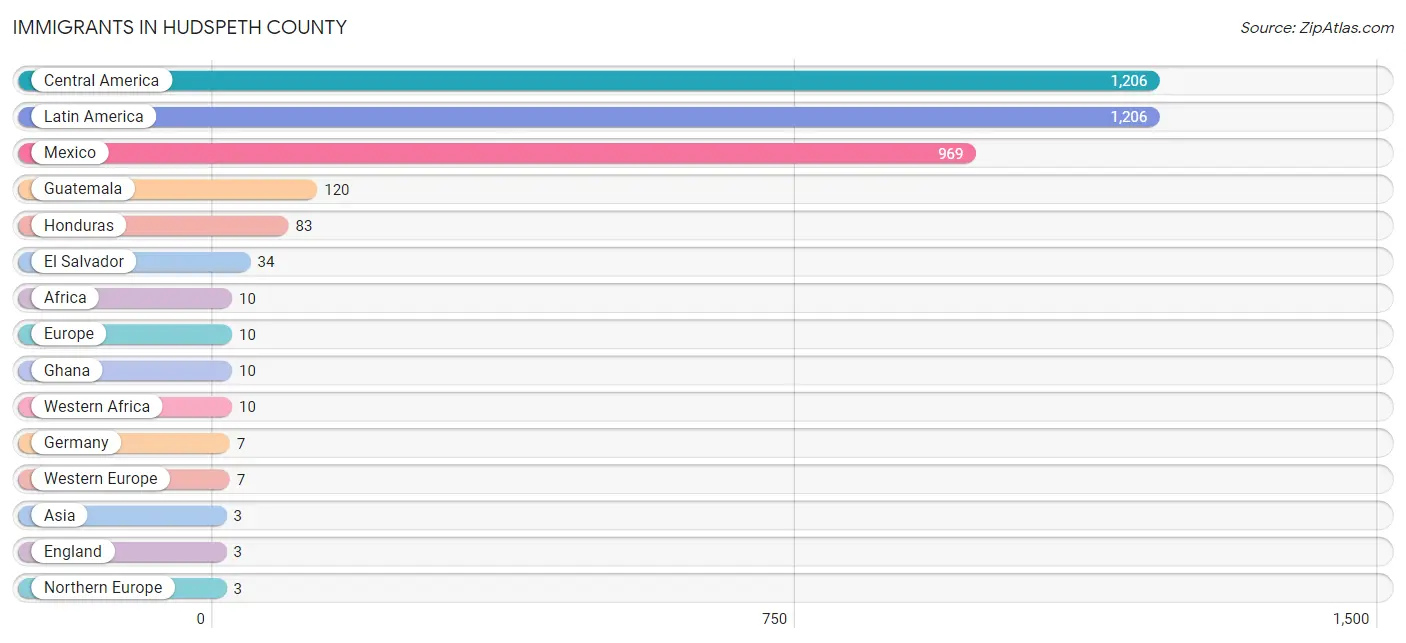
The most numerous immigrant groups reported in Hudspeth County came from Central America (1,206 | 36.2%), Latin America (1,206 | 36.2%), Mexico (969 | 29.1%), Guatemala (120 | 3.6%), and Honduras (83 | 2.5%), together accounting for 107.7% of all Hudspeth County residents.
| Immigration Origin | # Population | % Population |
| Africa | 10 | 0.3% |
| Asia | 3 | 0.1% |
| Central America | 1,206 | 36.2% |
| El Salvador | 34 | 1.0% |
| England | 3 | 0.1% |
| Europe | 10 | 0.3% |
| Germany | 7 | 0.2% |
| Ghana | 10 | 0.3% |
| Guatemala | 120 | 3.6% |
| Honduras | 83 | 2.5% |
| Latin America | 1,206 | 36.2% |
| Mexico | 969 | 29.1% |
| Northern Europe | 3 | 0.1% |
| South Eastern Asia | 3 | 0.1% |
| Western Africa | 10 | 0.3% |
| Western Europe | 7 | 0.2% | View All 16 Rows |
Sex and Age in Hudspeth County
Sex and Age in Hudspeth County
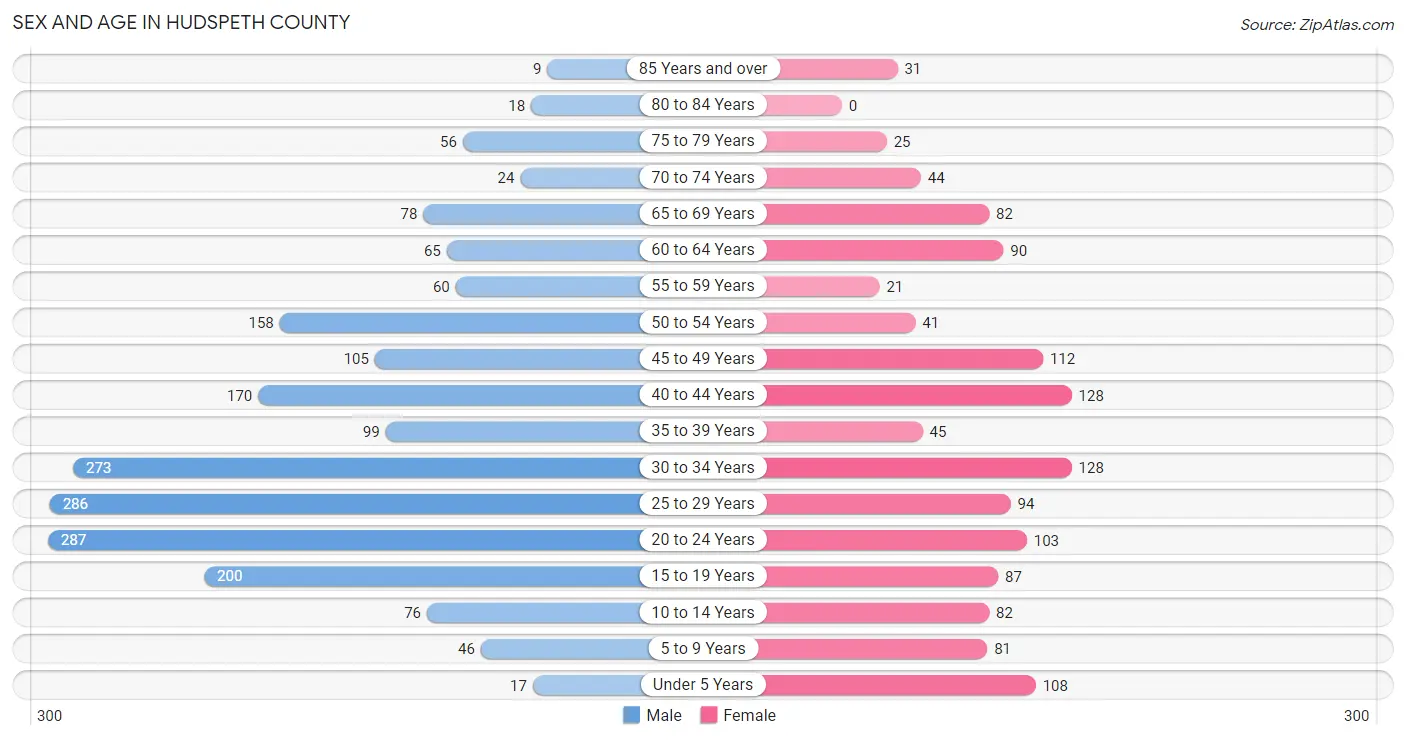
The most populous age groups in Hudspeth County are 20 to 24 Years (287 | 14.2%) for men and 30 to 34 Years (128 | 9.8%) for women.
| Age Bracket | Male | Female |
| Under 5 Years | 17 (0.8%) | 108 (8.3%) |
| 5 to 9 Years | 46 (2.3%) | 81 (6.2%) |
| 10 to 14 Years | 76 (3.7%) | 82 (6.3%) |
| 15 to 19 Years | 200 (9.9%) | 87 (6.7%) |
| 20 to 24 Years | 287 (14.2%) | 103 (7.9%) |
| 25 to 29 Years | 286 (14.1%) | 94 (7.2%) |
| 30 to 34 Years | 273 (13.5%) | 128 (9.8%) |
| 35 to 39 Years | 99 (4.9%) | 45 (3.5%) |
| 40 to 44 Years | 170 (8.4%) | 128 (9.8%) |
| 45 to 49 Years | 105 (5.2%) | 112 (8.6%) |
| 50 to 54 Years | 158 (7.8%) | 41 (3.2%) |
| 55 to 59 Years | 60 (3.0%) | 21 (1.6%) |
| 60 to 64 Years | 65 (3.2%) | 90 (6.9%) |
| 65 to 69 Years | 78 (3.8%) | 82 (6.3%) |
| 70 to 74 Years | 24 (1.2%) | 44 (3.4%) |
| 75 to 79 Years | 56 (2.8%) | 25 (1.9%) |
| 80 to 84 Years | 18 (0.9%) | 0 (0.0%) |
| 85 Years and over | 9 (0.4%) | 31 (2.4%) |
| Total | 2,027 (100.0%) | 1,302 (100.0%) |
Families and Households in Hudspeth County
Median Family Size in Hudspeth County
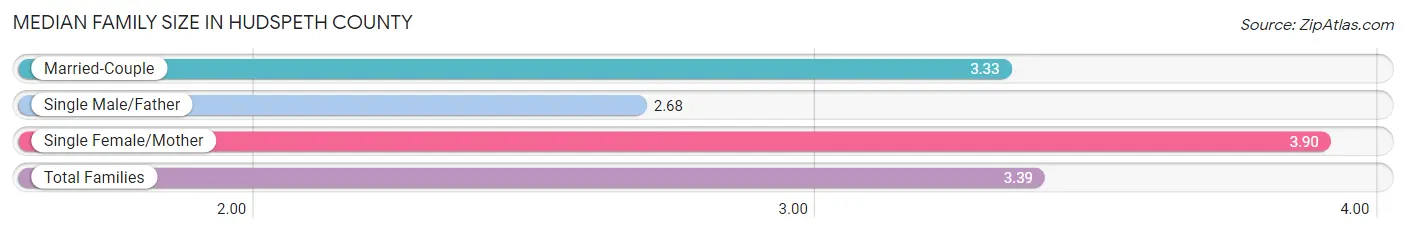
The median family size in Hudspeth County is 3.39 persons per family, with single female/mother families (152 | 24.2%) accounting for the largest median family size of 3.9 persons per family. On the other hand, single male/father families (76 | 12.1%) represent the smallest median family size with 2.68 persons per family.
| Family Type | # Families | Family Size |
| Married-Couple | 401 (63.7%) | 3.33 |
| Single Male/Father | 76 (12.1%) | 2.68 |
| Single Female/Mother | 152 (24.2%) | 3.90 |
| Total Families | 629 (100.0%) | 3.39 |
Median Household Size in Hudspeth County
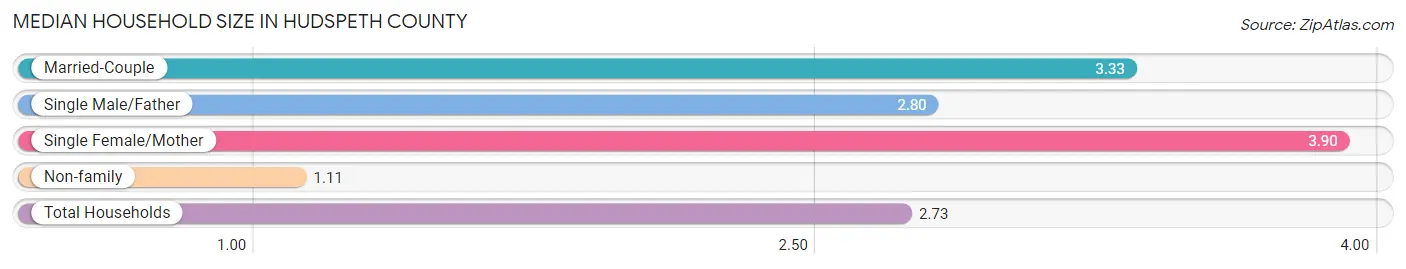
The median household size in Hudspeth County is 2.73 persons per household, with single female/mother households (152 | 17.1%) accounting for the largest median household size of 3.9 persons per household. non-family households (261 | 29.3%) represent the smallest median household size with 1.11 persons per household.
| Household Type | # Households | Household Size |
| Married-Couple | 401 (45.1%) | 3.33 |
| Single Male/Father | 76 (8.5%) | 2.80 |
| Single Female/Mother | 152 (17.1%) | 3.90 |
| Non-family | 261 (29.3%) | 1.11 |
| Total Households | 890 (100.0%) | 2.73 |
Household Size by Marriage Status in Hudspeth County
Out of a total of 890 households in Hudspeth County, 629 (70.7%) are family households, while 261 (29.3%) are nonfamily households. The most numerous type of family households are 2-person households, comprising 298, and the most common type of nonfamily households are 1-person households, comprising 235.
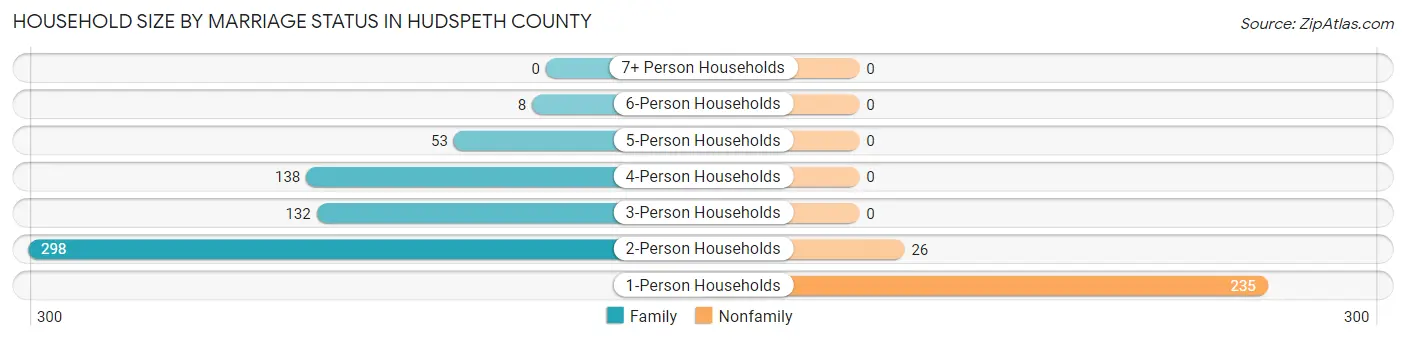
| Household Size | Family Households | Nonfamily Households |
| 1-Person Households | - | 235 (26.4%) |
| 2-Person Households | 298 (33.5%) | 26 (2.9%) |
| 3-Person Households | 132 (14.8%) | 0 (0.0%) |
| 4-Person Households | 138 (15.5%) | 0 (0.0%) |
| 5-Person Households | 53 (6.0%) | 0 (0.0%) |
| 6-Person Households | 8 (0.9%) | 0 (0.0%) |
| 7+ Person Households | 0 (0.0%) | 0 (0.0%) |
| Total | 629 (70.7%) | 261 (29.3%) |
Female Fertility in Hudspeth County
Fertility by Age in Hudspeth County
Average fertility rate in Hudspeth County is 19.0 births per 1,000 women. Women in the age bracket of 20 to 34 years have the highest fertility rate with 40.0 births per 1,000 women. Women in the age bracket of 20 to 34 years acount for 100.0% of all women with births.
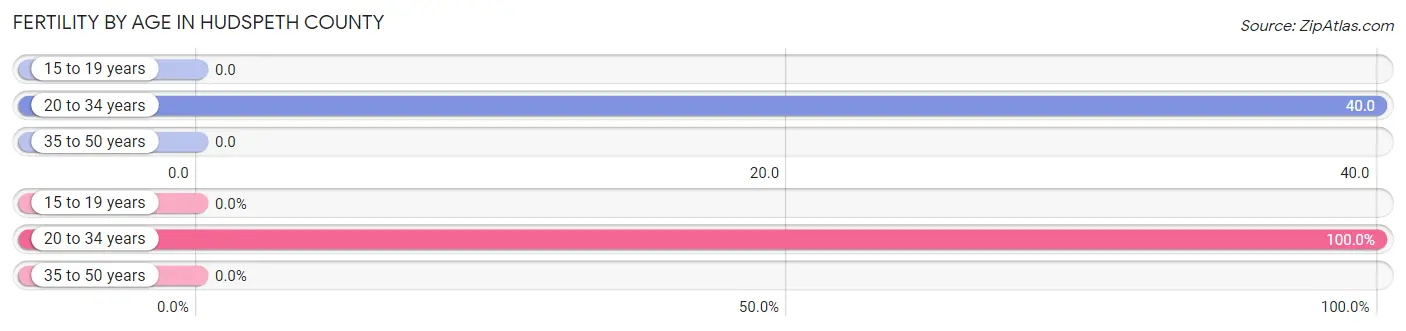
| Age Bracket | Women with Births | Births / 1,000 Women |
| 15 to 19 years | 0 (0.0%) | 0.0 |
| 20 to 34 years | 13 (100.0%) | 40.0 |
| 35 to 50 years | 0 (0.0%) | 0.0 |
| Total | 13 (100.0%) | 19.0 |
Fertility by Age by Marriage Status in Hudspeth County
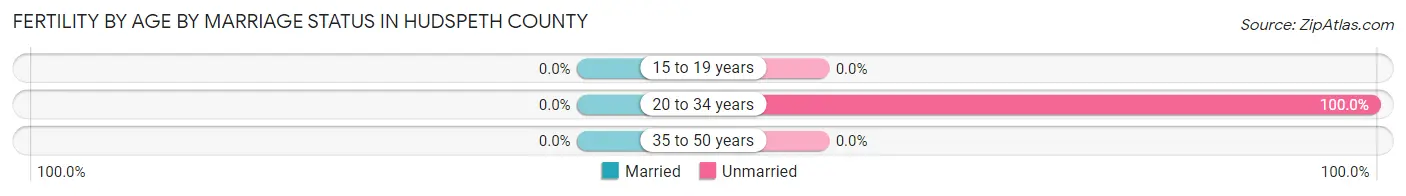
| Age Bracket | Married | Unmarried |
| 15 to 19 years | 0 (0.0%) | 0 (0.0%) |
| 20 to 34 years | 0 (0.0%) | 13 (100.0%) |
| 35 to 50 years | 0 (0.0%) | 0 (0.0%) |
| Total | 0 (0.0%) | 13 (100.0%) |
Fertility by Education in Hudspeth County
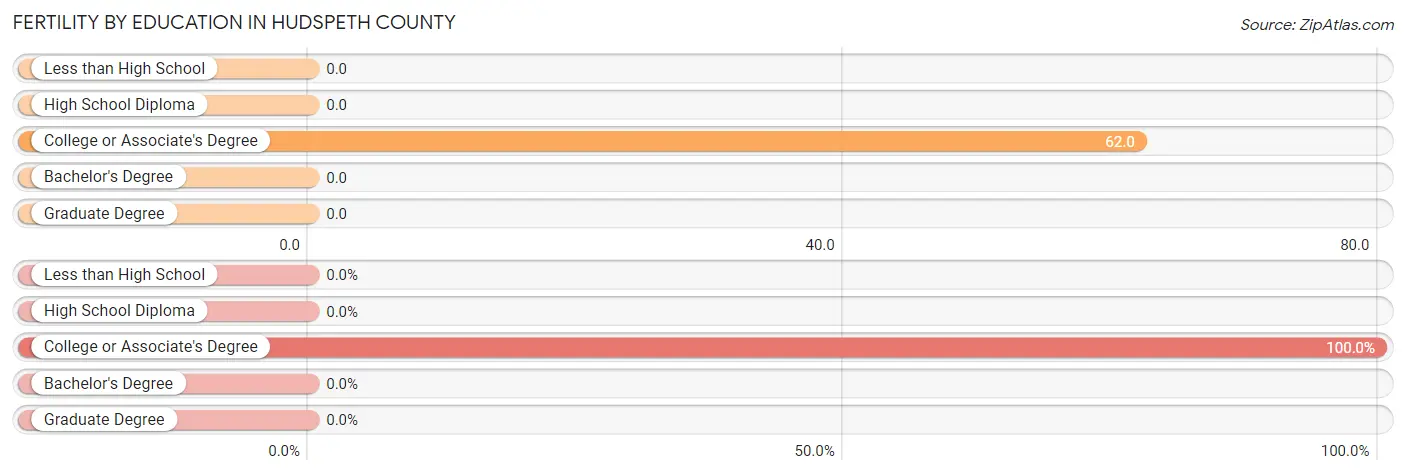
| Educational Attainment | Women with Births | Births / 1,000 Women |
| Less than High School | 0 (0.0%) | 0.0 |
| High School Diploma | 0 (0.0%) | 0.0 |
| College or Associate's Degree | 13 (100.0%) | 62.0 |
| Bachelor's Degree | 0 (0.0%) | 0.0 |
| Graduate Degree | 0 (0.0%) | 0.0 |
| Total | 13 (100.0%) | 19.0 |
Fertility by Education by Marriage Status in Hudspeth County
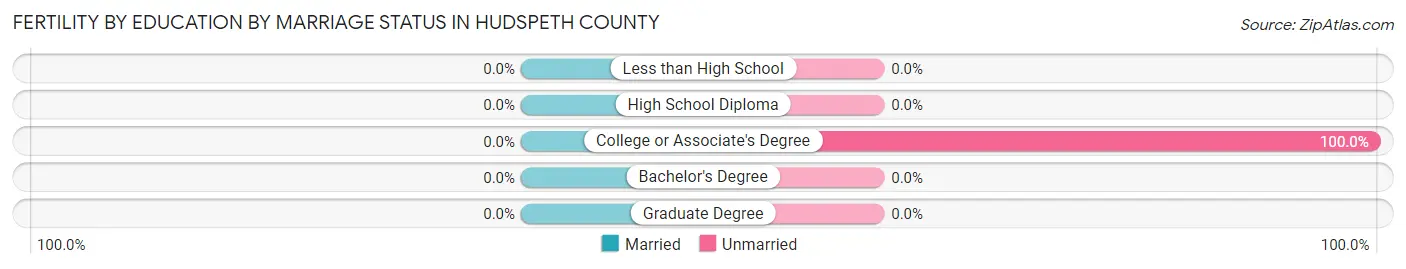
| Educational Attainment | Married | Unmarried |
| Less than High School | 0 (0.0%) | 0 (0.0%) |
| High School Diploma | 0 (0.0%) | 0 (0.0%) |
| College or Associate's Degree | 0 (0.0%) | 13 (100.0%) |
| Bachelor's Degree | 0 (0.0%) | 0 (0.0%) |
| Graduate Degree | 0 (0.0%) | 0 (0.0%) |
| Total | 0 (0.0%) | 13 (100.0%) |
Employment Characteristics in Hudspeth County
Employment by Class of Employer in Hudspeth County
Among the 966 employed individuals in Hudspeth County, private company employees (539 | 55.8%), state government employees (110 | 11.4%), and self-employed (not incorporated) (105 | 10.9%) make up the most common classes of employment.
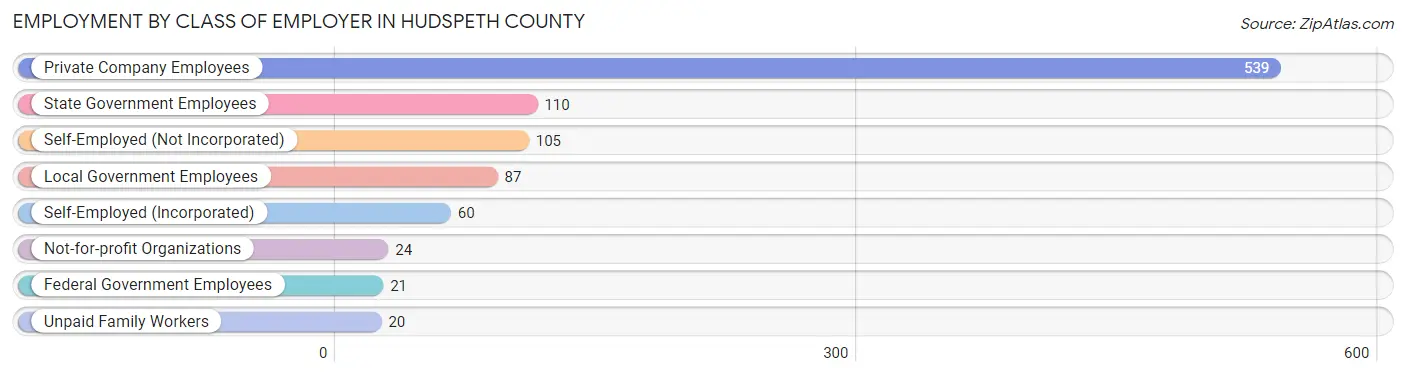
| Employer Class | # Employees | % Employees |
| Private Company Employees | 539 | 55.8% |
| Self-Employed (Incorporated) | 60 | 6.2% |
| Self-Employed (Not Incorporated) | 105 | 10.9% |
| Not-for-profit Organizations | 24 | 2.5% |
| Local Government Employees | 87 | 9.0% |
| State Government Employees | 110 | 11.4% |
| Federal Government Employees | 21 | 2.2% |
| Unpaid Family Workers | 20 | 2.1% |
| Total | 966 | 100.0% |
Employment Status by Age in Hudspeth County
According to the labor force statistics for Hudspeth County, out of the total population over 16 years of age (2,876), 36.6% or 1,053 individuals are in the labor force, with 8.2% or 86 of them unemployed. The age group with the highest labor force participation rate is 20 to 24 years, with 61.5% or 240 individuals in the labor force. Within the labor force, the 45 to 54 years age range has the highest percentage of unemployed individuals, with 26.8% or 45 of them being unemployed.
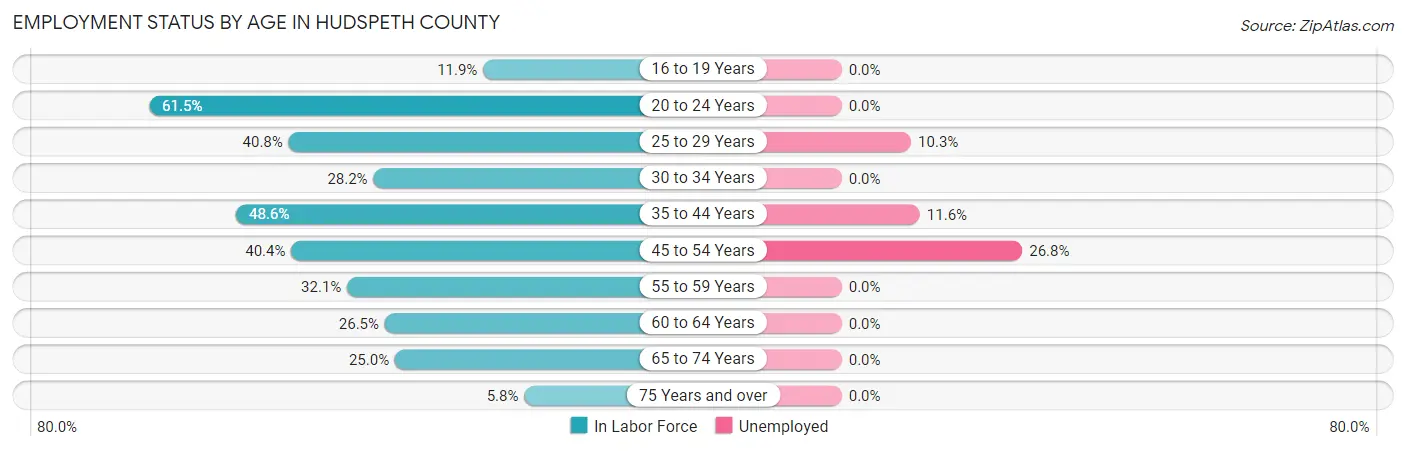
| Age Bracket | In Labor Force | Unemployed |
| 16 to 19 Years | 29 (11.9%) | 0 (0.0%) |
| 20 to 24 Years | 240 (61.5%) | 0 (0.0%) |
| 25 to 29 Years | 155 (40.8%) | 16 (10.3%) |
| 30 to 34 Years | 113 (28.2%) | 0 (0.0%) |
| 35 to 44 Years | 215 (48.6%) | 25 (11.6%) |
| 45 to 54 Years | 168 (40.4%) | 45 (26.8%) |
| 55 to 59 Years | 26 (32.1%) | 0 (0.0%) |
| 60 to 64 Years | 41 (26.5%) | 0 (0.0%) |
| 65 to 74 Years | 57 (25.0%) | 0 (0.0%) |
| 75 Years and over | 8 (5.8%) | 0 (0.0%) |
| Total | 1,053 (36.6%) | 86 (8.2%) |
Employment Status by Educational Attainment in Hudspeth County
According to labor force statistics for Hudspeth County, 38.3% of individuals (718) out of the total population between 25 and 64 years of age (1,875) are in the labor force, with 12.0% or 86 of them being unemployed. The group with the highest labor force participation rate are those with the educational attainment of bachelor's degree or higher, with 83.9% or 141 individuals in the labor force. Within the labor force, individuals with college / associate degree education have the highest percentage of unemployment, with 42.6% or 66 of them being unemployed.
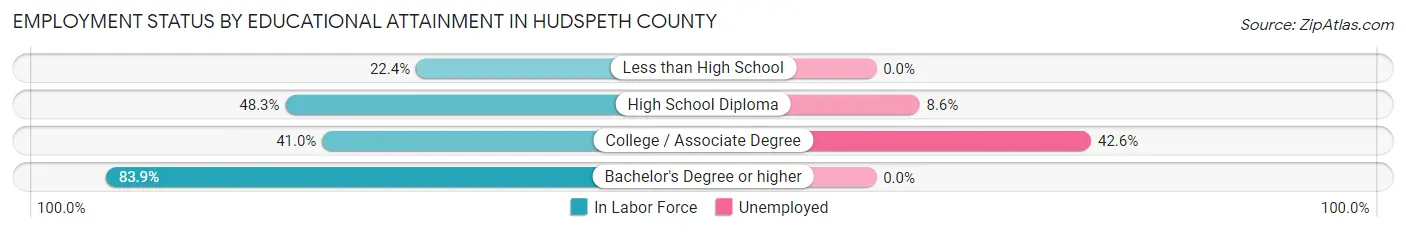
| Educational Attainment | In Labor Force | Unemployed |
| Less than High School | 190 (22.4%) | 0 (0.0%) |
| High School Diploma | 232 (48.3%) | 41 (8.6%) |
| College / Associate Degree | 155 (41.0%) | 161 (42.6%) |
| Bachelor's Degree or higher | 141 (83.9%) | 0 (0.0%) |
| Total | 718 (38.3%) | 225 (12.0%) |
Employment Occupations by Sex in Hudspeth County
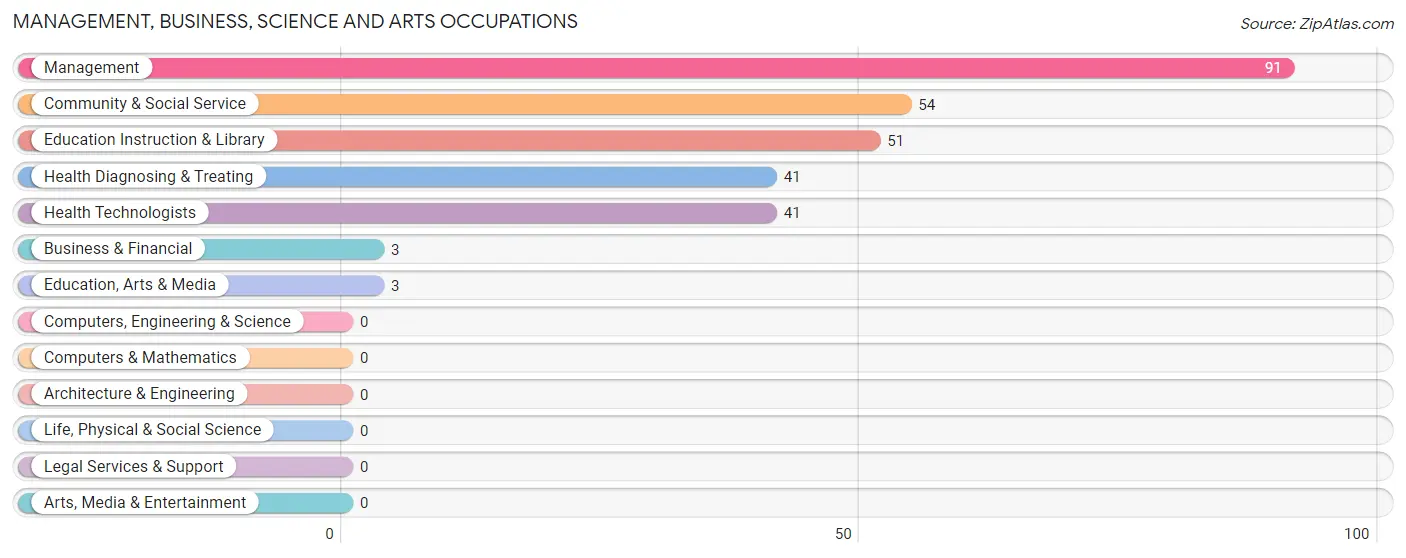
Management, Business, Science and Arts Occupations
The most common Management, Business, Science and Arts occupations in Hudspeth County are Management (91 | 9.4%), Community & Social Service (54 | 5.6%), Education Instruction & Library (51 | 5.3%), Health Diagnosing & Treating (41 | 4.2%), and Health Technologists (41 | 4.2%).
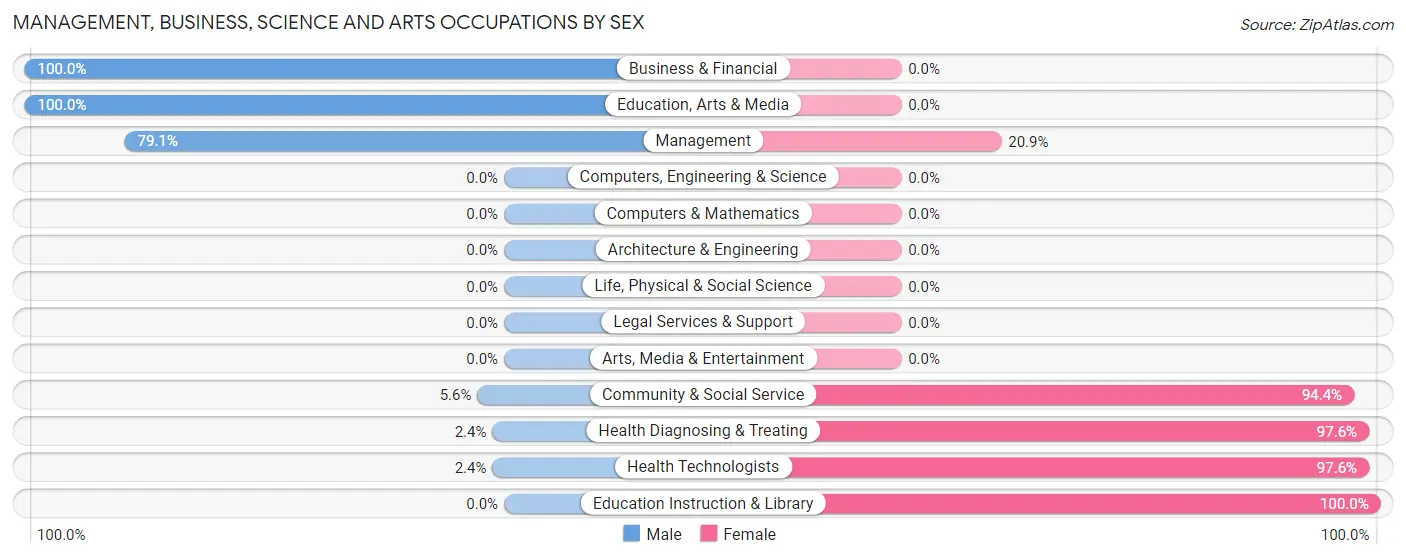
Management, Business, Science and Arts Occupations by Sex
Within the Management, Business, Science and Arts occupations in Hudspeth County, the most male-oriented occupations are Business & Financial (100.0%), Education, Arts & Media (100.0%), and Management (79.1%), while the most female-oriented occupations are Education Instruction & Library (100.0%), Health Diagnosing & Treating (97.6%), and Health Technologists (97.6%).
| Occupation | Male | Female |
| Management | 72 (79.1%) | 19 (20.9%) |
| Business & Financial | 3 (100.0%) | 0 (0.0%) |
| Computers, Engineering & Science | 0 (0.0%) | 0 (0.0%) |
| Computers & Mathematics | 0 (0.0%) | 0 (0.0%) |
| Architecture & Engineering | 0 (0.0%) | 0 (0.0%) |
| Life, Physical & Social Science | 0 (0.0%) | 0 (0.0%) |
| Community & Social Service | 3 (5.6%) | 51 (94.4%) |
| Education, Arts & Media | 3 (100.0%) | 0 (0.0%) |
| Legal Services & Support | 0 (0.0%) | 0 (0.0%) |
| Education Instruction & Library | 0 (0.0%) | 51 (100.0%) |
| Arts, Media & Entertainment | 0 (0.0%) | 0 (0.0%) |
| Health Diagnosing & Treating | 1 (2.4%) | 40 (97.6%) |
| Health Technologists | 1 (2.4%) | 40 (97.6%) |
| Total (Category) | 79 (41.8%) | 110 (58.2%) |
| Total (Overall) | 553 (57.3%) | 413 (42.7%) |
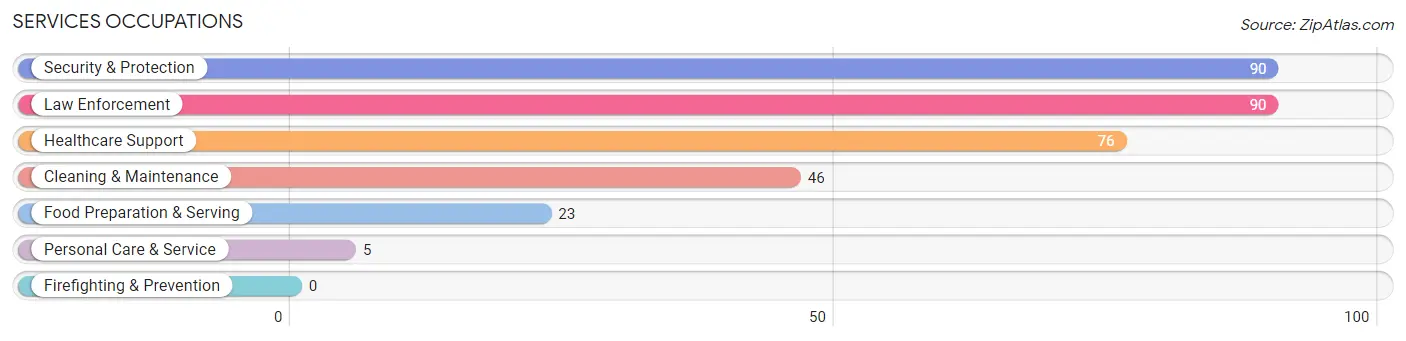
Services Occupations
The most common Services occupations in Hudspeth County are Security & Protection (90 | 9.3%), Law Enforcement (90 | 9.3%), Healthcare Support (76 | 7.9%), Cleaning & Maintenance (46 | 4.8%), and Food Preparation & Serving (23 | 2.4%).
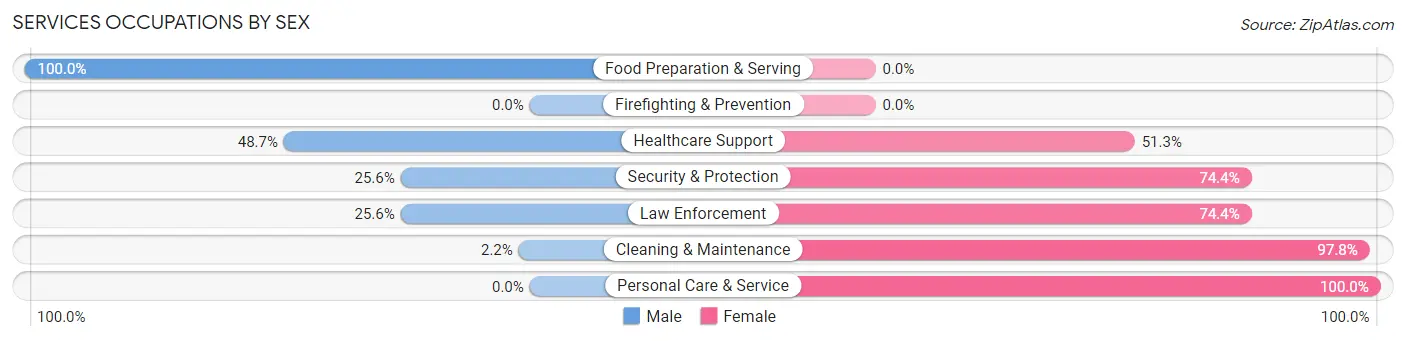
Services Occupations by Sex
Within the Services occupations in Hudspeth County, the most male-oriented occupations are Food Preparation & Serving (100.0%), Healthcare Support (48.7%), and Security & Protection (25.6%), while the most female-oriented occupations are Personal Care & Service (100.0%), Cleaning & Maintenance (97.8%), and Security & Protection (74.4%).
| Occupation | Male | Female |
| Healthcare Support | 37 (48.7%) | 39 (51.3%) |
| Security & Protection | 23 (25.6%) | 67 (74.4%) |
| Firefighting & Prevention | 0 (0.0%) | 0 (0.0%) |
| Law Enforcement | 23 (25.6%) | 67 (74.4%) |
| Food Preparation & Serving | 23 (100.0%) | 0 (0.0%) |
| Cleaning & Maintenance | 1 (2.2%) | 45 (97.8%) |
| Personal Care & Service | 0 (0.0%) | 5 (100.0%) |
| Total (Category) | 84 (35.0%) | 156 (65.0%) |
| Total (Overall) | 553 (57.3%) | 413 (42.7%) |
Sales and Office Occupations
The most common Sales and Office occupations in Hudspeth County are Office & Administration (92 | 9.5%), and Sales & Related (85 | 8.8%).
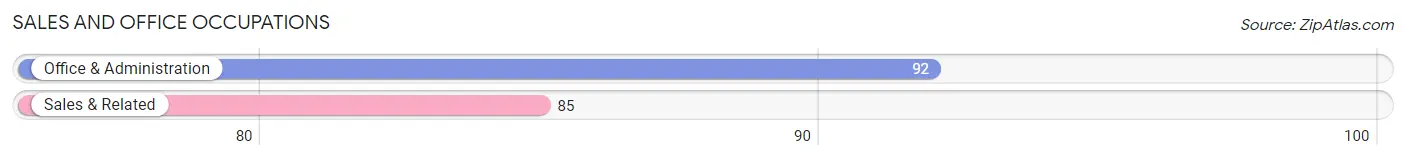
Sales and Office Occupations by Sex
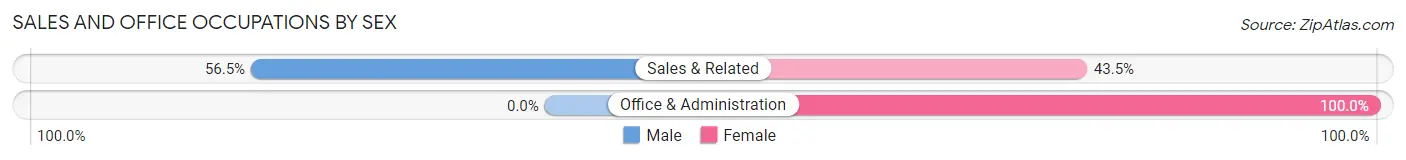
| Occupation | Male | Female |
| Sales & Related | 48 (56.5%) | 37 (43.5%) |
| Office & Administration | 0 (0.0%) | 92 (100.0%) |
| Total (Category) | 48 (27.1%) | 129 (72.9%) |
| Total (Overall) | 553 (57.3%) | 413 (42.7%) |
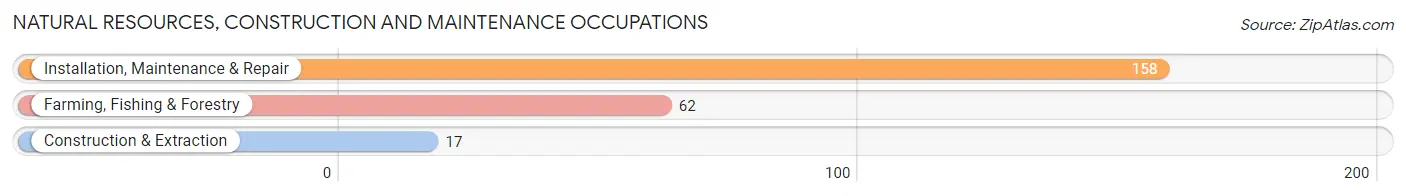
Natural Resources, Construction and Maintenance Occupations
The most common Natural Resources, Construction and Maintenance occupations in Hudspeth County are Installation, Maintenance & Repair (158 | 16.4%), Farming, Fishing & Forestry (62 | 6.4%), and Construction & Extraction (17 | 1.8%).
Natural Resources, Construction and Maintenance Occupations by Sex
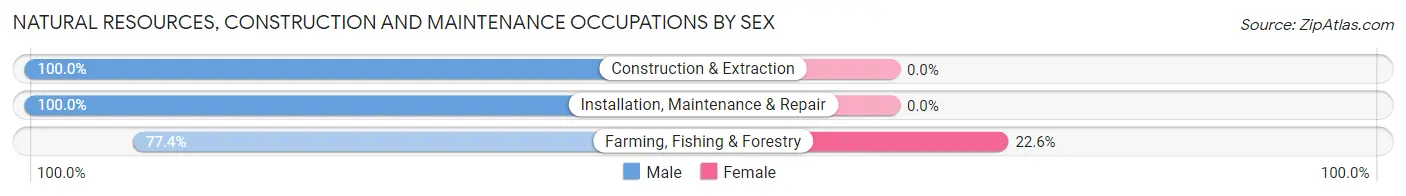
| Occupation | Male | Female |
| Farming, Fishing & Forestry | 48 (77.4%) | 14 (22.6%) |
| Construction & Extraction | 17 (100.0%) | 0 (0.0%) |
| Installation, Maintenance & Repair | 158 (100.0%) | 0 (0.0%) |
| Total (Category) | 223 (94.1%) | 14 (5.9%) |
| Total (Overall) | 553 (57.3%) | 413 (42.7%) |
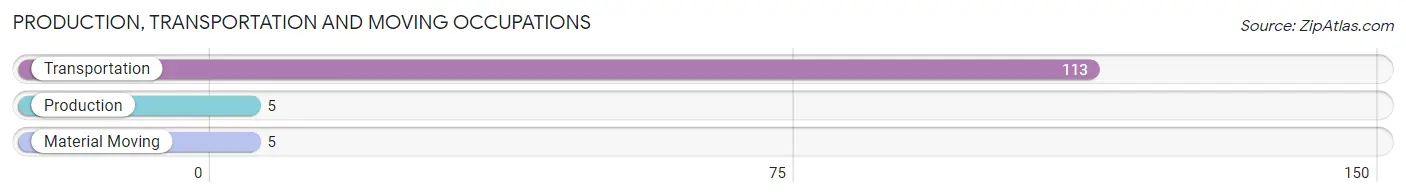
Production, Transportation and Moving Occupations
The most common Production, Transportation and Moving occupations in Hudspeth County are Transportation (113 | 11.7%), Production (5 | 0.5%), and Material Moving (5 | 0.5%).
Production, Transportation and Moving Occupations by Sex
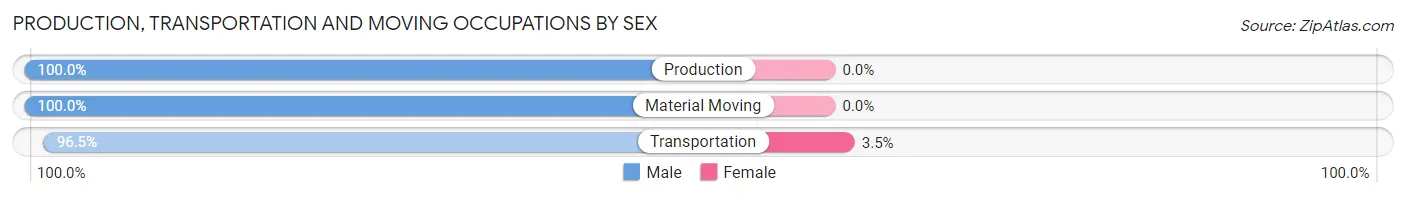
| Occupation | Male | Female |
| Production | 5 (100.0%) | 0 (0.0%) |
| Transportation | 109 (96.5%) | 4 (3.5%) |
| Material Moving | 5 (100.0%) | 0 (0.0%) |
| Total (Category) | 119 (96.8%) | 4 (3.3%) |
| Total (Overall) | 553 (57.3%) | 413 (42.7%) |
Employment Industries by Sex in Hudspeth County
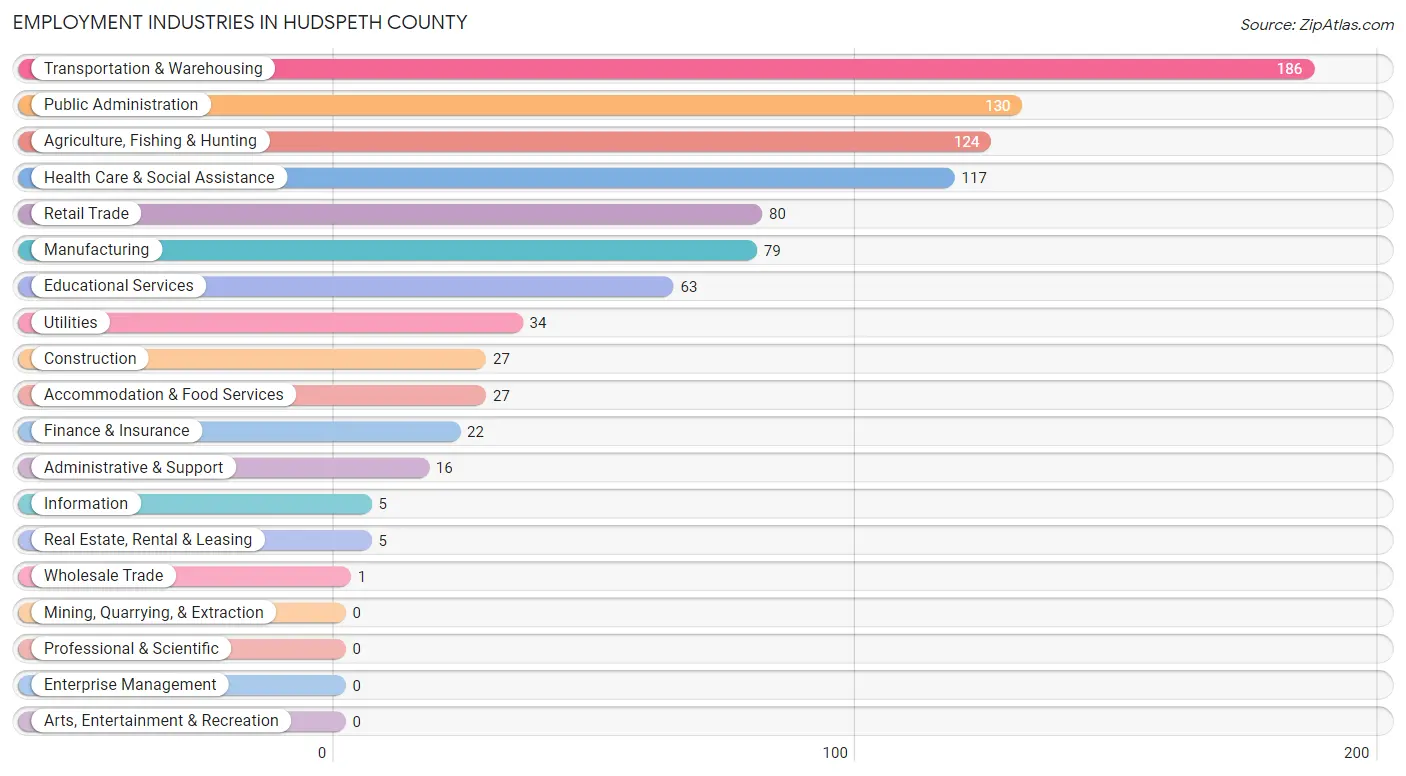
Employment Industries in Hudspeth County
The major employment industries in Hudspeth County include Transportation & Warehousing (186 | 19.3%), Public Administration (130 | 13.5%), Agriculture, Fishing & Hunting (124 | 12.8%), Health Care & Social Assistance (117 | 12.1%), and Retail Trade (80 | 8.3%).
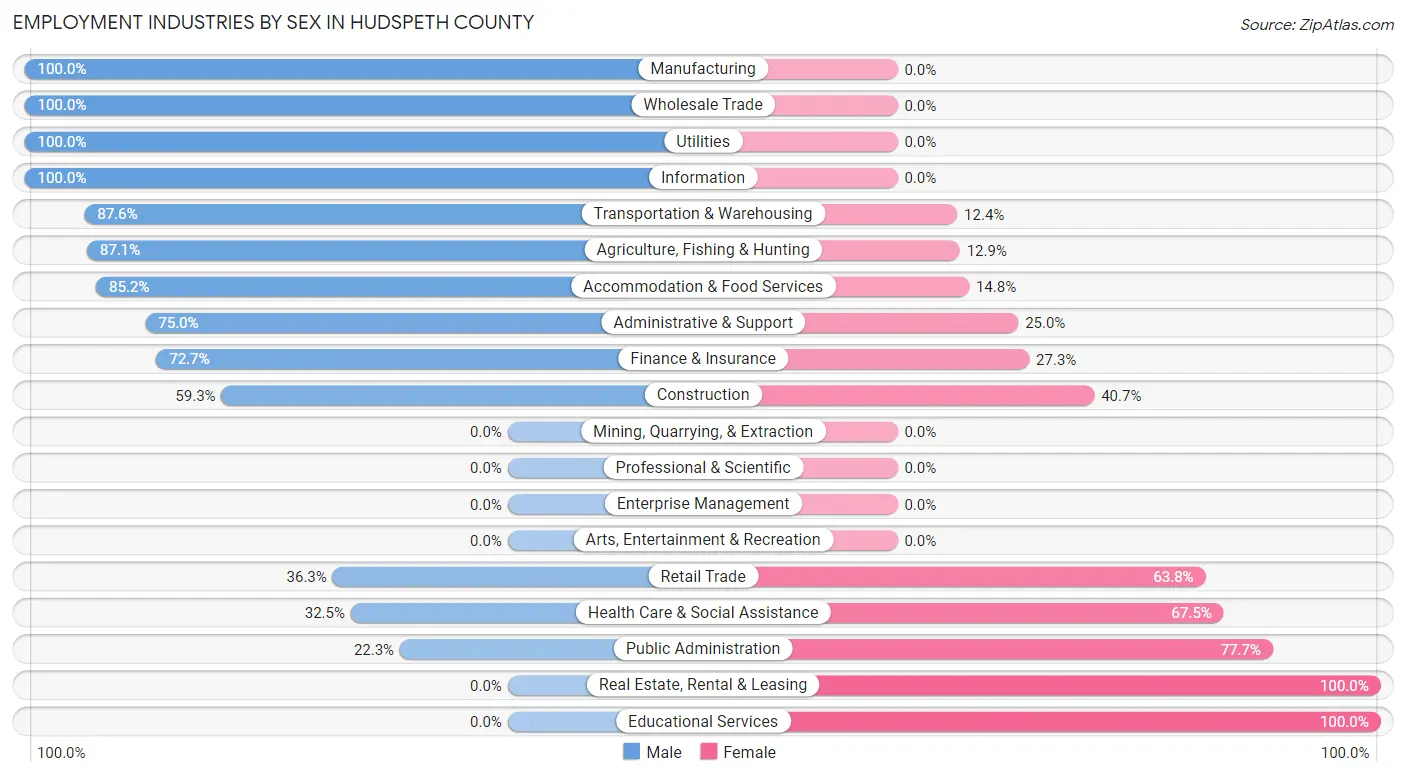
Employment Industries by Sex in Hudspeth County
The Hudspeth County industries that see more men than women are Manufacturing (100.0%), Wholesale Trade (100.0%), and Utilities (100.0%), whereas the industries that tend to have a higher number of women are Real Estate, Rental & Leasing (100.0%), Educational Services (100.0%), and Public Administration (77.7%).
| Industry | Male | Female |
| Agriculture, Fishing & Hunting | 108 (87.1%) | 16 (12.9%) |
| Mining, Quarrying, & Extraction | 0 (0.0%) | 0 (0.0%) |
| Construction | 16 (59.3%) | 11 (40.7%) |
| Manufacturing | 79 (100.0%) | 0 (0.0%) |
| Wholesale Trade | 1 (100.0%) | 0 (0.0%) |
| Retail Trade | 29 (36.2%) | 51 (63.7%) |
| Transportation & Warehousing | 163 (87.6%) | 23 (12.4%) |
| Utilities | 34 (100.0%) | 0 (0.0%) |
| Information | 5 (100.0%) | 0 (0.0%) |
| Finance & Insurance | 16 (72.7%) | 6 (27.3%) |
| Real Estate, Rental & Leasing | 0 (0.0%) | 5 (100.0%) |
| Professional & Scientific | 0 (0.0%) | 0 (0.0%) |
| Enterprise Management | 0 (0.0%) | 0 (0.0%) |
| Administrative & Support | 12 (75.0%) | 4 (25.0%) |
| Educational Services | 0 (0.0%) | 63 (100.0%) |
| Health Care & Social Assistance | 38 (32.5%) | 79 (67.5%) |
| Arts, Entertainment & Recreation | 0 (0.0%) | 0 (0.0%) |
| Accommodation & Food Services | 23 (85.2%) | 4 (14.8%) |
| Public Administration | 29 (22.3%) | 101 (77.7%) |
| Total | 553 (57.3%) | 413 (42.7%) |
Education in Hudspeth County
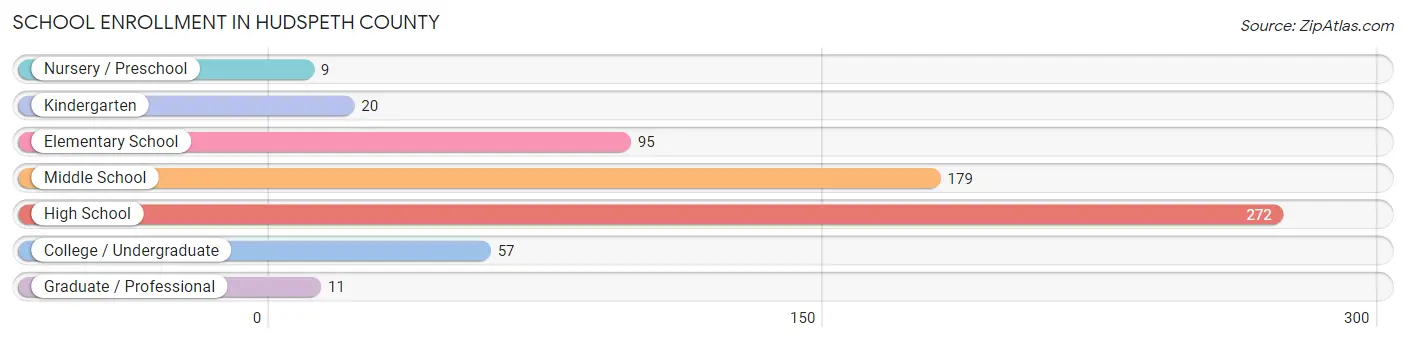
School Enrollment in Hudspeth County
The most common levels of schooling among the 643 students in Hudspeth County are high school (272 | 42.3%), middle school (179 | 27.8%), and elementary school (95 | 14.8%).
| School Level | # Students | % Students |
| Nursery / Preschool | 9 | 1.4% |
| Kindergarten | 20 | 3.1% |
| Elementary School | 95 | 14.8% |
| Middle School | 179 | 27.8% |
| High School | 272 | 42.3% |
| College / Undergraduate | 57 | 8.9% |
| Graduate / Professional | 11 | 1.7% |
| Total | 643 | 100.0% |
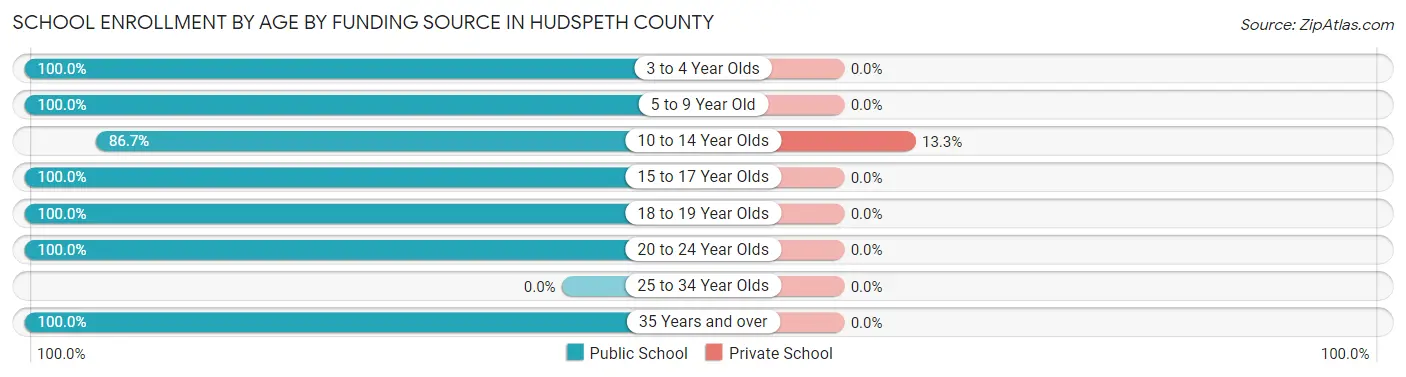
School Enrollment by Age by Funding Source in Hudspeth County
Out of a total of 643 students who are enrolled in schools in Hudspeth County, 21 (3.3%) attend a private institution, while the remaining 622 (96.7%) are enrolled in public schools. The age group of 10 to 14 year olds has the highest likelihood of being enrolled in private schools, with 21 (13.3% in the age bracket) enrolled. Conversely, the age group of 3 to 4 year olds has the lowest likelihood of being enrolled in a private school, with 4 (100.0% in the age bracket) attending a public institution.
| Age Bracket | Public School | Private School |
| 3 to 4 Year Olds | 4 (100.0%) | 0 (0.0%) |
| 5 to 9 Year Old | 120 (100.0%) | 0 (0.0%) |
| 10 to 14 Year Olds | 137 (86.7%) | 21 (13.3%) |
| 15 to 17 Year Olds | 150 (100.0%) | 0 (0.0%) |
| 18 to 19 Year Olds | 94 (100.0%) | 0 (0.0%) |
| 20 to 24 Year Olds | 89 (100.0%) | 0 (0.0%) |
| 25 to 34 Year Olds | 0 (0.0%) | 0 (0.0%) |
| 35 Years and over | 28 (100.0%) | 0 (0.0%) |
| Total | 622 (96.7%) | 21 (3.3%) |
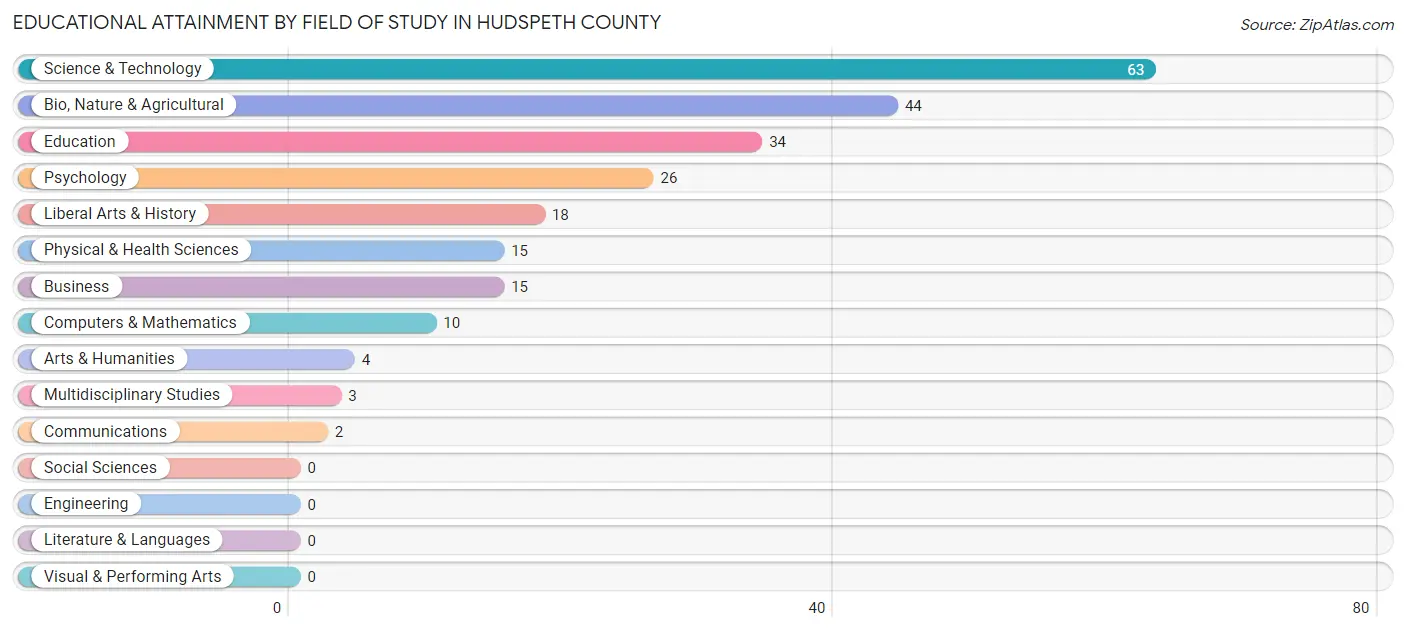
Educational Attainment by Field of Study in Hudspeth County
Science & technology (63 | 26.9%), bio, nature & agricultural (44 | 18.8%), education (34 | 14.5%), psychology (26 | 11.1%), and liberal arts & history (18 | 7.7%) are the most common fields of study among 234 individuals in Hudspeth County who have obtained a bachelor's degree or higher.
| Field of Study | # Graduates | % Graduates |
| Computers & Mathematics | 10 | 4.3% |
| Bio, Nature & Agricultural | 44 | 18.8% |
| Physical & Health Sciences | 15 | 6.4% |
| Psychology | 26 | 11.1% |
| Social Sciences | 0 | 0.0% |
| Engineering | 0 | 0.0% |
| Multidisciplinary Studies | 3 | 1.3% |
| Science & Technology | 63 | 26.9% |
| Business | 15 | 6.4% |
| Education | 34 | 14.5% |
| Literature & Languages | 0 | 0.0% |
| Liberal Arts & History | 18 | 7.7% |
| Visual & Performing Arts | 0 | 0.0% |
| Communications | 2 | 0.9% |
| Arts & Humanities | 4 | 1.7% |
| Total | 234 | 100.0% |
Transportation & Commute in Hudspeth County
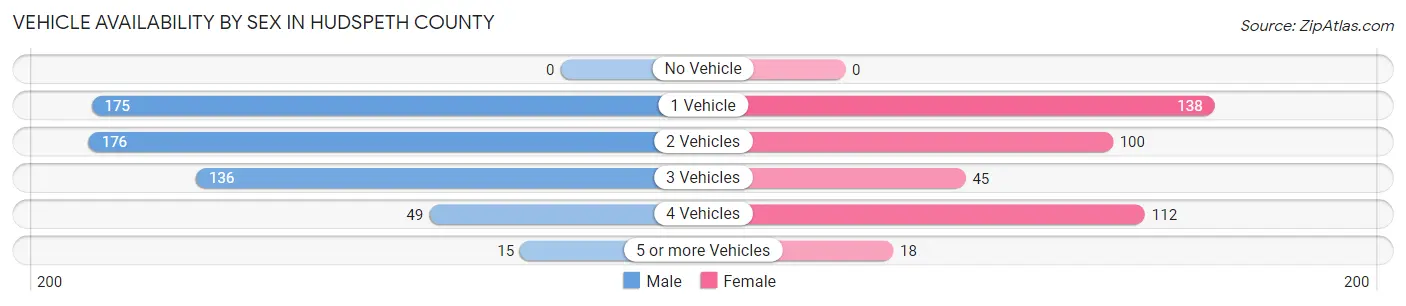
Vehicle Availability by Sex in Hudspeth County
The most prevalent vehicle ownership categories in Hudspeth County are males with 2 vehicles (176, accounting for 31.9%) and females with 2 vehicles (100, making up 42.6%).
| Vehicles Available | Male | Female |
| No Vehicle | 0 (0.0%) | 0 (0.0%) |
| 1 Vehicle | 175 (31.8%) | 138 (33.4%) |
| 2 Vehicles | 176 (31.9%) | 100 (24.2%) |
| 3 Vehicles | 136 (24.7%) | 45 (10.9%) |
| 4 Vehicles | 49 (8.9%) | 112 (27.1%) |
| 5 or more Vehicles | 15 (2.7%) | 18 (4.4%) |
| Total | 551 (100.0%) | 413 (100.0%) |
Commute Time in Hudspeth County
The most frequently occuring commute durations in Hudspeth County are 5 to 9 minutes (227 commuters, 27.3%), 30 to 34 minutes (166 commuters, 20.0%), and 10 to 14 minutes (105 commuters, 12.6%).
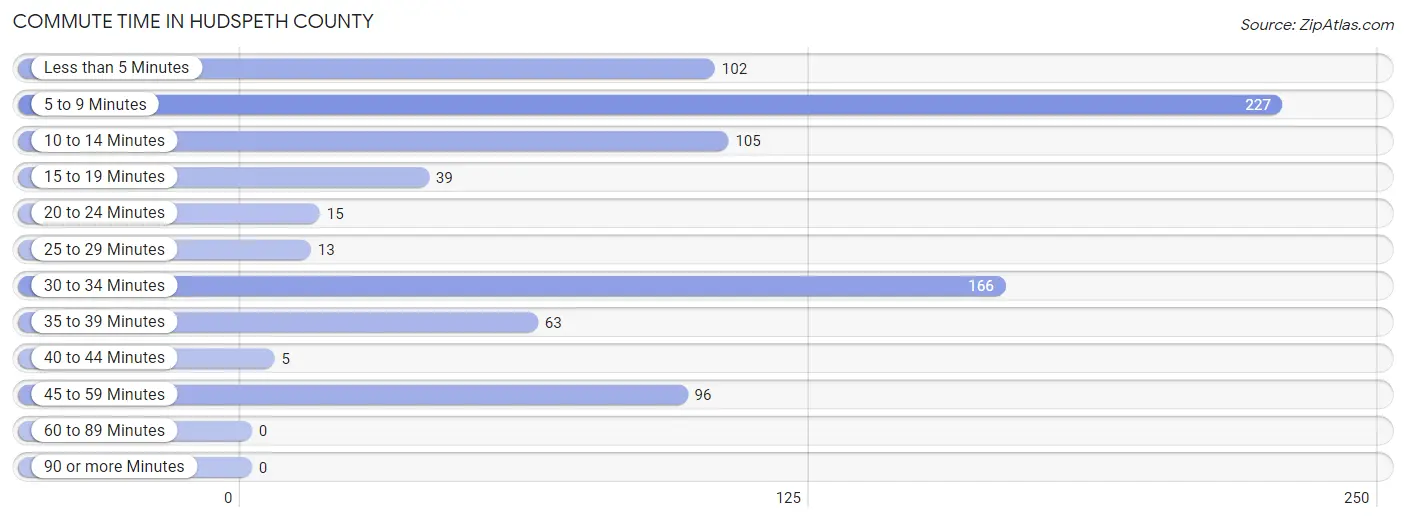
| Commute Time | # Commuters | % Commuters |
| Less than 5 Minutes | 102 | 12.3% |
| 5 to 9 Minutes | 227 | 27.3% |
| 10 to 14 Minutes | 105 | 12.6% |
| 15 to 19 Minutes | 39 | 4.7% |
| 20 to 24 Minutes | 15 | 1.8% |
| 25 to 29 Minutes | 13 | 1.6% |
| 30 to 34 Minutes | 166 | 20.0% |
| 35 to 39 Minutes | 63 | 7.6% |
| 40 to 44 Minutes | 5 | 0.6% |
| 45 to 59 Minutes | 96 | 11.6% |
| 60 to 89 Minutes | 0 | 0.0% |
| 90 or more Minutes | 0 | 0.0% |
Commute Time by Sex in Hudspeth County
The most common commute times in Hudspeth County are 5 to 9 minutes (147 commuters, 31.7%) for males and 5 to 9 minutes (80 commuters, 21.8%) for females.
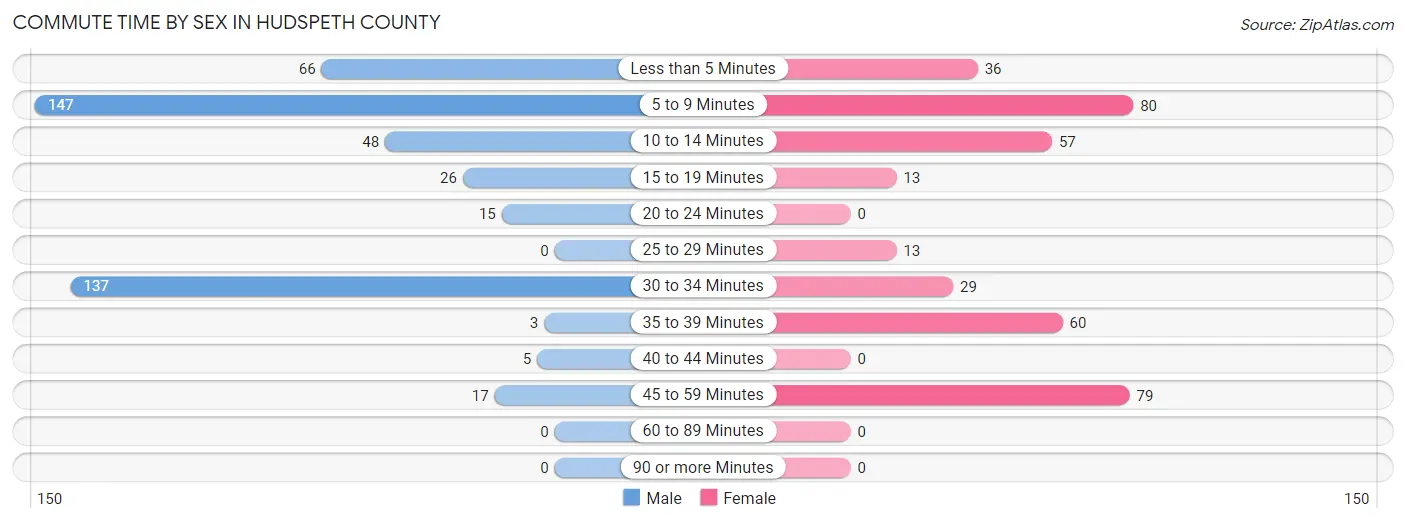
| Commute Time | Male | Female |
| Less than 5 Minutes | 66 (14.2%) | 36 (9.8%) |
| 5 to 9 Minutes | 147 (31.7%) | 80 (21.8%) |
| 10 to 14 Minutes | 48 (10.3%) | 57 (15.5%) |
| 15 to 19 Minutes | 26 (5.6%) | 13 (3.5%) |
| 20 to 24 Minutes | 15 (3.2%) | 0 (0.0%) |
| 25 to 29 Minutes | 0 (0.0%) | 13 (3.5%) |
| 30 to 34 Minutes | 137 (29.5%) | 29 (7.9%) |
| 35 to 39 Minutes | 3 (0.6%) | 60 (16.4%) |
| 40 to 44 Minutes | 5 (1.1%) | 0 (0.0%) |
| 45 to 59 Minutes | 17 (3.7%) | 79 (21.5%) |
| 60 to 89 Minutes | 0 (0.0%) | 0 (0.0%) |
| 90 or more Minutes | 0 (0.0%) | 0 (0.0%) |
Time of Departure to Work by Sex in Hudspeth County
The most frequent times of departure to work in Hudspeth County are 7:00 AM to 7:29 AM (164, 35.3%) for males and 7:00 AM to 7:29 AM (95, 25.9%) for females.
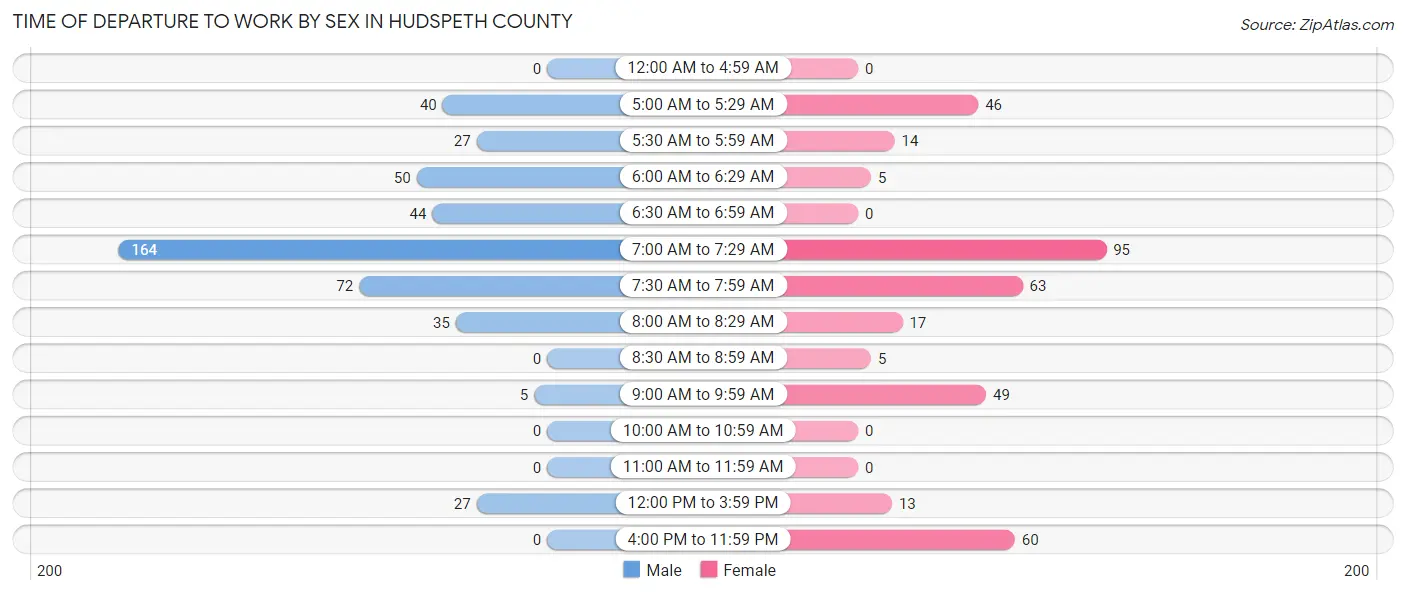
| Time of Departure | Male | Female |
| 12:00 AM to 4:59 AM | 0 (0.0%) | 0 (0.0%) |
| 5:00 AM to 5:29 AM | 40 (8.6%) | 46 (12.5%) |
| 5:30 AM to 5:59 AM | 27 (5.8%) | 14 (3.8%) |
| 6:00 AM to 6:29 AM | 50 (10.8%) | 5 (1.4%) |
| 6:30 AM to 6:59 AM | 44 (9.5%) | 0 (0.0%) |
| 7:00 AM to 7:29 AM | 164 (35.3%) | 95 (25.9%) |
| 7:30 AM to 7:59 AM | 72 (15.5%) | 63 (17.2%) |
| 8:00 AM to 8:29 AM | 35 (7.5%) | 17 (4.6%) |
| 8:30 AM to 8:59 AM | 0 (0.0%) | 5 (1.4%) |
| 9:00 AM to 9:59 AM | 5 (1.1%) | 49 (13.4%) |
| 10:00 AM to 10:59 AM | 0 (0.0%) | 0 (0.0%) |
| 11:00 AM to 11:59 AM | 0 (0.0%) | 0 (0.0%) |
| 12:00 PM to 3:59 PM | 27 (5.8%) | 13 (3.5%) |
| 4:00 PM to 11:59 PM | 0 (0.0%) | 60 (16.4%) |
| Total | 464 (100.0%) | 367 (100.0%) |
Housing Occupancy in Hudspeth County
Occupancy by Ownership in Hudspeth County
Of the total 890 dwellings in Hudspeth County, owner-occupied units account for 608 (68.3%), while renter-occupied units make up 282 (31.7%).
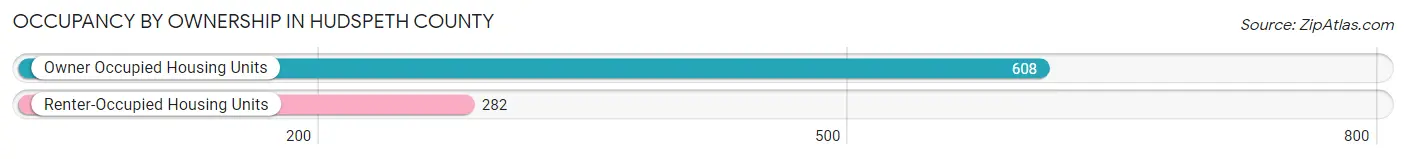
| Occupancy | # Housing Units | % Housing Units |
| Owner Occupied Housing Units | 608 | 68.3% |
| Renter-Occupied Housing Units | 282 | 31.7% |
| Total Occupied Housing Units | 890 | 100.0% |
Occupancy by Household Size in Hudspeth County
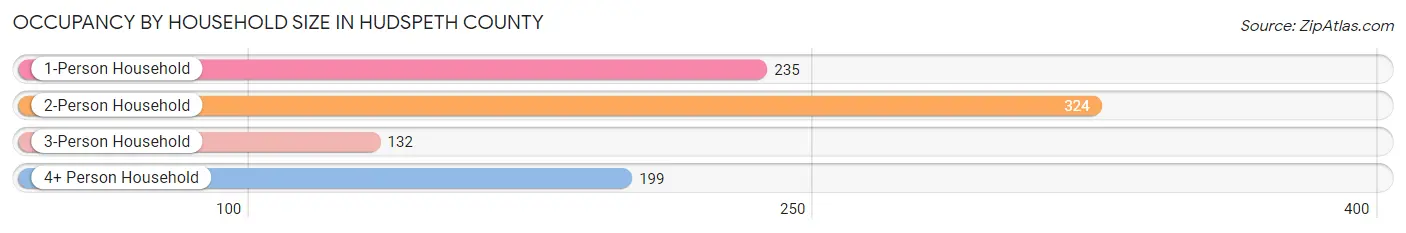
| Household Size | # Housing Units | % Housing Units |
| 1-Person Household | 235 | 26.4% |
| 2-Person Household | 324 | 36.4% |
| 3-Person Household | 132 | 14.8% |
| 4+ Person Household | 199 | 22.4% |
| Total Housing Units | 890 | 100.0% |
Occupancy by Ownership by Household Size in Hudspeth County
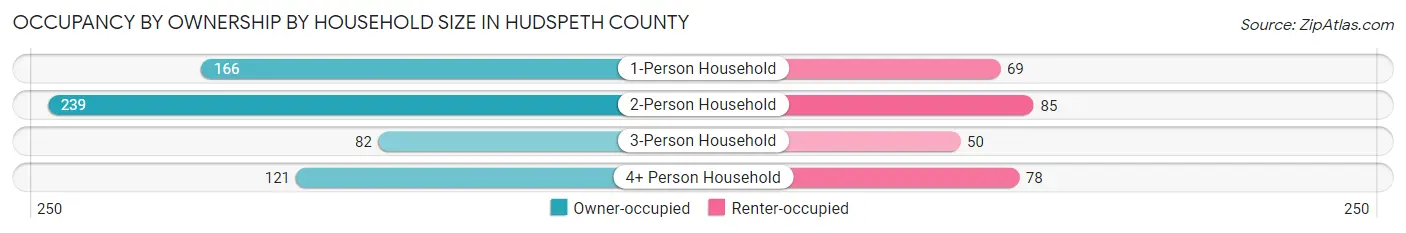
| Household Size | Owner-occupied | Renter-occupied |
| 1-Person Household | 166 (70.6%) | 69 (29.4%) |
| 2-Person Household | 239 (73.8%) | 85 (26.2%) |
| 3-Person Household | 82 (62.1%) | 50 (37.9%) |
| 4+ Person Household | 121 (60.8%) | 78 (39.2%) |
| Total Housing Units | 608 (68.3%) | 282 (31.7%) |
Occupancy by Educational Attainment in Hudspeth County
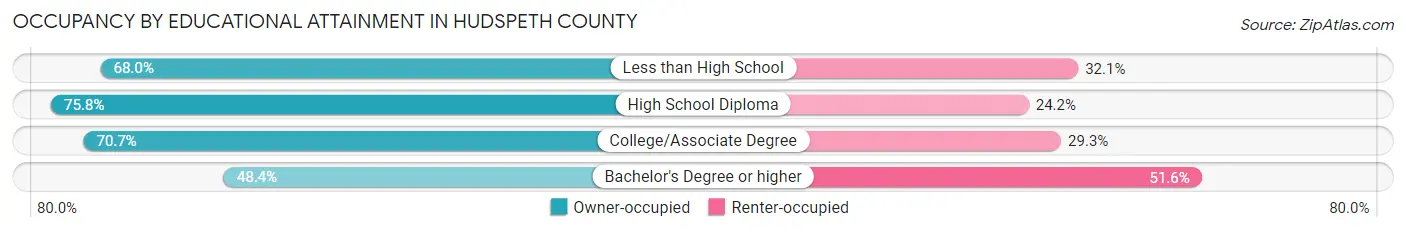
| Household Size | Owner-occupied | Renter-occupied |
| Less than High School | 248 (67.9%) | 117 (32.1%) |
| High School Diploma | 144 (75.8%) | 46 (24.2%) |
| College/Associate Degree | 171 (70.7%) | 71 (29.3%) |
| Bachelor's Degree or higher | 45 (48.4%) | 48 (51.6%) |
Occupancy by Age of Householder in Hudspeth County
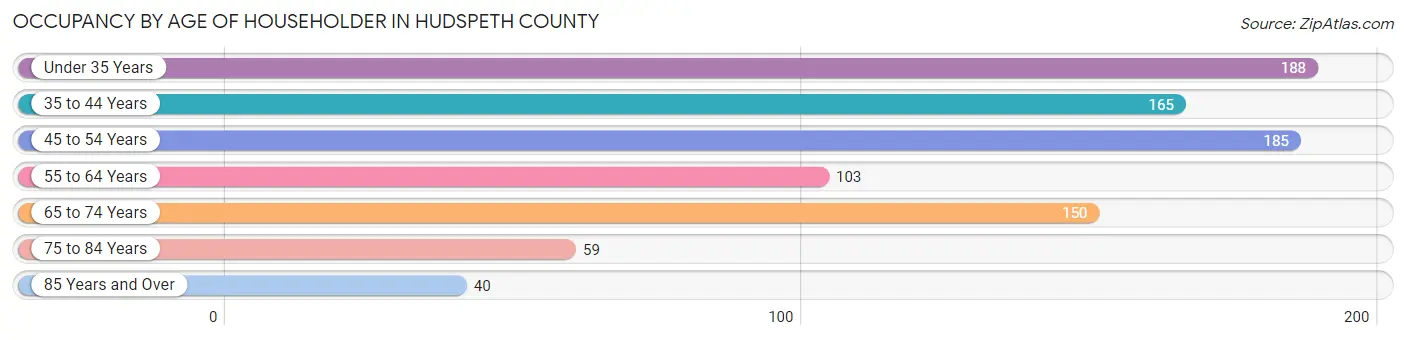
| Age Bracket | # Households | % Households |
| Under 35 Years | 188 | 21.1% |
| 35 to 44 Years | 165 | 18.5% |
| 45 to 54 Years | 185 | 20.8% |
| 55 to 64 Years | 103 | 11.6% |
| 65 to 74 Years | 150 | 16.9% |
| 75 to 84 Years | 59 | 6.6% |
| 85 Years and Over | 40 | 4.5% |
| Total | 890 | 100.0% |
Housing Finances in Hudspeth County
Median Income by Occupancy in Hudspeth County

| Occupancy Type | # Households | Median Income |
| Owner-Occupied | 608 (68.3%) | $36,250 |
| Renter-Occupied | 282 (31.7%) | $26,837 |
| Average | 890 (100.0%) | $35,163 |
Occupancy by Householder Income Bracket in Hudspeth County
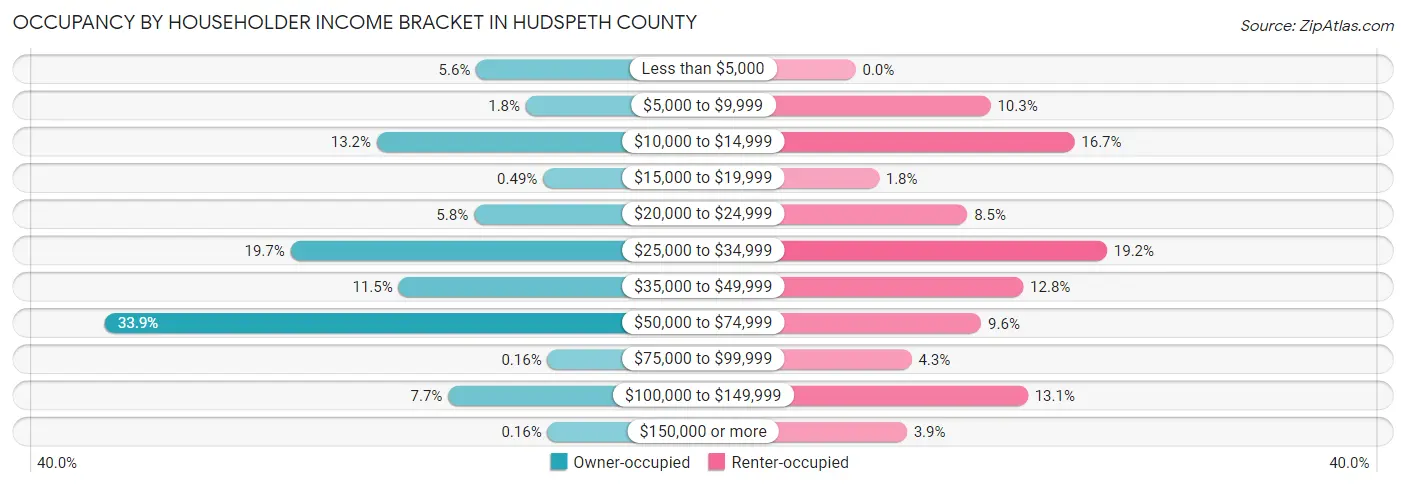
| Income Bracket | Owner-occupied | Renter-occupied |
| Less than $5,000 | 34 (5.6%) | 0 (0.0%) |
| $5,000 to $9,999 | 11 (1.8%) | 29 (10.3%) |
| $10,000 to $14,999 | 80 (13.2%) | 47 (16.7%) |
| $15,000 to $19,999 | 3 (0.5%) | 5 (1.8%) |
| $20,000 to $24,999 | 35 (5.8%) | 24 (8.5%) |
| $25,000 to $34,999 | 120 (19.7%) | 54 (19.2%) |
| $35,000 to $49,999 | 70 (11.5%) | 36 (12.8%) |
| $50,000 to $74,999 | 206 (33.9%) | 27 (9.6%) |
| $75,000 to $99,999 | 1 (0.2%) | 12 (4.3%) |
| $100,000 to $149,999 | 47 (7.7%) | 37 (13.1%) |
| $150,000 or more | 1 (0.2%) | 11 (3.9%) |
| Total | 608 (100.0%) | 282 (100.0%) |
Monthly Housing Cost Tiers in Hudspeth County
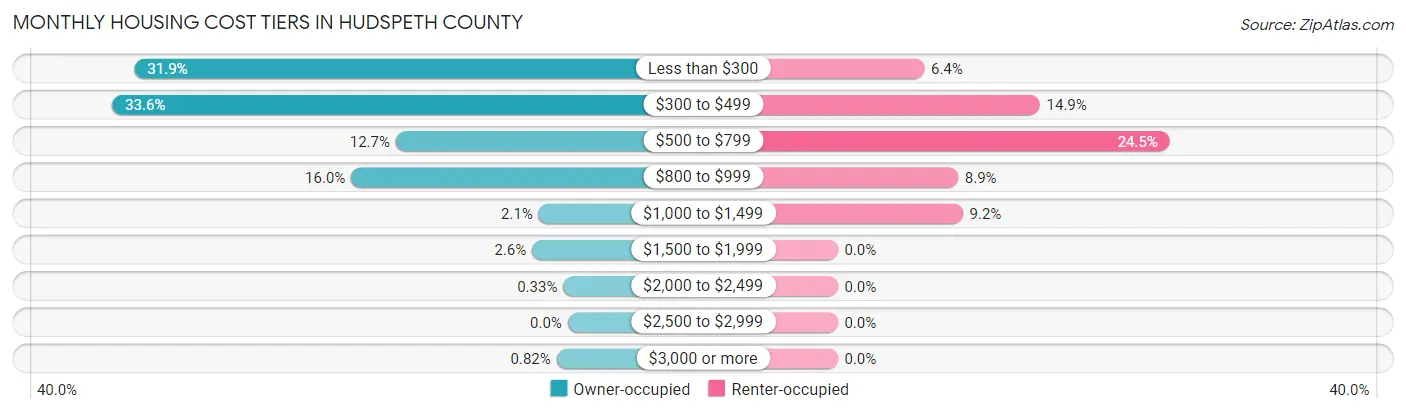
| Monthly Cost | Owner-occupied | Renter-occupied |
| Less than $300 | 194 (31.9%) | 18 (6.4%) |
| $300 to $499 | 204 (33.6%) | 42 (14.9%) |
| $500 to $799 | 77 (12.7%) | 69 (24.5%) |
| $800 to $999 | 97 (16.0%) | 25 (8.9%) |
| $1,000 to $1,499 | 13 (2.1%) | 26 (9.2%) |
| $1,500 to $1,999 | 16 (2.6%) | 0 (0.0%) |
| $2,000 to $2,499 | 2 (0.3%) | 0 (0.0%) |
| $2,500 to $2,999 | 0 (0.0%) | 0 (0.0%) |
| $3,000 or more | 5 (0.8%) | 0 (0.0%) |
| Total | 608 (100.0%) | 282 (100.0%) |
Physical Housing Characteristics in Hudspeth County
Housing Structures in Hudspeth County
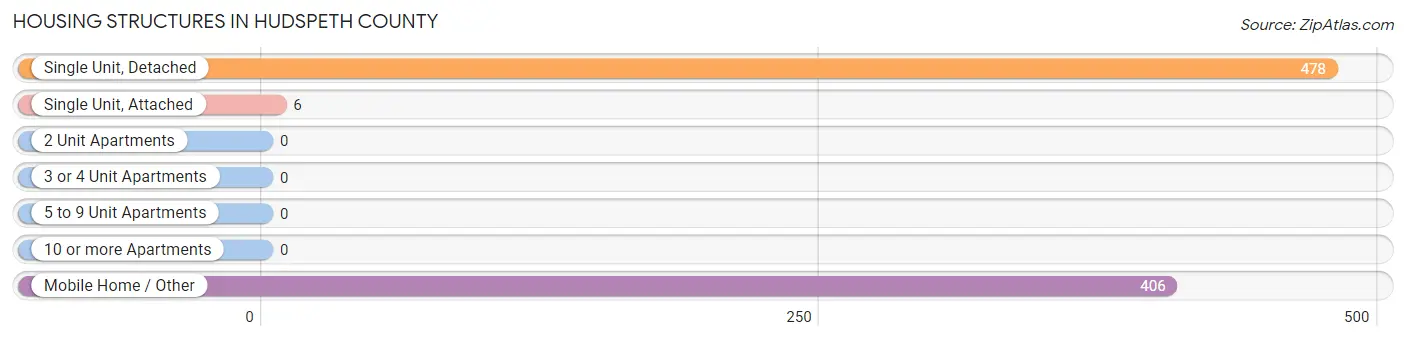
| Structure Type | # Housing Units | % Housing Units |
| Single Unit, Detached | 478 | 53.7% |
| Single Unit, Attached | 6 | 0.7% |
| 2 Unit Apartments | 0 | 0.0% |
| 3 or 4 Unit Apartments | 0 | 0.0% |
| 5 to 9 Unit Apartments | 0 | 0.0% |
| 10 or more Apartments | 0 | 0.0% |
| Mobile Home / Other | 406 | 45.6% |
| Total | 890 | 100.0% |
Housing Structures by Occupancy in Hudspeth County
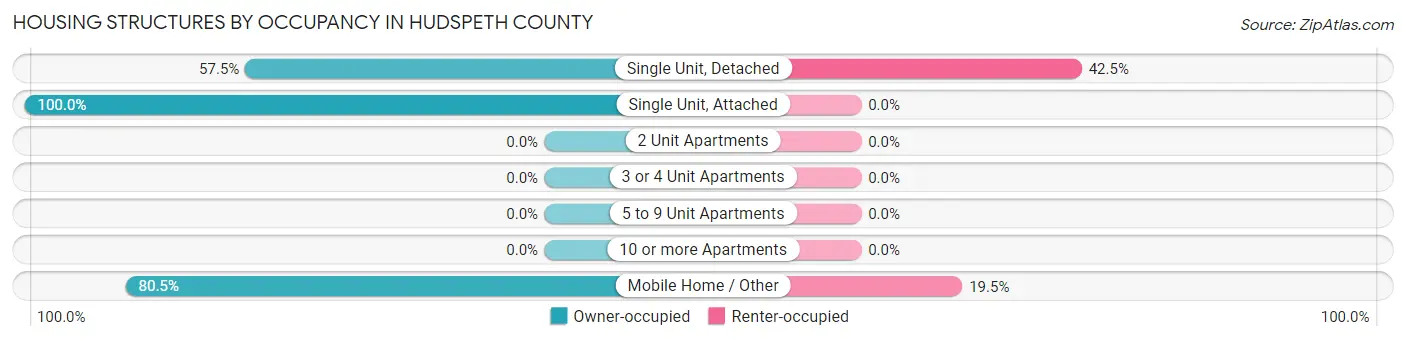
| Structure Type | Owner-occupied | Renter-occupied |
| Single Unit, Detached | 275 (57.5%) | 203 (42.5%) |
| Single Unit, Attached | 6 (100.0%) | 0 (0.0%) |
| 2 Unit Apartments | 0 (0.0%) | 0 (0.0%) |
| 3 or 4 Unit Apartments | 0 (0.0%) | 0 (0.0%) |
| 5 to 9 Unit Apartments | 0 (0.0%) | 0 (0.0%) |
| 10 or more Apartments | 0 (0.0%) | 0 (0.0%) |
| Mobile Home / Other | 327 (80.5%) | 79 (19.5%) |
| Total | 608 (68.3%) | 282 (31.7%) |
Housing Structures by Number of Rooms in Hudspeth County
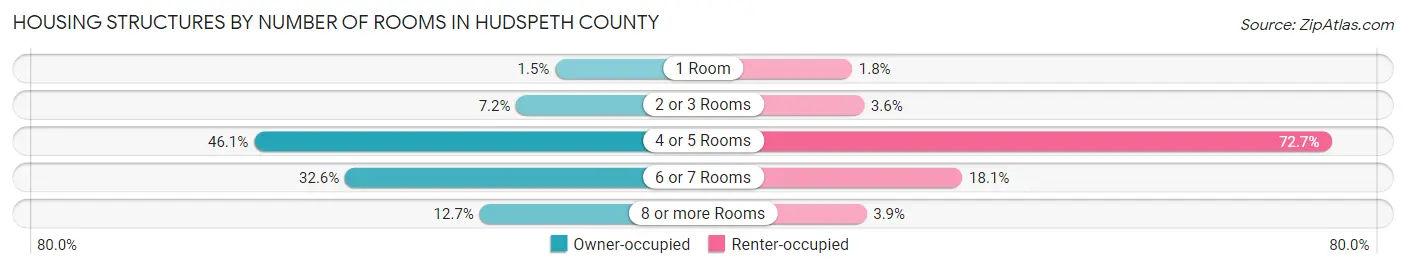
| Number of Rooms | Owner-occupied | Renter-occupied |
| 1 Room | 9 (1.5%) | 5 (1.8%) |
| 2 or 3 Rooms | 44 (7.2%) | 10 (3.5%) |
| 4 or 5 Rooms | 280 (46.1%) | 205 (72.7%) |
| 6 or 7 Rooms | 198 (32.6%) | 51 (18.1%) |
| 8 or more Rooms | 77 (12.7%) | 11 (3.9%) |
| Total | 608 (100.0%) | 282 (100.0%) |
Housing Structure by Heating Type in Hudspeth County
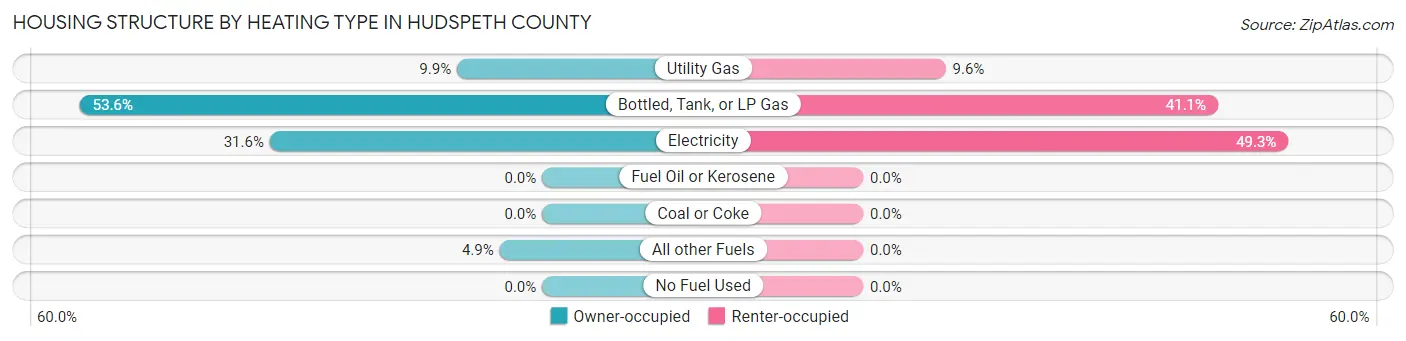
| Heating Type | Owner-occupied | Renter-occupied |
| Utility Gas | 60 (9.9%) | 27 (9.6%) |
| Bottled, Tank, or LP Gas | 326 (53.6%) | 116 (41.1%) |
| Electricity | 192 (31.6%) | 139 (49.3%) |
| Fuel Oil or Kerosene | 0 (0.0%) | 0 (0.0%) |
| Coal or Coke | 0 (0.0%) | 0 (0.0%) |
| All other Fuels | 30 (4.9%) | 0 (0.0%) |
| No Fuel Used | 0 (0.0%) | 0 (0.0%) |
| Total | 608 (100.0%) | 282 (100.0%) |
Household Vehicle Usage in Hudspeth County
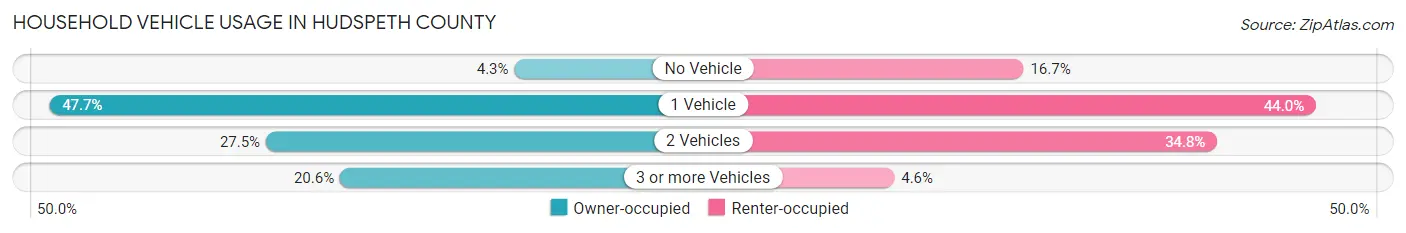
| Vehicles per Household | Owner-occupied | Renter-occupied |
| No Vehicle | 26 (4.3%) | 47 (16.7%) |
| 1 Vehicle | 290 (47.7%) | 124 (44.0%) |
| 2 Vehicles | 167 (27.5%) | 98 (34.7%) |
| 3 or more Vehicles | 125 (20.6%) | 13 (4.6%) |
| Total | 608 (100.0%) | 282 (100.0%) |
Real Estate & Mortgages in Hudspeth County
Real Estate and Mortgage Overview in Hudspeth County
| Characteristic | Without Mortgage | With Mortgage |
| Housing Units | 473 | 135 |
| Median Property Value | $48,500 | $73,000 |
| Median Household Income | $35,685 | $0 |
| Monthly Housing Costs | $321 | $5 |
| Real Estate Taxes | $647 | $3 |
Property Value by Mortgage Status in Hudspeth County
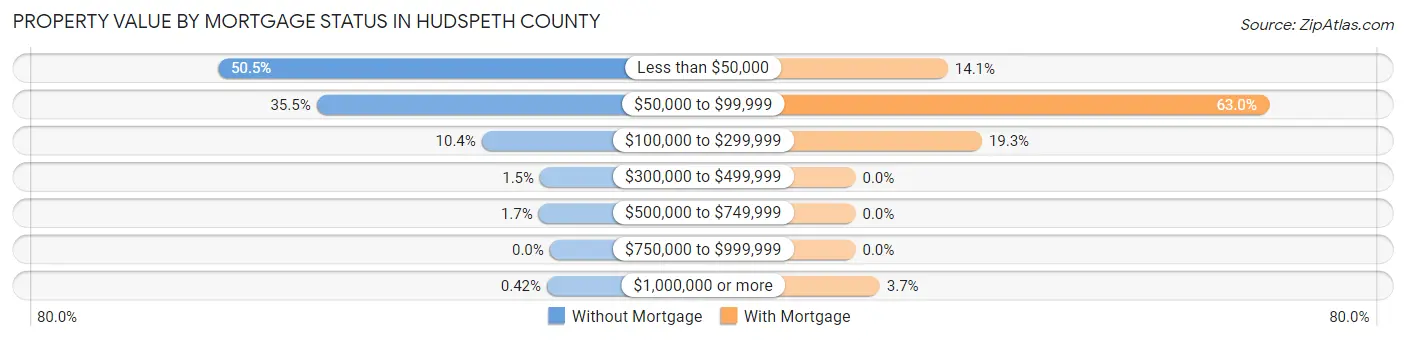
| Property Value | Without Mortgage | With Mortgage |
| Less than $50,000 | 239 (50.5%) | 19 (14.1%) |
| $50,000 to $99,999 | 168 (35.5%) | 85 (63.0%) |
| $100,000 to $299,999 | 49 (10.4%) | 26 (19.3%) |
| $300,000 to $499,999 | 7 (1.5%) | 0 (0.0%) |
| $500,000 to $749,999 | 8 (1.7%) | 0 (0.0%) |
| $750,000 to $999,999 | 0 (0.0%) | 0 (0.0%) |
| $1,000,000 or more | 2 (0.4%) | 5 (3.7%) |
| Total | 473 (100.0%) | 135 (100.0%) |
Household Income by Mortgage Status in Hudspeth County
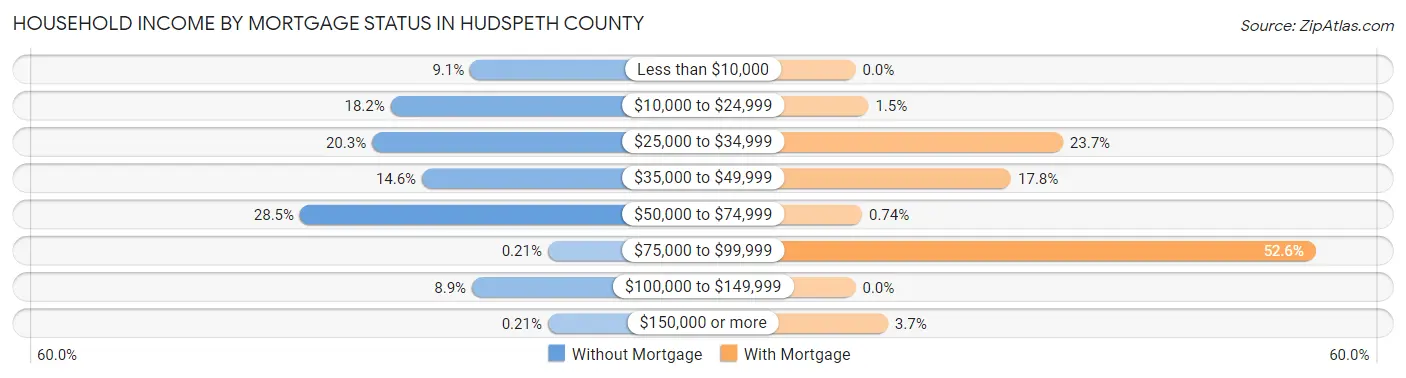
| Household Income | Without Mortgage | With Mortgage |
| Less than $10,000 | 43 (9.1%) | 0 (0.0%) |
| $10,000 to $24,999 | 86 (18.2%) | 2 (1.5%) |
| $25,000 to $34,999 | 96 (20.3%) | 32 (23.7%) |
| $35,000 to $49,999 | 69 (14.6%) | 24 (17.8%) |
| $50,000 to $74,999 | 135 (28.5%) | 1 (0.7%) |
| $75,000 to $99,999 | 1 (0.2%) | 71 (52.6%) |
| $100,000 to $149,999 | 42 (8.9%) | 0 (0.0%) |
| $150,000 or more | 1 (0.2%) | 5 (3.7%) |
| Total | 473 (100.0%) | 135 (100.0%) |
Property Value to Household Income Ratio in Hudspeth County
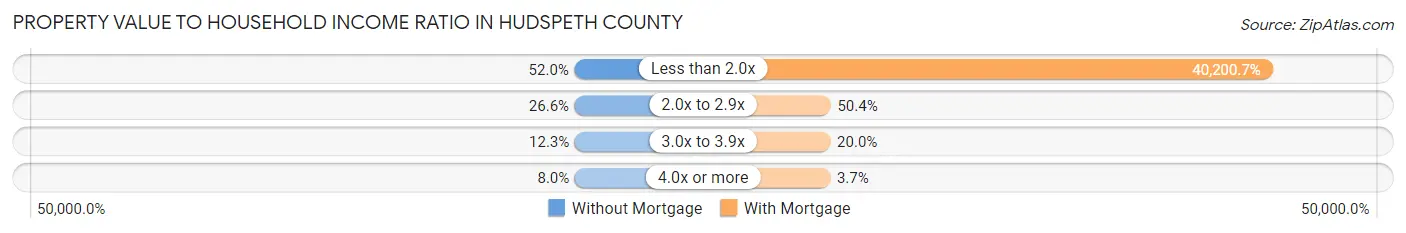
| Value-to-Income Ratio | Without Mortgage | With Mortgage |
| Less than 2.0x | 246 (52.0%) | 54,271 (40,200.7%) |
| 2.0x to 2.9x | 126 (26.6%) | 68 (50.4%) |
| 3.0x to 3.9x | 58 (12.3%) | 27 (20.0%) |
| 4.0x or more | 38 (8.0%) | 5 (3.7%) |
| Total | 473 (100.0%) | 135 (100.0%) |
Real Estate Taxes by Mortgage Status in Hudspeth County
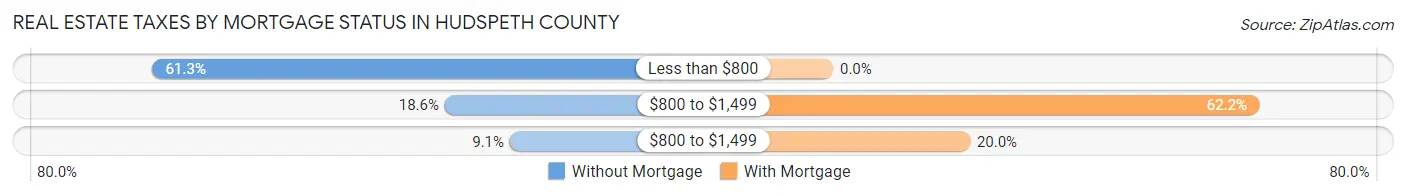
| Property Taxes | Without Mortgage | With Mortgage |
| Less than $800 | 290 (61.3%) | 0 (0.0%) |
| $800 to $1,499 | 88 (18.6%) | 84 (62.2%) |
| $800 to $1,499 | 43 (9.1%) | 27 (20.0%) |
| Total | 473 (100.0%) | 135 (100.0%) |
Health & Disability in Hudspeth County
Health Insurance Coverage by Age in Hudspeth County
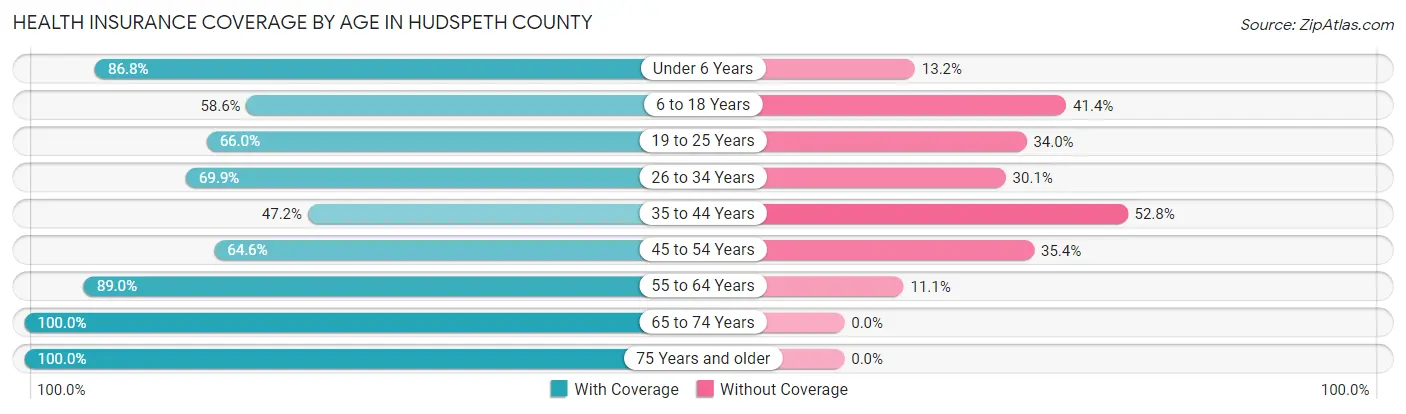
| Age Bracket | With Coverage | Without Coverage |
| Under 6 Years | 132 (86.8%) | 20 (13.2%) |
| 6 to 18 Years | 265 (58.6%) | 187 (41.4%) |
| 19 to 25 Years | 241 (66.0%) | 124 (34.0%) |
| 26 to 34 Years | 223 (69.9%) | 96 (30.1%) |
| 35 to 44 Years | 134 (47.2%) | 150 (52.8%) |
| 45 to 54 Years | 199 (64.6%) | 109 (35.4%) |
| 55 to 64 Years | 169 (88.9%) | 21 (11.1%) |
| 65 to 74 Years | 228 (100.0%) | 0 (0.0%) |
| 75 Years and older | 139 (100.0%) | 0 (0.0%) |
| Total | 1,730 (71.0%) | 707 (29.0%) |
Health Insurance Coverage by Citizenship Status in Hudspeth County
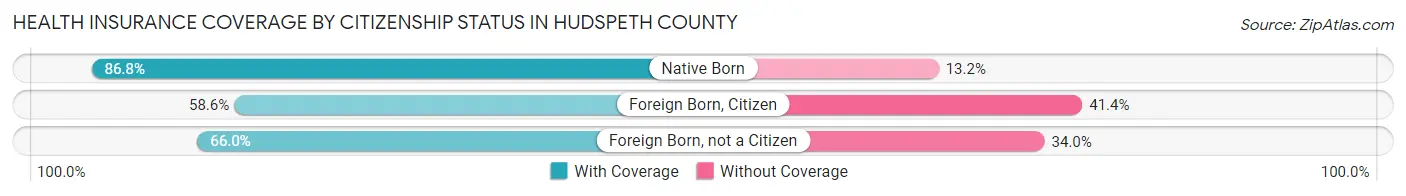
| Citizenship Status | With Coverage | Without Coverage |
| Native Born | 132 (86.8%) | 20 (13.2%) |
| Foreign Born, Citizen | 265 (58.6%) | 187 (41.4%) |
| Foreign Born, not a Citizen | 241 (66.0%) | 124 (34.0%) |
Health Insurance Coverage by Household Income in Hudspeth County
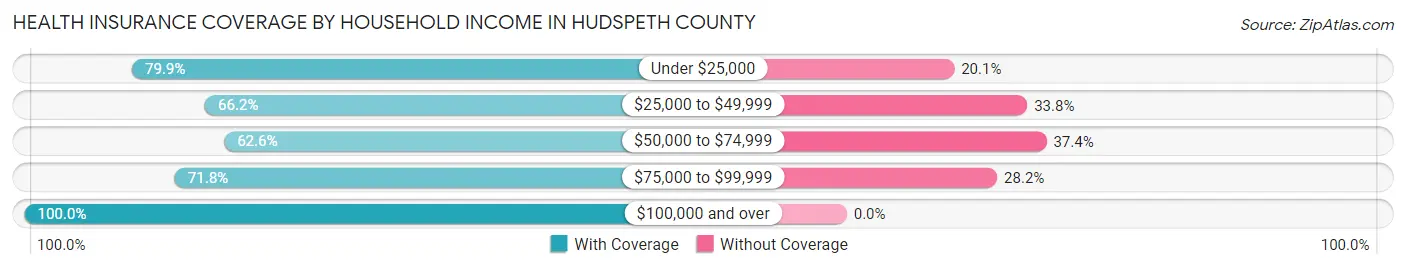
| Household Income | With Coverage | Without Coverage |
| Under $25,000 | 381 (79.9%) | 96 (20.1%) |
| $25,000 to $49,999 | 552 (66.2%) | 282 (33.8%) |
| $50,000 to $74,999 | 517 (62.6%) | 309 (37.4%) |
| $75,000 to $99,999 | 51 (71.8%) | 20 (28.2%) |
| $100,000 and over | 224 (100.0%) | 0 (0.0%) |
Public vs Private Health Insurance Coverage by Age in Hudspeth County
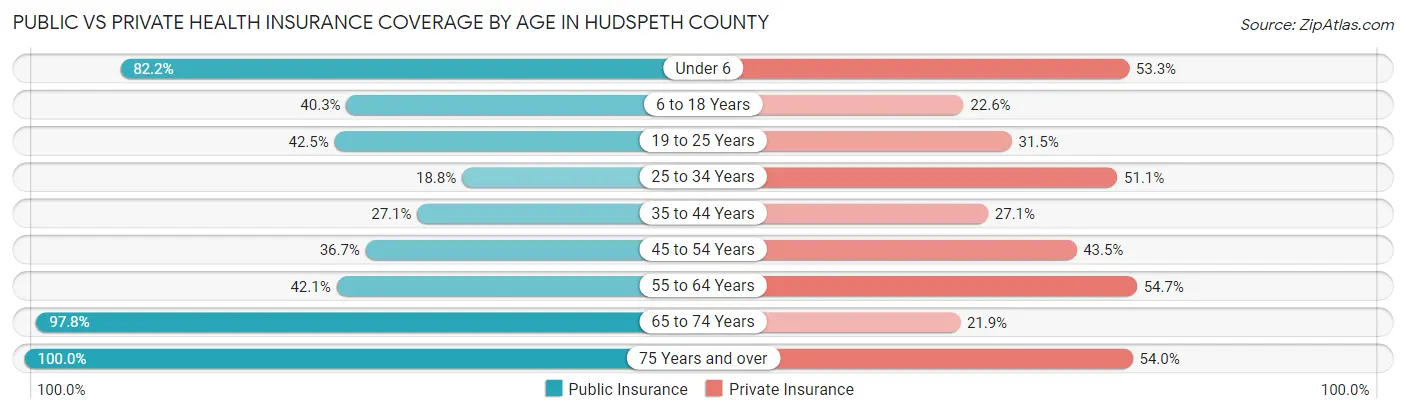
| Age Bracket | Public Insurance | Private Insurance |
| Under 6 | 125 (82.2%) | 81 (53.3%) |
| 6 to 18 Years | 182 (40.3%) | 102 (22.6%) |
| 19 to 25 Years | 155 (42.5%) | 115 (31.5%) |
| 25 to 34 Years | 60 (18.8%) | 163 (51.1%) |
| 35 to 44 Years | 77 (27.1%) | 77 (27.1%) |
| 45 to 54 Years | 113 (36.7%) | 134 (43.5%) |
| 55 to 64 Years | 80 (42.1%) | 104 (54.7%) |
| 65 to 74 Years | 223 (97.8%) | 50 (21.9%) |
| 75 Years and over | 139 (100.0%) | 75 (54.0%) |
| Total | 1,154 (47.3%) | 901 (37.0%) |
Disability Status by Sex by Age in Hudspeth County
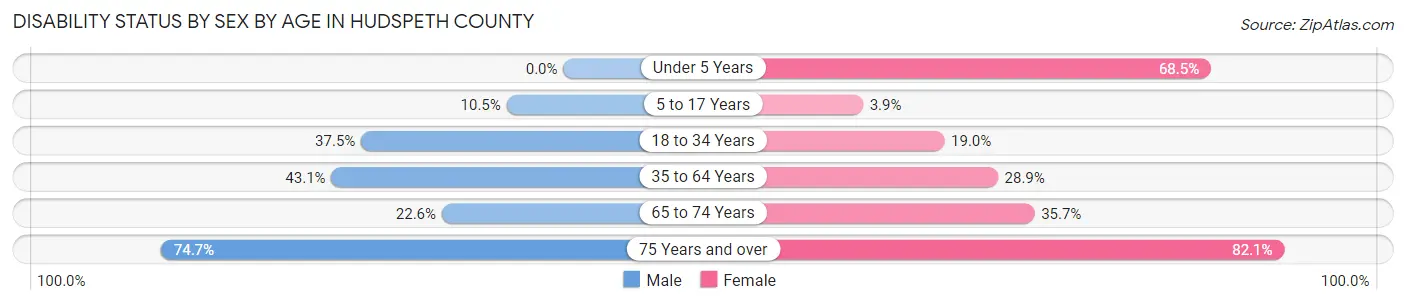
| Age Bracket | Male | Female |
| Under 5 Years | 0 (0.0%) | 74 (68.5%) |
| 5 to 17 Years | 22 (10.5%) | 9 (3.9%) |
| 18 to 34 Years | 182 (37.5%) | 45 (19.0%) |
| 35 to 64 Years | 161 (43.0%) | 118 (28.9%) |
| 65 to 74 Years | 23 (22.6%) | 45 (35.7%) |
| 75 Years and over | 62 (74.7%) | 46 (82.1%) |
Disability Class by Sex by Age in Hudspeth County
Disability Class: Hearing Difficulty
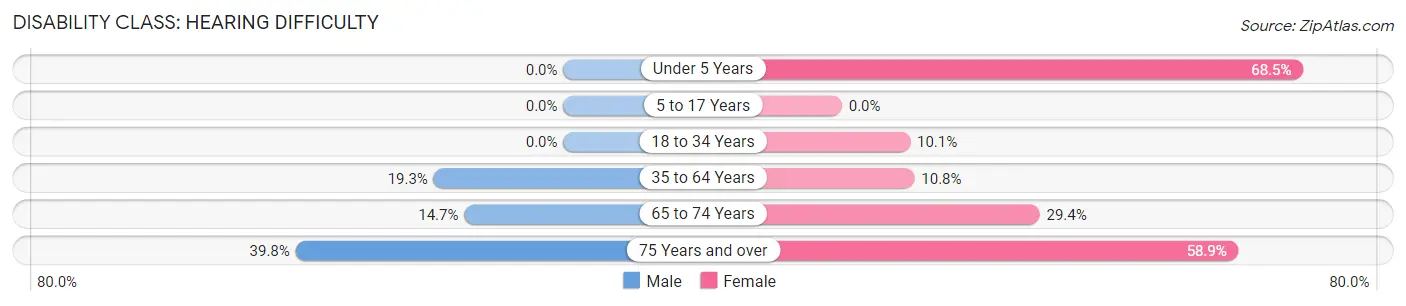
| Age Bracket | Male | Female |
| Under 5 Years | 0 (0.0%) | 74 (68.5%) |
| 5 to 17 Years | 0 (0.0%) | 0 (0.0%) |
| 18 to 34 Years | 0 (0.0%) | 24 (10.1%) |
| 35 to 64 Years | 72 (19.3%) | 44 (10.8%) |
| 65 to 74 Years | 15 (14.7%) | 37 (29.4%) |
| 75 Years and over | 33 (39.8%) | 33 (58.9%) |
Disability Class: Vision Difficulty
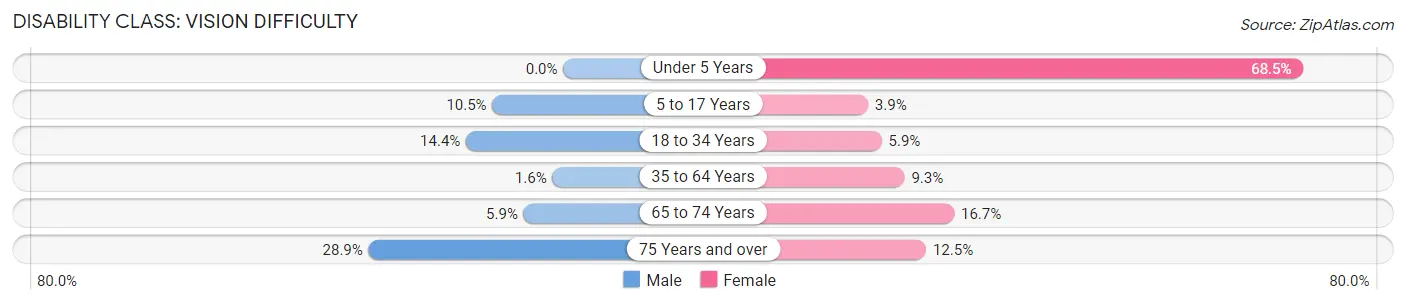
| Age Bracket | Male | Female |
| Under 5 Years | 0 (0.0%) | 74 (68.5%) |
| 5 to 17 Years | 22 (10.5%) | 9 (3.9%) |
| 18 to 34 Years | 70 (14.4%) | 14 (5.9%) |
| 35 to 64 Years | 6 (1.6%) | 38 (9.3%) |
| 65 to 74 Years | 6 (5.9%) | 21 (16.7%) |
| 75 Years and over | 24 (28.9%) | 7 (12.5%) |
Disability Class: Cognitive Difficulty
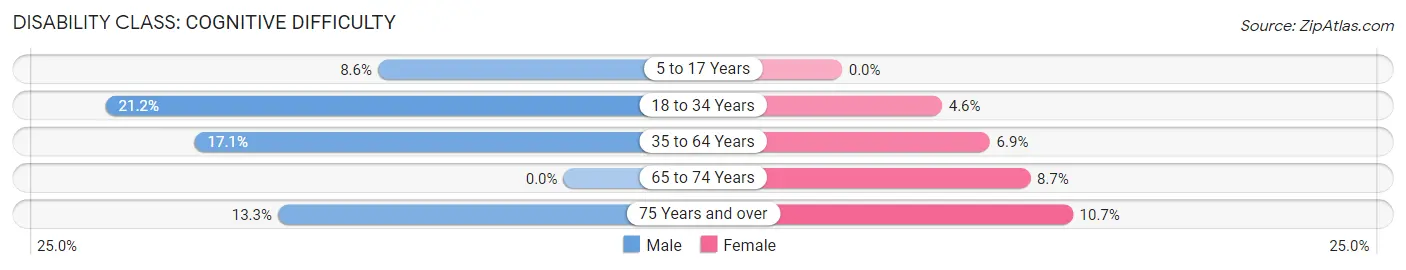
| Age Bracket | Male | Female |
| 5 to 17 Years | 18 (8.6%) | 0 (0.0%) |
| 18 to 34 Years | 103 (21.2%) | 11 (4.6%) |
| 35 to 64 Years | 64 (17.1%) | 28 (6.9%) |
| 65 to 74 Years | 0 (0.0%) | 11 (8.7%) |
| 75 Years and over | 11 (13.3%) | 6 (10.7%) |
Disability Class: Ambulatory Difficulty
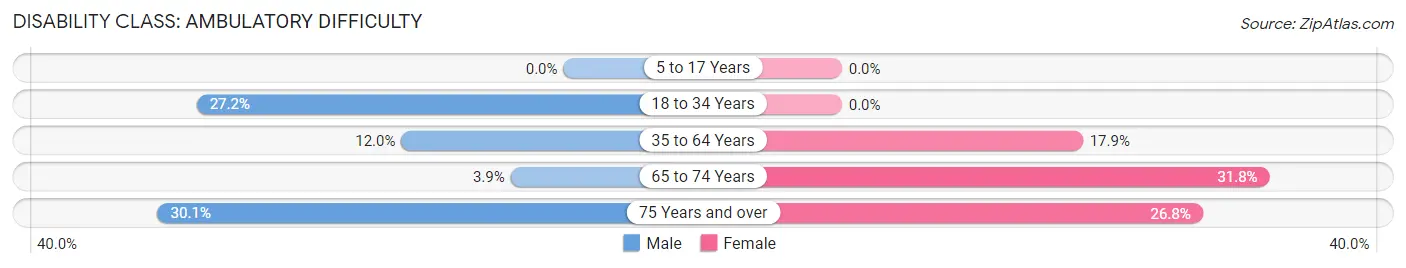
| Age Bracket | Male | Female |
| 5 to 17 Years | 0 (0.0%) | 0 (0.0%) |
| 18 to 34 Years | 132 (27.2%) | 0 (0.0%) |
| 35 to 64 Years | 45 (12.0%) | 73 (17.9%) |
| 65 to 74 Years | 4 (3.9%) | 40 (31.8%) |
| 75 Years and over | 25 (30.1%) | 15 (26.8%) |
Disability Class: Self-Care Difficulty
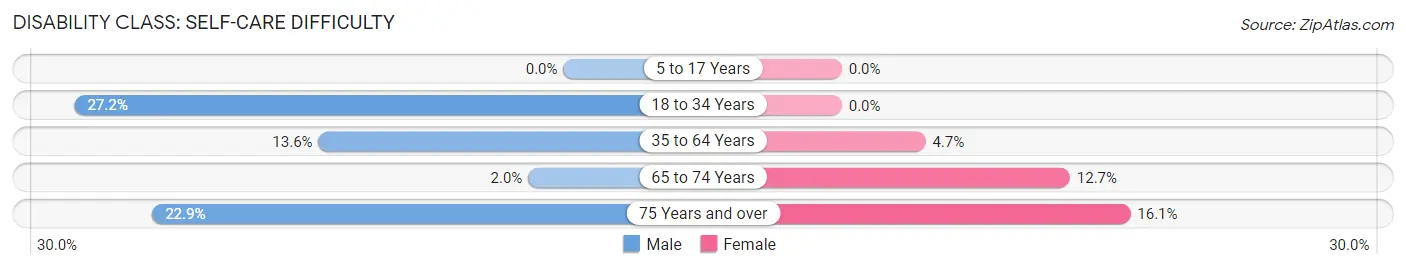
| Age Bracket | Male | Female |
| 5 to 17 Years | 0 (0.0%) | 0 (0.0%) |
| 18 to 34 Years | 132 (27.2%) | 0 (0.0%) |
| 35 to 64 Years | 51 (13.6%) | 19 (4.7%) |
| 65 to 74 Years | 2 (2.0%) | 16 (12.7%) |
| 75 Years and over | 19 (22.9%) | 9 (16.1%) |
Technology Access in Hudspeth County
Computing Device Access in Hudspeth County
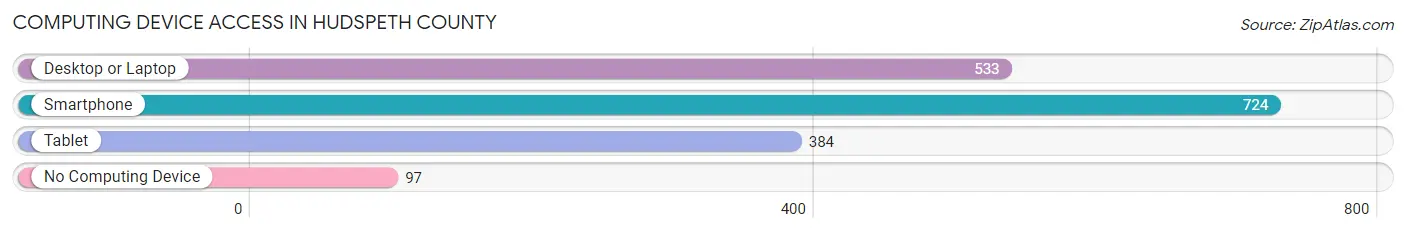
| Device Type | # Households | % Households |
| Desktop or Laptop | 533 | 59.9% |
| Smartphone | 724 | 81.4% |
| Tablet | 384 | 43.1% |
| No Computing Device | 97 | 10.9% |
| Total | 890 | 100.0% |
Internet Access in Hudspeth County
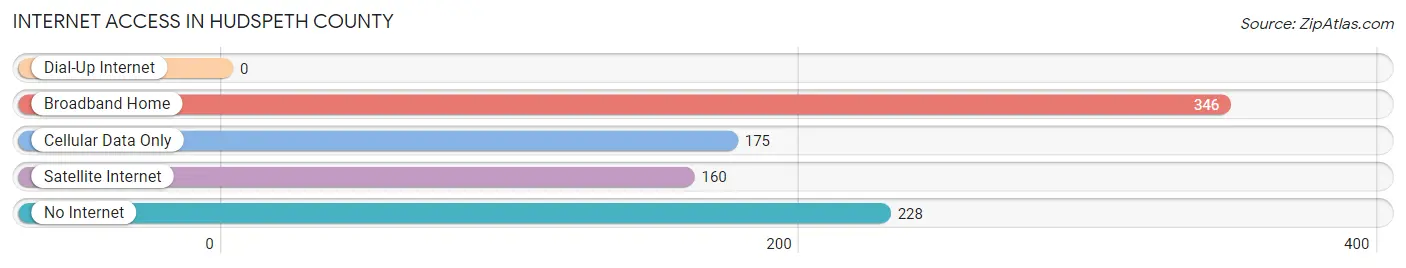
| Internet Type | # Households | % Households |
| Dial-Up Internet | 0 | 0.0% |
| Broadband Home | 346 | 38.9% |
| Cellular Data Only | 175 | 19.7% |
| Satellite Internet | 160 | 18.0% |
| No Internet | 228 | 25.6% |
| Total | 890 | 100.0% |
Hudspeth County Summary
Hudspeth County is located in the western part of Texas, along the Rio Grande River. It is bordered by El Paso County to the north, Culberson County to the east, and Mexico to the south and west. The county seat is Sierra Blanca, and the largest city is Fort Hancock. The county was created in 1917 from El Paso County and named for Claude Benton Hudspeth, a state senator and representative.
Geography
Hudspeth County covers an area of 3,856 square miles, making it the second-largest county in Texas. The terrain is mostly flat, with some rolling hills in the northern part of the county. The Rio Grande forms the county’s western border, and the Hueco Mountains are located in the northern part of the county. The county is home to several state parks, including Franklin Mountains State Park, Hueco Tanks State Historic Site, and Amistad National Recreation Area.
Economy
The economy of Hudspeth County is largely based on agriculture and ranching. The county is home to several large ranches, including the King Ranch, which is the largest ranch in the United States. Other major industries in the county include oil and gas production, mining, and tourism.
Demographics
As of the 2010 census, the population of Hudspeth County was 3,476. The population is largely Hispanic, with over 90% of the population identifying as Hispanic or Latino. The median household income in the county is $30,938, and the median age is 33.
History
Hudspeth County was created in 1917 from El Paso County. The county was named for Claude Benton Hudspeth, a state senator and representative. The county seat was originally located in Sierra Blanca, but was moved to Fort Hancock in 1921.
The county has a long history of ranching and agriculture. The King Ranch, one of the largest ranches in the United States, was established in Hudspeth County in 1853. The county also has a long history of oil and gas production, with the first oil well being drilled in the county in 1921.
In recent years, Hudspeth County has become a popular tourist destination. The county is home to several state parks, including Franklin Mountains State Park, Hueco Tanks State Historic Site, and Amistad National Recreation Area. The county is also home to the Big Bend National Park, which is one of the most popular tourist destinations in the state.
Hudspeth County is a unique and diverse county with a rich history and culture. The county is home to a variety of industries, from ranching and agriculture to oil and gas production and tourism. The county is also home to several state parks and the Big Bend National Park, making it a popular tourist destination. With its diverse population and economy, Hudspeth County is an important part of the state of Texas.
Common Questions
What is Per Capita Income in Hudspeth County?
Per Capita income in Hudspeth County is $16,368.
What is the Median Family Income in Hudspeth County?
Median Family Income in Hudspeth County is $50,125.
What is the Median Household income in Hudspeth County?
Median Household Income in Hudspeth County is $35,163.
What is Income or Wage Gap in Hudspeth County?
Income or Wage Gap in Hudspeth County is 57.3%.
Women in Hudspeth County earn 42.7 cents for every dollar earned by a man.
What is Inequality or Gini Index in Hudspeth County?
Inequality or Gini Index in Hudspeth County is 0.41.
What is the Total Population of Hudspeth County?
Total Population of Hudspeth County is 3,329.
What is the Total Male Population of Hudspeth County?
Total Male Population of Hudspeth County is 2,027.
What is the Total Female Population of Hudspeth County?
Total Female Population of Hudspeth County is 1,302.
What is the Ratio of Males per 100 Females in Hudspeth County?
There are 155.68 Males per 100 Females in Hudspeth County.
What is the Ratio of Females per 100 Males in Hudspeth County?
There are 64.23 Females per 100 Males in Hudspeth County.
What is the Median Population Age in Hudspeth County?
Median Population Age in Hudspeth County is 32.1 Years.
What is the Average Family Size in Hudspeth County
Average Family Size in Hudspeth County is 3.4 People.
What is the Average Household Size in Hudspeth County
Average Household Size in Hudspeth County is 2.7 People.
How Large is the Labor Force in Hudspeth County?
There are 1,053 People in the Labor Forcein in Hudspeth County.
What is the Percentage of People in the Labor Force in Hudspeth County?
36.6% of People are in the Labor Force in Hudspeth County.
What is the Unemployment Rate in Hudspeth County?
Unemployment Rate in Hudspeth County is 8.2%.