Houston County, TX Map & Demographics
Houston County Map
Houston County Overview
$25,346
PER CAPITA INCOME
$63,776
AVG FAMILY INCOME
$51,043
AVG HOUSEHOLD INCOME
38.3%
WAGE / INCOME GAP [ % ]
61.7¢/ $1
WAGE / INCOME GAP [ $ ]
$12,131
FAMILY INCOME DEFICIT
0.48
INEQUALITY / GINI INDEX
22,107
TOTAL POPULATION
12,021
MALE POPULATION
10,086
FEMALE POPULATION
119.19
MALES / 100 FEMALES
83.90
FEMALES / 100 MALES
43.9
MEDIAN AGE
3.1
AVG FAMILY SIZE
2.6
AVG HOUSEHOLD SIZE
8,193
LABOR FORCE [ PEOPLE ]
44.8%
PERCENT IN LABOR FORCE
4.5%
UNEMPLOYMENT RATE
Houston County Area Codes
Income in Houston County
Income Overview in Houston County
Per Capita Income in Houston County is $25,346, while median incomes of families and households are $63,776 and $51,043 respectively.
| Characteristic | Number | Measure |
| Per Capita Income | 22,107 | $25,346 |
| Median Family Income | 5,001 | $63,776 |
| Mean Family Income | 5,001 | $82,156 |
| Median Household Income | 7,464 | $51,043 |
| Mean Household Income | 7,464 | $71,244 |
| Income Deficit | 5,001 | $12,131 |
| Wage / Income Gap (%) | 22,107 | 38.26% |
| Wage / Income Gap ($) | 22,107 | 61.74¢ per $1 |
| Gini / Inequality Index | 22,107 | 0.48 |
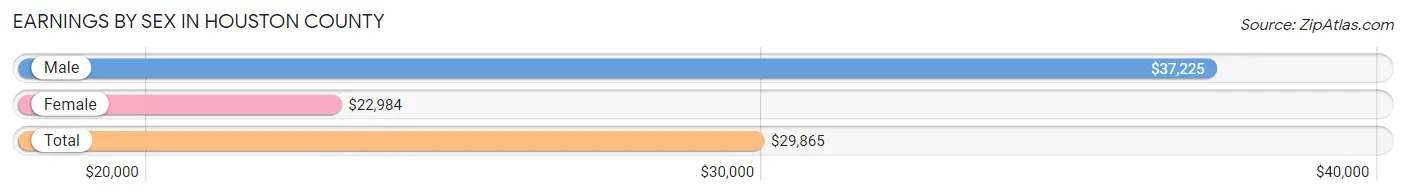
Earnings by Sex in Houston County
Average Earnings in Houston County are $29,865, $37,225 for men and $22,984 for women, a difference of 38.3%.
| Sex | Number | Average Earnings |
| Male | 4,241 (49.2%) | $37,225 |
| Female | 4,384 (50.8%) | $22,984 |
| Total | 8,625 (100.0%) | $29,865 |
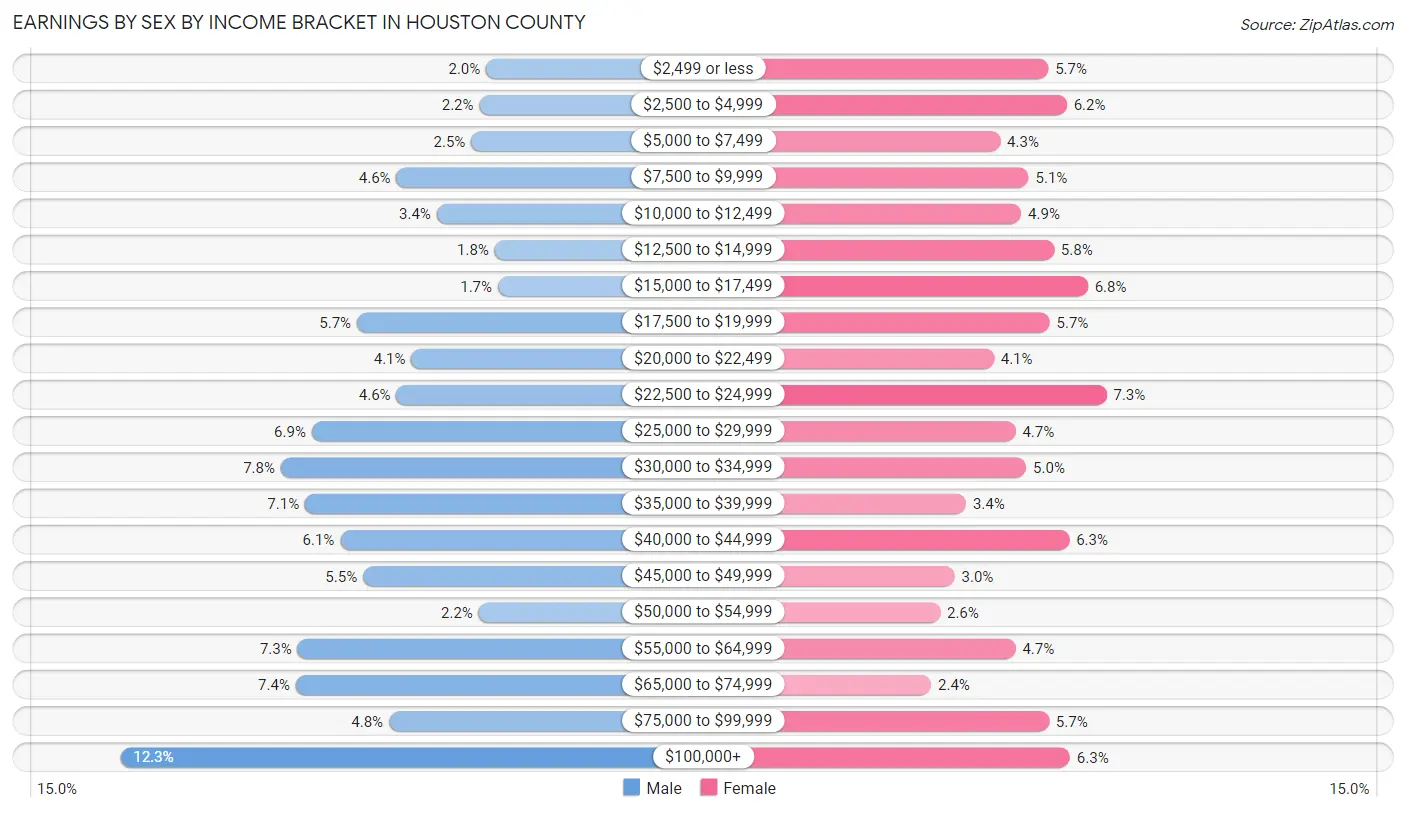
Earnings by Sex by Income Bracket in Houston County
The most common earnings brackets in Houston County are $100,000+ for men (522 | 12.3%) and $22,500 to $24,999 for women (320 | 7.3%).
| Income | Male | Female |
| $2,499 or less | 86 (2.0%) | 248 (5.7%) |
| $2,500 to $4,999 | 94 (2.2%) | 271 (6.2%) |
| $5,000 to $7,499 | 104 (2.5%) | 189 (4.3%) |
| $7,500 to $9,999 | 193 (4.5%) | 224 (5.1%) |
| $10,000 to $12,499 | 145 (3.4%) | 215 (4.9%) |
| $12,500 to $14,999 | 76 (1.8%) | 255 (5.8%) |
| $15,000 to $17,499 | 72 (1.7%) | 297 (6.8%) |
| $17,500 to $19,999 | 240 (5.7%) | 250 (5.7%) |
| $20,000 to $22,499 | 175 (4.1%) | 181 (4.1%) |
| $22,500 to $24,999 | 193 (4.5%) | 320 (7.3%) |
| $25,000 to $29,999 | 294 (6.9%) | 208 (4.7%) |
| $30,000 to $34,999 | 331 (7.8%) | 221 (5.0%) |
| $35,000 to $39,999 | 302 (7.1%) | 147 (3.4%) |
| $40,000 to $44,999 | 260 (6.1%) | 274 (6.2%) |
| $45,000 to $49,999 | 233 (5.5%) | 133 (3.0%) |
| $50,000 to $54,999 | 95 (2.2%) | 115 (2.6%) |
| $55,000 to $64,999 | 311 (7.3%) | 208 (4.7%) |
| $65,000 to $74,999 | 313 (7.4%) | 104 (2.4%) |
| $75,000 to $99,999 | 202 (4.8%) | 249 (5.7%) |
| $100,000+ | 522 (12.3%) | 275 (6.3%) |
| Total | 4,241 (100.0%) | 4,384 (100.0%) |
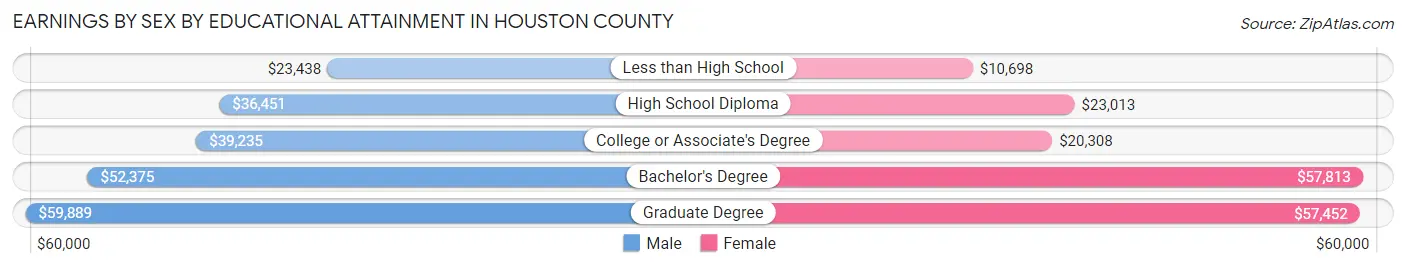
Earnings by Sex by Educational Attainment in Houston County
Average earnings in Houston County are $39,839 for men and $24,218 for women, a difference of 39.2%. Men with an educational attainment of graduate degree enjoy the highest average annual earnings of $59,889, while those with less than high school education earn the least with $23,438. Women with an educational attainment of bachelor's degree earn the most with the average annual earnings of $57,813, while those with less than high school education have the smallest earnings of $10,698.
| Educational Attainment | Male Income | Female Income |
| Less than High School | $23,438 | $10,698 |
| High School Diploma | $36,451 | $23,013 |
| College or Associate's Degree | $39,235 | $20,308 |
| Bachelor's Degree | $52,375 | $57,813 |
| Graduate Degree | $59,889 | $57,452 |
| Total | $39,839 | $24,218 |
Family Income in Houston County
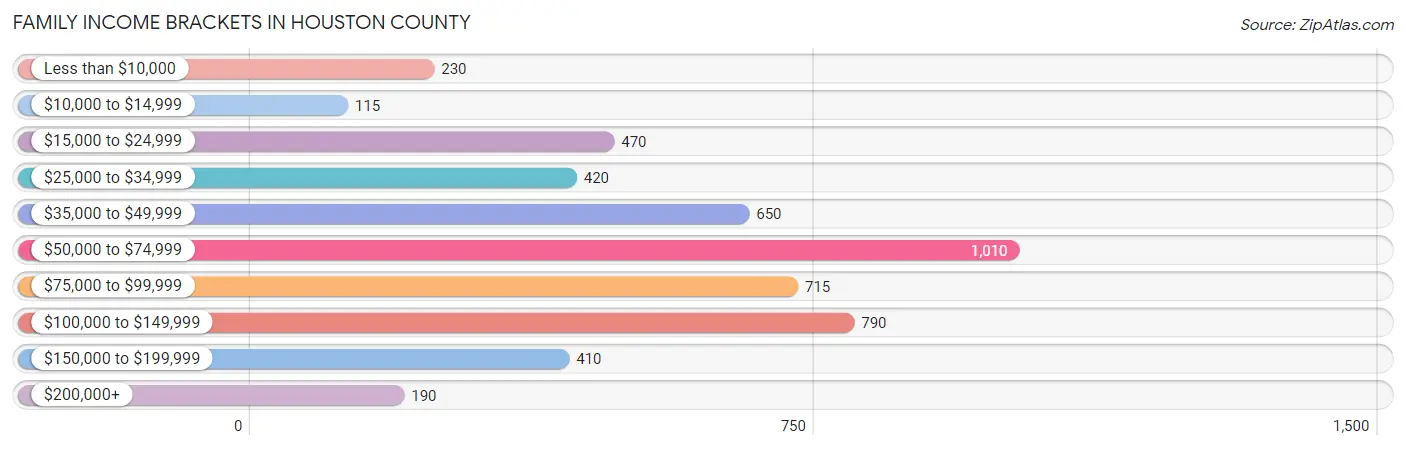
Family Income Brackets in Houston County
According to the Houston County family income data, there are 1,010 families falling into the $50,000 to $74,999 income range, which is the most common income bracket and makes up 20.2% of all families. Conversely, the $10,000 to $14,999 income bracket is the least frequent group with only 115 families (2.3%) belonging to this category.
| Income Bracket | # Families | % Families |
| Less than $10,000 | 230 | 4.6% |
| $10,000 to $14,999 | 115 | 2.3% |
| $15,000 to $24,999 | 470 | 9.4% |
| $25,000 to $34,999 | 420 | 8.4% |
| $35,000 to $49,999 | 650 | 13.0% |
| $50,000 to $74,999 | 1,010 | 20.2% |
| $75,000 to $99,999 | 715 | 14.3% |
| $100,000 to $149,999 | 790 | 15.8% |
| $150,000 to $199,999 | 410 | 8.2% |
| $200,000+ | 190 | 3.8% |
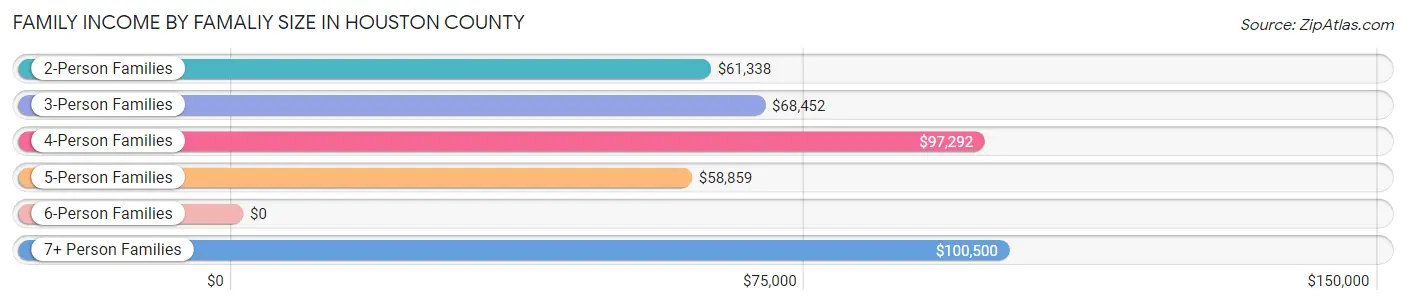
Family Income by Famaliy Size in Houston County
7+ person families (28 | 0.6%) account for the highest median family income in Houston County with $100,500 per family, while 2-person families (2,851 | 57.0%) have the highest median income of $30,669 per family member.
| Income Bracket | # Families | Median Income |
| 2-Person Families | 2,851 (57.0%) | $61,338 |
| 3-Person Families | 1,012 (20.2%) | $68,452 |
| 4-Person Families | 654 (13.1%) | $97,292 |
| 5-Person Families | 309 (6.2%) | $58,859 |
| 6-Person Families | 147 (2.9%) | $0 |
| 7+ Person Families | 28 (0.6%) | $100,500 |
| Total | 5,001 (100.0%) | $63,776 |
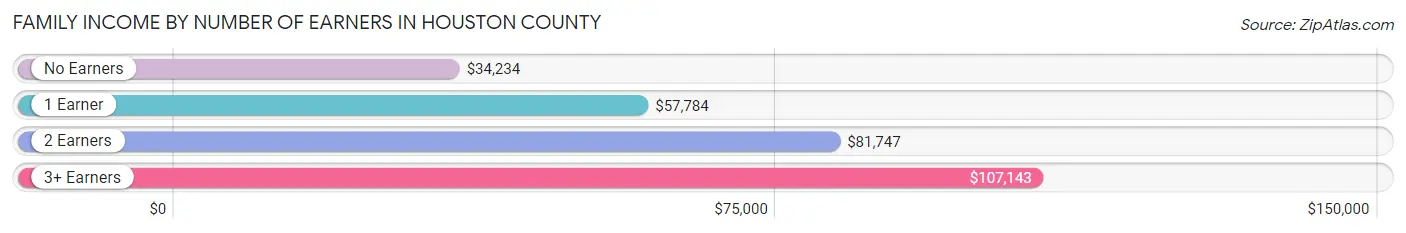
Family Income by Number of Earners in Houston County
The median family income in Houston County is $63,776, with families comprising 3+ earners (248) having the highest median family income of $107,143, while families with no earners (1,221) have the lowest median family income of $34,234, accounting for 5.0% and 24.4% of families, respectively.
| Number of Earners | # Families | Median Income |
| No Earners | 1,221 (24.4%) | $34,234 |
| 1 Earner | 1,615 (32.3%) | $57,784 |
| 2 Earners | 1,917 (38.3%) | $81,747 |
| 3+ Earners | 248 (5.0%) | $107,143 |
| Total | 5,001 (100.0%) | $63,776 |
Household Income in Houston County
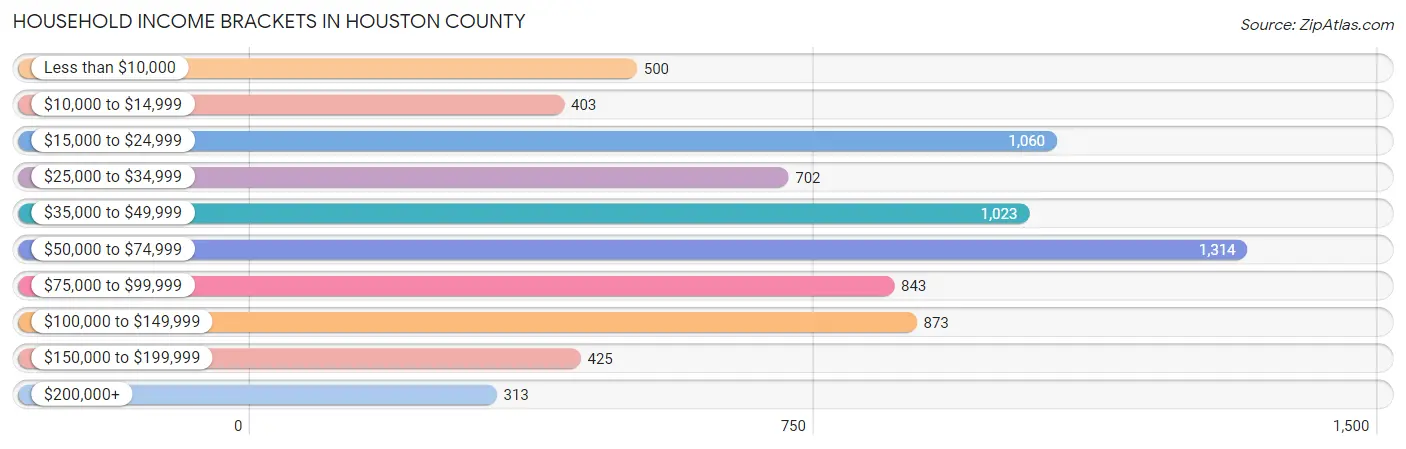
Household Income Brackets in Houston County
With 1,314 households falling in the category, the $50,000 to $74,999 income range is the most frequent in Houston County, accounting for 17.6% of all households. In contrast, only 313 households (4.2%) fall into the $200,000+ income bracket, making it the least populous group.
| Income Bracket | # Households | % Households |
| Less than $10,000 | 500 | 6.7% |
| $10,000 to $14,999 | 403 | 5.4% |
| $15,000 to $24,999 | 1,060 | 14.2% |
| $25,000 to $34,999 | 702 | 9.4% |
| $35,000 to $49,999 | 1,023 | 13.7% |
| $50,000 to $74,999 | 1,314 | 17.6% |
| $75,000 to $99,999 | 843 | 11.3% |
| $100,000 to $149,999 | 873 | 11.7% |
| $150,000 to $199,999 | 425 | 5.7% |
| $200,000+ | 313 | 4.2% |
Household Income by Householder Age in Houston County
The median household income in Houston County is $51,043, with the highest median household income of $56,280 found in the 45 to 64 years age bracket for the primary householder. A total of 2,579 households (34.5%) fall into this category. Meanwhile, the 15 to 24 years age bracket for the primary householder has the lowest median household income of $36,012, with 219 households (2.9%) in this group.
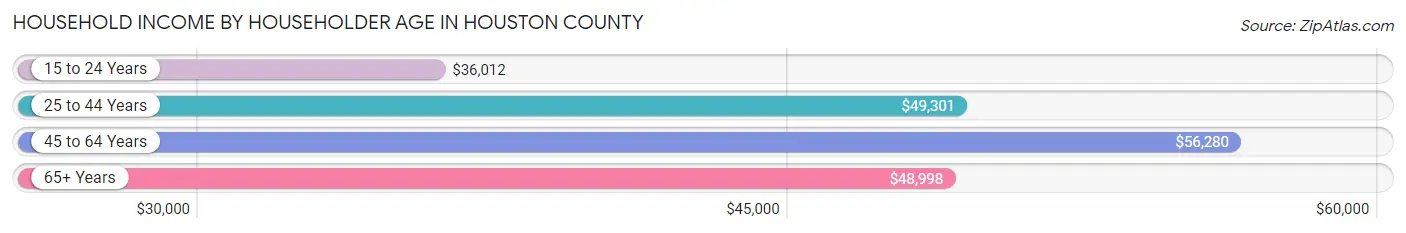
| Income Bracket | # Households | Median Income |
| 15 to 24 Years | 219 (2.9%) | $36,012 |
| 25 to 44 Years | 1,765 (23.6%) | $49,301 |
| 45 to 64 Years | 2,579 (34.5%) | $56,280 |
| 65+ Years | 2,901 (38.9%) | $48,998 |
| Total | 7,464 (100.0%) | $51,043 |
Poverty in Houston County
Income Below Poverty by Sex and Age in Houston County
With 17.7% poverty level for males and 17.5% for females among the residents of Houston County, 16 and 17 year old males and 5 year old females are the most vulnerable to poverty, with 102 males (38.5%) and 96 females (55.8%) in their respective age groups living below the poverty level.
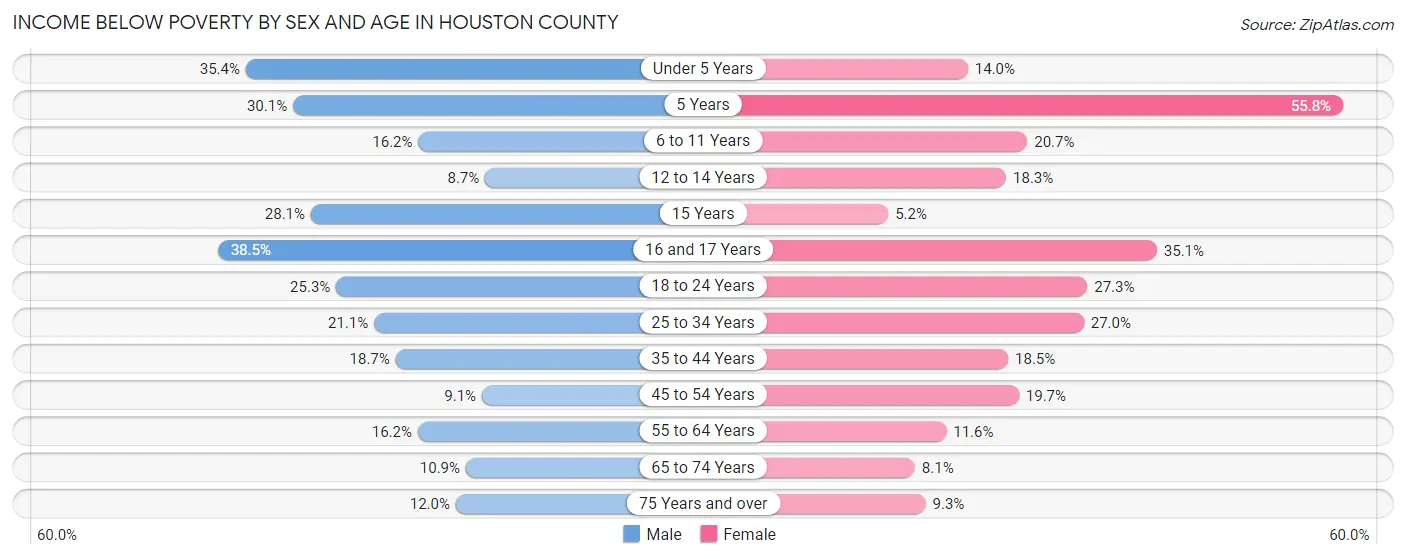
| Age Bracket | Male | Female |
| Under 5 Years | 214 (35.4%) | 65 (14.0%) |
| 5 Years | 56 (30.1%) | 96 (55.8%) |
| 6 to 11 Years | 109 (16.2%) | 137 (20.7%) |
| 12 to 14 Years | 35 (8.7%) | 71 (18.3%) |
| 15 Years | 27 (28.1%) | 6 (5.2%) |
| 16 and 17 Years | 102 (38.5%) | 80 (35.1%) |
| 18 to 24 Years | 170 (25.3%) | 193 (27.3%) |
| 25 to 34 Years | 231 (21.1%) | 280 (27.0%) |
| 35 to 44 Years | 184 (18.7%) | 202 (18.5%) |
| 45 to 54 Years | 92 (9.1%) | 213 (19.7%) |
| 55 to 64 Years | 182 (16.2%) | 166 (11.6%) |
| 65 to 74 Years | 132 (10.9%) | 111 (8.1%) |
| 75 Years and over | 113 (12.0%) | 107 (9.3%) |
| Total | 1,647 (17.7%) | 1,727 (17.5%) |
Income Above Poverty by Sex and Age in Houston County
According to the poverty statistics in Houston County, males aged 12 to 14 years and females aged 15 years are the age groups that are most secure financially, with 91.3% of males and 94.8% of females in these age groups living above the poverty line.
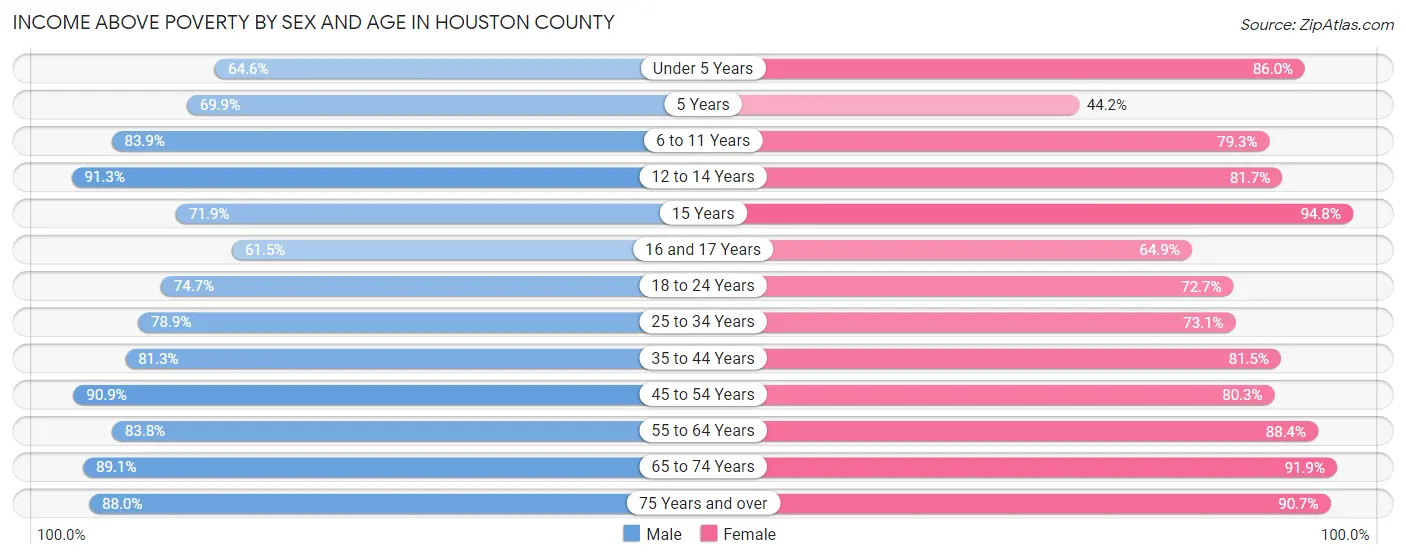
| Age Bracket | Male | Female |
| Under 5 Years | 391 (64.6%) | 398 (86.0%) |
| 5 Years | 130 (69.9%) | 76 (44.2%) |
| 6 to 11 Years | 566 (83.9%) | 526 (79.3%) |
| 12 to 14 Years | 367 (91.3%) | 317 (81.7%) |
| 15 Years | 69 (71.9%) | 110 (94.8%) |
| 16 and 17 Years | 163 (61.5%) | 148 (64.9%) |
| 18 to 24 Years | 502 (74.7%) | 513 (72.7%) |
| 25 to 34 Years | 865 (78.9%) | 759 (73.1%) |
| 35 to 44 Years | 801 (81.3%) | 889 (81.5%) |
| 45 to 54 Years | 922 (90.9%) | 867 (80.3%) |
| 55 to 64 Years | 941 (83.8%) | 1,260 (88.4%) |
| 65 to 74 Years | 1,084 (89.1%) | 1,252 (91.9%) |
| 75 Years and over | 830 (88.0%) | 1,040 (90.7%) |
| Total | 7,631 (82.3%) | 8,155 (82.5%) |
Income Below Poverty Among Married-Couple Families in Houston County
The poverty statistics for married-couple families in Houston County show that 6.7% or 246 of the total 3,688 families live below the poverty line. Families with 3 or 4 children have the highest poverty rate of 26.8%, comprising of 87 families. On the other hand, families with 5 or more children have the lowest poverty rate of 0.0%, which includes 0 families.
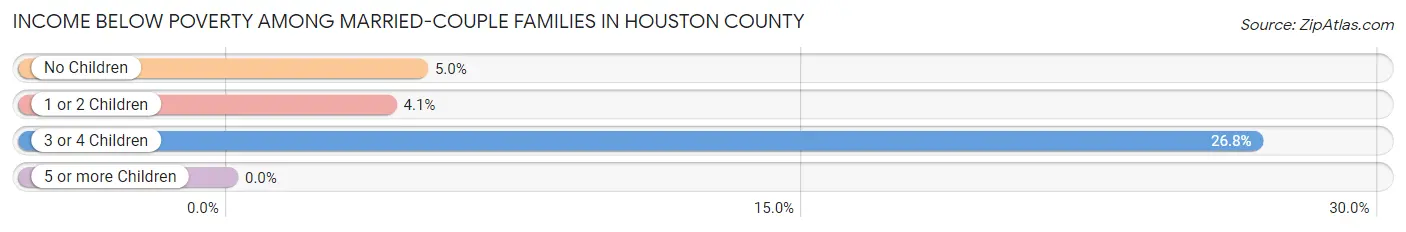
| Children | Above Poverty | Below Poverty |
| No Children | 2,299 (95.0%) | 120 (5.0%) |
| 1 or 2 Children | 902 (95.9%) | 39 (4.1%) |
| 3 or 4 Children | 238 (73.2%) | 87 (26.8%) |
| 5 or more Children | 3 (100.0%) | 0 (0.0%) |
| Total | 3,442 (93.3%) | 246 (6.7%) |
Income Below Poverty Among Single-Parent Households in Houston County
According to the poverty data in Houston County, 11.3% or 33 single-father households and 27.7% or 283 single-mother households are living below the poverty line. Among single-father households, those with 1 or 2 children have the highest poverty rate, with 23 households (12.9%) experiencing poverty. Likewise, among single-mother households, those with 5 or more children have the highest poverty rate, with 16 households (100.0%) falling below the poverty line.
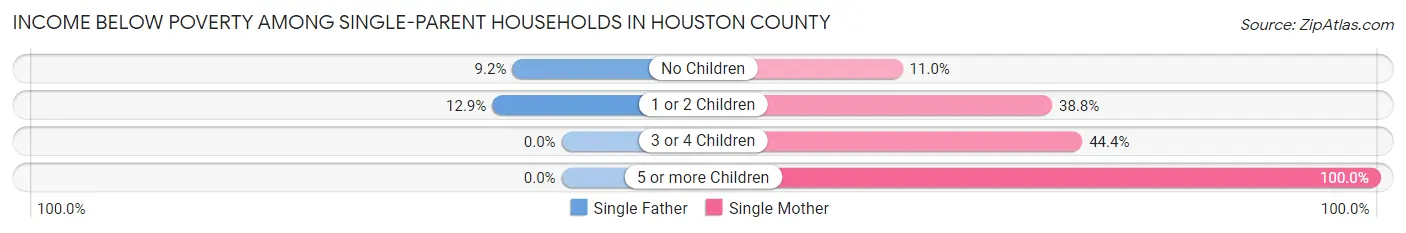
| Children | Single Father | Single Mother |
| No Children | 10 (9.2%) | 49 (11.0%) |
| 1 or 2 Children | 23 (12.9%) | 210 (38.8%) |
| 3 or 4 Children | 0 (0.0%) | 8 (44.4%) |
| 5 or more Children | 0 (0.0%) | 16 (100.0%) |
| Total | 33 (11.3%) | 283 (27.7%) |
Income Below Poverty Among Married-Couple vs Single-Parent Households in Houston County
The poverty data for Houston County shows that 246 of the married-couple family households (6.7%) and 316 of the single-parent households (24.1%) are living below the poverty level. Within the married-couple family households, those with 3 or 4 children have the highest poverty rate, with 87 households (26.8%) falling below the poverty line. Among the single-parent households, those with 5 or more children have the highest poverty rate, with 16 household (76.2%) living below poverty.
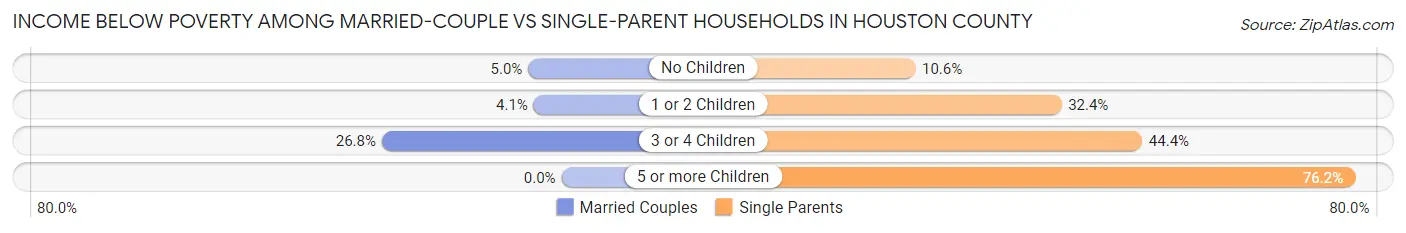
| Children | Married-Couple Families | Single-Parent Households |
| No Children | 120 (5.0%) | 59 (10.6%) |
| 1 or 2 Children | 39 (4.1%) | 233 (32.4%) |
| 3 or 4 Children | 87 (26.8%) | 8 (44.4%) |
| 5 or more Children | 0 (0.0%) | 16 (76.2%) |
| Total | 246 (6.7%) | 316 (24.1%) |
Race in Houston County
The most populous races in Houston County are White / Caucasian (14,500 | 65.6%), Black / African American (5,368 | 24.3%), and Hispanic or Latino (2,713 | 12.3%).
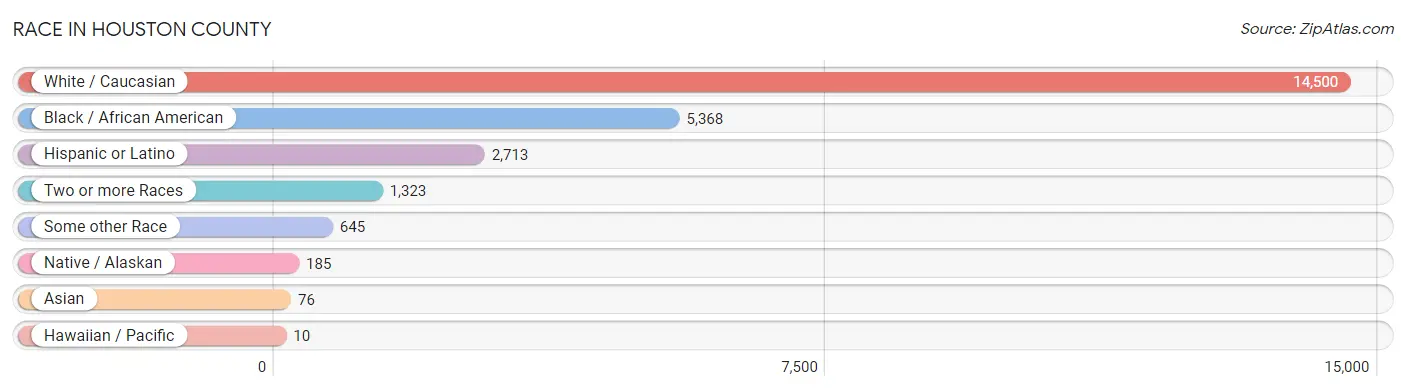
| Race | # Population | % Population |
| Asian | 76 | 0.3% |
| Black / African American | 5,368 | 24.3% |
| Hawaiian / Pacific | 10 | 0.1% |
| Hispanic or Latino | 2,713 | 12.3% |
| Native / Alaskan | 185 | 0.8% |
| White / Caucasian | 14,500 | 65.6% |
| Two or more Races | 1,323 | 6.0% |
| Some other Race | 645 | 2.9% |
| Total | 22,107 | 100.0% |
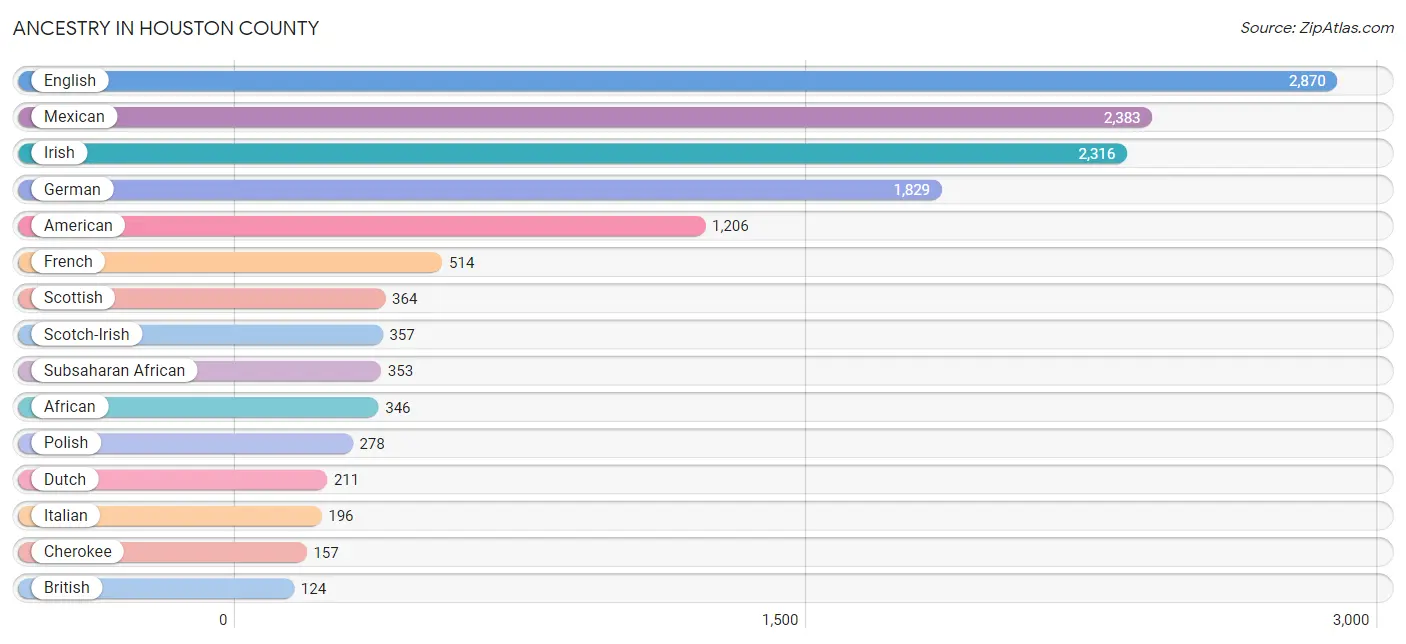
Ancestry in Houston County
The most populous ancestries reported in Houston County are English (2,870 | 13.0%), Mexican (2,383 | 10.8%), Irish (2,316 | 10.5%), German (1,829 | 8.3%), and American (1,206 | 5.5%), together accounting for 48.0% of all Houston County residents.
| Ancestry | # Population | % Population |
| African | 346 | 1.6% |
| American | 1,206 | 5.5% |
| Apache | 23 | 0.1% |
| Arab | 31 | 0.1% |
| Austrian | 11 | 0.1% |
| Bhutanese | 6 | 0.0% |
| Blackfeet | 9 | 0.0% |
| British | 124 | 0.6% |
| Burmese | 11 | 0.1% |
| Cajun | 21 | 0.1% |
| Central American | 21 | 0.1% |
| Cherokee | 157 | 0.7% |
| Cheyenne | 4 | 0.0% |
| Choctaw | 47 | 0.2% |
| Cuban | 5 | 0.0% |
| Czech | 48 | 0.2% |
| Czechoslovakian | 4 | 0.0% |
| Danish | 48 | 0.2% |
| Dominican | 12 | 0.1% |
| Dutch | 211 | 0.9% |
| Dutch West Indian | 48 | 0.2% |
| Eastern European | 2 | 0.0% |
| Ecuadorian | 28 | 0.1% |
| English | 2,870 | 13.0% |
| European | 54 | 0.2% |
| Finnish | 61 | 0.3% |
| French | 514 | 2.3% |
| French Canadian | 11 | 0.1% |
| German | 1,829 | 8.3% |
| Greek | 18 | 0.1% |
| Guamanian / Chamorro | 10 | 0.1% |
| Guatemalan | 4 | 0.0% |
| Honduran | 17 | 0.1% |
| Indian (Asian) | 18 | 0.1% |
| Irish | 2,316 | 10.5% |
| Israeli | 7 | 0.0% |
| Italian | 196 | 0.9% |
| Jamaican | 23 | 0.1% |
| Japanese | 10 | 0.1% |
| Korean | 54 | 0.2% |
| Lithuanian | 6 | 0.0% |
| Malaysian | 7 | 0.0% |
| Mexican | 2,383 | 10.8% |
| Mexican American Indian | 59 | 0.3% |
| Native Hawaiian | 6 | 0.0% |
| Northern European | 48 | 0.2% |
| Norwegian | 76 | 0.3% |
| Pakistani | 9 | 0.0% |
| Peruvian | 7 | 0.0% |
| Polish | 278 | 1.3% |
| Portuguese | 48 | 0.2% |
| Potawatomi | 41 | 0.2% |
| Puerto Rican | 77 | 0.4% |
| Romanian | 1 | 0.0% |
| Russian | 28 | 0.1% |
| Samoan | 6 | 0.0% |
| Scandinavian | 105 | 0.5% |
| Scotch-Irish | 357 | 1.6% |
| Scottish | 364 | 1.7% |
| Sioux | 24 | 0.1% |
| South American | 35 | 0.2% |
| Spaniard | 18 | 0.1% |
| Spanish | 26 | 0.1% |
| Sri Lankan | 6 | 0.0% |
| Subsaharan African | 353 | 1.6% |
| Sudanese | 7 | 0.0% |
| Swedish | 107 | 0.5% |
| Thai | 10 | 0.1% |
| Ukrainian | 7 | 0.0% |
| Welsh | 78 | 0.4% |
| Yaqui | 17 | 0.1% | View All 71 Rows |
Immigrants in Houston County
The most numerous immigrant groups reported in Houston County came from Latin America (535 | 2.4%), Central America (493 | 2.2%), Mexico (482 | 2.2%), Asia (71 | 0.3%), and South Eastern Asia (67 | 0.3%), together accounting for 7.4% of all Houston County residents.
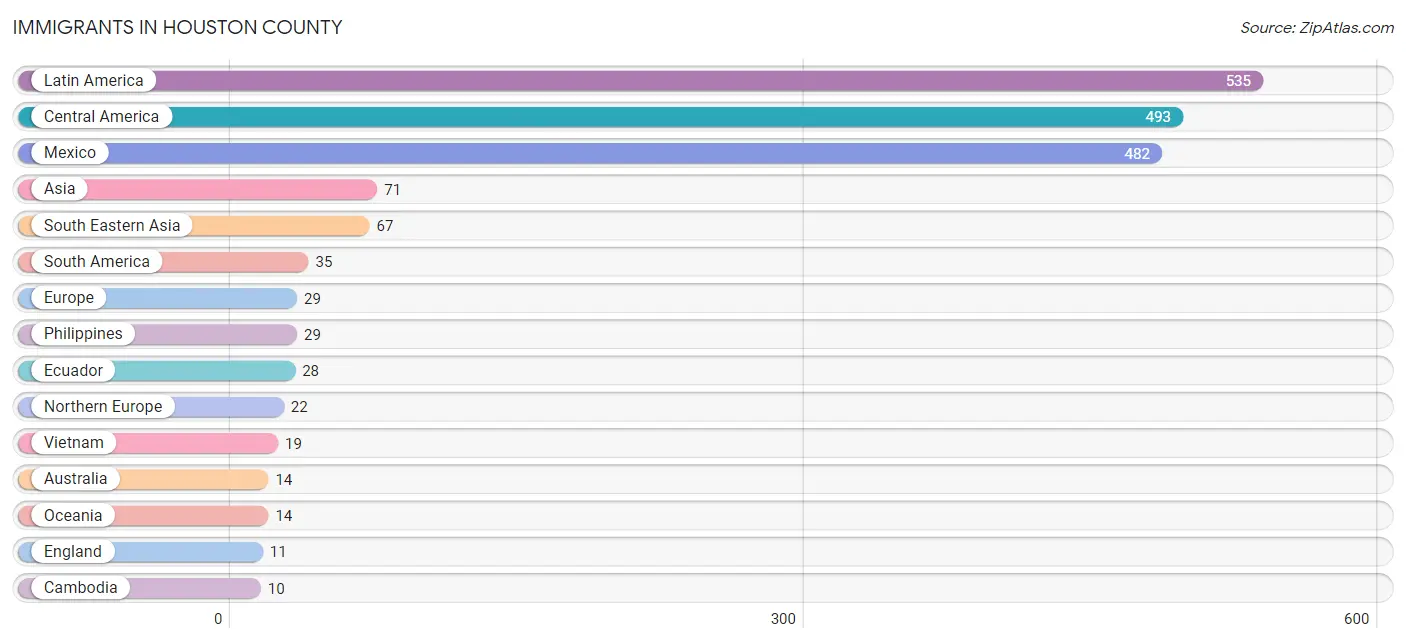
| Immigration Origin | # Population | % Population |
| Asia | 71 | 0.3% |
| Australia | 14 | 0.1% |
| Cambodia | 10 | 0.1% |
| Caribbean | 7 | 0.0% |
| Central America | 493 | 2.2% |
| Ecuador | 28 | 0.1% |
| England | 11 | 0.1% |
| Europe | 29 | 0.1% |
| Greece | 7 | 0.0% |
| Guatemala | 4 | 0.0% |
| Honduras | 7 | 0.0% |
| India | 4 | 0.0% |
| Jamaica | 7 | 0.0% |
| Latin America | 535 | 2.4% |
| Mexico | 482 | 2.2% |
| Northern Europe | 22 | 0.1% |
| Oceania | 14 | 0.1% |
| Peru | 7 | 0.0% |
| Philippines | 29 | 0.1% |
| South America | 35 | 0.2% |
| South Central Asia | 4 | 0.0% |
| South Eastern Asia | 67 | 0.3% |
| Southern Europe | 7 | 0.0% |
| Thailand | 9 | 0.0% |
| Vietnam | 19 | 0.1% | View All 25 Rows |
Sex and Age in Houston County
Sex and Age in Houston County
The most populous age groups in Houston County are 40 to 44 Years (947 | 7.9%) for men and 55 to 59 Years (838 | 8.3%) for women.
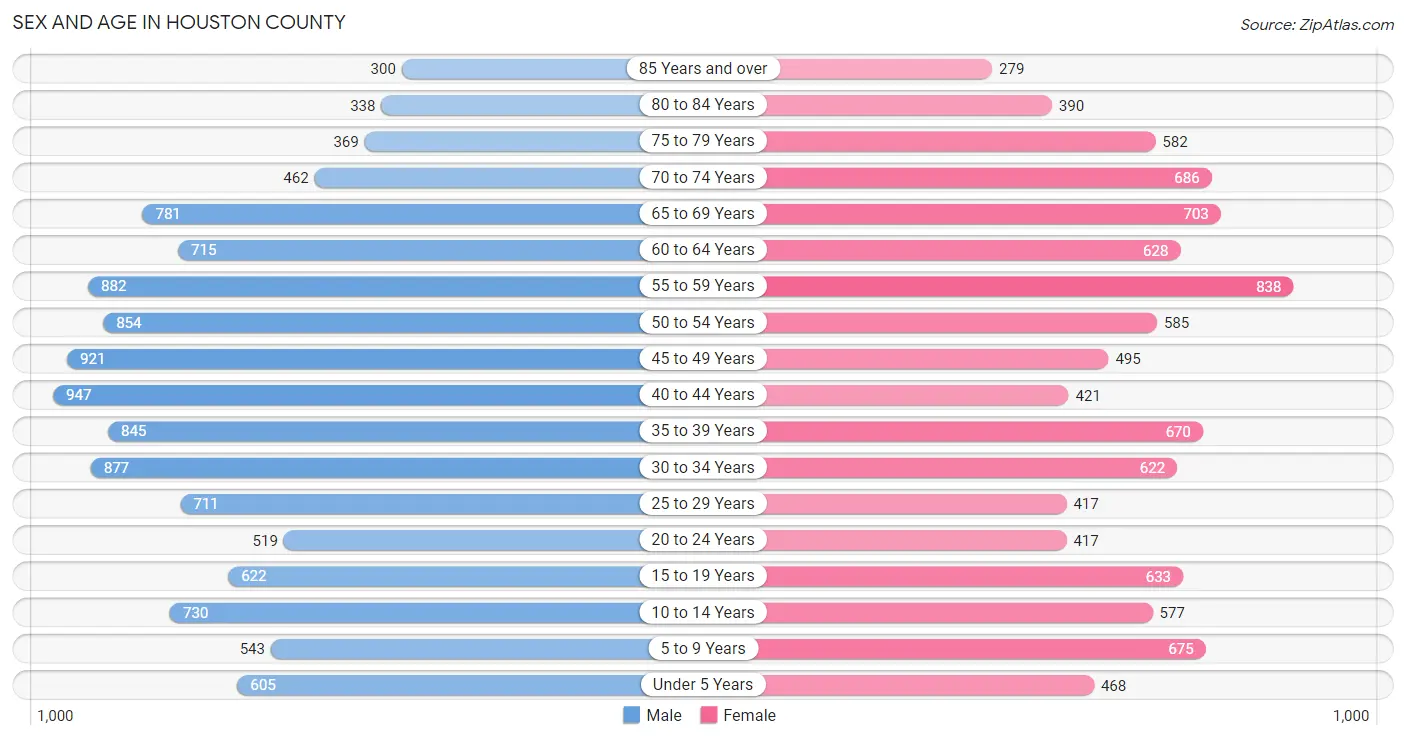
| Age Bracket | Male | Female |
| Under 5 Years | 605 (5.0%) | 468 (4.6%) |
| 5 to 9 Years | 543 (4.5%) | 675 (6.7%) |
| 10 to 14 Years | 730 (6.1%) | 577 (5.7%) |
| 15 to 19 Years | 622 (5.2%) | 633 (6.3%) |
| 20 to 24 Years | 519 (4.3%) | 417 (4.1%) |
| 25 to 29 Years | 711 (5.9%) | 417 (4.1%) |
| 30 to 34 Years | 877 (7.3%) | 622 (6.2%) |
| 35 to 39 Years | 845 (7.0%) | 670 (6.6%) |
| 40 to 44 Years | 947 (7.9%) | 421 (4.2%) |
| 45 to 49 Years | 921 (7.7%) | 495 (4.9%) |
| 50 to 54 Years | 854 (7.1%) | 585 (5.8%) |
| 55 to 59 Years | 882 (7.3%) | 838 (8.3%) |
| 60 to 64 Years | 715 (5.9%) | 628 (6.2%) |
| 65 to 69 Years | 781 (6.5%) | 703 (7.0%) |
| 70 to 74 Years | 462 (3.8%) | 686 (6.8%) |
| 75 to 79 Years | 369 (3.1%) | 582 (5.8%) |
| 80 to 84 Years | 338 (2.8%) | 390 (3.9%) |
| 85 Years and over | 300 (2.5%) | 279 (2.8%) |
| Total | 12,021 (100.0%) | 10,086 (100.0%) |
Families and Households in Houston County
Median Family Size in Houston County
The median family size in Houston County is 3.14 persons per family, with single male/father families (292 | 5.8%) accounting for the largest median family size of 3.47 persons per family. On the other hand, married-couple families (3,688 | 73.8%) represent the smallest median family size with 3.04 persons per family.
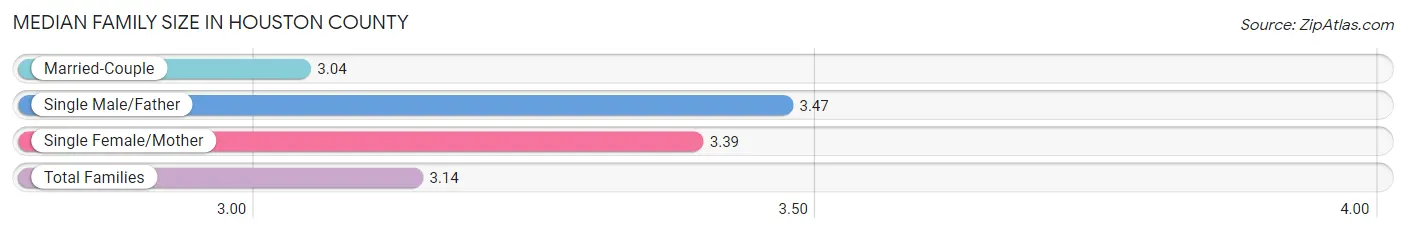
| Family Type | # Families | Family Size |
| Married-Couple | 3,688 (73.8%) | 3.04 |
| Single Male/Father | 292 (5.8%) | 3.47 |
| Single Female/Mother | 1,021 (20.4%) | 3.39 |
| Total Families | 5,001 (100.0%) | 3.14 |
Median Household Size in Houston County
The median household size in Houston County is 2.56 persons per household, with single female/mother households (1,021 | 13.7%) accounting for the largest median household size of 3.84 persons per household. non-family households (2,463 | 33.0%) represent the smallest median household size with 1.13 persons per household.
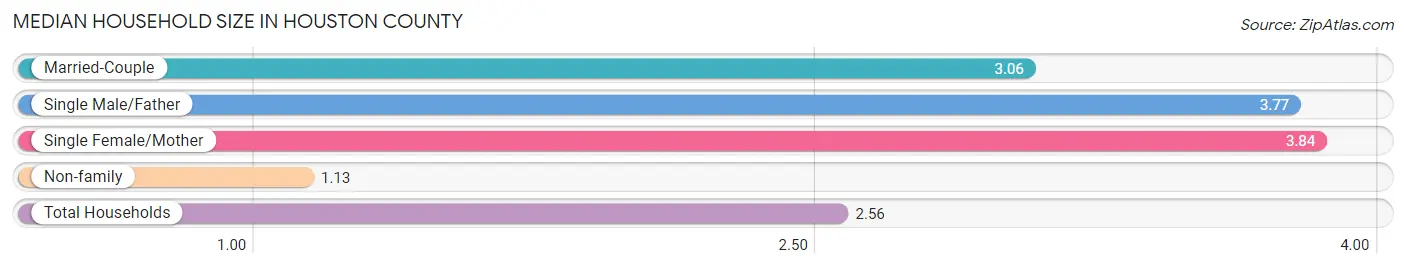
| Household Type | # Households | Household Size |
| Married-Couple | 3,688 (49.4%) | 3.06 |
| Single Male/Father | 292 (3.9%) | 3.77 |
| Single Female/Mother | 1,021 (13.7%) | 3.84 |
| Non-family | 2,463 (33.0%) | 1.13 |
| Total Households | 7,464 (100.0%) | 2.56 |
Household Size by Marriage Status in Houston County
Out of a total of 7,464 households in Houston County, 5,001 (67.0%) are family households, while 2,463 (33.0%) are nonfamily households. The most numerous type of family households are 2-person households, comprising 2,626, and the most common type of nonfamily households are 1-person households, comprising 2,230.
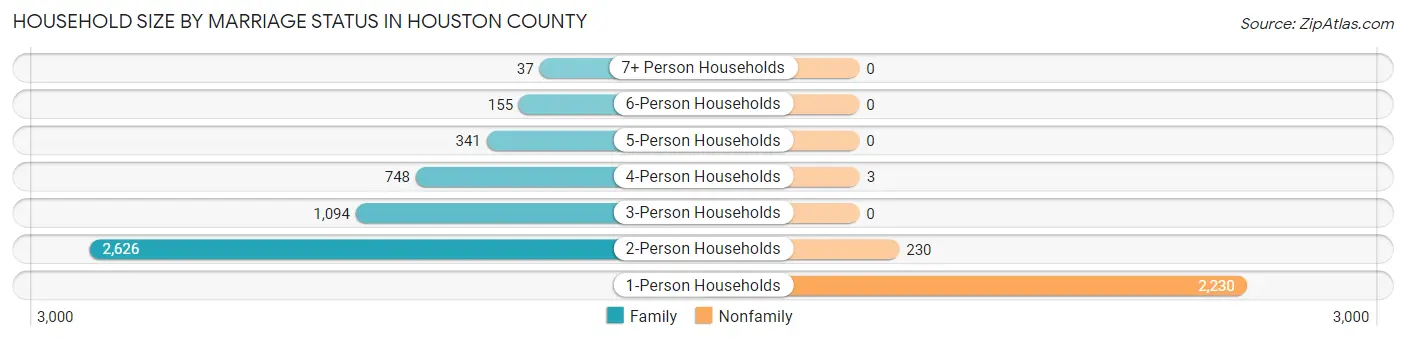
| Household Size | Family Households | Nonfamily Households |
| 1-Person Households | - | 2,230 (29.9%) |
| 2-Person Households | 2,626 (35.2%) | 230 (3.1%) |
| 3-Person Households | 1,094 (14.7%) | 0 (0.0%) |
| 4-Person Households | 748 (10.0%) | 3 (0.0%) |
| 5-Person Households | 341 (4.6%) | 0 (0.0%) |
| 6-Person Households | 155 (2.1%) | 0 (0.0%) |
| 7+ Person Households | 37 (0.5%) | 0 (0.0%) |
| Total | 5,001 (67.0%) | 2,463 (33.0%) |
Female Fertility in Houston County
Fertility by Age in Houston County
Average fertility rate in Houston County is 89.0 births per 1,000 women. Women in the age bracket of 20 to 34 years have the highest fertility rate with 214.0 births per 1,000 women. Women in the age bracket of 20 to 34 years acount for 92.0% of all women with births.
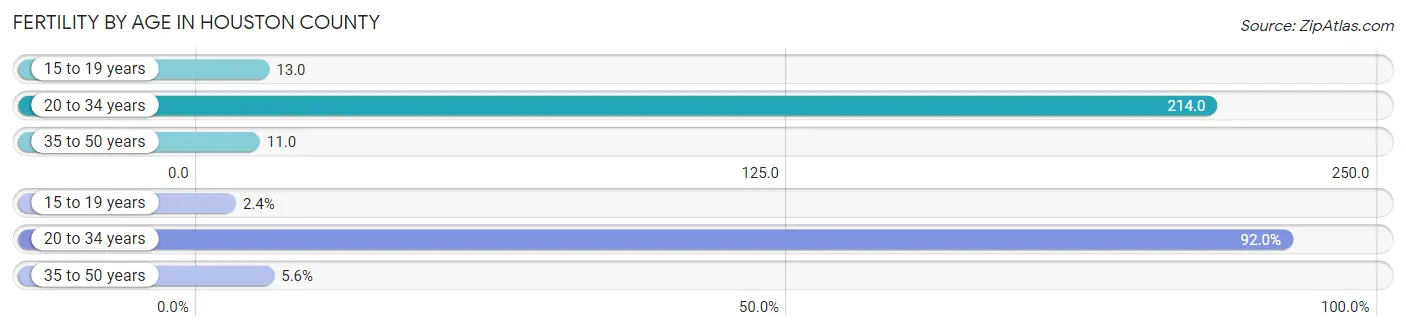
| Age Bracket | Women with Births | Births / 1,000 Women |
| 15 to 19 years | 8 (2.4%) | 13.0 |
| 20 to 34 years | 311 (92.0%) | 214.0 |
| 35 to 50 years | 19 (5.6%) | 11.0 |
| Total | 338 (100.0%) | 89.0 |
Fertility by Age by Marriage Status in Houston County
54.7% of women with births (338) in Houston County are married. The highest percentage of unmarried women with births falls into 15 to 19 years age bracket with 100.0% of them unmarried at the time of birth, while the lowest percentage of unmarried women with births belong to 35 to 50 years age bracket with 0.0% of them unmarried.
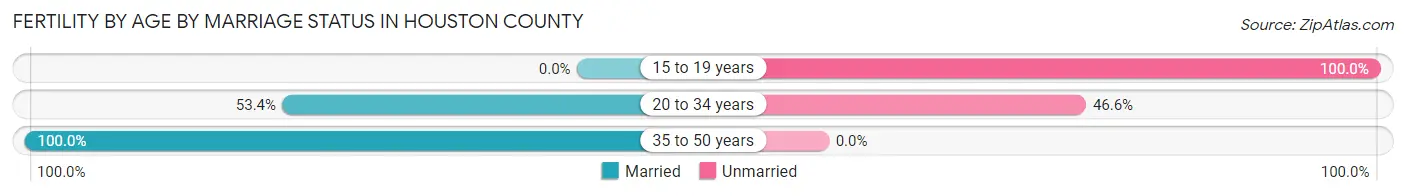
| Age Bracket | Married | Unmarried |
| 15 to 19 years | 0 (0.0%) | 8 (100.0%) |
| 20 to 34 years | 166 (53.4%) | 145 (46.6%) |
| 35 to 50 years | 19 (100.0%) | 0 (0.0%) |
| Total | 185 (54.7%) | 153 (45.3%) |
Fertility by Education in Houston County
Average fertility rate in Houston County is 89.0 births per 1,000 women. Women with the education attainment of bachelor's degree have the highest fertility rate of 132.0 births per 1,000 women, while women with the education attainment of less than high school have the lowest fertility at 43.0 births per 1,000 women. Women with the education attainment of high school diploma represent 36.4% of all women with births.
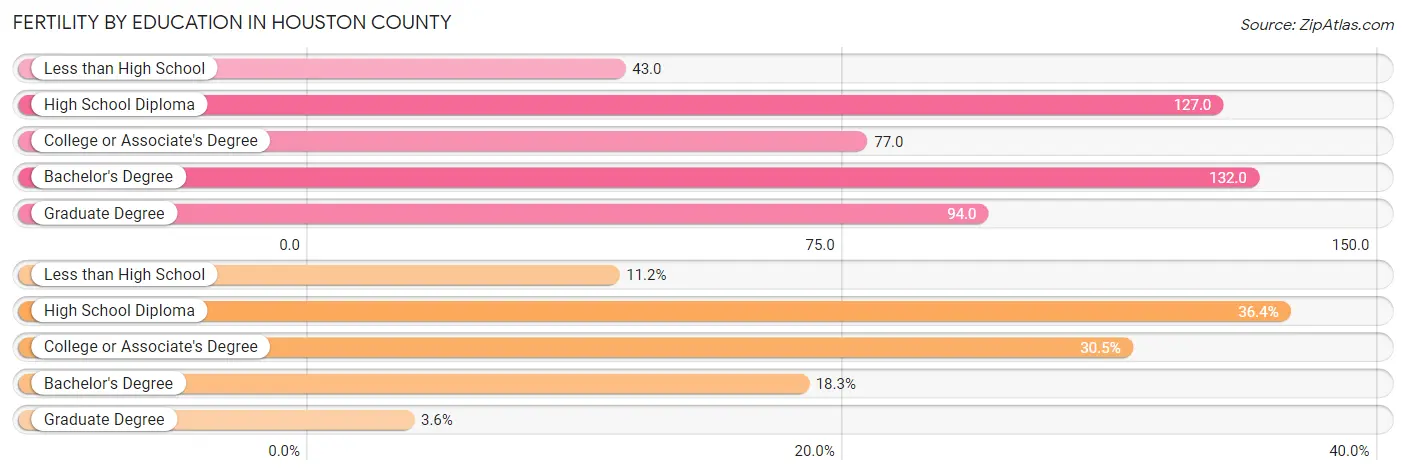
| Educational Attainment | Women with Births | Births / 1,000 Women |
| Less than High School | 38 (11.2%) | 43.0 |
| High School Diploma | 123 (36.4%) | 127.0 |
| College or Associate's Degree | 103 (30.5%) | 77.0 |
| Bachelor's Degree | 62 (18.3%) | 132.0 |
| Graduate Degree | 12 (3.5%) | 94.0 |
| Total | 338 (100.0%) | 89.0 |
Fertility by Education by Marriage Status in Houston County
45.3% of women with births in Houston County are unmarried. Women with the educational attainment of bachelor's degree are most likely to be married with 100.0% of them married at childbirth, while women with the educational attainment of less than high school are least likely to be married with 84.2% of them unmarried at childbirth.
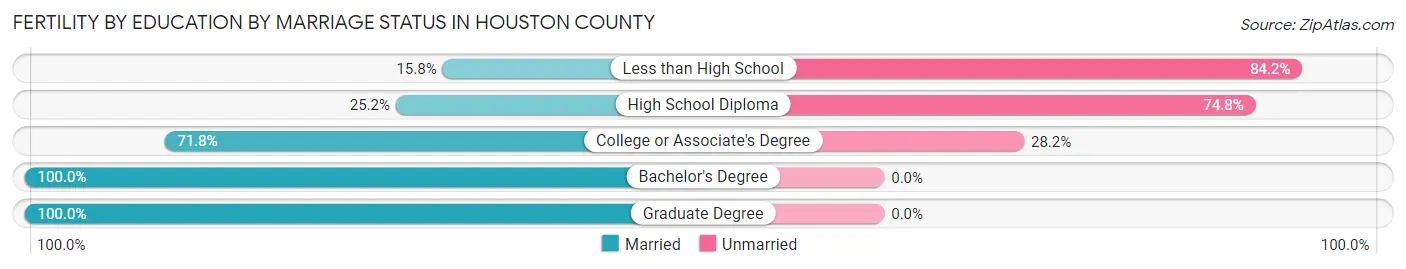
| Educational Attainment | Married | Unmarried |
| Less than High School | 6 (15.8%) | 32 (84.2%) |
| High School Diploma | 31 (25.2%) | 92 (74.8%) |
| College or Associate's Degree | 74 (71.8%) | 29 (28.2%) |
| Bachelor's Degree | 62 (100.0%) | 0 (0.0%) |
| Graduate Degree | 12 (100.0%) | 0 (0.0%) |
| Total | 185 (54.7%) | 153 (45.3%) |
Employment Characteristics in Houston County
Employment by Class of Employer in Houston County
Among the 7,676 employed individuals in Houston County, private company employees (4,683 | 61.0%), state government employees (939 | 12.2%), and not-for-profit organizations (644 | 8.4%) make up the most common classes of employment.
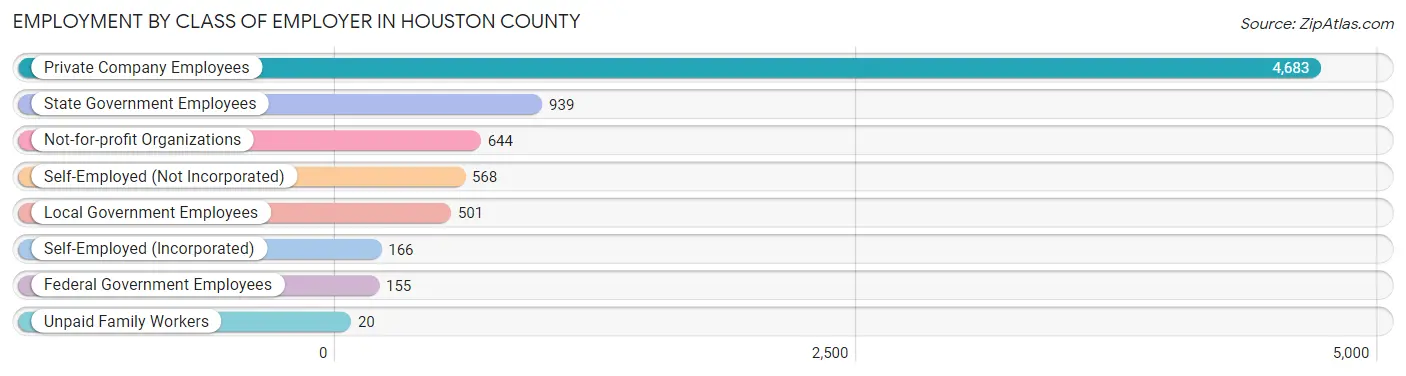
| Employer Class | # Employees | % Employees |
| Private Company Employees | 4,683 | 61.0% |
| Self-Employed (Incorporated) | 166 | 2.2% |
| Self-Employed (Not Incorporated) | 568 | 7.4% |
| Not-for-profit Organizations | 644 | 8.4% |
| Local Government Employees | 501 | 6.5% |
| State Government Employees | 939 | 12.2% |
| Federal Government Employees | 155 | 2.0% |
| Unpaid Family Workers | 20 | 0.3% |
| Total | 7,676 | 100.0% |
Employment Status by Age in Houston County
According to the labor force statistics for Houston County, out of the total population over 16 years of age (18,287), 44.8% or 8,193 individuals are in the labor force, with 4.5% or 369 of them unemployed. The age group with the highest labor force participation rate is 20 to 24 years, with 73.5% or 688 individuals in the labor force. Within the labor force, the 25 to 29 years age range has the highest percentage of unemployed individuals, with 8.0% or 54 of them being unemployed.
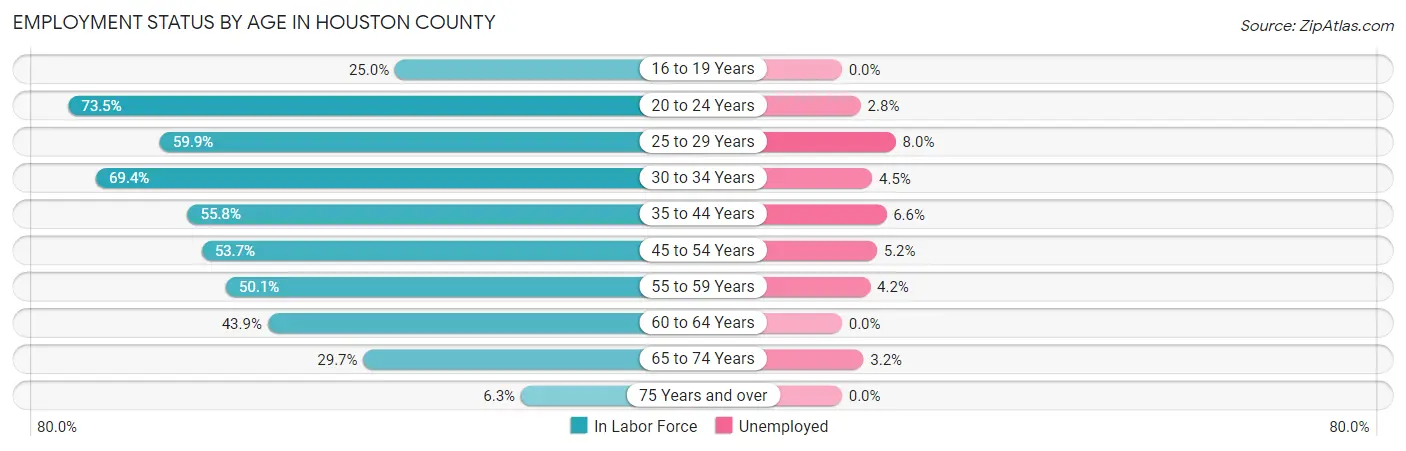
| Age Bracket | In Labor Force | Unemployed |
| 16 to 19 Years | 258 (25.0%) | 0 (0.0%) |
| 20 to 24 Years | 688 (73.5%) | 19 (2.8%) |
| 25 to 29 Years | 676 (59.9%) | 54 (8.0%) |
| 30 to 34 Years | 1,040 (69.4%) | 47 (4.5%) |
| 35 to 44 Years | 1,609 (55.8%) | 106 (6.6%) |
| 45 to 54 Years | 1,533 (53.7%) | 80 (5.2%) |
| 55 to 59 Years | 862 (50.1%) | 36 (4.2%) |
| 60 to 64 Years | 590 (43.9%) | 0 (0.0%) |
| 65 to 74 Years | 782 (29.7%) | 25 (3.2%) |
| 75 Years and over | 142 (6.3%) | 0 (0.0%) |
| Total | 8,193 (44.8%) | 369 (4.5%) |
Employment Status by Educational Attainment in Houston County
According to labor force statistics for Houston County, 55.2% of individuals (6,308) out of the total population between 25 and 64 years of age (11,428) are in the labor force, with 5.1% or 322 of them being unemployed. The group with the highest labor force participation rate are those with the educational attainment of bachelor's degree or higher, with 87.4% or 1,335 individuals in the labor force. Within the labor force, individuals with less than high school education have the highest percentage of unemployment, with 12.6% or 104 of them being unemployed.
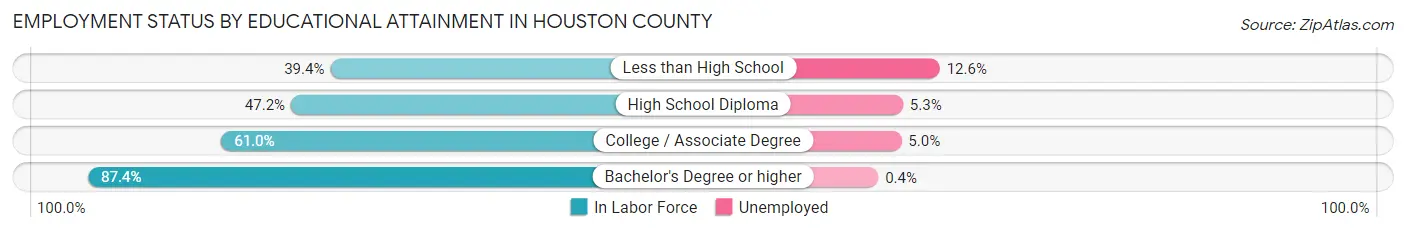
| Educational Attainment | In Labor Force | Unemployed |
| Less than High School | 828 (39.4%) | 265 (12.6%) |
| High School Diploma | 2,091 (47.2%) | 235 (5.3%) |
| College / Associate Degree | 2,056 (61.0%) | 168 (5.0%) |
| Bachelor's Degree or higher | 1,335 (87.4%) | 6 (0.4%) |
| Total | 6,308 (55.2%) | 583 (5.1%) |
Employment Occupations by Sex in Houston County
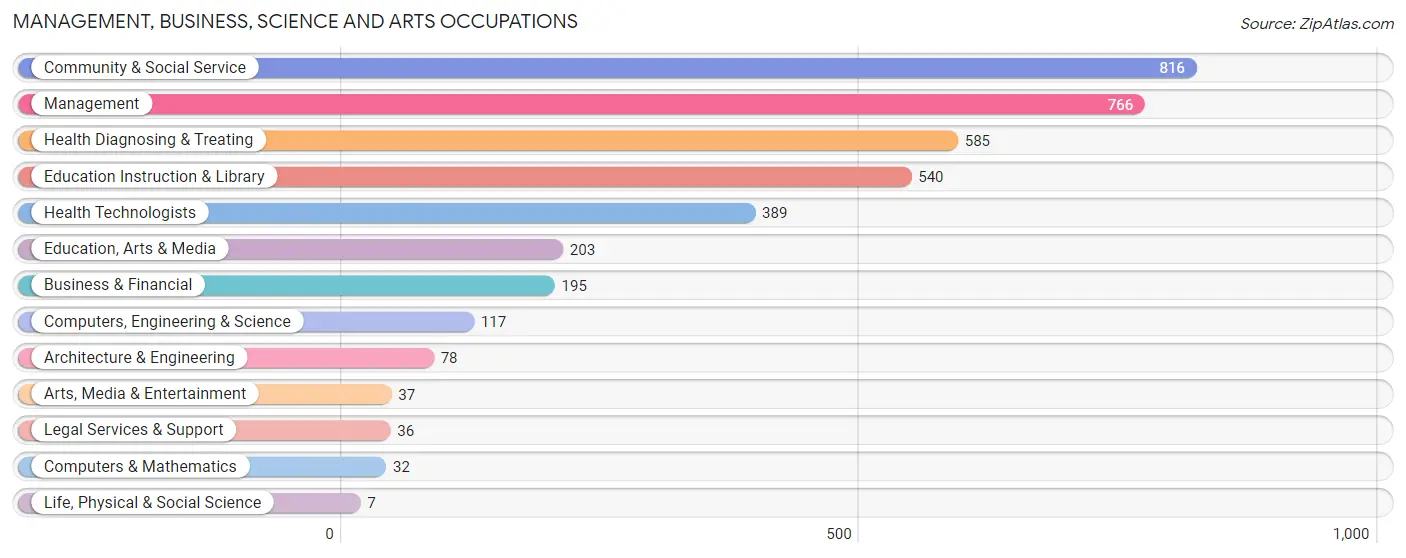
Management, Business, Science and Arts Occupations
The most common Management, Business, Science and Arts occupations in Houston County are Community & Social Service (816 | 10.4%), Management (766 | 9.8%), Health Diagnosing & Treating (585 | 7.5%), Education Instruction & Library (540 | 6.9%), and Health Technologists (389 | 5.0%).
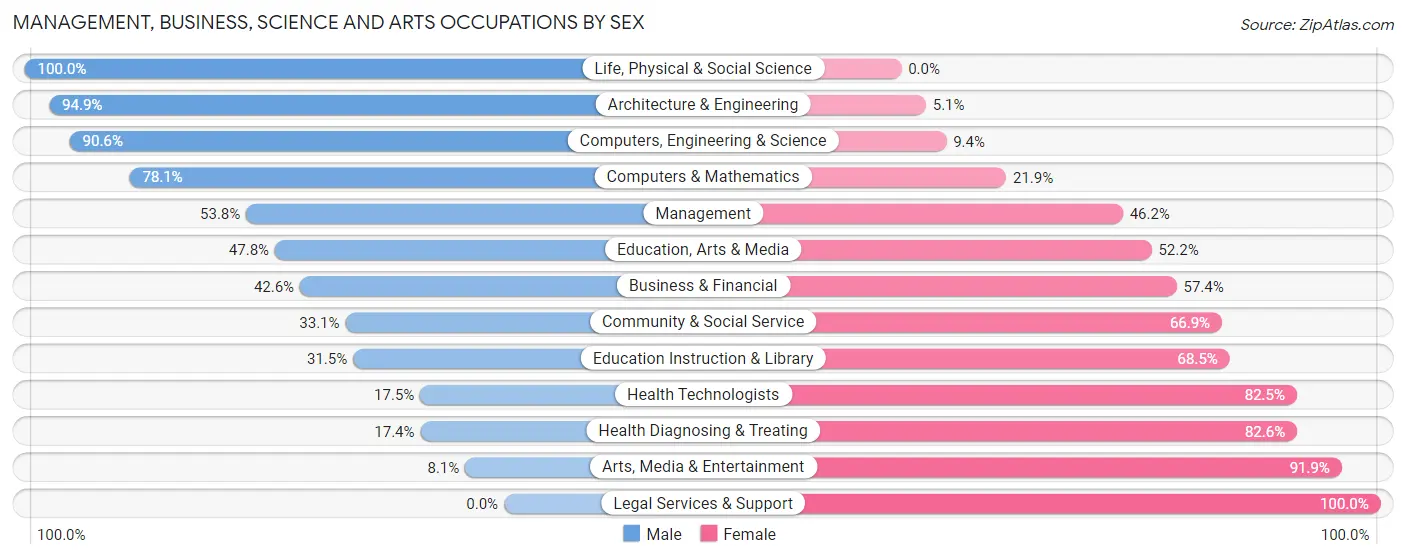
Management, Business, Science and Arts Occupations by Sex
Within the Management, Business, Science and Arts occupations in Houston County, the most male-oriented occupations are Life, Physical & Social Science (100.0%), Architecture & Engineering (94.9%), and Computers, Engineering & Science (90.6%), while the most female-oriented occupations are Legal Services & Support (100.0%), Arts, Media & Entertainment (91.9%), and Health Diagnosing & Treating (82.6%).
| Occupation | Male | Female |
| Management | 412 (53.8%) | 354 (46.2%) |
| Business & Financial | 83 (42.6%) | 112 (57.4%) |
| Computers, Engineering & Science | 106 (90.6%) | 11 (9.4%) |
| Computers & Mathematics | 25 (78.1%) | 7 (21.9%) |
| Architecture & Engineering | 74 (94.9%) | 4 (5.1%) |
| Life, Physical & Social Science | 7 (100.0%) | 0 (0.0%) |
| Community & Social Service | 270 (33.1%) | 546 (66.9%) |
| Education, Arts & Media | 97 (47.8%) | 106 (52.2%) |
| Legal Services & Support | 0 (0.0%) | 36 (100.0%) |
| Education Instruction & Library | 170 (31.5%) | 370 (68.5%) |
| Arts, Media & Entertainment | 3 (8.1%) | 34 (91.9%) |
| Health Diagnosing & Treating | 102 (17.4%) | 483 (82.6%) |
| Health Technologists | 68 (17.5%) | 321 (82.5%) |
| Total (Category) | 973 (39.3%) | 1,506 (60.8%) |
| Total (Overall) | 3,773 (48.3%) | 4,043 (51.7%) |
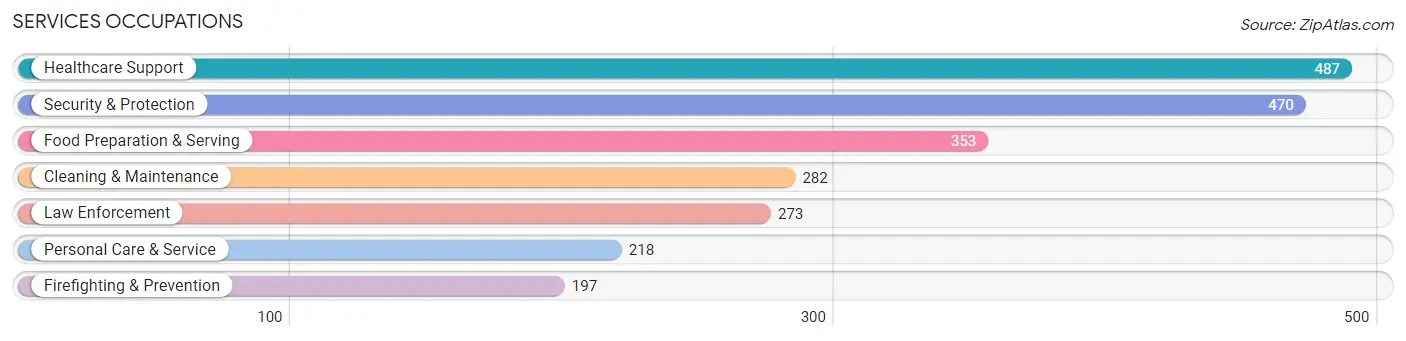
Services Occupations
The most common Services occupations in Houston County are Healthcare Support (487 | 6.2%), Security & Protection (470 | 6.0%), Food Preparation & Serving (353 | 4.5%), Cleaning & Maintenance (282 | 3.6%), and Law Enforcement (273 | 3.5%).
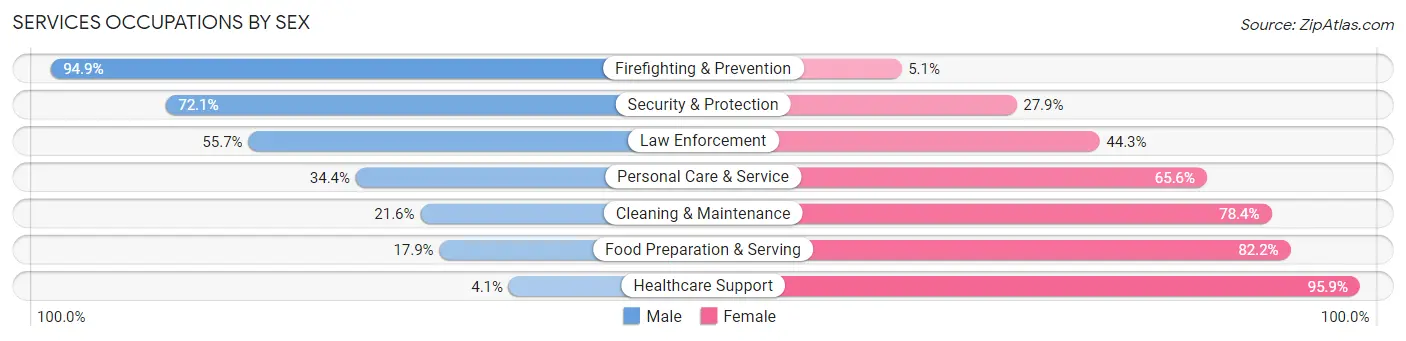
Services Occupations by Sex
Within the Services occupations in Houston County, the most male-oriented occupations are Firefighting & Prevention (94.9%), Security & Protection (72.1%), and Law Enforcement (55.7%), while the most female-oriented occupations are Healthcare Support (95.9%), Food Preparation & Serving (82.2%), and Cleaning & Maintenance (78.4%).
| Occupation | Male | Female |
| Healthcare Support | 20 (4.1%) | 467 (95.9%) |
| Security & Protection | 339 (72.1%) | 131 (27.9%) |
| Firefighting & Prevention | 187 (94.9%) | 10 (5.1%) |
| Law Enforcement | 152 (55.7%) | 121 (44.3%) |
| Food Preparation & Serving | 63 (17.8%) | 290 (82.2%) |
| Cleaning & Maintenance | 61 (21.6%) | 221 (78.4%) |
| Personal Care & Service | 75 (34.4%) | 143 (65.6%) |
| Total (Category) | 558 (30.8%) | 1,252 (69.2%) |
| Total (Overall) | 3,773 (48.3%) | 4,043 (51.7%) |
Sales and Office Occupations
The most common Sales and Office occupations in Houston County are Office & Administration (970 | 12.4%), and Sales & Related (576 | 7.4%).
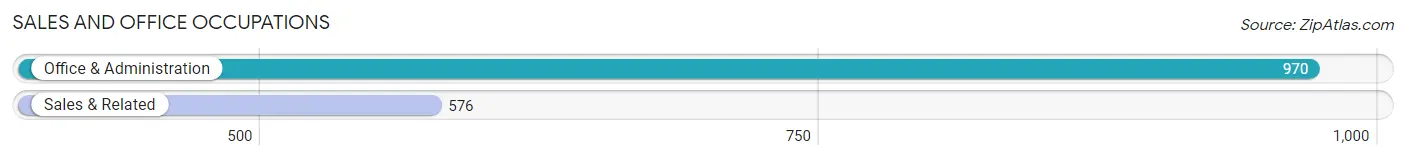
Sales and Office Occupations by Sex

| Occupation | Male | Female |
| Sales & Related | 190 (33.0%) | 386 (67.0%) |
| Office & Administration | 173 (17.8%) | 797 (82.2%) |
| Total (Category) | 363 (23.5%) | 1,183 (76.5%) |
| Total (Overall) | 3,773 (48.3%) | 4,043 (51.7%) |
Natural Resources, Construction and Maintenance Occupations
The most common Natural Resources, Construction and Maintenance occupations in Houston County are Construction & Extraction (438 | 5.6%), Installation, Maintenance & Repair (206 | 2.6%), and Farming, Fishing & Forestry (88 | 1.1%).
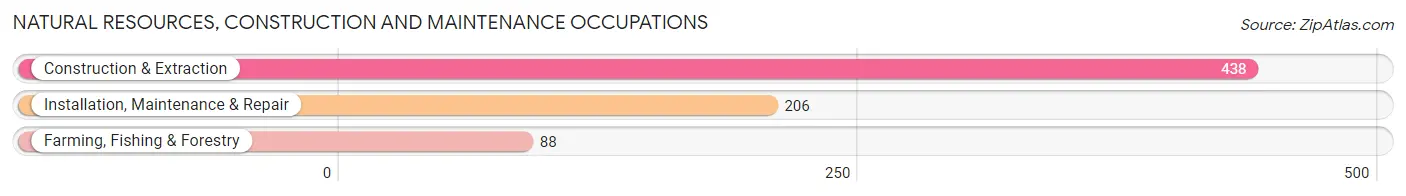
Natural Resources, Construction and Maintenance Occupations by Sex
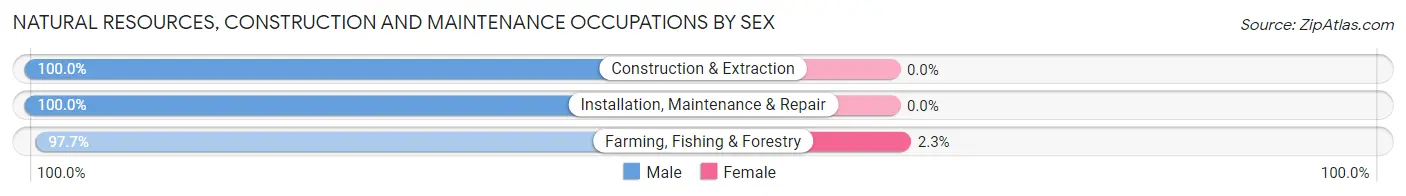
| Occupation | Male | Female |
| Farming, Fishing & Forestry | 86 (97.7%) | 2 (2.3%) |
| Construction & Extraction | 438 (100.0%) | 0 (0.0%) |
| Installation, Maintenance & Repair | 206 (100.0%) | 0 (0.0%) |
| Total (Category) | 730 (99.7%) | 2 (0.3%) |
| Total (Overall) | 3,773 (48.3%) | 4,043 (51.7%) |
Production, Transportation and Moving Occupations
The most common Production, Transportation and Moving occupations in Houston County are Production (600 | 7.7%), Transportation (373 | 4.8%), and Material Moving (276 | 3.5%).
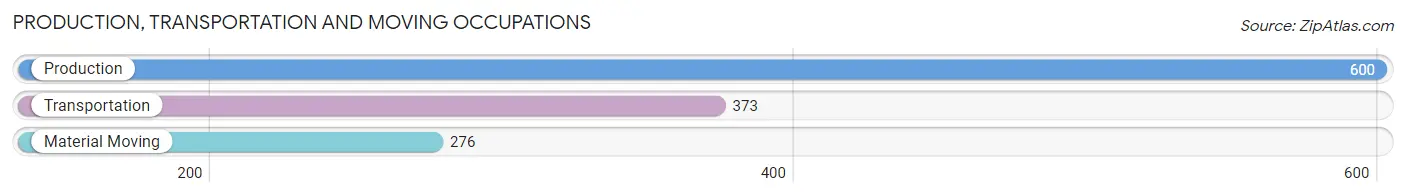
Production, Transportation and Moving Occupations by Sex
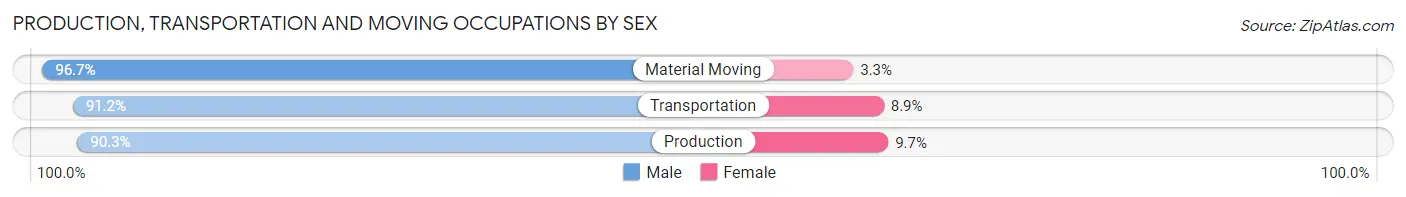
| Occupation | Male | Female |
| Production | 542 (90.3%) | 58 (9.7%) |
| Transportation | 340 (91.1%) | 33 (8.8%) |
| Material Moving | 267 (96.7%) | 9 (3.3%) |
| Total (Category) | 1,149 (92.0%) | 100 (8.0%) |
| Total (Overall) | 3,773 (48.3%) | 4,043 (51.7%) |
Employment Industries by Sex in Houston County
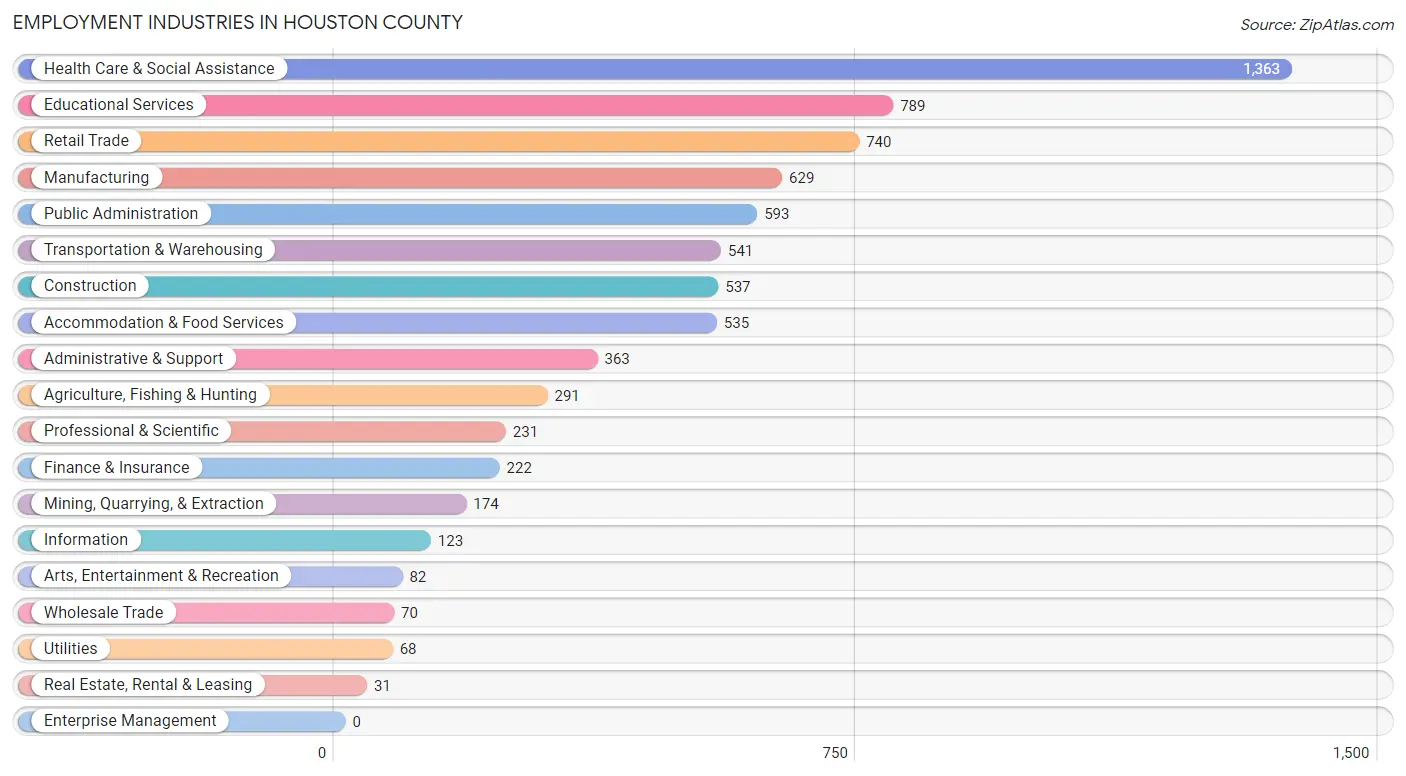
Employment Industries in Houston County
The major employment industries in Houston County include Health Care & Social Assistance (1,363 | 17.4%), Educational Services (789 | 10.1%), Retail Trade (740 | 9.5%), Manufacturing (629 | 8.1%), and Public Administration (593 | 7.6%).
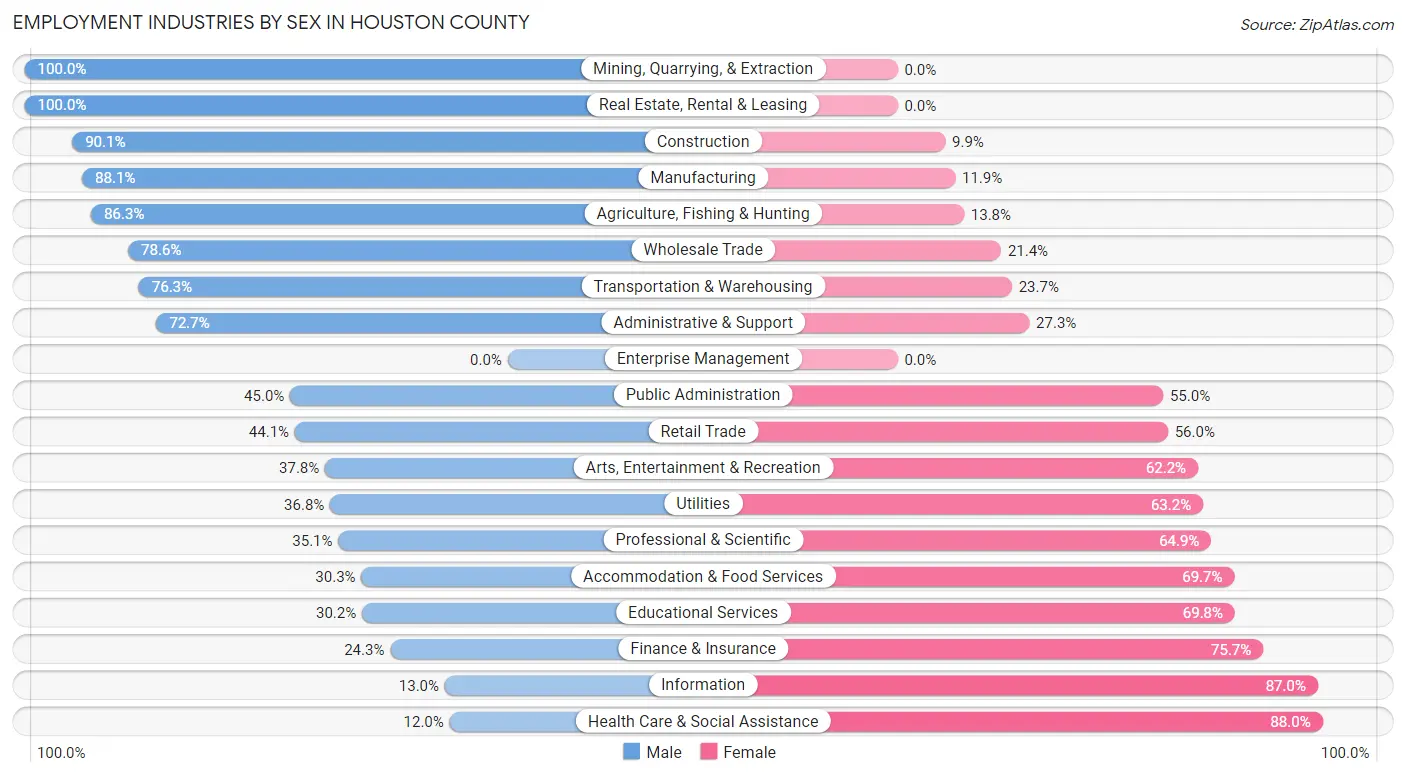
Employment Industries by Sex in Houston County
The Houston County industries that see more men than women are Mining, Quarrying, & Extraction (100.0%), Real Estate, Rental & Leasing (100.0%), and Construction (90.1%), whereas the industries that tend to have a higher number of women are Health Care & Social Assistance (88.0%), Information (87.0%), and Finance & Insurance (75.7%).
| Industry | Male | Female |
| Agriculture, Fishing & Hunting | 251 (86.3%) | 40 (13.8%) |
| Mining, Quarrying, & Extraction | 174 (100.0%) | 0 (0.0%) |
| Construction | 484 (90.1%) | 53 (9.9%) |
| Manufacturing | 554 (88.1%) | 75 (11.9%) |
| Wholesale Trade | 55 (78.6%) | 15 (21.4%) |
| Retail Trade | 326 (44.1%) | 414 (55.9%) |
| Transportation & Warehousing | 413 (76.3%) | 128 (23.7%) |
| Utilities | 25 (36.8%) | 43 (63.2%) |
| Information | 16 (13.0%) | 107 (87.0%) |
| Finance & Insurance | 54 (24.3%) | 168 (75.7%) |
| Real Estate, Rental & Leasing | 31 (100.0%) | 0 (0.0%) |
| Professional & Scientific | 81 (35.1%) | 150 (64.9%) |
| Enterprise Management | 0 (0.0%) | 0 (0.0%) |
| Administrative & Support | 264 (72.7%) | 99 (27.3%) |
| Educational Services | 238 (30.2%) | 551 (69.8%) |
| Health Care & Social Assistance | 164 (12.0%) | 1,199 (88.0%) |
| Arts, Entertainment & Recreation | 31 (37.8%) | 51 (62.2%) |
| Accommodation & Food Services | 162 (30.3%) | 373 (69.7%) |
| Public Administration | 267 (45.0%) | 326 (55.0%) |
| Total | 3,773 (48.3%) | 4,043 (51.7%) |
Education in Houston County
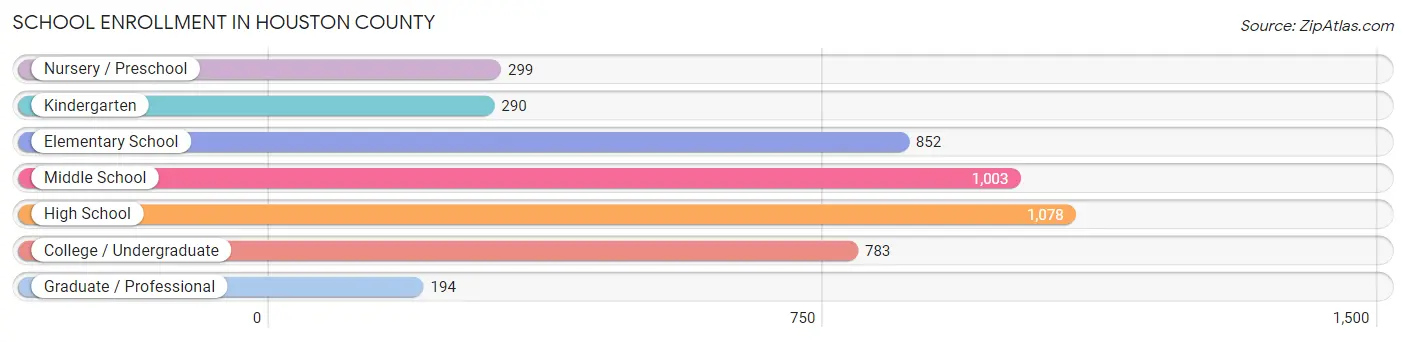
School Enrollment in Houston County
The most common levels of schooling among the 4,499 students in Houston County are high school (1,078 | 24.0%), middle school (1,003 | 22.3%), and elementary school (852 | 18.9%).
| School Level | # Students | % Students |
| Nursery / Preschool | 299 | 6.7% |
| Kindergarten | 290 | 6.5% |
| Elementary School | 852 | 18.9% |
| Middle School | 1,003 | 22.3% |
| High School | 1,078 | 24.0% |
| College / Undergraduate | 783 | 17.4% |
| Graduate / Professional | 194 | 4.3% |
| Total | 4,499 | 100.0% |
School Enrollment by Age by Funding Source in Houston County
Out of a total of 4,499 students who are enrolled in schools in Houston County, 387 (8.6%) attend a private institution, while the remaining 4,112 (91.4%) are enrolled in public schools. The age group of 25 to 34 year olds has the highest likelihood of being enrolled in private schools, with 54 (43.2% in the age bracket) enrolled. Conversely, the age group of 18 to 19 year olds has the lowest likelihood of being enrolled in a private school, with 311 (98.1% in the age bracket) attending a public institution.
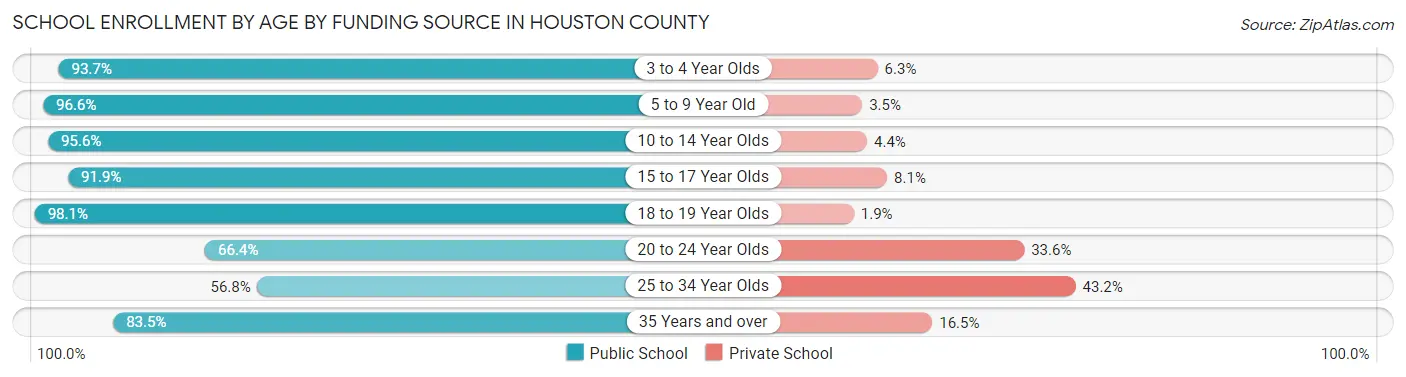
| Age Bracket | Public School | Private School |
| 3 to 4 Year Olds | 148 (93.7%) | 10 (6.3%) |
| 5 to 9 Year Old | 1,093 (96.6%) | 39 (3.5%) |
| 10 to 14 Year Olds | 1,250 (95.6%) | 57 (4.4%) |
| 15 to 17 Year Olds | 658 (91.9%) | 58 (8.1%) |
| 18 to 19 Year Olds | 311 (98.1%) | 6 (1.9%) |
| 20 to 24 Year Olds | 148 (66.4%) | 75 (33.6%) |
| 25 to 34 Year Olds | 71 (56.8%) | 54 (43.2%) |
| 35 Years and over | 435 (83.5%) | 86 (16.5%) |
| Total | 4,112 (91.4%) | 387 (8.6%) |
Educational Attainment by Field of Study in Houston County
Education (534 | 20.4%), science & technology (412 | 15.7%), business (407 | 15.5%), bio, nature & agricultural (246 | 9.4%), and arts & humanities (192 | 7.3%) are the most common fields of study among 2,619 individuals in Houston County who have obtained a bachelor's degree or higher.
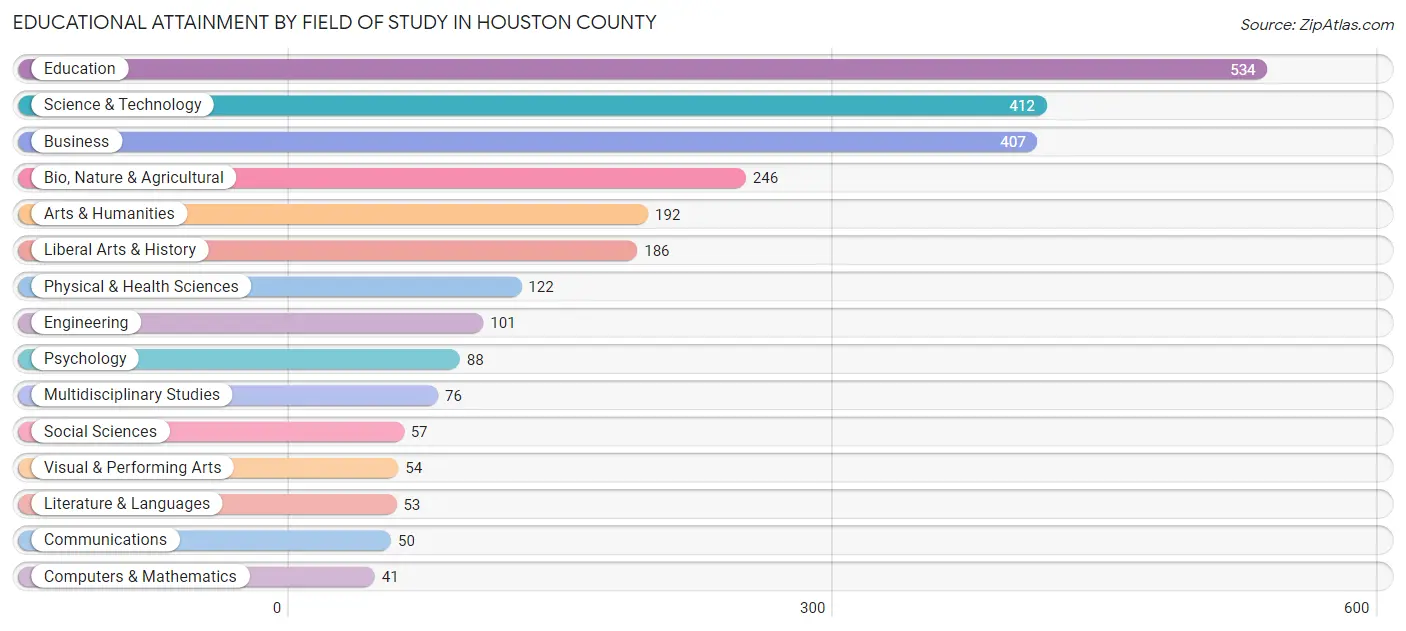
| Field of Study | # Graduates | % Graduates |
| Computers & Mathematics | 41 | 1.6% |
| Bio, Nature & Agricultural | 246 | 9.4% |
| Physical & Health Sciences | 122 | 4.7% |
| Psychology | 88 | 3.4% |
| Social Sciences | 57 | 2.2% |
| Engineering | 101 | 3.9% |
| Multidisciplinary Studies | 76 | 2.9% |
| Science & Technology | 412 | 15.7% |
| Business | 407 | 15.5% |
| Education | 534 | 20.4% |
| Literature & Languages | 53 | 2.0% |
| Liberal Arts & History | 186 | 7.1% |
| Visual & Performing Arts | 54 | 2.1% |
| Communications | 50 | 1.9% |
| Arts & Humanities | 192 | 7.3% |
| Total | 2,619 | 100.0% |
Transportation & Commute in Houston County
Vehicle Availability by Sex in Houston County
The most prevalent vehicle ownership categories in Houston County are males with 2 vehicles (1,669, accounting for 44.9%) and females with 2 vehicles (1,684, making up 43.2%).
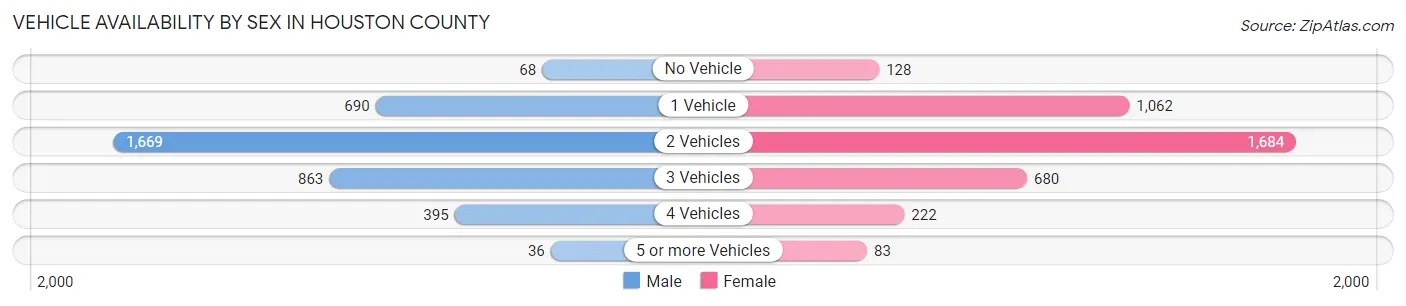
| Vehicles Available | Male | Female |
| No Vehicle | 68 (1.8%) | 128 (3.3%) |
| 1 Vehicle | 690 (18.5%) | 1,062 (27.5%) |
| 2 Vehicles | 1,669 (44.9%) | 1,684 (43.6%) |
| 3 Vehicles | 863 (23.2%) | 680 (17.6%) |
| 4 Vehicles | 395 (10.6%) | 222 (5.8%) |
| 5 or more Vehicles | 36 (1.0%) | 83 (2.1%) |
| Total | 3,721 (100.0%) | 3,859 (100.0%) |
Commute Time in Houston County
The most frequently occuring commute durations in Houston County are 10 to 14 minutes (1,321 commuters, 18.1%), 5 to 9 minutes (1,152 commuters, 15.8%), and 15 to 19 minutes (883 commuters, 12.1%).
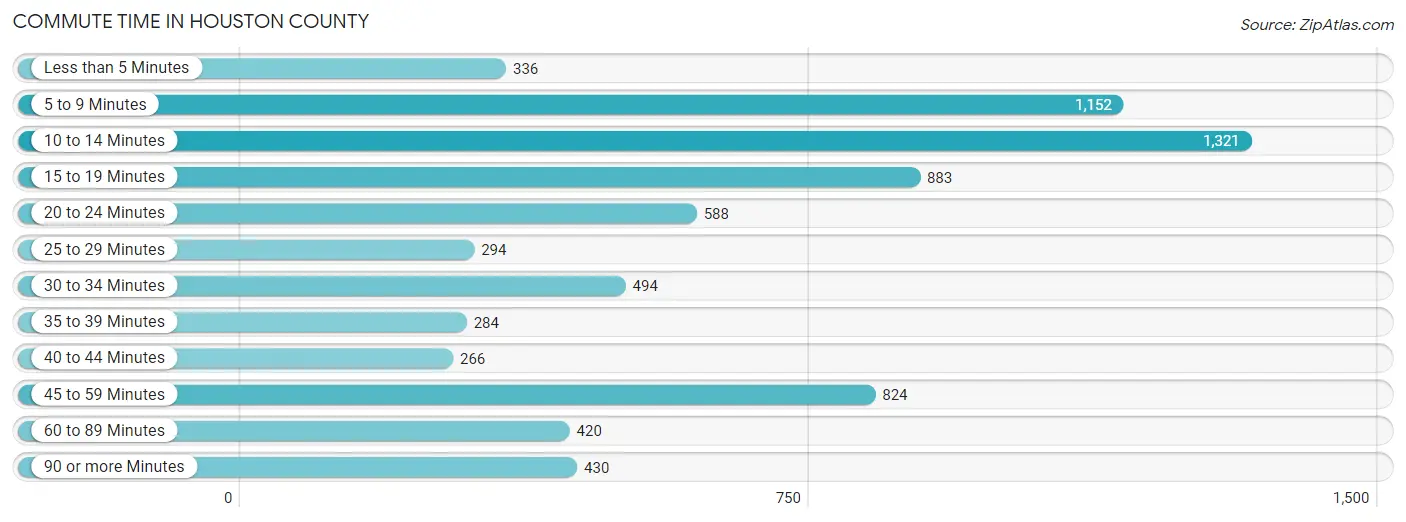
| Commute Time | # Commuters | % Commuters |
| Less than 5 Minutes | 336 | 4.6% |
| 5 to 9 Minutes | 1,152 | 15.8% |
| 10 to 14 Minutes | 1,321 | 18.1% |
| 15 to 19 Minutes | 883 | 12.1% |
| 20 to 24 Minutes | 588 | 8.1% |
| 25 to 29 Minutes | 294 | 4.0% |
| 30 to 34 Minutes | 494 | 6.8% |
| 35 to 39 Minutes | 284 | 3.9% |
| 40 to 44 Minutes | 266 | 3.6% |
| 45 to 59 Minutes | 824 | 11.3% |
| 60 to 89 Minutes | 420 | 5.8% |
| 90 or more Minutes | 430 | 5.9% |
Commute Time by Sex in Houston County
The most common commute times in Houston County are 45 to 59 minutes (546 commuters, 15.3%) for males and 10 to 14 minutes (785 commuters, 21.1%) for females.
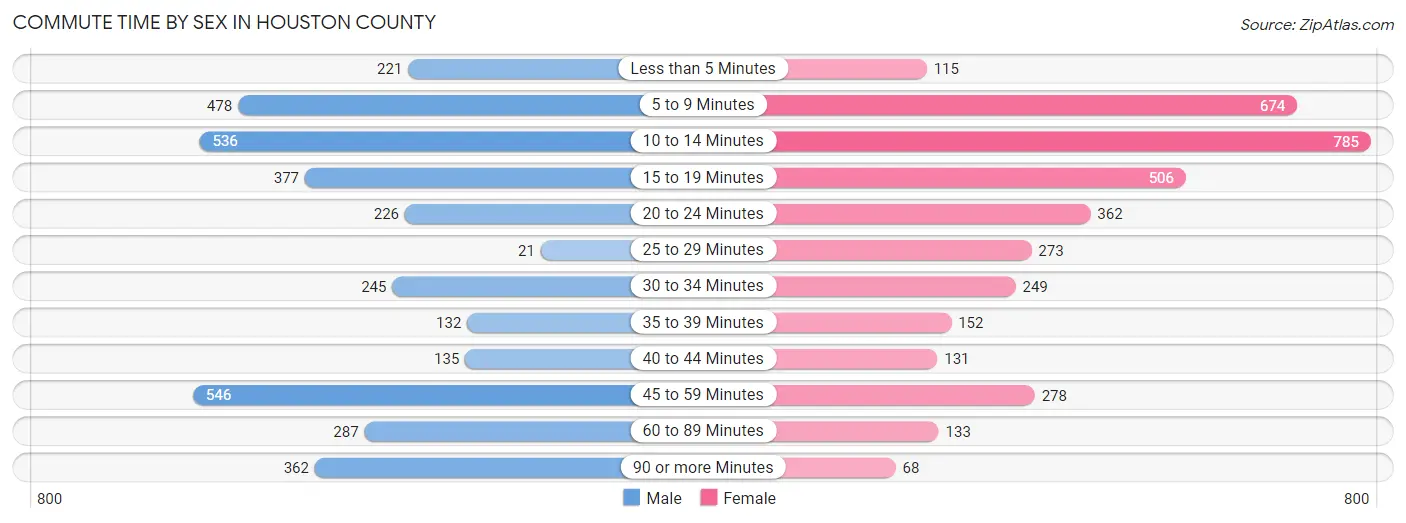
| Commute Time | Male | Female |
| Less than 5 Minutes | 221 (6.2%) | 115 (3.1%) |
| 5 to 9 Minutes | 478 (13.4%) | 674 (18.1%) |
| 10 to 14 Minutes | 536 (15.0%) | 785 (21.1%) |
| 15 to 19 Minutes | 377 (10.6%) | 506 (13.6%) |
| 20 to 24 Minutes | 226 (6.3%) | 362 (9.7%) |
| 25 to 29 Minutes | 21 (0.6%) | 273 (7.3%) |
| 30 to 34 Minutes | 245 (6.9%) | 249 (6.7%) |
| 35 to 39 Minutes | 132 (3.7%) | 152 (4.1%) |
| 40 to 44 Minutes | 135 (3.8%) | 131 (3.5%) |
| 45 to 59 Minutes | 546 (15.3%) | 278 (7.5%) |
| 60 to 89 Minutes | 287 (8.1%) | 133 (3.6%) |
| 90 or more Minutes | 362 (10.2%) | 68 (1.8%) |
Time of Departure to Work by Sex in Houston County
The most frequent times of departure to work in Houston County are 12:00 AM to 4:59 AM (651, 18.3%) for males and 7:00 AM to 7:29 AM (936, 25.1%) for females.
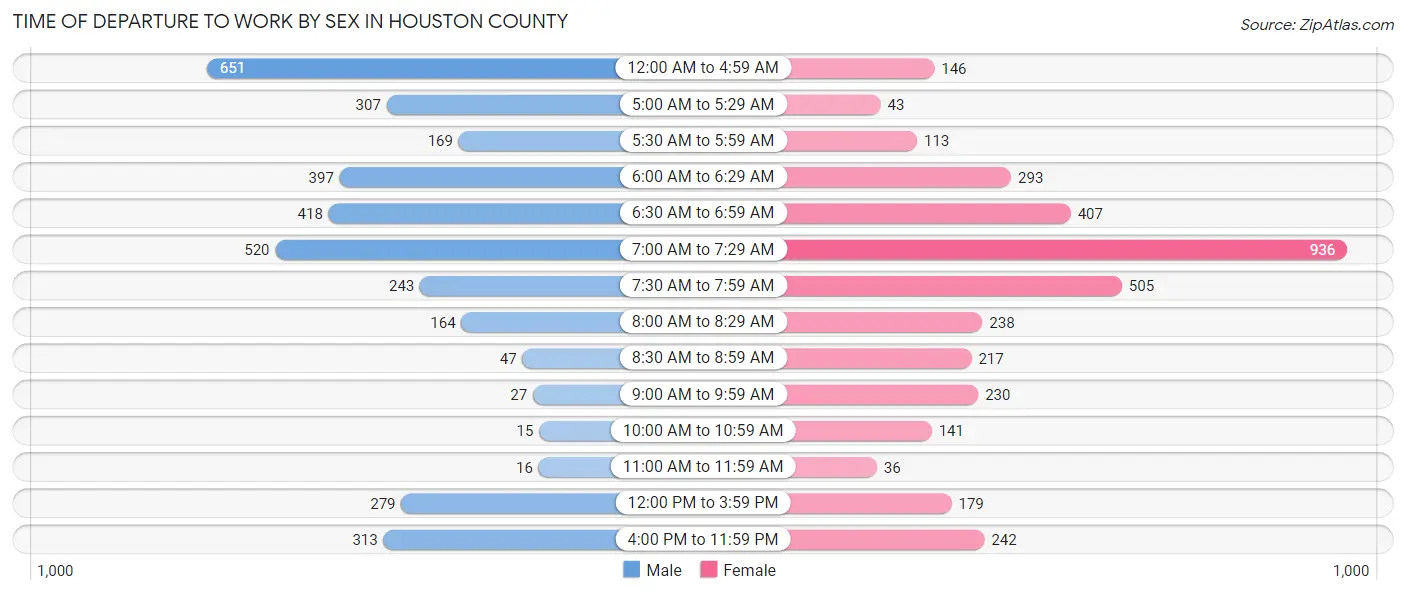
| Time of Departure | Male | Female |
| 12:00 AM to 4:59 AM | 651 (18.3%) | 146 (3.9%) |
| 5:00 AM to 5:29 AM | 307 (8.6%) | 43 (1.1%) |
| 5:30 AM to 5:59 AM | 169 (4.7%) | 113 (3.0%) |
| 6:00 AM to 6:29 AM | 397 (11.1%) | 293 (7.9%) |
| 6:30 AM to 6:59 AM | 418 (11.7%) | 407 (10.9%) |
| 7:00 AM to 7:29 AM | 520 (14.6%) | 936 (25.1%) |
| 7:30 AM to 7:59 AM | 243 (6.8%) | 505 (13.6%) |
| 8:00 AM to 8:29 AM | 164 (4.6%) | 238 (6.4%) |
| 8:30 AM to 8:59 AM | 47 (1.3%) | 217 (5.8%) |
| 9:00 AM to 9:59 AM | 27 (0.8%) | 230 (6.2%) |
| 10:00 AM to 10:59 AM | 15 (0.4%) | 141 (3.8%) |
| 11:00 AM to 11:59 AM | 16 (0.4%) | 36 (1.0%) |
| 12:00 PM to 3:59 PM | 279 (7.8%) | 179 (4.8%) |
| 4:00 PM to 11:59 PM | 313 (8.8%) | 242 (6.5%) |
| Total | 3,566 (100.0%) | 3,726 (100.0%) |
Housing Occupancy in Houston County
Occupancy by Ownership in Houston County
Of the total 7,464 dwellings in Houston County, owner-occupied units account for 5,180 (69.4%), while renter-occupied units make up 2,284 (30.6%).
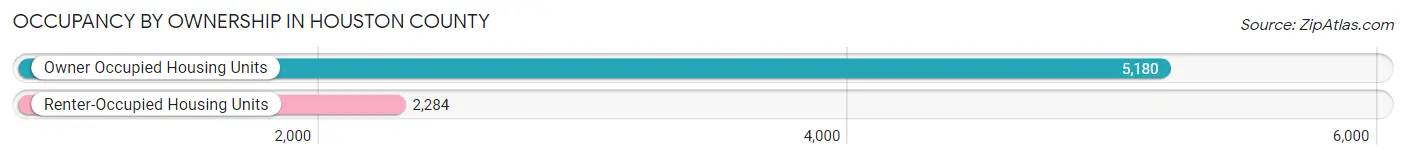
| Occupancy | # Housing Units | % Housing Units |
| Owner Occupied Housing Units | 5,180 | 69.4% |
| Renter-Occupied Housing Units | 2,284 | 30.6% |
| Total Occupied Housing Units | 7,464 | 100.0% |
Occupancy by Household Size in Houston County
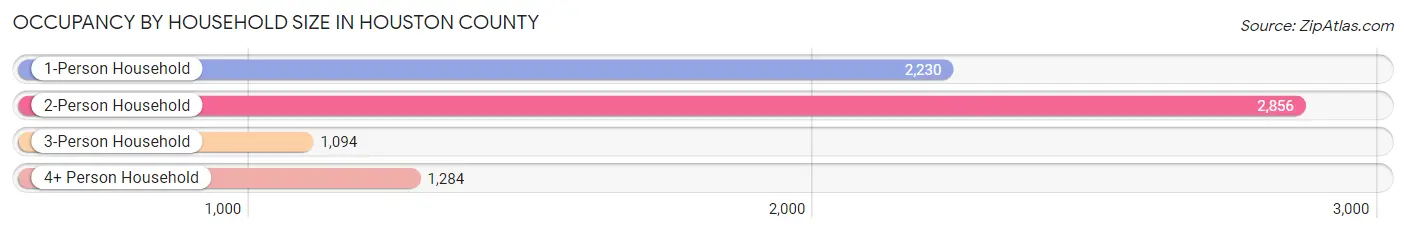
| Household Size | # Housing Units | % Housing Units |
| 1-Person Household | 2,230 | 29.9% |
| 2-Person Household | 2,856 | 38.3% |
| 3-Person Household | 1,094 | 14.7% |
| 4+ Person Household | 1,284 | 17.2% |
| Total Housing Units | 7,464 | 100.0% |
Occupancy by Ownership by Household Size in Houston County
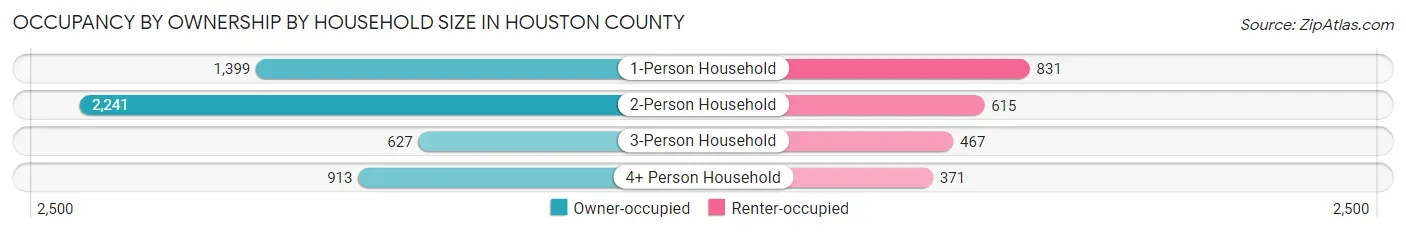
| Household Size | Owner-occupied | Renter-occupied |
| 1-Person Household | 1,399 (62.7%) | 831 (37.3%) |
| 2-Person Household | 2,241 (78.5%) | 615 (21.5%) |
| 3-Person Household | 627 (57.3%) | 467 (42.7%) |
| 4+ Person Household | 913 (71.1%) | 371 (28.9%) |
| Total Housing Units | 5,180 (69.4%) | 2,284 (30.6%) |
Occupancy by Educational Attainment in Houston County
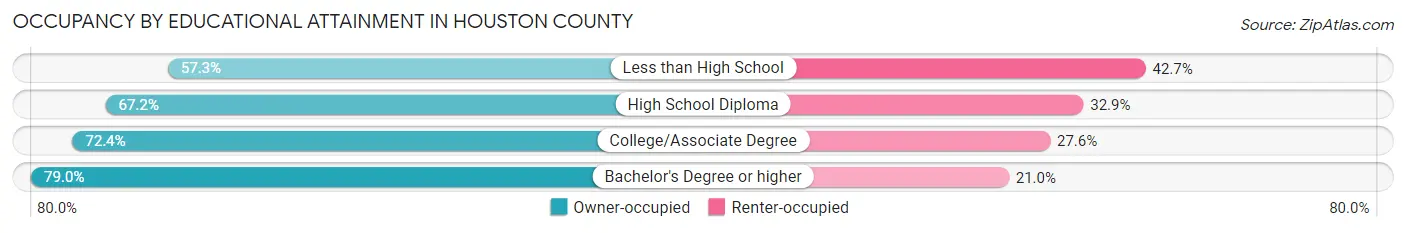
| Household Size | Owner-occupied | Renter-occupied |
| Less than High School | 650 (57.3%) | 485 (42.7%) |
| High School Diploma | 1,834 (67.1%) | 897 (32.9%) |
| College/Associate Degree | 1,607 (72.4%) | 612 (27.6%) |
| Bachelor's Degree or higher | 1,089 (79.0%) | 290 (21.0%) |
Occupancy by Age of Householder in Houston County
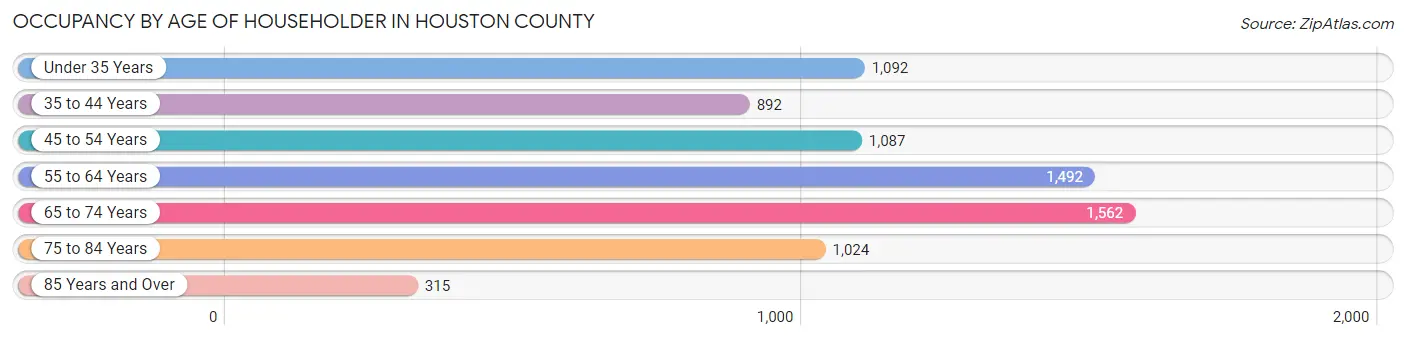
| Age Bracket | # Households | % Households |
| Under 35 Years | 1,092 | 14.6% |
| 35 to 44 Years | 892 | 11.9% |
| 45 to 54 Years | 1,087 | 14.6% |
| 55 to 64 Years | 1,492 | 20.0% |
| 65 to 74 Years | 1,562 | 20.9% |
| 75 to 84 Years | 1,024 | 13.7% |
| 85 Years and Over | 315 | 4.2% |
| Total | 7,464 | 100.0% |
Housing Finances in Houston County
Median Income by Occupancy in Houston County
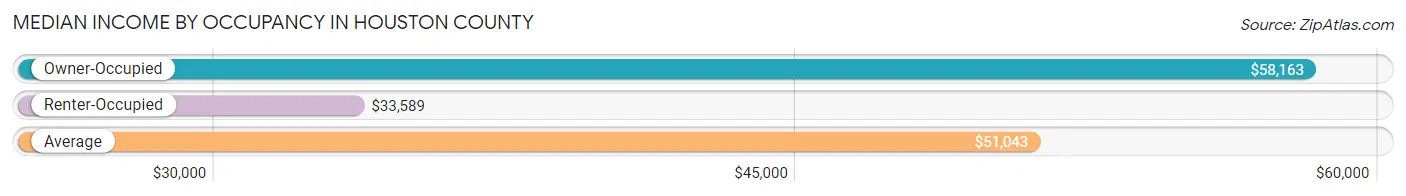
| Occupancy Type | # Households | Median Income |
| Owner-Occupied | 5,180 (69.4%) | $58,163 |
| Renter-Occupied | 2,284 (30.6%) | $33,589 |
| Average | 7,464 (100.0%) | $51,043 |
Occupancy by Householder Income Bracket in Houston County
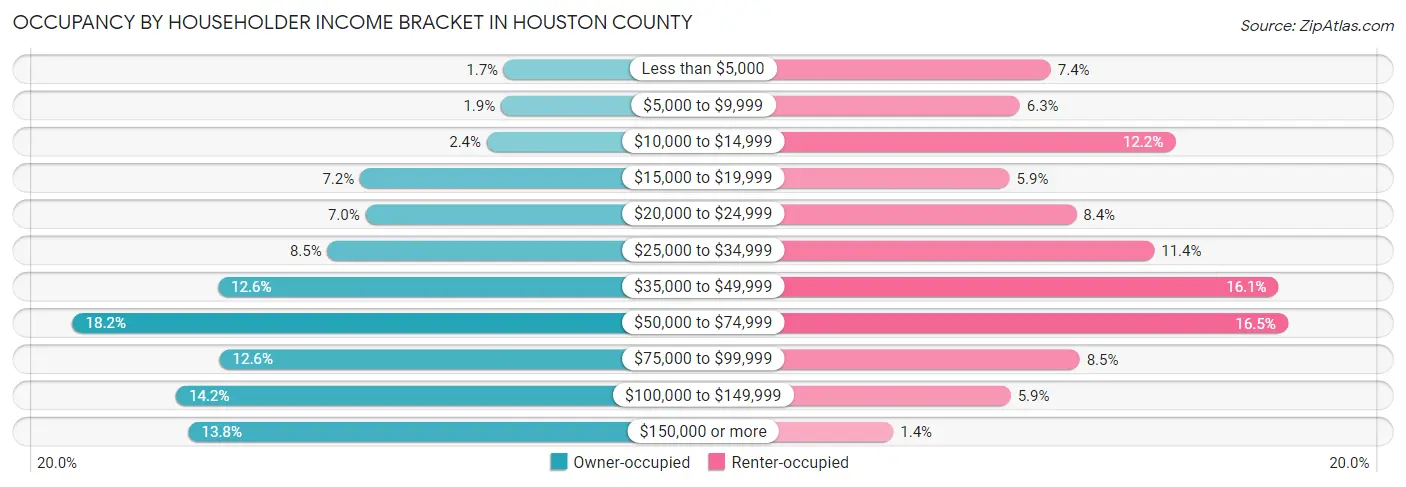
| Income Bracket | Owner-occupied | Renter-occupied |
| Less than $5,000 | 90 (1.7%) | 170 (7.4%) |
| $5,000 to $9,999 | 96 (1.8%) | 143 (6.3%) |
| $10,000 to $14,999 | 124 (2.4%) | 278 (12.2%) |
| $15,000 to $19,999 | 374 (7.2%) | 134 (5.9%) |
| $20,000 to $24,999 | 363 (7.0%) | 192 (8.4%) |
| $25,000 to $34,999 | 438 (8.5%) | 260 (11.4%) |
| $35,000 to $49,999 | 654 (12.6%) | 368 (16.1%) |
| $50,000 to $74,999 | 941 (18.2%) | 376 (16.5%) |
| $75,000 to $99,999 | 651 (12.6%) | 195 (8.5%) |
| $100,000 to $149,999 | 737 (14.2%) | 135 (5.9%) |
| $150,000 or more | 712 (13.8%) | 33 (1.4%) |
| Total | 5,180 (100.0%) | 2,284 (100.0%) |
Monthly Housing Cost Tiers in Houston County
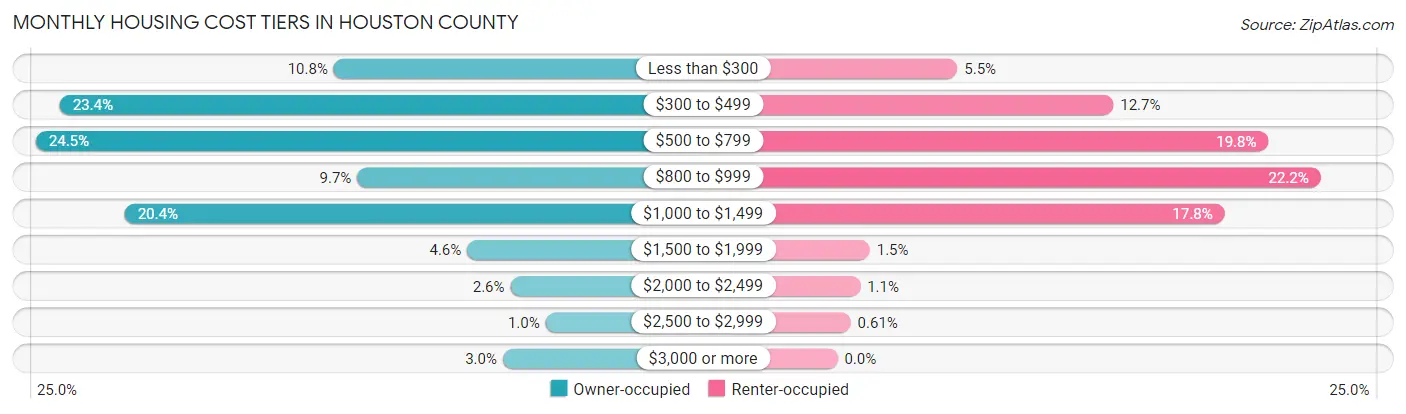
| Monthly Cost | Owner-occupied | Renter-occupied |
| Less than $300 | 558 (10.8%) | 126 (5.5%) |
| $300 to $499 | 1,211 (23.4%) | 290 (12.7%) |
| $500 to $799 | 1,268 (24.5%) | 453 (19.8%) |
| $800 to $999 | 502 (9.7%) | 508 (22.2%) |
| $1,000 to $1,499 | 1,056 (20.4%) | 407 (17.8%) |
| $1,500 to $1,999 | 240 (4.6%) | 34 (1.5%) |
| $2,000 to $2,499 | 137 (2.6%) | 24 (1.1%) |
| $2,500 to $2,999 | 53 (1.0%) | 14 (0.6%) |
| $3,000 or more | 155 (3.0%) | 0 (0.0%) |
| Total | 5,180 (100.0%) | 2,284 (100.0%) |
Physical Housing Characteristics in Houston County
Housing Structures in Houston County
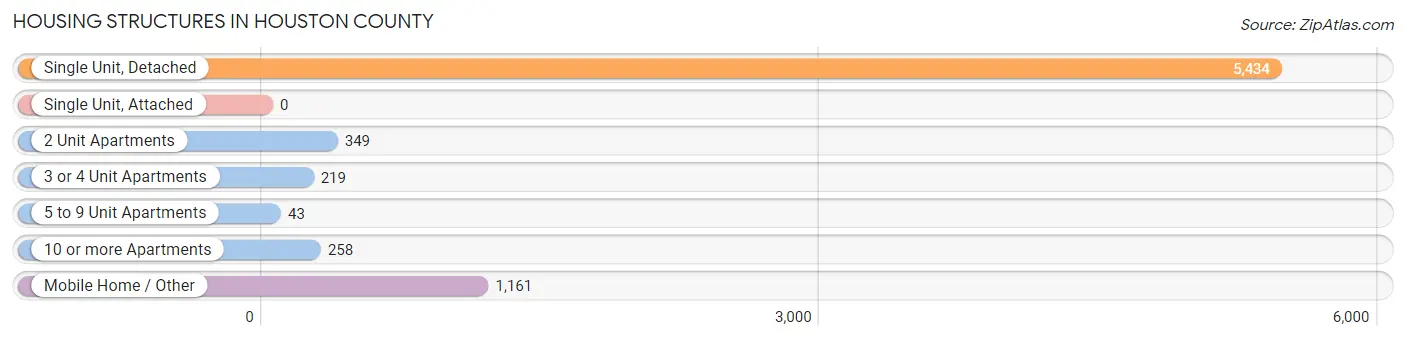
| Structure Type | # Housing Units | % Housing Units |
| Single Unit, Detached | 5,434 | 72.8% |
| Single Unit, Attached | 0 | 0.0% |
| 2 Unit Apartments | 349 | 4.7% |
| 3 or 4 Unit Apartments | 219 | 2.9% |
| 5 to 9 Unit Apartments | 43 | 0.6% |
| 10 or more Apartments | 258 | 3.5% |
| Mobile Home / Other | 1,161 | 15.5% |
| Total | 7,464 | 100.0% |
Housing Structures by Occupancy in Houston County
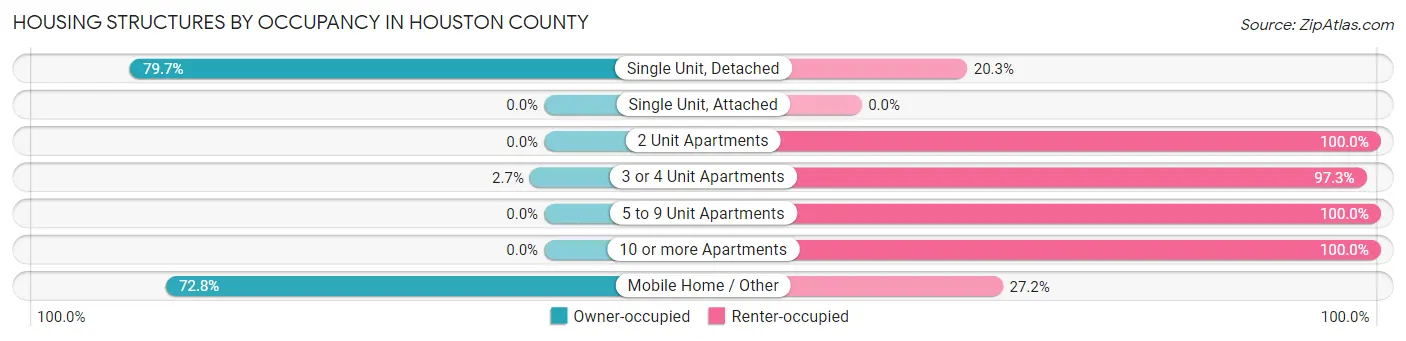
| Structure Type | Owner-occupied | Renter-occupied |
| Single Unit, Detached | 4,329 (79.7%) | 1,105 (20.3%) |
| Single Unit, Attached | 0 (0.0%) | 0 (0.0%) |
| 2 Unit Apartments | 0 (0.0%) | 349 (100.0%) |
| 3 or 4 Unit Apartments | 6 (2.7%) | 213 (97.3%) |
| 5 to 9 Unit Apartments | 0 (0.0%) | 43 (100.0%) |
| 10 or more Apartments | 0 (0.0%) | 258 (100.0%) |
| Mobile Home / Other | 845 (72.8%) | 316 (27.2%) |
| Total | 5,180 (69.4%) | 2,284 (30.6%) |
Housing Structures by Number of Rooms in Houston County
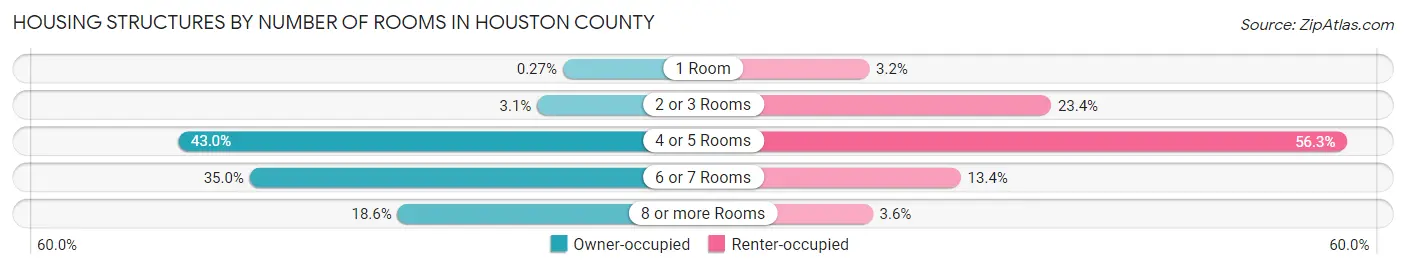
| Number of Rooms | Owner-occupied | Renter-occupied |
| 1 Room | 14 (0.3%) | 74 (3.2%) |
| 2 or 3 Rooms | 161 (3.1%) | 535 (23.4%) |
| 4 or 5 Rooms | 2,227 (43.0%) | 1,286 (56.3%) |
| 6 or 7 Rooms | 1,814 (35.0%) | 306 (13.4%) |
| 8 or more Rooms | 964 (18.6%) | 83 (3.6%) |
| Total | 5,180 (100.0%) | 2,284 (100.0%) |
Housing Structure by Heating Type in Houston County
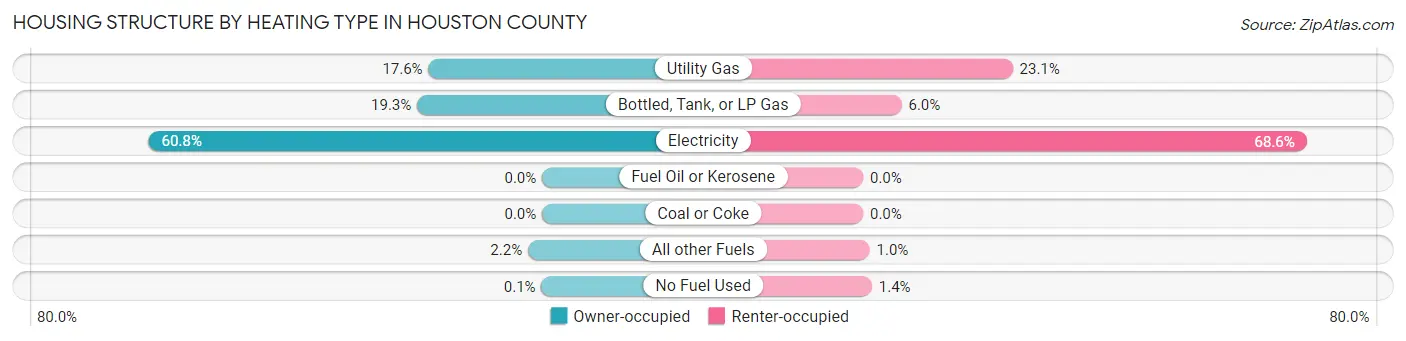
| Heating Type | Owner-occupied | Renter-occupied |
| Utility Gas | 910 (17.6%) | 528 (23.1%) |
| Bottled, Tank, or LP Gas | 1,001 (19.3%) | 136 (5.9%) |
| Electricity | 3,151 (60.8%) | 1,566 (68.6%) |
| Fuel Oil or Kerosene | 0 (0.0%) | 0 (0.0%) |
| Coal or Coke | 0 (0.0%) | 0 (0.0%) |
| All other Fuels | 113 (2.2%) | 23 (1.0%) |
| No Fuel Used | 5 (0.1%) | 31 (1.4%) |
| Total | 5,180 (100.0%) | 2,284 (100.0%) |
Household Vehicle Usage in Houston County
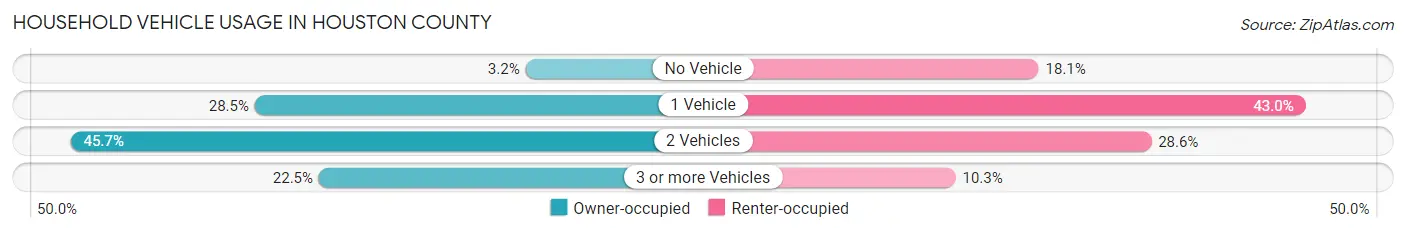
| Vehicles per Household | Owner-occupied | Renter-occupied |
| No Vehicle | 168 (3.2%) | 413 (18.1%) |
| 1 Vehicle | 1,477 (28.5%) | 982 (43.0%) |
| 2 Vehicles | 2,368 (45.7%) | 653 (28.6%) |
| 3 or more Vehicles | 1,167 (22.5%) | 236 (10.3%) |
| Total | 5,180 (100.0%) | 2,284 (100.0%) |
Real Estate & Mortgages in Houston County
Real Estate and Mortgage Overview in Houston County
| Characteristic | Without Mortgage | With Mortgage |
| Housing Units | 3,576 | 1,604 |
| Median Property Value | $116,600 | $152,200 |
| Median Household Income | $51,545 | $379 |
| Monthly Housing Costs | $508 | $155 |
| Real Estate Taxes | $1,233 | $46 |
Property Value by Mortgage Status in Houston County
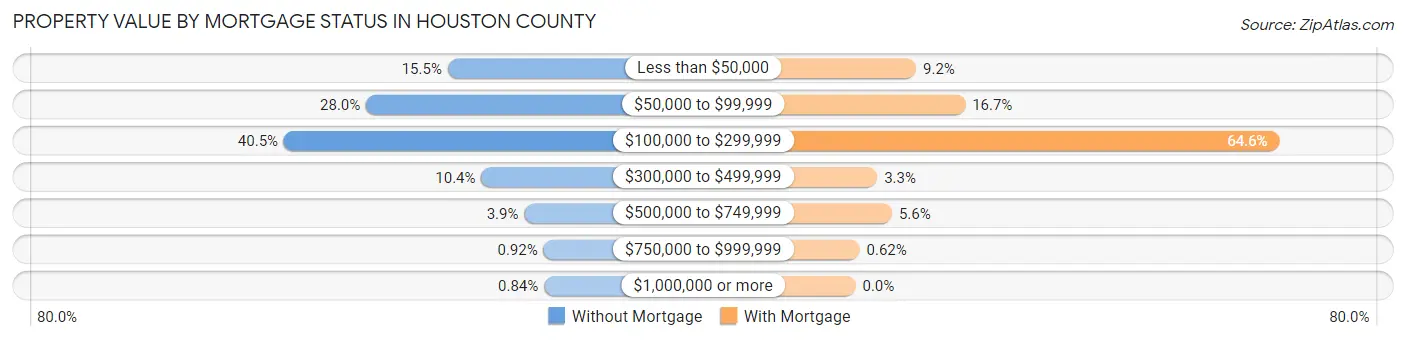
| Property Value | Without Mortgage | With Mortgage |
| Less than $50,000 | 555 (15.5%) | 148 (9.2%) |
| $50,000 to $99,999 | 1,000 (28.0%) | 268 (16.7%) |
| $100,000 to $299,999 | 1,448 (40.5%) | 1,036 (64.6%) |
| $300,000 to $499,999 | 372 (10.4%) | 53 (3.3%) |
| $500,000 to $749,999 | 138 (3.9%) | 89 (5.6%) |
| $750,000 to $999,999 | 33 (0.9%) | 10 (0.6%) |
| $1,000,000 or more | 30 (0.8%) | 0 (0.0%) |
| Total | 3,576 (100.0%) | 1,604 (100.0%) |
Household Income by Mortgage Status in Houston County
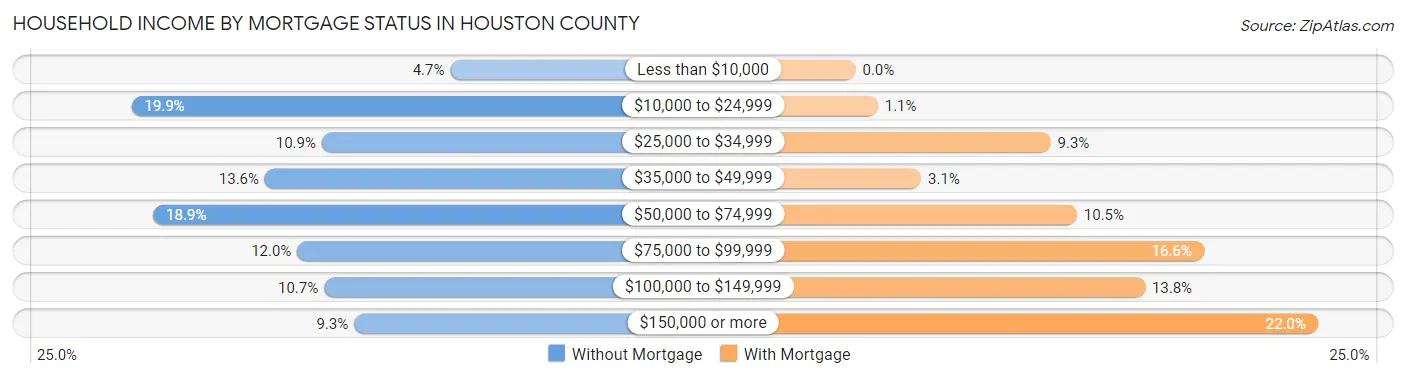
| Household Income | Without Mortgage | With Mortgage |
| Less than $10,000 | 169 (4.7%) | 0 (0.0%) |
| $10,000 to $24,999 | 712 (19.9%) | 17 (1.1%) |
| $25,000 to $34,999 | 388 (10.8%) | 149 (9.3%) |
| $35,000 to $49,999 | 485 (13.6%) | 50 (3.1%) |
| $50,000 to $74,999 | 675 (18.9%) | 169 (10.5%) |
| $75,000 to $99,999 | 430 (12.0%) | 266 (16.6%) |
| $100,000 to $149,999 | 384 (10.7%) | 221 (13.8%) |
| $150,000 or more | 333 (9.3%) | 353 (22.0%) |
| Total | 3,576 (100.0%) | 1,604 (100.0%) |
Property Value to Household Income Ratio in Houston County
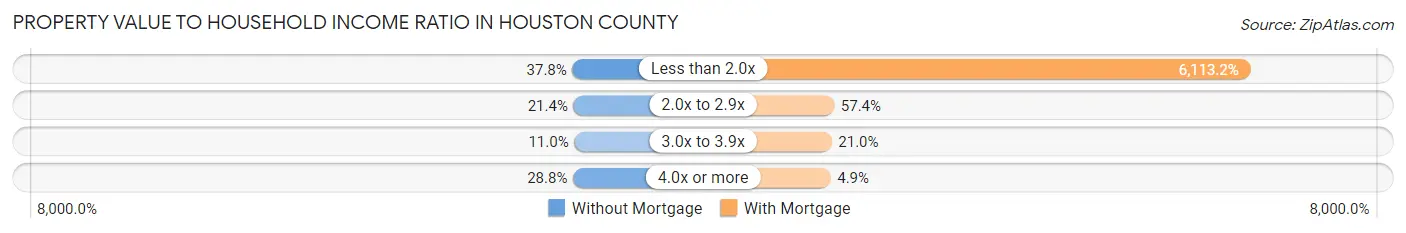
| Value-to-Income Ratio | Without Mortgage | With Mortgage |
| Less than 2.0x | 1,353 (37.8%) | 98,056 (6,113.2%) |
| 2.0x to 2.9x | 765 (21.4%) | 921 (57.4%) |
| 3.0x to 3.9x | 393 (11.0%) | 337 (21.0%) |
| 4.0x or more | 1,029 (28.8%) | 79 (4.9%) |
| Total | 3,576 (100.0%) | 1,604 (100.0%) |
Real Estate Taxes by Mortgage Status in Houston County
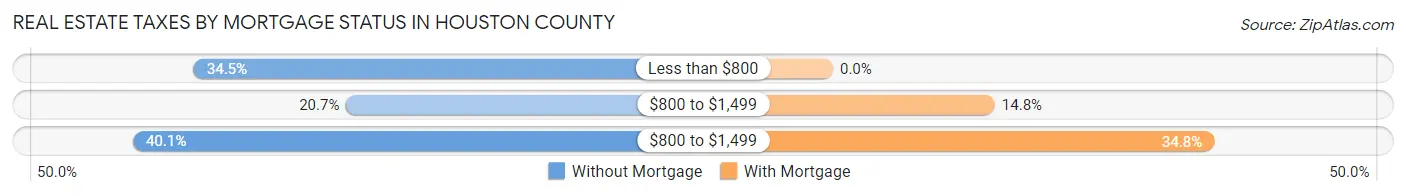
| Property Taxes | Without Mortgage | With Mortgage |
| Less than $800 | 1,235 (34.5%) | 0 (0.0%) |
| $800 to $1,499 | 741 (20.7%) | 237 (14.8%) |
| $800 to $1,499 | 1,434 (40.1%) | 558 (34.8%) |
| Total | 3,576 (100.0%) | 1,604 (100.0%) |
Health & Disability in Houston County
Health Insurance Coverage by Age in Houston County
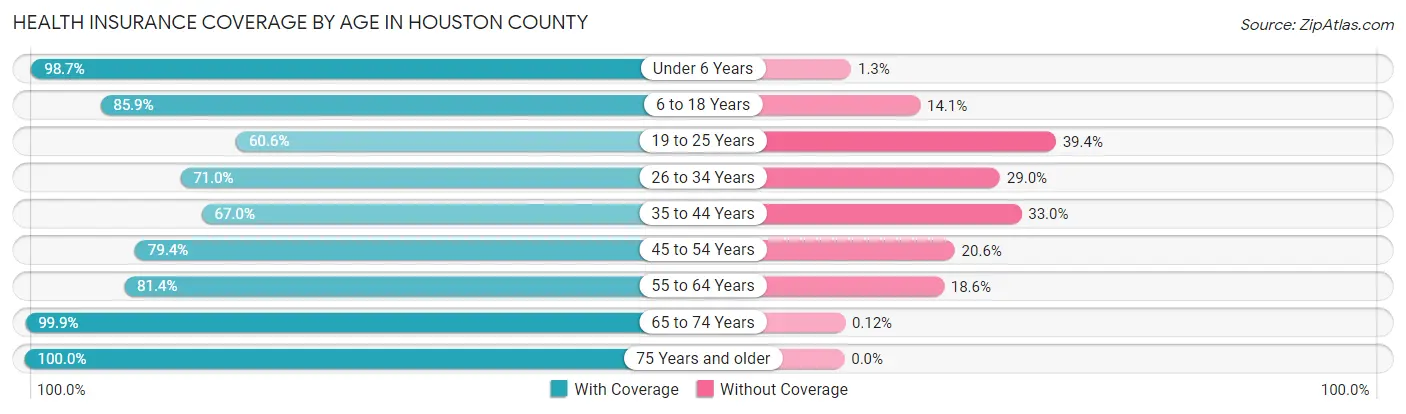
| Age Bracket | With Coverage | Without Coverage |
| Under 6 Years | 1,413 (98.7%) | 18 (1.3%) |
| 6 to 18 Years | 2,724 (85.9%) | 448 (14.1%) |
| 19 to 25 Years | 805 (60.6%) | 524 (39.4%) |
| 26 to 34 Years | 1,333 (71.0%) | 545 (29.0%) |
| 35 to 44 Years | 1,391 (67.0%) | 685 (33.0%) |
| 45 to 54 Years | 1,663 (79.4%) | 431 (20.6%) |
| 55 to 64 Years | 2,076 (81.4%) | 473 (18.6%) |
| 65 to 74 Years | 2,576 (99.9%) | 3 (0.1%) |
| 75 Years and older | 2,090 (100.0%) | 0 (0.0%) |
| Total | 16,071 (83.7%) | 3,127 (16.3%) |
Health Insurance Coverage by Citizenship Status in Houston County
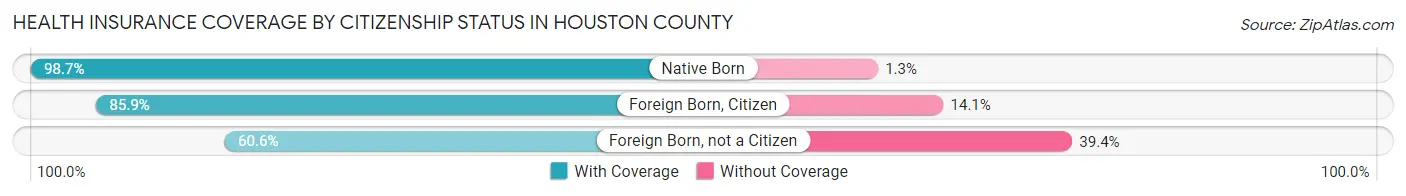
| Citizenship Status | With Coverage | Without Coverage |
| Native Born | 1,413 (98.7%) | 18 (1.3%) |
| Foreign Born, Citizen | 2,724 (85.9%) | 448 (14.1%) |
| Foreign Born, not a Citizen | 805 (60.6%) | 524 (39.4%) |
Health Insurance Coverage by Household Income in Houston County
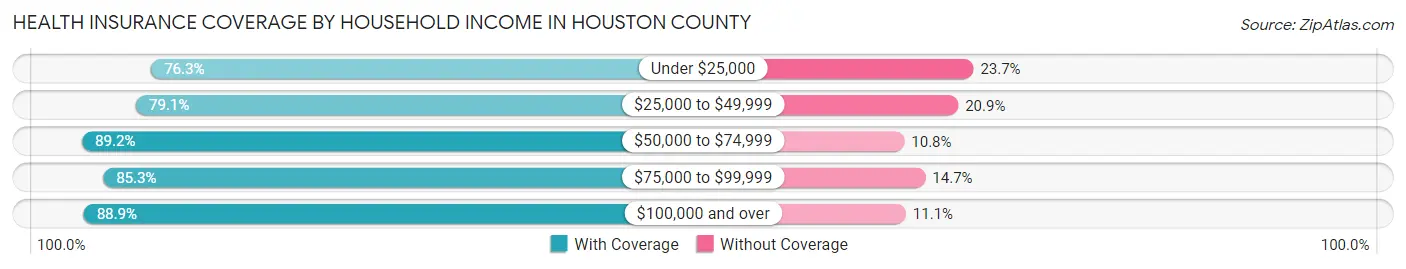
| Household Income | With Coverage | Without Coverage |
| Under $25,000 | 2,770 (76.3%) | 862 (23.7%) |
| $25,000 to $49,999 | 3,292 (79.1%) | 869 (20.9%) |
| $50,000 to $74,999 | 3,215 (89.2%) | 389 (10.8%) |
| $75,000 to $99,999 | 2,339 (85.3%) | 404 (14.7%) |
| $100,000 and over | 4,390 (88.9%) | 547 (11.1%) |
Public vs Private Health Insurance Coverage by Age in Houston County
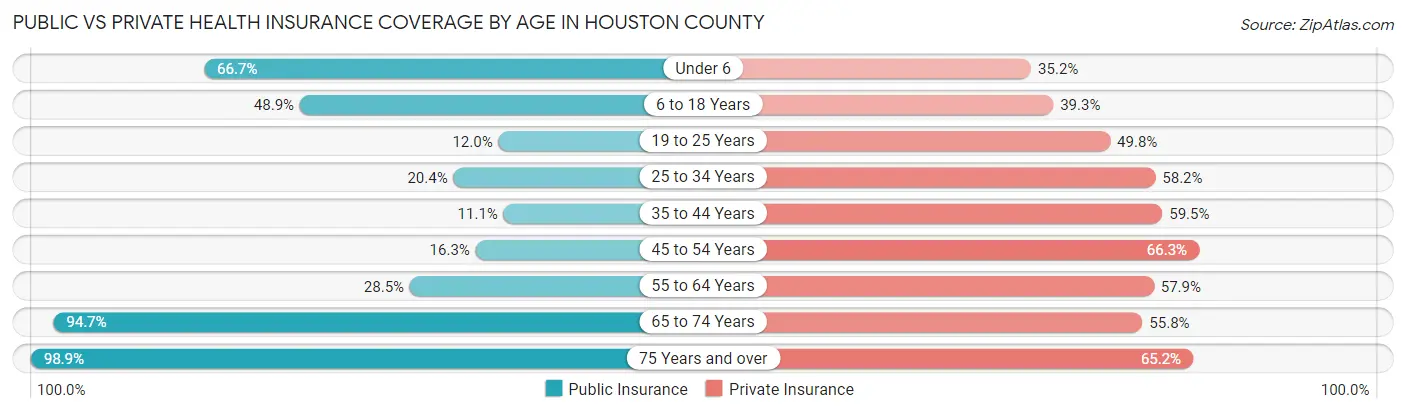
| Age Bracket | Public Insurance | Private Insurance |
| Under 6 | 954 (66.7%) | 503 (35.1%) |
| 6 to 18 Years | 1,551 (48.9%) | 1,245 (39.3%) |
| 19 to 25 Years | 160 (12.0%) | 662 (49.8%) |
| 25 to 34 Years | 383 (20.4%) | 1,093 (58.2%) |
| 35 to 44 Years | 230 (11.1%) | 1,235 (59.5%) |
| 45 to 54 Years | 341 (16.3%) | 1,388 (66.3%) |
| 55 to 64 Years | 726 (28.5%) | 1,476 (57.9%) |
| 65 to 74 Years | 2,441 (94.7%) | 1,439 (55.8%) |
| 75 Years and over | 2,066 (98.9%) | 1,362 (65.2%) |
| Total | 8,852 (46.1%) | 10,403 (54.2%) |
Disability Status by Sex by Age in Houston County
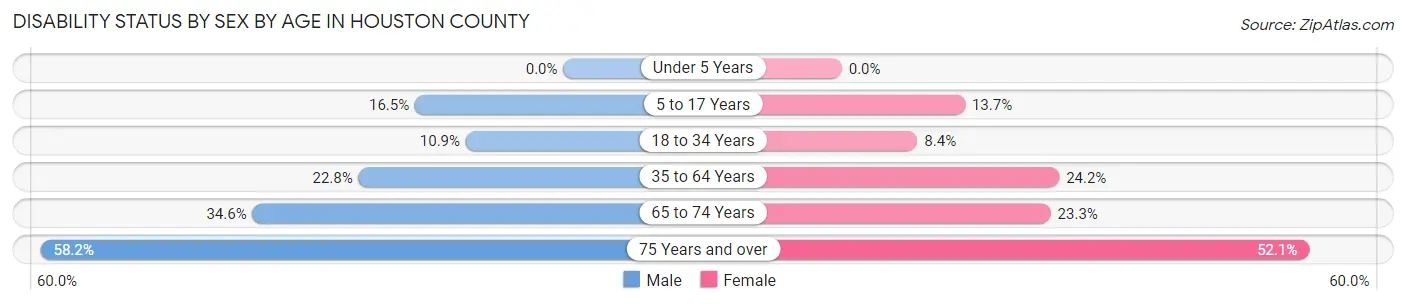
| Age Bracket | Male | Female |
| Under 5 Years | 0 (0.0%) | 0 (0.0%) |
| 5 to 17 Years | 269 (16.5%) | 219 (13.7%) |
| 18 to 34 Years | 192 (10.9%) | 147 (8.4%) |
| 35 to 64 Years | 712 (22.8%) | 871 (24.2%) |
| 65 to 74 Years | 421 (34.6%) | 317 (23.3%) |
| 75 Years and over | 549 (58.2%) | 597 (52.0%) |
Disability Class by Sex by Age in Houston County
Disability Class: Hearing Difficulty
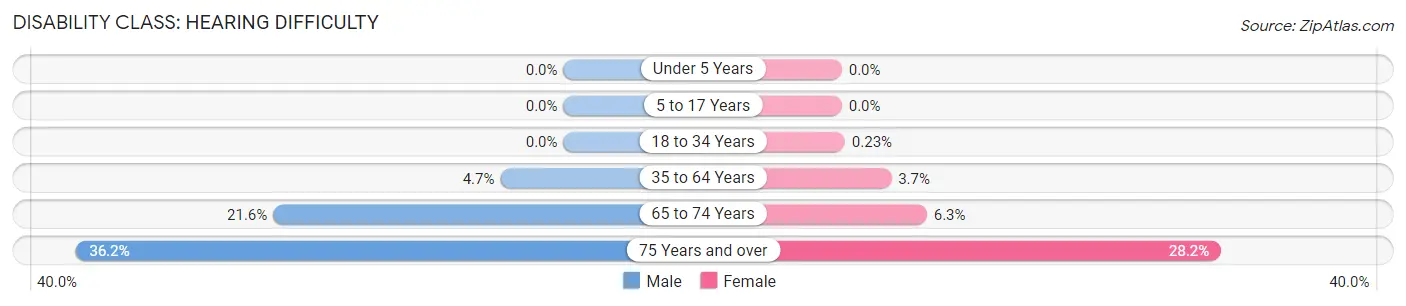
| Age Bracket | Male | Female |
| Under 5 Years | 0 (0.0%) | 0 (0.0%) |
| 5 to 17 Years | 0 (0.0%) | 0 (0.0%) |
| 18 to 34 Years | 0 (0.0%) | 4 (0.2%) |
| 35 to 64 Years | 146 (4.7%) | 132 (3.7%) |
| 65 to 74 Years | 262 (21.5%) | 86 (6.3%) |
| 75 Years and over | 341 (36.2%) | 323 (28.2%) |
Disability Class: Vision Difficulty
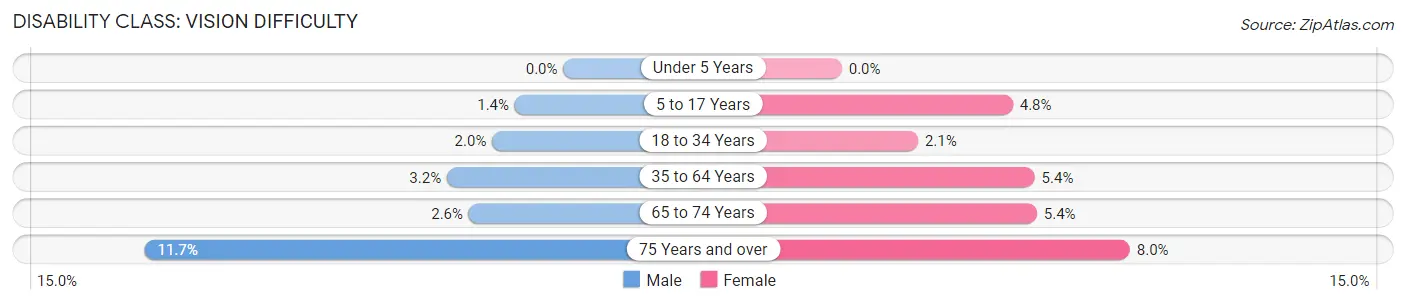
| Age Bracket | Male | Female |
| Under 5 Years | 0 (0.0%) | 0 (0.0%) |
| 5 to 17 Years | 22 (1.3%) | 76 (4.8%) |
| 18 to 34 Years | 35 (2.0%) | 37 (2.1%) |
| 35 to 64 Years | 101 (3.2%) | 193 (5.4%) |
| 65 to 74 Years | 32 (2.6%) | 74 (5.4%) |
| 75 Years and over | 110 (11.7%) | 92 (8.0%) |
Disability Class: Cognitive Difficulty
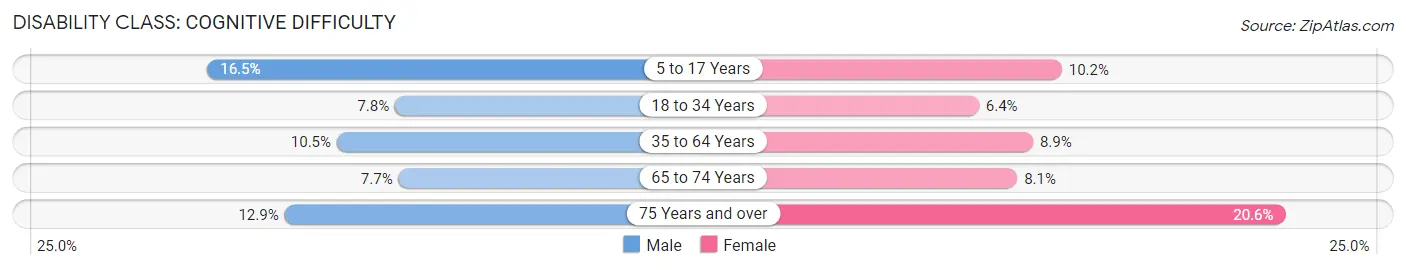
| Age Bracket | Male | Female |
| 5 to 17 Years | 269 (16.5%) | 163 (10.2%) |
| 18 to 34 Years | 138 (7.8%) | 111 (6.4%) |
| 35 to 64 Years | 328 (10.5%) | 319 (8.9%) |
| 65 to 74 Years | 93 (7.6%) | 111 (8.1%) |
| 75 Years and over | 122 (12.9%) | 236 (20.6%) |
Disability Class: Ambulatory Difficulty
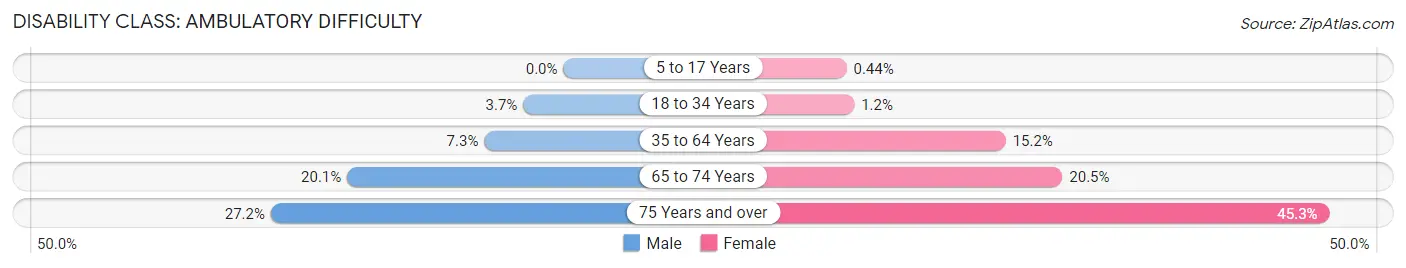
| Age Bracket | Male | Female |
| 5 to 17 Years | 0 (0.0%) | 7 (0.4%) |
| 18 to 34 Years | 66 (3.7%) | 20 (1.1%) |
| 35 to 64 Years | 229 (7.3%) | 547 (15.2%) |
| 65 to 74 Years | 244 (20.1%) | 279 (20.5%) |
| 75 Years and over | 256 (27.2%) | 519 (45.3%) |
Disability Class: Self-Care Difficulty
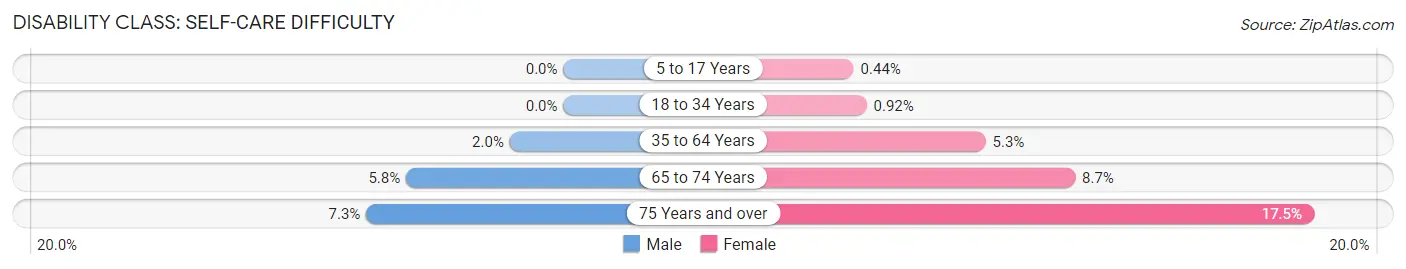
| Age Bracket | Male | Female |
| 5 to 17 Years | 0 (0.0%) | 7 (0.4%) |
| 18 to 34 Years | 0 (0.0%) | 16 (0.9%) |
| 35 to 64 Years | 62 (2.0%) | 192 (5.3%) |
| 65 to 74 Years | 71 (5.8%) | 118 (8.7%) |
| 75 Years and over | 69 (7.3%) | 201 (17.5%) |
Technology Access in Houston County
Computing Device Access in Houston County
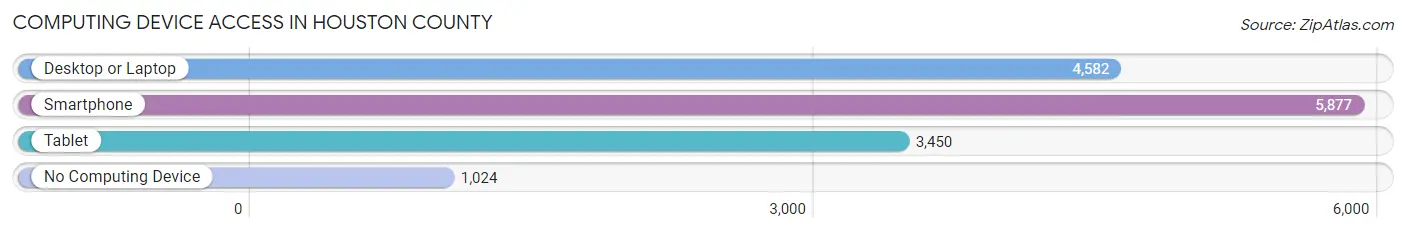
| Device Type | # Households | % Households |
| Desktop or Laptop | 4,582 | 61.4% |
| Smartphone | 5,877 | 78.7% |
| Tablet | 3,450 | 46.2% |
| No Computing Device | 1,024 | 13.7% |
| Total | 7,464 | 100.0% |
Internet Access in Houston County
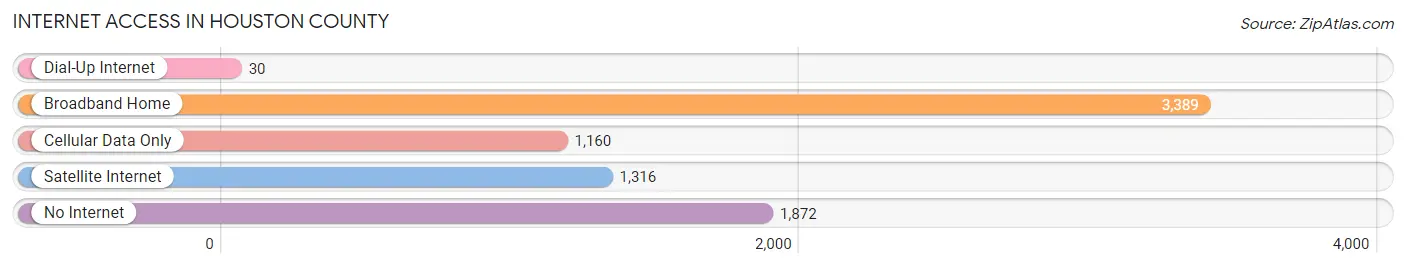
| Internet Type | # Households | % Households |
| Dial-Up Internet | 30 | 0.4% |
| Broadband Home | 3,389 | 45.4% |
| Cellular Data Only | 1,160 | 15.5% |
| Satellite Internet | 1,316 | 17.6% |
| No Internet | 1,872 | 25.1% |
| Total | 7,464 | 100.0% |
Houston County Summary
History
Houston County, Texas is located in the eastern part of the state and is part of the Piney Woods region. It was established in 1837 and named after Sam Houston, the first president of the Republic of Texas. The county was originally part of Nacogdoches County, but was later divided into its own county. The county seat is Crockett, which was named after Davy Crockett, a famous frontiersman and politician.
The first settlers in the area were Native Americans, who had been living in the area for thousands of years. The first European settlers arrived in the early 1800s, and the county was officially established in 1837. The county was largely agricultural, with cotton and timber being the main crops. The county also had a thriving lumber industry, with several sawmills located in the area.
The county was also home to several military installations during the Civil War, including Camp Crockett and Camp Houston. These camps were used to train Confederate soldiers and to protect the area from Union forces.
Geography
Houston County is located in the eastern part of Texas, and is part of the Piney Woods region. It is bordered by Anderson County to the north, Trinity County to the east, Madison County to the south, and Leon County to the west. The county covers an area of 845 square miles, and is mostly rural and forested. The terrain is mostly flat, with some rolling hills in the northern part of the county. The county is drained by the Trinity River, which flows through the county from north to south.
The climate of Houston County is humid subtropical, with hot summers and mild winters. The average annual temperature is around 70 degrees Fahrenheit, and the average annual precipitation is around 40 inches.
Economy
Houston County has a diverse economy, with a mix of agriculture, manufacturing, and services. The county is home to several large companies, including Tyson Foods, which has a large poultry processing plant in the county. Other major employers include the Houston County Electric Cooperative, the Houston County Hospital, and the Houston County School District.
Agriculture is an important part of the county’s economy, with cotton, soybeans, and timber being the main crops. The county also has a thriving timber industry, with several sawmills located in the area.
Demographics
As of the 2010 census, the population of Houston County was 23,732. The population is mostly white (83.3%), with African Americans (12.2%), Hispanics (2.7%), and Native Americans (1.2%) making up the remainder of the population. The median household income is $37,945, and the median home value is $90,000.
The county is served by several school districts, including the Houston County School District, the Crockett Independent School District, and the Latexo Independent School District. The county is also home to several higher education institutions, including Trinity Valley Community College and the University of Houston-Crockett.
Common Questions
What is Per Capita Income in Houston County?
Per Capita income in Houston County is $25,346.
What is the Median Family Income in Houston County?
Median Family Income in Houston County is $63,776.
What is the Median Household income in Houston County?
Median Household Income in Houston County is $51,043.
What is Income or Wage Gap in Houston County?
Income or Wage Gap in Houston County is 38.3%.
Women in Houston County earn 61.7 cents for every dollar earned by a man.
What is Family Income Deficit in Houston County?
Family Income Deficit in Houston County is $12,131.
Families that are below poverty line in Houston County earn $12,131 less on average than the poverty threshold level.
What is Inequality or Gini Index in Houston County?
Inequality or Gini Index in Houston County is 0.48.
What is the Total Population of Houston County?
Total Population of Houston County is 22,107.
What is the Total Male Population of Houston County?
Total Male Population of Houston County is 12,021.
What is the Total Female Population of Houston County?
Total Female Population of Houston County is 10,086.
What is the Ratio of Males per 100 Females in Houston County?
There are 119.19 Males per 100 Females in Houston County.
What is the Ratio of Females per 100 Males in Houston County?
There are 83.90 Females per 100 Males in Houston County.
What is the Median Population Age in Houston County?
Median Population Age in Houston County is 43.9 Years.
What is the Average Family Size in Houston County
Average Family Size in Houston County is 3.1 People.
What is the Average Household Size in Houston County
Average Household Size in Houston County is 2.6 People.
How Large is the Labor Force in Houston County?
There are 8,193 People in the Labor Forcein in Houston County.
What is the Percentage of People in the Labor Force in Houston County?
44.8% of People are in the Labor Force in Houston County.
What is the Unemployment Rate in Houston County?
Unemployment Rate in Houston County is 4.5%.