Hopkins County, TX Map & Demographics
Hopkins County Map
Hopkins County Overview
$32,100
PER CAPITA INCOME
$78,350
AVG FAMILY INCOME
$63,766
AVG HOUSEHOLD INCOME
30.8%
WAGE / INCOME GAP [ % ]
69.2¢/ $1
WAGE / INCOME GAP [ $ ]
$10,070
FAMILY INCOME DEFICIT
0.46
INEQUALITY / GINI INDEX
37,008
TOTAL POPULATION
18,359
MALE POPULATION
18,649
FEMALE POPULATION
98.44
MALES / 100 FEMALES
101.58
FEMALES / 100 MALES
39.7
MEDIAN AGE
3.2
AVG FAMILY SIZE
2.6
AVG HOUSEHOLD SIZE
17,989
LABOR FORCE [ PEOPLE ]
62.0%
PERCENT IN LABOR FORCE
4.8%
UNEMPLOYMENT RATE
Hopkins County Area Codes
Income in Hopkins County
Income Overview in Hopkins County
Per Capita Income in Hopkins County is $32,100, while median incomes of families and households are $78,350 and $63,766 respectively.
| Characteristic | Number | Measure |
| Per Capita Income | 37,008 | $32,100 |
| Median Family Income | 9,721 | $78,350 |
| Mean Family Income | 9,721 | $100,218 |
| Median Household Income | 13,781 | $63,766 |
| Mean Household Income | 13,781 | $84,614 |
| Income Deficit | 9,721 | $10,070 |
| Wage / Income Gap (%) | 37,008 | 30.79% |
| Wage / Income Gap ($) | 37,008 | 69.21¢ per $1 |
| Gini / Inequality Index | 37,008 | 0.46 |
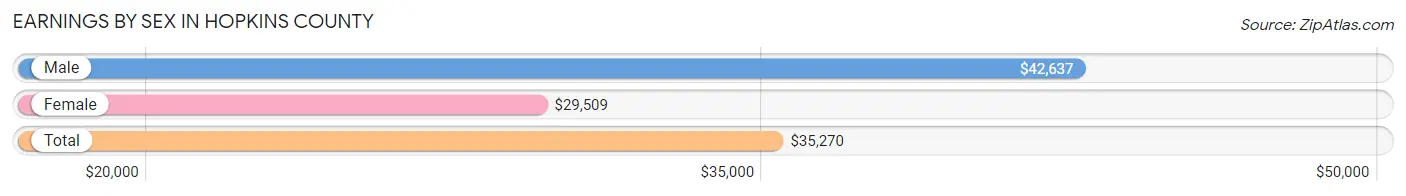
Earnings by Sex in Hopkins County
Average Earnings in Hopkins County are $35,270, $42,637 for men and $29,509 for women, a difference of 30.8%.
| Sex | Number | Average Earnings |
| Male | 10,085 (54.3%) | $42,637 |
| Female | 8,494 (45.7%) | $29,509 |
| Total | 18,579 (100.0%) | $35,270 |
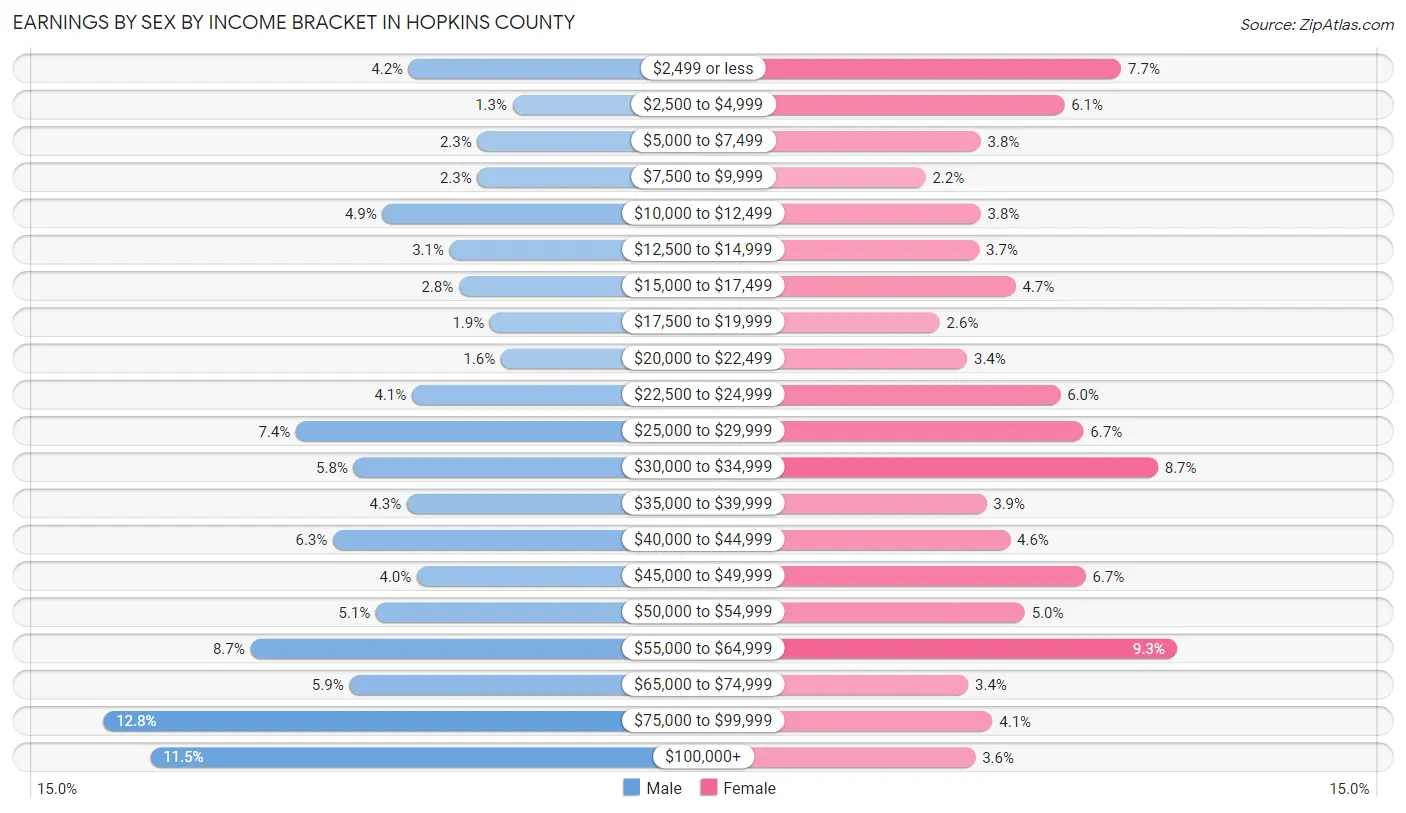
Earnings by Sex by Income Bracket in Hopkins County
The most common earnings brackets in Hopkins County are $75,000 to $99,999 for men (1,290 | 12.8%) and $55,000 to $64,999 for women (787 | 9.3%).
| Income | Male | Female |
| $2,499 or less | 424 (4.2%) | 655 (7.7%) |
| $2,500 to $4,999 | 129 (1.3%) | 519 (6.1%) |
| $5,000 to $7,499 | 229 (2.3%) | 319 (3.8%) |
| $7,500 to $9,999 | 229 (2.3%) | 188 (2.2%) |
| $10,000 to $12,499 | 498 (4.9%) | 319 (3.8%) |
| $12,500 to $14,999 | 308 (3.0%) | 316 (3.7%) |
| $15,000 to $17,499 | 281 (2.8%) | 403 (4.7%) |
| $17,500 to $19,999 | 194 (1.9%) | 222 (2.6%) |
| $20,000 to $22,499 | 162 (1.6%) | 287 (3.4%) |
| $22,500 to $24,999 | 414 (4.1%) | 510 (6.0%) |
| $25,000 to $29,999 | 743 (7.4%) | 565 (6.7%) |
| $30,000 to $34,999 | 580 (5.8%) | 742 (8.7%) |
| $35,000 to $39,999 | 429 (4.3%) | 333 (3.9%) |
| $40,000 to $44,999 | 638 (6.3%) | 390 (4.6%) |
| $45,000 to $49,999 | 400 (4.0%) | 570 (6.7%) |
| $50,000 to $54,999 | 516 (5.1%) | 425 (5.0%) |
| $55,000 to $64,999 | 872 (8.6%) | 787 (9.3%) |
| $65,000 to $74,999 | 592 (5.9%) | 290 (3.4%) |
| $75,000 to $99,999 | 1,290 (12.8%) | 347 (4.1%) |
| $100,000+ | 1,157 (11.5%) | 307 (3.6%) |
| Total | 10,085 (100.0%) | 8,494 (100.0%) |
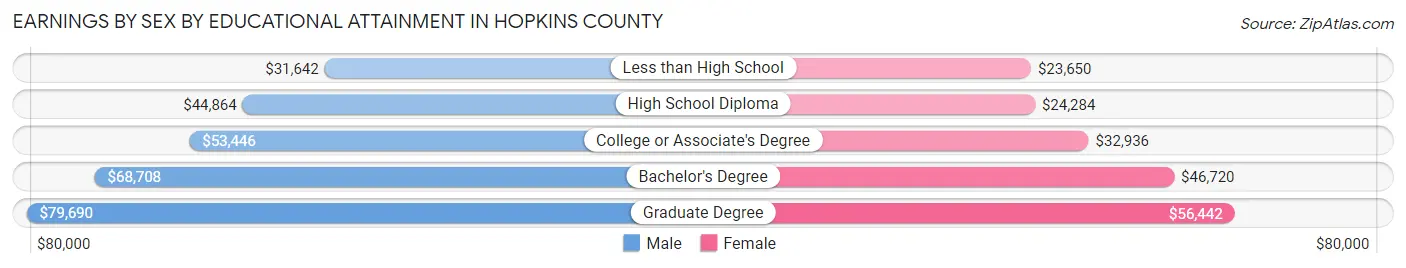
Earnings by Sex by Educational Attainment in Hopkins County
Average earnings in Hopkins County are $49,722 for men and $33,315 for women, a difference of 33.0%. Men with an educational attainment of graduate degree enjoy the highest average annual earnings of $79,690, while those with less than high school education earn the least with $31,642. Women with an educational attainment of graduate degree earn the most with the average annual earnings of $56,442, while those with less than high school education have the smallest earnings of $23,650.
| Educational Attainment | Male Income | Female Income |
| Less than High School | $31,642 | $23,650 |
| High School Diploma | $44,864 | $24,284 |
| College or Associate's Degree | $53,446 | $32,936 |
| Bachelor's Degree | $68,708 | $46,720 |
| Graduate Degree | $79,690 | $56,442 |
| Total | $49,722 | $33,315 |
Family Income in Hopkins County
Family Income Brackets in Hopkins County
According to the Hopkins County family income data, there are 2,012 families falling into the $100,000 to $149,999 income range, which is the most common income bracket and makes up 20.7% of all families. Conversely, the $10,000 to $14,999 income bracket is the least frequent group with only 282 families (2.9%) belonging to this category.
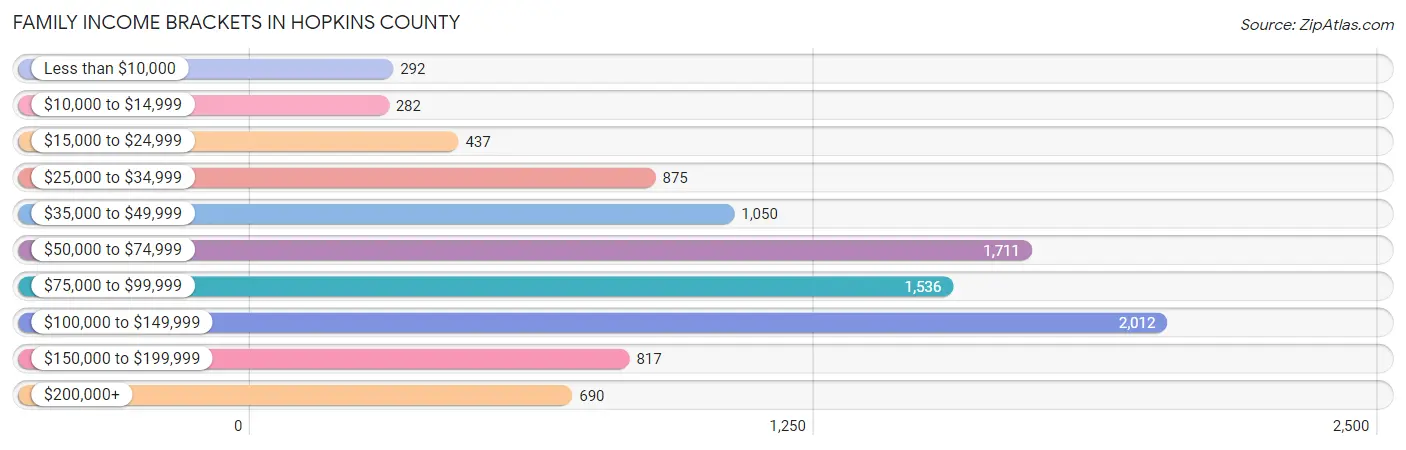
| Income Bracket | # Families | % Families |
| Less than $10,000 | 292 | 3.0% |
| $10,000 to $14,999 | 282 | 2.9% |
| $15,000 to $24,999 | 437 | 4.5% |
| $25,000 to $34,999 | 875 | 9.0% |
| $35,000 to $49,999 | 1,050 | 10.8% |
| $50,000 to $74,999 | 1,711 | 17.6% |
| $75,000 to $99,999 | 1,536 | 15.8% |
| $100,000 to $149,999 | 2,012 | 20.7% |
| $150,000 to $199,999 | 817 | 8.4% |
| $200,000+ | 690 | 7.1% |
Family Income by Famaliy Size in Hopkins County
7+ person families (205 | 2.1%) account for the highest median family income in Hopkins County with $180,268 per family, while 2-person families (4,538 | 46.7%) have the highest median income of $36,116 per family member.
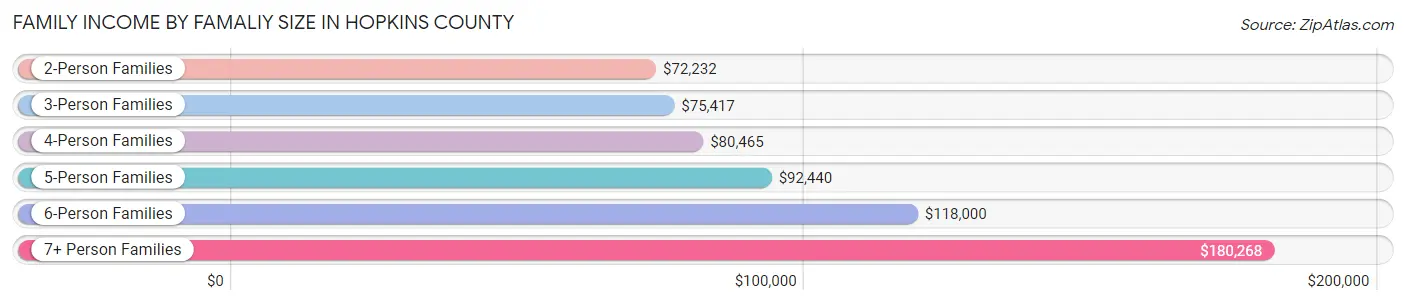
| Income Bracket | # Families | Median Income |
| 2-Person Families | 4,538 (46.7%) | $72,232 |
| 3-Person Families | 1,855 (19.1%) | $75,417 |
| 4-Person Families | 2,028 (20.9%) | $80,465 |
| 5-Person Families | 849 (8.7%) | $92,440 |
| 6-Person Families | 246 (2.5%) | $118,000 |
| 7+ Person Families | 205 (2.1%) | $180,268 |
| Total | 9,721 (100.0%) | $78,350 |
Family Income by Number of Earners in Hopkins County
The median family income in Hopkins County is $78,350, with families comprising 3+ earners (1,066) having the highest median family income of $130,992, while families with no earners (1,472) have the lowest median family income of $45,357, accounting for 11.0% and 15.1% of families, respectively.
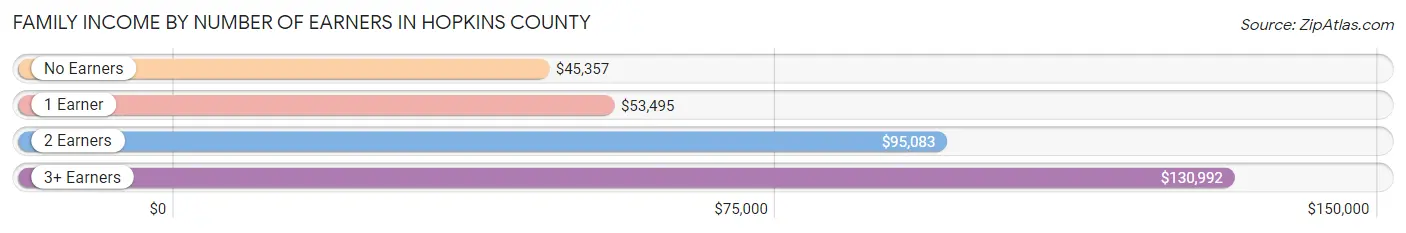
| Number of Earners | # Families | Median Income |
| No Earners | 1,472 (15.1%) | $45,357 |
| 1 Earner | 3,166 (32.6%) | $53,495 |
| 2 Earners | 4,017 (41.3%) | $95,083 |
| 3+ Earners | 1,066 (11.0%) | $130,992 |
| Total | 9,721 (100.0%) | $78,350 |
Household Income in Hopkins County
Household Income Brackets in Hopkins County
With 2,591 households falling in the category, the $50,000 to $74,999 income range is the most frequent in Hopkins County, accounting for 18.8% of all households. In contrast, only 634 households (4.6%) fall into the less than $10,000 income bracket, making it the least populous group.
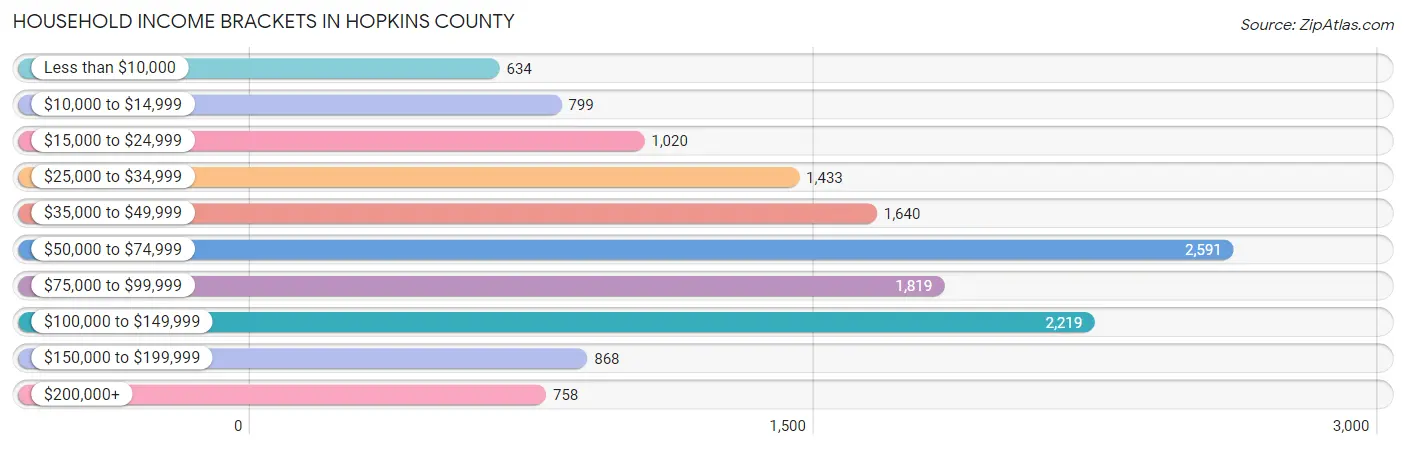
| Income Bracket | # Households | % Households |
| Less than $10,000 | 634 | 4.6% |
| $10,000 to $14,999 | 799 | 5.8% |
| $15,000 to $24,999 | 1,020 | 7.4% |
| $25,000 to $34,999 | 1,433 | 10.4% |
| $35,000 to $49,999 | 1,640 | 11.9% |
| $50,000 to $74,999 | 2,591 | 18.8% |
| $75,000 to $99,999 | 1,819 | 13.2% |
| $100,000 to $149,999 | 2,219 | 16.1% |
| $150,000 to $199,999 | 868 | 6.3% |
| $200,000+ | 758 | 5.5% |
Household Income by Householder Age in Hopkins County
The median household income in Hopkins County is $63,766, with the highest median household income of $73,547 found in the 45 to 64 years age bracket for the primary householder. A total of 4,973 households (36.1%) fall into this category. Meanwhile, the 65+ years age bracket for the primary householder has the lowest median household income of $48,500, with 4,254 households (30.9%) in this group.
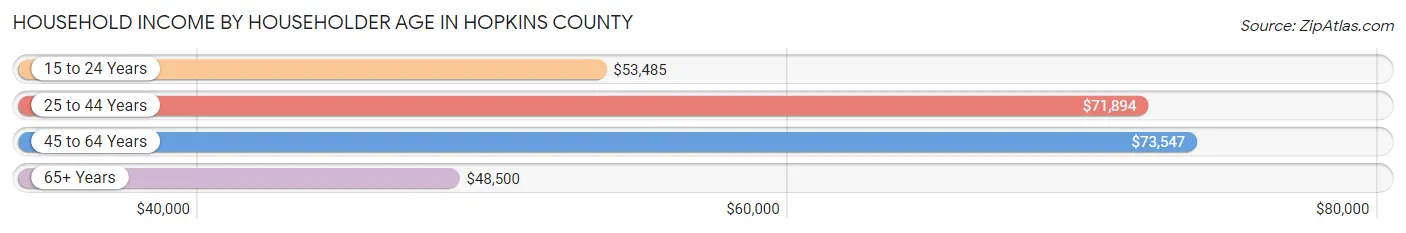
| Income Bracket | # Households | Median Income |
| 15 to 24 Years | 574 (4.2%) | $53,485 |
| 25 to 44 Years | 3,980 (28.9%) | $71,894 |
| 45 to 64 Years | 4,973 (36.1%) | $73,547 |
| 65+ Years | 4,254 (30.9%) | $48,500 |
| Total | 13,781 (100.0%) | $63,766 |
Poverty in Hopkins County
Income Below Poverty by Sex and Age in Hopkins County
With 13.0% poverty level for males and 13.8% for females among the residents of Hopkins County, 6 to 11 year old males and 12 to 14 year old females are the most vulnerable to poverty, with 332 males (21.8%) and 187 females (24.4%) in their respective age groups living below the poverty level.
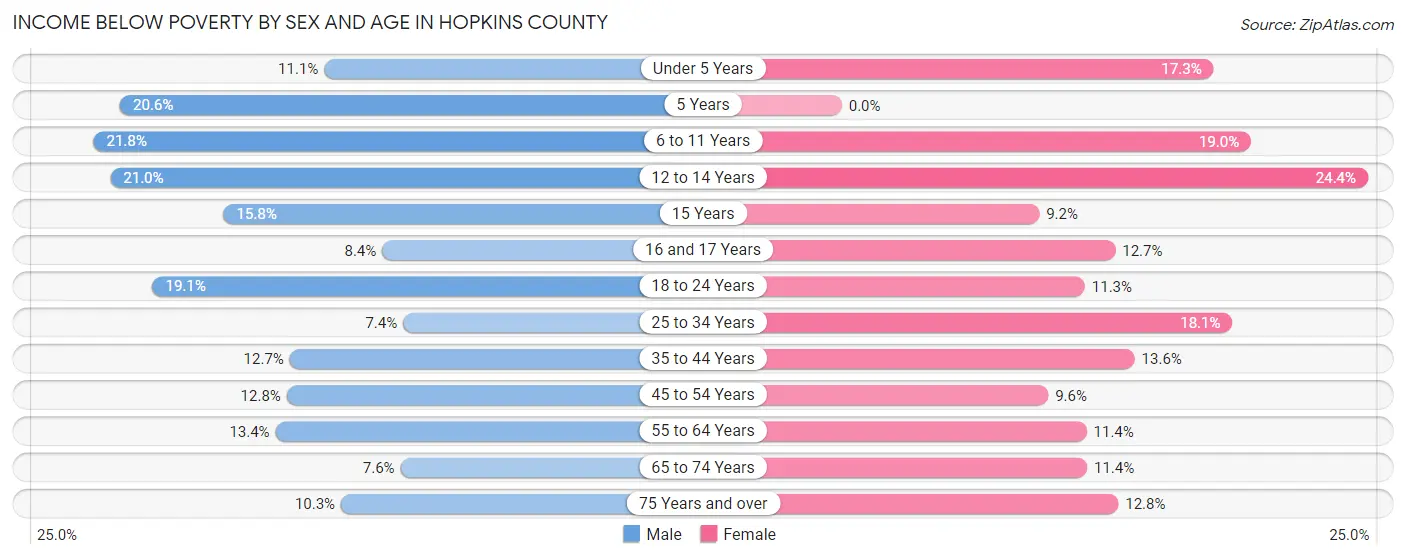
| Age Bracket | Male | Female |
| Under 5 Years | 130 (11.1%) | 186 (17.2%) |
| 5 Years | 58 (20.6%) | 0 (0.0%) |
| 6 to 11 Years | 332 (21.8%) | 291 (19.0%) |
| 12 to 14 Years | 157 (21.0%) | 187 (24.4%) |
| 15 Years | 38 (15.8%) | 34 (9.2%) |
| 16 and 17 Years | 48 (8.4%) | 50 (12.7%) |
| 18 to 24 Years | 293 (19.1%) | 173 (11.3%) |
| 25 to 34 Years | 170 (7.4%) | 399 (18.1%) |
| 35 to 44 Years | 259 (12.7%) | 282 (13.6%) |
| 45 to 54 Years | 295 (12.8%) | 223 (9.6%) |
| 55 to 64 Years | 314 (13.4%) | 275 (11.4%) |
| 65 to 74 Years | 143 (7.6%) | 227 (11.4%) |
| 75 Years and over | 112 (10.3%) | 198 (12.8%) |
| Total | 2,349 (13.0%) | 2,525 (13.8%) |
Income Above Poverty by Sex and Age in Hopkins County
According to the poverty statistics in Hopkins County, males aged 25 to 34 years and females aged 5 years are the age groups that are most secure financially, with 92.6% of males and 100.0% of females in these age groups living above the poverty line.
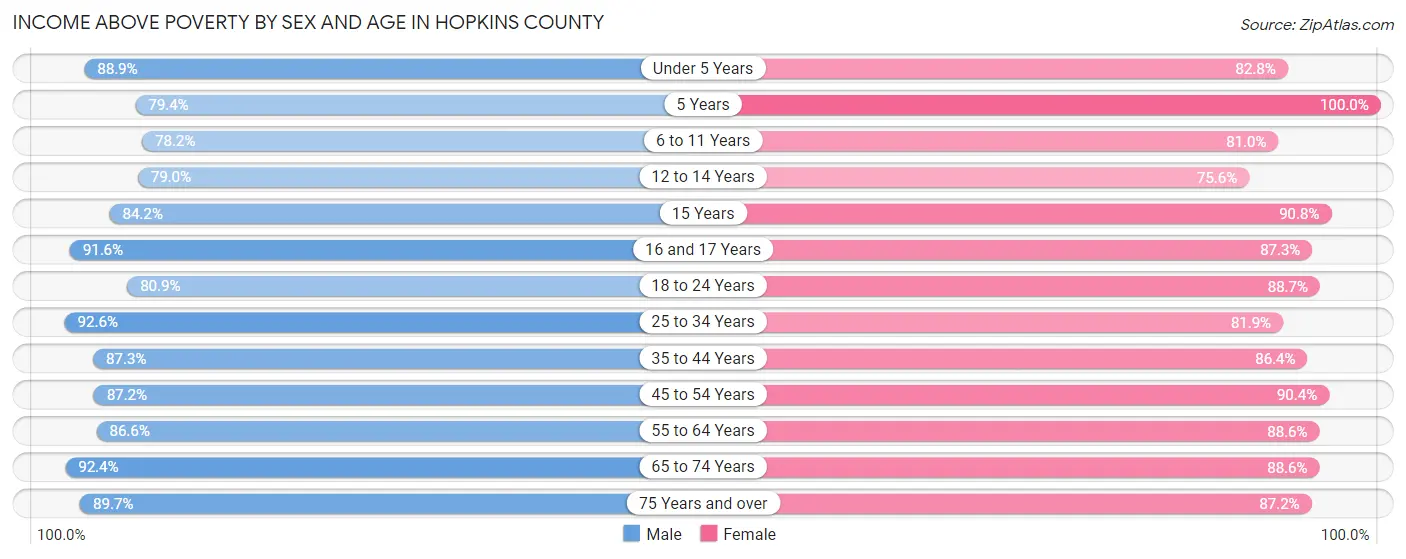
| Age Bracket | Male | Female |
| Under 5 Years | 1,041 (88.9%) | 892 (82.8%) |
| 5 Years | 224 (79.4%) | 115 (100.0%) |
| 6 to 11 Years | 1,191 (78.2%) | 1,241 (81.0%) |
| 12 to 14 Years | 590 (79.0%) | 579 (75.6%) |
| 15 Years | 203 (84.2%) | 337 (90.8%) |
| 16 and 17 Years | 523 (91.6%) | 344 (87.3%) |
| 18 to 24 Years | 1,244 (80.9%) | 1,361 (88.7%) |
| 25 to 34 Years | 2,116 (92.6%) | 1,803 (81.9%) |
| 35 to 44 Years | 1,780 (87.3%) | 1,793 (86.4%) |
| 45 to 54 Years | 2,003 (87.2%) | 2,105 (90.4%) |
| 55 to 64 Years | 2,037 (86.6%) | 2,146 (88.6%) |
| 65 to 74 Years | 1,749 (92.4%) | 1,768 (88.6%) |
| 75 Years and over | 973 (89.7%) | 1,345 (87.2%) |
| Total | 15,674 (87.0%) | 15,829 (86.2%) |
Income Below Poverty Among Married-Couple Families in Hopkins County
The poverty statistics for married-couple families in Hopkins County show that 6.5% or 480 of the total 7,440 families live below the poverty line. Families with 5 or more children have the highest poverty rate of 19.1%, comprising of 17 families. On the other hand, families with no children have the lowest poverty rate of 4.6%, which includes 196 families.
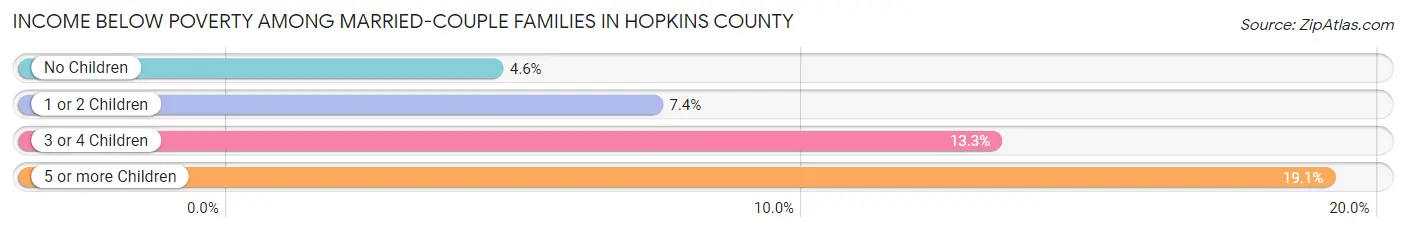
| Children | Above Poverty | Below Poverty |
| No Children | 4,052 (95.4%) | 196 (4.6%) |
| 1 or 2 Children | 2,282 (92.6%) | 182 (7.4%) |
| 3 or 4 Children | 554 (86.7%) | 85 (13.3%) |
| 5 or more Children | 72 (80.9%) | 17 (19.1%) |
| Total | 6,960 (93.5%) | 480 (6.5%) |
Income Below Poverty Among Single-Parent Households in Hopkins County
According to the poverty data in Hopkins County, 13.0% or 108 single-father households and 27.6% or 400 single-mother households are living below the poverty line. Among single-father households, those with 5 or more children have the highest poverty rate, with 5 households (100.0%) experiencing poverty. Likewise, among single-mother households, those with 3 or 4 children have the highest poverty rate, with 86 households (85.2%) falling below the poverty line.
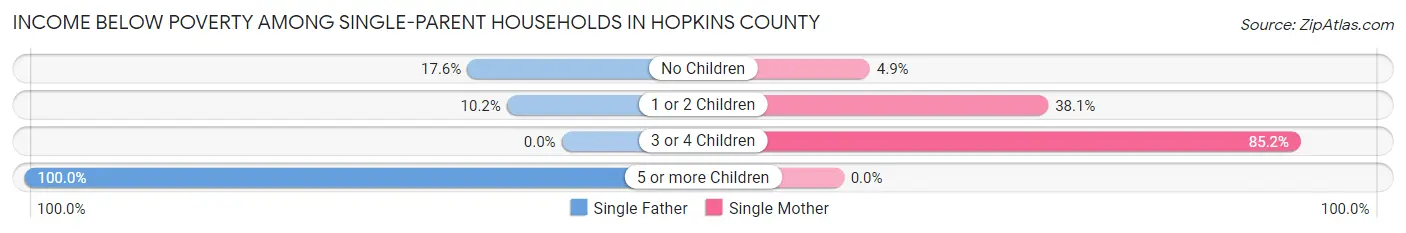
| Children | Single Father | Single Mother |
| No Children | 61 (17.6%) | 29 (4.9%) |
| 1 or 2 Children | 42 (10.2%) | 285 (38.1%) |
| 3 or 4 Children | 0 (0.0%) | 86 (85.2%) |
| 5 or more Children | 5 (100.0%) | 0 (0.0%) |
| Total | 108 (13.0%) | 400 (27.6%) |
Income Below Poverty Among Married-Couple vs Single-Parent Households in Hopkins County
The poverty data for Hopkins County shows that 480 of the married-couple family households (6.5%) and 508 of the single-parent households (22.3%) are living below the poverty level. Within the married-couple family households, those with 5 or more children have the highest poverty rate, with 17 households (19.1%) falling below the poverty line. Among the single-parent households, those with 3 or 4 children have the highest poverty rate, with 86 household (51.2%) living below poverty.
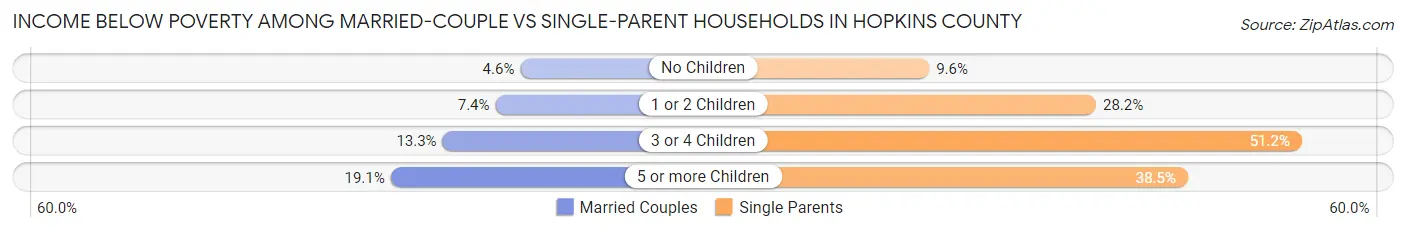
| Children | Married-Couple Families | Single-Parent Households |
| No Children | 196 (4.6%) | 90 (9.6%) |
| 1 or 2 Children | 182 (7.4%) | 327 (28.2%) |
| 3 or 4 Children | 85 (13.3%) | 86 (51.2%) |
| 5 or more Children | 17 (19.1%) | 5 (38.5%) |
| Total | 480 (6.5%) | 508 (22.3%) |
Race in Hopkins County
The most populous races in Hopkins County are White / Caucasian (30,096 | 81.3%), Hispanic or Latino (6,605 | 17.8%), and Black / African American (2,709 | 7.3%).
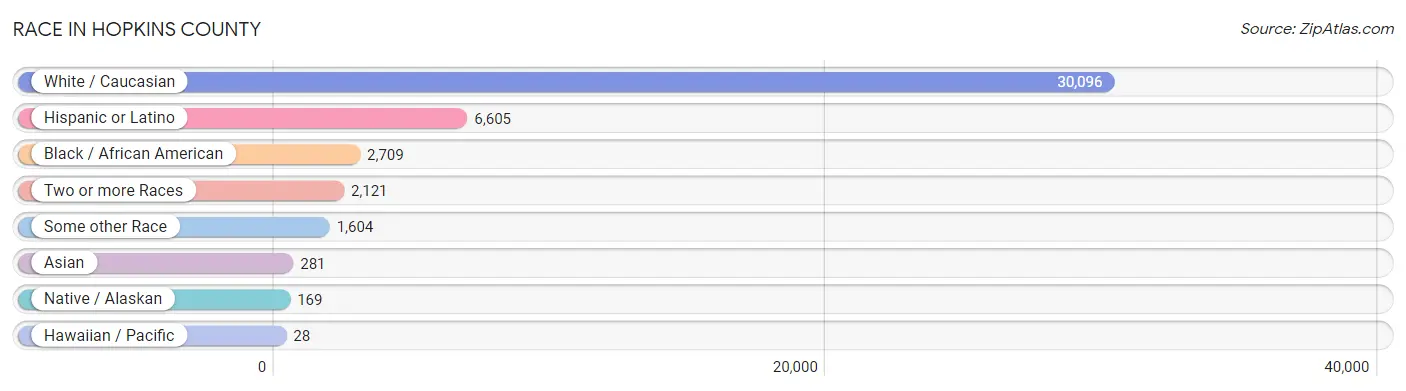
| Race | # Population | % Population |
| Asian | 281 | 0.8% |
| Black / African American | 2,709 | 7.3% |
| Hawaiian / Pacific | 28 | 0.1% |
| Hispanic or Latino | 6,605 | 17.8% |
| Native / Alaskan | 169 | 0.5% |
| White / Caucasian | 30,096 | 81.3% |
| Two or more Races | 2,121 | 5.7% |
| Some other Race | 1,604 | 4.3% |
| Total | 37,008 | 100.0% |
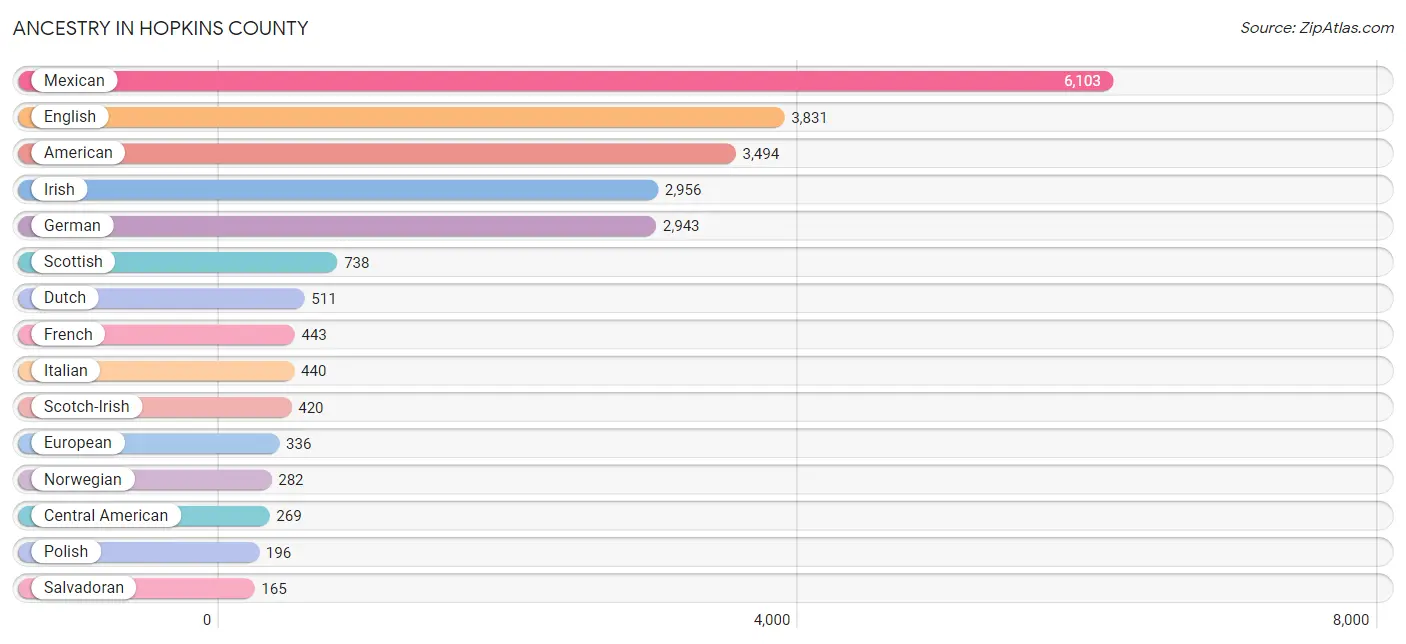
Ancestry in Hopkins County
The most populous ancestries reported in Hopkins County are Mexican (6,103 | 16.5%), English (3,831 | 10.3%), American (3,494 | 9.4%), Irish (2,956 | 8.0%), and German (2,943 | 8.0%), together accounting for 52.2% of all Hopkins County residents.
| Ancestry | # Population | % Population |
| African | 84 | 0.2% |
| American | 3,494 | 9.4% |
| Apache | 4 | 0.0% |
| Arab | 28 | 0.1% |
| Argentinean | 18 | 0.1% |
| Armenian | 18 | 0.1% |
| Austrian | 113 | 0.3% |
| Belgian | 25 | 0.1% |
| Belizean | 54 | 0.2% |
| Blackfeet | 40 | 0.1% |
| Bolivian | 2 | 0.0% |
| British | 120 | 0.3% |
| Burmese | 47 | 0.1% |
| Cajun | 7 | 0.0% |
| Canadian | 21 | 0.1% |
| Central American | 269 | 0.7% |
| Central American Indian | 5 | 0.0% |
| Cherokee | 81 | 0.2% |
| Chickasaw | 5 | 0.0% |
| Choctaw | 57 | 0.2% |
| Comanche | 11 | 0.0% |
| Cree | 5 | 0.0% |
| Crow | 2 | 0.0% |
| Cuban | 66 | 0.2% |
| Czech | 120 | 0.3% |
| Czechoslovakian | 16 | 0.0% |
| Danish | 34 | 0.1% |
| Dominican | 17 | 0.1% |
| Dutch | 511 | 1.4% |
| Dutch West Indian | 33 | 0.1% |
| Eastern European | 33 | 0.1% |
| English | 3,831 | 10.3% |
| European | 336 | 0.9% |
| French | 443 | 1.2% |
| French American Indian | 3 | 0.0% |
| French Canadian | 37 | 0.1% |
| German | 2,943 | 8.0% |
| Greek | 34 | 0.1% |
| Guamanian / Chamorro | 3 | 0.0% |
| Guatemalan | 68 | 0.2% |
| Honduran | 36 | 0.1% |
| Hungarian | 24 | 0.1% |
| Indian (Asian) | 15 | 0.0% |
| Iranian | 2 | 0.0% |
| Irish | 2,956 | 8.0% |
| Italian | 440 | 1.2% |
| Jamaican | 18 | 0.1% |
| Jordanian | 3 | 0.0% |
| Korean | 60 | 0.2% |
| Lebanese | 20 | 0.1% |
| Maltese | 10 | 0.0% |
| Mexican | 6,103 | 16.5% |
| Mexican American Indian | 25 | 0.1% |
| Moroccan | 5 | 0.0% |
| Native Hawaiian | 14 | 0.0% |
| Navajo | 55 | 0.2% |
| Nigerian | 5 | 0.0% |
| Northern European | 40 | 0.1% |
| Norwegian | 282 | 0.8% |
| Osage | 1 | 0.0% |
| Peruvian | 27 | 0.1% |
| Polish | 196 | 0.5% |
| Portuguese | 62 | 0.2% |
| Potawatomi | 11 | 0.0% |
| Puerto Rican | 17 | 0.1% |
| Romanian | 4 | 0.0% |
| Russian | 44 | 0.1% |
| Salvadoran | 165 | 0.4% |
| Samoan | 13 | 0.0% |
| Scandinavian | 62 | 0.2% |
| Scotch-Irish | 420 | 1.1% |
| Scottish | 738 | 2.0% |
| Serbian | 10 | 0.0% |
| Sioux | 4 | 0.0% |
| Slovak | 19 | 0.1% |
| South American | 47 | 0.1% |
| Spaniard | 64 | 0.2% |
| Spanish | 7 | 0.0% |
| Sri Lankan | 160 | 0.4% |
| Subsaharan African | 89 | 0.2% |
| Swedish | 114 | 0.3% |
| Swiss | 40 | 0.1% |
| Thai | 43 | 0.1% |
| Ukrainian | 18 | 0.1% |
| Vietnamese | 4 | 0.0% |
| Welsh | 123 | 0.3% |
| Yup'ik | 5 | 0.0% | View All 87 Rows |
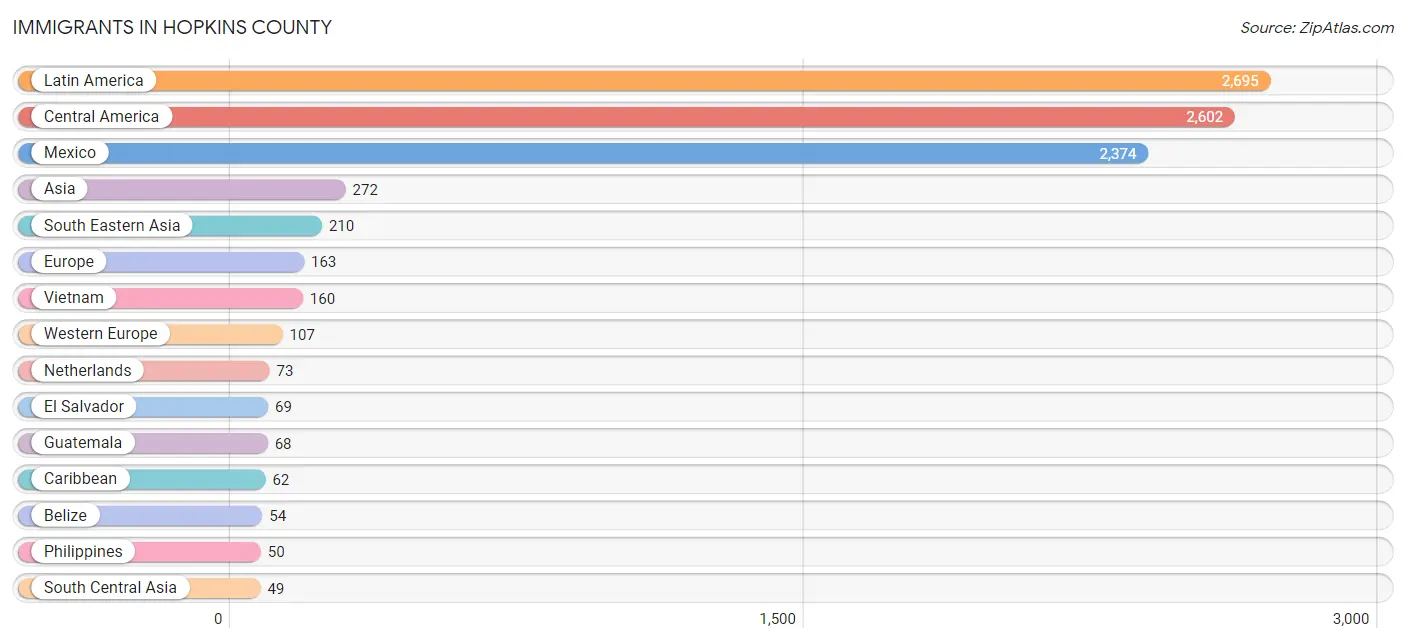
Immigrants in Hopkins County
The most numerous immigrant groups reported in Hopkins County came from Latin America (2,695 | 7.3%), Central America (2,602 | 7.0%), Mexico (2,374 | 6.4%), Asia (272 | 0.7%), and South Eastern Asia (210 | 0.6%), together accounting for 22.0% of all Hopkins County residents.
| Immigration Origin | # Population | % Population |
| Africa | 34 | 0.1% |
| Asia | 272 | 0.7% |
| Belgium | 2 | 0.0% |
| Belize | 54 | 0.2% |
| Bolivia | 7 | 0.0% |
| Canada | 32 | 0.1% |
| Caribbean | 62 | 0.2% |
| Central America | 2,602 | 7.0% |
| China | 6 | 0.0% |
| Cuba | 44 | 0.1% |
| Eastern Africa | 8 | 0.0% |
| Eastern Asia | 10 | 0.0% |
| El Salvador | 69 | 0.2% |
| England | 23 | 0.1% |
| Europe | 163 | 0.4% |
| France | 13 | 0.0% |
| Germany | 19 | 0.1% |
| Guatemala | 68 | 0.2% |
| Honduras | 37 | 0.1% |
| India | 27 | 0.1% |
| Italy | 12 | 0.0% |
| Jamaica | 18 | 0.1% |
| Jordan | 3 | 0.0% |
| Kenya | 8 | 0.0% |
| Korea | 4 | 0.0% |
| Latin America | 2,695 | 7.3% |
| Mexico | 2,374 | 6.4% |
| Netherlands | 73 | 0.2% |
| Northern Europe | 23 | 0.1% |
| Pakistan | 22 | 0.1% |
| Peru | 24 | 0.1% |
| Philippines | 50 | 0.1% |
| South Africa | 26 | 0.1% |
| South America | 31 | 0.1% |
| South Central Asia | 49 | 0.1% |
| South Eastern Asia | 210 | 0.6% |
| Southern Europe | 33 | 0.1% |
| Vietnam | 160 | 0.4% |
| Western Asia | 3 | 0.0% |
| Western Europe | 107 | 0.3% | View All 40 Rows |
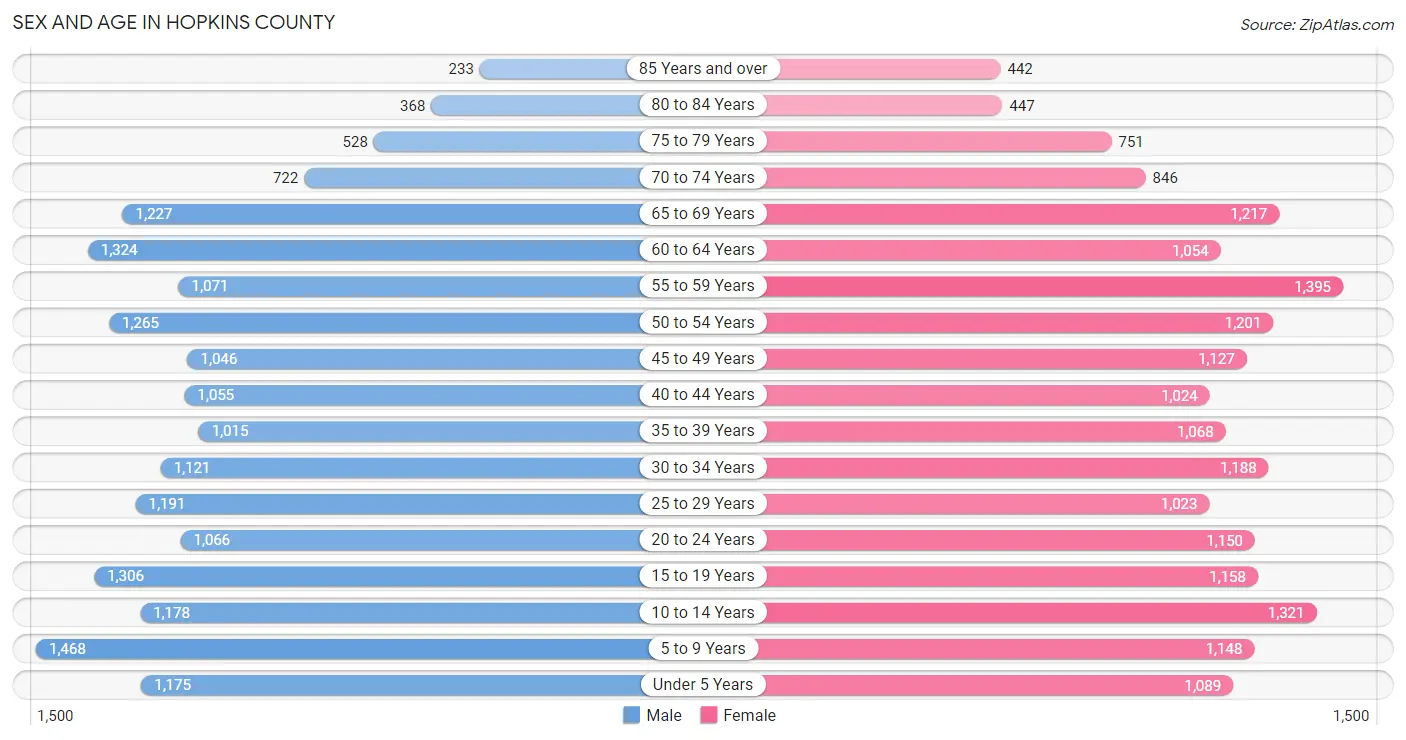
Sex and Age in Hopkins County
Sex and Age in Hopkins County
The most populous age groups in Hopkins County are 5 to 9 Years (1,468 | 8.0%) for men and 55 to 59 Years (1,395 | 7.5%) for women.
| Age Bracket | Male | Female |
| Under 5 Years | 1,175 (6.4%) | 1,089 (5.8%) |
| 5 to 9 Years | 1,468 (8.0%) | 1,148 (6.2%) |
| 10 to 14 Years | 1,178 (6.4%) | 1,321 (7.1%) |
| 15 to 19 Years | 1,306 (7.1%) | 1,158 (6.2%) |
| 20 to 24 Years | 1,066 (5.8%) | 1,150 (6.2%) |
| 25 to 29 Years | 1,191 (6.5%) | 1,023 (5.5%) |
| 30 to 34 Years | 1,121 (6.1%) | 1,188 (6.4%) |
| 35 to 39 Years | 1,015 (5.5%) | 1,068 (5.7%) |
| 40 to 44 Years | 1,055 (5.8%) | 1,024 (5.5%) |
| 45 to 49 Years | 1,046 (5.7%) | 1,127 (6.0%) |
| 50 to 54 Years | 1,265 (6.9%) | 1,201 (6.4%) |
| 55 to 59 Years | 1,071 (5.8%) | 1,395 (7.5%) |
| 60 to 64 Years | 1,324 (7.2%) | 1,054 (5.7%) |
| 65 to 69 Years | 1,227 (6.7%) | 1,217 (6.5%) |
| 70 to 74 Years | 722 (3.9%) | 846 (4.5%) |
| 75 to 79 Years | 528 (2.9%) | 751 (4.0%) |
| 80 to 84 Years | 368 (2.0%) | 447 (2.4%) |
| 85 Years and over | 233 (1.3%) | 442 (2.4%) |
| Total | 18,359 (100.0%) | 18,649 (100.0%) |
Families and Households in Hopkins County
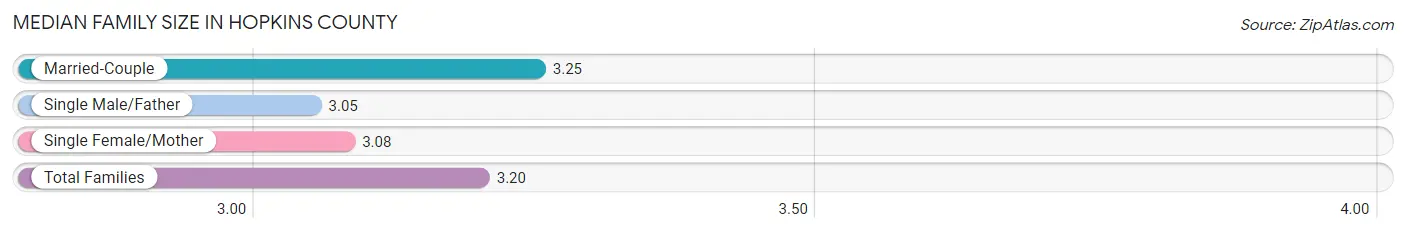
Median Family Size in Hopkins County
The median family size in Hopkins County is 3.20 persons per family, with married-couple families (7,440 | 76.5%) accounting for the largest median family size of 3.25 persons per family. On the other hand, single male/father families (830 | 8.5%) represent the smallest median family size with 3.05 persons per family.
| Family Type | # Families | Family Size |
| Married-Couple | 7,440 (76.5%) | 3.25 |
| Single Male/Father | 830 (8.5%) | 3.05 |
| Single Female/Mother | 1,451 (14.9%) | 3.08 |
| Total Families | 9,721 (100.0%) | 3.20 |
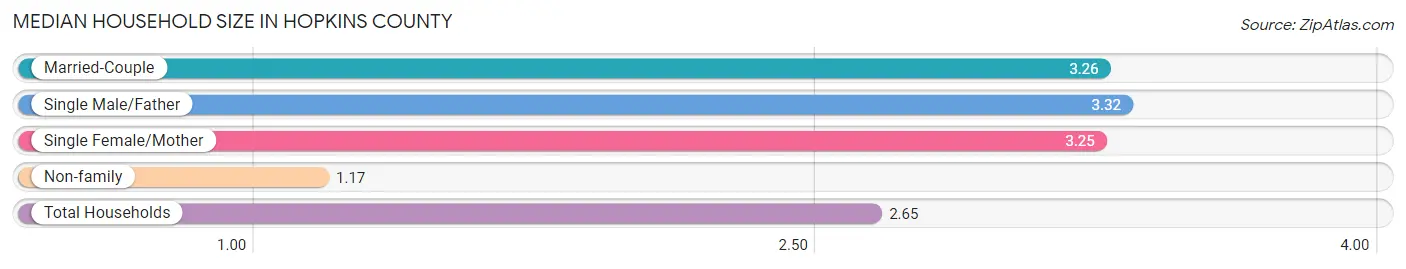
Median Household Size in Hopkins County
The median household size in Hopkins County is 2.65 persons per household, with single male/father households (830 | 6.0%) accounting for the largest median household size of 3.32 persons per household. non-family households (4,060 | 29.5%) represent the smallest median household size with 1.17 persons per household.
| Household Type | # Households | Household Size |
| Married-Couple | 7,440 (54.0%) | 3.26 |
| Single Male/Father | 830 (6.0%) | 3.32 |
| Single Female/Mother | 1,451 (10.5%) | 3.25 |
| Non-family | 4,060 (29.5%) | 1.17 |
| Total Households | 13,781 (100.0%) | 2.65 |
Household Size by Marriage Status in Hopkins County
Out of a total of 13,781 households in Hopkins County, 9,721 (70.5%) are family households, while 4,060 (29.5%) are nonfamily households. The most numerous type of family households are 2-person households, comprising 4,340, and the most common type of nonfamily households are 1-person households, comprising 3,680.
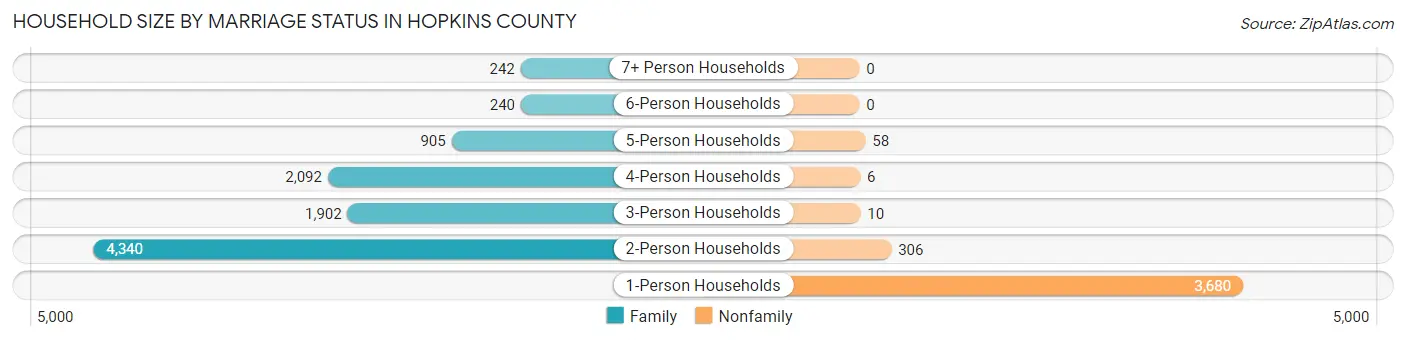
| Household Size | Family Households | Nonfamily Households |
| 1-Person Households | - | 3,680 (26.7%) |
| 2-Person Households | 4,340 (31.5%) | 306 (2.2%) |
| 3-Person Households | 1,902 (13.8%) | 10 (0.1%) |
| 4-Person Households | 2,092 (15.2%) | 6 (0.0%) |
| 5-Person Households | 905 (6.6%) | 58 (0.4%) |
| 6-Person Households | 240 (1.7%) | 0 (0.0%) |
| 7+ Person Households | 242 (1.8%) | 0 (0.0%) |
| Total | 9,721 (70.5%) | 4,060 (29.5%) |
Female Fertility in Hopkins County
Fertility by Age in Hopkins County
Average fertility rate in Hopkins County is 57.0 births per 1,000 women. Women in the age bracket of 20 to 34 years have the highest fertility rate with 96.0 births per 1,000 women. Women in the age bracket of 20 to 34 years acount for 71.6% of all women with births.
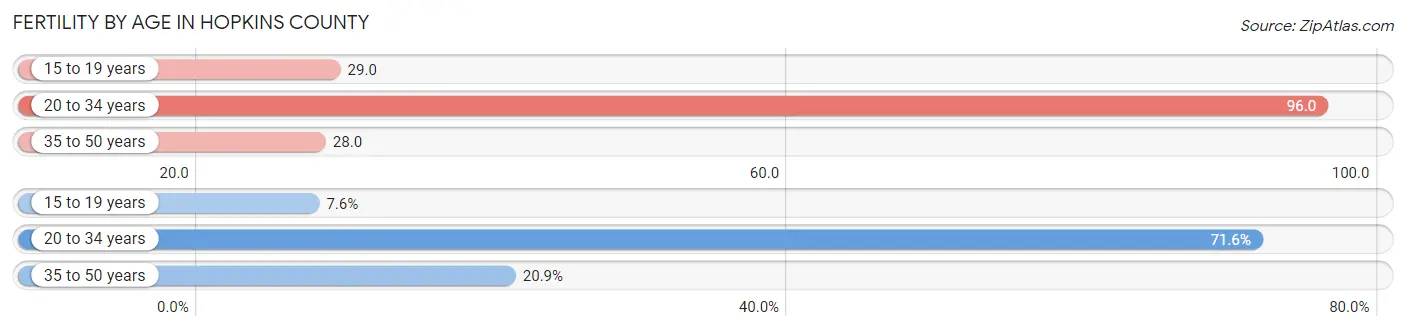
| Age Bracket | Women with Births | Births / 1,000 Women |
| 15 to 19 years | 34 (7.6%) | 29.0 |
| 20 to 34 years | 322 (71.6%) | 96.0 |
| 35 to 50 years | 94 (20.9%) | 28.0 |
| Total | 450 (100.0%) | 57.0 |
Fertility by Age by Marriage Status in Hopkins County
83.1% of women with births (450) in Hopkins County are married. The highest percentage of unmarried women with births falls into 15 to 19 years age bracket with 100.0% of them unmarried at the time of birth, while the lowest percentage of unmarried women with births belong to 20 to 34 years age bracket with 8.7% of them unmarried.
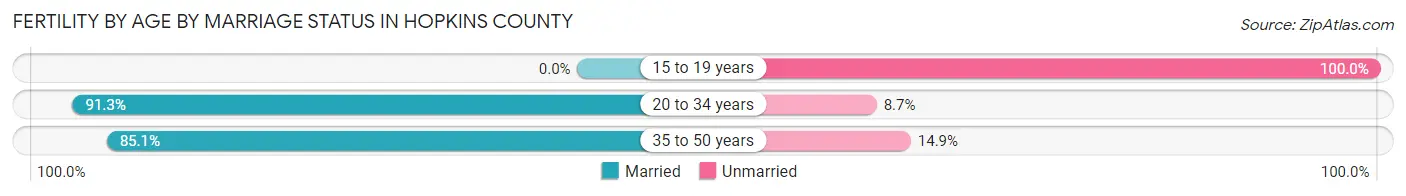
| Age Bracket | Married | Unmarried |
| 15 to 19 years | 0 (0.0%) | 34 (100.0%) |
| 20 to 34 years | 294 (91.3%) | 28 (8.7%) |
| 35 to 50 years | 80 (85.1%) | 14 (14.9%) |
| Total | 374 (83.1%) | 76 (16.9%) |
Fertility by Education in Hopkins County
Average fertility rate in Hopkins County is 57.0 births per 1,000 women. Women with the education attainment of bachelor's degree have the highest fertility rate of 86.0 births per 1,000 women, while women with the education attainment of less than high school have the lowest fertility at 36.0 births per 1,000 women. Women with the education attainment of bachelor's degree represent 28.9% of all women with births.
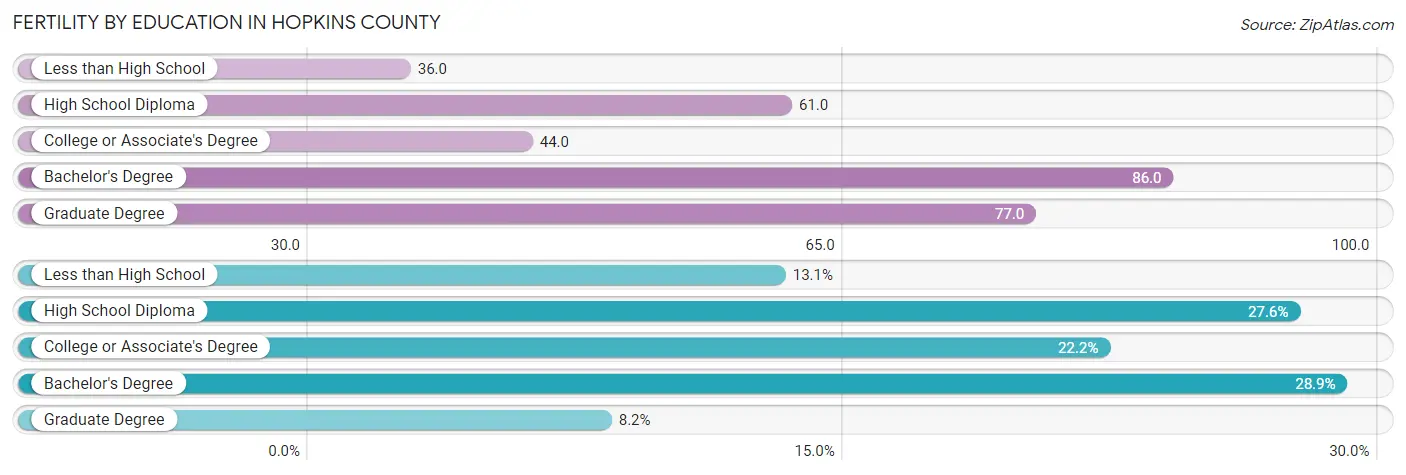
| Educational Attainment | Women with Births | Births / 1,000 Women |
| Less than High School | 59 (13.1%) | 36.0 |
| High School Diploma | 124 (27.6%) | 61.0 |
| College or Associate's Degree | 100 (22.2%) | 44.0 |
| Bachelor's Degree | 130 (28.9%) | 86.0 |
| Graduate Degree | 37 (8.2%) | 77.0 |
| Total | 450 (100.0%) | 57.0 |
Fertility by Education by Marriage Status in Hopkins County
16.9% of women with births in Hopkins County are unmarried. Women with the educational attainment of bachelor's degree are most likely to be married with 100.0% of them married at childbirth, while women with the educational attainment of less than high school are least likely to be married with 44.1% of them unmarried at childbirth.
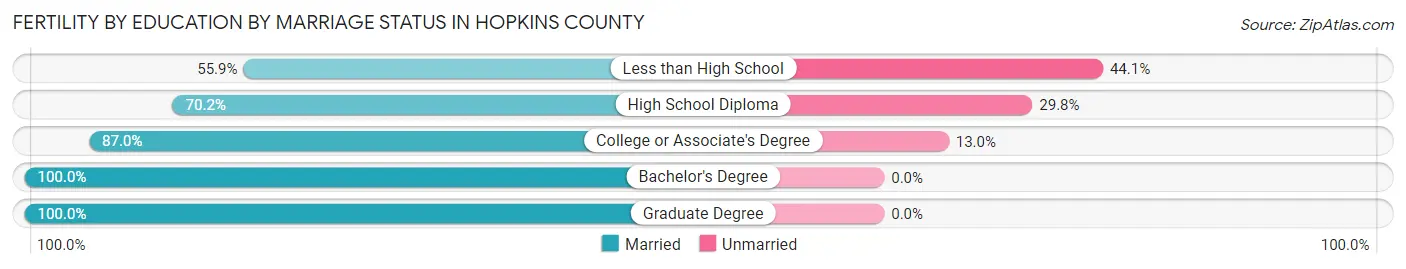
| Educational Attainment | Married | Unmarried |
| Less than High School | 33 (55.9%) | 26 (44.1%) |
| High School Diploma | 87 (70.2%) | 37 (29.8%) |
| College or Associate's Degree | 87 (87.0%) | 13 (13.0%) |
| Bachelor's Degree | 130 (100.0%) | 0 (0.0%) |
| Graduate Degree | 37 (100.0%) | 0 (0.0%) |
| Total | 374 (83.1%) | 76 (16.9%) |
Employment Characteristics in Hopkins County
Employment by Class of Employer in Hopkins County
Among the 16,779 employed individuals in Hopkins County, private company employees (11,305 | 67.4%), self-employed (not incorporated) (1,574 | 9.4%), and local government employees (1,475 | 8.8%) make up the most common classes of employment.
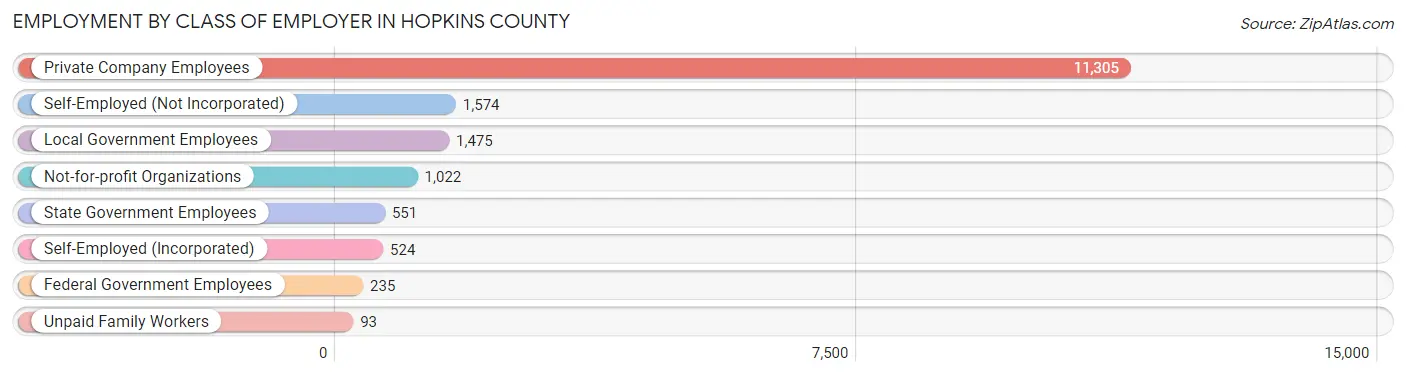
| Employer Class | # Employees | % Employees |
| Private Company Employees | 11,305 | 67.4% |
| Self-Employed (Incorporated) | 524 | 3.1% |
| Self-Employed (Not Incorporated) | 1,574 | 9.4% |
| Not-for-profit Organizations | 1,022 | 6.1% |
| Local Government Employees | 1,475 | 8.8% |
| State Government Employees | 551 | 3.3% |
| Federal Government Employees | 235 | 1.4% |
| Unpaid Family Workers | 93 | 0.5% |
| Total | 16,779 | 100.0% |
Employment Status by Age in Hopkins County
According to the labor force statistics for Hopkins County, out of the total population over 16 years of age (29,014), 62.0% or 17,989 individuals are in the labor force, with 4.8% or 863 of them unemployed. The age group with the highest labor force participation rate is 25 to 29 years, with 86.2% or 1,908 individuals in the labor force. Within the labor force, the 20 to 24 years age range has the highest percentage of unemployed individuals, with 9.0% or 160 of them being unemployed.
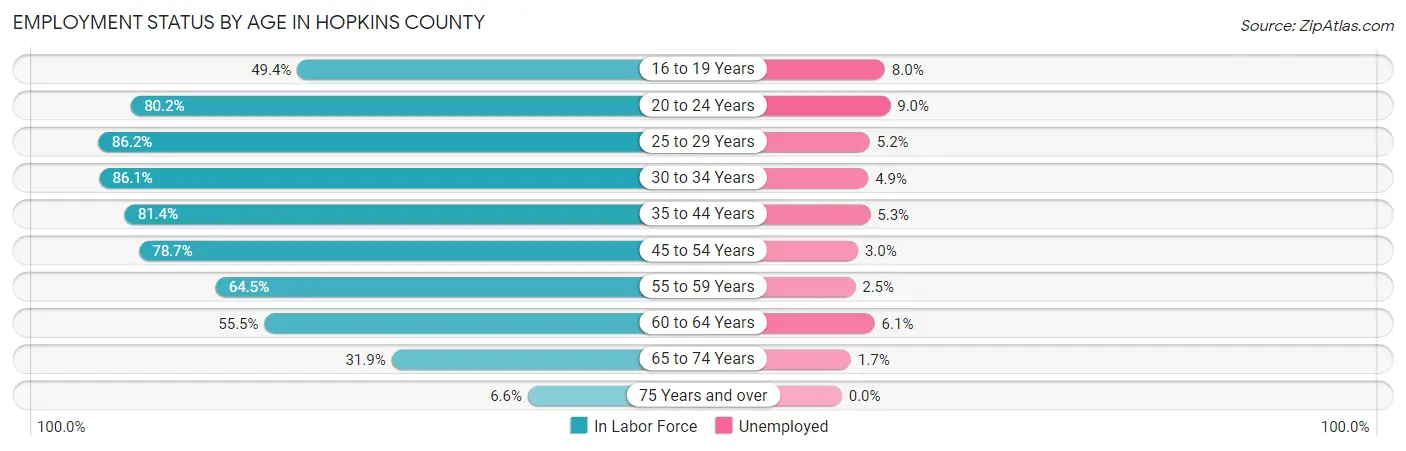
| Age Bracket | In Labor Force | Unemployed |
| 16 to 19 Years | 913 (49.4%) | 73 (8.0%) |
| 20 to 24 Years | 1,777 (80.2%) | 160 (9.0%) |
| 25 to 29 Years | 1,908 (86.2%) | 99 (5.2%) |
| 30 to 34 Years | 1,988 (86.1%) | 97 (4.9%) |
| 35 to 44 Years | 3,388 (81.4%) | 180 (5.3%) |
| 45 to 54 Years | 3,651 (78.7%) | 110 (3.0%) |
| 55 to 59 Years | 1,591 (64.5%) | 40 (2.5%) |
| 60 to 64 Years | 1,320 (55.5%) | 81 (6.1%) |
| 65 to 74 Years | 1,280 (31.9%) | 22 (1.7%) |
| 75 Years and over | 183 (6.6%) | 0 (0.0%) |
| Total | 17,989 (62.0%) | 863 (4.8%) |
Employment Status by Educational Attainment in Hopkins County
According to labor force statistics for Hopkins County, 76.2% of individuals (13,844) out of the total population between 25 and 64 years of age (18,168) are in the labor force, with 4.4% or 609 of them being unemployed. The group with the highest labor force participation rate are those with the educational attainment of bachelor's degree or higher, with 89.6% or 3,674 individuals in the labor force. Within the labor force, individuals with college / associate degree education have the highest percentage of unemployment, with 5.4% or 218 of them being unemployed.
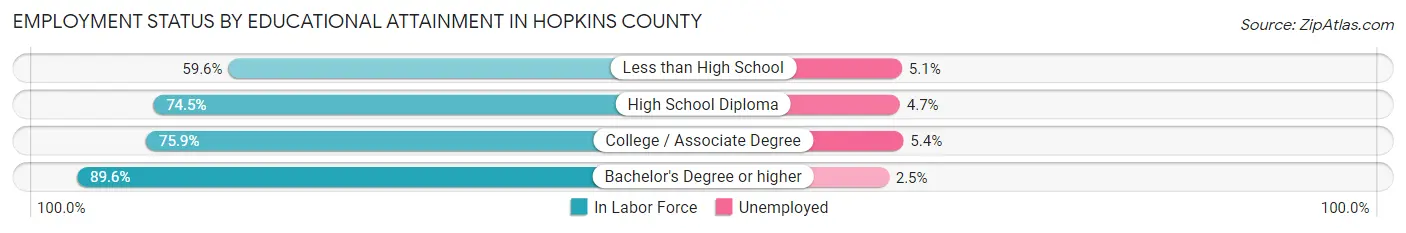
| Educational Attainment | In Labor Force | Unemployed |
| Less than High School | 1,541 (59.6%) | 132 (5.1%) |
| High School Diploma | 4,592 (74.5%) | 290 (4.7%) |
| College / Associate Degree | 4,036 (75.9%) | 287 (5.4%) |
| Bachelor's Degree or higher | 3,674 (89.6%) | 103 (2.5%) |
| Total | 13,844 (76.2%) | 799 (4.4%) |
Employment Occupations by Sex in Hopkins County
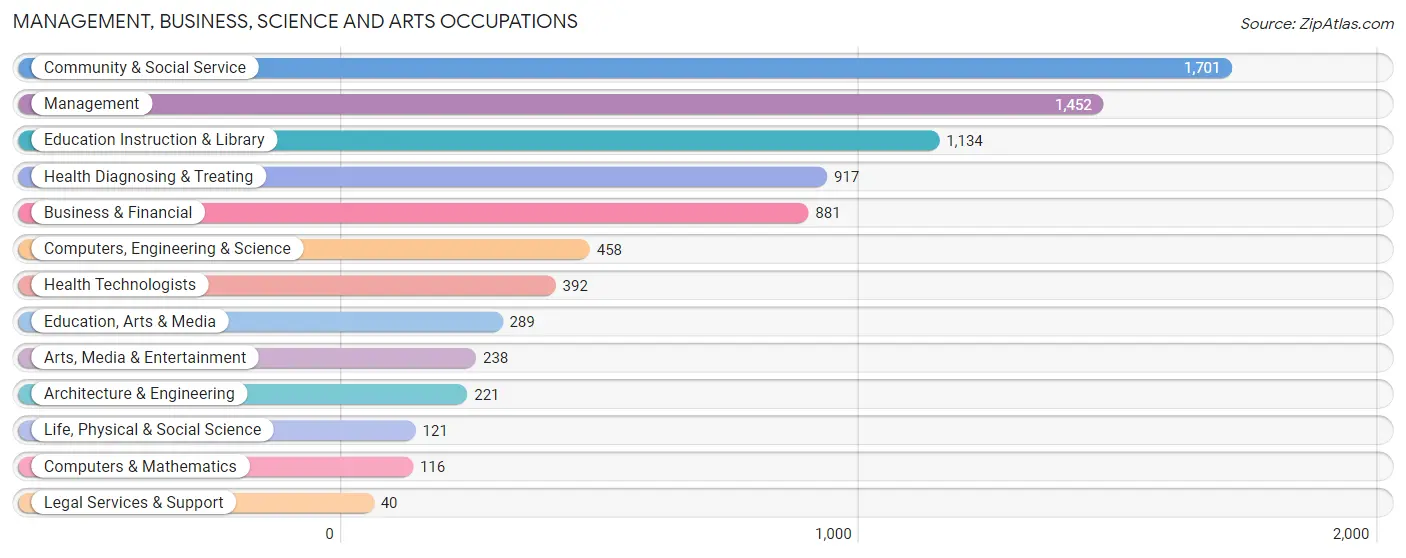
Management, Business, Science and Arts Occupations
The most common Management, Business, Science and Arts occupations in Hopkins County are Community & Social Service (1,701 | 10.0%), Management (1,452 | 8.5%), Education Instruction & Library (1,134 | 6.6%), Health Diagnosing & Treating (917 | 5.4%), and Business & Financial (881 | 5.2%).
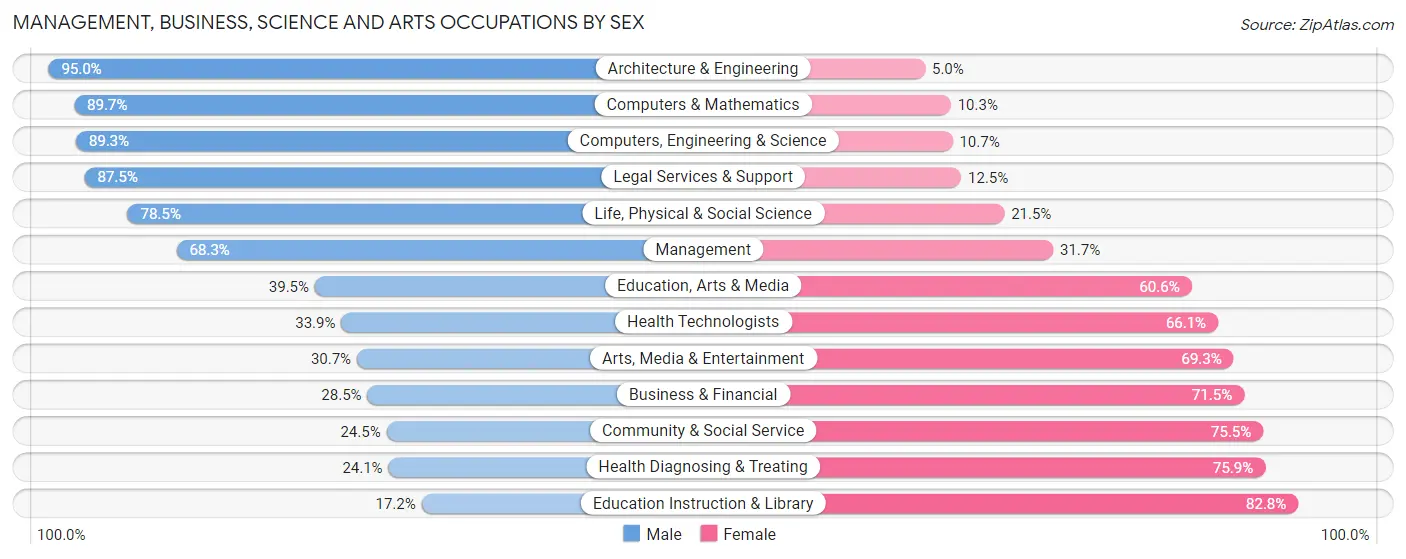
Management, Business, Science and Arts Occupations by Sex
Within the Management, Business, Science and Arts occupations in Hopkins County, the most male-oriented occupations are Architecture & Engineering (95.0%), Computers & Mathematics (89.7%), and Computers, Engineering & Science (89.3%), while the most female-oriented occupations are Education Instruction & Library (82.8%), Health Diagnosing & Treating (75.9%), and Community & Social Service (75.5%).
| Occupation | Male | Female |
| Management | 992 (68.3%) | 460 (31.7%) |
| Business & Financial | 251 (28.5%) | 630 (71.5%) |
| Computers, Engineering & Science | 409 (89.3%) | 49 (10.7%) |
| Computers & Mathematics | 104 (89.7%) | 12 (10.3%) |
| Architecture & Engineering | 210 (95.0%) | 11 (5.0%) |
| Life, Physical & Social Science | 95 (78.5%) | 26 (21.5%) |
| Community & Social Service | 417 (24.5%) | 1,284 (75.5%) |
| Education, Arts & Media | 114 (39.5%) | 175 (60.6%) |
| Legal Services & Support | 35 (87.5%) | 5 (12.5%) |
| Education Instruction & Library | 195 (17.2%) | 939 (82.8%) |
| Arts, Media & Entertainment | 73 (30.7%) | 165 (69.3%) |
| Health Diagnosing & Treating | 221 (24.1%) | 696 (75.9%) |
| Health Technologists | 133 (33.9%) | 259 (66.1%) |
| Total (Category) | 2,290 (42.3%) | 3,119 (57.7%) |
| Total (Overall) | 9,317 (54.6%) | 7,752 (45.4%) |
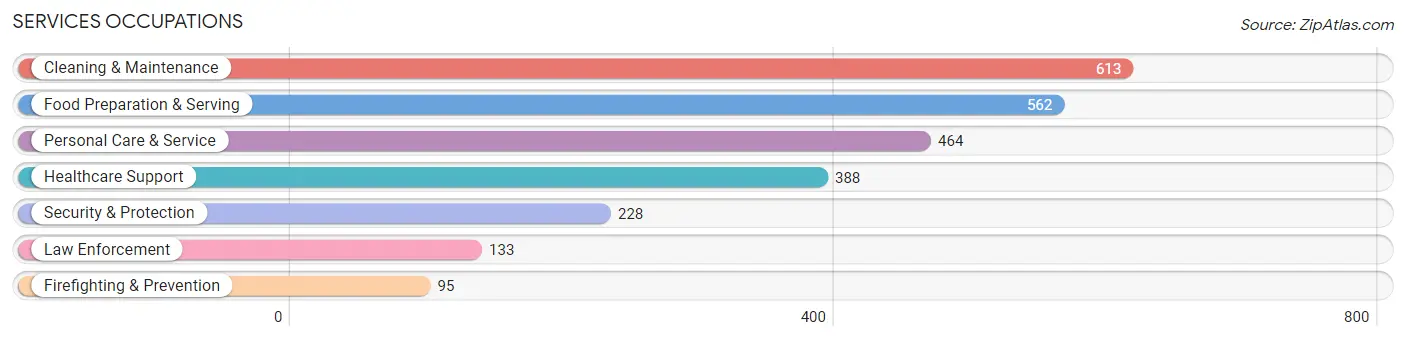
Services Occupations
The most common Services occupations in Hopkins County are Cleaning & Maintenance (613 | 3.6%), Food Preparation & Serving (562 | 3.3%), Personal Care & Service (464 | 2.7%), Healthcare Support (388 | 2.3%), and Security & Protection (228 | 1.3%).
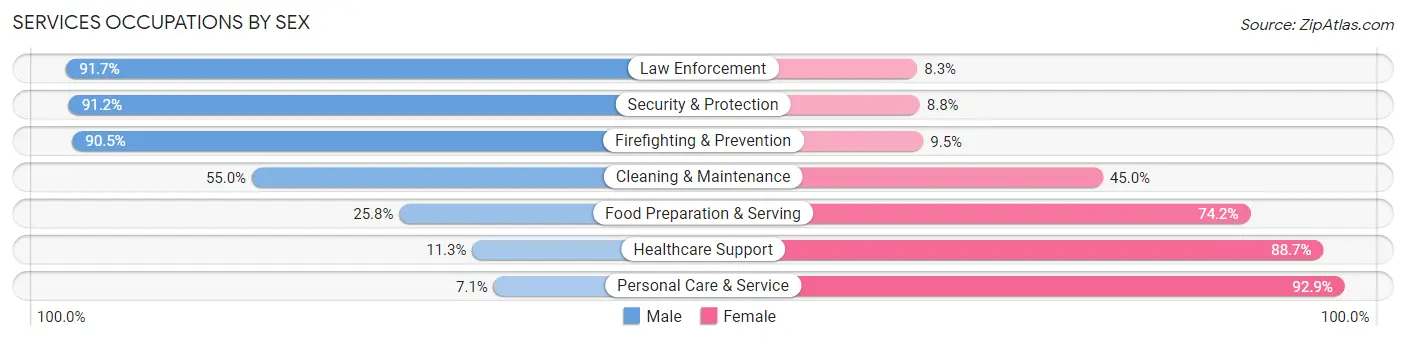
Services Occupations by Sex
Within the Services occupations in Hopkins County, the most male-oriented occupations are Law Enforcement (91.7%), Security & Protection (91.2%), and Firefighting & Prevention (90.5%), while the most female-oriented occupations are Personal Care & Service (92.9%), Healthcare Support (88.7%), and Food Preparation & Serving (74.2%).
| Occupation | Male | Female |
| Healthcare Support | 44 (11.3%) | 344 (88.7%) |
| Security & Protection | 208 (91.2%) | 20 (8.8%) |
| Firefighting & Prevention | 86 (90.5%) | 9 (9.5%) |
| Law Enforcement | 122 (91.7%) | 11 (8.3%) |
| Food Preparation & Serving | 145 (25.8%) | 417 (74.2%) |
| Cleaning & Maintenance | 337 (55.0%) | 276 (45.0%) |
| Personal Care & Service | 33 (7.1%) | 431 (92.9%) |
| Total (Category) | 767 (34.0%) | 1,488 (66.0%) |
| Total (Overall) | 9,317 (54.6%) | 7,752 (45.4%) |
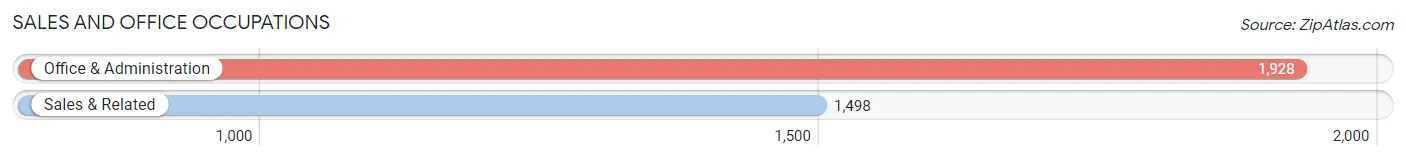
Sales and Office Occupations
The most common Sales and Office occupations in Hopkins County are Office & Administration (1,928 | 11.3%), and Sales & Related (1,498 | 8.8%).
Sales and Office Occupations by Sex
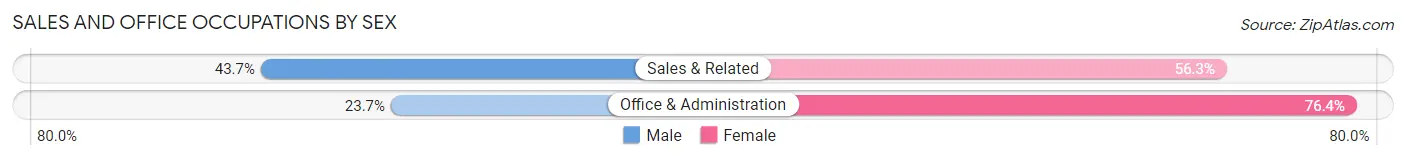
| Occupation | Male | Female |
| Sales & Related | 654 (43.7%) | 844 (56.3%) |
| Office & Administration | 456 (23.6%) | 1,472 (76.3%) |
| Total (Category) | 1,110 (32.4%) | 2,316 (67.6%) |
| Total (Overall) | 9,317 (54.6%) | 7,752 (45.4%) |
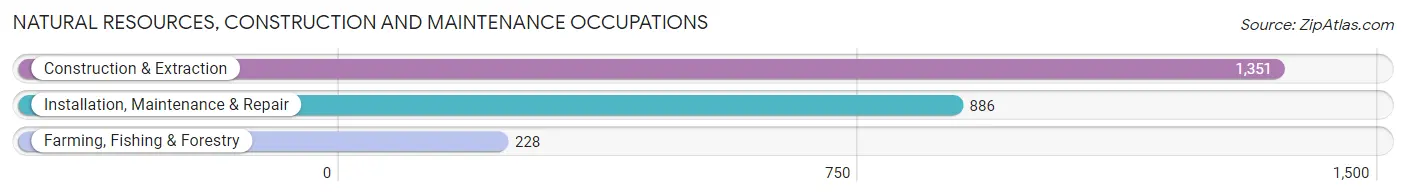
Natural Resources, Construction and Maintenance Occupations
The most common Natural Resources, Construction and Maintenance occupations in Hopkins County are Construction & Extraction (1,351 | 7.9%), Installation, Maintenance & Repair (886 | 5.2%), and Farming, Fishing & Forestry (228 | 1.3%).
Natural Resources, Construction and Maintenance Occupations by Sex
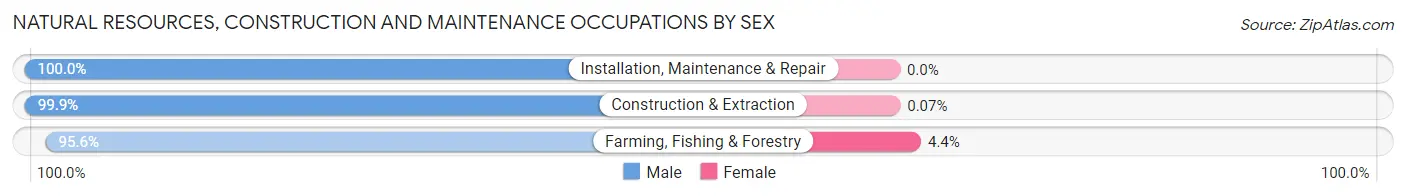
| Occupation | Male | Female |
| Farming, Fishing & Forestry | 218 (95.6%) | 10 (4.4%) |
| Construction & Extraction | 1,350 (99.9%) | 1 (0.1%) |
| Installation, Maintenance & Repair | 886 (100.0%) | 0 (0.0%) |
| Total (Category) | 2,454 (99.6%) | 11 (0.4%) |
| Total (Overall) | 9,317 (54.6%) | 7,752 (45.4%) |
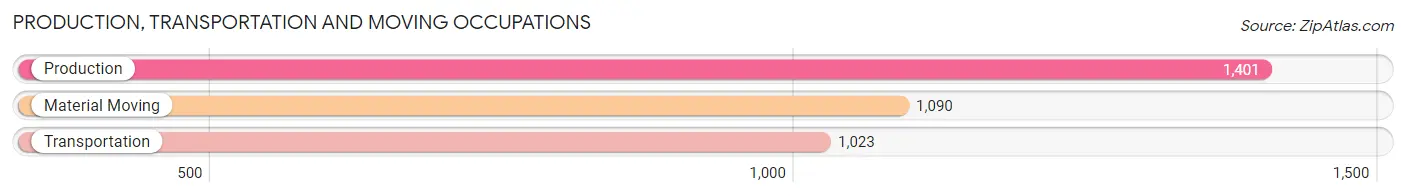
Production, Transportation and Moving Occupations
The most common Production, Transportation and Moving occupations in Hopkins County are Production (1,401 | 8.2%), Material Moving (1,090 | 6.4%), and Transportation (1,023 | 6.0%).
Production, Transportation and Moving Occupations by Sex
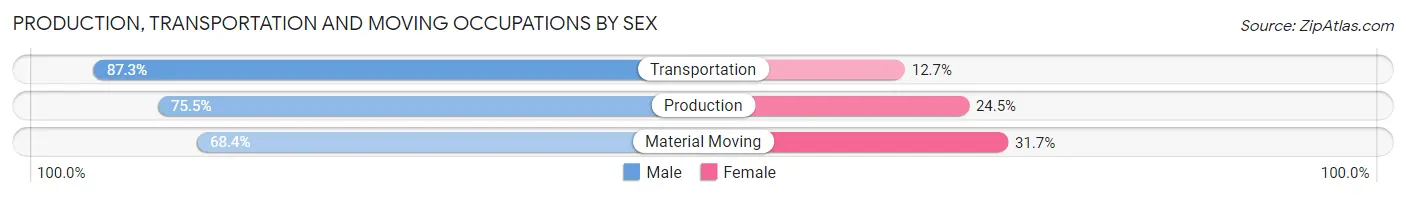
| Occupation | Male | Female |
| Production | 1,058 (75.5%) | 343 (24.5%) |
| Transportation | 893 (87.3%) | 130 (12.7%) |
| Material Moving | 745 (68.3%) | 345 (31.7%) |
| Total (Category) | 2,696 (76.7%) | 818 (23.3%) |
| Total (Overall) | 9,317 (54.6%) | 7,752 (45.4%) |
Employment Industries by Sex in Hopkins County
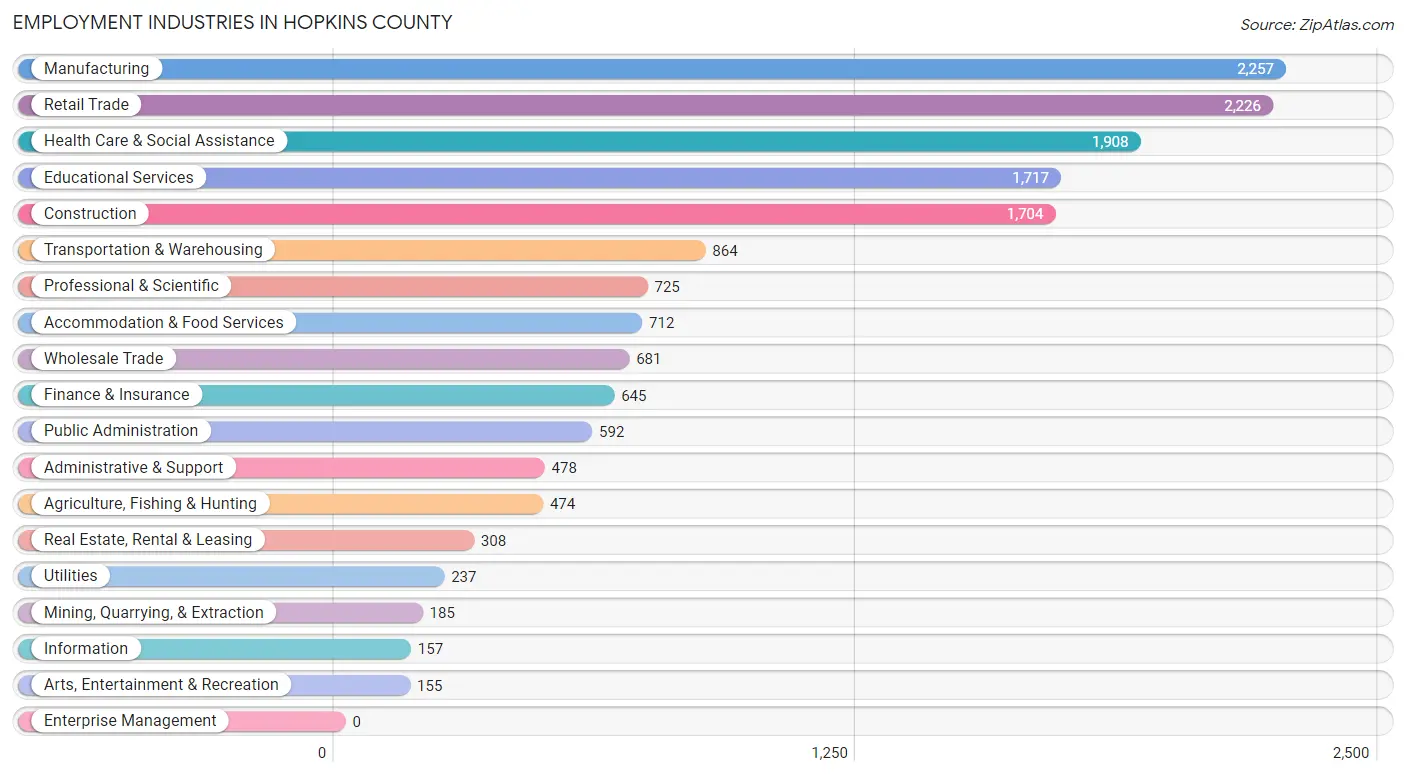
Employment Industries in Hopkins County
The major employment industries in Hopkins County include Manufacturing (2,257 | 13.2%), Retail Trade (2,226 | 13.0%), Health Care & Social Assistance (1,908 | 11.2%), Educational Services (1,717 | 10.1%), and Construction (1,704 | 10.0%).
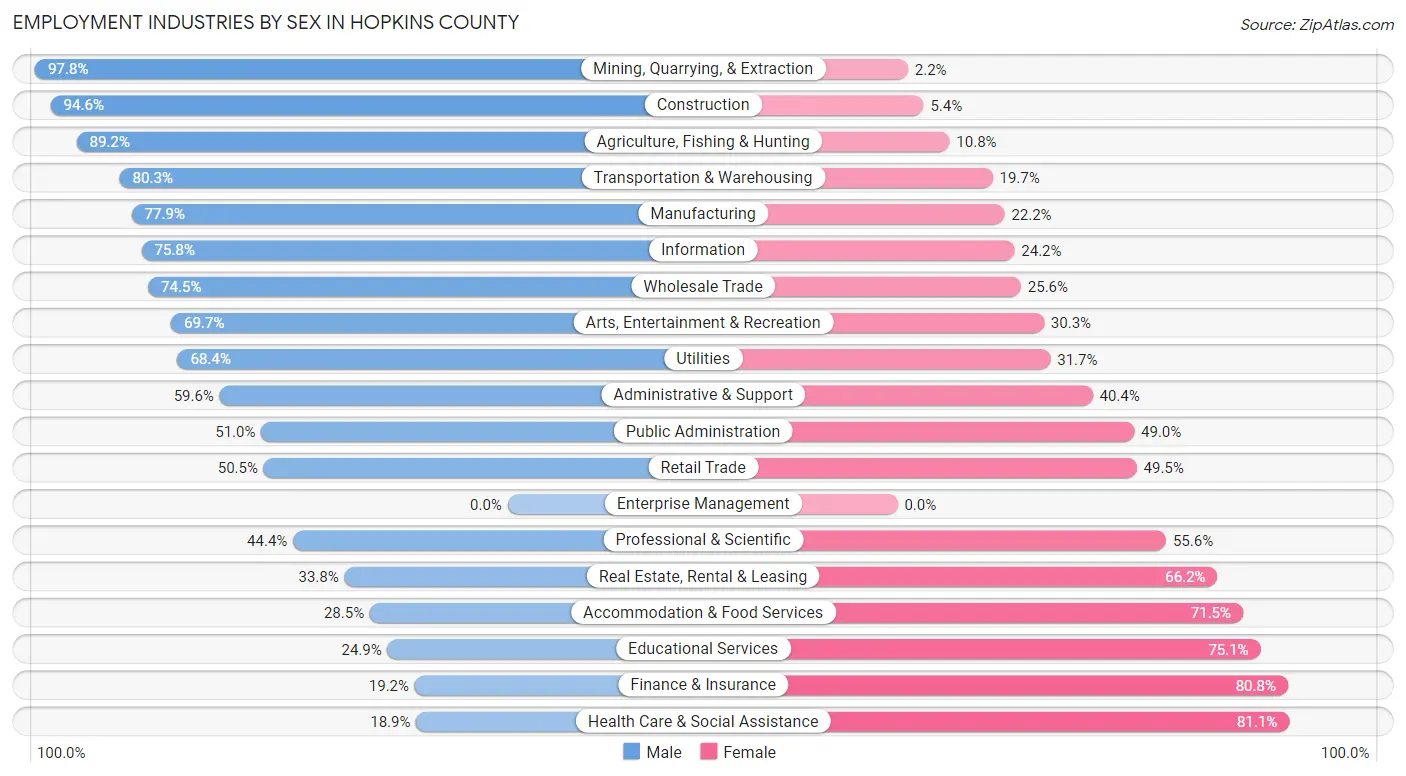
Employment Industries by Sex in Hopkins County
The Hopkins County industries that see more men than women are Mining, Quarrying, & Extraction (97.8%), Construction (94.6%), and Agriculture, Fishing & Hunting (89.2%), whereas the industries that tend to have a higher number of women are Health Care & Social Assistance (81.1%), Finance & Insurance (80.8%), and Educational Services (75.1%).
| Industry | Male | Female |
| Agriculture, Fishing & Hunting | 423 (89.2%) | 51 (10.8%) |
| Mining, Quarrying, & Extraction | 181 (97.8%) | 4 (2.2%) |
| Construction | 1,612 (94.6%) | 92 (5.4%) |
| Manufacturing | 1,757 (77.8%) | 500 (22.2%) |
| Wholesale Trade | 507 (74.5%) | 174 (25.6%) |
| Retail Trade | 1,124 (50.5%) | 1,102 (49.5%) |
| Transportation & Warehousing | 694 (80.3%) | 170 (19.7%) |
| Utilities | 162 (68.3%) | 75 (31.7%) |
| Information | 119 (75.8%) | 38 (24.2%) |
| Finance & Insurance | 124 (19.2%) | 521 (80.8%) |
| Real Estate, Rental & Leasing | 104 (33.8%) | 204 (66.2%) |
| Professional & Scientific | 322 (44.4%) | 403 (55.6%) |
| Enterprise Management | 0 (0.0%) | 0 (0.0%) |
| Administrative & Support | 285 (59.6%) | 193 (40.4%) |
| Educational Services | 427 (24.9%) | 1,290 (75.1%) |
| Health Care & Social Assistance | 361 (18.9%) | 1,547 (81.1%) |
| Arts, Entertainment & Recreation | 108 (69.7%) | 47 (30.3%) |
| Accommodation & Food Services | 203 (28.5%) | 509 (71.5%) |
| Public Administration | 302 (51.0%) | 290 (49.0%) |
| Total | 9,317 (54.6%) | 7,752 (45.4%) |
Education in Hopkins County
School Enrollment in Hopkins County
The most common levels of schooling among the 8,566 students in Hopkins County are middle school (2,152 | 25.1%), elementary school (2,109 | 24.6%), and high school (2,046 | 23.9%).
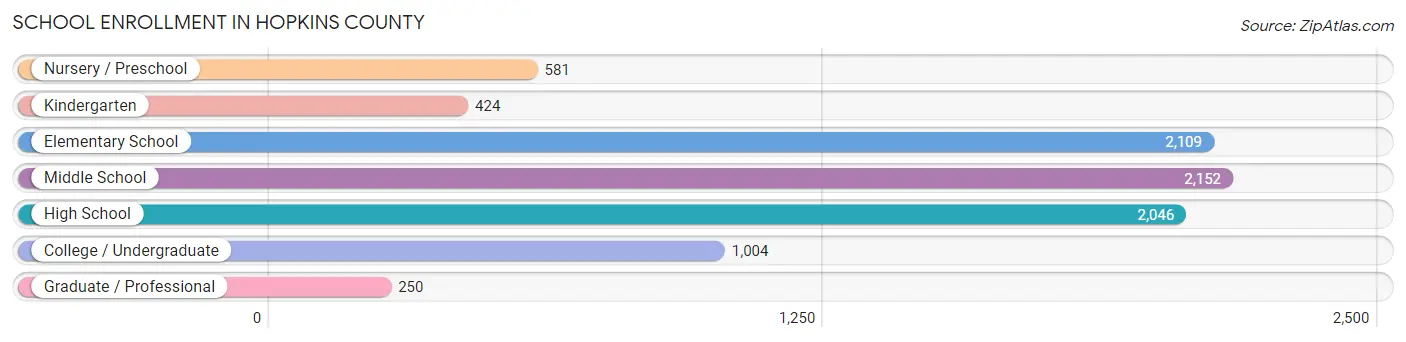
| School Level | # Students | % Students |
| Nursery / Preschool | 581 | 6.8% |
| Kindergarten | 424 | 5.0% |
| Elementary School | 2,109 | 24.6% |
| Middle School | 2,152 | 25.1% |
| High School | 2,046 | 23.9% |
| College / Undergraduate | 1,004 | 11.7% |
| Graduate / Professional | 250 | 2.9% |
| Total | 8,566 | 100.0% |
School Enrollment by Age by Funding Source in Hopkins County
Out of a total of 8,566 students who are enrolled in schools in Hopkins County, 1,028 (12.0%) attend a private institution, while the remaining 7,538 (88.0%) are enrolled in public schools. The age group of 3 to 4 year olds has the highest likelihood of being enrolled in private schools, with 108 (26.5% in the age bracket) enrolled. Conversely, the age group of 25 to 34 year olds has the lowest likelihood of being enrolled in a private school, with 248 (97.3% in the age bracket) attending a public institution.
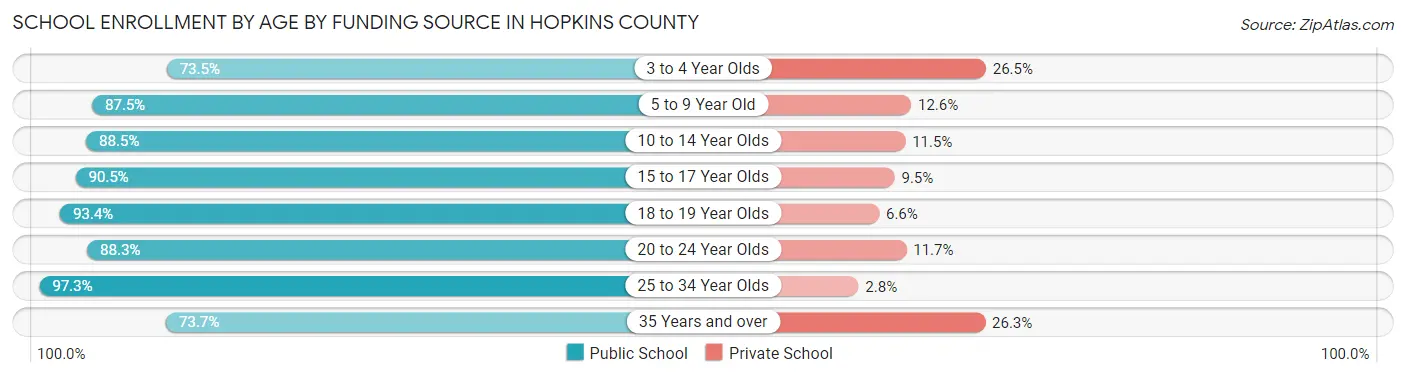
| Age Bracket | Public School | Private School |
| 3 to 4 Year Olds | 300 (73.5%) | 108 (26.5%) |
| 5 to 9 Year Old | 2,209 (87.5%) | 317 (12.6%) |
| 10 to 14 Year Olds | 2,133 (88.5%) | 276 (11.5%) |
| 15 to 17 Year Olds | 1,433 (90.5%) | 150 (9.5%) |
| 18 to 19 Year Olds | 496 (93.4%) | 35 (6.6%) |
| 20 to 24 Year Olds | 523 (88.3%) | 69 (11.7%) |
| 25 to 34 Year Olds | 248 (97.3%) | 7 (2.8%) |
| 35 Years and over | 193 (73.7%) | 69 (26.3%) |
| Total | 7,538 (88.0%) | 1,028 (12.0%) |
Educational Attainment by Field of Study in Hopkins County
Education (1,161 | 19.5%), business (1,133 | 19.0%), science & technology (648 | 10.9%), bio, nature & agricultural (552 | 9.3%), and arts & humanities (533 | 8.9%) are the most common fields of study among 5,954 individuals in Hopkins County who have obtained a bachelor's degree or higher.
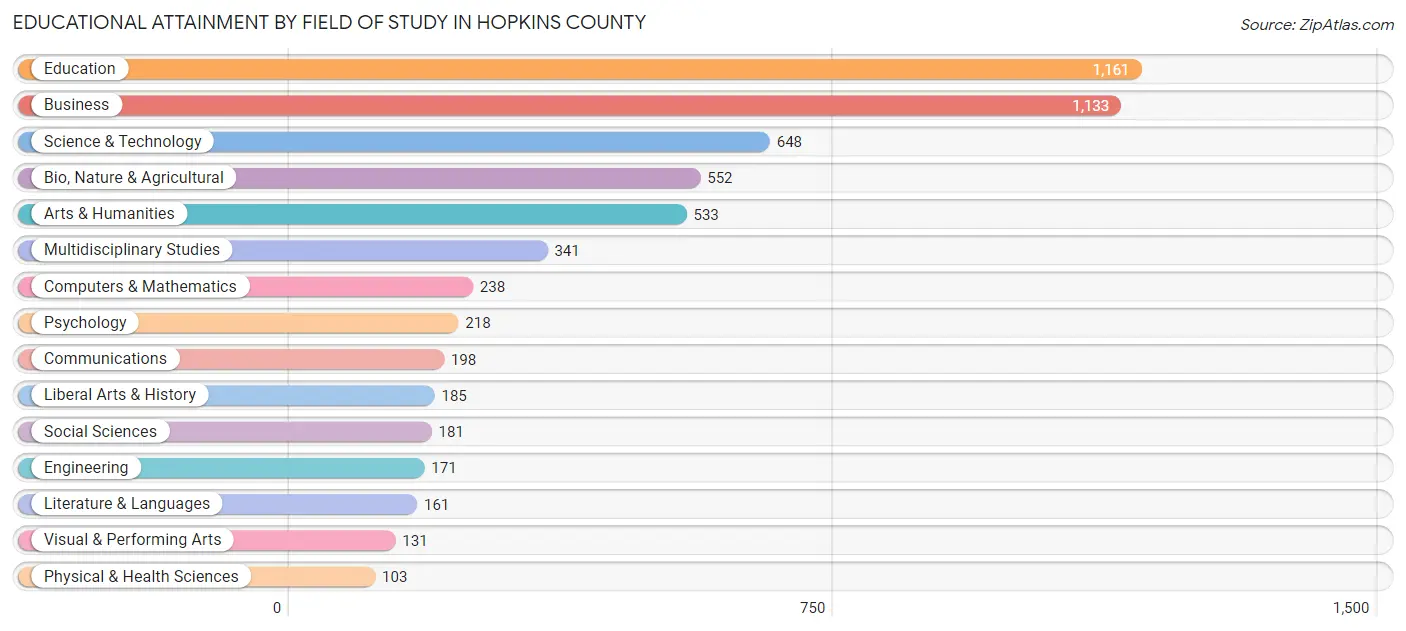
| Field of Study | # Graduates | % Graduates |
| Computers & Mathematics | 238 | 4.0% |
| Bio, Nature & Agricultural | 552 | 9.3% |
| Physical & Health Sciences | 103 | 1.7% |
| Psychology | 218 | 3.7% |
| Social Sciences | 181 | 3.0% |
| Engineering | 171 | 2.9% |
| Multidisciplinary Studies | 341 | 5.7% |
| Science & Technology | 648 | 10.9% |
| Business | 1,133 | 19.0% |
| Education | 1,161 | 19.5% |
| Literature & Languages | 161 | 2.7% |
| Liberal Arts & History | 185 | 3.1% |
| Visual & Performing Arts | 131 | 2.2% |
| Communications | 198 | 3.3% |
| Arts & Humanities | 533 | 8.9% |
| Total | 5,954 | 100.0% |
Transportation & Commute in Hopkins County
Vehicle Availability by Sex in Hopkins County
The most prevalent vehicle ownership categories in Hopkins County are males with 2 vehicles (3,516, accounting for 38.2%) and females with 2 vehicles (3,325, making up 46.5%).
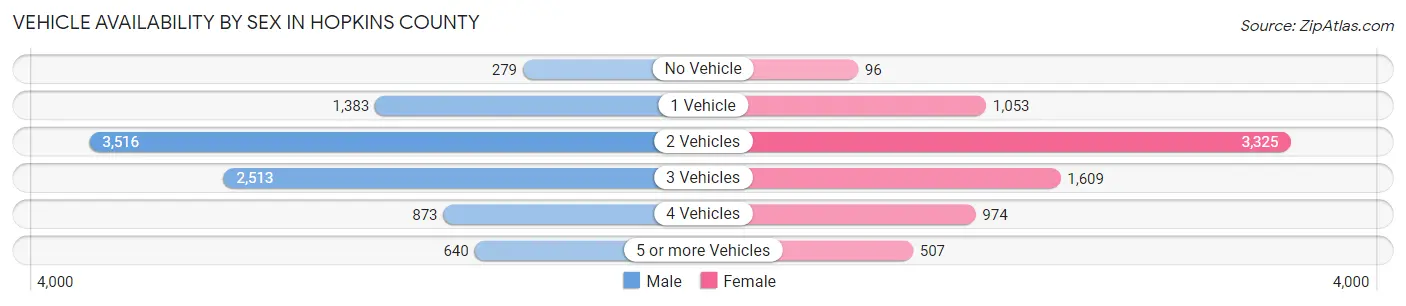
| Vehicles Available | Male | Female |
| No Vehicle | 279 (3.0%) | 96 (1.3%) |
| 1 Vehicle | 1,383 (15.0%) | 1,053 (13.9%) |
| 2 Vehicles | 3,516 (38.2%) | 3,325 (44.0%) |
| 3 Vehicles | 2,513 (27.3%) | 1,609 (21.3%) |
| 4 Vehicles | 873 (9.5%) | 974 (12.9%) |
| 5 or more Vehicles | 640 (7.0%) | 507 (6.7%) |
| Total | 9,204 (100.0%) | 7,564 (100.0%) |
Commute Time in Hopkins County
The most frequently occuring commute durations in Hopkins County are 5 to 9 minutes (3,259 commuters, 20.5%), 10 to 14 minutes (2,956 commuters, 18.6%), and 15 to 19 minutes (2,555 commuters, 16.1%).
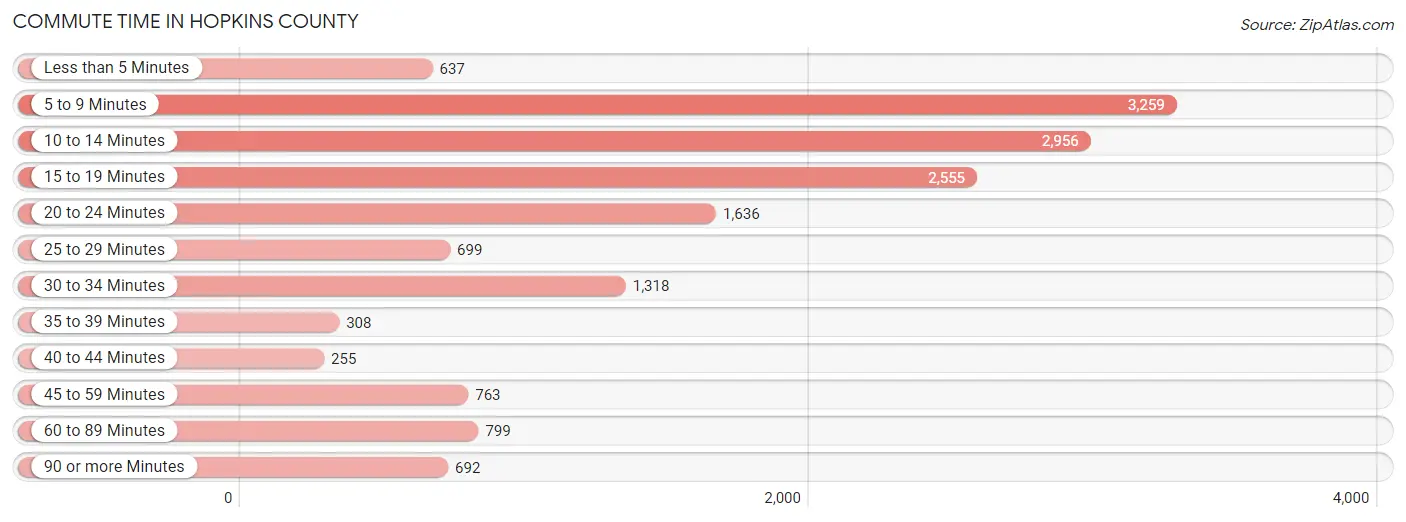
| Commute Time | # Commuters | % Commuters |
| Less than 5 Minutes | 637 | 4.0% |
| 5 to 9 Minutes | 3,259 | 20.5% |
| 10 to 14 Minutes | 2,956 | 18.6% |
| 15 to 19 Minutes | 2,555 | 16.1% |
| 20 to 24 Minutes | 1,636 | 10.3% |
| 25 to 29 Minutes | 699 | 4.4% |
| 30 to 34 Minutes | 1,318 | 8.3% |
| 35 to 39 Minutes | 308 | 1.9% |
| 40 to 44 Minutes | 255 | 1.6% |
| 45 to 59 Minutes | 763 | 4.8% |
| 60 to 89 Minutes | 799 | 5.0% |
| 90 or more Minutes | 692 | 4.4% |
Commute Time by Sex in Hopkins County
The most common commute times in Hopkins County are 10 to 14 minutes (1,556 commuters, 17.5%) for males and 5 to 9 minutes (1,720 commuters, 24.6%) for females.
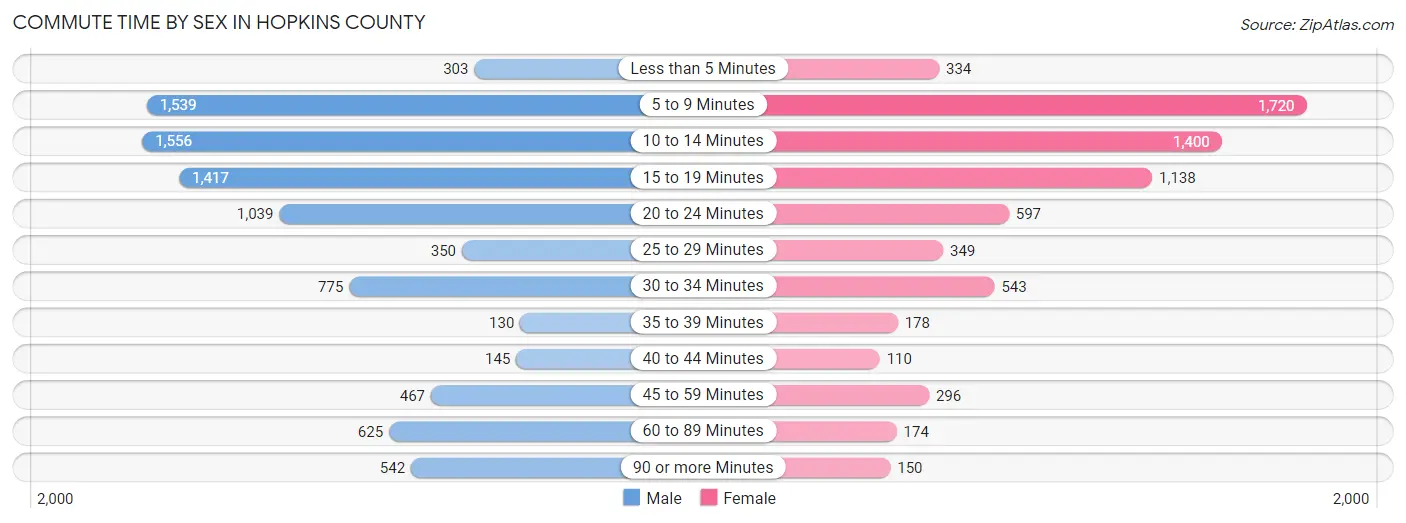
| Commute Time | Male | Female |
| Less than 5 Minutes | 303 (3.4%) | 334 (4.8%) |
| 5 to 9 Minutes | 1,539 (17.3%) | 1,720 (24.6%) |
| 10 to 14 Minutes | 1,556 (17.5%) | 1,400 (20.0%) |
| 15 to 19 Minutes | 1,417 (15.9%) | 1,138 (16.3%) |
| 20 to 24 Minutes | 1,039 (11.7%) | 597 (8.5%) |
| 25 to 29 Minutes | 350 (3.9%) | 349 (5.0%) |
| 30 to 34 Minutes | 775 (8.7%) | 543 (7.8%) |
| 35 to 39 Minutes | 130 (1.5%) | 178 (2.5%) |
| 40 to 44 Minutes | 145 (1.6%) | 110 (1.6%) |
| 45 to 59 Minutes | 467 (5.2%) | 296 (4.2%) |
| 60 to 89 Minutes | 625 (7.0%) | 174 (2.5%) |
| 90 or more Minutes | 542 (6.1%) | 150 (2.1%) |
Time of Departure to Work by Sex in Hopkins County
The most frequent times of departure to work in Hopkins County are 7:00 AM to 7:29 AM (1,394, 15.7%) for males and 7:00 AM to 7:29 AM (1,534, 22.0%) for females.
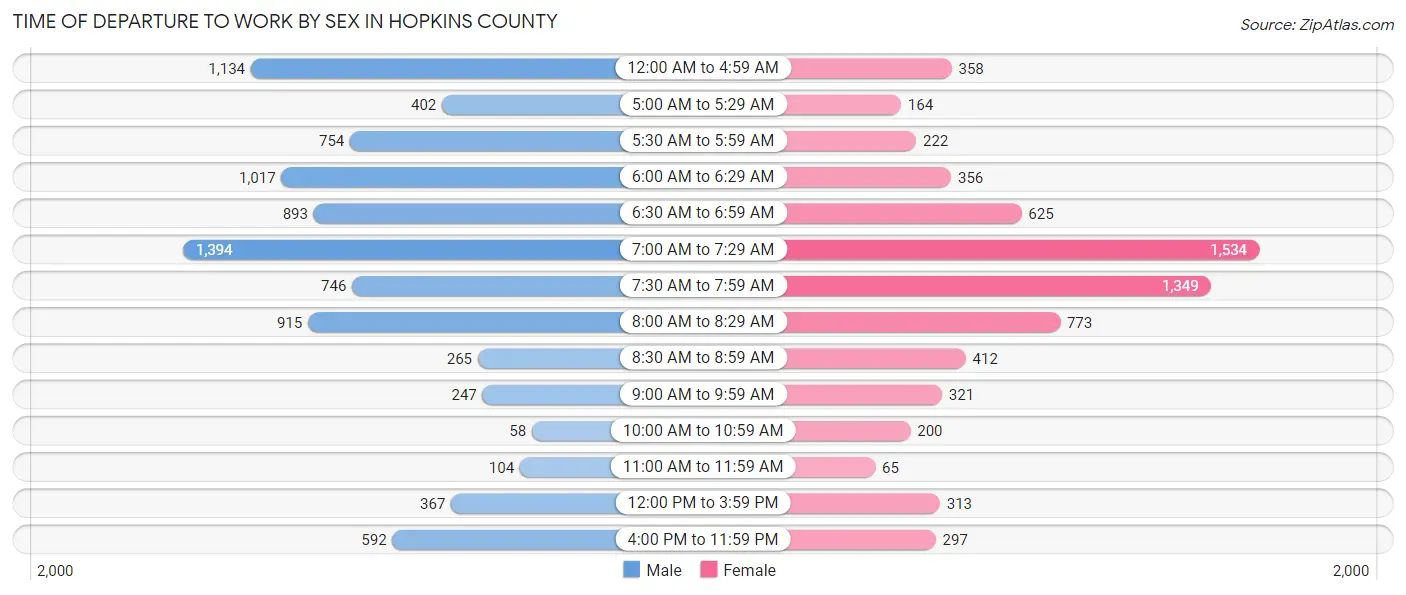
| Time of Departure | Male | Female |
| 12:00 AM to 4:59 AM | 1,134 (12.8%) | 358 (5.1%) |
| 5:00 AM to 5:29 AM | 402 (4.5%) | 164 (2.4%) |
| 5:30 AM to 5:59 AM | 754 (8.5%) | 222 (3.2%) |
| 6:00 AM to 6:29 AM | 1,017 (11.4%) | 356 (5.1%) |
| 6:30 AM to 6:59 AM | 893 (10.1%) | 625 (8.9%) |
| 7:00 AM to 7:29 AM | 1,394 (15.7%) | 1,534 (22.0%) |
| 7:30 AM to 7:59 AM | 746 (8.4%) | 1,349 (19.3%) |
| 8:00 AM to 8:29 AM | 915 (10.3%) | 773 (11.1%) |
| 8:30 AM to 8:59 AM | 265 (3.0%) | 412 (5.9%) |
| 9:00 AM to 9:59 AM | 247 (2.8%) | 321 (4.6%) |
| 10:00 AM to 10:59 AM | 58 (0.6%) | 200 (2.9%) |
| 11:00 AM to 11:59 AM | 104 (1.2%) | 65 (0.9%) |
| 12:00 PM to 3:59 PM | 367 (4.1%) | 313 (4.5%) |
| 4:00 PM to 11:59 PM | 592 (6.7%) | 297 (4.3%) |
| Total | 8,888 (100.0%) | 6,989 (100.0%) |
Housing Occupancy in Hopkins County
Occupancy by Ownership in Hopkins County
Of the total 13,781 dwellings in Hopkins County, owner-occupied units account for 9,655 (70.1%), while renter-occupied units make up 4,126 (29.9%).
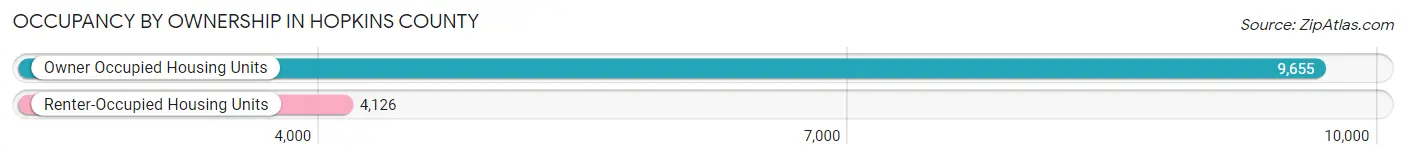
| Occupancy | # Housing Units | % Housing Units |
| Owner Occupied Housing Units | 9,655 | 70.1% |
| Renter-Occupied Housing Units | 4,126 | 29.9% |
| Total Occupied Housing Units | 13,781 | 100.0% |
Occupancy by Household Size in Hopkins County
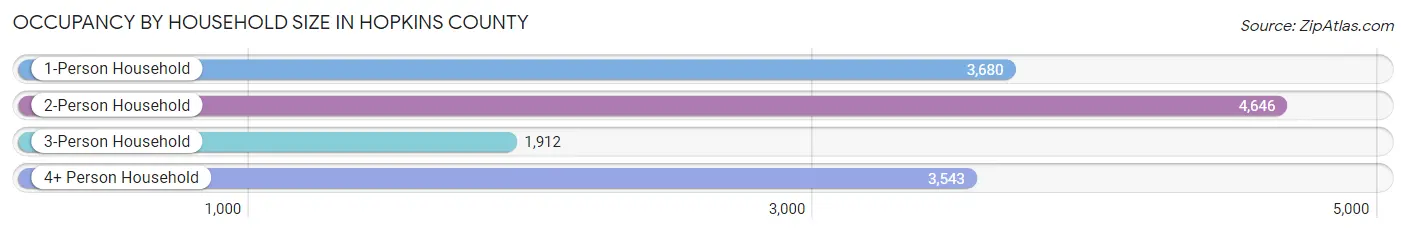
| Household Size | # Housing Units | % Housing Units |
| 1-Person Household | 3,680 | 26.7% |
| 2-Person Household | 4,646 | 33.7% |
| 3-Person Household | 1,912 | 13.9% |
| 4+ Person Household | 3,543 | 25.7% |
| Total Housing Units | 13,781 | 100.0% |
Occupancy by Ownership by Household Size in Hopkins County
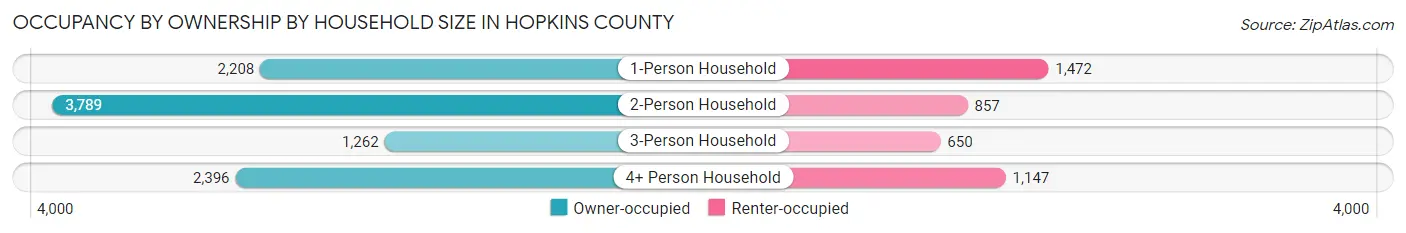
| Household Size | Owner-occupied | Renter-occupied |
| 1-Person Household | 2,208 (60.0%) | 1,472 (40.0%) |
| 2-Person Household | 3,789 (81.6%) | 857 (18.4%) |
| 3-Person Household | 1,262 (66.0%) | 650 (34.0%) |
| 4+ Person Household | 2,396 (67.6%) | 1,147 (32.4%) |
| Total Housing Units | 9,655 (70.1%) | 4,126 (29.9%) |
Occupancy by Educational Attainment in Hopkins County
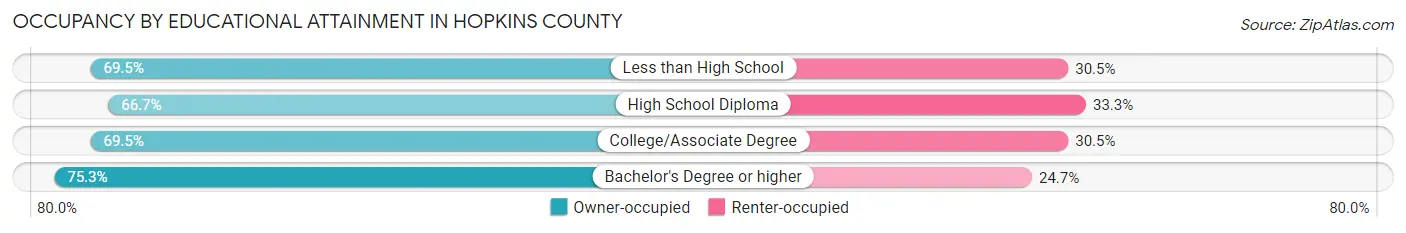
| Household Size | Owner-occupied | Renter-occupied |
| Less than High School | 1,159 (69.5%) | 508 (30.5%) |
| High School Diploma | 2,862 (66.7%) | 1,428 (33.3%) |
| College/Associate Degree | 3,094 (69.5%) | 1,356 (30.5%) |
| Bachelor's Degree or higher | 2,540 (75.3%) | 834 (24.7%) |
Occupancy by Age of Householder in Hopkins County
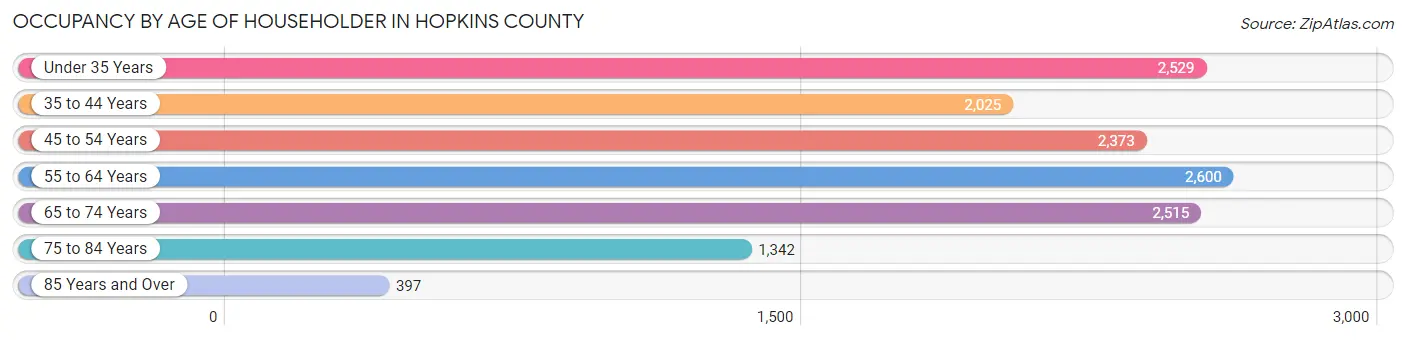
| Age Bracket | # Households | % Households |
| Under 35 Years | 2,529 | 18.3% |
| 35 to 44 Years | 2,025 | 14.7% |
| 45 to 54 Years | 2,373 | 17.2% |
| 55 to 64 Years | 2,600 | 18.9% |
| 65 to 74 Years | 2,515 | 18.2% |
| 75 to 84 Years | 1,342 | 9.7% |
| 85 Years and Over | 397 | 2.9% |
| Total | 13,781 | 100.0% |
Housing Finances in Hopkins County
Median Income by Occupancy in Hopkins County
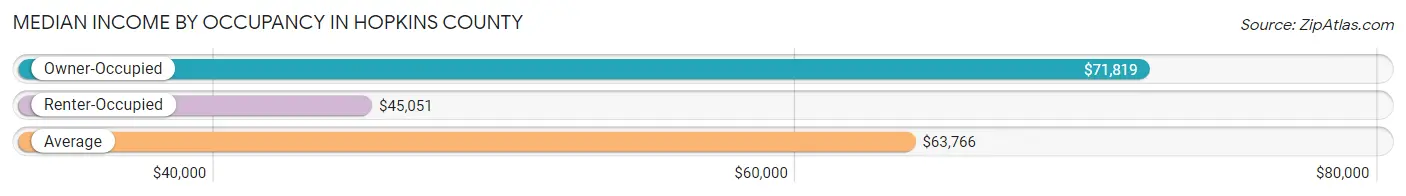
| Occupancy Type | # Households | Median Income |
| Owner-Occupied | 9,655 (70.1%) | $71,819 |
| Renter-Occupied | 4,126 (29.9%) | $45,051 |
| Average | 13,781 (100.0%) | $63,766 |
Occupancy by Householder Income Bracket in Hopkins County
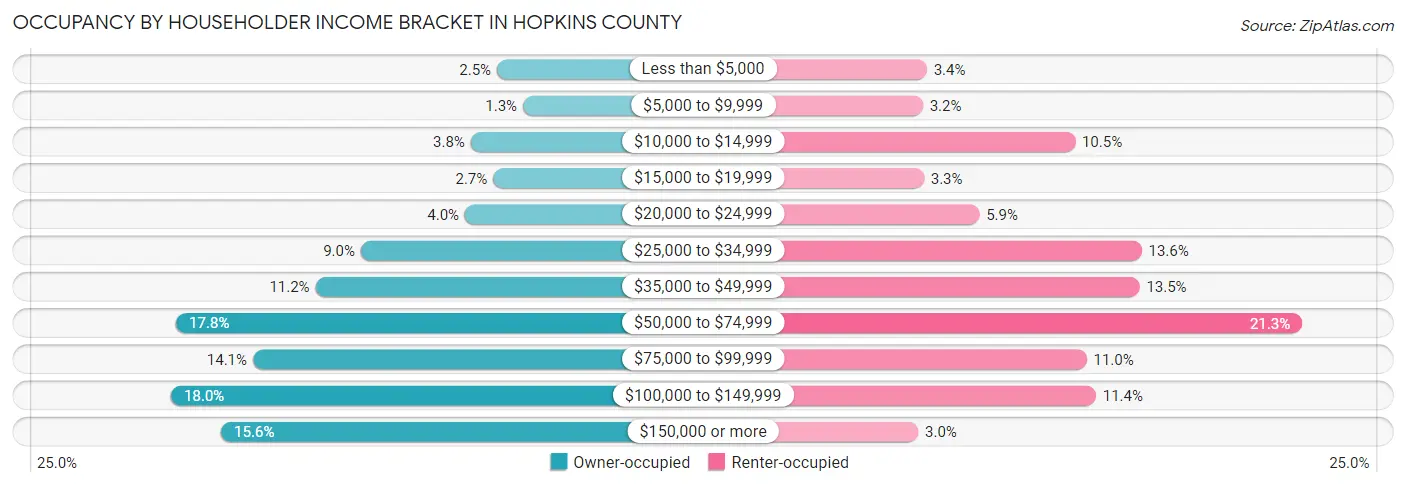
| Income Bracket | Owner-occupied | Renter-occupied |
| Less than $5,000 | 242 (2.5%) | 140 (3.4%) |
| $5,000 to $9,999 | 123 (1.3%) | 132 (3.2%) |
| $10,000 to $14,999 | 363 (3.8%) | 431 (10.4%) |
| $15,000 to $19,999 | 260 (2.7%) | 134 (3.3%) |
| $20,000 to $24,999 | 389 (4.0%) | 243 (5.9%) |
| $25,000 to $34,999 | 868 (9.0%) | 562 (13.6%) |
| $35,000 to $49,999 | 1,077 (11.2%) | 558 (13.5%) |
| $50,000 to $74,999 | 1,718 (17.8%) | 877 (21.3%) |
| $75,000 to $99,999 | 1,364 (14.1%) | 454 (11.0%) |
| $100,000 to $149,999 | 1,741 (18.0%) | 472 (11.4%) |
| $150,000 or more | 1,510 (15.6%) | 123 (3.0%) |
| Total | 9,655 (100.0%) | 4,126 (100.0%) |
Monthly Housing Cost Tiers in Hopkins County
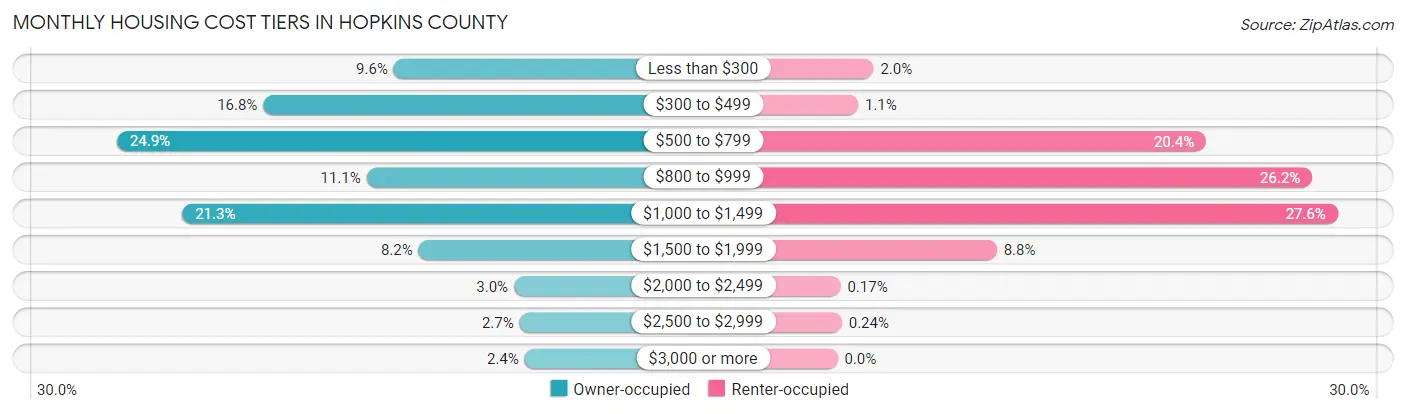
| Monthly Cost | Owner-occupied | Renter-occupied |
| Less than $300 | 928 (9.6%) | 82 (2.0%) |
| $300 to $499 | 1,624 (16.8%) | 47 (1.1%) |
| $500 to $799 | 2,404 (24.9%) | 840 (20.4%) |
| $800 to $999 | 1,073 (11.1%) | 1,082 (26.2%) |
| $1,000 to $1,499 | 2,056 (21.3%) | 1,140 (27.6%) |
| $1,500 to $1,999 | 796 (8.2%) | 363 (8.8%) |
| $2,000 to $2,499 | 287 (3.0%) | 7 (0.2%) |
| $2,500 to $2,999 | 257 (2.7%) | 10 (0.2%) |
| $3,000 or more | 230 (2.4%) | 0 (0.0%) |
| Total | 9,655 (100.0%) | 4,126 (100.0%) |
Physical Housing Characteristics in Hopkins County
Housing Structures in Hopkins County
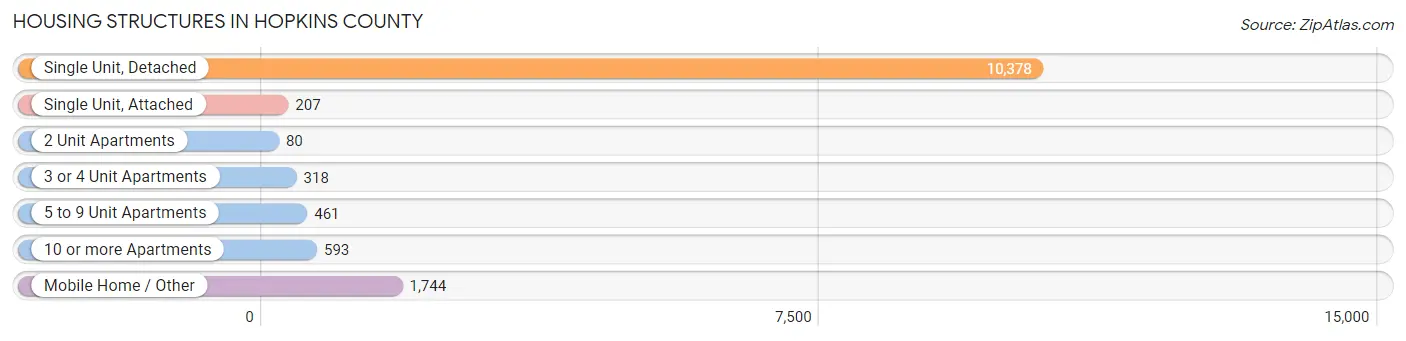
| Structure Type | # Housing Units | % Housing Units |
| Single Unit, Detached | 10,378 | 75.3% |
| Single Unit, Attached | 207 | 1.5% |
| 2 Unit Apartments | 80 | 0.6% |
| 3 or 4 Unit Apartments | 318 | 2.3% |
| 5 to 9 Unit Apartments | 461 | 3.4% |
| 10 or more Apartments | 593 | 4.3% |
| Mobile Home / Other | 1,744 | 12.7% |
| Total | 13,781 | 100.0% |
Housing Structures by Occupancy in Hopkins County
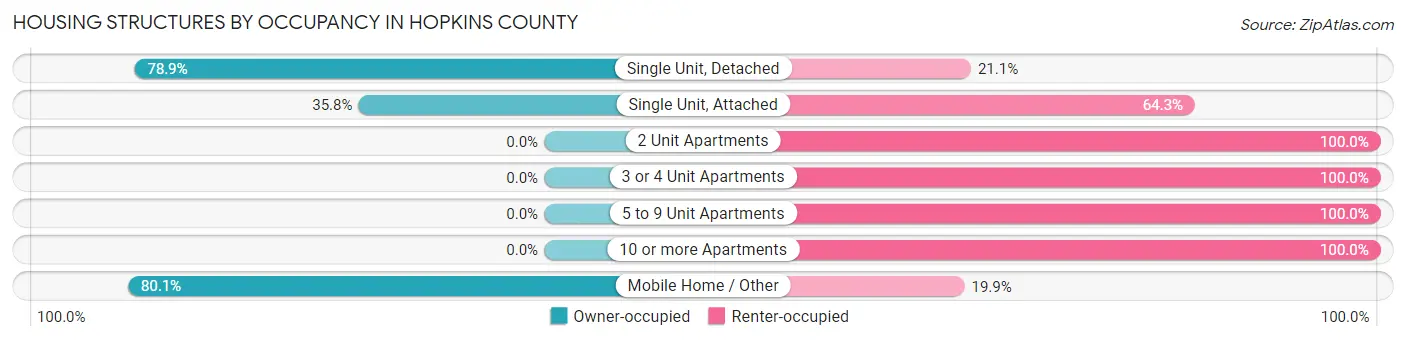
| Structure Type | Owner-occupied | Renter-occupied |
| Single Unit, Detached | 8,184 (78.9%) | 2,194 (21.1%) |
| Single Unit, Attached | 74 (35.7%) | 133 (64.2%) |
| 2 Unit Apartments | 0 (0.0%) | 80 (100.0%) |
| 3 or 4 Unit Apartments | 0 (0.0%) | 318 (100.0%) |
| 5 to 9 Unit Apartments | 0 (0.0%) | 461 (100.0%) |
| 10 or more Apartments | 0 (0.0%) | 593 (100.0%) |
| Mobile Home / Other | 1,397 (80.1%) | 347 (19.9%) |
| Total | 9,655 (70.1%) | 4,126 (29.9%) |
Housing Structures by Number of Rooms in Hopkins County
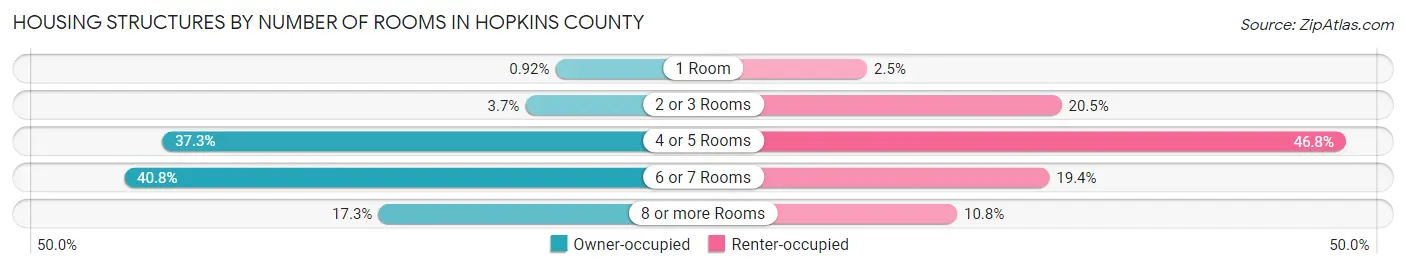
| Number of Rooms | Owner-occupied | Renter-occupied |
| 1 Room | 89 (0.9%) | 104 (2.5%) |
| 2 or 3 Rooms | 357 (3.7%) | 846 (20.5%) |
| 4 or 5 Rooms | 3,600 (37.3%) | 1,930 (46.8%) |
| 6 or 7 Rooms | 3,939 (40.8%) | 799 (19.4%) |
| 8 or more Rooms | 1,670 (17.3%) | 447 (10.8%) |
| Total | 9,655 (100.0%) | 4,126 (100.0%) |
Housing Structure by Heating Type in Hopkins County
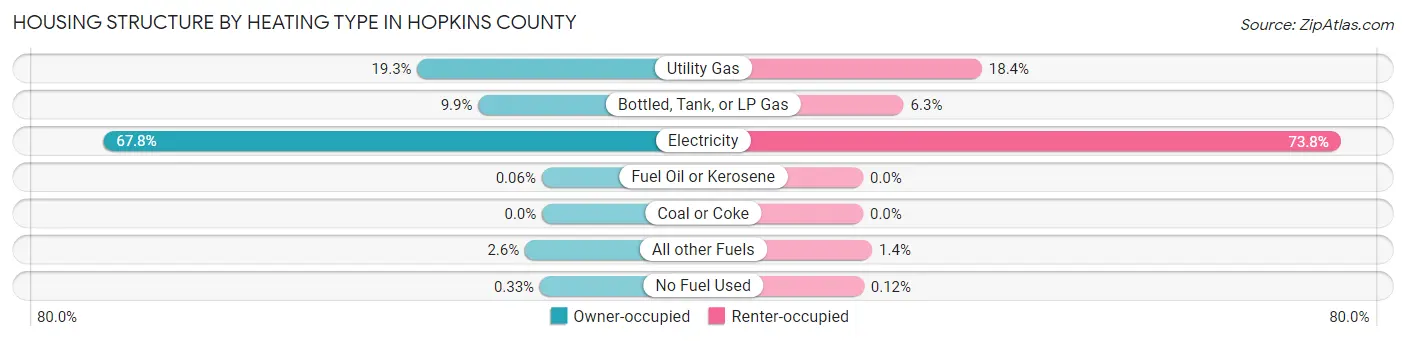
| Heating Type | Owner-occupied | Renter-occupied |
| Utility Gas | 1,861 (19.3%) | 758 (18.4%) |
| Bottled, Tank, or LP Gas | 953 (9.9%) | 259 (6.3%) |
| Electricity | 6,549 (67.8%) | 3,046 (73.8%) |
| Fuel Oil or Kerosene | 6 (0.1%) | 0 (0.0%) |
| Coal or Coke | 0 (0.0%) | 0 (0.0%) |
| All other Fuels | 254 (2.6%) | 58 (1.4%) |
| No Fuel Used | 32 (0.3%) | 5 (0.1%) |
| Total | 9,655 (100.0%) | 4,126 (100.0%) |
Household Vehicle Usage in Hopkins County
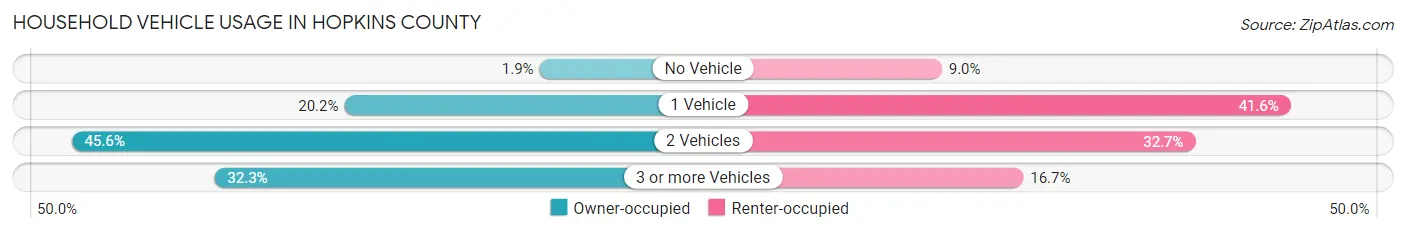
| Vehicles per Household | Owner-occupied | Renter-occupied |
| No Vehicle | 187 (1.9%) | 373 (9.0%) |
| 1 Vehicle | 1,946 (20.2%) | 1,717 (41.6%) |
| 2 Vehicles | 4,405 (45.6%) | 1,349 (32.7%) |
| 3 or more Vehicles | 3,117 (32.3%) | 687 (16.7%) |
| Total | 9,655 (100.0%) | 4,126 (100.0%) |
Real Estate & Mortgages in Hopkins County
Real Estate and Mortgage Overview in Hopkins County
| Characteristic | Without Mortgage | With Mortgage |
| Housing Units | 5,678 | 3,977 |
| Median Property Value | $165,000 | $182,100 |
| Median Household Income | $63,090 | $809 |
| Monthly Housing Costs | $528 | $228 |
| Real Estate Taxes | $1,779 | $152 |
Property Value by Mortgage Status in Hopkins County
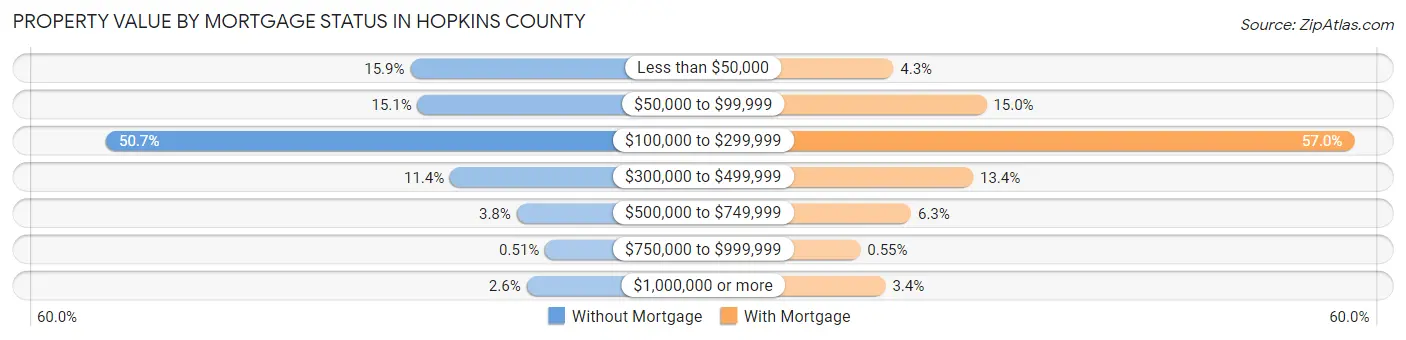
| Property Value | Without Mortgage | With Mortgage |
| Less than $50,000 | 904 (15.9%) | 172 (4.3%) |
| $50,000 to $99,999 | 857 (15.1%) | 595 (15.0%) |
| $100,000 to $299,999 | 2,878 (50.7%) | 2,266 (57.0%) |
| $300,000 to $499,999 | 646 (11.4%) | 534 (13.4%) |
| $500,000 to $749,999 | 214 (3.8%) | 252 (6.3%) |
| $750,000 to $999,999 | 29 (0.5%) | 22 (0.5%) |
| $1,000,000 or more | 150 (2.6%) | 136 (3.4%) |
| Total | 5,678 (100.0%) | 3,977 (100.0%) |
Household Income by Mortgage Status in Hopkins County
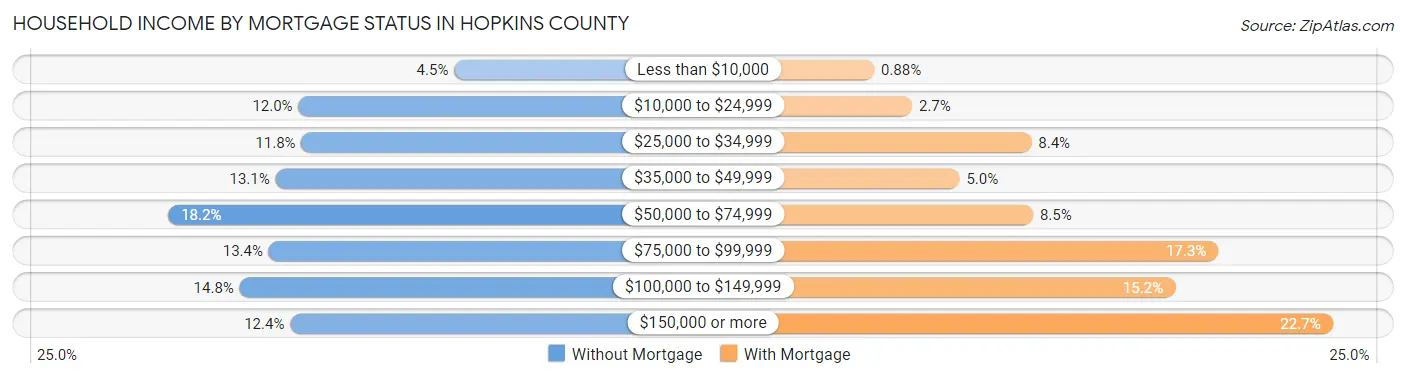
| Household Income | Without Mortgage | With Mortgage |
| Less than $10,000 | 258 (4.5%) | 35 (0.9%) |
| $10,000 to $24,999 | 679 (12.0%) | 107 (2.7%) |
| $25,000 to $34,999 | 671 (11.8%) | 333 (8.4%) |
| $35,000 to $49,999 | 741 (13.1%) | 197 (5.0%) |
| $50,000 to $74,999 | 1,031 (18.2%) | 336 (8.5%) |
| $75,000 to $99,999 | 759 (13.4%) | 687 (17.3%) |
| $100,000 to $149,999 | 838 (14.8%) | 605 (15.2%) |
| $150,000 or more | 701 (12.3%) | 903 (22.7%) |
| Total | 5,678 (100.0%) | 3,977 (100.0%) |
Property Value to Household Income Ratio in Hopkins County
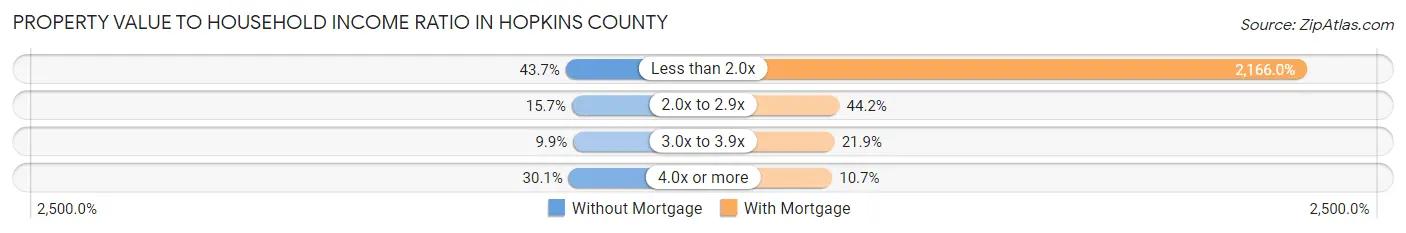
| Value-to-Income Ratio | Without Mortgage | With Mortgage |
| Less than 2.0x | 2,482 (43.7%) | 86,142 (2,166.0%) |
| 2.0x to 2.9x | 892 (15.7%) | 1,757 (44.2%) |
| 3.0x to 3.9x | 560 (9.9%) | 872 (21.9%) |
| 4.0x or more | 1,711 (30.1%) | 427 (10.7%) |
| Total | 5,678 (100.0%) | 3,977 (100.0%) |
Real Estate Taxes by Mortgage Status in Hopkins County
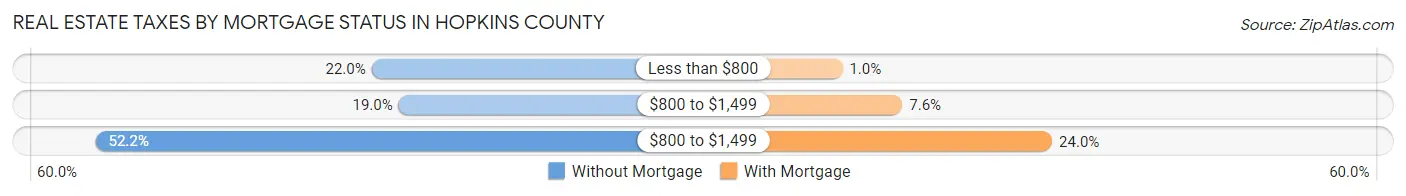
| Property Taxes | Without Mortgage | With Mortgage |
| Less than $800 | 1,248 (22.0%) | 41 (1.0%) |
| $800 to $1,499 | 1,080 (19.0%) | 302 (7.6%) |
| $800 to $1,499 | 2,965 (52.2%) | 955 (24.0%) |
| Total | 5,678 (100.0%) | 3,977 (100.0%) |
Health & Disability in Hopkins County
Health Insurance Coverage by Age in Hopkins County
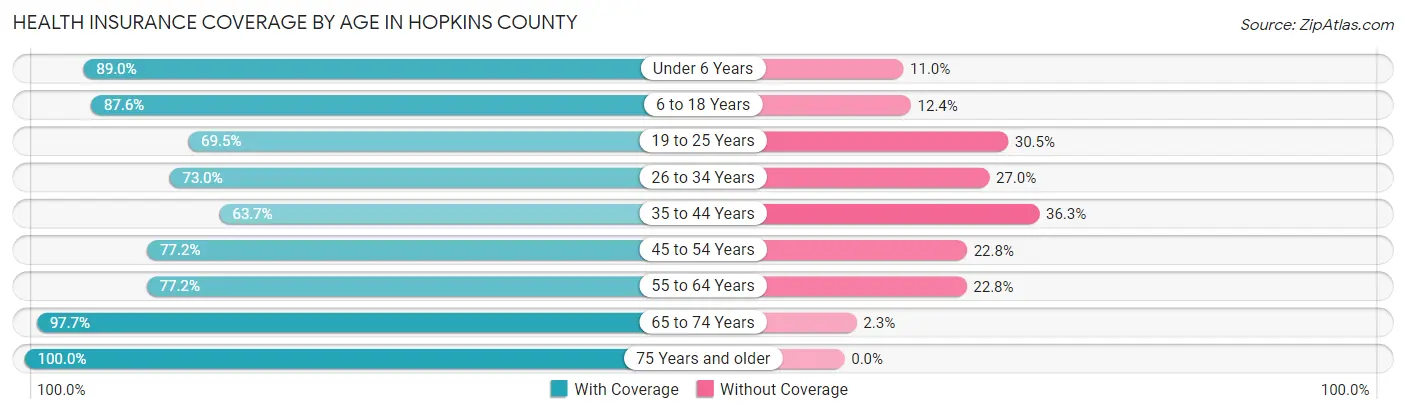
| Age Bracket | With Coverage | Without Coverage |
| Under 6 Years | 2,369 (89.0%) | 292 (11.0%) |
| 6 to 18 Years | 5,915 (87.6%) | 835 (12.4%) |
| 19 to 25 Years | 2,152 (69.5%) | 944 (30.5%) |
| 26 to 34 Years | 2,886 (73.0%) | 1,067 (27.0%) |
| 35 to 44 Years | 2,600 (63.7%) | 1,482 (36.3%) |
| 45 to 54 Years | 3,570 (77.2%) | 1,056 (22.8%) |
| 55 to 64 Years | 3,686 (77.2%) | 1,086 (22.8%) |
| 65 to 74 Years | 3,799 (97.7%) | 88 (2.3%) |
| 75 Years and older | 2,628 (100.0%) | 0 (0.0%) |
| Total | 29,605 (81.2%) | 6,850 (18.8%) |
Health Insurance Coverage by Citizenship Status in Hopkins County
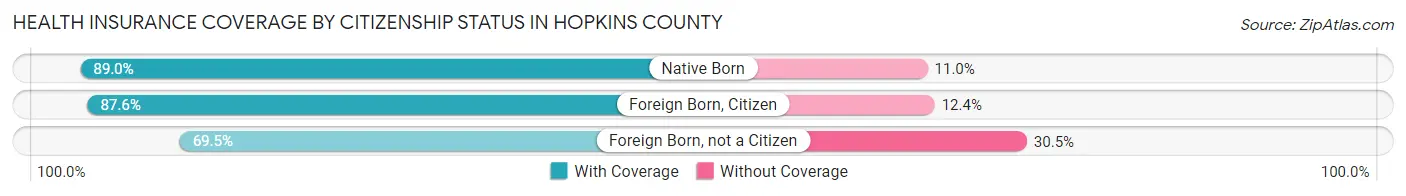
| Citizenship Status | With Coverage | Without Coverage |
| Native Born | 2,369 (89.0%) | 292 (11.0%) |
| Foreign Born, Citizen | 5,915 (87.6%) | 835 (12.4%) |
| Foreign Born, not a Citizen | 2,152 (69.5%) | 944 (30.5%) |
Health Insurance Coverage by Household Income in Hopkins County
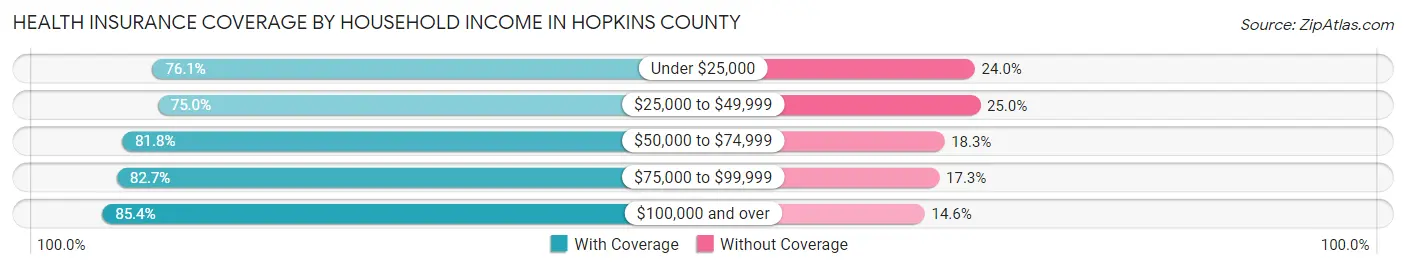
| Household Income | With Coverage | Without Coverage |
| Under $25,000 | 3,331 (76.0%) | 1,049 (23.9%) |
| $25,000 to $49,999 | 5,221 (75.0%) | 1,737 (25.0%) |
| $50,000 to $74,999 | 5,232 (81.8%) | 1,168 (18.2%) |
| $75,000 to $99,999 | 4,522 (82.7%) | 946 (17.3%) |
| $100,000 and over | 11,299 (85.4%) | 1,927 (14.6%) |
Public vs Private Health Insurance Coverage by Age in Hopkins County
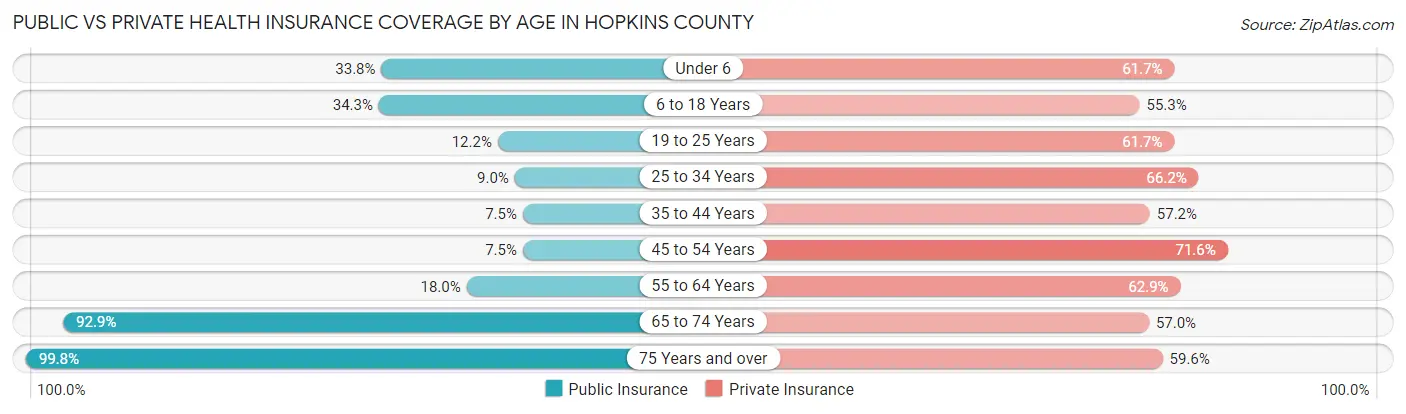
| Age Bracket | Public Insurance | Private Insurance |
| Under 6 | 899 (33.8%) | 1,643 (61.7%) |
| 6 to 18 Years | 2,312 (34.3%) | 3,731 (55.3%) |
| 19 to 25 Years | 377 (12.2%) | 1,911 (61.7%) |
| 25 to 34 Years | 357 (9.0%) | 2,618 (66.2%) |
| 35 to 44 Years | 307 (7.5%) | 2,334 (57.2%) |
| 45 to 54 Years | 348 (7.5%) | 3,312 (71.6%) |
| 55 to 64 Years | 857 (18.0%) | 2,999 (62.8%) |
| 65 to 74 Years | 3,609 (92.8%) | 2,216 (57.0%) |
| 75 Years and over | 2,622 (99.8%) | 1,565 (59.6%) |
| Total | 11,688 (32.1%) | 22,329 (61.3%) |
Disability Status by Sex by Age in Hopkins County
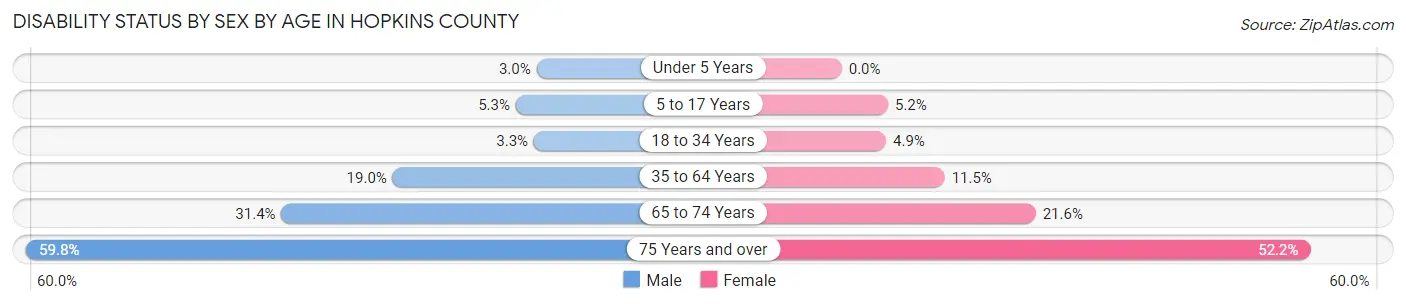
| Age Bracket | Male | Female |
| Under 5 Years | 35 (3.0%) | 0 (0.0%) |
| 5 to 17 Years | 183 (5.3%) | 166 (5.1%) |
| 18 to 34 Years | 124 (3.3%) | 184 (4.9%) |
| 35 to 64 Years | 1,265 (19.0%) | 782 (11.5%) |
| 65 to 74 Years | 594 (31.4%) | 431 (21.6%) |
| 75 Years and over | 649 (59.8%) | 805 (52.2%) |
Disability Class by Sex by Age in Hopkins County
Disability Class: Hearing Difficulty
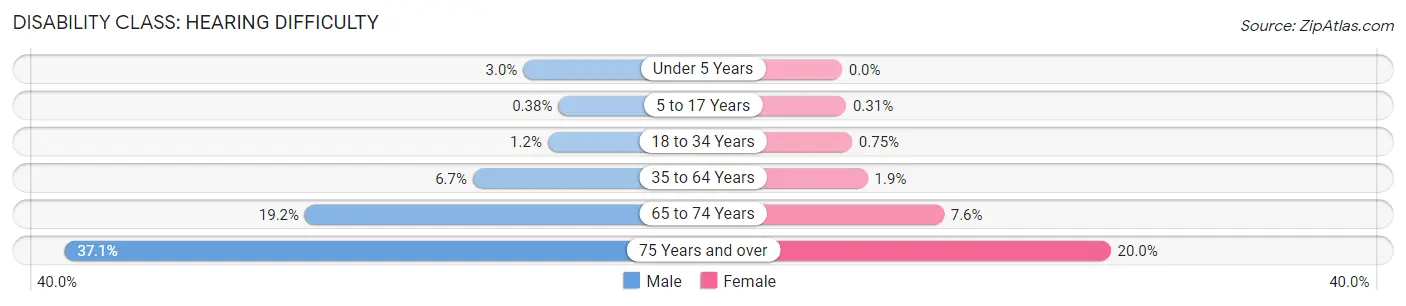
| Age Bracket | Male | Female |
| Under 5 Years | 35 (3.0%) | 0 (0.0%) |
| 5 to 17 Years | 13 (0.4%) | 10 (0.3%) |
| 18 to 34 Years | 44 (1.2%) | 28 (0.7%) |
| 35 to 64 Years | 447 (6.7%) | 131 (1.9%) |
| 65 to 74 Years | 363 (19.2%) | 151 (7.6%) |
| 75 Years and over | 402 (37.0%) | 308 (20.0%) |
Disability Class: Vision Difficulty
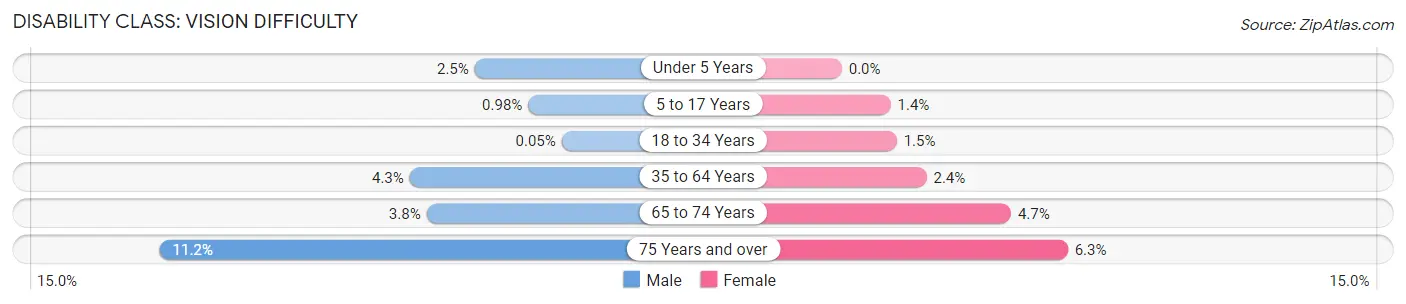
| Age Bracket | Male | Female |
| Under 5 Years | 29 (2.5%) | 0 (0.0%) |
| 5 to 17 Years | 34 (1.0%) | 44 (1.4%) |
| 18 to 34 Years | 2 (0.1%) | 57 (1.5%) |
| 35 to 64 Years | 285 (4.3%) | 161 (2.4%) |
| 65 to 74 Years | 72 (3.8%) | 94 (4.7%) |
| 75 Years and over | 122 (11.2%) | 97 (6.3%) |
Disability Class: Cognitive Difficulty
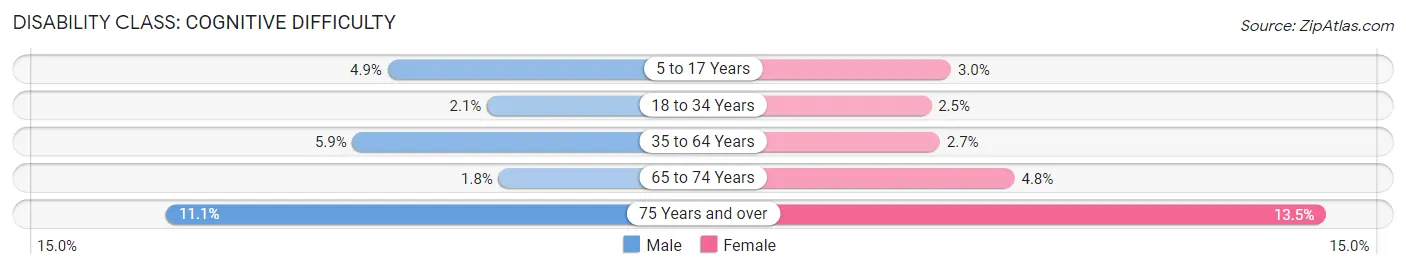
| Age Bracket | Male | Female |
| 5 to 17 Years | 169 (4.9%) | 98 (3.0%) |
| 18 to 34 Years | 80 (2.1%) | 93 (2.5%) |
| 35 to 64 Years | 391 (5.9%) | 186 (2.7%) |
| 65 to 74 Years | 34 (1.8%) | 96 (4.8%) |
| 75 Years and over | 120 (11.1%) | 208 (13.5%) |
Disability Class: Ambulatory Difficulty
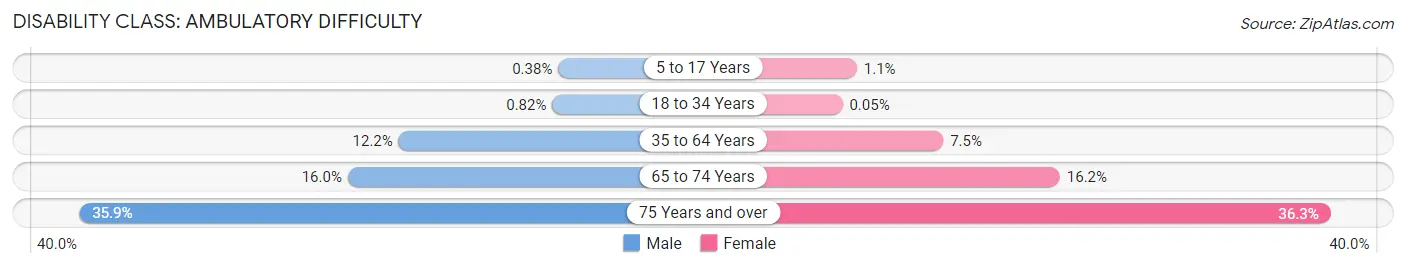
| Age Bracket | Male | Female |
| 5 to 17 Years | 13 (0.4%) | 36 (1.1%) |
| 18 to 34 Years | 31 (0.8%) | 2 (0.1%) |
| 35 to 64 Years | 814 (12.2%) | 514 (7.5%) |
| 65 to 74 Years | 303 (16.0%) | 323 (16.2%) |
| 75 Years and over | 390 (35.9%) | 560 (36.3%) |
Disability Class: Self-Care Difficulty
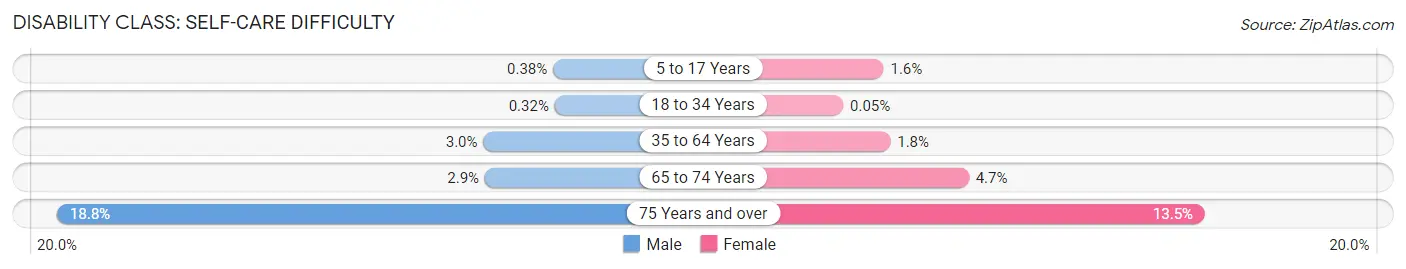
| Age Bracket | Male | Female |
| 5 to 17 Years | 13 (0.4%) | 50 (1.5%) |
| 18 to 34 Years | 12 (0.3%) | 2 (0.1%) |
| 35 to 64 Years | 198 (3.0%) | 123 (1.8%) |
| 65 to 74 Years | 55 (2.9%) | 94 (4.7%) |
| 75 Years and over | 204 (18.8%) | 208 (13.5%) |
Technology Access in Hopkins County
Computing Device Access in Hopkins County
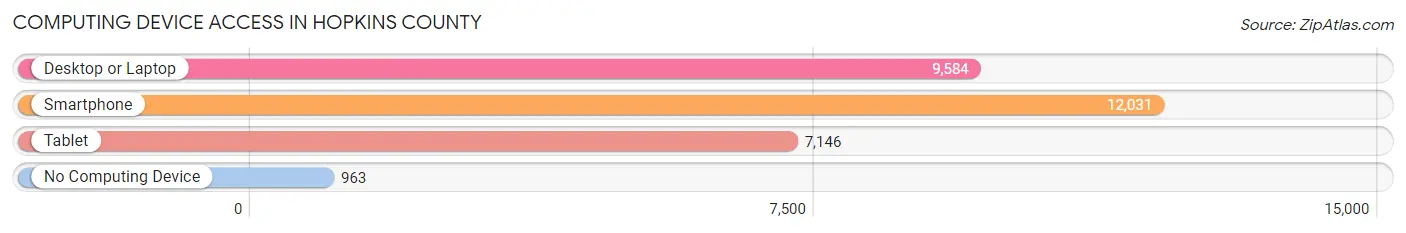
| Device Type | # Households | % Households |
| Desktop or Laptop | 9,584 | 69.6% |
| Smartphone | 12,031 | 87.3% |
| Tablet | 7,146 | 51.8% |
| No Computing Device | 963 | 7.0% |
| Total | 13,781 | 100.0% |
Internet Access in Hopkins County
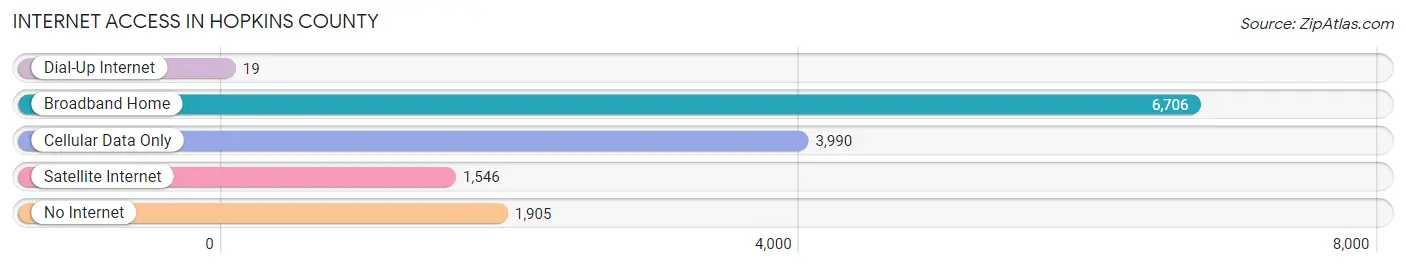
| Internet Type | # Households | % Households |
| Dial-Up Internet | 19 | 0.1% |
| Broadband Home | 6,706 | 48.7% |
| Cellular Data Only | 3,990 | 28.9% |
| Satellite Internet | 1,546 | 11.2% |
| No Internet | 1,905 | 13.8% |
| Total | 13,781 | 100.0% |
Hopkins County Summary
Hopkins County is located in the northeastern part of Texas, and is part of the Texoma region. It is bordered by Delta, Franklin, Lamar, Rains, and Wood Counties. The county seat is Sulphur Springs, and the county is named after the family of David Hopkins, an early settler in the area.
History
The area that is now Hopkins County was originally inhabited by the Caddo Indians. The first European settlers arrived in the area in the early 1800s, and the county was officially established in 1846. The county was named after the family of David Hopkins, who was an early settler in the area.
In the late 1800s, the county experienced a period of growth and development. The Texas and Pacific Railway was built through the county in 1876, and the town of Sulphur Springs was established in 1879. The county also experienced a boom in the timber industry, and several sawmills were built in the area.
In the early 1900s, the county experienced a period of economic growth. The discovery of oil in the area in the 1920s led to an increase in population and economic activity. The county also experienced a boom in the poultry industry, and several poultry processing plants were built in the area.
Geography
Hopkins County is located in the northeastern part of Texas, and is part of the Texoma region. It is bordered by Delta, Franklin, Lamar, Rains, and Wood Counties. The county has a total area of 845 square miles, and is mostly flat with some rolling hills. The county is drained by the Sulphur River, which flows through the county from east to west.
The climate of Hopkins County is generally warm and humid. The average temperature in the summer is around 90 degrees Fahrenheit, and the average temperature in the winter is around 50 degrees Fahrenheit. The average annual precipitation is around 40 inches.
Economy
The economy of Hopkins County is largely based on agriculture and manufacturing. The county is home to several poultry processing plants, as well as a number of other food processing plants. The county also has a large timber industry, and several sawmills are located in the area.
The county is also home to several oil and gas production companies, as well as several chemical plants. The county is also home to several retail stores, as well as a number of other businesses.
Demographics
As of the 2010 census, the population of Hopkins County was 35,161. The population is mostly white (83.3%), with a small African American population (11.2%) and a small Hispanic population (4.3%). The median household income in the county is $41,945, and the median age is 38.7 years.
Conclusion
Hopkins County is located in the northeastern part of Texas, and is part of the Texoma region. The county has a long history, and has experienced periods of growth and development. The economy of the county is largely based on agriculture and manufacturing, and the county is home to several poultry processing plants, sawmills, oil and gas production companies, and chemical plants. The population of the county is mostly white, with a small African American and Hispanic population.
Common Questions
What is Per Capita Income in Hopkins County?
Per Capita income in Hopkins County is $32,100.
What is the Median Family Income in Hopkins County?
Median Family Income in Hopkins County is $78,350.
What is the Median Household income in Hopkins County?
Median Household Income in Hopkins County is $63,766.
What is Income or Wage Gap in Hopkins County?
Income or Wage Gap in Hopkins County is 30.8%.
Women in Hopkins County earn 69.2 cents for every dollar earned by a man.
What is Family Income Deficit in Hopkins County?
Family Income Deficit in Hopkins County is $10,070.
Families that are below poverty line in Hopkins County earn $10,070 less on average than the poverty threshold level.
What is Inequality or Gini Index in Hopkins County?
Inequality or Gini Index in Hopkins County is 0.46.
What is the Total Population of Hopkins County?
Total Population of Hopkins County is 37,008.
What is the Total Male Population of Hopkins County?
Total Male Population of Hopkins County is 18,359.
What is the Total Female Population of Hopkins County?
Total Female Population of Hopkins County is 18,649.
What is the Ratio of Males per 100 Females in Hopkins County?
There are 98.44 Males per 100 Females in Hopkins County.
What is the Ratio of Females per 100 Males in Hopkins County?
There are 101.58 Females per 100 Males in Hopkins County.
What is the Median Population Age in Hopkins County?
Median Population Age in Hopkins County is 39.7 Years.
What is the Average Family Size in Hopkins County
Average Family Size in Hopkins County is 3.2 People.
What is the Average Household Size in Hopkins County
Average Household Size in Hopkins County is 2.6 People.
How Large is the Labor Force in Hopkins County?
There are 17,989 People in the Labor Forcein in Hopkins County.
What is the Percentage of People in the Labor Force in Hopkins County?
62.0% of People are in the Labor Force in Hopkins County.
What is the Unemployment Rate in Hopkins County?
Unemployment Rate in Hopkins County is 4.8%.