Hill County, TX Map & Demographics
Hill County Map
Hill County Overview
$30,730
PER CAPITA INCOME
$73,509
AVG FAMILY INCOME
$60,669
AVG HOUSEHOLD INCOME
40.3%
WAGE / INCOME GAP [ % ]
59.7¢/ $1
WAGE / INCOME GAP [ $ ]
$8,978
FAMILY INCOME DEFICIT
0.44
INEQUALITY / GINI INDEX
36,138
TOTAL POPULATION
18,161
MALE POPULATION
17,977
FEMALE POPULATION
101.02
MALES / 100 FEMALES
98.99
FEMALES / 100 MALES
41.2
MEDIAN AGE
3.2
AVG FAMILY SIZE
2.6
AVG HOUSEHOLD SIZE
16,595
LABOR FORCE [ PEOPLE ]
57.7%
PERCENT IN LABOR FORCE
4.5%
UNEMPLOYMENT RATE
Hill County Area Codes
Income in Hill County
Income Overview in Hill County
Per Capita Income in Hill County is $30,730, while median incomes of families and households are $73,509 and $60,669 respectively.
| Characteristic | Number | Measure |
| Per Capita Income | 36,138 | $30,730 |
| Median Family Income | 9,061 | $73,509 |
| Mean Family Income | 9,061 | $92,517 |
| Median Household Income | 13,390 | $60,669 |
| Mean Household Income | 13,390 | $78,273 |
| Income Deficit | 9,061 | $8,978 |
| Wage / Income Gap (%) | 36,138 | 40.26% |
| Wage / Income Gap ($) | 36,138 | 59.74¢ per $1 |
| Gini / Inequality Index | 36,138 | 0.44 |
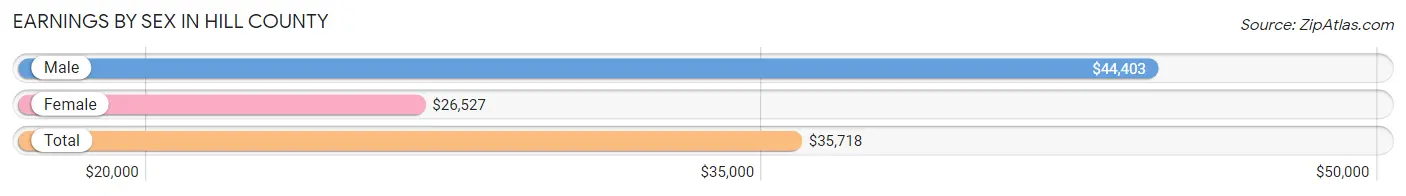
Earnings by Sex in Hill County
Average Earnings in Hill County are $35,718, $44,403 for men and $26,527 for women, a difference of 40.3%.
| Sex | Number | Average Earnings |
| Male | 9,672 (55.6%) | $44,403 |
| Female | 7,732 (44.4%) | $26,527 |
| Total | 17,404 (100.0%) | $35,718 |
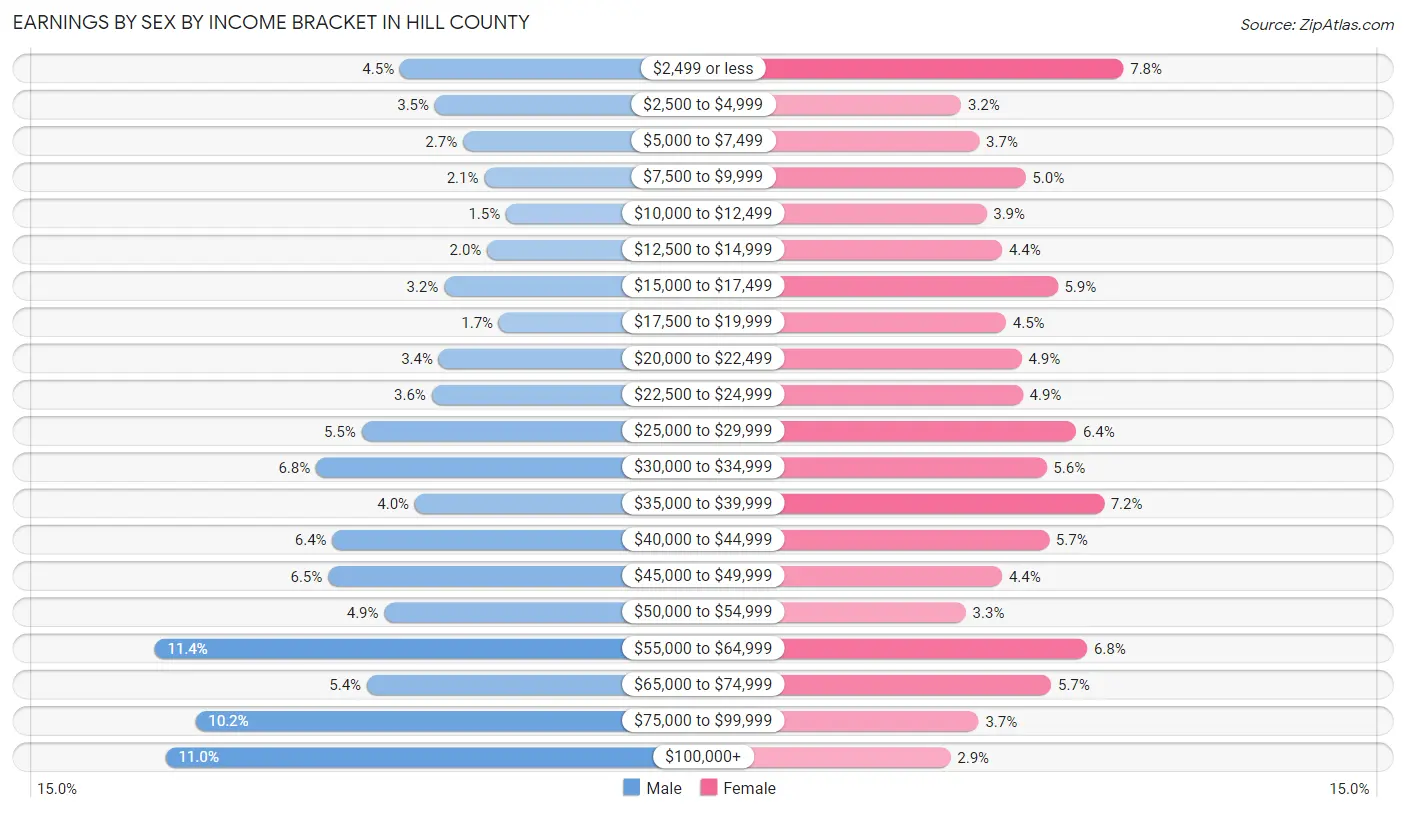
Earnings by Sex by Income Bracket in Hill County
The most common earnings brackets in Hill County are $55,000 to $64,999 for men (1,098 | 11.4%) and $2,499 or less for women (601 | 7.8%).
| Income | Male | Female |
| $2,499 or less | 430 (4.4%) | 601 (7.8%) |
| $2,500 to $4,999 | 336 (3.5%) | 248 (3.2%) |
| $5,000 to $7,499 | 259 (2.7%) | 288 (3.7%) |
| $7,500 to $9,999 | 201 (2.1%) | 388 (5.0%) |
| $10,000 to $12,499 | 142 (1.5%) | 303 (3.9%) |
| $12,500 to $14,999 | 193 (2.0%) | 337 (4.4%) |
| $15,000 to $17,499 | 310 (3.2%) | 458 (5.9%) |
| $17,500 to $19,999 | 162 (1.7%) | 346 (4.5%) |
| $20,000 to $22,499 | 325 (3.4%) | 380 (4.9%) |
| $22,500 to $24,999 | 344 (3.6%) | 382 (4.9%) |
| $25,000 to $29,999 | 535 (5.5%) | 498 (6.4%) |
| $30,000 to $34,999 | 659 (6.8%) | 434 (5.6%) |
| $35,000 to $39,999 | 390 (4.0%) | 558 (7.2%) |
| $40,000 to $44,999 | 614 (6.4%) | 439 (5.7%) |
| $45,000 to $49,999 | 626 (6.5%) | 337 (4.4%) |
| $50,000 to $54,999 | 473 (4.9%) | 258 (3.3%) |
| $55,000 to $64,999 | 1,098 (11.4%) | 522 (6.8%) |
| $65,000 to $74,999 | 520 (5.4%) | 444 (5.7%) |
| $75,000 to $99,999 | 987 (10.2%) | 286 (3.7%) |
| $100,000+ | 1,068 (11.0%) | 225 (2.9%) |
| Total | 9,672 (100.0%) | 7,732 (100.0%) |
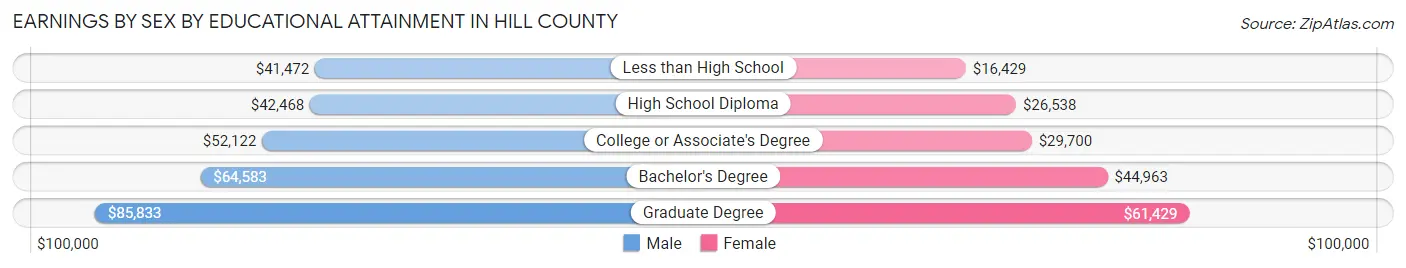
Earnings by Sex by Educational Attainment in Hill County
Average earnings in Hill County are $47,351 for men and $30,064 for women, a difference of 36.5%. Men with an educational attainment of graduate degree enjoy the highest average annual earnings of $85,833, while those with less than high school education earn the least with $41,472. Women with an educational attainment of graduate degree earn the most with the average annual earnings of $61,429, while those with less than high school education have the smallest earnings of $16,429.
| Educational Attainment | Male Income | Female Income |
| Less than High School | $41,472 | $16,429 |
| High School Diploma | $42,468 | $26,538 |
| College or Associate's Degree | $52,122 | $29,700 |
| Bachelor's Degree | $64,583 | $44,963 |
| Graduate Degree | $85,833 | $61,429 |
| Total | $47,351 | $30,064 |
Family Income in Hill County
Family Income Brackets in Hill County
According to the Hill County family income data, there are 1,848 families falling into the $50,000 to $74,999 income range, which is the most common income bracket and makes up 20.4% of all families. Conversely, the $10,000 to $14,999 income bracket is the least frequent group with only 172 families (1.9%) belonging to this category.
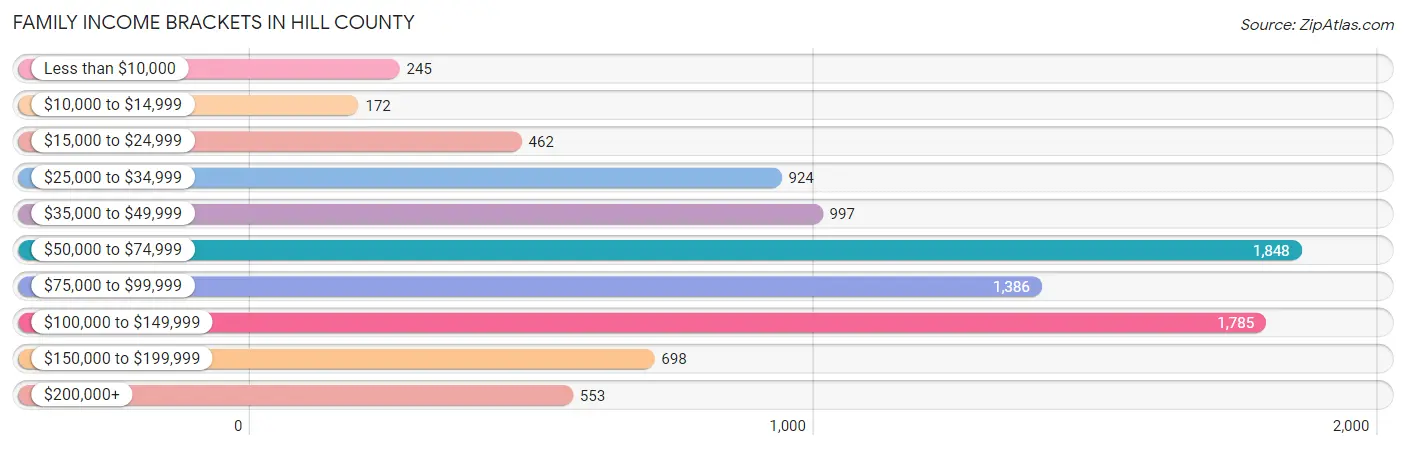
| Income Bracket | # Families | % Families |
| Less than $10,000 | 245 | 2.7% |
| $10,000 to $14,999 | 172 | 1.9% |
| $15,000 to $24,999 | 462 | 5.1% |
| $25,000 to $34,999 | 924 | 10.2% |
| $35,000 to $49,999 | 997 | 11.0% |
| $50,000 to $74,999 | 1,848 | 20.4% |
| $75,000 to $99,999 | 1,386 | 15.3% |
| $100,000 to $149,999 | 1,785 | 19.7% |
| $150,000 to $199,999 | 698 | 7.7% |
| $200,000+ | 553 | 6.1% |
Family Income by Famaliy Size in Hill County
7+ person families (171 | 1.9%) account for the highest median family income in Hill County with $102,750 per family, while 2-person families (4,388 | 48.4%) have the highest median income of $34,337 per family member.
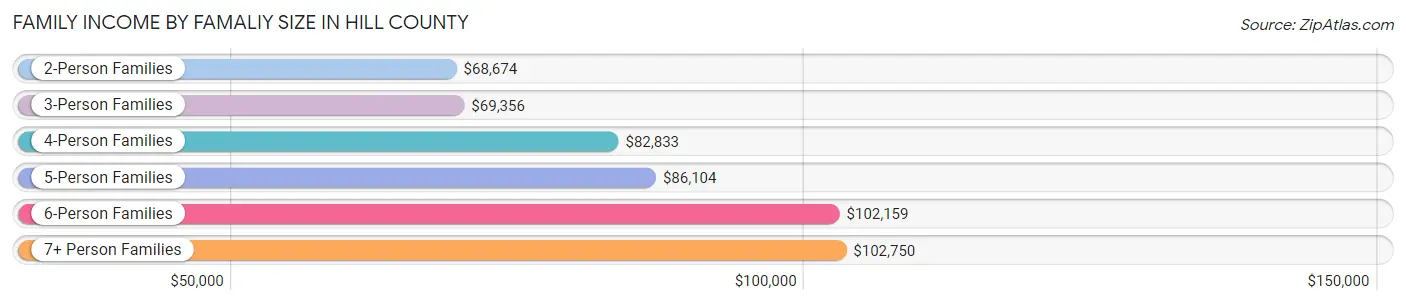
| Income Bracket | # Families | Median Income |
| 2-Person Families | 4,388 (48.4%) | $68,674 |
| 3-Person Families | 1,976 (21.8%) | $69,356 |
| 4-Person Families | 1,270 (14.0%) | $82,833 |
| 5-Person Families | 959 (10.6%) | $86,104 |
| 6-Person Families | 297 (3.3%) | $102,159 |
| 7+ Person Families | 171 (1.9%) | $102,750 |
| Total | 9,061 (100.0%) | $73,509 |
Family Income by Number of Earners in Hill County
The median family income in Hill County is $73,509, with families comprising 3+ earners (1,009) having the highest median family income of $130,026, while families with no earners (1,666) have the lowest median family income of $43,682, accounting for 11.1% and 18.4% of families, respectively.
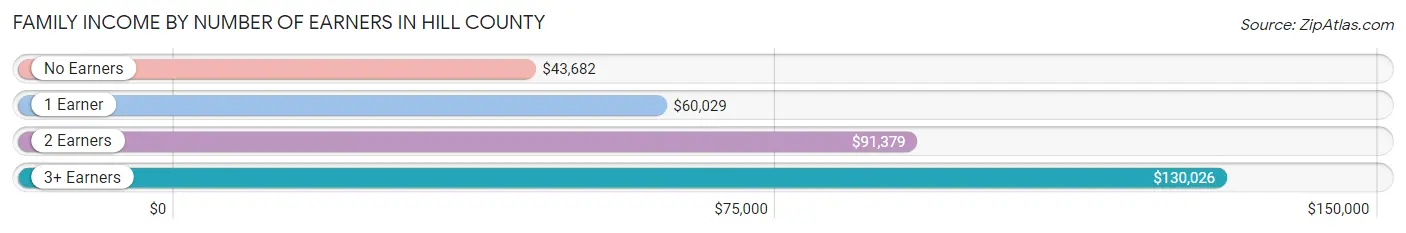
| Number of Earners | # Families | Median Income |
| No Earners | 1,666 (18.4%) | $43,682 |
| 1 Earner | 2,975 (32.8%) | $60,029 |
| 2 Earners | 3,411 (37.6%) | $91,379 |
| 3+ Earners | 1,009 (11.1%) | $130,026 |
| Total | 9,061 (100.0%) | $73,509 |
Household Income in Hill County
Household Income Brackets in Hill County
With 2,491 households falling in the category, the $50,000 to $74,999 income range is the most frequent in Hill County, accounting for 18.6% of all households. In contrast, only 522 households (3.9%) fall into the $10,000 to $14,999 income bracket, making it the least populous group.
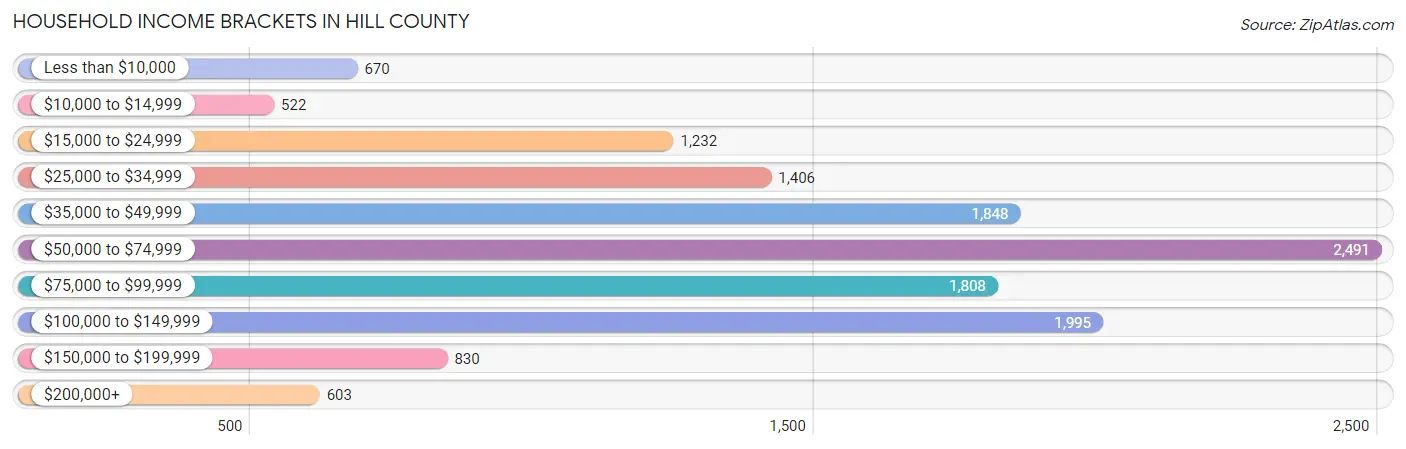
| Income Bracket | # Households | % Households |
| Less than $10,000 | 670 | 5.0% |
| $10,000 to $14,999 | 522 | 3.9% |
| $15,000 to $24,999 | 1,232 | 9.2% |
| $25,000 to $34,999 | 1,406 | 10.5% |
| $35,000 to $49,999 | 1,848 | 13.8% |
| $50,000 to $74,999 | 2,491 | 18.6% |
| $75,000 to $99,999 | 1,808 | 13.5% |
| $100,000 to $149,999 | 1,995 | 14.9% |
| $150,000 to $199,999 | 830 | 6.2% |
| $200,000+ | 603 | 4.5% |
Household Income by Householder Age in Hill County
The median household income in Hill County is $60,669, with the highest median household income of $73,982 found in the 45 to 64 years age bracket for the primary householder. A total of 4,833 households (36.1%) fall into this category. Meanwhile, the 65+ years age bracket for the primary householder has the lowest median household income of $45,562, with 4,778 households (35.7%) in this group.
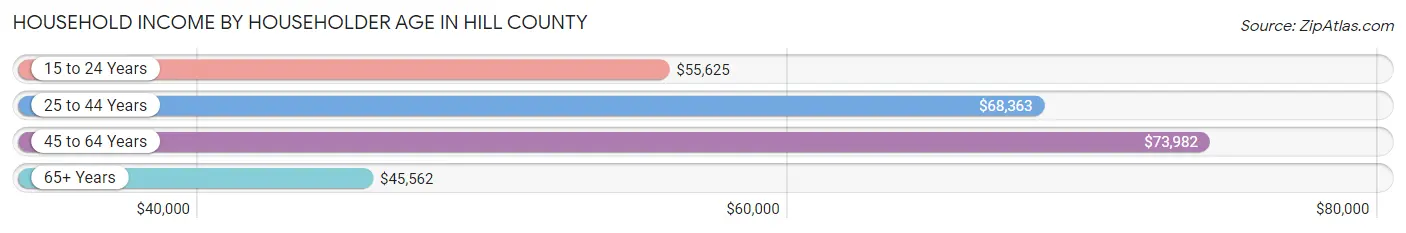
| Income Bracket | # Households | Median Income |
| 15 to 24 Years | 421 (3.1%) | $55,625 |
| 25 to 44 Years | 3,358 (25.1%) | $68,363 |
| 45 to 64 Years | 4,833 (36.1%) | $73,982 |
| 65+ Years | 4,778 (35.7%) | $45,562 |
| Total | 13,390 (100.0%) | $60,669 |
Poverty in Hill County
Income Below Poverty by Sex and Age in Hill County
With 10.9% poverty level for males and 15.8% for females among the residents of Hill County, 5 year old males and 12 to 14 year old females are the most vulnerable to poverty, with 98 males (31.5%) and 270 females (36.6%) in their respective age groups living below the poverty level.
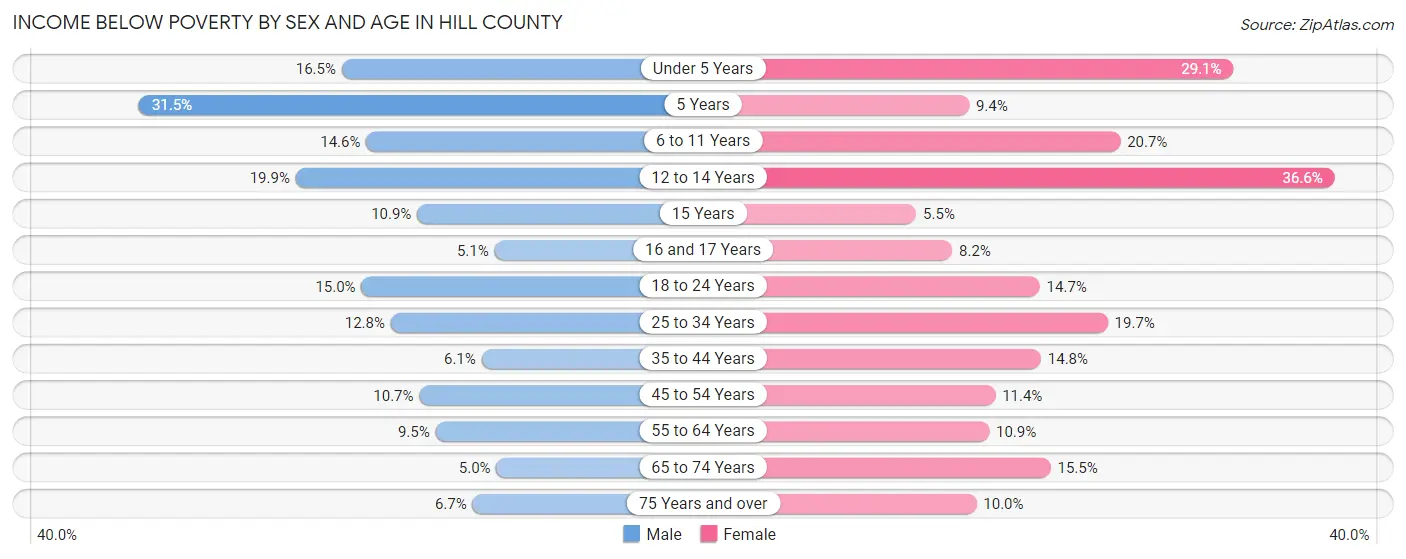
| Age Bracket | Male | Female |
| Under 5 Years | 175 (16.5%) | 286 (29.1%) |
| 5 Years | 98 (31.5%) | 22 (9.4%) |
| 6 to 11 Years | 172 (14.6%) | 267 (20.7%) |
| 12 to 14 Years | 183 (19.9%) | 270 (36.6%) |
| 15 Years | 23 (10.8%) | 18 (5.5%) |
| 16 and 17 Years | 28 (5.1%) | 33 (8.2%) |
| 18 to 24 Years | 213 (15.0%) | 182 (14.7%) |
| 25 to 34 Years | 251 (12.8%) | 376 (19.7%) |
| 35 to 44 Years | 123 (6.1%) | 301 (14.8%) |
| 45 to 54 Years | 229 (10.7%) | 240 (11.4%) |
| 55 to 64 Years | 236 (9.5%) | 278 (10.9%) |
| 65 to 74 Years | 104 (5.0%) | 335 (15.5%) |
| 75 Years and over | 90 (6.7%) | 148 (10.0%) |
| Total | 1,925 (10.9%) | 2,756 (15.8%) |
Income Above Poverty by Sex and Age in Hill County
According to the poverty statistics in Hill County, males aged 65 to 74 years and females aged 15 years are the age groups that are most secure financially, with 95.0% of males and 94.5% of females in these age groups living above the poverty line.
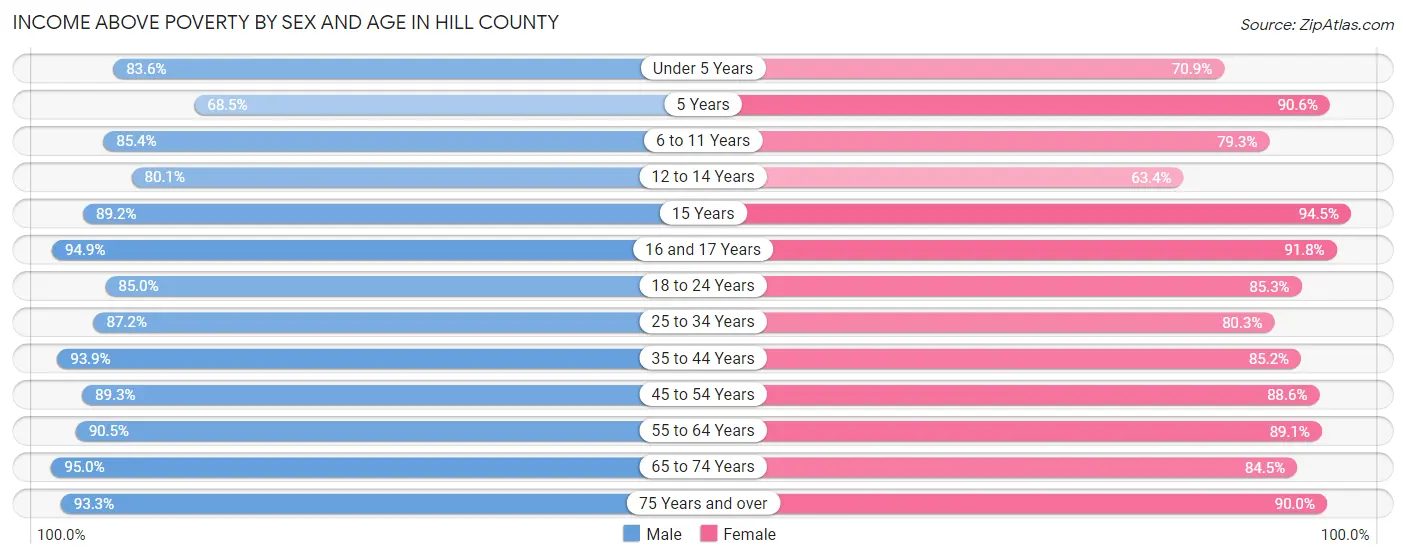
| Age Bracket | Male | Female |
| Under 5 Years | 889 (83.6%) | 698 (70.9%) |
| 5 Years | 213 (68.5%) | 211 (90.6%) |
| 6 to 11 Years | 1,004 (85.4%) | 1,025 (79.3%) |
| 12 to 14 Years | 738 (80.1%) | 468 (63.4%) |
| 15 Years | 189 (89.1%) | 308 (94.5%) |
| 16 and 17 Years | 520 (94.9%) | 370 (91.8%) |
| 18 to 24 Years | 1,208 (85.0%) | 1,057 (85.3%) |
| 25 to 34 Years | 1,708 (87.2%) | 1,529 (80.3%) |
| 35 to 44 Years | 1,904 (93.9%) | 1,736 (85.2%) |
| 45 to 54 Years | 1,913 (89.3%) | 1,868 (88.6%) |
| 55 to 64 Years | 2,251 (90.5%) | 2,265 (89.1%) |
| 65 to 74 Years | 1,987 (95.0%) | 1,826 (84.5%) |
| 75 Years and over | 1,246 (93.3%) | 1,333 (90.0%) |
| Total | 15,770 (89.1%) | 14,694 (84.2%) |
Income Below Poverty Among Married-Couple Families in Hill County
The poverty statistics for married-couple families in Hill County show that 6.0% or 411 of the total 6,848 families live below the poverty line. Families with 3 or 4 children have the highest poverty rate of 25.8%, comprising of 165 families. On the other hand, families with no children have the lowest poverty rate of 3.5%, which includes 144 families.
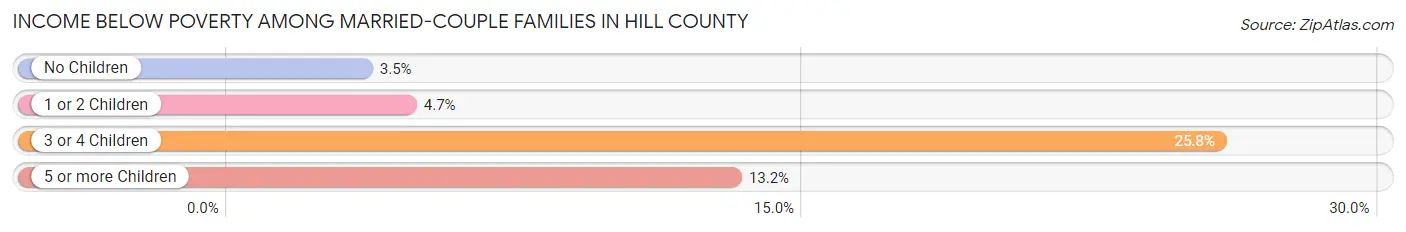
| Children | Above Poverty | Below Poverty |
| No Children | 3,948 (96.5%) | 144 (3.5%) |
| 1 or 2 Children | 1,982 (95.3%) | 97 (4.7%) |
| 3 or 4 Children | 474 (74.2%) | 165 (25.8%) |
| 5 or more Children | 33 (86.8%) | 5 (13.2%) |
| Total | 6,437 (94.0%) | 411 (6.0%) |
Income Below Poverty Among Single-Parent Households in Hill County
According to the poverty data in Hill County, 10.8% or 78 single-father households and 31.0% or 462 single-mother households are living below the poverty line. Among single-father households, those with 1 or 2 children have the highest poverty rate, with 44 households (17.1%) experiencing poverty. Likewise, among single-mother households, those with 3 or 4 children have the highest poverty rate, with 124 households (66.3%) falling below the poverty line.
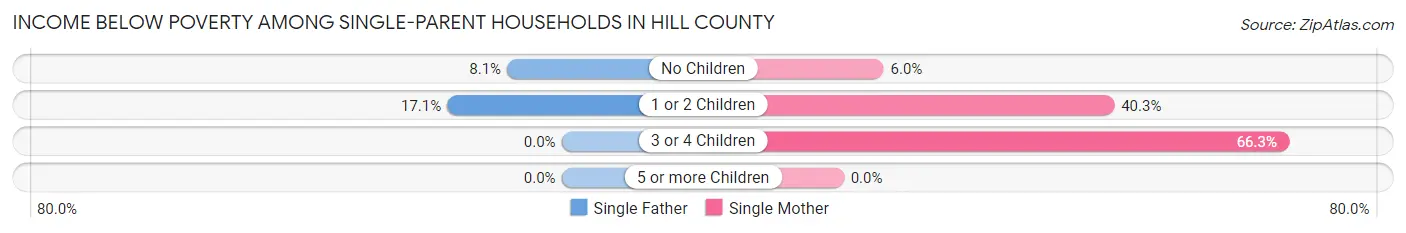
| Children | Single Father | Single Mother |
| No Children | 34 (8.1%) | 32 (5.9%) |
| 1 or 2 Children | 44 (17.1%) | 306 (40.3%) |
| 3 or 4 Children | 0 (0.0%) | 124 (66.3%) |
| 5 or more Children | 0 (0.0%) | 0 (0.0%) |
| Total | 78 (10.8%) | 462 (31.0%) |
Income Below Poverty Among Married-Couple vs Single-Parent Households in Hill County
The poverty data for Hill County shows that 411 of the married-couple family households (6.0%) and 540 of the single-parent households (24.4%) are living below the poverty level. Within the married-couple family households, those with 3 or 4 children have the highest poverty rate, with 165 households (25.8%) falling below the poverty line. Among the single-parent households, those with 3 or 4 children have the highest poverty rate, with 124 household (54.6%) living below poverty.
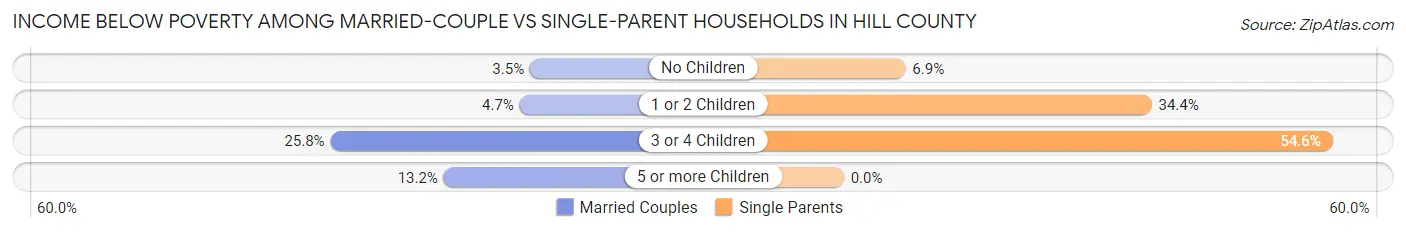
| Children | Married-Couple Families | Single-Parent Households |
| No Children | 144 (3.5%) | 66 (6.9%) |
| 1 or 2 Children | 97 (4.7%) | 350 (34.4%) |
| 3 or 4 Children | 165 (25.8%) | 124 (54.6%) |
| 5 or more Children | 5 (13.2%) | 0 (0.0%) |
| Total | 411 (6.0%) | 540 (24.4%) |
Race in Hill County
The most populous races in Hill County are White / Caucasian (28,841 | 79.8%), Hispanic or Latino (7,910 | 21.9%), and Some other Race (2,494 | 6.9%).
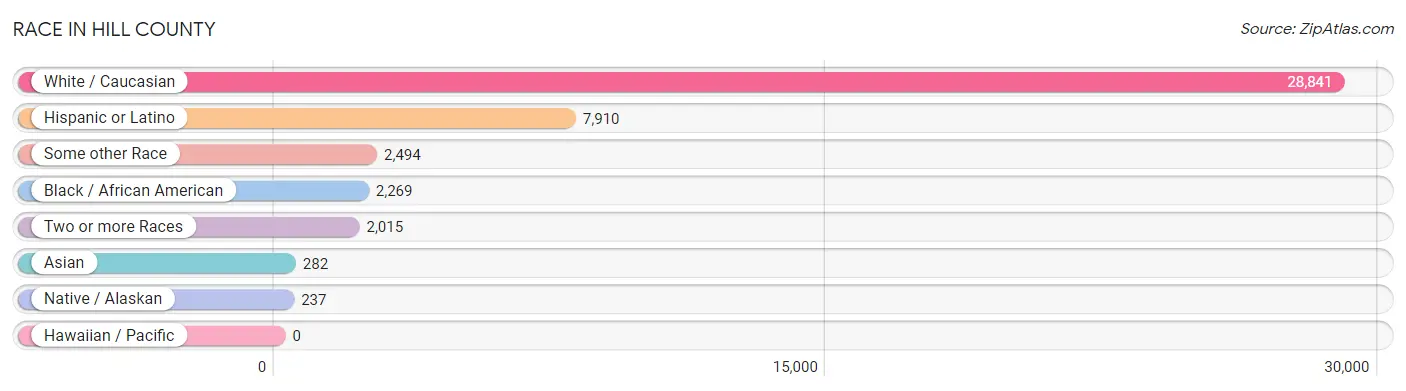
| Race | # Population | % Population |
| Asian | 282 | 0.8% |
| Black / African American | 2,269 | 6.3% |
| Hawaiian / Pacific | 0 | 0.0% |
| Hispanic or Latino | 7,910 | 21.9% |
| Native / Alaskan | 237 | 0.7% |
| White / Caucasian | 28,841 | 79.8% |
| Two or more Races | 2,015 | 5.6% |
| Some other Race | 2,494 | 6.9% |
| Total | 36,138 | 100.0% |
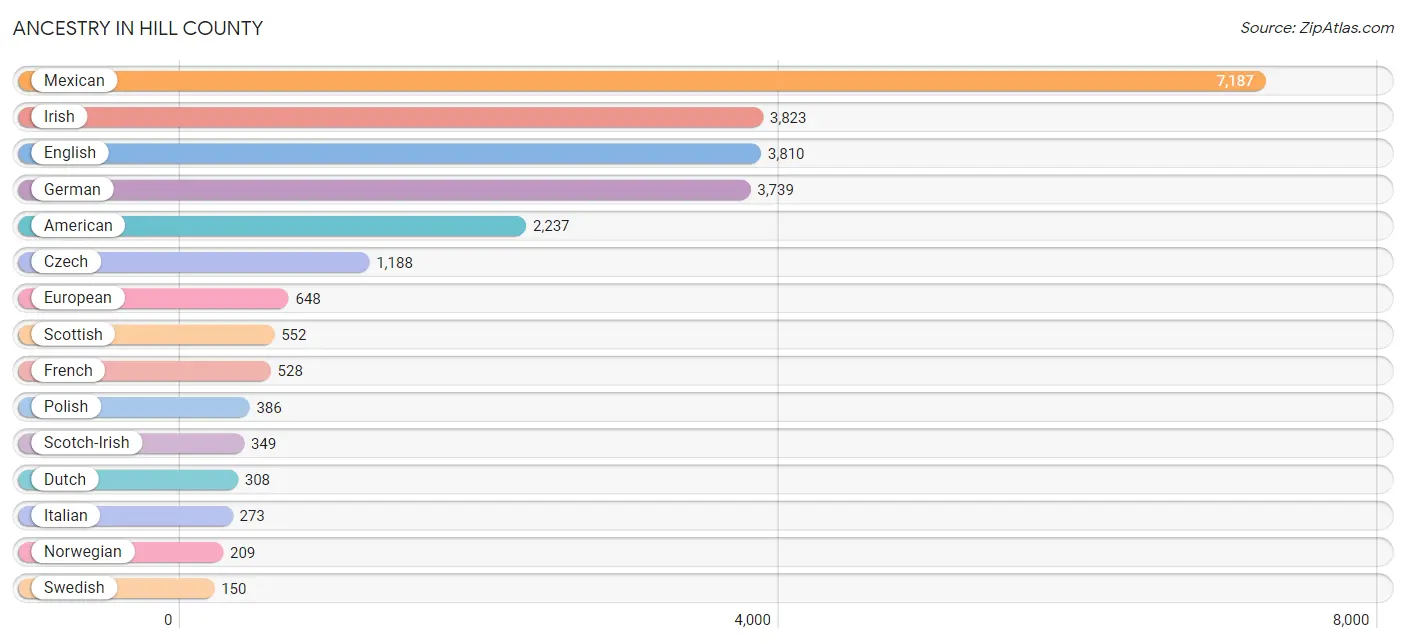
Ancestry in Hill County
The most populous ancestries reported in Hill County are Mexican (7,187 | 19.9%), Irish (3,823 | 10.6%), English (3,810 | 10.5%), German (3,739 | 10.3%), and American (2,237 | 6.2%), together accounting for 57.5% of all Hill County residents.
| Ancestry | # Population | % Population |
| African | 34 | 0.1% |
| American | 2,237 | 6.2% |
| Apache | 66 | 0.2% |
| Arab | 24 | 0.1% |
| Armenian | 9 | 0.0% |
| Austrian | 6 | 0.0% |
| Belgian | 28 | 0.1% |
| Belizean | 28 | 0.1% |
| Bhutanese | 5 | 0.0% |
| Blackfeet | 7 | 0.0% |
| British | 50 | 0.1% |
| Burmese | 93 | 0.3% |
| Cajun | 31 | 0.1% |
| Canadian | 2 | 0.0% |
| Central American | 110 | 0.3% |
| Central American Indian | 41 | 0.1% |
| Cherokee | 137 | 0.4% |
| Chickasaw | 36 | 0.1% |
| Choctaw | 69 | 0.2% |
| Colombian | 2 | 0.0% |
| Comanche | 25 | 0.1% |
| Costa Rican | 29 | 0.1% |
| Creek | 8 | 0.0% |
| Croatian | 1 | 0.0% |
| Cuban | 40 | 0.1% |
| Czech | 1,188 | 3.3% |
| Czechoslovakian | 129 | 0.4% |
| Danish | 84 | 0.2% |
| Dutch | 308 | 0.9% |
| Dutch West Indian | 12 | 0.0% |
| Eastern European | 22 | 0.1% |
| English | 3,810 | 10.5% |
| European | 648 | 1.8% |
| Finnish | 4 | 0.0% |
| French | 528 | 1.5% |
| French Canadian | 7 | 0.0% |
| German | 3,739 | 10.3% |
| German Russian | 26 | 0.1% |
| Ghanaian | 3 | 0.0% |
| Greek | 12 | 0.0% |
| Honduran | 24 | 0.1% |
| Hungarian | 27 | 0.1% |
| Indian (Asian) | 103 | 0.3% |
| Iranian | 6 | 0.0% |
| Irish | 3,823 | 10.6% |
| Iroquois | 16 | 0.0% |
| Italian | 273 | 0.8% |
| Jamaican | 4 | 0.0% |
| Korean | 68 | 0.2% |
| Lebanese | 11 | 0.0% |
| Lithuanian | 17 | 0.1% |
| Lumbee | 6 | 0.0% |
| Maltese | 3 | 0.0% |
| Mexican | 7,187 | 19.9% |
| Mexican American Indian | 2 | 0.0% |
| Navajo | 4 | 0.0% |
| Northern European | 14 | 0.0% |
| Norwegian | 209 | 0.6% |
| Osage | 15 | 0.0% |
| Pakistani | 9 | 0.0% |
| Panamanian | 3 | 0.0% |
| Pennsylvania German | 4 | 0.0% |
| Polish | 386 | 1.1% |
| Portuguese | 34 | 0.1% |
| Potawatomi | 2 | 0.0% |
| Pueblo | 39 | 0.1% |
| Puerto Rican | 134 | 0.4% |
| Russian | 103 | 0.3% |
| Salvadoran | 54 | 0.2% |
| Samoan | 6 | 0.0% |
| Scandinavian | 141 | 0.4% |
| Scotch-Irish | 349 | 1.0% |
| Scottish | 552 | 1.5% |
| Seminole | 20 | 0.1% |
| Sioux | 21 | 0.1% |
| South American | 2 | 0.0% |
| Spaniard | 63 | 0.2% |
| Spanish | 50 | 0.1% |
| Sri Lankan | 81 | 0.2% |
| Subsaharan African | 37 | 0.1% |
| Swedish | 150 | 0.4% |
| Swiss | 73 | 0.2% |
| Syrian | 7 | 0.0% |
| Thai | 4 | 0.0% |
| Trinidadian and Tobagonian | 4 | 0.0% |
| Turkish | 2 | 0.0% |
| Ukrainian | 12 | 0.0% |
| Ute | 2 | 0.0% |
| Welsh | 112 | 0.3% |
| West Indian | 5 | 0.0% | View All 90 Rows |
Immigrants in Hill County
The most numerous immigrant groups reported in Hill County came from Latin America (1,970 | 5.4%), Central America (1,946 | 5.4%), Mexico (1,916 | 5.3%), Asia (187 | 0.5%), and Europe (85 | 0.2%), together accounting for 16.9% of all Hill County residents.
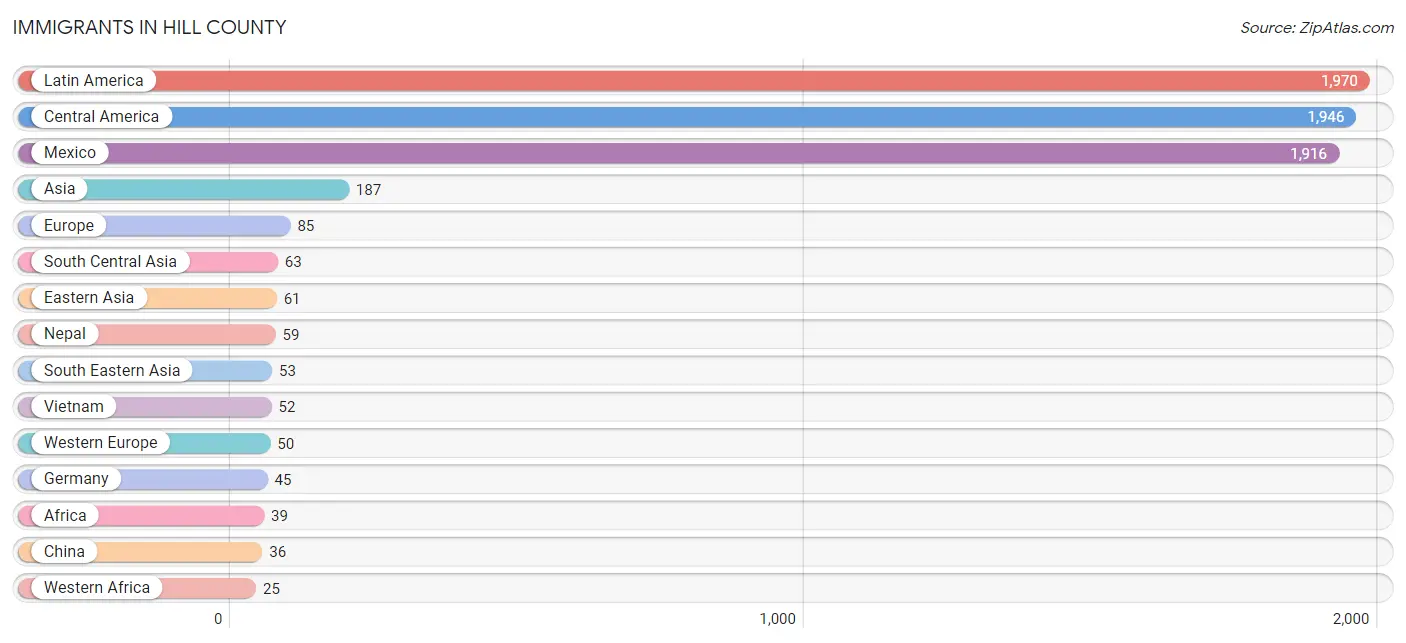
| Immigration Origin | # Population | % Population |
| Africa | 39 | 0.1% |
| Asia | 187 | 0.5% |
| Australia | 14 | 0.0% |
| Canada | 4 | 0.0% |
| Caribbean | 22 | 0.1% |
| Central America | 1,946 | 5.4% |
| China | 36 | 0.1% |
| Colombia | 2 | 0.0% |
| Cuba | 14 | 0.0% |
| Eastern Asia | 61 | 0.2% |
| El Salvador | 16 | 0.0% |
| Europe | 85 | 0.2% |
| Germany | 45 | 0.1% |
| Guatemala | 3 | 0.0% |
| Honduras | 8 | 0.0% |
| India | 4 | 0.0% |
| Italy | 16 | 0.0% |
| Jamaica | 4 | 0.0% |
| Japan | 3 | 0.0% |
| Korea | 22 | 0.1% |
| Latin America | 1,970 | 5.4% |
| Lebanon | 4 | 0.0% |
| Mexico | 1,916 | 5.3% |
| Middle Africa | 6 | 0.0% |
| Nepal | 59 | 0.2% |
| Netherlands | 5 | 0.0% |
| Nigeria | 20 | 0.1% |
| Northern Africa | 6 | 0.0% |
| Northern Europe | 19 | 0.1% |
| Oceania | 14 | 0.0% |
| Panama | 3 | 0.0% |
| Philippines | 1 | 0.0% |
| South Africa | 2 | 0.0% |
| South America | 2 | 0.0% |
| South Central Asia | 63 | 0.2% |
| South Eastern Asia | 53 | 0.2% |
| Southern Europe | 16 | 0.0% |
| Trinidad and Tobago | 4 | 0.0% |
| Turkey | 2 | 0.0% |
| Vietnam | 52 | 0.1% |
| Western Africa | 25 | 0.1% |
| Western Asia | 10 | 0.0% |
| Western Europe | 50 | 0.1% |
| Zaire | 6 | 0.0% | View All 44 Rows |
Sex and Age in Hill County
Sex and Age in Hill County
The most populous age groups in Hill County are 10 to 14 Years (1,392 | 7.7%) for men and 60 to 64 Years (1,291 | 7.2%) for women.
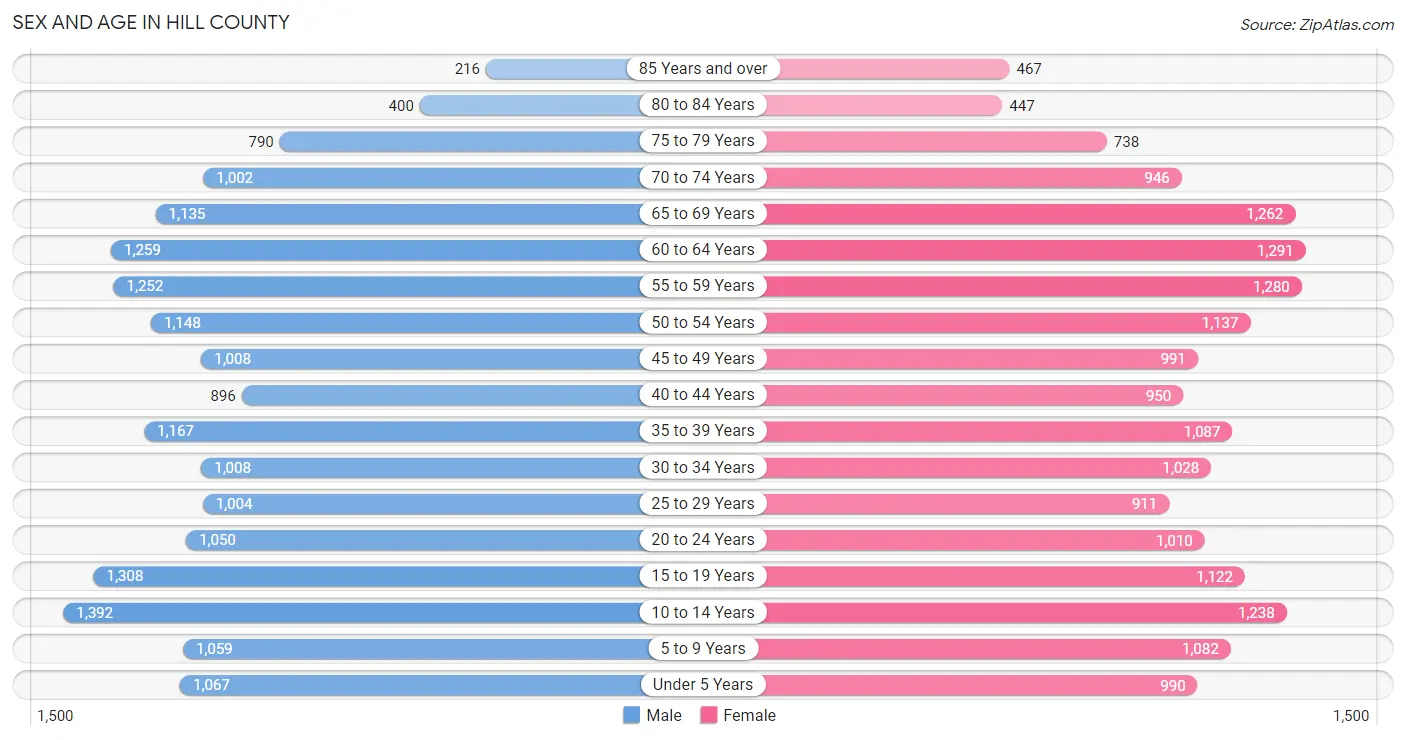
| Age Bracket | Male | Female |
| Under 5 Years | 1,067 (5.9%) | 990 (5.5%) |
| 5 to 9 Years | 1,059 (5.8%) | 1,082 (6.0%) |
| 10 to 14 Years | 1,392 (7.7%) | 1,238 (6.9%) |
| 15 to 19 Years | 1,308 (7.2%) | 1,122 (6.2%) |
| 20 to 24 Years | 1,050 (5.8%) | 1,010 (5.6%) |
| 25 to 29 Years | 1,004 (5.5%) | 911 (5.1%) |
| 30 to 34 Years | 1,008 (5.6%) | 1,028 (5.7%) |
| 35 to 39 Years | 1,167 (6.4%) | 1,087 (6.0%) |
| 40 to 44 Years | 896 (4.9%) | 950 (5.3%) |
| 45 to 49 Years | 1,008 (5.6%) | 991 (5.5%) |
| 50 to 54 Years | 1,148 (6.3%) | 1,137 (6.3%) |
| 55 to 59 Years | 1,252 (6.9%) | 1,280 (7.1%) |
| 60 to 64 Years | 1,259 (6.9%) | 1,291 (7.2%) |
| 65 to 69 Years | 1,135 (6.2%) | 1,262 (7.0%) |
| 70 to 74 Years | 1,002 (5.5%) | 946 (5.3%) |
| 75 to 79 Years | 790 (4.3%) | 738 (4.1%) |
| 80 to 84 Years | 400 (2.2%) | 447 (2.5%) |
| 85 Years and over | 216 (1.2%) | 467 (2.6%) |
| Total | 18,161 (100.0%) | 17,977 (100.0%) |
Families and Households in Hill County
Median Family Size in Hill County
The median family size in Hill County is 3.25 persons per family, with married-couple families (6,848 | 75.6%) accounting for the largest median family size of 3.31 persons per family. On the other hand, single male/father families (722 | 8.0%) represent the smallest median family size with 2.74 persons per family.
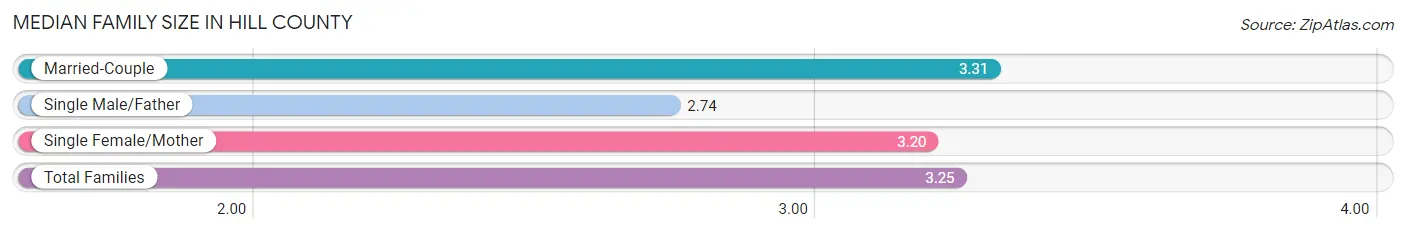
| Family Type | # Families | Family Size |
| Married-Couple | 6,848 (75.6%) | 3.31 |
| Single Male/Father | 722 (8.0%) | 2.74 |
| Single Female/Mother | 1,491 (16.5%) | 3.20 |
| Total Families | 9,061 (100.0%) | 3.25 |
Median Household Size in Hill County
The median household size in Hill County is 2.63 persons per household, with single female/mother households (1,491 | 11.1%) accounting for the largest median household size of 3.42 persons per household. non-family households (4,329 | 32.3%) represent the smallest median household size with 1.13 persons per household.
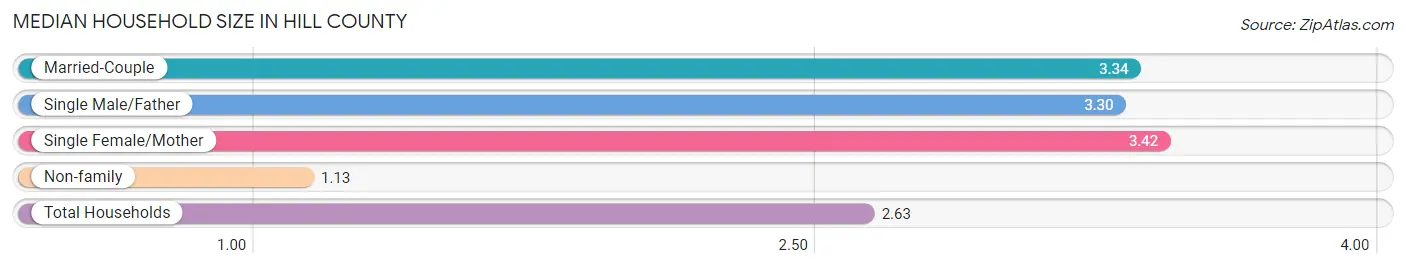
| Household Type | # Households | Household Size |
| Married-Couple | 6,848 (51.1%) | 3.34 |
| Single Male/Father | 722 (5.4%) | 3.30 |
| Single Female/Mother | 1,491 (11.1%) | 3.42 |
| Non-family | 4,329 (32.3%) | 1.13 |
| Total Households | 13,390 (100.0%) | 2.63 |
Household Size by Marriage Status in Hill County
Out of a total of 13,390 households in Hill County, 9,061 (67.7%) are family households, while 4,329 (32.3%) are nonfamily households. The most numerous type of family households are 2-person households, comprising 4,051, and the most common type of nonfamily households are 1-person households, comprising 3,913.
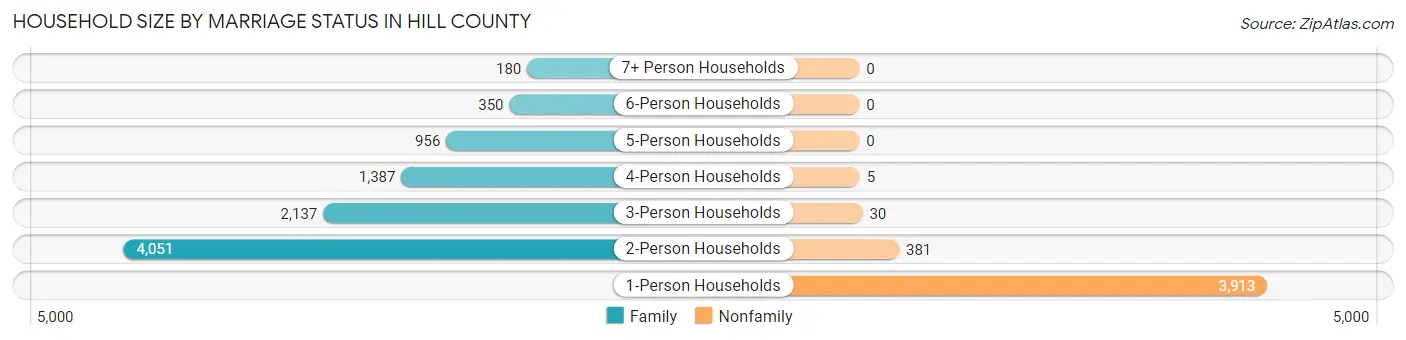
| Household Size | Family Households | Nonfamily Households |
| 1-Person Households | - | 3,913 (29.2%) |
| 2-Person Households | 4,051 (30.2%) | 381 (2.9%) |
| 3-Person Households | 2,137 (16.0%) | 30 (0.2%) |
| 4-Person Households | 1,387 (10.4%) | 5 (0.0%) |
| 5-Person Households | 956 (7.1%) | 0 (0.0%) |
| 6-Person Households | 350 (2.6%) | 0 (0.0%) |
| 7+ Person Households | 180 (1.3%) | 0 (0.0%) |
| Total | 9,061 (67.7%) | 4,329 (32.3%) |
Female Fertility in Hill County
Fertility by Age in Hill County
Average fertility rate in Hill County is 52.0 births per 1,000 women. Women in the age bracket of 20 to 34 years have the highest fertility rate with 107.0 births per 1,000 women. Women in the age bracket of 20 to 34 years acount for 83.6% of all women with births.
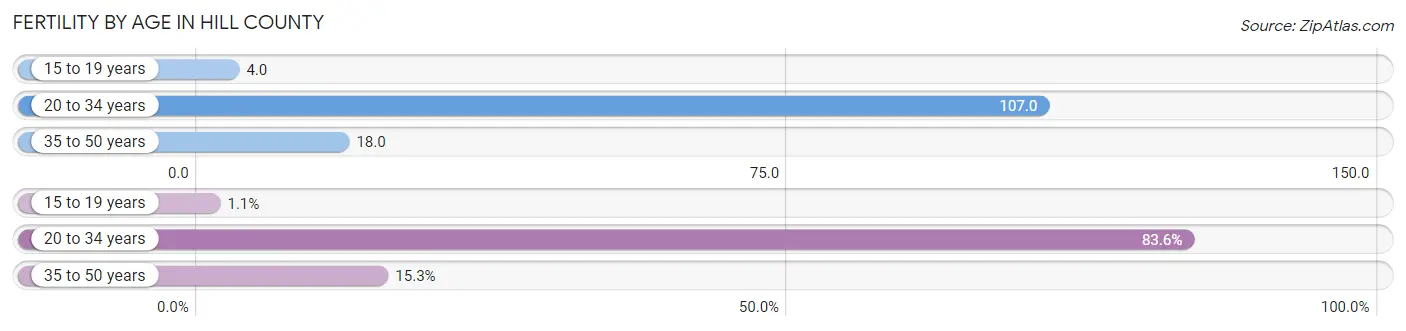
| Age Bracket | Women with Births | Births / 1,000 Women |
| 15 to 19 years | 4 (1.1%) | 4.0 |
| 20 to 34 years | 317 (83.6%) | 107.0 |
| 35 to 50 years | 58 (15.3%) | 18.0 |
| Total | 379 (100.0%) | 52.0 |
Fertility by Age by Marriage Status in Hill County
56.5% of women with births (379) in Hill County are married. The highest percentage of unmarried women with births falls into 15 to 19 years age bracket with 100.0% of them unmarried at the time of birth, while the lowest percentage of unmarried women with births belong to 35 to 50 years age bracket with 20.7% of them unmarried.
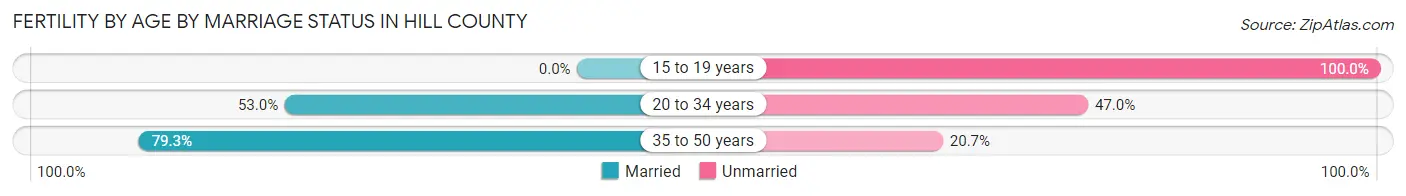
| Age Bracket | Married | Unmarried |
| 15 to 19 years | 0 (0.0%) | 4 (100.0%) |
| 20 to 34 years | 168 (53.0%) | 149 (47.0%) |
| 35 to 50 years | 46 (79.3%) | 12 (20.7%) |
| Total | 214 (56.5%) | 165 (43.5%) |
Fertility by Education in Hill County
Average fertility rate in Hill County is 52.0 births per 1,000 women. Women with the education attainment of college or associate's degree have the highest fertility rate of 85.0 births per 1,000 women, while women with the education attainment of less than high school have the lowest fertility at 13.0 births per 1,000 women. Women with the education attainment of college or associate's degree represent 56.7% of all women with births.
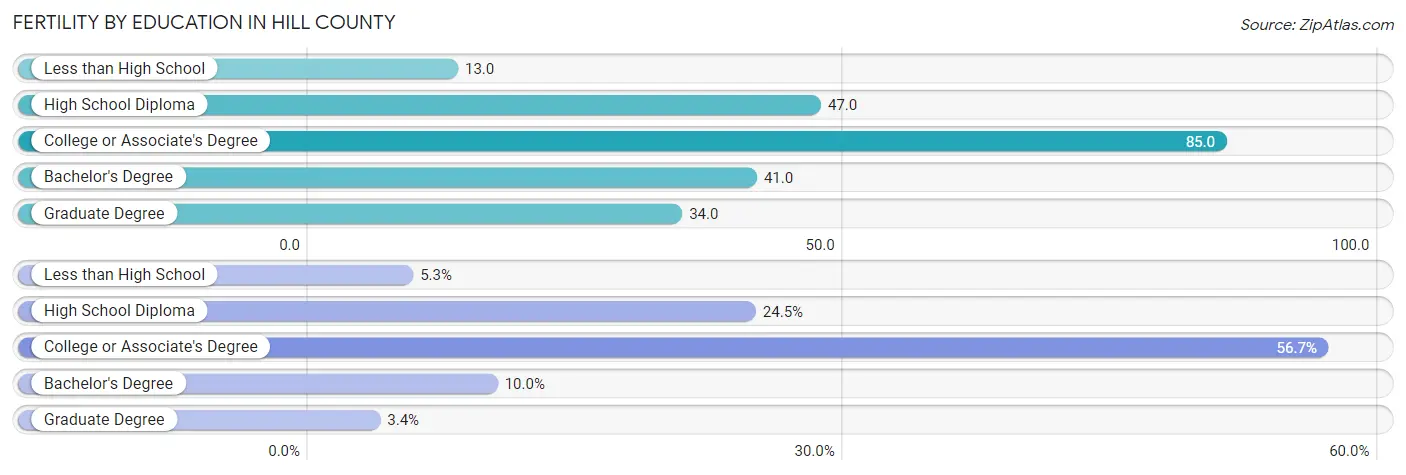
| Educational Attainment | Women with Births | Births / 1,000 Women |
| Less than High School | 20 (5.3%) | 13.0 |
| High School Diploma | 93 (24.5%) | 47.0 |
| College or Associate's Degree | 215 (56.7%) | 85.0 |
| Bachelor's Degree | 38 (10.0%) | 41.0 |
| Graduate Degree | 13 (3.4%) | 34.0 |
| Total | 379 (100.0%) | 52.0 |
Fertility by Education by Marriage Status in Hill County
43.5% of women with births in Hill County are unmarried. Women with the educational attainment of bachelor's degree are most likely to be married with 100.0% of them married at childbirth, while women with the educational attainment of less than high school are least likely to be married with 90.0% of them unmarried at childbirth.
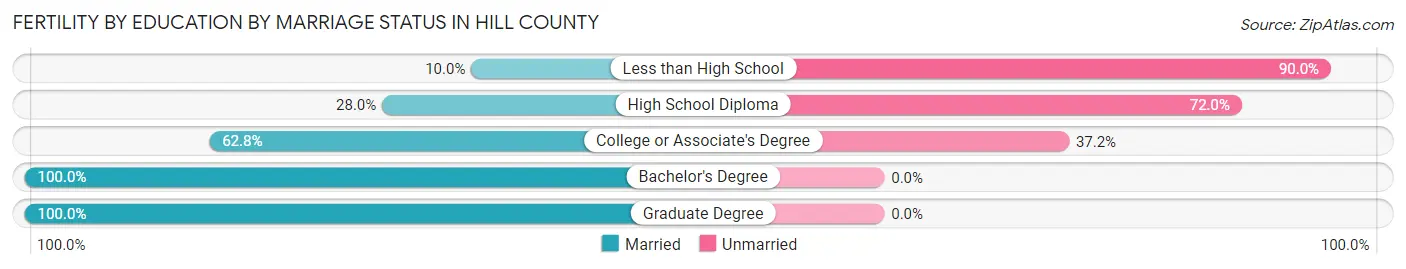
| Educational Attainment | Married | Unmarried |
| Less than High School | 2 (10.0%) | 18 (90.0%) |
| High School Diploma | 26 (28.0%) | 67 (72.0%) |
| College or Associate's Degree | 135 (62.8%) | 80 (37.2%) |
| Bachelor's Degree | 38 (100.0%) | 0 (0.0%) |
| Graduate Degree | 13 (100.0%) | 0 (0.0%) |
| Total | 214 (56.5%) | 165 (43.5%) |
Employment Characteristics in Hill County
Employment by Class of Employer in Hill County
Among the 15,366 employed individuals in Hill County, private company employees (10,495 | 68.3%), local government employees (1,456 | 9.5%), and self-employed (not incorporated) (1,360 | 8.8%) make up the most common classes of employment.
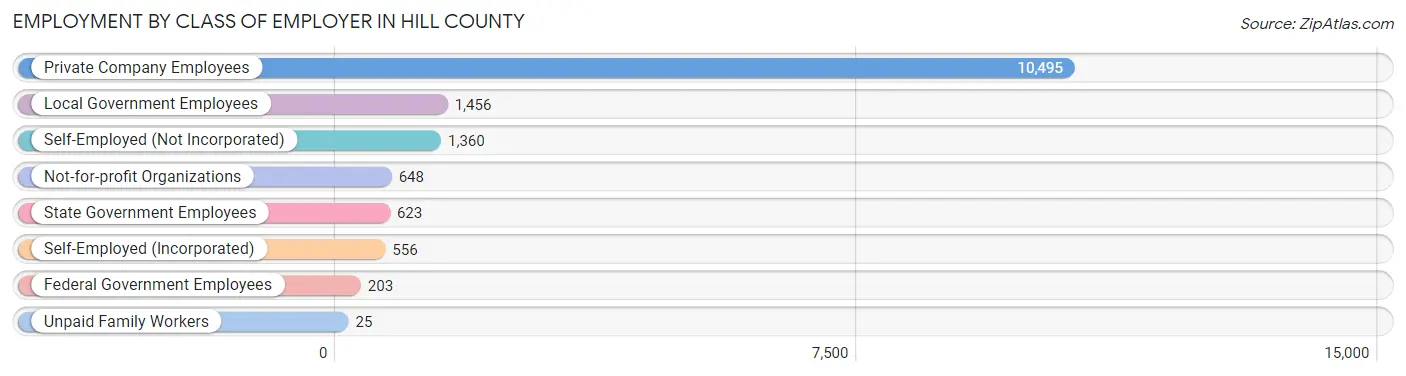
| Employer Class | # Employees | % Employees |
| Private Company Employees | 10,495 | 68.3% |
| Self-Employed (Incorporated) | 556 | 3.6% |
| Self-Employed (Not Incorporated) | 1,360 | 8.8% |
| Not-for-profit Organizations | 648 | 4.2% |
| Local Government Employees | 1,456 | 9.5% |
| State Government Employees | 623 | 4.1% |
| Federal Government Employees | 203 | 1.3% |
| Unpaid Family Workers | 25 | 0.2% |
| Total | 15,366 | 100.0% |
Employment Status by Age in Hill County
According to the labor force statistics for Hill County, out of the total population over 16 years of age (28,760), 57.7% or 16,595 individuals are in the labor force, with 4.5% or 747 of them unemployed. The age group with the highest labor force participation rate is 35 to 44 years, with 81.0% or 3,321 individuals in the labor force. Within the labor force, the 16 to 19 years age range has the highest percentage of unemployed individuals, with 9.8% or 78 of them being unemployed.
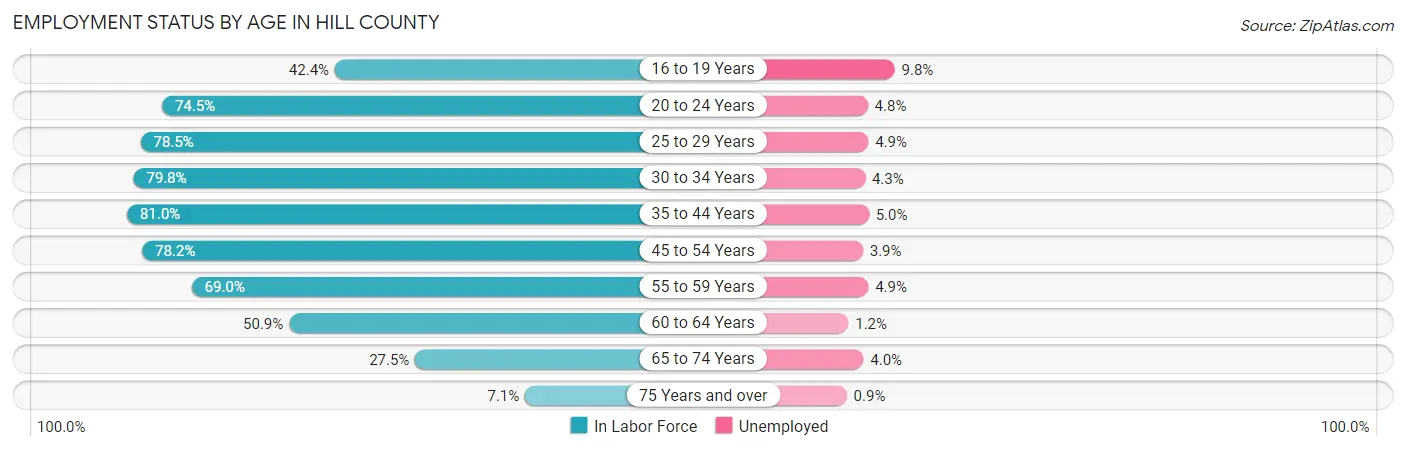
| Age Bracket | In Labor Force | Unemployed |
| 16 to 19 Years | 797 (42.4%) | 78 (9.8%) |
| 20 to 24 Years | 1,535 (74.5%) | 74 (4.8%) |
| 25 to 29 Years | 1,503 (78.5%) | 74 (4.9%) |
| 30 to 34 Years | 1,625 (79.8%) | 70 (4.3%) |
| 35 to 44 Years | 3,321 (81.0%) | 166 (5.0%) |
| 45 to 54 Years | 3,350 (78.2%) | 131 (3.9%) |
| 55 to 59 Years | 1,747 (69.0%) | 86 (4.9%) |
| 60 to 64 Years | 1,298 (50.9%) | 16 (1.2%) |
| 65 to 74 Years | 1,195 (27.5%) | 48 (4.0%) |
| 75 Years and over | 217 (7.1%) | 2 (0.9%) |
| Total | 16,595 (57.7%) | 747 (4.5%) |
Employment Status by Educational Attainment in Hill County
According to labor force statistics for Hill County, 73.7% of individuals (12,836) out of the total population between 25 and 64 years of age (17,417) are in the labor force, with 4.2% or 539 of them being unemployed. The group with the highest labor force participation rate are those with the educational attainment of college / associate degree, with 79.2% or 4,683 individuals in the labor force. Within the labor force, individuals with less than high school education have the highest percentage of unemployment, with 6.2% or 103 of them being unemployed.
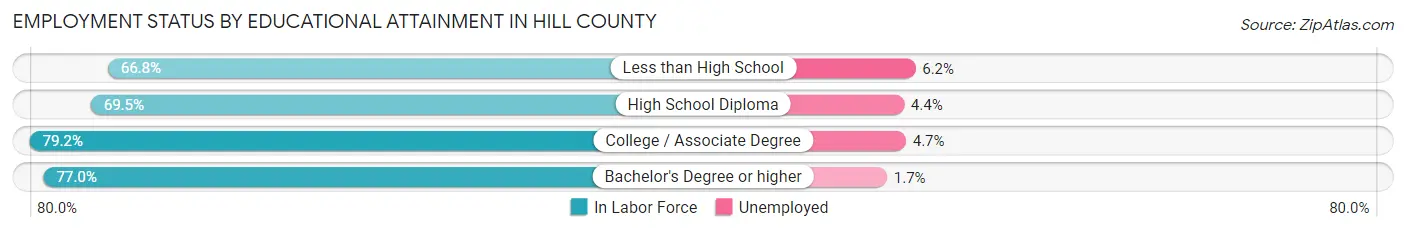
| Educational Attainment | In Labor Force | Unemployed |
| Less than High School | 1,657 (66.8%) | 154 (6.2%) |
| High School Diploma | 4,171 (69.5%) | 264 (4.4%) |
| College / Associate Degree | 4,683 (79.2%) | 278 (4.7%) |
| Bachelor's Degree or higher | 2,327 (77.0%) | 51 (1.7%) |
| Total | 12,836 (73.7%) | 732 (4.2%) |
Employment Occupations by Sex in Hill County
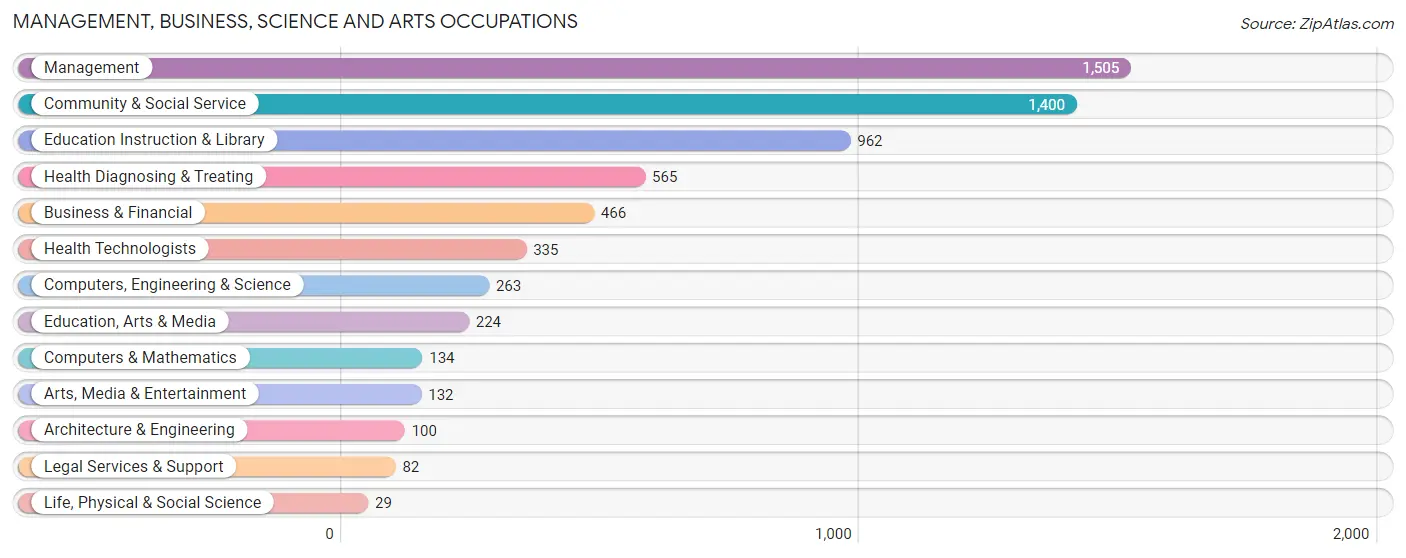
Management, Business, Science and Arts Occupations
The most common Management, Business, Science and Arts occupations in Hill County are Management (1,505 | 9.5%), Community & Social Service (1,400 | 8.8%), Education Instruction & Library (962 | 6.1%), Health Diagnosing & Treating (565 | 3.6%), and Business & Financial (466 | 2.9%).
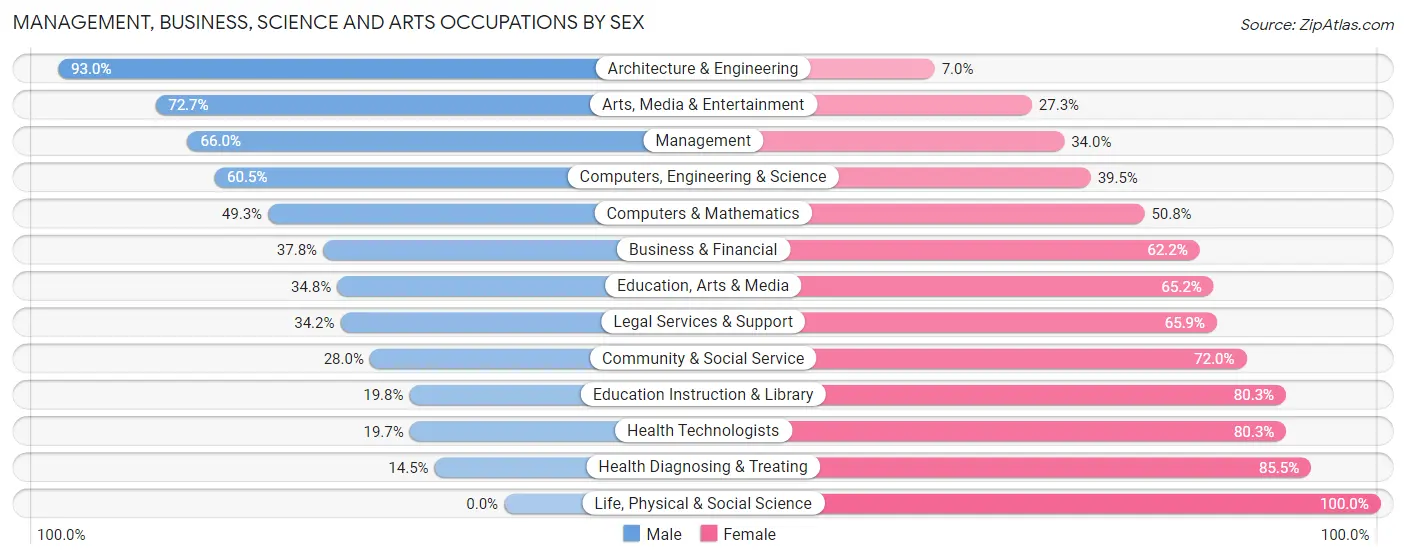
Management, Business, Science and Arts Occupations by Sex
Within the Management, Business, Science and Arts occupations in Hill County, the most male-oriented occupations are Architecture & Engineering (93.0%), Arts, Media & Entertainment (72.7%), and Management (66.0%), while the most female-oriented occupations are Life, Physical & Social Science (100.0%), Health Diagnosing & Treating (85.5%), and Health Technologists (80.3%).
| Occupation | Male | Female |
| Management | 993 (66.0%) | 512 (34.0%) |
| Business & Financial | 176 (37.8%) | 290 (62.2%) |
| Computers, Engineering & Science | 159 (60.5%) | 104 (39.5%) |
| Computers & Mathematics | 66 (49.2%) | 68 (50.7%) |
| Architecture & Engineering | 93 (93.0%) | 7 (7.0%) |
| Life, Physical & Social Science | 0 (0.0%) | 29 (100.0%) |
| Community & Social Service | 392 (28.0%) | 1,008 (72.0%) |
| Education, Arts & Media | 78 (34.8%) | 146 (65.2%) |
| Legal Services & Support | 28 (34.2%) | 54 (65.8%) |
| Education Instruction & Library | 190 (19.8%) | 772 (80.2%) |
| Arts, Media & Entertainment | 96 (72.7%) | 36 (27.3%) |
| Health Diagnosing & Treating | 82 (14.5%) | 483 (85.5%) |
| Health Technologists | 66 (19.7%) | 269 (80.3%) |
| Total (Category) | 1,802 (42.9%) | 2,397 (57.1%) |
| Total (Overall) | 8,944 (56.5%) | 6,898 (43.5%) |
Services Occupations
The most common Services occupations in Hill County are Food Preparation & Serving (869 | 5.5%), Healthcare Support (567 | 3.6%), Cleaning & Maintenance (547 | 3.5%), Personal Care & Service (358 | 2.3%), and Security & Protection (294 | 1.9%).

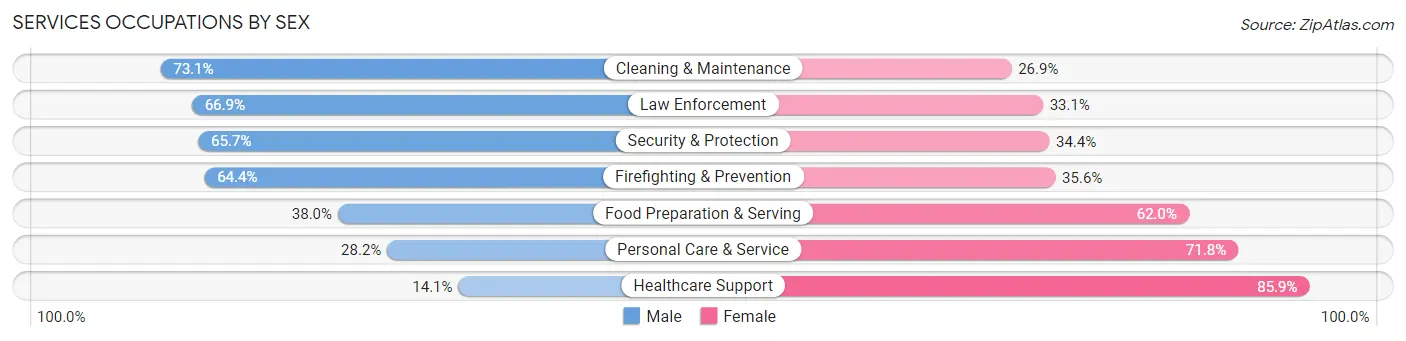
Services Occupations by Sex
Within the Services occupations in Hill County, the most male-oriented occupations are Cleaning & Maintenance (73.1%), Law Enforcement (66.9%), and Security & Protection (65.6%), while the most female-oriented occupations are Healthcare Support (85.9%), Personal Care & Service (71.8%), and Food Preparation & Serving (62.0%).
| Occupation | Male | Female |
| Healthcare Support | 80 (14.1%) | 487 (85.9%) |
| Security & Protection | 193 (65.6%) | 101 (34.4%) |
| Firefighting & Prevention | 96 (64.4%) | 53 (35.6%) |
| Law Enforcement | 97 (66.9%) | 48 (33.1%) |
| Food Preparation & Serving | 330 (38.0%) | 539 (62.0%) |
| Cleaning & Maintenance | 400 (73.1%) | 147 (26.9%) |
| Personal Care & Service | 101 (28.2%) | 257 (71.8%) |
| Total (Category) | 1,104 (41.9%) | 1,531 (58.1%) |
| Total (Overall) | 8,944 (56.5%) | 6,898 (43.5%) |
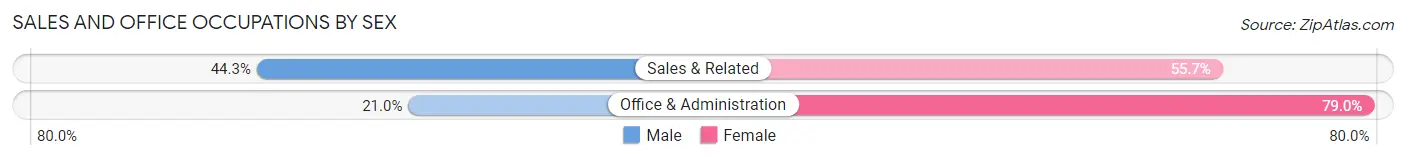
Sales and Office Occupations
The most common Sales and Office occupations in Hill County are Office & Administration (1,778 | 11.2%), and Sales & Related (1,576 | 10.0%).

Sales and Office Occupations by Sex
| Occupation | Male | Female |
| Sales & Related | 698 (44.3%) | 878 (55.7%) |
| Office & Administration | 373 (21.0%) | 1,405 (79.0%) |
| Total (Category) | 1,071 (31.9%) | 2,283 (68.1%) |
| Total (Overall) | 8,944 (56.5%) | 6,898 (43.5%) |
Natural Resources, Construction and Maintenance Occupations
The most common Natural Resources, Construction and Maintenance occupations in Hill County are Construction & Extraction (1,464 | 9.2%), Installation, Maintenance & Repair (713 | 4.5%), and Farming, Fishing & Forestry (242 | 1.5%).
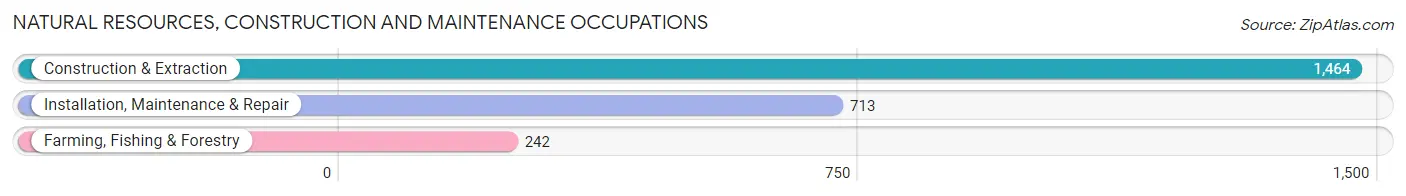
Natural Resources, Construction and Maintenance Occupations by Sex
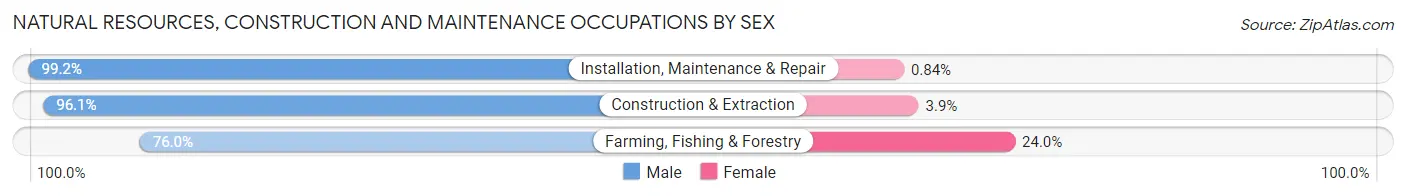
| Occupation | Male | Female |
| Farming, Fishing & Forestry | 184 (76.0%) | 58 (24.0%) |
| Construction & Extraction | 1,407 (96.1%) | 57 (3.9%) |
| Installation, Maintenance & Repair | 707 (99.2%) | 6 (0.8%) |
| Total (Category) | 2,298 (95.0%) | 121 (5.0%) |
| Total (Overall) | 8,944 (56.5%) | 6,898 (43.5%) |
Production, Transportation and Moving Occupations
The most common Production, Transportation and Moving occupations in Hill County are Production (1,649 | 10.4%), Transportation (868 | 5.5%), and Material Moving (718 | 4.5%).
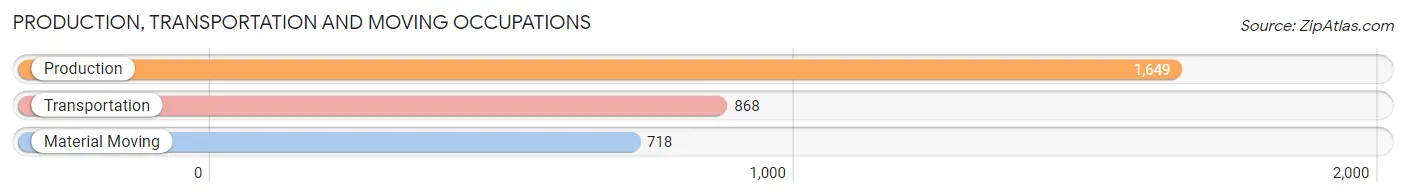
Production, Transportation and Moving Occupations by Sex
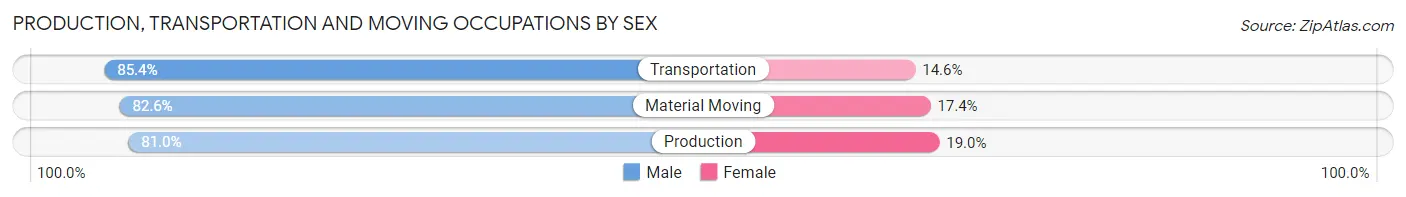
| Occupation | Male | Female |
| Production | 1,335 (81.0%) | 314 (19.0%) |
| Transportation | 741 (85.4%) | 127 (14.6%) |
| Material Moving | 593 (82.6%) | 125 (17.4%) |
| Total (Category) | 2,669 (82.5%) | 566 (17.5%) |
| Total (Overall) | 8,944 (56.5%) | 6,898 (43.5%) |
Employment Industries by Sex in Hill County
Employment Industries in Hill County
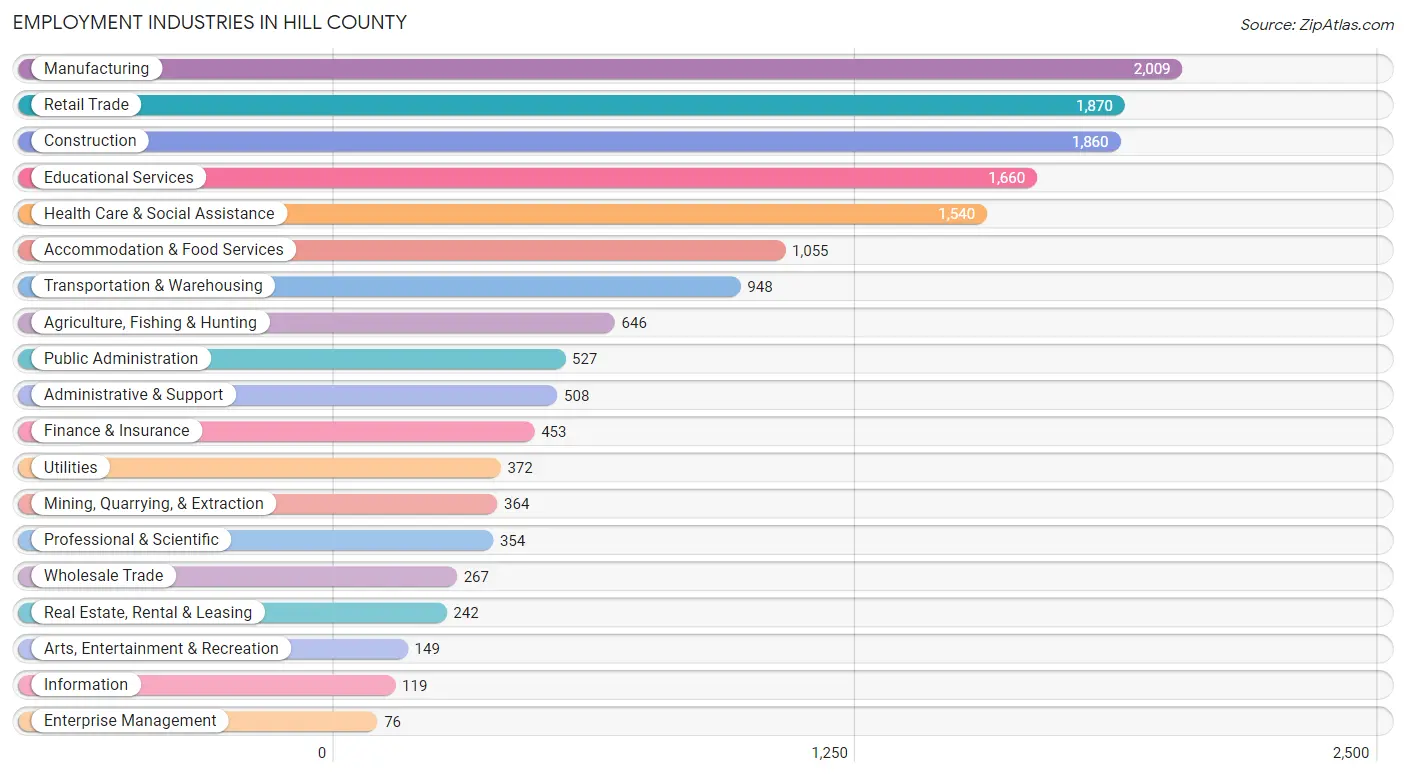
The major employment industries in Hill County include Manufacturing (2,009 | 12.7%), Retail Trade (1,870 | 11.8%), Construction (1,860 | 11.7%), Educational Services (1,660 | 10.5%), and Health Care & Social Assistance (1,540 | 9.7%).
Employment Industries by Sex in Hill County
The Hill County industries that see more men than women are Mining, Quarrying, & Extraction (88.7%), Agriculture, Fishing & Hunting (86.7%), and Construction (86.5%), whereas the industries that tend to have a higher number of women are Health Care & Social Assistance (83.4%), Finance & Insurance (79.0%), and Educational Services (77.0%).
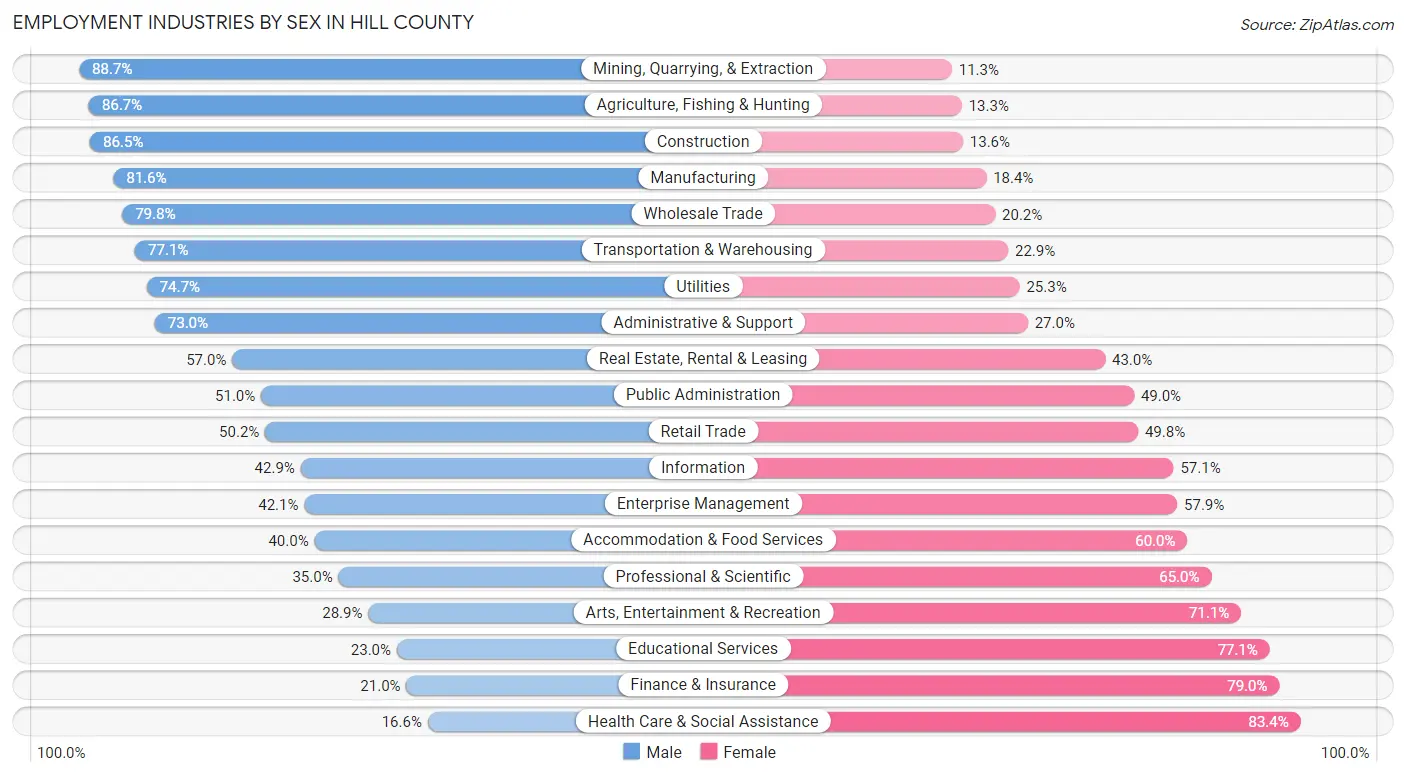
| Industry | Male | Female |
| Agriculture, Fishing & Hunting | 560 (86.7%) | 86 (13.3%) |
| Mining, Quarrying, & Extraction | 323 (88.7%) | 41 (11.3%) |
| Construction | 1,608 (86.5%) | 252 (13.6%) |
| Manufacturing | 1,640 (81.6%) | 369 (18.4%) |
| Wholesale Trade | 213 (79.8%) | 54 (20.2%) |
| Retail Trade | 939 (50.2%) | 931 (49.8%) |
| Transportation & Warehousing | 731 (77.1%) | 217 (22.9%) |
| Utilities | 278 (74.7%) | 94 (25.3%) |
| Information | 51 (42.9%) | 68 (57.1%) |
| Finance & Insurance | 95 (21.0%) | 358 (79.0%) |
| Real Estate, Rental & Leasing | 138 (57.0%) | 104 (43.0%) |
| Professional & Scientific | 124 (35.0%) | 230 (65.0%) |
| Enterprise Management | 32 (42.1%) | 44 (57.9%) |
| Administrative & Support | 371 (73.0%) | 137 (27.0%) |
| Educational Services | 381 (23.0%) | 1,279 (77.0%) |
| Health Care & Social Assistance | 255 (16.6%) | 1,285 (83.4%) |
| Arts, Entertainment & Recreation | 43 (28.9%) | 106 (71.1%) |
| Accommodation & Food Services | 422 (40.0%) | 633 (60.0%) |
| Public Administration | 269 (51.0%) | 258 (49.0%) |
| Total | 8,944 (56.5%) | 6,898 (43.5%) |
Education in Hill County
School Enrollment in Hill County
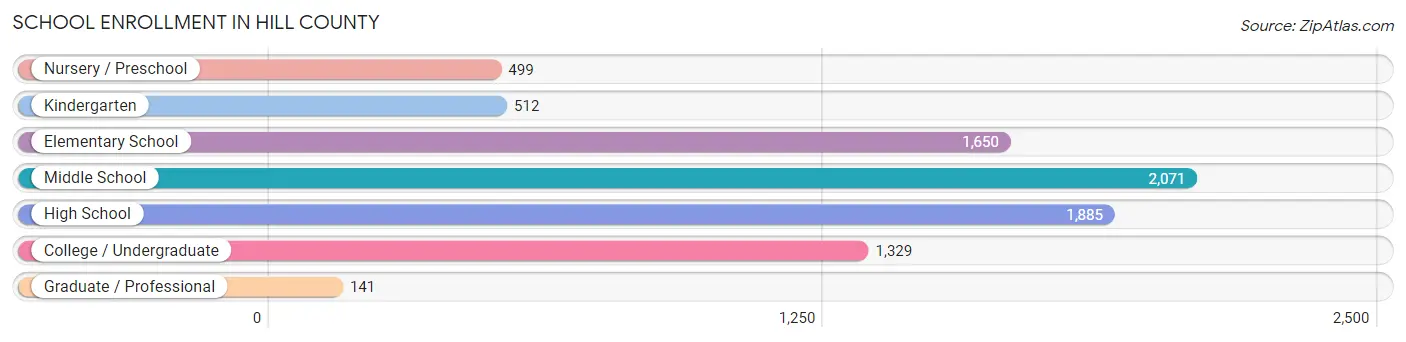
The most common levels of schooling among the 8,087 students in Hill County are middle school (2,071 | 25.6%), high school (1,885 | 23.3%), and elementary school (1,650 | 20.4%).
| School Level | # Students | % Students |
| Nursery / Preschool | 499 | 6.2% |
| Kindergarten | 512 | 6.3% |
| Elementary School | 1,650 | 20.4% |
| Middle School | 2,071 | 25.6% |
| High School | 1,885 | 23.3% |
| College / Undergraduate | 1,329 | 16.4% |
| Graduate / Professional | 141 | 1.7% |
| Total | 8,087 | 100.0% |
School Enrollment by Age by Funding Source in Hill County
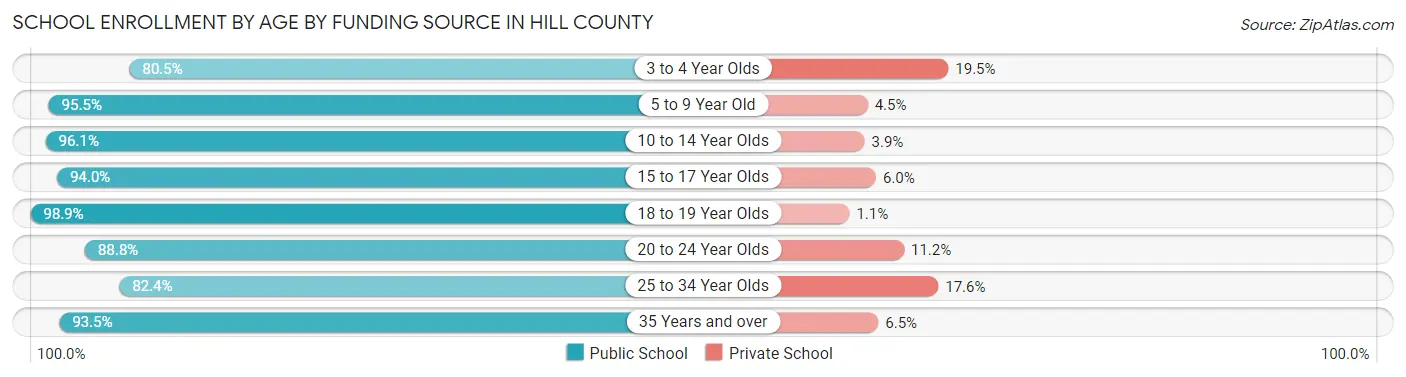
Out of a total of 8,087 students who are enrolled in schools in Hill County, 493 (6.1%) attend a private institution, while the remaining 7,594 (93.9%) are enrolled in public schools. The age group of 3 to 4 year olds has the highest likelihood of being enrolled in private schools, with 63 (19.5% in the age bracket) enrolled. Conversely, the age group of 18 to 19 year olds has the lowest likelihood of being enrolled in a private school, with 460 (98.9% in the age bracket) attending a public institution.
| Age Bracket | Public School | Private School |
| 3 to 4 Year Olds | 260 (80.5%) | 63 (19.5%) |
| 5 to 9 Year Old | 1,960 (95.5%) | 92 (4.5%) |
| 10 to 14 Year Olds | 2,492 (96.1%) | 101 (3.9%) |
| 15 to 17 Year Olds | 1,386 (94.0%) | 89 (6.0%) |
| 18 to 19 Year Olds | 460 (98.9%) | 5 (1.1%) |
| 20 to 24 Year Olds | 521 (88.8%) | 66 (11.2%) |
| 25 to 34 Year Olds | 271 (82.4%) | 58 (17.6%) |
| 35 Years and over | 246 (93.5%) | 17 (6.5%) |
| Total | 7,594 (93.9%) | 493 (6.1%) |
Educational Attainment by Field of Study in Hill County
Education (1,205 | 25.6%), business (1,036 | 22.0%), bio, nature & agricultural (466 | 9.9%), science & technology (362 | 7.7%), and arts & humanities (337 | 7.2%) are the most common fields of study among 4,707 individuals in Hill County who have obtained a bachelor's degree or higher.
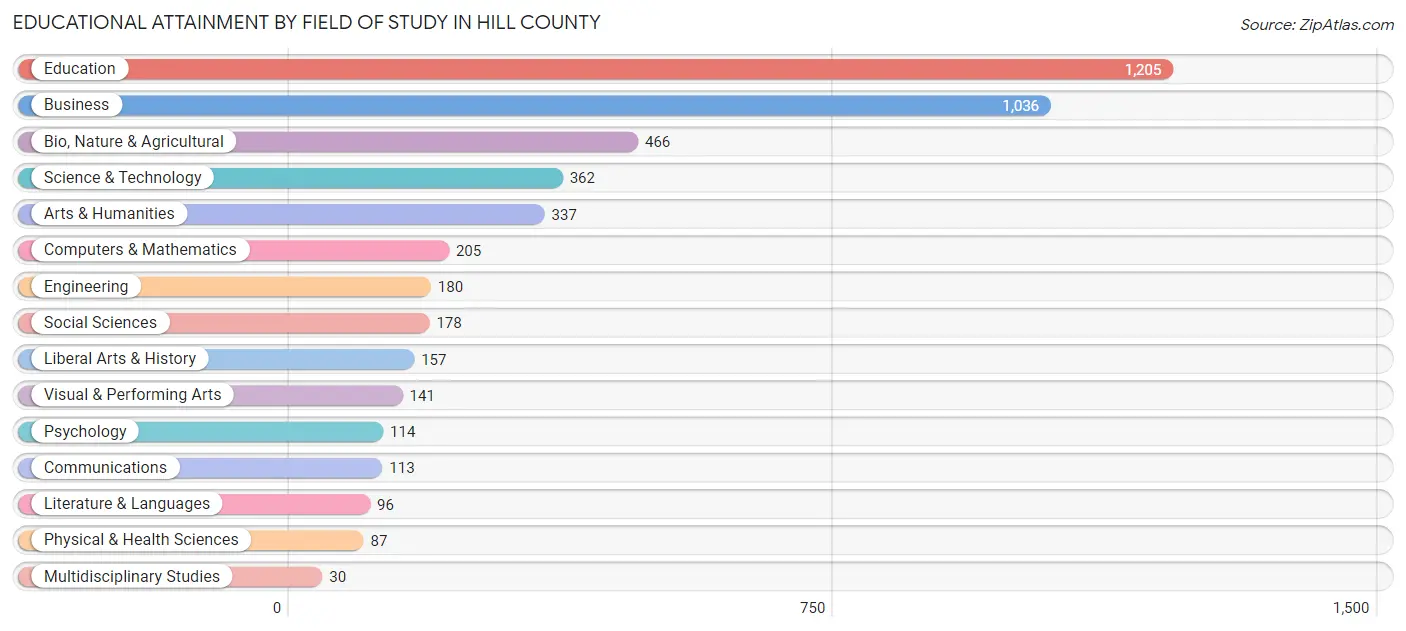
| Field of Study | # Graduates | % Graduates |
| Computers & Mathematics | 205 | 4.4% |
| Bio, Nature & Agricultural | 466 | 9.9% |
| Physical & Health Sciences | 87 | 1.8% |
| Psychology | 114 | 2.4% |
| Social Sciences | 178 | 3.8% |
| Engineering | 180 | 3.8% |
| Multidisciplinary Studies | 30 | 0.6% |
| Science & Technology | 362 | 7.7% |
| Business | 1,036 | 22.0% |
| Education | 1,205 | 25.6% |
| Literature & Languages | 96 | 2.0% |
| Liberal Arts & History | 157 | 3.3% |
| Visual & Performing Arts | 141 | 3.0% |
| Communications | 113 | 2.4% |
| Arts & Humanities | 337 | 7.2% |
| Total | 4,707 | 100.0% |
Transportation & Commute in Hill County
Vehicle Availability by Sex in Hill County
The most prevalent vehicle ownership categories in Hill County are males with 2 vehicles (3,418, accounting for 39.6%) and females with 2 vehicles (2,196, making up 51.5%).
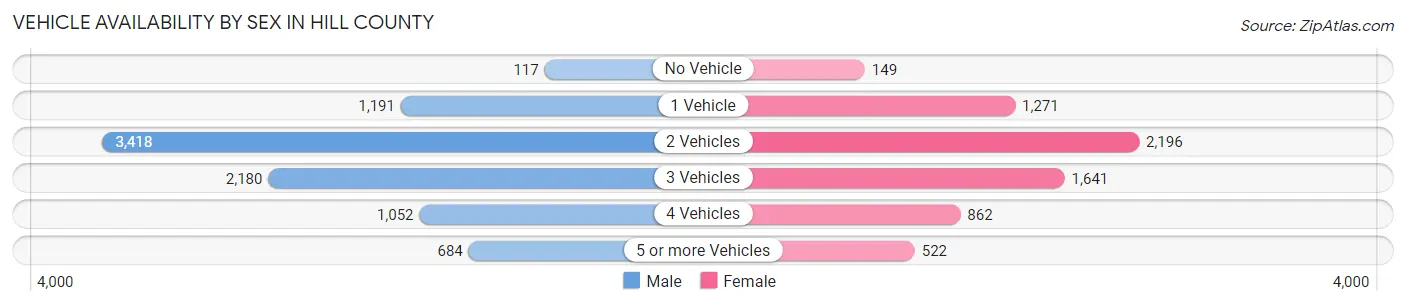
| Vehicles Available | Male | Female |
| No Vehicle | 117 (1.3%) | 149 (2.2%) |
| 1 Vehicle | 1,191 (13.8%) | 1,271 (19.1%) |
| 2 Vehicles | 3,418 (39.6%) | 2,196 (33.1%) |
| 3 Vehicles | 2,180 (25.2%) | 1,641 (24.7%) |
| 4 Vehicles | 1,052 (12.2%) | 862 (13.0%) |
| 5 or more Vehicles | 684 (7.9%) | 522 (7.9%) |
| Total | 8,642 (100.0%) | 6,641 (100.0%) |
Commute Time in Hill County
The most frequently occuring commute durations in Hill County are 10 to 14 minutes (1,820 commuters, 12.6%), 45 to 59 minutes (1,757 commuters, 12.1%), and 5 to 9 minutes (1,750 commuters, 12.1%).
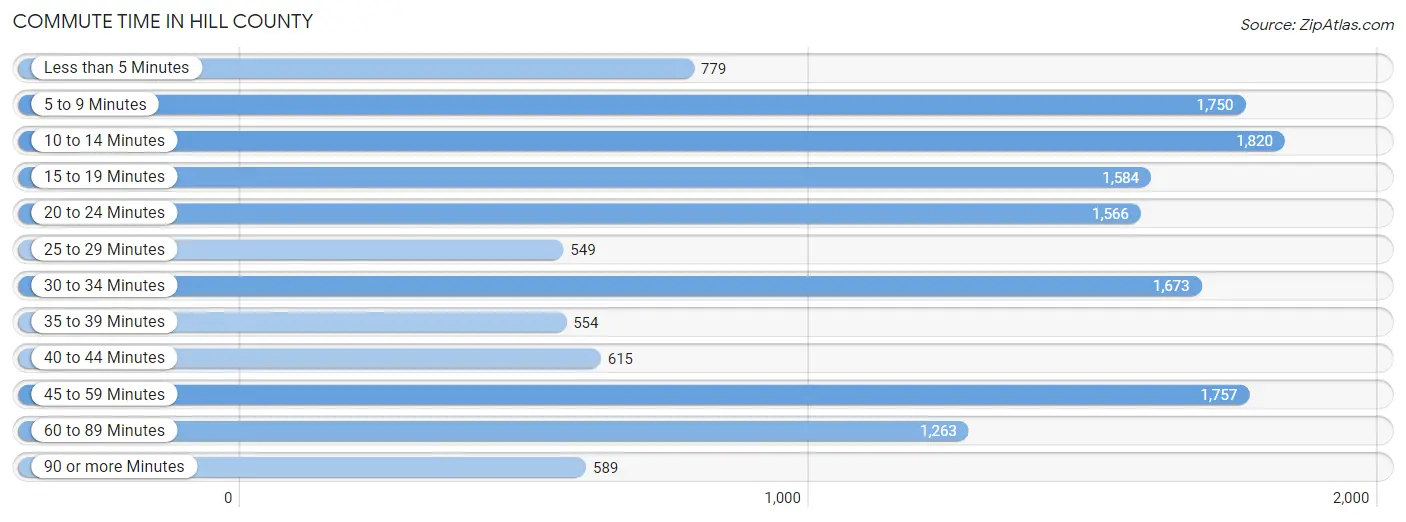
| Commute Time | # Commuters | % Commuters |
| Less than 5 Minutes | 779 | 5.4% |
| 5 to 9 Minutes | 1,750 | 12.1% |
| 10 to 14 Minutes | 1,820 | 12.6% |
| 15 to 19 Minutes | 1,584 | 10.9% |
| 20 to 24 Minutes | 1,566 | 10.8% |
| 25 to 29 Minutes | 549 | 3.8% |
| 30 to 34 Minutes | 1,673 | 11.5% |
| 35 to 39 Minutes | 554 | 3.8% |
| 40 to 44 Minutes | 615 | 4.2% |
| 45 to 59 Minutes | 1,757 | 12.1% |
| 60 to 89 Minutes | 1,263 | 8.7% |
| 90 or more Minutes | 589 | 4.1% |
Commute Time by Sex in Hill County
The most common commute times in Hill County are 45 to 59 minutes (1,174 commuters, 14.4%) for males and 5 to 9 minutes (883 commuters, 14.0%) for females.
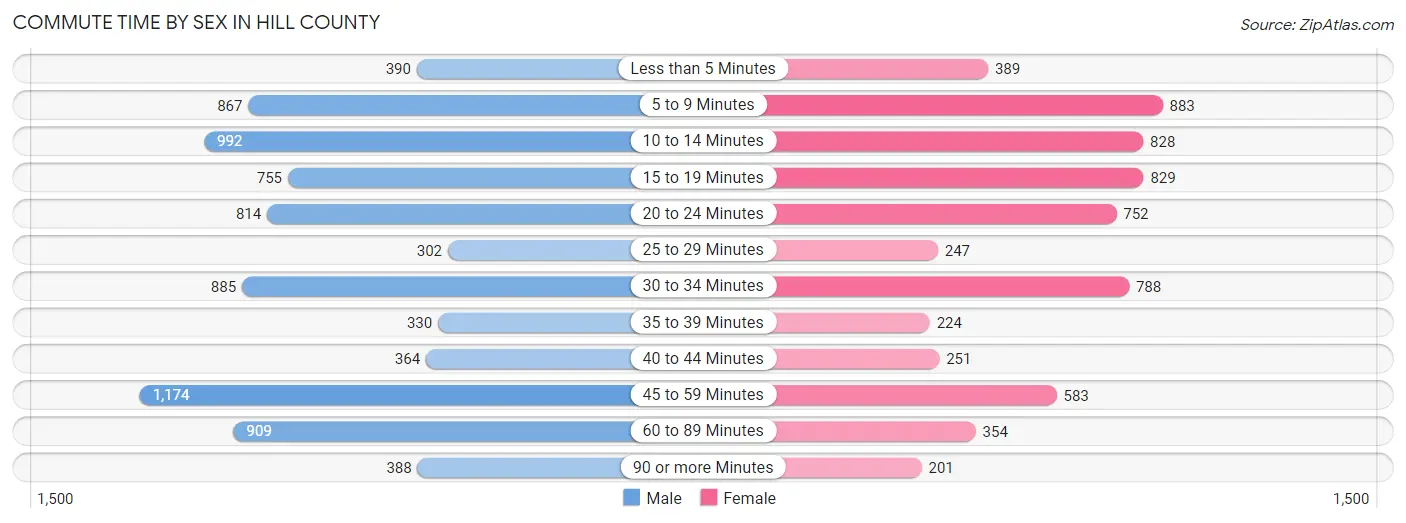
| Commute Time | Male | Female |
| Less than 5 Minutes | 390 (4.8%) | 389 (6.1%) |
| 5 to 9 Minutes | 867 (10.6%) | 883 (14.0%) |
| 10 to 14 Minutes | 992 (12.1%) | 828 (13.1%) |
| 15 to 19 Minutes | 755 (9.2%) | 829 (13.1%) |
| 20 to 24 Minutes | 814 (10.0%) | 752 (11.9%) |
| 25 to 29 Minutes | 302 (3.7%) | 247 (3.9%) |
| 30 to 34 Minutes | 885 (10.8%) | 788 (12.4%) |
| 35 to 39 Minutes | 330 (4.0%) | 224 (3.5%) |
| 40 to 44 Minutes | 364 (4.5%) | 251 (4.0%) |
| 45 to 59 Minutes | 1,174 (14.4%) | 583 (9.2%) |
| 60 to 89 Minutes | 909 (11.1%) | 354 (5.6%) |
| 90 or more Minutes | 388 (4.8%) | 201 (3.2%) |
Time of Departure to Work by Sex in Hill County
The most frequent times of departure to work in Hill County are 6:30 AM to 6:59 AM (1,096, 13.4%) for males and 7:00 AM to 7:29 AM (1,184, 18.7%) for females.
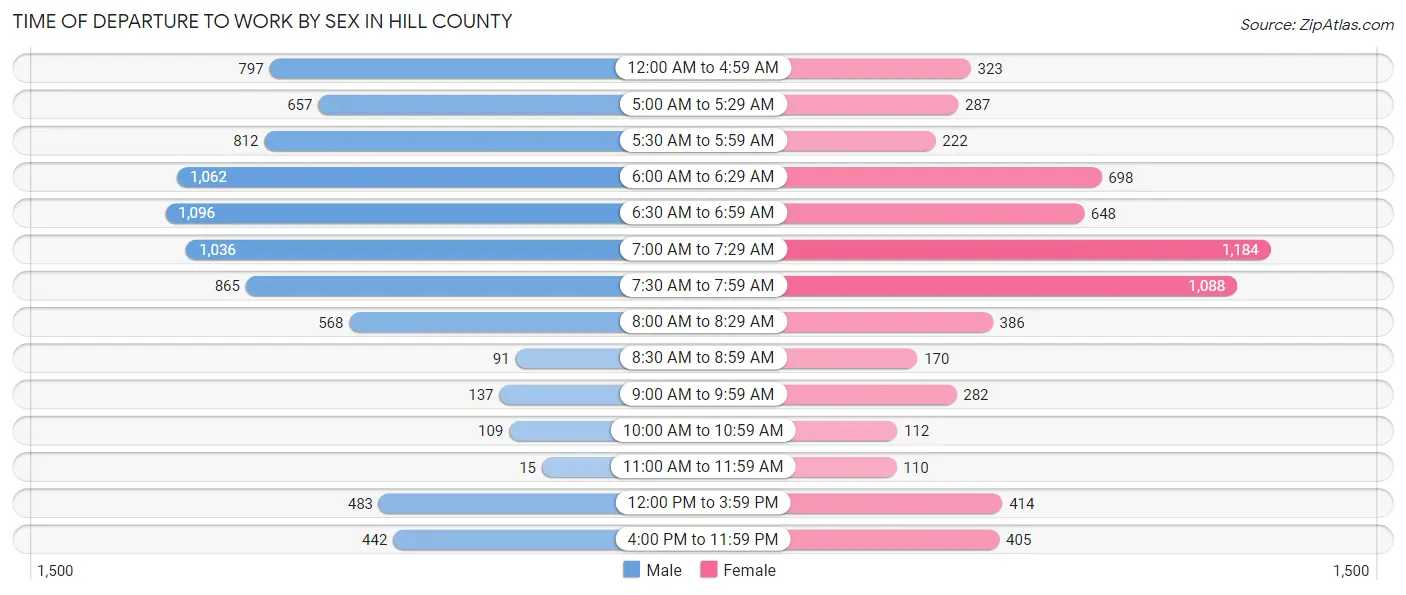
| Time of Departure | Male | Female |
| 12:00 AM to 4:59 AM | 797 (9.8%) | 323 (5.1%) |
| 5:00 AM to 5:29 AM | 657 (8.0%) | 287 (4.5%) |
| 5:30 AM to 5:59 AM | 812 (9.9%) | 222 (3.5%) |
| 6:00 AM to 6:29 AM | 1,062 (13.0%) | 698 (11.0%) |
| 6:30 AM to 6:59 AM | 1,096 (13.4%) | 648 (10.2%) |
| 7:00 AM to 7:29 AM | 1,036 (12.7%) | 1,184 (18.7%) |
| 7:30 AM to 7:59 AM | 865 (10.6%) | 1,088 (17.2%) |
| 8:00 AM to 8:29 AM | 568 (7.0%) | 386 (6.1%) |
| 8:30 AM to 8:59 AM | 91 (1.1%) | 170 (2.7%) |
| 9:00 AM to 9:59 AM | 137 (1.7%) | 282 (4.5%) |
| 10:00 AM to 10:59 AM | 109 (1.3%) | 112 (1.8%) |
| 11:00 AM to 11:59 AM | 15 (0.2%) | 110 (1.7%) |
| 12:00 PM to 3:59 PM | 483 (5.9%) | 414 (6.5%) |
| 4:00 PM to 11:59 PM | 442 (5.4%) | 405 (6.4%) |
| Total | 8,170 (100.0%) | 6,329 (100.0%) |
Housing Occupancy in Hill County
Occupancy by Ownership in Hill County
Of the total 13,390 dwellings in Hill County, owner-occupied units account for 10,088 (75.3%), while renter-occupied units make up 3,302 (24.7%).
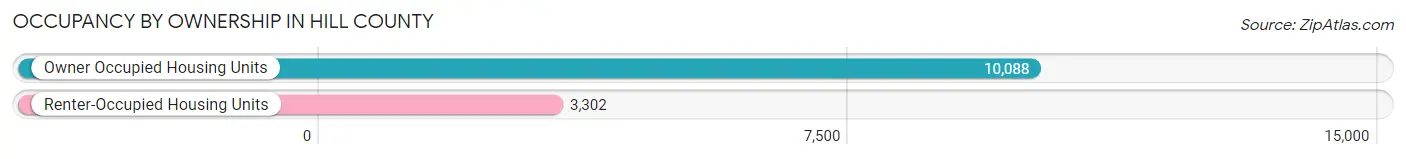
| Occupancy | # Housing Units | % Housing Units |
| Owner Occupied Housing Units | 10,088 | 75.3% |
| Renter-Occupied Housing Units | 3,302 | 24.7% |
| Total Occupied Housing Units | 13,390 | 100.0% |
Occupancy by Household Size in Hill County
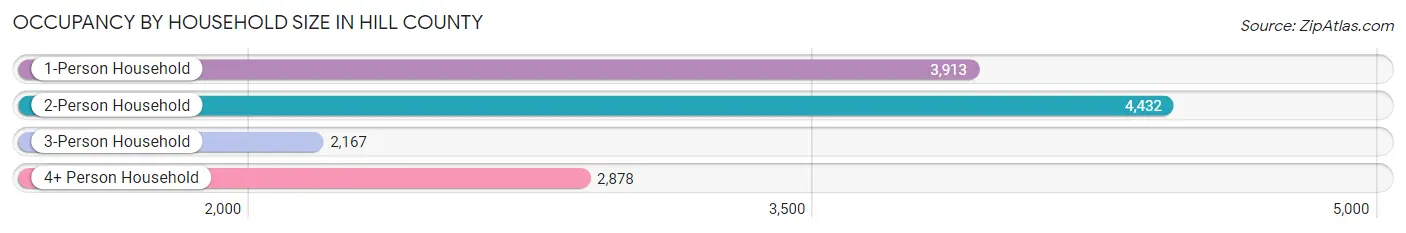
| Household Size | # Housing Units | % Housing Units |
| 1-Person Household | 3,913 | 29.2% |
| 2-Person Household | 4,432 | 33.1% |
| 3-Person Household | 2,167 | 16.2% |
| 4+ Person Household | 2,878 | 21.5% |
| Total Housing Units | 13,390 | 100.0% |
Occupancy by Ownership by Household Size in Hill County
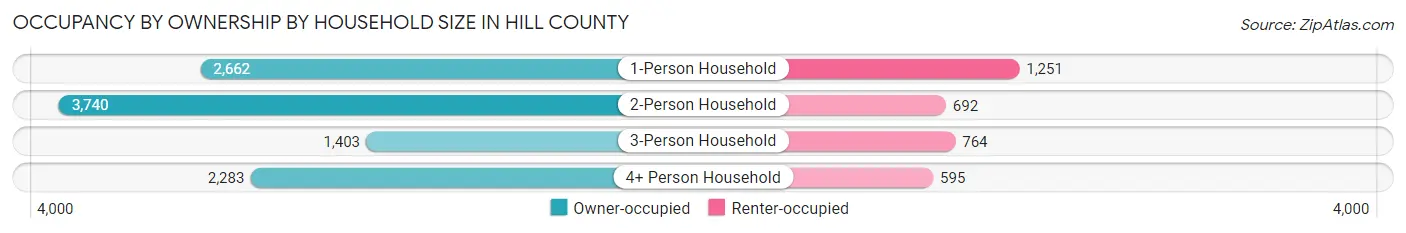
| Household Size | Owner-occupied | Renter-occupied |
| 1-Person Household | 2,662 (68.0%) | 1,251 (32.0%) |
| 2-Person Household | 3,740 (84.4%) | 692 (15.6%) |
| 3-Person Household | 1,403 (64.7%) | 764 (35.3%) |
| 4+ Person Household | 2,283 (79.3%) | 595 (20.7%) |
| Total Housing Units | 10,088 (75.3%) | 3,302 (24.7%) |
Occupancy by Educational Attainment in Hill County
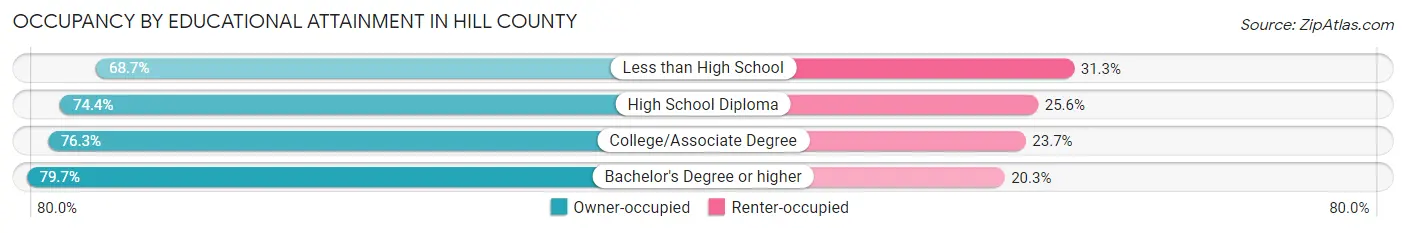
| Household Size | Owner-occupied | Renter-occupied |
| Less than High School | 1,253 (68.7%) | 572 (31.3%) |
| High School Diploma | 3,057 (74.4%) | 1,054 (25.6%) |
| College/Associate Degree | 3,679 (76.3%) | 1,141 (23.7%) |
| Bachelor's Degree or higher | 2,099 (79.7%) | 535 (20.3%) |
Occupancy by Age of Householder in Hill County
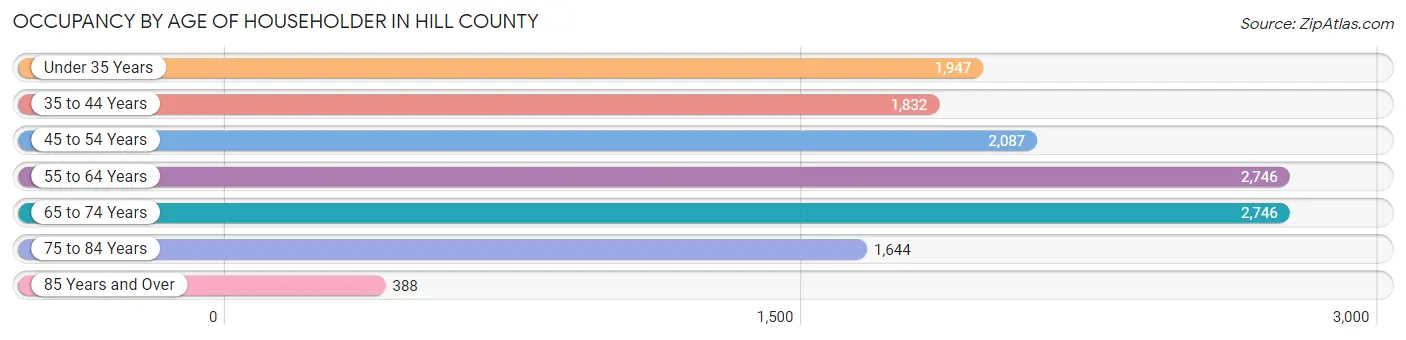
| Age Bracket | # Households | % Households |
| Under 35 Years | 1,947 | 14.5% |
| 35 to 44 Years | 1,832 | 13.7% |
| 45 to 54 Years | 2,087 | 15.6% |
| 55 to 64 Years | 2,746 | 20.5% |
| 65 to 74 Years | 2,746 | 20.5% |
| 75 to 84 Years | 1,644 | 12.3% |
| 85 Years and Over | 388 | 2.9% |
| Total | 13,390 | 100.0% |
Housing Finances in Hill County
Median Income by Occupancy in Hill County
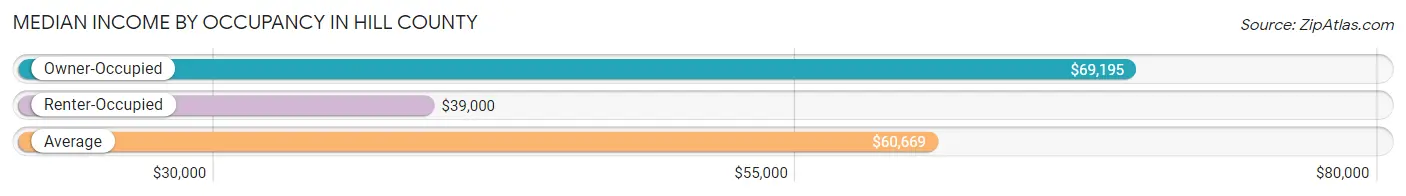
| Occupancy Type | # Households | Median Income |
| Owner-Occupied | 10,088 (75.3%) | $69,195 |
| Renter-Occupied | 3,302 (24.7%) | $39,000 |
| Average | 13,390 (100.0%) | $60,669 |
Occupancy by Householder Income Bracket in Hill County
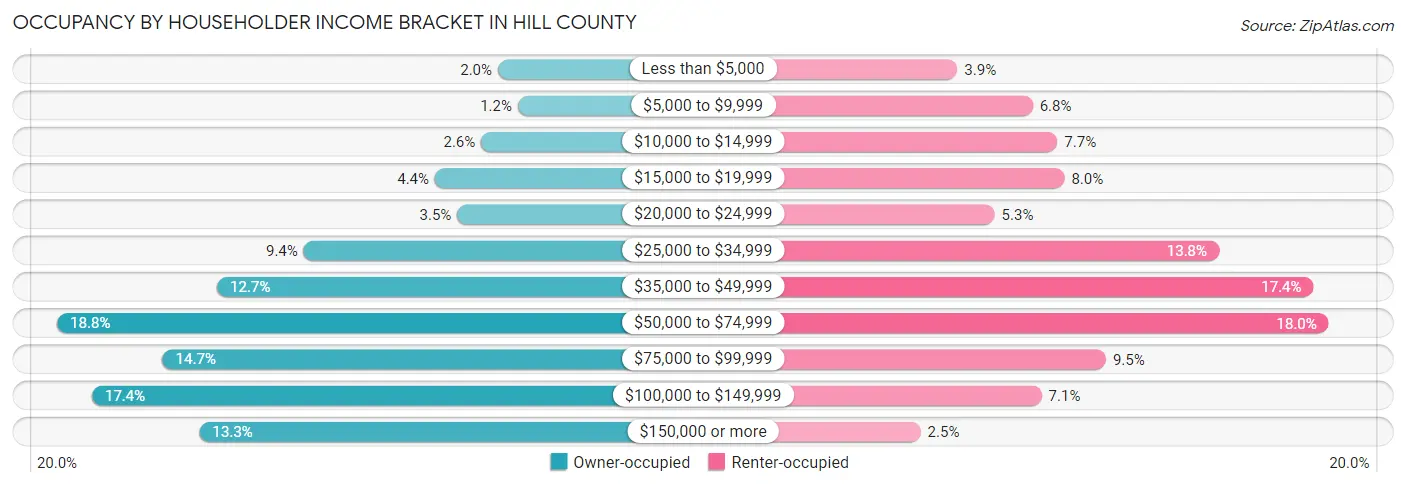
| Income Bracket | Owner-occupied | Renter-occupied |
| Less than $5,000 | 199 (2.0%) | 128 (3.9%) |
| $5,000 to $9,999 | 122 (1.2%) | 223 (6.8%) |
| $10,000 to $14,999 | 263 (2.6%) | 254 (7.7%) |
| $15,000 to $19,999 | 441 (4.4%) | 263 (8.0%) |
| $20,000 to $24,999 | 355 (3.5%) | 175 (5.3%) |
| $25,000 to $34,999 | 945 (9.4%) | 457 (13.8%) |
| $35,000 to $49,999 | 1,278 (12.7%) | 576 (17.4%) |
| $50,000 to $74,999 | 1,893 (18.8%) | 595 (18.0%) |
| $75,000 to $99,999 | 1,487 (14.7%) | 315 (9.5%) |
| $100,000 to $149,999 | 1,759 (17.4%) | 234 (7.1%) |
| $150,000 or more | 1,346 (13.3%) | 82 (2.5%) |
| Total | 10,088 (100.0%) | 3,302 (100.0%) |
Monthly Housing Cost Tiers in Hill County
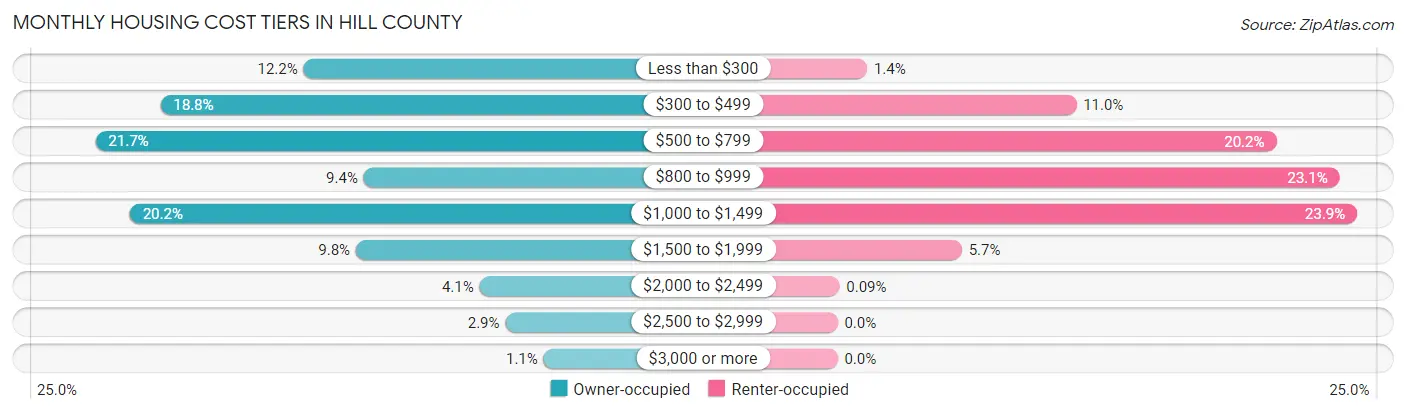
| Monthly Cost | Owner-occupied | Renter-occupied |
| Less than $300 | 1,227 (12.2%) | 45 (1.4%) |
| $300 to $499 | 1,891 (18.8%) | 363 (11.0%) |
| $500 to $799 | 2,193 (21.7%) | 667 (20.2%) |
| $800 to $999 | 947 (9.4%) | 763 (23.1%) |
| $1,000 to $1,499 | 2,034 (20.2%) | 790 (23.9%) |
| $1,500 to $1,999 | 984 (9.8%) | 189 (5.7%) |
| $2,000 to $2,499 | 410 (4.1%) | 3 (0.1%) |
| $2,500 to $2,999 | 290 (2.9%) | 0 (0.0%) |
| $3,000 or more | 112 (1.1%) | 0 (0.0%) |
| Total | 10,088 (100.0%) | 3,302 (100.0%) |
Physical Housing Characteristics in Hill County
Housing Structures in Hill County
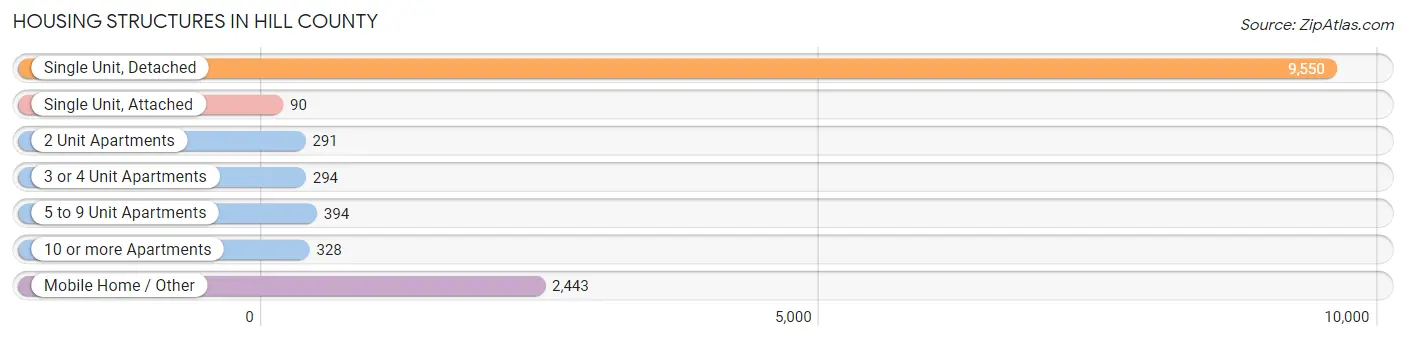
| Structure Type | # Housing Units | % Housing Units |
| Single Unit, Detached | 9,550 | 71.3% |
| Single Unit, Attached | 90 | 0.7% |
| 2 Unit Apartments | 291 | 2.2% |
| 3 or 4 Unit Apartments | 294 | 2.2% |
| 5 to 9 Unit Apartments | 394 | 2.9% |
| 10 or more Apartments | 328 | 2.5% |
| Mobile Home / Other | 2,443 | 18.2% |
| Total | 13,390 | 100.0% |
Housing Structures by Occupancy in Hill County
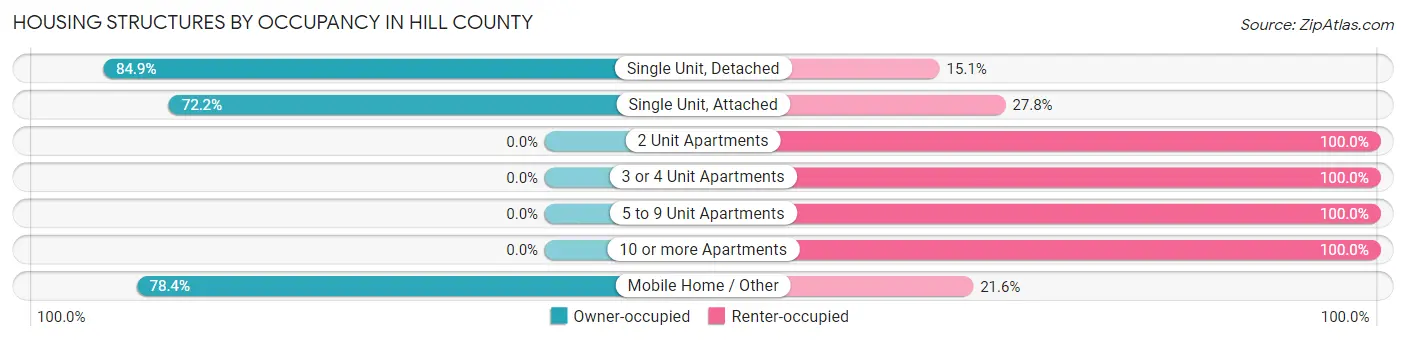
| Structure Type | Owner-occupied | Renter-occupied |
| Single Unit, Detached | 8,107 (84.9%) | 1,443 (15.1%) |
| Single Unit, Attached | 65 (72.2%) | 25 (27.8%) |
| 2 Unit Apartments | 0 (0.0%) | 291 (100.0%) |
| 3 or 4 Unit Apartments | 0 (0.0%) | 294 (100.0%) |
| 5 to 9 Unit Apartments | 0 (0.0%) | 394 (100.0%) |
| 10 or more Apartments | 0 (0.0%) | 328 (100.0%) |
| Mobile Home / Other | 1,916 (78.4%) | 527 (21.6%) |
| Total | 10,088 (75.3%) | 3,302 (24.7%) |
Housing Structures by Number of Rooms in Hill County
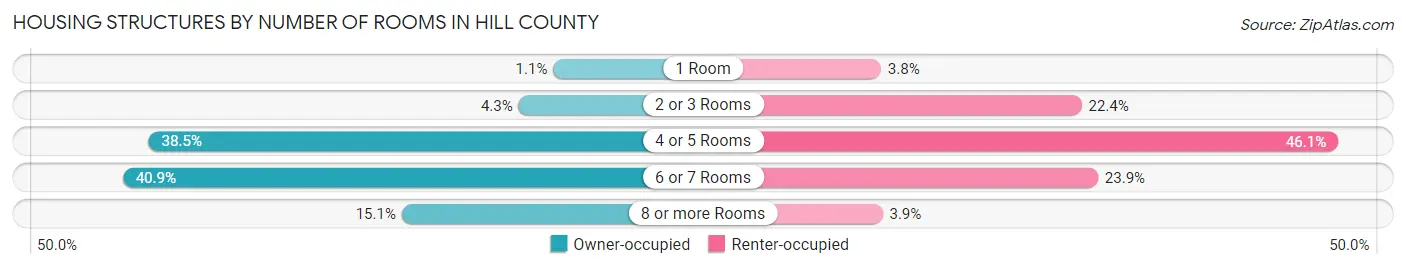
| Number of Rooms | Owner-occupied | Renter-occupied |
| 1 Room | 112 (1.1%) | 125 (3.8%) |
| 2 or 3 Rooms | 436 (4.3%) | 738 (22.4%) |
| 4 or 5 Rooms | 3,887 (38.5%) | 1,521 (46.1%) |
| 6 or 7 Rooms | 4,128 (40.9%) | 788 (23.9%) |
| 8 or more Rooms | 1,525 (15.1%) | 130 (3.9%) |
| Total | 10,088 (100.0%) | 3,302 (100.0%) |
Housing Structure by Heating Type in Hill County
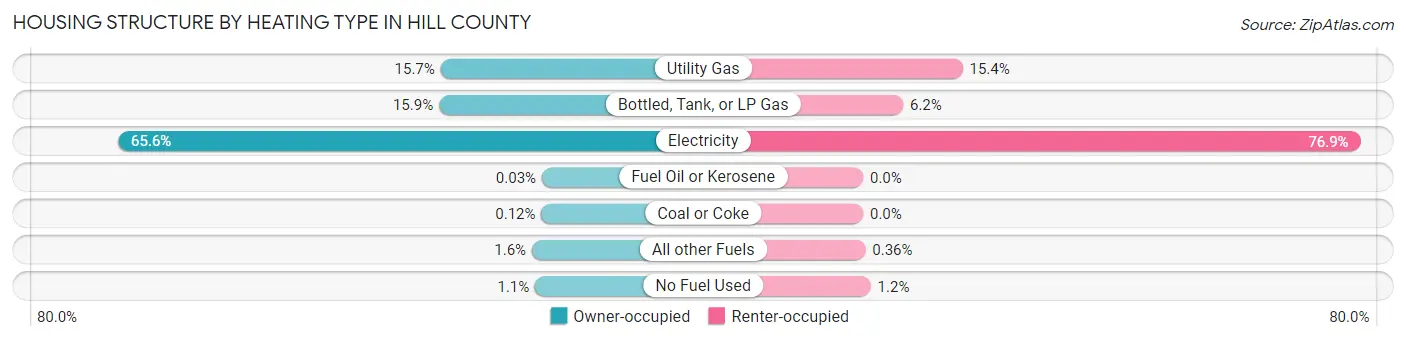
| Heating Type | Owner-occupied | Renter-occupied |
| Utility Gas | 1,583 (15.7%) | 508 (15.4%) |
| Bottled, Tank, or LP Gas | 1,608 (15.9%) | 204 (6.2%) |
| Electricity | 6,615 (65.6%) | 2,539 (76.9%) |
| Fuel Oil or Kerosene | 3 (0.0%) | 0 (0.0%) |
| Coal or Coke | 12 (0.1%) | 0 (0.0%) |
| All other Fuels | 158 (1.6%) | 12 (0.4%) |
| No Fuel Used | 109 (1.1%) | 39 (1.2%) |
| Total | 10,088 (100.0%) | 3,302 (100.0%) |
Household Vehicle Usage in Hill County
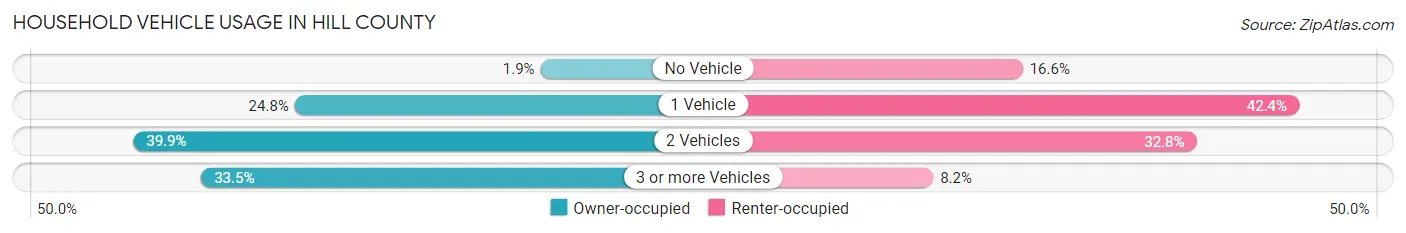
| Vehicles per Household | Owner-occupied | Renter-occupied |
| No Vehicle | 187 (1.8%) | 548 (16.6%) |
| 1 Vehicle | 2,501 (24.8%) | 1,399 (42.4%) |
| 2 Vehicles | 4,020 (39.9%) | 1,083 (32.8%) |
| 3 or more Vehicles | 3,380 (33.5%) | 272 (8.2%) |
| Total | 10,088 (100.0%) | 3,302 (100.0%) |
Real Estate & Mortgages in Hill County
Real Estate and Mortgage Overview in Hill County
| Characteristic | Without Mortgage | With Mortgage |
| Housing Units | 5,915 | 4,173 |
| Median Property Value | $103,300 | $187,400 |
| Median Household Income | $57,283 | $788 |
| Monthly Housing Costs | $484 | $112 |
| Real Estate Taxes | $1,358 | $359 |
Property Value by Mortgage Status in Hill County
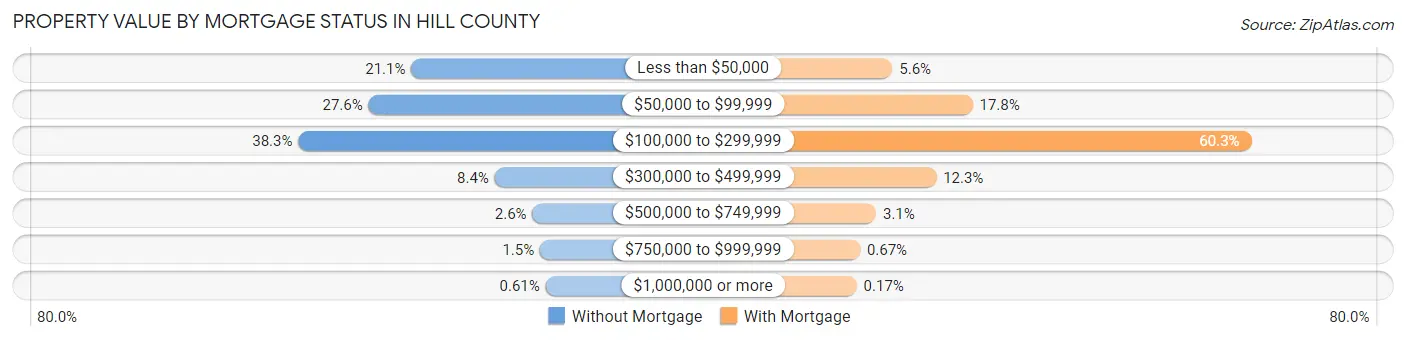
| Property Value | Without Mortgage | With Mortgage |
| Less than $50,000 | 1,246 (21.1%) | 234 (5.6%) |
| $50,000 to $99,999 | 1,632 (27.6%) | 744 (17.8%) |
| $100,000 to $299,999 | 2,265 (38.3%) | 2,517 (60.3%) |
| $300,000 to $499,999 | 495 (8.4%) | 513 (12.3%) |
| $500,000 to $749,999 | 155 (2.6%) | 130 (3.1%) |
| $750,000 to $999,999 | 86 (1.5%) | 28 (0.7%) |
| $1,000,000 or more | 36 (0.6%) | 7 (0.2%) |
| Total | 5,915 (100.0%) | 4,173 (100.0%) |
Household Income by Mortgage Status in Hill County
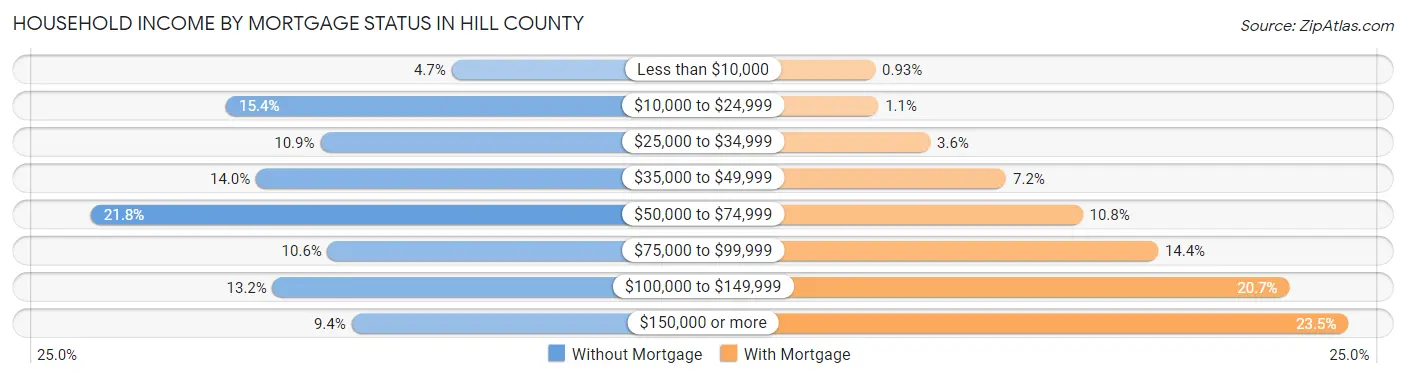
| Household Income | Without Mortgage | With Mortgage |
| Less than $10,000 | 276 (4.7%) | 39 (0.9%) |
| $10,000 to $24,999 | 911 (15.4%) | 45 (1.1%) |
| $25,000 to $34,999 | 646 (10.9%) | 148 (3.5%) |
| $35,000 to $49,999 | 827 (14.0%) | 299 (7.2%) |
| $50,000 to $74,999 | 1,292 (21.8%) | 451 (10.8%) |
| $75,000 to $99,999 | 625 (10.6%) | 601 (14.4%) |
| $100,000 to $149,999 | 780 (13.2%) | 862 (20.7%) |
| $150,000 or more | 558 (9.4%) | 979 (23.5%) |
| Total | 5,915 (100.0%) | 4,173 (100.0%) |
Property Value to Household Income Ratio in Hill County
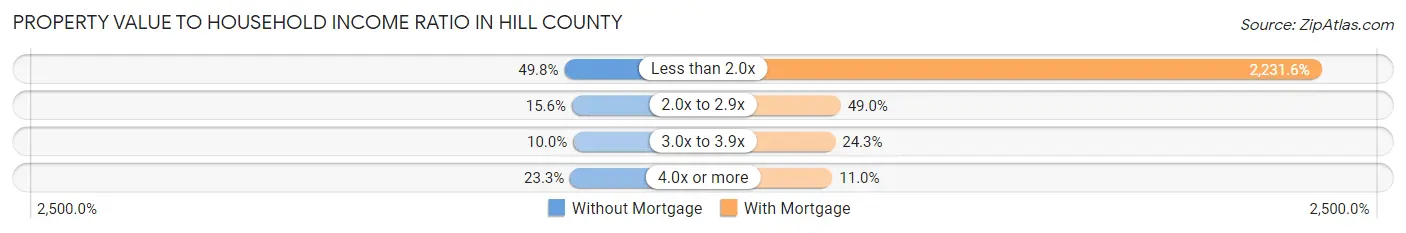
| Value-to-Income Ratio | Without Mortgage | With Mortgage |
| Less than 2.0x | 2,946 (49.8%) | 93,125 (2,231.6%) |
| 2.0x to 2.9x | 925 (15.6%) | 2,045 (49.0%) |
| 3.0x to 3.9x | 589 (10.0%) | 1,013 (24.3%) |
| 4.0x or more | 1,377 (23.3%) | 459 (11.0%) |
| Total | 5,915 (100.0%) | 4,173 (100.0%) |
Real Estate Taxes by Mortgage Status in Hill County
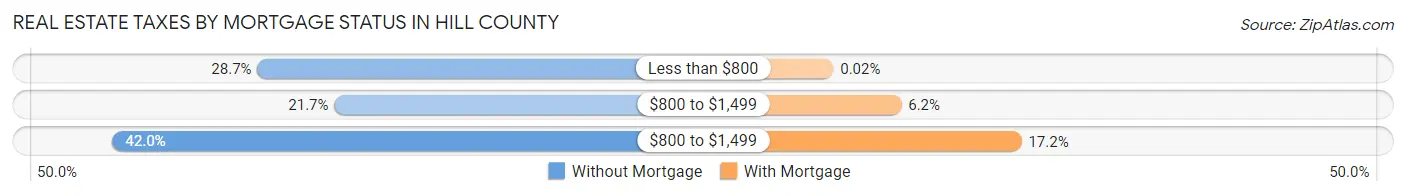
| Property Taxes | Without Mortgage | With Mortgage |
| Less than $800 | 1,700 (28.7%) | 1 (0.0%) |
| $800 to $1,499 | 1,284 (21.7%) | 260 (6.2%) |
| $800 to $1,499 | 2,483 (42.0%) | 718 (17.2%) |
| Total | 5,915 (100.0%) | 4,173 (100.0%) |
Health & Disability in Hill County
Health Insurance Coverage by Age in Hill County
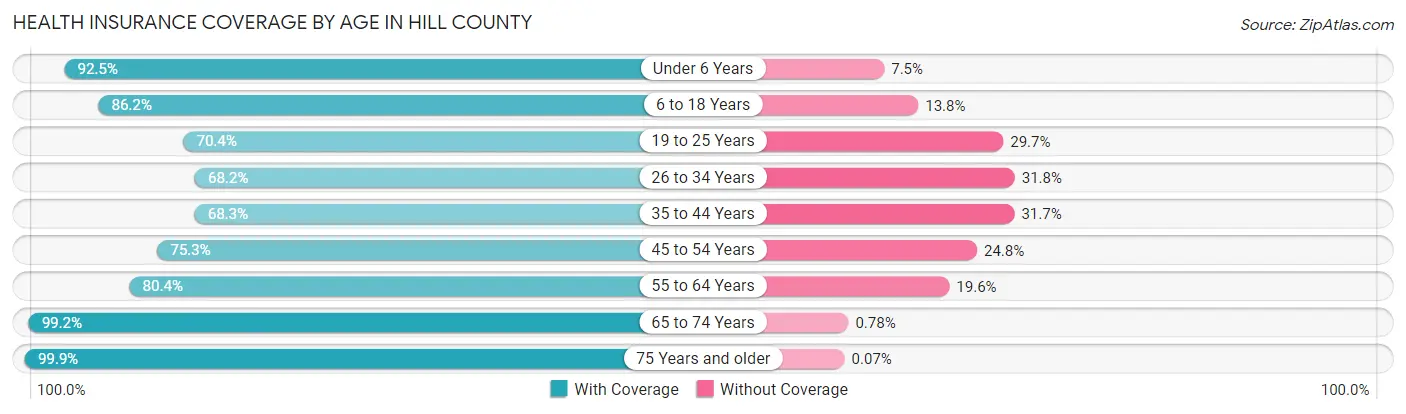
| Age Bracket | With Coverage | Without Coverage |
| Under 6 Years | 2,418 (92.5%) | 195 (7.5%) |
| 6 to 18 Years | 5,303 (86.2%) | 849 (13.8%) |
| 19 to 25 Years | 1,960 (70.4%) | 826 (29.6%) |
| 26 to 34 Years | 2,397 (68.2%) | 1,117 (31.8%) |
| 35 to 44 Years | 2,774 (68.3%) | 1,290 (31.7%) |
| 45 to 54 Years | 3,198 (75.2%) | 1,052 (24.7%) |
| 55 to 64 Years | 4,044 (80.4%) | 986 (19.6%) |
| 65 to 74 Years | 4,219 (99.2%) | 33 (0.8%) |
| 75 Years and older | 2,815 (99.9%) | 2 (0.1%) |
| Total | 29,128 (82.1%) | 6,350 (17.9%) |
Health Insurance Coverage by Citizenship Status in Hill County
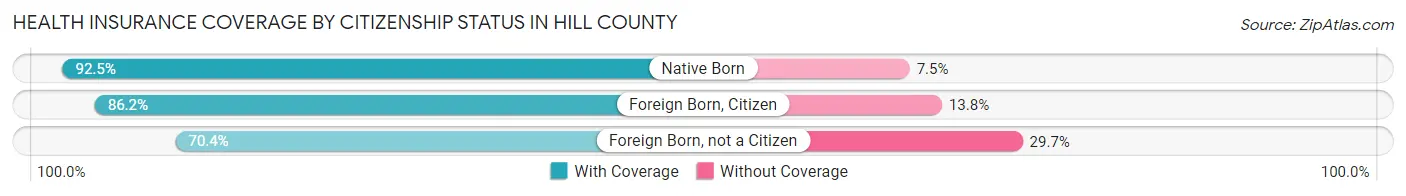
| Citizenship Status | With Coverage | Without Coverage |
| Native Born | 2,418 (92.5%) | 195 (7.5%) |
| Foreign Born, Citizen | 5,303 (86.2%) | 849 (13.8%) |
| Foreign Born, not a Citizen | 1,960 (70.4%) | 826 (29.6%) |
Health Insurance Coverage by Household Income in Hill County
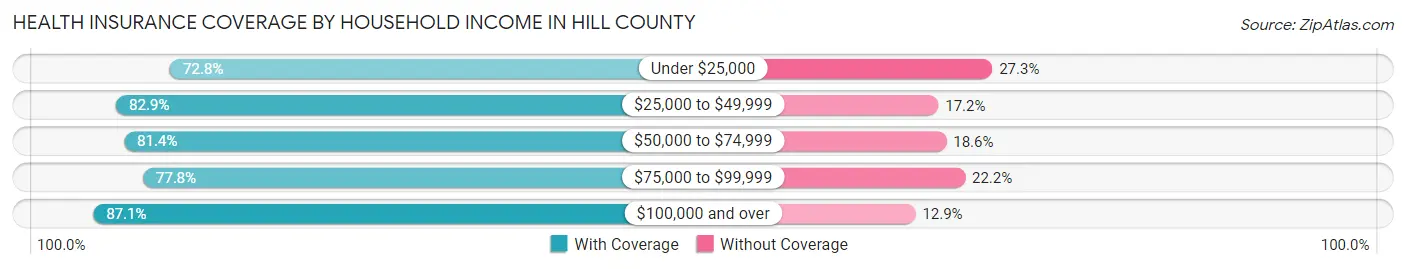
| Household Income | With Coverage | Without Coverage |
| Under $25,000 | 2,990 (72.8%) | 1,120 (27.3%) |
| $25,000 to $49,999 | 6,252 (82.9%) | 1,294 (17.2%) |
| $50,000 to $74,999 | 5,152 (81.4%) | 1,180 (18.6%) |
| $75,000 to $99,999 | 4,274 (77.8%) | 1,217 (22.2%) |
| $100,000 and over | 10,218 (87.1%) | 1,508 (12.9%) |
Public vs Private Health Insurance Coverage by Age in Hill County
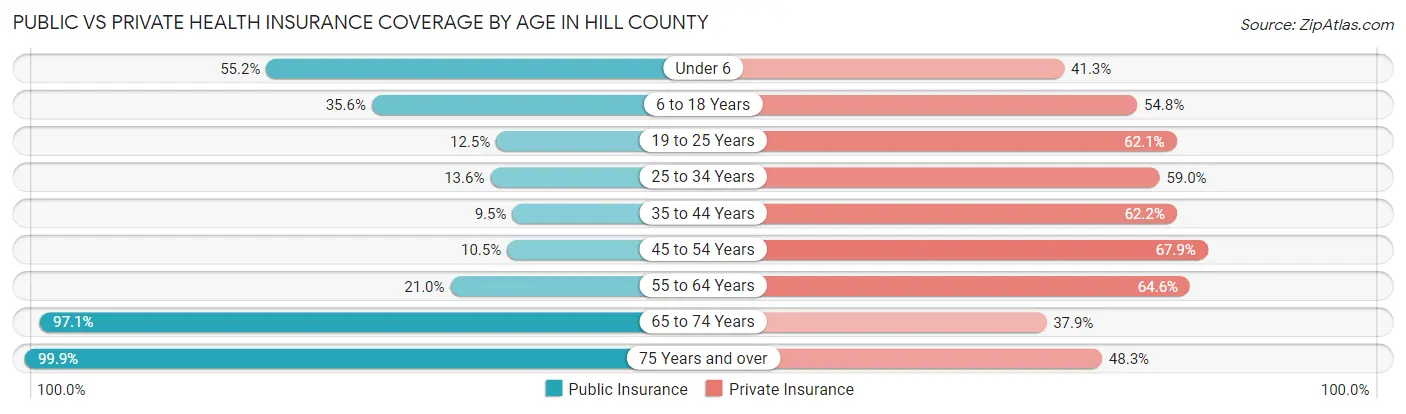
| Age Bracket | Public Insurance | Private Insurance |
| Under 6 | 1,441 (55.1%) | 1,078 (41.3%) |
| 6 to 18 Years | 2,188 (35.6%) | 3,371 (54.8%) |
| 19 to 25 Years | 348 (12.5%) | 1,730 (62.1%) |
| 25 to 34 Years | 477 (13.6%) | 2,072 (59.0%) |
| 35 to 44 Years | 385 (9.5%) | 2,526 (62.2%) |
| 45 to 54 Years | 444 (10.4%) | 2,886 (67.9%) |
| 55 to 64 Years | 1,055 (21.0%) | 3,250 (64.6%) |
| 65 to 74 Years | 4,129 (97.1%) | 1,613 (37.9%) |
| 75 Years and over | 2,815 (99.9%) | 1,360 (48.3%) |
| Total | 13,282 (37.4%) | 19,886 (56.0%) |
Disability Status by Sex by Age in Hill County
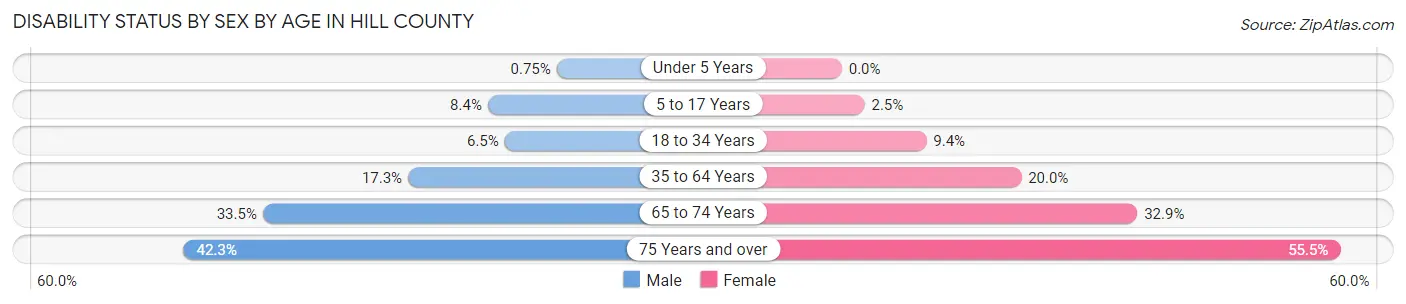
| Age Bracket | Male | Female |
| Under 5 Years | 8 (0.7%) | 0 (0.0%) |
| 5 to 17 Years | 270 (8.4%) | 77 (2.5%) |
| 18 to 34 Years | 229 (6.5%) | 307 (9.4%) |
| 35 to 64 Years | 1,152 (17.3%) | 1,336 (20.0%) |
| 65 to 74 Years | 700 (33.5%) | 711 (32.9%) |
| 75 Years and over | 565 (42.3%) | 822 (55.5%) |
Disability Class by Sex by Age in Hill County
Disability Class: Hearing Difficulty
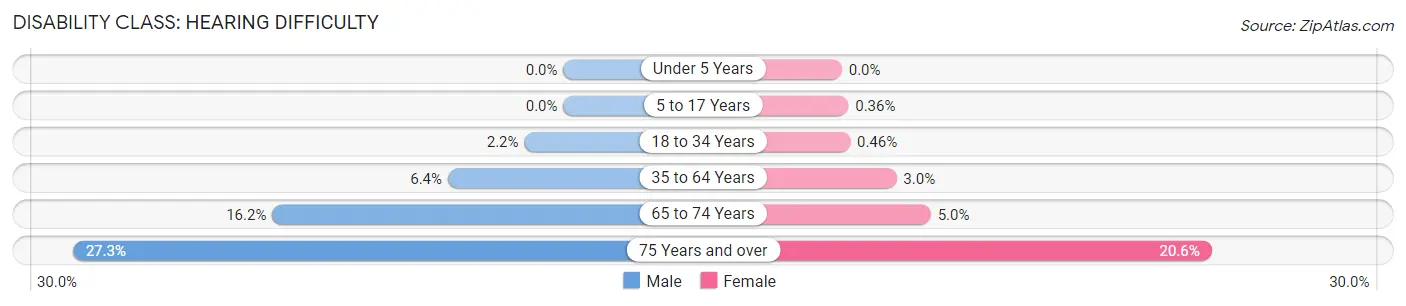
| Age Bracket | Male | Female |
| Under 5 Years | 0 (0.0%) | 0 (0.0%) |
| 5 to 17 Years | 0 (0.0%) | 11 (0.4%) |
| 18 to 34 Years | 76 (2.2%) | 15 (0.5%) |
| 35 to 64 Years | 428 (6.4%) | 203 (3.0%) |
| 65 to 74 Years | 339 (16.2%) | 107 (5.0%) |
| 75 Years and over | 365 (27.3%) | 305 (20.6%) |
Disability Class: Vision Difficulty
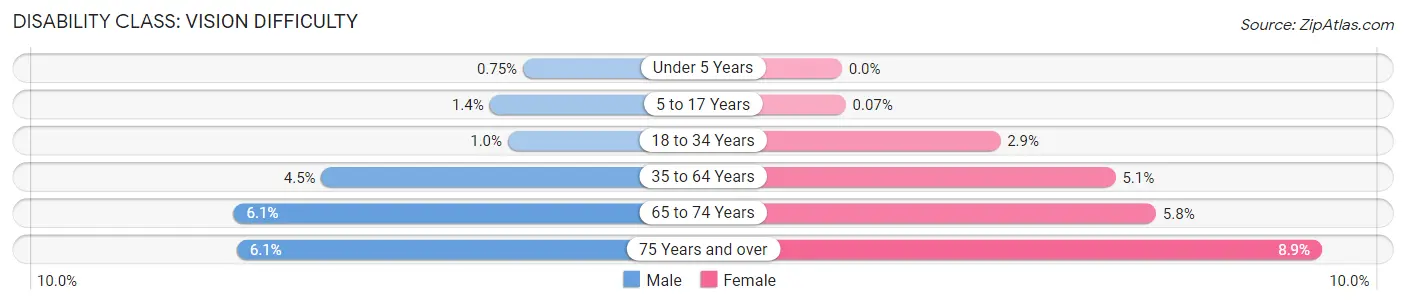
| Age Bracket | Male | Female |
| Under 5 Years | 8 (0.7%) | 0 (0.0%) |
| 5 to 17 Years | 44 (1.4%) | 2 (0.1%) |
| 18 to 34 Years | 36 (1.0%) | 96 (2.9%) |
| 35 to 64 Years | 299 (4.5%) | 340 (5.1%) |
| 65 to 74 Years | 128 (6.1%) | 126 (5.8%) |
| 75 Years and over | 81 (6.1%) | 132 (8.9%) |
Disability Class: Cognitive Difficulty
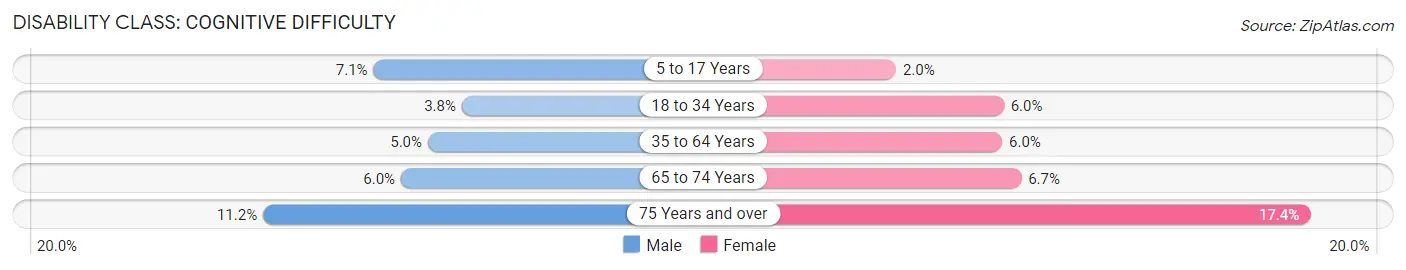
| Age Bracket | Male | Female |
| 5 to 17 Years | 226 (7.0%) | 61 (2.0%) |
| 18 to 34 Years | 132 (3.8%) | 196 (6.0%) |
| 35 to 64 Years | 335 (5.0%) | 398 (5.9%) |
| 65 to 74 Years | 126 (6.0%) | 144 (6.7%) |
| 75 Years and over | 149 (11.2%) | 258 (17.4%) |
Disability Class: Ambulatory Difficulty
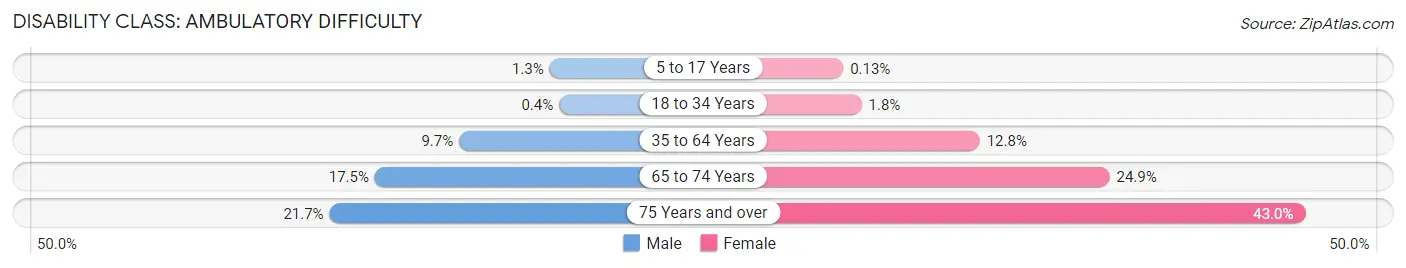
| Age Bracket | Male | Female |
| 5 to 17 Years | 41 (1.3%) | 4 (0.1%) |
| 18 to 34 Years | 14 (0.4%) | 60 (1.8%) |
| 35 to 64 Years | 644 (9.7%) | 856 (12.8%) |
| 65 to 74 Years | 366 (17.5%) | 537 (24.8%) |
| 75 Years and over | 290 (21.7%) | 637 (43.0%) |
Disability Class: Self-Care Difficulty
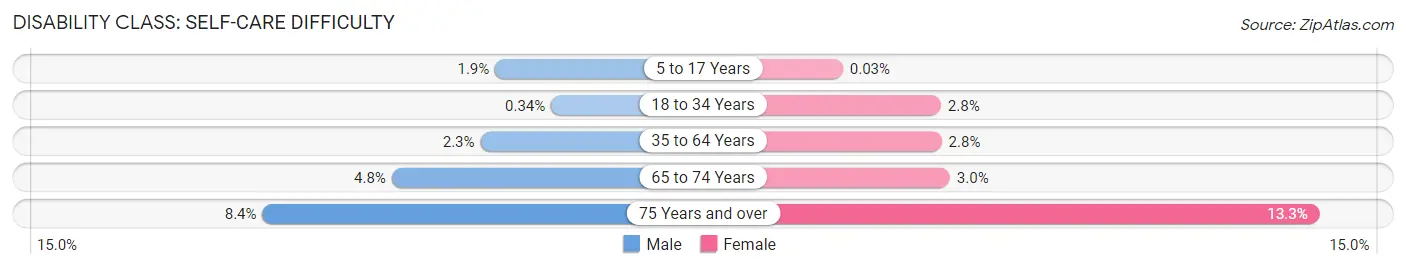
| Age Bracket | Male | Female |
| 5 to 17 Years | 61 (1.9%) | 1 (0.0%) |
| 18 to 34 Years | 12 (0.3%) | 90 (2.8%) |
| 35 to 64 Years | 154 (2.3%) | 186 (2.8%) |
| 65 to 74 Years | 100 (4.8%) | 65 (3.0%) |
| 75 Years and over | 112 (8.4%) | 197 (13.3%) |
Technology Access in Hill County
Computing Device Access in Hill County
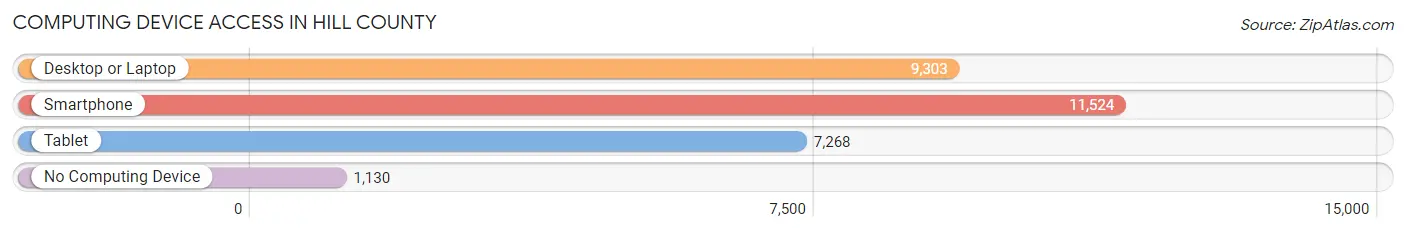
| Device Type | # Households | % Households |
| Desktop or Laptop | 9,303 | 69.5% |
| Smartphone | 11,524 | 86.1% |
| Tablet | 7,268 | 54.3% |
| No Computing Device | 1,130 | 8.4% |
| Total | 13,390 | 100.0% |
Internet Access in Hill County
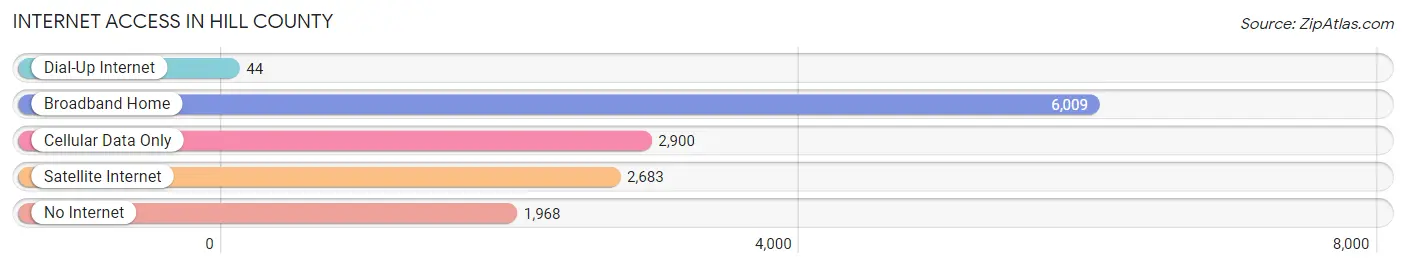
| Internet Type | # Households | % Households |
| Dial-Up Internet | 44 | 0.3% |
| Broadband Home | 6,009 | 44.9% |
| Cellular Data Only | 2,900 | 21.7% |
| Satellite Internet | 2,683 | 20.0% |
| No Internet | 1,968 | 14.7% |
| Total | 13,390 | 100.0% |
Hill County Summary
Hill County is located in Central Texas, and is part of the Waco Metropolitan Statistical Area. The county seat is Hillsboro, and the county is named for George Washington Hill, a former Texas Ranger and soldier in the Texas Revolution. Hill County covers an area of 890 square miles and has a population of 35,089, according to the 2010 census.
Geography
Hill County is located in Central Texas, and is bordered by Johnson County to the north, Bosque County to the east, McLennan County to the south, and Ellis County to the west. The county is located in the Brazos River Valley, and is part of the Waco Metropolitan Statistical Area. The county is mostly flat, with some rolling hills in the western part of the county. The highest point in the county is located in the western part of the county, at an elevation of 890 feet. The county is drained by the Brazos River, which flows through the county from north to south.
The county is home to several state parks, including Lake Whitney State Park, which is located on the shores of Lake Whitney, and Dinosaur Valley State Park, which is located on the Paluxy River. The county is also home to several wildlife management areas, including the Hill County Wildlife Management Area, which is located in the western part of the county.
Economy
The economy of Hill County is largely based on agriculture, with the county being one of the top producers of cotton in the state. Other crops grown in the county include corn, wheat, sorghum, and hay. The county is also home to several livestock operations, including cattle, sheep, and goats.
The county is also home to several manufacturing operations, including a paper mill, a plastics plant, and a metal fabrication plant. The county is also home to several oil and gas operations, as well as several wind farms.
Demographics
According to the 2010 census, Hill County had a population of 35,089. The racial makeup of the county was 79.3% White, 14.2% Hispanic or Latino, 4.2% African American, 0.7% Native American, 0.3% Asian, and 1.5% from other races. The median household income in the county was $41,945, and the median family income was $50,945.
The largest employers in the county are the Hillsboro Independent School District, Hill Regional Hospital, and the City of Hillsboro. Other major employers in the county include the Hill County Sheriff's Office, the Hill County Courthouse, and the Hill County Tax Office.
Conclusion
Hill County is located in Central Texas, and is part of the Waco Metropolitan Statistical Area. The county is mostly flat, with some rolling hills in the western part of the county. The economy of Hill County is largely based on agriculture, with the county being one of the top producers of cotton in the state. According to the 2010 census, Hill County had a population of 35,089, with the largest employers in the county being the Hillsboro Independent School District, Hill Regional Hospital, and the City of Hillsboro.
Common Questions
What is Per Capita Income in Hill County?
Per Capita income in Hill County is $30,730.
What is the Median Family Income in Hill County?
Median Family Income in Hill County is $73,509.
What is the Median Household income in Hill County?
Median Household Income in Hill County is $60,669.
What is Income or Wage Gap in Hill County?
Income or Wage Gap in Hill County is 40.3%.
Women in Hill County earn 59.7 cents for every dollar earned by a man.
What is Family Income Deficit in Hill County?
Family Income Deficit in Hill County is $8,978.
Families that are below poverty line in Hill County earn $8,978 less on average than the poverty threshold level.
What is Inequality or Gini Index in Hill County?
Inequality or Gini Index in Hill County is 0.44.
What is the Total Population of Hill County?
Total Population of Hill County is 36,138.
What is the Total Male Population of Hill County?
Total Male Population of Hill County is 18,161.
What is the Total Female Population of Hill County?
Total Female Population of Hill County is 17,977.
What is the Ratio of Males per 100 Females in Hill County?
There are 101.02 Males per 100 Females in Hill County.
What is the Ratio of Females per 100 Males in Hill County?
There are 98.99 Females per 100 Males in Hill County.
What is the Median Population Age in Hill County?
Median Population Age in Hill County is 41.2 Years.
What is the Average Family Size in Hill County
Average Family Size in Hill County is 3.2 People.
What is the Average Household Size in Hill County
Average Household Size in Hill County is 2.6 People.
How Large is the Labor Force in Hill County?
There are 16,595 People in the Labor Forcein in Hill County.
What is the Percentage of People in the Labor Force in Hill County?
57.7% of People are in the Labor Force in Hill County.
What is the Unemployment Rate in Hill County?
Unemployment Rate in Hill County is 4.5%.