Henderson County, TX Map & Demographics
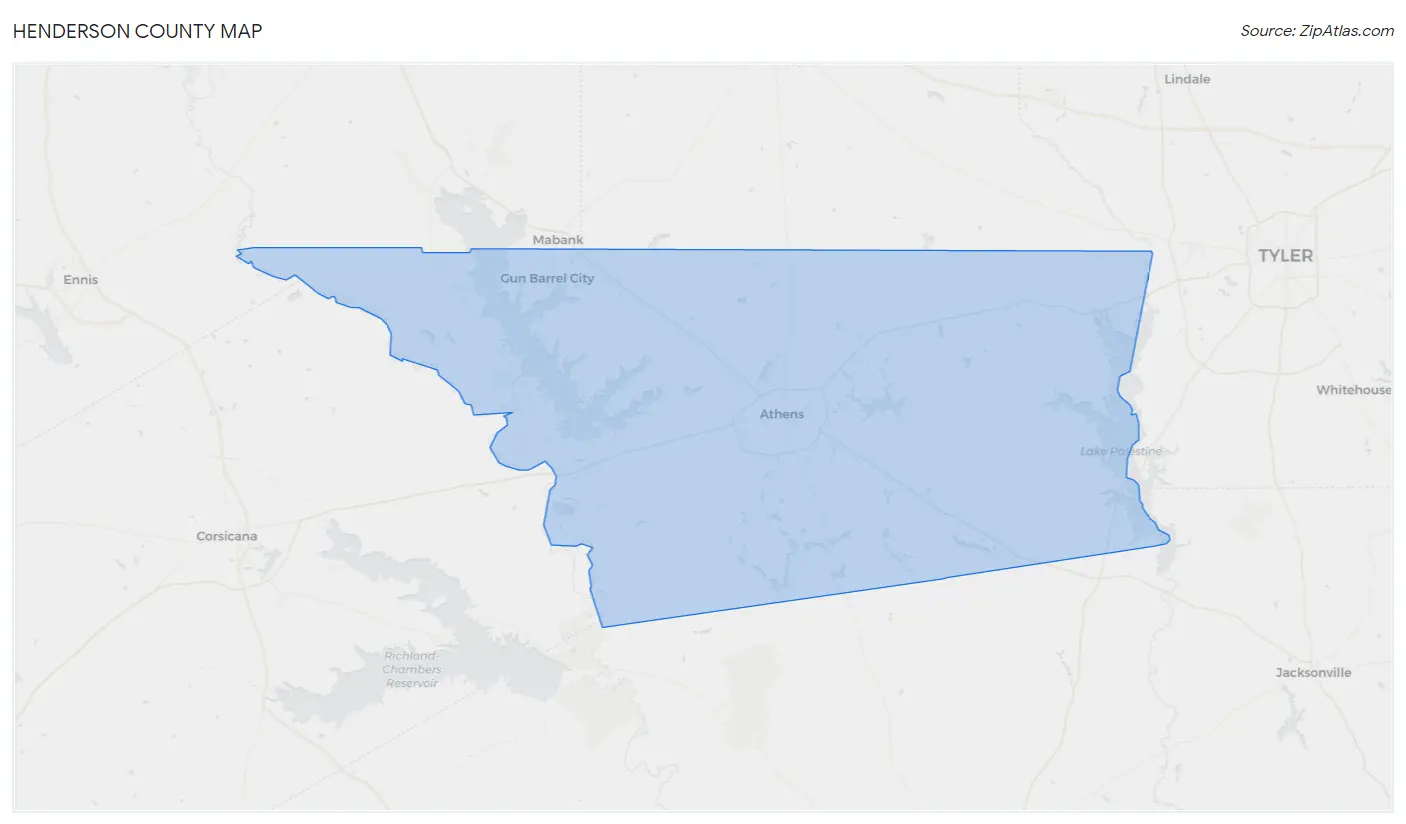
Henderson County Map
Henderson County Overview
$32,513
PER CAPITA INCOME
$71,798
AVG FAMILY INCOME
$59,778
AVG HOUSEHOLD INCOME
31.7%
WAGE / INCOME GAP [ % ]
68.3¢/ $1
WAGE / INCOME GAP [ $ ]
$10,817
FAMILY INCOME DEFICIT
0.48
INEQUALITY / GINI INDEX
82,627
TOTAL POPULATION
40,851
MALE POPULATION
41,776
FEMALE POPULATION
97.79
MALES / 100 FEMALES
102.26
FEMALES / 100 MALES
43.9
MEDIAN AGE
3.1
AVG FAMILY SIZE
2.5
AVG HOUSEHOLD SIZE
35,657
LABOR FORCE [ PEOPLE ]
53.2%
PERCENT IN LABOR FORCE
5.5%
UNEMPLOYMENT RATE
Income in Henderson County
Income Overview in Henderson County
Per Capita Income in Henderson County is $32,513, while median incomes of families and households are $71,798 and $59,778 respectively.
| Characteristic | Number | Measure |
| Per Capita Income | 82,627 | $32,513 |
| Median Family Income | 21,982 | $71,798 |
| Mean Family Income | 21,982 | $96,016 |
| Median Household Income | 31,973 | $59,778 |
| Mean Household Income | 31,973 | $81,990 |
| Income Deficit | 21,982 | $10,817 |
| Wage / Income Gap (%) | 82,627 | 31.69% |
| Wage / Income Gap ($) | 82,627 | 68.31¢ per $1 |
| Gini / Inequality Index | 82,627 | 0.48 |
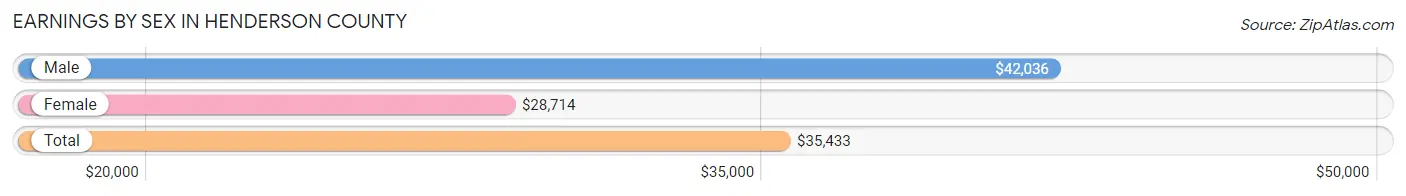
Earnings by Sex in Henderson County
Average Earnings in Henderson County are $35,433, $42,036 for men and $28,714 for women, a difference of 31.7%.
| Sex | Number | Average Earnings |
| Male | 20,459 (54.8%) | $42,036 |
| Female | 16,839 (45.2%) | $28,714 |
| Total | 37,298 (100.0%) | $35,433 |
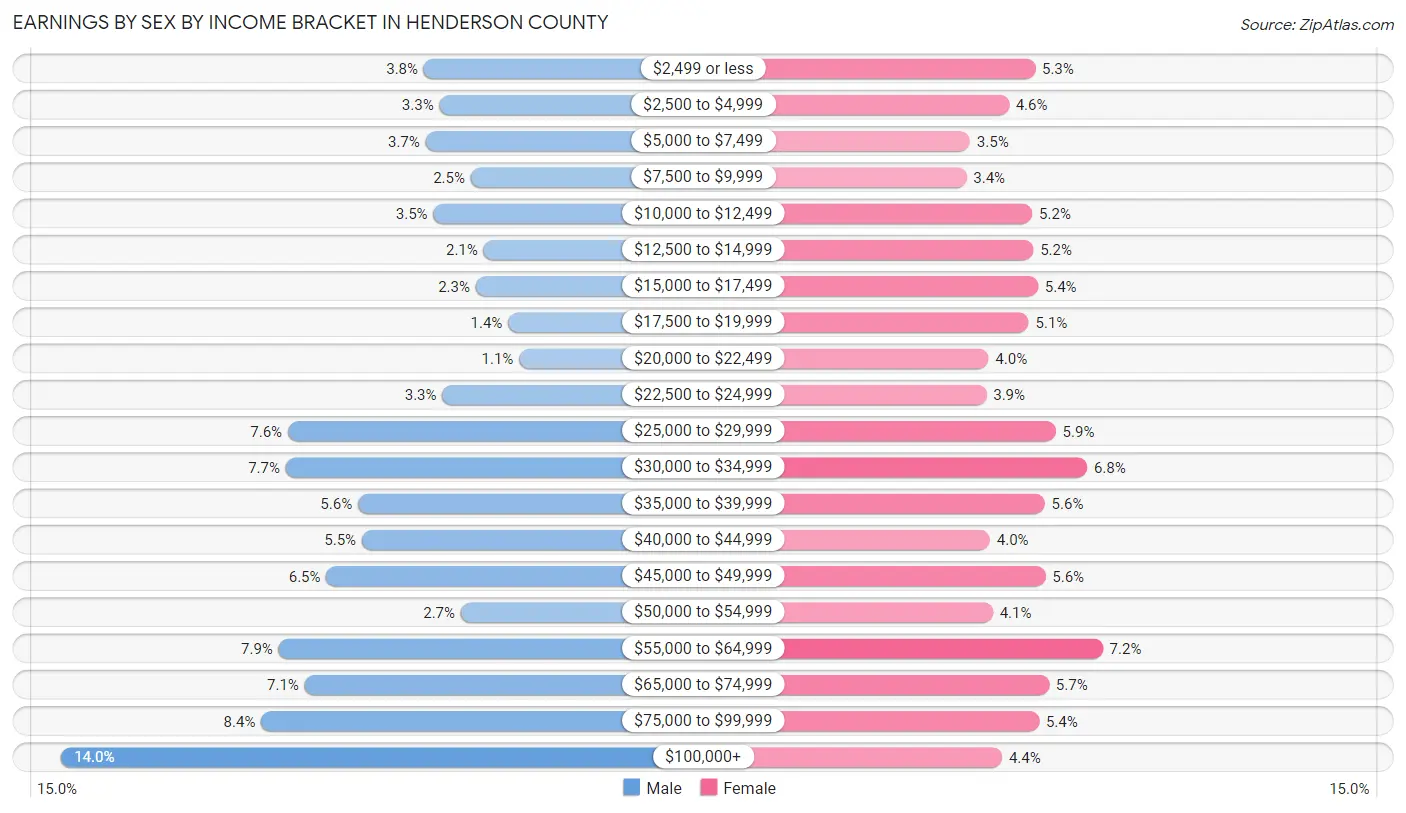
Earnings by Sex by Income Bracket in Henderson County
The most common earnings brackets in Henderson County are $100,000+ for men (2,859 | 14.0%) and $55,000 to $64,999 for women (1,211 | 7.2%).
| Income | Male | Female |
| $2,499 or less | 773 (3.8%) | 891 (5.3%) |
| $2,500 to $4,999 | 683 (3.3%) | 766 (4.5%) |
| $5,000 to $7,499 | 764 (3.7%) | 583 (3.5%) |
| $7,500 to $9,999 | 504 (2.5%) | 565 (3.4%) |
| $10,000 to $12,499 | 718 (3.5%) | 878 (5.2%) |
| $12,500 to $14,999 | 430 (2.1%) | 882 (5.2%) |
| $15,000 to $17,499 | 475 (2.3%) | 904 (5.4%) |
| $17,500 to $19,999 | 289 (1.4%) | 861 (5.1%) |
| $20,000 to $22,499 | 226 (1.1%) | 670 (4.0%) |
| $22,500 to $24,999 | 666 (3.3%) | 660 (3.9%) |
| $25,000 to $29,999 | 1,554 (7.6%) | 989 (5.9%) |
| $30,000 to $34,999 | 1,568 (7.7%) | 1,136 (6.8%) |
| $35,000 to $39,999 | 1,152 (5.6%) | 937 (5.6%) |
| $40,000 to $44,999 | 1,129 (5.5%) | 677 (4.0%) |
| $45,000 to $49,999 | 1,334 (6.5%) | 940 (5.6%) |
| $50,000 to $54,999 | 560 (2.7%) | 690 (4.1%) |
| $55,000 to $64,999 | 1,608 (7.9%) | 1,211 (7.2%) |
| $65,000 to $74,999 | 1,458 (7.1%) | 956 (5.7%) |
| $75,000 to $99,999 | 1,709 (8.4%) | 909 (5.4%) |
| $100,000+ | 2,859 (14.0%) | 734 (4.4%) |
| Total | 20,459 (100.0%) | 16,839 (100.0%) |
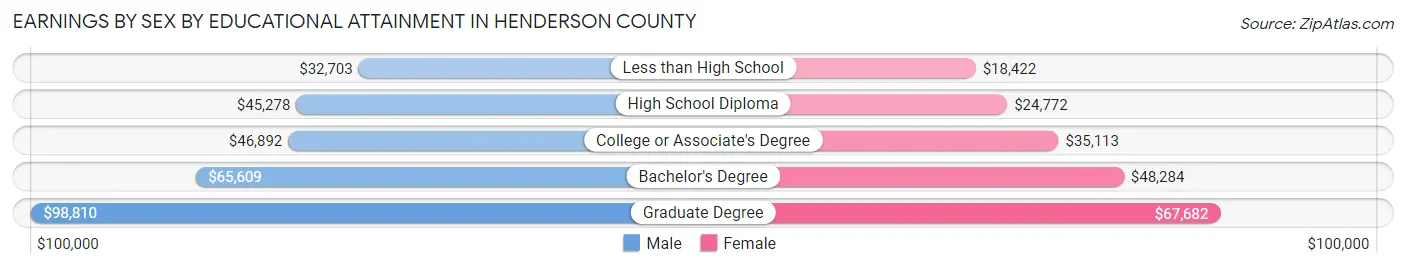
Earnings by Sex by Educational Attainment in Henderson County
Average earnings in Henderson County are $46,587 for men and $34,210 for women, a difference of 26.6%. Men with an educational attainment of graduate degree enjoy the highest average annual earnings of $98,810, while those with less than high school education earn the least with $32,703. Women with an educational attainment of graduate degree earn the most with the average annual earnings of $67,682, while those with less than high school education have the smallest earnings of $18,422.
| Educational Attainment | Male Income | Female Income |
| Less than High School | $32,703 | $18,422 |
| High School Diploma | $45,278 | $24,772 |
| College or Associate's Degree | $46,892 | $35,113 |
| Bachelor's Degree | $65,609 | $48,284 |
| Graduate Degree | $98,810 | $67,682 |
| Total | $46,587 | $34,210 |
Family Income in Henderson County
Family Income Brackets in Henderson County
According to the Henderson County family income data, there are 4,374 families falling into the $50,000 to $74,999 income range, which is the most common income bracket and makes up 19.9% of all families. Conversely, the $10,000 to $14,999 income bracket is the least frequent group with only 594 families (2.7%) belonging to this category.
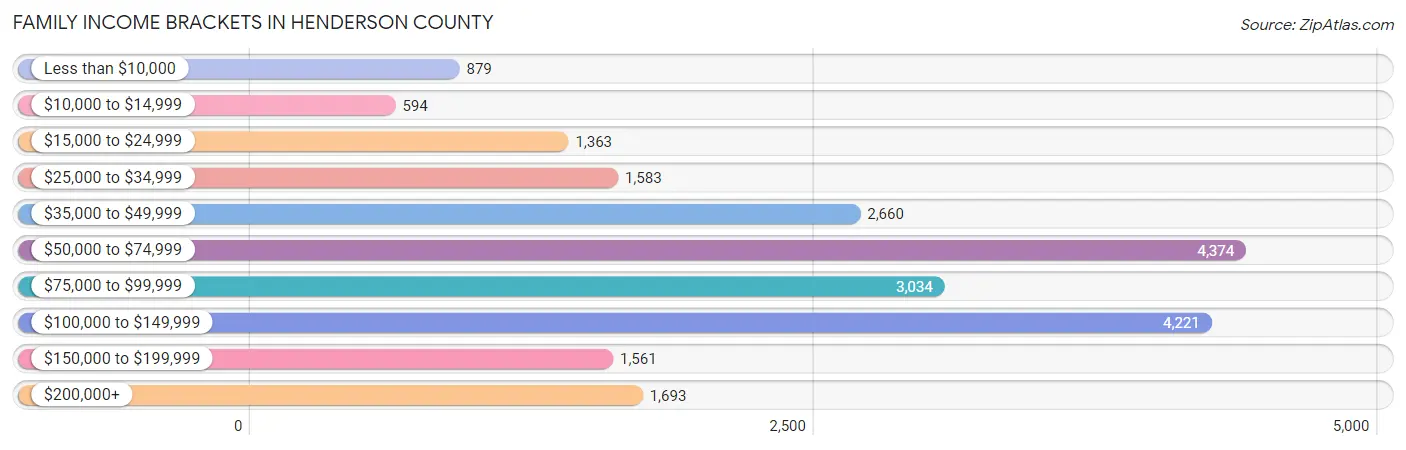
| Income Bracket | # Families | % Families |
| Less than $10,000 | 879 | 4.0% |
| $10,000 to $14,999 | 594 | 2.7% |
| $15,000 to $24,999 | 1,363 | 6.2% |
| $25,000 to $34,999 | 1,583 | 7.2% |
| $35,000 to $49,999 | 2,660 | 12.1% |
| $50,000 to $74,999 | 4,374 | 19.9% |
| $75,000 to $99,999 | 3,034 | 13.8% |
| $100,000 to $149,999 | 4,221 | 19.2% |
| $150,000 to $199,999 | 1,561 | 7.1% |
| $200,000+ | 1,693 | 7.7% |
Family Income by Famaliy Size in Henderson County
5-person families (1,625 | 7.4%) account for the highest median family income in Henderson County with $87,894 per family, while 2-person families (11,863 | 54.0%) have the highest median income of $34,044 per family member.
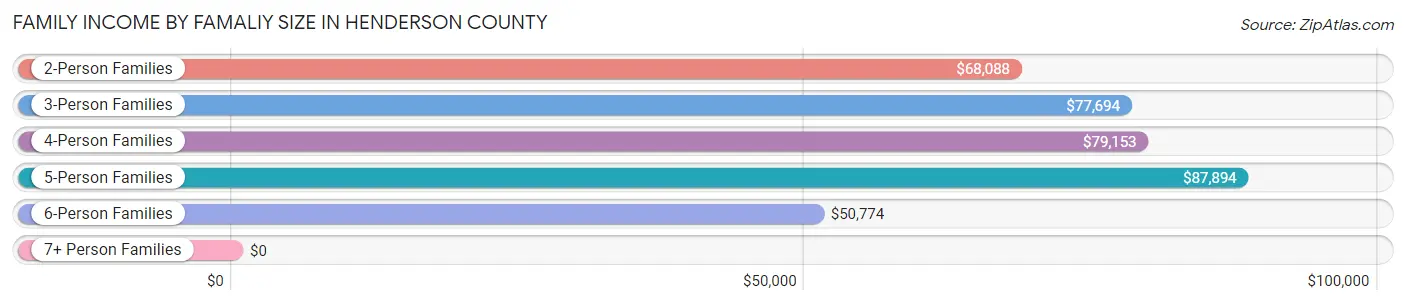
| Income Bracket | # Families | Median Income |
| 2-Person Families | 11,863 (54.0%) | $68,088 |
| 3-Person Families | 4,437 (20.2%) | $77,694 |
| 4-Person Families | 3,099 (14.1%) | $79,153 |
| 5-Person Families | 1,625 (7.4%) | $87,894 |
| 6-Person Families | 695 (3.2%) | $50,774 |
| 7+ Person Families | 263 (1.2%) | $0 |
| Total | 21,982 (100.0%) | $71,798 |
Family Income by Number of Earners in Henderson County
The median family income in Henderson County is $71,798, with families comprising 3+ earners (1,695) having the highest median family income of $117,321, while families with no earners (4,934) have the lowest median family income of $40,375, accounting for 7.7% and 22.5% of families, respectively.
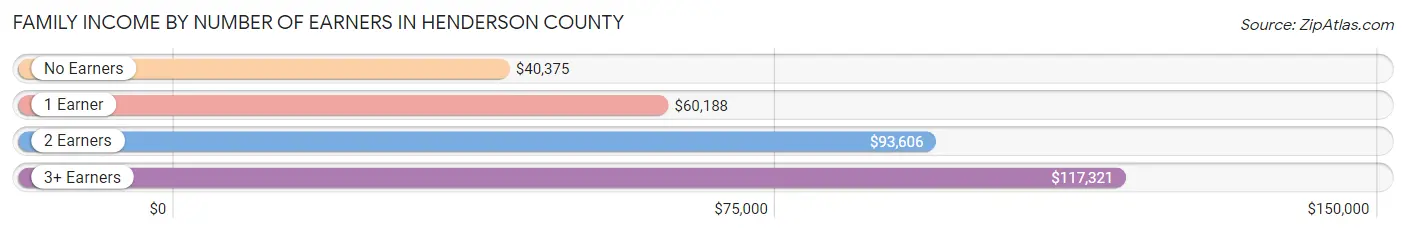
| Number of Earners | # Families | Median Income |
| No Earners | 4,934 (22.5%) | $40,375 |
| 1 Earner | 7,416 (33.7%) | $60,188 |
| 2 Earners | 7,937 (36.1%) | $93,606 |
| 3+ Earners | 1,695 (7.7%) | $117,321 |
| Total | 21,982 (100.0%) | $71,798 |
Household Income in Henderson County
Household Income Brackets in Henderson County
With 5,819 households falling in the category, the $50,000 to $74,999 income range is the most frequent in Henderson County, accounting for 18.2% of all households. In contrast, only 1,631 households (5.1%) fall into the $10,000 to $14,999 income bracket, making it the least populous group.
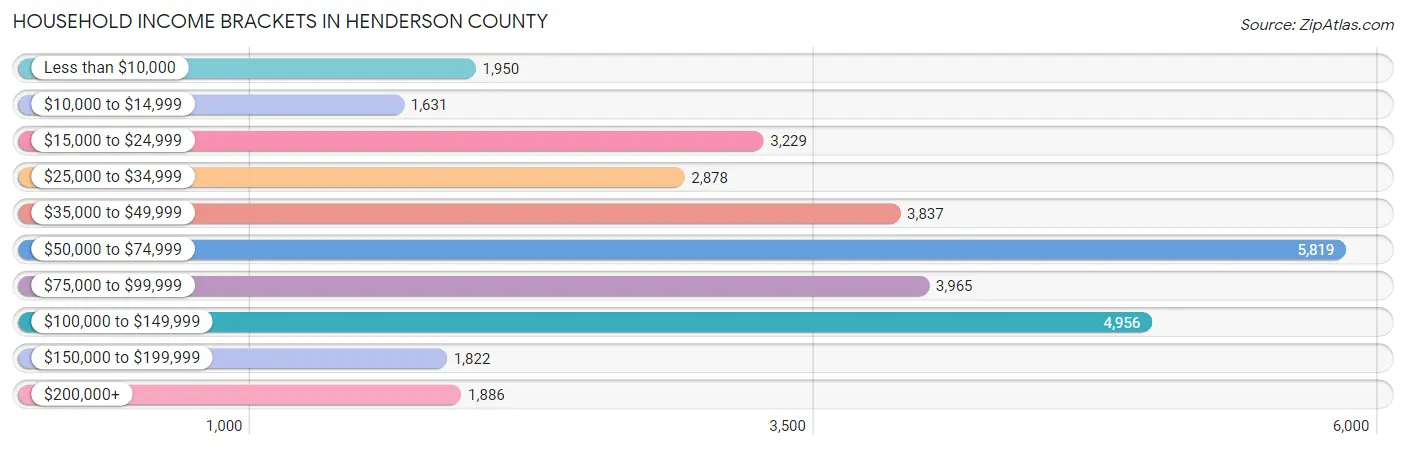
| Income Bracket | # Households | % Households |
| Less than $10,000 | 1,950 | 6.1% |
| $10,000 to $14,999 | 1,631 | 5.1% |
| $15,000 to $24,999 | 3,229 | 10.1% |
| $25,000 to $34,999 | 2,878 | 9.0% |
| $35,000 to $49,999 | 3,837 | 12.0% |
| $50,000 to $74,999 | 5,819 | 18.2% |
| $75,000 to $99,999 | 3,965 | 12.4% |
| $100,000 to $149,999 | 4,956 | 15.5% |
| $150,000 to $199,999 | 1,822 | 5.7% |
| $200,000+ | 1,886 | 5.9% |
Household Income by Householder Age in Henderson County
The median household income in Henderson County is $59,778, with the highest median household income of $69,091 found in the 45 to 64 years age bracket for the primary householder. A total of 11,306 households (35.4%) fall into this category. Meanwhile, the 65+ years age bracket for the primary householder has the lowest median household income of $48,352, with 11,595 households (36.3%) in this group.
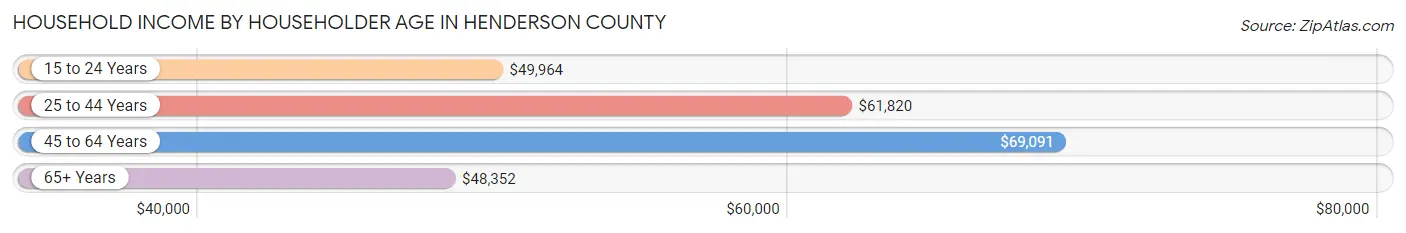
| Income Bracket | # Households | Median Income |
| 15 to 24 Years | 997 (3.1%) | $49,964 |
| 25 to 44 Years | 8,075 (25.3%) | $61,820 |
| 45 to 64 Years | 11,306 (35.4%) | $69,091 |
| 65+ Years | 11,595 (36.3%) | $48,352 |
| Total | 31,973 (100.0%) | $59,778 |
Poverty in Henderson County
Income Below Poverty by Sex and Age in Henderson County
With 14.8% poverty level for males and 14.8% for females among the residents of Henderson County, 12 to 14 year old males and under 5 year old females are the most vulnerable to poverty, with 828 males (36.4%) and 702 females (33.6%) in their respective age groups living below the poverty level.
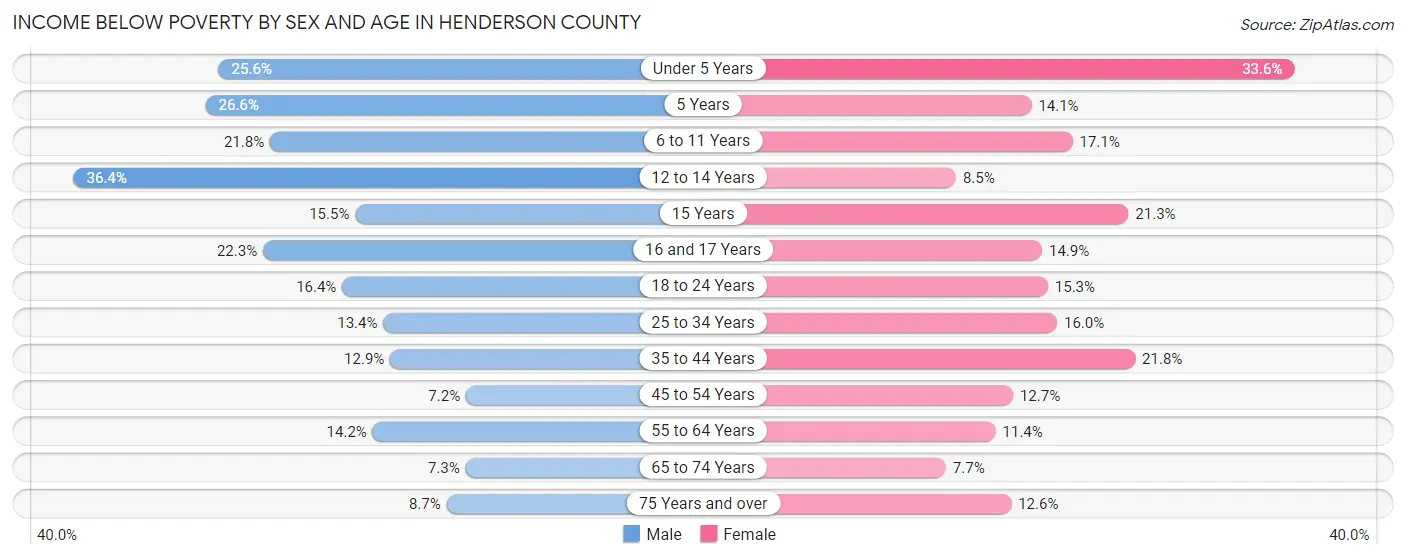
| Age Bracket | Male | Female |
| Under 5 Years | 618 (25.6%) | 702 (33.6%) |
| 5 Years | 136 (26.6%) | 40 (14.1%) |
| 6 to 11 Years | 498 (21.8%) | 491 (17.1%) |
| 12 to 14 Years | 828 (36.4%) | 134 (8.5%) |
| 15 Years | 95 (15.4%) | 113 (21.3%) |
| 16 and 17 Years | 244 (22.3%) | 142 (14.9%) |
| 18 to 24 Years | 530 (16.4%) | 454 (15.3%) |
| 25 to 34 Years | 609 (13.4%) | 713 (16.0%) |
| 35 to 44 Years | 548 (12.9%) | 985 (21.8%) |
| 45 to 54 Years | 341 (7.2%) | 638 (12.7%) |
| 55 to 64 Years | 804 (14.2%) | 725 (11.4%) |
| 65 to 74 Years | 365 (7.3%) | 413 (7.7%) |
| 75 Years and over | 293 (8.7%) | 527 (12.6%) |
| Total | 5,909 (14.8%) | 6,077 (14.8%) |
Income Above Poverty by Sex and Age in Henderson County
According to the poverty statistics in Henderson County, males aged 45 to 54 years and females aged 65 to 74 years are the age groups that are most secure financially, with 92.8% of males and 92.3% of females in these age groups living above the poverty line.
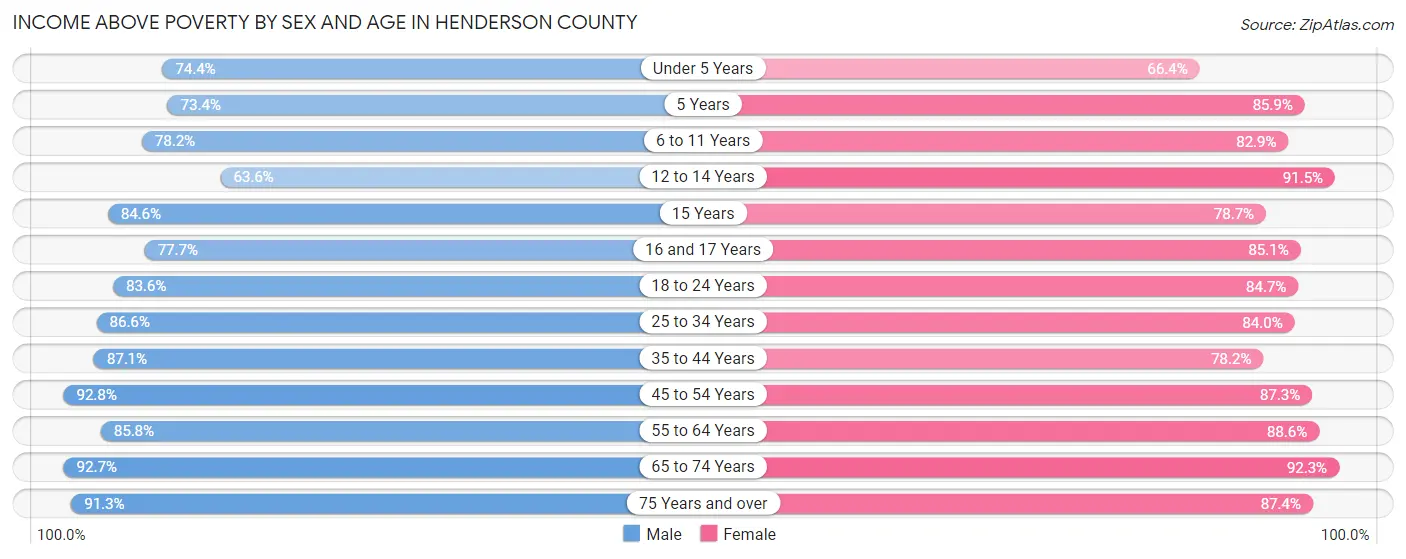
| Age Bracket | Male | Female |
| Under 5 Years | 1,797 (74.4%) | 1,388 (66.4%) |
| 5 Years | 376 (73.4%) | 244 (85.9%) |
| 6 to 11 Years | 1,789 (78.2%) | 2,375 (82.9%) |
| 12 to 14 Years | 1,449 (63.6%) | 1,447 (91.5%) |
| 15 Years | 520 (84.6%) | 418 (78.7%) |
| 16 and 17 Years | 850 (77.7%) | 813 (85.1%) |
| 18 to 24 Years | 2,697 (83.6%) | 2,513 (84.7%) |
| 25 to 34 Years | 3,946 (86.6%) | 3,750 (84.0%) |
| 35 to 44 Years | 3,712 (87.1%) | 3,537 (78.2%) |
| 45 to 54 Years | 4,375 (92.8%) | 4,381 (87.3%) |
| 55 to 64 Years | 4,874 (85.8%) | 5,624 (88.6%) |
| 65 to 74 Years | 4,666 (92.7%) | 4,931 (92.3%) |
| 75 Years and over | 3,087 (91.3%) | 3,663 (87.4%) |
| Total | 34,138 (85.2%) | 35,084 (85.2%) |
Income Below Poverty Among Married-Couple Families in Henderson County
The poverty statistics for married-couple families in Henderson County show that 6.3% or 1,091 of the total 17,237 families live below the poverty line. Families with 3 or 4 children have the highest poverty rate of 22.9%, comprising of 312 families. On the other hand, families with no children have the lowest poverty rate of 3.9%, which includes 442 families.
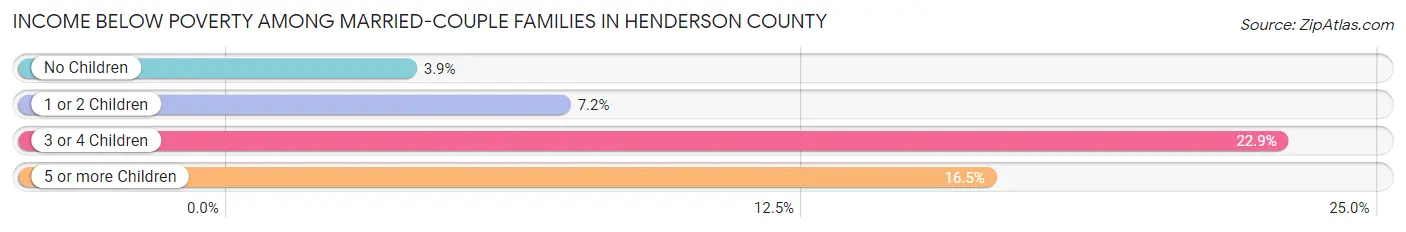
| Children | Above Poverty | Below Poverty |
| No Children | 10,916 (96.1%) | 442 (3.9%) |
| 1 or 2 Children | 4,086 (92.8%) | 319 (7.2%) |
| 3 or 4 Children | 1,053 (77.1%) | 312 (22.9%) |
| 5 or more Children | 91 (83.5%) | 18 (16.5%) |
| Total | 16,146 (93.7%) | 1,091 (6.3%) |
Income Below Poverty Among Single-Parent Households in Henderson County
According to the poverty data in Henderson County, 18.2% or 228 single-father households and 32.7% or 1,140 single-mother households are living below the poverty line. Among single-father households, those with 1 or 2 children have the highest poverty rate, with 117 households (25.0%) experiencing poverty. Likewise, among single-mother households, those with 3 or 4 children have the highest poverty rate, with 194 households (67.6%) falling below the poverty line.
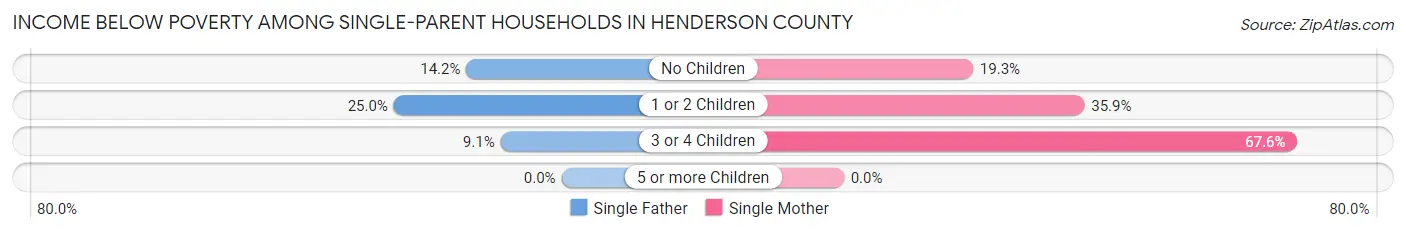
| Children | Single Father | Single Mother |
| No Children | 110 (14.2%) | 235 (19.3%) |
| 1 or 2 Children | 117 (25.0%) | 711 (35.8%) |
| 3 or 4 Children | 1 (9.1%) | 194 (67.6%) |
| 5 or more Children | 0 (0.0%) | 0 (0.0%) |
| Total | 228 (18.2%) | 1,140 (32.7%) |
Income Below Poverty Among Married-Couple vs Single-Parent Households in Henderson County
The poverty data for Henderson County shows that 1,091 of the married-couple family households (6.3%) and 1,368 of the single-parent households (28.8%) are living below the poverty level. Within the married-couple family households, those with 3 or 4 children have the highest poverty rate, with 312 households (22.9%) falling below the poverty line. Among the single-parent households, those with 3 or 4 children have the highest poverty rate, with 195 household (65.4%) living below poverty.
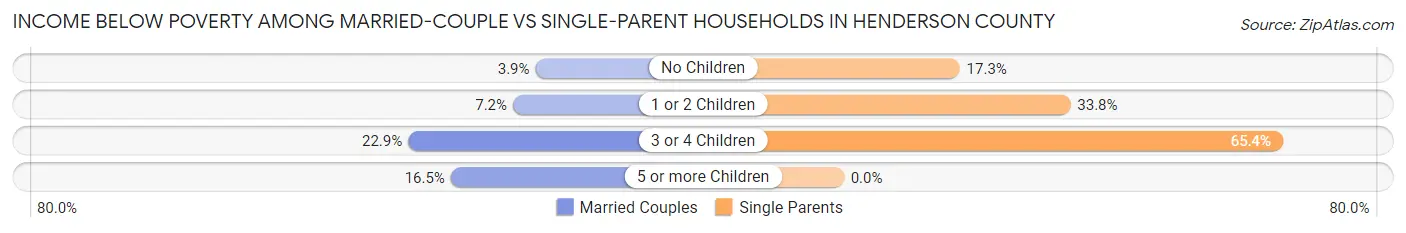
| Children | Married-Couple Families | Single-Parent Households |
| No Children | 442 (3.9%) | 345 (17.3%) |
| 1 or 2 Children | 319 (7.2%) | 828 (33.8%) |
| 3 or 4 Children | 312 (22.9%) | 195 (65.4%) |
| 5 or more Children | 18 (16.5%) | 0 (0.0%) |
| Total | 1,091 (6.3%) | 1,368 (28.8%) |
Race in Henderson County
The most populous races in Henderson County are White / Caucasian (68,511 | 82.9%), Hispanic or Latino (11,544 | 14.0%), and Two or more Races (7,259 | 8.8%).
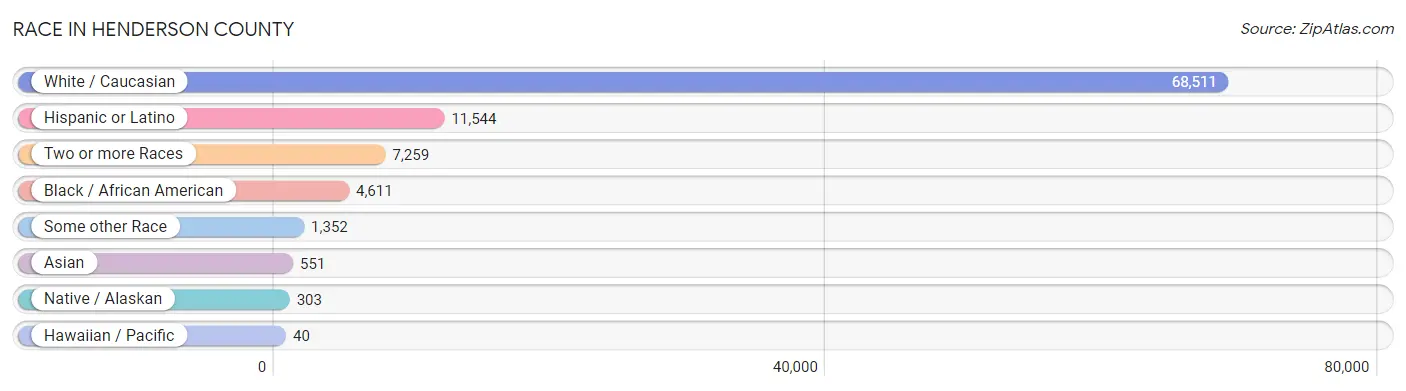
| Race | # Population | % Population |
| Asian | 551 | 0.7% |
| Black / African American | 4,611 | 5.6% |
| Hawaiian / Pacific | 40 | 0.1% |
| Hispanic or Latino | 11,544 | 14.0% |
| Native / Alaskan | 303 | 0.4% |
| White / Caucasian | 68,511 | 82.9% |
| Two or more Races | 7,259 | 8.8% |
| Some other Race | 1,352 | 1.6% |
| Total | 82,627 | 100.0% |
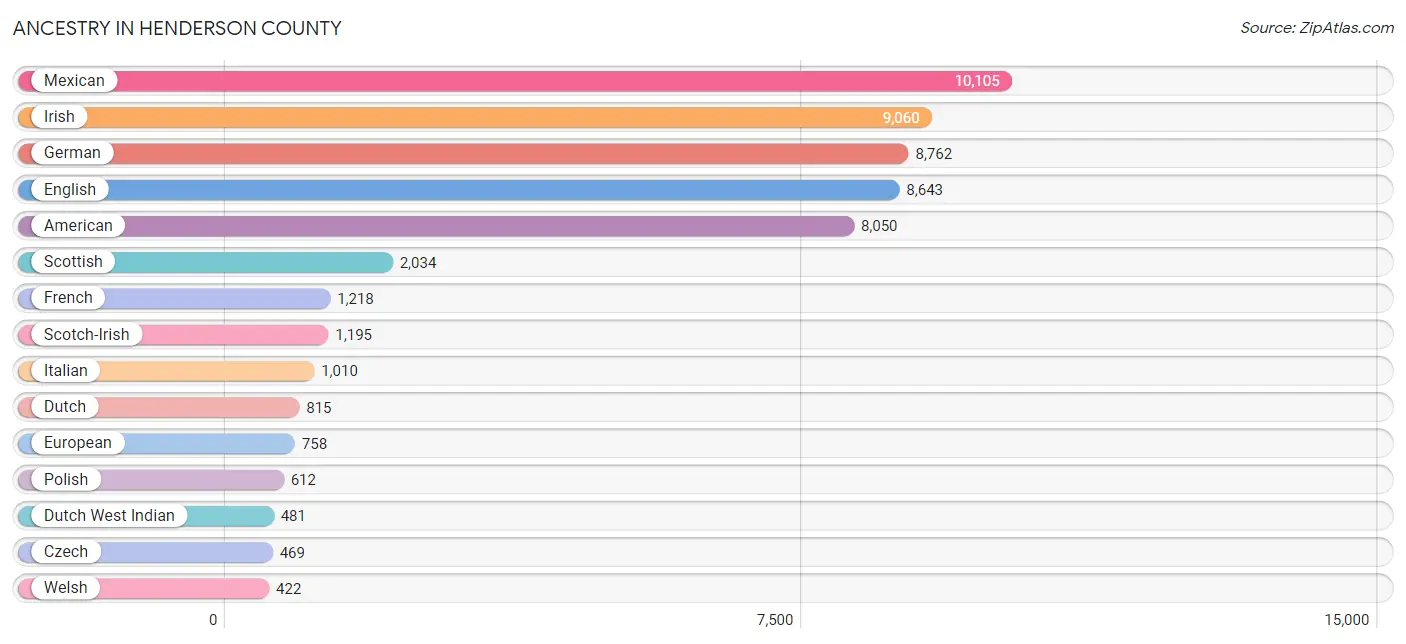
Ancestry in Henderson County
The most populous ancestries reported in Henderson County are Mexican (10,105 | 12.2%), Irish (9,060 | 11.0%), German (8,762 | 10.6%), English (8,643 | 10.5%), and American (8,050 | 9.7%), together accounting for 54.0% of all Henderson County residents.
| Ancestry | # Population | % Population |
| African | 371 | 0.4% |
| Albanian | 35 | 0.0% |
| American | 8,050 | 9.7% |
| Apache | 5 | 0.0% |
| Arab | 71 | 0.1% |
| Armenian | 24 | 0.0% |
| Australian | 16 | 0.0% |
| Austrian | 19 | 0.0% |
| Basque | 25 | 0.0% |
| Belgian | 47 | 0.1% |
| Bermudan | 18 | 0.0% |
| Bhutanese | 18 | 0.0% |
| Blackfeet | 24 | 0.0% |
| Bolivian | 11 | 0.0% |
| British | 209 | 0.3% |
| Burmese | 71 | 0.1% |
| Cajun | 66 | 0.1% |
| Canadian | 111 | 0.1% |
| Celtic | 12 | 0.0% |
| Central American | 302 | 0.4% |
| Central American Indian | 4 | 0.0% |
| Cherokee | 375 | 0.4% |
| Chickasaw | 28 | 0.0% |
| Chilean | 54 | 0.1% |
| Choctaw | 63 | 0.1% |
| Colombian | 40 | 0.1% |
| Comanche | 8 | 0.0% |
| Creek | 47 | 0.1% |
| Croatian | 34 | 0.0% |
| Cuban | 52 | 0.1% |
| Czech | 469 | 0.6% |
| Czechoslovakian | 66 | 0.1% |
| Danish | 54 | 0.1% |
| Delaware | 8 | 0.0% |
| Dominican | 68 | 0.1% |
| Dutch | 815 | 1.0% |
| Dutch West Indian | 481 | 0.6% |
| Eastern European | 80 | 0.1% |
| Egyptian | 3 | 0.0% |
| English | 8,643 | 10.5% |
| Estonian | 17 | 0.0% |
| European | 758 | 0.9% |
| Filipino | 4 | 0.0% |
| Finnish | 32 | 0.0% |
| French | 1,218 | 1.5% |
| French Canadian | 67 | 0.1% |
| German | 8,762 | 10.6% |
| Greek | 154 | 0.2% |
| Guamanian / Chamorro | 8 | 0.0% |
| Guatemalan | 66 | 0.1% |
| Haitian | 11 | 0.0% |
| Honduran | 223 | 0.3% |
| Hungarian | 52 | 0.1% |
| Indian (Asian) | 50 | 0.1% |
| Iranian | 63 | 0.1% |
| Irish | 9,060 | 11.0% |
| Iroquois | 17 | 0.0% |
| Italian | 1,010 | 1.2% |
| Jamaican | 16 | 0.0% |
| Japanese | 258 | 0.3% |
| Korean | 103 | 0.1% |
| Lebanese | 25 | 0.0% |
| Lithuanian | 32 | 0.0% |
| Maltese | 9 | 0.0% |
| Mexican | 10,105 | 12.2% |
| Mexican American Indian | 52 | 0.1% |
| Native Hawaiian | 41 | 0.1% |
| Navajo | 29 | 0.0% |
| Northern European | 57 | 0.1% |
| Norwegian | 367 | 0.4% |
| Osage | 3 | 0.0% |
| Paiute | 4 | 0.0% |
| Pennsylvania German | 35 | 0.0% |
| Peruvian | 25 | 0.0% |
| Polish | 612 | 0.7% |
| Portuguese | 156 | 0.2% |
| Potawatomi | 16 | 0.0% |
| Puerto Rican | 264 | 0.3% |
| Romanian | 42 | 0.1% |
| Russian | 56 | 0.1% |
| Salvadoran | 13 | 0.0% |
| Scandinavian | 257 | 0.3% |
| Scotch-Irish | 1,195 | 1.5% |
| Scottish | 2,034 | 2.5% |
| Seminole | 22 | 0.0% |
| Slavic | 13 | 0.0% |
| Slovak | 5 | 0.0% |
| South American | 132 | 0.2% |
| Spaniard | 3 | 0.0% |
| Spanish | 143 | 0.2% |
| Sri Lankan | 57 | 0.1% |
| Subsaharan African | 371 | 0.4% |
| Swedish | 225 | 0.3% |
| Swiss | 66 | 0.1% |
| Thai | 80 | 0.1% |
| Turkish | 20 | 0.0% |
| Ukrainian | 54 | 0.1% |
| Venezuelan | 2 | 0.0% |
| Welsh | 422 | 0.5% |
| Yugoslavian | 18 | 0.0% | View All 100 Rows |
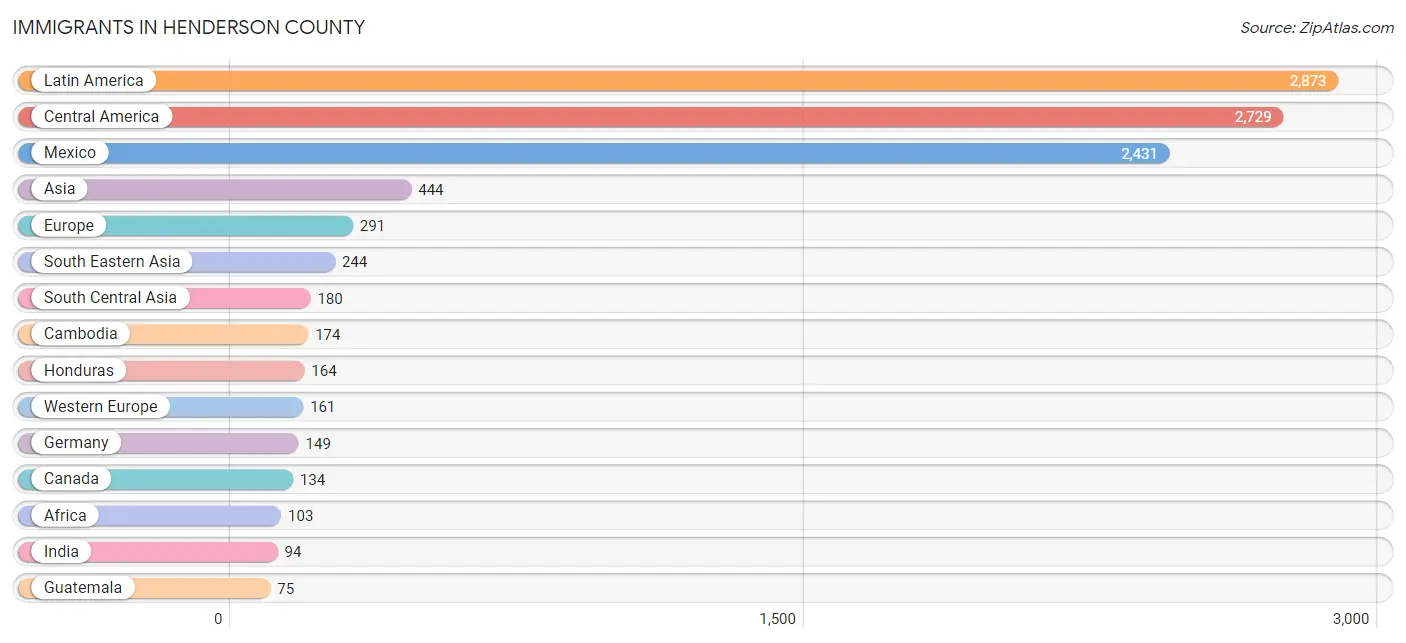
Immigrants in Henderson County
The most numerous immigrant groups reported in Henderson County came from Latin America (2,873 | 3.5%), Central America (2,729 | 3.3%), Mexico (2,431 | 2.9%), Asia (444 | 0.5%), and Europe (291 | 0.4%), together accounting for 10.6% of all Henderson County residents.
| Immigration Origin | # Population | % Population |
| Africa | 103 | 0.1% |
| Asia | 444 | 0.5% |
| Australia | 5 | 0.0% |
| Austria | 8 | 0.0% |
| Belgium | 4 | 0.0% |
| Bolivia | 8 | 0.0% |
| Cambodia | 174 | 0.2% |
| Canada | 134 | 0.2% |
| Caribbean | 69 | 0.1% |
| Central America | 2,729 | 3.3% |
| Chile | 15 | 0.0% |
| China | 15 | 0.0% |
| Colombia | 40 | 0.1% |
| Cuba | 31 | 0.0% |
| Dominican Republic | 1 | 0.0% |
| Eastern Asia | 18 | 0.0% |
| Eastern Europe | 16 | 0.0% |
| Egypt | 3 | 0.0% |
| El Salvador | 59 | 0.1% |
| England | 32 | 0.0% |
| Europe | 291 | 0.4% |
| Germany | 149 | 0.2% |
| Greece | 48 | 0.1% |
| Guatemala | 75 | 0.1% |
| Honduras | 164 | 0.2% |
| India | 94 | 0.1% |
| Iran | 20 | 0.0% |
| Jamaica | 16 | 0.0% |
| Japan | 3 | 0.0% |
| Latin America | 2,873 | 3.5% |
| Mexico | 2,431 | 2.9% |
| Nepal | 66 | 0.1% |
| Northern Africa | 3 | 0.0% |
| Northern Europe | 66 | 0.1% |
| Oceania | 5 | 0.0% |
| Peru | 12 | 0.0% |
| Philippines | 30 | 0.0% |
| Poland | 4 | 0.0% |
| South America | 75 | 0.1% |
| South Central Asia | 180 | 0.2% |
| South Eastern Asia | 244 | 0.3% |
| Southern Europe | 48 | 0.1% |
| Taiwan | 3 | 0.0% |
| Trinidad and Tobago | 21 | 0.0% |
| Ukraine | 10 | 0.0% |
| Vietnam | 40 | 0.1% |
| Western Asia | 2 | 0.0% |
| Western Europe | 161 | 0.2% | View All 48 Rows |
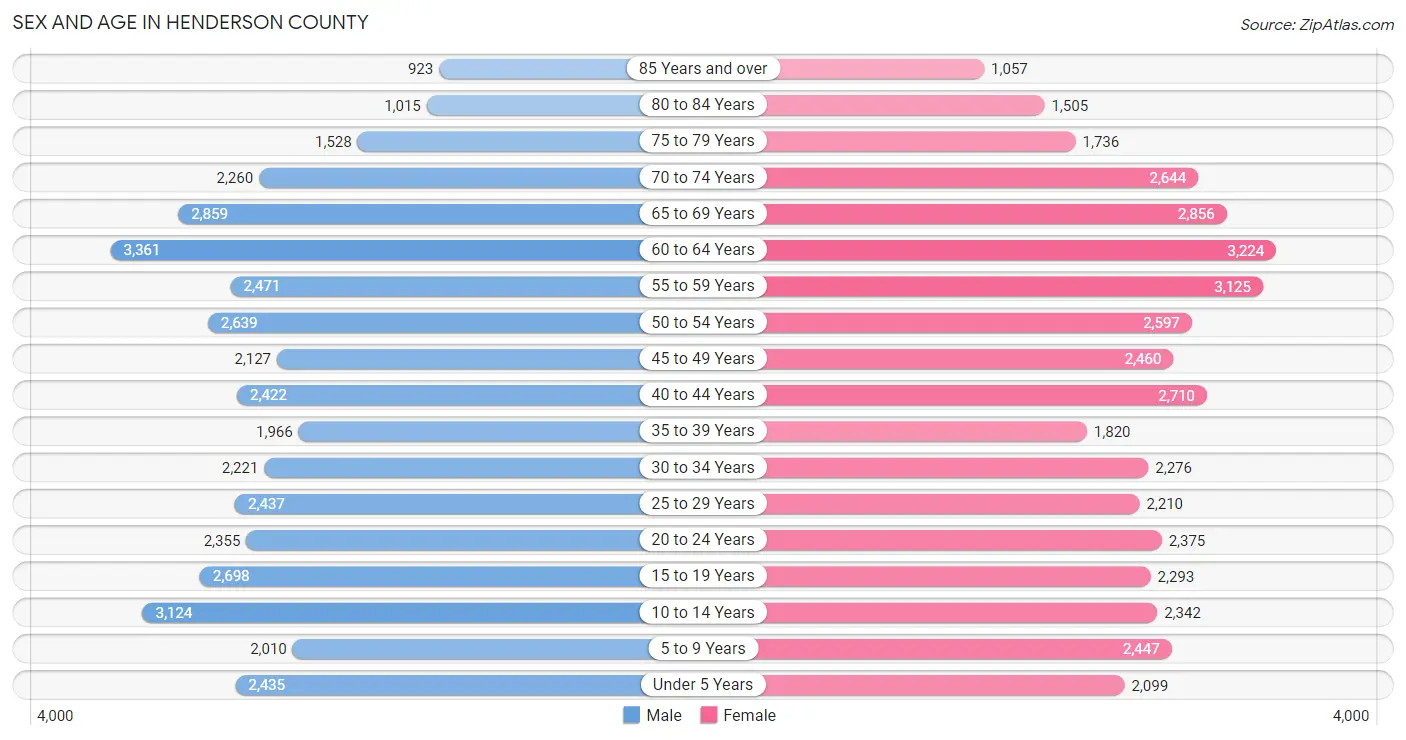
Sex and Age in Henderson County
Sex and Age in Henderson County
The most populous age groups in Henderson County are 60 to 64 Years (3,361 | 8.2%) for men and 60 to 64 Years (3,224 | 7.7%) for women.
| Age Bracket | Male | Female |
| Under 5 Years | 2,435 (6.0%) | 2,099 (5.0%) |
| 5 to 9 Years | 2,010 (4.9%) | 2,447 (5.9%) |
| 10 to 14 Years | 3,124 (7.6%) | 2,342 (5.6%) |
| 15 to 19 Years | 2,698 (6.6%) | 2,293 (5.5%) |
| 20 to 24 Years | 2,355 (5.8%) | 2,375 (5.7%) |
| 25 to 29 Years | 2,437 (6.0%) | 2,210 (5.3%) |
| 30 to 34 Years | 2,221 (5.4%) | 2,276 (5.4%) |
| 35 to 39 Years | 1,966 (4.8%) | 1,820 (4.4%) |
| 40 to 44 Years | 2,422 (5.9%) | 2,710 (6.5%) |
| 45 to 49 Years | 2,127 (5.2%) | 2,460 (5.9%) |
| 50 to 54 Years | 2,639 (6.5%) | 2,597 (6.2%) |
| 55 to 59 Years | 2,471 (6.0%) | 3,125 (7.5%) |
| 60 to 64 Years | 3,361 (8.2%) | 3,224 (7.7%) |
| 65 to 69 Years | 2,859 (7.0%) | 2,856 (6.8%) |
| 70 to 74 Years | 2,260 (5.5%) | 2,644 (6.3%) |
| 75 to 79 Years | 1,528 (3.7%) | 1,736 (4.2%) |
| 80 to 84 Years | 1,015 (2.5%) | 1,505 (3.6%) |
| 85 Years and over | 923 (2.3%) | 1,057 (2.5%) |
| Total | 40,851 (100.0%) | 41,776 (100.0%) |
Families and Households in Henderson County
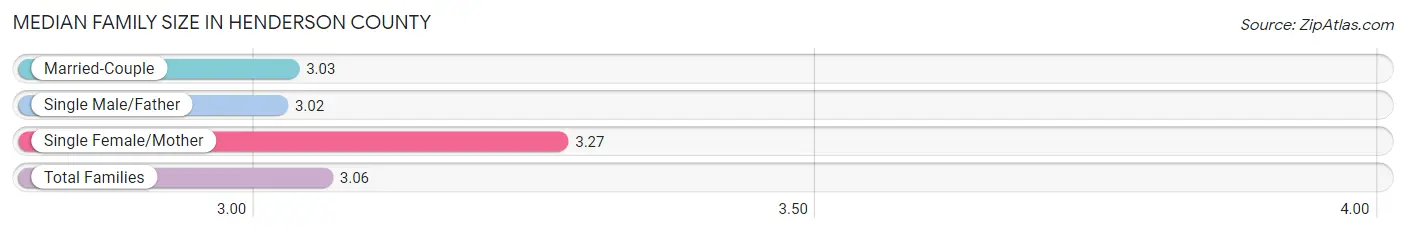
Median Family Size in Henderson County
The median family size in Henderson County is 3.06 persons per family, with single female/mother families (3,490 | 15.9%) accounting for the largest median family size of 3.27 persons per family. On the other hand, single male/father families (1,255 | 5.7%) represent the smallest median family size with 3.02 persons per family.
| Family Type | # Families | Family Size |
| Married-Couple | 17,237 (78.4%) | 3.03 |
| Single Male/Father | 1,255 (5.7%) | 3.02 |
| Single Female/Mother | 3,490 (15.9%) | 3.27 |
| Total Families | 21,982 (100.0%) | 3.06 |
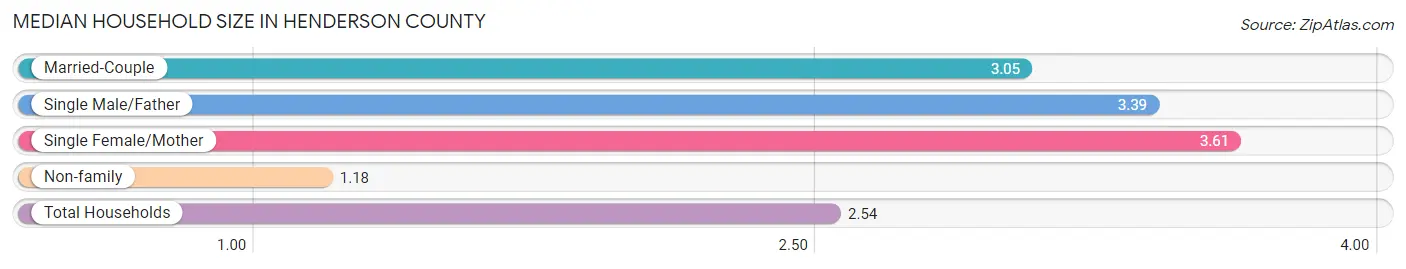
Median Household Size in Henderson County
The median household size in Henderson County is 2.54 persons per household, with single female/mother households (3,490 | 10.9%) accounting for the largest median household size of 3.61 persons per household. non-family households (9,991 | 31.2%) represent the smallest median household size with 1.18 persons per household.
| Household Type | # Households | Household Size |
| Married-Couple | 17,237 (53.9%) | 3.05 |
| Single Male/Father | 1,255 (3.9%) | 3.39 |
| Single Female/Mother | 3,490 (10.9%) | 3.61 |
| Non-family | 9,991 (31.2%) | 1.18 |
| Total Households | 31,973 (100.0%) | 2.54 |
Household Size by Marriage Status in Henderson County
Out of a total of 31,973 households in Henderson County, 21,982 (68.8%) are family households, while 9,991 (31.2%) are nonfamily households. The most numerous type of family households are 2-person households, comprising 11,221, and the most common type of nonfamily households are 1-person households, comprising 8,471.
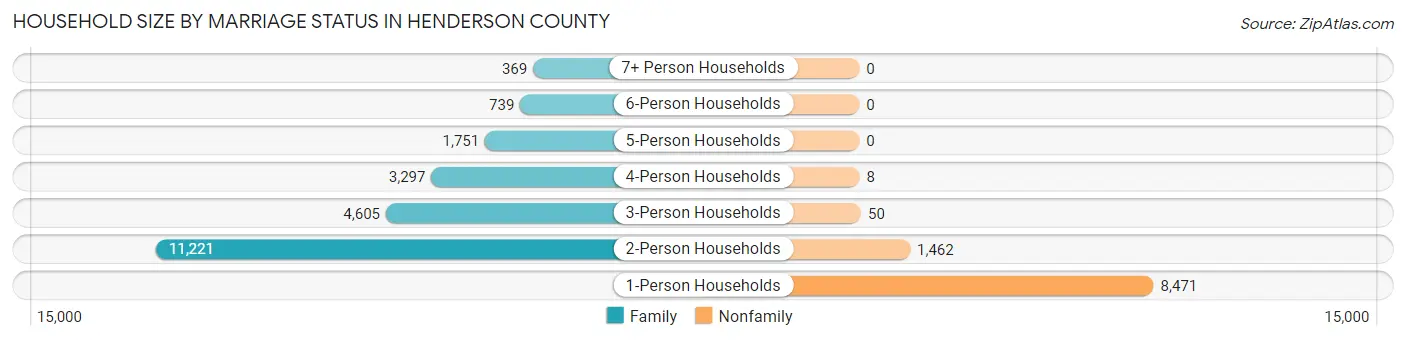
| Household Size | Family Households | Nonfamily Households |
| 1-Person Households | - | 8,471 (26.5%) |
| 2-Person Households | 11,221 (35.1%) | 1,462 (4.6%) |
| 3-Person Households | 4,605 (14.4%) | 50 (0.2%) |
| 4-Person Households | 3,297 (10.3%) | 8 (0.0%) |
| 5-Person Households | 1,751 (5.5%) | 0 (0.0%) |
| 6-Person Households | 739 (2.3%) | 0 (0.0%) |
| 7+ Person Households | 369 (1.1%) | 0 (0.0%) |
| Total | 21,982 (68.8%) | 9,991 (31.2%) |
Female Fertility in Henderson County
Fertility by Age in Henderson County
Average fertility rate in Henderson County is 75.0 births per 1,000 women. Women in the age bracket of 20 to 34 years have the highest fertility rate with 131.0 births per 1,000 women. Women in the age bracket of 20 to 34 years acount for 71.2% of all women with births.
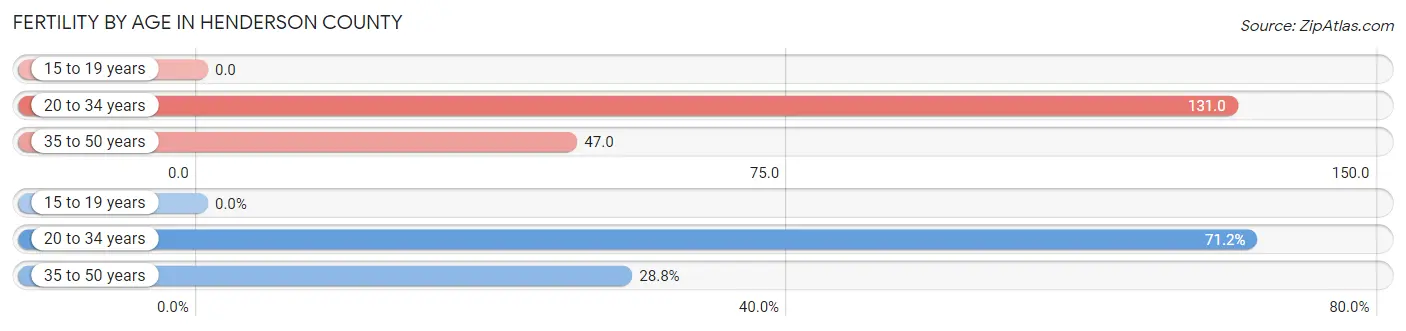
| Age Bracket | Women with Births | Births / 1,000 Women |
| 15 to 19 years | 0 (0.0%) | 0.0 |
| 20 to 34 years | 900 (71.2%) | 131.0 |
| 35 to 50 years | 364 (28.8%) | 47.0 |
| Total | 1,264 (100.0%) | 75.0 |
Fertility by Age by Marriage Status in Henderson County
81.4% of women with births (1,264) in Henderson County are married. The highest percentage of unmarried women with births falls into 20 to 34 years age bracket with 20.8% of them unmarried at the time of birth, while the lowest percentage of unmarried women with births belong to 35 to 50 years age bracket with 13.2% of them unmarried.
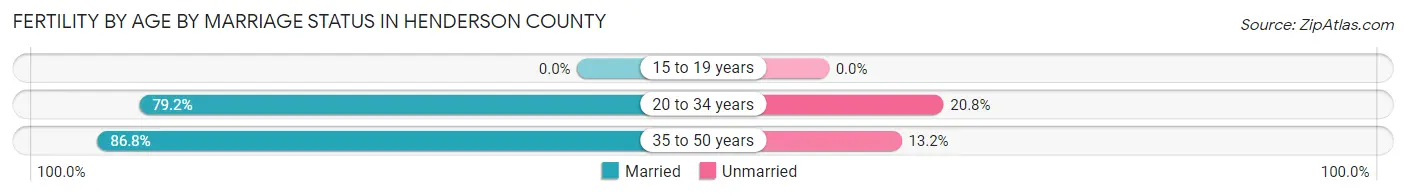
| Age Bracket | Married | Unmarried |
| 15 to 19 years | 0 (0.0%) | 0 (0.0%) |
| 20 to 34 years | 713 (79.2%) | 187 (20.8%) |
| 35 to 50 years | 316 (86.8%) | 48 (13.2%) |
| Total | 1,029 (81.4%) | 235 (18.6%) |
Fertility by Education in Henderson County
Average fertility rate in Henderson County is 75.0 births per 1,000 women. Women with the education attainment of high school diploma have the highest fertility rate of 145.0 births per 1,000 women, while women with the education attainment of bachelor's degree have the lowest fertility at 25.0 births per 1,000 women. Women with the education attainment of high school diploma represent 58.9% of all women with births.
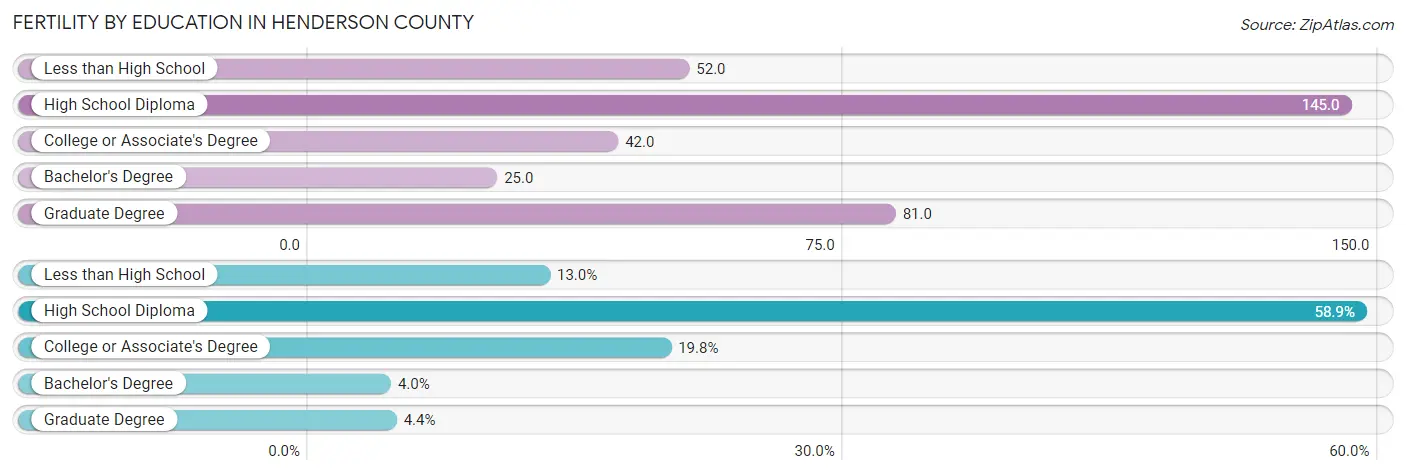
| Educational Attainment | Women with Births | Births / 1,000 Women |
| Less than High School | 164 (13.0%) | 52.0 |
| High School Diploma | 744 (58.9%) | 145.0 |
| College or Associate's Degree | 250 (19.8%) | 42.0 |
| Bachelor's Degree | 51 (4.0%) | 25.0 |
| Graduate Degree | 55 (4.3%) | 81.0 |
| Total | 1,264 (100.0%) | 75.0 |
Fertility by Education by Marriage Status in Henderson County
18.6% of women with births in Henderson County are unmarried. Women with the educational attainment of bachelor's degree are most likely to be married with 100.0% of them married at childbirth, while women with the educational attainment of less than high school are least likely to be married with 44.5% of them unmarried at childbirth.
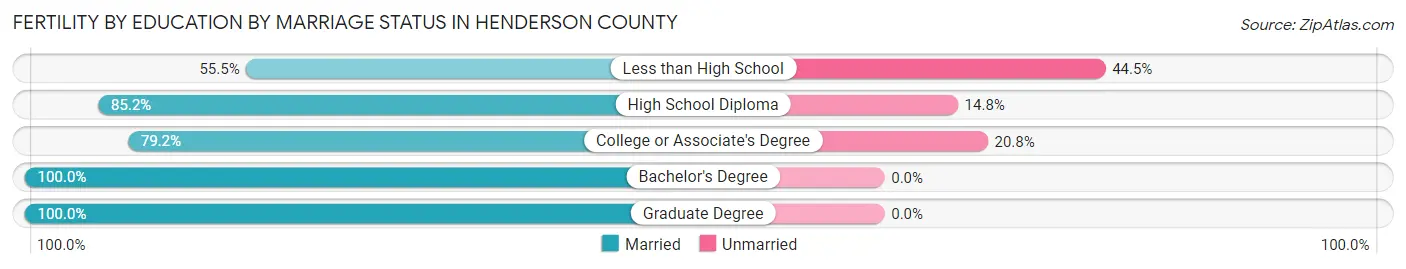
| Educational Attainment | Married | Unmarried |
| Less than High School | 91 (55.5%) | 73 (44.5%) |
| High School Diploma | 634 (85.2%) | 110 (14.8%) |
| College or Associate's Degree | 198 (79.2%) | 52 (20.8%) |
| Bachelor's Degree | 51 (100.0%) | 0 (0.0%) |
| Graduate Degree | 55 (100.0%) | 0 (0.0%) |
| Total | 1,029 (81.4%) | 235 (18.6%) |
Employment Characteristics in Henderson County
Employment by Class of Employer in Henderson County
Among the 33,007 employed individuals in Henderson County, private company employees (22,058 | 66.8%), local government employees (3,036 | 9.2%), and self-employed (not incorporated) (2,788 | 8.5%) make up the most common classes of employment.
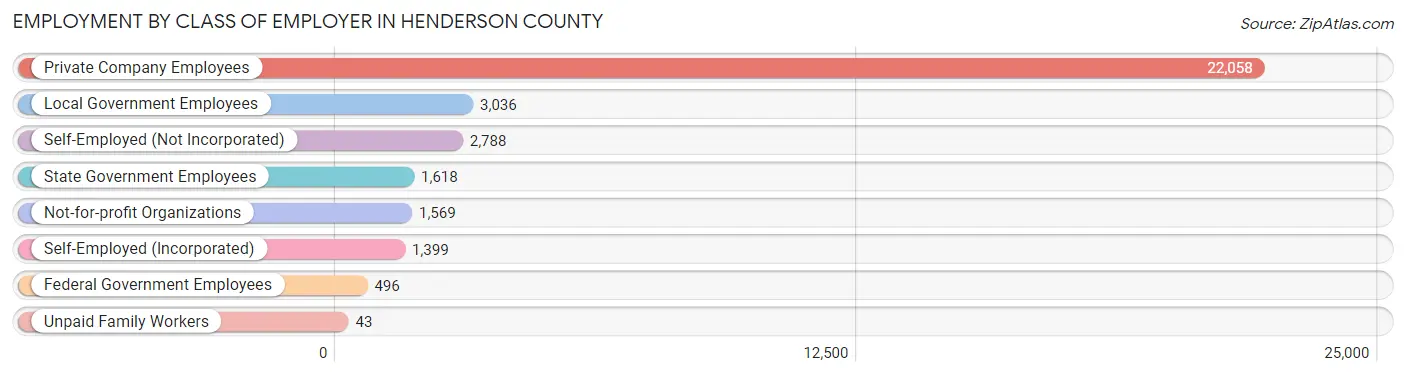
| Employer Class | # Employees | % Employees |
| Private Company Employees | 22,058 | 66.8% |
| Self-Employed (Incorporated) | 1,399 | 4.2% |
| Self-Employed (Not Incorporated) | 2,788 | 8.5% |
| Not-for-profit Organizations | 1,569 | 4.8% |
| Local Government Employees | 3,036 | 9.2% |
| State Government Employees | 1,618 | 4.9% |
| Federal Government Employees | 496 | 1.5% |
| Unpaid Family Workers | 43 | 0.1% |
| Total | 33,007 | 100.0% |
Employment Status by Age in Henderson County
According to the labor force statistics for Henderson County, out of the total population over 16 years of age (67,024), 53.2% or 35,657 individuals are in the labor force, with 5.5% or 1,961 of them unemployed. The age group with the highest labor force participation rate is 25 to 29 years, with 81.5% or 3,787 individuals in the labor force. Within the labor force, the 16 to 19 years age range has the highest percentage of unemployed individuals, with 9.8% or 103 of them being unemployed.
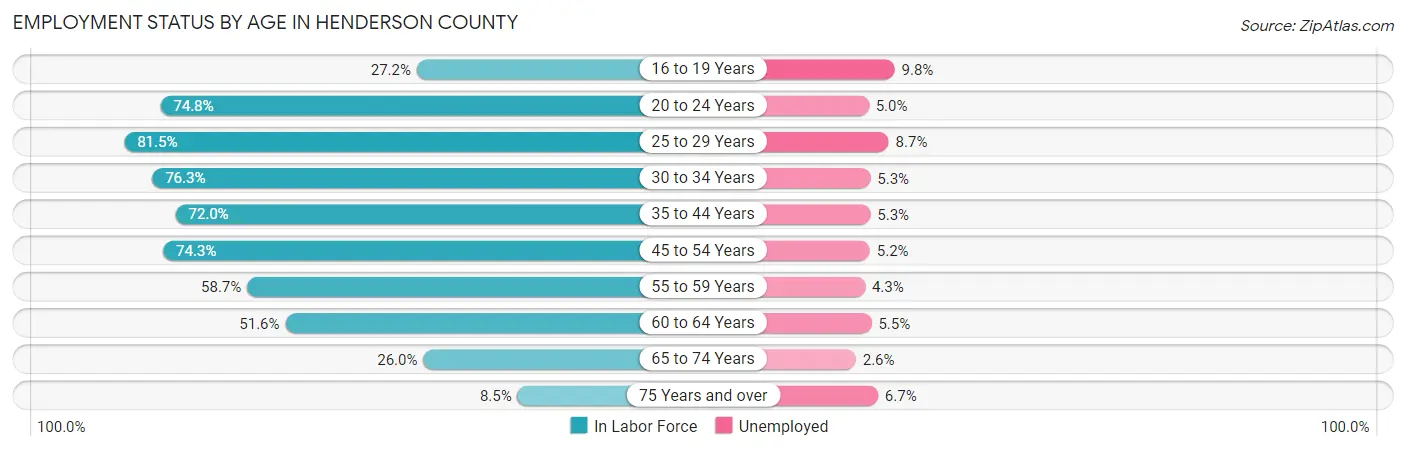
| Age Bracket | In Labor Force | Unemployed |
| 16 to 19 Years | 1,046 (27.2%) | 103 (9.8%) |
| 20 to 24 Years | 3,538 (74.8%) | 177 (5.0%) |
| 25 to 29 Years | 3,787 (81.5%) | 329 (8.7%) |
| 30 to 34 Years | 3,431 (76.3%) | 182 (5.3%) |
| 35 to 44 Years | 6,421 (72.0%) | 340 (5.3%) |
| 45 to 54 Years | 7,298 (74.3%) | 379 (5.2%) |
| 55 to 59 Years | 3,285 (58.7%) | 141 (4.3%) |
| 60 to 64 Years | 3,398 (51.6%) | 187 (5.5%) |
| 65 to 74 Years | 2,761 (26.0%) | 72 (2.6%) |
| 75 Years and over | 660 (8.5%) | 44 (6.7%) |
| Total | 35,657 (53.2%) | 1,961 (5.5%) |
Employment Status by Educational Attainment in Henderson County
According to labor force statistics for Henderson County, 69.0% of individuals (27,646) out of the total population between 25 and 64 years of age (40,066) are in the labor force, with 5.7% or 1,576 of them being unemployed. The group with the highest labor force participation rate are those with the educational attainment of bachelor's degree or higher, with 81.4% or 5,782 individuals in the labor force. Within the labor force, individuals with less than high school education have the highest percentage of unemployment, with 12.5% or 441 of them being unemployed.
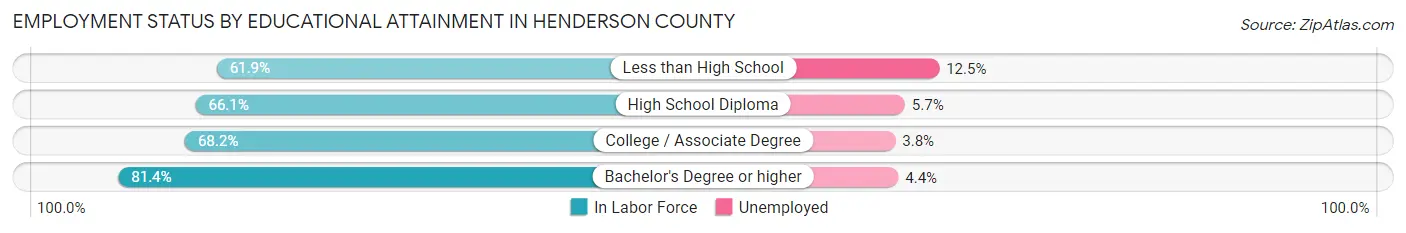
| Educational Attainment | In Labor Force | Unemployed |
| Less than High School | 3,526 (61.9%) | 712 (12.5%) |
| High School Diploma | 9,009 (66.1%) | 777 (5.7%) |
| College / Associate Degree | 9,300 (68.2%) | 518 (3.8%) |
| Bachelor's Degree or higher | 5,782 (81.4%) | 313 (4.4%) |
| Total | 27,646 (69.0%) | 2,284 (5.7%) |
Employment Occupations by Sex in Henderson County
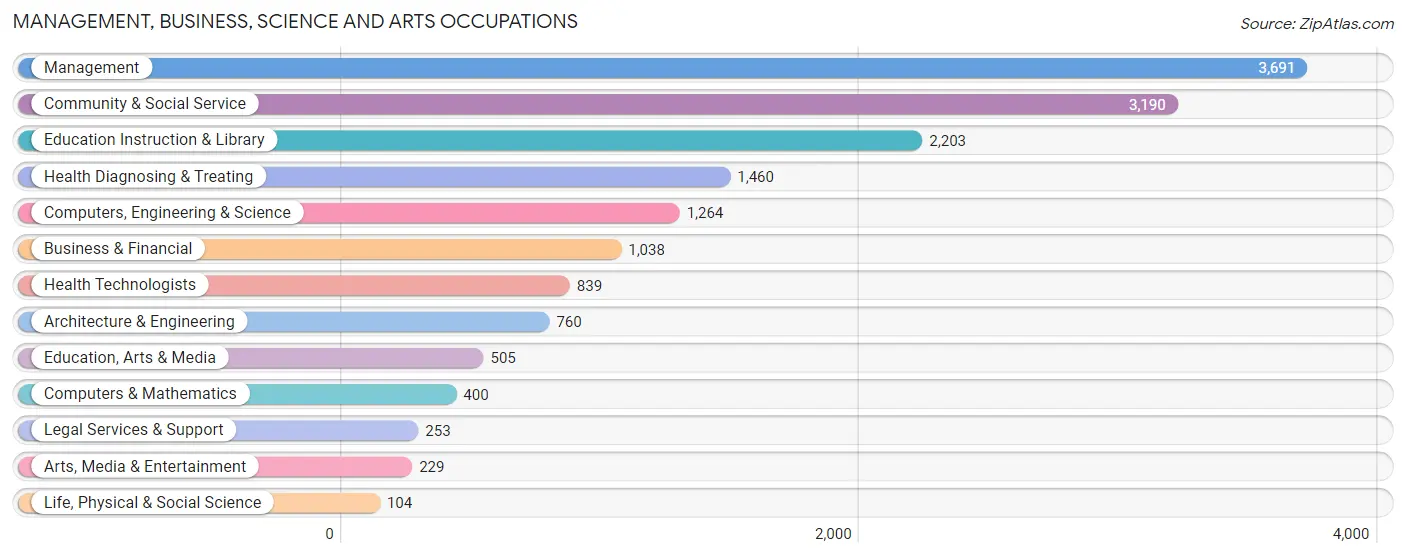
Management, Business, Science and Arts Occupations
The most common Management, Business, Science and Arts occupations in Henderson County are Management (3,691 | 11.0%), Community & Social Service (3,190 | 9.5%), Education Instruction & Library (2,203 | 6.5%), Health Diagnosing & Treating (1,460 | 4.3%), and Computers, Engineering & Science (1,264 | 3.7%).
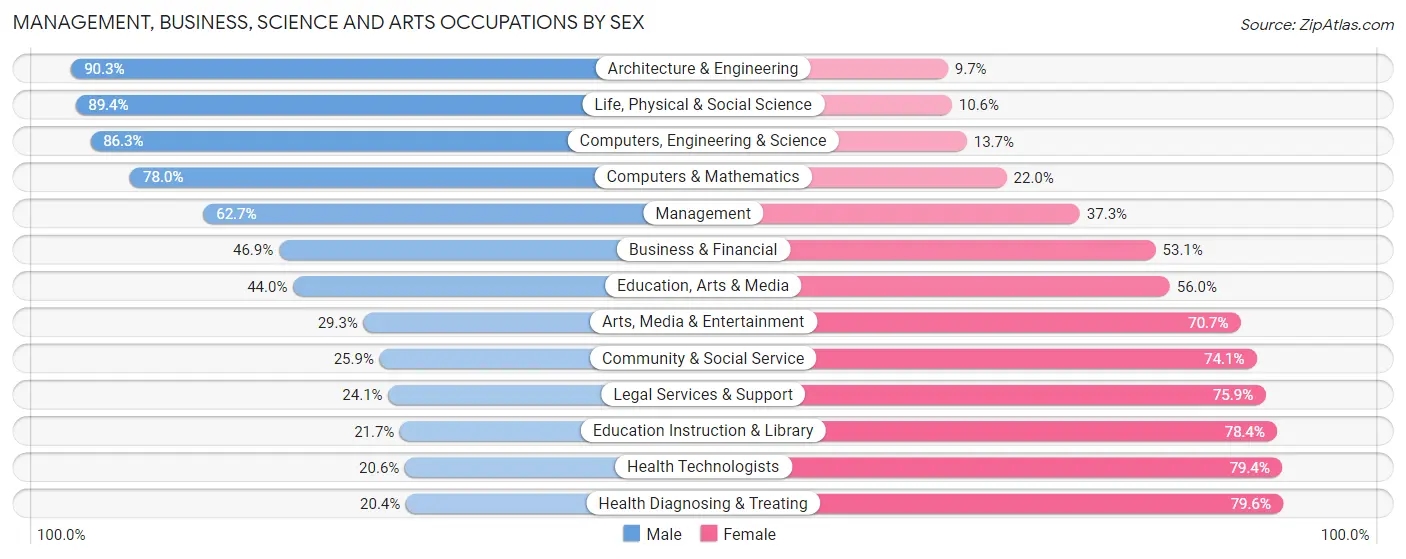
Management, Business, Science and Arts Occupations by Sex
Within the Management, Business, Science and Arts occupations in Henderson County, the most male-oriented occupations are Architecture & Engineering (90.3%), Life, Physical & Social Science (89.4%), and Computers, Engineering & Science (86.3%), while the most female-oriented occupations are Health Diagnosing & Treating (79.6%), Health Technologists (79.4%), and Education Instruction & Library (78.3%).
| Occupation | Male | Female |
| Management | 2,315 (62.7%) | 1,376 (37.3%) |
| Business & Financial | 487 (46.9%) | 551 (53.1%) |
| Computers, Engineering & Science | 1,091 (86.3%) | 173 (13.7%) |
| Computers & Mathematics | 312 (78.0%) | 88 (22.0%) |
| Architecture & Engineering | 686 (90.3%) | 74 (9.7%) |
| Life, Physical & Social Science | 93 (89.4%) | 11 (10.6%) |
| Community & Social Service | 827 (25.9%) | 2,363 (74.1%) |
| Education, Arts & Media | 222 (44.0%) | 283 (56.0%) |
| Legal Services & Support | 61 (24.1%) | 192 (75.9%) |
| Education Instruction & Library | 477 (21.6%) | 1,726 (78.3%) |
| Arts, Media & Entertainment | 67 (29.3%) | 162 (70.7%) |
| Health Diagnosing & Treating | 298 (20.4%) | 1,162 (79.6%) |
| Health Technologists | 173 (20.6%) | 666 (79.4%) |
| Total (Category) | 5,018 (47.1%) | 5,625 (52.8%) |
| Total (Overall) | 18,590 (55.2%) | 15,077 (44.8%) |
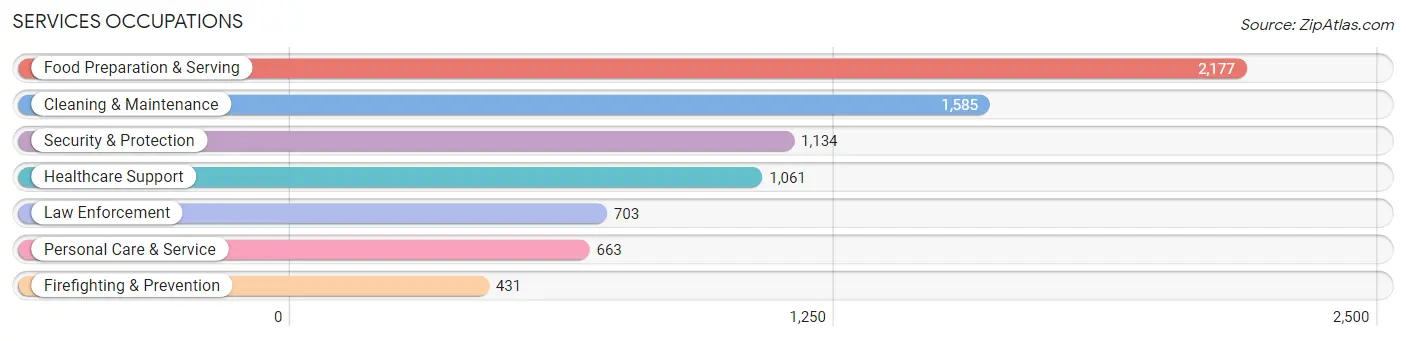
Services Occupations
The most common Services occupations in Henderson County are Food Preparation & Serving (2,177 | 6.5%), Cleaning & Maintenance (1,585 | 4.7%), Security & Protection (1,134 | 3.4%), Healthcare Support (1,061 | 3.2%), and Law Enforcement (703 | 2.1%).
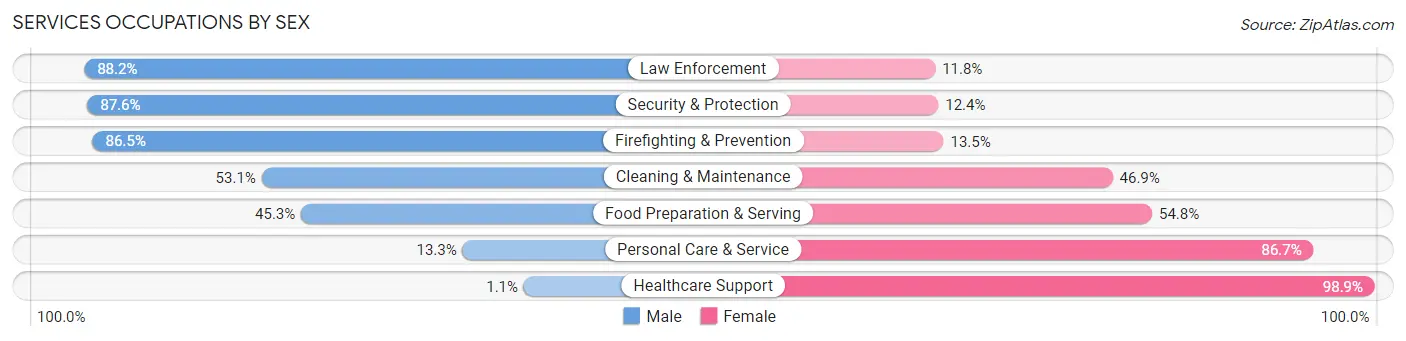
Services Occupations by Sex
Within the Services occupations in Henderson County, the most male-oriented occupations are Law Enforcement (88.2%), Security & Protection (87.6%), and Firefighting & Prevention (86.5%), while the most female-oriented occupations are Healthcare Support (98.9%), Personal Care & Service (86.7%), and Food Preparation & Serving (54.7%).
| Occupation | Male | Female |
| Healthcare Support | 12 (1.1%) | 1,049 (98.9%) |
| Security & Protection | 993 (87.6%) | 141 (12.4%) |
| Firefighting & Prevention | 373 (86.5%) | 58 (13.5%) |
| Law Enforcement | 620 (88.2%) | 83 (11.8%) |
| Food Preparation & Serving | 985 (45.3%) | 1,192 (54.7%) |
| Cleaning & Maintenance | 841 (53.1%) | 744 (46.9%) |
| Personal Care & Service | 88 (13.3%) | 575 (86.7%) |
| Total (Category) | 2,919 (44.1%) | 3,701 (55.9%) |
| Total (Overall) | 18,590 (55.2%) | 15,077 (44.8%) |
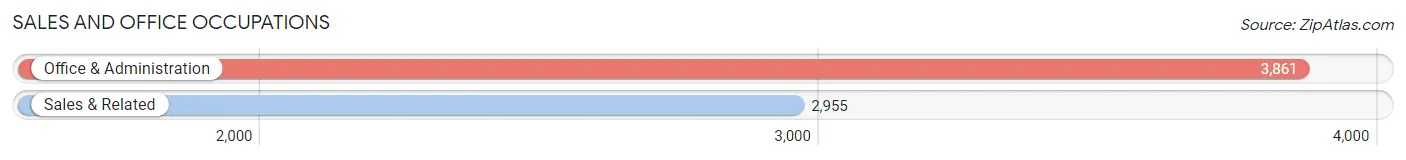
Sales and Office Occupations
The most common Sales and Office occupations in Henderson County are Office & Administration (3,861 | 11.5%), and Sales & Related (2,955 | 8.8%).
Sales and Office Occupations by Sex
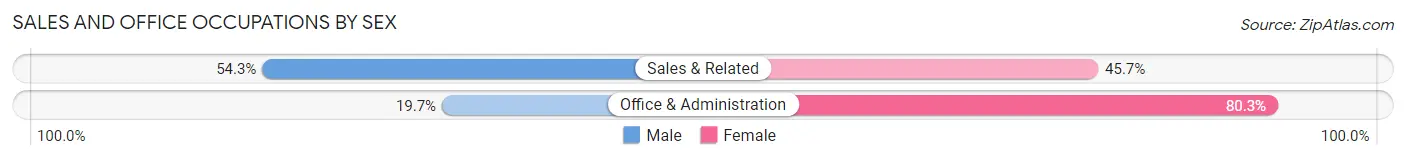
| Occupation | Male | Female |
| Sales & Related | 1,605 (54.3%) | 1,350 (45.7%) |
| Office & Administration | 762 (19.7%) | 3,099 (80.3%) |
| Total (Category) | 2,367 (34.7%) | 4,449 (65.3%) |
| Total (Overall) | 18,590 (55.2%) | 15,077 (44.8%) |
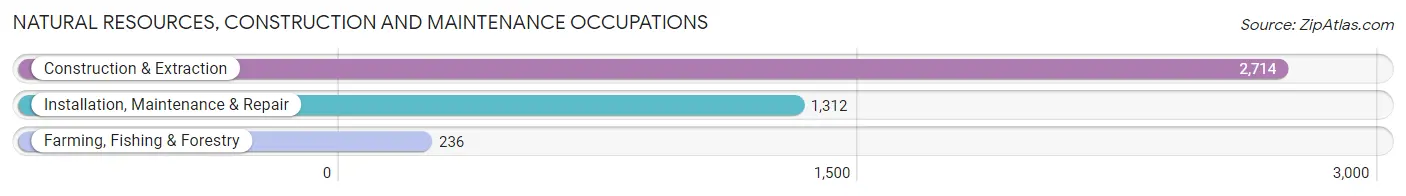
Natural Resources, Construction and Maintenance Occupations
The most common Natural Resources, Construction and Maintenance occupations in Henderson County are Construction & Extraction (2,714 | 8.1%), Installation, Maintenance & Repair (1,312 | 3.9%), and Farming, Fishing & Forestry (236 | 0.7%).
Natural Resources, Construction and Maintenance Occupations by Sex
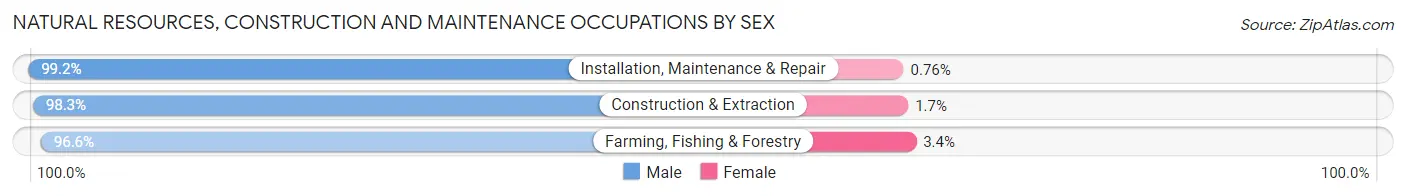
| Occupation | Male | Female |
| Farming, Fishing & Forestry | 228 (96.6%) | 8 (3.4%) |
| Construction & Extraction | 2,667 (98.3%) | 47 (1.7%) |
| Installation, Maintenance & Repair | 1,302 (99.2%) | 10 (0.8%) |
| Total (Category) | 4,197 (98.5%) | 65 (1.5%) |
| Total (Overall) | 18,590 (55.2%) | 15,077 (44.8%) |
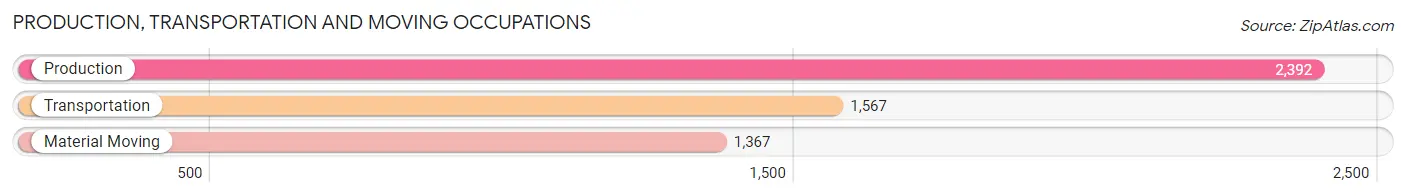
Production, Transportation and Moving Occupations
The most common Production, Transportation and Moving occupations in Henderson County are Production (2,392 | 7.1%), Transportation (1,567 | 4.6%), and Material Moving (1,367 | 4.1%).
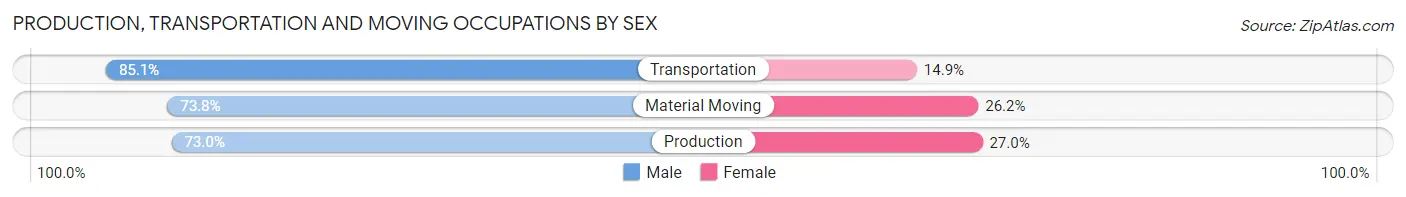
Production, Transportation and Moving Occupations by Sex
| Occupation | Male | Female |
| Production | 1,747 (73.0%) | 645 (27.0%) |
| Transportation | 1,333 (85.1%) | 234 (14.9%) |
| Material Moving | 1,009 (73.8%) | 358 (26.2%) |
| Total (Category) | 4,089 (76.8%) | 1,237 (23.2%) |
| Total (Overall) | 18,590 (55.2%) | 15,077 (44.8%) |
Employment Industries by Sex in Henderson County
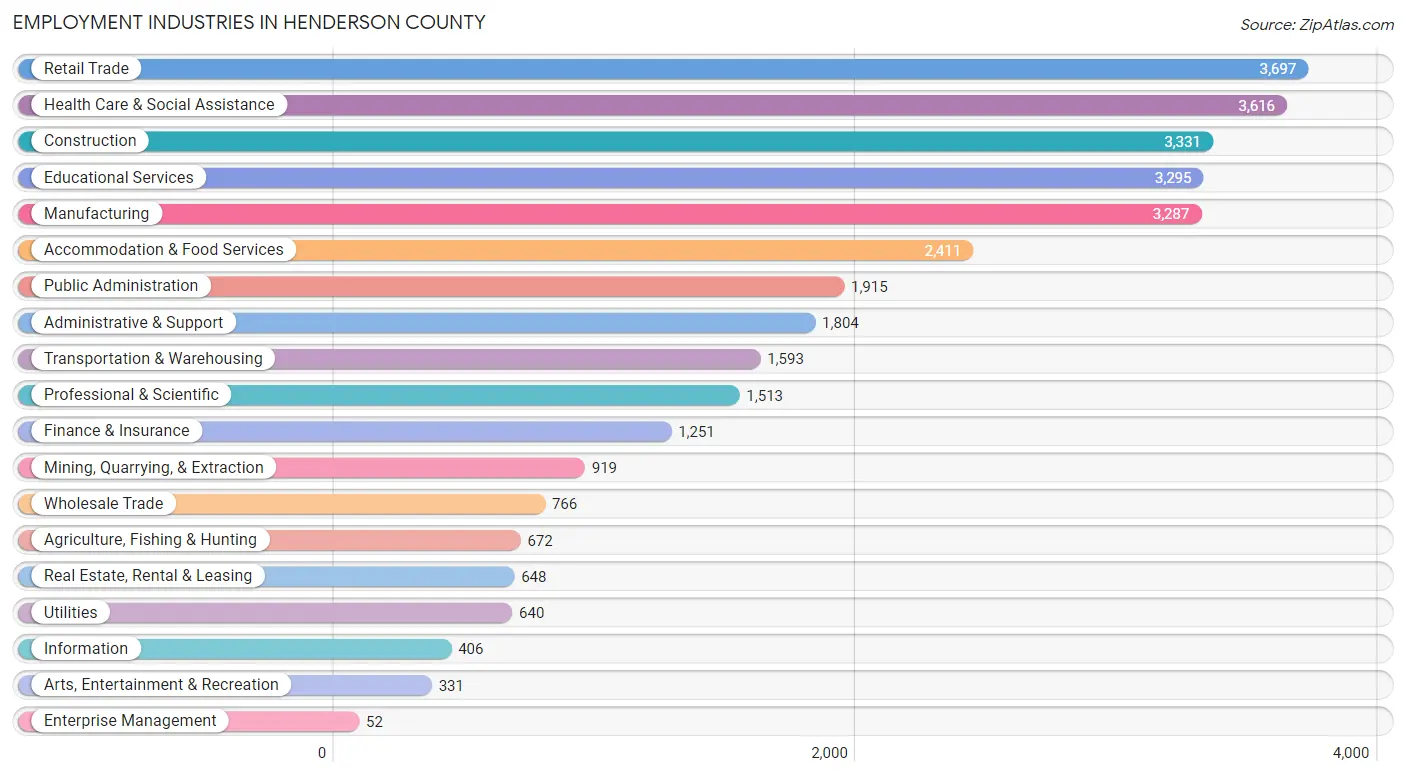
Employment Industries in Henderson County
The major employment industries in Henderson County include Retail Trade (3,697 | 11.0%), Health Care & Social Assistance (3,616 | 10.7%), Construction (3,331 | 9.9%), Educational Services (3,295 | 9.8%), and Manufacturing (3,287 | 9.8%).
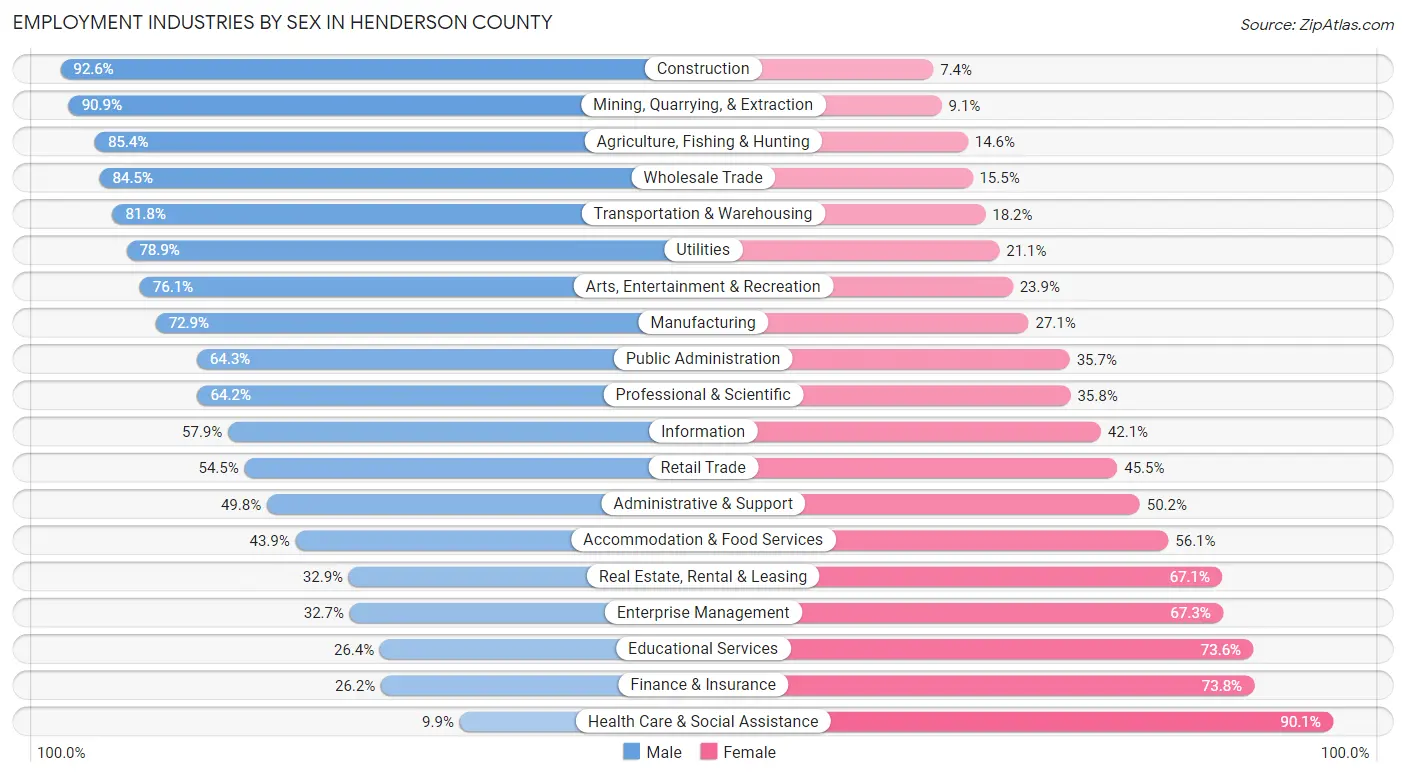
Employment Industries by Sex in Henderson County
The Henderson County industries that see more men than women are Construction (92.6%), Mining, Quarrying, & Extraction (90.9%), and Agriculture, Fishing & Hunting (85.4%), whereas the industries that tend to have a higher number of women are Health Care & Social Assistance (90.1%), Finance & Insurance (73.8%), and Educational Services (73.6%).
| Industry | Male | Female |
| Agriculture, Fishing & Hunting | 574 (85.4%) | 98 (14.6%) |
| Mining, Quarrying, & Extraction | 835 (90.9%) | 84 (9.1%) |
| Construction | 3,084 (92.6%) | 247 (7.4%) |
| Manufacturing | 2,395 (72.9%) | 892 (27.1%) |
| Wholesale Trade | 647 (84.5%) | 119 (15.5%) |
| Retail Trade | 2,014 (54.5%) | 1,683 (45.5%) |
| Transportation & Warehousing | 1,303 (81.8%) | 290 (18.2%) |
| Utilities | 505 (78.9%) | 135 (21.1%) |
| Information | 235 (57.9%) | 171 (42.1%) |
| Finance & Insurance | 328 (26.2%) | 923 (73.8%) |
| Real Estate, Rental & Leasing | 213 (32.9%) | 435 (67.1%) |
| Professional & Scientific | 971 (64.2%) | 542 (35.8%) |
| Enterprise Management | 17 (32.7%) | 35 (67.3%) |
| Administrative & Support | 899 (49.8%) | 905 (50.2%) |
| Educational Services | 871 (26.4%) | 2,424 (73.6%) |
| Health Care & Social Assistance | 359 (9.9%) | 3,257 (90.1%) |
| Arts, Entertainment & Recreation | 252 (76.1%) | 79 (23.9%) |
| Accommodation & Food Services | 1,059 (43.9%) | 1,352 (56.1%) |
| Public Administration | 1,232 (64.3%) | 683 (35.7%) |
| Total | 18,590 (55.2%) | 15,077 (44.8%) |
Education in Henderson County
School Enrollment in Henderson County
The most common levels of schooling among the 16,633 students in Henderson County are middle school (4,226 | 25.4%), high school (4,073 | 24.5%), and elementary school (3,485 | 20.9%).
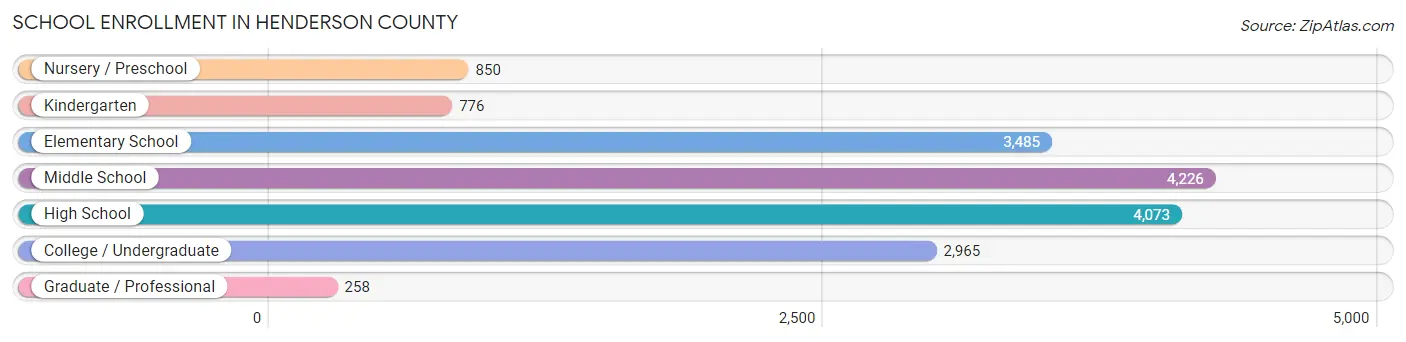
| School Level | # Students | % Students |
| Nursery / Preschool | 850 | 5.1% |
| Kindergarten | 776 | 4.7% |
| Elementary School | 3,485 | 20.9% |
| Middle School | 4,226 | 25.4% |
| High School | 4,073 | 24.5% |
| College / Undergraduate | 2,965 | 17.8% |
| Graduate / Professional | 258 | 1.5% |
| Total | 16,633 | 100.0% |
School Enrollment by Age by Funding Source in Henderson County
Out of a total of 16,633 students who are enrolled in schools in Henderson County, 2,229 (13.4%) attend a private institution, while the remaining 14,404 (86.6%) are enrolled in public schools. The age group of 3 to 4 year olds has the highest likelihood of being enrolled in private schools, with 189 (30.8% in the age bracket) enrolled. Conversely, the age group of 20 to 24 year olds has the lowest likelihood of being enrolled in a private school, with 1,219 (92.1% in the age bracket) attending a public institution.
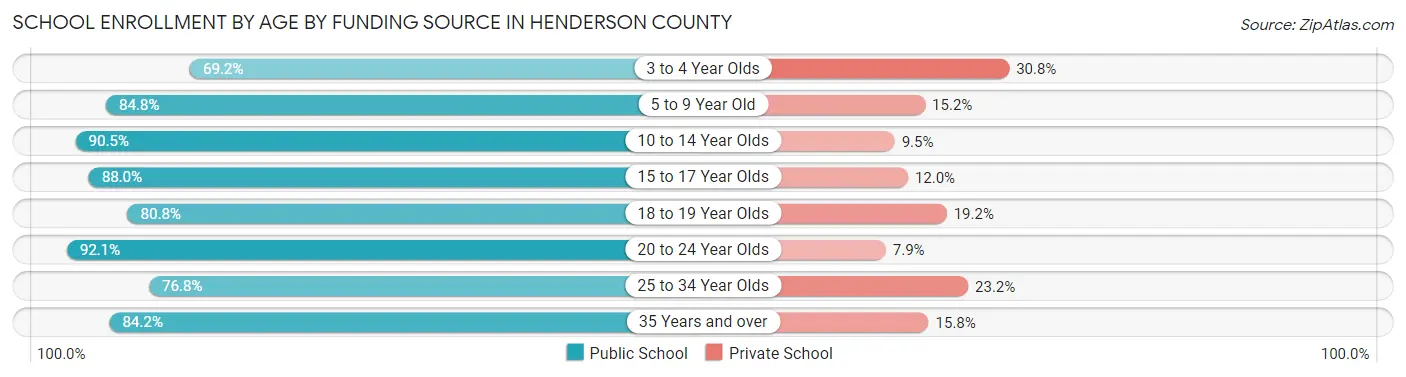
| Age Bracket | Public School | Private School |
| 3 to 4 Year Olds | 424 (69.2%) | 189 (30.8%) |
| 5 to 9 Year Old | 3,448 (84.8%) | 617 (15.2%) |
| 10 to 14 Year Olds | 4,518 (90.5%) | 475 (9.5%) |
| 15 to 17 Year Olds | 2,706 (88.0%) | 368 (12.0%) |
| 18 to 19 Year Olds | 905 (80.8%) | 215 (19.2%) |
| 20 to 24 Year Olds | 1,219 (92.1%) | 104 (7.9%) |
| 25 to 34 Year Olds | 401 (76.8%) | 121 (23.2%) |
| 35 Years and over | 777 (84.2%) | 146 (15.8%) |
| Total | 14,404 (86.6%) | 2,229 (13.4%) |
Educational Attainment by Field of Study in Henderson County
Business (2,252 | 18.7%), education (2,181 | 18.1%), science & technology (1,220 | 10.1%), arts & humanities (1,124 | 9.3%), and engineering (884 | 7.3%) are the most common fields of study among 12,064 individuals in Henderson County who have obtained a bachelor's degree or higher.
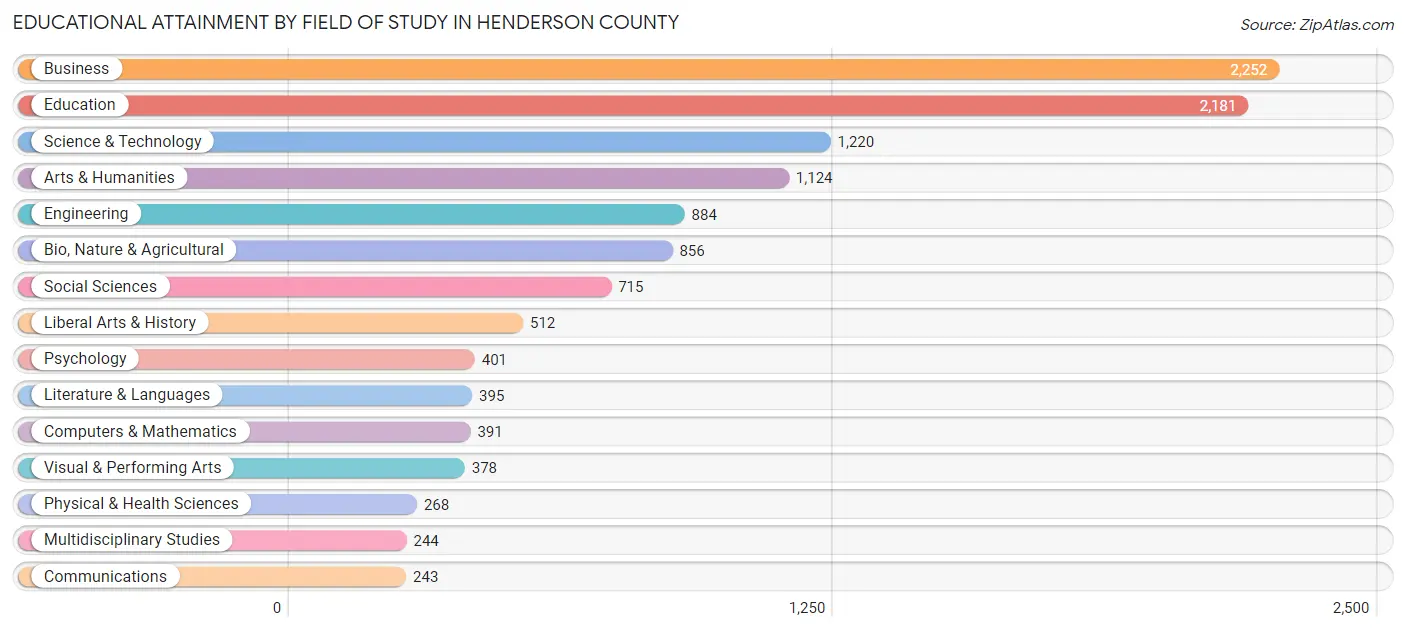
| Field of Study | # Graduates | % Graduates |
| Computers & Mathematics | 391 | 3.2% |
| Bio, Nature & Agricultural | 856 | 7.1% |
| Physical & Health Sciences | 268 | 2.2% |
| Psychology | 401 | 3.3% |
| Social Sciences | 715 | 5.9% |
| Engineering | 884 | 7.3% |
| Multidisciplinary Studies | 244 | 2.0% |
| Science & Technology | 1,220 | 10.1% |
| Business | 2,252 | 18.7% |
| Education | 2,181 | 18.1% |
| Literature & Languages | 395 | 3.3% |
| Liberal Arts & History | 512 | 4.2% |
| Visual & Performing Arts | 378 | 3.1% |
| Communications | 243 | 2.0% |
| Arts & Humanities | 1,124 | 9.3% |
| Total | 12,064 | 100.0% |
Transportation & Commute in Henderson County
Vehicle Availability by Sex in Henderson County
The most prevalent vehicle ownership categories in Henderson County are males with 2 vehicles (8,266, accounting for 45.6%) and females with 2 vehicles (5,984, making up 55.9%).
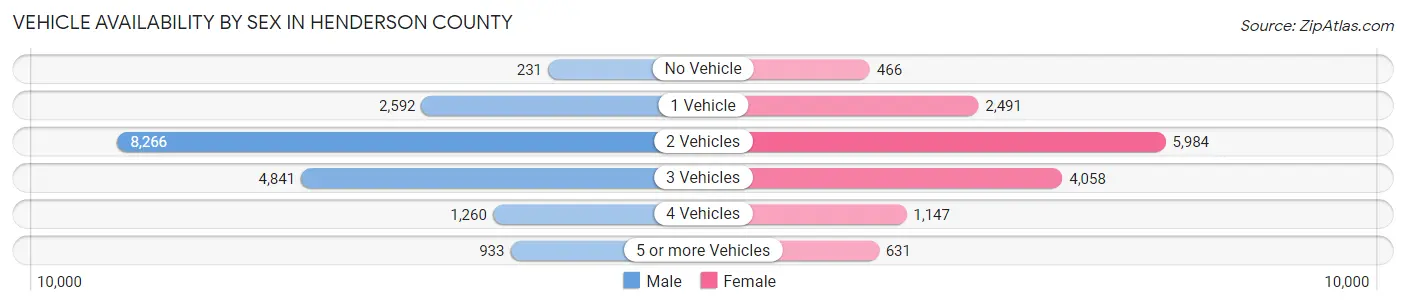
| Vehicles Available | Male | Female |
| No Vehicle | 231 (1.3%) | 466 (3.2%) |
| 1 Vehicle | 2,592 (14.3%) | 2,491 (16.9%) |
| 2 Vehicles | 8,266 (45.6%) | 5,984 (40.5%) |
| 3 Vehicles | 4,841 (26.7%) | 4,058 (27.5%) |
| 4 Vehicles | 1,260 (7.0%) | 1,147 (7.8%) |
| 5 or more Vehicles | 933 (5.1%) | 631 (4.3%) |
| Total | 18,123 (100.0%) | 14,777 (100.0%) |
Commute Time in Henderson County
The most frequently occuring commute durations in Henderson County are 5 to 9 minutes (4,415 commuters, 14.5%), 30 to 34 minutes (4,340 commuters, 14.3%), and 15 to 19 minutes (3,478 commuters, 11.4%).
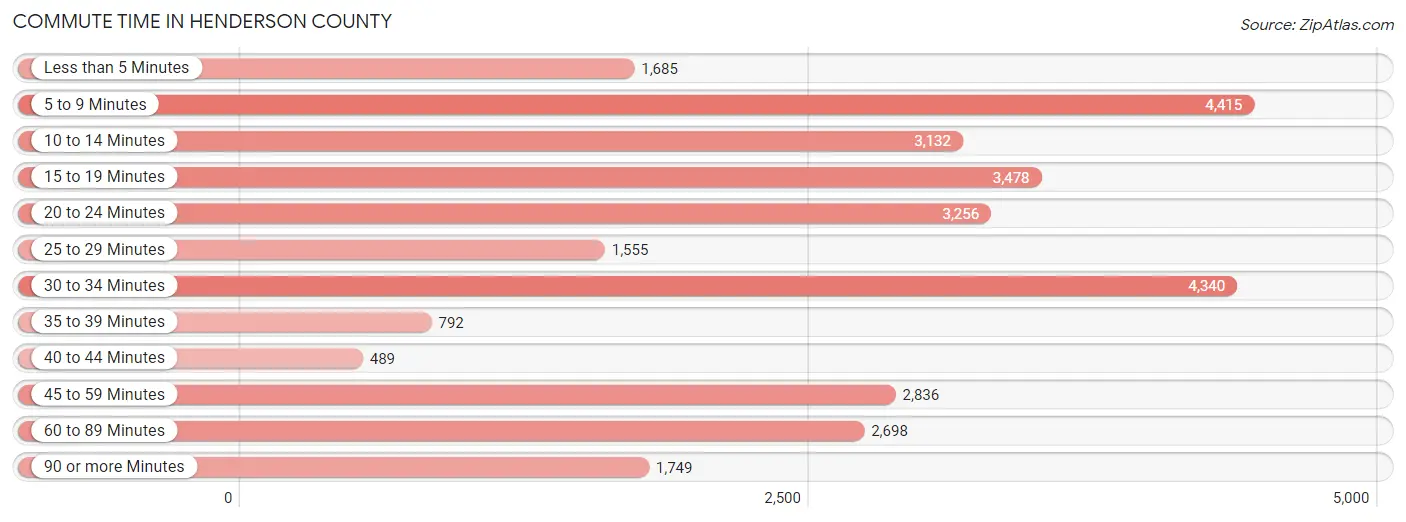
| Commute Time | # Commuters | % Commuters |
| Less than 5 Minutes | 1,685 | 5.5% |
| 5 to 9 Minutes | 4,415 | 14.5% |
| 10 to 14 Minutes | 3,132 | 10.3% |
| 15 to 19 Minutes | 3,478 | 11.4% |
| 20 to 24 Minutes | 3,256 | 10.7% |
| 25 to 29 Minutes | 1,555 | 5.1% |
| 30 to 34 Minutes | 4,340 | 14.3% |
| 35 to 39 Minutes | 792 | 2.6% |
| 40 to 44 Minutes | 489 | 1.6% |
| 45 to 59 Minutes | 2,836 | 9.3% |
| 60 to 89 Minutes | 2,698 | 8.9% |
| 90 or more Minutes | 1,749 | 5.8% |
Commute Time by Sex in Henderson County
The most common commute times in Henderson County are 30 to 34 minutes (2,544 commuters, 15.0%) for males and 5 to 9 minutes (2,327 commuters, 17.3%) for females.
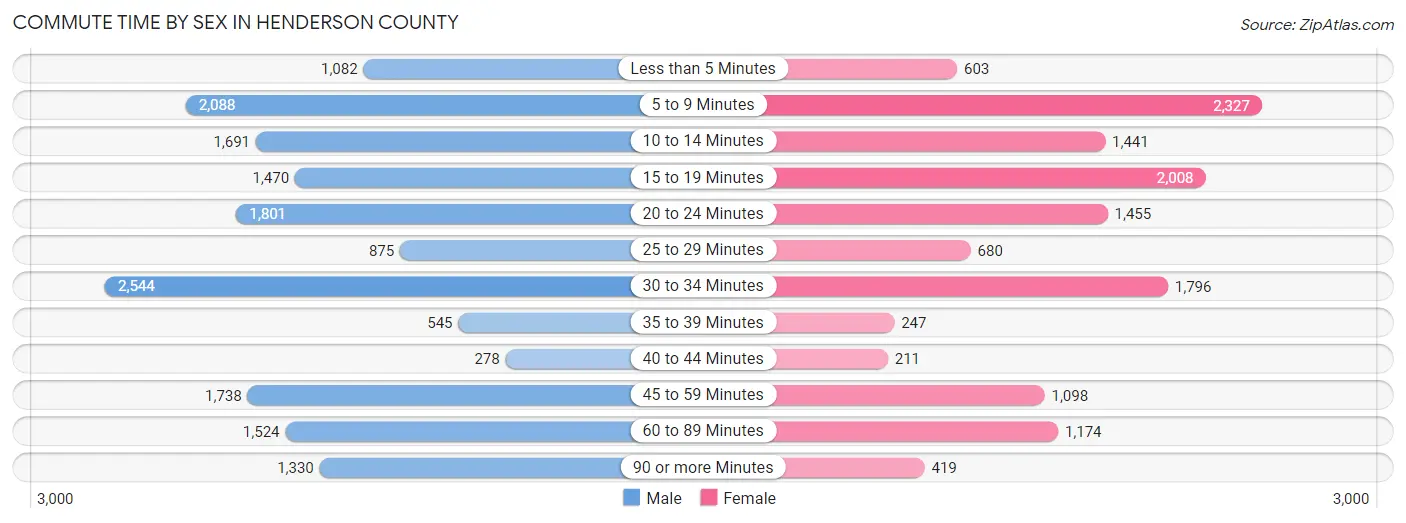
| Commute Time | Male | Female |
| Less than 5 Minutes | 1,082 (6.4%) | 603 (4.5%) |
| 5 to 9 Minutes | 2,088 (12.3%) | 2,327 (17.3%) |
| 10 to 14 Minutes | 1,691 (10.0%) | 1,441 (10.7%) |
| 15 to 19 Minutes | 1,470 (8.7%) | 2,008 (14.9%) |
| 20 to 24 Minutes | 1,801 (10.6%) | 1,455 (10.8%) |
| 25 to 29 Minutes | 875 (5.2%) | 680 (5.1%) |
| 30 to 34 Minutes | 2,544 (15.0%) | 1,796 (13.3%) |
| 35 to 39 Minutes | 545 (3.2%) | 247 (1.8%) |
| 40 to 44 Minutes | 278 (1.6%) | 211 (1.6%) |
| 45 to 59 Minutes | 1,738 (10.2%) | 1,098 (8.2%) |
| 60 to 89 Minutes | 1,524 (9.0%) | 1,174 (8.7%) |
| 90 or more Minutes | 1,330 (7.8%) | 419 (3.1%) |
Time of Departure to Work by Sex in Henderson County
The most frequent times of departure to work in Henderson County are 7:00 AM to 7:29 AM (2,779, 16.4%) for males and 7:00 AM to 7:29 AM (2,305, 17.1%) for females.
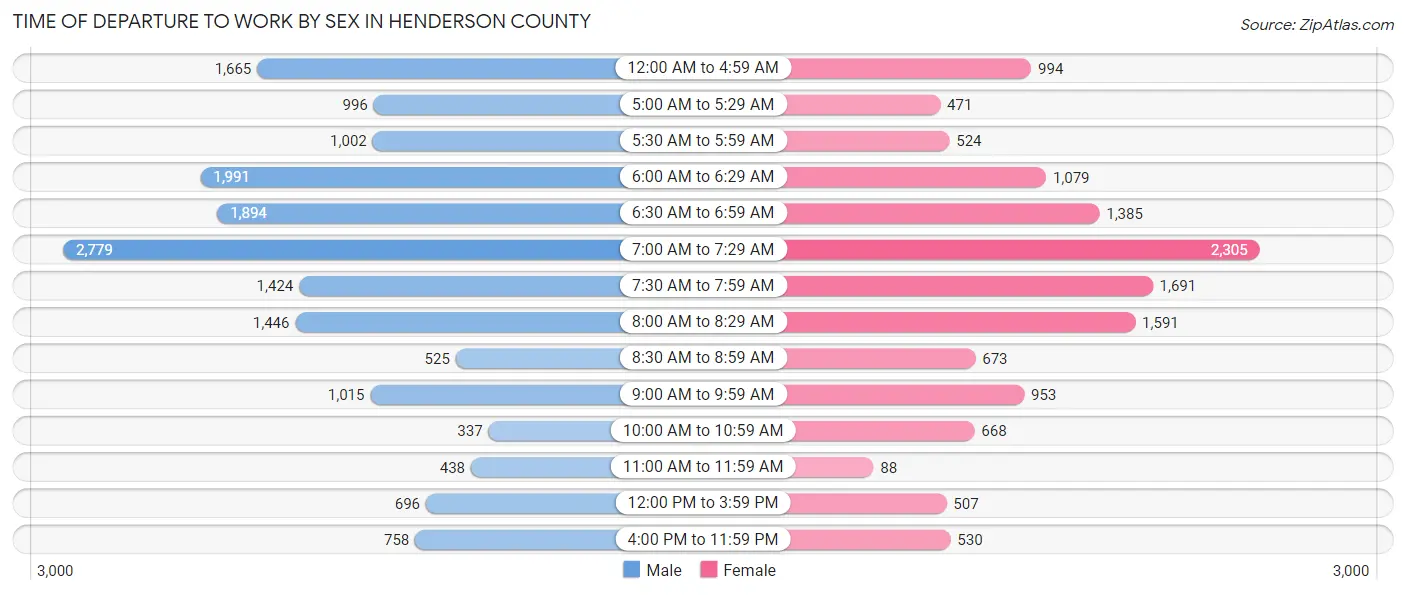
| Time of Departure | Male | Female |
| 12:00 AM to 4:59 AM | 1,665 (9.8%) | 994 (7.4%) |
| 5:00 AM to 5:29 AM | 996 (5.9%) | 471 (3.5%) |
| 5:30 AM to 5:59 AM | 1,002 (5.9%) | 524 (3.9%) |
| 6:00 AM to 6:29 AM | 1,991 (11.7%) | 1,079 (8.0%) |
| 6:30 AM to 6:59 AM | 1,894 (11.2%) | 1,385 (10.3%) |
| 7:00 AM to 7:29 AM | 2,779 (16.4%) | 2,305 (17.1%) |
| 7:30 AM to 7:59 AM | 1,424 (8.4%) | 1,691 (12.6%) |
| 8:00 AM to 8:29 AM | 1,446 (8.5%) | 1,591 (11.8%) |
| 8:30 AM to 8:59 AM | 525 (3.1%) | 673 (5.0%) |
| 9:00 AM to 9:59 AM | 1,015 (6.0%) | 953 (7.1%) |
| 10:00 AM to 10:59 AM | 337 (2.0%) | 668 (5.0%) |
| 11:00 AM to 11:59 AM | 438 (2.6%) | 88 (0.6%) |
| 12:00 PM to 3:59 PM | 696 (4.1%) | 507 (3.8%) |
| 4:00 PM to 11:59 PM | 758 (4.5%) | 530 (3.9%) |
| Total | 16,966 (100.0%) | 13,459 (100.0%) |
Housing Occupancy in Henderson County
Occupancy by Ownership in Henderson County
Of the total 31,973 dwellings in Henderson County, owner-occupied units account for 24,300 (76.0%), while renter-occupied units make up 7,673 (24.0%).
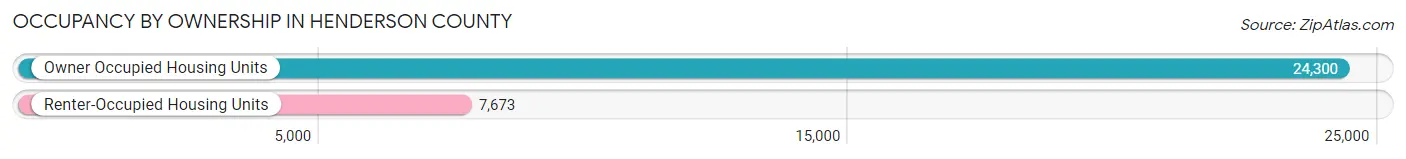
| Occupancy | # Housing Units | % Housing Units |
| Owner Occupied Housing Units | 24,300 | 76.0% |
| Renter-Occupied Housing Units | 7,673 | 24.0% |
| Total Occupied Housing Units | 31,973 | 100.0% |
Occupancy by Household Size in Henderson County
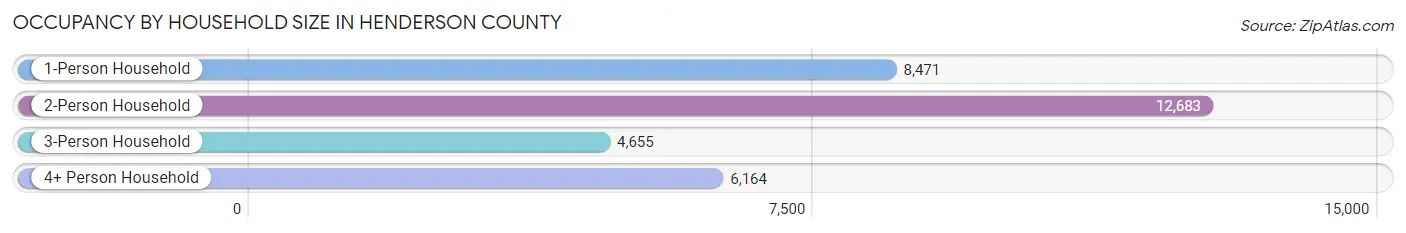
| Household Size | # Housing Units | % Housing Units |
| 1-Person Household | 8,471 | 26.5% |
| 2-Person Household | 12,683 | 39.7% |
| 3-Person Household | 4,655 | 14.6% |
| 4+ Person Household | 6,164 | 19.3% |
| Total Housing Units | 31,973 | 100.0% |
Occupancy by Ownership by Household Size in Henderson County
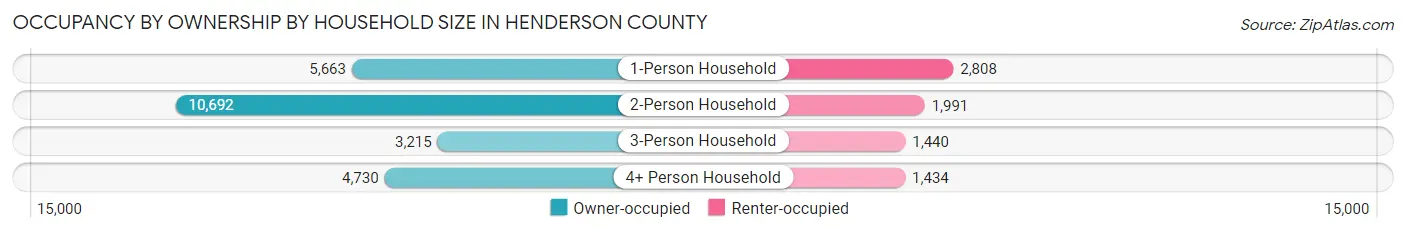
| Household Size | Owner-occupied | Renter-occupied |
| 1-Person Household | 5,663 (66.8%) | 2,808 (33.2%) |
| 2-Person Household | 10,692 (84.3%) | 1,991 (15.7%) |
| 3-Person Household | 3,215 (69.1%) | 1,440 (30.9%) |
| 4+ Person Household | 4,730 (76.7%) | 1,434 (23.3%) |
| Total Housing Units | 24,300 (76.0%) | 7,673 (24.0%) |
Occupancy by Educational Attainment in Henderson County
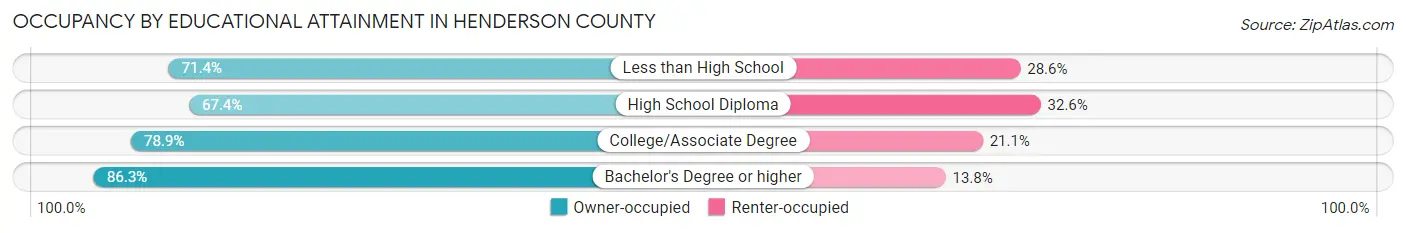
| Household Size | Owner-occupied | Renter-occupied |
| Less than High School | 2,828 (71.4%) | 1,131 (28.6%) |
| High School Diploma | 6,510 (67.4%) | 3,149 (32.6%) |
| College/Associate Degree | 9,308 (78.9%) | 2,492 (21.1%) |
| Bachelor's Degree or higher | 5,654 (86.3%) | 901 (13.8%) |
Occupancy by Age of Householder in Henderson County
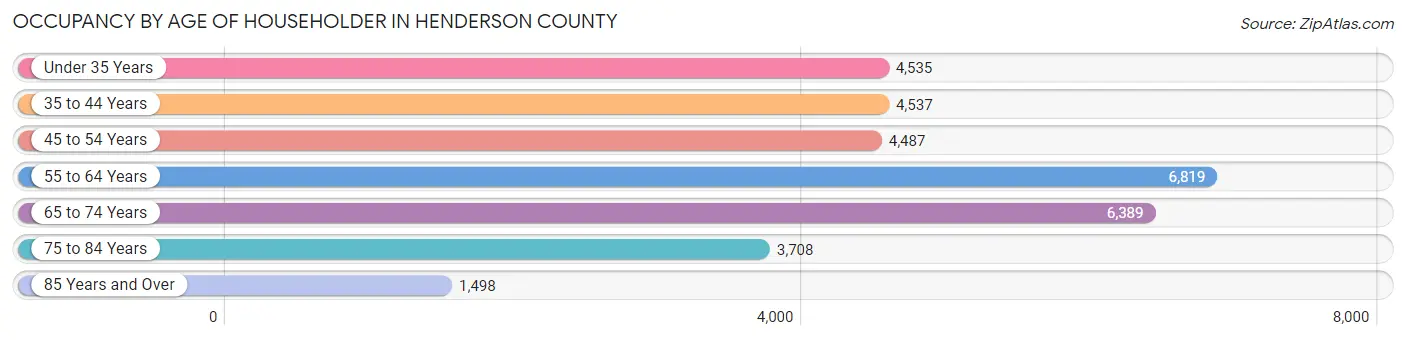
| Age Bracket | # Households | % Households |
| Under 35 Years | 4,535 | 14.2% |
| 35 to 44 Years | 4,537 | 14.2% |
| 45 to 54 Years | 4,487 | 14.0% |
| 55 to 64 Years | 6,819 | 21.3% |
| 65 to 74 Years | 6,389 | 20.0% |
| 75 to 84 Years | 3,708 | 11.6% |
| 85 Years and Over | 1,498 | 4.7% |
| Total | 31,973 | 100.0% |
Housing Finances in Henderson County
Median Income by Occupancy in Henderson County
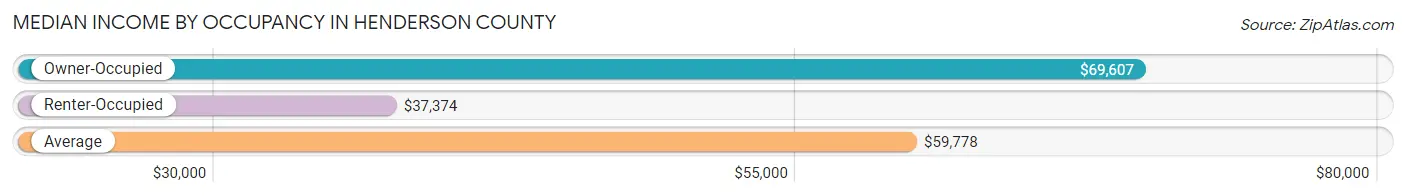
| Occupancy Type | # Households | Median Income |
| Owner-Occupied | 24,300 (76.0%) | $69,607 |
| Renter-Occupied | 7,673 (24.0%) | $37,374 |
| Average | 31,973 (100.0%) | $59,778 |
Occupancy by Householder Income Bracket in Henderson County

| Income Bracket | Owner-occupied | Renter-occupied |
| Less than $5,000 | 832 (3.4%) | 308 (4.0%) |
| $5,000 to $9,999 | 420 (1.7%) | 396 (5.2%) |
| $10,000 to $14,999 | 932 (3.8%) | 699 (9.1%) |
| $15,000 to $19,999 | 958 (3.9%) | 701 (9.1%) |
| $20,000 to $24,999 | 1,087 (4.5%) | 478 (6.2%) |
| $25,000 to $34,999 | 1,948 (8.0%) | 925 (12.1%) |
| $35,000 to $49,999 | 2,524 (10.4%) | 1,322 (17.2%) |
| $50,000 to $74,999 | 4,301 (17.7%) | 1,523 (19.9%) |
| $75,000 to $99,999 | 3,147 (13.0%) | 806 (10.5%) |
| $100,000 to $149,999 | 4,586 (18.9%) | 384 (5.0%) |
| $150,000 or more | 3,565 (14.7%) | 131 (1.7%) |
| Total | 24,300 (100.0%) | 7,673 (100.0%) |
Monthly Housing Cost Tiers in Henderson County
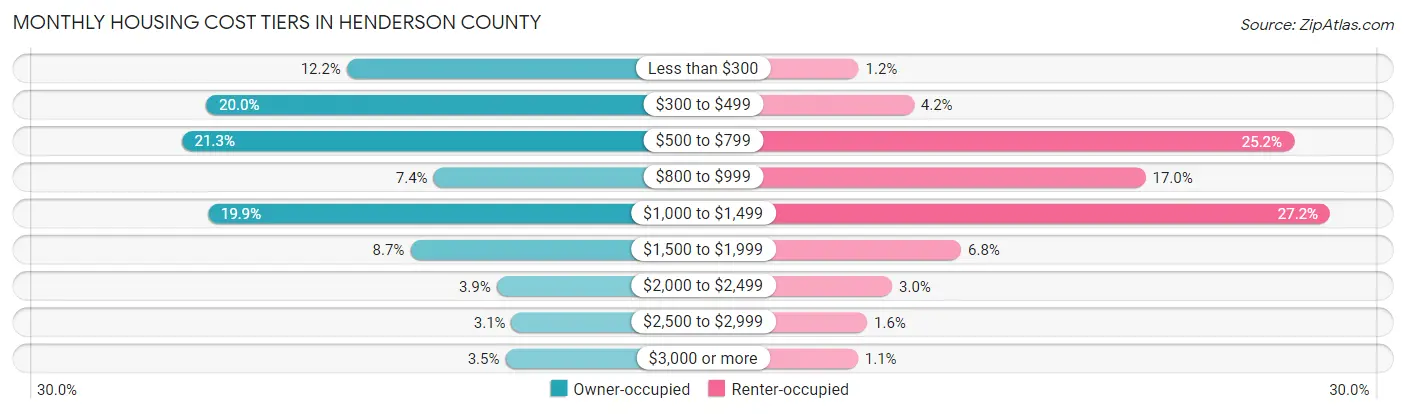
| Monthly Cost | Owner-occupied | Renter-occupied |
| Less than $300 | 2,967 (12.2%) | 90 (1.2%) |
| $300 to $499 | 4,852 (20.0%) | 324 (4.2%) |
| $500 to $799 | 5,184 (21.3%) | 1,934 (25.2%) |
| $800 to $999 | 1,804 (7.4%) | 1,306 (17.0%) |
| $1,000 to $1,499 | 4,831 (19.9%) | 2,087 (27.2%) |
| $1,500 to $1,999 | 2,113 (8.7%) | 524 (6.8%) |
| $2,000 to $2,499 | 955 (3.9%) | 232 (3.0%) |
| $2,500 to $2,999 | 756 (3.1%) | 126 (1.6%) |
| $3,000 or more | 838 (3.5%) | 87 (1.1%) |
| Total | 24,300 (100.0%) | 7,673 (100.0%) |
Physical Housing Characteristics in Henderson County
Housing Structures in Henderson County
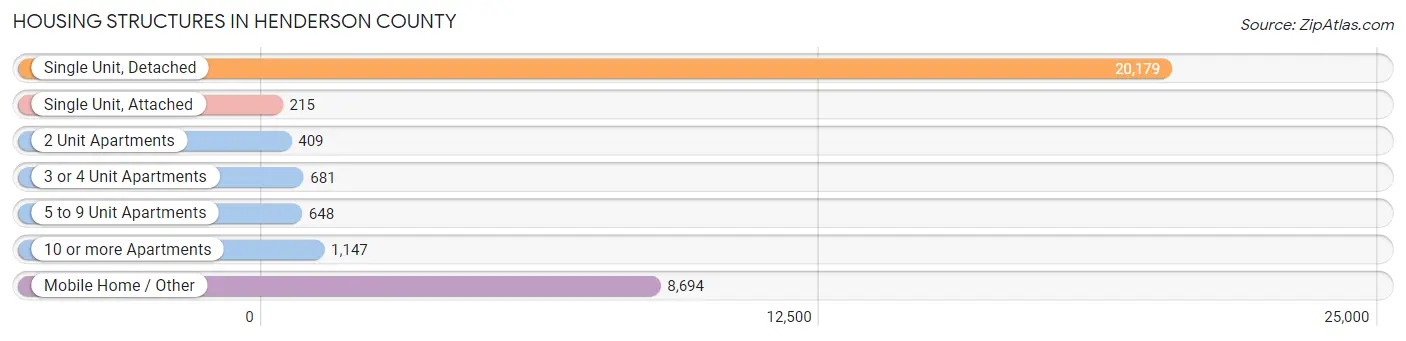
| Structure Type | # Housing Units | % Housing Units |
| Single Unit, Detached | 20,179 | 63.1% |
| Single Unit, Attached | 215 | 0.7% |
| 2 Unit Apartments | 409 | 1.3% |
| 3 or 4 Unit Apartments | 681 | 2.1% |
| 5 to 9 Unit Apartments | 648 | 2.0% |
| 10 or more Apartments | 1,147 | 3.6% |
| Mobile Home / Other | 8,694 | 27.2% |
| Total | 31,973 | 100.0% |
Housing Structures by Occupancy in Henderson County
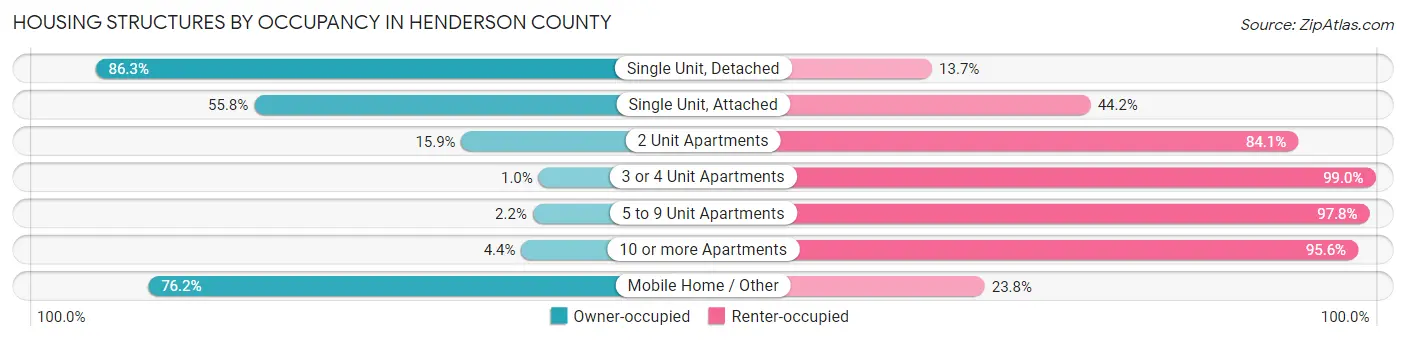
| Structure Type | Owner-occupied | Renter-occupied |
| Single Unit, Detached | 17,420 (86.3%) | 2,759 (13.7%) |
| Single Unit, Attached | 120 (55.8%) | 95 (44.2%) |
| 2 Unit Apartments | 65 (15.9%) | 344 (84.1%) |
| 3 or 4 Unit Apartments | 7 (1.0%) | 674 (99.0%) |
| 5 to 9 Unit Apartments | 14 (2.2%) | 634 (97.8%) |
| 10 or more Apartments | 50 (4.4%) | 1,097 (95.6%) |
| Mobile Home / Other | 6,624 (76.2%) | 2,070 (23.8%) |
| Total | 24,300 (76.0%) | 7,673 (24.0%) |
Housing Structures by Number of Rooms in Henderson County
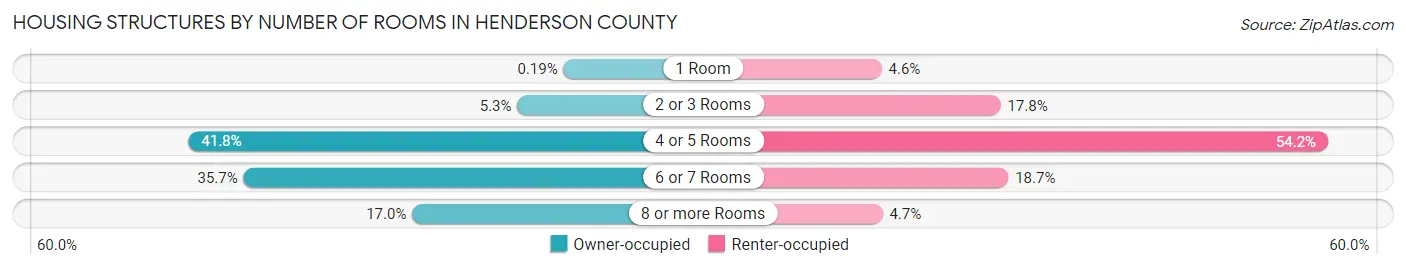
| Number of Rooms | Owner-occupied | Renter-occupied |
| 1 Room | 47 (0.2%) | 355 (4.6%) |
| 2 or 3 Rooms | 1,290 (5.3%) | 1,367 (17.8%) |
| 4 or 5 Rooms | 10,163 (41.8%) | 4,156 (54.2%) |
| 6 or 7 Rooms | 8,675 (35.7%) | 1,433 (18.7%) |
| 8 or more Rooms | 4,125 (17.0%) | 362 (4.7%) |
| Total | 24,300 (100.0%) | 7,673 (100.0%) |
Housing Structure by Heating Type in Henderson County
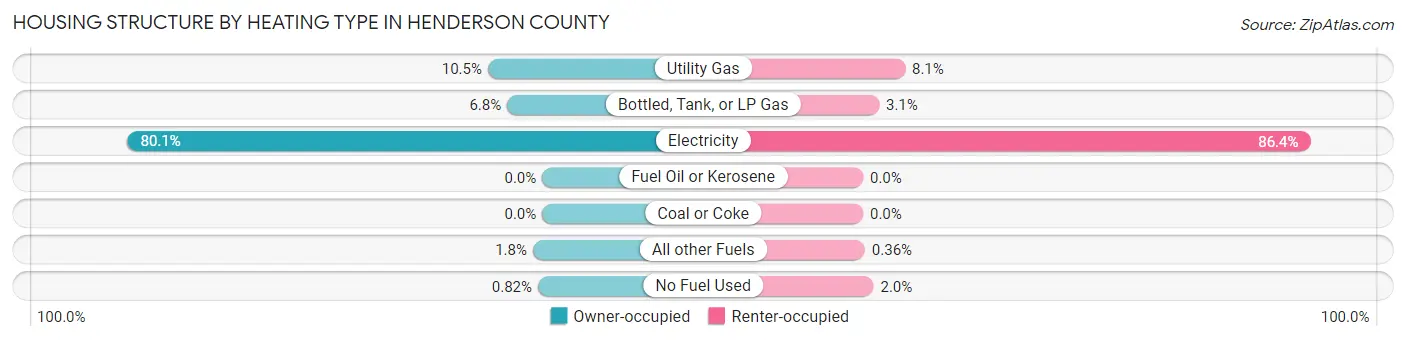
| Heating Type | Owner-occupied | Renter-occupied |
| Utility Gas | 2,549 (10.5%) | 622 (8.1%) |
| Bottled, Tank, or LP Gas | 1,645 (6.8%) | 237 (3.1%) |
| Electricity | 19,469 (80.1%) | 6,630 (86.4%) |
| Fuel Oil or Kerosene | 0 (0.0%) | 0 (0.0%) |
| Coal or Coke | 0 (0.0%) | 0 (0.0%) |
| All other Fuels | 438 (1.8%) | 28 (0.4%) |
| No Fuel Used | 199 (0.8%) | 156 (2.0%) |
| Total | 24,300 (100.0%) | 7,673 (100.0%) |
Household Vehicle Usage in Henderson County
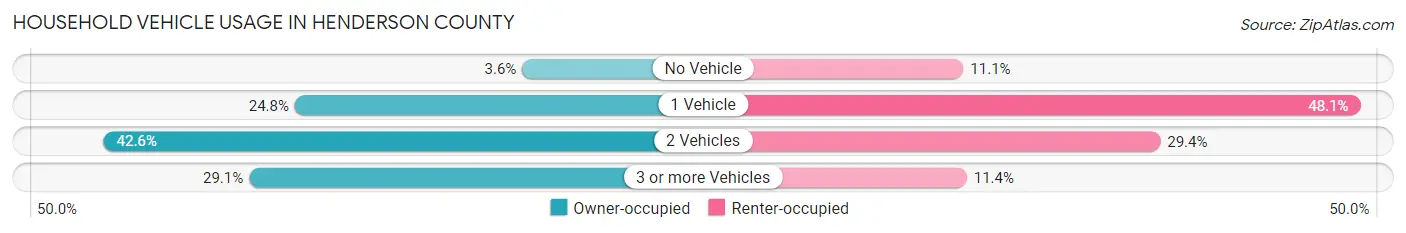
| Vehicles per Household | Owner-occupied | Renter-occupied |
| No Vehicle | 863 (3.5%) | 849 (11.1%) |
| 1 Vehicle | 6,021 (24.8%) | 3,692 (48.1%) |
| 2 Vehicles | 10,357 (42.6%) | 2,259 (29.4%) |
| 3 or more Vehicles | 7,059 (29.0%) | 873 (11.4%) |
| Total | 24,300 (100.0%) | 7,673 (100.0%) |
Real Estate & Mortgages in Henderson County
Real Estate and Mortgage Overview in Henderson County
| Characteristic | Without Mortgage | With Mortgage |
| Housing Units | 14,178 | 10,122 |
| Median Property Value | $114,900 | $212,300 |
| Median Household Income | $50,745 | $2,255 |
| Monthly Housing Costs | $470 | $818 |
| Real Estate Taxes | $1,234 | $248 |
Property Value by Mortgage Status in Henderson County
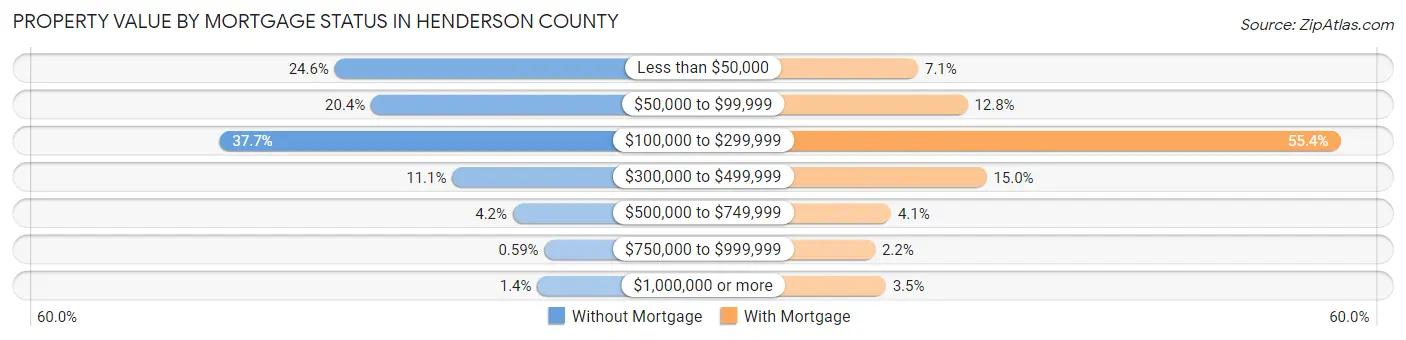
| Property Value | Without Mortgage | With Mortgage |
| Less than $50,000 | 3,482 (24.6%) | 723 (7.1%) |
| $50,000 to $99,999 | 2,892 (20.4%) | 1,295 (12.8%) |
| $100,000 to $299,999 | 5,350 (37.7%) | 5,606 (55.4%) |
| $300,000 to $499,999 | 1,576 (11.1%) | 1,514 (15.0%) |
| $500,000 to $749,999 | 595 (4.2%) | 410 (4.1%) |
| $750,000 to $999,999 | 84 (0.6%) | 225 (2.2%) |
| $1,000,000 or more | 199 (1.4%) | 349 (3.5%) |
| Total | 14,178 (100.0%) | 10,122 (100.0%) |
Household Income by Mortgage Status in Henderson County
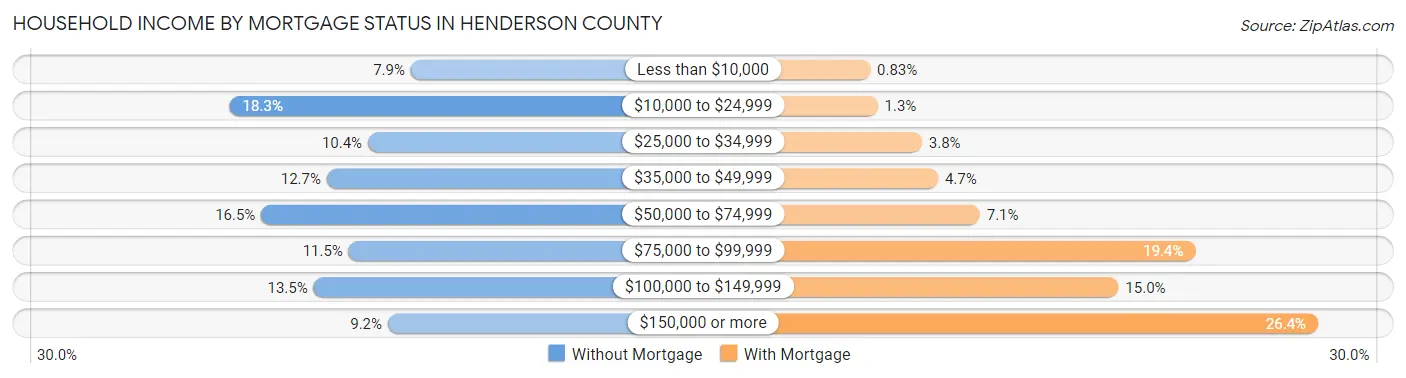
| Household Income | Without Mortgage | With Mortgage |
| Less than $10,000 | 1,124 (7.9%) | 84 (0.8%) |
| $10,000 to $24,999 | 2,593 (18.3%) | 128 (1.3%) |
| $25,000 to $34,999 | 1,471 (10.4%) | 384 (3.8%) |
| $35,000 to $49,999 | 1,805 (12.7%) | 477 (4.7%) |
| $50,000 to $74,999 | 2,336 (16.5%) | 719 (7.1%) |
| $75,000 to $99,999 | 1,627 (11.5%) | 1,965 (19.4%) |
| $100,000 to $149,999 | 1,912 (13.5%) | 1,520 (15.0%) |
| $150,000 or more | 1,310 (9.2%) | 2,674 (26.4%) |
| Total | 14,178 (100.0%) | 10,122 (100.0%) |
Property Value to Household Income Ratio in Henderson County
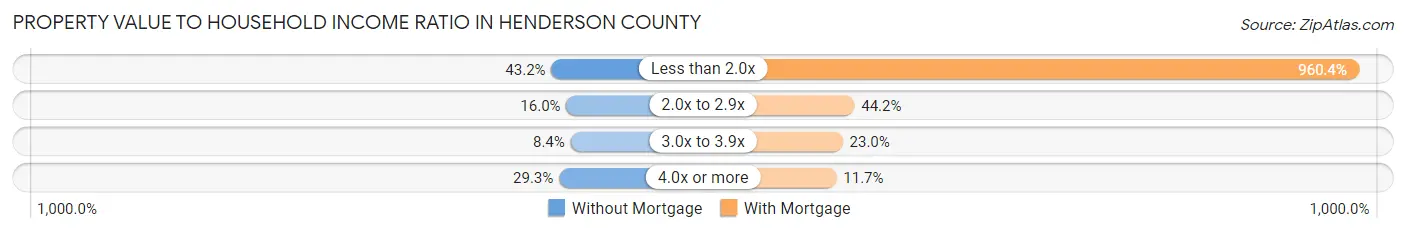
| Value-to-Income Ratio | Without Mortgage | With Mortgage |
| Less than 2.0x | 6,127 (43.2%) | 97,215 (960.4%) |
| 2.0x to 2.9x | 2,270 (16.0%) | 4,474 (44.2%) |
| 3.0x to 3.9x | 1,186 (8.4%) | 2,331 (23.0%) |
| 4.0x or more | 4,147 (29.2%) | 1,186 (11.7%) |
| Total | 14,178 (100.0%) | 10,122 (100.0%) |
Real Estate Taxes by Mortgage Status in Henderson County
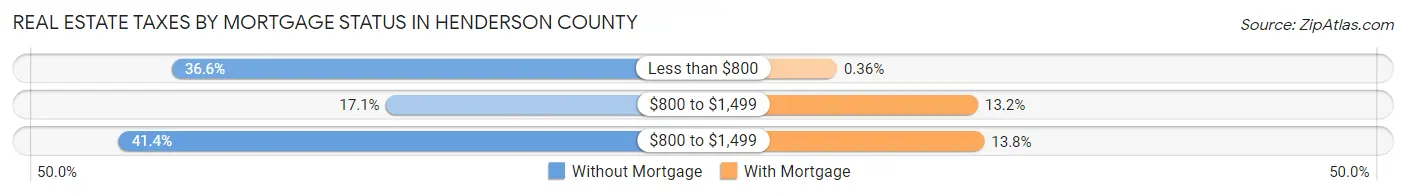
| Property Taxes | Without Mortgage | With Mortgage |
| Less than $800 | 5,182 (36.5%) | 36 (0.4%) |
| $800 to $1,499 | 2,418 (17.1%) | 1,340 (13.2%) |
| $800 to $1,499 | 5,869 (41.4%) | 1,399 (13.8%) |
| Total | 14,178 (100.0%) | 10,122 (100.0%) |
Health & Disability in Henderson County
Health Insurance Coverage by Age in Henderson County
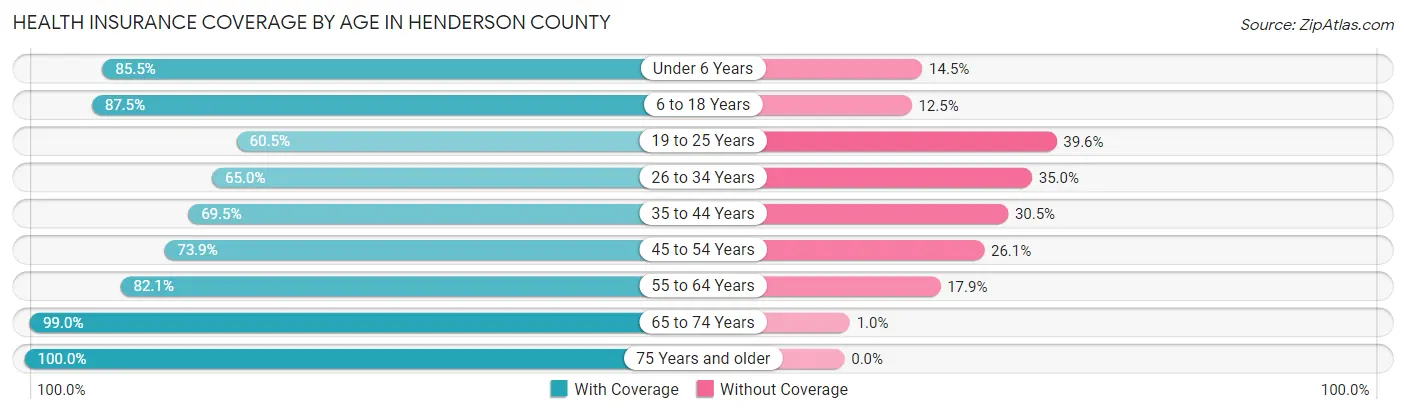
| Age Bracket | With Coverage | Without Coverage |
| Under 6 Years | 4,556 (85.5%) | 774 (14.5%) |
| 6 to 18 Years | 11,663 (87.5%) | 1,670 (12.5%) |
| 19 to 25 Years | 4,054 (60.5%) | 2,652 (39.6%) |
| 26 to 34 Years | 5,066 (65.0%) | 2,724 (35.0%) |
| 35 to 44 Years | 6,102 (69.5%) | 2,680 (30.5%) |
| 45 to 54 Years | 7,198 (73.9%) | 2,537 (26.1%) |
| 55 to 64 Years | 9,875 (82.1%) | 2,152 (17.9%) |
| 65 to 74 Years | 10,270 (99.0%) | 105 (1.0%) |
| 75 Years and older | 7,570 (100.0%) | 0 (0.0%) |
| Total | 66,354 (81.3%) | 15,294 (18.7%) |
Health Insurance Coverage by Citizenship Status in Henderson County
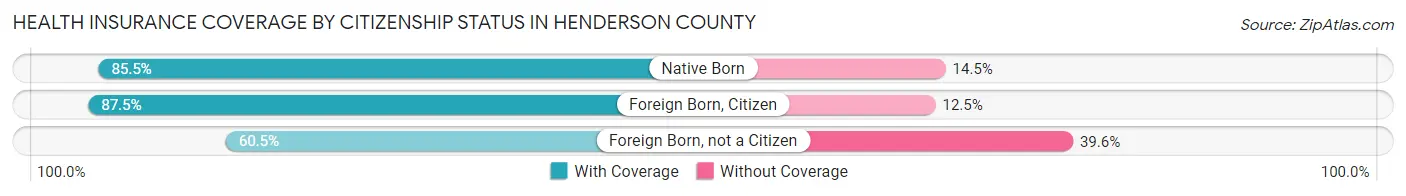
| Citizenship Status | With Coverage | Without Coverage |
| Native Born | 4,556 (85.5%) | 774 (14.5%) |
| Foreign Born, Citizen | 11,663 (87.5%) | 1,670 (12.5%) |
| Foreign Born, not a Citizen | 4,054 (60.5%) | 2,652 (39.6%) |
Health Insurance Coverage by Household Income in Henderson County
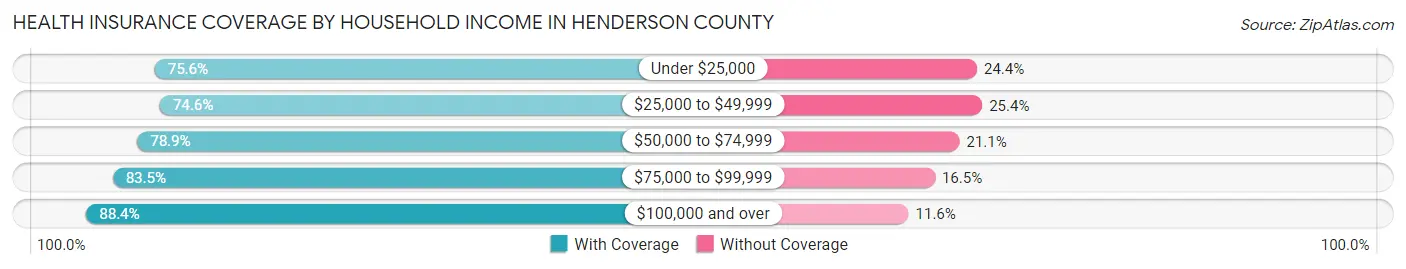
| Household Income | With Coverage | Without Coverage |
| Under $25,000 | 9,039 (75.6%) | 2,918 (24.4%) |
| $25,000 to $49,999 | 12,418 (74.6%) | 4,221 (25.4%) |
| $50,000 to $74,999 | 12,095 (78.9%) | 3,238 (21.1%) |
| $75,000 to $99,999 | 9,421 (83.5%) | 1,864 (16.5%) |
| $100,000 and over | 22,998 (88.4%) | 3,012 (11.6%) |
Public vs Private Health Insurance Coverage by Age in Henderson County
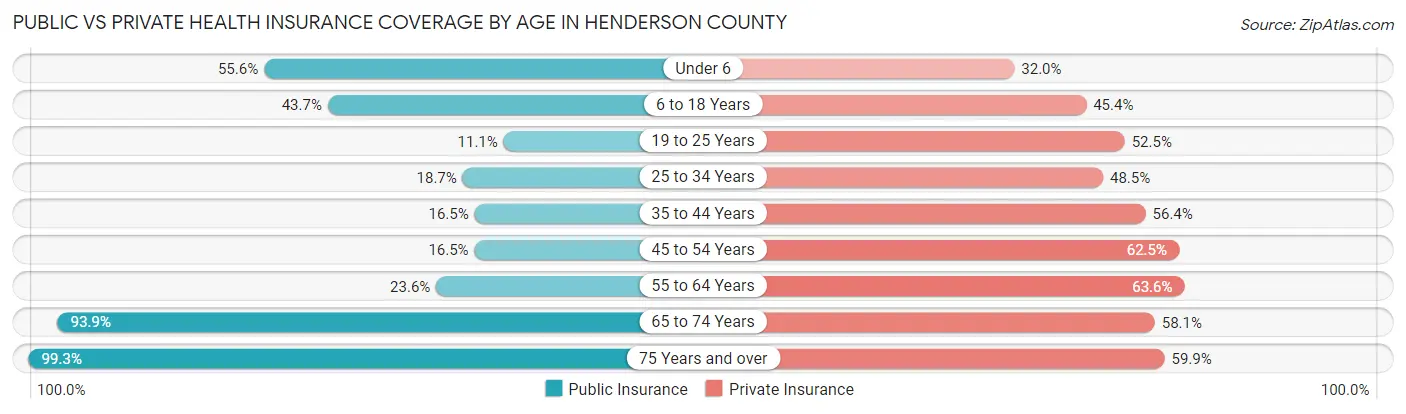
| Age Bracket | Public Insurance | Private Insurance |
| Under 6 | 2,962 (55.6%) | 1,707 (32.0%) |
| 6 to 18 Years | 5,830 (43.7%) | 6,049 (45.4%) |
| 19 to 25 Years | 744 (11.1%) | 3,522 (52.5%) |
| 25 to 34 Years | 1,457 (18.7%) | 3,777 (48.5%) |
| 35 to 44 Years | 1,448 (16.5%) | 4,952 (56.4%) |
| 45 to 54 Years | 1,606 (16.5%) | 6,088 (62.5%) |
| 55 to 64 Years | 2,840 (23.6%) | 7,645 (63.6%) |
| 65 to 74 Years | 9,739 (93.9%) | 6,028 (58.1%) |
| 75 Years and over | 7,515 (99.3%) | 4,535 (59.9%) |
| Total | 34,141 (41.8%) | 44,303 (54.3%) |
Disability Status by Sex by Age in Henderson County
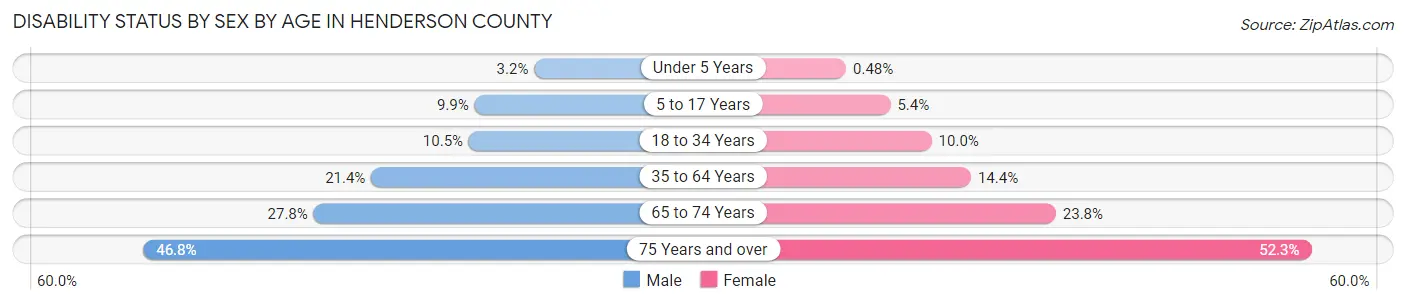
| Age Bracket | Male | Female |
| Under 5 Years | 79 (3.2%) | 10 (0.5%) |
| 5 to 17 Years | 677 (9.9%) | 340 (5.4%) |
| 18 to 34 Years | 830 (10.5%) | 763 (10.0%) |
| 35 to 64 Years | 3,136 (21.4%) | 2,286 (14.4%) |
| 65 to 74 Years | 1,399 (27.8%) | 1,274 (23.8%) |
| 75 Years and over | 1,581 (46.8%) | 2,191 (52.3%) |
Disability Class by Sex by Age in Henderson County
Disability Class: Hearing Difficulty
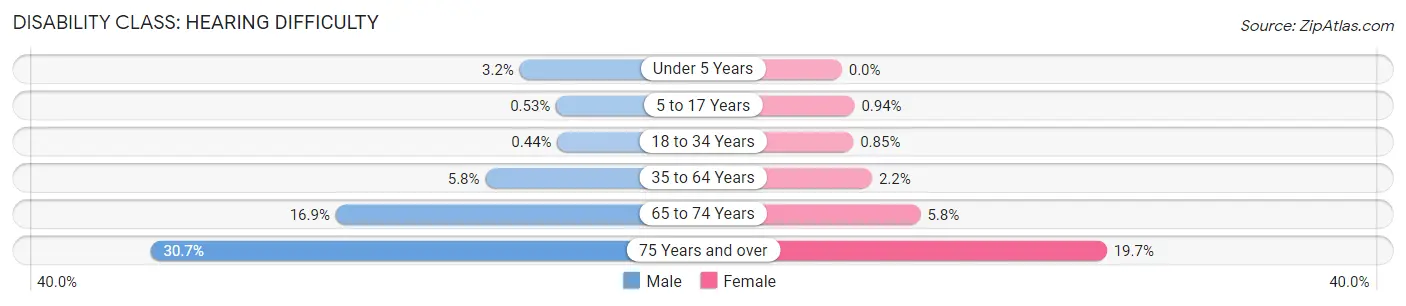
| Age Bracket | Male | Female |
| Under 5 Years | 79 (3.2%) | 0 (0.0%) |
| 5 to 17 Years | 36 (0.5%) | 59 (0.9%) |
| 18 to 34 Years | 35 (0.4%) | 65 (0.9%) |
| 35 to 64 Years | 848 (5.8%) | 356 (2.2%) |
| 65 to 74 Years | 850 (16.9%) | 312 (5.8%) |
| 75 Years and over | 1,036 (30.6%) | 824 (19.7%) |
Disability Class: Vision Difficulty
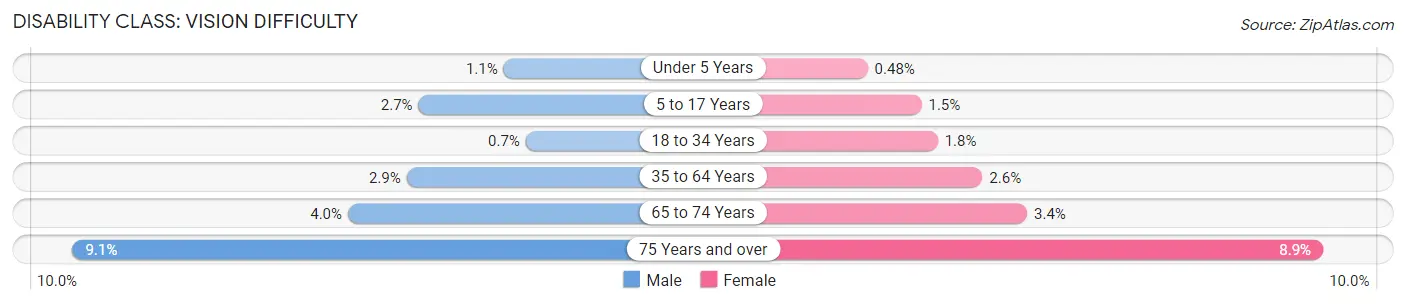
| Age Bracket | Male | Female |
| Under 5 Years | 27 (1.1%) | 10 (0.5%) |
| 5 to 17 Years | 184 (2.7%) | 93 (1.5%) |
| 18 to 34 Years | 55 (0.7%) | 136 (1.8%) |
| 35 to 64 Years | 426 (2.9%) | 414 (2.6%) |
| 65 to 74 Years | 201 (4.0%) | 184 (3.4%) |
| 75 Years and over | 308 (9.1%) | 374 (8.9%) |
Disability Class: Cognitive Difficulty
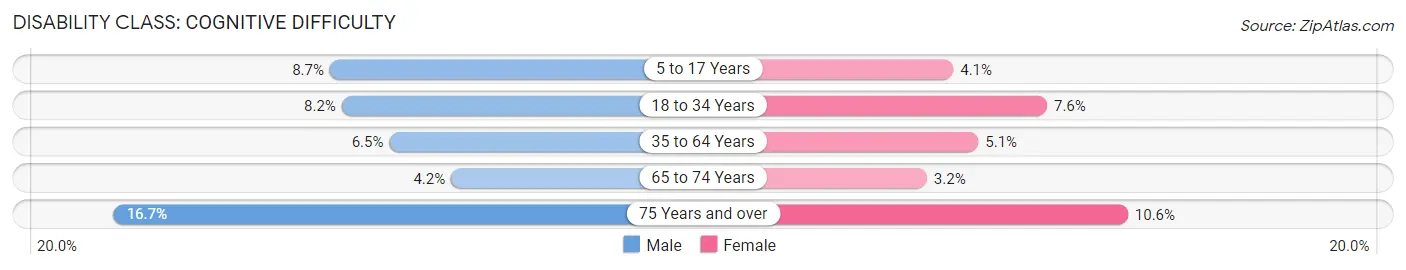
| Age Bracket | Male | Female |
| 5 to 17 Years | 593 (8.7%) | 260 (4.1%) |
| 18 to 34 Years | 649 (8.2%) | 581 (7.6%) |
| 35 to 64 Years | 947 (6.5%) | 806 (5.1%) |
| 65 to 74 Years | 210 (4.2%) | 169 (3.2%) |
| 75 Years and over | 564 (16.7%) | 445 (10.6%) |
Disability Class: Ambulatory Difficulty
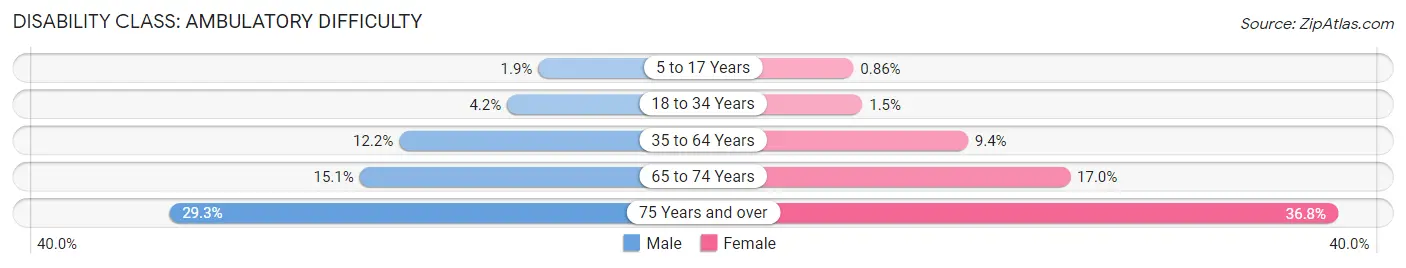
| Age Bracket | Male | Female |
| 5 to 17 Years | 128 (1.9%) | 54 (0.9%) |
| 18 to 34 Years | 330 (4.2%) | 116 (1.5%) |
| 35 to 64 Years | 1,788 (12.2%) | 1,488 (9.4%) |
| 65 to 74 Years | 761 (15.1%) | 906 (17.0%) |
| 75 Years and over | 989 (29.3%) | 1,543 (36.8%) |
Disability Class: Self-Care Difficulty
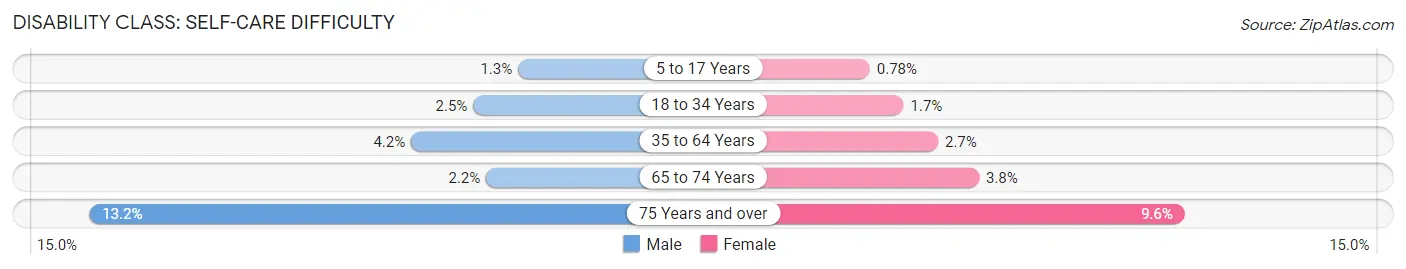
| Age Bracket | Male | Female |
| 5 to 17 Years | 86 (1.3%) | 49 (0.8%) |
| 18 to 34 Years | 198 (2.5%) | 131 (1.7%) |
| 35 to 64 Years | 622 (4.2%) | 426 (2.7%) |
| 65 to 74 Years | 108 (2.1%) | 204 (3.8%) |
| 75 Years and over | 446 (13.2%) | 400 (9.6%) |
Technology Access in Henderson County
Computing Device Access in Henderson County
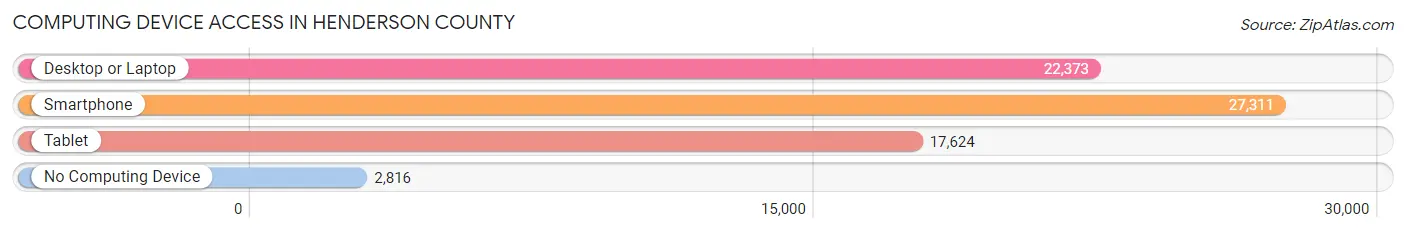
| Device Type | # Households | % Households |
| Desktop or Laptop | 22,373 | 70.0% |
| Smartphone | 27,311 | 85.4% |
| Tablet | 17,624 | 55.1% |
| No Computing Device | 2,816 | 8.8% |
| Total | 31,973 | 100.0% |
Internet Access in Henderson County
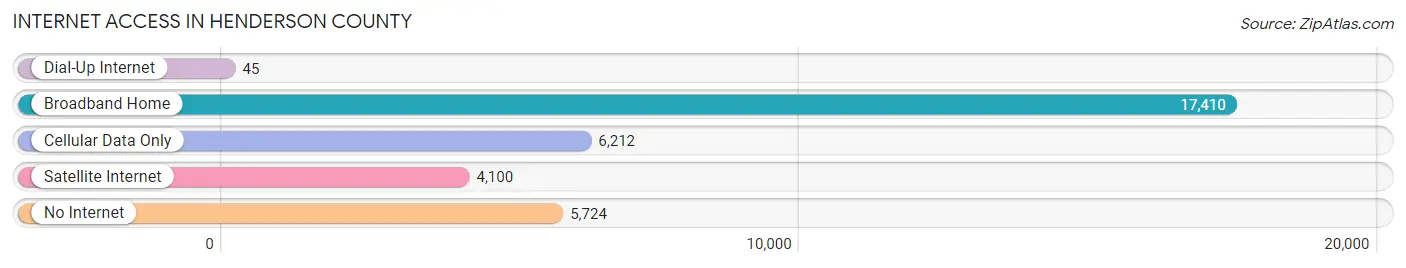
| Internet Type | # Households | % Households |
| Dial-Up Internet | 45 | 0.1% |
| Broadband Home | 17,410 | 54.4% |
| Cellular Data Only | 6,212 | 19.4% |
| Satellite Internet | 4,100 | 12.8% |
| No Internet | 5,724 | 17.9% |
| Total | 31,973 | 100.0% |
Henderson County Summary
Henderson County is located in the eastern part of the state of Texas, in the United States. It is part of the Tyler-Longview metropolitan statistical area and is bordered by Anderson, Van Zandt, Smith, and Cherokee counties. The county seat is Athens, and the largest city is Tyler. The county was named for James Pinckney Henderson, the first governor of Texas.
Geography
Henderson County covers an area of 845 square miles, of which 843 square miles is land and 2 square miles is water. The county is located in the East Texas Timberlands region, and is mostly flat with rolling hills. The terrain is mostly covered in pine and hardwood forests, with some open prairies. The county is drained by the Neches River and its tributaries, including the Trinity River. The highest point in the county is located in the northwest corner, at an elevation of 590 feet.
The climate of Henderson County is humid subtropical, with hot summers and mild winters. Average temperatures range from a low of 33°F in January to a high of 95°F in July. Average annual precipitation is around 44 inches.
Economy
The economy of Henderson County is largely based on agriculture and manufacturing. The county is home to a number of large farms, which produce cotton, soybeans, corn, and hay. The county is also home to several manufacturing plants, including a Tyson Foods poultry processing plant and a Goodyear tire plant.
The county is also home to a number of oil and gas fields, which produce natural gas and crude oil. The county is also home to a number of small businesses, including restaurants, retail stores, and service providers.
Demographics
As of the 2010 census, the population of Henderson County was 78,532. The population density was 93 people per square mile. The racial makeup of the county was 79.2% White, 15.7% African American, 0.5% Native American, 0.7% Asian, 0.1% Pacific Islander, 2.7% from other races, and 1.2% from two or more races. Hispanic or Latino of any race were 6.7% of the population.
The median income for a household in the county was $41,945, and the median income for a family was $50,945. The per capita income for the county was $21,845. About 14.2% of the population was below the poverty line.
Conclusion
Henderson County is located in the eastern part of the state of Texas, in the United States. It is part of the Tyler-Longview metropolitan statistical area and is bordered by Anderson, Van Zandt, Smith, and Cherokee counties. The county is mostly flat with rolling hills, and is covered in pine and hardwood forests, with some open prairies. The economy of Henderson County is largely based on agriculture and manufacturing, and the county is also home to a number of oil and gas fields. As of the 2010 census, the population of Henderson County was 78,532, with a median household income of $41,945.
Common Questions
What is Per Capita Income in Henderson County?
Per Capita income in Henderson County is $32,513.
What is the Median Family Income in Henderson County?
Median Family Income in Henderson County is $71,798.
What is the Median Household income in Henderson County?
Median Household Income in Henderson County is $59,778.
What is Income or Wage Gap in Henderson County?
Income or Wage Gap in Henderson County is 31.7%.
Women in Henderson County earn 68.3 cents for every dollar earned by a man.
What is Family Income Deficit in Henderson County?
Family Income Deficit in Henderson County is $10,817.
Families that are below poverty line in Henderson County earn $10,817 less on average than the poverty threshold level.
What is Inequality or Gini Index in Henderson County?
Inequality or Gini Index in Henderson County is 0.48.
What is the Total Population of Henderson County?
Total Population of Henderson County is 82,627.
What is the Total Male Population of Henderson County?
Total Male Population of Henderson County is 40,851.
What is the Total Female Population of Henderson County?
Total Female Population of Henderson County is 41,776.
What is the Ratio of Males per 100 Females in Henderson County?
There are 97.79 Males per 100 Females in Henderson County.
What is the Ratio of Females per 100 Males in Henderson County?
There are 102.26 Females per 100 Males in Henderson County.
What is the Median Population Age in Henderson County?
Median Population Age in Henderson County is 43.9 Years.
What is the Average Family Size in Henderson County
Average Family Size in Henderson County is 3.1 People.
What is the Average Household Size in Henderson County
Average Household Size in Henderson County is 2.5 People.
How Large is the Labor Force in Henderson County?
There are 35,657 People in the Labor Forcein in Henderson County.
What is the Percentage of People in the Labor Force in Henderson County?
53.2% of People are in the Labor Force in Henderson County.
What is the Unemployment Rate in Henderson County?
Unemployment Rate in Henderson County is 5.5%.