Hartley County, TX Map & Demographics
Hartley County Overview
$27,850
PER CAPITA INCOME
$105,724
AVG FAMILY INCOME
$78,065
AVG HOUSEHOLD INCOME
26.9%
WAGE / INCOME GAP [ % ]
73.1¢/ $1
WAGE / INCOME GAP [ $ ]
0.39
INEQUALITY / GINI INDEX
5,369
TOTAL POPULATION
3,055
MALE POPULATION
2,314
FEMALE POPULATION
132.02
MALES / 100 FEMALES
75.74
FEMALES / 100 MALES
39.7
MEDIAN AGE
2.9
AVG FAMILY SIZE
2.4
AVG HOUSEHOLD SIZE
1,796
LABOR FORCE [ PEOPLE ]
42.5%
PERCENT IN LABOR FORCE
1.5%
UNEMPLOYMENT RATE
Hartley County Area Codes
Income in Hartley County
Income Overview in Hartley County
Per Capita Income in Hartley County is $27,850, while median incomes of families and households are $105,724 and $78,065 respectively.
| Characteristic | Number | Measure |
| Per Capita Income | 5,369 | $27,850 |
| Median Family Income | 1,174 | $105,724 |
| Mean Family Income | 1,174 | $114,311 |
| Median Household Income | 1,626 | $78,065 |
| Mean Household Income | 1,626 | $98,638 |
| Income Deficit | 1,174 | $0 |
| Wage / Income Gap (%) | 5,369 | 26.88% |
| Wage / Income Gap ($) | 5,369 | 73.12¢ per $1 |
| Gini / Inequality Index | 5,369 | 0.39 |
Earnings by Sex in Hartley County
Average Earnings in Hartley County are $48,878, $53,661 for men and $39,236 for women, a difference of 26.9%.
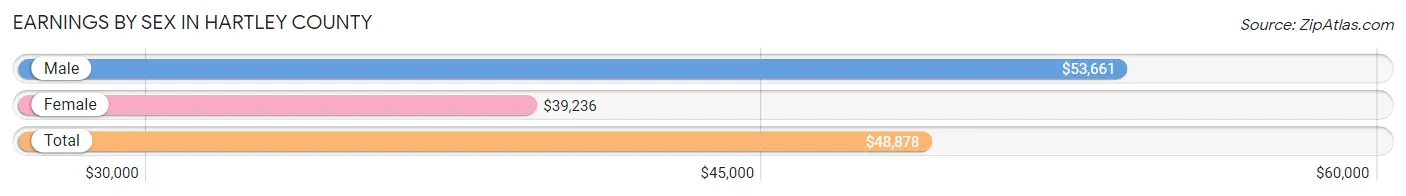
| Sex | Number | Average Earnings |
| Male | 978 (48.4%) | $53,661 |
| Female | 1,041 (51.6%) | $39,236 |
| Total | 2,019 (100.0%) | $48,878 |
Earnings by Sex by Income Bracket in Hartley County
The most common earnings brackets in Hartley County are $100,000+ for men (150 | 15.3%) and $45,000 to $49,999 for women (114 | 11.0%).
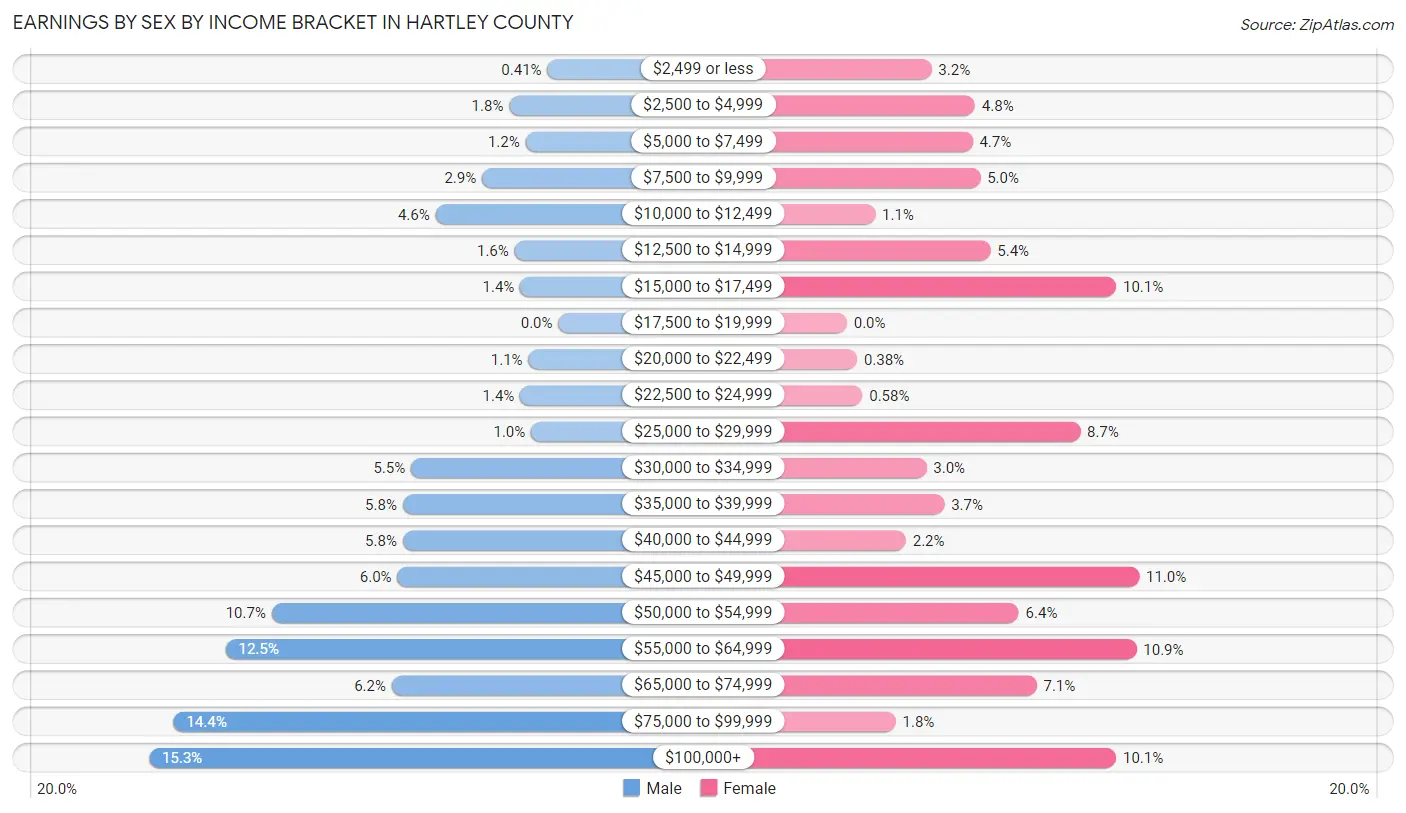
| Income | Male | Female |
| $2,499 or less | 4 (0.4%) | 33 (3.2%) |
| $2,500 to $4,999 | 18 (1.8%) | 50 (4.8%) |
| $5,000 to $7,499 | 12 (1.2%) | 49 (4.7%) |
| $7,500 to $9,999 | 28 (2.9%) | 52 (5.0%) |
| $10,000 to $12,499 | 45 (4.6%) | 11 (1.1%) |
| $12,500 to $14,999 | 16 (1.6%) | 56 (5.4%) |
| $15,000 to $17,499 | 14 (1.4%) | 105 (10.1%) |
| $17,500 to $19,999 | 0 (0.0%) | 0 (0.0%) |
| $20,000 to $22,499 | 11 (1.1%) | 4 (0.4%) |
| $22,500 to $24,999 | 14 (1.4%) | 6 (0.6%) |
| $25,000 to $29,999 | 10 (1.0%) | 91 (8.7%) |
| $30,000 to $34,999 | 54 (5.5%) | 31 (3.0%) |
| $35,000 to $39,999 | 57 (5.8%) | 38 (3.6%) |
| $40,000 to $44,999 | 57 (5.8%) | 23 (2.2%) |
| $45,000 to $49,999 | 59 (6.0%) | 114 (11.0%) |
| $50,000 to $54,999 | 105 (10.7%) | 67 (6.4%) |
| $55,000 to $64,999 | 122 (12.5%) | 113 (10.8%) |
| $65,000 to $74,999 | 61 (6.2%) | 74 (7.1%) |
| $75,000 to $99,999 | 141 (14.4%) | 19 (1.8%) |
| $100,000+ | 150 (15.3%) | 105 (10.1%) |
| Total | 978 (100.0%) | 1,041 (100.0%) |
Earnings by Sex by Educational Attainment in Hartley County
Average earnings in Hartley County are $54,554 for men and $43,250 for women, a difference of 20.7%. Men with an educational attainment of high school diploma enjoy the highest average annual earnings of $72,292, while those with less than high school education earn the least with $40,938. Women with an educational attainment of high school diploma earn the most with the average annual earnings of $56,065, while those with college or associate's degree education have the smallest earnings of $27,038.
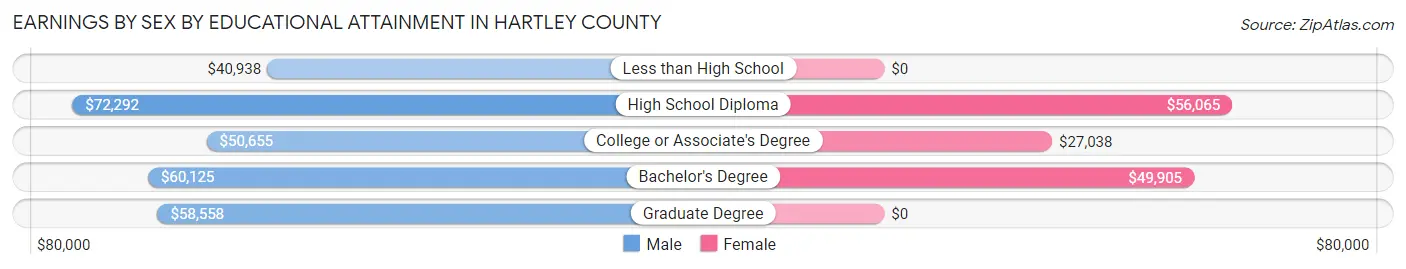
| Educational Attainment | Male Income | Female Income |
| Less than High School | $40,938 | $0 |
| High School Diploma | $72,292 | $56,065 |
| College or Associate's Degree | $50,655 | $27,038 |
| Bachelor's Degree | $60,125 | $49,905 |
| Graduate Degree | $58,558 | $0 |
| Total | $54,554 | $43,250 |
Family Income in Hartley County
Family Income Brackets in Hartley County
According to the Hartley County family income data, there are 316 families falling into the $100,000 to $149,999 income range, which is the most common income bracket and makes up 26.9% of all families. Conversely, the $10,000 to $14,999 income bracket is the least frequent group with only 4 families (0.3%) belonging to this category.
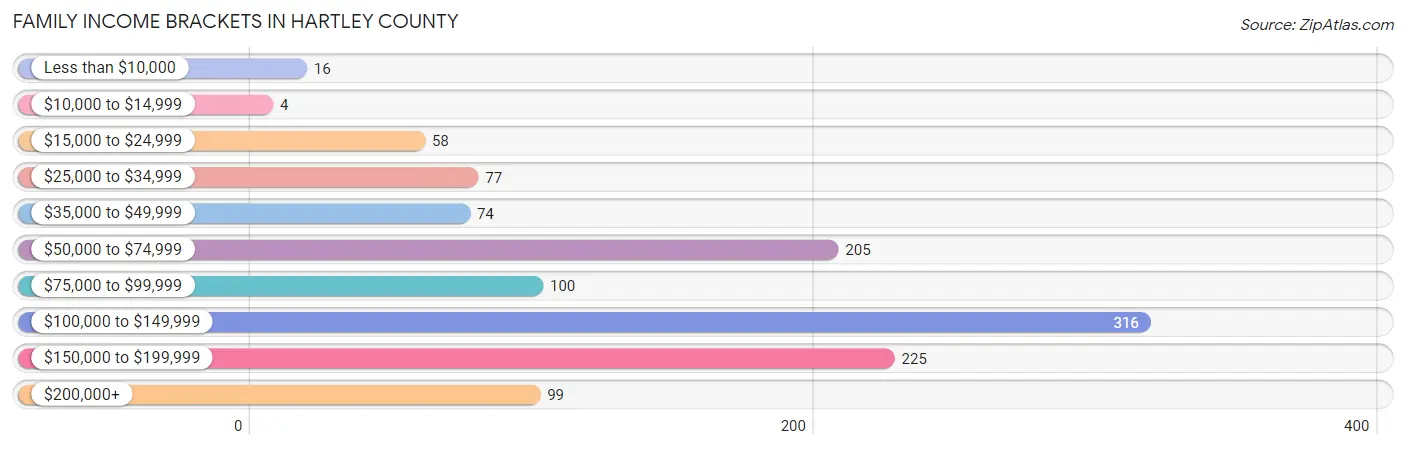
| Income Bracket | # Families | % Families |
| Less than $10,000 | 16 | 1.4% |
| $10,000 to $14,999 | 4 | 0.3% |
| $15,000 to $24,999 | 58 | 4.9% |
| $25,000 to $34,999 | 77 | 6.6% |
| $35,000 to $49,999 | 74 | 6.3% |
| $50,000 to $74,999 | 205 | 17.5% |
| $75,000 to $99,999 | 100 | 8.5% |
| $100,000 to $149,999 | 316 | 26.9% |
| $150,000 to $199,999 | 225 | 19.2% |
| $200,000+ | 99 | 8.4% |
Family Income by Famaliy Size in Hartley County
5-person families (143 | 12.2%) account for the highest median family income in Hartley County with $112,361 per family, while 2-person families (607 | 51.7%) have the highest median income of $54,182 per family member.
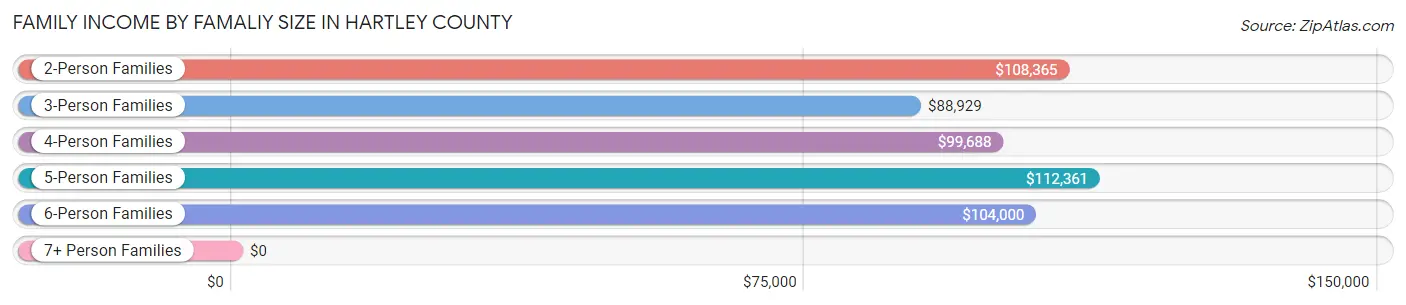
| Income Bracket | # Families | Median Income |
| 2-Person Families | 607 (51.7%) | $108,365 |
| 3-Person Families | 128 (10.9%) | $88,929 |
| 4-Person Families | 260 (22.2%) | $99,688 |
| 5-Person Families | 143 (12.2%) | $112,361 |
| 6-Person Families | 22 (1.9%) | $104,000 |
| 7+ Person Families | 14 (1.2%) | $0 |
| Total | 1,174 (100.0%) | $105,724 |
Family Income by Number of Earners in Hartley County
The median family income in Hartley County is $105,724, with families comprising 3+ earners (105) having the highest median family income of $153,512, while families with no earners (99) have the lowest median family income of $31,806, accounting for 8.9% and 8.4% of families, respectively.
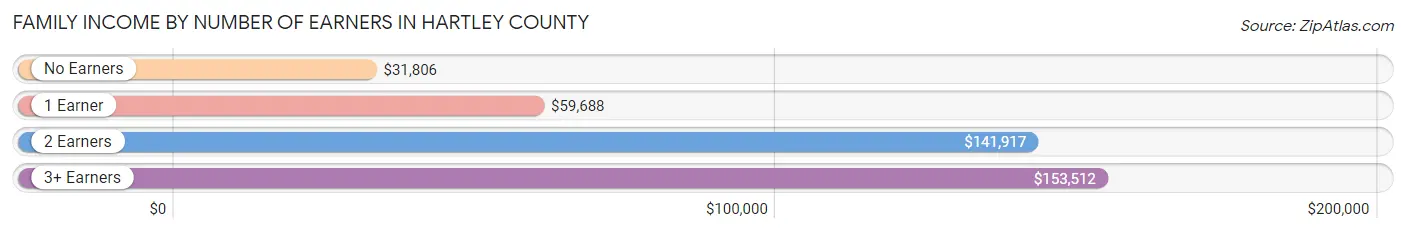
| Number of Earners | # Families | Median Income |
| No Earners | 99 (8.4%) | $31,806 |
| 1 Earner | 369 (31.4%) | $59,688 |
| 2 Earners | 601 (51.2%) | $141,917 |
| 3+ Earners | 105 (8.9%) | $153,512 |
| Total | 1,174 (100.0%) | $105,724 |
Household Income in Hartley County
Household Income Brackets in Hartley County
With 340 households falling in the category, the $50,000 to $74,999 income range is the most frequent in Hartley County, accounting for 20.9% of all households. In contrast, only 26 households (1.6%) fall into the $10,000 to $14,999 income bracket, making it the least populous group.
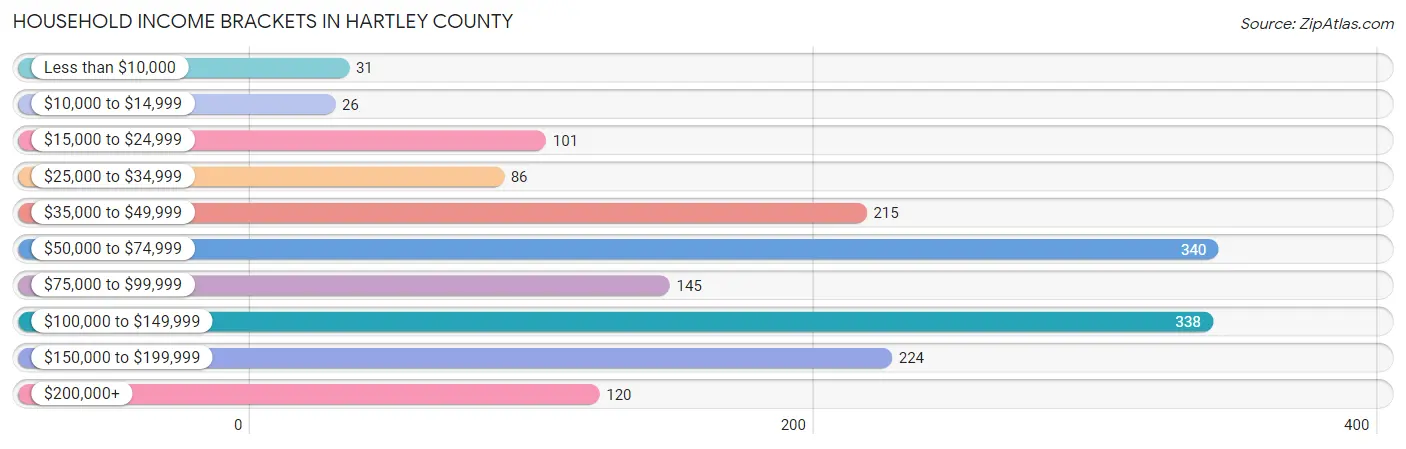
| Income Bracket | # Households | % Households |
| Less than $10,000 | 31 | 1.9% |
| $10,000 to $14,999 | 26 | 1.6% |
| $15,000 to $24,999 | 101 | 6.2% |
| $25,000 to $34,999 | 86 | 5.3% |
| $35,000 to $49,999 | 215 | 13.2% |
| $50,000 to $74,999 | 340 | 20.9% |
| $75,000 to $99,999 | 145 | 8.9% |
| $100,000 to $149,999 | 338 | 20.8% |
| $150,000 to $199,999 | 224 | 13.8% |
| $200,000+ | 120 | 7.4% |
Household Income by Householder Age in Hartley County
The median household income in Hartley County is $78,065, with the highest median household income of $105,521 found in the 45 to 64 years age bracket for the primary householder. A total of 403 households (24.8%) fall into this category. Meanwhile, the 65+ years age bracket for the primary householder has the lowest median household income of $50,250, with 592 households (36.4%) in this group.
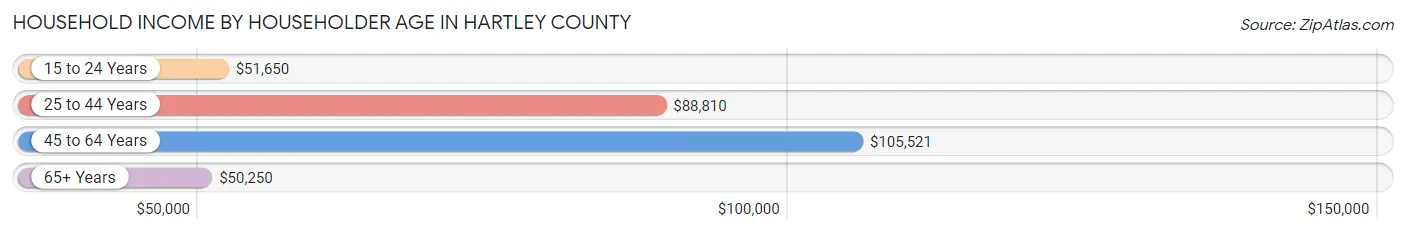
| Income Bracket | # Households | Median Income |
| 15 to 24 Years | 41 (2.5%) | $51,650 |
| 25 to 44 Years | 590 (36.3%) | $88,810 |
| 45 to 64 Years | 403 (24.8%) | $105,521 |
| 65+ Years | 592 (36.4%) | $50,250 |
| Total | 1,626 (100.0%) | $78,065 |
Poverty in Hartley County
Income Below Poverty by Sex and Age in Hartley County
With 5.6% poverty level for males and 7.9% for females among the residents of Hartley County, 12 to 14 year old males and 35 to 44 year old females are the most vulnerable to poverty, with 52 males (32.5%) and 68 females (26.4%) in their respective age groups living below the poverty level.
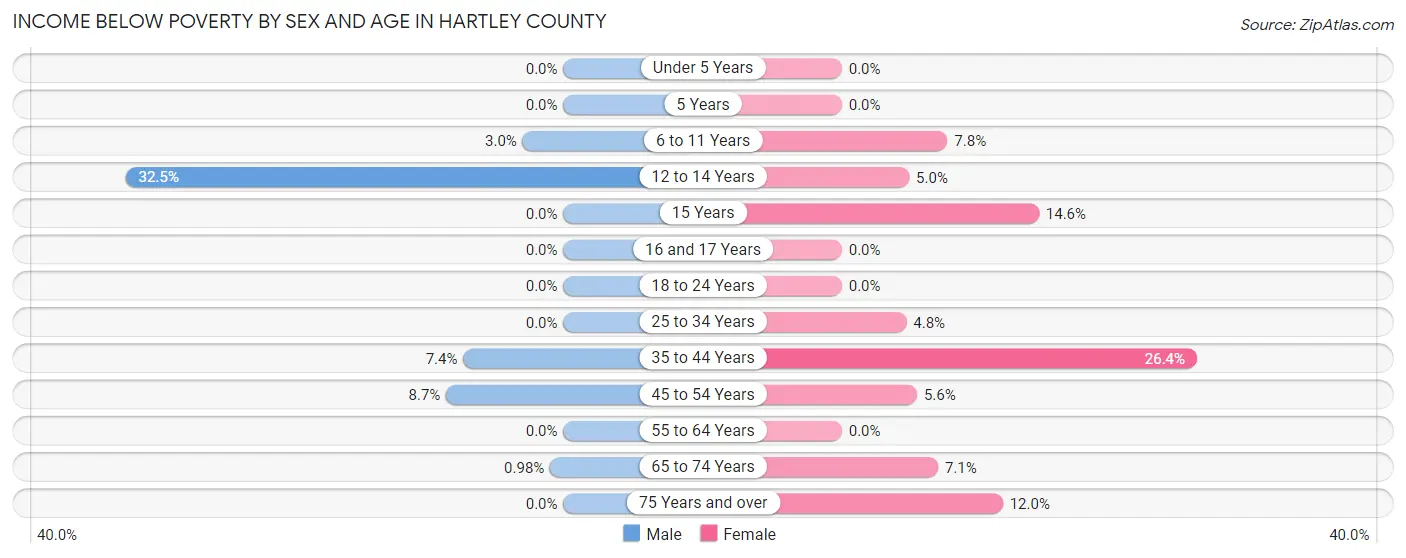
| Age Bracket | Male | Female |
| Under 5 Years | 0 (0.0%) | 0 (0.0%) |
| 5 Years | 0 (0.0%) | 0 (0.0%) |
| 6 to 11 Years | 6 (3.0%) | 24 (7.8%) |
| 12 to 14 Years | 52 (32.5%) | 6 (5.0%) |
| 15 Years | 0 (0.0%) | 6 (14.6%) |
| 16 and 17 Years | 0 (0.0%) | 0 (0.0%) |
| 18 to 24 Years | 0 (0.0%) | 0 (0.0%) |
| 25 to 34 Years | 0 (0.0%) | 19 (4.8%) |
| 35 to 44 Years | 15 (7.4%) | 68 (26.4%) |
| 45 to 54 Years | 16 (8.7%) | 11 (5.6%) |
| 55 to 64 Years | 0 (0.0%) | 0 (0.0%) |
| 65 to 74 Years | 2 (1.0%) | 15 (7.1%) |
| 75 Years and over | 0 (0.0%) | 30 (11.9%) |
| Total | 91 (5.6%) | 179 (7.9%) |
Income Above Poverty by Sex and Age in Hartley County
According to the poverty statistics in Hartley County, males aged under 5 years and females aged under 5 years are the age groups that are most secure financially, with 100.0% of males and 100.0% of females in these age groups living above the poverty line.
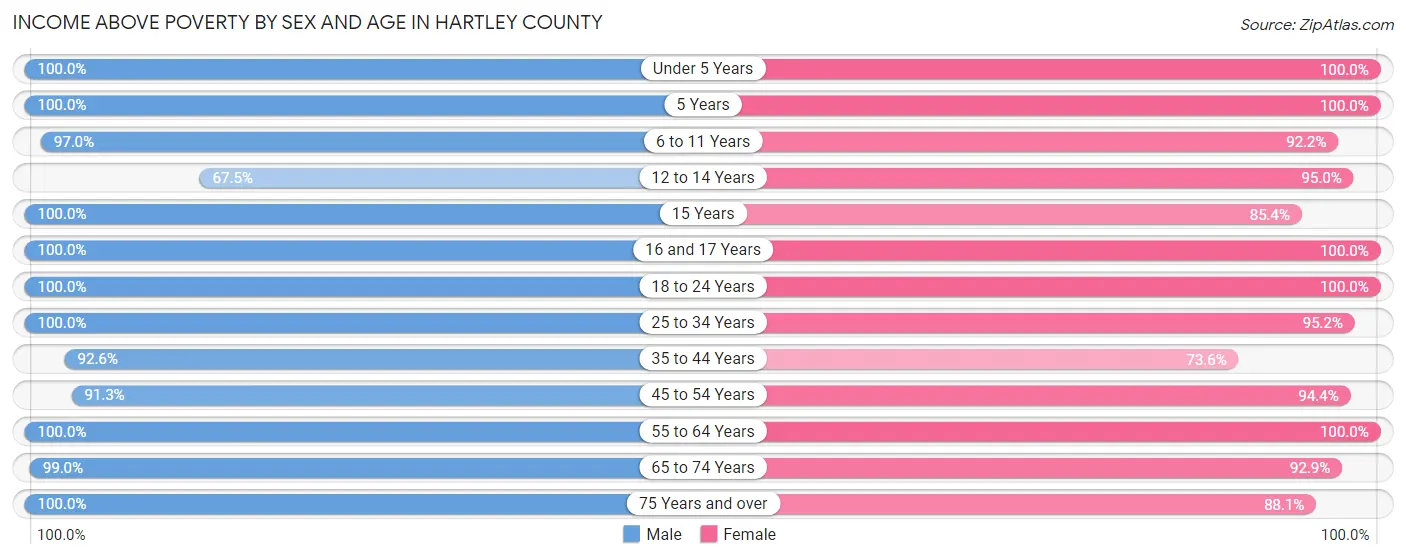
| Age Bracket | Male | Female |
| Under 5 Years | 118 (100.0%) | 159 (100.0%) |
| 5 Years | 8 (100.0%) | 3 (100.0%) |
| 6 to 11 Years | 193 (97.0%) | 282 (92.2%) |
| 12 to 14 Years | 108 (67.5%) | 114 (95.0%) |
| 15 Years | 14 (100.0%) | 35 (85.4%) |
| 16 and 17 Years | 29 (100.0%) | 20 (100.0%) |
| 18 to 24 Years | 15 (100.0%) | 72 (100.0%) |
| 25 to 34 Years | 176 (100.0%) | 378 (95.2%) |
| 35 to 44 Years | 187 (92.6%) | 190 (73.6%) |
| 45 to 54 Years | 168 (91.3%) | 186 (94.4%) |
| 55 to 64 Years | 175 (100.0%) | 220 (100.0%) |
| 65 to 74 Years | 202 (99.0%) | 195 (92.9%) |
| 75 Years and over | 150 (100.0%) | 221 (88.0%) |
| Total | 1,543 (94.4%) | 2,075 (92.1%) |
Income Below Poverty Among Married-Couple Families in Hartley County
The poverty statistics for married-couple families in Hartley County show that 3.3% or 33 of the total 1,009 families live below the poverty line. Families with 3 or 4 children have the highest poverty rate of 11.6%, comprising of 16 families. On the other hand, families with 5 or more children have the lowest poverty rate of 0.0%, which includes 0 families.
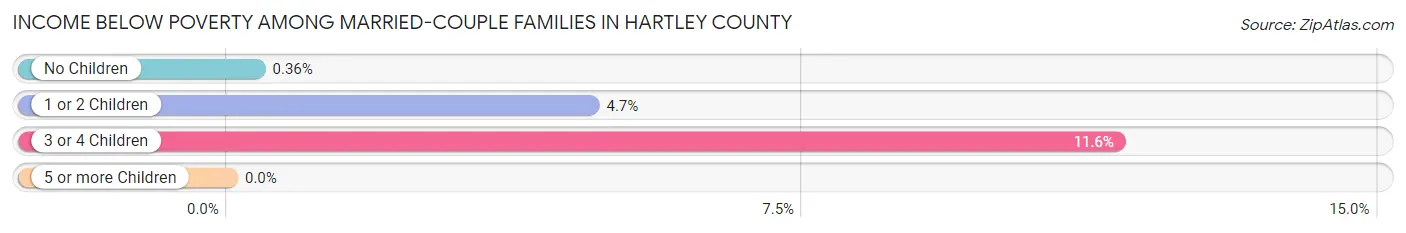
| Children | Above Poverty | Below Poverty |
| No Children | 550 (99.6%) | 2 (0.4%) |
| 1 or 2 Children | 303 (95.3%) | 15 (4.7%) |
| 3 or 4 Children | 122 (88.4%) | 16 (11.6%) |
| 5 or more Children | 1 (100.0%) | 0 (0.0%) |
| Total | 976 (96.7%) | 33 (3.3%) |
Income Below Poverty Among Single-Parent Households in Hartley County
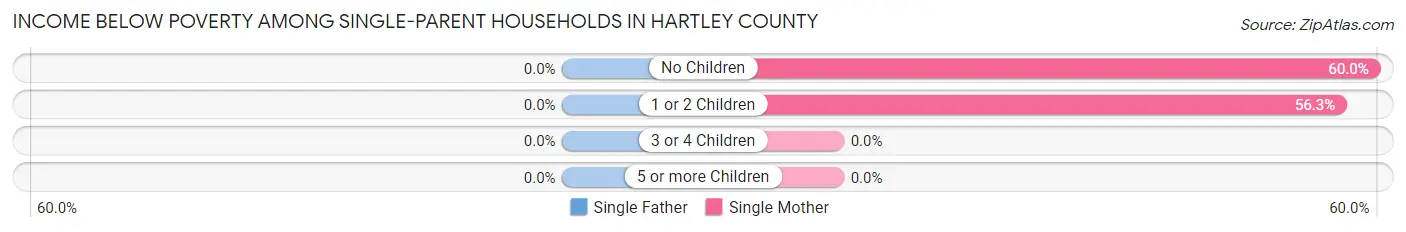
| Children | Single Father | Single Mother |
| No Children | 0 (0.0%) | 3 (60.0%) |
| 1 or 2 Children | 0 (0.0%) | 54 (56.2%) |
| 3 or 4 Children | 0 (0.0%) | 0 (0.0%) |
| 5 or more Children | 0 (0.0%) | 0 (0.0%) |
| Total | 0 (0.0%) | 57 (56.4%) |
Income Below Poverty Among Married-Couple vs Single-Parent Households in Hartley County
The poverty data for Hartley County shows that 33 of the married-couple family households (3.3%) and 57 of the single-parent households (34.5%) are living below the poverty level. Within the married-couple family households, those with 3 or 4 children have the highest poverty rate, with 16 households (11.6%) falling below the poverty line. Among the single-parent households, those with 1 or 2 children have the highest poverty rate, with 54 household (48.6%) living below poverty.
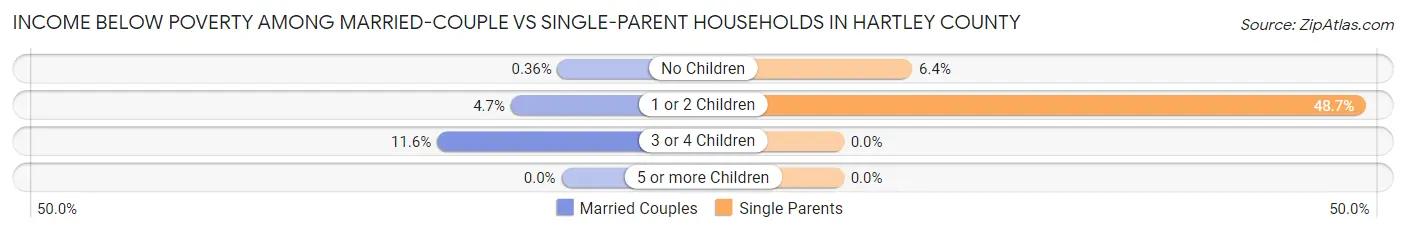
| Children | Married-Couple Families | Single-Parent Households |
| No Children | 2 (0.4%) | 3 (6.4%) |
| 1 or 2 Children | 15 (4.7%) | 54 (48.6%) |
| 3 or 4 Children | 16 (11.6%) | 0 (0.0%) |
| 5 or more Children | 0 (0.0%) | 0 (0.0%) |
| Total | 33 (3.3%) | 57 (34.5%) |
Race in Hartley County
The most populous races in Hartley County are White / Caucasian (4,021 | 74.9%), Hispanic or Latino (1,460 | 27.2%), and Two or more Races (698 | 13.0%).
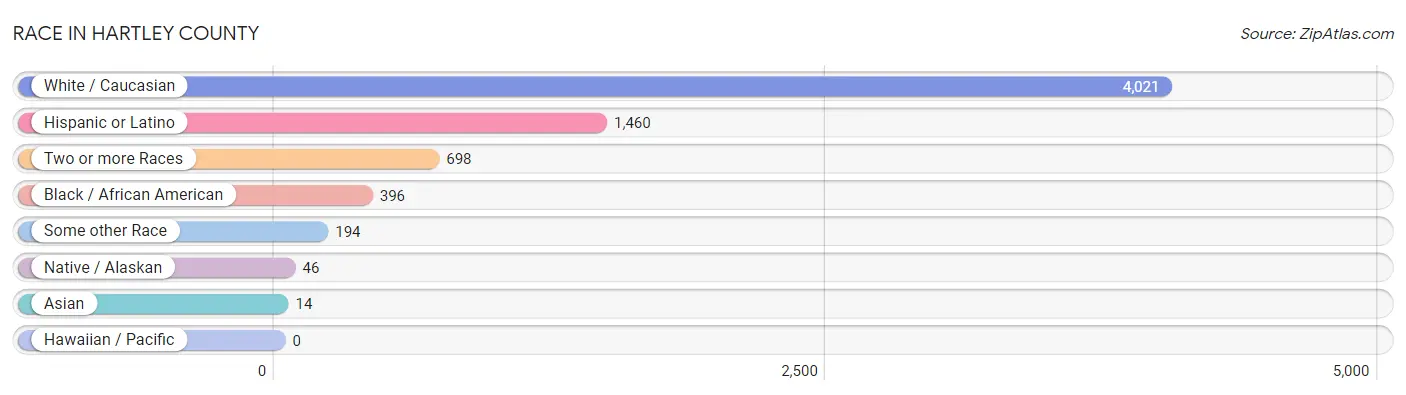
| Race | # Population | % Population |
| Asian | 14 | 0.3% |
| Black / African American | 396 | 7.4% |
| Hawaiian / Pacific | 0 | 0.0% |
| Hispanic or Latino | 1,460 | 27.2% |
| Native / Alaskan | 46 | 0.9% |
| White / Caucasian | 4,021 | 74.9% |
| Two or more Races | 698 | 13.0% |
| Some other Race | 194 | 3.6% |
| Total | 5,369 | 100.0% |
Ancestry in Hartley County
The most populous ancestries reported in Hartley County are Mexican (1,343 | 25.0%), English (846 | 15.8%), German (764 | 14.2%), Irish (602 | 11.2%), and American (214 | 4.0%), together accounting for 70.2% of all Hartley County residents.
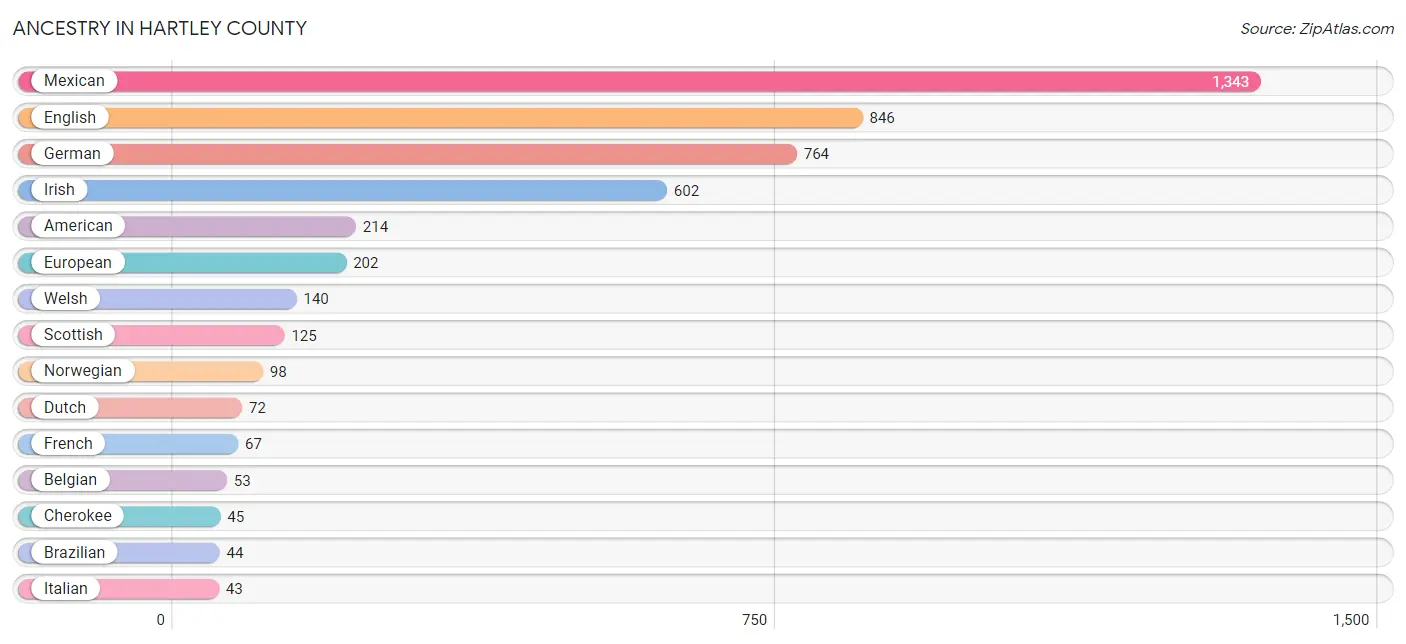
| Ancestry | # Population | % Population |
| African | 28 | 0.5% |
| American | 214 | 4.0% |
| Apache | 11 | 0.2% |
| Belgian | 53 | 1.0% |
| Bhutanese | 13 | 0.2% |
| Brazilian | 44 | 0.8% |
| British | 15 | 0.3% |
| Canadian | 17 | 0.3% |
| Celtic | 15 | 0.3% |
| Central American | 13 | 0.2% |
| Cherokee | 45 | 0.8% |
| Creek | 21 | 0.4% |
| Czech | 33 | 0.6% |
| Danish | 1 | 0.0% |
| Dutch | 72 | 1.3% |
| Dutch West Indian | 14 | 0.3% |
| English | 846 | 15.8% |
| European | 202 | 3.8% |
| French | 67 | 1.3% |
| French Canadian | 5 | 0.1% |
| German | 764 | 14.2% |
| Honduran | 6 | 0.1% |
| Indian (Asian) | 6 | 0.1% |
| Irish | 602 | 11.2% |
| Iroquois | 12 | 0.2% |
| Israeli | 16 | 0.3% |
| Italian | 43 | 0.8% |
| Jamaican | 12 | 0.2% |
| Korean | 20 | 0.4% |
| Mexican | 1,343 | 25.0% |
| Navajo | 18 | 0.3% |
| Northern European | 25 | 0.5% |
| Norwegian | 98 | 1.8% |
| Polish | 7 | 0.1% |
| Puerto Rican | 6 | 0.1% |
| Russian | 1 | 0.0% |
| Salvadoran | 7 | 0.1% |
| Scotch-Irish | 35 | 0.6% |
| Scottish | 125 | 2.3% |
| Sioux | 15 | 0.3% |
| Slovak | 3 | 0.1% |
| Spaniard | 43 | 0.8% |
| Subsaharan African | 28 | 0.5% |
| Swedish | 30 | 0.6% |
| Thai | 12 | 0.2% |
| Ukrainian | 41 | 0.8% |
| Welsh | 140 | 2.6% | View All 47 Rows |
Immigrants in Hartley County
The most numerous immigrant groups reported in Hartley County came from Latin America (395 | 7.4%), Central America (389 | 7.2%), Mexico (383 | 7.1%), Canada (45 | 0.8%), and Europe (15 | 0.3%), together accounting for 22.9% of all Hartley County residents.
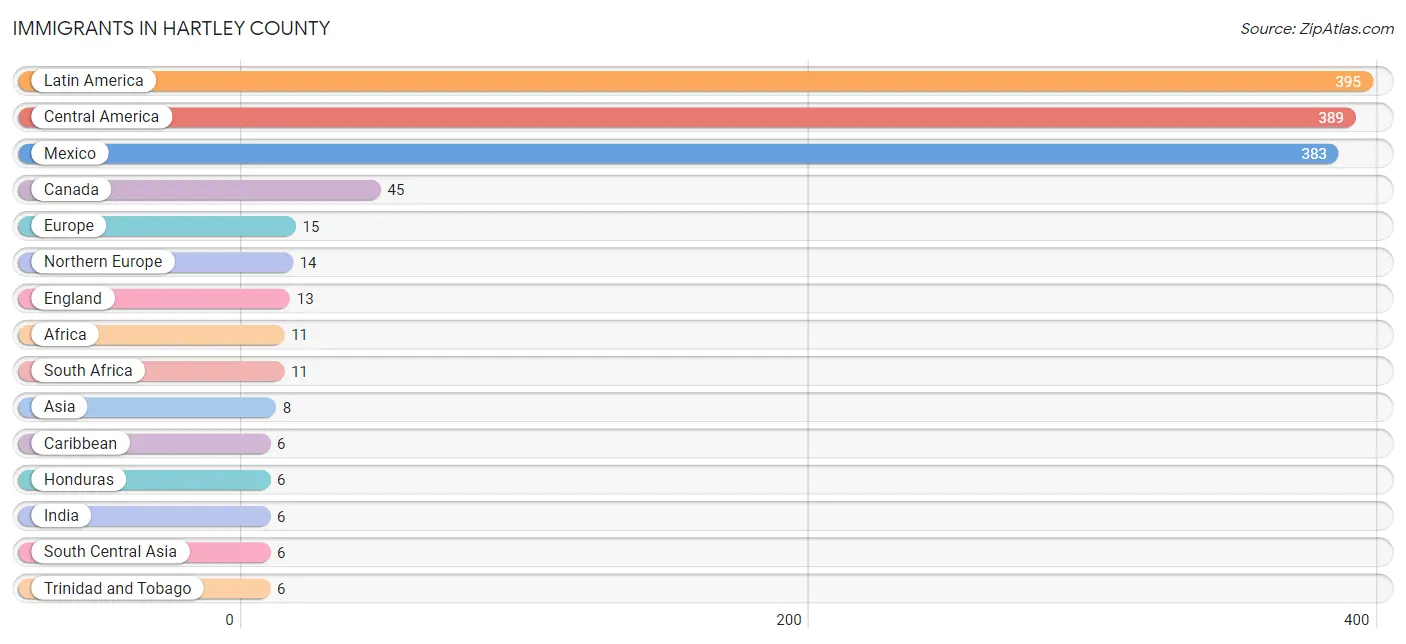
| Immigration Origin | # Population | % Population |
| Africa | 11 | 0.2% |
| Asia | 8 | 0.2% |
| Canada | 45 | 0.8% |
| Caribbean | 6 | 0.1% |
| Central America | 389 | 7.2% |
| England | 13 | 0.2% |
| Europe | 15 | 0.3% |
| Honduras | 6 | 0.1% |
| India | 6 | 0.1% |
| Ireland | 1 | 0.0% |
| Latin America | 395 | 7.4% |
| Mexico | 383 | 7.1% |
| Northern Europe | 14 | 0.3% |
| Philippines | 2 | 0.0% |
| South Africa | 11 | 0.2% |
| South Central Asia | 6 | 0.1% |
| South Eastern Asia | 2 | 0.0% |
| Southern Europe | 1 | 0.0% |
| Spain | 1 | 0.0% |
| Trinidad and Tobago | 6 | 0.1% | View All 20 Rows |
Sex and Age in Hartley County
Sex and Age in Hartley County
The most populous age groups in Hartley County are 40 to 44 Years (492 | 16.1%) for men and 10 to 14 Years (218 | 9.4%) for women.
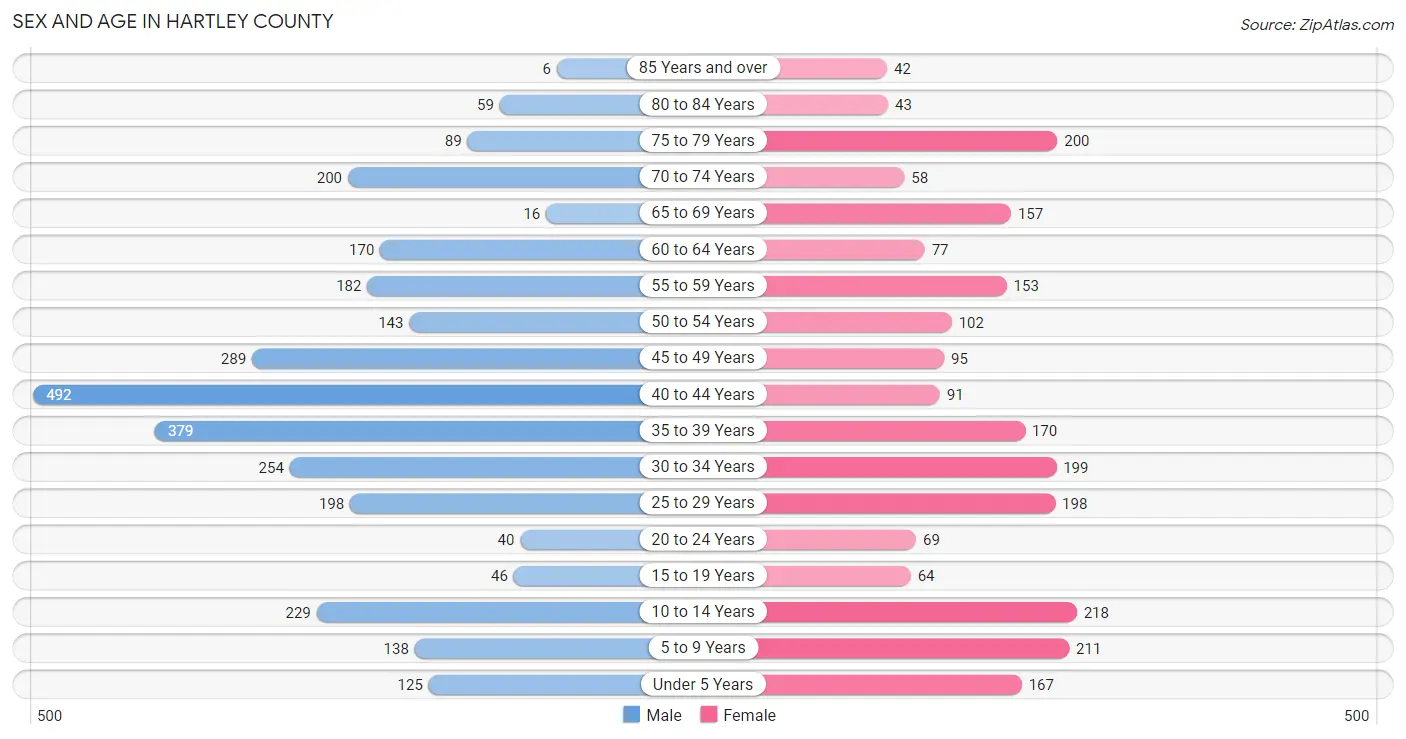
| Age Bracket | Male | Female |
| Under 5 Years | 125 (4.1%) | 167 (7.2%) |
| 5 to 9 Years | 138 (4.5%) | 211 (9.1%) |
| 10 to 14 Years | 229 (7.5%) | 218 (9.4%) |
| 15 to 19 Years | 46 (1.5%) | 64 (2.8%) |
| 20 to 24 Years | 40 (1.3%) | 69 (3.0%) |
| 25 to 29 Years | 198 (6.5%) | 198 (8.6%) |
| 30 to 34 Years | 254 (8.3%) | 199 (8.6%) |
| 35 to 39 Years | 379 (12.4%) | 170 (7.3%) |
| 40 to 44 Years | 492 (16.1%) | 91 (3.9%) |
| 45 to 49 Years | 289 (9.5%) | 95 (4.1%) |
| 50 to 54 Years | 143 (4.7%) | 102 (4.4%) |
| 55 to 59 Years | 182 (6.0%) | 153 (6.6%) |
| 60 to 64 Years | 170 (5.6%) | 77 (3.3%) |
| 65 to 69 Years | 16 (0.5%) | 157 (6.8%) |
| 70 to 74 Years | 200 (6.6%) | 58 (2.5%) |
| 75 to 79 Years | 89 (2.9%) | 200 (8.6%) |
| 80 to 84 Years | 59 (1.9%) | 43 (1.9%) |
| 85 Years and over | 6 (0.2%) | 42 (1.8%) |
| Total | 3,055 (100.0%) | 2,314 (100.0%) |
Families and Households in Hartley County
Median Family Size in Hartley County
The median family size in Hartley County is 2.85 persons per family, with married-couple families (1,009 | 86.0%) accounting for the largest median family size of 3.02 persons per family. On the other hand, single male/father families (64 | 5.4%) represent the smallest median family size with 1.83 persons per family.
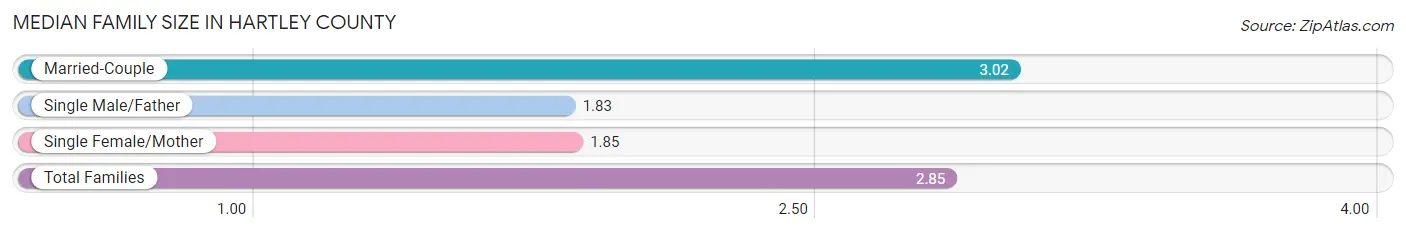
| Family Type | # Families | Family Size |
| Married-Couple | 1,009 (86.0%) | 3.02 |
| Single Male/Father | 64 (5.4%) | 1.83 |
| Single Female/Mother | 101 (8.6%) | 1.85 |
| Total Families | 1,174 (100.0%) | 2.85 |
Median Household Size in Hartley County
The median household size in Hartley County is 2.40 persons per household, with married-couple households (1,009 | 62.1%) accounting for the largest median household size of 3.02 persons per household. non-family households (452 | 27.8%) represent the smallest median household size with 1.10 persons per household.
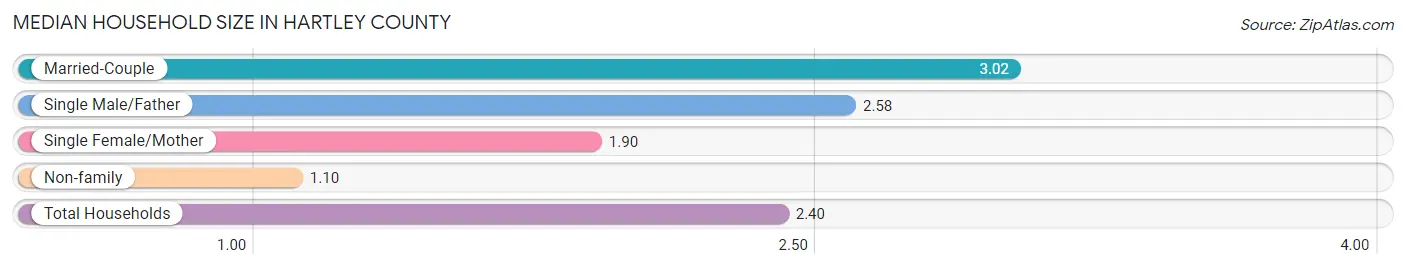
| Household Type | # Households | Household Size |
| Married-Couple | 1,009 (62.1%) | 3.02 |
| Single Male/Father | 64 (3.9%) | 2.58 |
| Single Female/Mother | 101 (6.2%) | 1.90 |
| Non-family | 452 (27.8%) | 1.10 |
| Total Households | 1,626 (100.0%) | 2.40 |
Household Size by Marriage Status in Hartley County
Out of a total of 1,626 households in Hartley County, 1,174 (72.2%) are family households, while 452 (27.8%) are nonfamily households. The most numerous type of family households are 2-person households, comprising 594, and the most common type of nonfamily households are 1-person households, comprising 417.
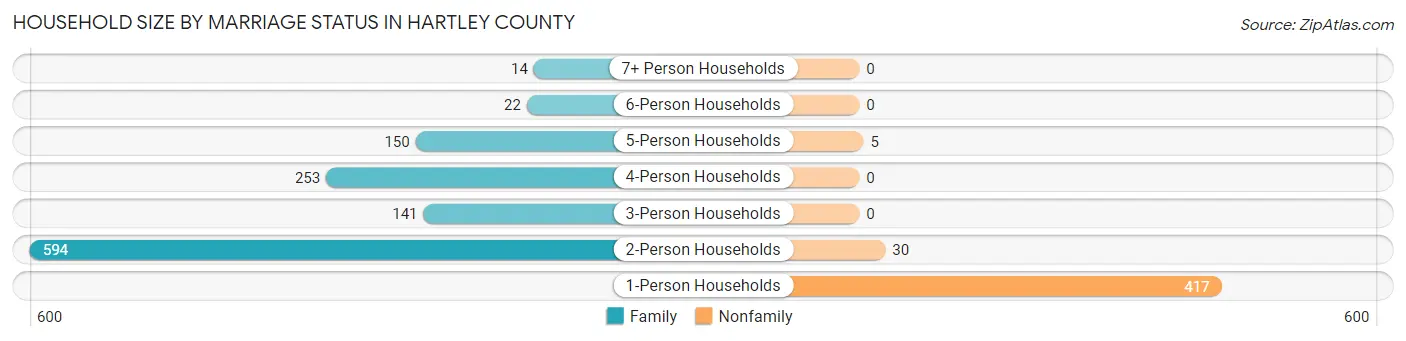
| Household Size | Family Households | Nonfamily Households |
| 1-Person Households | - | 417 (25.7%) |
| 2-Person Households | 594 (36.5%) | 30 (1.8%) |
| 3-Person Households | 141 (8.7%) | 0 (0.0%) |
| 4-Person Households | 253 (15.6%) | 0 (0.0%) |
| 5-Person Households | 150 (9.2%) | 5 (0.3%) |
| 6-Person Households | 22 (1.3%) | 0 (0.0%) |
| 7+ Person Households | 14 (0.9%) | 0 (0.0%) |
| Total | 1,174 (72.2%) | 452 (27.8%) |
Female Fertility in Hartley County
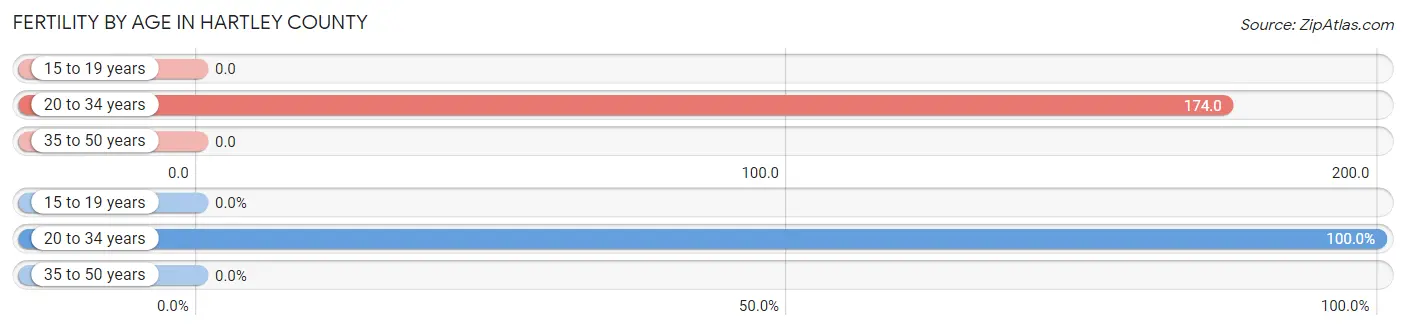
Fertility by Age in Hartley County
Average fertility rate in Hartley County is 89.0 births per 1,000 women. Women in the age bracket of 20 to 34 years have the highest fertility rate with 174.0 births per 1,000 women. Women in the age bracket of 20 to 34 years acount for 100.0% of all women with births.
| Age Bracket | Women with Births | Births / 1,000 Women |
| 15 to 19 years | 0 (0.0%) | 0.0 |
| 20 to 34 years | 81 (100.0%) | 174.0 |
| 35 to 50 years | 0 (0.0%) | 0.0 |
| Total | 81 (100.0%) | 89.0 |
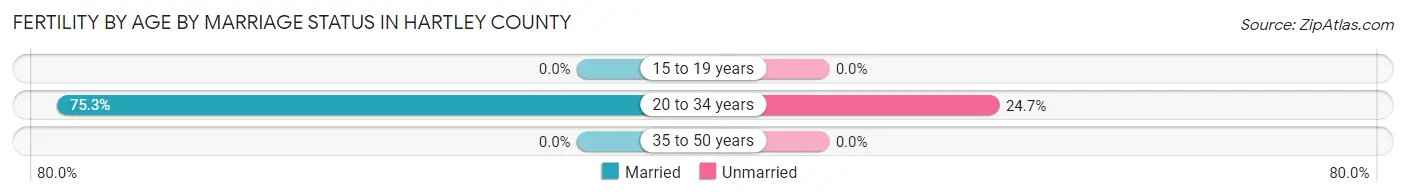
Fertility by Age by Marriage Status in Hartley County
75.3% of women with births (81) in Hartley County are married. The highest percentage of unmarried women with births falls into 20 to 34 years age bracket with 24.7% of them unmarried at the time of birth, while the lowest percentage of unmarried women with births belong to 20 to 34 years age bracket with 24.7% of them unmarried.
| Age Bracket | Married | Unmarried |
| 15 to 19 years | 0 (0.0%) | 0 (0.0%) |
| 20 to 34 years | 61 (75.3%) | 20 (24.7%) |
| 35 to 50 years | 0 (0.0%) | 0 (0.0%) |
| Total | 61 (75.3%) | 20 (24.7%) |
Fertility by Education in Hartley County
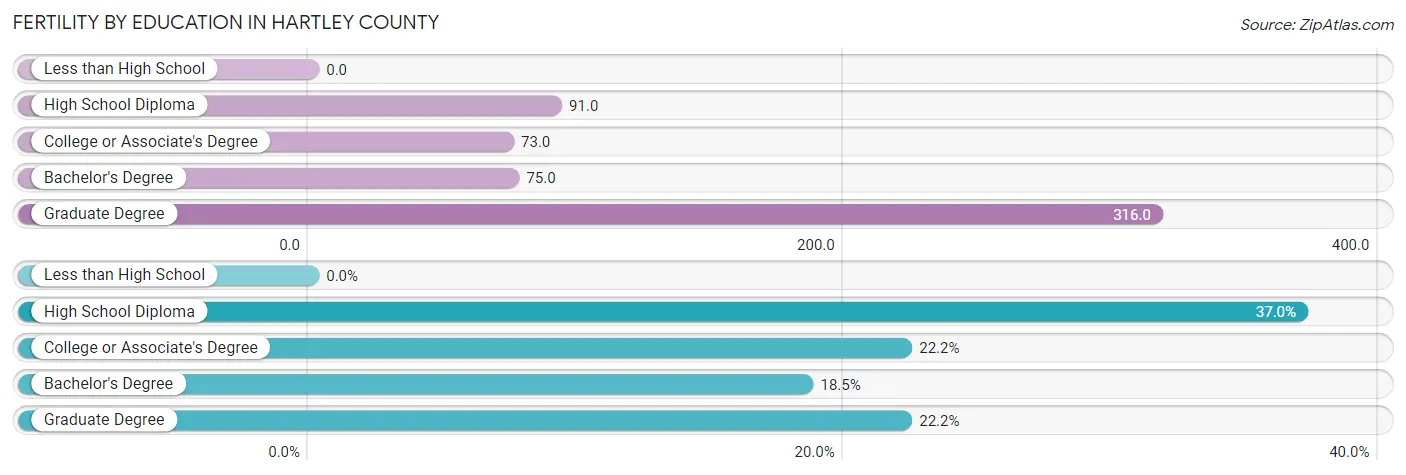
| Educational Attainment | Women with Births | Births / 1,000 Women |
| Less than High School | 0 (0.0%) | 0.0 |
| High School Diploma | 30 (37.0%) | 91.0 |
| College or Associate's Degree | 18 (22.2%) | 73.0 |
| Bachelor's Degree | 15 (18.5%) | 75.0 |
| Graduate Degree | 18 (22.2%) | 316.0 |
| Total | 81 (100.0%) | 89.0 |
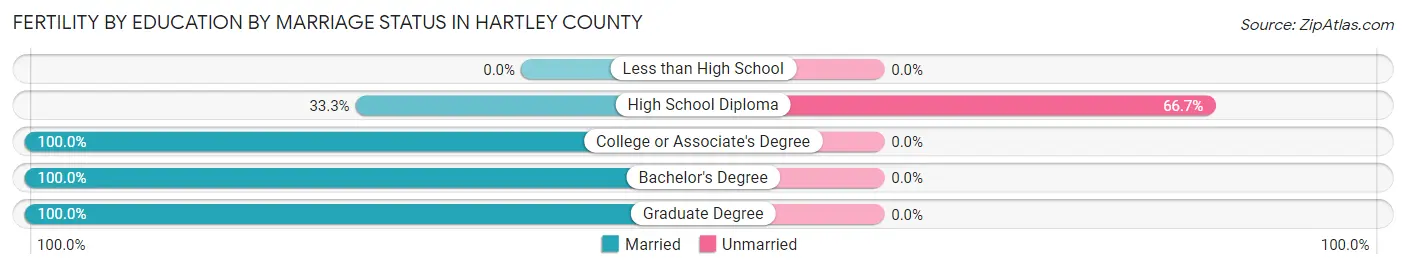
Fertility by Education by Marriage Status in Hartley County
24.7% of women with births in Hartley County are unmarried. Women with the educational attainment of college or associate's degree are most likely to be married with 100.0% of them married at childbirth, while women with the educational attainment of high school diploma are least likely to be married with 66.7% of them unmarried at childbirth.
| Educational Attainment | Married | Unmarried |
| Less than High School | 0 (0.0%) | 0 (0.0%) |
| High School Diploma | 10 (33.3%) | 20 (66.7%) |
| College or Associate's Degree | 18 (100.0%) | 0 (0.0%) |
| Bachelor's Degree | 15 (100.0%) | 0 (0.0%) |
| Graduate Degree | 18 (100.0%) | 0 (0.0%) |
| Total | 61 (75.3%) | 20 (24.7%) |
Employment Characteristics in Hartley County
Employment by Class of Employer in Hartley County
Among the 1,695 employed individuals in Hartley County, private company employees (916 | 54.0%), self-employed (not incorporated) (269 | 15.9%), and local government employees (202 | 11.9%) make up the most common classes of employment.
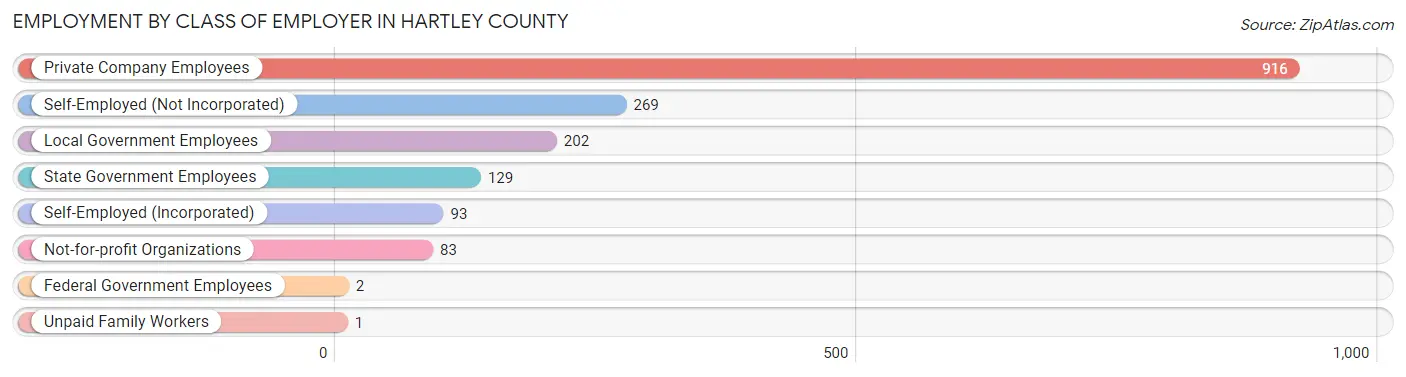
| Employer Class | # Employees | % Employees |
| Private Company Employees | 916 | 54.0% |
| Self-Employed (Incorporated) | 93 | 5.5% |
| Self-Employed (Not Incorporated) | 269 | 15.9% |
| Not-for-profit Organizations | 83 | 4.9% |
| Local Government Employees | 202 | 11.9% |
| State Government Employees | 129 | 7.6% |
| Federal Government Employees | 2 | 0.1% |
| Unpaid Family Workers | 1 | 0.1% |
| Total | 1,695 | 100.0% |
Employment Status by Age in Hartley County
According to the labor force statistics for Hartley County, out of the total population over 16 years of age (4,226), 42.5% or 1,796 individuals are in the labor force, with 1.5% or 27 of them unemployed. The age group with the highest labor force participation rate is 25 to 29 years, with 62.6% or 248 individuals in the labor force. Within the labor force, the 60 to 64 years age range has the highest percentage of unemployed individuals, with 6.0% or 7 of them being unemployed.
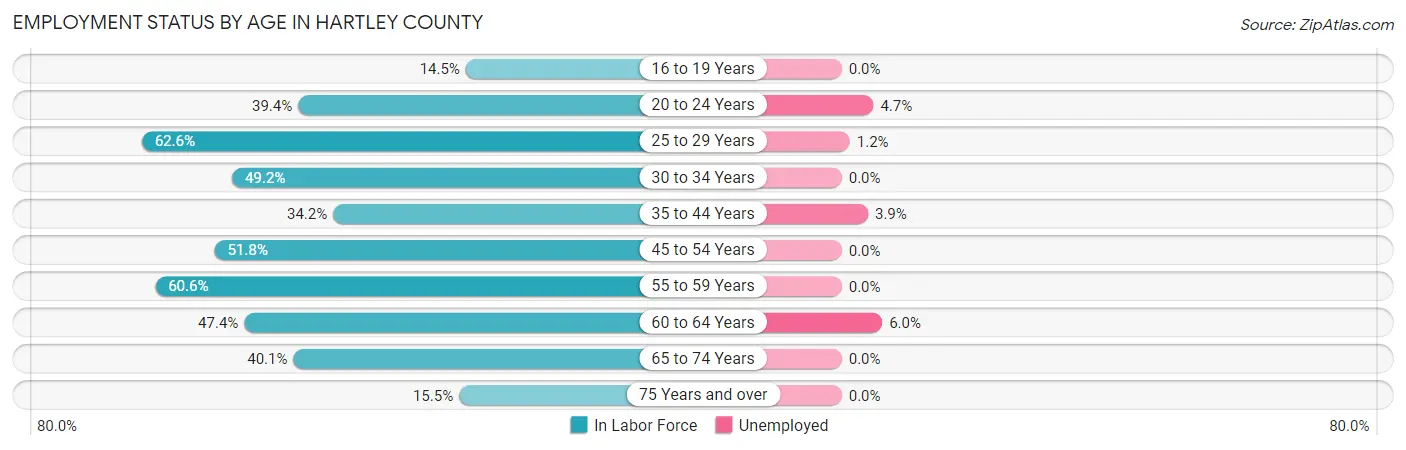
| Age Bracket | In Labor Force | Unemployed |
| 16 to 19 Years | 8 (14.5%) | 0 (0.0%) |
| 20 to 24 Years | 43 (39.4%) | 2 (4.7%) |
| 25 to 29 Years | 248 (62.6%) | 3 (1.2%) |
| 30 to 34 Years | 223 (49.2%) | 0 (0.0%) |
| 35 to 44 Years | 387 (34.2%) | 15 (3.9%) |
| 45 to 54 Years | 326 (51.8%) | 0 (0.0%) |
| 55 to 59 Years | 203 (60.6%) | 0 (0.0%) |
| 60 to 64 Years | 117 (47.4%) | 7 (6.0%) |
| 65 to 74 Years | 173 (40.1%) | 0 (0.0%) |
| 75 Years and over | 68 (15.5%) | 0 (0.0%) |
| Total | 1,796 (42.5%) | 27 (1.5%) |
Employment Status by Educational Attainment in Hartley County
According to labor force statistics for Hartley County, 47.1% of individuals (1,503) out of the total population between 25 and 64 years of age (3,192) are in the labor force, with 1.7% or 26 of them being unemployed. The group with the highest labor force participation rate are those with the educational attainment of bachelor's degree or higher, with 91.4% or 565 individuals in the labor force. Within the labor force, individuals with high school diploma education have the highest percentage of unemployment, with 3.9% or 15 of them being unemployed.
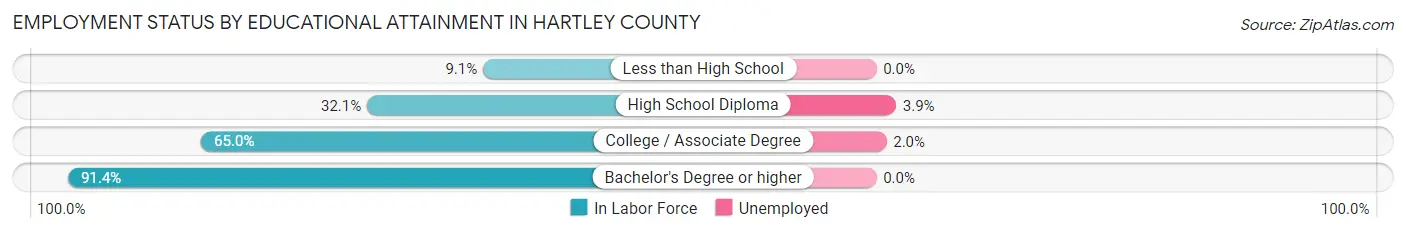
| Educational Attainment | In Labor Force | Unemployed |
| Less than High School | 55 (9.1%) | 0 (0.0%) |
| High School Diploma | 388 (32.1%) | 47 (3.9%) |
| College / Associate Degree | 495 (65.0%) | 15 (2.0%) |
| Bachelor's Degree or higher | 565 (91.4%) | 0 (0.0%) |
| Total | 1,503 (47.1%) | 54 (1.7%) |
Employment Occupations by Sex in Hartley County
Management, Business, Science and Arts Occupations
The most common Management, Business, Science and Arts occupations in Hartley County are Management (325 | 18.4%), Community & Social Service (297 | 16.8%), Education Instruction & Library (261 | 14.7%), Health Diagnosing & Treating (63 | 3.6%), and Computers, Engineering & Science (50 | 2.8%).
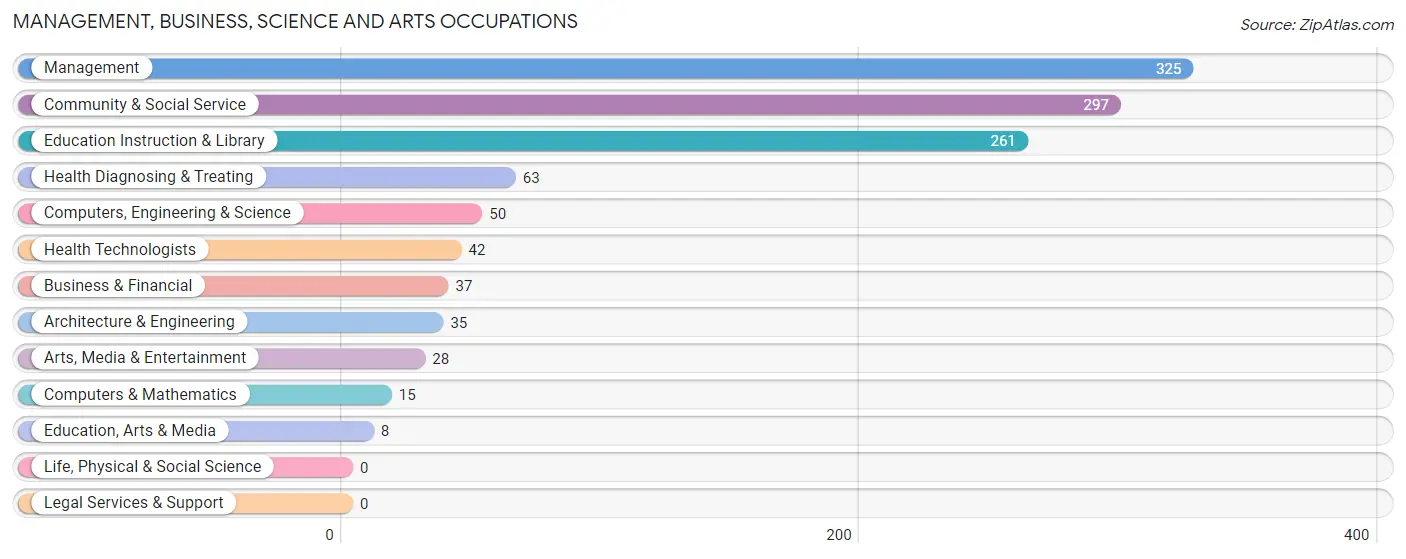
Management, Business, Science and Arts Occupations by Sex
Within the Management, Business, Science and Arts occupations in Hartley County, the most male-oriented occupations are Computers, Engineering & Science (100.0%), Computers & Mathematics (100.0%), and Architecture & Engineering (100.0%), while the most female-oriented occupations are Arts, Media & Entertainment (100.0%), Health Technologists (90.5%), and Community & Social Service (84.5%).
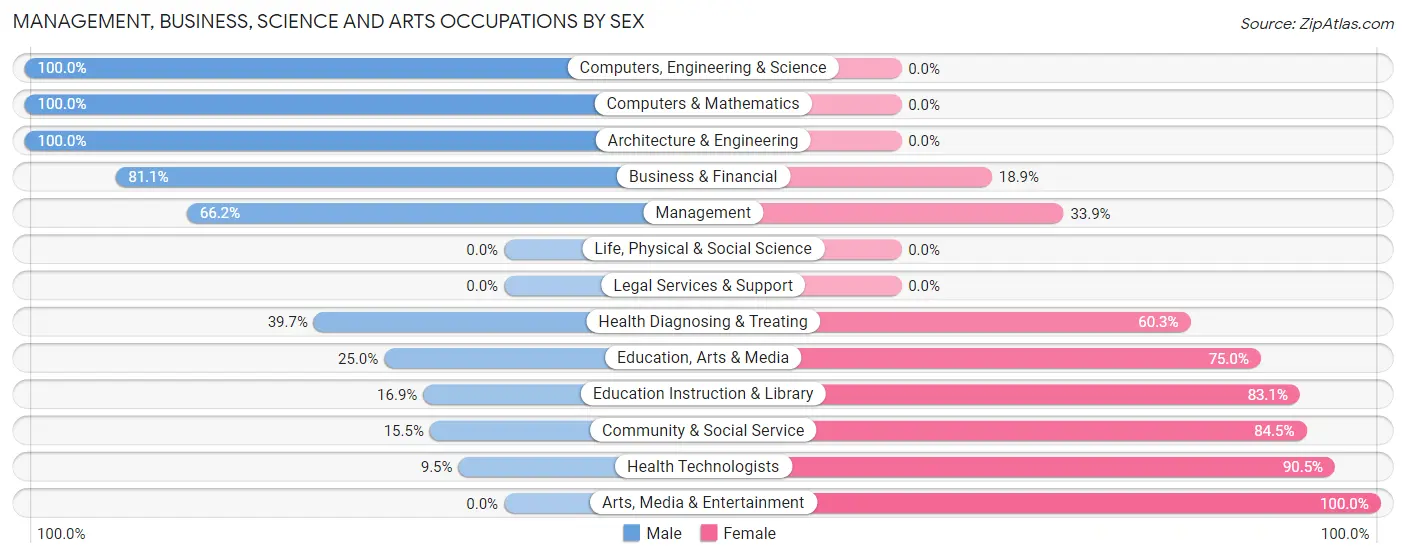
| Occupation | Male | Female |
| Management | 215 (66.1%) | 110 (33.9%) |
| Business & Financial | 30 (81.1%) | 7 (18.9%) |
| Computers, Engineering & Science | 50 (100.0%) | 0 (0.0%) |
| Computers & Mathematics | 15 (100.0%) | 0 (0.0%) |
| Architecture & Engineering | 35 (100.0%) | 0 (0.0%) |
| Life, Physical & Social Science | 0 (0.0%) | 0 (0.0%) |
| Community & Social Service | 46 (15.5%) | 251 (84.5%) |
| Education, Arts & Media | 2 (25.0%) | 6 (75.0%) |
| Legal Services & Support | 0 (0.0%) | 0 (0.0%) |
| Education Instruction & Library | 44 (16.9%) | 217 (83.1%) |
| Arts, Media & Entertainment | 0 (0.0%) | 28 (100.0%) |
| Health Diagnosing & Treating | 25 (39.7%) | 38 (60.3%) |
| Health Technologists | 4 (9.5%) | 38 (90.5%) |
| Total (Category) | 366 (47.4%) | 406 (52.6%) |
| Total (Overall) | 825 (46.6%) | 944 (53.4%) |
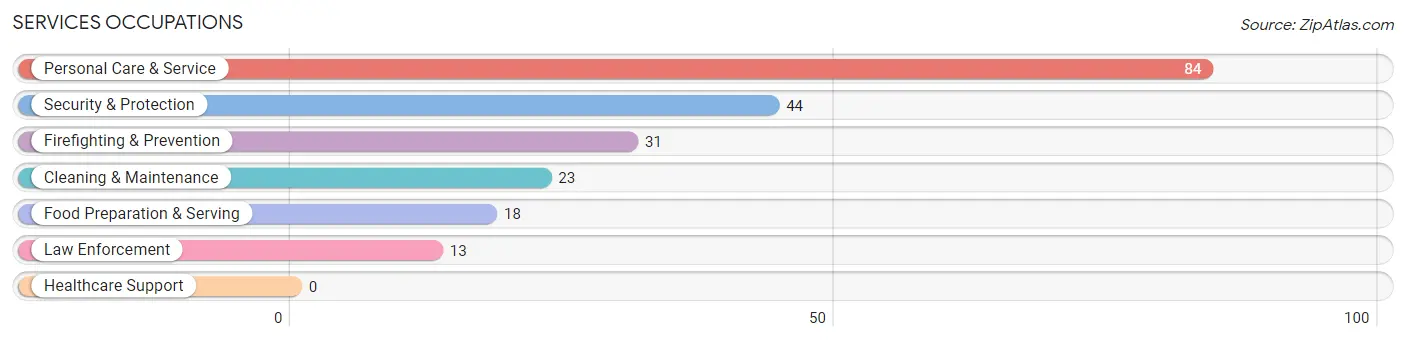
Services Occupations
The most common Services occupations in Hartley County are Personal Care & Service (84 | 4.8%), Security & Protection (44 | 2.5%), Firefighting & Prevention (31 | 1.8%), Cleaning & Maintenance (23 | 1.3%), and Food Preparation & Serving (18 | 1.0%).
Services Occupations by Sex
Within the Services occupations in Hartley County, the most male-oriented occupations are Security & Protection (100.0%), Firefighting & Prevention (100.0%), and Law Enforcement (100.0%), while the most female-oriented occupations are Personal Care & Service (75.0%), Food Preparation & Serving (72.2%), and Cleaning & Maintenance (4.3%).
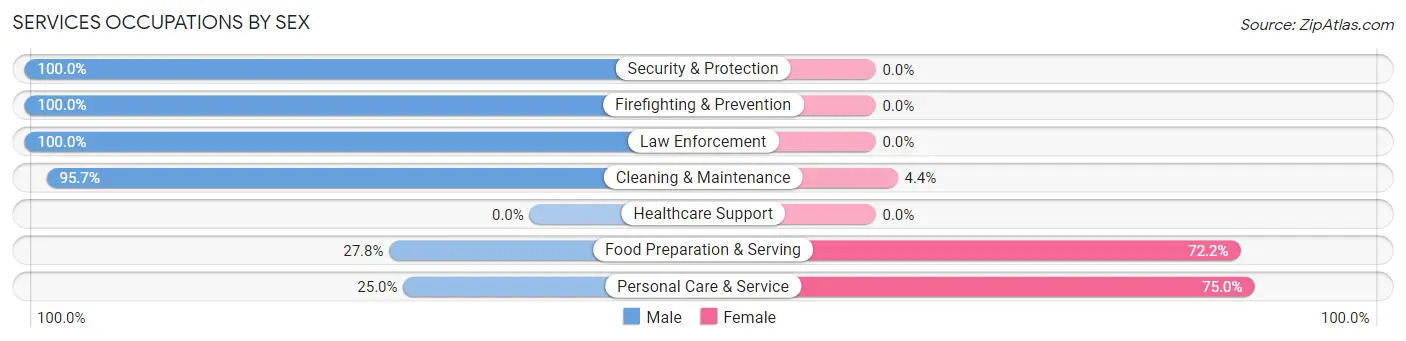
| Occupation | Male | Female |
| Healthcare Support | 0 (0.0%) | 0 (0.0%) |
| Security & Protection | 44 (100.0%) | 0 (0.0%) |
| Firefighting & Prevention | 31 (100.0%) | 0 (0.0%) |
| Law Enforcement | 13 (100.0%) | 0 (0.0%) |
| Food Preparation & Serving | 5 (27.8%) | 13 (72.2%) |
| Cleaning & Maintenance | 22 (95.7%) | 1 (4.3%) |
| Personal Care & Service | 21 (25.0%) | 63 (75.0%) |
| Total (Category) | 92 (54.4%) | 77 (45.6%) |
| Total (Overall) | 825 (46.6%) | 944 (53.4%) |
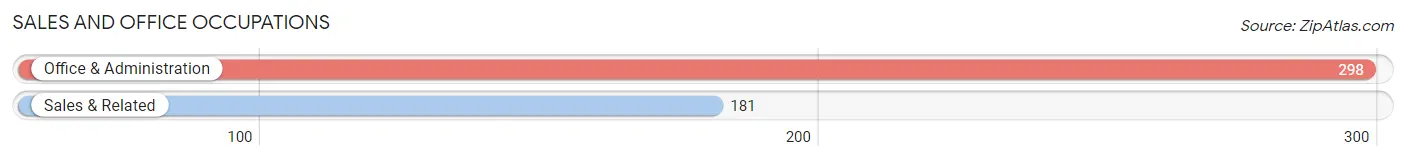
Sales and Office Occupations
The most common Sales and Office occupations in Hartley County are Office & Administration (298 | 16.9%), and Sales & Related (181 | 10.2%).
Sales and Office Occupations by Sex
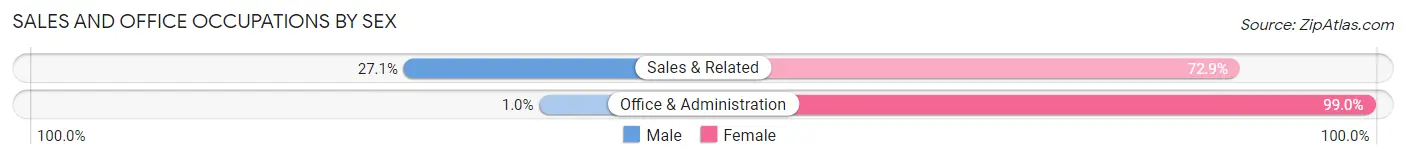
| Occupation | Male | Female |
| Sales & Related | 49 (27.1%) | 132 (72.9%) |
| Office & Administration | 3 (1.0%) | 295 (99.0%) |
| Total (Category) | 52 (10.9%) | 427 (89.1%) |
| Total (Overall) | 825 (46.6%) | 944 (53.4%) |
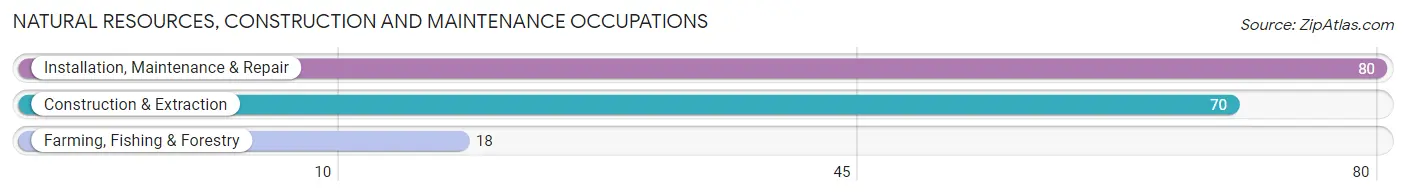
Natural Resources, Construction and Maintenance Occupations
The most common Natural Resources, Construction and Maintenance occupations in Hartley County are Installation, Maintenance & Repair (80 | 4.5%), Construction & Extraction (70 | 4.0%), and Farming, Fishing & Forestry (18 | 1.0%).
Natural Resources, Construction and Maintenance Occupations by Sex
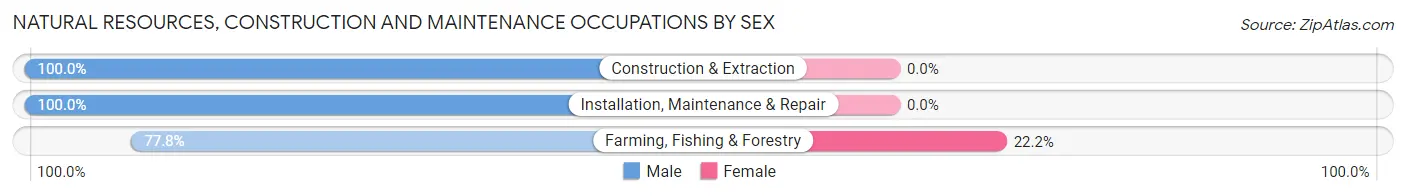
| Occupation | Male | Female |
| Farming, Fishing & Forestry | 14 (77.8%) | 4 (22.2%) |
| Construction & Extraction | 70 (100.0%) | 0 (0.0%) |
| Installation, Maintenance & Repair | 80 (100.0%) | 0 (0.0%) |
| Total (Category) | 164 (97.6%) | 4 (2.4%) |
| Total (Overall) | 825 (46.6%) | 944 (53.4%) |
Production, Transportation and Moving Occupations
The most common Production, Transportation and Moving occupations in Hartley County are Transportation (113 | 6.4%), Production (40 | 2.3%), and Material Moving (28 | 1.6%).
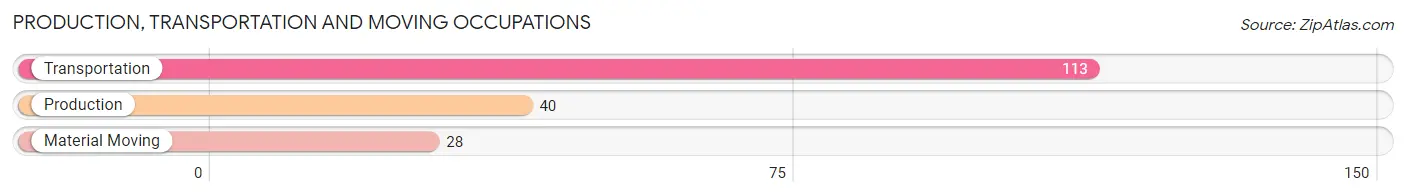
Production, Transportation and Moving Occupations by Sex
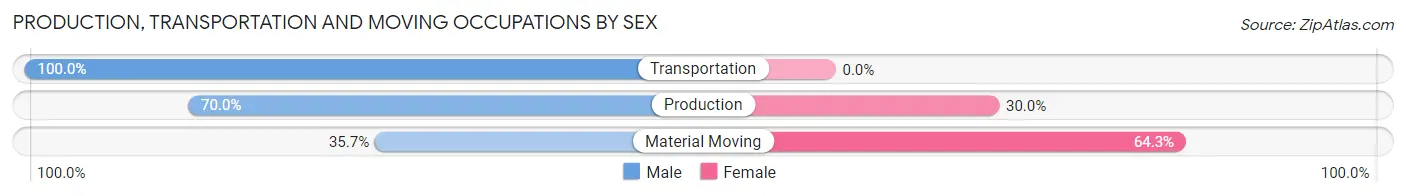
| Occupation | Male | Female |
| Production | 28 (70.0%) | 12 (30.0%) |
| Transportation | 113 (100.0%) | 0 (0.0%) |
| Material Moving | 10 (35.7%) | 18 (64.3%) |
| Total (Category) | 151 (83.4%) | 30 (16.6%) |
| Total (Overall) | 825 (46.6%) | 944 (53.4%) |
Employment Industries by Sex in Hartley County
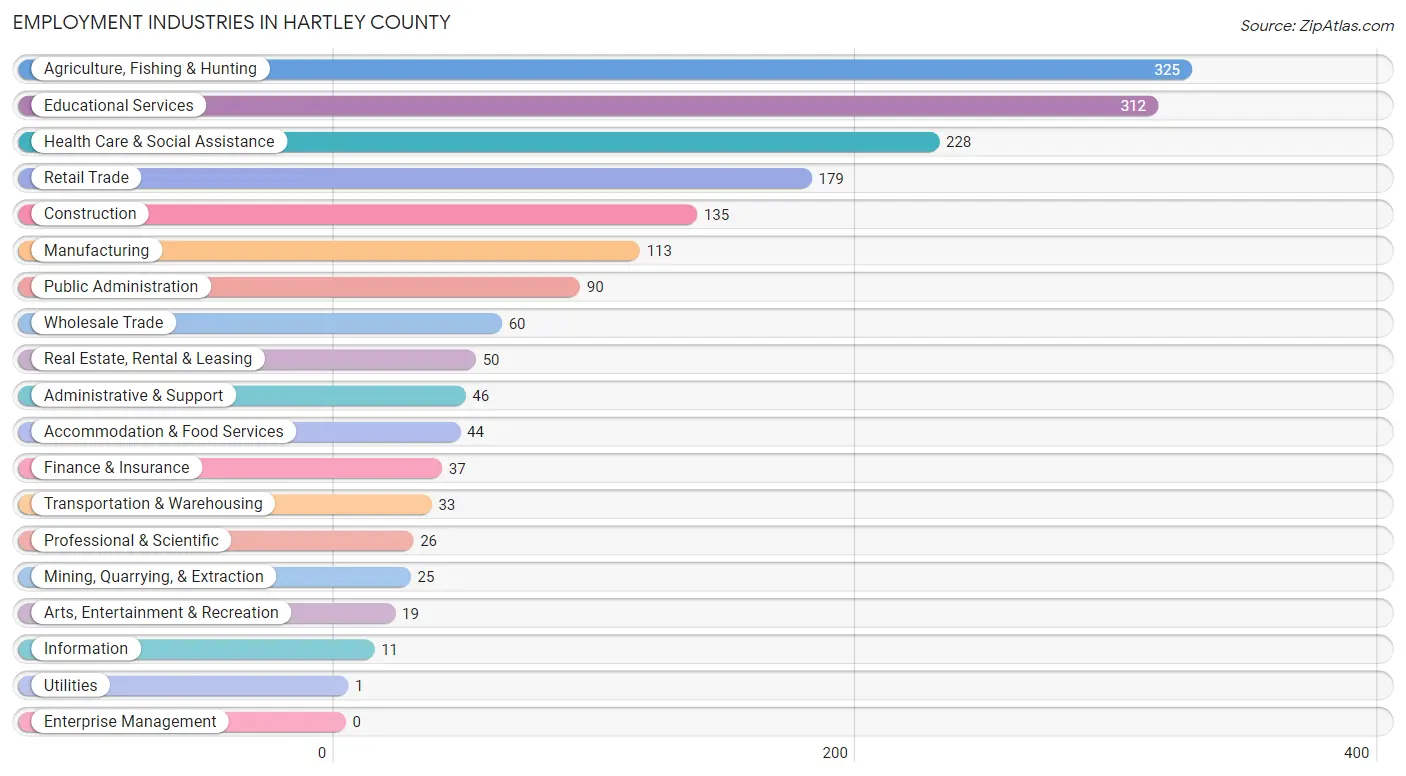
Employment Industries in Hartley County
The major employment industries in Hartley County include Agriculture, Fishing & Hunting (325 | 18.4%), Educational Services (312 | 17.6%), Health Care & Social Assistance (228 | 12.9%), Retail Trade (179 | 10.1%), and Construction (135 | 7.6%).
Employment Industries by Sex in Hartley County
The Hartley County industries that see more men than women are Mining, Quarrying, & Extraction (100.0%), Utilities (100.0%), and Arts, Entertainment & Recreation (100.0%), whereas the industries that tend to have a higher number of women are Professional & Scientific (100.0%), Health Care & Social Assistance (86.8%), and Educational Services (82.1%).
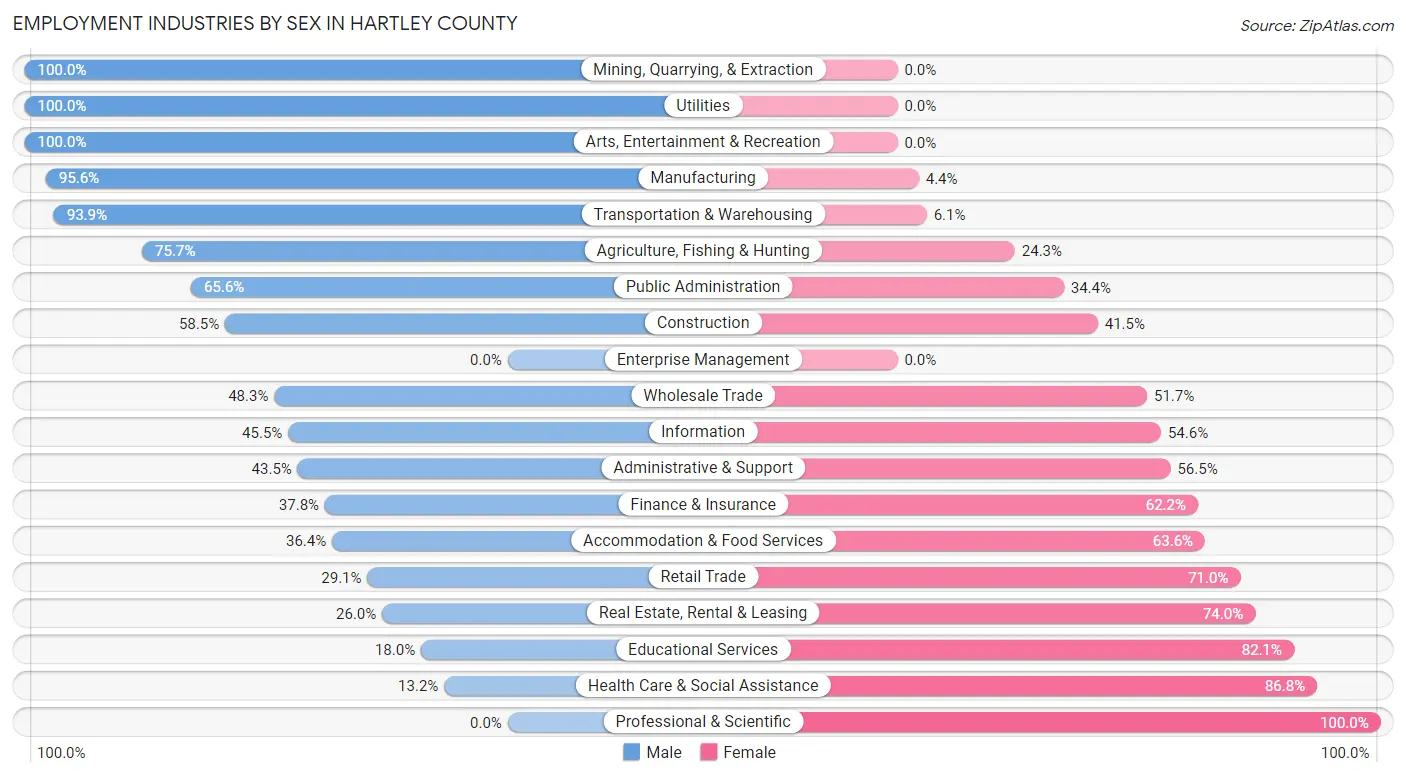
| Industry | Male | Female |
| Agriculture, Fishing & Hunting | 246 (75.7%) | 79 (24.3%) |
| Mining, Quarrying, & Extraction | 25 (100.0%) | 0 (0.0%) |
| Construction | 79 (58.5%) | 56 (41.5%) |
| Manufacturing | 108 (95.6%) | 5 (4.4%) |
| Wholesale Trade | 29 (48.3%) | 31 (51.7%) |
| Retail Trade | 52 (29.0%) | 127 (71.0%) |
| Transportation & Warehousing | 31 (93.9%) | 2 (6.1%) |
| Utilities | 1 (100.0%) | 0 (0.0%) |
| Information | 5 (45.5%) | 6 (54.5%) |
| Finance & Insurance | 14 (37.8%) | 23 (62.2%) |
| Real Estate, Rental & Leasing | 13 (26.0%) | 37 (74.0%) |
| Professional & Scientific | 0 (0.0%) | 26 (100.0%) |
| Enterprise Management | 0 (0.0%) | 0 (0.0%) |
| Administrative & Support | 20 (43.5%) | 26 (56.5%) |
| Educational Services | 56 (17.9%) | 256 (82.1%) |
| Health Care & Social Assistance | 30 (13.2%) | 198 (86.8%) |
| Arts, Entertainment & Recreation | 19 (100.0%) | 0 (0.0%) |
| Accommodation & Food Services | 16 (36.4%) | 28 (63.6%) |
| Public Administration | 59 (65.6%) | 31 (34.4%) |
| Total | 825 (46.6%) | 944 (53.4%) |
Education in Hartley County
School Enrollment in Hartley County
The most common levels of schooling among the 1,023 students in Hartley County are middle school (401 | 39.2%), elementary school (388 | 37.9%), and high school (108 | 10.6%).
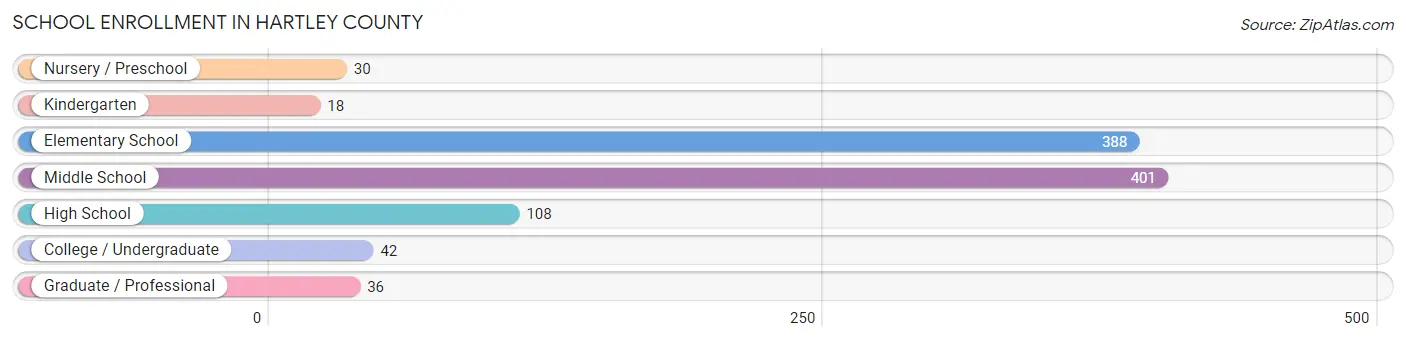
| School Level | # Students | % Students |
| Nursery / Preschool | 30 | 2.9% |
| Kindergarten | 18 | 1.8% |
| Elementary School | 388 | 37.9% |
| Middle School | 401 | 39.2% |
| High School | 108 | 10.6% |
| College / Undergraduate | 42 | 4.1% |
| Graduate / Professional | 36 | 3.5% |
| Total | 1,023 | 100.0% |
School Enrollment by Age by Funding Source in Hartley County
Out of a total of 1,023 students who are enrolled in schools in Hartley County, 145 (14.2%) attend a private institution, while the remaining 878 (85.8%) are enrolled in public schools. The age group of 3 to 4 year olds has the highest likelihood of being enrolled in private schools, with 27 (79.4% in the age bracket) enrolled. Conversely, the age group of 18 to 19 year olds has the lowest likelihood of being enrolled in a private school, with 3 (100.0% in the age bracket) attending a public institution.
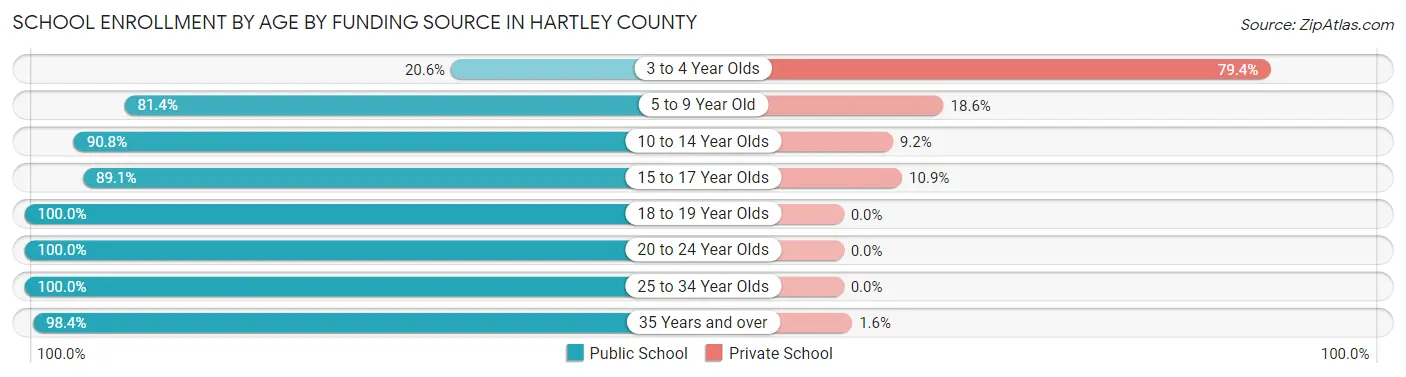
| Age Bracket | Public School | Private School |
| 3 to 4 Year Olds | 7 (20.6%) | 27 (79.4%) |
| 5 to 9 Year Old | 284 (81.4%) | 65 (18.6%) |
| 10 to 14 Year Olds | 406 (90.8%) | 41 (9.2%) |
| 15 to 17 Year Olds | 90 (89.1%) | 11 (10.9%) |
| 18 to 19 Year Olds | 3 (100.0%) | 0 (0.0%) |
| 20 to 24 Year Olds | 8 (100.0%) | 0 (0.0%) |
| 25 to 34 Year Olds | 18 (100.0%) | 0 (0.0%) |
| 35 Years and over | 62 (98.4%) | 1 (1.6%) |
| Total | 878 (85.8%) | 145 (14.2%) |
Educational Attainment by Field of Study in Hartley County
Education (398 | 36.7%), business (181 | 16.7%), bio, nature & agricultural (124 | 11.4%), science & technology (94 | 8.7%), and liberal arts & history (89 | 8.2%) are the most common fields of study among 1,084 individuals in Hartley County who have obtained a bachelor's degree or higher.
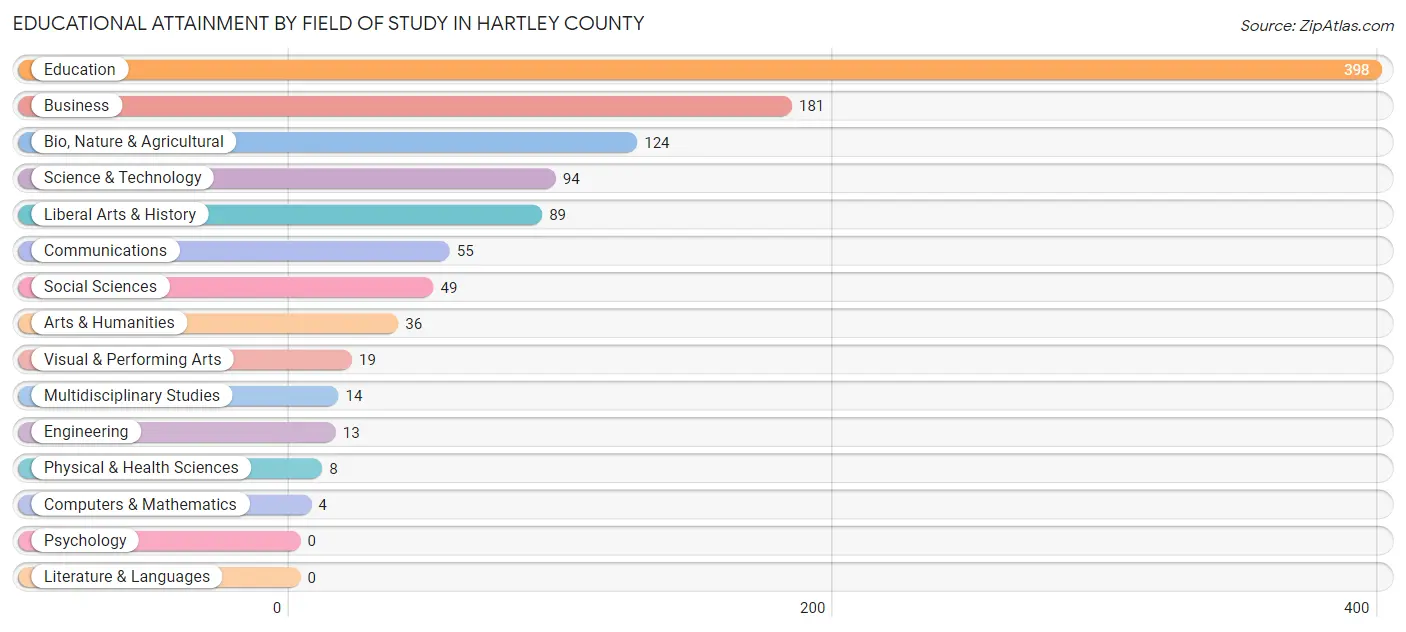
| Field of Study | # Graduates | % Graduates |
| Computers & Mathematics | 4 | 0.4% |
| Bio, Nature & Agricultural | 124 | 11.4% |
| Physical & Health Sciences | 8 | 0.7% |
| Psychology | 0 | 0.0% |
| Social Sciences | 49 | 4.5% |
| Engineering | 13 | 1.2% |
| Multidisciplinary Studies | 14 | 1.3% |
| Science & Technology | 94 | 8.7% |
| Business | 181 | 16.7% |
| Education | 398 | 36.7% |
| Literature & Languages | 0 | 0.0% |
| Liberal Arts & History | 89 | 8.2% |
| Visual & Performing Arts | 19 | 1.8% |
| Communications | 55 | 5.1% |
| Arts & Humanities | 36 | 3.3% |
| Total | 1,084 | 100.0% |
Transportation & Commute in Hartley County
Vehicle Availability by Sex in Hartley County
The most prevalent vehicle ownership categories in Hartley County are males with 2 vehicles (318, accounting for 38.8%) and females with 2 vehicles (403, making up 36.4%).
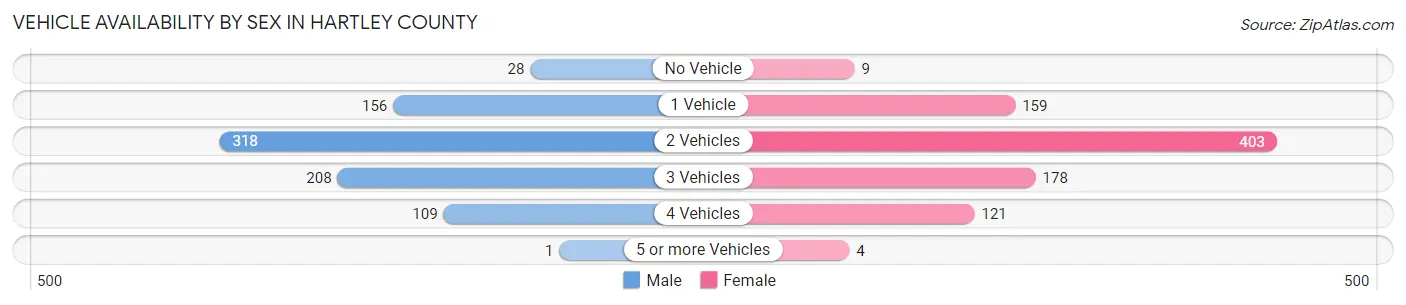
| Vehicles Available | Male | Female |
| No Vehicle | 28 (3.4%) | 9 (1.0%) |
| 1 Vehicle | 156 (19.0%) | 159 (18.2%) |
| 2 Vehicles | 318 (38.8%) | 403 (46.1%) |
| 3 Vehicles | 208 (25.4%) | 178 (20.4%) |
| 4 Vehicles | 109 (13.3%) | 121 (13.8%) |
| 5 or more Vehicles | 1 (0.1%) | 4 (0.5%) |
| Total | 820 (100.0%) | 874 (100.0%) |
Commute Time in Hartley County
The most frequently occuring commute durations in Hartley County are 5 to 9 minutes (544 commuters, 33.8%), 10 to 14 minutes (405 commuters, 25.2%), and less than 5 minutes (182 commuters, 11.3%).
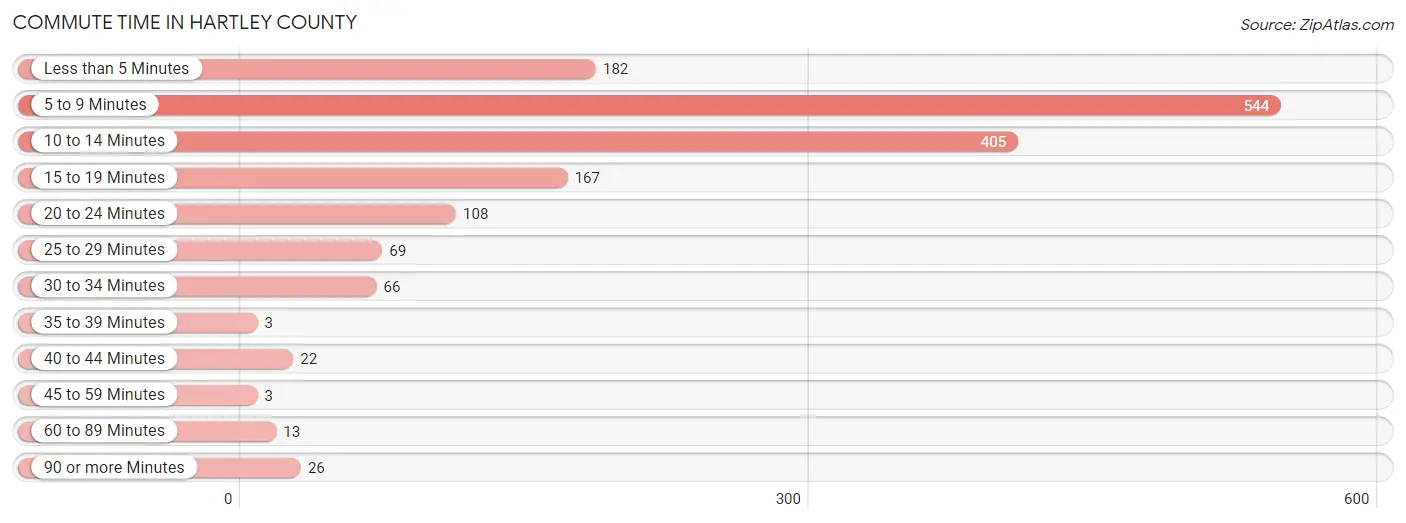
| Commute Time | # Commuters | % Commuters |
| Less than 5 Minutes | 182 | 11.3% |
| 5 to 9 Minutes | 544 | 33.8% |
| 10 to 14 Minutes | 405 | 25.2% |
| 15 to 19 Minutes | 167 | 10.4% |
| 20 to 24 Minutes | 108 | 6.7% |
| 25 to 29 Minutes | 69 | 4.3% |
| 30 to 34 Minutes | 66 | 4.1% |
| 35 to 39 Minutes | 3 | 0.2% |
| 40 to 44 Minutes | 22 | 1.4% |
| 45 to 59 Minutes | 3 | 0.2% |
| 60 to 89 Minutes | 13 | 0.8% |
| 90 or more Minutes | 26 | 1.6% |
Commute Time by Sex in Hartley County
The most common commute times in Hartley County are 5 to 9 minutes (242 commuters, 31.0%) for males and 5 to 9 minutes (302 commuters, 36.5%) for females.
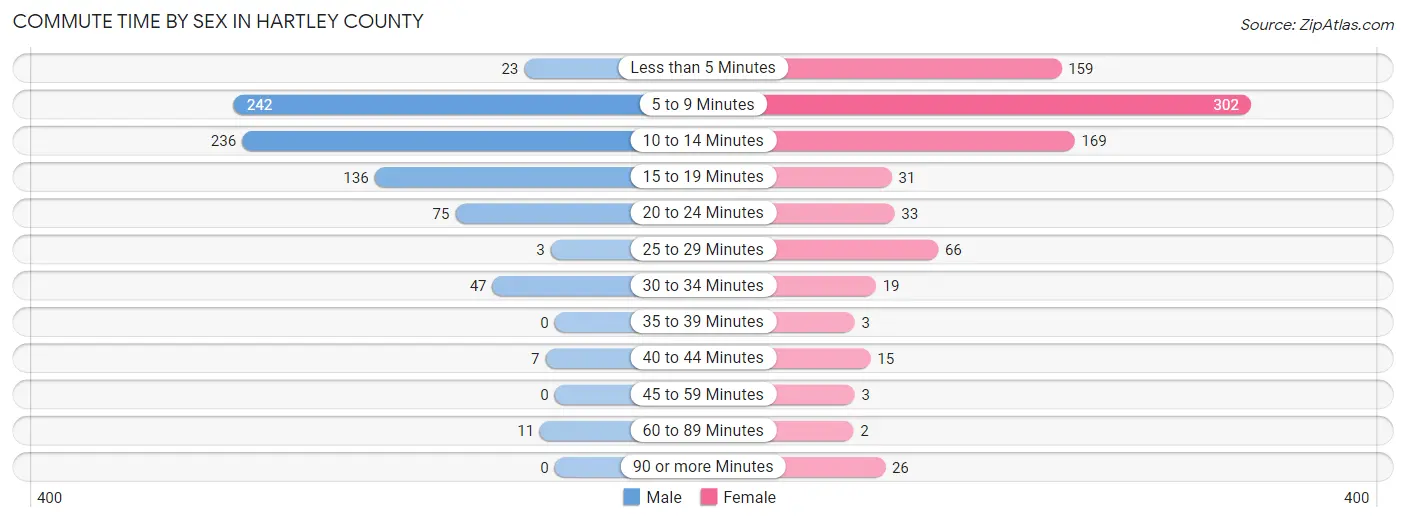
| Commute Time | Male | Female |
| Less than 5 Minutes | 23 (2.9%) | 159 (19.2%) |
| 5 to 9 Minutes | 242 (31.0%) | 302 (36.5%) |
| 10 to 14 Minutes | 236 (30.3%) | 169 (20.4%) |
| 15 to 19 Minutes | 136 (17.4%) | 31 (3.7%) |
| 20 to 24 Minutes | 75 (9.6%) | 33 (4.0%) |
| 25 to 29 Minutes | 3 (0.4%) | 66 (8.0%) |
| 30 to 34 Minutes | 47 (6.0%) | 19 (2.3%) |
| 35 to 39 Minutes | 0 (0.0%) | 3 (0.4%) |
| 40 to 44 Minutes | 7 (0.9%) | 15 (1.8%) |
| 45 to 59 Minutes | 0 (0.0%) | 3 (0.4%) |
| 60 to 89 Minutes | 11 (1.4%) | 2 (0.2%) |
| 90 or more Minutes | 0 (0.0%) | 26 (3.1%) |
Time of Departure to Work by Sex in Hartley County
The most frequent times of departure to work in Hartley County are 7:00 AM to 7:29 AM (221, 28.3%) for males and 7:30 AM to 7:59 AM (298, 36.0%) for females.
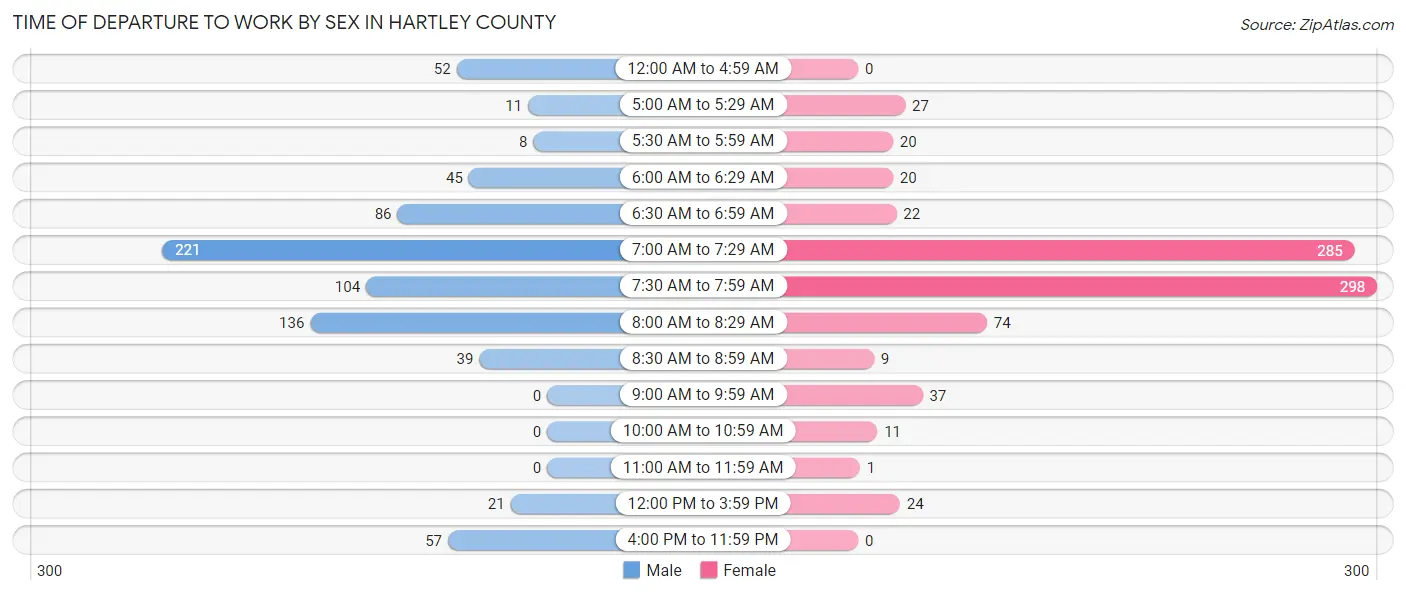
| Time of Departure | Male | Female |
| 12:00 AM to 4:59 AM | 52 (6.7%) | 0 (0.0%) |
| 5:00 AM to 5:29 AM | 11 (1.4%) | 27 (3.3%) |
| 5:30 AM to 5:59 AM | 8 (1.0%) | 20 (2.4%) |
| 6:00 AM to 6:29 AM | 45 (5.8%) | 20 (2.4%) |
| 6:30 AM to 6:59 AM | 86 (11.0%) | 22 (2.7%) |
| 7:00 AM to 7:29 AM | 221 (28.3%) | 285 (34.4%) |
| 7:30 AM to 7:59 AM | 104 (13.3%) | 298 (36.0%) |
| 8:00 AM to 8:29 AM | 136 (17.4%) | 74 (8.9%) |
| 8:30 AM to 8:59 AM | 39 (5.0%) | 9 (1.1%) |
| 9:00 AM to 9:59 AM | 0 (0.0%) | 37 (4.5%) |
| 10:00 AM to 10:59 AM | 0 (0.0%) | 11 (1.3%) |
| 11:00 AM to 11:59 AM | 0 (0.0%) | 1 (0.1%) |
| 12:00 PM to 3:59 PM | 21 (2.7%) | 24 (2.9%) |
| 4:00 PM to 11:59 PM | 57 (7.3%) | 0 (0.0%) |
| Total | 780 (100.0%) | 828 (100.0%) |
Housing Occupancy in Hartley County
Occupancy by Ownership in Hartley County
Of the total 1,626 dwellings in Hartley County, owner-occupied units account for 1,296 (79.7%), while renter-occupied units make up 330 (20.3%).
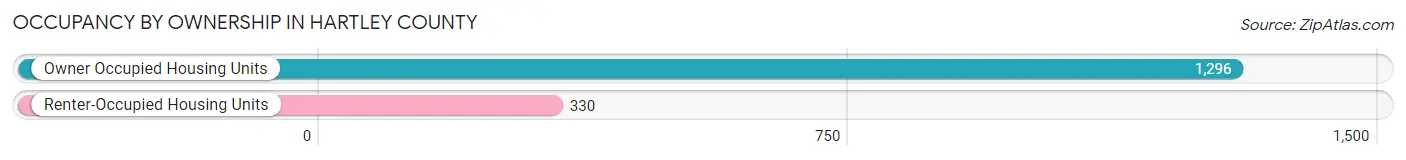
| Occupancy | # Housing Units | % Housing Units |
| Owner Occupied Housing Units | 1,296 | 79.7% |
| Renter-Occupied Housing Units | 330 | 20.3% |
| Total Occupied Housing Units | 1,626 | 100.0% |
Occupancy by Household Size in Hartley County
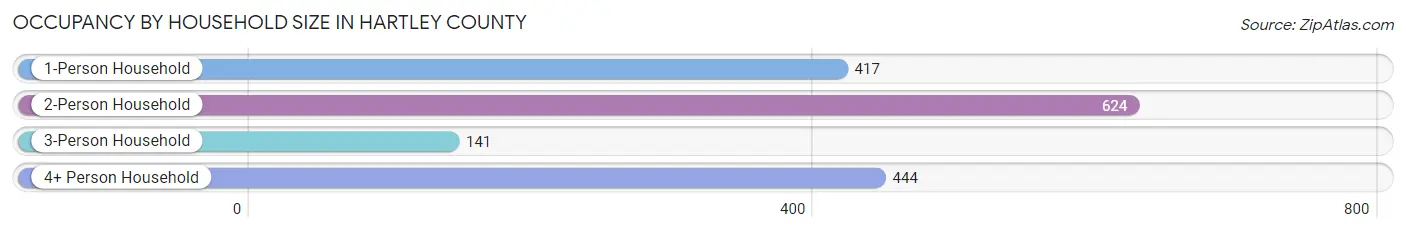
| Household Size | # Housing Units | % Housing Units |
| 1-Person Household | 417 | 25.7% |
| 2-Person Household | 624 | 38.4% |
| 3-Person Household | 141 | 8.7% |
| 4+ Person Household | 444 | 27.3% |
| Total Housing Units | 1,626 | 100.0% |
Occupancy by Ownership by Household Size in Hartley County
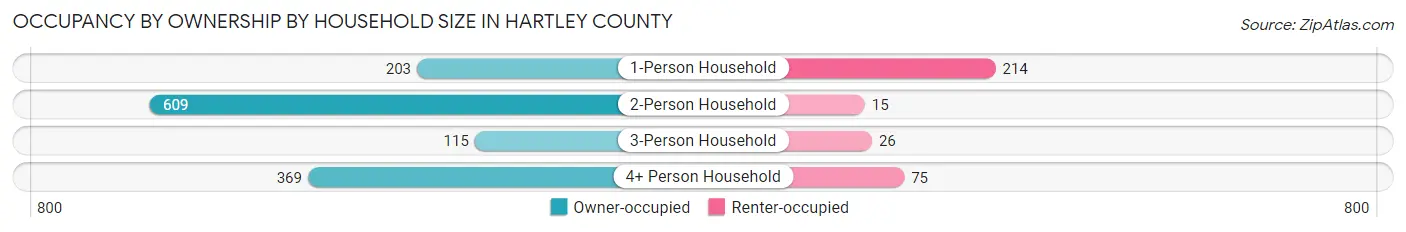
| Household Size | Owner-occupied | Renter-occupied |
| 1-Person Household | 203 (48.7%) | 214 (51.3%) |
| 2-Person Household | 609 (97.6%) | 15 (2.4%) |
| 3-Person Household | 115 (81.6%) | 26 (18.4%) |
| 4+ Person Household | 369 (83.1%) | 75 (16.9%) |
| Total Housing Units | 1,296 (79.7%) | 330 (20.3%) |
Occupancy by Educational Attainment in Hartley County
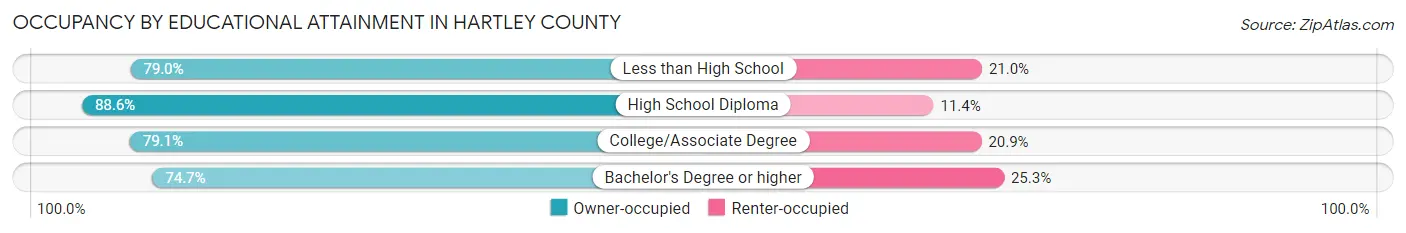
| Household Size | Owner-occupied | Renter-occupied |
| Less than High School | 49 (79.0%) | 13 (21.0%) |
| High School Diploma | 366 (88.6%) | 47 (11.4%) |
| College/Associate Degree | 383 (79.1%) | 101 (20.9%) |
| Bachelor's Degree or higher | 498 (74.7%) | 169 (25.3%) |
Occupancy by Age of Householder in Hartley County
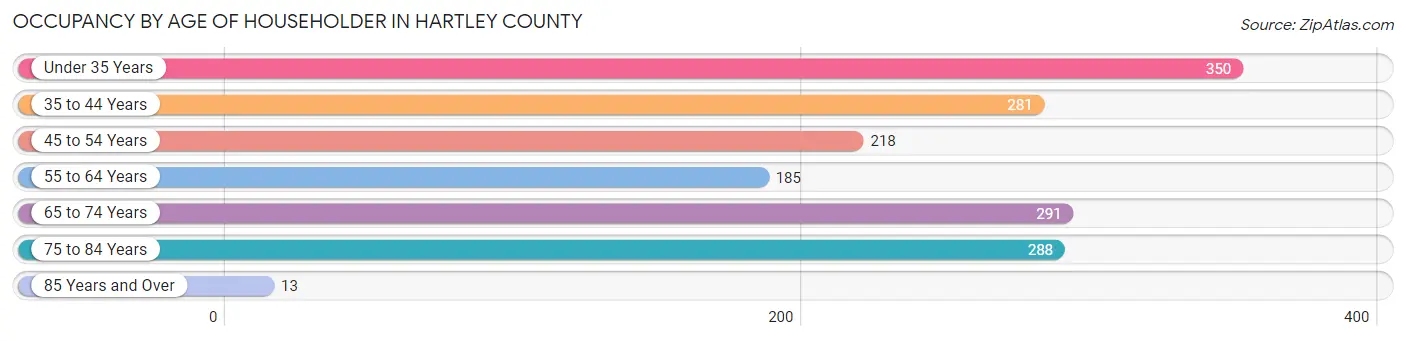
| Age Bracket | # Households | % Households |
| Under 35 Years | 350 | 21.5% |
| 35 to 44 Years | 281 | 17.3% |
| 45 to 54 Years | 218 | 13.4% |
| 55 to 64 Years | 185 | 11.4% |
| 65 to 74 Years | 291 | 17.9% |
| 75 to 84 Years | 288 | 17.7% |
| 85 Years and Over | 13 | 0.8% |
| Total | 1,626 | 100.0% |
Housing Finances in Hartley County
Median Income by Occupancy in Hartley County
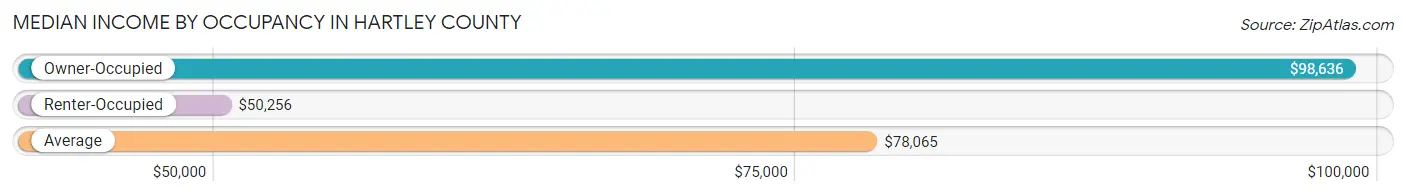
| Occupancy Type | # Households | Median Income |
| Owner-Occupied | 1,296 (79.7%) | $98,636 |
| Renter-Occupied | 330 (20.3%) | $50,256 |
| Average | 1,626 (100.0%) | $78,065 |
Occupancy by Householder Income Bracket in Hartley County
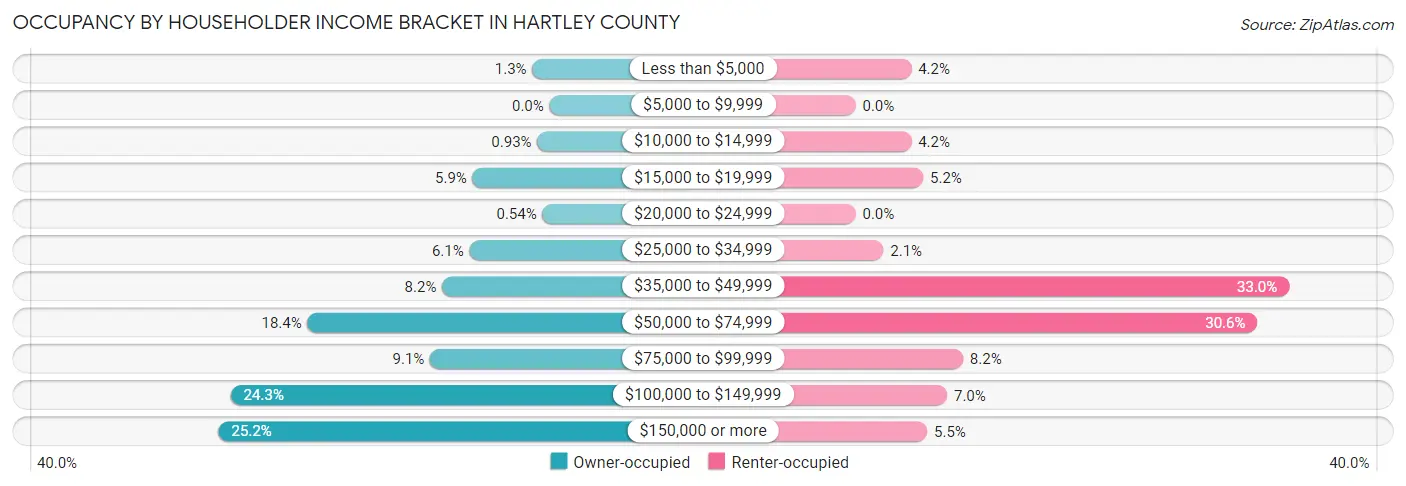
| Income Bracket | Owner-occupied | Renter-occupied |
| Less than $5,000 | 17 (1.3%) | 14 (4.2%) |
| $5,000 to $9,999 | 0 (0.0%) | 0 (0.0%) |
| $10,000 to $14,999 | 12 (0.9%) | 14 (4.2%) |
| $15,000 to $19,999 | 76 (5.9%) | 17 (5.1%) |
| $20,000 to $24,999 | 7 (0.5%) | 0 (0.0%) |
| $25,000 to $34,999 | 79 (6.1%) | 7 (2.1%) |
| $35,000 to $49,999 | 106 (8.2%) | 109 (33.0%) |
| $50,000 to $74,999 | 239 (18.4%) | 101 (30.6%) |
| $75,000 to $99,999 | 118 (9.1%) | 27 (8.2%) |
| $100,000 to $149,999 | 315 (24.3%) | 23 (7.0%) |
| $150,000 or more | 327 (25.2%) | 18 (5.4%) |
| Total | 1,296 (100.0%) | 330 (100.0%) |
Monthly Housing Cost Tiers in Hartley County
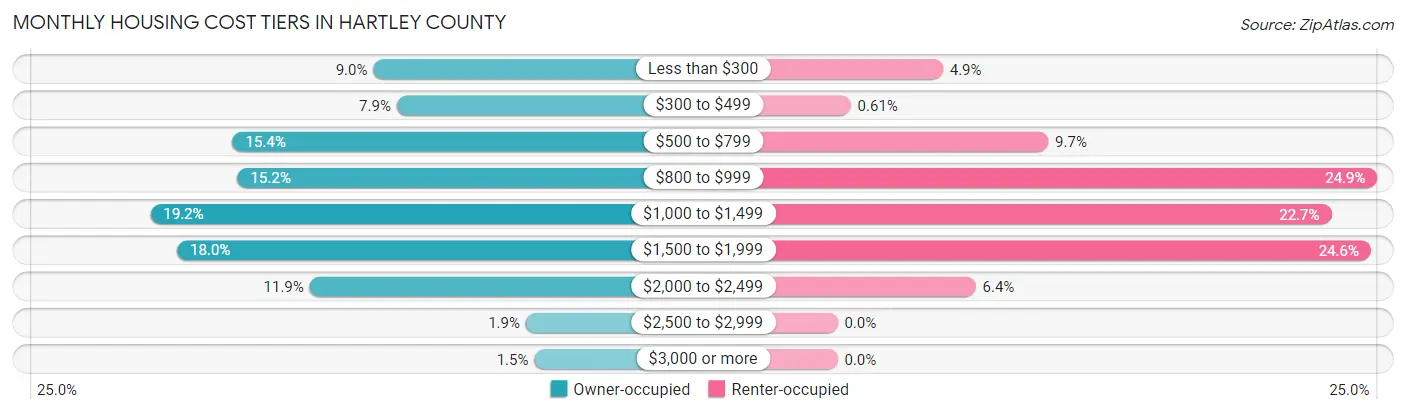
| Monthly Cost | Owner-occupied | Renter-occupied |
| Less than $300 | 116 (8.9%) | 16 (4.9%) |
| $300 to $499 | 102 (7.9%) | 2 (0.6%) |
| $500 to $799 | 200 (15.4%) | 32 (9.7%) |
| $800 to $999 | 197 (15.2%) | 82 (24.8%) |
| $1,000 to $1,499 | 249 (19.2%) | 75 (22.7%) |
| $1,500 to $1,999 | 233 (18.0%) | 81 (24.5%) |
| $2,000 to $2,499 | 154 (11.9%) | 21 (6.4%) |
| $2,500 to $2,999 | 25 (1.9%) | 0 (0.0%) |
| $3,000 or more | 20 (1.5%) | 0 (0.0%) |
| Total | 1,296 (100.0%) | 330 (100.0%) |
Physical Housing Characteristics in Hartley County
Housing Structures in Hartley County
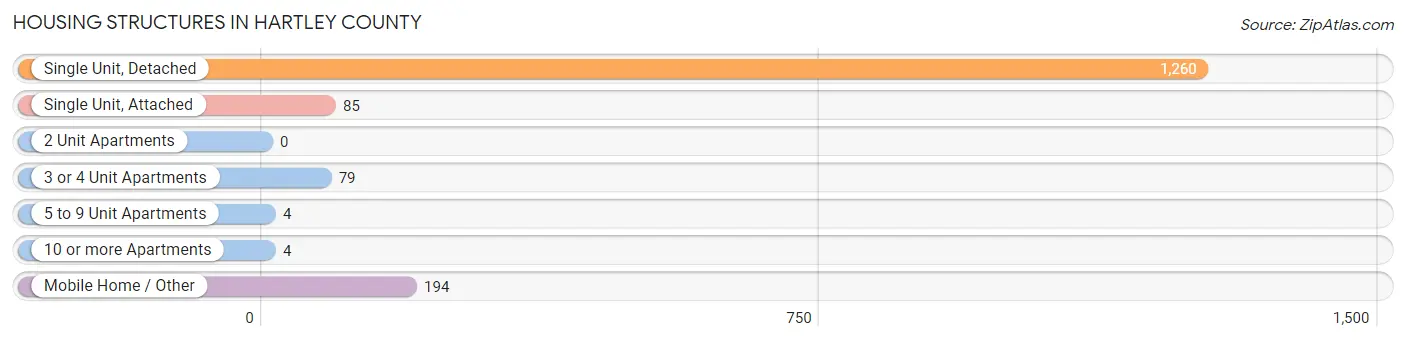
| Structure Type | # Housing Units | % Housing Units |
| Single Unit, Detached | 1,260 | 77.5% |
| Single Unit, Attached | 85 | 5.2% |
| 2 Unit Apartments | 0 | 0.0% |
| 3 or 4 Unit Apartments | 79 | 4.9% |
| 5 to 9 Unit Apartments | 4 | 0.3% |
| 10 or more Apartments | 4 | 0.3% |
| Mobile Home / Other | 194 | 11.9% |
| Total | 1,626 | 100.0% |
Housing Structures by Occupancy in Hartley County
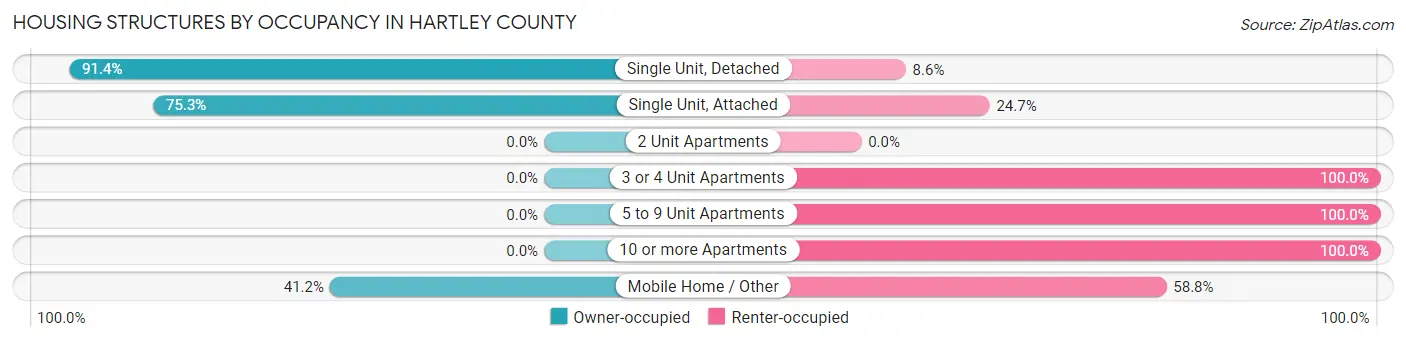
| Structure Type | Owner-occupied | Renter-occupied |
| Single Unit, Detached | 1,152 (91.4%) | 108 (8.6%) |
| Single Unit, Attached | 64 (75.3%) | 21 (24.7%) |
| 2 Unit Apartments | 0 (0.0%) | 0 (0.0%) |
| 3 or 4 Unit Apartments | 0 (0.0%) | 79 (100.0%) |
| 5 to 9 Unit Apartments | 0 (0.0%) | 4 (100.0%) |
| 10 or more Apartments | 0 (0.0%) | 4 (100.0%) |
| Mobile Home / Other | 80 (41.2%) | 114 (58.8%) |
| Total | 1,296 (79.7%) | 330 (20.3%) |
Housing Structures by Number of Rooms in Hartley County
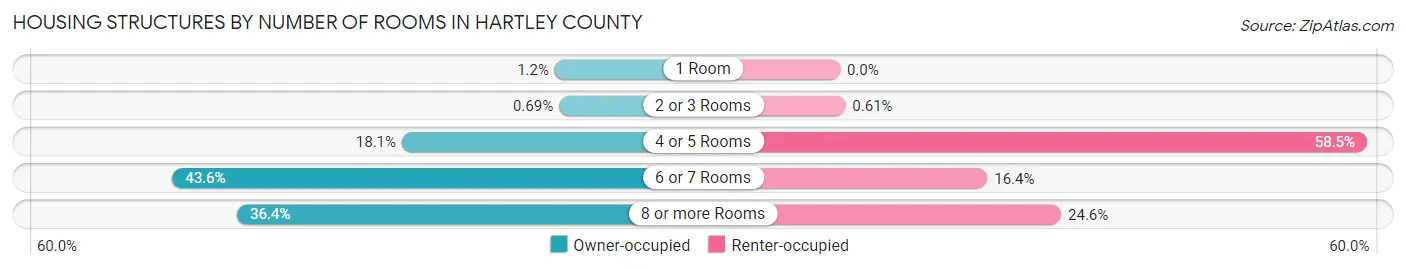
| Number of Rooms | Owner-occupied | Renter-occupied |
| 1 Room | 15 (1.2%) | 0 (0.0%) |
| 2 or 3 Rooms | 9 (0.7%) | 2 (0.6%) |
| 4 or 5 Rooms | 235 (18.1%) | 193 (58.5%) |
| 6 or 7 Rooms | 565 (43.6%) | 54 (16.4%) |
| 8 or more Rooms | 472 (36.4%) | 81 (24.5%) |
| Total | 1,296 (100.0%) | 330 (100.0%) |
Housing Structure by Heating Type in Hartley County
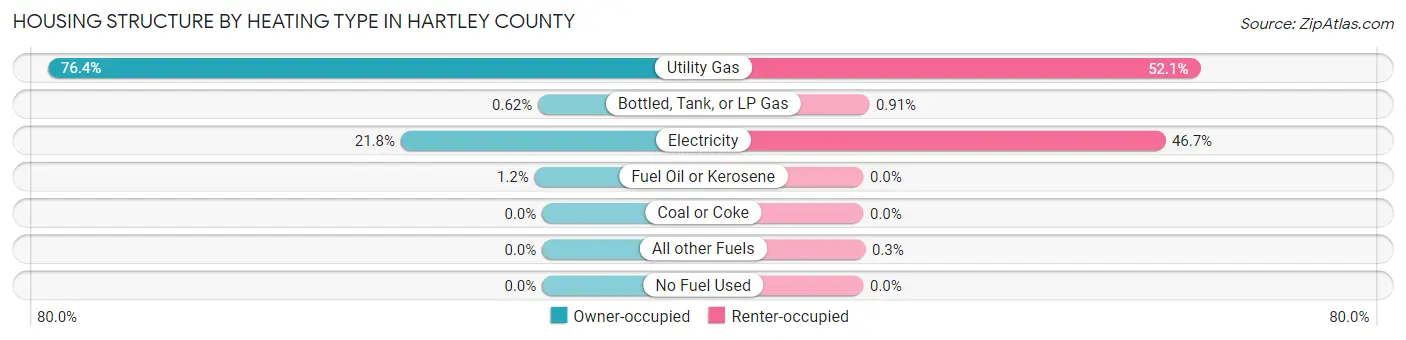
| Heating Type | Owner-occupied | Renter-occupied |
| Utility Gas | 990 (76.4%) | 172 (52.1%) |
| Bottled, Tank, or LP Gas | 8 (0.6%) | 3 (0.9%) |
| Electricity | 283 (21.8%) | 154 (46.7%) |
| Fuel Oil or Kerosene | 15 (1.2%) | 0 (0.0%) |
| Coal or Coke | 0 (0.0%) | 0 (0.0%) |
| All other Fuels | 0 (0.0%) | 1 (0.3%) |
| No Fuel Used | 0 (0.0%) | 0 (0.0%) |
| Total | 1,296 (100.0%) | 330 (100.0%) |
Household Vehicle Usage in Hartley County
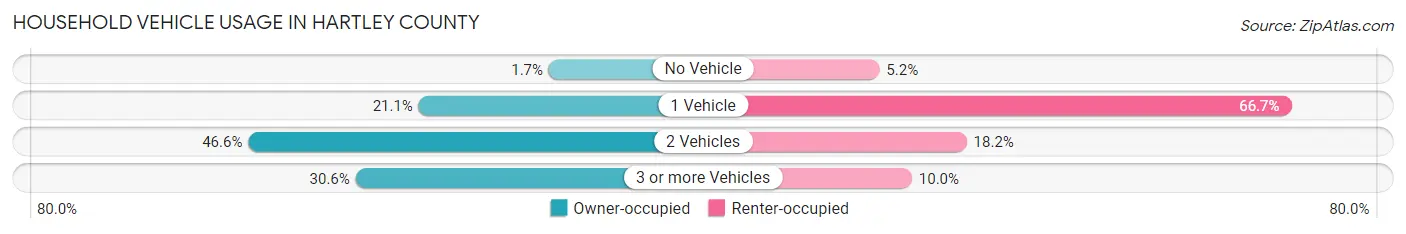
| Vehicles per Household | Owner-occupied | Renter-occupied |
| No Vehicle | 22 (1.7%) | 17 (5.1%) |
| 1 Vehicle | 274 (21.1%) | 220 (66.7%) |
| 2 Vehicles | 604 (46.6%) | 60 (18.2%) |
| 3 or more Vehicles | 396 (30.6%) | 33 (10.0%) |
| Total | 1,296 (100.0%) | 330 (100.0%) |
Real Estate & Mortgages in Hartley County
Real Estate and Mortgage Overview in Hartley County
| Characteristic | Without Mortgage | With Mortgage |
| Housing Units | 673 | 623 |
| Median Property Value | $234,900 | $216,300 |
| Median Household Income | $107,212 | $124 |
| Monthly Housing Costs | $679 | $6 |
| Real Estate Taxes | $3,150 | $4 |
Property Value by Mortgage Status in Hartley County
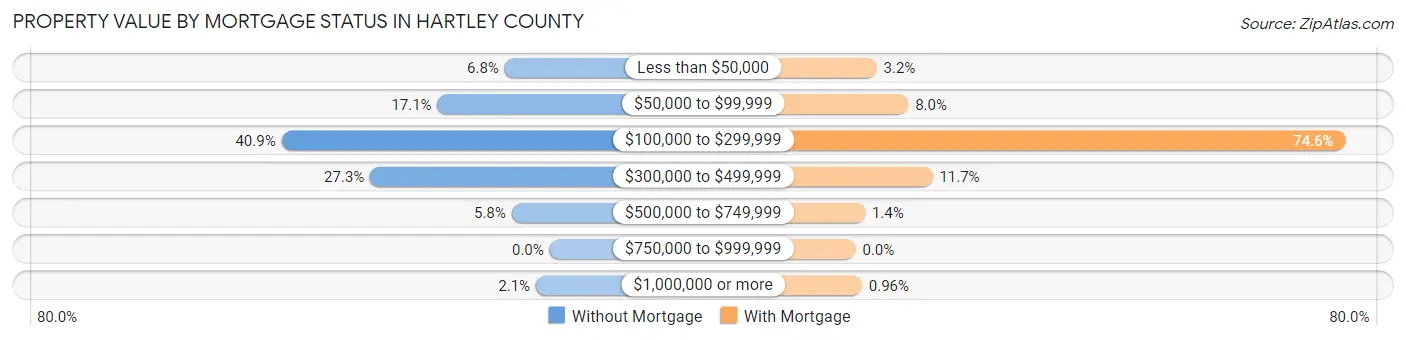
| Property Value | Without Mortgage | With Mortgage |
| Less than $50,000 | 46 (6.8%) | 20 (3.2%) |
| $50,000 to $99,999 | 115 (17.1%) | 50 (8.0%) |
| $100,000 to $299,999 | 275 (40.9%) | 465 (74.6%) |
| $300,000 to $499,999 | 184 (27.3%) | 73 (11.7%) |
| $500,000 to $749,999 | 39 (5.8%) | 9 (1.4%) |
| $750,000 to $999,999 | 0 (0.0%) | 0 (0.0%) |
| $1,000,000 or more | 14 (2.1%) | 6 (1.0%) |
| Total | 673 (100.0%) | 623 (100.0%) |
Household Income by Mortgage Status in Hartley County
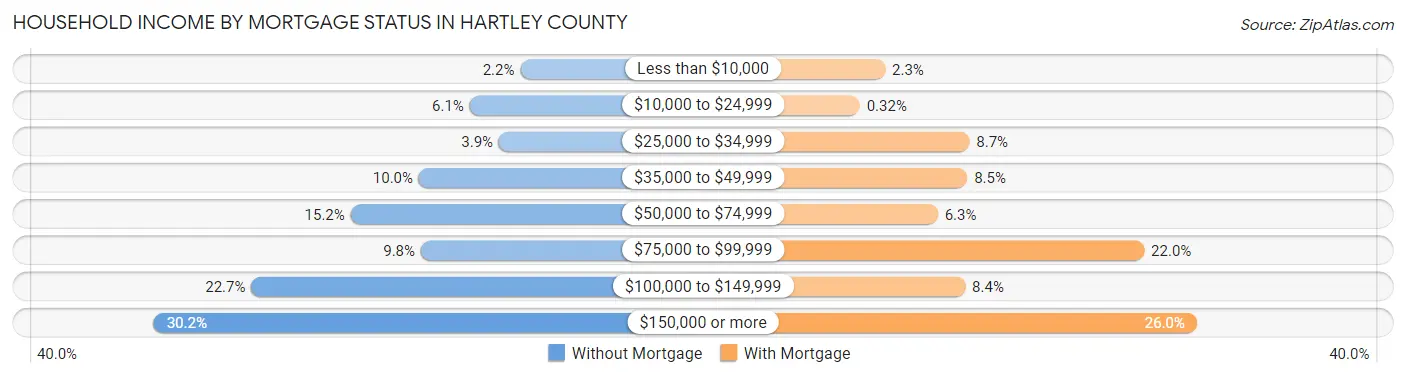
| Household Income | Without Mortgage | With Mortgage |
| Less than $10,000 | 15 (2.2%) | 14 (2.2%) |
| $10,000 to $24,999 | 41 (6.1%) | 2 (0.3%) |
| $25,000 to $34,999 | 26 (3.9%) | 54 (8.7%) |
| $35,000 to $49,999 | 67 (10.0%) | 53 (8.5%) |
| $50,000 to $74,999 | 102 (15.2%) | 39 (6.3%) |
| $75,000 to $99,999 | 66 (9.8%) | 137 (22.0%) |
| $100,000 to $149,999 | 153 (22.7%) | 52 (8.4%) |
| $150,000 or more | 203 (30.2%) | 162 (26.0%) |
| Total | 673 (100.0%) | 623 (100.0%) |
Property Value to Household Income Ratio in Hartley County
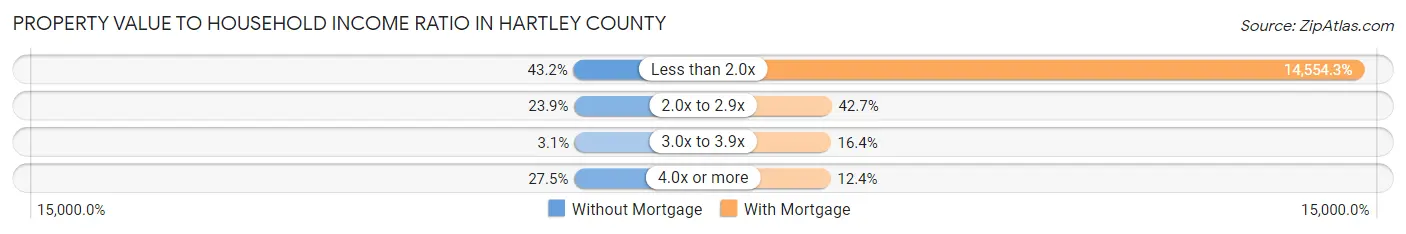
| Value-to-Income Ratio | Without Mortgage | With Mortgage |
| Less than 2.0x | 291 (43.2%) | 90,673 (14,554.2%) |
| 2.0x to 2.9x | 161 (23.9%) | 266 (42.7%) |
| 3.0x to 3.9x | 21 (3.1%) | 102 (16.4%) |
| 4.0x or more | 185 (27.5%) | 77 (12.4%) |
| Total | 673 (100.0%) | 623 (100.0%) |
Real Estate Taxes by Mortgage Status in Hartley County
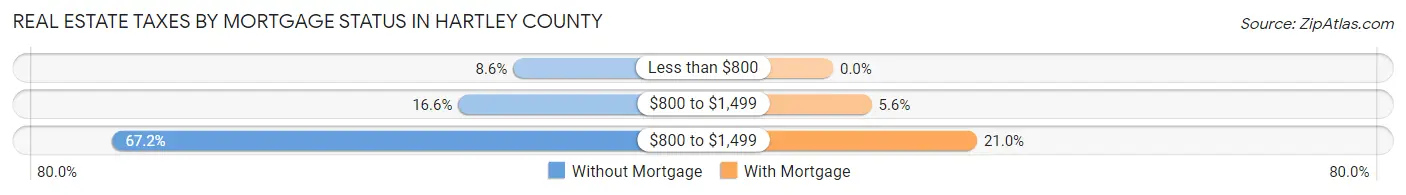
| Property Taxes | Without Mortgage | With Mortgage |
| Less than $800 | 58 (8.6%) | 0 (0.0%) |
| $800 to $1,499 | 112 (16.6%) | 35 (5.6%) |
| $800 to $1,499 | 452 (67.2%) | 131 (21.0%) |
| Total | 673 (100.0%) | 623 (100.0%) |
Health & Disability in Hartley County
Health Insurance Coverage by Age in Hartley County
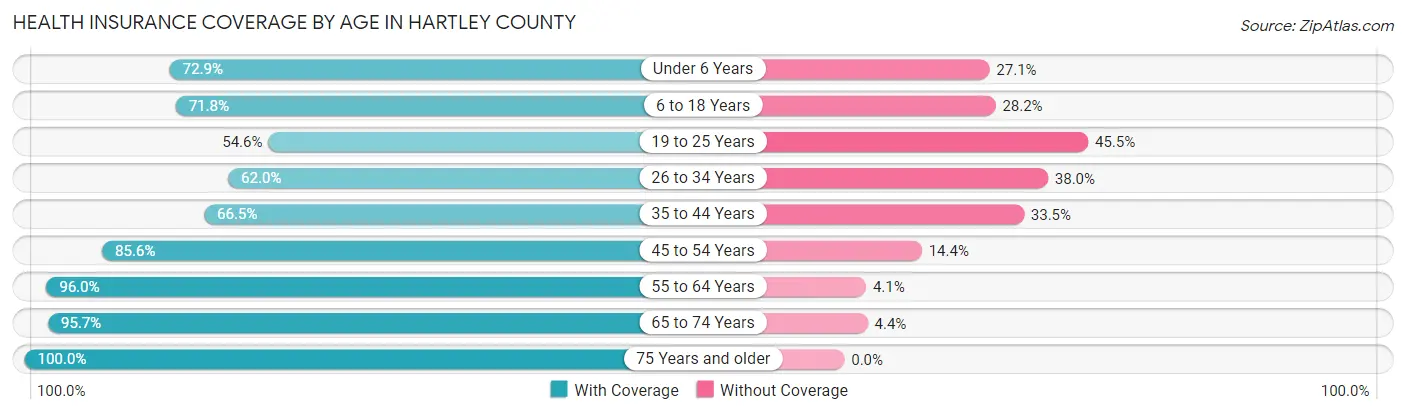
| Age Bracket | With Coverage | Without Coverage |
| Under 6 Years | 221 (72.9%) | 82 (27.1%) |
| 6 to 18 Years | 642 (71.8%) | 252 (28.2%) |
| 19 to 25 Years | 90 (54.5%) | 75 (45.5%) |
| 26 to 34 Years | 304 (62.0%) | 186 (38.0%) |
| 35 to 44 Years | 306 (66.5%) | 154 (33.5%) |
| 45 to 54 Years | 326 (85.6%) | 55 (14.4%) |
| 55 to 64 Years | 379 (96.0%) | 16 (4.1%) |
| 65 to 74 Years | 396 (95.7%) | 18 (4.3%) |
| 75 Years and older | 401 (100.0%) | 0 (0.0%) |
| Total | 3,065 (78.5%) | 838 (21.5%) |
Health Insurance Coverage by Citizenship Status in Hartley County
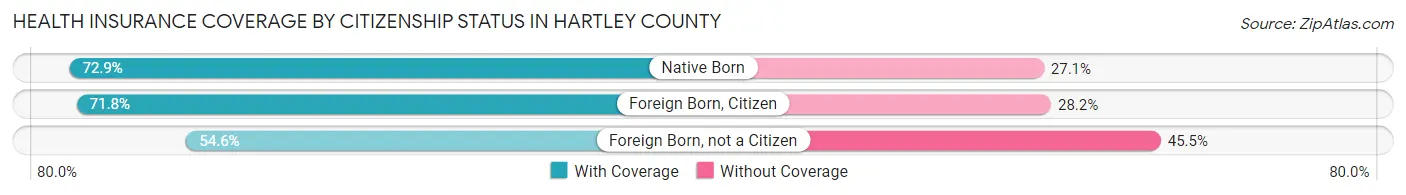
| Citizenship Status | With Coverage | Without Coverage |
| Native Born | 221 (72.9%) | 82 (27.1%) |
| Foreign Born, Citizen | 642 (71.8%) | 252 (28.2%) |
| Foreign Born, not a Citizen | 90 (54.5%) | 75 (45.5%) |
Health Insurance Coverage by Household Income in Hartley County
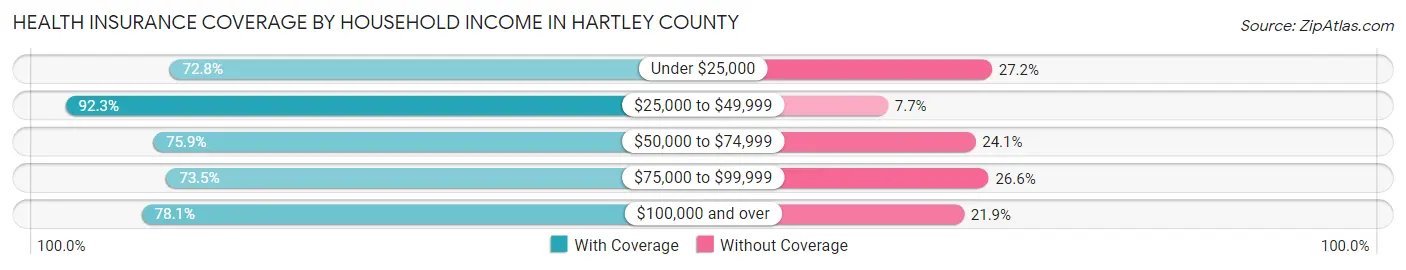
| Household Income | With Coverage | Without Coverage |
| Under $25,000 | 177 (72.8%) | 66 (27.2%) |
| $25,000 to $49,999 | 432 (92.3%) | 36 (7.7%) |
| $50,000 to $74,999 | 675 (75.9%) | 214 (24.1%) |
| $75,000 to $99,999 | 285 (73.5%) | 103 (26.6%) |
| $100,000 and over | 1,492 (78.1%) | 419 (21.9%) |
Public vs Private Health Insurance Coverage by Age in Hartley County
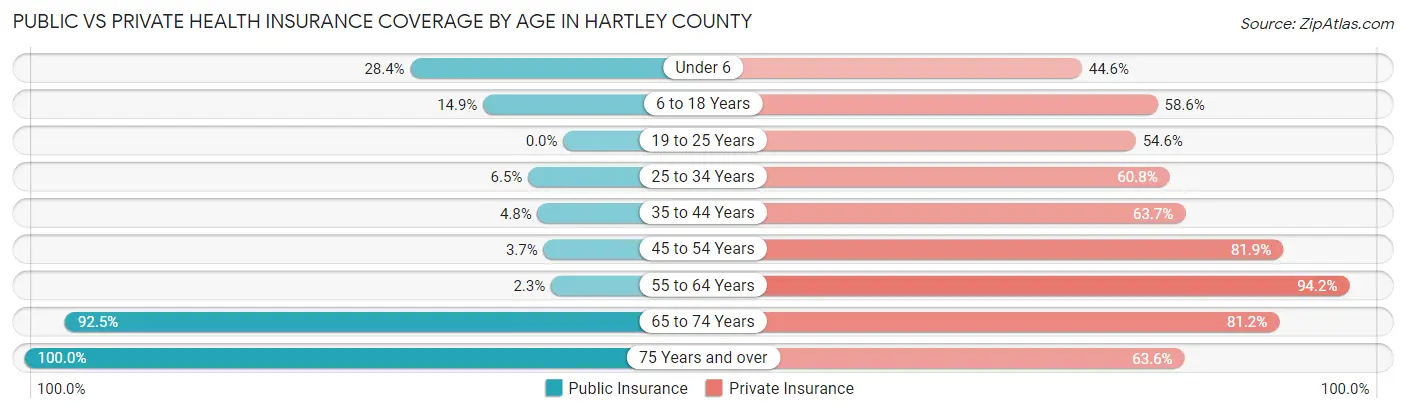
| Age Bracket | Public Insurance | Private Insurance |
| Under 6 | 86 (28.4%) | 135 (44.6%) |
| 6 to 18 Years | 133 (14.9%) | 524 (58.6%) |
| 19 to 25 Years | 0 (0.0%) | 90 (54.5%) |
| 25 to 34 Years | 32 (6.5%) | 298 (60.8%) |
| 35 to 44 Years | 22 (4.8%) | 293 (63.7%) |
| 45 to 54 Years | 14 (3.7%) | 312 (81.9%) |
| 55 to 64 Years | 9 (2.3%) | 372 (94.2%) |
| 65 to 74 Years | 383 (92.5%) | 336 (81.2%) |
| 75 Years and over | 401 (100.0%) | 255 (63.6%) |
| Total | 1,080 (27.7%) | 2,615 (67.0%) |
Disability Status by Sex by Age in Hartley County
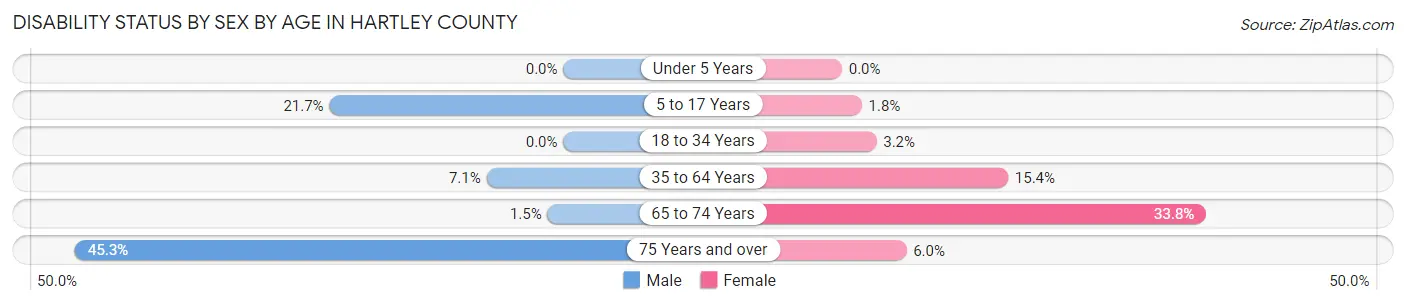
| Age Bracket | Male | Female |
| Under 5 Years | 0 (0.0%) | 0 (0.0%) |
| 5 to 17 Years | 89 (21.7%) | 9 (1.8%) |
| 18 to 34 Years | 0 (0.0%) | 15 (3.2%) |
| 35 to 64 Years | 40 (7.1%) | 104 (15.4%) |
| 65 to 74 Years | 3 (1.5%) | 71 (33.8%) |
| 75 Years and over | 68 (45.3%) | 15 (6.0%) |
Disability Class by Sex by Age in Hartley County
Disability Class: Hearing Difficulty
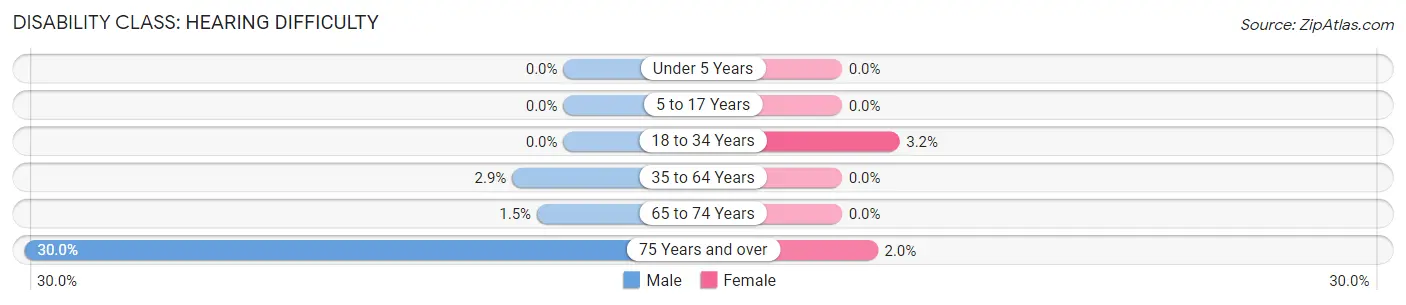
| Age Bracket | Male | Female |
| Under 5 Years | 0 (0.0%) | 0 (0.0%) |
| 5 to 17 Years | 0 (0.0%) | 0 (0.0%) |
| 18 to 34 Years | 0 (0.0%) | 15 (3.2%) |
| 35 to 64 Years | 16 (2.9%) | 0 (0.0%) |
| 65 to 74 Years | 3 (1.5%) | 0 (0.0%) |
| 75 Years and over | 45 (30.0%) | 5 (2.0%) |
Disability Class: Vision Difficulty
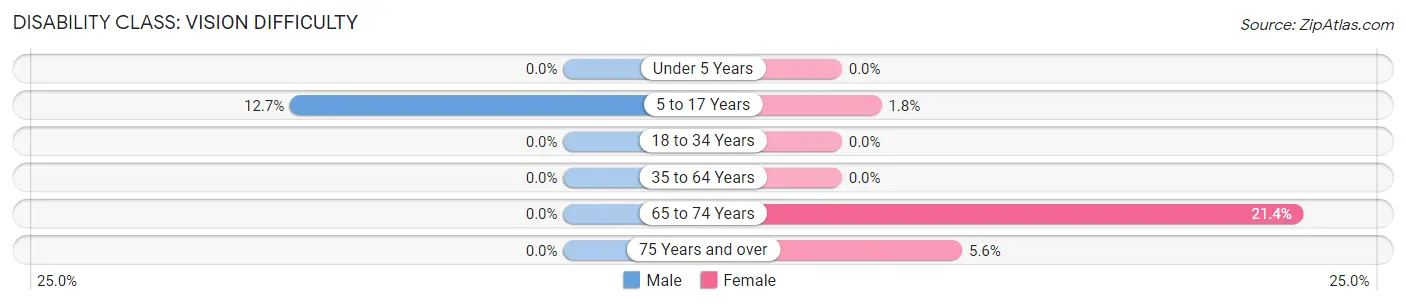
| Age Bracket | Male | Female |
| Under 5 Years | 0 (0.0%) | 0 (0.0%) |
| 5 to 17 Years | 52 (12.7%) | 9 (1.8%) |
| 18 to 34 Years | 0 (0.0%) | 0 (0.0%) |
| 35 to 64 Years | 0 (0.0%) | 0 (0.0%) |
| 65 to 74 Years | 0 (0.0%) | 45 (21.4%) |
| 75 Years and over | 0 (0.0%) | 14 (5.6%) |
Disability Class: Cognitive Difficulty
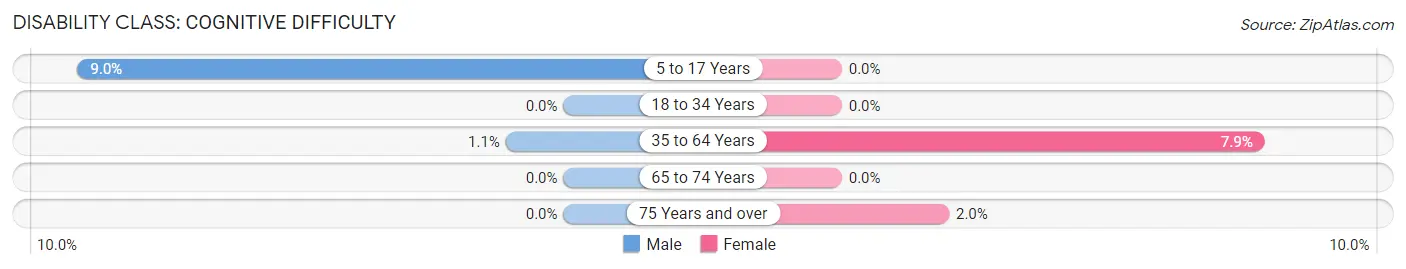
| Age Bracket | Male | Female |
| 5 to 17 Years | 37 (9.0%) | 0 (0.0%) |
| 18 to 34 Years | 0 (0.0%) | 0 (0.0%) |
| 35 to 64 Years | 6 (1.1%) | 53 (7.9%) |
| 65 to 74 Years | 0 (0.0%) | 0 (0.0%) |
| 75 Years and over | 0 (0.0%) | 5 (2.0%) |
Disability Class: Ambulatory Difficulty
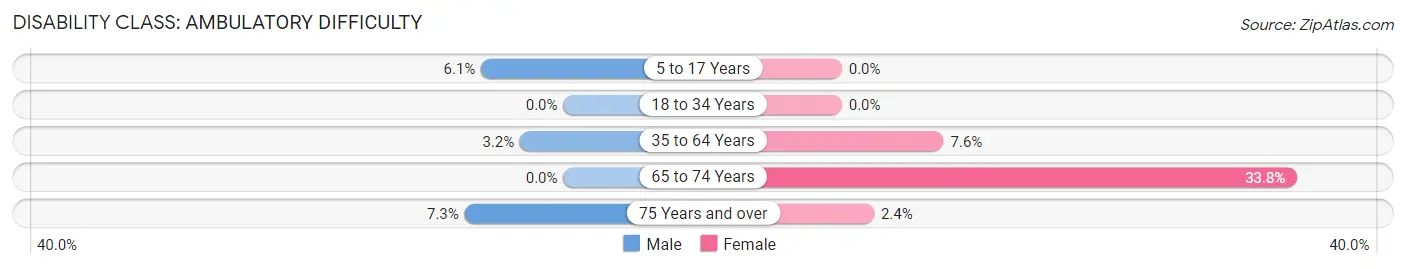
| Age Bracket | Male | Female |
| 5 to 17 Years | 25 (6.1%) | 0 (0.0%) |
| 18 to 34 Years | 0 (0.0%) | 0 (0.0%) |
| 35 to 64 Years | 18 (3.2%) | 51 (7.6%) |
| 65 to 74 Years | 0 (0.0%) | 71 (33.8%) |
| 75 Years and over | 11 (7.3%) | 6 (2.4%) |
Disability Class: Self-Care Difficulty
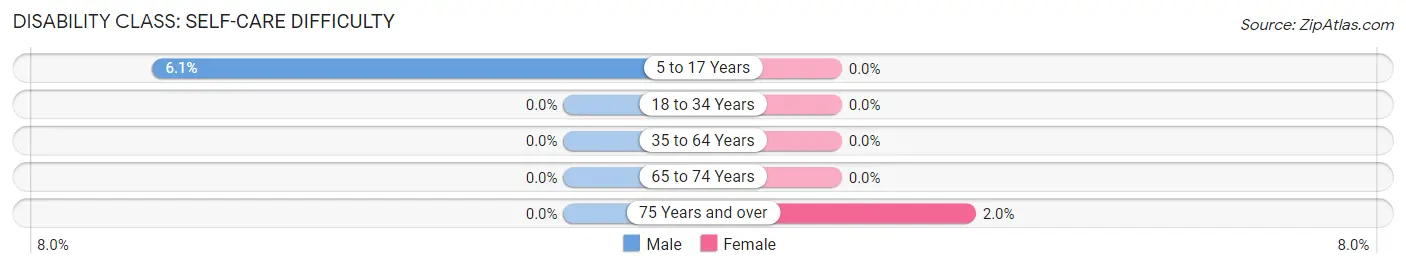
| Age Bracket | Male | Female |
| 5 to 17 Years | 25 (6.1%) | 0 (0.0%) |
| 18 to 34 Years | 0 (0.0%) | 0 (0.0%) |
| 35 to 64 Years | 0 (0.0%) | 0 (0.0%) |
| 65 to 74 Years | 0 (0.0%) | 0 (0.0%) |
| 75 Years and over | 0 (0.0%) | 5 (2.0%) |
Technology Access in Hartley County
Computing Device Access in Hartley County
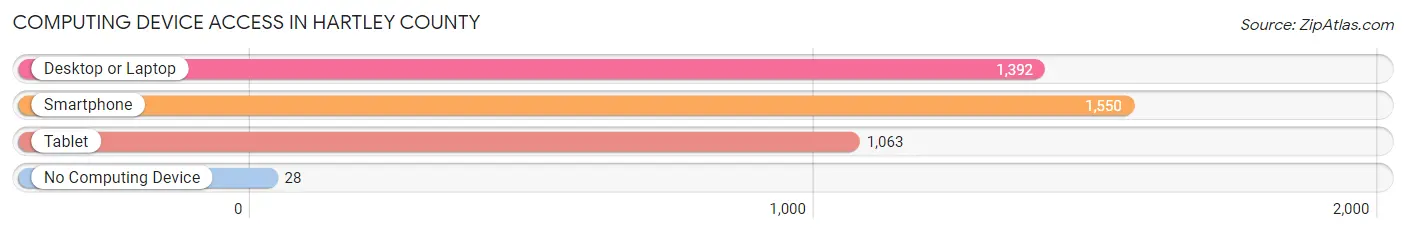
| Device Type | # Households | % Households |
| Desktop or Laptop | 1,392 | 85.6% |
| Smartphone | 1,550 | 95.3% |
| Tablet | 1,063 | 65.4% |
| No Computing Device | 28 | 1.7% |
| Total | 1,626 | 100.0% |
Internet Access in Hartley County
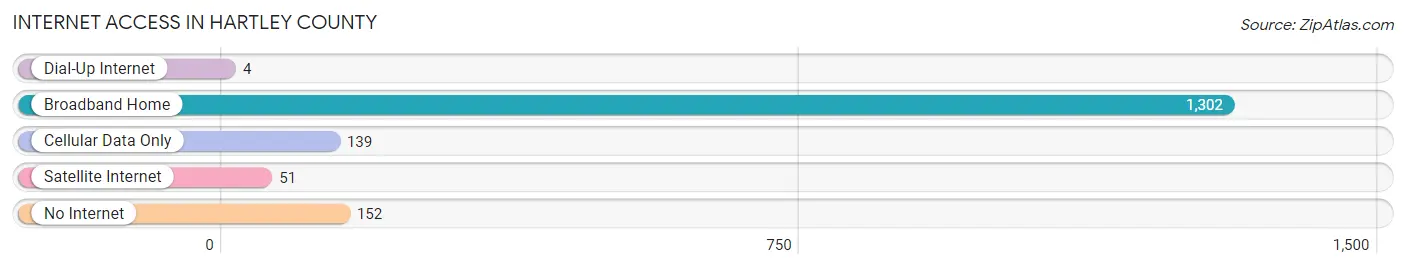
| Internet Type | # Households | % Households |
| Dial-Up Internet | 4 | 0.3% |
| Broadband Home | 1,302 | 80.1% |
| Cellular Data Only | 139 | 8.6% |
| Satellite Internet | 51 | 3.1% |
| No Internet | 152 | 9.3% |
| Total | 1,626 | 100.0% |
Hartley County Summary
Hartley County is located in the Texas Panhandle, in the northwestern corner of the state. It is bordered by Dallam County to the north, Moore County to the east, Oldham County to the south, and Union County, New Mexico to the west. The county seat is Channing, and the largest city is Dalhart. The county was created in 1876 and is named for Oliver Cromwell Hartley, a Texas state legislator.
Geography
Hartley County covers an area of 902 square miles, making it the second-smallest county in Texas. The terrain is mostly flat, with some rolling hills in the western part of the county. The county is part of the High Plains region of the Great Plains, and is mostly covered in shortgrass prairie. The Canadian River forms the northern border of the county, and the Rita Blanca Creek runs through the center. The county is home to several small lakes, including Lake Meredith and Lake McClellan.
Demographics
As of the 2010 census, the population of Hartley County was 6,062. The population density was 6.7 people per square mile. The racial makeup of the county was 84.3% White, 0.7% African American, 0.7% Native American, 0.3% Asian, 11.7% from other races, and 2.1% from two or more races. Hispanic or Latino of any race were 24.3% of the population.
The median income for a household in the county was $41,944, and the median income for a family was $48,958. The per capita income for the county was $19,945. About 11.2% of families and 14.2% of the population were below the poverty line, including 18.2% of those under age 18 and 10.2% of those age 65 or over.
Economy
Agriculture is the main economic driver in Hartley County. The county is home to a variety of crops, including wheat, corn, sorghum, cotton, and hay. Cattle ranching is also an important part of the local economy. The county is home to several oil and gas fields, and there is some mining activity in the area.
The county is home to several businesses, including a number of restaurants, retail stores, and service providers. The county is also home to a number of manufacturing companies, including a plastics plant and a food processing plant.
The county is served by the Dalhart Independent School District, which includes two elementary schools, one middle school, and one high school. The county is also home to a branch of Amarillo College.
Conclusion
Hartley County is a small county in the Texas Panhandle, located in the northwestern corner of the state. The county is mostly flat, with some rolling hills in the western part of the county. The population of the county is 6,062, and the median income for a household is $41,944. Agriculture is the main economic driver in the county, and the county is home to several businesses, including restaurants, retail stores, and manufacturing companies. The county is served by the Dalhart Independent School District, and is home to a branch of Amarillo College.
Common Questions
What is Per Capita Income in Hartley County?
Per Capita income in Hartley County is $27,850.
What is the Median Family Income in Hartley County?
Median Family Income in Hartley County is $105,724.
What is the Median Household income in Hartley County?
Median Household Income in Hartley County is $78,065.
What is Income or Wage Gap in Hartley County?
Income or Wage Gap in Hartley County is 26.9%.
Women in Hartley County earn 73.1 cents for every dollar earned by a man.
What is Inequality or Gini Index in Hartley County?
Inequality or Gini Index in Hartley County is 0.39.
What is the Total Population of Hartley County?
Total Population of Hartley County is 5,369.
What is the Total Male Population of Hartley County?
Total Male Population of Hartley County is 3,055.
What is the Total Female Population of Hartley County?
Total Female Population of Hartley County is 2,314.
What is the Ratio of Males per 100 Females in Hartley County?
There are 132.02 Males per 100 Females in Hartley County.
What is the Ratio of Females per 100 Males in Hartley County?
There are 75.74 Females per 100 Males in Hartley County.
What is the Median Population Age in Hartley County?
Median Population Age in Hartley County is 39.7 Years.
What is the Average Family Size in Hartley County
Average Family Size in Hartley County is 2.9 People.
What is the Average Household Size in Hartley County
Average Household Size in Hartley County is 2.4 People.
How Large is the Labor Force in Hartley County?
There are 1,796 People in the Labor Forcein in Hartley County.
What is the Percentage of People in the Labor Force in Hartley County?
42.5% of People are in the Labor Force in Hartley County.
What is the Unemployment Rate in Hartley County?
Unemployment Rate in Hartley County is 1.5%.