Harrison County, TX Map & Demographics
Harrison County Map
Harrison County Overview
$30,613
PER CAPITA INCOME
$77,299
AVG FAMILY INCOME
$63,427
AVG HOUSEHOLD INCOME
35.7%
WAGE / INCOME GAP [ % ]
64.3¢/ $1
WAGE / INCOME GAP [ $ ]
$13,740
FAMILY INCOME DEFICIT
0.47
INEQUALITY / GINI INDEX
69,098
TOTAL POPULATION
33,790
MALE POPULATION
35,308
FEMALE POPULATION
95.70
MALES / 100 FEMALES
104.49
FEMALES / 100 MALES
38.8
MEDIAN AGE
3.2
AVG FAMILY SIZE
2.7
AVG HOUSEHOLD SIZE
32,960
LABOR FORCE [ PEOPLE ]
60.4%
PERCENT IN LABOR FORCE
6.1%
UNEMPLOYMENT RATE
Income in Harrison County
Income Overview in Harrison County
Per Capita Income in Harrison County is $30,613, while median incomes of families and households are $77,299 and $63,427 respectively.
| Characteristic | Number | Measure |
| Per Capita Income | 69,098 | $30,613 |
| Median Family Income | 17,936 | $77,299 |
| Mean Family Income | 17,936 | $94,232 |
| Median Household Income | 24,993 | $63,427 |
| Mean Household Income | 24,993 | $81,428 |
| Income Deficit | 17,936 | $13,740 |
| Wage / Income Gap (%) | 69,098 | 35.68% |
| Wage / Income Gap ($) | 69,098 | 64.32¢ per $1 |
| Gini / Inequality Index | 69,098 | 0.47 |
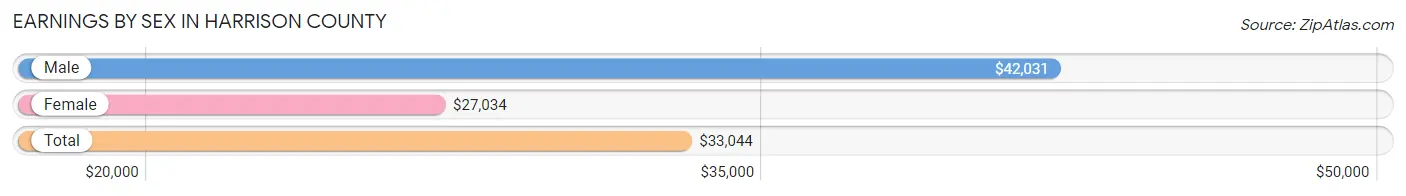
Earnings by Sex in Harrison County
Average Earnings in Harrison County are $33,044, $42,031 for men and $27,034 for women, a difference of 35.7%.
| Sex | Number | Average Earnings |
| Male | 18,092 (52.8%) | $42,031 |
| Female | 16,191 (47.2%) | $27,034 |
| Total | 34,283 (100.0%) | $33,044 |
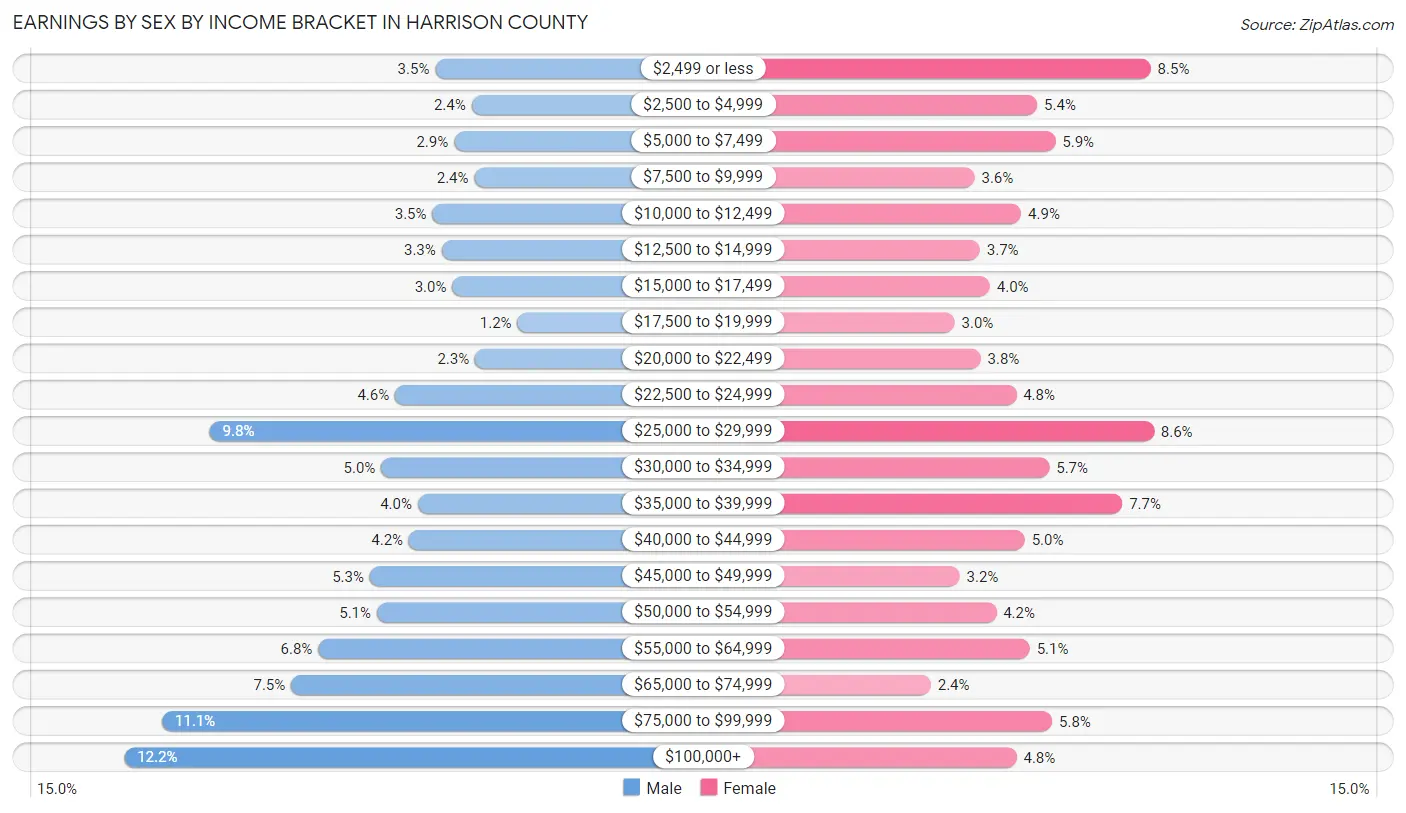
Earnings by Sex by Income Bracket in Harrison County
The most common earnings brackets in Harrison County are $100,000+ for men (2,207 | 12.2%) and $25,000 to $29,999 for women (1,397 | 8.6%).
| Income | Male | Female |
| $2,499 or less | 626 (3.5%) | 1,382 (8.5%) |
| $2,500 to $4,999 | 441 (2.4%) | 867 (5.3%) |
| $5,000 to $7,499 | 531 (2.9%) | 948 (5.9%) |
| $7,500 to $9,999 | 427 (2.4%) | 581 (3.6%) |
| $10,000 to $12,499 | 641 (3.5%) | 793 (4.9%) |
| $12,500 to $14,999 | 593 (3.3%) | 606 (3.7%) |
| $15,000 to $17,499 | 539 (3.0%) | 651 (4.0%) |
| $17,500 to $19,999 | 208 (1.1%) | 490 (3.0%) |
| $20,000 to $22,499 | 424 (2.3%) | 608 (3.8%) |
| $22,500 to $24,999 | 830 (4.6%) | 770 (4.8%) |
| $25,000 to $29,999 | 1,773 (9.8%) | 1,397 (8.6%) |
| $30,000 to $34,999 | 901 (5.0%) | 921 (5.7%) |
| $35,000 to $39,999 | 714 (4.0%) | 1,253 (7.7%) |
| $40,000 to $44,999 | 760 (4.2%) | 809 (5.0%) |
| $45,000 to $49,999 | 958 (5.3%) | 513 (3.2%) |
| $50,000 to $54,999 | 923 (5.1%) | 680 (4.2%) |
| $55,000 to $64,999 | 1,222 (6.8%) | 832 (5.1%) |
| $65,000 to $74,999 | 1,358 (7.5%) | 382 (2.4%) |
| $75,000 to $99,999 | 2,016 (11.1%) | 935 (5.8%) |
| $100,000+ | 2,207 (12.2%) | 773 (4.8%) |
| Total | 18,092 (100.0%) | 16,191 (100.0%) |
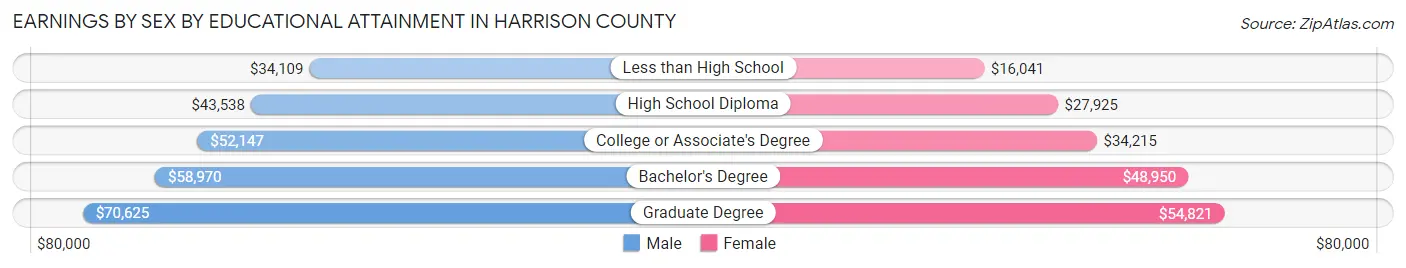
Earnings by Sex by Educational Attainment in Harrison County
Average earnings in Harrison County are $50,220 for men and $32,018 for women, a difference of 36.2%. Men with an educational attainment of graduate degree enjoy the highest average annual earnings of $70,625, while those with less than high school education earn the least with $34,109. Women with an educational attainment of graduate degree earn the most with the average annual earnings of $54,821, while those with less than high school education have the smallest earnings of $16,041.
| Educational Attainment | Male Income | Female Income |
| Less than High School | $34,109 | $16,041 |
| High School Diploma | $43,538 | $27,925 |
| College or Associate's Degree | $52,147 | $34,215 |
| Bachelor's Degree | $58,970 | $48,950 |
| Graduate Degree | $70,625 | $54,821 |
| Total | $50,220 | $32,018 |
Family Income in Harrison County
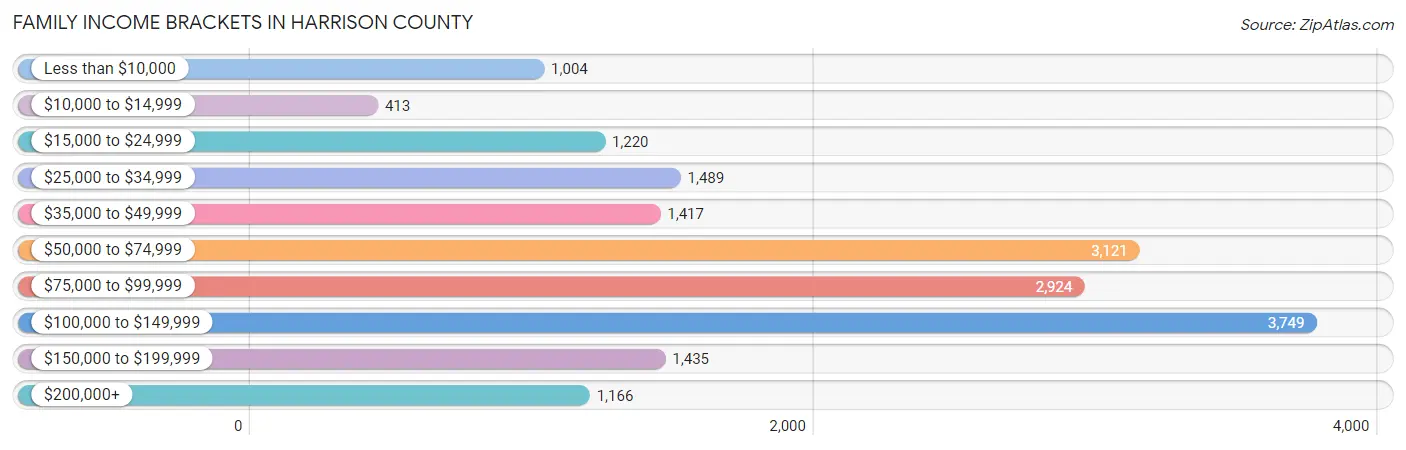
Family Income Brackets in Harrison County
According to the Harrison County family income data, there are 3,749 families falling into the $100,000 to $149,999 income range, which is the most common income bracket and makes up 20.9% of all families. Conversely, the $10,000 to $14,999 income bracket is the least frequent group with only 413 families (2.3%) belonging to this category.
| Income Bracket | # Families | % Families |
| Less than $10,000 | 1,004 | 5.6% |
| $10,000 to $14,999 | 413 | 2.3% |
| $15,000 to $24,999 | 1,220 | 6.8% |
| $25,000 to $34,999 | 1,489 | 8.3% |
| $35,000 to $49,999 | 1,417 | 7.9% |
| $50,000 to $74,999 | 3,121 | 17.4% |
| $75,000 to $99,999 | 2,924 | 16.3% |
| $100,000 to $149,999 | 3,749 | 20.9% |
| $150,000 to $199,999 | 1,435 | 8.0% |
| $200,000+ | 1,166 | 6.5% |
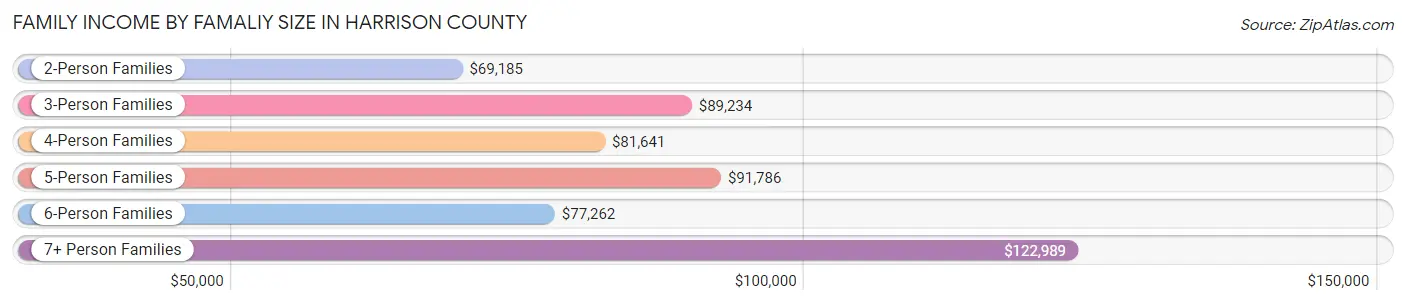
Family Income by Famaliy Size in Harrison County
7+ person families (313 | 1.8%) account for the highest median family income in Harrison County with $122,989 per family, while 2-person families (8,616 | 48.0%) have the highest median income of $34,592 per family member.
| Income Bracket | # Families | Median Income |
| 2-Person Families | 8,616 (48.0%) | $69,185 |
| 3-Person Families | 3,717 (20.7%) | $89,234 |
| 4-Person Families | 3,492 (19.5%) | $81,641 |
| 5-Person Families | 1,312 (7.3%) | $91,786 |
| 6-Person Families | 486 (2.7%) | $77,262 |
| 7+ Person Families | 313 (1.8%) | $122,989 |
| Total | 17,936 (100.0%) | $77,299 |
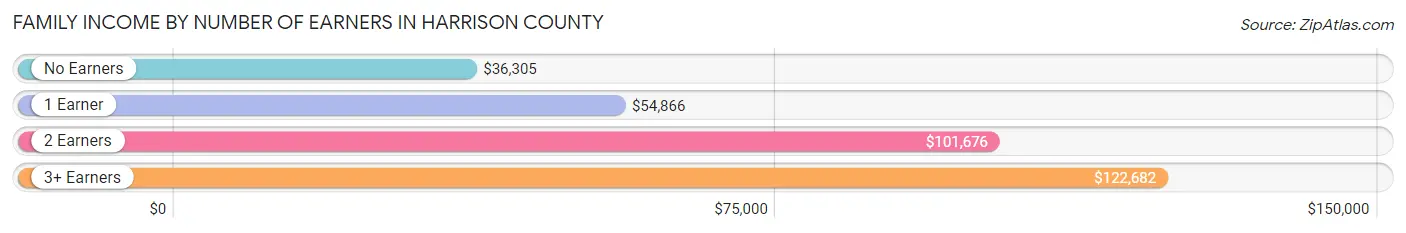
Family Income by Number of Earners in Harrison County
The median family income in Harrison County is $77,299, with families comprising 3+ earners (1,983) having the highest median family income of $122,682, while families with no earners (3,020) have the lowest median family income of $36,305, accounting for 11.1% and 16.8% of families, respectively.
| Number of Earners | # Families | Median Income |
| No Earners | 3,020 (16.8%) | $36,305 |
| 1 Earner | 6,332 (35.3%) | $54,866 |
| 2 Earners | 6,601 (36.8%) | $101,676 |
| 3+ Earners | 1,983 (11.1%) | $122,682 |
| Total | 17,936 (100.0%) | $77,299 |
Household Income in Harrison County
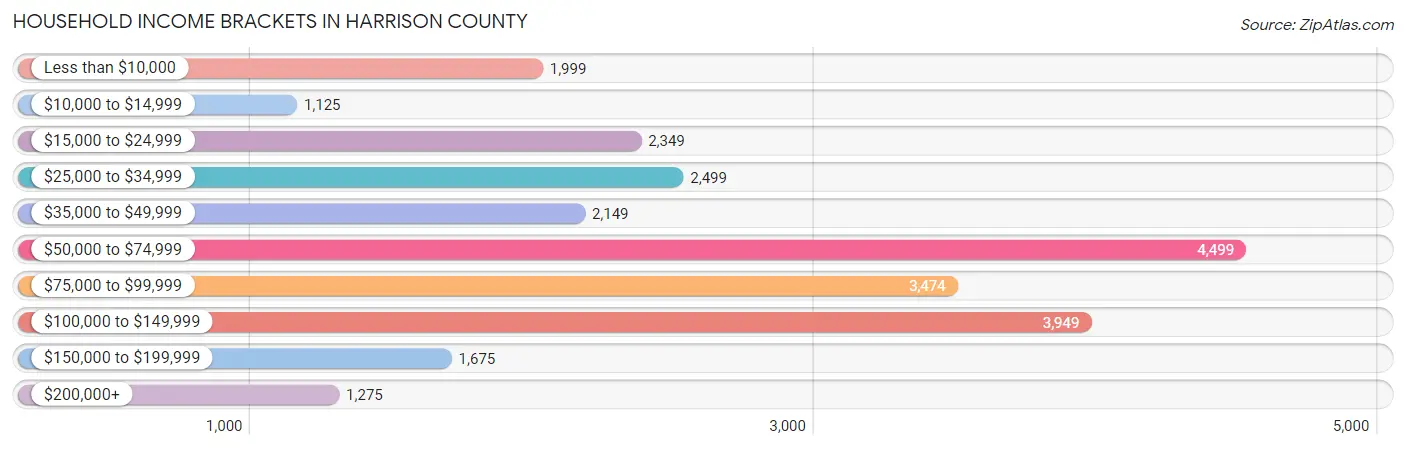
Household Income Brackets in Harrison County
With 4,499 households falling in the category, the $50,000 to $74,999 income range is the most frequent in Harrison County, accounting for 18.0% of all households. In contrast, only 1,125 households (4.5%) fall into the $10,000 to $14,999 income bracket, making it the least populous group.
| Income Bracket | # Households | % Households |
| Less than $10,000 | 1,999 | 8.0% |
| $10,000 to $14,999 | 1,125 | 4.5% |
| $15,000 to $24,999 | 2,349 | 9.4% |
| $25,000 to $34,999 | 2,499 | 10.0% |
| $35,000 to $49,999 | 2,149 | 8.6% |
| $50,000 to $74,999 | 4,499 | 18.0% |
| $75,000 to $99,999 | 3,474 | 13.9% |
| $100,000 to $149,999 | 3,949 | 15.8% |
| $150,000 to $199,999 | 1,675 | 6.7% |
| $200,000+ | 1,275 | 5.1% |
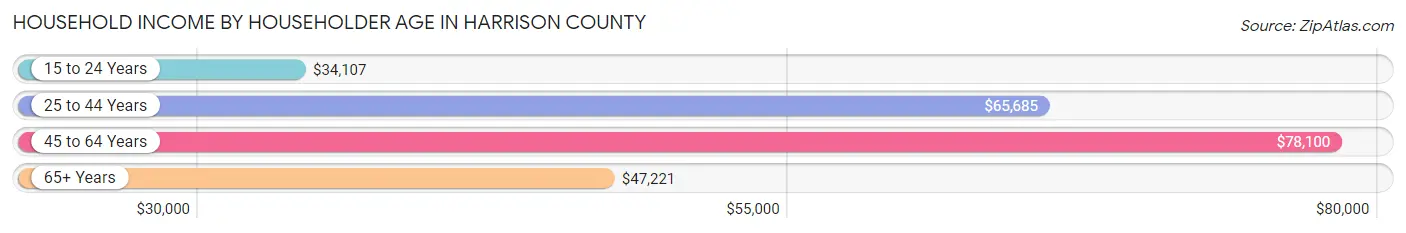
Household Income by Householder Age in Harrison County
The median household income in Harrison County is $63,427, with the highest median household income of $78,100 found in the 45 to 64 years age bracket for the primary householder. A total of 9,399 households (37.6%) fall into this category. Meanwhile, the 15 to 24 years age bracket for the primary householder has the lowest median household income of $34,107, with 686 households (2.7%) in this group.
| Income Bracket | # Households | Median Income |
| 15 to 24 Years | 686 (2.7%) | $34,107 |
| 25 to 44 Years | 7,705 (30.8%) | $65,685 |
| 45 to 64 Years | 9,399 (37.6%) | $78,100 |
| 65+ Years | 7,203 (28.8%) | $47,221 |
| Total | 24,993 (100.0%) | $63,427 |
Poverty in Harrison County
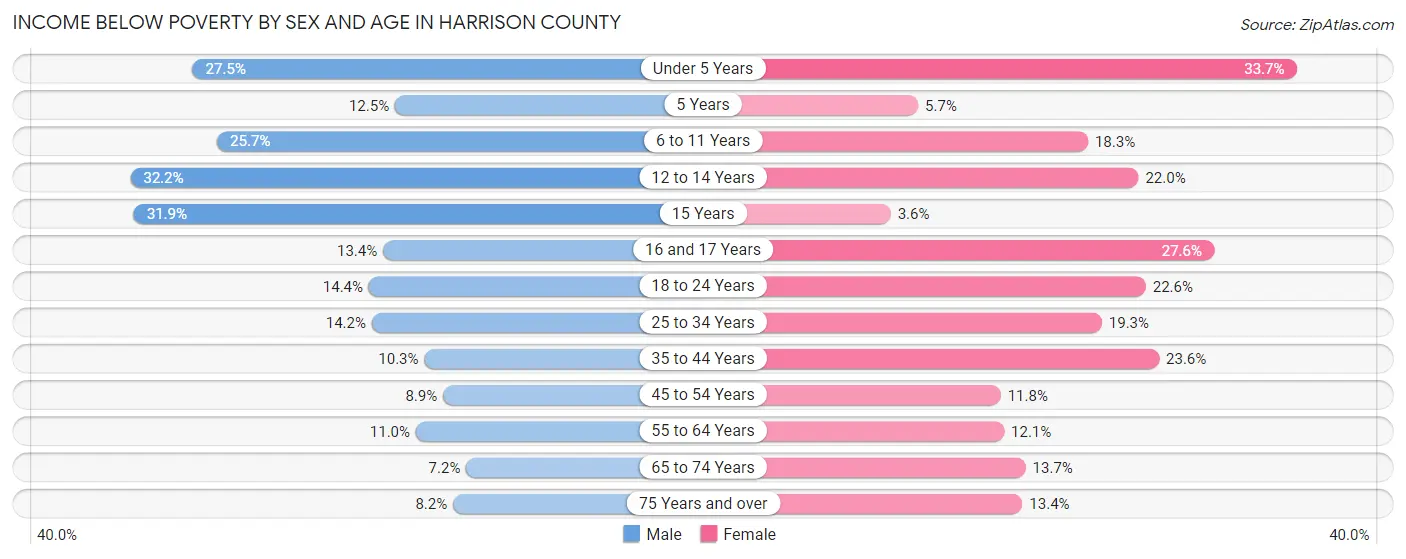
Income Below Poverty by Sex and Age in Harrison County
With 14.4% poverty level for males and 18.2% for females among the residents of Harrison County, 12 to 14 year old males and under 5 year old females are the most vulnerable to poverty, with 462 males (32.2%) and 714 females (33.7%) in their respective age groups living below the poverty level.
| Age Bracket | Male | Female |
| Under 5 Years | 500 (27.5%) | 714 (33.7%) |
| 5 Years | 36 (12.5%) | 25 (5.7%) |
| 6 to 11 Years | 767 (25.7%) | 518 (18.3%) |
| 12 to 14 Years | 462 (32.2%) | 260 (22.0%) |
| 15 Years | 177 (31.9%) | 9 (3.6%) |
| 16 and 17 Years | 133 (13.4%) | 337 (27.6%) |
| 18 to 24 Years | 485 (14.4%) | 576 (22.6%) |
| 25 to 34 Years | 545 (14.2%) | 849 (19.3%) |
| 35 to 44 Years | 445 (10.3%) | 1,058 (23.6%) |
| 45 to 54 Years | 333 (8.9%) | 453 (11.8%) |
| 55 to 64 Years | 494 (11.0%) | 543 (12.0%) |
| 65 to 74 Years | 249 (7.2%) | 503 (13.7%) |
| 75 Years and over | 142 (8.2%) | 333 (13.4%) |
| Total | 4,768 (14.4%) | 6,178 (18.2%) |
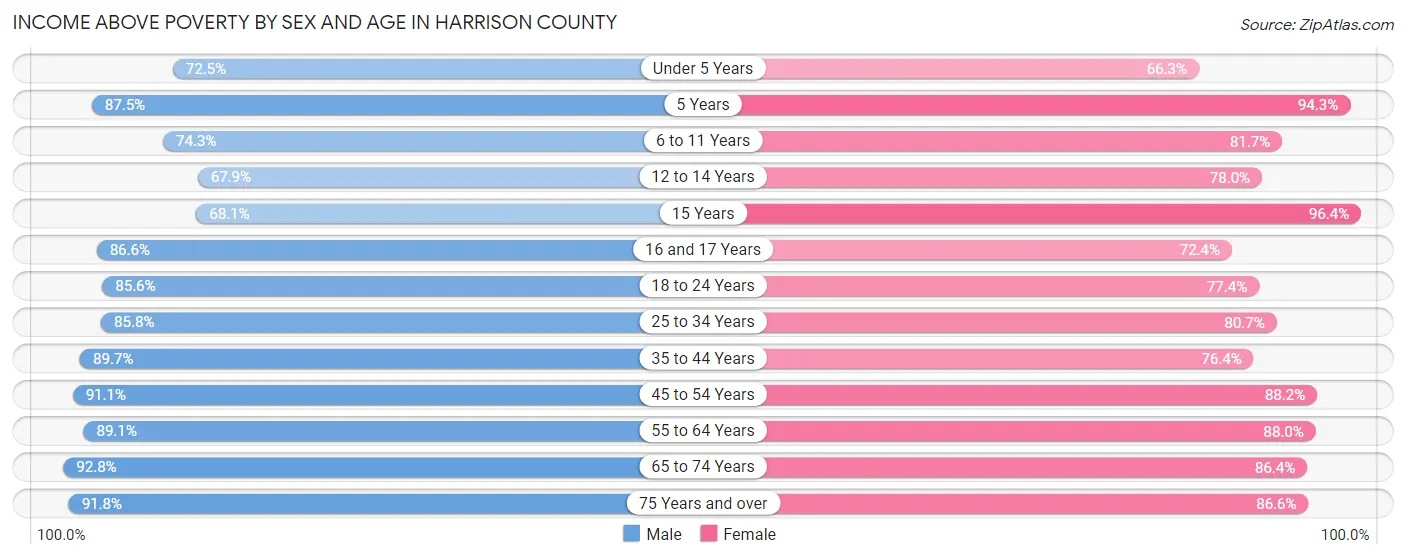
Income Above Poverty by Sex and Age in Harrison County
According to the poverty statistics in Harrison County, males aged 65 to 74 years and females aged 15 years are the age groups that are most secure financially, with 92.8% of males and 96.4% of females in these age groups living above the poverty line.
| Age Bracket | Male | Female |
| Under 5 Years | 1,316 (72.5%) | 1,402 (66.3%) |
| 5 Years | 252 (87.5%) | 416 (94.3%) |
| 6 to 11 Years | 2,218 (74.3%) | 2,315 (81.7%) |
| 12 to 14 Years | 975 (67.8%) | 920 (78.0%) |
| 15 Years | 378 (68.1%) | 239 (96.4%) |
| 16 and 17 Years | 860 (86.6%) | 883 (72.4%) |
| 18 to 24 Years | 2,873 (85.6%) | 1,976 (77.4%) |
| 25 to 34 Years | 3,288 (85.8%) | 3,548 (80.7%) |
| 35 to 44 Years | 3,867 (89.7%) | 3,432 (76.4%) |
| 45 to 54 Years | 3,394 (91.1%) | 3,387 (88.2%) |
| 55 to 64 Years | 4,019 (89.0%) | 3,963 (87.9%) |
| 65 to 74 Years | 3,203 (92.8%) | 3,182 (86.4%) |
| 75 Years and over | 1,591 (91.8%) | 2,151 (86.6%) |
| Total | 28,234 (85.6%) | 27,814 (81.8%) |
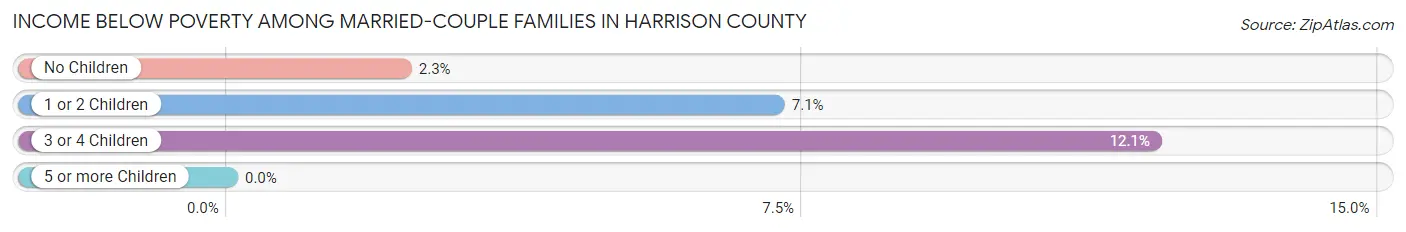
Income Below Poverty Among Married-Couple Families in Harrison County
The poverty statistics for married-couple families in Harrison County show that 4.6% or 587 of the total 12,670 families live below the poverty line. Families with 3 or 4 children have the highest poverty rate of 12.1%, comprising of 143 families. On the other hand, families with 5 or more children have the lowest poverty rate of 0.0%, which includes 0 families.
| Children | Above Poverty | Below Poverty |
| No Children | 7,481 (97.7%) | 174 (2.3%) |
| 1 or 2 Children | 3,509 (92.9%) | 270 (7.1%) |
| 3 or 4 Children | 1,043 (87.9%) | 143 (12.1%) |
| 5 or more Children | 50 (100.0%) | 0 (0.0%) |
| Total | 12,083 (95.4%) | 587 (4.6%) |
Income Below Poverty Among Single-Parent Households in Harrison County
According to the poverty data in Harrison County, 14.5% or 181 single-father households and 37.0% or 1,487 single-mother households are living below the poverty line. Among single-father households, those with 3 or 4 children have the highest poverty rate, with 90 households (61.6%) experiencing poverty. Likewise, among single-mother households, those with 5 or more children have the highest poverty rate, with 58 households (77.3%) falling below the poverty line.
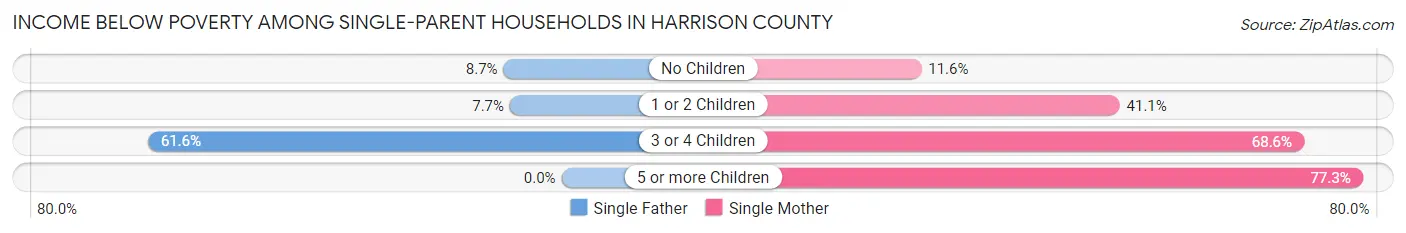
| Children | Single Father | Single Mother |
| No Children | 59 (8.6%) | 164 (11.6%) |
| 1 or 2 Children | 32 (7.7%) | 702 (41.1%) |
| 3 or 4 Children | 90 (61.6%) | 563 (68.6%) |
| 5 or more Children | 0 (0.0%) | 58 (77.3%) |
| Total | 181 (14.5%) | 1,487 (37.0%) |
Income Below Poverty Among Married-Couple vs Single-Parent Households in Harrison County
The poverty data for Harrison County shows that 587 of the married-couple family households (4.6%) and 1,668 of the single-parent households (31.7%) are living below the poverty level. Within the married-couple family households, those with 3 or 4 children have the highest poverty rate, with 143 households (12.1%) falling below the poverty line. Among the single-parent households, those with 5 or more children have the highest poverty rate, with 58 household (77.3%) living below poverty.
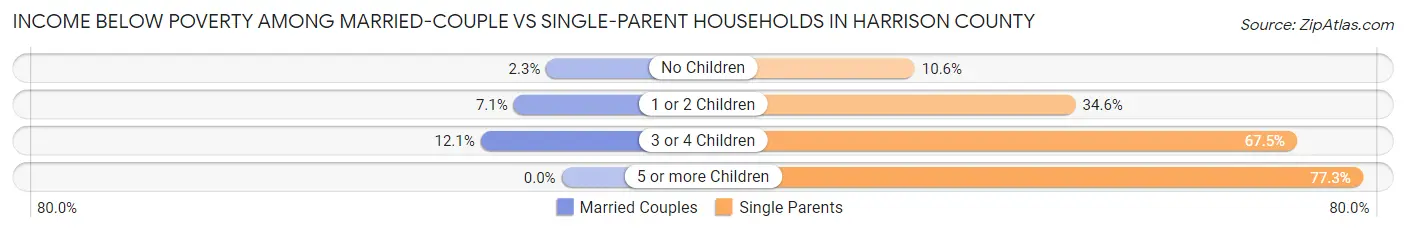
| Children | Married-Couple Families | Single-Parent Households |
| No Children | 174 (2.3%) | 223 (10.6%) |
| 1 or 2 Children | 270 (7.1%) | 734 (34.6%) |
| 3 or 4 Children | 143 (12.1%) | 653 (67.5%) |
| 5 or more Children | 0 (0.0%) | 58 (77.3%) |
| Total | 587 (4.6%) | 1,668 (31.7%) |
Race in Harrison County
The most populous races in Harrison County are White / Caucasian (46,326 | 67.0%), Black / African American (14,215 | 20.6%), and Hispanic or Latino (9,597 | 13.9%).
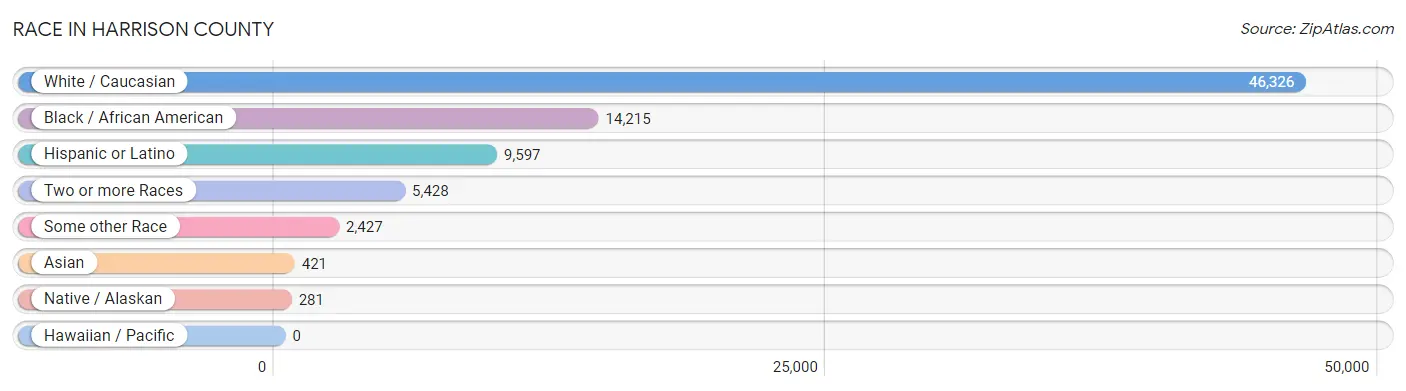
| Race | # Population | % Population |
| Asian | 421 | 0.6% |
| Black / African American | 14,215 | 20.6% |
| Hawaiian / Pacific | 0 | 0.0% |
| Hispanic or Latino | 9,597 | 13.9% |
| Native / Alaskan | 281 | 0.4% |
| White / Caucasian | 46,326 | 67.0% |
| Two or more Races | 5,428 | 7.9% |
| Some other Race | 2,427 | 3.5% |
| Total | 69,098 | 100.0% |
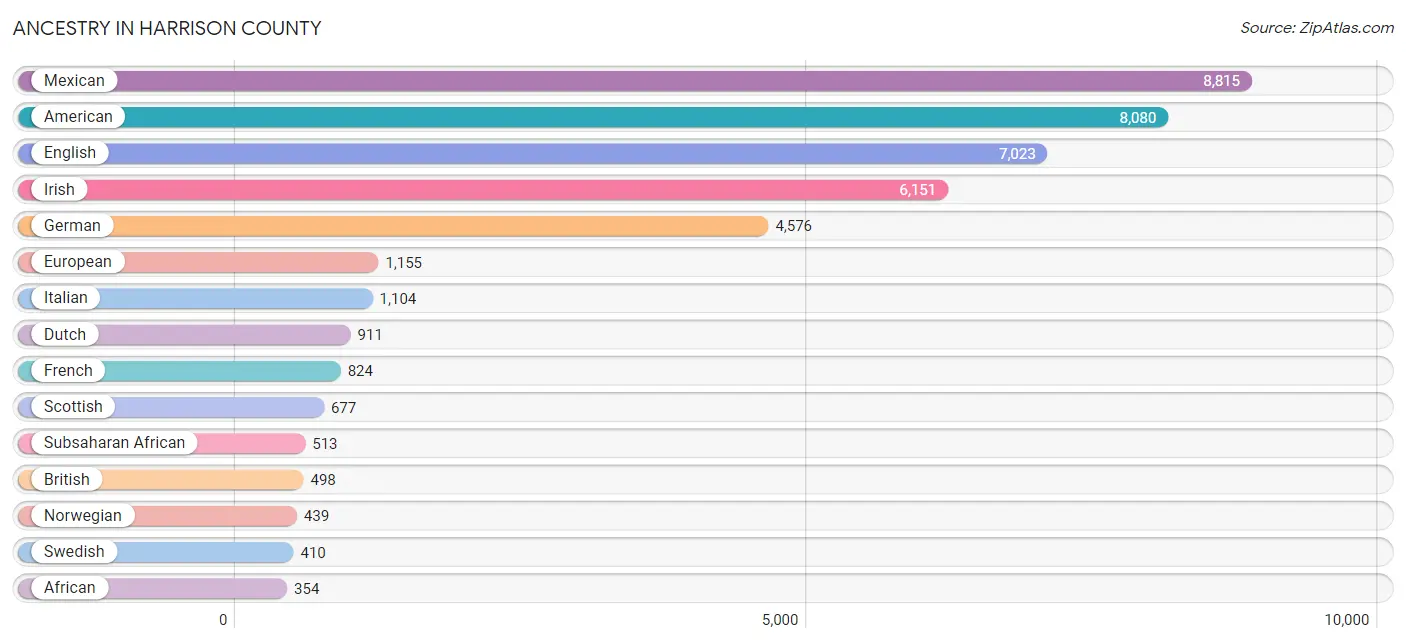
Ancestry in Harrison County
The most populous ancestries reported in Harrison County are Mexican (8,815 | 12.8%), American (8,080 | 11.7%), English (7,023 | 10.2%), Irish (6,151 | 8.9%), and German (4,576 | 6.6%), together accounting for 50.1% of all Harrison County residents.
| Ancestry | # Population | % Population |
| African | 354 | 0.5% |
| Aleut | 14 | 0.0% |
| American | 8,080 | 11.7% |
| Apache | 89 | 0.1% |
| Arab | 39 | 0.1% |
| Argentinean | 14 | 0.0% |
| Armenian | 10 | 0.0% |
| Austrian | 54 | 0.1% |
| Bangladeshi | 131 | 0.2% |
| Bhutanese | 8 | 0.0% |
| Blackfeet | 18 | 0.0% |
| Brazilian | 5 | 0.0% |
| British | 498 | 0.7% |
| Burmese | 201 | 0.3% |
| Canadian | 24 | 0.0% |
| Celtic | 23 | 0.0% |
| Central American | 214 | 0.3% |
| Central American Indian | 159 | 0.2% |
| Cherokee | 280 | 0.4% |
| Choctaw | 101 | 0.2% |
| Colombian | 134 | 0.2% |
| Czech | 80 | 0.1% |
| Czechoslovakian | 47 | 0.1% |
| Danish | 17 | 0.0% |
| Dutch | 911 | 1.3% |
| Eastern European | 63 | 0.1% |
| English | 7,023 | 10.2% |
| European | 1,155 | 1.7% |
| Finnish | 23 | 0.0% |
| French | 824 | 1.2% |
| French American Indian | 14 | 0.0% |
| French Canadian | 277 | 0.4% |
| German | 4,576 | 6.6% |
| Greek | 54 | 0.1% |
| Guatemalan | 46 | 0.1% |
| Honduran | 163 | 0.2% |
| Hungarian | 18 | 0.0% |
| Indian (Asian) | 50 | 0.1% |
| Inupiat | 33 | 0.1% |
| Iranian | 11 | 0.0% |
| Irish | 6,151 | 8.9% |
| Israeli | 75 | 0.1% |
| Italian | 1,104 | 1.6% |
| Jamaican | 60 | 0.1% |
| Japanese | 47 | 0.1% |
| Kenyan | 11 | 0.0% |
| Korean | 118 | 0.2% |
| Lebanese | 39 | 0.1% |
| Lithuanian | 47 | 0.1% |
| Mexican | 8,815 | 12.8% |
| Mexican American Indian | 159 | 0.2% |
| Nigerian | 91 | 0.1% |
| Northern European | 63 | 0.1% |
| Norwegian | 439 | 0.6% |
| Pakistani | 1 | 0.0% |
| Peruvian | 14 | 0.0% |
| Polish | 316 | 0.5% |
| Pueblo | 32 | 0.1% |
| Puerto Rican | 37 | 0.1% |
| Russian | 75 | 0.1% |
| Salvadoran | 5 | 0.0% |
| Scandinavian | 163 | 0.2% |
| Scotch-Irish | 264 | 0.4% |
| Scottish | 677 | 1.0% |
| Serbian | 13 | 0.0% |
| South African | 8 | 0.0% |
| South American | 164 | 0.2% |
| Spaniard | 8 | 0.0% |
| Spanish | 17 | 0.0% |
| Sri Lankan | 58 | 0.1% |
| Subsaharan African | 513 | 0.7% |
| Swedish | 410 | 0.6% |
| Swiss | 24 | 0.0% |
| Thai | 86 | 0.1% |
| Trinidadian and Tobagonian | 5 | 0.0% |
| Venezuelan | 2 | 0.0% |
| Welsh | 311 | 0.4% |
| Yugoslavian | 25 | 0.0% | View All 78 Rows |
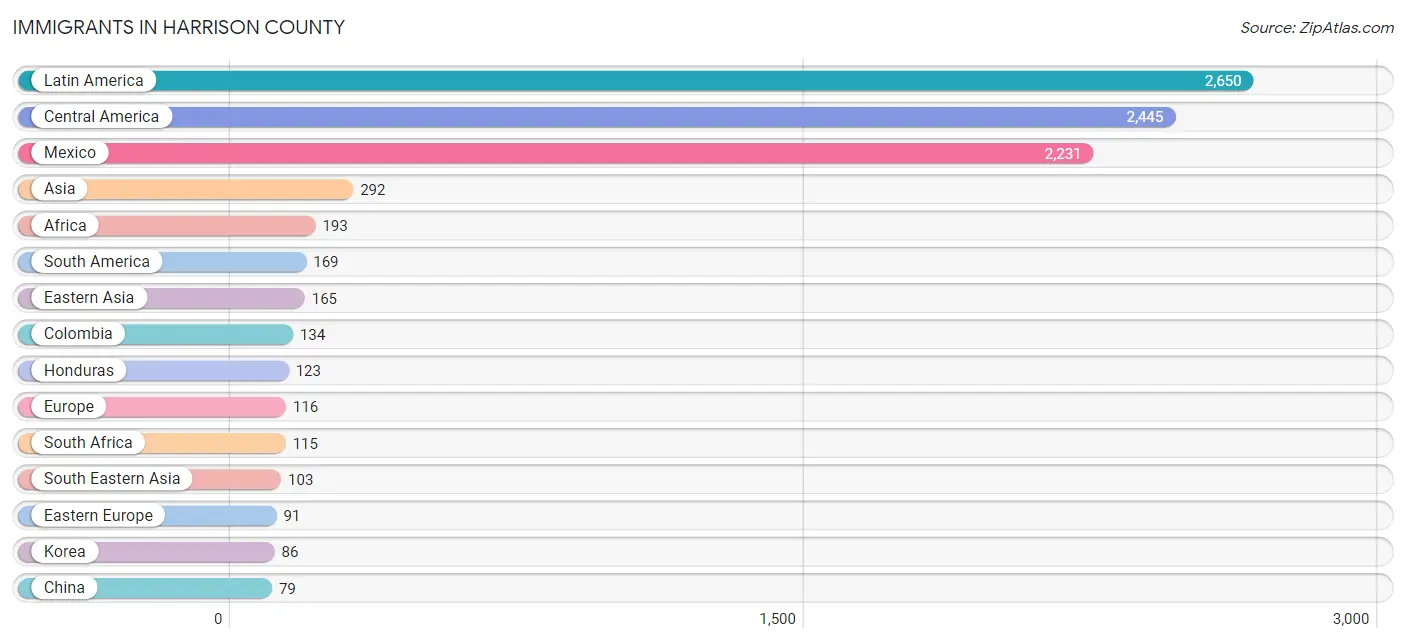
Immigrants in Harrison County
The most numerous immigrant groups reported in Harrison County came from Latin America (2,650 | 3.8%), Central America (2,445 | 3.5%), Mexico (2,231 | 3.2%), Asia (292 | 0.4%), and Africa (193 | 0.3%), together accounting for 11.3% of all Harrison County residents.
| Immigration Origin | # Population | % Population |
| Africa | 193 | 0.3% |
| Argentina | 14 | 0.0% |
| Asia | 292 | 0.4% |
| Belize | 11 | 0.0% |
| Brazil | 5 | 0.0% |
| Canada | 16 | 0.0% |
| Caribbean | 36 | 0.1% |
| Central America | 2,445 | 3.5% |
| China | 79 | 0.1% |
| Colombia | 134 | 0.2% |
| Eastern Africa | 47 | 0.1% |
| Eastern Asia | 165 | 0.2% |
| Eastern Europe | 91 | 0.1% |
| El Salvador | 31 | 0.0% |
| England | 11 | 0.0% |
| Europe | 116 | 0.2% |
| Germany | 3 | 0.0% |
| Guatemala | 49 | 0.1% |
| Honduras | 123 | 0.2% |
| India | 24 | 0.0% |
| Jamaica | 31 | 0.0% |
| Kenya | 11 | 0.0% |
| Korea | 86 | 0.1% |
| Latin America | 2,650 | 3.8% |
| Mexico | 2,231 | 3.2% |
| Netherlands | 11 | 0.0% |
| Nigeria | 31 | 0.0% |
| Northern Europe | 11 | 0.0% |
| Peru | 14 | 0.0% |
| Philippines | 37 | 0.1% |
| Poland | 37 | 0.1% |
| Russia | 54 | 0.1% |
| South Africa | 115 | 0.2% |
| South America | 169 | 0.2% |
| South Central Asia | 24 | 0.0% |
| South Eastern Asia | 103 | 0.2% |
| Taiwan | 39 | 0.1% |
| Thailand | 29 | 0.0% |
| Trinidad and Tobago | 5 | 0.0% |
| Venezuela | 2 | 0.0% |
| Vietnam | 37 | 0.1% |
| Western Africa | 31 | 0.0% |
| Western Europe | 14 | 0.0% | View All 43 Rows |
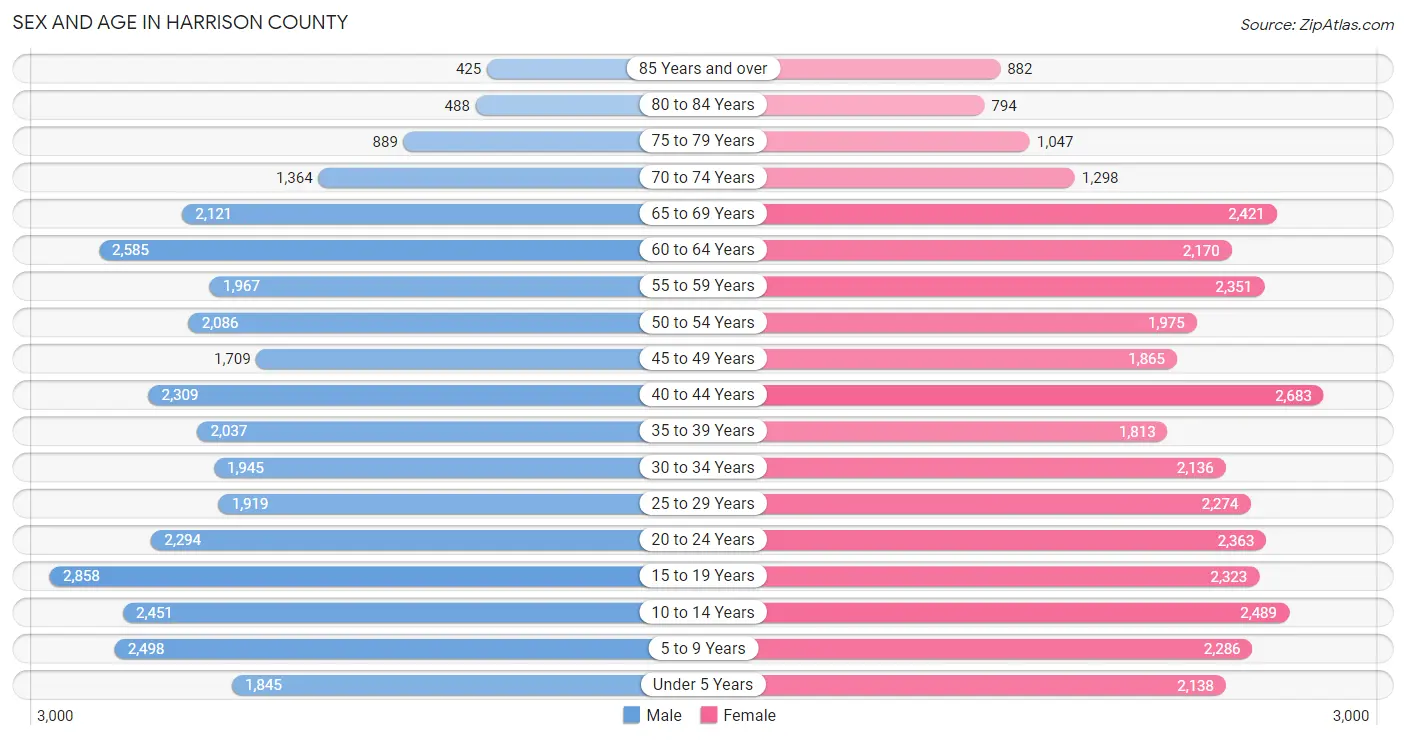
Sex and Age in Harrison County
Sex and Age in Harrison County
The most populous age groups in Harrison County are 15 to 19 Years (2,858 | 8.5%) for men and 40 to 44 Years (2,683 | 7.6%) for women.
| Age Bracket | Male | Female |
| Under 5 Years | 1,845 (5.5%) | 2,138 (6.1%) |
| 5 to 9 Years | 2,498 (7.4%) | 2,286 (6.5%) |
| 10 to 14 Years | 2,451 (7.2%) | 2,489 (7.0%) |
| 15 to 19 Years | 2,858 (8.5%) | 2,323 (6.6%) |
| 20 to 24 Years | 2,294 (6.8%) | 2,363 (6.7%) |
| 25 to 29 Years | 1,919 (5.7%) | 2,274 (6.4%) |
| 30 to 34 Years | 1,945 (5.8%) | 2,136 (6.0%) |
| 35 to 39 Years | 2,037 (6.0%) | 1,813 (5.1%) |
| 40 to 44 Years | 2,309 (6.8%) | 2,683 (7.6%) |
| 45 to 49 Years | 1,709 (5.1%) | 1,865 (5.3%) |
| 50 to 54 Years | 2,086 (6.2%) | 1,975 (5.6%) |
| 55 to 59 Years | 1,967 (5.8%) | 2,351 (6.7%) |
| 60 to 64 Years | 2,585 (7.6%) | 2,170 (6.1%) |
| 65 to 69 Years | 2,121 (6.3%) | 2,421 (6.9%) |
| 70 to 74 Years | 1,364 (4.0%) | 1,298 (3.7%) |
| 75 to 79 Years | 889 (2.6%) | 1,047 (3.0%) |
| 80 to 84 Years | 488 (1.4%) | 794 (2.2%) |
| 85 Years and over | 425 (1.3%) | 882 (2.5%) |
| Total | 33,790 (100.0%) | 35,308 (100.0%) |
Families and Households in Harrison County
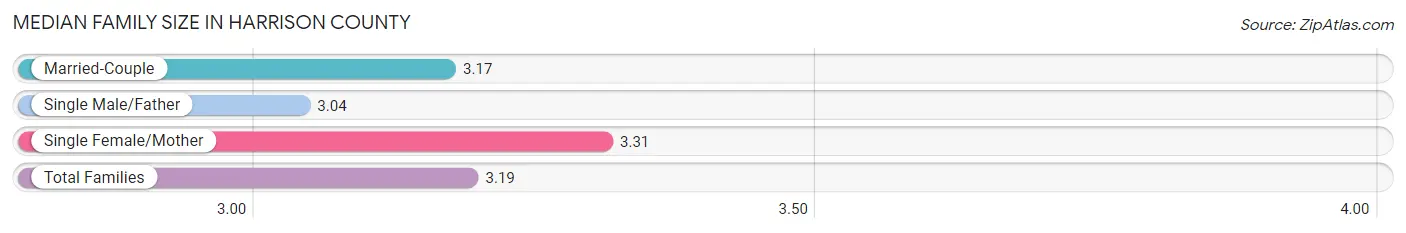
Median Family Size in Harrison County
The median family size in Harrison County is 3.19 persons per family, with single female/mother families (4,022 | 22.4%) accounting for the largest median family size of 3.31 persons per family. On the other hand, single male/father families (1,244 | 6.9%) represent the smallest median family size with 3.04 persons per family.
| Family Type | # Families | Family Size |
| Married-Couple | 12,670 (70.6%) | 3.17 |
| Single Male/Father | 1,244 (6.9%) | 3.04 |
| Single Female/Mother | 4,022 (22.4%) | 3.31 |
| Total Families | 17,936 (100.0%) | 3.19 |
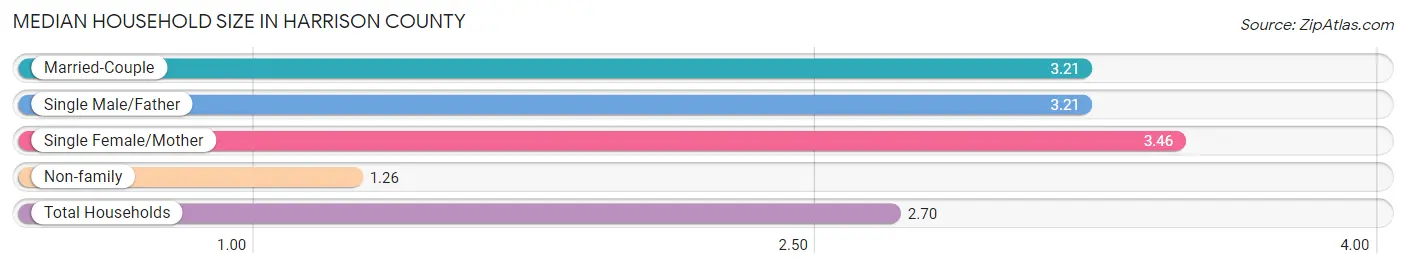
Median Household Size in Harrison County
The median household size in Harrison County is 2.70 persons per household, with single female/mother households (4,022 | 16.1%) accounting for the largest median household size of 3.46 persons per household. non-family households (7,057 | 28.2%) represent the smallest median household size with 1.26 persons per household.
| Household Type | # Households | Household Size |
| Married-Couple | 12,670 (50.7%) | 3.21 |
| Single Male/Father | 1,244 (5.0%) | 3.21 |
| Single Female/Mother | 4,022 (16.1%) | 3.46 |
| Non-family | 7,057 (28.2%) | 1.26 |
| Total Households | 24,993 (100.0%) | 2.70 |
Household Size by Marriage Status in Harrison County
Out of a total of 24,993 households in Harrison County, 17,936 (71.8%) are family households, while 7,057 (28.2%) are nonfamily households. The most numerous type of family households are 2-person households, comprising 8,204, and the most common type of nonfamily households are 1-person households, comprising 6,136.
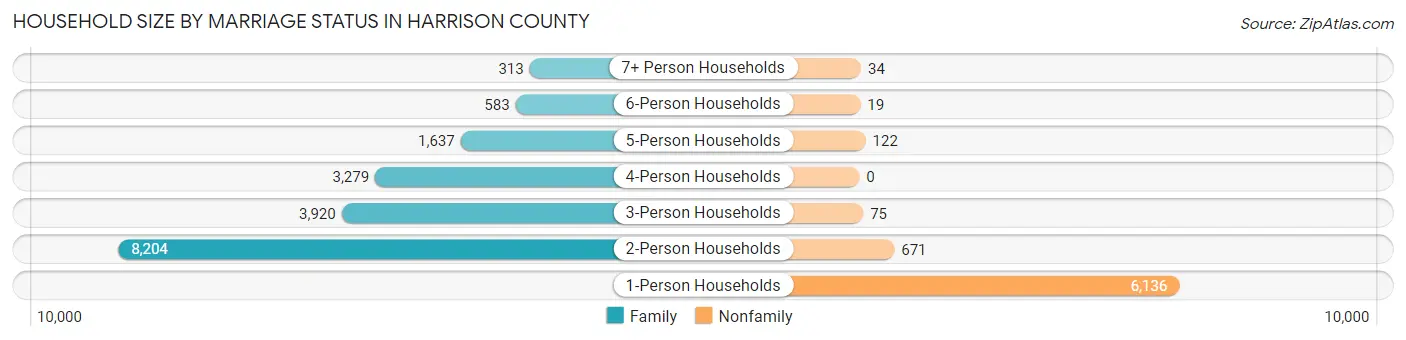
| Household Size | Family Households | Nonfamily Households |
| 1-Person Households | - | 6,136 (24.5%) |
| 2-Person Households | 8,204 (32.8%) | 671 (2.7%) |
| 3-Person Households | 3,920 (15.7%) | 75 (0.3%) |
| 4-Person Households | 3,279 (13.1%) | 0 (0.0%) |
| 5-Person Households | 1,637 (6.6%) | 122 (0.5%) |
| 6-Person Households | 583 (2.3%) | 19 (0.1%) |
| 7+ Person Households | 313 (1.3%) | 34 (0.1%) |
| Total | 17,936 (71.8%) | 7,057 (28.2%) |
Female Fertility in Harrison County
Fertility by Age in Harrison County
Average fertility rate in Harrison County is 42.0 births per 1,000 women. Women in the age bracket of 15 to 19 years have the highest fertility rate with 62.0 births per 1,000 women. Women in the age bracket of 20 to 34 years acount for 56.0% of all women with births.
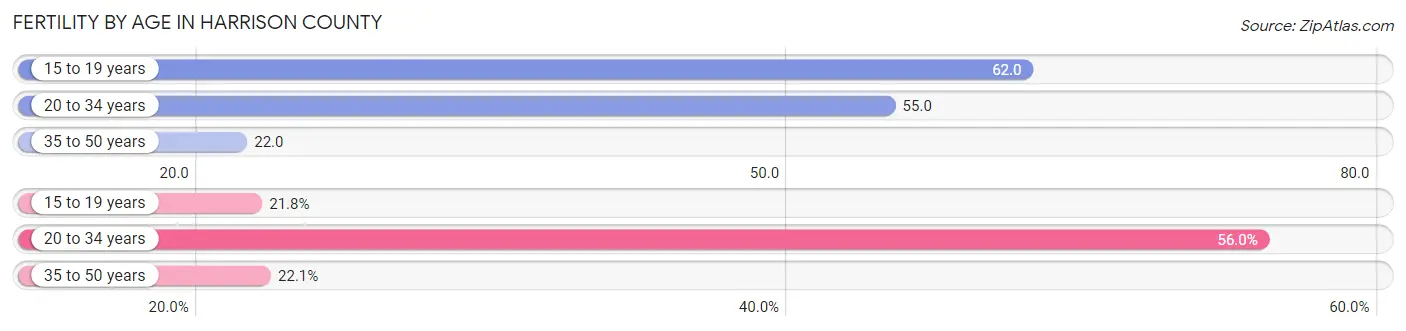
| Age Bracket | Women with Births | Births / 1,000 Women |
| 15 to 19 years | 145 (21.8%) | 62.0 |
| 20 to 34 years | 372 (56.0%) | 55.0 |
| 35 to 50 years | 147 (22.1%) | 22.0 |
| Total | 664 (100.0%) | 42.0 |
Fertility by Age by Marriage Status in Harrison County
51.2% of women with births (664) in Harrison County are married. The highest percentage of unmarried women with births falls into 15 to 19 years age bracket with 100.0% of them unmarried at the time of birth, while the lowest percentage of unmarried women with births belong to 20 to 34 years age bracket with 28.5% of them unmarried.
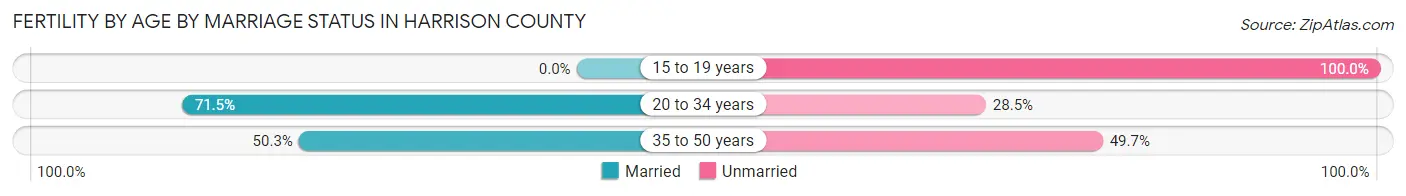
| Age Bracket | Married | Unmarried |
| 15 to 19 years | 0 (0.0%) | 145 (100.0%) |
| 20 to 34 years | 266 (71.5%) | 106 (28.5%) |
| 35 to 50 years | 74 (50.3%) | 73 (49.7%) |
| Total | 340 (51.2%) | 324 (48.8%) |
Fertility by Education in Harrison County
Average fertility rate in Harrison County is 42.0 births per 1,000 women. Women with the education attainment of less than high school have the highest fertility rate of 79.0 births per 1,000 women, while women with the education attainment of college or associate's degree have the lowest fertility at 30.0 births per 1,000 women. Women with the education attainment of less than high school represent 34.2% of all women with births.
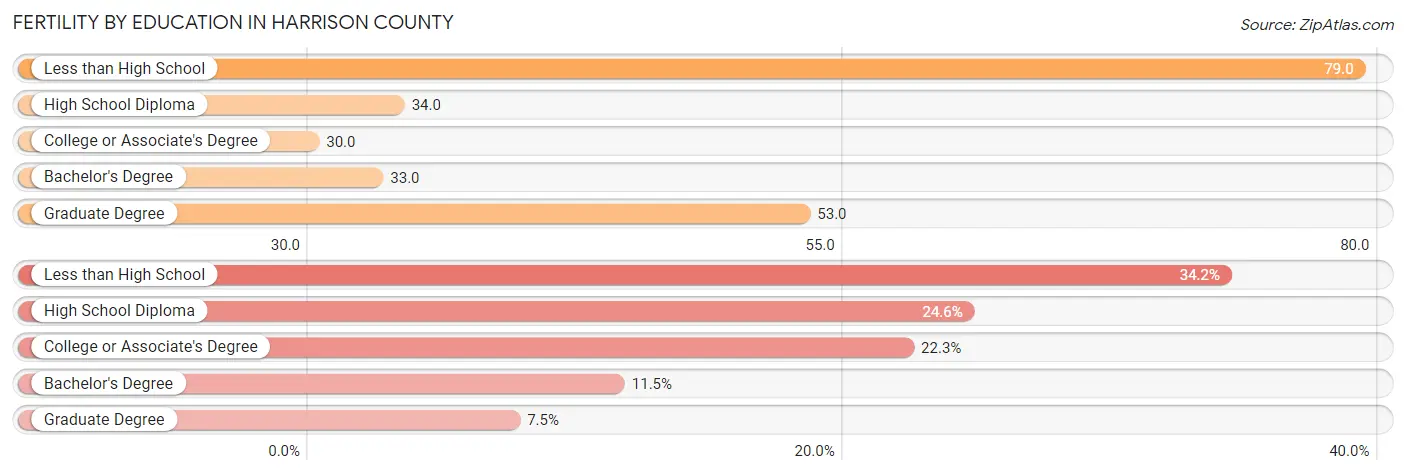
| Educational Attainment | Women with Births | Births / 1,000 Women |
| Less than High School | 227 (34.2%) | 79.0 |
| High School Diploma | 163 (24.5%) | 34.0 |
| College or Associate's Degree | 148 (22.3%) | 30.0 |
| Bachelor's Degree | 76 (11.5%) | 33.0 |
| Graduate Degree | 50 (7.5%) | 53.0 |
| Total | 664 (100.0%) | 42.0 |
Fertility by Education by Marriage Status in Harrison County
48.8% of women with births in Harrison County are unmarried. Women with the educational attainment of graduate degree are most likely to be married with 100.0% of them married at childbirth, while women with the educational attainment of high school diploma are least likely to be married with 84.1% of them unmarried at childbirth.
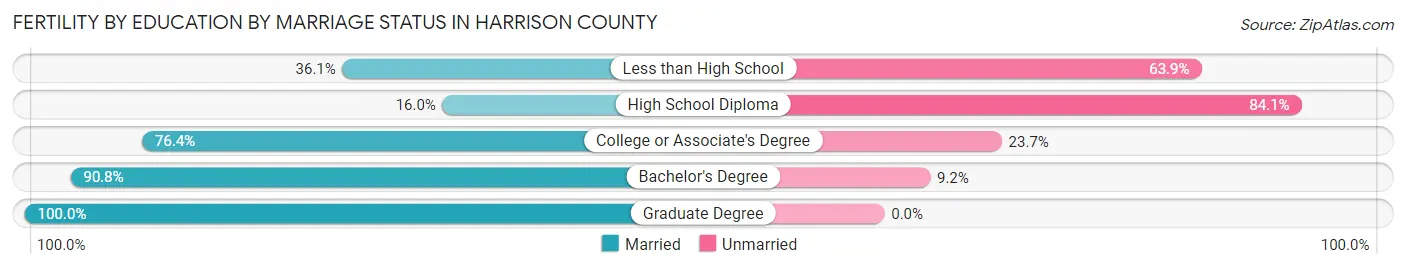
| Educational Attainment | Married | Unmarried |
| Less than High School | 82 (36.1%) | 145 (63.9%) |
| High School Diploma | 26 (16.0%) | 137 (84.1%) |
| College or Associate's Degree | 113 (76.3%) | 35 (23.6%) |
| Bachelor's Degree | 69 (90.8%) | 7 (9.2%) |
| Graduate Degree | 50 (100.0%) | 0 (0.0%) |
| Total | 340 (51.2%) | 324 (48.8%) |
Employment Characteristics in Harrison County
Employment by Class of Employer in Harrison County
Among the 30,667 employed individuals in Harrison County, private company employees (20,706 | 67.5%), not-for-profit organizations (2,677 | 8.7%), and local government employees (2,599 | 8.5%) make up the most common classes of employment.
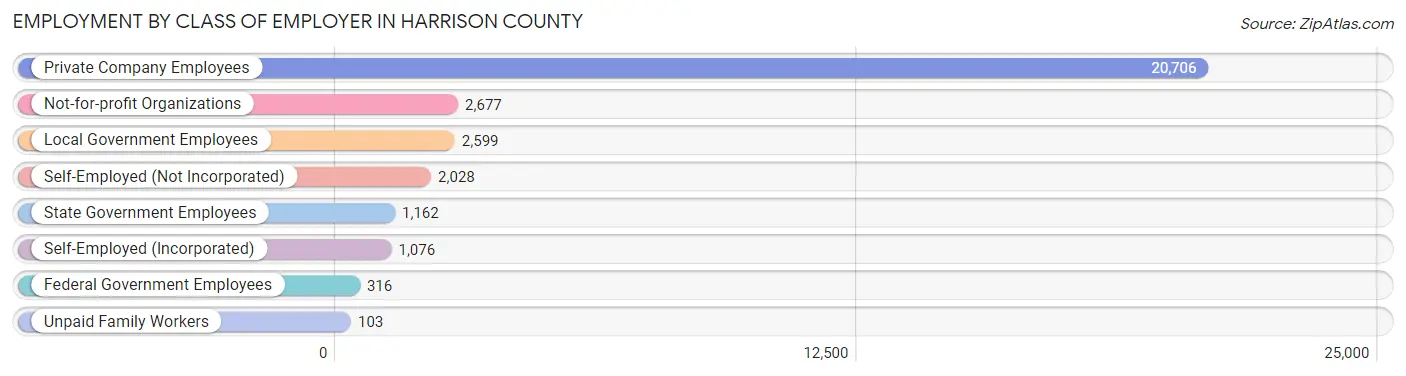
| Employer Class | # Employees | % Employees |
| Private Company Employees | 20,706 | 67.5% |
| Self-Employed (Incorporated) | 1,076 | 3.5% |
| Self-Employed (Not Incorporated) | 2,028 | 6.6% |
| Not-for-profit Organizations | 2,677 | 8.7% |
| Local Government Employees | 2,599 | 8.5% |
| State Government Employees | 1,162 | 3.8% |
| Federal Government Employees | 316 | 1.0% |
| Unpaid Family Workers | 103 | 0.3% |
| Total | 30,667 | 100.0% |
Employment Status by Age in Harrison County
According to the labor force statistics for Harrison County, out of the total population over 16 years of age (54,569), 60.4% or 32,960 individuals are in the labor force, with 6.1% or 2,011 of them unemployed. The age group with the highest labor force participation rate is 20 to 24 years, with 80.7% or 3,758 individuals in the labor force. Within the labor force, the 16 to 19 years age range has the highest percentage of unemployed individuals, with 17.6% or 264 of them being unemployed.
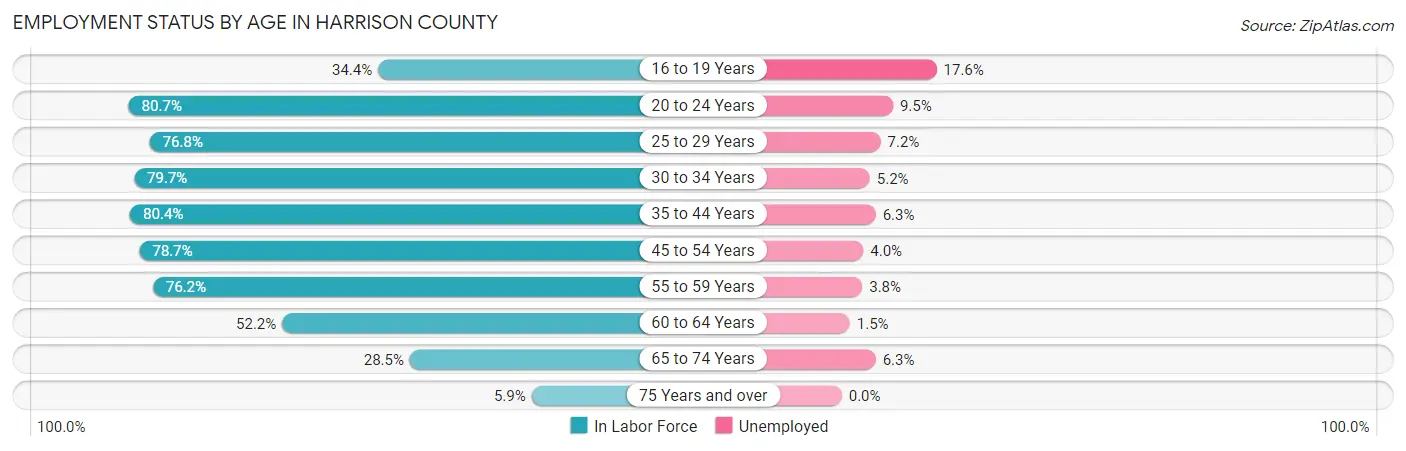
| Age Bracket | In Labor Force | Unemployed |
| 16 to 19 Years | 1,499 (34.4%) | 264 (17.6%) |
| 20 to 24 Years | 3,758 (80.7%) | 357 (9.5%) |
| 25 to 29 Years | 3,220 (76.8%) | 232 (7.2%) |
| 30 to 34 Years | 3,253 (79.7%) | 169 (5.2%) |
| 35 to 44 Years | 7,109 (80.4%) | 448 (6.3%) |
| 45 to 54 Years | 6,009 (78.7%) | 240 (4.0%) |
| 55 to 59 Years | 3,290 (76.2%) | 125 (3.8%) |
| 60 to 64 Years | 2,482 (52.2%) | 37 (1.5%) |
| 65 to 74 Years | 2,053 (28.5%) | 129 (6.3%) |
| 75 Years and over | 267 (5.9%) | 0 (0.0%) |
| Total | 32,960 (60.4%) | 2,011 (6.1%) |
Employment Status by Educational Attainment in Harrison County
According to labor force statistics for Harrison County, 75.0% of individuals (25,368) out of the total population between 25 and 64 years of age (33,824) are in the labor force, with 4.9% or 1,243 of them being unemployed. The group with the highest labor force participation rate are those with the educational attainment of bachelor's degree or higher, with 83.9% or 6,456 individuals in the labor force. Within the labor force, individuals with college / associate degree education have the highest percentage of unemployment, with 8.5% or 770 of them being unemployed.
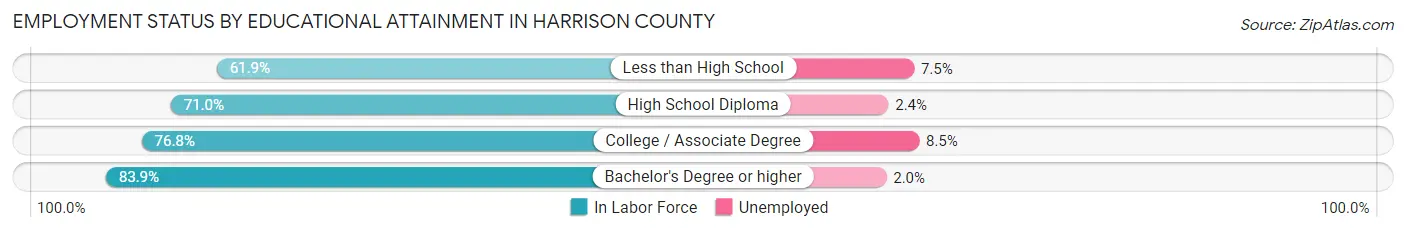
| Educational Attainment | In Labor Force | Unemployed |
| Less than High School | 2,212 (61.9%) | 268 (7.5%) |
| High School Diploma | 7,645 (71.0%) | 258 (2.4%) |
| College / Associate Degree | 9,054 (76.8%) | 1,002 (8.5%) |
| Bachelor's Degree or higher | 6,456 (83.9%) | 154 (2.0%) |
| Total | 25,368 (75.0%) | 1,657 (4.9%) |
Employment Occupations by Sex in Harrison County
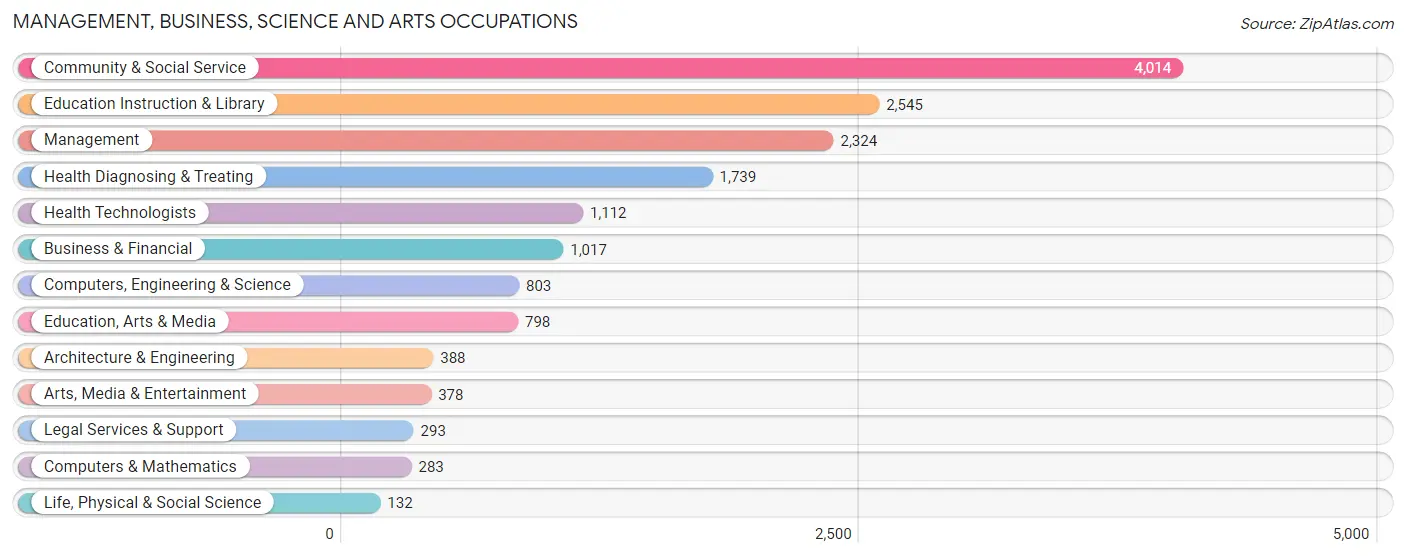
Management, Business, Science and Arts Occupations
The most common Management, Business, Science and Arts occupations in Harrison County are Community & Social Service (4,014 | 13.0%), Education Instruction & Library (2,545 | 8.2%), Management (2,324 | 7.5%), Health Diagnosing & Treating (1,739 | 5.6%), and Health Technologists (1,112 | 3.6%).
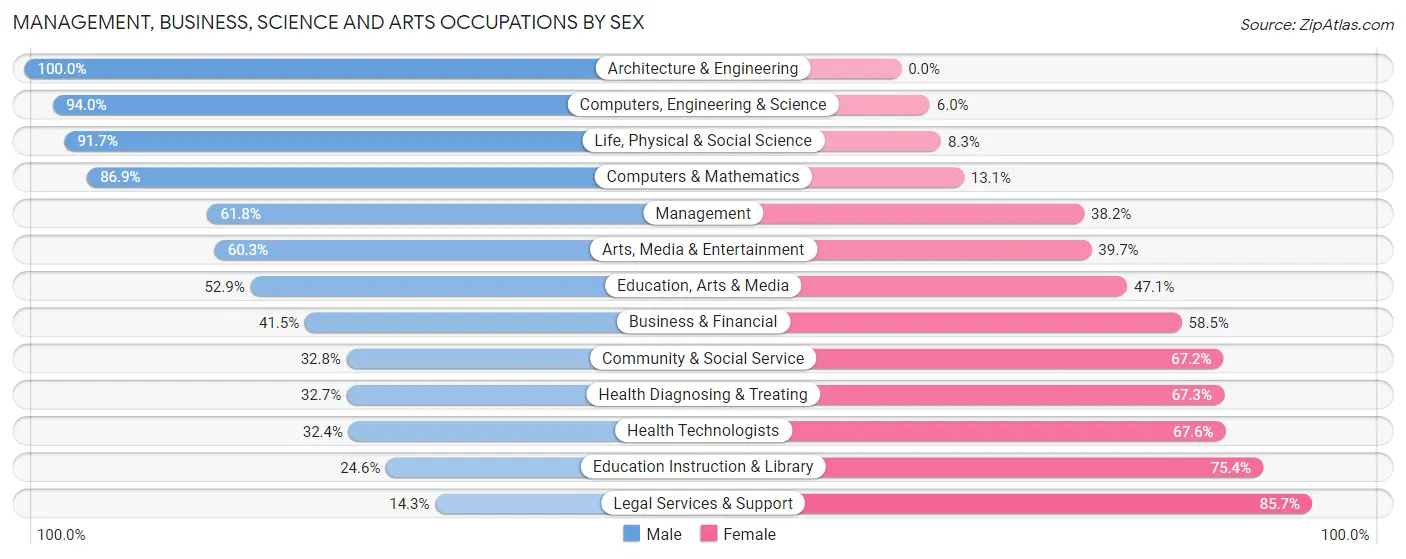
Management, Business, Science and Arts Occupations by Sex
Within the Management, Business, Science and Arts occupations in Harrison County, the most male-oriented occupations are Architecture & Engineering (100.0%), Computers, Engineering & Science (94.0%), and Life, Physical & Social Science (91.7%), while the most female-oriented occupations are Legal Services & Support (85.7%), Education Instruction & Library (75.4%), and Health Technologists (67.6%).
| Occupation | Male | Female |
| Management | 1,437 (61.8%) | 887 (38.2%) |
| Business & Financial | 422 (41.5%) | 595 (58.5%) |
| Computers, Engineering & Science | 755 (94.0%) | 48 (6.0%) |
| Computers & Mathematics | 246 (86.9%) | 37 (13.1%) |
| Architecture & Engineering | 388 (100.0%) | 0 (0.0%) |
| Life, Physical & Social Science | 121 (91.7%) | 11 (8.3%) |
| Community & Social Service | 1,317 (32.8%) | 2,697 (67.2%) |
| Education, Arts & Media | 422 (52.9%) | 376 (47.1%) |
| Legal Services & Support | 42 (14.3%) | 251 (85.7%) |
| Education Instruction & Library | 625 (24.6%) | 1,920 (75.4%) |
| Arts, Media & Entertainment | 228 (60.3%) | 150 (39.7%) |
| Health Diagnosing & Treating | 569 (32.7%) | 1,170 (67.3%) |
| Health Technologists | 360 (32.4%) | 752 (67.6%) |
| Total (Category) | 4,500 (45.5%) | 5,397 (54.5%) |
| Total (Overall) | 16,411 (53.1%) | 14,514 (46.9%) |
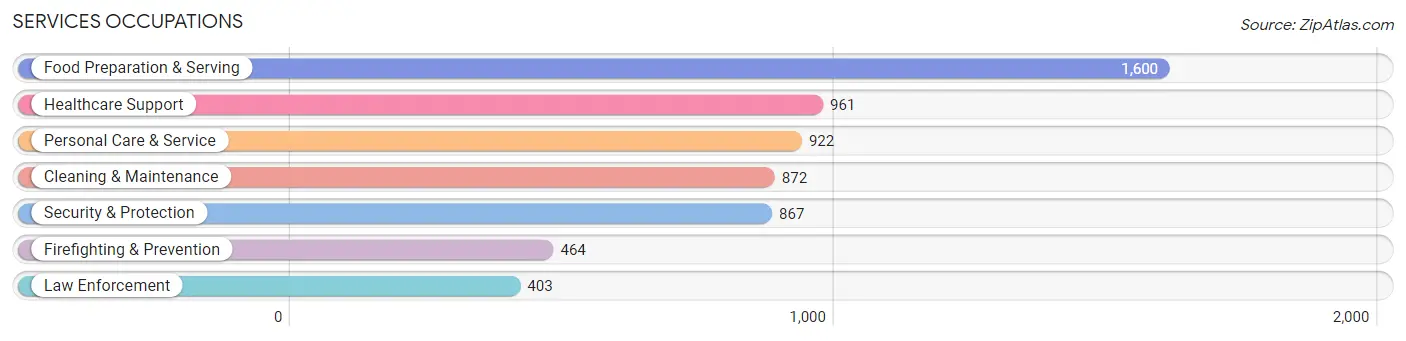
Services Occupations
The most common Services occupations in Harrison County are Food Preparation & Serving (1,600 | 5.2%), Healthcare Support (961 | 3.1%), Personal Care & Service (922 | 3.0%), Cleaning & Maintenance (872 | 2.8%), and Security & Protection (867 | 2.8%).
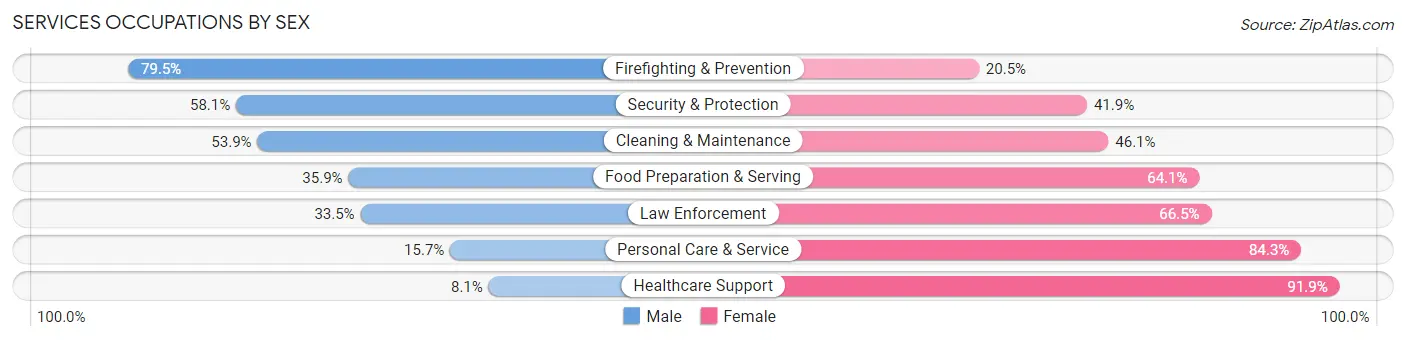
Services Occupations by Sex
Within the Services occupations in Harrison County, the most male-oriented occupations are Firefighting & Prevention (79.5%), Security & Protection (58.1%), and Cleaning & Maintenance (53.9%), while the most female-oriented occupations are Healthcare Support (91.9%), Personal Care & Service (84.3%), and Law Enforcement (66.5%).
| Occupation | Male | Female |
| Healthcare Support | 78 (8.1%) | 883 (91.9%) |
| Security & Protection | 504 (58.1%) | 363 (41.9%) |
| Firefighting & Prevention | 369 (79.5%) | 95 (20.5%) |
| Law Enforcement | 135 (33.5%) | 268 (66.5%) |
| Food Preparation & Serving | 574 (35.9%) | 1,026 (64.1%) |
| Cleaning & Maintenance | 470 (53.9%) | 402 (46.1%) |
| Personal Care & Service | 145 (15.7%) | 777 (84.3%) |
| Total (Category) | 1,771 (33.9%) | 3,451 (66.1%) |
| Total (Overall) | 16,411 (53.1%) | 14,514 (46.9%) |
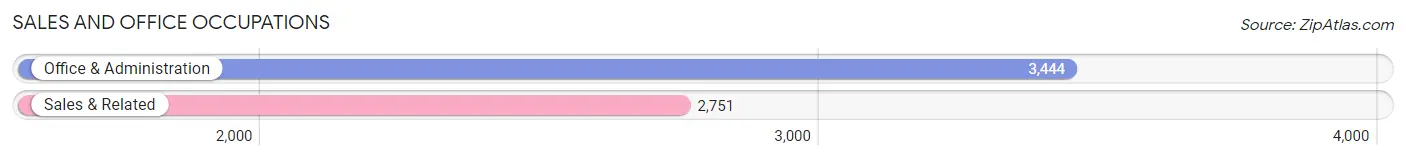
Sales and Office Occupations
The most common Sales and Office occupations in Harrison County are Office & Administration (3,444 | 11.1%), and Sales & Related (2,751 | 8.9%).
Sales and Office Occupations by Sex
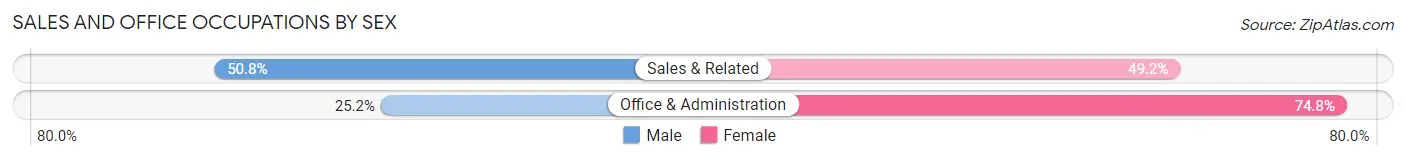
| Occupation | Male | Female |
| Sales & Related | 1,398 (50.8%) | 1,353 (49.2%) |
| Office & Administration | 868 (25.2%) | 2,576 (74.8%) |
| Total (Category) | 2,266 (36.6%) | 3,929 (63.4%) |
| Total (Overall) | 16,411 (53.1%) | 14,514 (46.9%) |
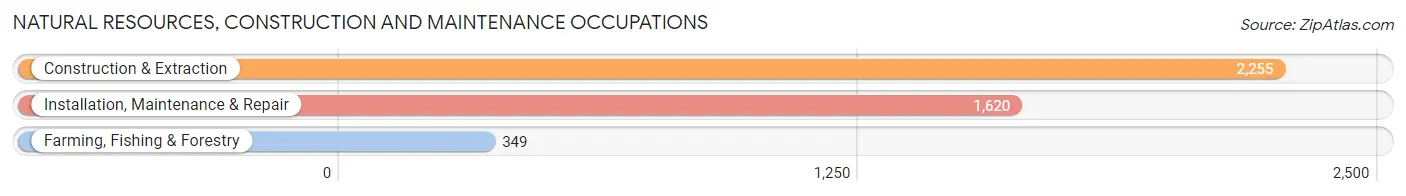
Natural Resources, Construction and Maintenance Occupations
The most common Natural Resources, Construction and Maintenance occupations in Harrison County are Construction & Extraction (2,255 | 7.3%), Installation, Maintenance & Repair (1,620 | 5.2%), and Farming, Fishing & Forestry (349 | 1.1%).
Natural Resources, Construction and Maintenance Occupations by Sex
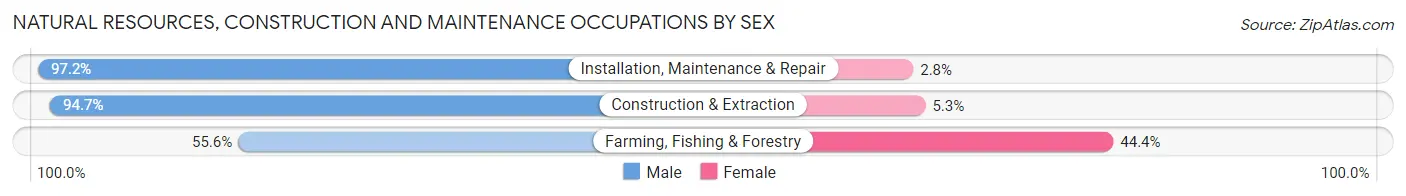
| Occupation | Male | Female |
| Farming, Fishing & Forestry | 194 (55.6%) | 155 (44.4%) |
| Construction & Extraction | 2,135 (94.7%) | 120 (5.3%) |
| Installation, Maintenance & Repair | 1,575 (97.2%) | 45 (2.8%) |
| Total (Category) | 3,904 (92.4%) | 320 (7.6%) |
| Total (Overall) | 16,411 (53.1%) | 14,514 (46.9%) |
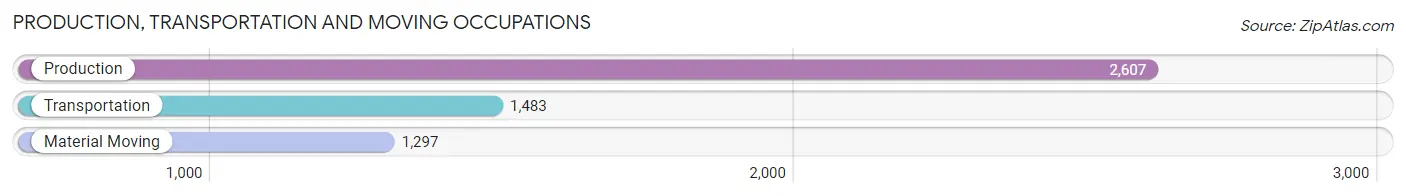
Production, Transportation and Moving Occupations
The most common Production, Transportation and Moving occupations in Harrison County are Production (2,607 | 8.4%), Transportation (1,483 | 4.8%), and Material Moving (1,297 | 4.2%).
Production, Transportation and Moving Occupations by Sex
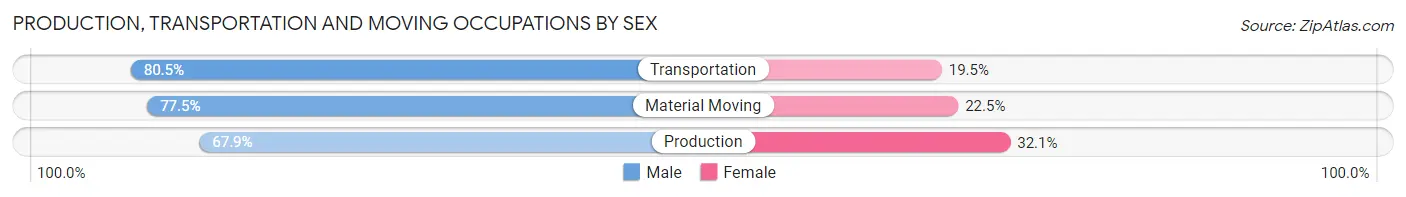
| Occupation | Male | Female |
| Production | 1,771 (67.9%) | 836 (32.1%) |
| Transportation | 1,194 (80.5%) | 289 (19.5%) |
| Material Moving | 1,005 (77.5%) | 292 (22.5%) |
| Total (Category) | 3,970 (73.7%) | 1,417 (26.3%) |
| Total (Overall) | 16,411 (53.1%) | 14,514 (46.9%) |
Employment Industries by Sex in Harrison County
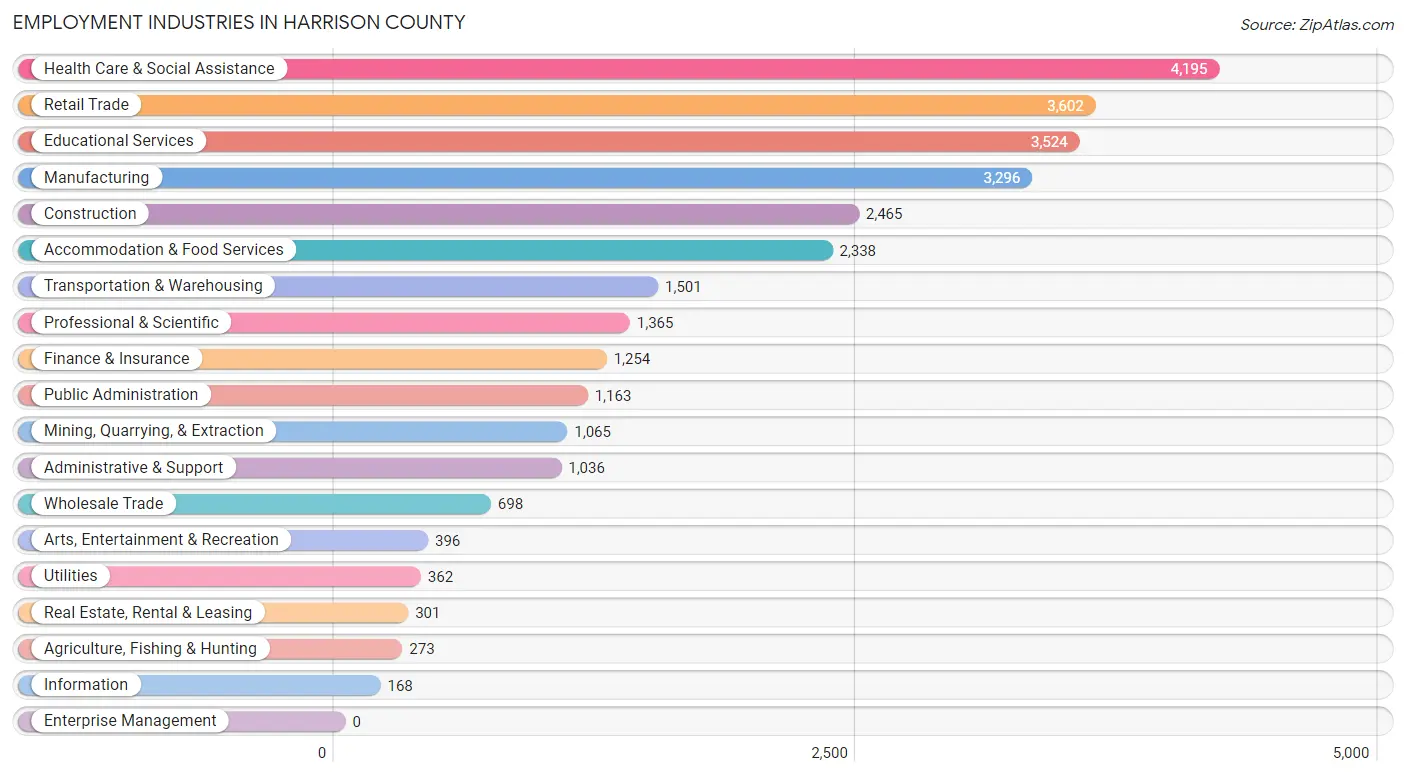
Employment Industries in Harrison County
The major employment industries in Harrison County include Health Care & Social Assistance (4,195 | 13.6%), Retail Trade (3,602 | 11.7%), Educational Services (3,524 | 11.4%), Manufacturing (3,296 | 10.7%), and Construction (2,465 | 8.0%).
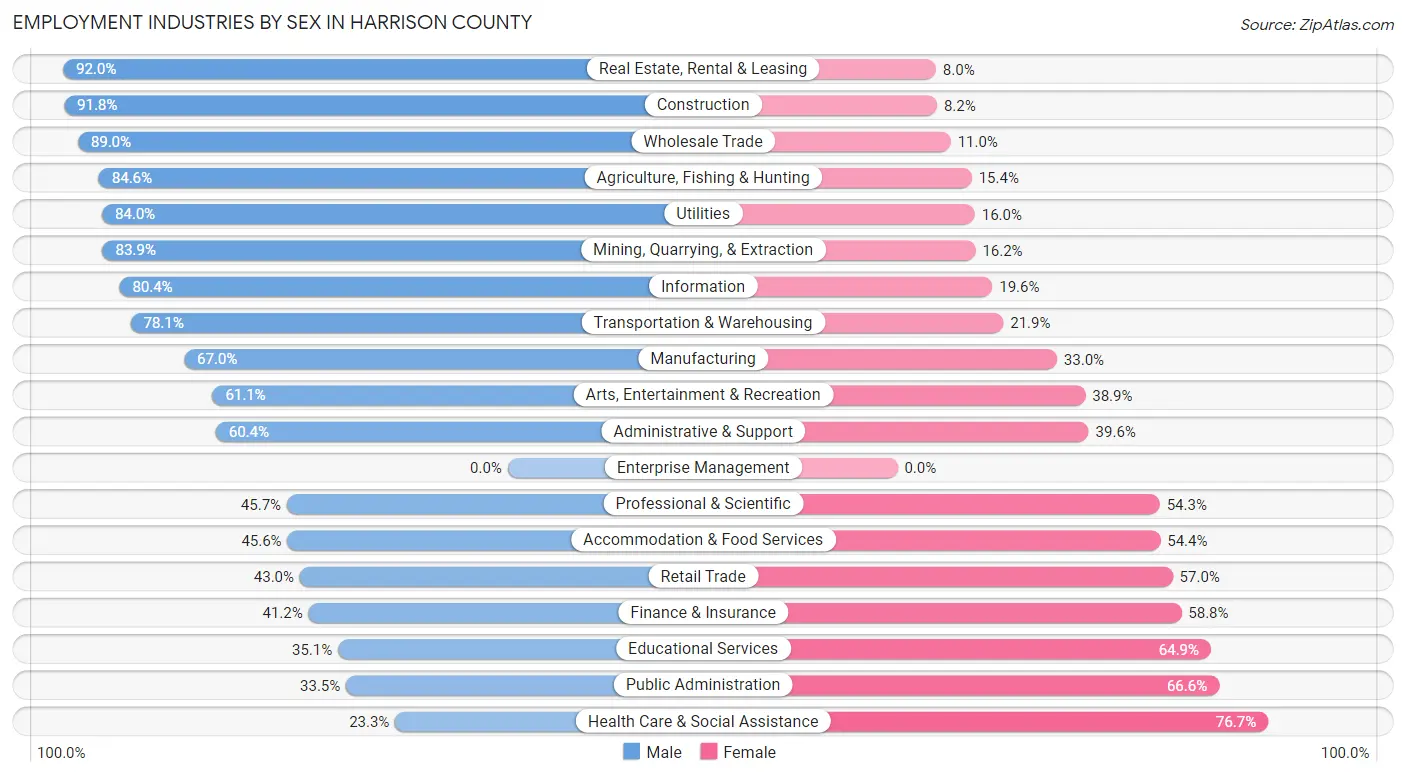
Employment Industries by Sex in Harrison County
The Harrison County industries that see more men than women are Real Estate, Rental & Leasing (92.0%), Construction (91.8%), and Wholesale Trade (89.0%), whereas the industries that tend to have a higher number of women are Health Care & Social Assistance (76.7%), Public Administration (66.5%), and Educational Services (64.9%).
| Industry | Male | Female |
| Agriculture, Fishing & Hunting | 231 (84.6%) | 42 (15.4%) |
| Mining, Quarrying, & Extraction | 893 (83.9%) | 172 (16.2%) |
| Construction | 2,263 (91.8%) | 202 (8.2%) |
| Manufacturing | 2,208 (67.0%) | 1,088 (33.0%) |
| Wholesale Trade | 621 (89.0%) | 77 (11.0%) |
| Retail Trade | 1,550 (43.0%) | 2,052 (57.0%) |
| Transportation & Warehousing | 1,172 (78.1%) | 329 (21.9%) |
| Utilities | 304 (84.0%) | 58 (16.0%) |
| Information | 135 (80.4%) | 33 (19.6%) |
| Finance & Insurance | 517 (41.2%) | 737 (58.8%) |
| Real Estate, Rental & Leasing | 277 (92.0%) | 24 (8.0%) |
| Professional & Scientific | 624 (45.7%) | 741 (54.3%) |
| Enterprise Management | 0 (0.0%) | 0 (0.0%) |
| Administrative & Support | 626 (60.4%) | 410 (39.6%) |
| Educational Services | 1,238 (35.1%) | 2,286 (64.9%) |
| Health Care & Social Assistance | 977 (23.3%) | 3,218 (76.7%) |
| Arts, Entertainment & Recreation | 242 (61.1%) | 154 (38.9%) |
| Accommodation & Food Services | 1,066 (45.6%) | 1,272 (54.4%) |
| Public Administration | 389 (33.5%) | 774 (66.5%) |
| Total | 16,411 (53.1%) | 14,514 (46.9%) |
Education in Harrison County
School Enrollment in Harrison County
The most common levels of schooling among the 16,682 students in Harrison County are high school (4,028 | 24.1%), middle school (3,943 | 23.6%), and elementary school (3,819 | 22.9%).
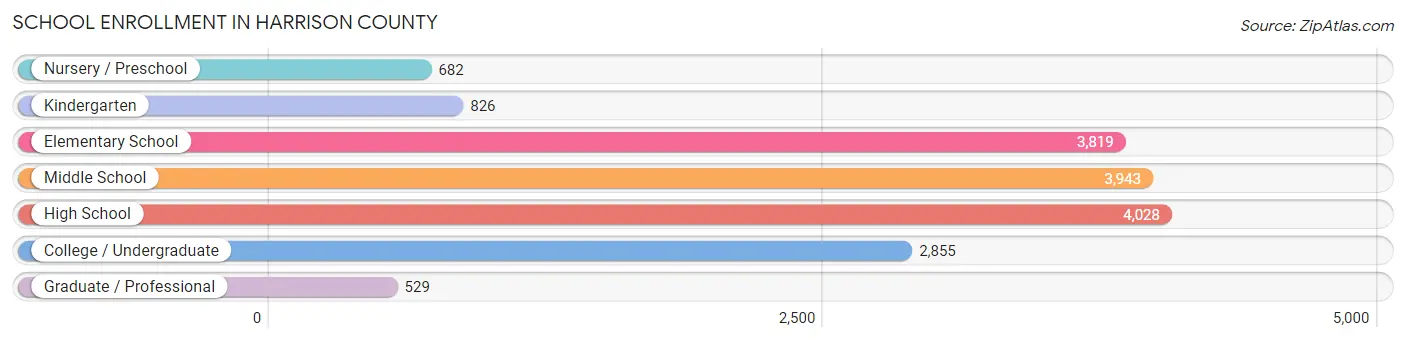
| School Level | # Students | % Students |
| Nursery / Preschool | 682 | 4.1% |
| Kindergarten | 826 | 5.0% |
| Elementary School | 3,819 | 22.9% |
| Middle School | 3,943 | 23.6% |
| High School | 4,028 | 24.1% |
| College / Undergraduate | 2,855 | 17.1% |
| Graduate / Professional | 529 | 3.2% |
| Total | 16,682 | 100.0% |
School Enrollment by Age by Funding Source in Harrison County
Out of a total of 16,682 students who are enrolled in schools in Harrison County, 2,986 (17.9%) attend a private institution, while the remaining 13,696 (82.1%) are enrolled in public schools. The age group of 3 to 4 year olds has the highest likelihood of being enrolled in private schools, with 356 (66.3% in the age bracket) enrolled. Conversely, the age group of 15 to 17 year olds has the lowest likelihood of being enrolled in a private school, with 2,696 (96.1% in the age bracket) attending a public institution.
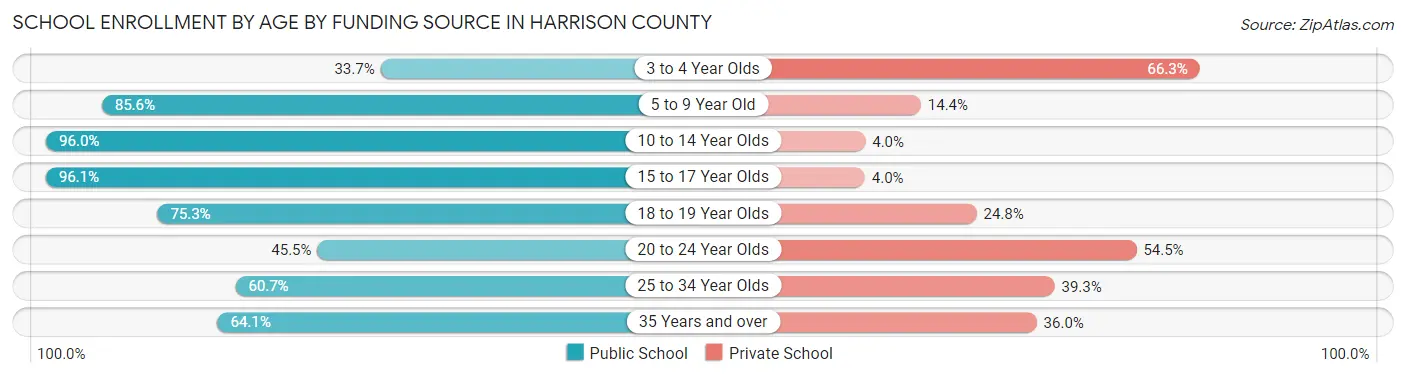
| Age Bracket | Public School | Private School |
| 3 to 4 Year Olds | 181 (33.7%) | 356 (66.3%) |
| 5 to 9 Year Old | 3,906 (85.6%) | 656 (14.4%) |
| 10 to 14 Year Olds | 4,446 (96.0%) | 186 (4.0%) |
| 15 to 17 Year Olds | 2,696 (96.1%) | 111 (4.0%) |
| 18 to 19 Year Olds | 1,046 (75.2%) | 344 (24.7%) |
| 20 to 24 Year Olds | 798 (45.5%) | 957 (54.5%) |
| 25 to 34 Year Olds | 235 (60.7%) | 152 (39.3%) |
| 35 Years and over | 392 (64.0%) | 220 (35.9%) |
| Total | 13,696 (82.1%) | 2,986 (17.9%) |
Educational Attainment by Field of Study in Harrison County
Business (2,320 | 21.6%), education (2,082 | 19.4%), science & technology (894 | 8.3%), bio, nature & agricultural (786 | 7.3%), and engineering (730 | 6.8%) are the most common fields of study among 10,730 individuals in Harrison County who have obtained a bachelor's degree or higher.
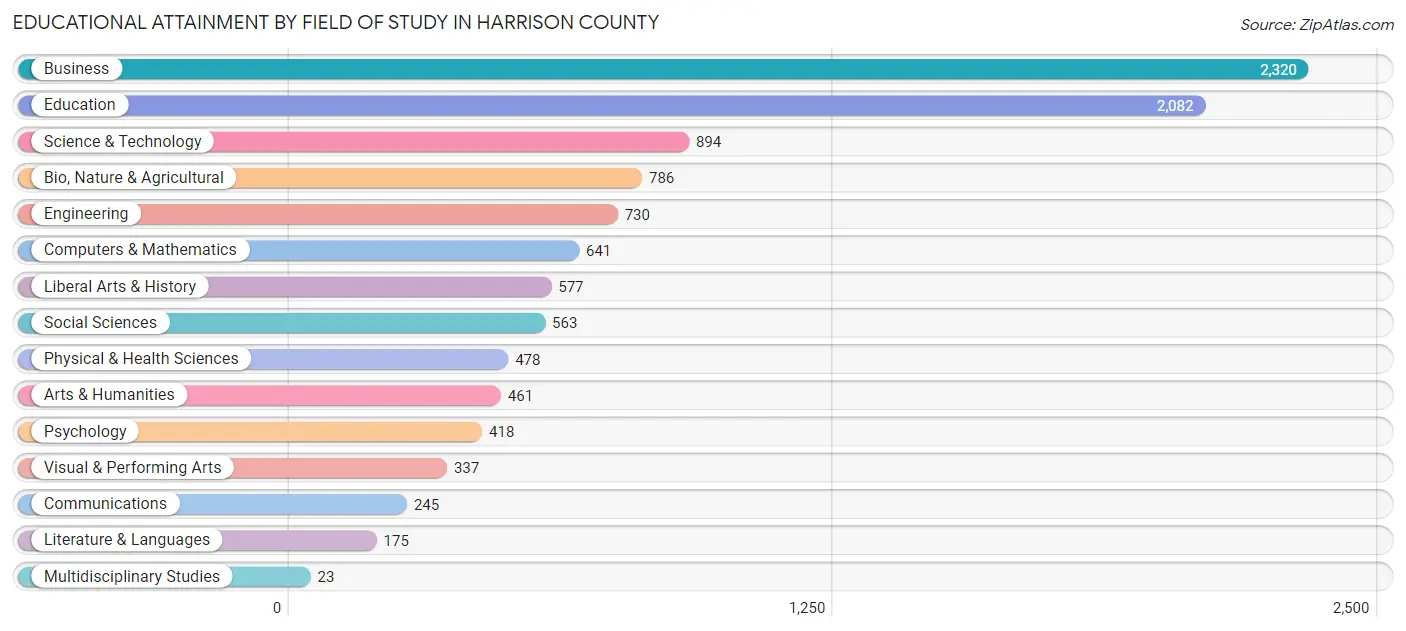
| Field of Study | # Graduates | % Graduates |
| Computers & Mathematics | 641 | 6.0% |
| Bio, Nature & Agricultural | 786 | 7.3% |
| Physical & Health Sciences | 478 | 4.4% |
| Psychology | 418 | 3.9% |
| Social Sciences | 563 | 5.2% |
| Engineering | 730 | 6.8% |
| Multidisciplinary Studies | 23 | 0.2% |
| Science & Technology | 894 | 8.3% |
| Business | 2,320 | 21.6% |
| Education | 2,082 | 19.4% |
| Literature & Languages | 175 | 1.6% |
| Liberal Arts & History | 577 | 5.4% |
| Visual & Performing Arts | 337 | 3.1% |
| Communications | 245 | 2.3% |
| Arts & Humanities | 461 | 4.3% |
| Total | 10,730 | 100.0% |
Transportation & Commute in Harrison County
Vehicle Availability by Sex in Harrison County
The most prevalent vehicle ownership categories in Harrison County are males with 2 vehicles (6,821, accounting for 42.1%) and females with 2 vehicles (5,276, making up 48.5%).
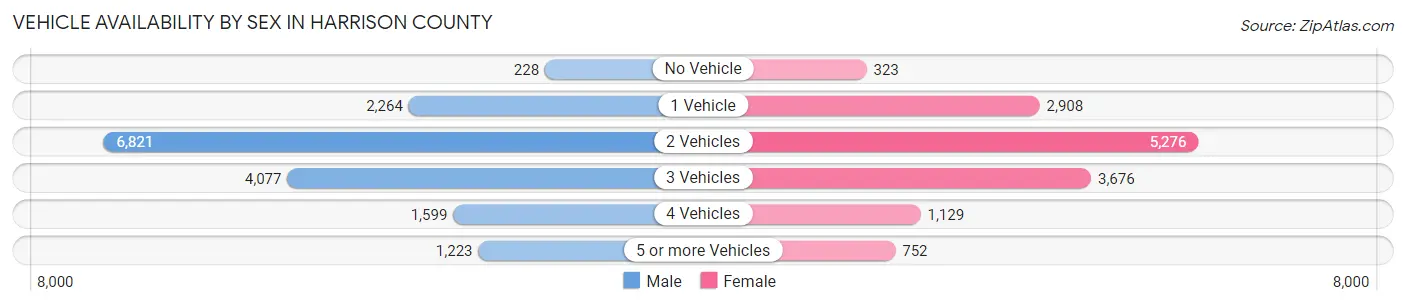
| Vehicles Available | Male | Female |
| No Vehicle | 228 (1.4%) | 323 (2.3%) |
| 1 Vehicle | 2,264 (14.0%) | 2,908 (20.7%) |
| 2 Vehicles | 6,821 (42.1%) | 5,276 (37.5%) |
| 3 Vehicles | 4,077 (25.2%) | 3,676 (26.1%) |
| 4 Vehicles | 1,599 (9.9%) | 1,129 (8.0%) |
| 5 or more Vehicles | 1,223 (7.5%) | 752 (5.3%) |
| Total | 16,212 (100.0%) | 14,064 (100.0%) |
Commute Time in Harrison County
The most frequently occuring commute durations in Harrison County are 20 to 24 minutes (5,234 commuters, 18.2%), 15 to 19 minutes (4,679 commuters, 16.2%), and 10 to 14 minutes (4,625 commuters, 16.0%).
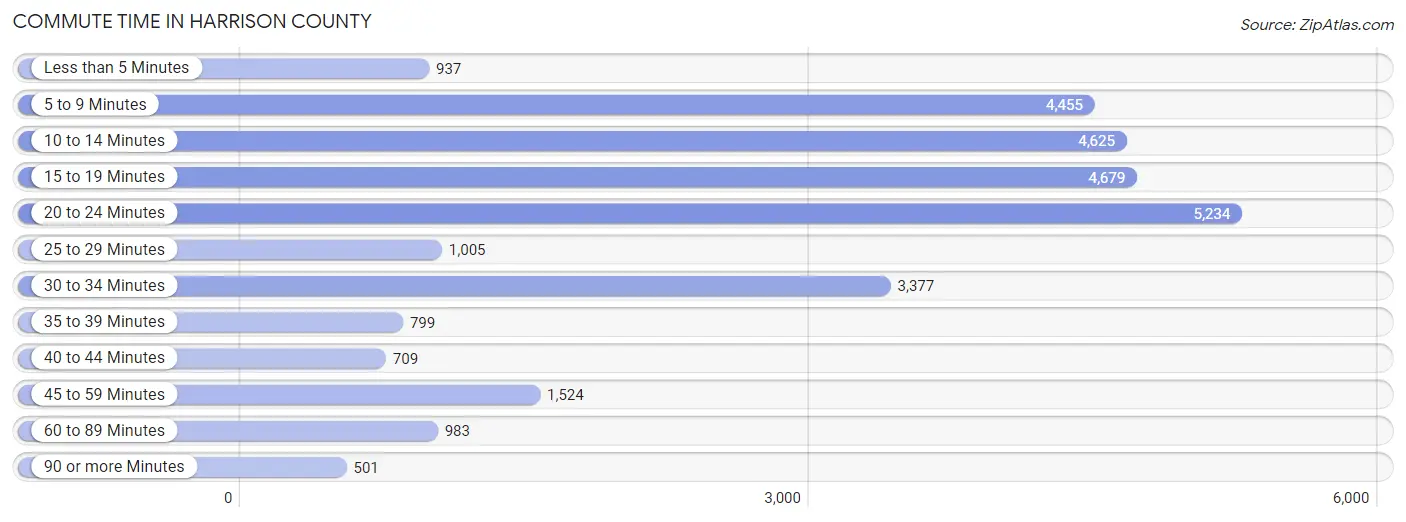
| Commute Time | # Commuters | % Commuters |
| Less than 5 Minutes | 937 | 3.3% |
| 5 to 9 Minutes | 4,455 | 15.4% |
| 10 to 14 Minutes | 4,625 | 16.0% |
| 15 to 19 Minutes | 4,679 | 16.2% |
| 20 to 24 Minutes | 5,234 | 18.2% |
| 25 to 29 Minutes | 1,005 | 3.5% |
| 30 to 34 Minutes | 3,377 | 11.7% |
| 35 to 39 Minutes | 799 | 2.8% |
| 40 to 44 Minutes | 709 | 2.5% |
| 45 to 59 Minutes | 1,524 | 5.3% |
| 60 to 89 Minutes | 983 | 3.4% |
| 90 or more Minutes | 501 | 1.7% |
Commute Time by Sex in Harrison County
The most common commute times in Harrison County are 20 to 24 minutes (2,578 commuters, 16.7%) for males and 20 to 24 minutes (2,656 commuters, 19.8%) for females.
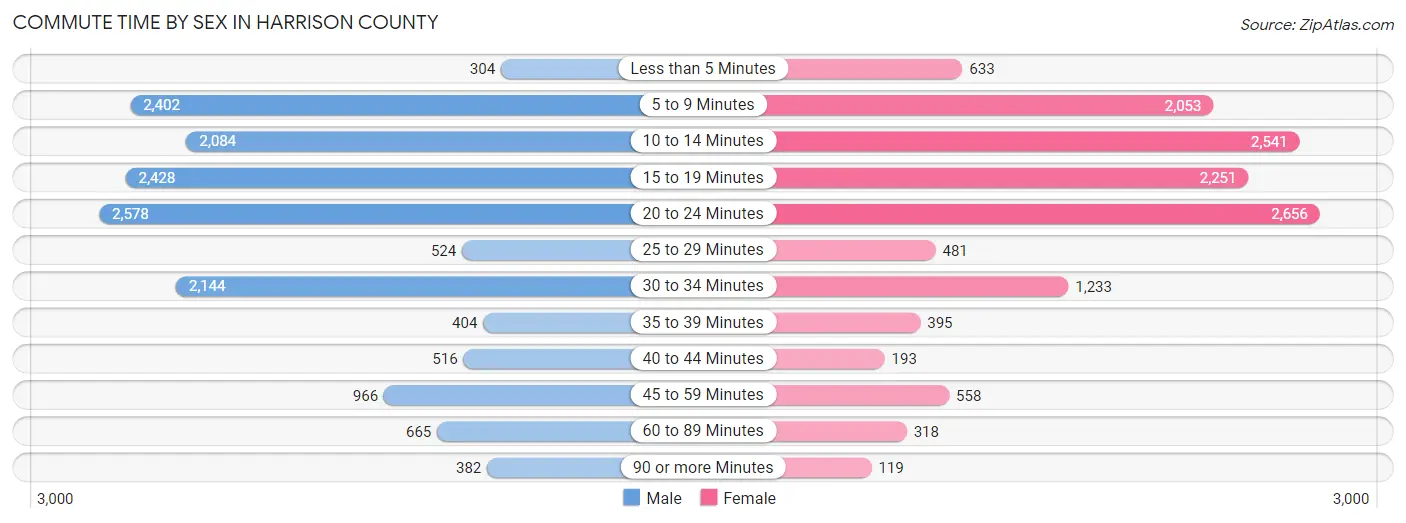
| Commute Time | Male | Female |
| Less than 5 Minutes | 304 (2.0%) | 633 (4.7%) |
| 5 to 9 Minutes | 2,402 (15.6%) | 2,053 (15.3%) |
| 10 to 14 Minutes | 2,084 (13.5%) | 2,541 (18.9%) |
| 15 to 19 Minutes | 2,428 (15.8%) | 2,251 (16.8%) |
| 20 to 24 Minutes | 2,578 (16.7%) | 2,656 (19.8%) |
| 25 to 29 Minutes | 524 (3.4%) | 481 (3.6%) |
| 30 to 34 Minutes | 2,144 (13.9%) | 1,233 (9.2%) |
| 35 to 39 Minutes | 404 (2.6%) | 395 (2.9%) |
| 40 to 44 Minutes | 516 (3.4%) | 193 (1.4%) |
| 45 to 59 Minutes | 966 (6.3%) | 558 (4.2%) |
| 60 to 89 Minutes | 665 (4.3%) | 318 (2.4%) |
| 90 or more Minutes | 382 (2.5%) | 119 (0.9%) |
Time of Departure to Work by Sex in Harrison County
The most frequent times of departure to work in Harrison County are 7:00 AM to 7:29 AM (1,875, 12.2%) for males and 7:00 AM to 7:29 AM (2,156, 16.1%) for females.
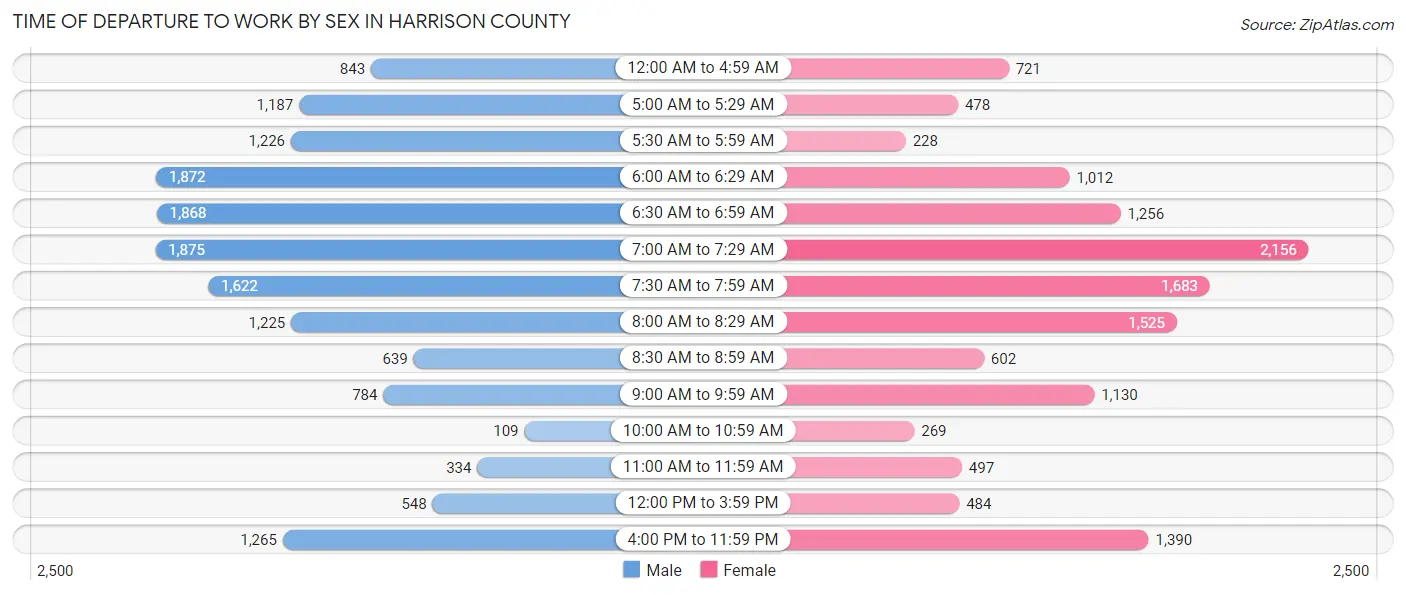
| Time of Departure | Male | Female |
| 12:00 AM to 4:59 AM | 843 (5.5%) | 721 (5.4%) |
| 5:00 AM to 5:29 AM | 1,187 (7.7%) | 478 (3.6%) |
| 5:30 AM to 5:59 AM | 1,226 (8.0%) | 228 (1.7%) |
| 6:00 AM to 6:29 AM | 1,872 (12.2%) | 1,012 (7.5%) |
| 6:30 AM to 6:59 AM | 1,868 (12.1%) | 1,256 (9.3%) |
| 7:00 AM to 7:29 AM | 1,875 (12.2%) | 2,156 (16.1%) |
| 7:30 AM to 7:59 AM | 1,622 (10.5%) | 1,683 (12.5%) |
| 8:00 AM to 8:29 AM | 1,225 (8.0%) | 1,525 (11.4%) |
| 8:30 AM to 8:59 AM | 639 (4.2%) | 602 (4.5%) |
| 9:00 AM to 9:59 AM | 784 (5.1%) | 1,130 (8.4%) |
| 10:00 AM to 10:59 AM | 109 (0.7%) | 269 (2.0%) |
| 11:00 AM to 11:59 AM | 334 (2.2%) | 497 (3.7%) |
| 12:00 PM to 3:59 PM | 548 (3.6%) | 484 (3.6%) |
| 4:00 PM to 11:59 PM | 1,265 (8.2%) | 1,390 (10.3%) |
| Total | 15,397 (100.0%) | 13,431 (100.0%) |
Housing Occupancy in Harrison County
Occupancy by Ownership in Harrison County
Of the total 24,993 dwellings in Harrison County, owner-occupied units account for 18,494 (74.0%), while renter-occupied units make up 6,499 (26.0%).
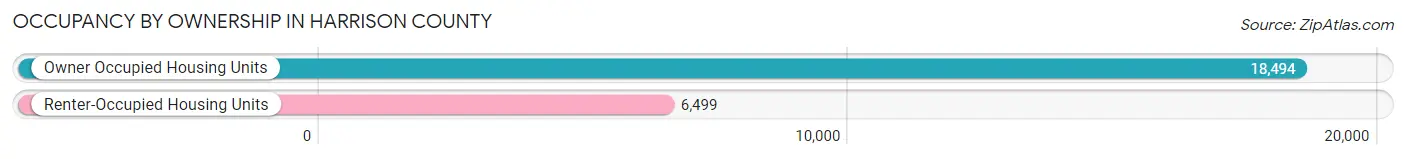
| Occupancy | # Housing Units | % Housing Units |
| Owner Occupied Housing Units | 18,494 | 74.0% |
| Renter-Occupied Housing Units | 6,499 | 26.0% |
| Total Occupied Housing Units | 24,993 | 100.0% |
Occupancy by Household Size in Harrison County
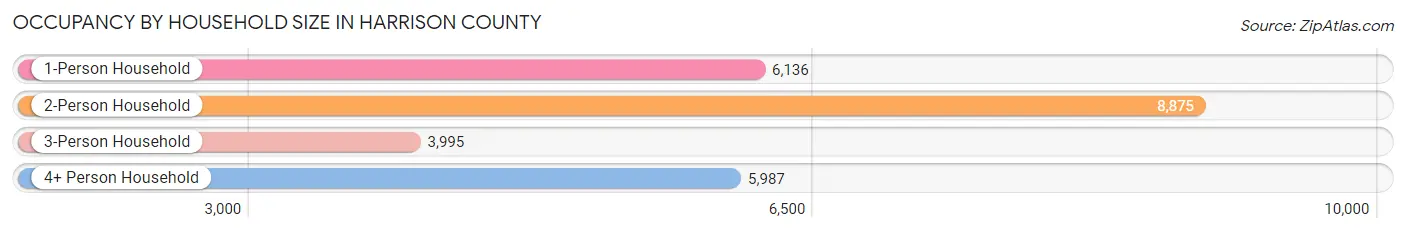
| Household Size | # Housing Units | % Housing Units |
| 1-Person Household | 6,136 | 24.5% |
| 2-Person Household | 8,875 | 35.5% |
| 3-Person Household | 3,995 | 16.0% |
| 4+ Person Household | 5,987 | 23.9% |
| Total Housing Units | 24,993 | 100.0% |
Occupancy by Ownership by Household Size in Harrison County
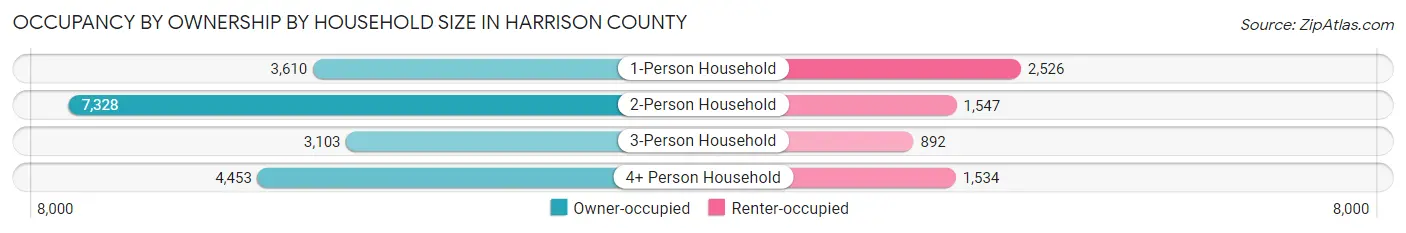
| Household Size | Owner-occupied | Renter-occupied |
| 1-Person Household | 3,610 (58.8%) | 2,526 (41.2%) |
| 2-Person Household | 7,328 (82.6%) | 1,547 (17.4%) |
| 3-Person Household | 3,103 (77.7%) | 892 (22.3%) |
| 4+ Person Household | 4,453 (74.4%) | 1,534 (25.6%) |
| Total Housing Units | 18,494 (74.0%) | 6,499 (26.0%) |
Occupancy by Educational Attainment in Harrison County
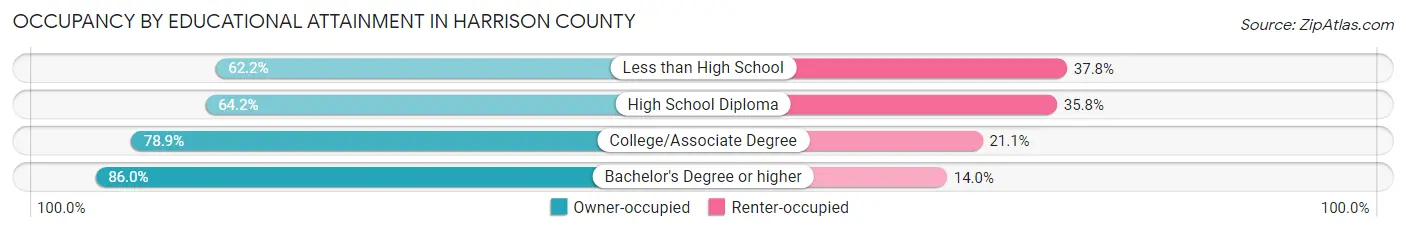
| Household Size | Owner-occupied | Renter-occupied |
| Less than High School | 1,722 (62.2%) | 1,047 (37.8%) |
| High School Diploma | 5,049 (64.2%) | 2,817 (35.8%) |
| College/Associate Degree | 6,975 (78.9%) | 1,862 (21.1%) |
| Bachelor's Degree or higher | 4,748 (86.0%) | 773 (14.0%) |
Occupancy by Age of Householder in Harrison County
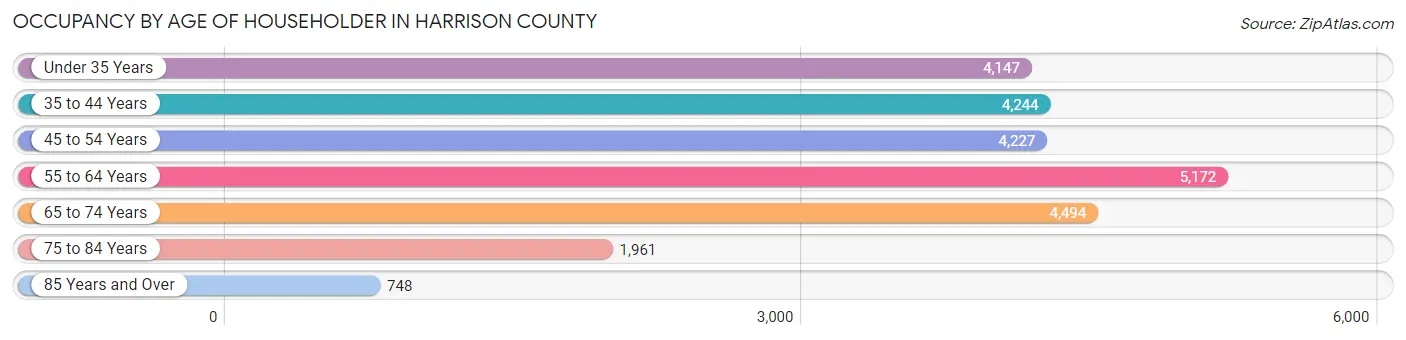
| Age Bracket | # Households | % Households |
| Under 35 Years | 4,147 | 16.6% |
| 35 to 44 Years | 4,244 | 17.0% |
| 45 to 54 Years | 4,227 | 16.9% |
| 55 to 64 Years | 5,172 | 20.7% |
| 65 to 74 Years | 4,494 | 18.0% |
| 75 to 84 Years | 1,961 | 7.9% |
| 85 Years and Over | 748 | 3.0% |
| Total | 24,993 | 100.0% |
Housing Finances in Harrison County
Median Income by Occupancy in Harrison County
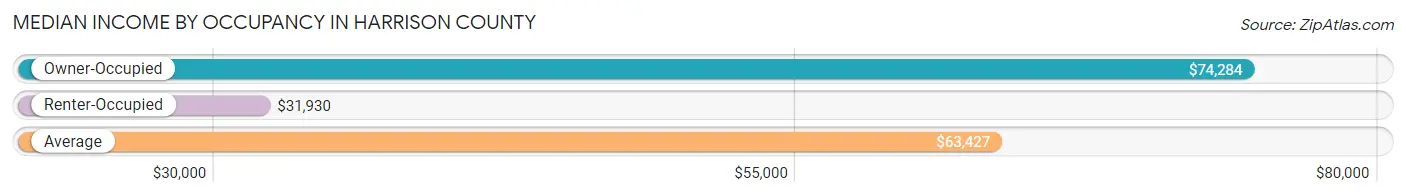
| Occupancy Type | # Households | Median Income |
| Owner-Occupied | 18,494 (74.0%) | $74,284 |
| Renter-Occupied | 6,499 (26.0%) | $31,930 |
| Average | 24,993 (100.0%) | $63,427 |
Occupancy by Householder Income Bracket in Harrison County
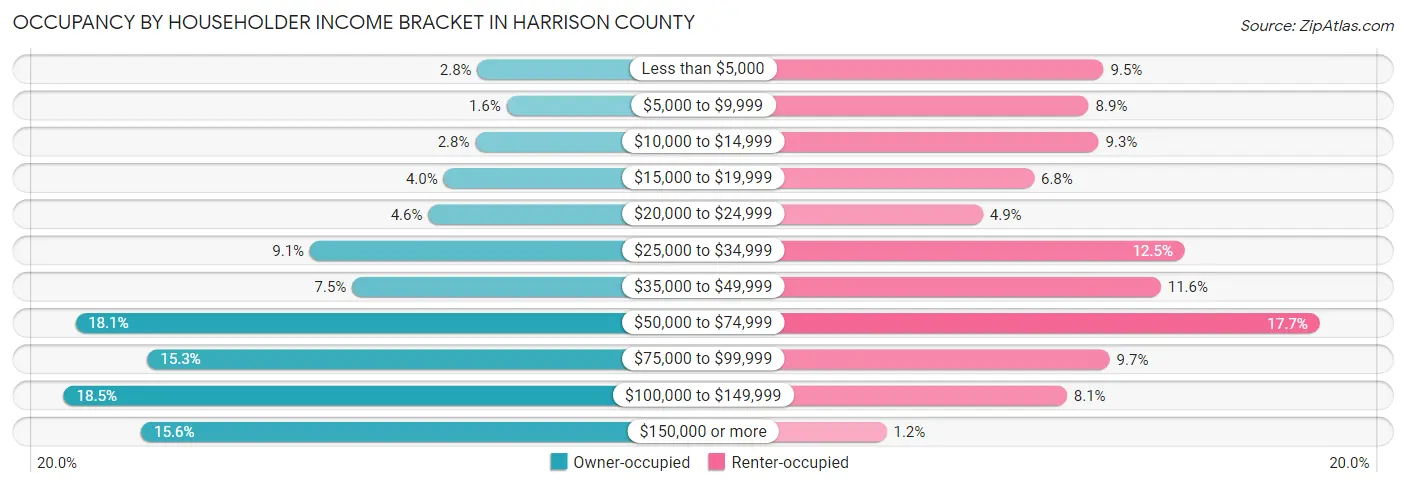
| Income Bracket | Owner-occupied | Renter-occupied |
| Less than $5,000 | 508 (2.8%) | 614 (9.5%) |
| $5,000 to $9,999 | 304 (1.6%) | 577 (8.9%) |
| $10,000 to $14,999 | 524 (2.8%) | 602 (9.3%) |
| $15,000 to $19,999 | 748 (4.0%) | 442 (6.8%) |
| $20,000 to $24,999 | 855 (4.6%) | 315 (4.9%) |
| $25,000 to $34,999 | 1,689 (9.1%) | 815 (12.5%) |
| $35,000 to $49,999 | 1,390 (7.5%) | 756 (11.6%) |
| $50,000 to $74,999 | 3,341 (18.1%) | 1,149 (17.7%) |
| $75,000 to $99,999 | 2,833 (15.3%) | 629 (9.7%) |
| $100,000 to $149,999 | 3,424 (18.5%) | 523 (8.1%) |
| $150,000 or more | 2,878 (15.6%) | 77 (1.2%) |
| Total | 18,494 (100.0%) | 6,499 (100.0%) |
Monthly Housing Cost Tiers in Harrison County
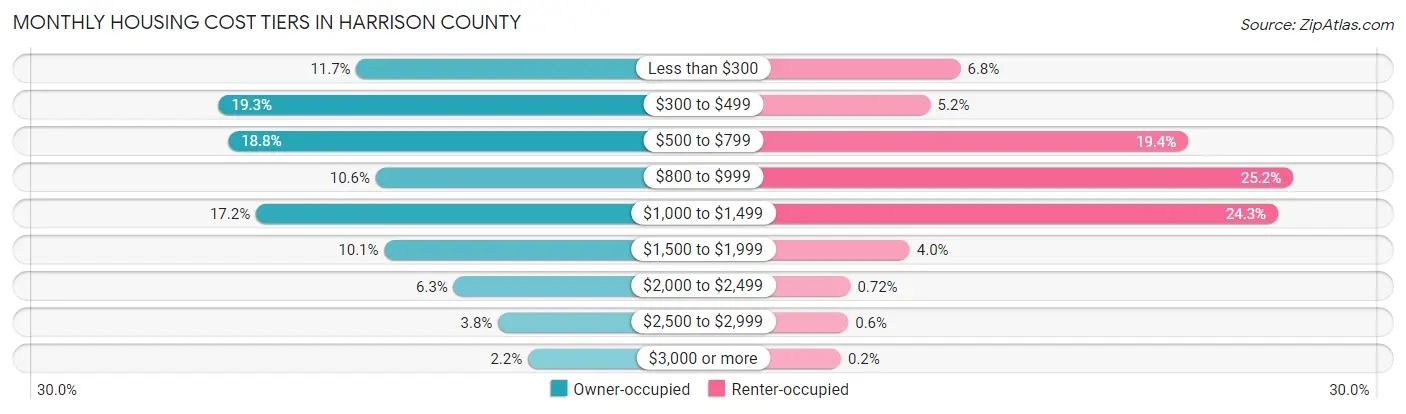
| Monthly Cost | Owner-occupied | Renter-occupied |
| Less than $300 | 2,159 (11.7%) | 442 (6.8%) |
| $300 to $499 | 3,566 (19.3%) | 335 (5.1%) |
| $500 to $799 | 3,468 (18.8%) | 1,259 (19.4%) |
| $800 to $999 | 1,961 (10.6%) | 1,636 (25.2%) |
| $1,000 to $1,499 | 3,184 (17.2%) | 1,581 (24.3%) |
| $1,500 to $1,999 | 1,874 (10.1%) | 260 (4.0%) |
| $2,000 to $2,499 | 1,166 (6.3%) | 47 (0.7%) |
| $2,500 to $2,999 | 711 (3.8%) | 39 (0.6%) |
| $3,000 or more | 405 (2.2%) | 13 (0.2%) |
| Total | 18,494 (100.0%) | 6,499 (100.0%) |
Physical Housing Characteristics in Harrison County
Housing Structures in Harrison County
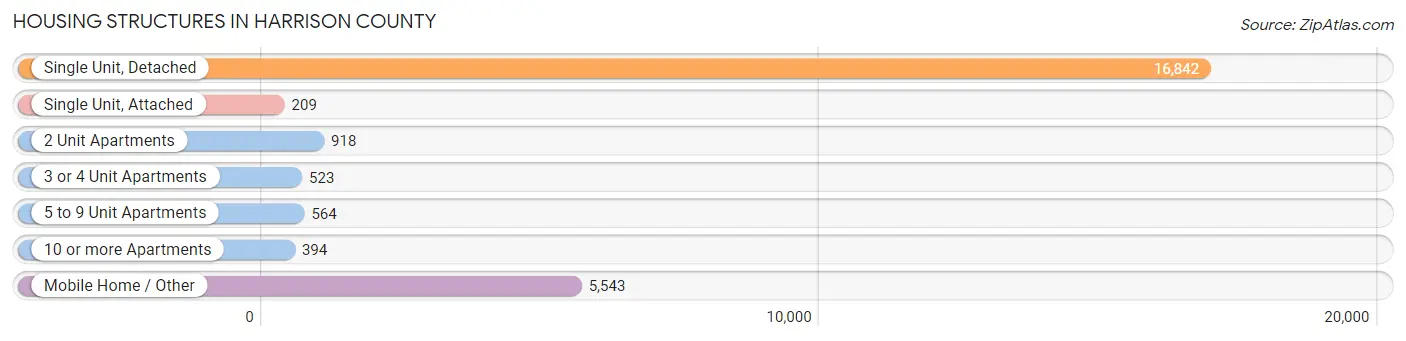
| Structure Type | # Housing Units | % Housing Units |
| Single Unit, Detached | 16,842 | 67.4% |
| Single Unit, Attached | 209 | 0.8% |
| 2 Unit Apartments | 918 | 3.7% |
| 3 or 4 Unit Apartments | 523 | 2.1% |
| 5 to 9 Unit Apartments | 564 | 2.3% |
| 10 or more Apartments | 394 | 1.6% |
| Mobile Home / Other | 5,543 | 22.2% |
| Total | 24,993 | 100.0% |
Housing Structures by Occupancy in Harrison County
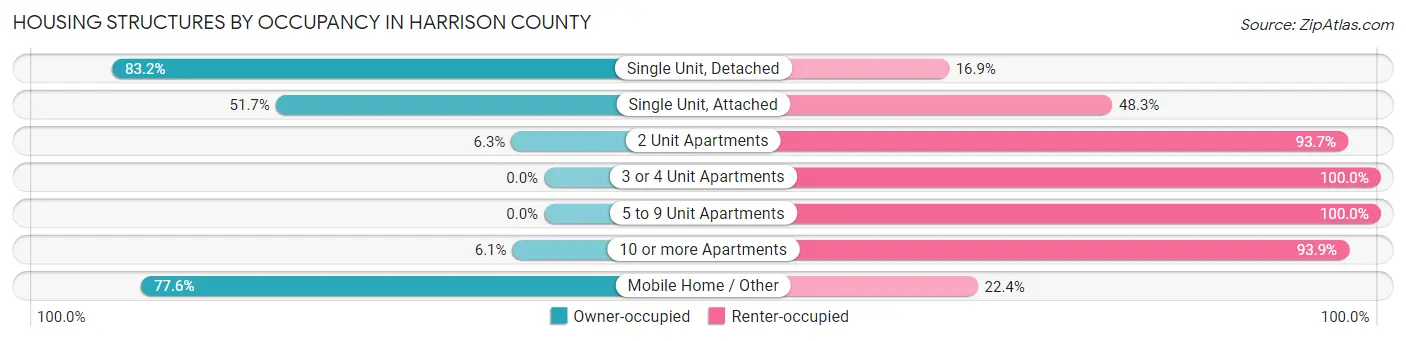
| Structure Type | Owner-occupied | Renter-occupied |
| Single Unit, Detached | 14,004 (83.2%) | 2,838 (16.9%) |
| Single Unit, Attached | 108 (51.7%) | 101 (48.3%) |
| 2 Unit Apartments | 58 (6.3%) | 860 (93.7%) |
| 3 or 4 Unit Apartments | 0 (0.0%) | 523 (100.0%) |
| 5 to 9 Unit Apartments | 0 (0.0%) | 564 (100.0%) |
| 10 or more Apartments | 24 (6.1%) | 370 (93.9%) |
| Mobile Home / Other | 4,300 (77.6%) | 1,243 (22.4%) |
| Total | 18,494 (74.0%) | 6,499 (26.0%) |
Housing Structures by Number of Rooms in Harrison County
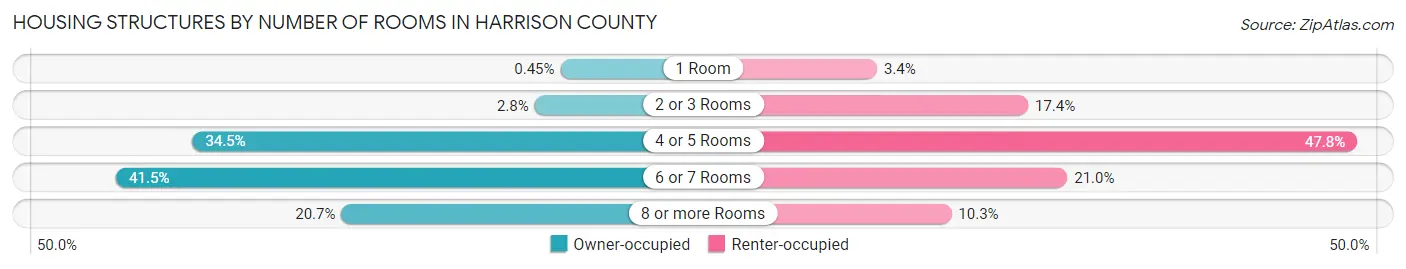
| Number of Rooms | Owner-occupied | Renter-occupied |
| 1 Room | 84 (0.4%) | 223 (3.4%) |
| 2 or 3 Rooms | 523 (2.8%) | 1,131 (17.4%) |
| 4 or 5 Rooms | 6,376 (34.5%) | 3,108 (47.8%) |
| 6 or 7 Rooms | 7,681 (41.5%) | 1,367 (21.0%) |
| 8 or more Rooms | 3,830 (20.7%) | 670 (10.3%) |
| Total | 18,494 (100.0%) | 6,499 (100.0%) |
Housing Structure by Heating Type in Harrison County
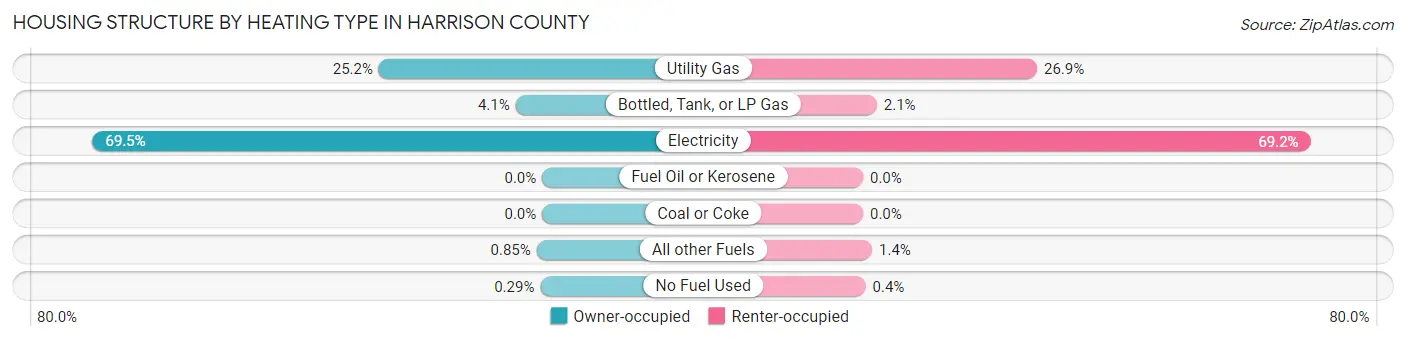
| Heating Type | Owner-occupied | Renter-occupied |
| Utility Gas | 4,668 (25.2%) | 1,748 (26.9%) |
| Bottled, Tank, or LP Gas | 758 (4.1%) | 139 (2.1%) |
| Electricity | 12,857 (69.5%) | 4,495 (69.2%) |
| Fuel Oil or Kerosene | 0 (0.0%) | 0 (0.0%) |
| Coal or Coke | 0 (0.0%) | 0 (0.0%) |
| All other Fuels | 158 (0.9%) | 91 (1.4%) |
| No Fuel Used | 53 (0.3%) | 26 (0.4%) |
| Total | 18,494 (100.0%) | 6,499 (100.0%) |
Household Vehicle Usage in Harrison County
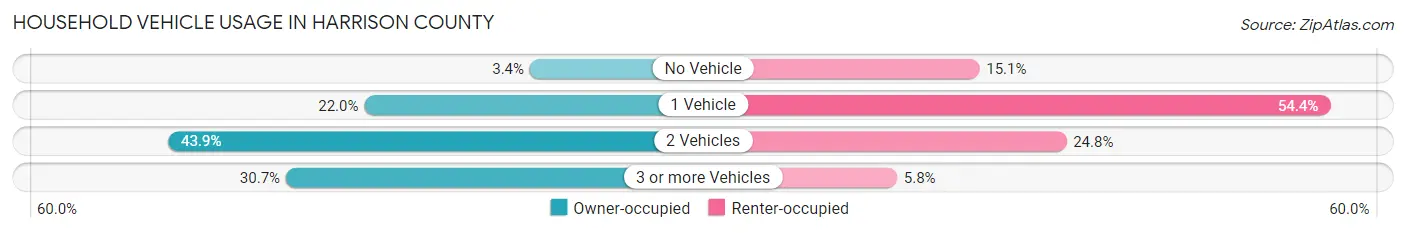
| Vehicles per Household | Owner-occupied | Renter-occupied |
| No Vehicle | 628 (3.4%) | 978 (15.0%) |
| 1 Vehicle | 4,059 (22.0%) | 3,532 (54.3%) |
| 2 Vehicles | 8,124 (43.9%) | 1,611 (24.8%) |
| 3 or more Vehicles | 5,683 (30.7%) | 378 (5.8%) |
| Total | 18,494 (100.0%) | 6,499 (100.0%) |
Real Estate & Mortgages in Harrison County
Real Estate and Mortgage Overview in Harrison County
| Characteristic | Without Mortgage | With Mortgage |
| Housing Units | 9,962 | 8,532 |
| Median Property Value | $120,000 | $201,700 |
| Median Household Income | $58,515 | $2,002 |
| Monthly Housing Costs | $459 | $392 |
| Real Estate Taxes | $1,201 | $277 |
Property Value by Mortgage Status in Harrison County
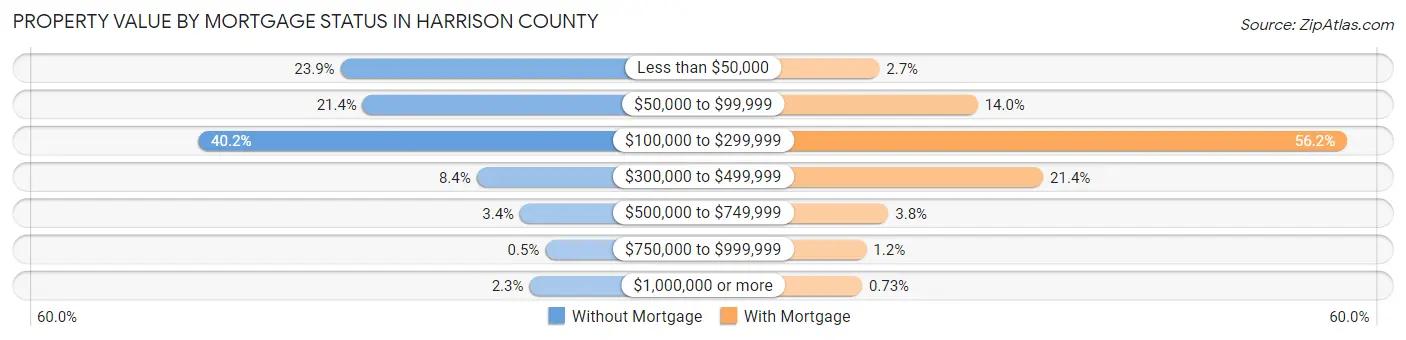
| Property Value | Without Mortgage | With Mortgage |
| Less than $50,000 | 2,382 (23.9%) | 232 (2.7%) |
| $50,000 to $99,999 | 2,128 (21.4%) | 1,191 (14.0%) |
| $100,000 to $299,999 | 4,001 (40.2%) | 4,792 (56.2%) |
| $300,000 to $499,999 | 832 (8.4%) | 1,829 (21.4%) |
| $500,000 to $749,999 | 338 (3.4%) | 320 (3.7%) |
| $750,000 to $999,999 | 50 (0.5%) | 106 (1.2%) |
| $1,000,000 or more | 231 (2.3%) | 62 (0.7%) |
| Total | 9,962 (100.0%) | 8,532 (100.0%) |
Household Income by Mortgage Status in Harrison County
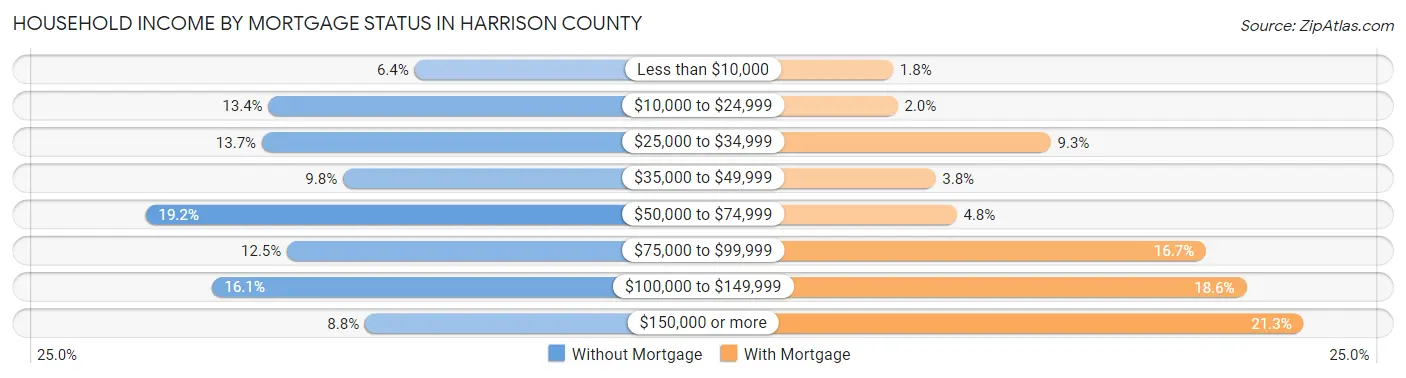
| Household Income | Without Mortgage | With Mortgage |
| Less than $10,000 | 641 (6.4%) | 152 (1.8%) |
| $10,000 to $24,999 | 1,334 (13.4%) | 171 (2.0%) |
| $25,000 to $34,999 | 1,365 (13.7%) | 793 (9.3%) |
| $35,000 to $49,999 | 980 (9.8%) | 324 (3.8%) |
| $50,000 to $74,999 | 1,917 (19.2%) | 410 (4.8%) |
| $75,000 to $99,999 | 1,245 (12.5%) | 1,424 (16.7%) |
| $100,000 to $149,999 | 1,604 (16.1%) | 1,588 (18.6%) |
| $150,000 or more | 876 (8.8%) | 1,820 (21.3%) |
| Total | 9,962 (100.0%) | 8,532 (100.0%) |
Property Value to Household Income Ratio in Harrison County
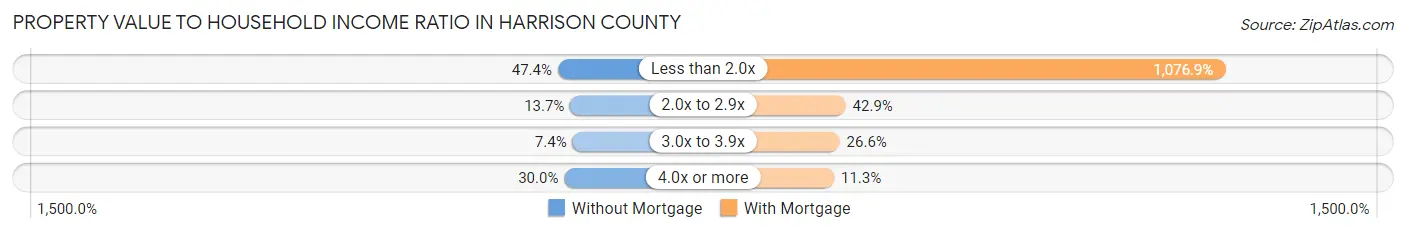
| Value-to-Income Ratio | Without Mortgage | With Mortgage |
| Less than 2.0x | 4,722 (47.4%) | 91,884 (1,076.9%) |
| 2.0x to 2.9x | 1,365 (13.7%) | 3,659 (42.9%) |
| 3.0x to 3.9x | 741 (7.4%) | 2,266 (26.6%) |
| 4.0x or more | 2,989 (30.0%) | 960 (11.3%) |
| Total | 9,962 (100.0%) | 8,532 (100.0%) |
Real Estate Taxes by Mortgage Status in Harrison County
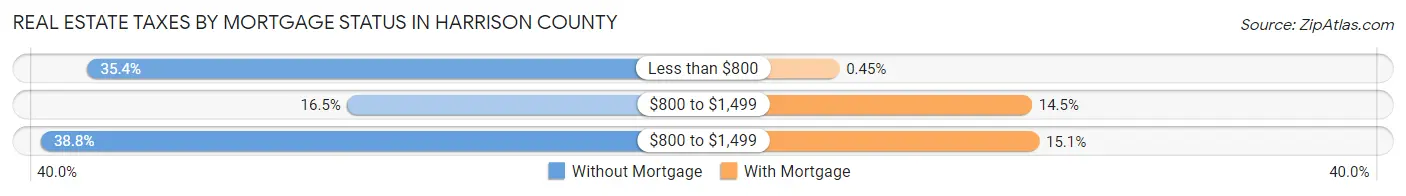
| Property Taxes | Without Mortgage | With Mortgage |
| Less than $800 | 3,526 (35.4%) | 38 (0.4%) |
| $800 to $1,499 | 1,641 (16.5%) | 1,239 (14.5%) |
| $800 to $1,499 | 3,865 (38.8%) | 1,284 (15.0%) |
| Total | 9,962 (100.0%) | 8,532 (100.0%) |
Health & Disability in Harrison County
Health Insurance Coverage by Age in Harrison County
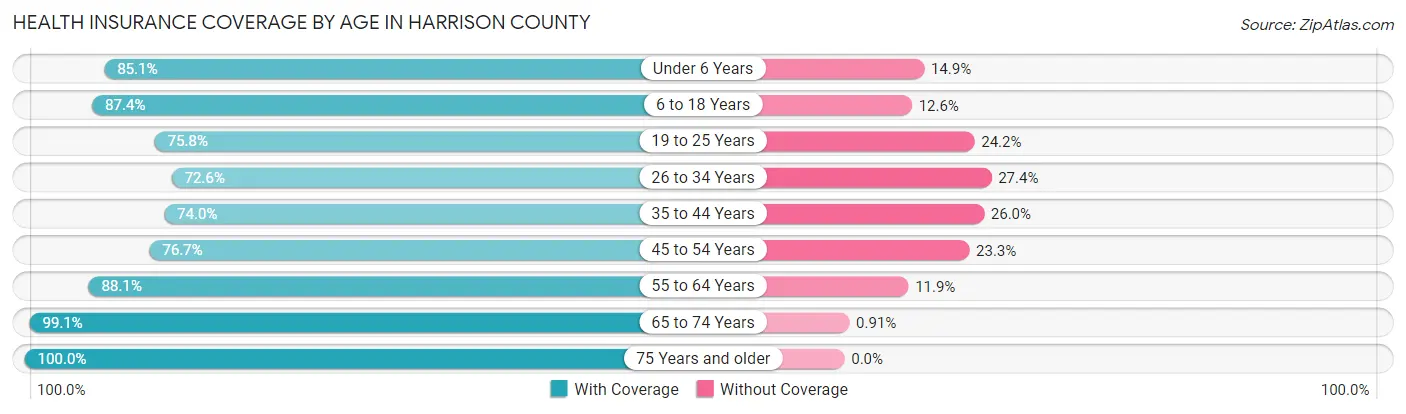
| Age Bracket | With Coverage | Without Coverage |
| Under 6 Years | 4,012 (85.1%) | 700 (14.9%) |
| 6 to 18 Years | 11,453 (87.4%) | 1,647 (12.6%) |
| 19 to 25 Years | 4,717 (75.8%) | 1,509 (24.2%) |
| 26 to 34 Years | 5,525 (72.6%) | 2,085 (27.4%) |
| 35 to 44 Years | 6,512 (74.0%) | 2,290 (26.0%) |
| 45 to 54 Years | 5,793 (76.7%) | 1,757 (23.3%) |
| 55 to 64 Years | 7,944 (88.1%) | 1,075 (11.9%) |
| 65 to 74 Years | 7,072 (99.1%) | 65 (0.9%) |
| 75 Years and older | 4,217 (100.0%) | 0 (0.0%) |
| Total | 57,245 (83.7%) | 11,128 (16.3%) |
Health Insurance Coverage by Citizenship Status in Harrison County
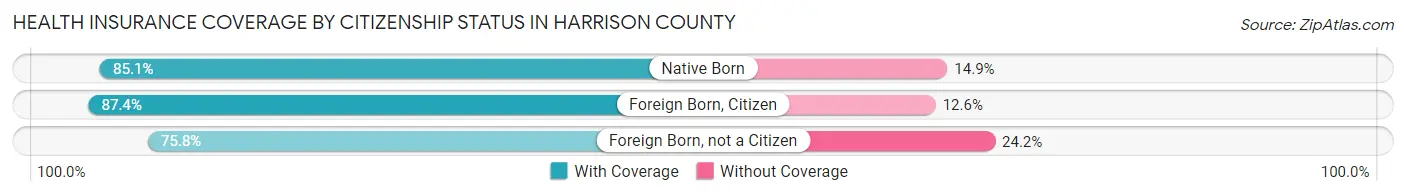
| Citizenship Status | With Coverage | Without Coverage |
| Native Born | 4,012 (85.1%) | 700 (14.9%) |
| Foreign Born, Citizen | 11,453 (87.4%) | 1,647 (12.6%) |
| Foreign Born, not a Citizen | 4,717 (75.8%) | 1,509 (24.2%) |
Health Insurance Coverage by Household Income in Harrison County
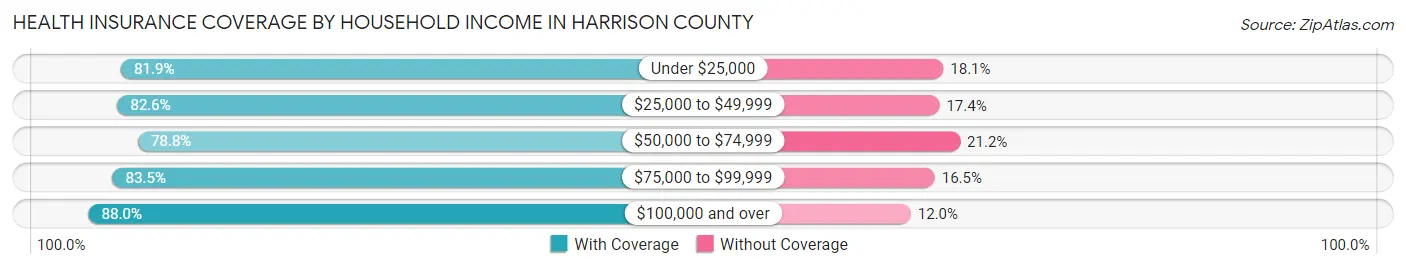
| Household Income | With Coverage | Without Coverage |
| Under $25,000 | 8,826 (81.9%) | 1,949 (18.1%) |
| $25,000 to $49,999 | 8,645 (82.6%) | 1,817 (17.4%) |
| $50,000 to $74,999 | 9,790 (78.8%) | 2,640 (21.2%) |
| $75,000 to $99,999 | 8,718 (83.5%) | 1,721 (16.5%) |
| $100,000 and over | 20,562 (88.0%) | 2,804 (12.0%) |
Public vs Private Health Insurance Coverage by Age in Harrison County
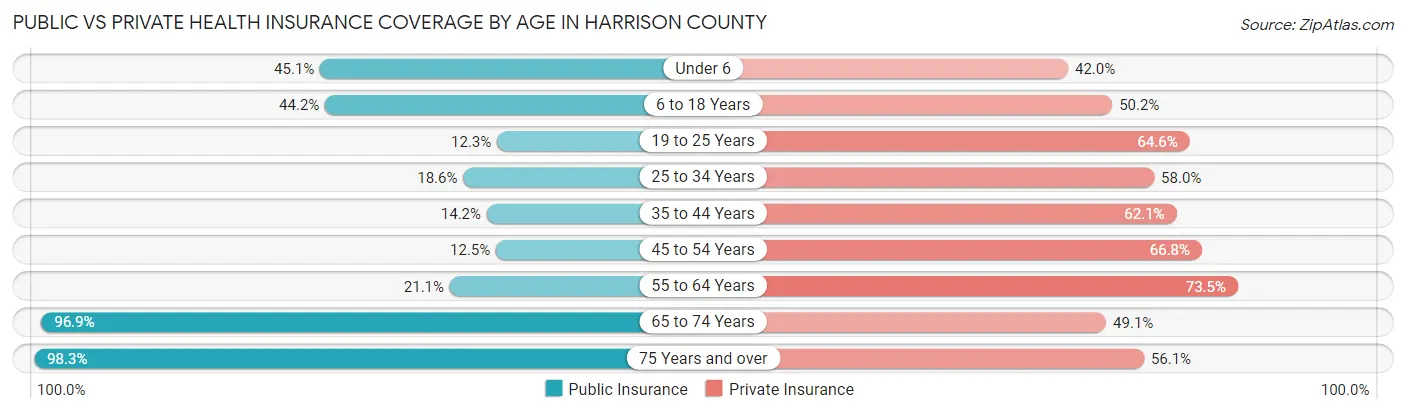
| Age Bracket | Public Insurance | Private Insurance |
| Under 6 | 2,127 (45.1%) | 1,979 (42.0%) |
| 6 to 18 Years | 5,792 (44.2%) | 6,575 (50.2%) |
| 19 to 25 Years | 765 (12.3%) | 4,019 (64.5%) |
| 25 to 34 Years | 1,413 (18.6%) | 4,412 (58.0%) |
| 35 to 44 Years | 1,250 (14.2%) | 5,466 (62.1%) |
| 45 to 54 Years | 942 (12.5%) | 5,046 (66.8%) |
| 55 to 64 Years | 1,899 (21.1%) | 6,628 (73.5%) |
| 65 to 74 Years | 6,916 (96.9%) | 3,502 (49.1%) |
| 75 Years and over | 4,143 (98.3%) | 2,365 (56.1%) |
| Total | 25,247 (36.9%) | 39,992 (58.5%) |
Disability Status by Sex by Age in Harrison County
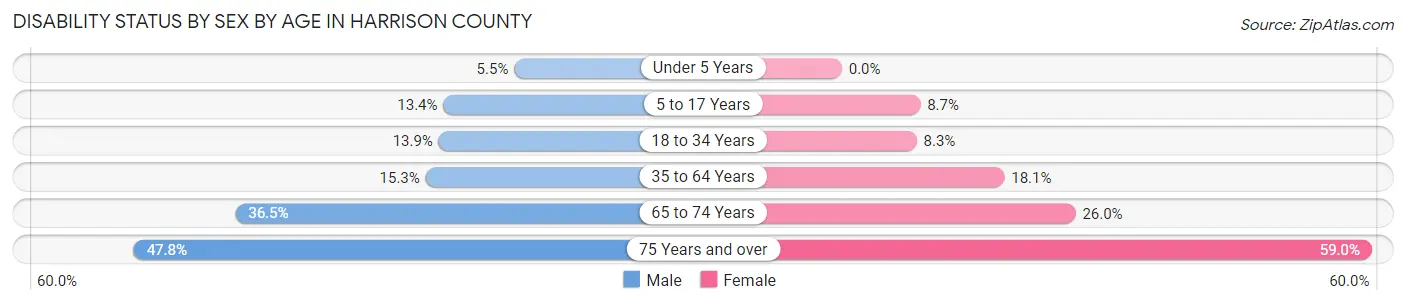
| Age Bracket | Male | Female |
| Under 5 Years | 101 (5.5%) | 0 (0.0%) |
| 5 to 17 Years | 863 (13.4%) | 542 (8.7%) |
| 18 to 34 Years | 1,027 (13.9%) | 633 (8.3%) |
| 35 to 64 Years | 1,923 (15.3%) | 2,323 (18.1%) |
| 65 to 74 Years | 1,261 (36.5%) | 959 (26.0%) |
| 75 Years and over | 829 (47.8%) | 1,466 (59.0%) |
Disability Class by Sex by Age in Harrison County
Disability Class: Hearing Difficulty
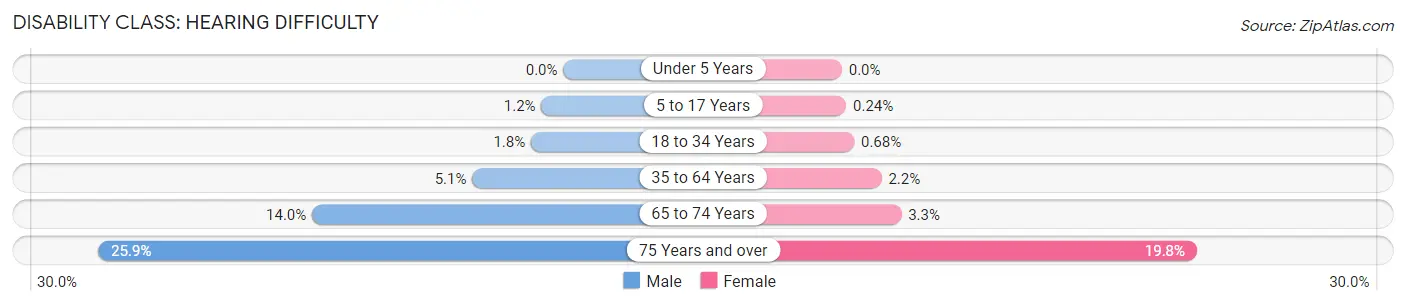
| Age Bracket | Male | Female |
| Under 5 Years | 0 (0.0%) | 0 (0.0%) |
| 5 to 17 Years | 79 (1.2%) | 15 (0.2%) |
| 18 to 34 Years | 133 (1.8%) | 52 (0.7%) |
| 35 to 64 Years | 635 (5.1%) | 284 (2.2%) |
| 65 to 74 Years | 483 (14.0%) | 122 (3.3%) |
| 75 Years and over | 449 (25.9%) | 491 (19.8%) |
Disability Class: Vision Difficulty
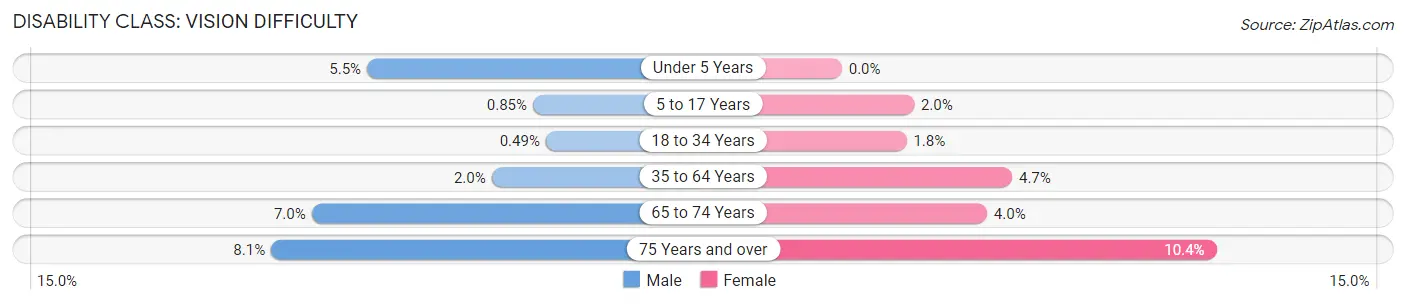
| Age Bracket | Male | Female |
| Under 5 Years | 101 (5.5%) | 0 (0.0%) |
| 5 to 17 Years | 55 (0.9%) | 125 (2.0%) |
| 18 to 34 Years | 36 (0.5%) | 137 (1.8%) |
| 35 to 64 Years | 251 (2.0%) | 608 (4.7%) |
| 65 to 74 Years | 242 (7.0%) | 149 (4.0%) |
| 75 Years and over | 141 (8.1%) | 259 (10.4%) |
Disability Class: Cognitive Difficulty
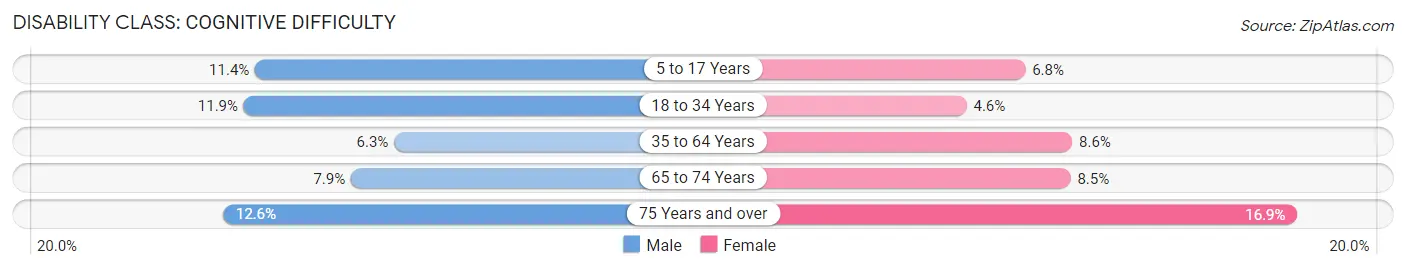
| Age Bracket | Male | Female |
| 5 to 17 Years | 739 (11.4%) | 423 (6.8%) |
| 18 to 34 Years | 877 (11.9%) | 352 (4.6%) |
| 35 to 64 Years | 787 (6.3%) | 1,098 (8.6%) |
| 65 to 74 Years | 272 (7.9%) | 313 (8.5%) |
| 75 Years and over | 219 (12.6%) | 420 (16.9%) |
Disability Class: Ambulatory Difficulty
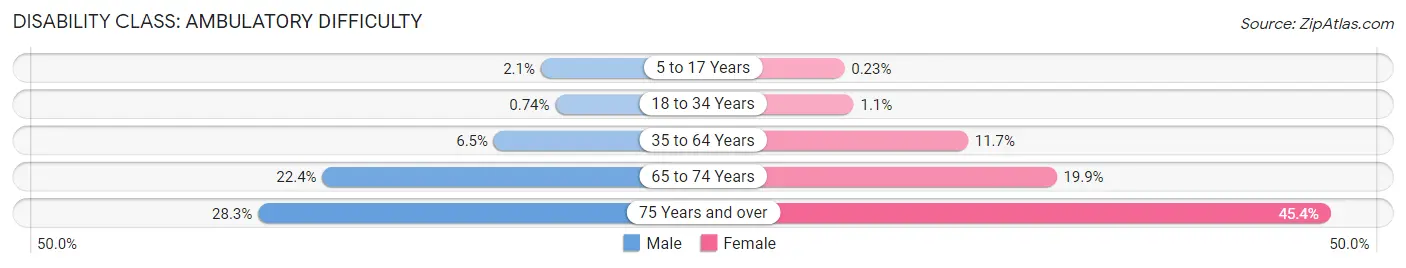
| Age Bracket | Male | Female |
| 5 to 17 Years | 135 (2.1%) | 14 (0.2%) |
| 18 to 34 Years | 55 (0.7%) | 83 (1.1%) |
| 35 to 64 Years | 808 (6.5%) | 1,501 (11.7%) |
| 65 to 74 Years | 772 (22.4%) | 734 (19.9%) |
| 75 Years and over | 491 (28.3%) | 1,127 (45.4%) |
Disability Class: Self-Care Difficulty
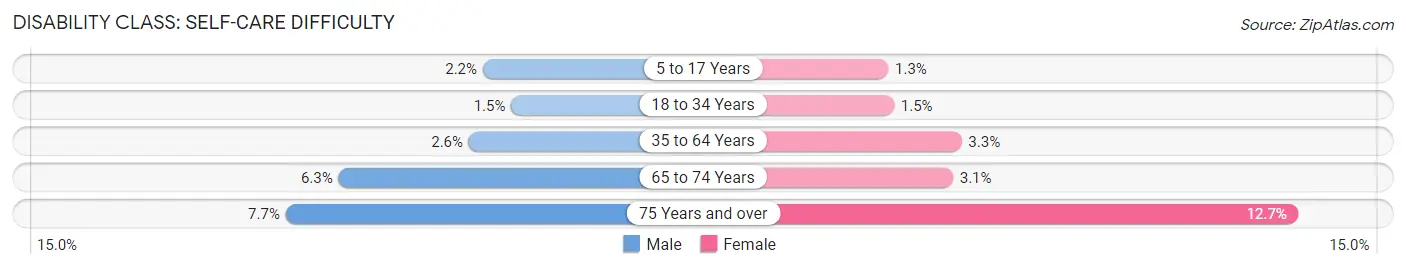
| Age Bracket | Male | Female |
| 5 to 17 Years | 145 (2.2%) | 80 (1.3%) |
| 18 to 34 Years | 107 (1.5%) | 110 (1.5%) |
| 35 to 64 Years | 330 (2.6%) | 427 (3.3%) |
| 65 to 74 Years | 216 (6.3%) | 114 (3.1%) |
| 75 Years and over | 134 (7.7%) | 316 (12.7%) |
Technology Access in Harrison County
Computing Device Access in Harrison County
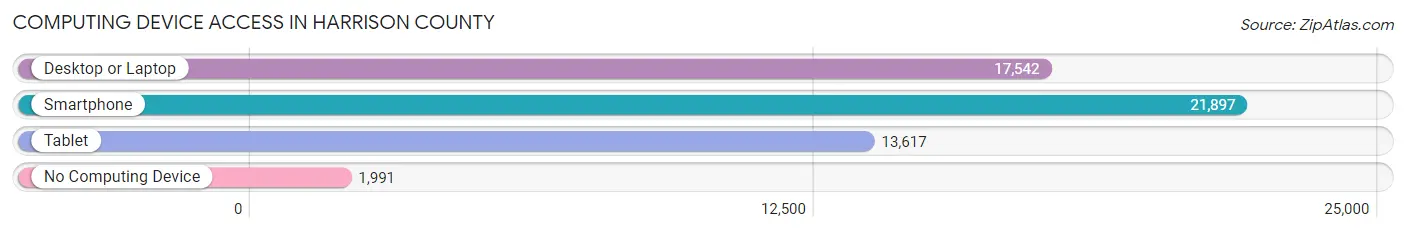
| Device Type | # Households | % Households |
| Desktop or Laptop | 17,542 | 70.2% |
| Smartphone | 21,897 | 87.6% |
| Tablet | 13,617 | 54.5% |
| No Computing Device | 1,991 | 8.0% |
| Total | 24,993 | 100.0% |
Internet Access in Harrison County
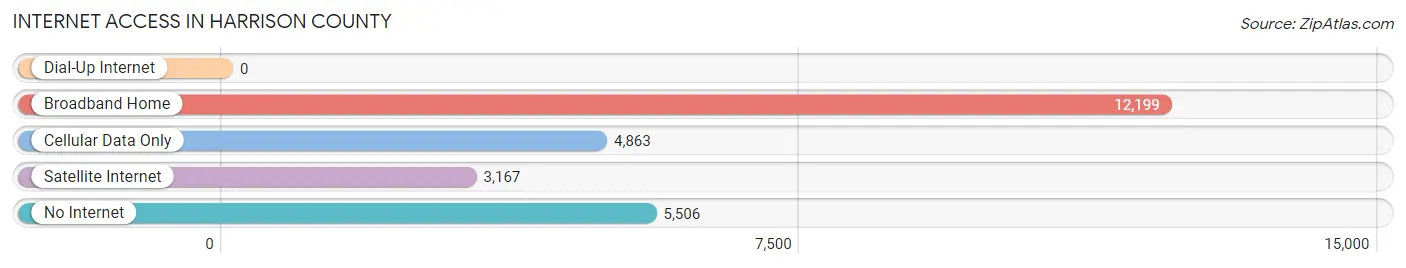
| Internet Type | # Households | % Households |
| Dial-Up Internet | 0 | 0.0% |
| Broadband Home | 12,199 | 48.8% |
| Cellular Data Only | 4,863 | 19.5% |
| Satellite Internet | 3,167 | 12.7% |
| No Internet | 5,506 | 22.0% |
| Total | 24,993 | 100.0% |
Harrison County Summary
Harrison County is located in the northeastern corner of Texas, and is part of the Longview-Marshall Metropolitan Statistical Area. The county is bordered by Gregg County to the north, Upshur County to the east, Marion County to the south, and Panola County to the west. The county seat is Marshall, and the largest city is Longview.
History
Harrison County was established in 1839 and named for Jonas Harrison, a signer of the Texas Declaration of Independence. The county was originally part of Upshur County, but was later divided into its own county. The first settlers in the area were mostly from the southern states, and the county was largely agricultural.
In the late 19th century, the county began to experience an economic boom due to the discovery of oil and natural gas. This led to the development of several towns, including Marshall, Longview, and Hallsville. The county also experienced a population boom, with the population increasing from 8,000 in 1900 to over 40,000 by 1930.
Geography
Harrison County covers an area of 845 square miles, and is mostly flat with some rolling hills. The county is drained by the Sabine River, which forms the western border of the county. The county is also home to several lakes, including Lake O' the Pines, Lake Bob Sandlin, and Lake Cherokee.
The climate of Harrison County is humid subtropical, with hot summers and mild winters. The average annual temperature is 68°F, and the average annual precipitation is 44 inches.
Economy
Harrison County has a diverse economy, with the largest industries being manufacturing, retail, healthcare, and education. The county is home to several large employers, including Eastman Chemical Company, Good Shepherd Medical Center, and the University of Texas at Tyler.
The county also has a strong agricultural sector, with the main crops being cotton, soybeans, and hay. The county is also home to several wineries, and is a popular destination for hunting and fishing.
Demographics
As of the 2010 census, the population of Harrison County was 65,631. The population is mostly white (76.3%), with African Americans making up 17.3% of the population. The median household income is $45,845, and the median home value is $117,400.
The county is home to several colleges and universities, including the University of Texas at Tyler, East Texas Baptist University, and Kilgore College. The county also has several public school districts, including Marshall ISD, Hallsville ISD, and Longview ISD.
Conclusion
Harrison County is a diverse and vibrant county located in the northeastern corner of Texas. The county has a strong economy, with the largest industries being manufacturing, retail, healthcare, and education. The county is also home to several colleges and universities, and is a popular destination for hunting and fishing. The population of the county is mostly white, with African Americans making up 17.3% of the population. The median household income is $45,845, and the median home value is $117,400.
Common Questions
What is Per Capita Income in Harrison County?
Per Capita income in Harrison County is $30,613.
What is the Median Family Income in Harrison County?
Median Family Income in Harrison County is $77,299.
What is the Median Household income in Harrison County?
Median Household Income in Harrison County is $63,427.
What is Income or Wage Gap in Harrison County?
Income or Wage Gap in Harrison County is 35.7%.
Women in Harrison County earn 64.3 cents for every dollar earned by a man.
What is Family Income Deficit in Harrison County?
Family Income Deficit in Harrison County is $13,740.
Families that are below poverty line in Harrison County earn $13,740 less on average than the poverty threshold level.
What is Inequality or Gini Index in Harrison County?
Inequality or Gini Index in Harrison County is 0.47.
What is the Total Population of Harrison County?
Total Population of Harrison County is 69,098.
What is the Total Male Population of Harrison County?
Total Male Population of Harrison County is 33,790.
What is the Total Female Population of Harrison County?
Total Female Population of Harrison County is 35,308.
What is the Ratio of Males per 100 Females in Harrison County?
There are 95.70 Males per 100 Females in Harrison County.
What is the Ratio of Females per 100 Males in Harrison County?
There are 104.49 Females per 100 Males in Harrison County.
What is the Median Population Age in Harrison County?
Median Population Age in Harrison County is 38.8 Years.
What is the Average Family Size in Harrison County
Average Family Size in Harrison County is 3.2 People.
What is the Average Household Size in Harrison County
Average Household Size in Harrison County is 2.7 People.
How Large is the Labor Force in Harrison County?
There are 32,960 People in the Labor Forcein in Harrison County.
What is the Percentage of People in the Labor Force in Harrison County?
60.4% of People are in the Labor Force in Harrison County.
What is the Unemployment Rate in Harrison County?
Unemployment Rate in Harrison County is 6.1%.