Hardin County, TX Map & Demographics
Hardin County Map
Hardin County Overview
$33,700
PER CAPITA INCOME
$89,761
AVG FAMILY INCOME
$70,164
AVG HOUSEHOLD INCOME
52.3%
WAGE / INCOME GAP [ % ]
47.7¢/ $1
WAGE / INCOME GAP [ $ ]
$8,769
FAMILY INCOME DEFICIT
0.43
INEQUALITY / GINI INDEX
56,576
TOTAL POPULATION
27,727
MALE POPULATION
28,849
FEMALE POPULATION
96.11
MALES / 100 FEMALES
104.05
FEMALES / 100 MALES
39.4
MEDIAN AGE
3.1
AVG FAMILY SIZE
2.7
AVG HOUSEHOLD SIZE
25,207
LABOR FORCE [ PEOPLE ]
56.8%
PERCENT IN LABOR FORCE
4.6%
UNEMPLOYMENT RATE
Income in Hardin County
Income Overview in Hardin County
Per Capita Income in Hardin County is $33,700, while median incomes of families and households are $89,761 and $70,164 respectively.
| Characteristic | Number | Measure |
| Per Capita Income | 56,576 | $33,700 |
| Median Family Income | 15,175 | $89,761 |
| Mean Family Income | 15,175 | $102,334 |
| Median Household Income | 20,845 | $70,164 |
| Mean Household Income | 20,845 | $87,881 |
| Income Deficit | 15,175 | $8,769 |
| Wage / Income Gap (%) | 56,576 | 52.33% |
| Wage / Income Gap ($) | 56,576 | 47.67¢ per $1 |
| Gini / Inequality Index | 56,576 | 0.43 |
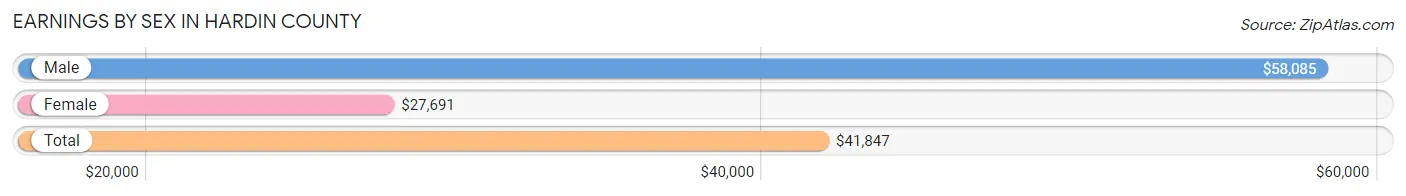
Earnings by Sex in Hardin County
Average Earnings in Hardin County are $41,847, $58,085 for men and $27,691 for women, a difference of 52.3%.
| Sex | Number | Average Earnings |
| Male | 14,475 (54.5%) | $58,085 |
| Female | 12,065 (45.5%) | $27,691 |
| Total | 26,540 (100.0%) | $41,847 |
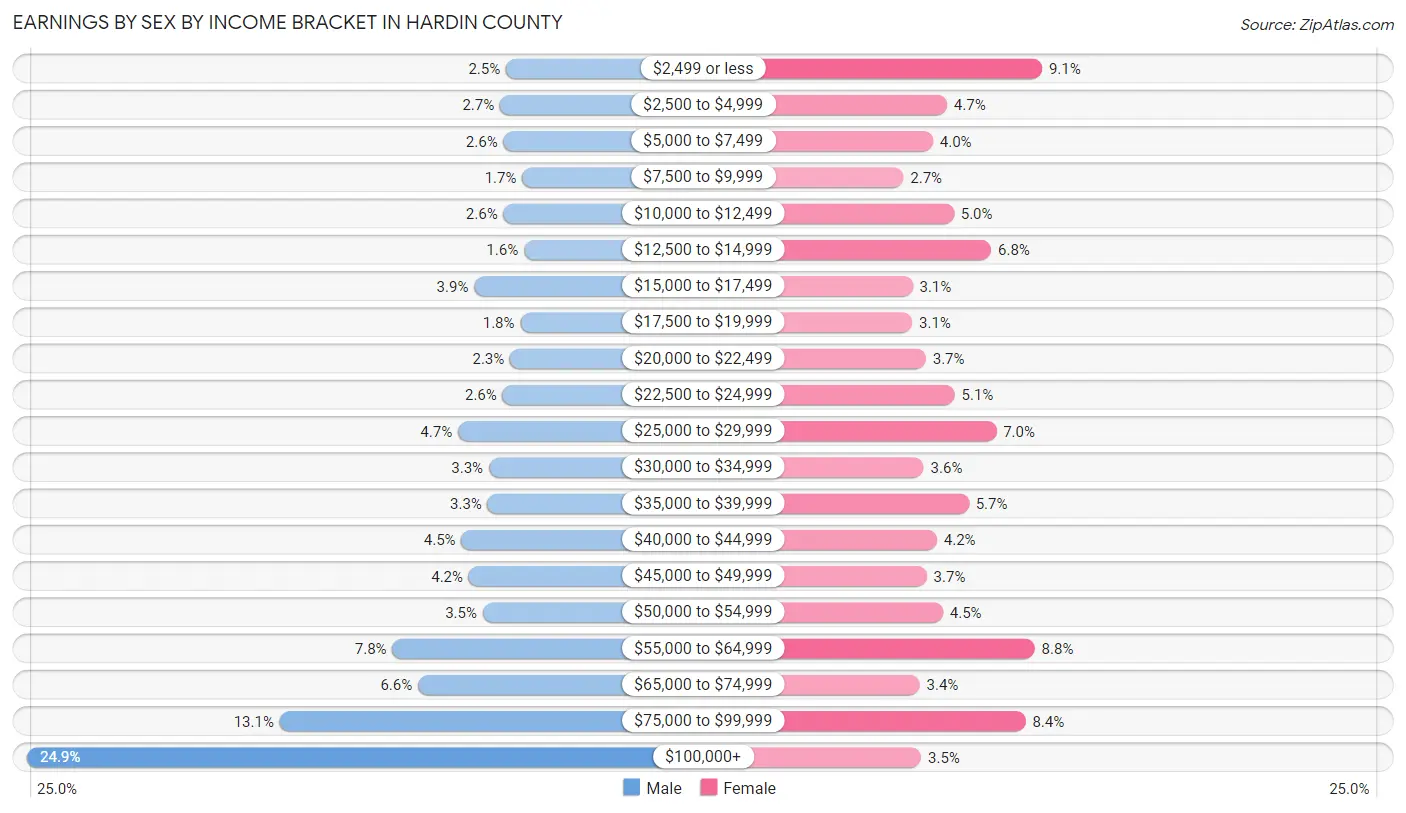
Earnings by Sex by Income Bracket in Hardin County
The most common earnings brackets in Hardin County are $100,000+ for men (3,601 | 24.9%) and $2,499 or less for women (1,103 | 9.1%).
| Income | Male | Female |
| $2,499 or less | 354 (2.5%) | 1,103 (9.1%) |
| $2,500 to $4,999 | 395 (2.7%) | 566 (4.7%) |
| $5,000 to $7,499 | 372 (2.6%) | 486 (4.0%) |
| $7,500 to $9,999 | 244 (1.7%) | 320 (2.6%) |
| $10,000 to $12,499 | 372 (2.6%) | 605 (5.0%) |
| $12,500 to $14,999 | 233 (1.6%) | 815 (6.8%) |
| $15,000 to $17,499 | 571 (3.9%) | 371 (3.1%) |
| $17,500 to $19,999 | 258 (1.8%) | 369 (3.1%) |
| $20,000 to $22,499 | 327 (2.3%) | 446 (3.7%) |
| $22,500 to $24,999 | 378 (2.6%) | 609 (5.1%) |
| $25,000 to $29,999 | 681 (4.7%) | 845 (7.0%) |
| $30,000 to $34,999 | 470 (3.3%) | 434 (3.6%) |
| $35,000 to $39,999 | 479 (3.3%) | 689 (5.7%) |
| $40,000 to $44,999 | 657 (4.5%) | 509 (4.2%) |
| $45,000 to $49,999 | 607 (4.2%) | 451 (3.7%) |
| $50,000 to $54,999 | 512 (3.5%) | 543 (4.5%) |
| $55,000 to $64,999 | 1,124 (7.8%) | 1,062 (8.8%) |
| $65,000 to $74,999 | 951 (6.6%) | 412 (3.4%) |
| $75,000 to $99,999 | 1,889 (13.1%) | 1,010 (8.4%) |
| $100,000+ | 3,601 (24.9%) | 420 (3.5%) |
| Total | 14,475 (100.0%) | 12,065 (100.0%) |
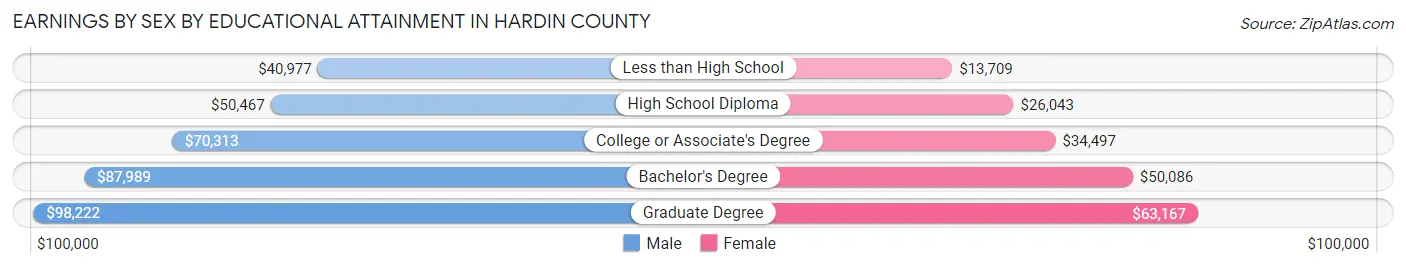
Earnings by Sex by Educational Attainment in Hardin County
Average earnings in Hardin County are $65,742 for men and $32,037 for women, a difference of 51.3%. Men with an educational attainment of graduate degree enjoy the highest average annual earnings of $98,222, while those with less than high school education earn the least with $40,977. Women with an educational attainment of graduate degree earn the most with the average annual earnings of $63,167, while those with less than high school education have the smallest earnings of $13,709.
| Educational Attainment | Male Income | Female Income |
| Less than High School | $40,977 | $13,709 |
| High School Diploma | $50,467 | $26,043 |
| College or Associate's Degree | $70,313 | $34,497 |
| Bachelor's Degree | $87,989 | $50,086 |
| Graduate Degree | $98,222 | $63,167 |
| Total | $65,742 | $32,037 |
Family Income in Hardin County
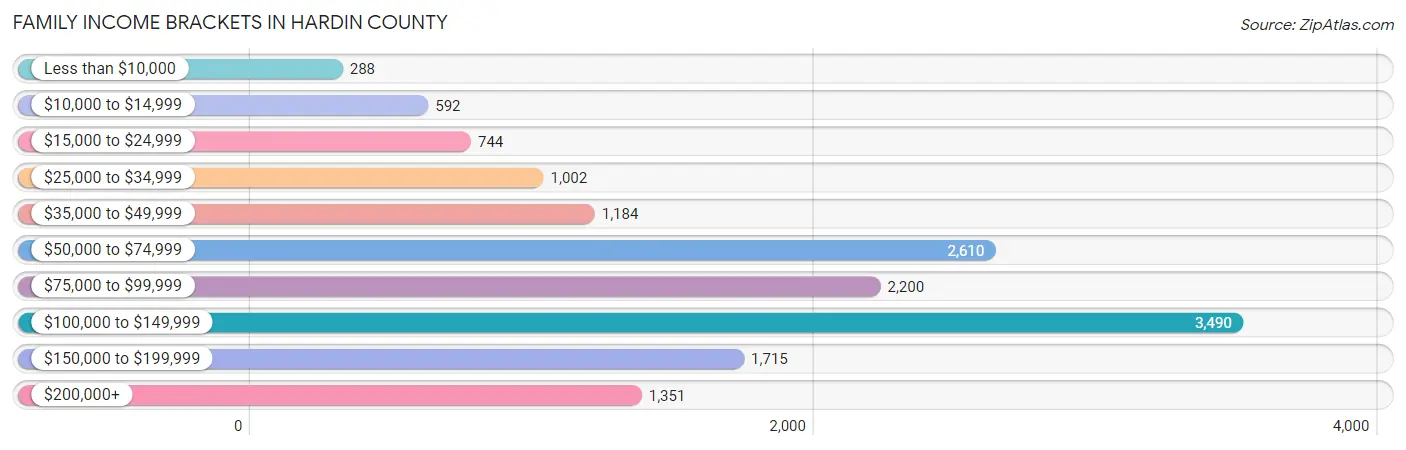
Family Income Brackets in Hardin County
According to the Hardin County family income data, there are 3,490 families falling into the $100,000 to $149,999 income range, which is the most common income bracket and makes up 23.0% of all families. Conversely, the less than $10,000 income bracket is the least frequent group with only 288 families (1.9%) belonging to this category.
| Income Bracket | # Families | % Families |
| Less than $10,000 | 288 | 1.9% |
| $10,000 to $14,999 | 592 | 3.9% |
| $15,000 to $24,999 | 744 | 4.9% |
| $25,000 to $34,999 | 1,002 | 6.6% |
| $35,000 to $49,999 | 1,184 | 7.8% |
| $50,000 to $74,999 | 2,610 | 17.2% |
| $75,000 to $99,999 | 2,200 | 14.5% |
| $100,000 to $149,999 | 3,490 | 23.0% |
| $150,000 to $199,999 | 1,715 | 11.3% |
| $200,000+ | 1,351 | 8.9% |
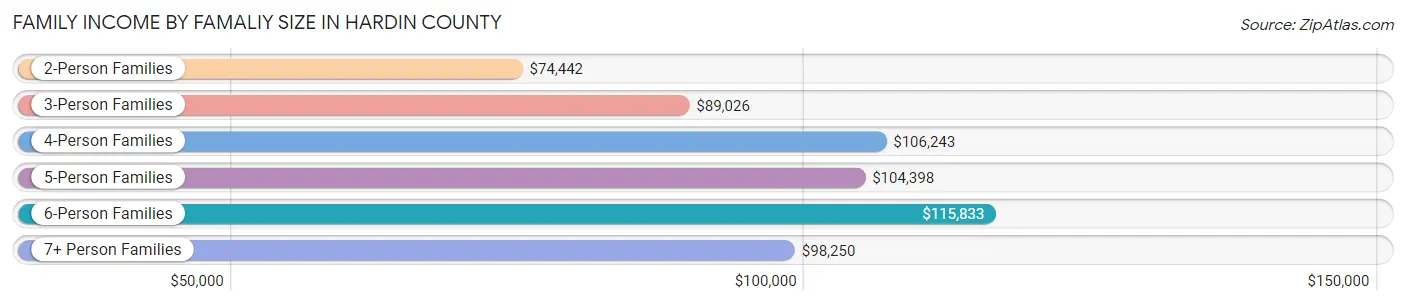
Family Income by Famaliy Size in Hardin County
6-person families (260 | 1.7%) account for the highest median family income in Hardin County with $115,833 per family, while 2-person families (7,403 | 48.8%) have the highest median income of $37,221 per family member.
| Income Bracket | # Families | Median Income |
| 2-Person Families | 7,403 (48.8%) | $74,442 |
| 3-Person Families | 2,982 (19.7%) | $89,026 |
| 4-Person Families | 2,943 (19.4%) | $106,243 |
| 5-Person Families | 1,462 (9.6%) | $104,398 |
| 6-Person Families | 260 (1.7%) | $115,833 |
| 7+ Person Families | 125 (0.8%) | $98,250 |
| Total | 15,175 (100.0%) | $89,761 |
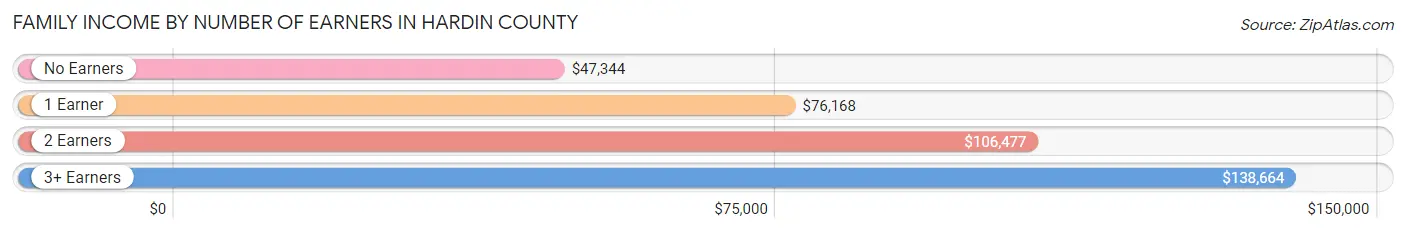
Family Income by Number of Earners in Hardin County
The median family income in Hardin County is $89,761, with families comprising 3+ earners (1,231) having the highest median family income of $138,664, while families with no earners (2,233) have the lowest median family income of $47,344, accounting for 8.1% and 14.7% of families, respectively.
| Number of Earners | # Families | Median Income |
| No Earners | 2,233 (14.7%) | $47,344 |
| 1 Earner | 5,616 (37.0%) | $76,168 |
| 2 Earners | 6,095 (40.2%) | $106,477 |
| 3+ Earners | 1,231 (8.1%) | $138,664 |
| Total | 15,175 (100.0%) | $89,761 |
Household Income in Hardin County
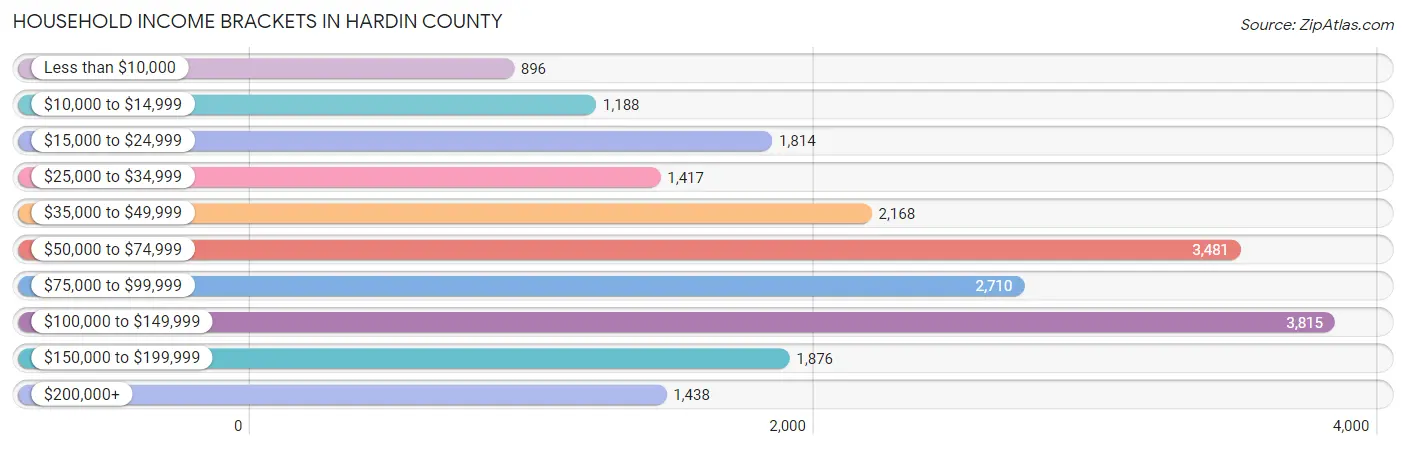
Household Income Brackets in Hardin County
With 3,815 households falling in the category, the $100,000 to $149,999 income range is the most frequent in Hardin County, accounting for 18.3% of all households. In contrast, only 896 households (4.3%) fall into the less than $10,000 income bracket, making it the least populous group.
| Income Bracket | # Households | % Households |
| Less than $10,000 | 896 | 4.3% |
| $10,000 to $14,999 | 1,188 | 5.7% |
| $15,000 to $24,999 | 1,814 | 8.7% |
| $25,000 to $34,999 | 1,417 | 6.8% |
| $35,000 to $49,999 | 2,168 | 10.4% |
| $50,000 to $74,999 | 3,481 | 16.7% |
| $75,000 to $99,999 | 2,710 | 13.0% |
| $100,000 to $149,999 | 3,815 | 18.3% |
| $150,000 to $199,999 | 1,876 | 9.0% |
| $200,000+ | 1,438 | 6.9% |
Household Income by Householder Age in Hardin County
The median household income in Hardin County is $70,164, with the highest median household income of $90,007 found in the 45 to 64 years age bracket for the primary householder. A total of 7,703 households (36.9%) fall into this category. Meanwhile, the 65+ years age bracket for the primary householder has the lowest median household income of $45,032, with 5,937 households (28.5%) in this group.
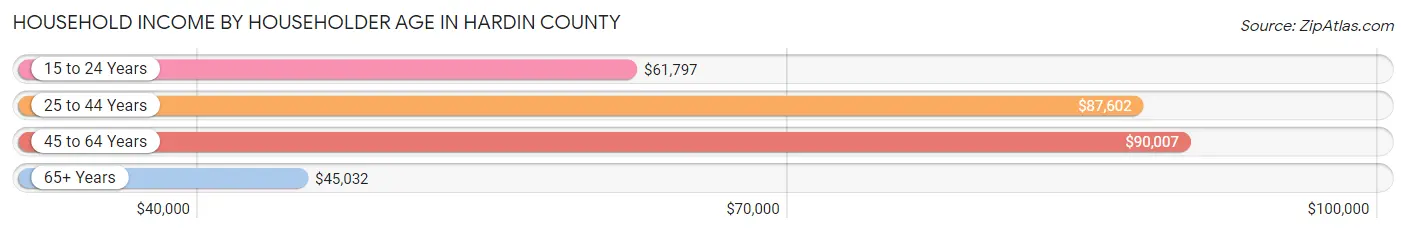
| Income Bracket | # Households | Median Income |
| 15 to 24 Years | 462 (2.2%) | $61,797 |
| 25 to 44 Years | 6,743 (32.4%) | $87,602 |
| 45 to 64 Years | 7,703 (36.9%) | $90,007 |
| 65+ Years | 5,937 (28.5%) | $45,032 |
| Total | 20,845 (100.0%) | $70,164 |
Poverty in Hardin County
Income Below Poverty by Sex and Age in Hardin County
With 12.8% poverty level for males and 14.1% for females among the residents of Hardin County, 16 and 17 year old males and 16 and 17 year old females are the most vulnerable to poverty, with 200 males (24.2%) and 223 females (26.3%) in their respective age groups living below the poverty level.

| Age Bracket | Male | Female |
| Under 5 Years | 323 (20.3%) | 288 (16.2%) |
| 5 Years | 3 (0.7%) | 0 (0.0%) |
| 6 to 11 Years | 336 (13.5%) | 301 (13.9%) |
| 12 to 14 Years | 153 (14.1%) | 143 (13.5%) |
| 15 Years | 44 (14.4%) | 58 (14.5%) |
| 16 and 17 Years | 200 (24.2%) | 223 (26.3%) |
| 18 to 24 Years | 401 (18.6%) | 350 (15.7%) |
| 25 to 34 Years | 413 (11.3%) | 668 (20.1%) |
| 35 to 44 Years | 260 (7.2%) | 628 (16.4%) |
| 45 to 54 Years | 419 (11.8%) | 358 (10.9%) |
| 55 to 64 Years | 498 (13.9%) | 437 (11.8%) |
| 65 to 74 Years | 298 (11.2%) | 211 (6.8%) |
| 75 Years and over | 150 (9.9%) | 343 (16.3%) |
| Total | 3,498 (12.8%) | 4,008 (14.1%) |
Income Above Poverty by Sex and Age in Hardin County
According to the poverty statistics in Hardin County, males aged 5 years and females aged 5 years are the age groups that are most secure financially, with 99.3% of males and 100.0% of females in these age groups living above the poverty line.
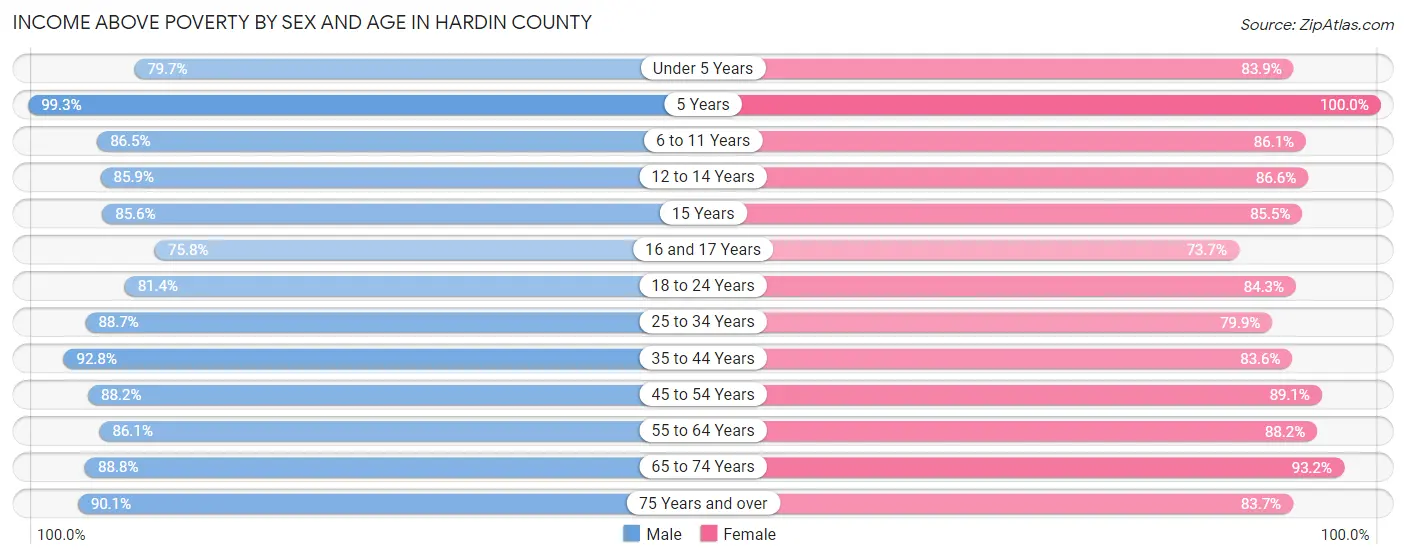
| Age Bracket | Male | Female |
| Under 5 Years | 1,264 (79.6%) | 1,495 (83.9%) |
| 5 Years | 436 (99.3%) | 508 (100.0%) |
| 6 to 11 Years | 2,155 (86.5%) | 1,870 (86.1%) |
| 12 to 14 Years | 931 (85.9%) | 920 (86.6%) |
| 15 Years | 261 (85.6%) | 341 (85.5%) |
| 16 and 17 Years | 625 (75.8%) | 624 (73.7%) |
| 18 to 24 Years | 1,756 (81.4%) | 1,876 (84.3%) |
| 25 to 34 Years | 3,241 (88.7%) | 2,652 (79.9%) |
| 35 to 44 Years | 3,329 (92.8%) | 3,203 (83.6%) |
| 45 to 54 Years | 3,137 (88.2%) | 2,916 (89.1%) |
| 55 to 64 Years | 3,082 (86.1%) | 3,270 (88.2%) |
| 65 to 74 Years | 2,354 (88.8%) | 2,881 (93.2%) |
| 75 Years and over | 1,368 (90.1%) | 1,765 (83.7%) |
| Total | 23,939 (87.3%) | 24,321 (85.9%) |
Income Below Poverty Among Married-Couple Families in Hardin County
The poverty statistics for married-couple families in Hardin County show that 5.2% or 607 of the total 11,566 families live below the poverty line. Families with 1 or 2 children have the highest poverty rate of 11.1%, comprising of 420 families. On the other hand, families with 5 or more children have the lowest poverty rate of 0.0%, which includes 0 families.
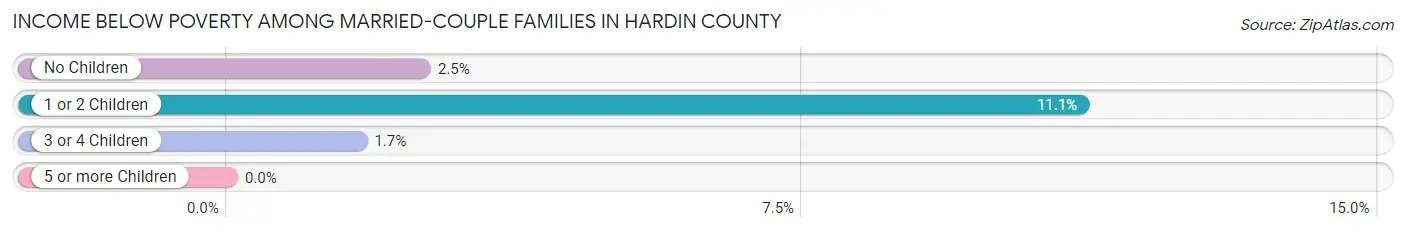
| Children | Above Poverty | Below Poverty |
| No Children | 6,582 (97.5%) | 170 (2.5%) |
| 1 or 2 Children | 3,362 (88.9%) | 420 (11.1%) |
| 3 or 4 Children | 990 (98.3%) | 17 (1.7%) |
| 5 or more Children | 25 (100.0%) | 0 (0.0%) |
| Total | 10,959 (94.8%) | 607 (5.2%) |
Income Below Poverty Among Single-Parent Households in Hardin County
According to the poverty data in Hardin County, 12.8% or 159 single-father households and 31.9% or 754 single-mother households are living below the poverty line. Among single-father households, those with 1 or 2 children have the highest poverty rate, with 142 households (22.8%) experiencing poverty. Likewise, among single-mother households, those with 3 or 4 children have the highest poverty rate, with 123 households (58.9%) falling below the poverty line.
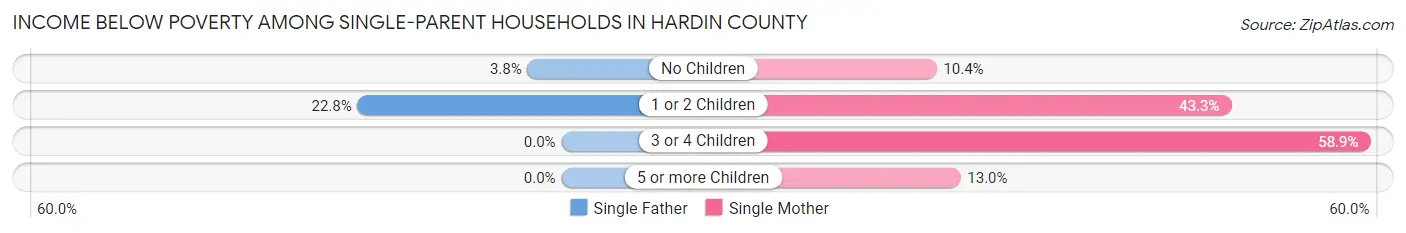
| Children | Single Father | Single Mother |
| No Children | 17 (3.8%) | 93 (10.4%) |
| 1 or 2 Children | 142 (22.8%) | 535 (43.3%) |
| 3 or 4 Children | 0 (0.0%) | 123 (58.9%) |
| 5 or more Children | 0 (0.0%) | 3 (13.0%) |
| Total | 159 (12.8%) | 754 (31.9%) |
Income Below Poverty Among Married-Couple vs Single-Parent Households in Hardin County
The poverty data for Hardin County shows that 607 of the married-couple family households (5.2%) and 913 of the single-parent households (25.3%) are living below the poverty level. Within the married-couple family households, those with 1 or 2 children have the highest poverty rate, with 420 households (11.1%) falling below the poverty line. Among the single-parent households, those with 1 or 2 children have the highest poverty rate, with 677 household (36.4%) living below poverty.
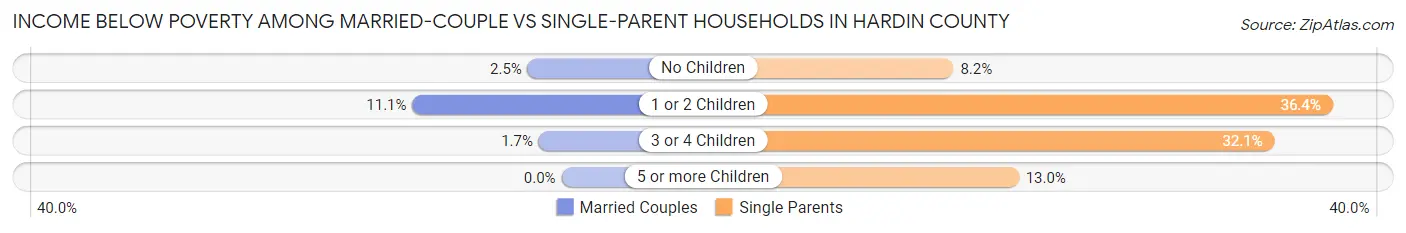
| Children | Married-Couple Families | Single-Parent Households |
| No Children | 170 (2.5%) | 110 (8.2%) |
| 1 or 2 Children | 420 (11.1%) | 677 (36.4%) |
| 3 or 4 Children | 17 (1.7%) | 123 (32.1%) |
| 5 or more Children | 0 (0.0%) | 3 (13.0%) |
| Total | 607 (5.2%) | 913 (25.3%) |
Race in Hardin County
The most populous races in Hardin County are White / Caucasian (49,234 | 87.0%), Hispanic or Latino (3,694 | 6.5%), and Black / African American (3,491 | 6.2%).
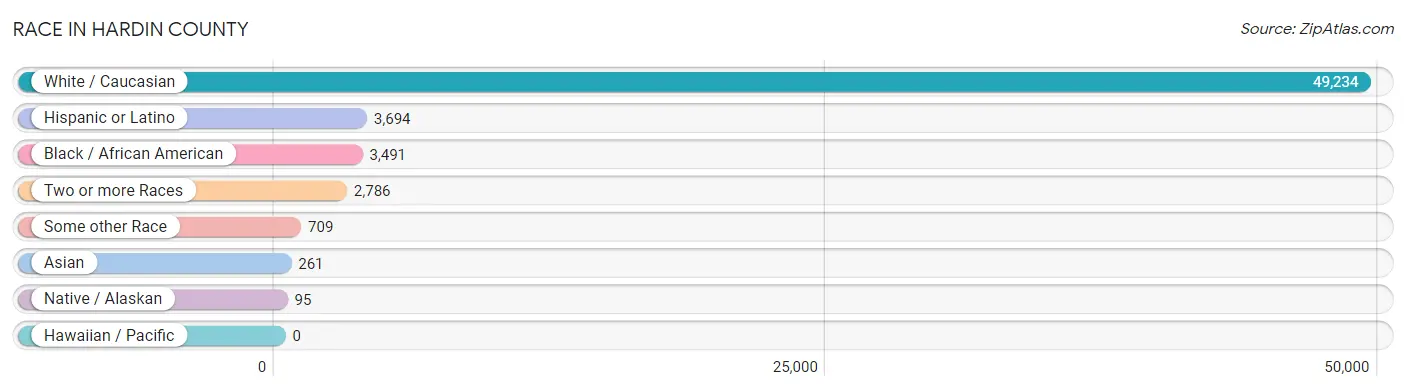
| Race | # Population | % Population |
| Asian | 261 | 0.5% |
| Black / African American | 3,491 | 6.2% |
| Hawaiian / Pacific | 0 | 0.0% |
| Hispanic or Latino | 3,694 | 6.5% |
| Native / Alaskan | 95 | 0.2% |
| White / Caucasian | 49,234 | 87.0% |
| Two or more Races | 2,786 | 4.9% |
| Some other Race | 709 | 1.3% |
| Total | 56,576 | 100.0% |
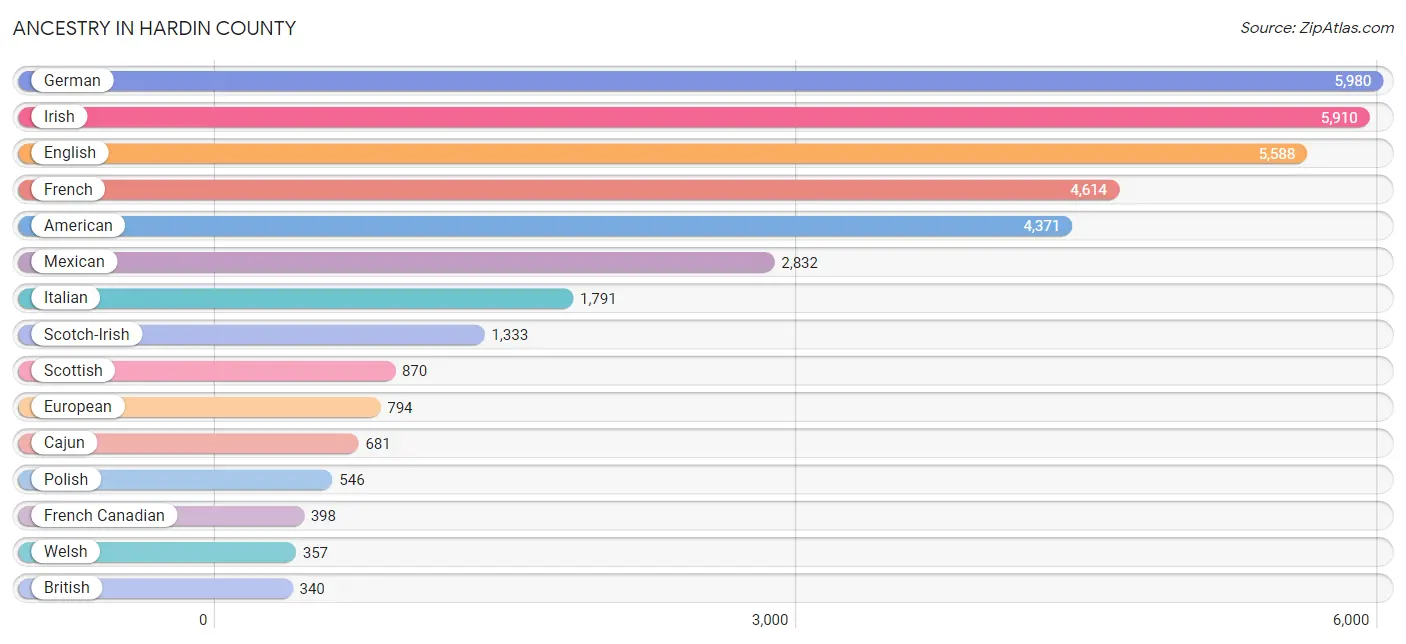
Ancestry in Hardin County
The most populous ancestries reported in Hardin County are German (5,980 | 10.6%), Irish (5,910 | 10.4%), English (5,588 | 9.9%), French (4,614 | 8.2%), and American (4,371 | 7.7%), together accounting for 46.8% of all Hardin County residents.
| Ancestry | # Population | % Population |
| African | 132 | 0.2% |
| American | 4,371 | 7.7% |
| Apache | 27 | 0.1% |
| Arab | 50 | 0.1% |
| Austrian | 2 | 0.0% |
| Bhutanese | 94 | 0.2% |
| British | 340 | 0.6% |
| Burmese | 19 | 0.0% |
| Cajun | 681 | 1.2% |
| Canadian | 62 | 0.1% |
| Celtic | 6 | 0.0% |
| Central American | 283 | 0.5% |
| Cherokee | 270 | 0.5% |
| Choctaw | 48 | 0.1% |
| Colombian | 14 | 0.0% |
| Comanche | 15 | 0.0% |
| Costa Rican | 11 | 0.0% |
| Cuban | 8 | 0.0% |
| Czech | 235 | 0.4% |
| Czechoslovakian | 48 | 0.1% |
| Danish | 97 | 0.2% |
| Dutch | 324 | 0.6% |
| Eastern European | 133 | 0.2% |
| Egyptian | 42 | 0.1% |
| English | 5,588 | 9.9% |
| European | 794 | 1.4% |
| Finnish | 14 | 0.0% |
| French | 4,614 | 8.2% |
| French American Indian | 42 | 0.1% |
| French Canadian | 398 | 0.7% |
| German | 5,980 | 10.6% |
| Greek | 45 | 0.1% |
| Guatemalan | 242 | 0.4% |
| Hungarian | 27 | 0.1% |
| Icelander | 3 | 0.0% |
| Indian (Asian) | 92 | 0.2% |
| Irish | 5,910 | 10.4% |
| Iroquois | 112 | 0.2% |
| Italian | 1,791 | 3.2% |
| Japanese | 22 | 0.0% |
| Korean | 37 | 0.1% |
| Lebanese | 8 | 0.0% |
| Lithuanian | 38 | 0.1% |
| Mexican | 2,832 | 5.0% |
| Navajo | 25 | 0.0% |
| Nicaraguan | 6 | 0.0% |
| Northern European | 45 | 0.1% |
| Norwegian | 135 | 0.2% |
| Pakistani | 7 | 0.0% |
| Panamanian | 24 | 0.0% |
| Peruvian | 13 | 0.0% |
| Polish | 546 | 1.0% |
| Puerto Rican | 107 | 0.2% |
| Romanian | 8 | 0.0% |
| Russian | 121 | 0.2% |
| Scandinavian | 164 | 0.3% |
| Scotch-Irish | 1,333 | 2.4% |
| Scottish | 870 | 1.5% |
| South American | 32 | 0.1% |
| Spaniard | 75 | 0.1% |
| Spanish | 64 | 0.1% |
| Spanish American | 29 | 0.1% |
| Sri Lankan | 204 | 0.4% |
| Subsaharan African | 226 | 0.4% |
| Swedish | 164 | 0.3% |
| Swiss | 8 | 0.0% |
| Thai | 138 | 0.2% |
| Venezuelan | 5 | 0.0% |
| Welsh | 357 | 0.6% |
| Yugoslavian | 16 | 0.0% | View All 70 Rows |
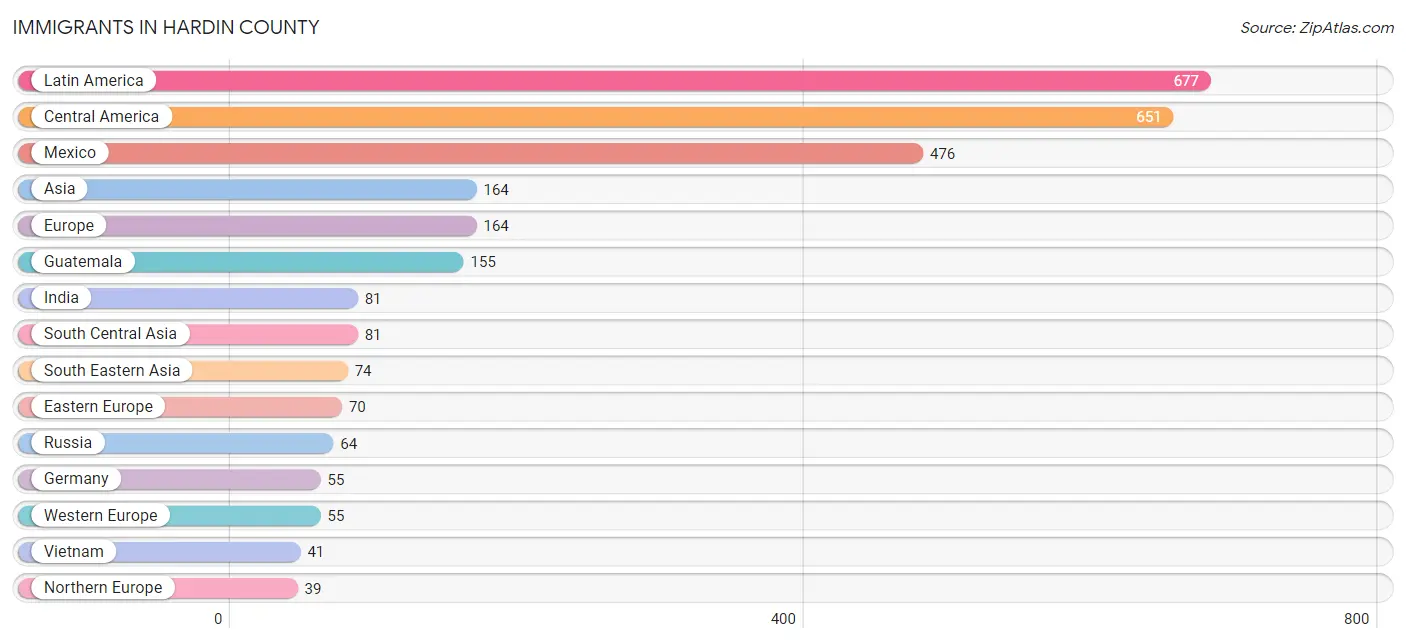
Immigrants in Hardin County
The most numerous immigrant groups reported in Hardin County came from Latin America (677 | 1.2%), Central America (651 | 1.1%), Mexico (476 | 0.8%), Asia (164 | 0.3%), and Europe (164 | 0.3%), together accounting for 3.8% of all Hardin County residents.
| Immigration Origin | # Population | % Population |
| Asia | 164 | 0.3% |
| Central America | 651 | 1.1% |
| China | 9 | 0.0% |
| Colombia | 14 | 0.0% |
| Eastern Asia | 9 | 0.0% |
| Eastern Europe | 70 | 0.1% |
| Europe | 164 | 0.3% |
| Germany | 55 | 0.1% |
| Guatemala | 155 | 0.3% |
| India | 81 | 0.1% |
| Latin America | 677 | 1.2% |
| Mexico | 476 | 0.8% |
| Northern Europe | 39 | 0.1% |
| Panama | 20 | 0.0% |
| Peru | 7 | 0.0% |
| Philippines | 33 | 0.1% |
| Poland | 6 | 0.0% |
| Russia | 64 | 0.1% |
| South America | 26 | 0.1% |
| South Central Asia | 81 | 0.1% |
| South Eastern Asia | 74 | 0.1% |
| Venezuela | 5 | 0.0% |
| Vietnam | 41 | 0.1% |
| Western Europe | 55 | 0.1% | View All 24 Rows |
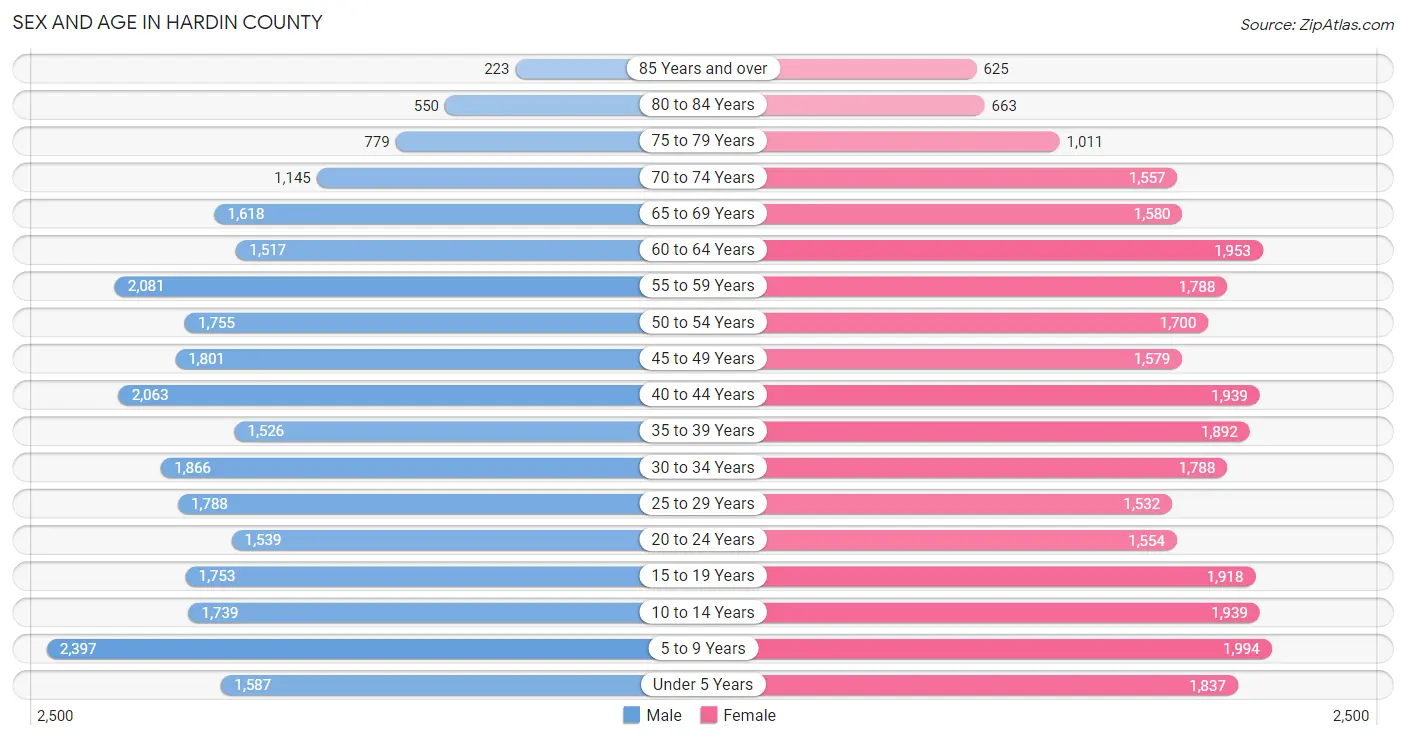
Sex and Age in Hardin County
Sex and Age in Hardin County
The most populous age groups in Hardin County are 5 to 9 Years (2,397 | 8.6%) for men and 5 to 9 Years (1,994 | 6.9%) for women.
| Age Bracket | Male | Female |
| Under 5 Years | 1,587 (5.7%) | 1,837 (6.4%) |
| 5 to 9 Years | 2,397 (8.6%) | 1,994 (6.9%) |
| 10 to 14 Years | 1,739 (6.3%) | 1,939 (6.7%) |
| 15 to 19 Years | 1,753 (6.3%) | 1,918 (6.7%) |
| 20 to 24 Years | 1,539 (5.6%) | 1,554 (5.4%) |
| 25 to 29 Years | 1,788 (6.5%) | 1,532 (5.3%) |
| 30 to 34 Years | 1,866 (6.7%) | 1,788 (6.2%) |
| 35 to 39 Years | 1,526 (5.5%) | 1,892 (6.6%) |
| 40 to 44 Years | 2,063 (7.4%) | 1,939 (6.7%) |
| 45 to 49 Years | 1,801 (6.5%) | 1,579 (5.5%) |
| 50 to 54 Years | 1,755 (6.3%) | 1,700 (5.9%) |
| 55 to 59 Years | 2,081 (7.5%) | 1,788 (6.2%) |
| 60 to 64 Years | 1,517 (5.5%) | 1,953 (6.8%) |
| 65 to 69 Years | 1,618 (5.8%) | 1,580 (5.5%) |
| 70 to 74 Years | 1,145 (4.1%) | 1,557 (5.4%) |
| 75 to 79 Years | 779 (2.8%) | 1,011 (3.5%) |
| 80 to 84 Years | 550 (2.0%) | 663 (2.3%) |
| 85 Years and over | 223 (0.8%) | 625 (2.2%) |
| Total | 27,727 (100.0%) | 28,849 (100.0%) |
Families and Households in Hardin County
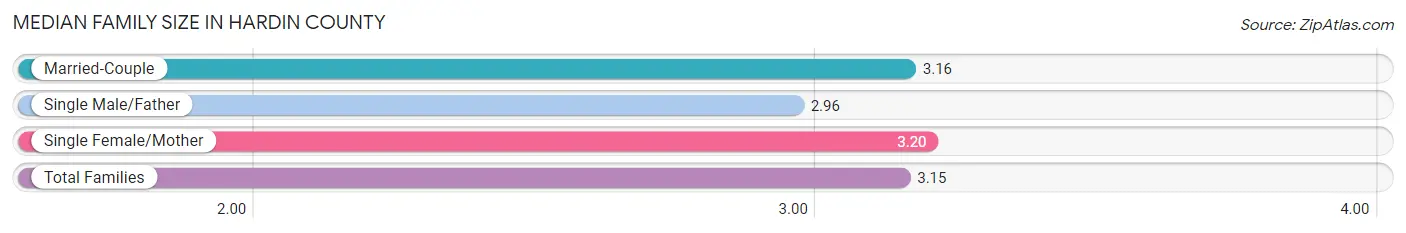
Median Family Size in Hardin County
The median family size in Hardin County is 3.15 persons per family, with single female/mother families (2,364 | 15.6%) accounting for the largest median family size of 3.2 persons per family. On the other hand, single male/father families (1,245 | 8.2%) represent the smallest median family size with 2.96 persons per family.
| Family Type | # Families | Family Size |
| Married-Couple | 11,566 (76.2%) | 3.16 |
| Single Male/Father | 1,245 (8.2%) | 2.96 |
| Single Female/Mother | 2,364 (15.6%) | 3.20 |
| Total Families | 15,175 (100.0%) | 3.15 |
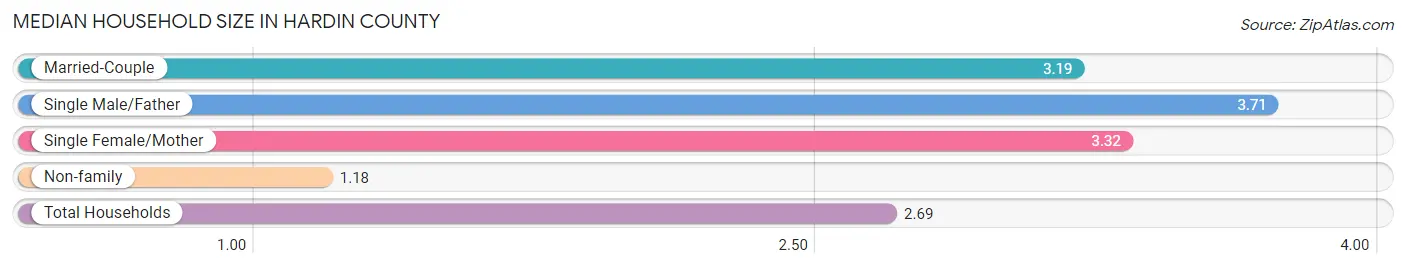
Median Household Size in Hardin County
The median household size in Hardin County is 2.69 persons per household, with single male/father households (1,245 | 6.0%) accounting for the largest median household size of 3.71 persons per household. non-family households (5,670 | 27.2%) represent the smallest median household size with 1.18 persons per household.
| Household Type | # Households | Household Size |
| Married-Couple | 11,566 (55.5%) | 3.19 |
| Single Male/Father | 1,245 (6.0%) | 3.71 |
| Single Female/Mother | 2,364 (11.3%) | 3.32 |
| Non-family | 5,670 (27.2%) | 1.18 |
| Total Households | 20,845 (100.0%) | 2.69 |
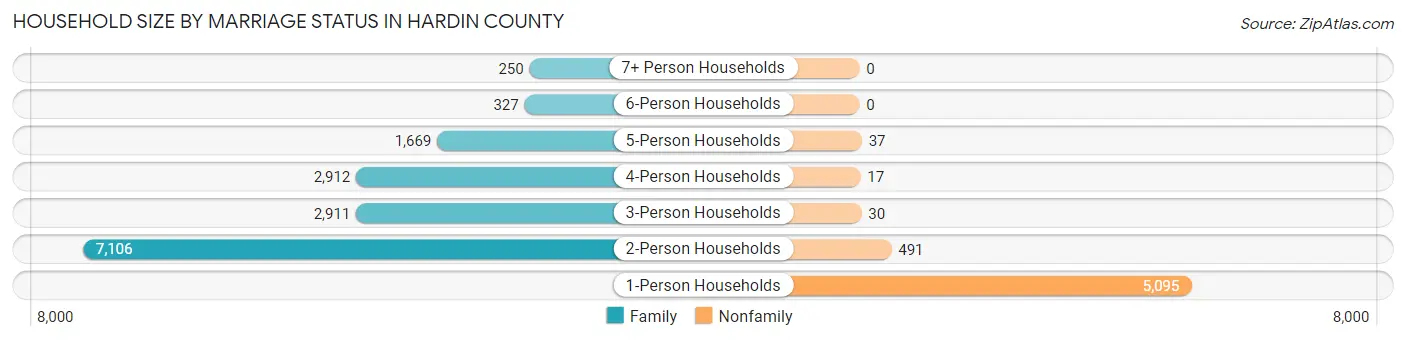
Household Size by Marriage Status in Hardin County
Out of a total of 20,845 households in Hardin County, 15,175 (72.8%) are family households, while 5,670 (27.2%) are nonfamily households. The most numerous type of family households are 2-person households, comprising 7,106, and the most common type of nonfamily households are 1-person households, comprising 5,095.
| Household Size | Family Households | Nonfamily Households |
| 1-Person Households | - | 5,095 (24.4%) |
| 2-Person Households | 7,106 (34.1%) | 491 (2.4%) |
| 3-Person Households | 2,911 (14.0%) | 30 (0.1%) |
| 4-Person Households | 2,912 (14.0%) | 17 (0.1%) |
| 5-Person Households | 1,669 (8.0%) | 37 (0.2%) |
| 6-Person Households | 327 (1.6%) | 0 (0.0%) |
| 7+ Person Households | 250 (1.2%) | 0 (0.0%) |
| Total | 15,175 (72.8%) | 5,670 (27.2%) |
Female Fertility in Hardin County
Fertility by Age in Hardin County
Average fertility rate in Hardin County is 53.0 births per 1,000 women. Women in the age bracket of 20 to 34 years have the highest fertility rate with 97.0 births per 1,000 women. Women in the age bracket of 20 to 34 years acount for 70.6% of all women with births.
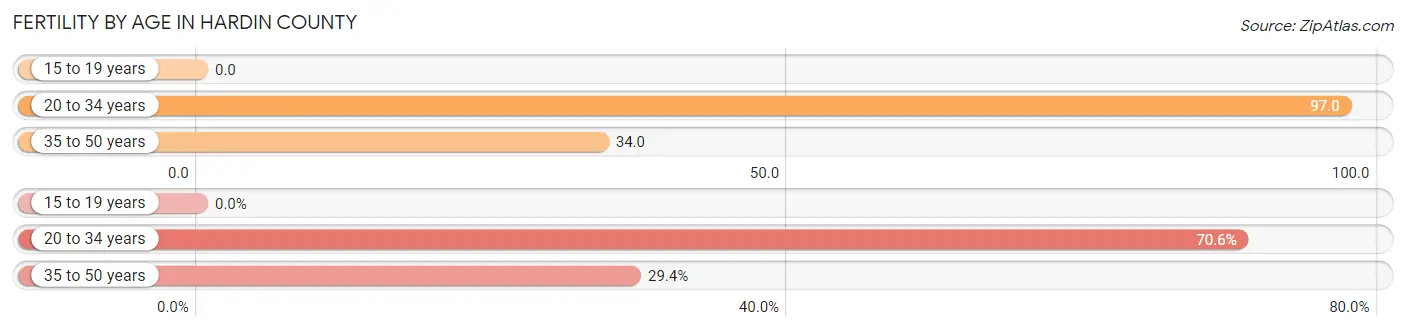
| Age Bracket | Women with Births | Births / 1,000 Women |
| 15 to 19 years | 0 (0.0%) | 0.0 |
| 20 to 34 years | 471 (70.6%) | 97.0 |
| 35 to 50 years | 196 (29.4%) | 34.0 |
| Total | 667 (100.0%) | 53.0 |
Fertility by Age by Marriage Status in Hardin County
68.4% of women with births (667) in Hardin County are married. The highest percentage of unmarried women with births falls into 35 to 50 years age bracket with 32.1% of them unmarried at the time of birth, while the lowest percentage of unmarried women with births belong to 20 to 34 years age bracket with 31.4% of them unmarried.
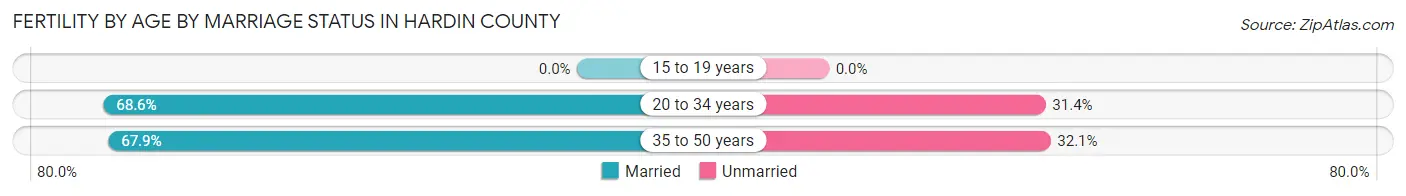
| Age Bracket | Married | Unmarried |
| 15 to 19 years | 0 (0.0%) | 0 (0.0%) |
| 20 to 34 years | 323 (68.6%) | 148 (31.4%) |
| 35 to 50 years | 133 (67.9%) | 63 (32.1%) |
| Total | 456 (68.4%) | 211 (31.6%) |
Fertility by Education in Hardin County
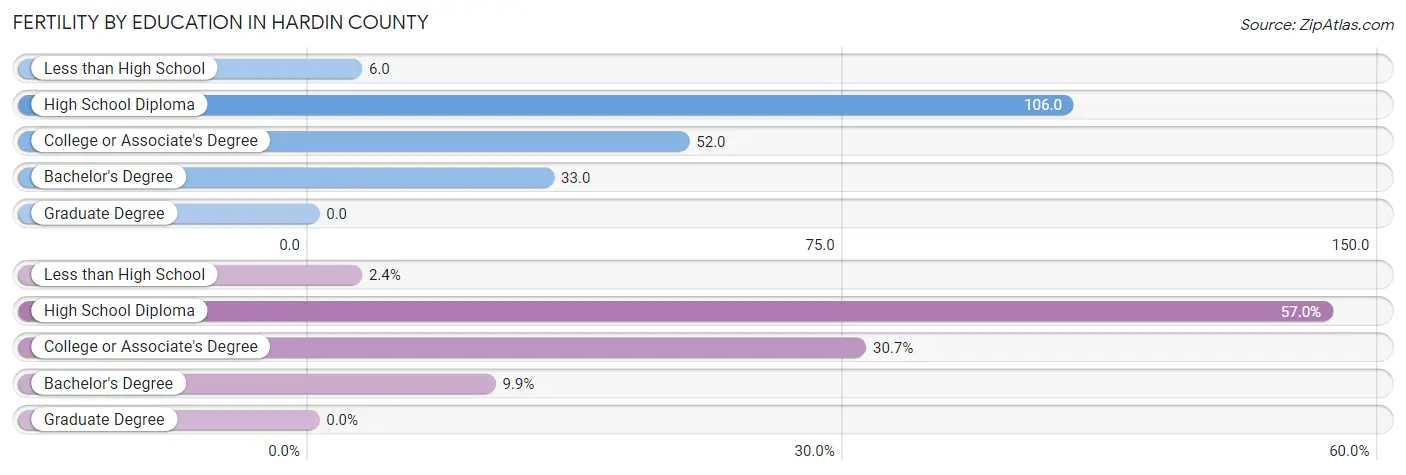
| Educational Attainment | Women with Births | Births / 1,000 Women |
| Less than High School | 16 (2.4%) | 6.0 |
| High School Diploma | 380 (57.0%) | 106.0 |
| College or Associate's Degree | 205 (30.7%) | 52.0 |
| Bachelor's Degree | 66 (9.9%) | 33.0 |
| Graduate Degree | 0 (0.0%) | 0.0 |
| Total | 667 (100.0%) | 53.0 |
Fertility by Education by Marriage Status in Hardin County
31.6% of women with births in Hardin County are unmarried. Women with the educational attainment of high school diploma are most likely to be married with 80.0% of them married at childbirth, while women with the educational attainment of less than high school are least likely to be married with 100.0% of them unmarried at childbirth.
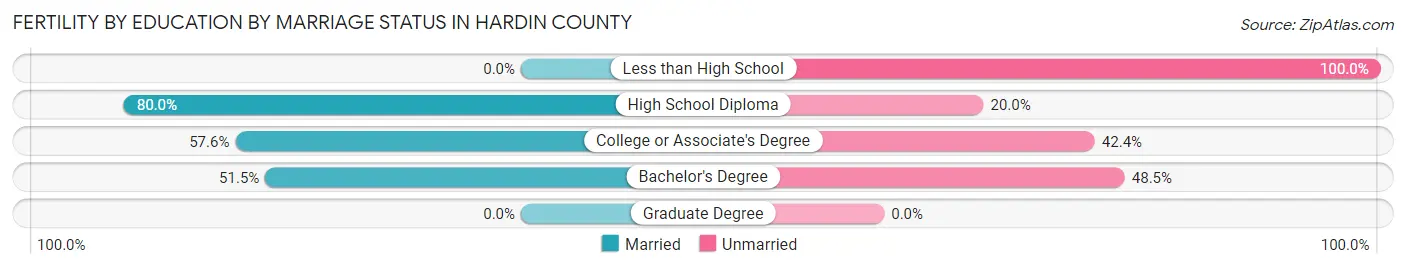
| Educational Attainment | Married | Unmarried |
| Less than High School | 0 (0.0%) | 16 (100.0%) |
| High School Diploma | 304 (80.0%) | 76 (20.0%) |
| College or Associate's Degree | 118 (57.6%) | 87 (42.4%) |
| Bachelor's Degree | 34 (51.5%) | 32 (48.5%) |
| Graduate Degree | 0 (0.0%) | 0 (0.0%) |
| Total | 456 (68.4%) | 211 (31.6%) |
Employment Characteristics in Hardin County
Employment by Class of Employer in Hardin County
Among the 23,503 employed individuals in Hardin County, private company employees (17,926 | 76.3%), local government employees (1,764 | 7.5%), and self-employed (not incorporated) (1,066 | 4.5%) make up the most common classes of employment.
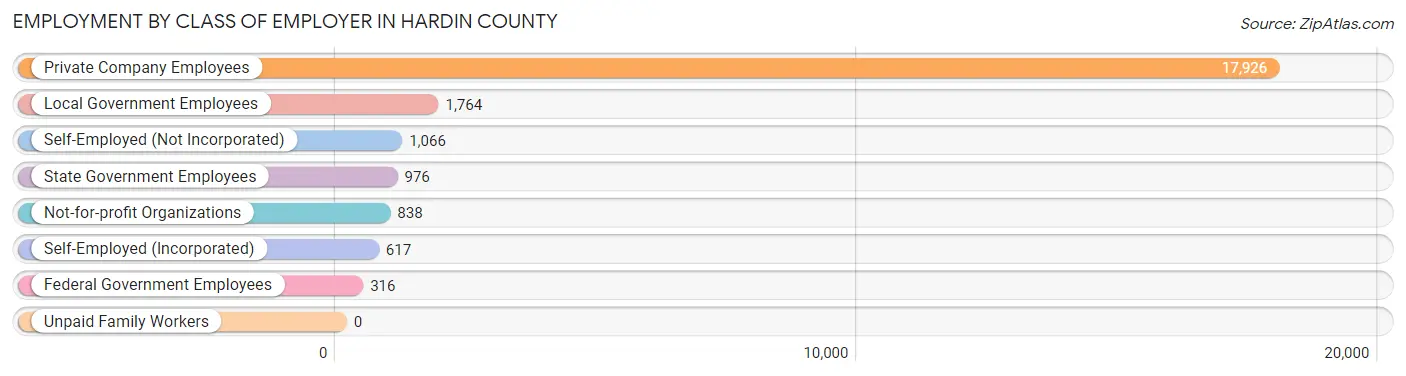
| Employer Class | # Employees | % Employees |
| Private Company Employees | 17,926 | 76.3% |
| Self-Employed (Incorporated) | 617 | 2.6% |
| Self-Employed (Not Incorporated) | 1,066 | 4.5% |
| Not-for-profit Organizations | 838 | 3.6% |
| Local Government Employees | 1,764 | 7.5% |
| State Government Employees | 976 | 4.2% |
| Federal Government Employees | 316 | 1.3% |
| Unpaid Family Workers | 0 | 0.0% |
| Total | 23,503 | 100.0% |
Employment Status by Age in Hardin County
According to the labor force statistics for Hardin County, out of the total population over 16 years of age (44,379), 56.8% or 25,207 individuals are in the labor force, with 4.6% or 1,160 of them unemployed. The age group with the highest labor force participation rate is 20 to 24 years, with 84.7% or 2,620 individuals in the labor force. Within the labor force, the 20 to 24 years age range has the highest percentage of unemployed individuals, with 19.4% or 508 of them being unemployed.
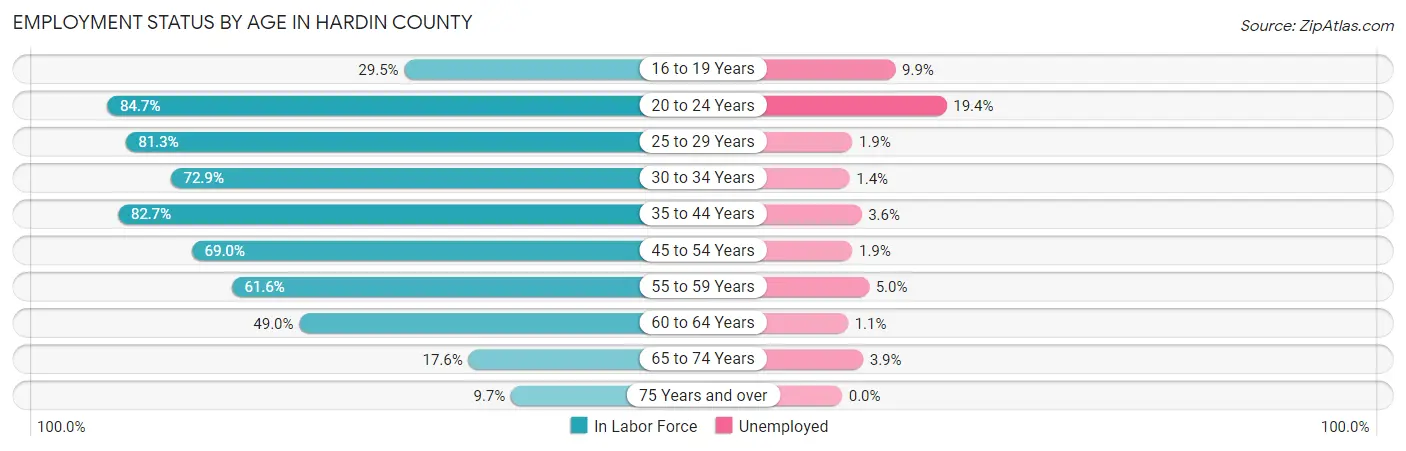
| Age Bracket | In Labor Force | Unemployed |
| 16 to 19 Years | 875 (29.5%) | 87 (9.9%) |
| 20 to 24 Years | 2,620 (84.7%) | 508 (19.4%) |
| 25 to 29 Years | 2,699 (81.3%) | 51 (1.9%) |
| 30 to 34 Years | 2,664 (72.9%) | 37 (1.4%) |
| 35 to 44 Years | 6,136 (82.7%) | 221 (3.6%) |
| 45 to 54 Years | 4,716 (69.0%) | 90 (1.9%) |
| 55 to 59 Years | 2,383 (61.6%) | 119 (5.0%) |
| 60 to 64 Years | 1,700 (49.0%) | 19 (1.1%) |
| 65 to 74 Years | 1,038 (17.6%) | 40 (3.9%) |
| 75 Years and over | 374 (9.7%) | 0 (0.0%) |
| Total | 25,207 (56.8%) | 1,160 (4.6%) |
Employment Status by Educational Attainment in Hardin County
According to labor force statistics for Hardin County, 71.1% of individuals (20,312) out of the total population between 25 and 64 years of age (28,568) are in the labor force, with 2.6% or 528 of them being unemployed. The group with the highest labor force participation rate are those with the educational attainment of bachelor's degree or higher, with 87.3% or 5,045 individuals in the labor force. Within the labor force, individuals with less than high school education have the highest percentage of unemployment, with 17.0% or 231 of them being unemployed.
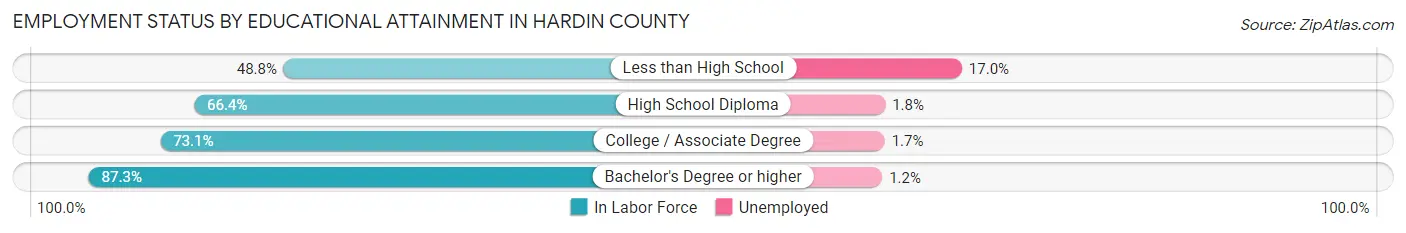
| Educational Attainment | In Labor Force | Unemployed |
| Less than High School | 1,356 (48.8%) | 472 (17.0%) |
| High School Diploma | 7,142 (66.4%) | 194 (1.8%) |
| College / Associate Degree | 6,765 (73.1%) | 157 (1.7%) |
| Bachelor's Degree or higher | 5,045 (87.3%) | 69 (1.2%) |
| Total | 20,312 (71.1%) | 743 (2.6%) |
Employment Occupations by Sex in Hardin County
Management, Business, Science and Arts Occupations
The most common Management, Business, Science and Arts occupations in Hardin County are Management (2,650 | 11.0%), Community & Social Service (2,013 | 8.4%), Health Diagnosing & Treating (1,798 | 7.5%), Education Instruction & Library (1,236 | 5.1%), and Health Technologists (1,199 | 5.0%).
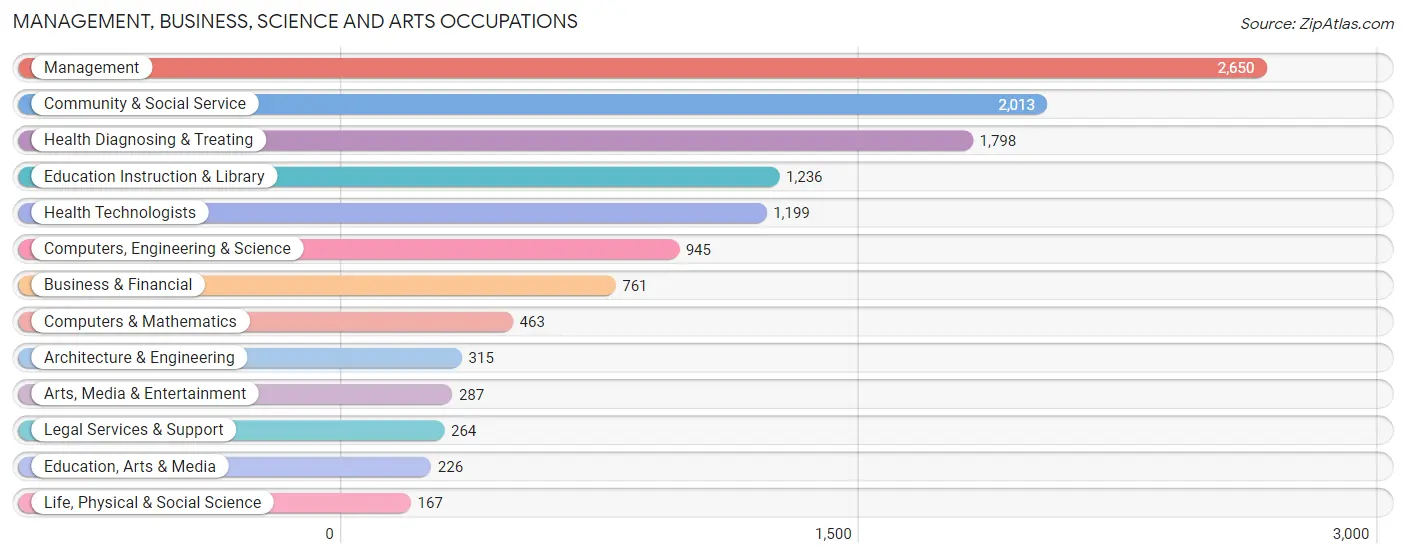
Management, Business, Science and Arts Occupations by Sex
Within the Management, Business, Science and Arts occupations in Hardin County, the most male-oriented occupations are Architecture & Engineering (98.4%), Life, Physical & Social Science (95.2%), and Computers, Engineering & Science (92.6%), while the most female-oriented occupations are Legal Services & Support (84.5%), Education Instruction & Library (83.7%), and Health Technologists (83.1%).
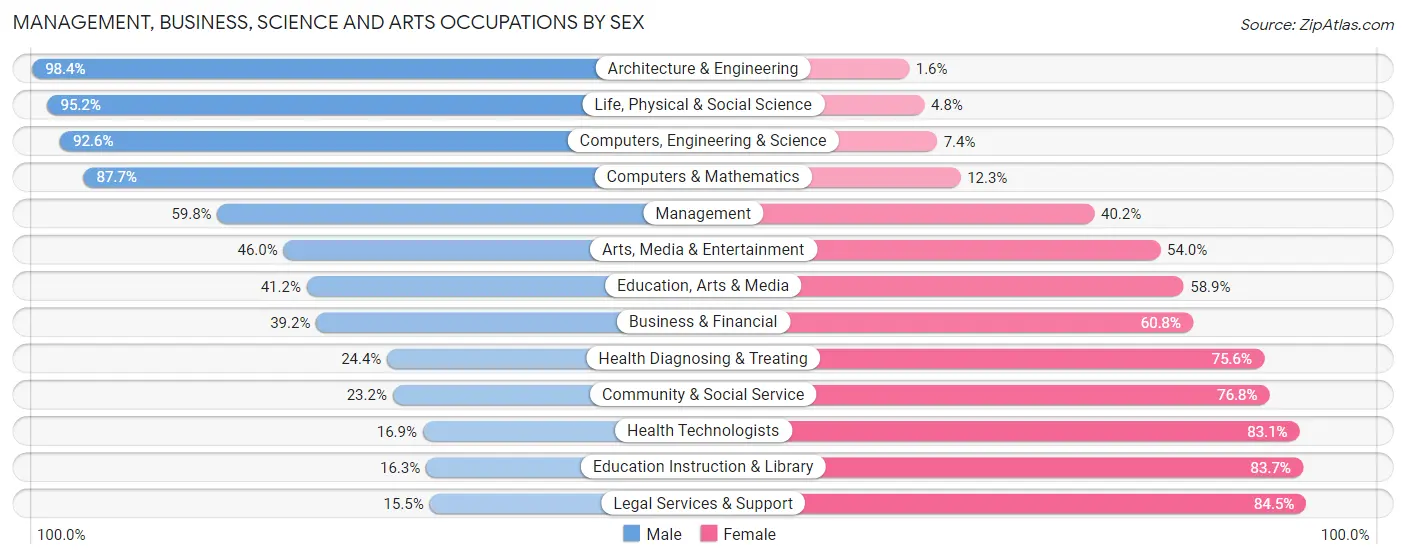
| Occupation | Male | Female |
| Management | 1,584 (59.8%) | 1,066 (40.2%) |
| Business & Financial | 298 (39.2%) | 463 (60.8%) |
| Computers, Engineering & Science | 875 (92.6%) | 70 (7.4%) |
| Computers & Mathematics | 406 (87.7%) | 57 (12.3%) |
| Architecture & Engineering | 310 (98.4%) | 5 (1.6%) |
| Life, Physical & Social Science | 159 (95.2%) | 8 (4.8%) |
| Community & Social Service | 467 (23.2%) | 1,546 (76.8%) |
| Education, Arts & Media | 93 (41.1%) | 133 (58.9%) |
| Legal Services & Support | 41 (15.5%) | 223 (84.5%) |
| Education Instruction & Library | 201 (16.3%) | 1,035 (83.7%) |
| Arts, Media & Entertainment | 132 (46.0%) | 155 (54.0%) |
| Health Diagnosing & Treating | 438 (24.4%) | 1,360 (75.6%) |
| Health Technologists | 203 (16.9%) | 996 (83.1%) |
| Total (Category) | 3,662 (44.8%) | 4,505 (55.2%) |
| Total (Overall) | 13,508 (56.3%) | 10,496 (43.7%) |
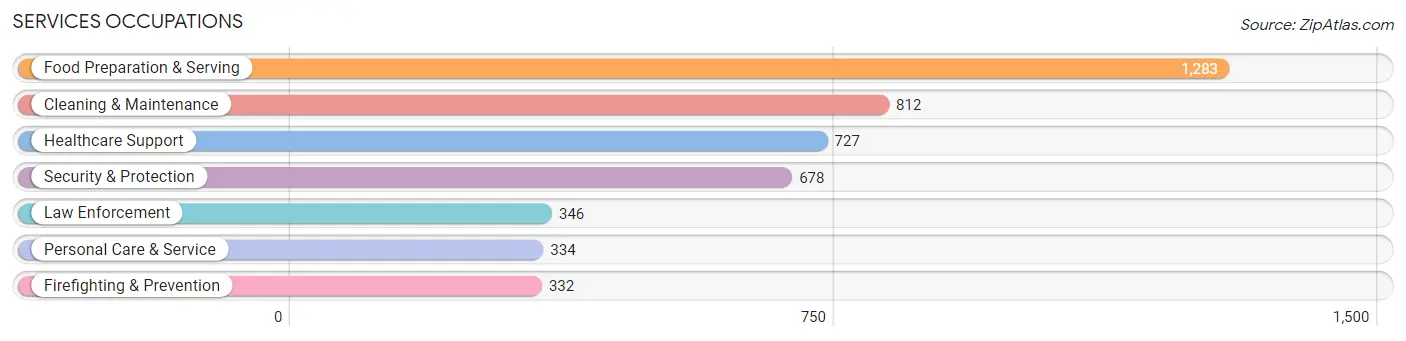
Services Occupations
The most common Services occupations in Hardin County are Food Preparation & Serving (1,283 | 5.3%), Cleaning & Maintenance (812 | 3.4%), Healthcare Support (727 | 3.0%), Security & Protection (678 | 2.8%), and Law Enforcement (346 | 1.4%).
Services Occupations by Sex
Within the Services occupations in Hardin County, the most male-oriented occupations are Firefighting & Prevention (94.9%), Security & Protection (80.5%), and Law Enforcement (66.8%), while the most female-oriented occupations are Personal Care & Service (95.8%), Healthcare Support (87.6%), and Cleaning & Maintenance (61.3%).
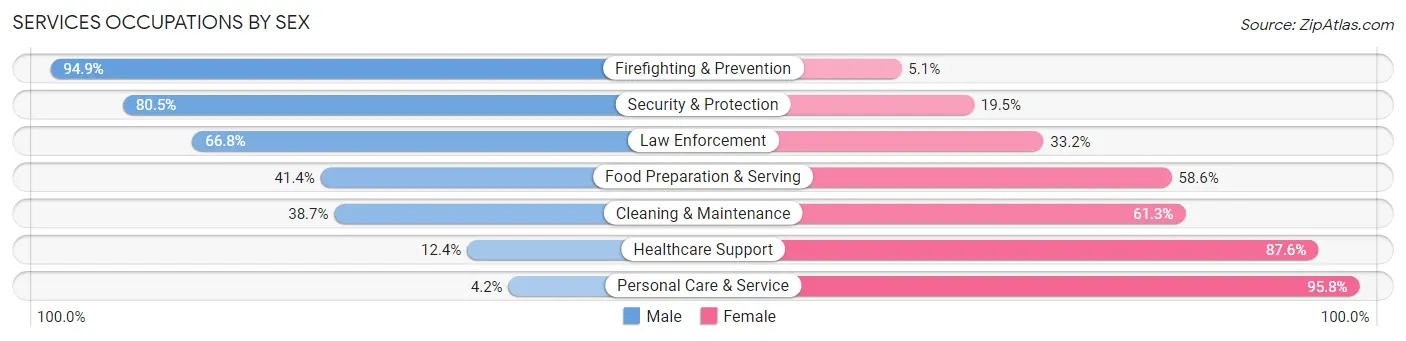
| Occupation | Male | Female |
| Healthcare Support | 90 (12.4%) | 637 (87.6%) |
| Security & Protection | 546 (80.5%) | 132 (19.5%) |
| Firefighting & Prevention | 315 (94.9%) | 17 (5.1%) |
| Law Enforcement | 231 (66.8%) | 115 (33.2%) |
| Food Preparation & Serving | 531 (41.4%) | 752 (58.6%) |
| Cleaning & Maintenance | 314 (38.7%) | 498 (61.3%) |
| Personal Care & Service | 14 (4.2%) | 320 (95.8%) |
| Total (Category) | 1,495 (39.0%) | 2,339 (61.0%) |
| Total (Overall) | 13,508 (56.3%) | 10,496 (43.7%) |
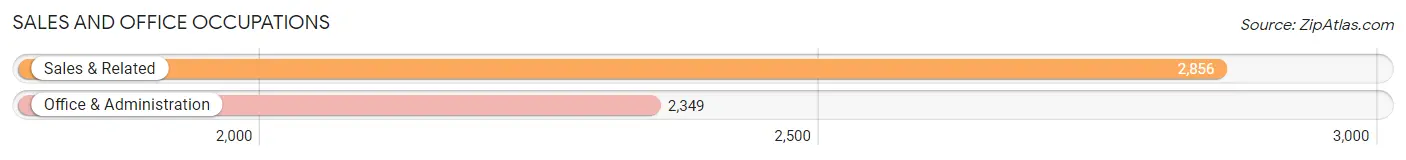
Sales and Office Occupations
The most common Sales and Office occupations in Hardin County are Sales & Related (2,856 | 11.9%), and Office & Administration (2,349 | 9.8%).
Sales and Office Occupations by Sex
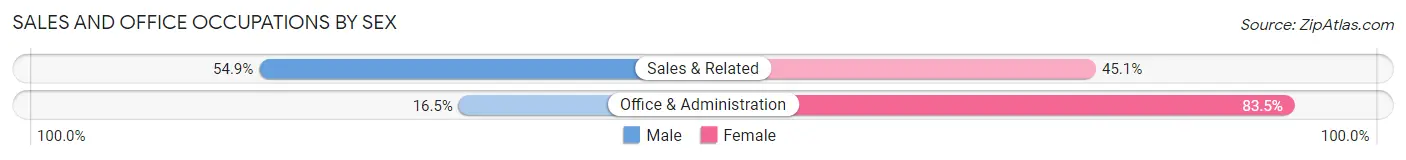
| Occupation | Male | Female |
| Sales & Related | 1,568 (54.9%) | 1,288 (45.1%) |
| Office & Administration | 388 (16.5%) | 1,961 (83.5%) |
| Total (Category) | 1,956 (37.6%) | 3,249 (62.4%) |
| Total (Overall) | 13,508 (56.3%) | 10,496 (43.7%) |
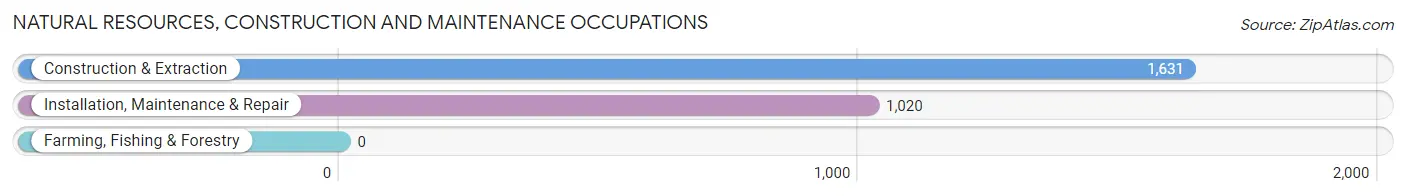
Natural Resources, Construction and Maintenance Occupations
The most common Natural Resources, Construction and Maintenance occupations in Hardin County are Construction & Extraction (1,631 | 6.8%), and Installation, Maintenance & Repair (1,020 | 4.3%).
Natural Resources, Construction and Maintenance Occupations by Sex
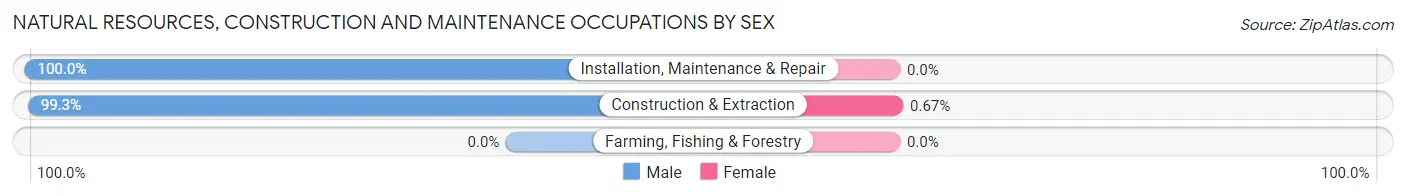
| Occupation | Male | Female |
| Farming, Fishing & Forestry | 0 (0.0%) | 0 (0.0%) |
| Construction & Extraction | 1,620 (99.3%) | 11 (0.7%) |
| Installation, Maintenance & Repair | 1,020 (100.0%) | 0 (0.0%) |
| Total (Category) | 2,640 (99.6%) | 11 (0.4%) |
| Total (Overall) | 13,508 (56.3%) | 10,496 (43.7%) |
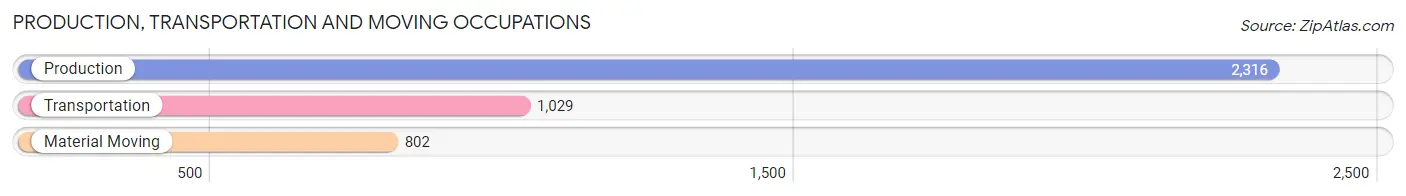
Production, Transportation and Moving Occupations
The most common Production, Transportation and Moving occupations in Hardin County are Production (2,316 | 9.7%), Transportation (1,029 | 4.3%), and Material Moving (802 | 3.3%).
Production, Transportation and Moving Occupations by Sex
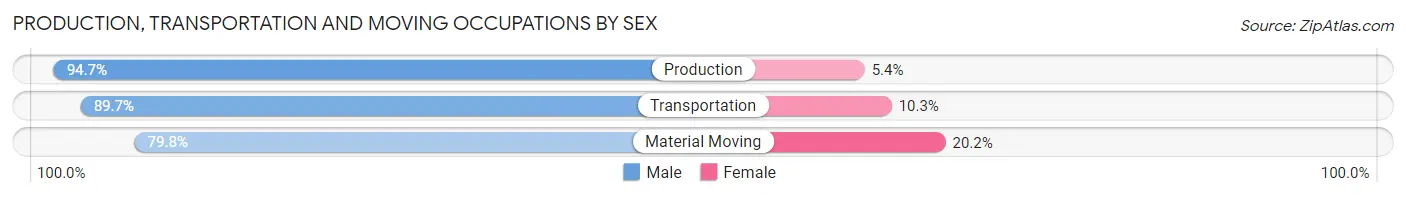
| Occupation | Male | Female |
| Production | 2,192 (94.7%) | 124 (5.3%) |
| Transportation | 923 (89.7%) | 106 (10.3%) |
| Material Moving | 640 (79.8%) | 162 (20.2%) |
| Total (Category) | 3,755 (90.5%) | 392 (9.5%) |
| Total (Overall) | 13,508 (56.3%) | 10,496 (43.7%) |
Employment Industries by Sex in Hardin County
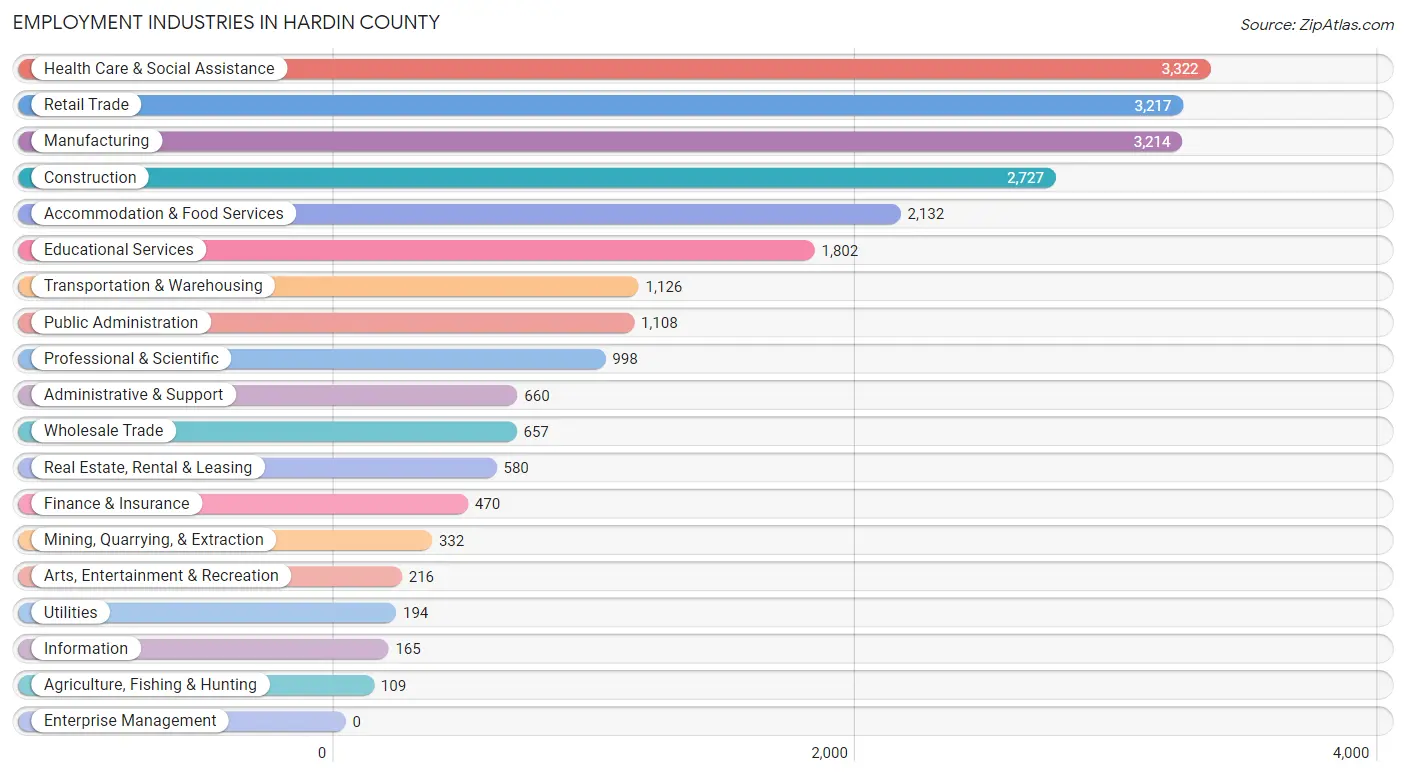
Employment Industries in Hardin County
The major employment industries in Hardin County include Health Care & Social Assistance (3,322 | 13.8%), Retail Trade (3,217 | 13.4%), Manufacturing (3,214 | 13.4%), Construction (2,727 | 11.4%), and Accommodation & Food Services (2,132 | 8.9%).
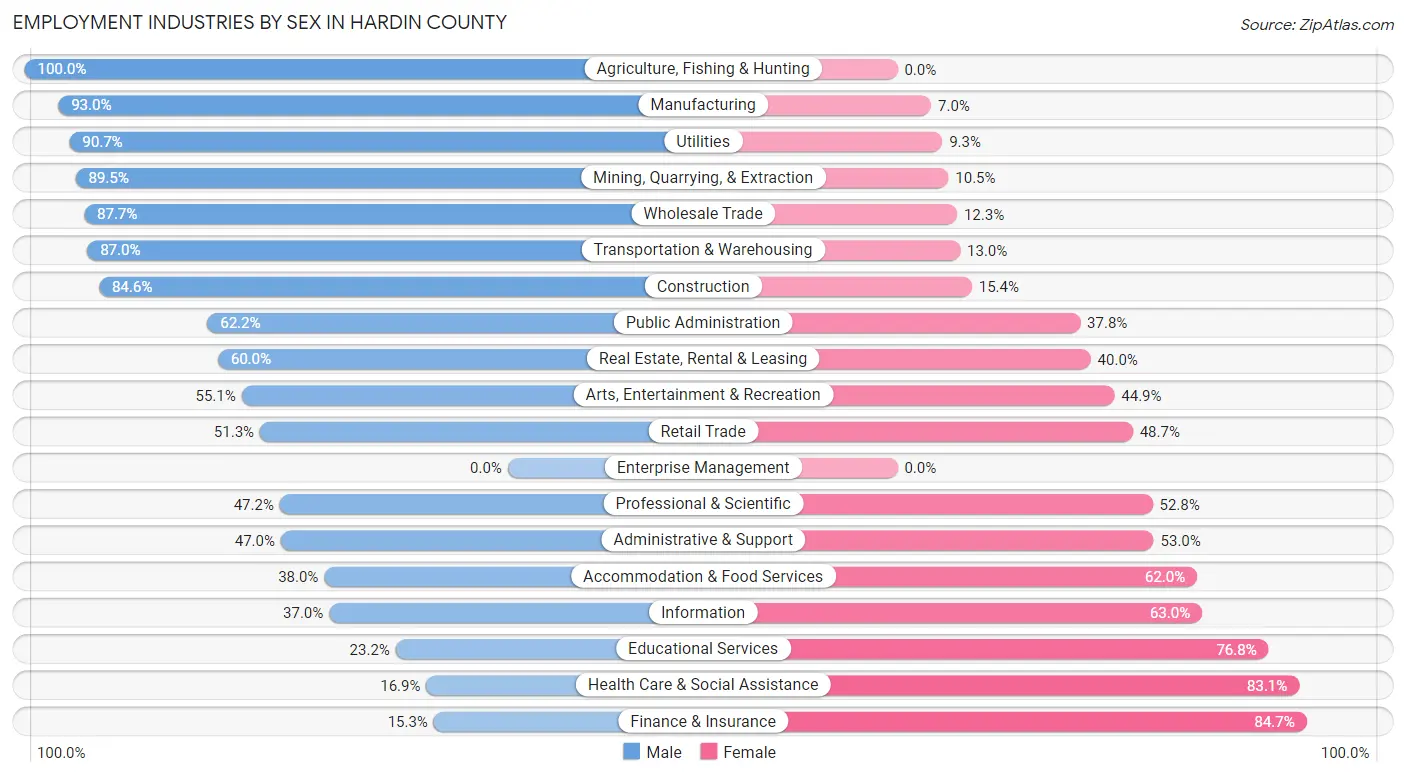
Employment Industries by Sex in Hardin County
The Hardin County industries that see more men than women are Agriculture, Fishing & Hunting (100.0%), Manufacturing (93.0%), and Utilities (90.7%), whereas the industries that tend to have a higher number of women are Finance & Insurance (84.7%), Health Care & Social Assistance (83.1%), and Educational Services (76.8%).
| Industry | Male | Female |
| Agriculture, Fishing & Hunting | 109 (100.0%) | 0 (0.0%) |
| Mining, Quarrying, & Extraction | 297 (89.5%) | 35 (10.5%) |
| Construction | 2,307 (84.6%) | 420 (15.4%) |
| Manufacturing | 2,990 (93.0%) | 224 (7.0%) |
| Wholesale Trade | 576 (87.7%) | 81 (12.3%) |
| Retail Trade | 1,650 (51.3%) | 1,567 (48.7%) |
| Transportation & Warehousing | 980 (87.0%) | 146 (13.0%) |
| Utilities | 176 (90.7%) | 18 (9.3%) |
| Information | 61 (37.0%) | 104 (63.0%) |
| Finance & Insurance | 72 (15.3%) | 398 (84.7%) |
| Real Estate, Rental & Leasing | 348 (60.0%) | 232 (40.0%) |
| Professional & Scientific | 471 (47.2%) | 527 (52.8%) |
| Enterprise Management | 0 (0.0%) | 0 (0.0%) |
| Administrative & Support | 310 (47.0%) | 350 (53.0%) |
| Educational Services | 418 (23.2%) | 1,384 (76.8%) |
| Health Care & Social Assistance | 560 (16.9%) | 2,762 (83.1%) |
| Arts, Entertainment & Recreation | 119 (55.1%) | 97 (44.9%) |
| Accommodation & Food Services | 810 (38.0%) | 1,322 (62.0%) |
| Public Administration | 689 (62.2%) | 419 (37.8%) |
| Total | 13,508 (56.3%) | 10,496 (43.7%) |
Education in Hardin County
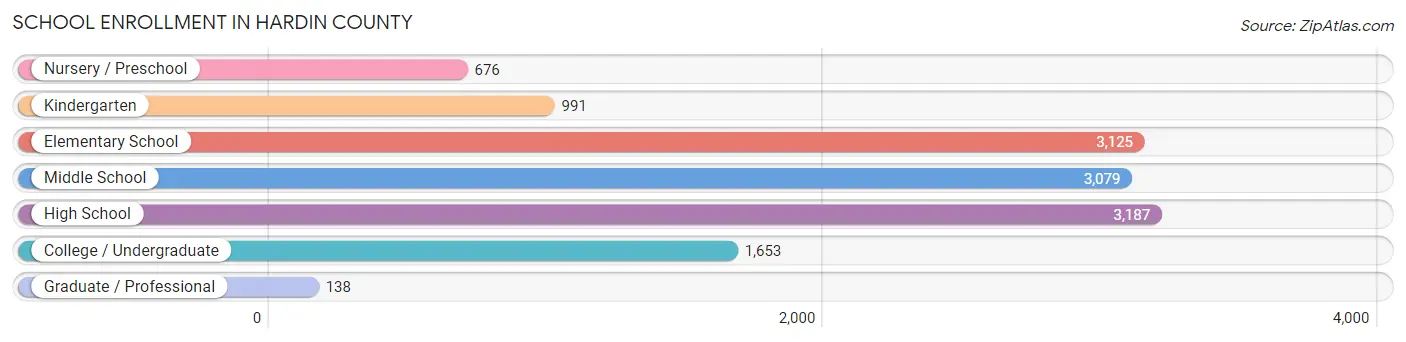
School Enrollment in Hardin County
The most common levels of schooling among the 12,849 students in Hardin County are high school (3,187 | 24.8%), elementary school (3,125 | 24.3%), and middle school (3,079 | 24.0%).
| School Level | # Students | % Students |
| Nursery / Preschool | 676 | 5.3% |
| Kindergarten | 991 | 7.7% |
| Elementary School | 3,125 | 24.3% |
| Middle School | 3,079 | 24.0% |
| High School | 3,187 | 24.8% |
| College / Undergraduate | 1,653 | 12.9% |
| Graduate / Professional | 138 | 1.1% |
| Total | 12,849 | 100.0% |
School Enrollment by Age by Funding Source in Hardin County
Out of a total of 12,849 students who are enrolled in schools in Hardin County, 1,773 (13.8%) attend a private institution, while the remaining 11,076 (86.2%) are enrolled in public schools. The age group of 3 to 4 year olds has the highest likelihood of being enrolled in private schools, with 135 (42.1% in the age bracket) enrolled. Conversely, the age group of 18 to 19 year olds has the lowest likelihood of being enrolled in a private school, with 934 (97.2% in the age bracket) attending a public institution.
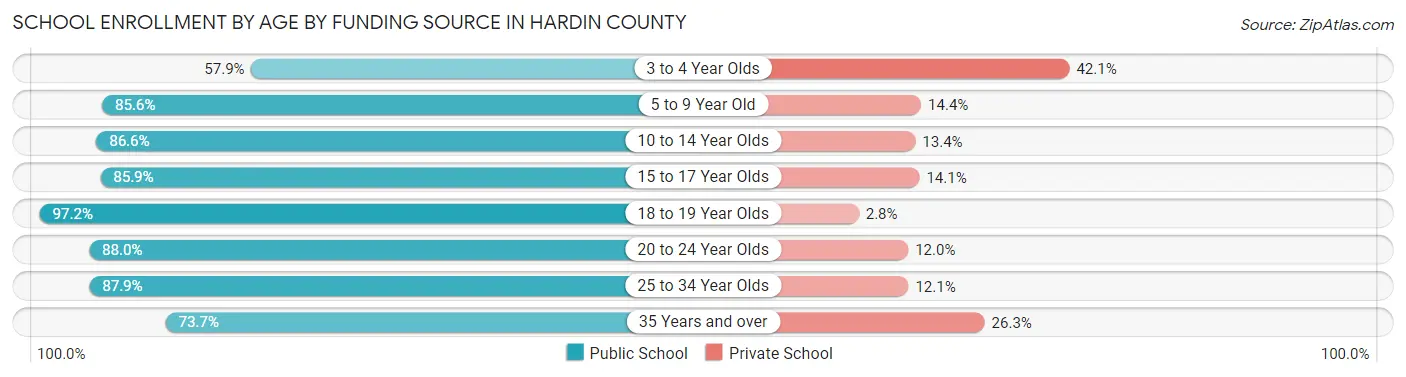
| Age Bracket | Public School | Private School |
| 3 to 4 Year Olds | 186 (57.9%) | 135 (42.1%) |
| 5 to 9 Year Old | 3,564 (85.6%) | 601 (14.4%) |
| 10 to 14 Year Olds | 3,151 (86.6%) | 486 (13.4%) |
| 15 to 17 Year Olds | 1,946 (85.9%) | 320 (14.1%) |
| 18 to 19 Year Olds | 934 (97.2%) | 27 (2.8%) |
| 20 to 24 Year Olds | 724 (88.0%) | 99 (12.0%) |
| 25 to 34 Year Olds | 437 (87.9%) | 60 (12.1%) |
| 35 Years and over | 132 (73.7%) | 47 (26.3%) |
| Total | 11,076 (86.2%) | 1,773 (13.8%) |
Educational Attainment by Field of Study in Hardin County
Business (1,247 | 16.4%), education (1,168 | 15.4%), arts & humanities (957 | 12.6%), science & technology (905 | 11.9%), and engineering (540 | 7.1%) are the most common fields of study among 7,588 individuals in Hardin County who have obtained a bachelor's degree or higher.

| Field of Study | # Graduates | % Graduates |
| Computers & Mathematics | 407 | 5.4% |
| Bio, Nature & Agricultural | 531 | 7.0% |
| Physical & Health Sciences | 67 | 0.9% |
| Psychology | 402 | 5.3% |
| Social Sciences | 289 | 3.8% |
| Engineering | 540 | 7.1% |
| Multidisciplinary Studies | 63 | 0.8% |
| Science & Technology | 905 | 11.9% |
| Business | 1,247 | 16.4% |
| Education | 1,168 | 15.4% |
| Literature & Languages | 166 | 2.2% |
| Liberal Arts & History | 363 | 4.8% |
| Visual & Performing Arts | 235 | 3.1% |
| Communications | 248 | 3.3% |
| Arts & Humanities | 957 | 12.6% |
| Total | 7,588 | 100.0% |
Transportation & Commute in Hardin County
Vehicle Availability by Sex in Hardin County
The most prevalent vehicle ownership categories in Hardin County are males with 2 vehicles (5,864, accounting for 44.2%) and females with 2 vehicles (4,366, making up 57.3%).
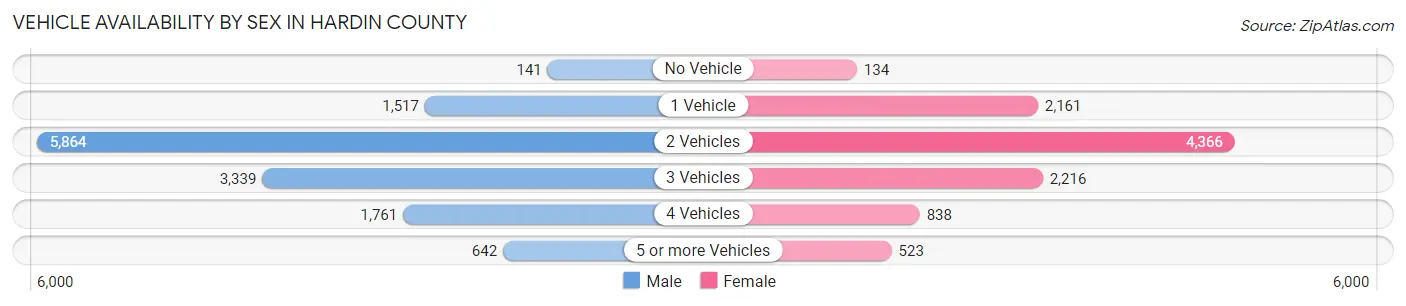
| Vehicles Available | Male | Female |
| No Vehicle | 141 (1.1%) | 134 (1.3%) |
| 1 Vehicle | 1,517 (11.4%) | 2,161 (21.1%) |
| 2 Vehicles | 5,864 (44.2%) | 4,366 (42.6%) |
| 3 Vehicles | 3,339 (25.2%) | 2,216 (21.6%) |
| 4 Vehicles | 1,761 (13.3%) | 838 (8.2%) |
| 5 or more Vehicles | 642 (4.8%) | 523 (5.1%) |
| Total | 13,264 (100.0%) | 10,238 (100.0%) |
Commute Time in Hardin County
The most frequently occuring commute durations in Hardin County are 30 to 34 minutes (4,700 commuters, 20.8%), 15 to 19 minutes (2,793 commuters, 12.4%), and 20 to 24 minutes (2,662 commuters, 11.8%).
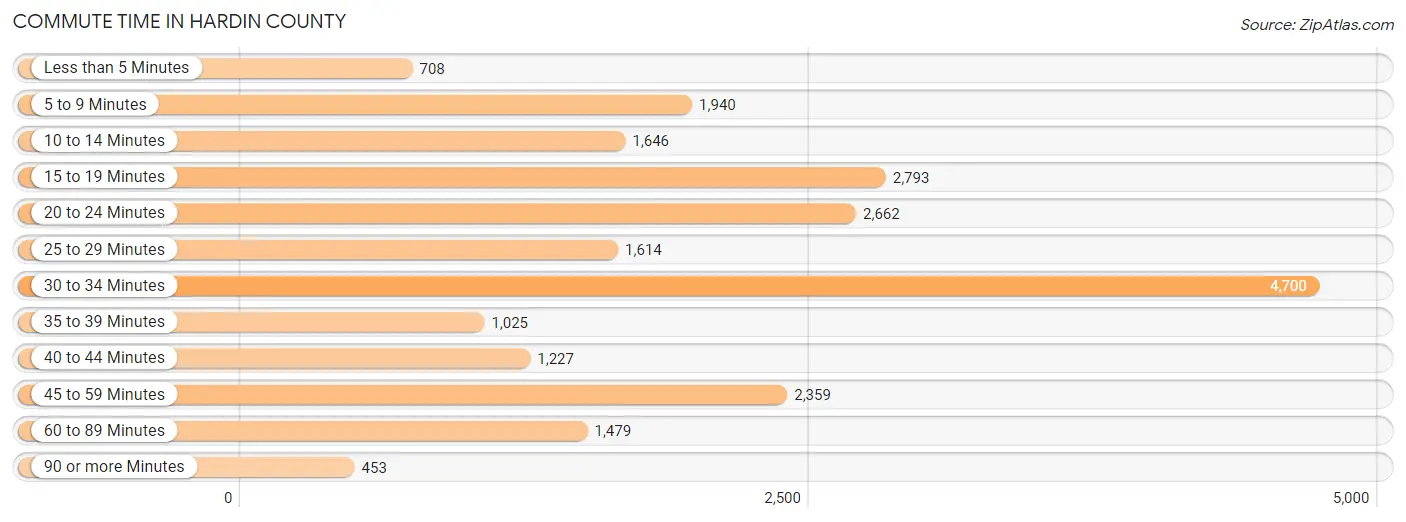
| Commute Time | # Commuters | % Commuters |
| Less than 5 Minutes | 708 | 3.1% |
| 5 to 9 Minutes | 1,940 | 8.6% |
| 10 to 14 Minutes | 1,646 | 7.3% |
| 15 to 19 Minutes | 2,793 | 12.4% |
| 20 to 24 Minutes | 2,662 | 11.8% |
| 25 to 29 Minutes | 1,614 | 7.1% |
| 30 to 34 Minutes | 4,700 | 20.8% |
| 35 to 39 Minutes | 1,025 | 4.5% |
| 40 to 44 Minutes | 1,227 | 5.4% |
| 45 to 59 Minutes | 2,359 | 10.4% |
| 60 to 89 Minutes | 1,479 | 6.5% |
| 90 or more Minutes | 453 | 2.0% |
Commute Time by Sex in Hardin County
The most common commute times in Hardin County are 30 to 34 minutes (2,900 commuters, 22.5%) for males and 30 to 34 minutes (1,800 commuters, 18.5%) for females.
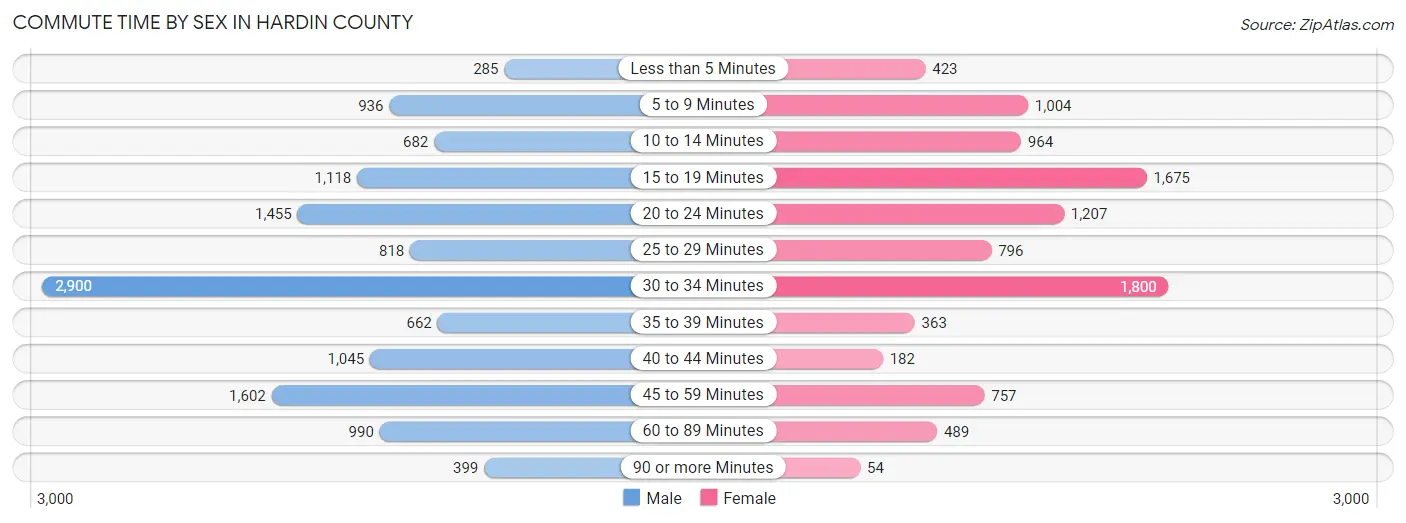
| Commute Time | Male | Female |
| Less than 5 Minutes | 285 (2.2%) | 423 (4.3%) |
| 5 to 9 Minutes | 936 (7.3%) | 1,004 (10.3%) |
| 10 to 14 Minutes | 682 (5.3%) | 964 (9.9%) |
| 15 to 19 Minutes | 1,118 (8.7%) | 1,675 (17.2%) |
| 20 to 24 Minutes | 1,455 (11.3%) | 1,207 (12.4%) |
| 25 to 29 Minutes | 818 (6.4%) | 796 (8.2%) |
| 30 to 34 Minutes | 2,900 (22.5%) | 1,800 (18.5%) |
| 35 to 39 Minutes | 662 (5.1%) | 363 (3.7%) |
| 40 to 44 Minutes | 1,045 (8.1%) | 182 (1.9%) |
| 45 to 59 Minutes | 1,602 (12.4%) | 757 (7.8%) |
| 60 to 89 Minutes | 990 (7.7%) | 489 (5.0%) |
| 90 or more Minutes | 399 (3.1%) | 54 (0.6%) |
Time of Departure to Work by Sex in Hardin County
The most frequent times of departure to work in Hardin County are 12:00 AM to 4:59 AM (2,269, 17.6%) for males and 7:00 AM to 7:29 AM (2,095, 21.6%) for females.
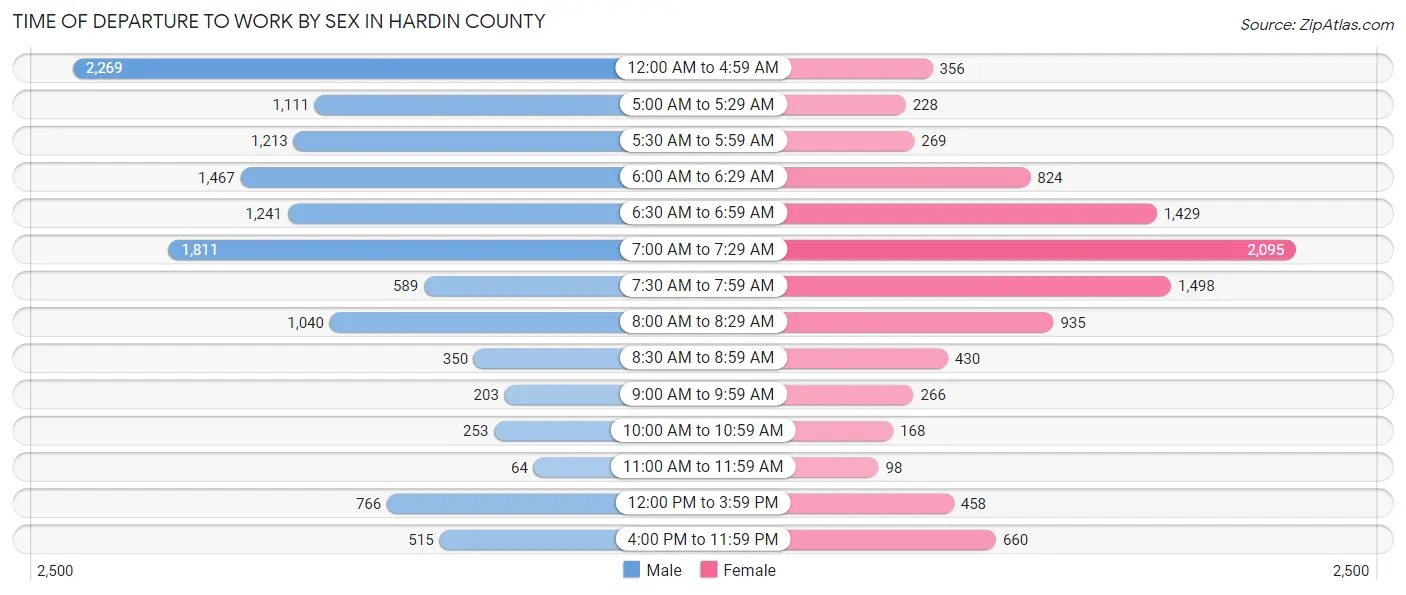
| Time of Departure | Male | Female |
| 12:00 AM to 4:59 AM | 2,269 (17.6%) | 356 (3.7%) |
| 5:00 AM to 5:29 AM | 1,111 (8.6%) | 228 (2.4%) |
| 5:30 AM to 5:59 AM | 1,213 (9.4%) | 269 (2.8%) |
| 6:00 AM to 6:29 AM | 1,467 (11.4%) | 824 (8.5%) |
| 6:30 AM to 6:59 AM | 1,241 (9.6%) | 1,429 (14.7%) |
| 7:00 AM to 7:29 AM | 1,811 (14.1%) | 2,095 (21.6%) |
| 7:30 AM to 7:59 AM | 589 (4.6%) | 1,498 (15.4%) |
| 8:00 AM to 8:29 AM | 1,040 (8.1%) | 935 (9.6%) |
| 8:30 AM to 8:59 AM | 350 (2.7%) | 430 (4.4%) |
| 9:00 AM to 9:59 AM | 203 (1.6%) | 266 (2.7%) |
| 10:00 AM to 10:59 AM | 253 (2.0%) | 168 (1.7%) |
| 11:00 AM to 11:59 AM | 64 (0.5%) | 98 (1.0%) |
| 12:00 PM to 3:59 PM | 766 (5.9%) | 458 (4.7%) |
| 4:00 PM to 11:59 PM | 515 (4.0%) | 660 (6.8%) |
| Total | 12,892 (100.0%) | 9,714 (100.0%) |
Housing Occupancy in Hardin County
Occupancy by Ownership in Hardin County
Of the total 20,845 dwellings in Hardin County, owner-occupied units account for 17,208 (82.6%), while renter-occupied units make up 3,637 (17.4%).
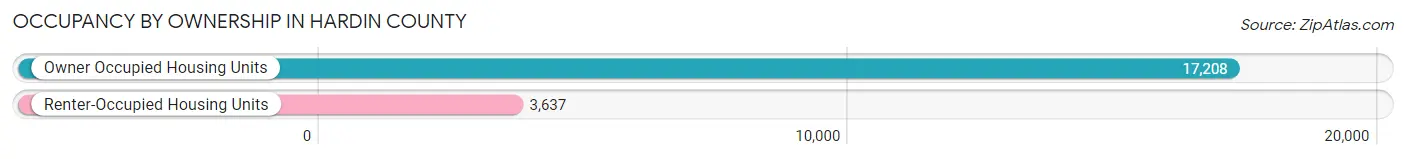
| Occupancy | # Housing Units | % Housing Units |
| Owner Occupied Housing Units | 17,208 | 82.6% |
| Renter-Occupied Housing Units | 3,637 | 17.4% |
| Total Occupied Housing Units | 20,845 | 100.0% |
Occupancy by Household Size in Hardin County
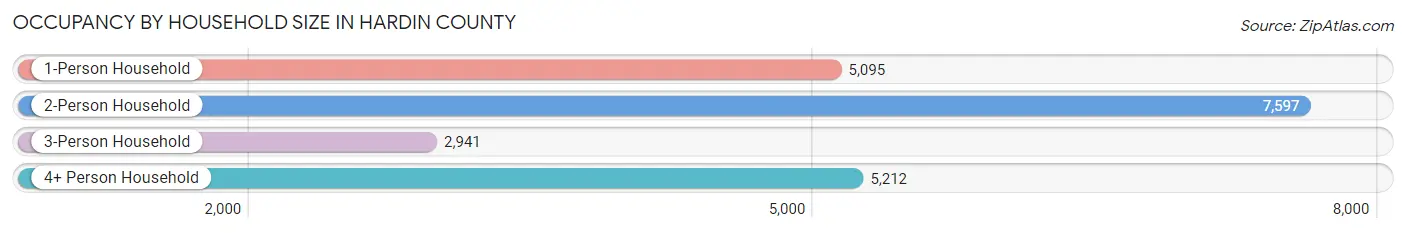
| Household Size | # Housing Units | % Housing Units |
| 1-Person Household | 5,095 | 24.4% |
| 2-Person Household | 7,597 | 36.4% |
| 3-Person Household | 2,941 | 14.1% |
| 4+ Person Household | 5,212 | 25.0% |
| Total Housing Units | 20,845 | 100.0% |
Occupancy by Ownership by Household Size in Hardin County
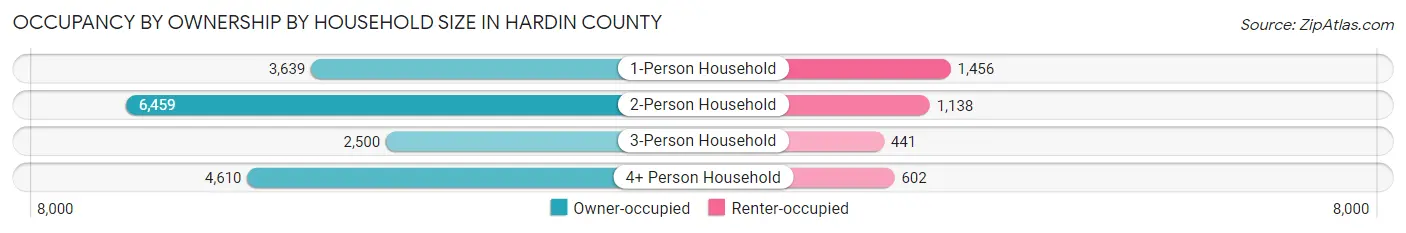
| Household Size | Owner-occupied | Renter-occupied |
| 1-Person Household | 3,639 (71.4%) | 1,456 (28.6%) |
| 2-Person Household | 6,459 (85.0%) | 1,138 (15.0%) |
| 3-Person Household | 2,500 (85.0%) | 441 (15.0%) |
| 4+ Person Household | 4,610 (88.4%) | 602 (11.6%) |
| Total Housing Units | 17,208 (82.6%) | 3,637 (17.4%) |
Occupancy by Educational Attainment in Hardin County
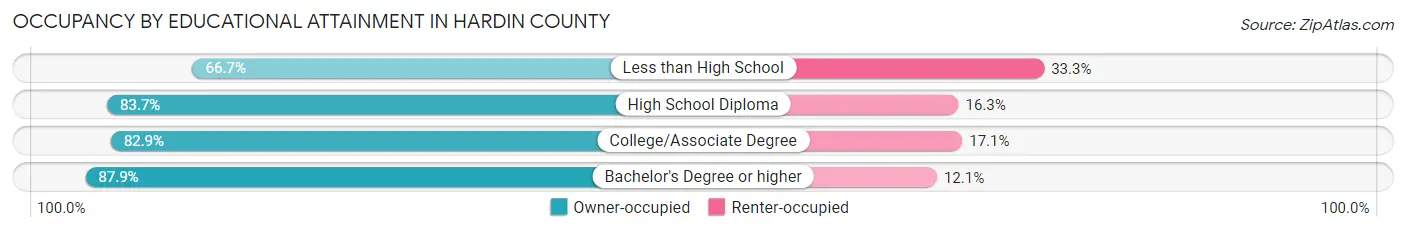
| Household Size | Owner-occupied | Renter-occupied |
| Less than High School | 1,379 (66.7%) | 689 (33.3%) |
| High School Diploma | 6,408 (83.7%) | 1,251 (16.3%) |
| College/Associate Degree | 5,884 (82.9%) | 1,212 (17.1%) |
| Bachelor's Degree or higher | 3,537 (87.9%) | 485 (12.1%) |
Occupancy by Age of Householder in Hardin County
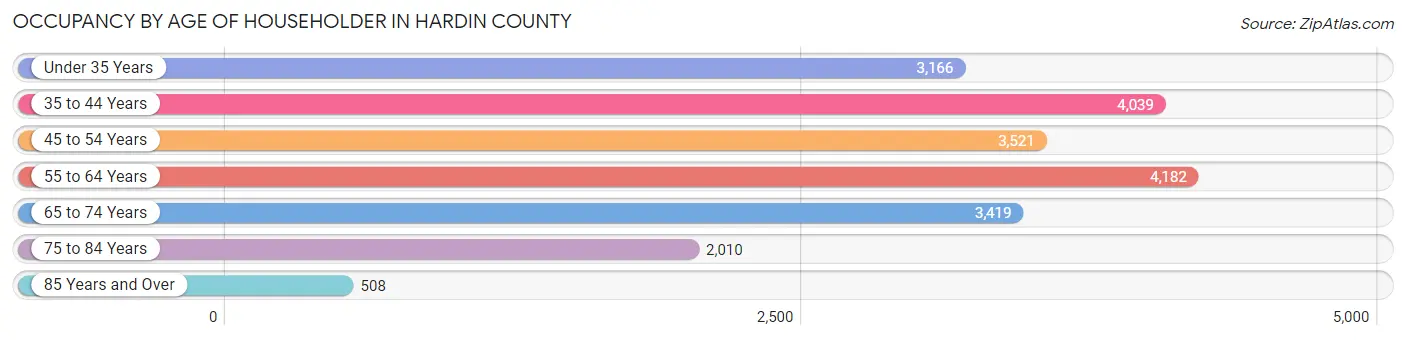
| Age Bracket | # Households | % Households |
| Under 35 Years | 3,166 | 15.2% |
| 35 to 44 Years | 4,039 | 19.4% |
| 45 to 54 Years | 3,521 | 16.9% |
| 55 to 64 Years | 4,182 | 20.1% |
| 65 to 74 Years | 3,419 | 16.4% |
| 75 to 84 Years | 2,010 | 9.6% |
| 85 Years and Over | 508 | 2.4% |
| Total | 20,845 | 100.0% |
Housing Finances in Hardin County
Median Income by Occupancy in Hardin County
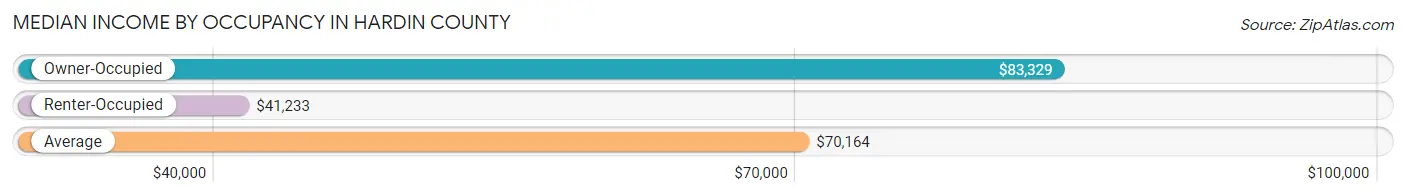
| Occupancy Type | # Households | Median Income |
| Owner-Occupied | 17,208 (82.6%) | $83,329 |
| Renter-Occupied | 3,637 (17.4%) | $41,233 |
| Average | 20,845 (100.0%) | $70,164 |
Occupancy by Householder Income Bracket in Hardin County
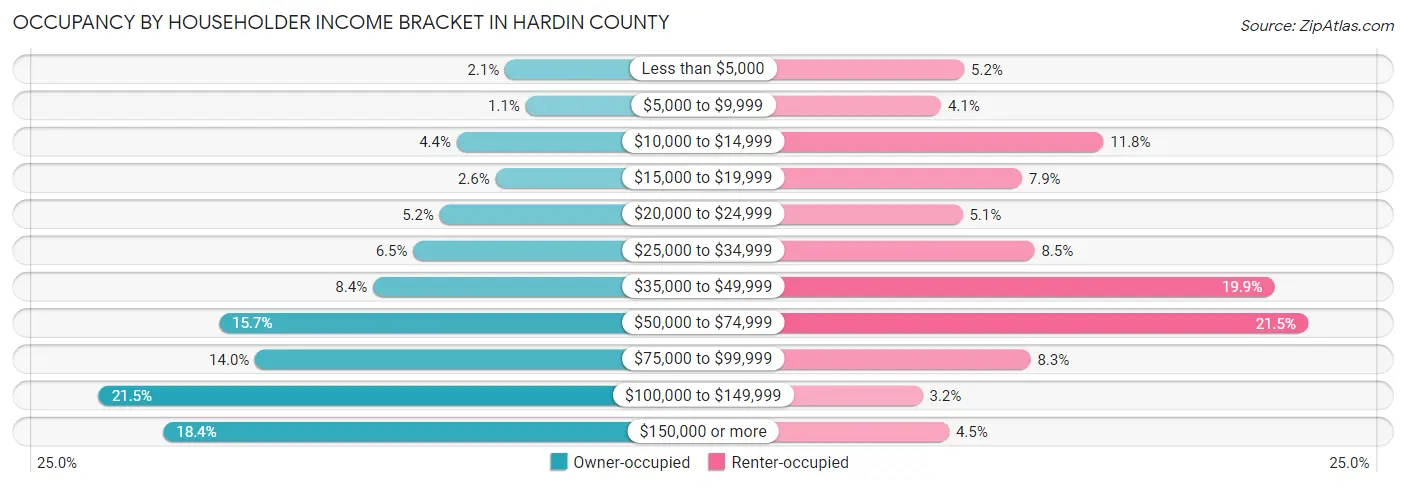
| Income Bracket | Owner-occupied | Renter-occupied |
| Less than $5,000 | 365 (2.1%) | 188 (5.2%) |
| $5,000 to $9,999 | 197 (1.1%) | 148 (4.1%) |
| $10,000 to $14,999 | 760 (4.4%) | 429 (11.8%) |
| $15,000 to $19,999 | 443 (2.6%) | 288 (7.9%) |
| $20,000 to $24,999 | 900 (5.2%) | 185 (5.1%) |
| $25,000 to $34,999 | 1,116 (6.5%) | 310 (8.5%) |
| $35,000 to $49,999 | 1,447 (8.4%) | 725 (19.9%) |
| $50,000 to $74,999 | 2,708 (15.7%) | 783 (21.5%) |
| $75,000 to $99,999 | 2,413 (14.0%) | 303 (8.3%) |
| $100,000 to $149,999 | 3,694 (21.5%) | 116 (3.2%) |
| $150,000 or more | 3,165 (18.4%) | 162 (4.4%) |
| Total | 17,208 (100.0%) | 3,637 (100.0%) |
Monthly Housing Cost Tiers in Hardin County
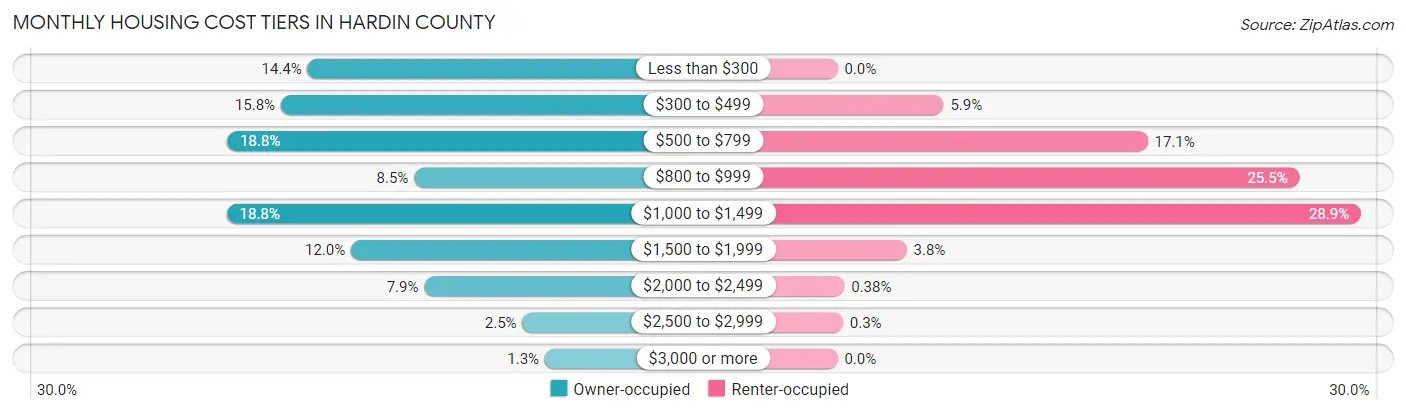
| Monthly Cost | Owner-occupied | Renter-occupied |
| Less than $300 | 2,473 (14.4%) | 0 (0.0%) |
| $300 to $499 | 2,726 (15.8%) | 213 (5.9%) |
| $500 to $799 | 3,238 (18.8%) | 623 (17.1%) |
| $800 to $999 | 1,459 (8.5%) | 928 (25.5%) |
| $1,000 to $1,499 | 3,242 (18.8%) | 1,052 (28.9%) |
| $1,500 to $1,999 | 2,060 (12.0%) | 139 (3.8%) |
| $2,000 to $2,499 | 1,363 (7.9%) | 14 (0.4%) |
| $2,500 to $2,999 | 430 (2.5%) | 11 (0.3%) |
| $3,000 or more | 217 (1.3%) | 0 (0.0%) |
| Total | 17,208 (100.0%) | 3,637 (100.0%) |
Physical Housing Characteristics in Hardin County
Housing Structures in Hardin County
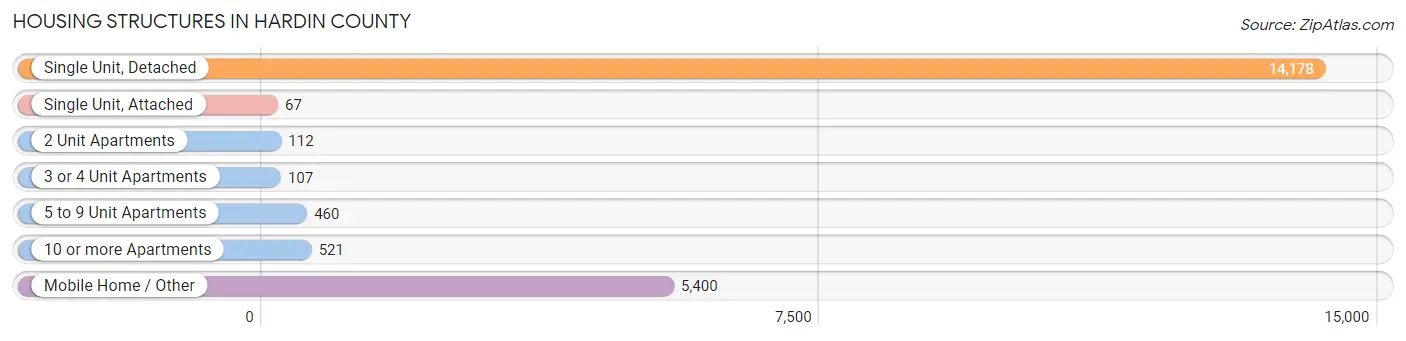
| Structure Type | # Housing Units | % Housing Units |
| Single Unit, Detached | 14,178 | 68.0% |
| Single Unit, Attached | 67 | 0.3% |
| 2 Unit Apartments | 112 | 0.5% |
| 3 or 4 Unit Apartments | 107 | 0.5% |
| 5 to 9 Unit Apartments | 460 | 2.2% |
| 10 or more Apartments | 521 | 2.5% |
| Mobile Home / Other | 5,400 | 25.9% |
| Total | 20,845 | 100.0% |
Housing Structures by Occupancy in Hardin County
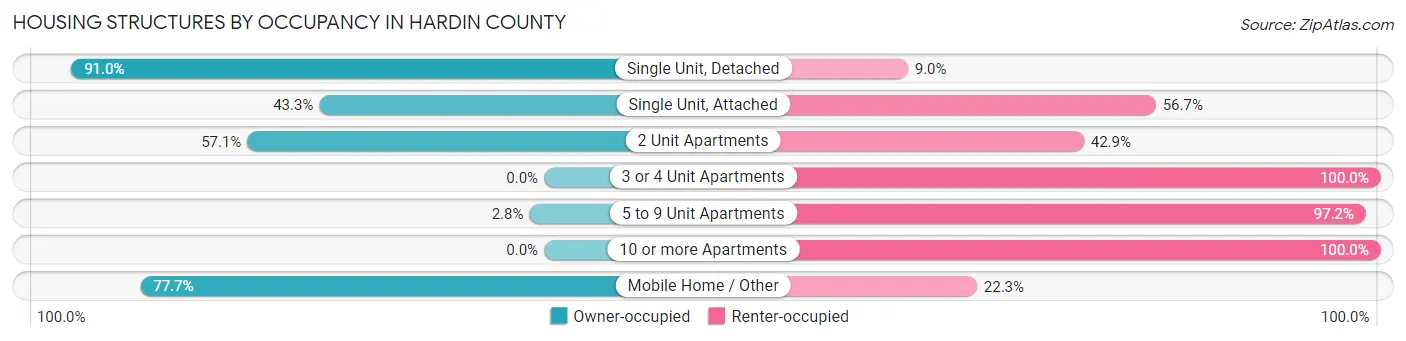
| Structure Type | Owner-occupied | Renter-occupied |
| Single Unit, Detached | 12,905 (91.0%) | 1,273 (9.0%) |
| Single Unit, Attached | 29 (43.3%) | 38 (56.7%) |
| 2 Unit Apartments | 64 (57.1%) | 48 (42.9%) |
| 3 or 4 Unit Apartments | 0 (0.0%) | 107 (100.0%) |
| 5 to 9 Unit Apartments | 13 (2.8%) | 447 (97.2%) |
| 10 or more Apartments | 0 (0.0%) | 521 (100.0%) |
| Mobile Home / Other | 4,197 (77.7%) | 1,203 (22.3%) |
| Total | 17,208 (82.6%) | 3,637 (17.4%) |
Housing Structures by Number of Rooms in Hardin County
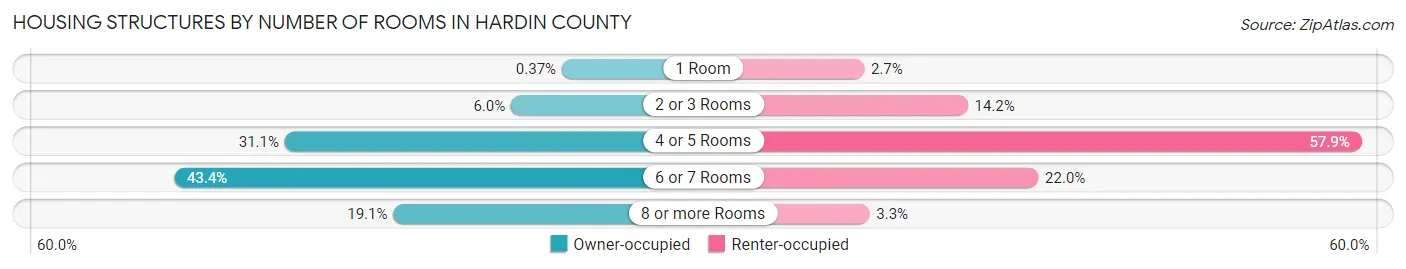
| Number of Rooms | Owner-occupied | Renter-occupied |
| 1 Room | 63 (0.4%) | 97 (2.7%) |
| 2 or 3 Rooms | 1,035 (6.0%) | 515 (14.2%) |
| 4 or 5 Rooms | 5,355 (31.1%) | 2,106 (57.9%) |
| 6 or 7 Rooms | 7,471 (43.4%) | 800 (22.0%) |
| 8 or more Rooms | 3,284 (19.1%) | 119 (3.3%) |
| Total | 17,208 (100.0%) | 3,637 (100.0%) |
Housing Structure by Heating Type in Hardin County
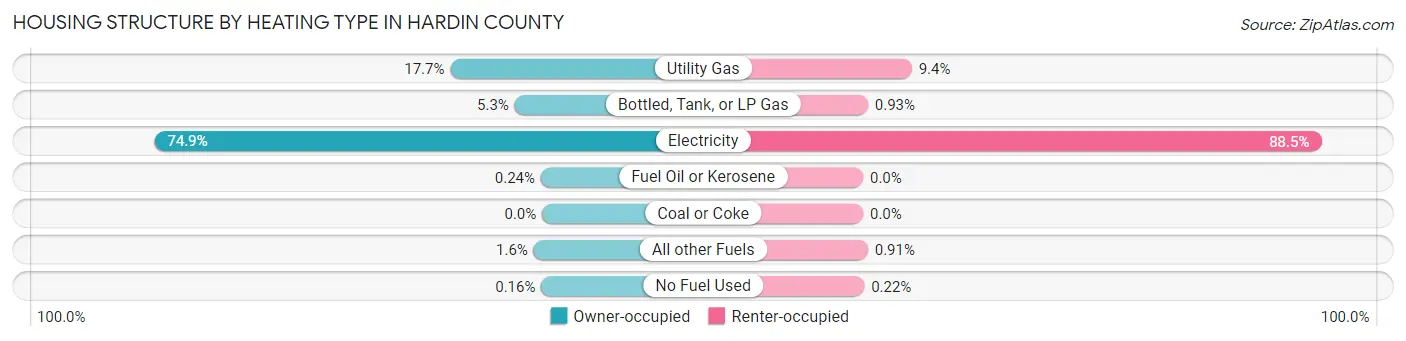
| Heating Type | Owner-occupied | Renter-occupied |
| Utility Gas | 3,052 (17.7%) | 342 (9.4%) |
| Bottled, Tank, or LP Gas | 912 (5.3%) | 34 (0.9%) |
| Electricity | 12,893 (74.9%) | 3,220 (88.5%) |
| Fuel Oil or Kerosene | 42 (0.2%) | 0 (0.0%) |
| Coal or Coke | 0 (0.0%) | 0 (0.0%) |
| All other Fuels | 281 (1.6%) | 33 (0.9%) |
| No Fuel Used | 28 (0.2%) | 8 (0.2%) |
| Total | 17,208 (100.0%) | 3,637 (100.0%) |
Household Vehicle Usage in Hardin County
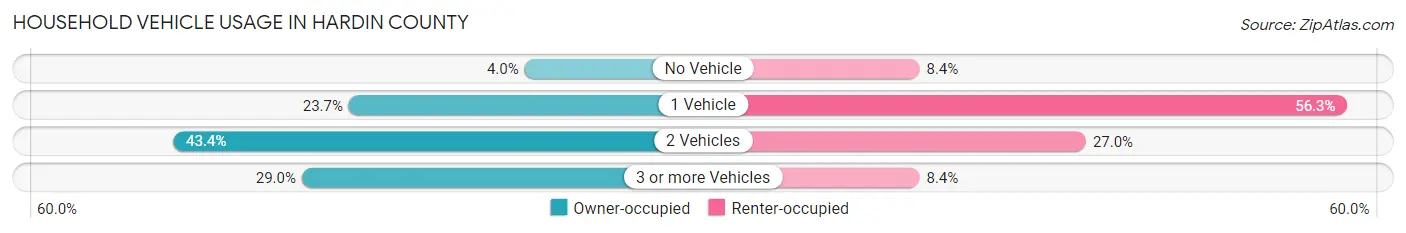
| Vehicles per Household | Owner-occupied | Renter-occupied |
| No Vehicle | 688 (4.0%) | 304 (8.4%) |
| 1 Vehicle | 4,075 (23.7%) | 2,047 (56.3%) |
| 2 Vehicles | 7,463 (43.4%) | 982 (27.0%) |
| 3 or more Vehicles | 4,982 (28.9%) | 304 (8.4%) |
| Total | 17,208 (100.0%) | 3,637 (100.0%) |
Real Estate & Mortgages in Hardin County
Real Estate and Mortgage Overview in Hardin County
| Characteristic | Without Mortgage | With Mortgage |
| Housing Units | 9,666 | 7,542 |
| Median Property Value | $122,500 | $199,900 |
| Median Household Income | $59,547 | $1,982 |
| Monthly Housing Costs | $477 | $217 |
| Real Estate Taxes | $1,331 | $402 |
Property Value by Mortgage Status in Hardin County
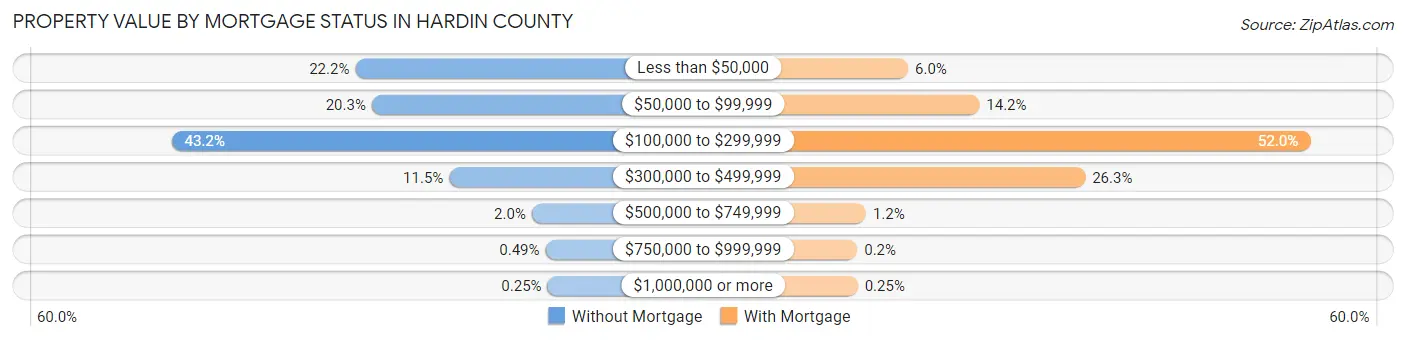
| Property Value | Without Mortgage | With Mortgage |
| Less than $50,000 | 2,147 (22.2%) | 453 (6.0%) |
| $50,000 to $99,999 | 1,965 (20.3%) | 1,067 (14.1%) |
| $100,000 to $299,999 | 4,176 (43.2%) | 3,918 (51.9%) |
| $300,000 to $499,999 | 1,110 (11.5%) | 1,980 (26.3%) |
| $500,000 to $749,999 | 197 (2.0%) | 90 (1.2%) |
| $750,000 to $999,999 | 47 (0.5%) | 15 (0.2%) |
| $1,000,000 or more | 24 (0.3%) | 19 (0.3%) |
| Total | 9,666 (100.0%) | 7,542 (100.0%) |
Household Income by Mortgage Status in Hardin County
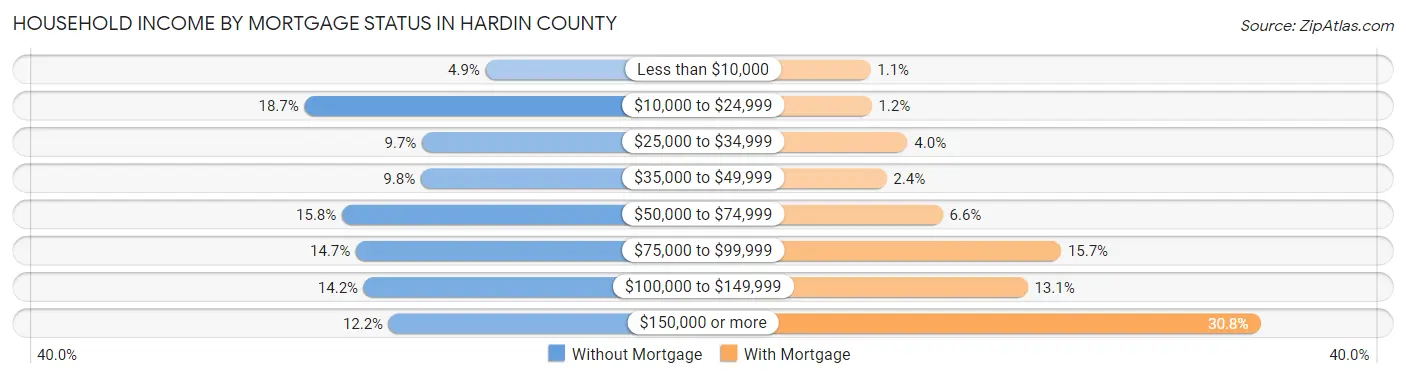
| Household Income | Without Mortgage | With Mortgage |
| Less than $10,000 | 471 (4.9%) | 85 (1.1%) |
| $10,000 to $24,999 | 1,805 (18.7%) | 91 (1.2%) |
| $25,000 to $34,999 | 939 (9.7%) | 298 (4.0%) |
| $35,000 to $49,999 | 947 (9.8%) | 177 (2.4%) |
| $50,000 to $74,999 | 1,528 (15.8%) | 500 (6.6%) |
| $75,000 to $99,999 | 1,425 (14.7%) | 1,180 (15.7%) |
| $100,000 to $149,999 | 1,368 (14.1%) | 988 (13.1%) |
| $150,000 or more | 1,183 (12.2%) | 2,326 (30.8%) |
| Total | 9,666 (100.0%) | 7,542 (100.0%) |
Property Value to Household Income Ratio in Hardin County
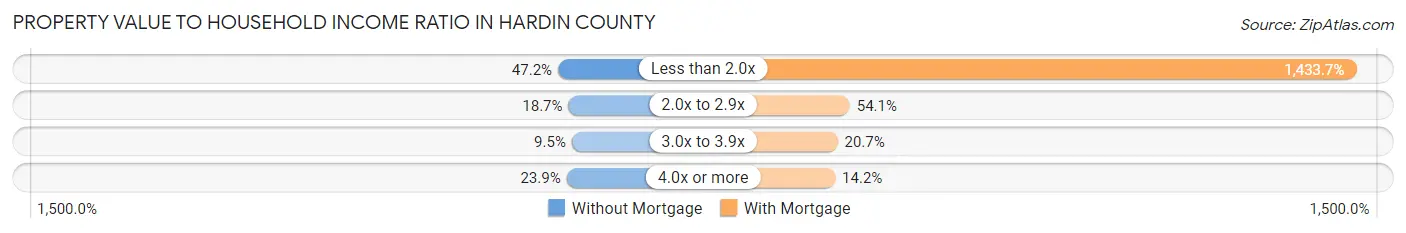
| Value-to-Income Ratio | Without Mortgage | With Mortgage |
| Less than 2.0x | 4,558 (47.1%) | 108,128 (1,433.7%) |
| 2.0x to 2.9x | 1,807 (18.7%) | 4,083 (54.1%) |
| 3.0x to 3.9x | 914 (9.5%) | 1,563 (20.7%) |
| 4.0x or more | 2,308 (23.9%) | 1,073 (14.2%) |
| Total | 9,666 (100.0%) | 7,542 (100.0%) |
Real Estate Taxes by Mortgage Status in Hardin County
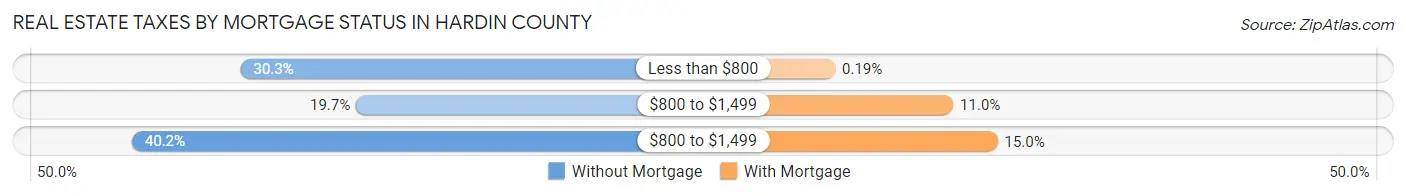
| Property Taxes | Without Mortgage | With Mortgage |
| Less than $800 | 2,928 (30.3%) | 14 (0.2%) |
| $800 to $1,499 | 1,907 (19.7%) | 827 (11.0%) |
| $800 to $1,499 | 3,886 (40.2%) | 1,133 (15.0%) |
| Total | 9,666 (100.0%) | 7,542 (100.0%) |
Health & Disability in Hardin County
Health Insurance Coverage by Age in Hardin County
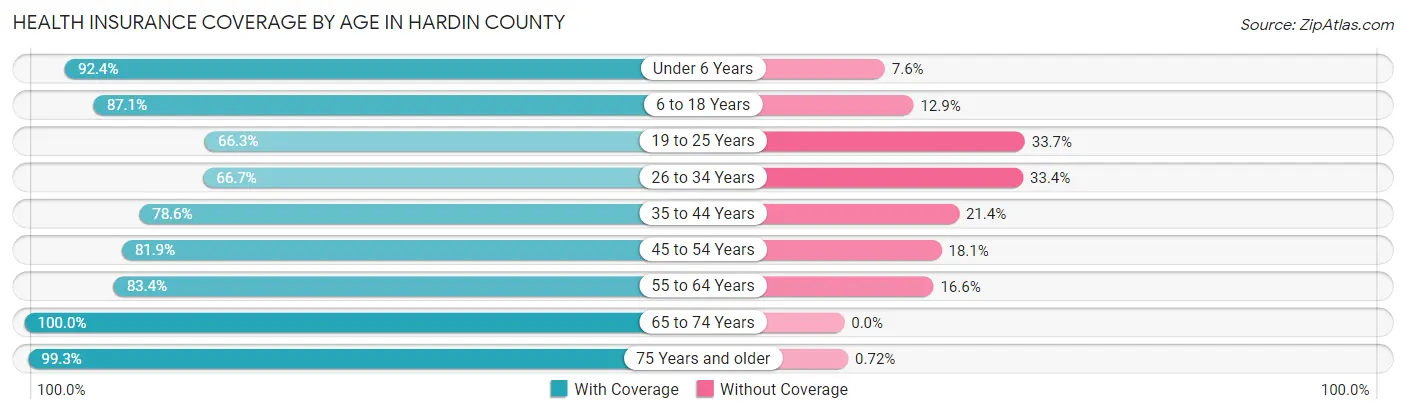
| Age Bracket | With Coverage | Without Coverage |
| Under 6 Years | 4,058 (92.4%) | 332 (7.6%) |
| 6 to 18 Years | 8,852 (87.1%) | 1,311 (12.9%) |
| 19 to 25 Years | 2,757 (66.3%) | 1,399 (33.7%) |
| 26 to 34 Years | 4,322 (66.6%) | 2,163 (33.4%) |
| 35 to 44 Years | 5,823 (78.6%) | 1,584 (21.4%) |
| 45 to 54 Years | 5,592 (81.9%) | 1,238 (18.1%) |
| 55 to 64 Years | 6,075 (83.4%) | 1,212 (16.6%) |
| 65 to 74 Years | 5,744 (100.0%) | 0 (0.0%) |
| 75 Years and older | 3,600 (99.3%) | 26 (0.7%) |
| Total | 46,823 (83.5%) | 9,265 (16.5%) |
Health Insurance Coverage by Citizenship Status in Hardin County
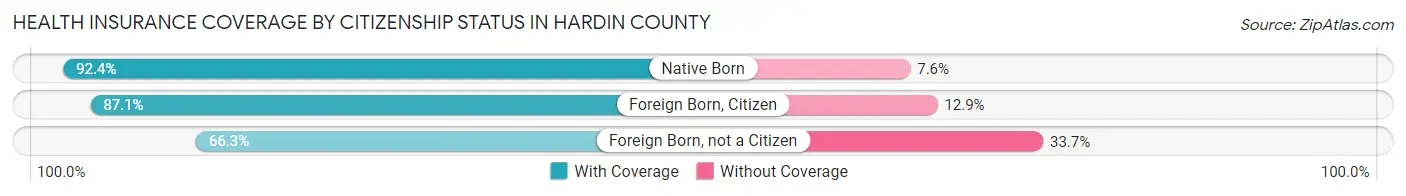
| Citizenship Status | With Coverage | Without Coverage |
| Native Born | 4,058 (92.4%) | 332 (7.6%) |
| Foreign Born, Citizen | 8,852 (87.1%) | 1,311 (12.9%) |
| Foreign Born, not a Citizen | 2,757 (66.3%) | 1,399 (33.7%) |
Health Insurance Coverage by Household Income in Hardin County
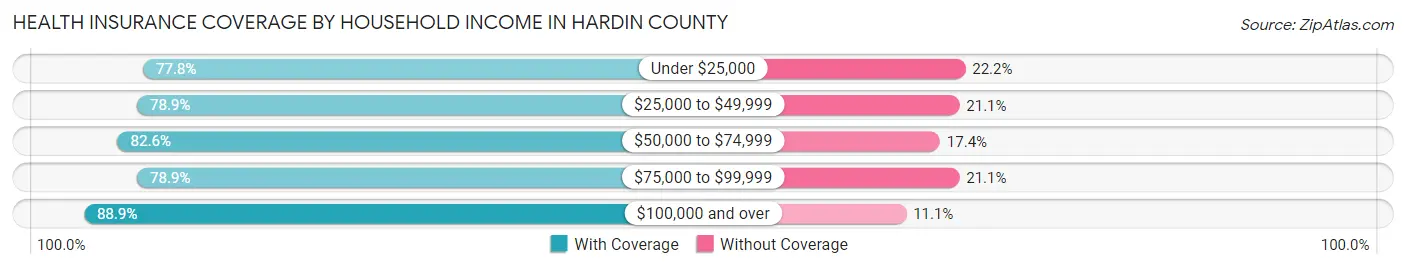
| Household Income | With Coverage | Without Coverage |
| Under $25,000 | 5,597 (77.8%) | 1,597 (22.2%) |
| $25,000 to $49,999 | 6,355 (78.9%) | 1,698 (21.1%) |
| $50,000 to $74,999 | 7,350 (82.6%) | 1,553 (17.4%) |
| $75,000 to $99,999 | 6,890 (78.9%) | 1,839 (21.1%) |
| $100,000 and over | 20,591 (88.9%) | 2,578 (11.1%) |
Public vs Private Health Insurance Coverage by Age in Hardin County
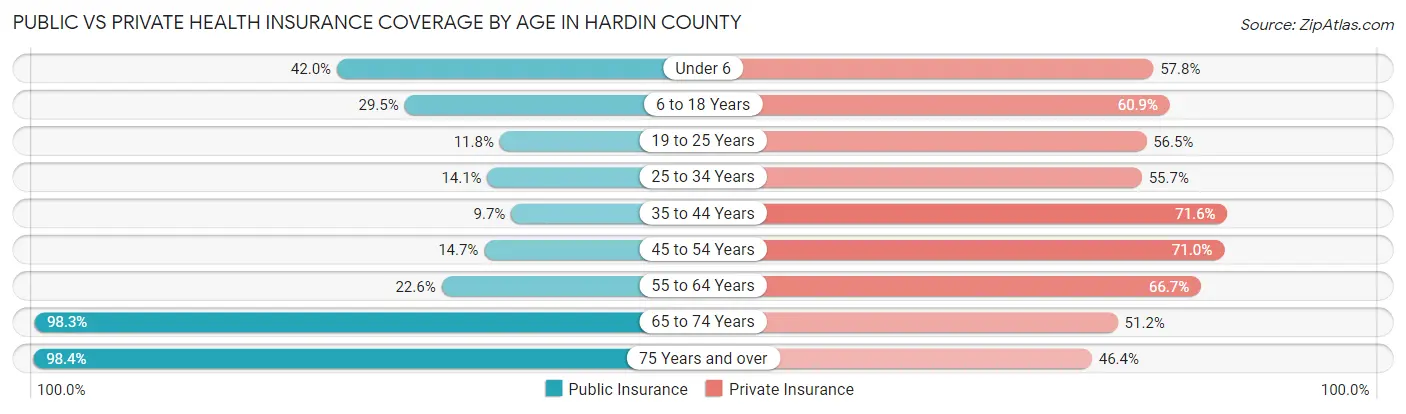
| Age Bracket | Public Insurance | Private Insurance |
| Under 6 | 1,845 (42.0%) | 2,538 (57.8%) |
| 6 to 18 Years | 2,996 (29.5%) | 6,188 (60.9%) |
| 19 to 25 Years | 491 (11.8%) | 2,348 (56.5%) |
| 25 to 34 Years | 914 (14.1%) | 3,610 (55.7%) |
| 35 to 44 Years | 717 (9.7%) | 5,301 (71.6%) |
| 45 to 54 Years | 1,003 (14.7%) | 4,846 (71.0%) |
| 55 to 64 Years | 1,648 (22.6%) | 4,858 (66.7%) |
| 65 to 74 Years | 5,644 (98.3%) | 2,941 (51.2%) |
| 75 Years and over | 3,568 (98.4%) | 1,683 (46.4%) |
| Total | 18,826 (33.6%) | 34,313 (61.2%) |
Disability Status by Sex by Age in Hardin County
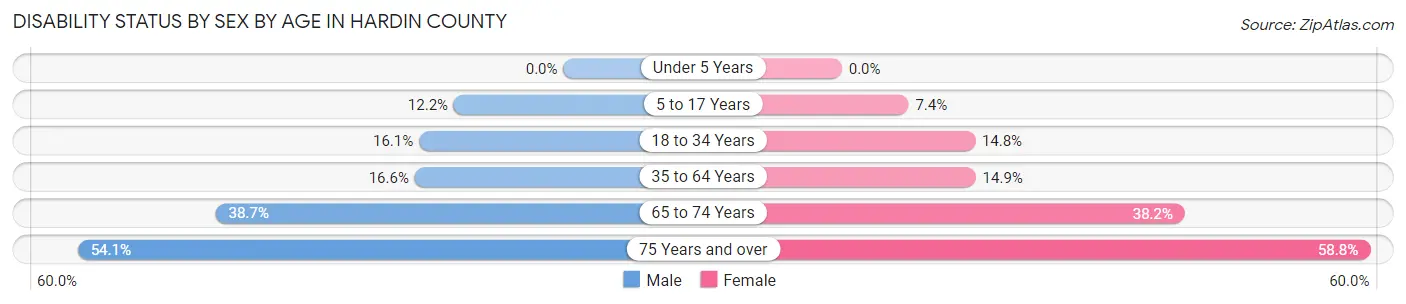
| Age Bracket | Male | Female |
| Under 5 Years | 0 (0.0%) | 0 (0.0%) |
| 5 to 17 Years | 642 (12.2%) | 385 (7.4%) |
| 18 to 34 Years | 934 (16.1%) | 818 (14.8%) |
| 35 to 64 Years | 1,773 (16.6%) | 1,612 (14.9%) |
| 65 to 74 Years | 1,027 (38.7%) | 1,181 (38.2%) |
| 75 Years and over | 821 (54.1%) | 1,240 (58.8%) |
Disability Class by Sex by Age in Hardin County
Disability Class: Hearing Difficulty
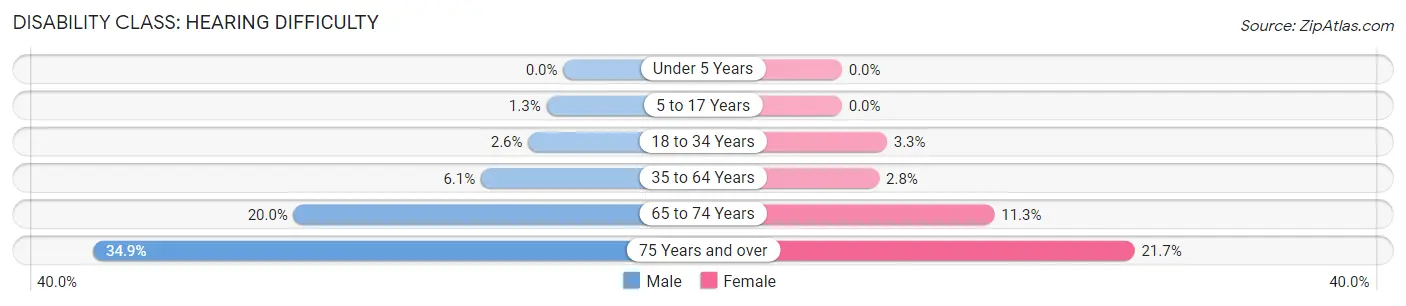
| Age Bracket | Male | Female |
| Under 5 Years | 0 (0.0%) | 0 (0.0%) |
| 5 to 17 Years | 66 (1.3%) | 0 (0.0%) |
| 18 to 34 Years | 151 (2.6%) | 184 (3.3%) |
| 35 to 64 Years | 654 (6.1%) | 300 (2.8%) |
| 65 to 74 Years | 531 (20.0%) | 350 (11.3%) |
| 75 Years and over | 530 (34.9%) | 458 (21.7%) |
Disability Class: Vision Difficulty
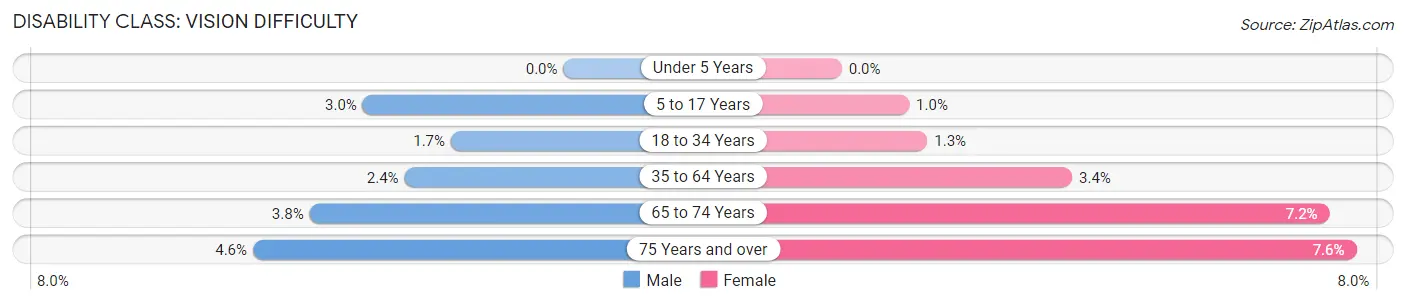
| Age Bracket | Male | Female |
| Under 5 Years | 0 (0.0%) | 0 (0.0%) |
| 5 to 17 Years | 157 (3.0%) | 52 (1.0%) |
| 18 to 34 Years | 97 (1.7%) | 70 (1.3%) |
| 35 to 64 Years | 253 (2.4%) | 370 (3.4%) |
| 65 to 74 Years | 100 (3.8%) | 224 (7.2%) |
| 75 Years and over | 70 (4.6%) | 161 (7.6%) |
Disability Class: Cognitive Difficulty
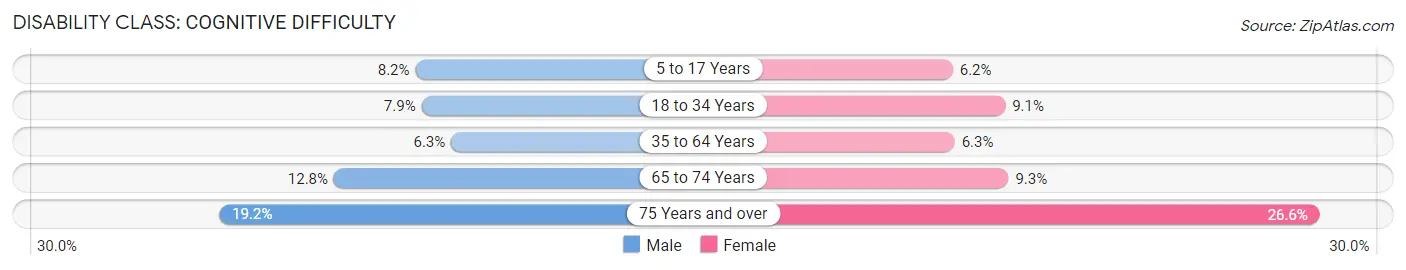
| Age Bracket | Male | Female |
| 5 to 17 Years | 434 (8.2%) | 320 (6.2%) |
| 18 to 34 Years | 459 (7.9%) | 502 (9.1%) |
| 35 to 64 Years | 669 (6.2%) | 680 (6.3%) |
| 65 to 74 Years | 339 (12.8%) | 287 (9.3%) |
| 75 Years and over | 291 (19.2%) | 561 (26.6%) |
Disability Class: Ambulatory Difficulty
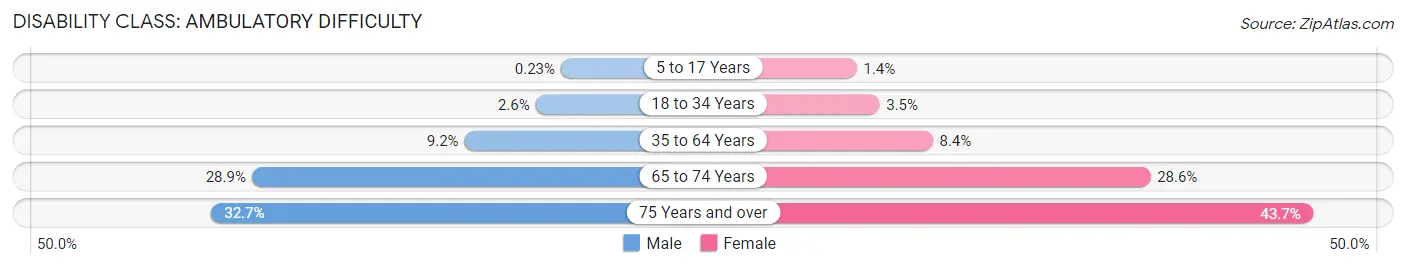
| Age Bracket | Male | Female |
| 5 to 17 Years | 12 (0.2%) | 71 (1.4%) |
| 18 to 34 Years | 150 (2.6%) | 192 (3.5%) |
| 35 to 64 Years | 983 (9.2%) | 910 (8.4%) |
| 65 to 74 Years | 767 (28.9%) | 885 (28.6%) |
| 75 Years and over | 496 (32.7%) | 921 (43.7%) |
Disability Class: Self-Care Difficulty
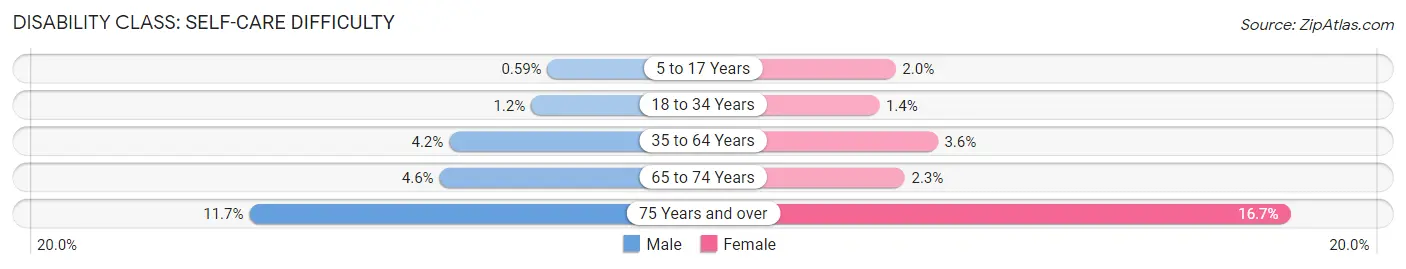
| Age Bracket | Male | Female |
| 5 to 17 Years | 31 (0.6%) | 103 (2.0%) |
| 18 to 34 Years | 70 (1.2%) | 76 (1.4%) |
| 35 to 64 Years | 454 (4.2%) | 384 (3.5%) |
| 65 to 74 Years | 122 (4.6%) | 72 (2.3%) |
| 75 Years and over | 177 (11.7%) | 351 (16.7%) |
Technology Access in Hardin County
Computing Device Access in Hardin County
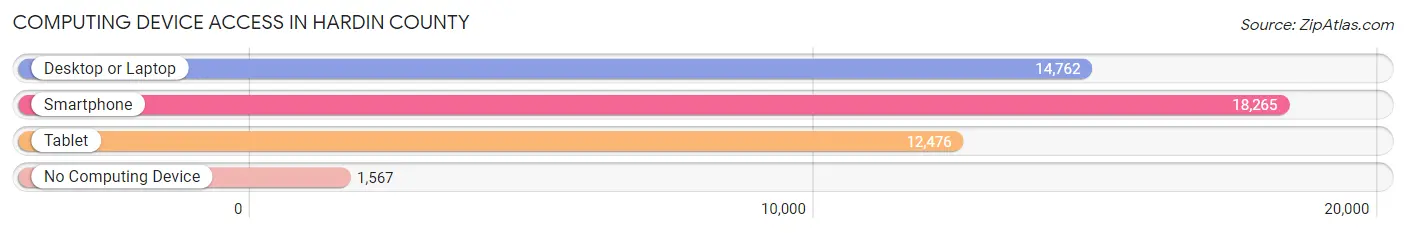
| Device Type | # Households | % Households |
| Desktop or Laptop | 14,762 | 70.8% |
| Smartphone | 18,265 | 87.6% |
| Tablet | 12,476 | 59.9% |
| No Computing Device | 1,567 | 7.5% |
| Total | 20,845 | 100.0% |
Internet Access in Hardin County
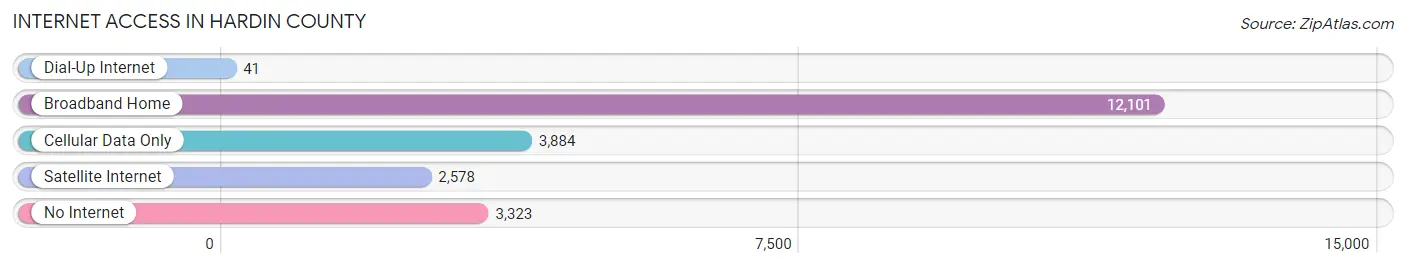
| Internet Type | # Households | % Households |
| Dial-Up Internet | 41 | 0.2% |
| Broadband Home | 12,101 | 58.1% |
| Cellular Data Only | 3,884 | 18.6% |
| Satellite Internet | 2,578 | 12.4% |
| No Internet | 3,323 | 15.9% |
| Total | 20,845 | 100.0% |
Hardin County Summary
Hardin County is located in the southeastern corner of Texas, and is part of the Beaumont-Port Arthur Metropolitan Statistical Area. The county is bordered by Jefferson County to the north, Orange County to the east, Tyler County to the south, and Liberty County to the west. The county seat is Kountze, and the largest city is Silsbee.
History
Hardin County was established in 1858 and named for the Texas revolutionary hero, Col. John Hardin. The county was originally part of Liberty County, but was later divided into its own county. The first settlers in the area were mostly German and French immigrants who arrived in the early 1800s.
The county was largely rural until the discovery of oil in the early 1900s. This led to a population boom and the development of the county’s economy. The county’s population peaked in the 1950s, but has since declined due to the decline of the oil industry.
Geography
Hardin County is located in the southeastern corner of Texas, and is part of the Beaumont-Port Arthur Metropolitan Statistical Area. The county is bordered by Jefferson County to the north, Orange County to the east, Tyler County to the south, and Liberty County to the west. The county has a total area of 845 square miles, of which 843 square miles is land and 2 square miles is water.
The terrain of Hardin County is mostly flat, with some rolling hills in the northern part of the county. The county is drained by the Neches River, which flows through the county from north to south. The county is also home to several small lakes, including Lake Livingston, Lake Anahuac, and Lake Sabine.
Economy
The economy of Hardin County is largely based on agriculture and oil and gas production. The county is home to several large oil and gas companies, including ExxonMobil, Chevron, and Shell. Agriculture is also an important part of the county’s economy, with crops such as cotton, corn, and soybeans being grown in the area.
The county is also home to several manufacturing companies, including a paper mill, a lumber mill, and a steel mill. The county is also home to several retail stores, restaurants, and other businesses.
Demographics
As of the 2010 census, Hardin County had a population of 54,635. The population is largely white (77.3%), with African Americans (17.2%) and Hispanics (4.5%) making up the remainder of the population. The median household income in the county is $45,845, and the median home value is $117,400.
The county is home to several small towns, including Kountze (the county seat), Silsbee, Lumberton, and Sour Lake. The county is also home to several unincorporated communities, including Batson, Daisetta, and Saratoga.
Conclusion
Hardin County is located in the southeastern corner of Texas, and is part of the Beaumont-Port Arthur Metropolitan Statistical Area. The county was established in 1858 and named for the Texas revolutionary hero, Col. John Hardin. The county’s economy is largely based on agriculture and oil and gas production, and the county is home to several small towns and unincorporated communities. As of the 2010 census, Hardin County had a population of 54,635, with whites making up the majority of the population.
Common Questions
What is Per Capita Income in Hardin County?
Per Capita income in Hardin County is $33,700.
What is the Median Family Income in Hardin County?
Median Family Income in Hardin County is $89,761.
What is the Median Household income in Hardin County?
Median Household Income in Hardin County is $70,164.
What is Income or Wage Gap in Hardin County?
Income or Wage Gap in Hardin County is 52.3%.
Women in Hardin County earn 47.7 cents for every dollar earned by a man.
What is Family Income Deficit in Hardin County?
Family Income Deficit in Hardin County is $8,769.
Families that are below poverty line in Hardin County earn $8,769 less on average than the poverty threshold level.
What is Inequality or Gini Index in Hardin County?
Inequality or Gini Index in Hardin County is 0.43.
What is the Total Population of Hardin County?
Total Population of Hardin County is 56,576.
What is the Total Male Population of Hardin County?
Total Male Population of Hardin County is 27,727.
What is the Total Female Population of Hardin County?
Total Female Population of Hardin County is 28,849.
What is the Ratio of Males per 100 Females in Hardin County?
There are 96.11 Males per 100 Females in Hardin County.
What is the Ratio of Females per 100 Males in Hardin County?
There are 104.05 Females per 100 Males in Hardin County.
What is the Median Population Age in Hardin County?
Median Population Age in Hardin County is 39.4 Years.
What is the Average Family Size in Hardin County
Average Family Size in Hardin County is 3.1 People.
What is the Average Household Size in Hardin County
Average Household Size in Hardin County is 2.7 People.
How Large is the Labor Force in Hardin County?
There are 25,207 People in the Labor Forcein in Hardin County.
What is the Percentage of People in the Labor Force in Hardin County?
56.8% of People are in the Labor Force in Hardin County.
What is the Unemployment Rate in Hardin County?
Unemployment Rate in Hardin County is 4.6%.