Hardeman County, TX Map & Demographics
Hardeman County Map
Hardeman County Overview
$29,783
PER CAPITA INCOME
$71,369
AVG FAMILY INCOME
$60,455
AVG HOUSEHOLD INCOME
21.7%
WAGE / INCOME GAP [ % ]
78.3¢/ $1
WAGE / INCOME GAP [ $ ]
0.41
INEQUALITY / GINI INDEX
3,541
TOTAL POPULATION
1,837
MALE POPULATION
1,704
FEMALE POPULATION
107.81
MALES / 100 FEMALES
92.76
FEMALES / 100 MALES
44.1
MEDIAN AGE
3.4
AVG FAMILY SIZE
2.7
AVG HOUSEHOLD SIZE
1,857
LABOR FORCE [ PEOPLE ]
64.7%
PERCENT IN LABOR FORCE
2.5%
UNEMPLOYMENT RATE
Hardeman County Area Codes
Income in Hardeman County
Income Overview in Hardeman County
Per Capita Income in Hardeman County is $29,783, while median incomes of families and households are $71,369 and $60,455 respectively.
| Characteristic | Number | Measure |
| Per Capita Income | 3,541 | $29,783 |
| Median Family Income | 799 | $71,369 |
| Mean Family Income | 799 | $86,984 |
| Median Household Income | 1,304 | $60,455 |
| Mean Household Income | 1,304 | $73,097 |
| Income Deficit | 799 | $0 |
| Wage / Income Gap (%) | 3,541 | 21.65% |
| Wage / Income Gap ($) | 3,541 | 78.35¢ per $1 |
| Gini / Inequality Index | 3,541 | 0.41 |
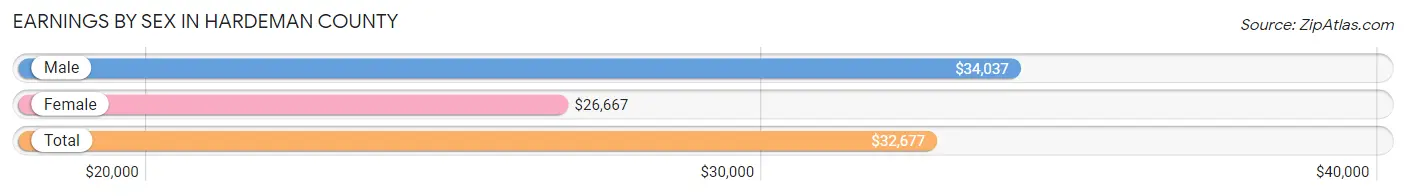
Earnings by Sex in Hardeman County
Average Earnings in Hardeman County are $32,677, $34,037 for men and $26,667 for women, a difference of 21.6%.
| Sex | Number | Average Earnings |
| Male | 1,176 (56.8%) | $34,037 |
| Female | 894 (43.2%) | $26,667 |
| Total | 2,070 (100.0%) | $32,677 |
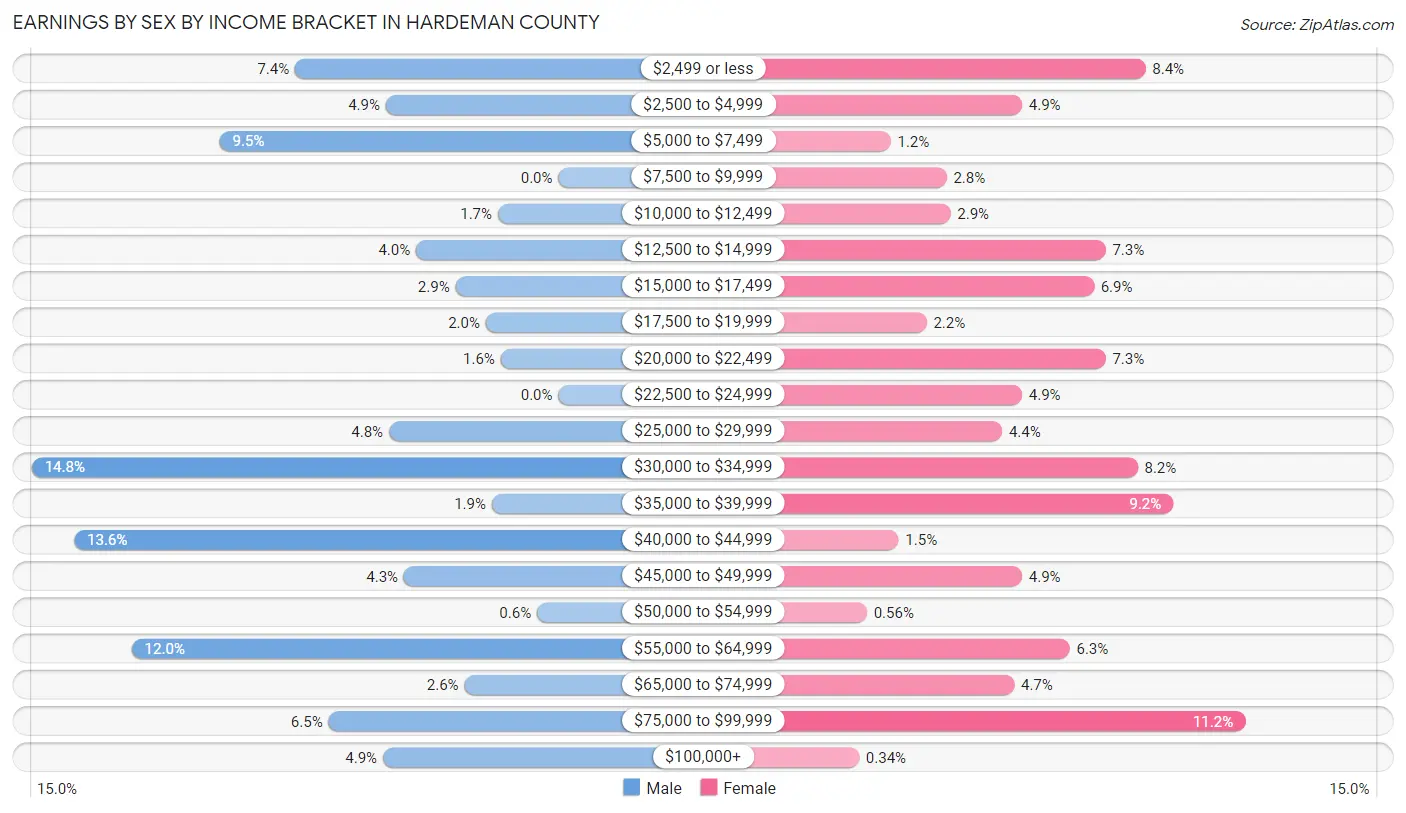
Earnings by Sex by Income Bracket in Hardeman County
The most common earnings brackets in Hardeman County are $30,000 to $34,999 for men (174 | 14.8%) and $75,000 to $99,999 for women (100 | 11.2%).
| Income | Male | Female |
| $2,499 or less | 87 (7.4%) | 75 (8.4%) |
| $2,500 to $4,999 | 57 (4.9%) | 44 (4.9%) |
| $5,000 to $7,499 | 112 (9.5%) | 11 (1.2%) |
| $7,500 to $9,999 | 0 (0.0%) | 25 (2.8%) |
| $10,000 to $12,499 | 20 (1.7%) | 26 (2.9%) |
| $12,500 to $14,999 | 47 (4.0%) | 65 (7.3%) |
| $15,000 to $17,499 | 34 (2.9%) | 62 (6.9%) |
| $17,500 to $19,999 | 24 (2.0%) | 20 (2.2%) |
| $20,000 to $22,499 | 19 (1.6%) | 65 (7.3%) |
| $22,500 to $24,999 | 0 (0.0%) | 44 (4.9%) |
| $25,000 to $29,999 | 56 (4.8%) | 39 (4.4%) |
| $30,000 to $34,999 | 174 (14.8%) | 73 (8.2%) |
| $35,000 to $39,999 | 22 (1.9%) | 82 (9.2%) |
| $40,000 to $44,999 | 160 (13.6%) | 13 (1.5%) |
| $45,000 to $49,999 | 51 (4.3%) | 44 (4.9%) |
| $50,000 to $54,999 | 7 (0.6%) | 5 (0.6%) |
| $55,000 to $64,999 | 141 (12.0%) | 56 (6.3%) |
| $65,000 to $74,999 | 31 (2.6%) | 42 (4.7%) |
| $75,000 to $99,999 | 76 (6.5%) | 100 (11.2%) |
| $100,000+ | 58 (4.9%) | 3 (0.3%) |
| Total | 1,176 (100.0%) | 894 (100.0%) |
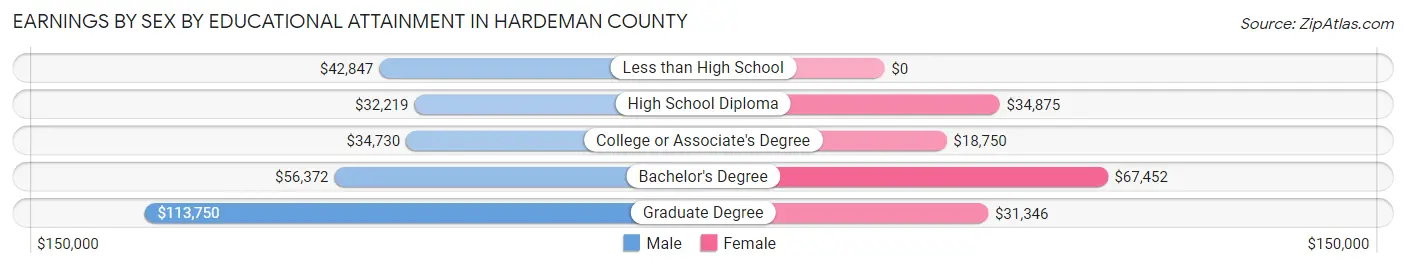
Earnings by Sex by Educational Attainment in Hardeman County
Average earnings in Hardeman County are $34,725 for men and $32,554 for women, a difference of 6.2%. Men with an educational attainment of graduate degree enjoy the highest average annual earnings of $113,750, while those with high school diploma education earn the least with $32,219. Women with an educational attainment of bachelor's degree earn the most with the average annual earnings of $67,452, while those with college or associate's degree education have the smallest earnings of $18,750.
| Educational Attainment | Male Income | Female Income |
| Less than High School | $42,847 | $0 |
| High School Diploma | $32,219 | $34,875 |
| College or Associate's Degree | $34,730 | $18,750 |
| Bachelor's Degree | $56,372 | $67,452 |
| Graduate Degree | $113,750 | $31,346 |
| Total | $34,725 | $32,554 |
Family Income in Hardeman County
Family Income Brackets in Hardeman County
According to the Hardeman County family income data, there are 224 families falling into the $50,000 to $74,999 income range, which is the most common income bracket and makes up 28.0% of all families. Conversely, the $200,000+ income bracket is the least frequent group with only 19 families (2.4%) belonging to this category.
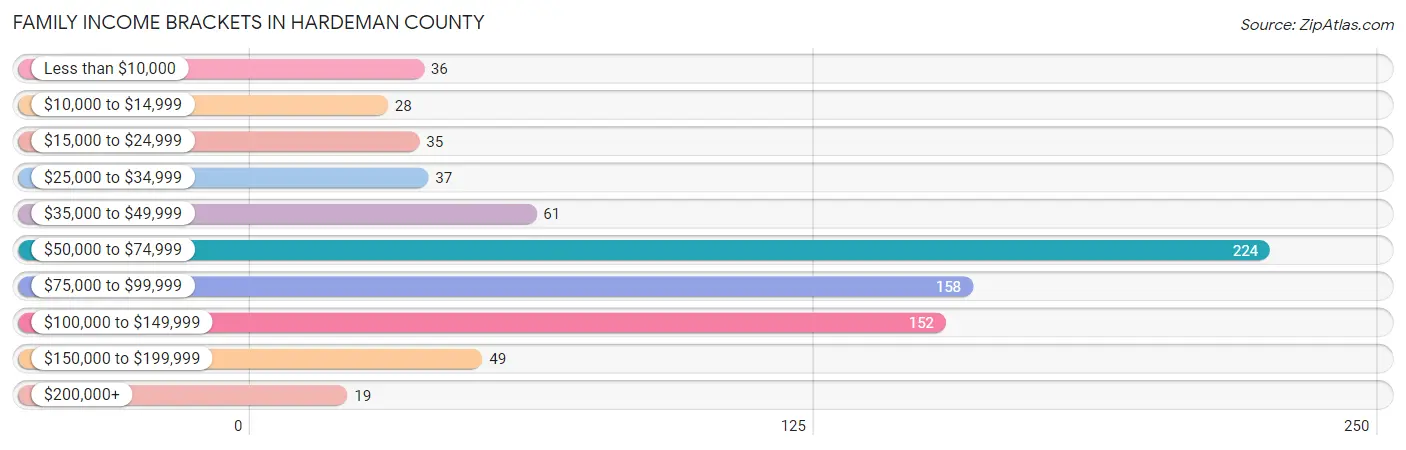
| Income Bracket | # Families | % Families |
| Less than $10,000 | 36 | 4.5% |
| $10,000 to $14,999 | 28 | 3.5% |
| $15,000 to $24,999 | 35 | 4.4% |
| $25,000 to $34,999 | 37 | 4.6% |
| $35,000 to $49,999 | 61 | 7.6% |
| $50,000 to $74,999 | 224 | 28.0% |
| $75,000 to $99,999 | 158 | 19.8% |
| $100,000 to $149,999 | 152 | 19.0% |
| $150,000 to $199,999 | 49 | 6.1% |
| $200,000+ | 19 | 2.4% |
Family Income by Famaliy Size in Hardeman County
6-person families (14 | 1.8%) account for the highest median family income in Hardeman County with $95,556 per family, while 2-person families (378 | 47.3%) have the highest median income of $31,792 per family member.
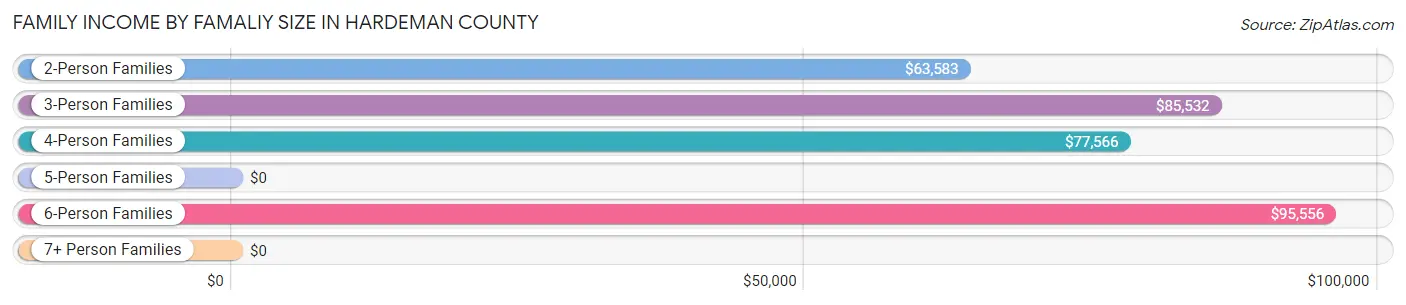
| Income Bracket | # Families | Median Income |
| 2-Person Families | 378 (47.3%) | $63,583 |
| 3-Person Families | 218 (27.3%) | $85,532 |
| 4-Person Families | 161 (20.2%) | $77,566 |
| 5-Person Families | 28 (3.5%) | $0 |
| 6-Person Families | 14 (1.8%) | $95,556 |
| 7+ Person Families | 0 (0.0%) | $0 |
| Total | 799 (100.0%) | $71,369 |
Family Income by Number of Earners in Hardeman County
The median family income in Hardeman County is $71,369, with families comprising 3+ earners (178) having the highest median family income of $93,333, while families with no earners (155) have the lowest median family income of $34,375, accounting for 22.3% and 19.4% of families, respectively.
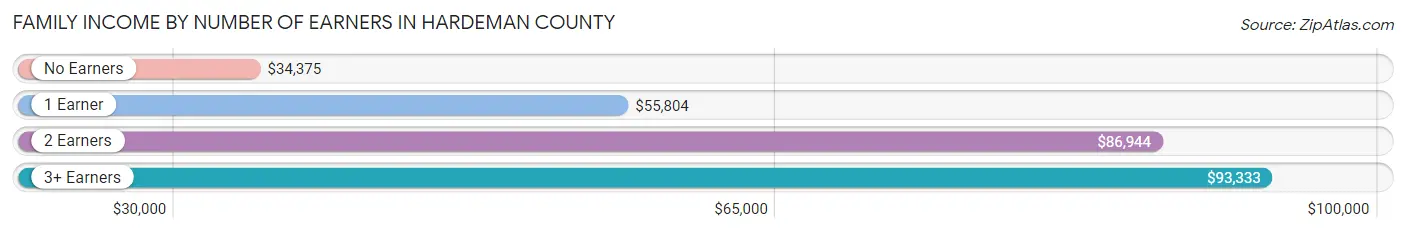
| Number of Earners | # Families | Median Income |
| No Earners | 155 (19.4%) | $34,375 |
| 1 Earner | 192 (24.0%) | $55,804 |
| 2 Earners | 274 (34.3%) | $86,944 |
| 3+ Earners | 178 (22.3%) | $93,333 |
| Total | 799 (100.0%) | $71,369 |
Household Income in Hardeman County
Household Income Brackets in Hardeman County
With 287 households falling in the category, the $50,000 to $74,999 income range is the most frequent in Hardeman County, accounting for 22.0% of all households. In contrast, only 20 households (1.5%) fall into the $200,000+ income bracket, making it the least populous group.
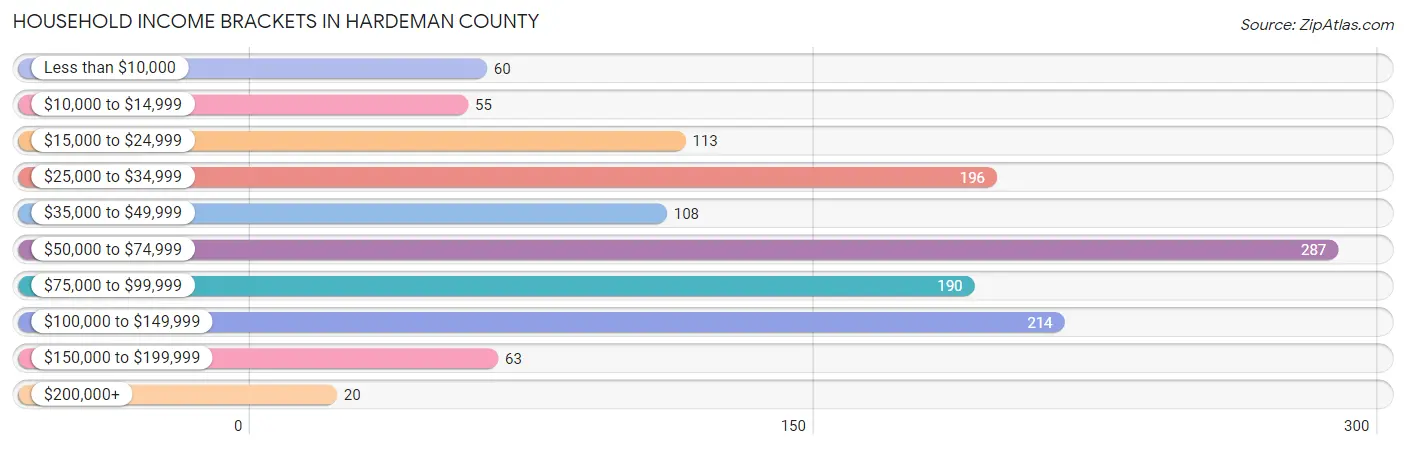
| Income Bracket | # Households | % Households |
| Less than $10,000 | 60 | 4.6% |
| $10,000 to $14,999 | 55 | 4.2% |
| $15,000 to $24,999 | 113 | 8.7% |
| $25,000 to $34,999 | 196 | 15.0% |
| $35,000 to $49,999 | 108 | 8.3% |
| $50,000 to $74,999 | 287 | 22.0% |
| $75,000 to $99,999 | 190 | 14.6% |
| $100,000 to $149,999 | 214 | 16.4% |
| $150,000 to $199,999 | 63 | 4.8% |
| $200,000+ | 20 | 1.5% |
Household Income by Householder Age in Hardeman County
The median household income in Hardeman County is $60,455, with the highest median household income of $67,222 found in the 15 to 24 years age bracket for the primary householder. A total of 54 households (4.1%) fall into this category. Meanwhile, the 45 to 64 years age bracket for the primary householder has the lowest median household income of $52,917, with 511 households (39.2%) in this group.
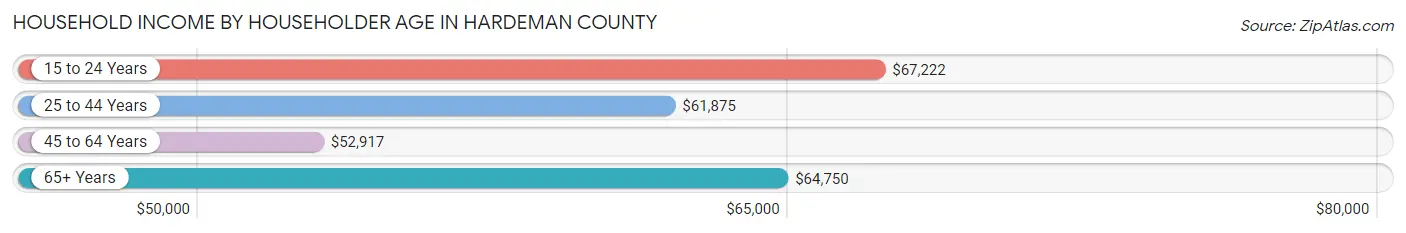
| Income Bracket | # Households | Median Income |
| 15 to 24 Years | 54 (4.1%) | $67,222 |
| 25 to 44 Years | 258 (19.8%) | $61,875 |
| 45 to 64 Years | 511 (39.2%) | $52,917 |
| 65+ Years | 481 (36.9%) | $64,750 |
| Total | 1,304 (100.0%) | $60,455 |
Poverty in Hardeman County
Income Below Poverty by Sex and Age in Hardeman County
With 9.0% poverty level for males and 13.5% for females among the residents of Hardeman County, 16 and 17 year old males and 5 year old females are the most vulnerable to poverty, with 8 males (27.6%) and 5 females (41.7%) in their respective age groups living below the poverty level.
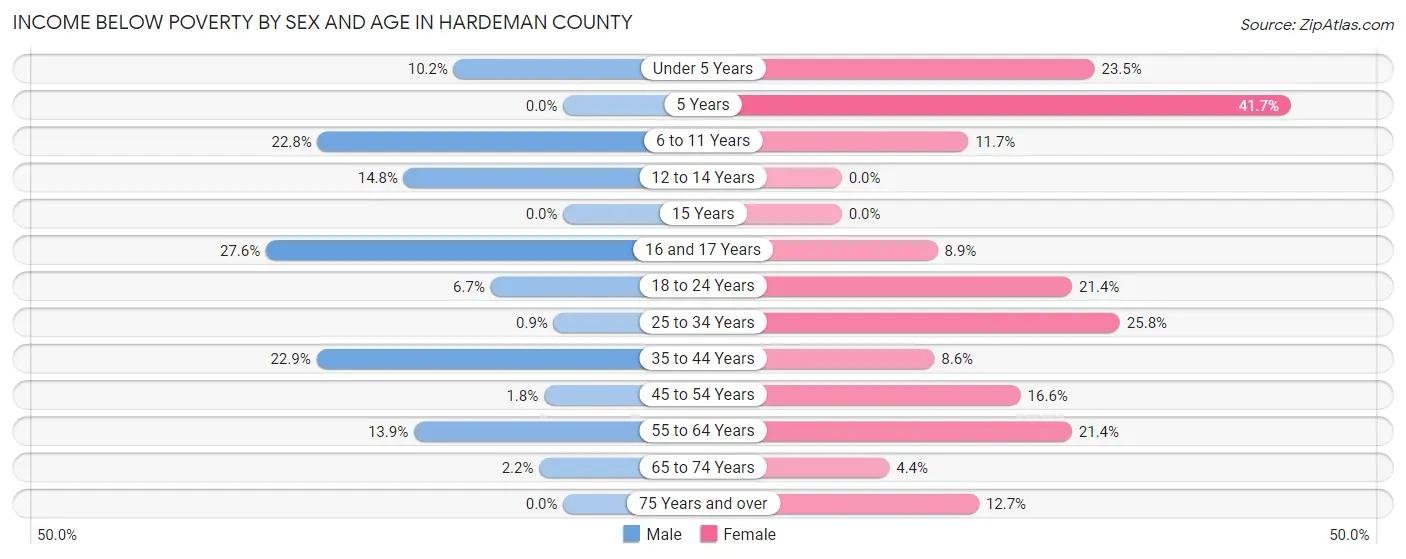
| Age Bracket | Male | Female |
| Under 5 Years | 6 (10.2%) | 19 (23.5%) |
| 5 Years | 0 (0.0%) | 5 (41.7%) |
| 6 to 11 Years | 26 (22.8%) | 19 (11.7%) |
| 12 to 14 Years | 4 (14.8%) | 0 (0.0%) |
| 15 Years | 0 (0.0%) | 0 (0.0%) |
| 16 and 17 Years | 8 (27.6%) | 4 (8.9%) |
| 18 to 24 Years | 12 (6.7%) | 31 (21.4%) |
| 25 to 34 Years | 2 (0.9%) | 24 (25.8%) |
| 35 to 44 Years | 52 (22.9%) | 22 (8.6%) |
| 45 to 54 Years | 4 (1.8%) | 42 (16.6%) |
| 55 to 64 Years | 42 (13.9%) | 38 (21.3%) |
| 65 to 74 Years | 6 (2.2%) | 10 (4.4%) |
| 75 Years and over | 0 (0.0%) | 14 (12.7%) |
| Total | 162 (9.0%) | 228 (13.5%) |
Income Above Poverty by Sex and Age in Hardeman County
According to the poverty statistics in Hardeman County, males aged 15 years and females aged 12 to 14 years are the age groups that are most secure financially, with 100.0% of males and 100.0% of females in these age groups living above the poverty line.
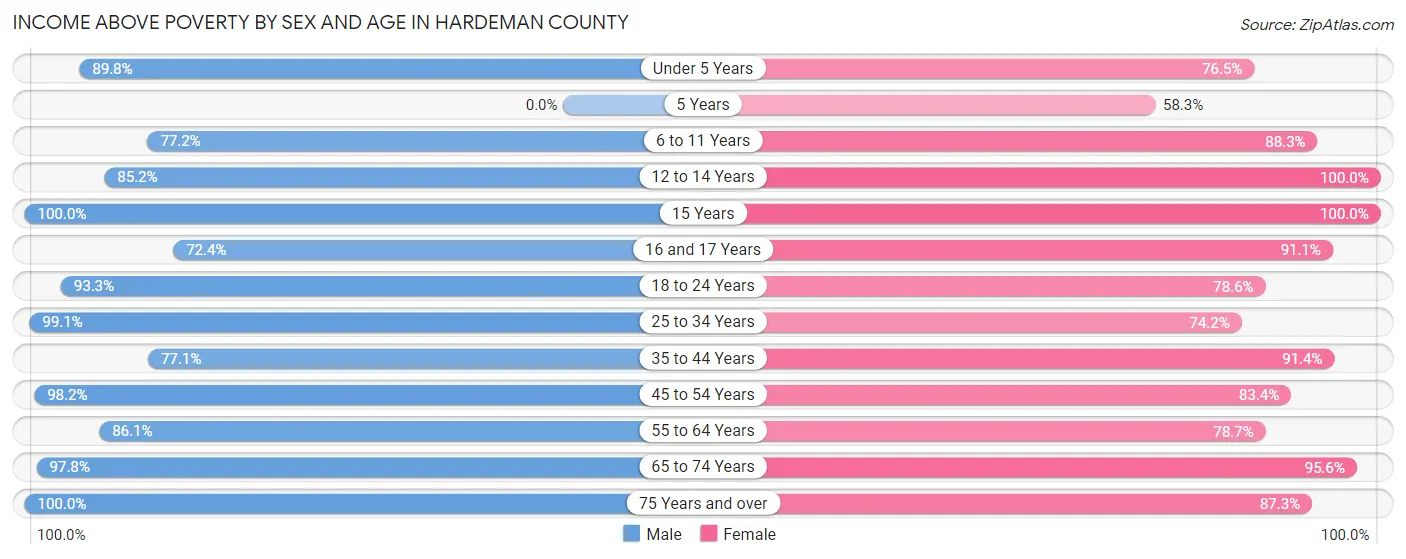
| Age Bracket | Male | Female |
| Under 5 Years | 53 (89.8%) | 62 (76.5%) |
| 5 Years | 0 (0.0%) | 7 (58.3%) |
| 6 to 11 Years | 88 (77.2%) | 143 (88.3%) |
| 12 to 14 Years | 23 (85.2%) | 90 (100.0%) |
| 15 Years | 45 (100.0%) | 39 (100.0%) |
| 16 and 17 Years | 21 (72.4%) | 41 (91.1%) |
| 18 to 24 Years | 166 (93.3%) | 114 (78.6%) |
| 25 to 34 Years | 220 (99.1%) | 69 (74.2%) |
| 35 to 44 Years | 175 (77.1%) | 234 (91.4%) |
| 45 to 54 Years | 219 (98.2%) | 211 (83.4%) |
| 55 to 64 Years | 261 (86.1%) | 140 (78.6%) |
| 65 to 74 Years | 263 (97.8%) | 217 (95.6%) |
| 75 Years and over | 103 (100.0%) | 96 (87.3%) |
| Total | 1,637 (91.0%) | 1,463 (86.5%) |
Income Below Poverty Among Married-Couple Families in Hardeman County
The poverty statistics for married-couple families in Hardeman County show that 2.9% or 17 of the total 594 families live below the poverty line. Families with no children have the highest poverty rate of 3.3%, comprising of 13 families. On the other hand, families with 3 or 4 children have the lowest poverty rate of 0.0%, which includes 0 families.
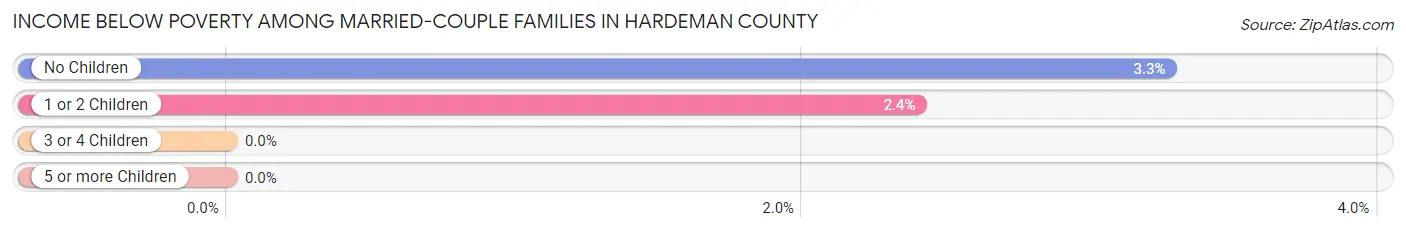
| Children | Above Poverty | Below Poverty |
| No Children | 384 (96.7%) | 13 (3.3%) |
| 1 or 2 Children | 163 (97.6%) | 4 (2.4%) |
| 3 or 4 Children | 30 (100.0%) | 0 (0.0%) |
| 5 or more Children | 0 (0.0%) | 0 (0.0%) |
| Total | 577 (97.1%) | 17 (2.9%) |
Income Below Poverty Among Single-Parent Households in Hardeman County
According to the poverty data in Hardeman County, 6.8% or 3 single-father households and 31.1% or 50 single-mother households are living below the poverty line. Among single-father households, those with 1 or 2 children have the highest poverty rate, with 3 households (7.9%) experiencing poverty. Likewise, among single-mother households, those with 3 or 4 children have the highest poverty rate, with 27 households (75.0%) falling below the poverty line.
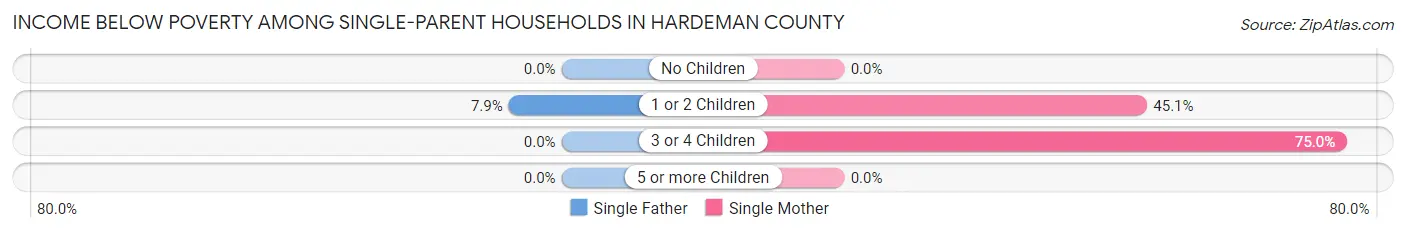
| Children | Single Father | Single Mother |
| No Children | 0 (0.0%) | 0 (0.0%) |
| 1 or 2 Children | 3 (7.9%) | 23 (45.1%) |
| 3 or 4 Children | 0 (0.0%) | 27 (75.0%) |
| 5 or more Children | 0 (0.0%) | 0 (0.0%) |
| Total | 3 (6.8%) | 50 (31.1%) |
Income Below Poverty Among Married-Couple vs Single-Parent Households in Hardeman County
The poverty data for Hardeman County shows that 17 of the married-couple family households (2.9%) and 53 of the single-parent households (25.9%) are living below the poverty level. Within the married-couple family households, those with no children have the highest poverty rate, with 13 households (3.3%) falling below the poverty line. Among the single-parent households, those with 3 or 4 children have the highest poverty rate, with 27 household (75.0%) living below poverty.
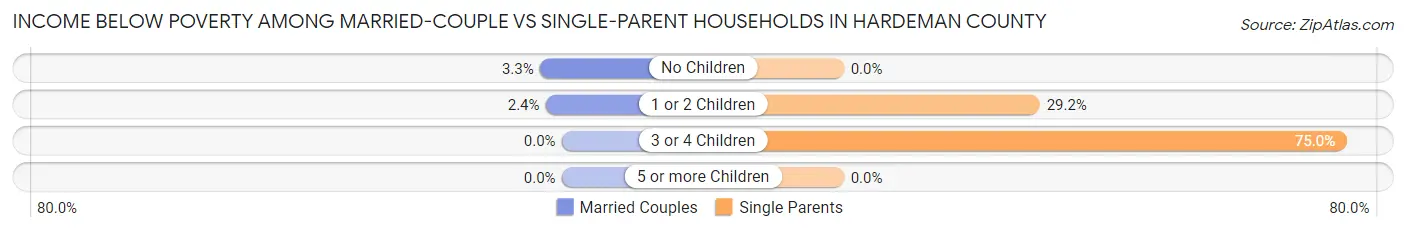
| Children | Married-Couple Families | Single-Parent Households |
| No Children | 13 (3.3%) | 0 (0.0%) |
| 1 or 2 Children | 4 (2.4%) | 26 (29.2%) |
| 3 or 4 Children | 0 (0.0%) | 27 (75.0%) |
| 5 or more Children | 0 (0.0%) | 0 (0.0%) |
| Total | 17 (2.9%) | 53 (25.9%) |
Race in Hardeman County
The most populous races in Hardeman County are White / Caucasian (2,852 | 80.5%), Hispanic or Latino (1,011 | 28.5%), and Two or more Races (382 | 10.8%).
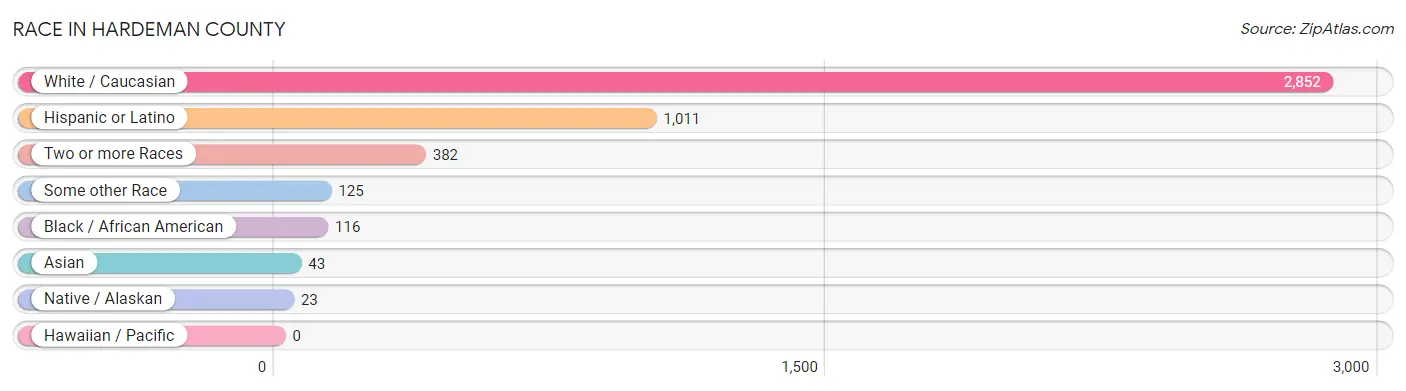
| Race | # Population | % Population |
| Asian | 43 | 1.2% |
| Black / African American | 116 | 3.3% |
| Hawaiian / Pacific | 0 | 0.0% |
| Hispanic or Latino | 1,011 | 28.5% |
| Native / Alaskan | 23 | 0.6% |
| White / Caucasian | 2,852 | 80.5% |
| Two or more Races | 382 | 10.8% |
| Some other Race | 125 | 3.5% |
| Total | 3,541 | 100.0% |
Ancestry in Hardeman County
The most populous ancestries reported in Hardeman County are Mexican (736 | 20.8%), Irish (543 | 15.3%), English (361 | 10.2%), American (214 | 6.0%), and German (195 | 5.5%), together accounting for 57.9% of all Hardeman County residents.
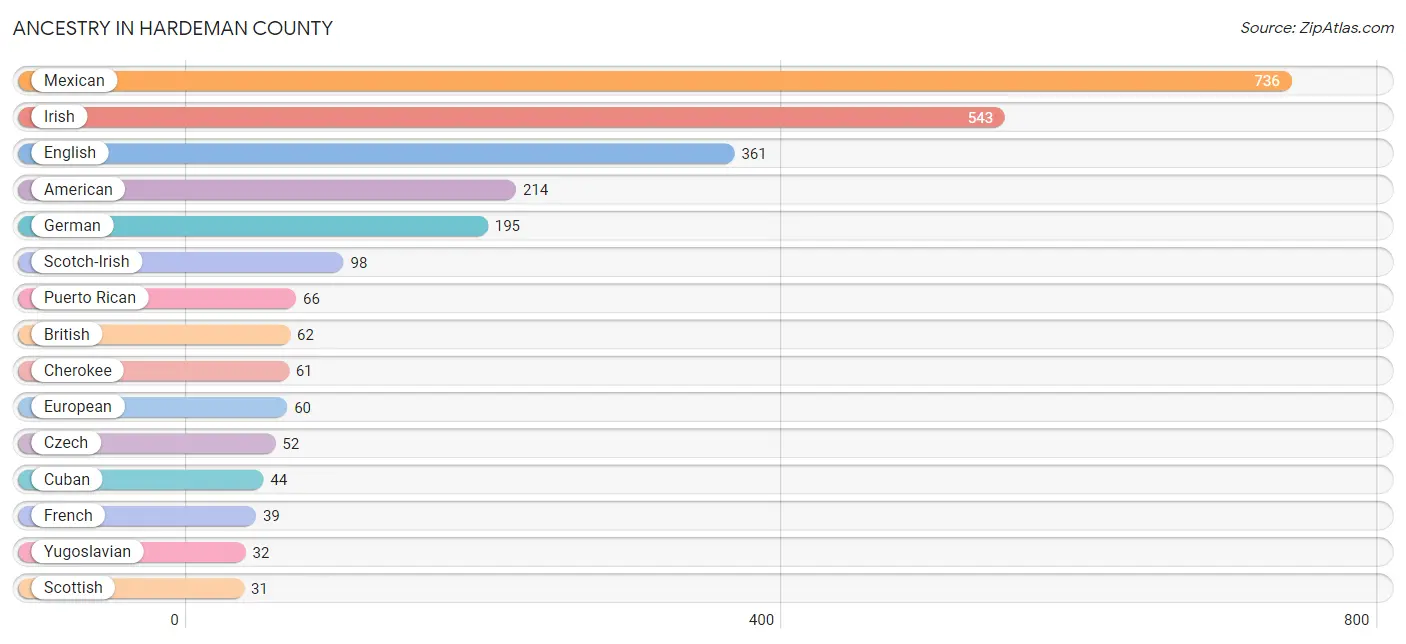
| Ancestry | # Population | % Population |
| African | 7 | 0.2% |
| American | 214 | 6.0% |
| British | 62 | 1.8% |
| Central American | 6 | 0.2% |
| Cherokee | 61 | 1.7% |
| Chickasaw | 18 | 0.5% |
| Choctaw | 29 | 0.8% |
| Comanche | 6 | 0.2% |
| Cuban | 44 | 1.2% |
| Czech | 52 | 1.5% |
| Dutch | 17 | 0.5% |
| Dutch West Indian | 10 | 0.3% |
| English | 361 | 10.2% |
| European | 60 | 1.7% |
| French | 39 | 1.1% |
| French Canadian | 5 | 0.1% |
| German | 195 | 5.5% |
| Guatemalan | 1 | 0.0% |
| Honduran | 5 | 0.1% |
| Irish | 543 | 15.3% |
| Italian | 22 | 0.6% |
| Mexican | 736 | 20.8% |
| Nigerian | 1 | 0.0% |
| Polish | 2 | 0.1% |
| Pueblo | 2 | 0.1% |
| Puerto Rican | 66 | 1.9% |
| Scandinavian | 9 | 0.3% |
| Scotch-Irish | 98 | 2.8% |
| Scottish | 31 | 0.9% |
| Sioux | 4 | 0.1% |
| South American | 18 | 0.5% |
| Spaniard | 13 | 0.4% |
| Spanish | 12 | 0.3% |
| Sri Lankan | 13 | 0.4% |
| Subsaharan African | 8 | 0.2% |
| Swiss | 3 | 0.1% |
| Thai | 30 | 0.9% |
| Venezuelan | 18 | 0.5% |
| Welsh | 8 | 0.2% |
| Yugoslavian | 32 | 0.9% | View All 40 Rows |
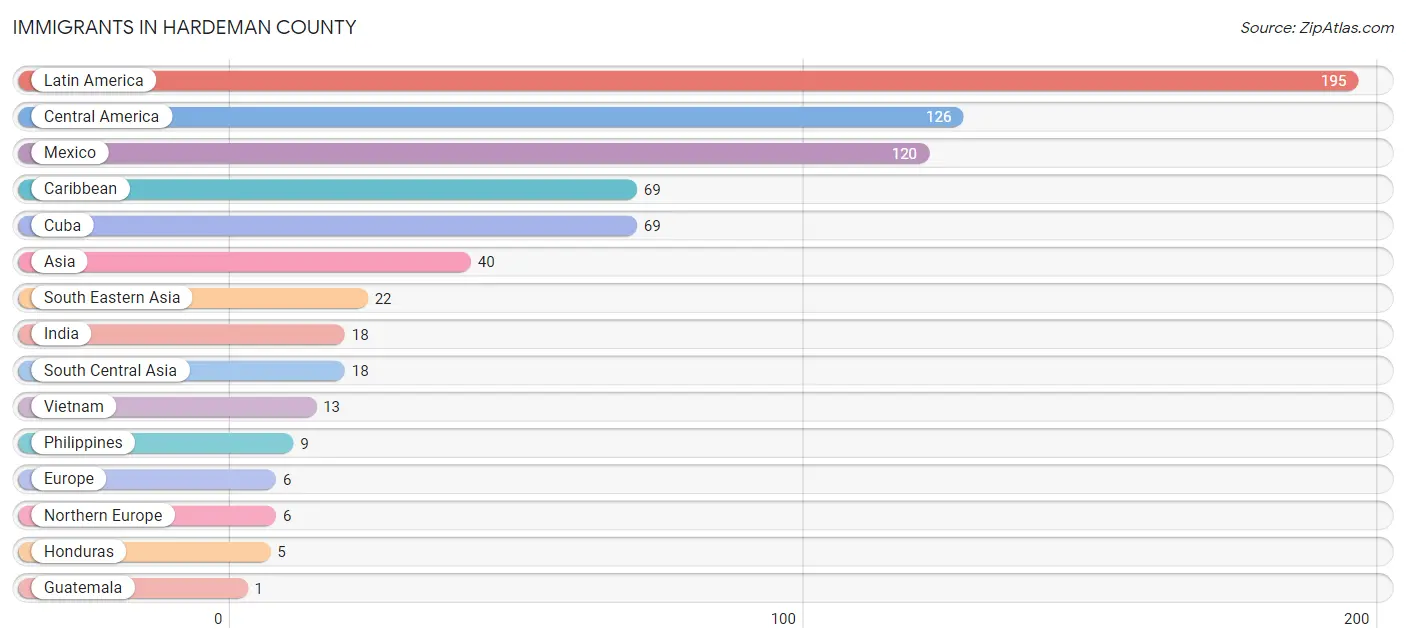
Immigrants in Hardeman County
The most numerous immigrant groups reported in Hardeman County came from Latin America (195 | 5.5%), Central America (126 | 3.6%), Mexico (120 | 3.4%), Caribbean (69 | 1.9%), and Cuba (69 | 1.9%), together accounting for 16.4% of all Hardeman County residents.
| Immigration Origin | # Population | % Population |
| Asia | 40 | 1.1% |
| Caribbean | 69 | 1.9% |
| Central America | 126 | 3.6% |
| Cuba | 69 | 1.9% |
| Europe | 6 | 0.2% |
| Guatemala | 1 | 0.0% |
| Honduras | 5 | 0.1% |
| India | 18 | 0.5% |
| Latin America | 195 | 5.5% |
| Mexico | 120 | 3.4% |
| Northern Europe | 6 | 0.2% |
| Philippines | 9 | 0.3% |
| South Central Asia | 18 | 0.5% |
| South Eastern Asia | 22 | 0.6% |
| Vietnam | 13 | 0.4% | View All 15 Rows |
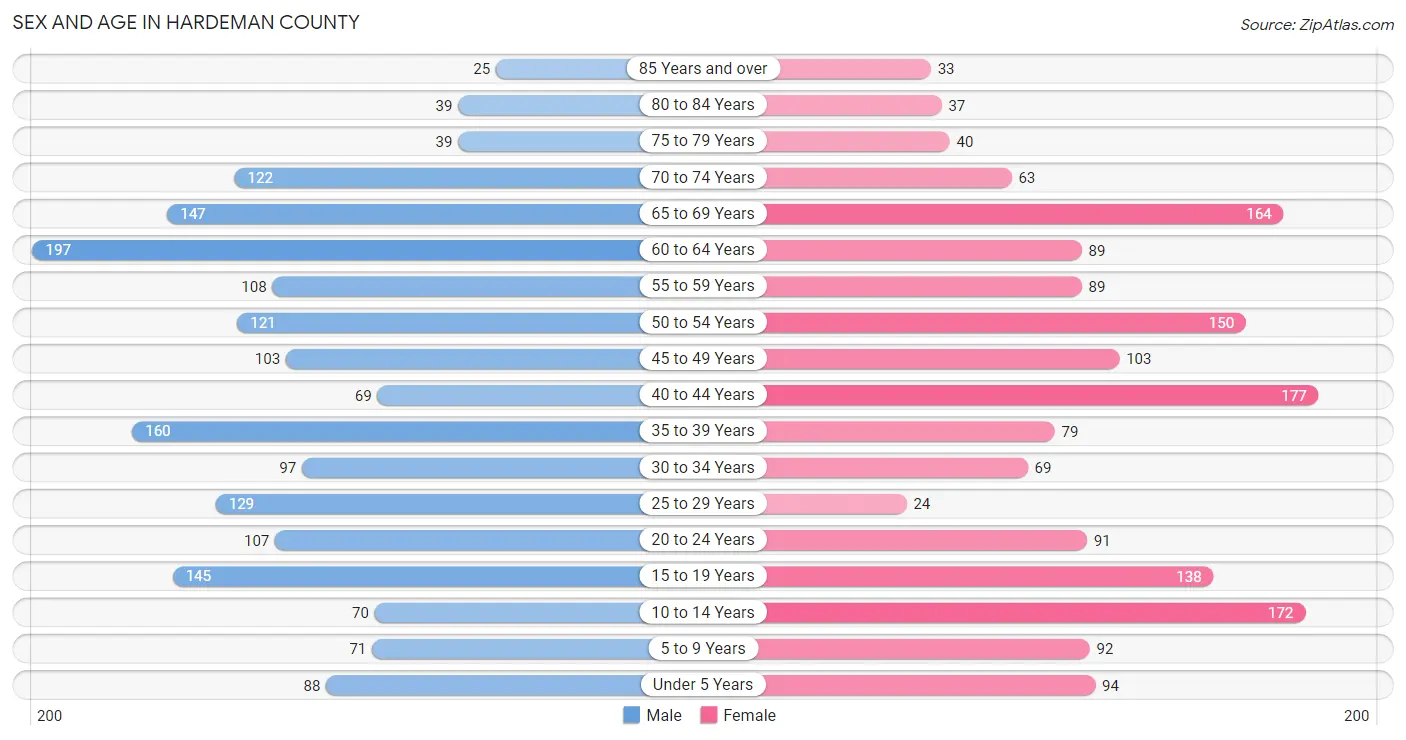
Sex and Age in Hardeman County
Sex and Age in Hardeman County
The most populous age groups in Hardeman County are 60 to 64 Years (197 | 10.7%) for men and 40 to 44 Years (177 | 10.4%) for women.
| Age Bracket | Male | Female |
| Under 5 Years | 88 (4.8%) | 94 (5.5%) |
| 5 to 9 Years | 71 (3.9%) | 92 (5.4%) |
| 10 to 14 Years | 70 (3.8%) | 172 (10.1%) |
| 15 to 19 Years | 145 (7.9%) | 138 (8.1%) |
| 20 to 24 Years | 107 (5.8%) | 91 (5.3%) |
| 25 to 29 Years | 129 (7.0%) | 24 (1.4%) |
| 30 to 34 Years | 97 (5.3%) | 69 (4.1%) |
| 35 to 39 Years | 160 (8.7%) | 79 (4.6%) |
| 40 to 44 Years | 69 (3.8%) | 177 (10.4%) |
| 45 to 49 Years | 103 (5.6%) | 103 (6.0%) |
| 50 to 54 Years | 121 (6.6%) | 150 (8.8%) |
| 55 to 59 Years | 108 (5.9%) | 89 (5.2%) |
| 60 to 64 Years | 197 (10.7%) | 89 (5.2%) |
| 65 to 69 Years | 147 (8.0%) | 164 (9.6%) |
| 70 to 74 Years | 122 (6.6%) | 63 (3.7%) |
| 75 to 79 Years | 39 (2.1%) | 40 (2.4%) |
| 80 to 84 Years | 39 (2.1%) | 37 (2.2%) |
| 85 Years and over | 25 (1.4%) | 33 (1.9%) |
| Total | 1,837 (100.0%) | 1,704 (100.0%) |
Families and Households in Hardeman County
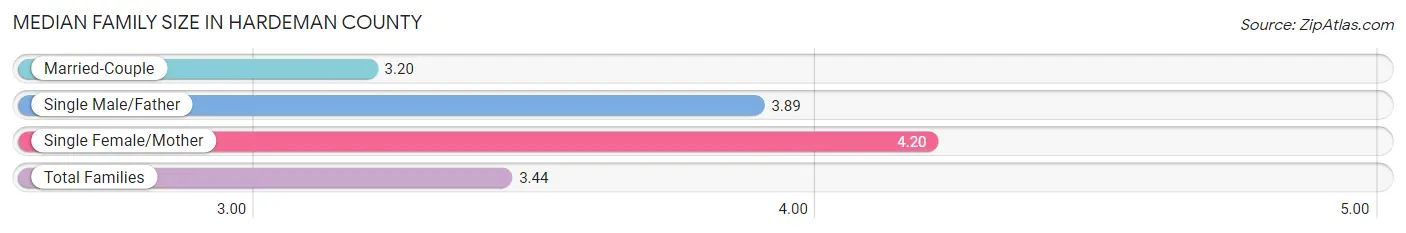
Median Family Size in Hardeman County
The median family size in Hardeman County is 3.44 persons per family, with single female/mother families (161 | 20.2%) accounting for the largest median family size of 4.2 persons per family. On the other hand, married-couple families (594 | 74.3%) represent the smallest median family size with 3.20 persons per family.
| Family Type | # Families | Family Size |
| Married-Couple | 594 (74.3%) | 3.20 |
| Single Male/Father | 44 (5.5%) | 3.89 |
| Single Female/Mother | 161 (20.2%) | 4.20 |
| Total Families | 799 (100.0%) | 3.44 |
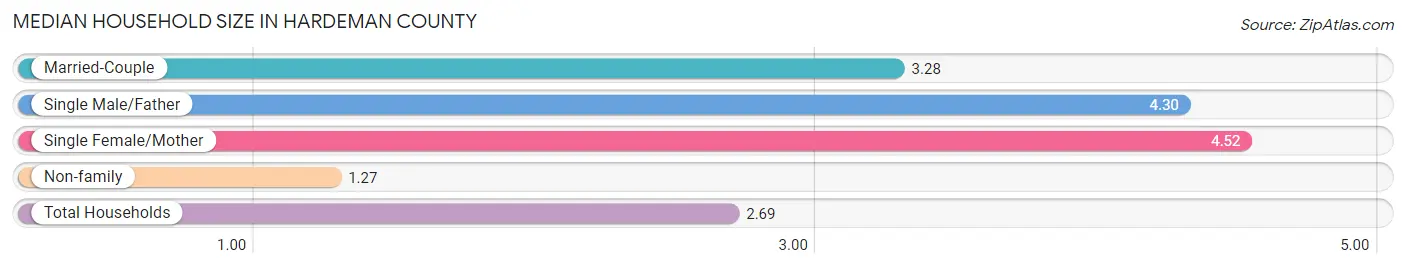
Median Household Size in Hardeman County
The median household size in Hardeman County is 2.69 persons per household, with single female/mother households (161 | 12.3%) accounting for the largest median household size of 4.52 persons per household. non-family households (505 | 38.7%) represent the smallest median household size with 1.27 persons per household.
| Household Type | # Households | Household Size |
| Married-Couple | 594 (45.6%) | 3.28 |
| Single Male/Father | 44 (3.4%) | 4.30 |
| Single Female/Mother | 161 (12.3%) | 4.52 |
| Non-family | 505 (38.7%) | 1.27 |
| Total Households | 1,304 (100.0%) | 2.69 |
Household Size by Marriage Status in Hardeman County
Out of a total of 1,304 households in Hardeman County, 799 (61.3%) are family households, while 505 (38.7%) are nonfamily households. The most numerous type of family households are 2-person households, comprising 361, and the most common type of nonfamily households are 1-person households, comprising 413.
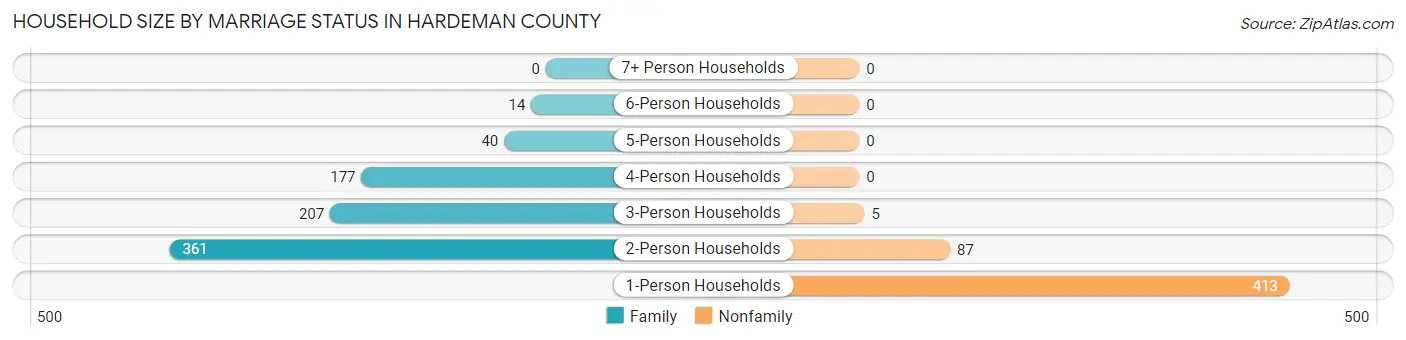
| Household Size | Family Households | Nonfamily Households |
| 1-Person Households | - | 413 (31.7%) |
| 2-Person Households | 361 (27.7%) | 87 (6.7%) |
| 3-Person Households | 207 (15.9%) | 5 (0.4%) |
| 4-Person Households | 177 (13.6%) | 0 (0.0%) |
| 5-Person Households | 40 (3.1%) | 0 (0.0%) |
| 6-Person Households | 14 (1.1%) | 0 (0.0%) |
| 7+ Person Households | 0 (0.0%) | 0 (0.0%) |
| Total | 799 (61.3%) | 505 (38.7%) |
Female Fertility in Hardeman County
Fertility by Age in Hardeman County
Average fertility rate in Hardeman County is 95.0 births per 1,000 women. Women in the age bracket of 20 to 34 years have the highest fertility rate with 326.0 births per 1,000 women. Women in the age bracket of 20 to 34 years acount for 90.9% of all women with births.
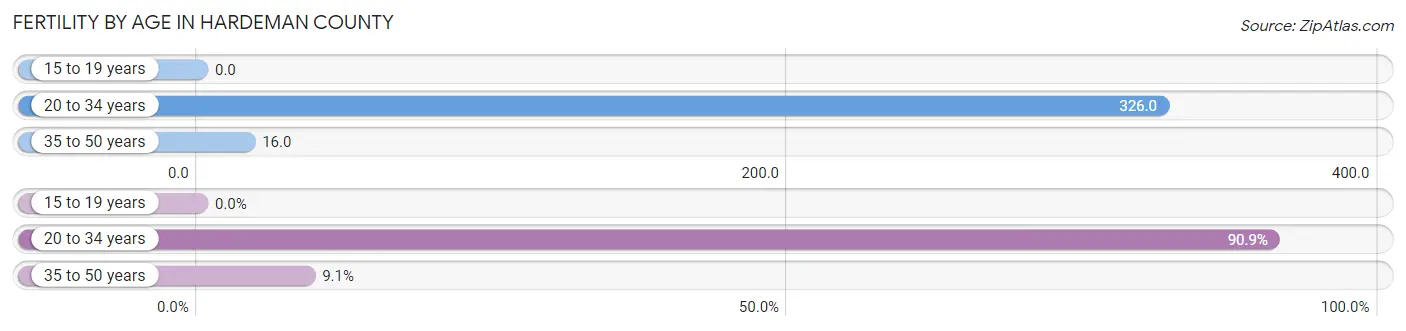
| Age Bracket | Women with Births | Births / 1,000 Women |
| 15 to 19 years | 0 (0.0%) | 0.0 |
| 20 to 34 years | 60 (90.9%) | 326.0 |
| 35 to 50 years | 6 (9.1%) | 16.0 |
| Total | 66 (100.0%) | 95.0 |
Fertility by Age by Marriage Status in Hardeman County
57.6% of women with births (66) in Hardeman County are married. The highest percentage of unmarried women with births falls into 20 to 34 years age bracket with 46.7% of them unmarried at the time of birth, while the lowest percentage of unmarried women with births belong to 35 to 50 years age bracket with 0.0% of them unmarried.
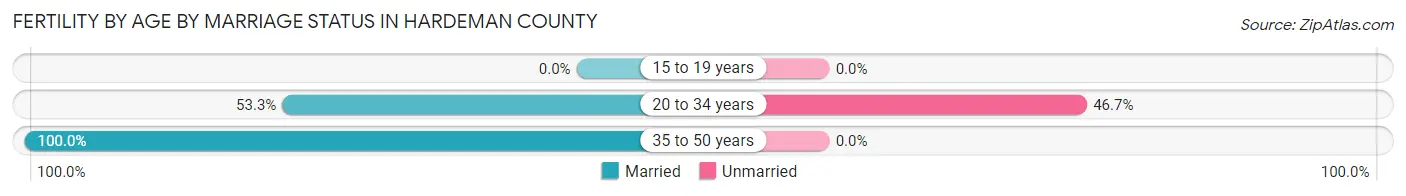
| Age Bracket | Married | Unmarried |
| 15 to 19 years | 0 (0.0%) | 0 (0.0%) |
| 20 to 34 years | 32 (53.3%) | 28 (46.7%) |
| 35 to 50 years | 6 (100.0%) | 0 (0.0%) |
| Total | 38 (57.6%) | 28 (42.4%) |
Fertility by Education in Hardeman County
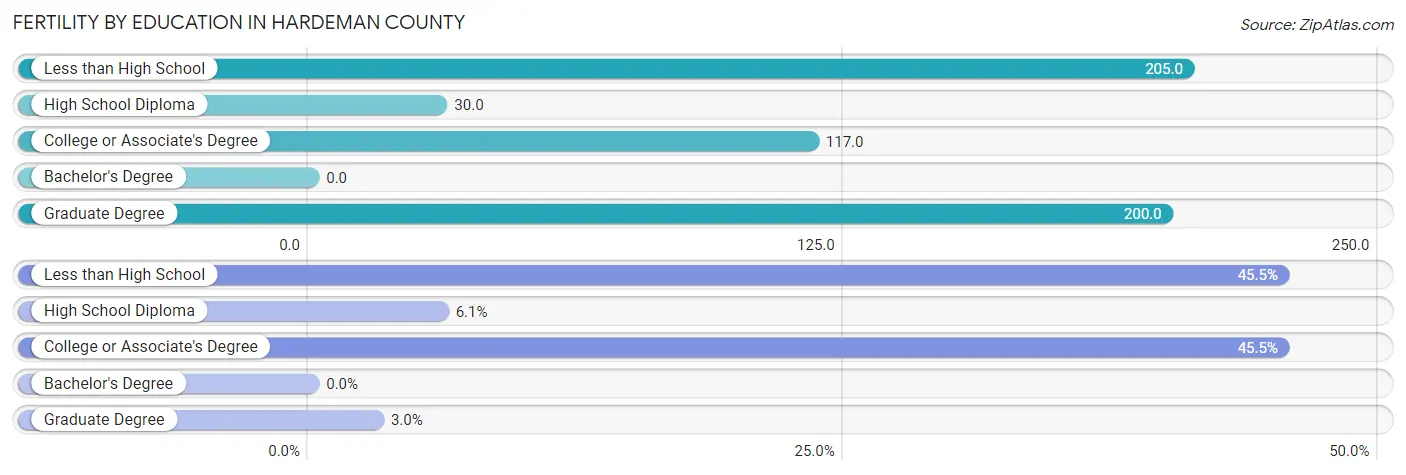
| Educational Attainment | Women with Births | Births / 1,000 Women |
| Less than High School | 30 (45.5%) | 205.0 |
| High School Diploma | 4 (6.1%) | 30.0 |
| College or Associate's Degree | 30 (45.5%) | 117.0 |
| Bachelor's Degree | 0 (0.0%) | 0.0 |
| Graduate Degree | 2 (3.0%) | 200.0 |
| Total | 66 (100.0%) | 95.0 |
Fertility by Education by Marriage Status in Hardeman County
42.4% of women with births in Hardeman County are unmarried. Women with the educational attainment of less than high school are most likely to be married with 100.0% of them married at childbirth, while women with the educational attainment of college or associate's degree are least likely to be married with 93.3% of them unmarried at childbirth.
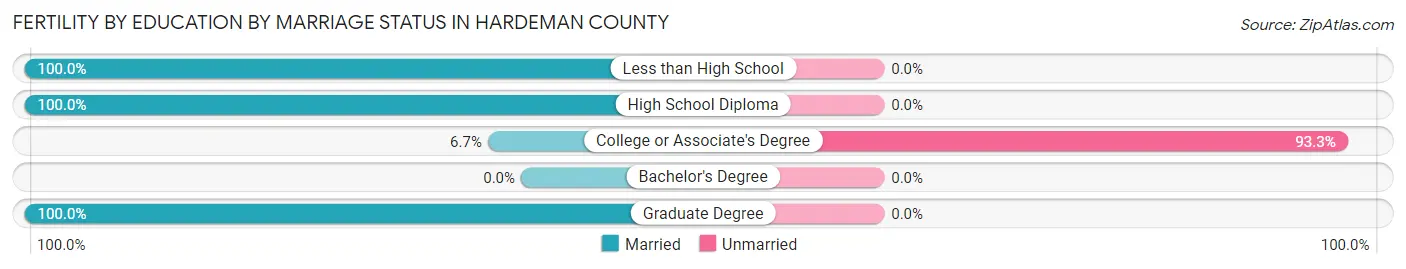
| Educational Attainment | Married | Unmarried |
| Less than High School | 30 (100.0%) | 0 (0.0%) |
| High School Diploma | 4 (100.0%) | 0 (0.0%) |
| College or Associate's Degree | 2 (6.7%) | 28 (93.3%) |
| Bachelor's Degree | 0 (0.0%) | 0 (0.0%) |
| Graduate Degree | 2 (100.0%) | 0 (0.0%) |
| Total | 38 (57.6%) | 28 (42.4%) |
Employment Characteristics in Hardeman County
Employment by Class of Employer in Hardeman County
Among the 1,802 employed individuals in Hardeman County, private company employees (1,004 | 55.7%), local government employees (334 | 18.5%), and self-employed (not incorporated) (177 | 9.8%) make up the most common classes of employment.
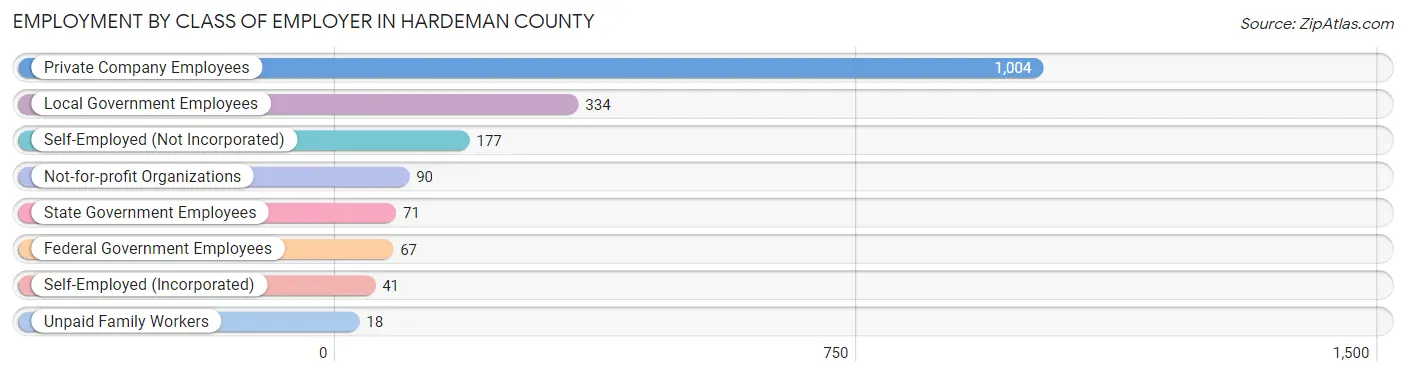
| Employer Class | # Employees | % Employees |
| Private Company Employees | 1,004 | 55.7% |
| Self-Employed (Incorporated) | 41 | 2.3% |
| Self-Employed (Not Incorporated) | 177 | 9.8% |
| Not-for-profit Organizations | 90 | 5.0% |
| Local Government Employees | 334 | 18.5% |
| State Government Employees | 71 | 3.9% |
| Federal Government Employees | 67 | 3.7% |
| Unpaid Family Workers | 18 | 1.0% |
| Total | 1,802 | 100.0% |
Employment Status by Age in Hardeman County
According to the labor force statistics for Hardeman County, out of the total population over 16 years of age (2,870), 64.7% or 1,857 individuals are in the labor force, with 2.5% or 46 of them unemployed. The age group with the highest labor force participation rate is 30 to 34 years, with 91.0% or 151 individuals in the labor force. Within the labor force, the 16 to 19 years age range has the highest percentage of unemployed individuals, with 7.4% or 6 of them being unemployed.
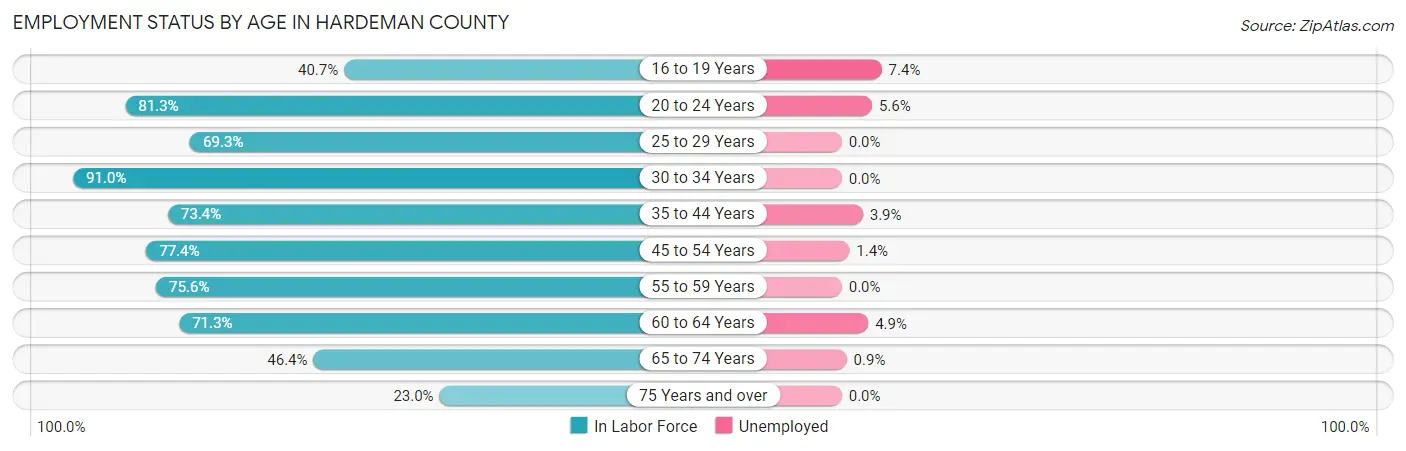
| Age Bracket | In Labor Force | Unemployed |
| 16 to 19 Years | 81 (40.7%) | 6 (7.4%) |
| 20 to 24 Years | 161 (81.3%) | 9 (5.6%) |
| 25 to 29 Years | 106 (69.3%) | 0 (0.0%) |
| 30 to 34 Years | 151 (91.0%) | 0 (0.0%) |
| 35 to 44 Years | 356 (73.4%) | 14 (3.9%) |
| 45 to 54 Years | 369 (77.4%) | 5 (1.4%) |
| 55 to 59 Years | 149 (75.6%) | 0 (0.0%) |
| 60 to 64 Years | 204 (71.3%) | 10 (4.9%) |
| 65 to 74 Years | 230 (46.4%) | 2 (0.9%) |
| 75 Years and over | 49 (23.0%) | 0 (0.0%) |
| Total | 1,857 (64.7%) | 46 (2.5%) |
Employment Status by Educational Attainment in Hardeman County
According to labor force statistics for Hardeman County, 75.7% of individuals (1,335) out of the total population between 25 and 64 years of age (1,764) are in the labor force, with 2.2% or 29 of them being unemployed. The group with the highest labor force participation rate are those with the educational attainment of bachelor's degree or higher, with 93.3% or 223 individuals in the labor force. Within the labor force, individuals with less than high school education have the highest percentage of unemployment, with 5.2% or 8 of them being unemployed.
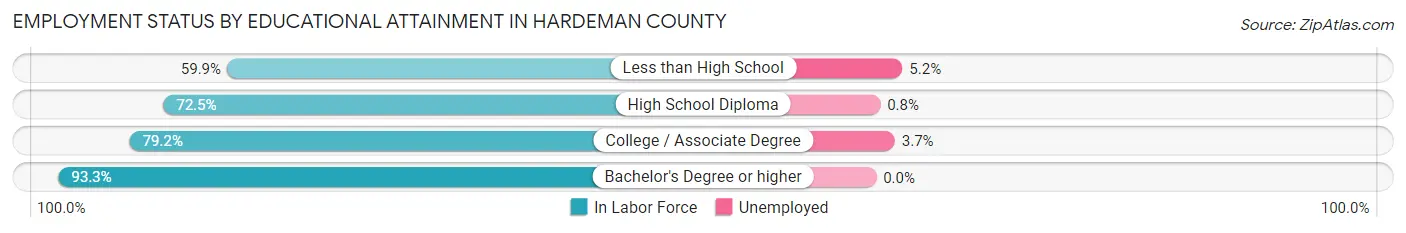
| Educational Attainment | In Labor Force | Unemployed |
| Less than High School | 154 (59.9%) | 13 (5.2%) |
| High School Diploma | 504 (72.5%) | 6 (0.8%) |
| College / Associate Degree | 454 (79.2%) | 21 (3.7%) |
| Bachelor's Degree or higher | 223 (93.3%) | 0 (0.0%) |
| Total | 1,335 (75.7%) | 39 (2.2%) |
Employment Occupations by Sex in Hardeman County
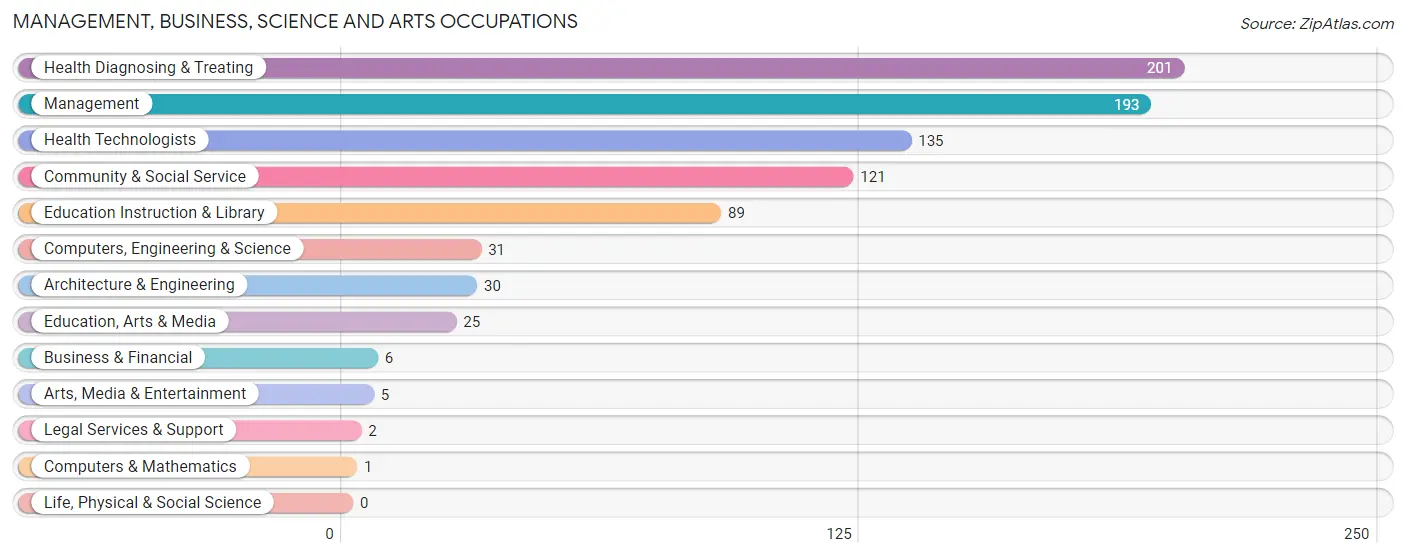
Management, Business, Science and Arts Occupations
The most common Management, Business, Science and Arts occupations in Hardeman County are Health Diagnosing & Treating (201 | 11.1%), Management (193 | 10.7%), Health Technologists (135 | 7.5%), Community & Social Service (121 | 6.7%), and Education Instruction & Library (89 | 4.9%).
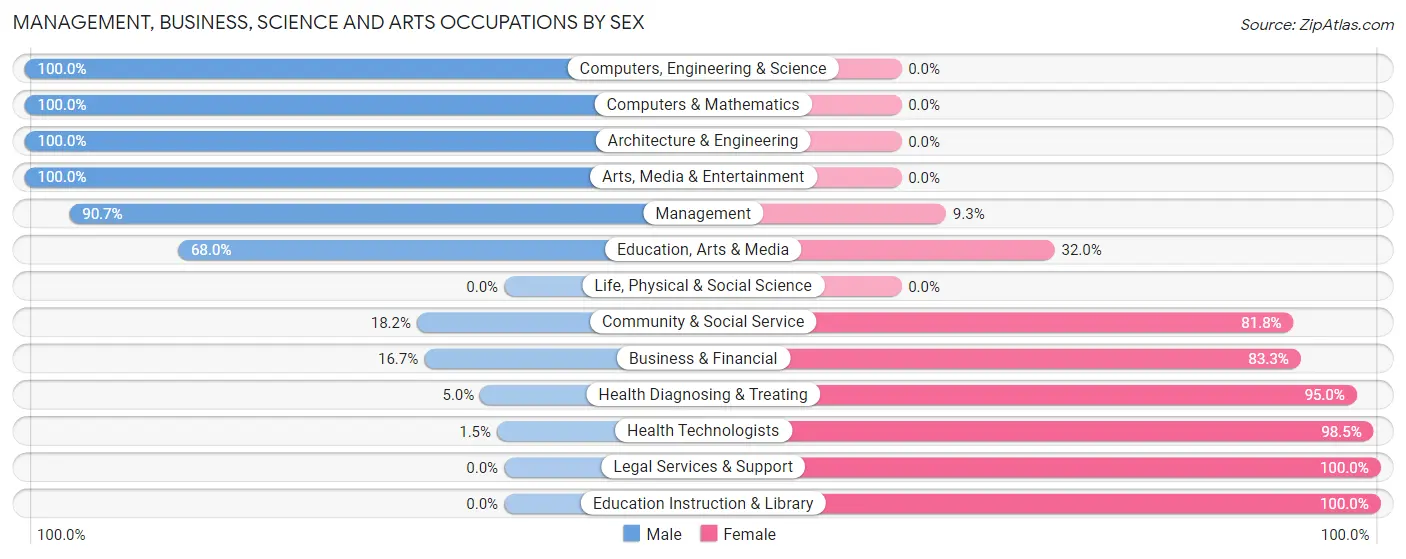
Management, Business, Science and Arts Occupations by Sex
Within the Management, Business, Science and Arts occupations in Hardeman County, the most male-oriented occupations are Computers, Engineering & Science (100.0%), Computers & Mathematics (100.0%), and Architecture & Engineering (100.0%), while the most female-oriented occupations are Legal Services & Support (100.0%), Education Instruction & Library (100.0%), and Health Technologists (98.5%).
| Occupation | Male | Female |
| Management | 175 (90.7%) | 18 (9.3%) |
| Business & Financial | 1 (16.7%) | 5 (83.3%) |
| Computers, Engineering & Science | 31 (100.0%) | 0 (0.0%) |
| Computers & Mathematics | 1 (100.0%) | 0 (0.0%) |
| Architecture & Engineering | 30 (100.0%) | 0 (0.0%) |
| Life, Physical & Social Science | 0 (0.0%) | 0 (0.0%) |
| Community & Social Service | 22 (18.2%) | 99 (81.8%) |
| Education, Arts & Media | 17 (68.0%) | 8 (32.0%) |
| Legal Services & Support | 0 (0.0%) | 2 (100.0%) |
| Education Instruction & Library | 0 (0.0%) | 89 (100.0%) |
| Arts, Media & Entertainment | 5 (100.0%) | 0 (0.0%) |
| Health Diagnosing & Treating | 10 (5.0%) | 191 (95.0%) |
| Health Technologists | 2 (1.5%) | 133 (98.5%) |
| Total (Category) | 239 (43.3%) | 313 (56.7%) |
| Total (Overall) | 981 (54.2%) | 829 (45.8%) |
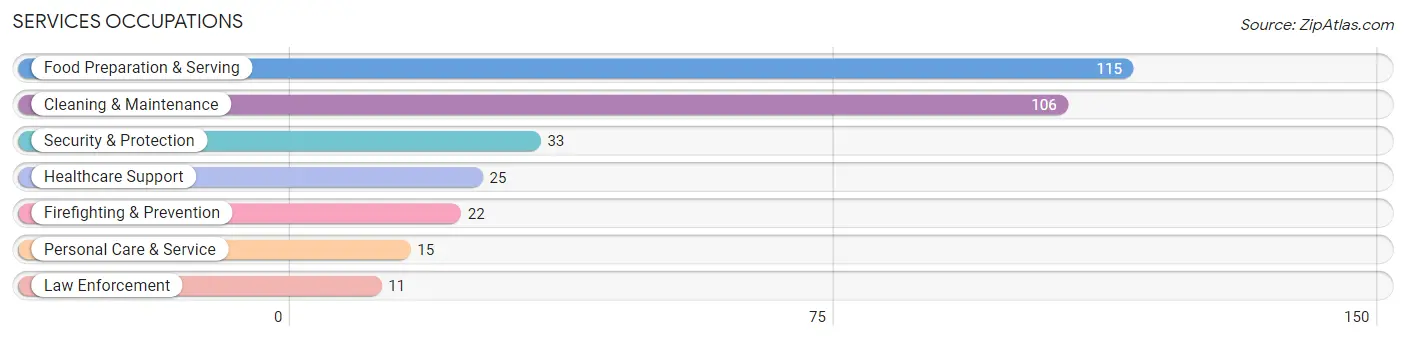
Services Occupations
The most common Services occupations in Hardeman County are Food Preparation & Serving (115 | 6.4%), Cleaning & Maintenance (106 | 5.9%), Security & Protection (33 | 1.8%), Healthcare Support (25 | 1.4%), and Firefighting & Prevention (22 | 1.2%).
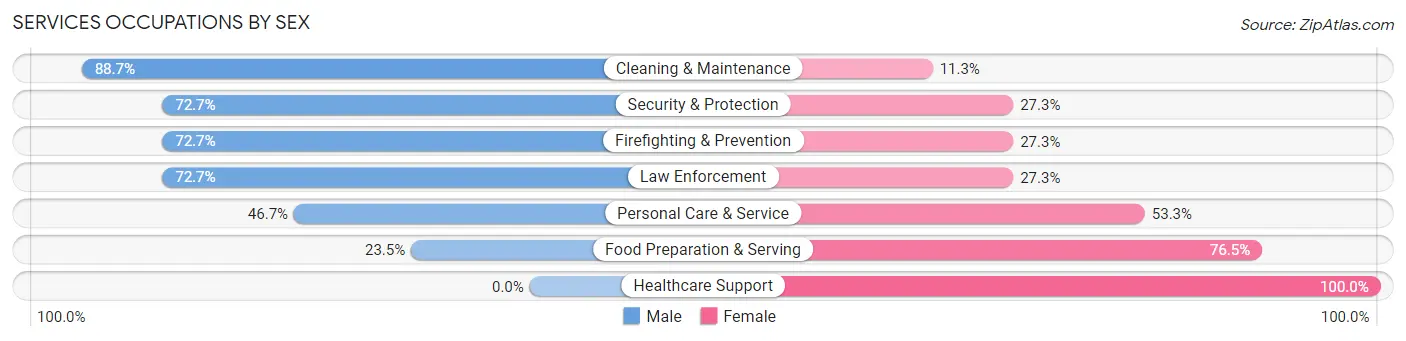
Services Occupations by Sex
Within the Services occupations in Hardeman County, the most male-oriented occupations are Cleaning & Maintenance (88.7%), Security & Protection (72.7%), and Firefighting & Prevention (72.7%), while the most female-oriented occupations are Healthcare Support (100.0%), Food Preparation & Serving (76.5%), and Personal Care & Service (53.3%).
| Occupation | Male | Female |
| Healthcare Support | 0 (0.0%) | 25 (100.0%) |
| Security & Protection | 24 (72.7%) | 9 (27.3%) |
| Firefighting & Prevention | 16 (72.7%) | 6 (27.3%) |
| Law Enforcement | 8 (72.7%) | 3 (27.3%) |
| Food Preparation & Serving | 27 (23.5%) | 88 (76.5%) |
| Cleaning & Maintenance | 94 (88.7%) | 12 (11.3%) |
| Personal Care & Service | 7 (46.7%) | 8 (53.3%) |
| Total (Category) | 152 (51.7%) | 142 (48.3%) |
| Total (Overall) | 981 (54.2%) | 829 (45.8%) |
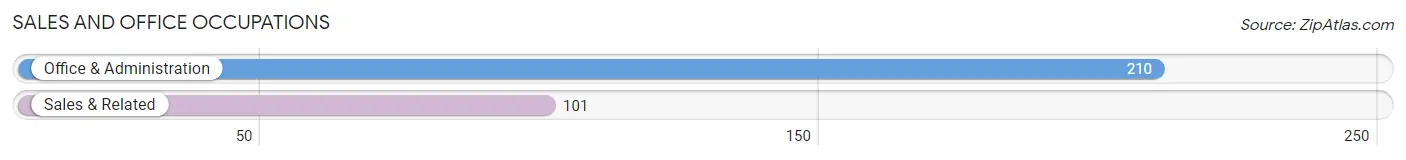
Sales and Office Occupations
The most common Sales and Office occupations in Hardeman County are Office & Administration (210 | 11.6%), and Sales & Related (101 | 5.6%).
Sales and Office Occupations by Sex
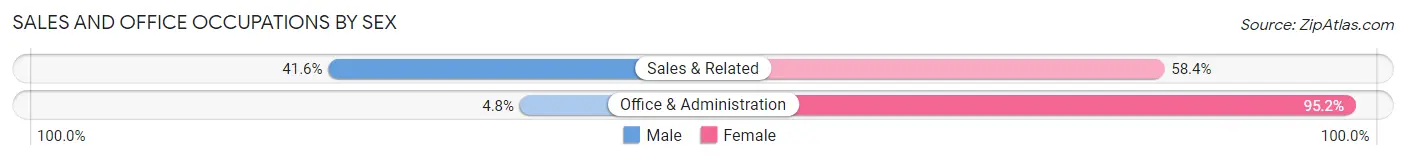
| Occupation | Male | Female |
| Sales & Related | 42 (41.6%) | 59 (58.4%) |
| Office & Administration | 10 (4.8%) | 200 (95.2%) |
| Total (Category) | 52 (16.7%) | 259 (83.3%) |
| Total (Overall) | 981 (54.2%) | 829 (45.8%) |
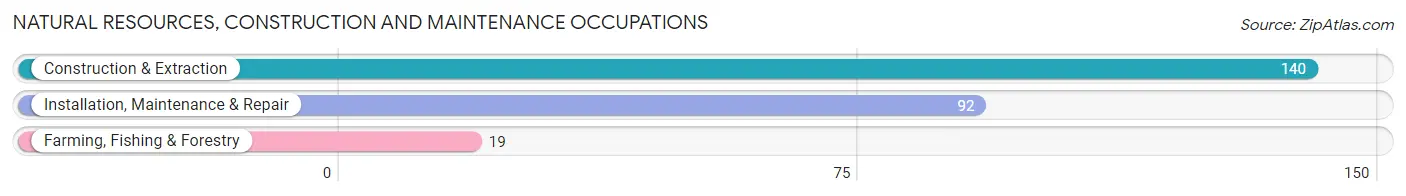
Natural Resources, Construction and Maintenance Occupations
The most common Natural Resources, Construction and Maintenance occupations in Hardeman County are Construction & Extraction (140 | 7.7%), Installation, Maintenance & Repair (92 | 5.1%), and Farming, Fishing & Forestry (19 | 1.1%).
Natural Resources, Construction and Maintenance Occupations by Sex
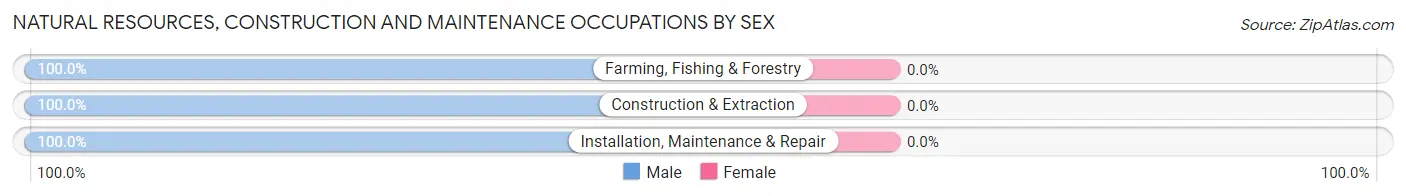
| Occupation | Male | Female |
| Farming, Fishing & Forestry | 19 (100.0%) | 0 (0.0%) |
| Construction & Extraction | 140 (100.0%) | 0 (0.0%) |
| Installation, Maintenance & Repair | 92 (100.0%) | 0 (0.0%) |
| Total (Category) | 251 (100.0%) | 0 (0.0%) |
| Total (Overall) | 981 (54.2%) | 829 (45.8%) |
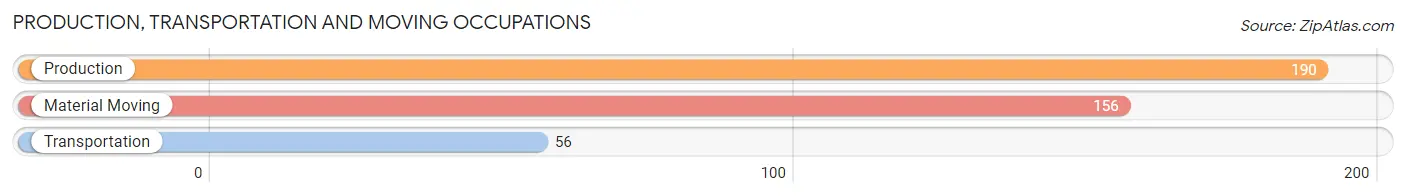
Production, Transportation and Moving Occupations
The most common Production, Transportation and Moving occupations in Hardeman County are Production (190 | 10.5%), Material Moving (156 | 8.6%), and Transportation (56 | 3.1%).
Production, Transportation and Moving Occupations by Sex
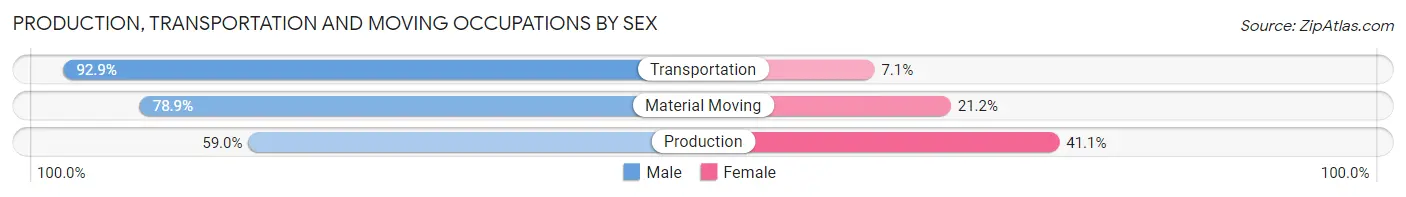
| Occupation | Male | Female |
| Production | 112 (59.0%) | 78 (41.0%) |
| Transportation | 52 (92.9%) | 4 (7.1%) |
| Material Moving | 123 (78.8%) | 33 (21.1%) |
| Total (Category) | 287 (71.4%) | 115 (28.6%) |
| Total (Overall) | 981 (54.2%) | 829 (45.8%) |
Employment Industries by Sex in Hardeman County
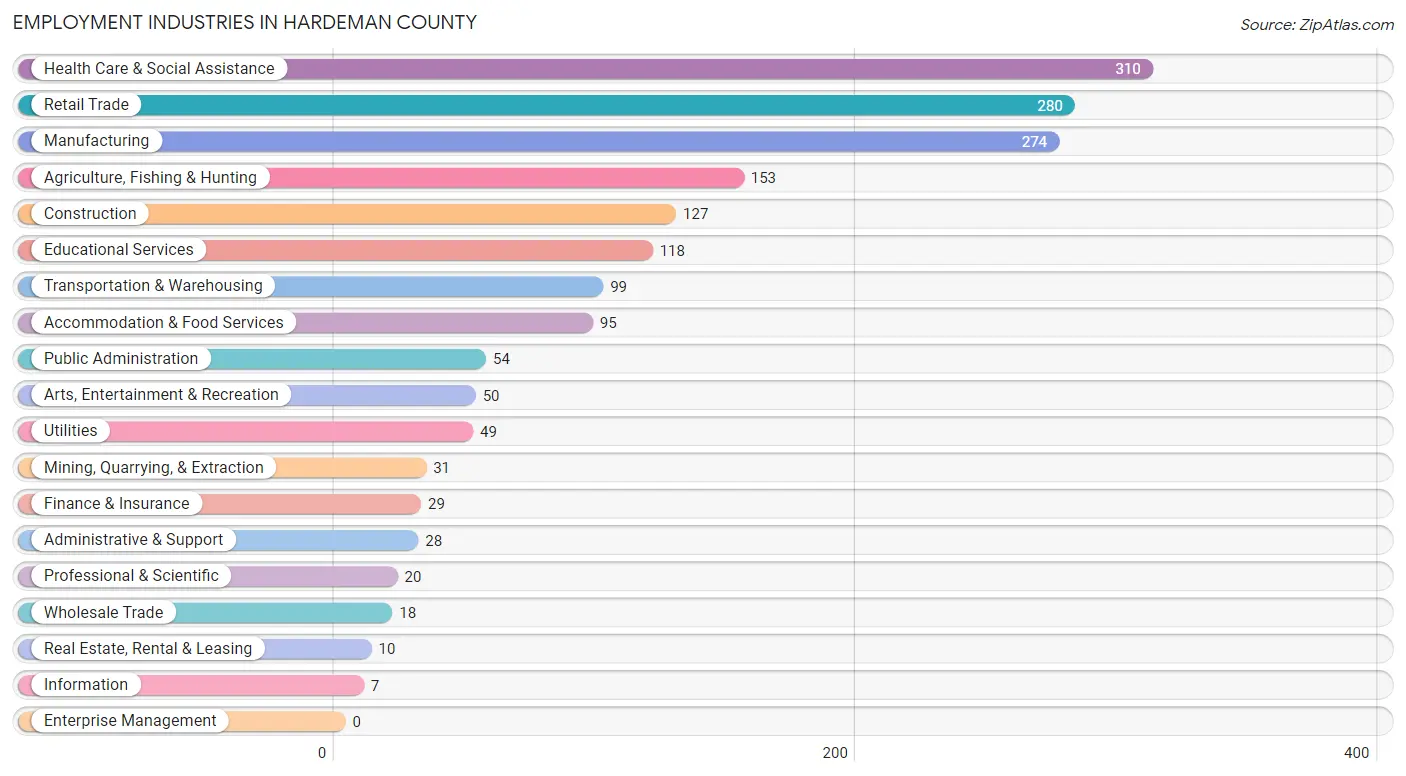
Employment Industries in Hardeman County
The major employment industries in Hardeman County include Health Care & Social Assistance (310 | 17.1%), Retail Trade (280 | 15.5%), Manufacturing (274 | 15.1%), Agriculture, Fishing & Hunting (153 | 8.5%), and Construction (127 | 7.0%).
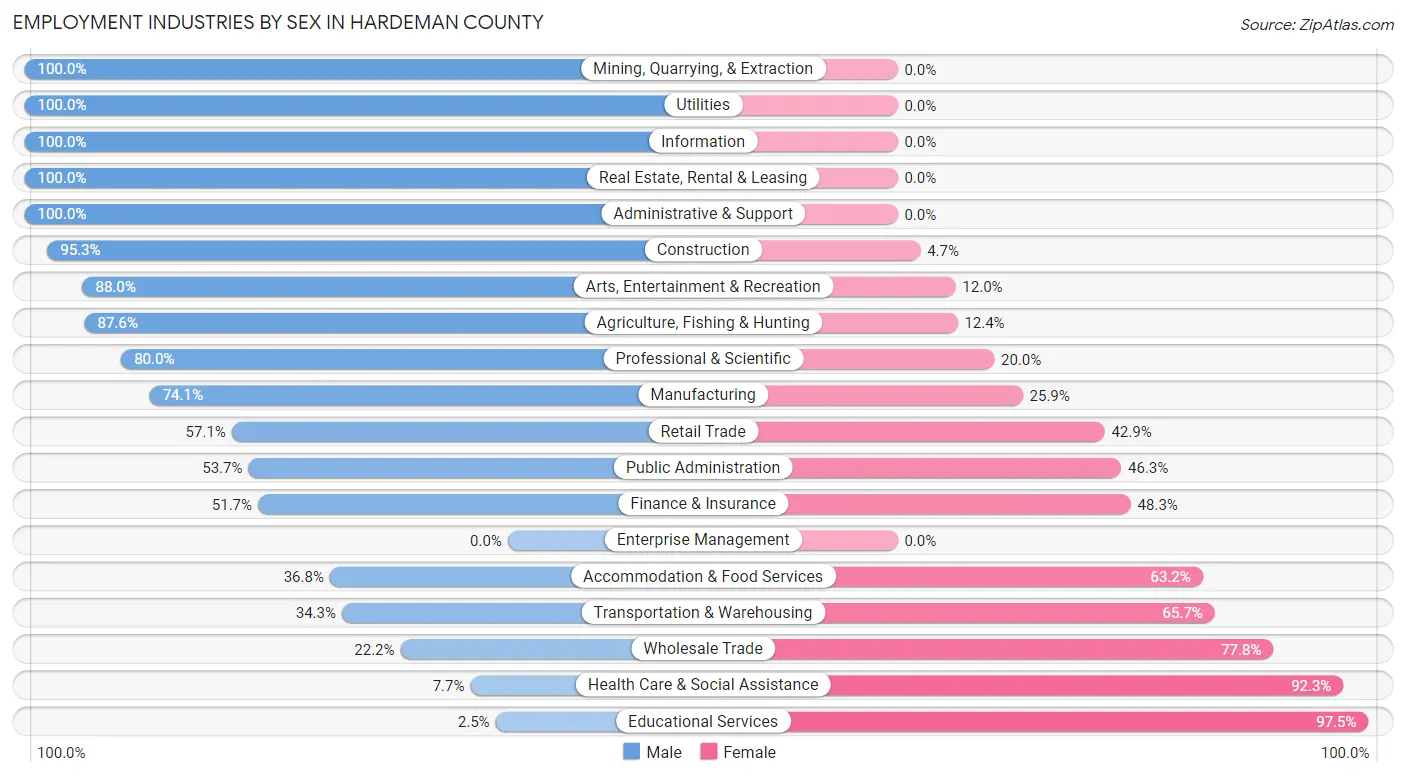
Employment Industries by Sex in Hardeman County
The Hardeman County industries that see more men than women are Mining, Quarrying, & Extraction (100.0%), Utilities (100.0%), and Information (100.0%), whereas the industries that tend to have a higher number of women are Educational Services (97.5%), Health Care & Social Assistance (92.3%), and Wholesale Trade (77.8%).
| Industry | Male | Female |
| Agriculture, Fishing & Hunting | 134 (87.6%) | 19 (12.4%) |
| Mining, Quarrying, & Extraction | 31 (100.0%) | 0 (0.0%) |
| Construction | 121 (95.3%) | 6 (4.7%) |
| Manufacturing | 203 (74.1%) | 71 (25.9%) |
| Wholesale Trade | 4 (22.2%) | 14 (77.8%) |
| Retail Trade | 160 (57.1%) | 120 (42.9%) |
| Transportation & Warehousing | 34 (34.3%) | 65 (65.7%) |
| Utilities | 49 (100.0%) | 0 (0.0%) |
| Information | 7 (100.0%) | 0 (0.0%) |
| Finance & Insurance | 15 (51.7%) | 14 (48.3%) |
| Real Estate, Rental & Leasing | 10 (100.0%) | 0 (0.0%) |
| Professional & Scientific | 16 (80.0%) | 4 (20.0%) |
| Enterprise Management | 0 (0.0%) | 0 (0.0%) |
| Administrative & Support | 28 (100.0%) | 0 (0.0%) |
| Educational Services | 3 (2.5%) | 115 (97.5%) |
| Health Care & Social Assistance | 24 (7.7%) | 286 (92.3%) |
| Arts, Entertainment & Recreation | 44 (88.0%) | 6 (12.0%) |
| Accommodation & Food Services | 35 (36.8%) | 60 (63.2%) |
| Public Administration | 29 (53.7%) | 25 (46.3%) |
| Total | 981 (54.2%) | 829 (45.8%) |
Education in Hardeman County
School Enrollment in Hardeman County
The most common levels of schooling among the 731 students in Hardeman County are high school (198 | 27.1%), elementary school (139 | 19.0%), and middle school (125 | 17.1%).
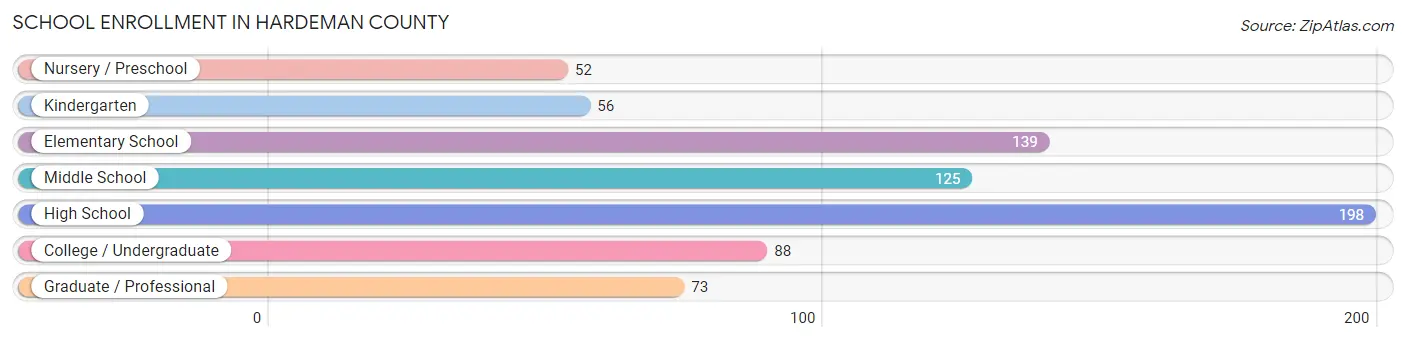
| School Level | # Students | % Students |
| Nursery / Preschool | 52 | 7.1% |
| Kindergarten | 56 | 7.7% |
| Elementary School | 139 | 19.0% |
| Middle School | 125 | 17.1% |
| High School | 198 | 27.1% |
| College / Undergraduate | 88 | 12.0% |
| Graduate / Professional | 73 | 10.0% |
| Total | 731 | 100.0% |
School Enrollment by Age by Funding Source in Hardeman County
Out of a total of 731 students who are enrolled in schools in Hardeman County, 24 (3.3%) attend a private institution, while the remaining 707 (96.7%) are enrolled in public schools. The age group of 3 to 4 year olds has the highest likelihood of being enrolled in private schools, with 10 (22.2% in the age bracket) enrolled. Conversely, the age group of 5 to 9 year old has the lowest likelihood of being enrolled in a private school, with 163 (100.0% in the age bracket) attending a public institution.
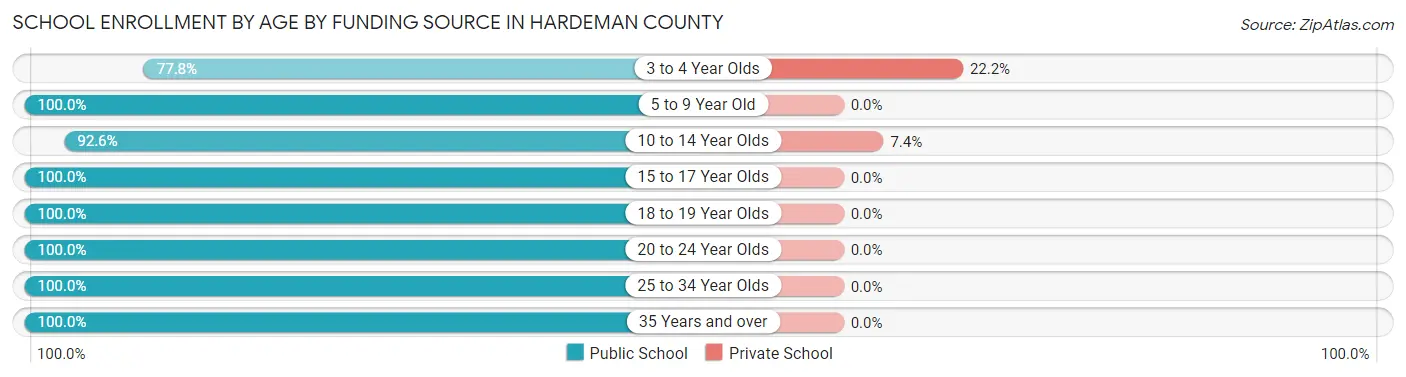
| Age Bracket | Public School | Private School |
| 3 to 4 Year Olds | 35 (77.8%) | 10 (22.2%) |
| 5 to 9 Year Old | 163 (100.0%) | 0 (0.0%) |
| 10 to 14 Year Olds | 175 (92.6%) | 14 (7.4%) |
| 15 to 17 Year Olds | 158 (100.0%) | 0 (0.0%) |
| 18 to 19 Year Olds | 55 (100.0%) | 0 (0.0%) |
| 20 to 24 Year Olds | 26 (100.0%) | 0 (0.0%) |
| 25 to 34 Year Olds | 12 (100.0%) | 0 (0.0%) |
| 35 Years and over | 83 (100.0%) | 0 (0.0%) |
| Total | 707 (96.7%) | 24 (3.3%) |
Educational Attainment by Field of Study in Hardeman County
Education (132 | 29.7%), physical & health sciences (83 | 18.7%), science & technology (74 | 16.7%), business (59 | 13.3%), and bio, nature & agricultural (37 | 8.3%) are the most common fields of study among 444 individuals in Hardeman County who have obtained a bachelor's degree or higher.
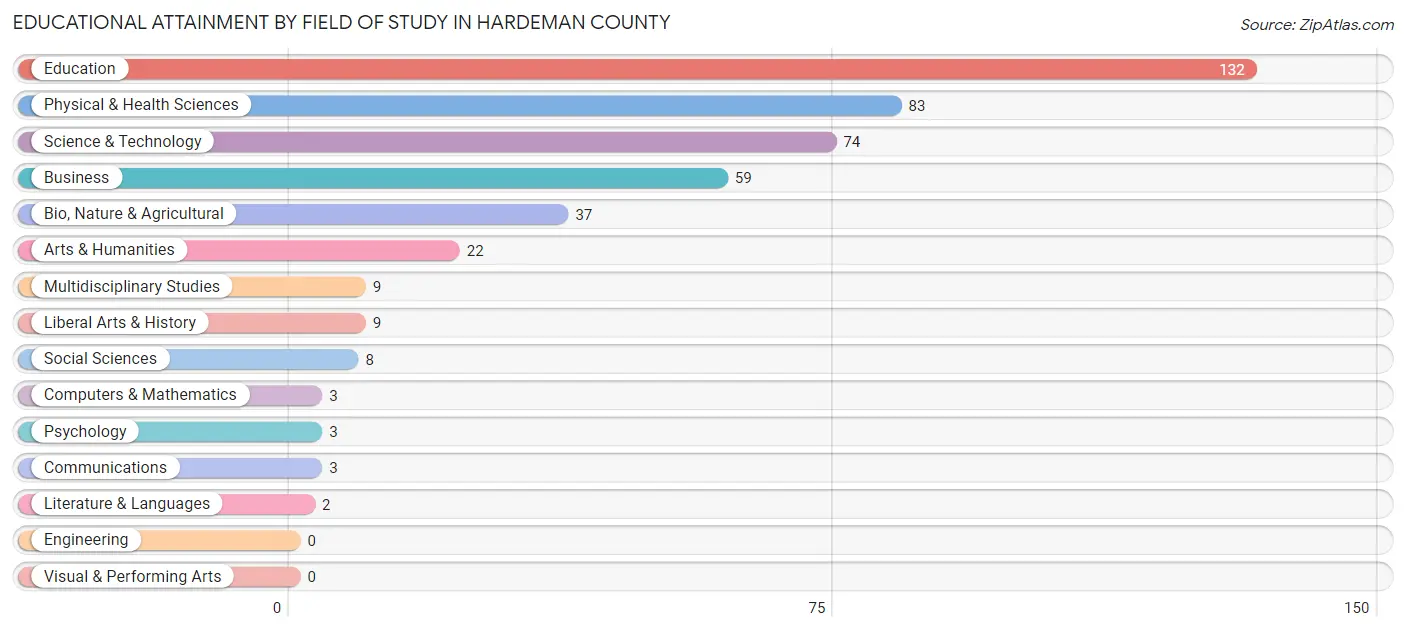
| Field of Study | # Graduates | % Graduates |
| Computers & Mathematics | 3 | 0.7% |
| Bio, Nature & Agricultural | 37 | 8.3% |
| Physical & Health Sciences | 83 | 18.7% |
| Psychology | 3 | 0.7% |
| Social Sciences | 8 | 1.8% |
| Engineering | 0 | 0.0% |
| Multidisciplinary Studies | 9 | 2.0% |
| Science & Technology | 74 | 16.7% |
| Business | 59 | 13.3% |
| Education | 132 | 29.7% |
| Literature & Languages | 2 | 0.4% |
| Liberal Arts & History | 9 | 2.0% |
| Visual & Performing Arts | 0 | 0.0% |
| Communications | 3 | 0.7% |
| Arts & Humanities | 22 | 5.0% |
| Total | 444 | 100.0% |
Transportation & Commute in Hardeman County
Vehicle Availability by Sex in Hardeman County
The most prevalent vehicle ownership categories in Hardeman County are males with 2 vehicles (323, accounting for 33.2%) and females with 2 vehicles (212, making up 39.1%).
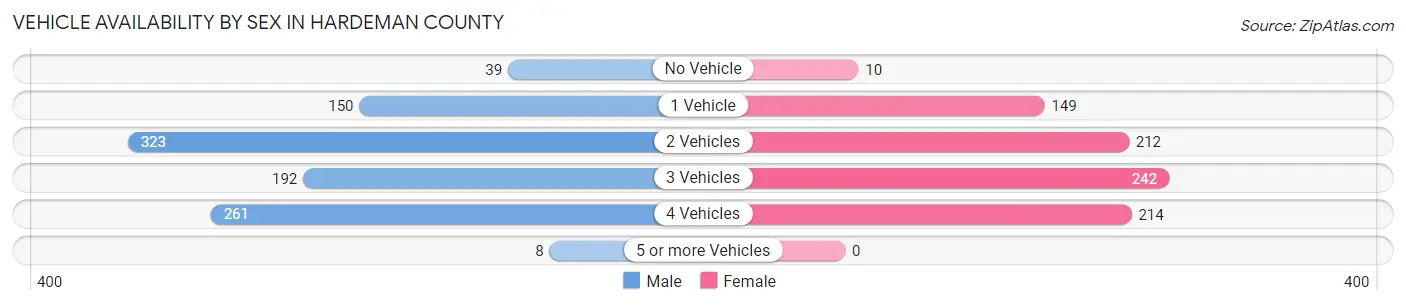
| Vehicles Available | Male | Female |
| No Vehicle | 39 (4.0%) | 10 (1.2%) |
| 1 Vehicle | 150 (15.4%) | 149 (18.0%) |
| 2 Vehicles | 323 (33.2%) | 212 (25.6%) |
| 3 Vehicles | 192 (19.7%) | 242 (29.3%) |
| 4 Vehicles | 261 (26.8%) | 214 (25.9%) |
| 5 or more Vehicles | 8 (0.8%) | 0 (0.0%) |
| Total | 973 (100.0%) | 827 (100.0%) |
Commute Time in Hardeman County
The most frequently occuring commute durations in Hardeman County are less than 5 minutes (446 commuters, 25.7%), 10 to 14 minutes (308 commuters, 17.8%), and 15 to 19 minutes (248 commuters, 14.3%).
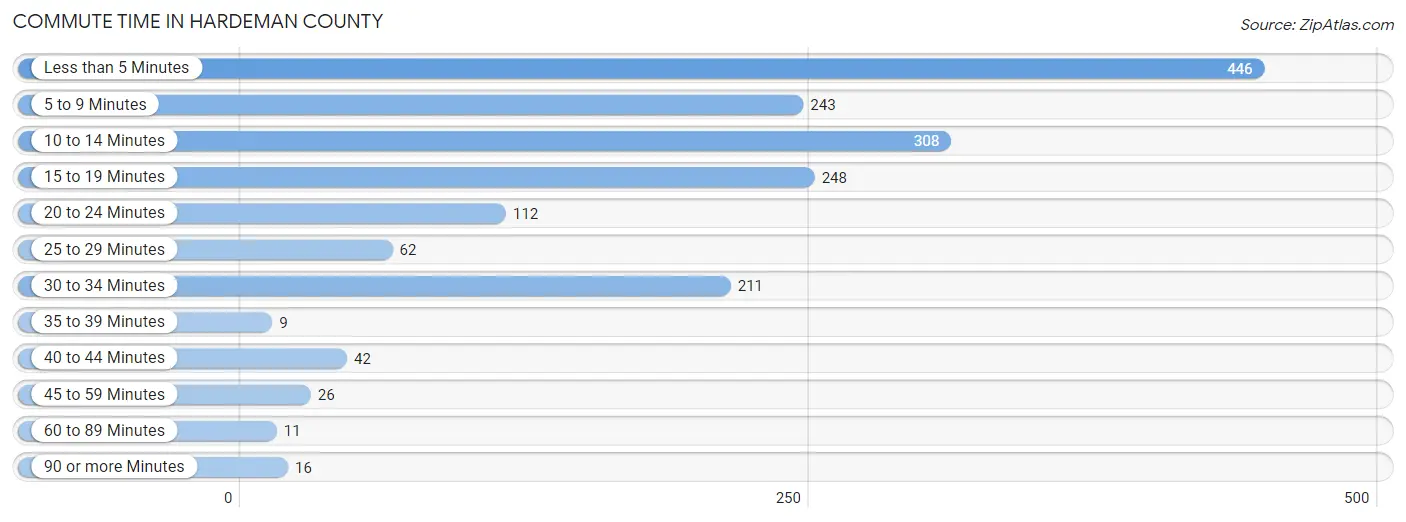
| Commute Time | # Commuters | % Commuters |
| Less than 5 Minutes | 446 | 25.7% |
| 5 to 9 Minutes | 243 | 14.0% |
| 10 to 14 Minutes | 308 | 17.8% |
| 15 to 19 Minutes | 248 | 14.3% |
| 20 to 24 Minutes | 112 | 6.5% |
| 25 to 29 Minutes | 62 | 3.6% |
| 30 to 34 Minutes | 211 | 12.2% |
| 35 to 39 Minutes | 9 | 0.5% |
| 40 to 44 Minutes | 42 | 2.4% |
| 45 to 59 Minutes | 26 | 1.5% |
| 60 to 89 Minutes | 11 | 0.6% |
| 90 or more Minutes | 16 | 0.9% |
Commute Time by Sex in Hardeman County
The most common commute times in Hardeman County are 10 to 14 minutes (218 commuters, 24.0%) for males and less than 5 minutes (233 commuters, 28.2%) for females.
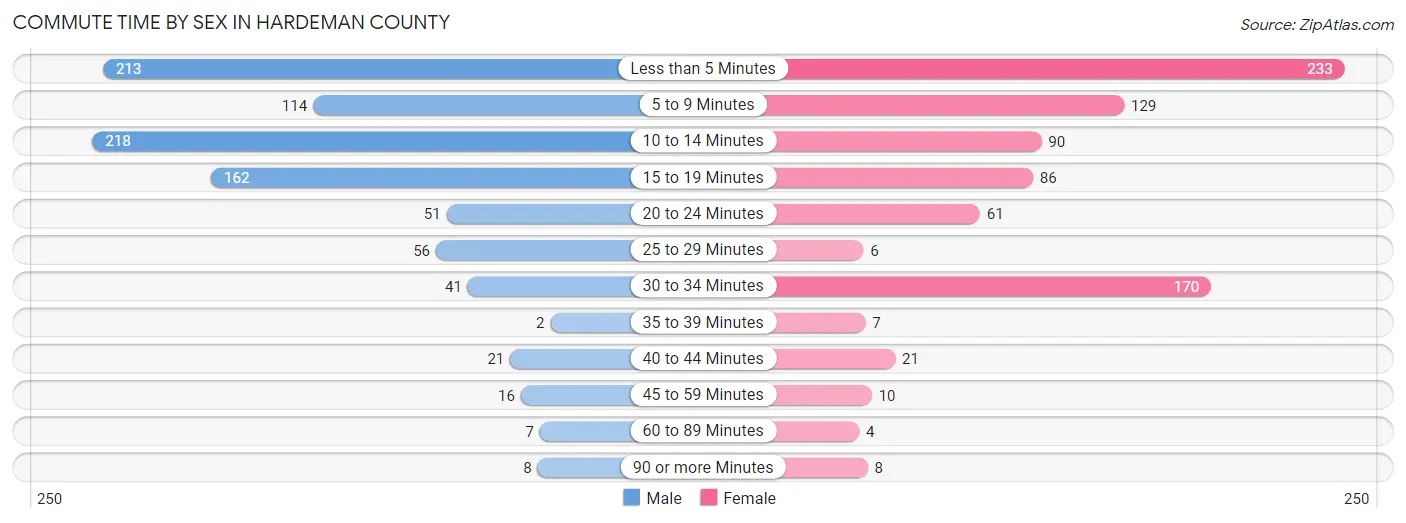
| Commute Time | Male | Female |
| Less than 5 Minutes | 213 (23.4%) | 233 (28.2%) |
| 5 to 9 Minutes | 114 (12.5%) | 129 (15.6%) |
| 10 to 14 Minutes | 218 (24.0%) | 90 (10.9%) |
| 15 to 19 Minutes | 162 (17.8%) | 86 (10.4%) |
| 20 to 24 Minutes | 51 (5.6%) | 61 (7.4%) |
| 25 to 29 Minutes | 56 (6.2%) | 6 (0.7%) |
| 30 to 34 Minutes | 41 (4.5%) | 170 (20.6%) |
| 35 to 39 Minutes | 2 (0.2%) | 7 (0.9%) |
| 40 to 44 Minutes | 21 (2.3%) | 21 (2.5%) |
| 45 to 59 Minutes | 16 (1.8%) | 10 (1.2%) |
| 60 to 89 Minutes | 7 (0.8%) | 4 (0.5%) |
| 90 or more Minutes | 8 (0.9%) | 8 (1.0%) |
Time of Departure to Work by Sex in Hardeman County
The most frequent times of departure to work in Hardeman County are 7:00 AM to 7:29 AM (194, 21.3%) for males and 7:00 AM to 7:29 AM (177, 21.4%) for females.
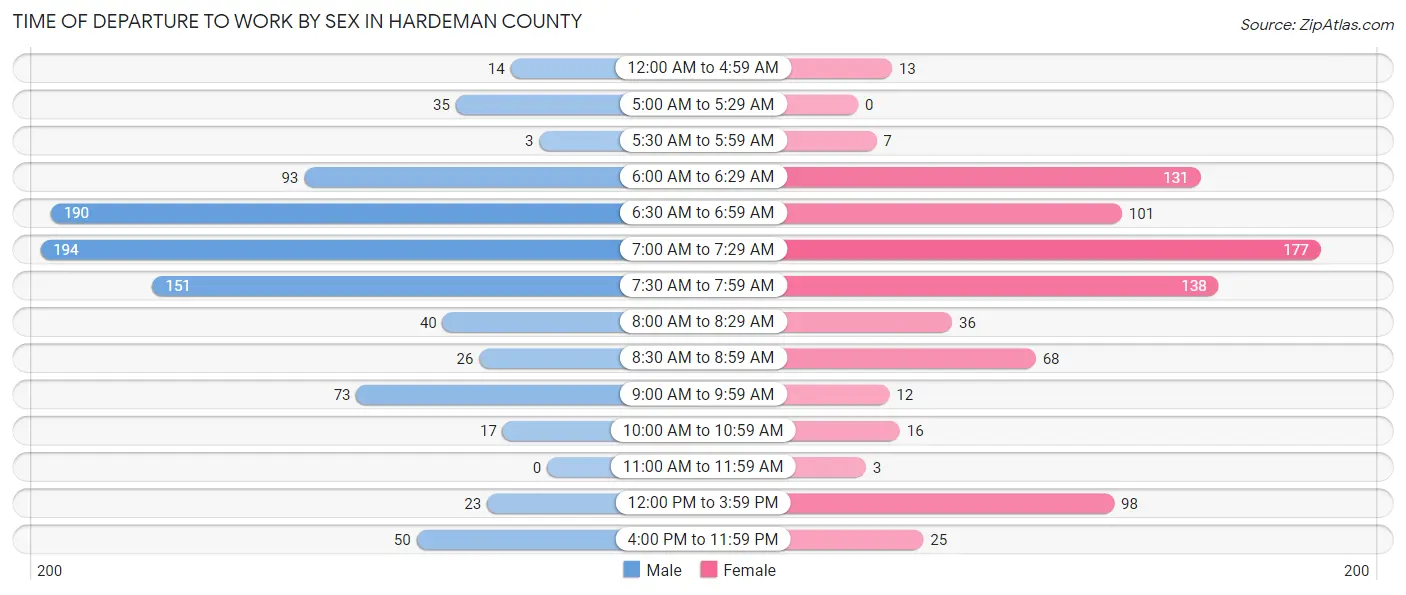
| Time of Departure | Male | Female |
| 12:00 AM to 4:59 AM | 14 (1.5%) | 13 (1.6%) |
| 5:00 AM to 5:29 AM | 35 (3.8%) | 0 (0.0%) |
| 5:30 AM to 5:59 AM | 3 (0.3%) | 7 (0.9%) |
| 6:00 AM to 6:29 AM | 93 (10.2%) | 131 (15.9%) |
| 6:30 AM to 6:59 AM | 190 (20.9%) | 101 (12.2%) |
| 7:00 AM to 7:29 AM | 194 (21.3%) | 177 (21.4%) |
| 7:30 AM to 7:59 AM | 151 (16.6%) | 138 (16.7%) |
| 8:00 AM to 8:29 AM | 40 (4.4%) | 36 (4.4%) |
| 8:30 AM to 8:59 AM | 26 (2.9%) | 68 (8.2%) |
| 9:00 AM to 9:59 AM | 73 (8.0%) | 12 (1.5%) |
| 10:00 AM to 10:59 AM | 17 (1.9%) | 16 (1.9%) |
| 11:00 AM to 11:59 AM | 0 (0.0%) | 3 (0.4%) |
| 12:00 PM to 3:59 PM | 23 (2.5%) | 98 (11.9%) |
| 4:00 PM to 11:59 PM | 50 (5.5%) | 25 (3.0%) |
| Total | 909 (100.0%) | 825 (100.0%) |
Housing Occupancy in Hardeman County
Occupancy by Ownership in Hardeman County
Of the total 1,304 dwellings in Hardeman County, owner-occupied units account for 883 (67.7%), while renter-occupied units make up 421 (32.3%).
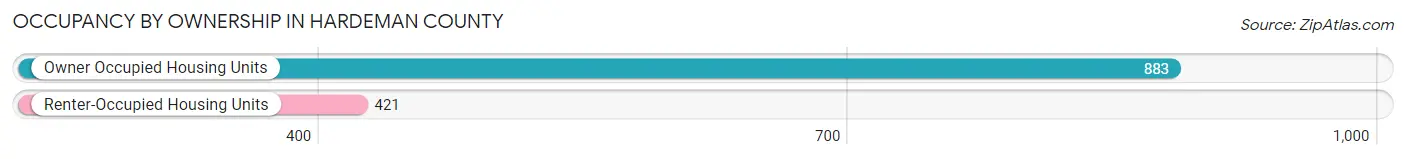
| Occupancy | # Housing Units | % Housing Units |
| Owner Occupied Housing Units | 883 | 67.7% |
| Renter-Occupied Housing Units | 421 | 32.3% |
| Total Occupied Housing Units | 1,304 | 100.0% |
Occupancy by Household Size in Hardeman County
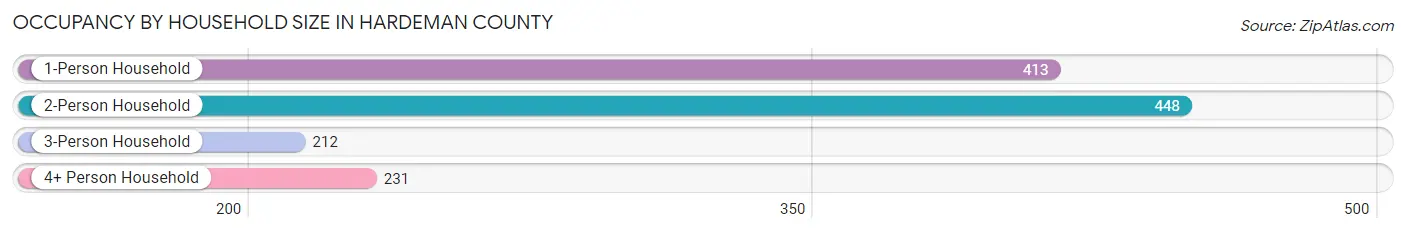
| Household Size | # Housing Units | % Housing Units |
| 1-Person Household | 413 | 31.7% |
| 2-Person Household | 448 | 34.4% |
| 3-Person Household | 212 | 16.3% |
| 4+ Person Household | 231 | 17.7% |
| Total Housing Units | 1,304 | 100.0% |
Occupancy by Ownership by Household Size in Hardeman County
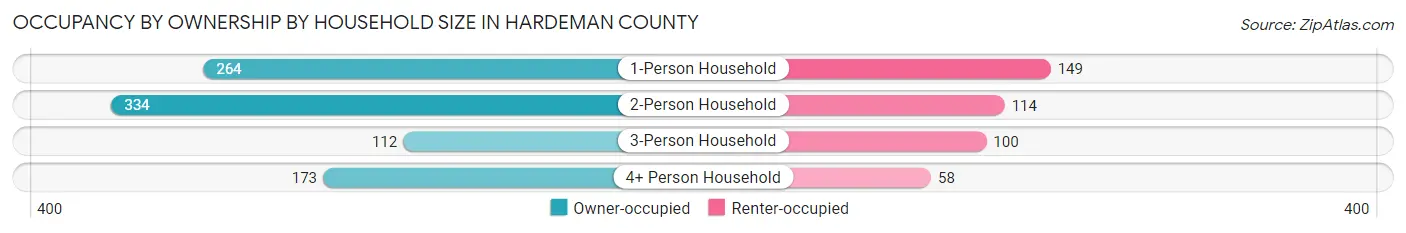
| Household Size | Owner-occupied | Renter-occupied |
| 1-Person Household | 264 (63.9%) | 149 (36.1%) |
| 2-Person Household | 334 (74.6%) | 114 (25.5%) |
| 3-Person Household | 112 (52.8%) | 100 (47.2%) |
| 4+ Person Household | 173 (74.9%) | 58 (25.1%) |
| Total Housing Units | 883 (67.7%) | 421 (32.3%) |
Occupancy by Educational Attainment in Hardeman County
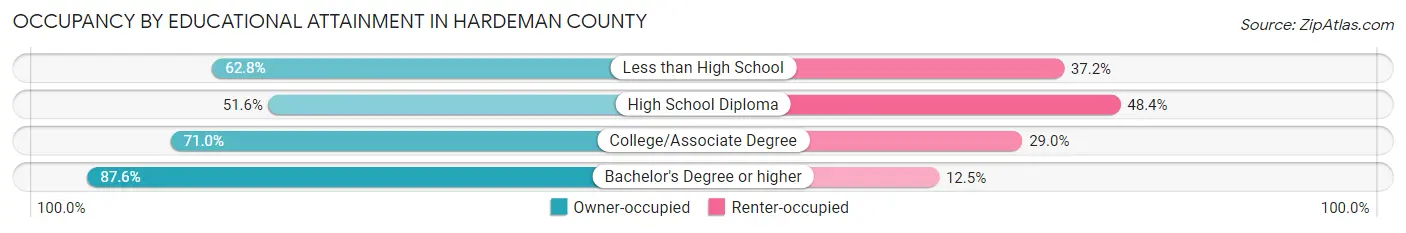
| Household Size | Owner-occupied | Renter-occupied |
| Less than High School | 113 (62.8%) | 67 (37.2%) |
| High School Diploma | 195 (51.6%) | 183 (48.4%) |
| College/Associate Degree | 336 (71.0%) | 137 (29.0%) |
| Bachelor's Degree or higher | 239 (87.5%) | 34 (12.4%) |
Occupancy by Age of Householder in Hardeman County
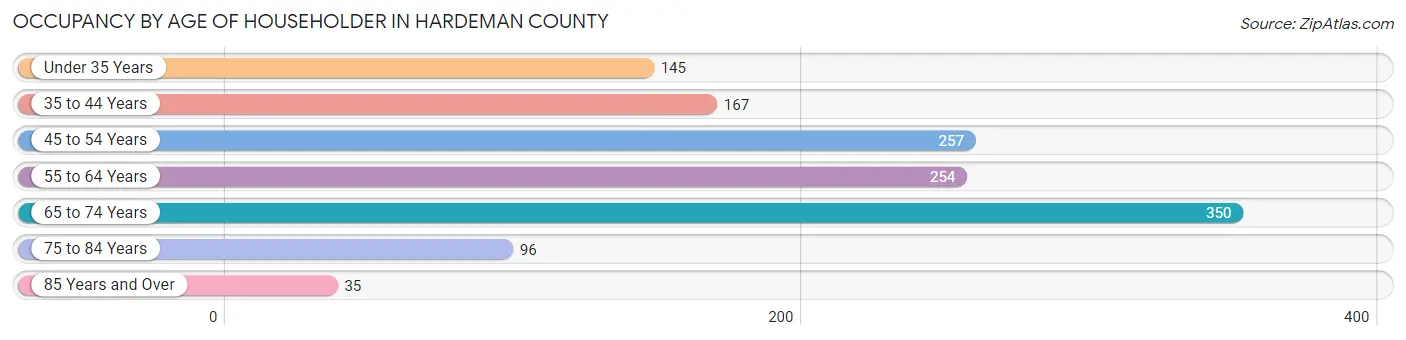
| Age Bracket | # Households | % Households |
| Under 35 Years | 145 | 11.1% |
| 35 to 44 Years | 167 | 12.8% |
| 45 to 54 Years | 257 | 19.7% |
| 55 to 64 Years | 254 | 19.5% |
| 65 to 74 Years | 350 | 26.8% |
| 75 to 84 Years | 96 | 7.4% |
| 85 Years and Over | 35 | 2.7% |
| Total | 1,304 | 100.0% |
Housing Finances in Hardeman County
Median Income by Occupancy in Hardeman County
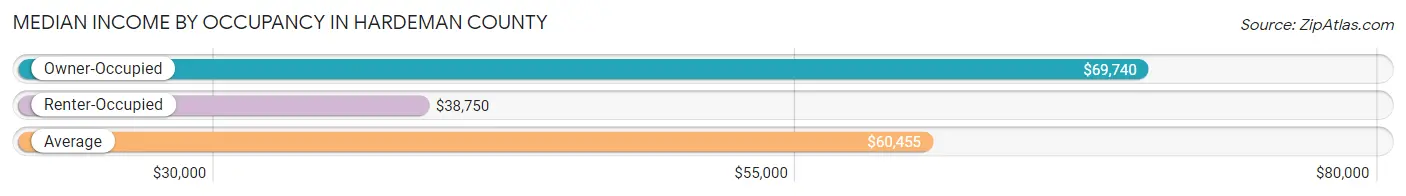
| Occupancy Type | # Households | Median Income |
| Owner-Occupied | 883 (67.7%) | $69,740 |
| Renter-Occupied | 421 (32.3%) | $38,750 |
| Average | 1,304 (100.0%) | $60,455 |
Occupancy by Householder Income Bracket in Hardeman County
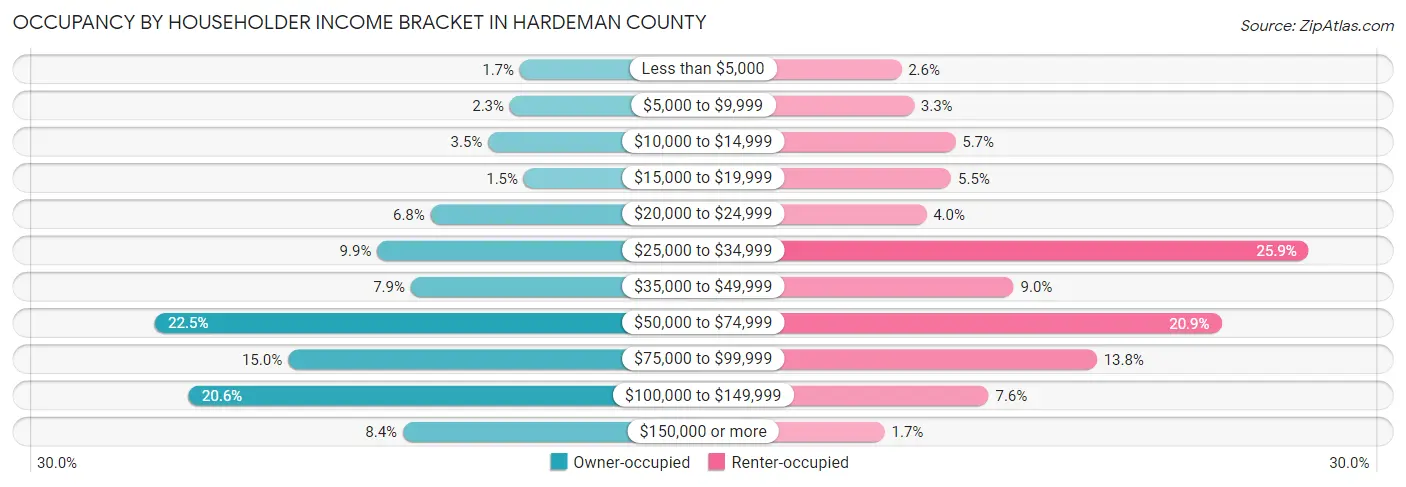
| Income Bracket | Owner-occupied | Renter-occupied |
| Less than $5,000 | 15 (1.7%) | 11 (2.6%) |
| $5,000 to $9,999 | 20 (2.3%) | 14 (3.3%) |
| $10,000 to $14,999 | 31 (3.5%) | 24 (5.7%) |
| $15,000 to $19,999 | 13 (1.5%) | 23 (5.5%) |
| $20,000 to $24,999 | 60 (6.8%) | 17 (4.0%) |
| $25,000 to $34,999 | 87 (9.9%) | 109 (25.9%) |
| $35,000 to $49,999 | 70 (7.9%) | 38 (9.0%) |
| $50,000 to $74,999 | 199 (22.5%) | 88 (20.9%) |
| $75,000 to $99,999 | 132 (14.9%) | 58 (13.8%) |
| $100,000 to $149,999 | 182 (20.6%) | 32 (7.6%) |
| $150,000 or more | 74 (8.4%) | 7 (1.7%) |
| Total | 883 (100.0%) | 421 (100.0%) |
Monthly Housing Cost Tiers in Hardeman County
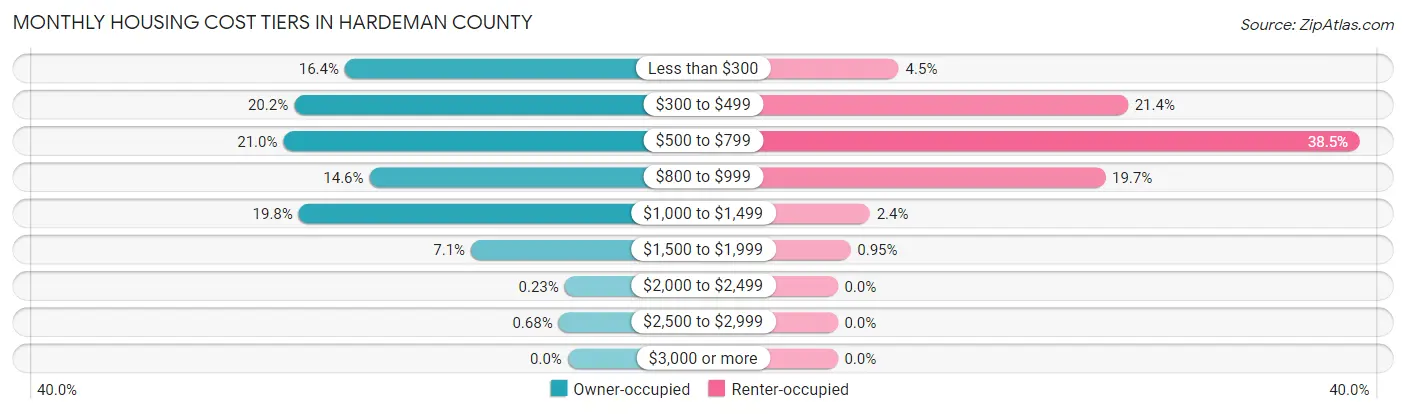
| Monthly Cost | Owner-occupied | Renter-occupied |
| Less than $300 | 145 (16.4%) | 19 (4.5%) |
| $300 to $499 | 178 (20.2%) | 90 (21.4%) |
| $500 to $799 | 185 (20.9%) | 162 (38.5%) |
| $800 to $999 | 129 (14.6%) | 83 (19.7%) |
| $1,000 to $1,499 | 175 (19.8%) | 10 (2.4%) |
| $1,500 to $1,999 | 63 (7.1%) | 4 (0.9%) |
| $2,000 to $2,499 | 2 (0.2%) | 0 (0.0%) |
| $2,500 to $2,999 | 6 (0.7%) | 0 (0.0%) |
| $3,000 or more | 0 (0.0%) | 0 (0.0%) |
| Total | 883 (100.0%) | 421 (100.0%) |
Physical Housing Characteristics in Hardeman County
Housing Structures in Hardeman County
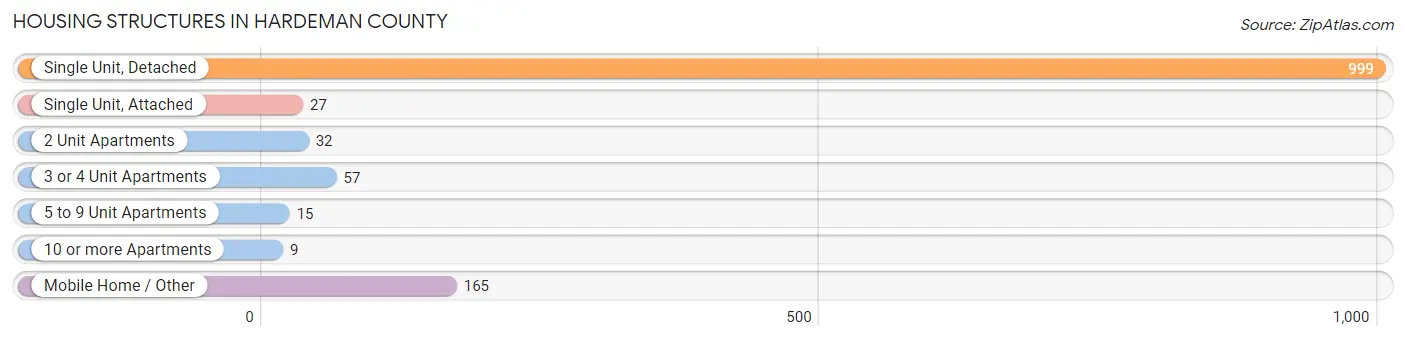
| Structure Type | # Housing Units | % Housing Units |
| Single Unit, Detached | 999 | 76.6% |
| Single Unit, Attached | 27 | 2.1% |
| 2 Unit Apartments | 32 | 2.5% |
| 3 or 4 Unit Apartments | 57 | 4.4% |
| 5 to 9 Unit Apartments | 15 | 1.1% |
| 10 or more Apartments | 9 | 0.7% |
| Mobile Home / Other | 165 | 12.7% |
| Total | 1,304 | 100.0% |
Housing Structures by Occupancy in Hardeman County
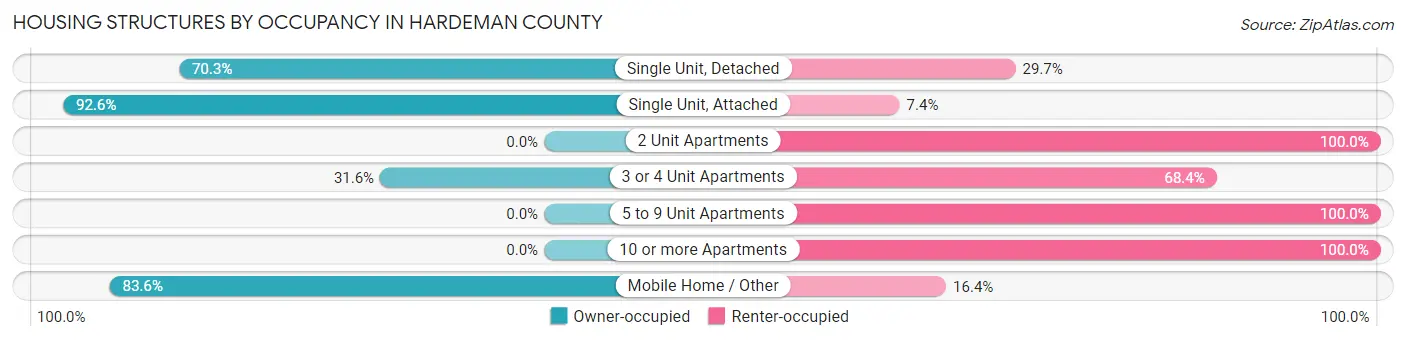
| Structure Type | Owner-occupied | Renter-occupied |
| Single Unit, Detached | 702 (70.3%) | 297 (29.7%) |
| Single Unit, Attached | 25 (92.6%) | 2 (7.4%) |
| 2 Unit Apartments | 0 (0.0%) | 32 (100.0%) |
| 3 or 4 Unit Apartments | 18 (31.6%) | 39 (68.4%) |
| 5 to 9 Unit Apartments | 0 (0.0%) | 15 (100.0%) |
| 10 or more Apartments | 0 (0.0%) | 9 (100.0%) |
| Mobile Home / Other | 138 (83.6%) | 27 (16.4%) |
| Total | 883 (67.7%) | 421 (32.3%) |
Housing Structures by Number of Rooms in Hardeman County
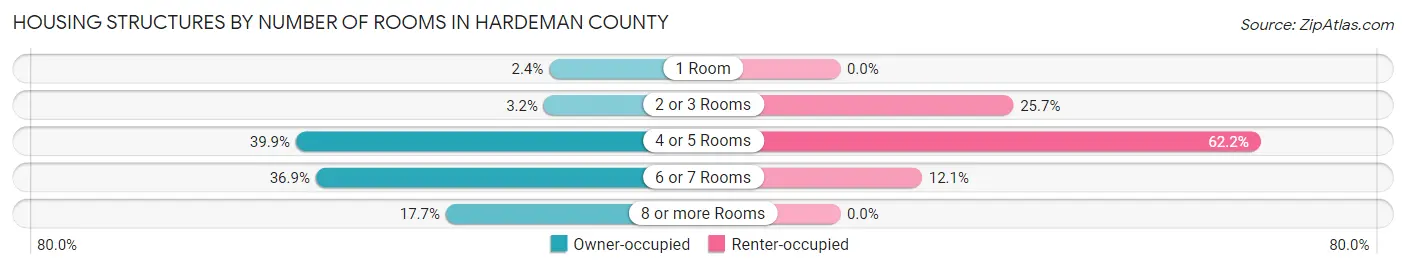
| Number of Rooms | Owner-occupied | Renter-occupied |
| 1 Room | 21 (2.4%) | 0 (0.0%) |
| 2 or 3 Rooms | 28 (3.2%) | 108 (25.7%) |
| 4 or 5 Rooms | 352 (39.9%) | 262 (62.2%) |
| 6 or 7 Rooms | 326 (36.9%) | 51 (12.1%) |
| 8 or more Rooms | 156 (17.7%) | 0 (0.0%) |
| Total | 883 (100.0%) | 421 (100.0%) |
Housing Structure by Heating Type in Hardeman County
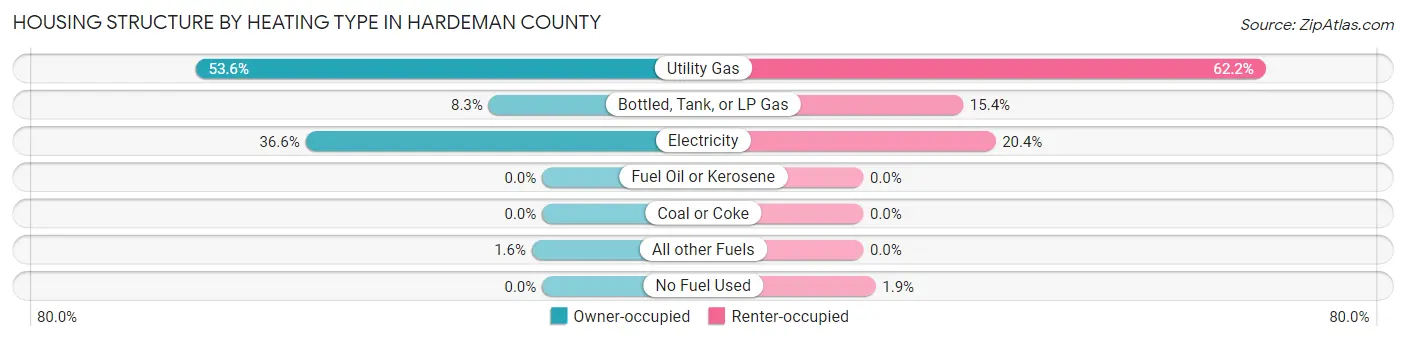
| Heating Type | Owner-occupied | Renter-occupied |
| Utility Gas | 473 (53.6%) | 262 (62.2%) |
| Bottled, Tank, or LP Gas | 73 (8.3%) | 65 (15.4%) |
| Electricity | 323 (36.6%) | 86 (20.4%) |
| Fuel Oil or Kerosene | 0 (0.0%) | 0 (0.0%) |
| Coal or Coke | 0 (0.0%) | 0 (0.0%) |
| All other Fuels | 14 (1.6%) | 0 (0.0%) |
| No Fuel Used | 0 (0.0%) | 8 (1.9%) |
| Total | 883 (100.0%) | 421 (100.0%) |
Household Vehicle Usage in Hardeman County
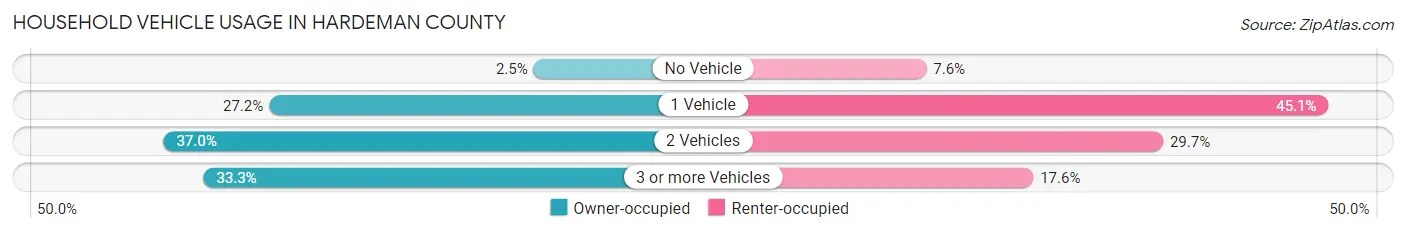
| Vehicles per Household | Owner-occupied | Renter-occupied |
| No Vehicle | 22 (2.5%) | 32 (7.6%) |
| 1 Vehicle | 240 (27.2%) | 190 (45.1%) |
| 2 Vehicles | 327 (37.0%) | 125 (29.7%) |
| 3 or more Vehicles | 294 (33.3%) | 74 (17.6%) |
| Total | 883 (100.0%) | 421 (100.0%) |
Real Estate & Mortgages in Hardeman County
Real Estate and Mortgage Overview in Hardeman County
| Characteristic | Without Mortgage | With Mortgage |
| Housing Units | 614 | 269 |
| Median Property Value | $62,800 | $69,200 |
| Median Household Income | $55,625 | $43 |
| Monthly Housing Costs | $488 | $0 |
| Real Estate Taxes | $751 | $7 |
Property Value by Mortgage Status in Hardeman County
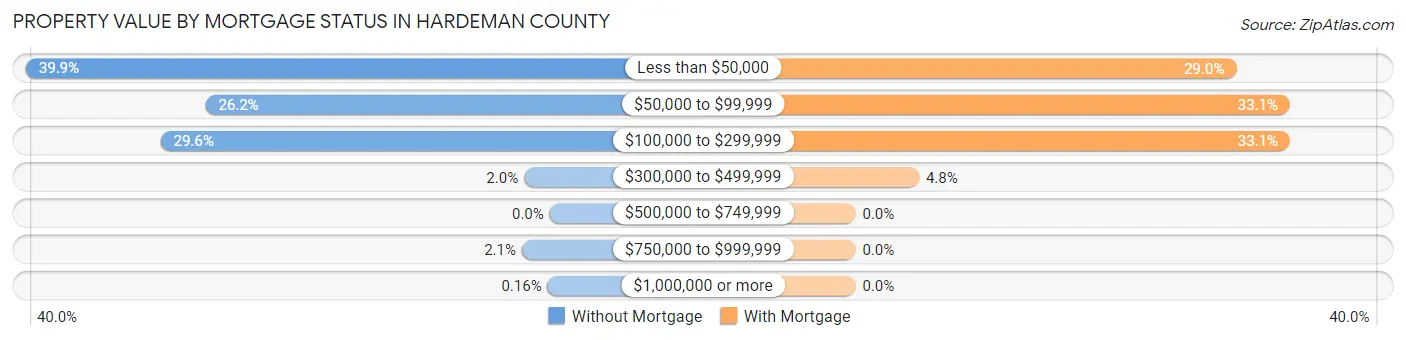
| Property Value | Without Mortgage | With Mortgage |
| Less than $50,000 | 245 (39.9%) | 78 (29.0%) |
| $50,000 to $99,999 | 161 (26.2%) | 89 (33.1%) |
| $100,000 to $299,999 | 182 (29.6%) | 89 (33.1%) |
| $300,000 to $499,999 | 12 (1.9%) | 13 (4.8%) |
| $500,000 to $749,999 | 0 (0.0%) | 0 (0.0%) |
| $750,000 to $999,999 | 13 (2.1%) | 0 (0.0%) |
| $1,000,000 or more | 1 (0.2%) | 0 (0.0%) |
| Total | 614 (100.0%) | 269 (100.0%) |
Household Income by Mortgage Status in Hardeman County
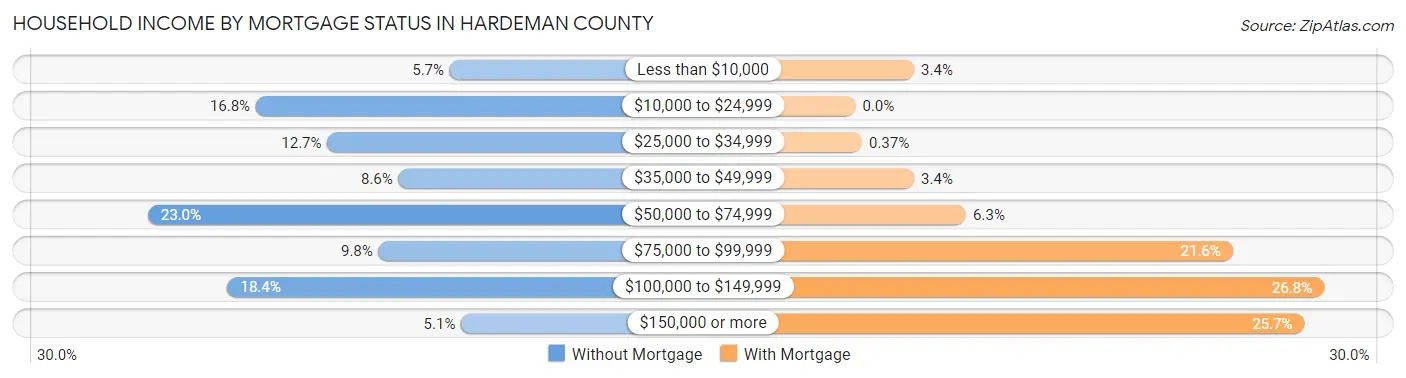
| Household Income | Without Mortgage | With Mortgage |
| Less than $10,000 | 35 (5.7%) | 9 (3.4%) |
| $10,000 to $24,999 | 103 (16.8%) | 0 (0.0%) |
| $25,000 to $34,999 | 78 (12.7%) | 1 (0.4%) |
| $35,000 to $49,999 | 53 (8.6%) | 9 (3.4%) |
| $50,000 to $74,999 | 141 (23.0%) | 17 (6.3%) |
| $75,000 to $99,999 | 60 (9.8%) | 58 (21.6%) |
| $100,000 to $149,999 | 113 (18.4%) | 72 (26.8%) |
| $150,000 or more | 31 (5.1%) | 69 (25.7%) |
| Total | 614 (100.0%) | 269 (100.0%) |
Property Value to Household Income Ratio in Hardeman County
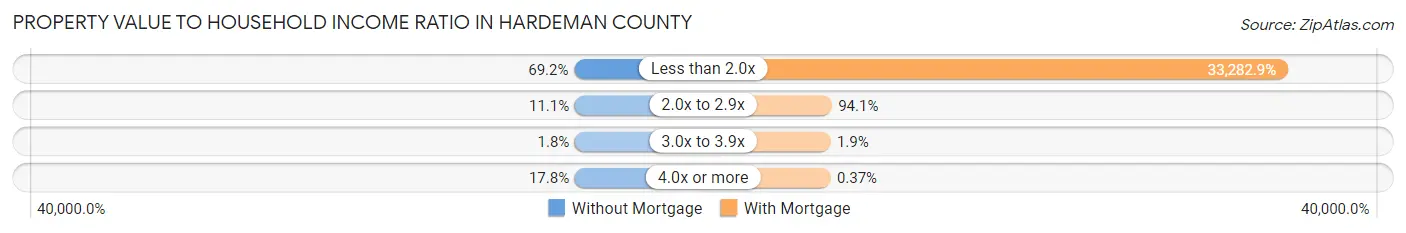
| Value-to-Income Ratio | Without Mortgage | With Mortgage |
| Less than 2.0x | 425 (69.2%) | 89,531 (33,282.9%) |
| 2.0x to 2.9x | 68 (11.1%) | 253 (94.1%) |
| 3.0x to 3.9x | 11 (1.8%) | 5 (1.9%) |
| 4.0x or more | 109 (17.7%) | 1 (0.4%) |
| Total | 614 (100.0%) | 269 (100.0%) |
Real Estate Taxes by Mortgage Status in Hardeman County
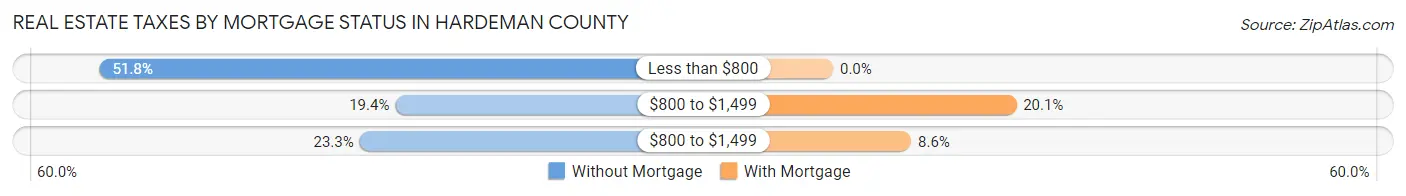
| Property Taxes | Without Mortgage | With Mortgage |
| Less than $800 | 318 (51.8%) | 0 (0.0%) |
| $800 to $1,499 | 119 (19.4%) | 54 (20.1%) |
| $800 to $1,499 | 143 (23.3%) | 23 (8.6%) |
| Total | 614 (100.0%) | 269 (100.0%) |
Health & Disability in Hardeman County
Health Insurance Coverage by Age in Hardeman County
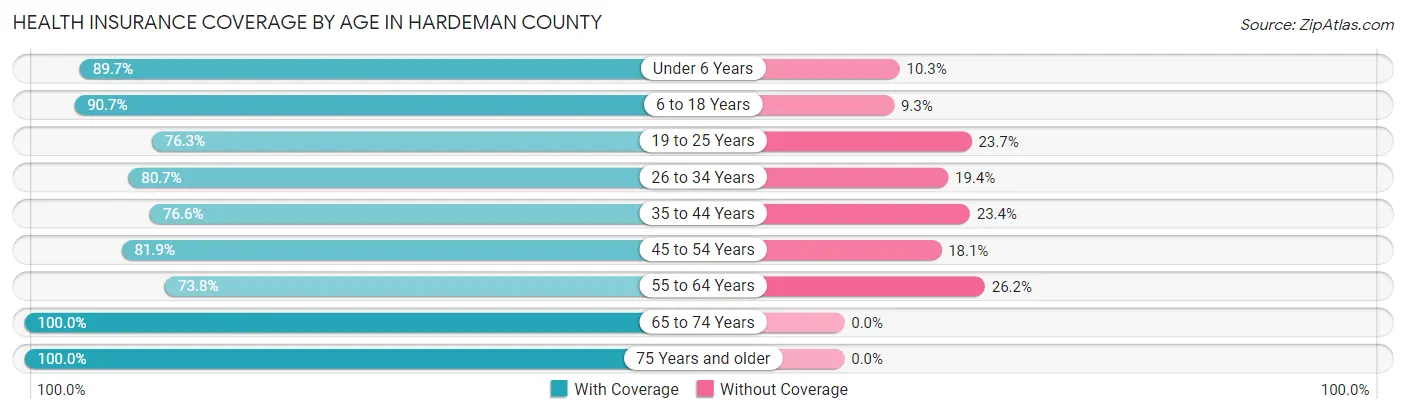
| Age Bracket | With Coverage | Without Coverage |
| Under 6 Years | 174 (89.7%) | 20 (10.3%) |
| 6 to 18 Years | 549 (90.7%) | 56 (9.3%) |
| 19 to 25 Years | 209 (76.3%) | 65 (23.7%) |
| 26 to 34 Years | 250 (80.6%) | 60 (19.4%) |
| 35 to 44 Years | 370 (76.6%) | 113 (23.4%) |
| 45 to 54 Years | 390 (81.9%) | 86 (18.1%) |
| 55 to 64 Years | 355 (73.8%) | 126 (26.2%) |
| 65 to 74 Years | 496 (100.0%) | 0 (0.0%) |
| 75 Years and older | 213 (100.0%) | 0 (0.0%) |
| Total | 3,006 (85.1%) | 526 (14.9%) |
Health Insurance Coverage by Citizenship Status in Hardeman County
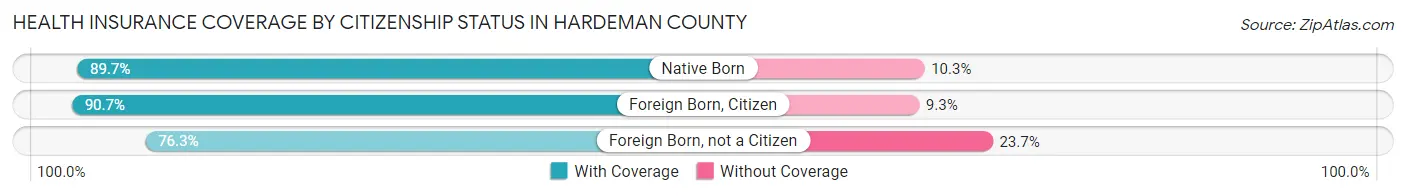
| Citizenship Status | With Coverage | Without Coverage |
| Native Born | 174 (89.7%) | 20 (10.3%) |
| Foreign Born, Citizen | 549 (90.7%) | 56 (9.3%) |
| Foreign Born, not a Citizen | 209 (76.3%) | 65 (23.7%) |
Health Insurance Coverage by Household Income in Hardeman County
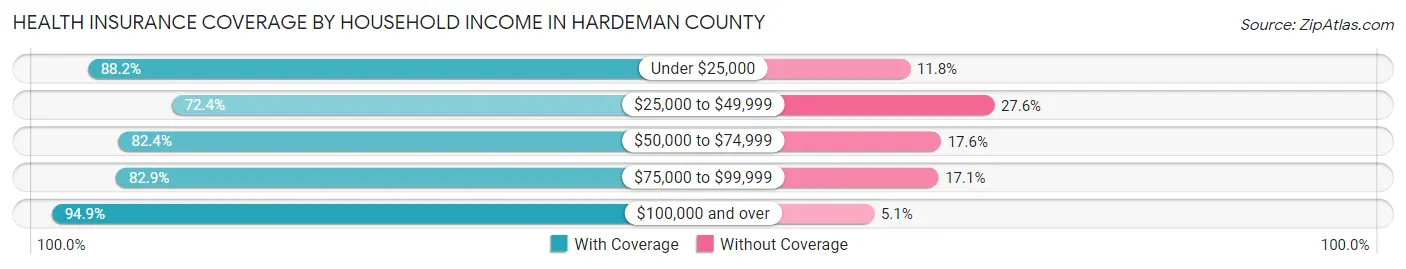
| Household Income | With Coverage | Without Coverage |
| Under $25,000 | 380 (88.2%) | 51 (11.8%) |
| $25,000 to $49,999 | 436 (72.4%) | 166 (27.6%) |
| $50,000 to $74,999 | 646 (82.4%) | 138 (17.6%) |
| $75,000 to $99,999 | 571 (82.9%) | 118 (17.1%) |
| $100,000 and over | 951 (94.9%) | 51 (5.1%) |
Public vs Private Health Insurance Coverage by Age in Hardeman County
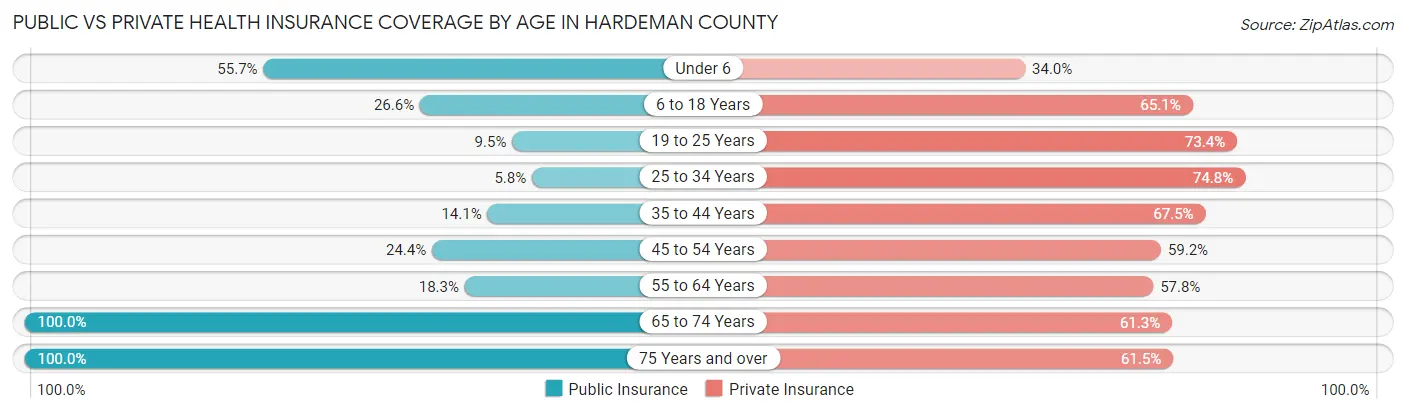
| Age Bracket | Public Insurance | Private Insurance |
| Under 6 | 108 (55.7%) | 66 (34.0%) |
| 6 to 18 Years | 161 (26.6%) | 394 (65.1%) |
| 19 to 25 Years | 26 (9.5%) | 201 (73.4%) |
| 25 to 34 Years | 18 (5.8%) | 232 (74.8%) |
| 35 to 44 Years | 68 (14.1%) | 326 (67.5%) |
| 45 to 54 Years | 116 (24.4%) | 282 (59.2%) |
| 55 to 64 Years | 88 (18.3%) | 278 (57.8%) |
| 65 to 74 Years | 496 (100.0%) | 304 (61.3%) |
| 75 Years and over | 213 (100.0%) | 131 (61.5%) |
| Total | 1,294 (36.6%) | 2,214 (62.7%) |
Disability Status by Sex by Age in Hardeman County
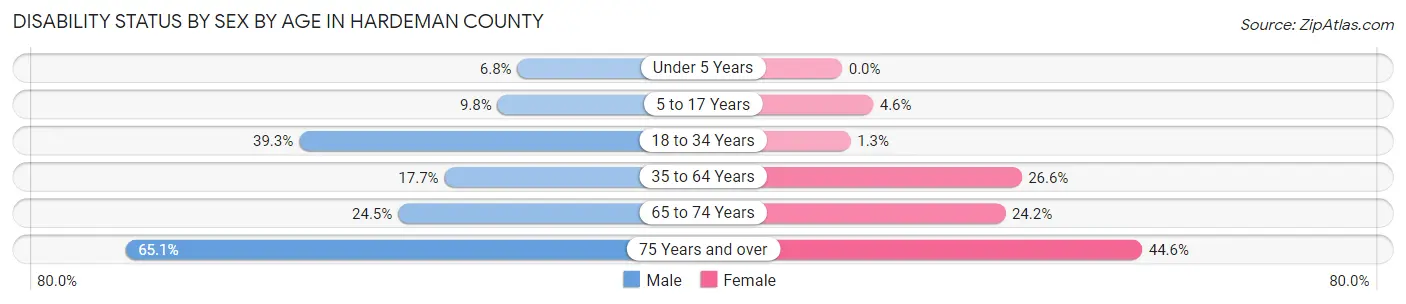
| Age Bracket | Male | Female |
| Under 5 Years | 6 (6.8%) | 0 (0.0%) |
| 5 to 17 Years | 21 (9.8%) | 16 (4.6%) |
| 18 to 34 Years | 157 (39.3%) | 3 (1.3%) |
| 35 to 64 Years | 133 (17.7%) | 183 (26.6%) |
| 65 to 74 Years | 66 (24.5%) | 55 (24.2%) |
| 75 Years and over | 67 (65.0%) | 49 (44.6%) |
Disability Class by Sex by Age in Hardeman County
Disability Class: Hearing Difficulty
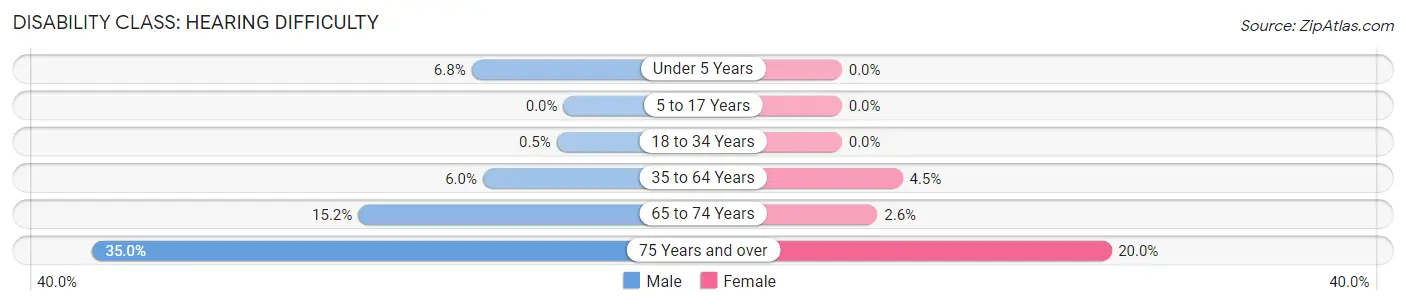
| Age Bracket | Male | Female |
| Under 5 Years | 6 (6.8%) | 0 (0.0%) |
| 5 to 17 Years | 0 (0.0%) | 0 (0.0%) |
| 18 to 34 Years | 2 (0.5%) | 0 (0.0%) |
| 35 to 64 Years | 45 (6.0%) | 31 (4.5%) |
| 65 to 74 Years | 41 (15.2%) | 6 (2.6%) |
| 75 Years and over | 36 (34.9%) | 22 (20.0%) |
Disability Class: Vision Difficulty
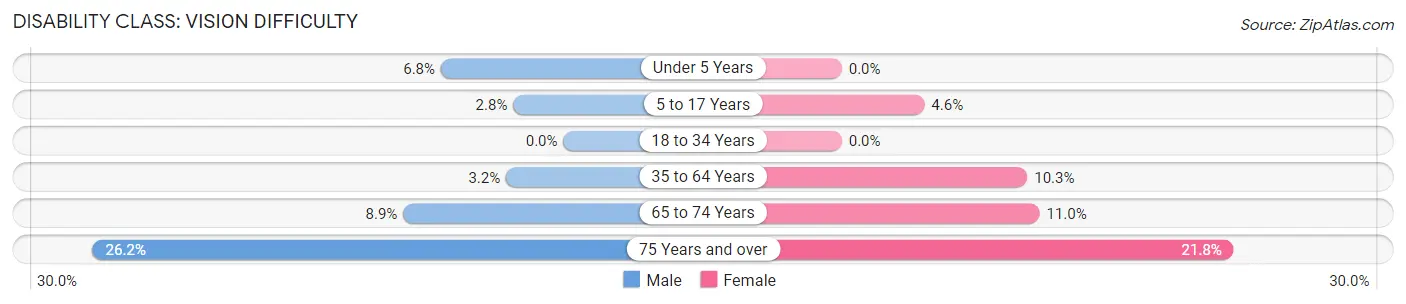
| Age Bracket | Male | Female |
| Under 5 Years | 6 (6.8%) | 0 (0.0%) |
| 5 to 17 Years | 6 (2.8%) | 16 (4.6%) |
| 18 to 34 Years | 0 (0.0%) | 0 (0.0%) |
| 35 to 64 Years | 24 (3.2%) | 71 (10.3%) |
| 65 to 74 Years | 24 (8.9%) | 25 (11.0%) |
| 75 Years and over | 27 (26.2%) | 24 (21.8%) |
Disability Class: Cognitive Difficulty
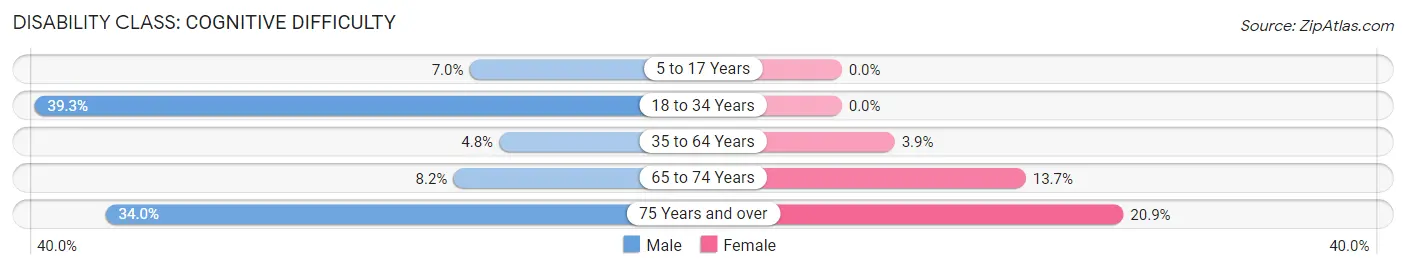
| Age Bracket | Male | Female |
| 5 to 17 Years | 15 (7.0%) | 0 (0.0%) |
| 18 to 34 Years | 157 (39.3%) | 0 (0.0%) |
| 35 to 64 Years | 36 (4.8%) | 27 (3.9%) |
| 65 to 74 Years | 22 (8.2%) | 31 (13.7%) |
| 75 Years and over | 35 (34.0%) | 23 (20.9%) |
Disability Class: Ambulatory Difficulty
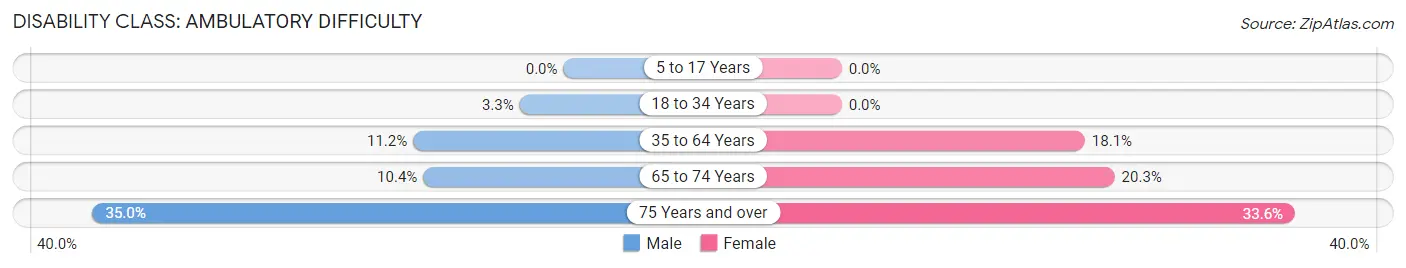
| Age Bracket | Male | Female |
| 5 to 17 Years | 0 (0.0%) | 0 (0.0%) |
| 18 to 34 Years | 13 (3.3%) | 0 (0.0%) |
| 35 to 64 Years | 84 (11.2%) | 124 (18.0%) |
| 65 to 74 Years | 28 (10.4%) | 46 (20.3%) |
| 75 Years and over | 36 (34.9%) | 37 (33.6%) |
Disability Class: Self-Care Difficulty
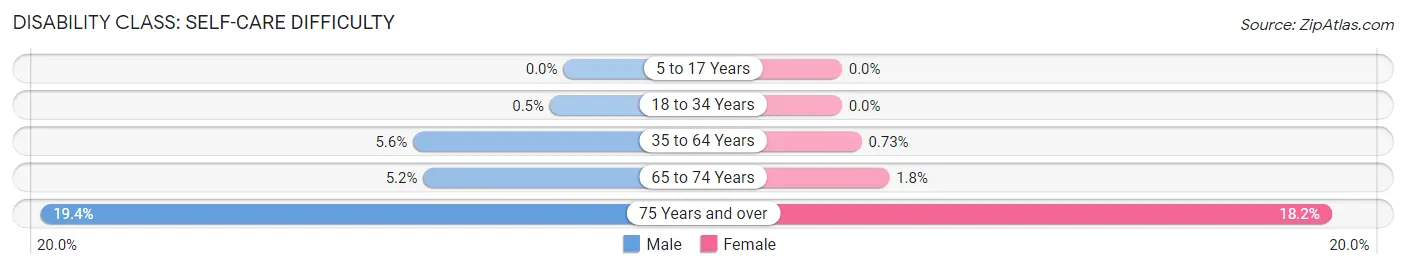
| Age Bracket | Male | Female |
| 5 to 17 Years | 0 (0.0%) | 0 (0.0%) |
| 18 to 34 Years | 2 (0.5%) | 0 (0.0%) |
| 35 to 64 Years | 42 (5.6%) | 5 (0.7%) |
| 65 to 74 Years | 14 (5.2%) | 4 (1.8%) |
| 75 Years and over | 20 (19.4%) | 20 (18.2%) |
Technology Access in Hardeman County
Computing Device Access in Hardeman County
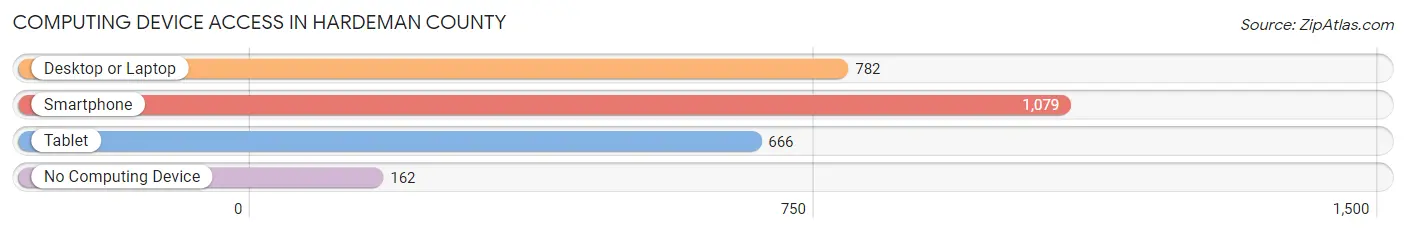
| Device Type | # Households | % Households |
| Desktop or Laptop | 782 | 60.0% |
| Smartphone | 1,079 | 82.8% |
| Tablet | 666 | 51.1% |
| No Computing Device | 162 | 12.4% |
| Total | 1,304 | 100.0% |
Internet Access in Hardeman County
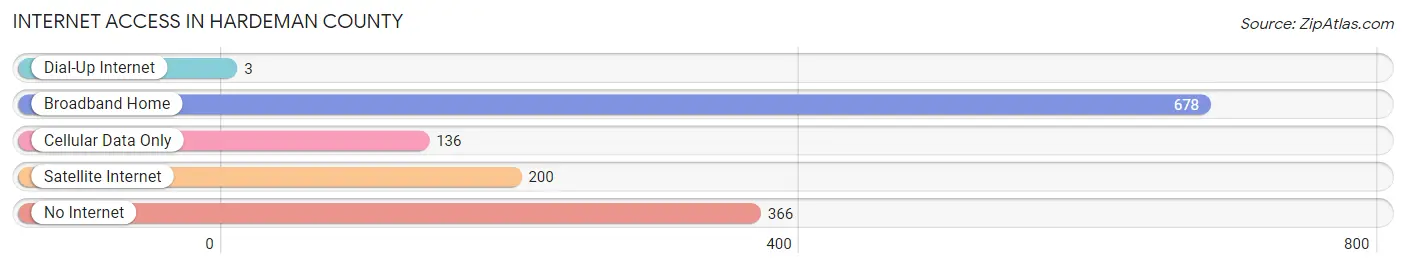
| Internet Type | # Households | % Households |
| Dial-Up Internet | 3 | 0.2% |
| Broadband Home | 678 | 52.0% |
| Cellular Data Only | 136 | 10.4% |
| Satellite Internet | 200 | 15.3% |
| No Internet | 366 | 28.1% |
| Total | 1,304 | 100.0% |
Hardeman County Summary
Hardeman County is located in the north-central region of Texas, and is part of the Wichita Falls Metropolitan Statistical Area. The county is bordered by Foard County to the north, Wilbarger County to the east, Wichita County to the south, and Childress County to the west. The county seat is Quanah, and the largest city is Quanah.
Geography
Hardeman County covers an area of 902 square miles, and is located in the Rolling Plains region of Texas. The terrain is mostly flat, with some rolling hills in the western part of the county. The county is drained by the Red River, which forms its western boundary. The county is also home to several small lakes, including Lake Kemp, Lake Diversion, and Lake Hardeman.
The climate of Hardeman County is semi-arid, with hot summers and mild winters. The average annual temperature is 64°F, and the average annual precipitation is 22 inches.
History
Hardeman County was established in 1858, and was named for brothers Bailey and Thomas Hardeman, who were early settlers in the area. The county was originally part of Fannin County, and was later part of Cooke County before becoming its own county.
The first settlers in the area were Native Americans, including the Comanche, Kiowa, and Apache tribes. The first European settlers arrived in the area in the late 1840s, and the county was officially organized in 1858.
The county was largely agricultural in its early years, with cotton and corn being the main crops. The county also had a thriving cattle industry, and Quanah became a major shipping point for cattle.
In the early 1900s, oil was discovered in the county, and the oil industry became a major part of the local economy. The county also became a major producer of cotton, and the town of Quanah became a major cotton-shipping center.
Economy
The economy of Hardeman County is largely based on agriculture and oil production. The county is a major producer of cotton, corn, wheat, and sorghum. The county is also home to several oil and gas fields, and is a major producer of oil and natural gas.
The county also has a thriving tourism industry, with several attractions, including the Hardeman County Museum, the Quanah Parker Trail, and the Quanah Parker Memorial.
Demographics
As of the 2010 census, Hardeman County had a population of 5,145. The racial makeup of the county was 79.3% White, 0.7% African American, 0.7% Native American, 0.2% Asian, 0.1% Pacific Islander, 17.2% from other races, and 1.9% from two or more races. Hispanic or Latino of any race were 33.2% of the population.
The median household income in Hardeman County was $37,917, and the median family income was $45,938. The per capita income was $17,945. About 17.2% of families and 22.2% of the population were below the poverty line, including 28.3% of those under age 18 and 16.2% of those age 65 or over.
Common Questions
What is Per Capita Income in Hardeman County?
Per Capita income in Hardeman County is $29,783.
What is the Median Family Income in Hardeman County?
Median Family Income in Hardeman County is $71,369.
What is the Median Household income in Hardeman County?
Median Household Income in Hardeman County is $60,455.
What is Income or Wage Gap in Hardeman County?
Income or Wage Gap in Hardeman County is 21.7%.
Women in Hardeman County earn 78.3 cents for every dollar earned by a man.
What is Inequality or Gini Index in Hardeman County?
Inequality or Gini Index in Hardeman County is 0.41.
What is the Total Population of Hardeman County?
Total Population of Hardeman County is 3,541.
What is the Total Male Population of Hardeman County?
Total Male Population of Hardeman County is 1,837.
What is the Total Female Population of Hardeman County?
Total Female Population of Hardeman County is 1,704.
What is the Ratio of Males per 100 Females in Hardeman County?
There are 107.81 Males per 100 Females in Hardeman County.
What is the Ratio of Females per 100 Males in Hardeman County?
There are 92.76 Females per 100 Males in Hardeman County.
What is the Median Population Age in Hardeman County?
Median Population Age in Hardeman County is 44.1 Years.
What is the Average Family Size in Hardeman County
Average Family Size in Hardeman County is 3.4 People.
What is the Average Household Size in Hardeman County
Average Household Size in Hardeman County is 2.7 People.
How Large is the Labor Force in Hardeman County?
There are 1,857 People in the Labor Forcein in Hardeman County.
What is the Percentage of People in the Labor Force in Hardeman County?
64.7% of People are in the Labor Force in Hardeman County.
What is the Unemployment Rate in Hardeman County?
Unemployment Rate in Hardeman County is 2.5%.