Hansford County, TX Map & Demographics
Hansford County Map
Hansford County Overview
$27,585
PER CAPITA INCOME
$88,538
AVG FAMILY INCOME
$62,350
AVG HOUSEHOLD INCOME
33.2%
WAGE / INCOME GAP [ % ]
66.8¢/ $1
WAGE / INCOME GAP [ $ ]
$5,736
FAMILY INCOME DEFICIT
0.40
INEQUALITY / GINI INDEX
5,270
TOTAL POPULATION
2,780
MALE POPULATION
2,490
FEMALE POPULATION
111.65
MALES / 100 FEMALES
89.57
FEMALES / 100 MALES
33.9
MEDIAN AGE
3.8
AVG FAMILY SIZE
3.0
AVG HOUSEHOLD SIZE
2,542
LABOR FORCE [ PEOPLE ]
65.1%
PERCENT IN LABOR FORCE
4.3%
UNEMPLOYMENT RATE
Hansford County Area Codes
Income in Hansford County
Income Overview in Hansford County
Per Capita Income in Hansford County is $27,585, while median incomes of families and households are $88,538 and $62,350 respectively.
| Characteristic | Number | Measure |
| Per Capita Income | 5,270 | $27,585 |
| Median Family Income | 1,198 | $88,538 |
| Mean Family Income | 1,198 | $96,193 |
| Median Household Income | 1,763 | $62,350 |
| Mean Household Income | 1,763 | $77,865 |
| Income Deficit | 1,198 | $5,736 |
| Wage / Income Gap (%) | 5,270 | 33.22% |
| Wage / Income Gap ($) | 5,270 | 66.78¢ per $1 |
| Gini / Inequality Index | 5,270 | 0.40 |
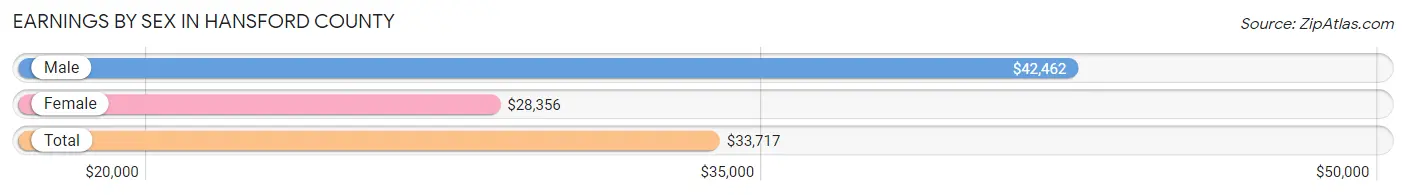
Earnings by Sex in Hansford County
Average Earnings in Hansford County are $33,717, $42,462 for men and $28,356 for women, a difference of 33.2%.
| Sex | Number | Average Earnings |
| Male | 1,578 (57.5%) | $42,462 |
| Female | 1,167 (42.5%) | $28,356 |
| Total | 2,745 (100.0%) | $33,717 |
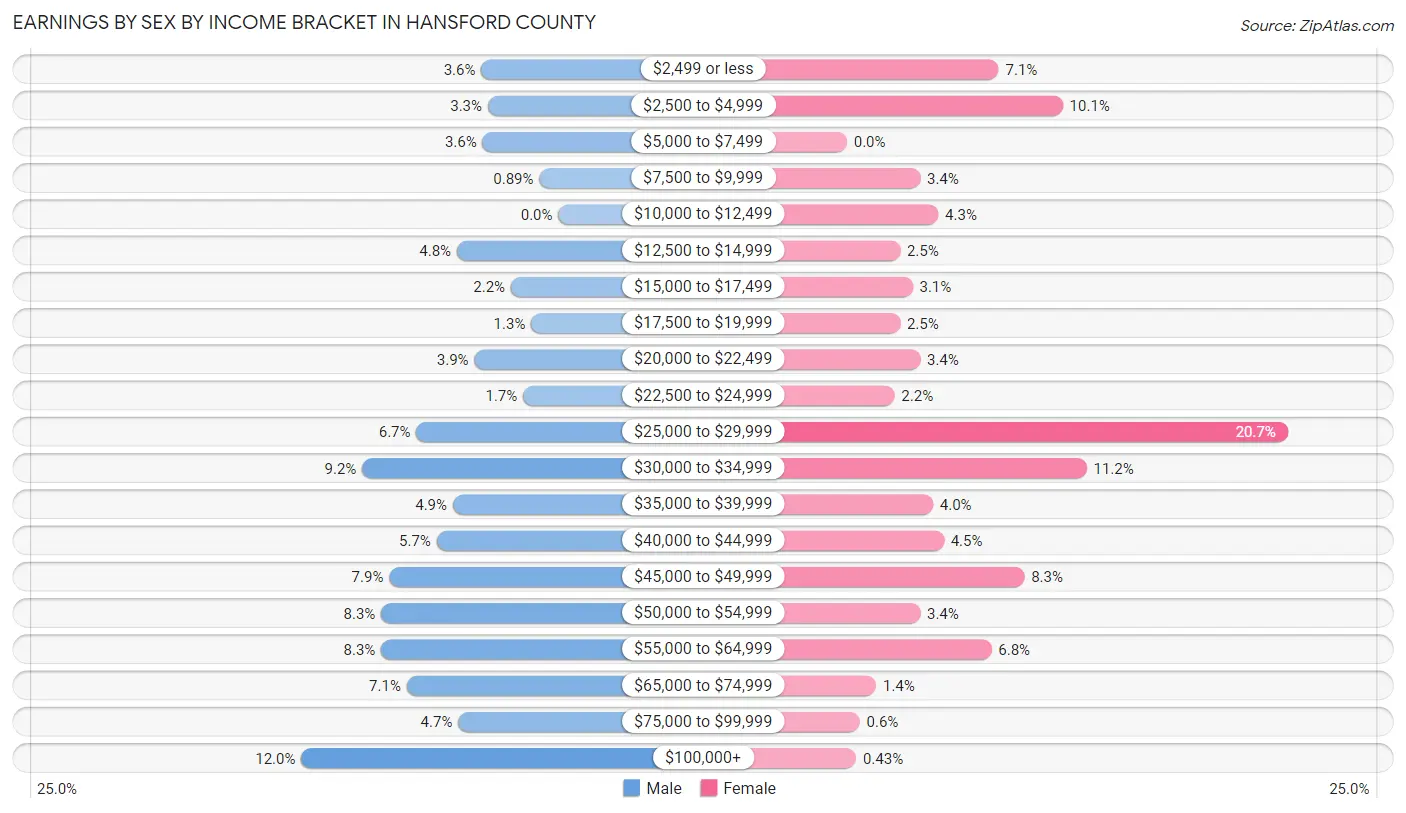
Earnings by Sex by Income Bracket in Hansford County
The most common earnings brackets in Hansford County are $100,000+ for men (190 | 12.0%) and $25,000 to $29,999 for women (241 | 20.6%).
| Income | Male | Female |
| $2,499 or less | 57 (3.6%) | 83 (7.1%) |
| $2,500 to $4,999 | 52 (3.3%) | 118 (10.1%) |
| $5,000 to $7,499 | 56 (3.5%) | 0 (0.0%) |
| $7,500 to $9,999 | 14 (0.9%) | 40 (3.4%) |
| $10,000 to $12,499 | 0 (0.0%) | 50 (4.3%) |
| $12,500 to $14,999 | 75 (4.8%) | 29 (2.5%) |
| $15,000 to $17,499 | 35 (2.2%) | 36 (3.1%) |
| $17,500 to $19,999 | 20 (1.3%) | 29 (2.5%) |
| $20,000 to $22,499 | 62 (3.9%) | 40 (3.4%) |
| $22,500 to $24,999 | 26 (1.7%) | 26 (2.2%) |
| $25,000 to $29,999 | 105 (6.7%) | 241 (20.6%) |
| $30,000 to $34,999 | 145 (9.2%) | 131 (11.2%) |
| $35,000 to $39,999 | 78 (4.9%) | 47 (4.0%) |
| $40,000 to $44,999 | 90 (5.7%) | 53 (4.5%) |
| $45,000 to $49,999 | 125 (7.9%) | 97 (8.3%) |
| $50,000 to $54,999 | 131 (8.3%) | 40 (3.4%) |
| $55,000 to $64,999 | 131 (8.3%) | 79 (6.8%) |
| $65,000 to $74,999 | 112 (7.1%) | 16 (1.4%) |
| $75,000 to $99,999 | 74 (4.7%) | 7 (0.6%) |
| $100,000+ | 190 (12.0%) | 5 (0.4%) |
| Total | 1,578 (100.0%) | 1,167 (100.0%) |
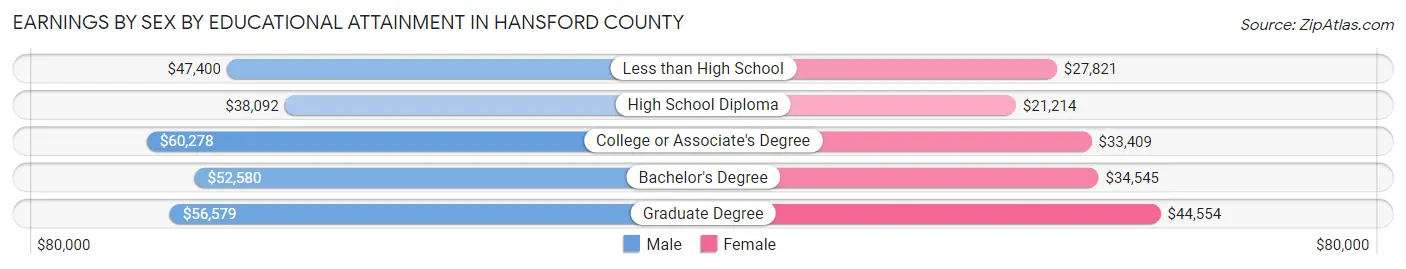
Earnings by Sex by Educational Attainment in Hansford County
Average earnings in Hansford County are $47,427 for men and $29,426 for women, a difference of 38.0%. Men with an educational attainment of college or associate's degree enjoy the highest average annual earnings of $60,278, while those with high school diploma education earn the least with $38,092. Women with an educational attainment of graduate degree earn the most with the average annual earnings of $44,554, while those with high school diploma education have the smallest earnings of $21,214.
| Educational Attainment | Male Income | Female Income |
| Less than High School | $47,400 | $27,821 |
| High School Diploma | $38,092 | $21,214 |
| College or Associate's Degree | $60,278 | $33,409 |
| Bachelor's Degree | $52,580 | $34,545 |
| Graduate Degree | $56,579 | $44,554 |
| Total | $47,427 | $29,426 |
Family Income in Hansford County
Family Income Brackets in Hansford County
According to the Hansford County family income data, there are 276 families falling into the $75,000 to $99,999 income range, which is the most common income bracket and makes up 23.0% of all families. Conversely, the $10,000 to $14,999 income bracket is the least frequent group with only 6 families (0.5%) belonging to this category.
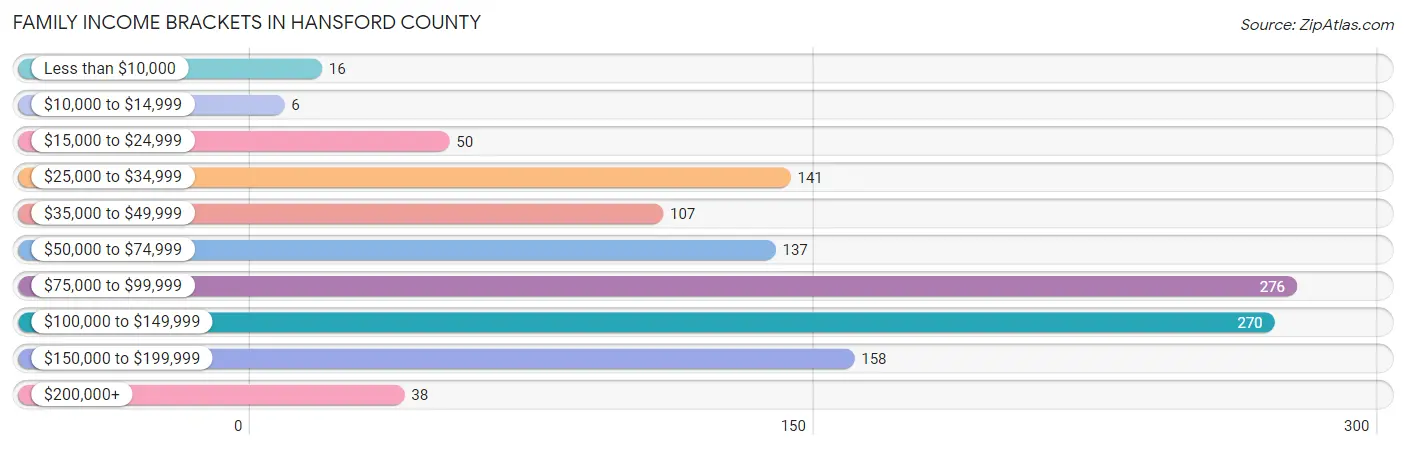
| Income Bracket | # Families | % Families |
| Less than $10,000 | 16 | 1.3% |
| $10,000 to $14,999 | 6 | 0.5% |
| $15,000 to $24,999 | 50 | 4.2% |
| $25,000 to $34,999 | 141 | 11.8% |
| $35,000 to $49,999 | 107 | 8.9% |
| $50,000 to $74,999 | 137 | 11.4% |
| $75,000 to $99,999 | 276 | 23.0% |
| $100,000 to $149,999 | 270 | 22.5% |
| $150,000 to $199,999 | 158 | 13.2% |
| $200,000+ | 38 | 3.2% |
Family Income by Famaliy Size in Hansford County
6-person families (28 | 2.3%) account for the highest median family income in Hansford County with $98,553 per family, while 2-person families (501 | 41.8%) have the highest median income of $39,688 per family member.
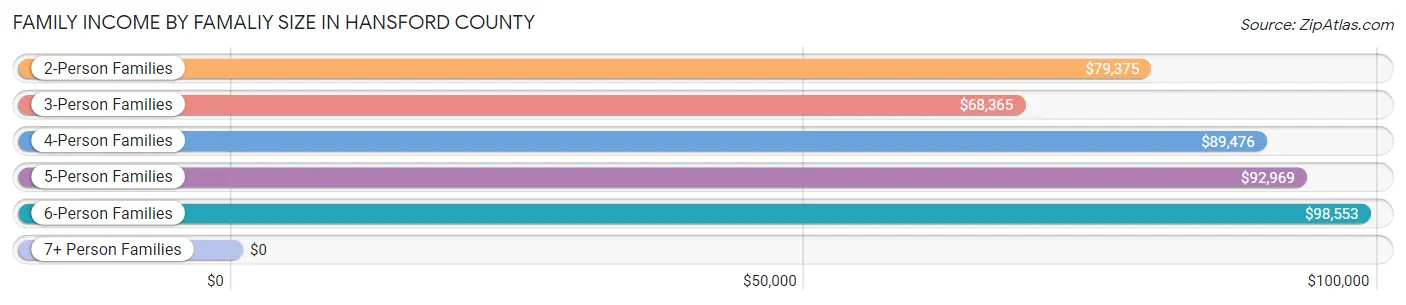
| Income Bracket | # Families | Median Income |
| 2-Person Families | 501 (41.8%) | $79,375 |
| 3-Person Families | 173 (14.4%) | $68,365 |
| 4-Person Families | 321 (26.8%) | $89,476 |
| 5-Person Families | 143 (11.9%) | $92,969 |
| 6-Person Families | 28 (2.3%) | $98,553 |
| 7+ Person Families | 32 (2.7%) | $0 |
| Total | 1,198 (100.0%) | $88,538 |
Family Income by Number of Earners in Hansford County
The median family income in Hansford County is $88,538, with families comprising 3+ earners (224) having the highest median family income of $152,802, while families with no earners (111) have the lowest median family income of $29,955, accounting for 18.7% and 9.3% of families, respectively.
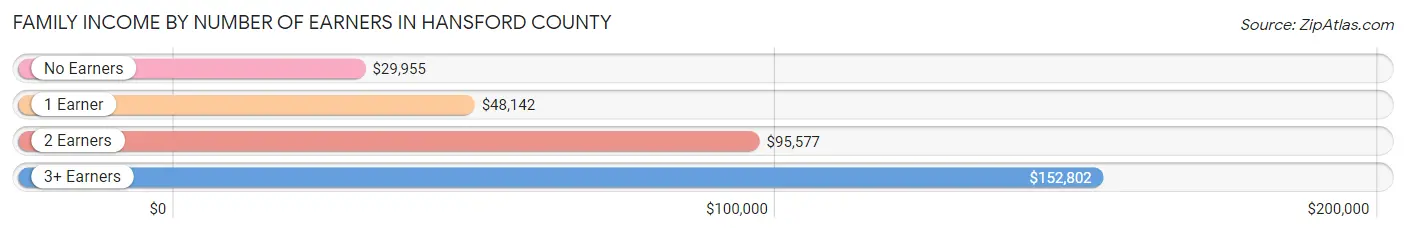
| Number of Earners | # Families | Median Income |
| No Earners | 111 (9.3%) | $29,955 |
| 1 Earner | 325 (27.1%) | $48,142 |
| 2 Earners | 538 (44.9%) | $95,577 |
| 3+ Earners | 224 (18.7%) | $152,802 |
| Total | 1,198 (100.0%) | $88,538 |
Household Income in Hansford County
Household Income Brackets in Hansford County
With 296 households falling in the category, the $75,000 to $99,999 income range is the most frequent in Hansford County, accounting for 16.8% of all households. In contrast, only 39 households (2.2%) fall into the $10,000 to $14,999 income bracket, making it the least populous group.
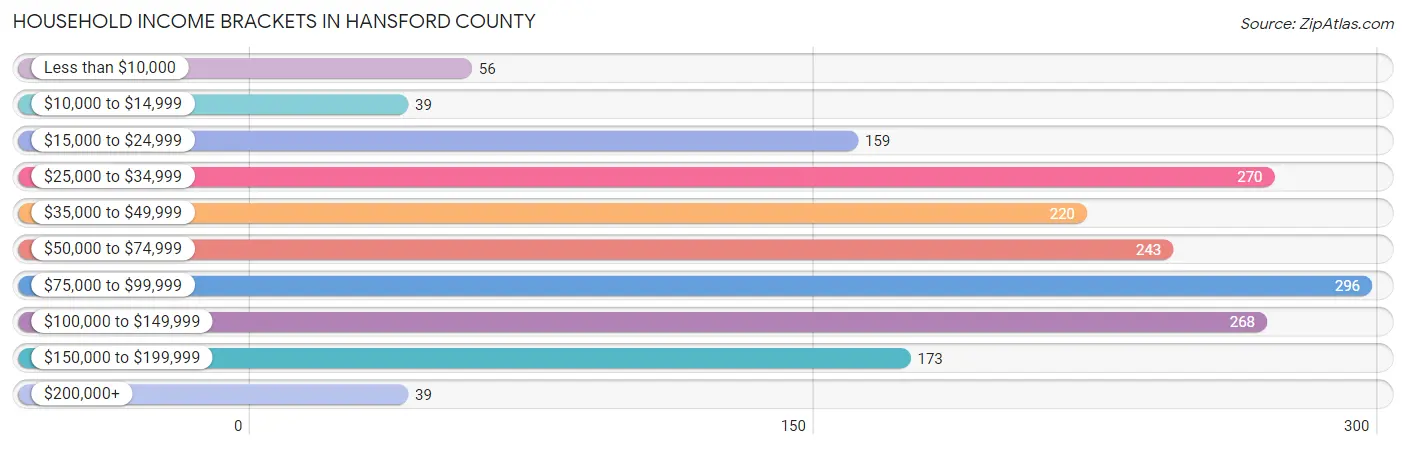
| Income Bracket | # Households | % Households |
| Less than $10,000 | 56 | 3.2% |
| $10,000 to $14,999 | 39 | 2.2% |
| $15,000 to $24,999 | 159 | 9.0% |
| $25,000 to $34,999 | 270 | 15.3% |
| $35,000 to $49,999 | 220 | 12.5% |
| $50,000 to $74,999 | 243 | 13.8% |
| $75,000 to $99,999 | 296 | 16.8% |
| $100,000 to $149,999 | 268 | 15.2% |
| $150,000 to $199,999 | 173 | 9.8% |
| $200,000+ | 39 | 2.2% |
Household Income by Householder Age in Hansford County
The median household income in Hansford County is $62,350, with the highest median household income of $78,462 found in the 45 to 64 years age bracket for the primary householder. A total of 742 households (42.1%) fall into this category. Meanwhile, the 65+ years age bracket for the primary householder has the lowest median household income of $36,550, with 379 households (21.5%) in this group.
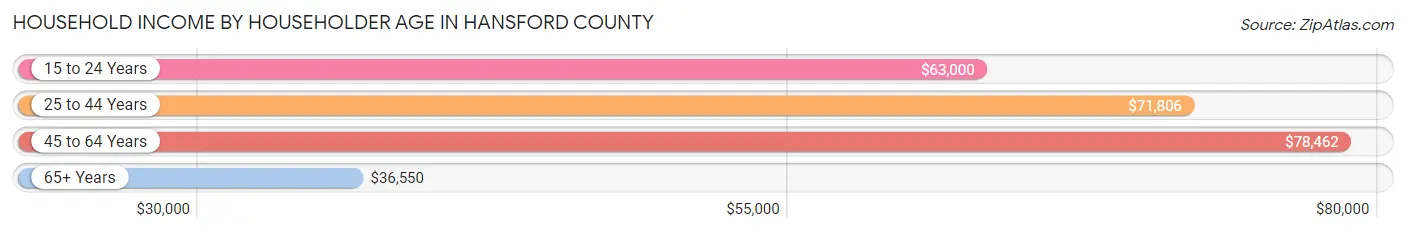
| Income Bracket | # Households | Median Income |
| 15 to 24 Years | 54 (3.1%) | $63,000 |
| 25 to 44 Years | 588 (33.4%) | $71,806 |
| 45 to 64 Years | 742 (42.1%) | $78,462 |
| 65+ Years | 379 (21.5%) | $36,550 |
| Total | 1,763 (100.0%) | $62,350 |
Poverty in Hansford County
Income Below Poverty by Sex and Age in Hansford County
With 6.2% poverty level for males and 10.8% for females among the residents of Hansford County, 5 year old males and 6 to 11 year old females are the most vulnerable to poverty, with 6 males (27.3%) and 55 females (28.9%) in their respective age groups living below the poverty level.
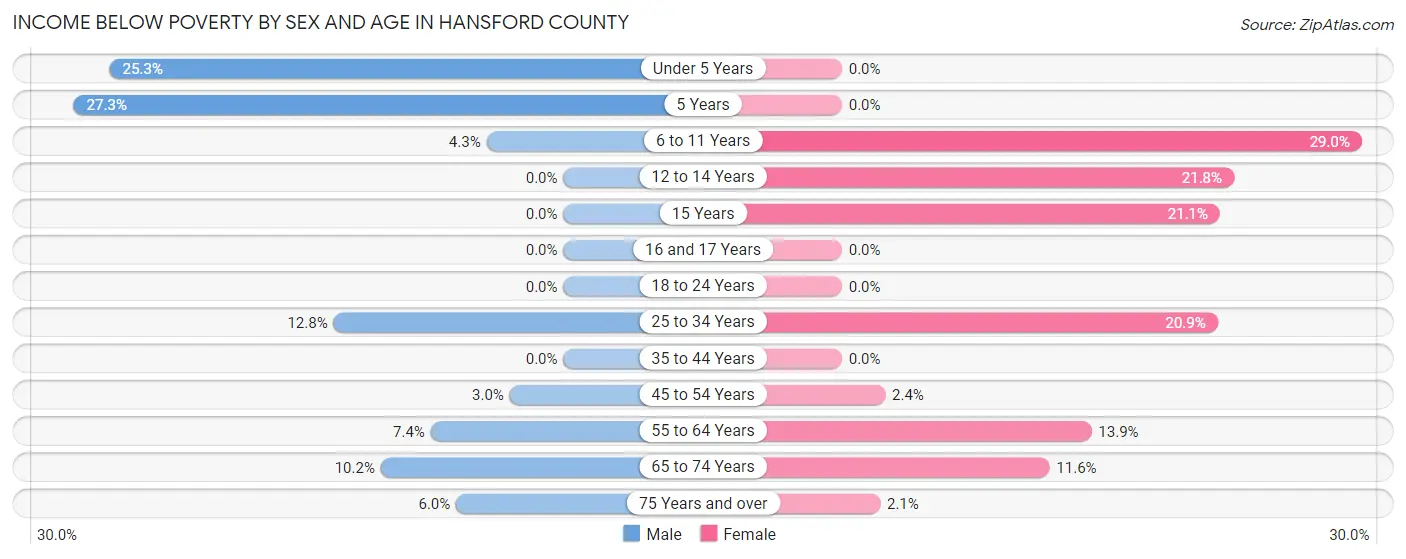
| Age Bracket | Male | Female |
| Under 5 Years | 46 (25.3%) | 0 (0.0%) |
| 5 Years | 6 (27.3%) | 0 (0.0%) |
| 6 to 11 Years | 13 (4.3%) | 55 (28.9%) |
| 12 to 14 Years | 0 (0.0%) | 31 (21.8%) |
| 15 Years | 0 (0.0%) | 20 (21.0%) |
| 16 and 17 Years | 0 (0.0%) | 0 (0.0%) |
| 18 to 24 Years | 0 (0.0%) | 0 (0.0%) |
| 25 to 34 Years | 43 (12.8%) | 77 (20.9%) |
| 35 to 44 Years | 0 (0.0%) | 0 (0.0%) |
| 45 to 54 Years | 10 (3.0%) | 7 (2.4%) |
| 55 to 64 Years | 28 (7.4%) | 46 (13.9%) |
| 65 to 74 Years | 18 (10.2%) | 23 (11.6%) |
| 75 Years and over | 8 (6.0%) | 3 (2.1%) |
| Total | 172 (6.2%) | 262 (10.8%) |
Income Above Poverty by Sex and Age in Hansford County
According to the poverty statistics in Hansford County, males aged 12 to 14 years and females aged under 5 years are the age groups that are most secure financially, with 100.0% of males and 100.0% of females in these age groups living above the poverty line.
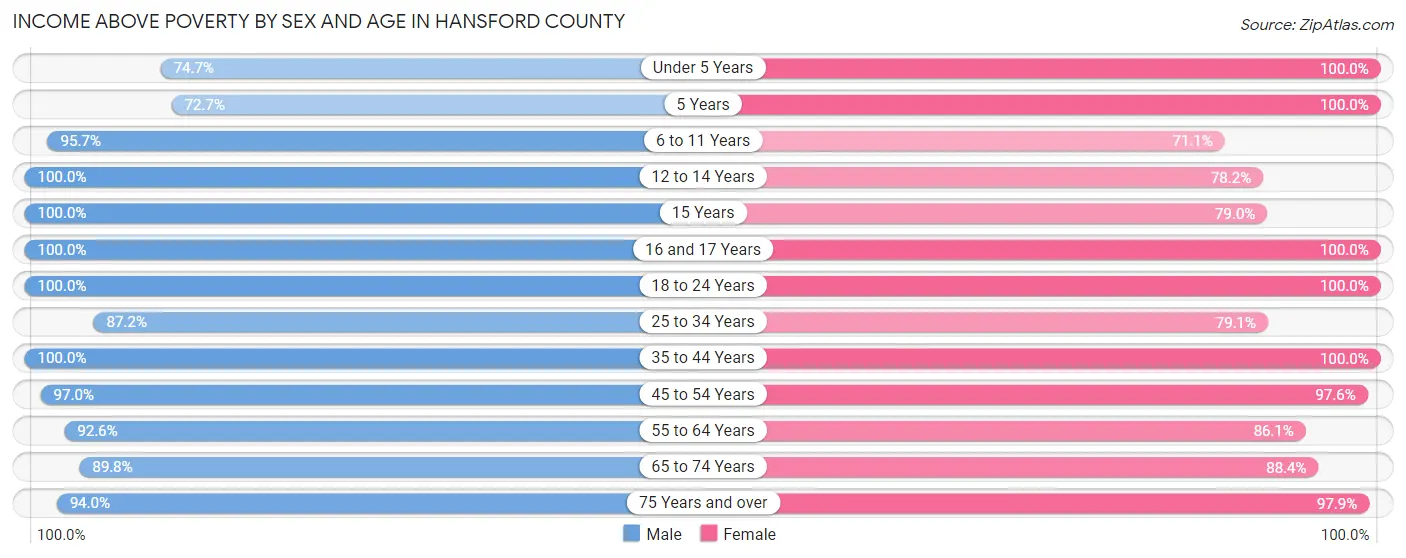
| Age Bracket | Male | Female |
| Under 5 Years | 136 (74.7%) | 200 (100.0%) |
| 5 Years | 16 (72.7%) | 26 (100.0%) |
| 6 to 11 Years | 291 (95.7%) | 135 (71.1%) |
| 12 to 14 Years | 147 (100.0%) | 111 (78.2%) |
| 15 Years | 57 (100.0%) | 75 (78.9%) |
| 16 and 17 Years | 150 (100.0%) | 3 (100.0%) |
| 18 to 24 Years | 266 (100.0%) | 209 (100.0%) |
| 25 to 34 Years | 293 (87.2%) | 291 (79.1%) |
| 35 to 44 Years | 270 (100.0%) | 240 (100.0%) |
| 45 to 54 Years | 325 (97.0%) | 284 (97.6%) |
| 55 to 64 Years | 351 (92.6%) | 285 (86.1%) |
| 65 to 74 Years | 159 (89.8%) | 176 (88.4%) |
| 75 Years and over | 126 (94.0%) | 138 (97.9%) |
| Total | 2,587 (93.8%) | 2,173 (89.2%) |
Income Below Poverty Among Married-Couple Families in Hansford County
The poverty statistics for married-couple families in Hansford County show that 5.5% or 58 of the total 1,049 families live below the poverty line. Families with no children have the highest poverty rate of 6.7%, comprising of 35 families. On the other hand, families with 3 or 4 children have the lowest poverty rate of 0.9%, which includes 1 families.
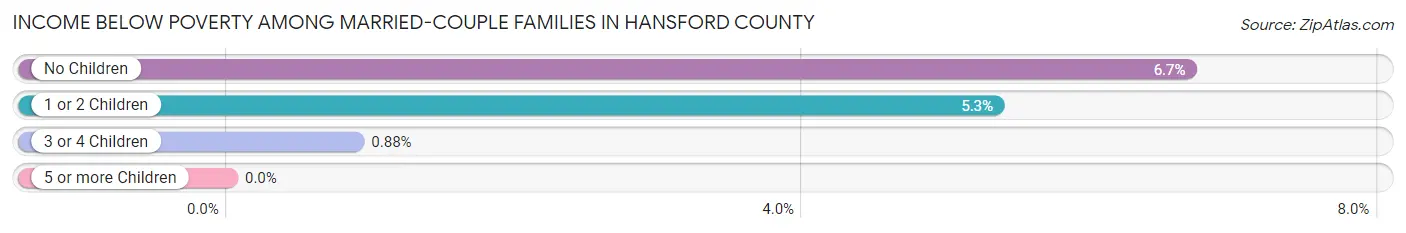
| Children | Above Poverty | Below Poverty |
| No Children | 489 (93.3%) | 35 (6.7%) |
| 1 or 2 Children | 390 (94.7%) | 22 (5.3%) |
| 3 or 4 Children | 112 (99.1%) | 1 (0.9%) |
| 5 or more Children | 0 (0.0%) | 0 (0.0%) |
| Total | 991 (94.5%) | 58 (5.5%) |
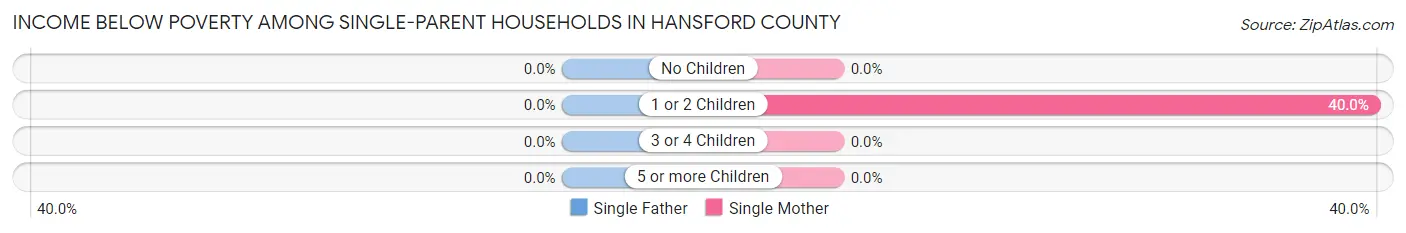
Income Below Poverty Among Single-Parent Households in Hansford County
| Children | Single Father | Single Mother |
| No Children | 0 (0.0%) | 0 (0.0%) |
| 1 or 2 Children | 0 (0.0%) | 28 (40.0%) |
| 3 or 4 Children | 0 (0.0%) | 0 (0.0%) |
| 5 or more Children | 0 (0.0%) | 0 (0.0%) |
| Total | 0 (0.0%) | 28 (22.2%) |
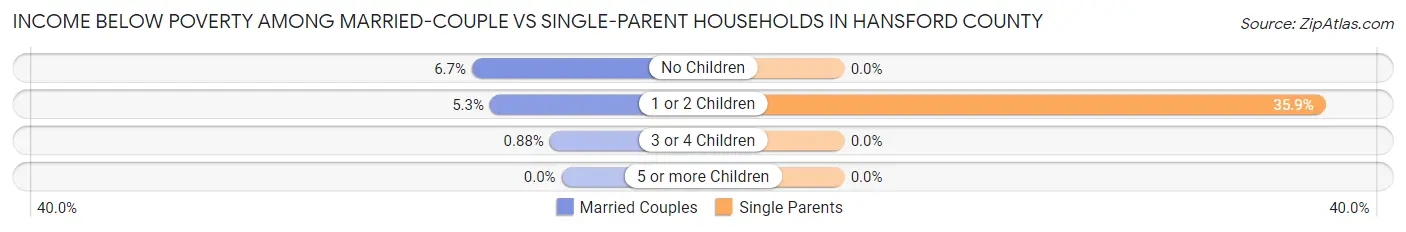
Income Below Poverty Among Married-Couple vs Single-Parent Households in Hansford County
The poverty data for Hansford County shows that 58 of the married-couple family households (5.5%) and 28 of the single-parent households (18.8%) are living below the poverty level. Within the married-couple family households, those with no children have the highest poverty rate, with 35 households (6.7%) falling below the poverty line. Among the single-parent households, those with 1 or 2 children have the highest poverty rate, with 28 household (35.9%) living below poverty.
| Children | Married-Couple Families | Single-Parent Households |
| No Children | 35 (6.7%) | 0 (0.0%) |
| 1 or 2 Children | 22 (5.3%) | 28 (35.9%) |
| 3 or 4 Children | 1 (0.9%) | 0 (0.0%) |
| 5 or more Children | 0 (0.0%) | 0 (0.0%) |
| Total | 58 (5.5%) | 28 (18.8%) |
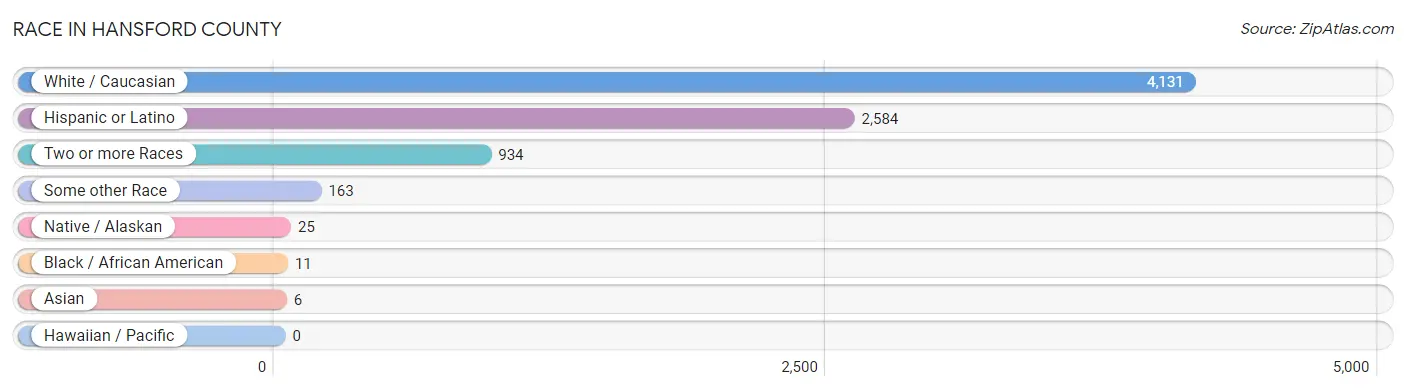
Race in Hansford County
The most populous races in Hansford County are White / Caucasian (4,131 | 78.4%), Hispanic or Latino (2,584 | 49.0%), and Two or more Races (934 | 17.7%).
| Race | # Population | % Population |
| Asian | 6 | 0.1% |
| Black / African American | 11 | 0.2% |
| Hawaiian / Pacific | 0 | 0.0% |
| Hispanic or Latino | 2,584 | 49.0% |
| Native / Alaskan | 25 | 0.5% |
| White / Caucasian | 4,131 | 78.4% |
| Two or more Races | 934 | 17.7% |
| Some other Race | 163 | 3.1% |
| Total | 5,270 | 100.0% |
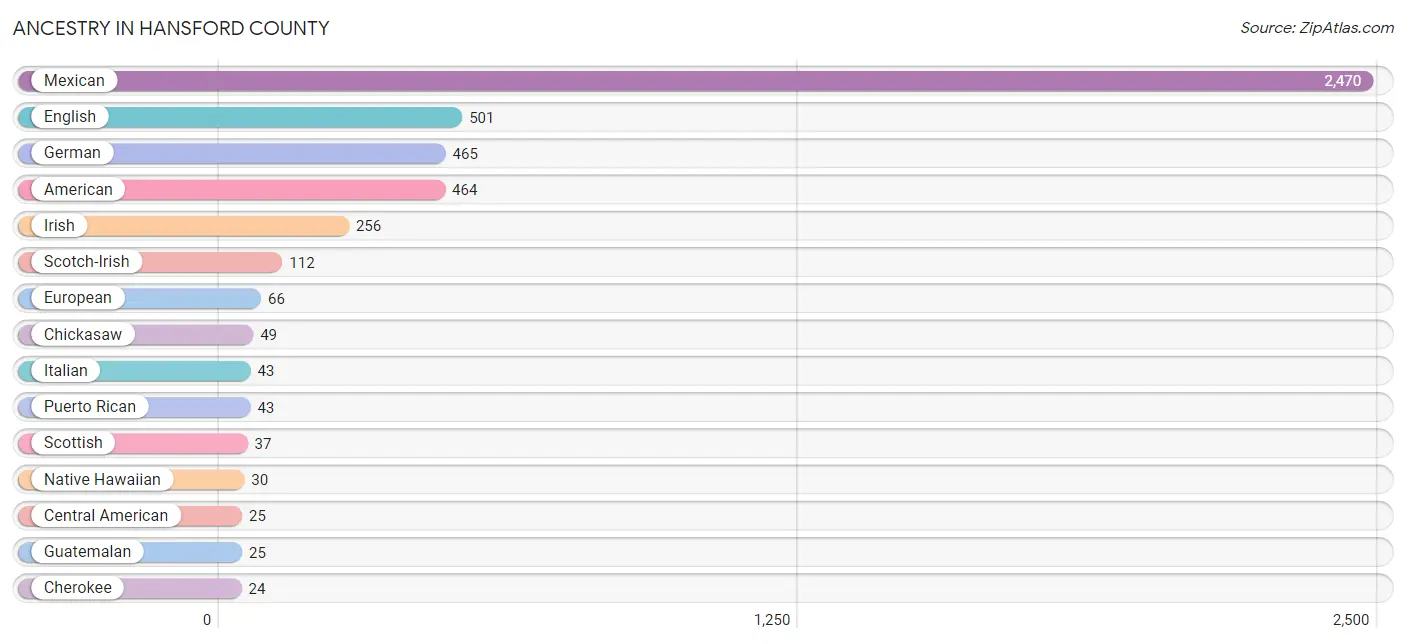
Ancestry in Hansford County
The most populous ancestries reported in Hansford County are Mexican (2,470 | 46.9%), English (501 | 9.5%), German (465 | 8.8%), American (464 | 8.8%), and Irish (256 | 4.9%), together accounting for 78.9% of all Hansford County residents.
| Ancestry | # Population | % Population |
| African | 1 | 0.0% |
| American | 464 | 8.8% |
| Argentinean | 5 | 0.1% |
| Basque | 6 | 0.1% |
| Bhutanese | 16 | 0.3% |
| British | 10 | 0.2% |
| Central American | 25 | 0.5% |
| Central American Indian | 5 | 0.1% |
| Cherokee | 24 | 0.5% |
| Chickasaw | 49 | 0.9% |
| Czech | 5 | 0.1% |
| Danish | 5 | 0.1% |
| Dutch | 6 | 0.1% |
| English | 501 | 9.5% |
| European | 66 | 1.3% |
| French | 11 | 0.2% |
| French Canadian | 16 | 0.3% |
| German | 465 | 8.8% |
| Guatemalan | 25 | 0.5% |
| Irish | 256 | 4.9% |
| Italian | 43 | 0.8% |
| Korean | 11 | 0.2% |
| Mexican | 2,470 | 46.9% |
| Mexican American Indian | 14 | 0.3% |
| Native Hawaiian | 30 | 0.6% |
| Norwegian | 24 | 0.5% |
| Portuguese | 8 | 0.2% |
| Puerto Rican | 43 | 0.8% |
| Scotch-Irish | 112 | 2.1% |
| Scottish | 37 | 0.7% |
| South American | 5 | 0.1% |
| Spaniard | 14 | 0.3% |
| Subsaharan African | 1 | 0.0% |
| Swedish | 4 | 0.1% |
| Welsh | 16 | 0.3% | View All 35 Rows |
Immigrants in Hansford County
The most numerous immigrant groups reported in Hansford County came from Central America (886 | 16.8%), Latin America (886 | 16.8%), Mexico (886 | 16.8%), Eastern Europe (27 | 0.5%), and Europe (27 | 0.5%), together accounting for 51.4% of all Hansford County residents.
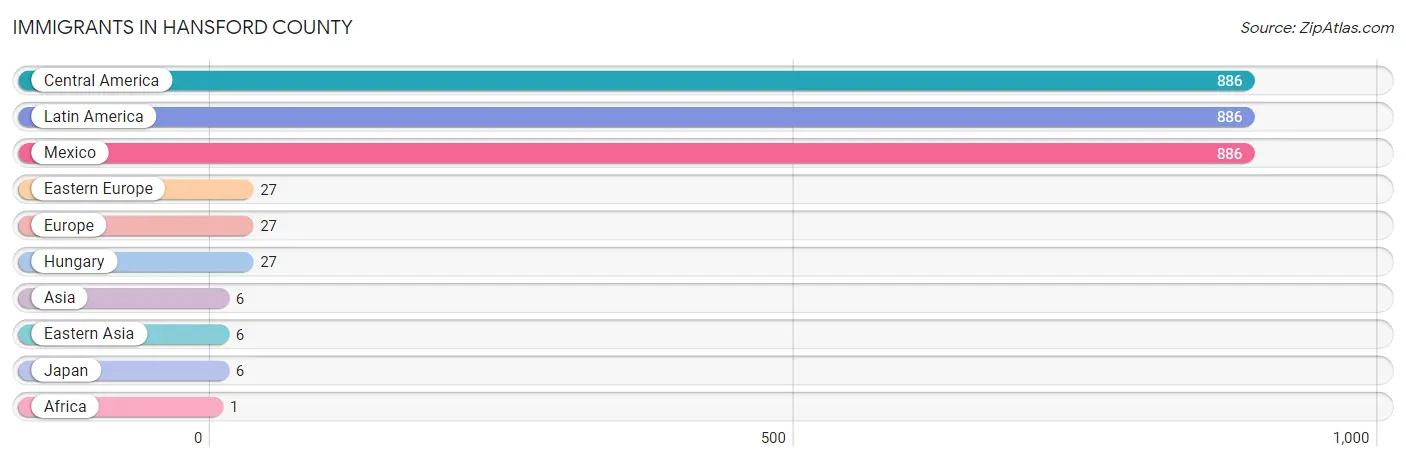
| Immigration Origin | # Population | % Population |
| Africa | 1 | 0.0% |
| Asia | 6 | 0.1% |
| Central America | 886 | 16.8% |
| Eastern Asia | 6 | 0.1% |
| Eastern Europe | 27 | 0.5% |
| Europe | 27 | 0.5% |
| Hungary | 27 | 0.5% |
| Japan | 6 | 0.1% |
| Latin America | 886 | 16.8% |
| Mexico | 886 | 16.8% | View All 10 Rows |
Sex and Age in Hansford County
Sex and Age in Hansford County
The most populous age groups in Hansford County are 15 to 19 Years (335 | 12.0%) for men and 50 to 54 Years (201 | 8.1%) for women.
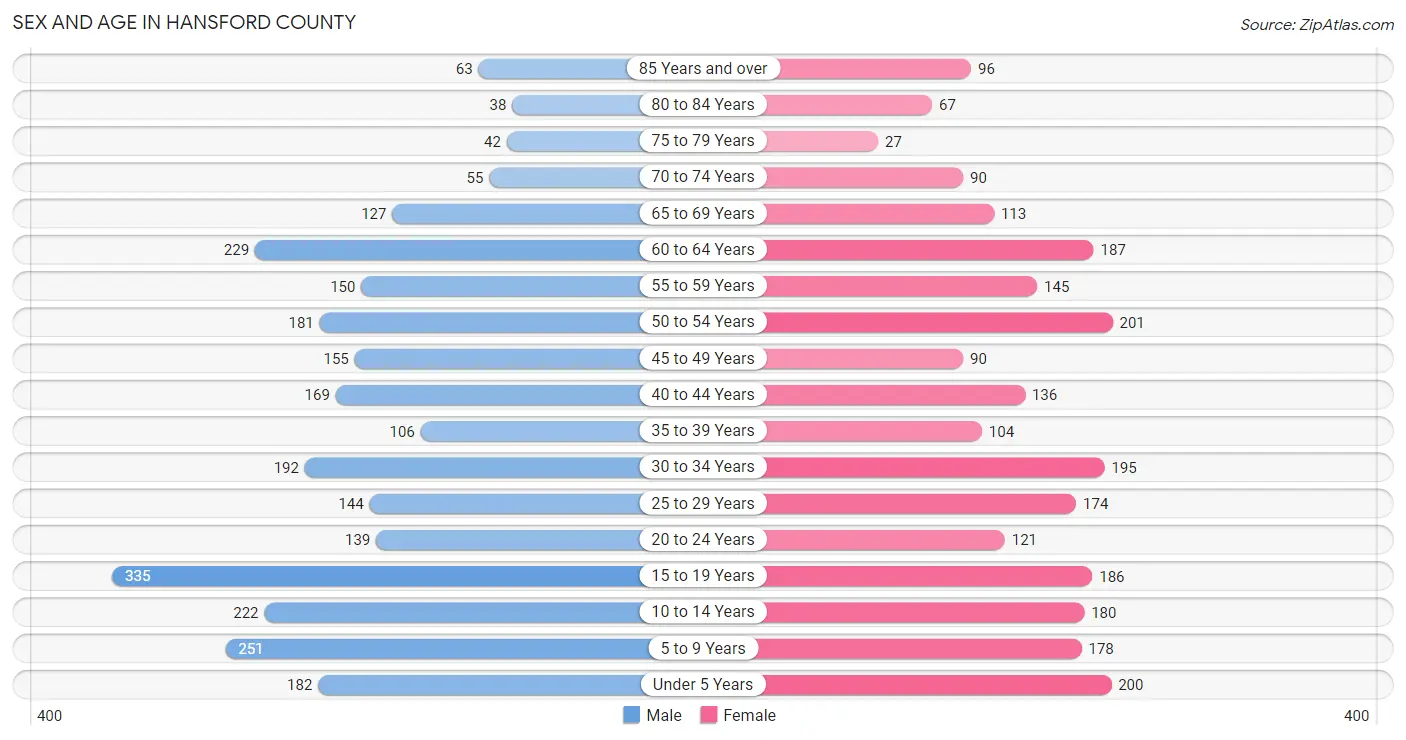
| Age Bracket | Male | Female |
| Under 5 Years | 182 (6.6%) | 200 (8.0%) |
| 5 to 9 Years | 251 (9.0%) | 178 (7.1%) |
| 10 to 14 Years | 222 (8.0%) | 180 (7.2%) |
| 15 to 19 Years | 335 (12.0%) | 186 (7.5%) |
| 20 to 24 Years | 139 (5.0%) | 121 (4.9%) |
| 25 to 29 Years | 144 (5.2%) | 174 (7.0%) |
| 30 to 34 Years | 192 (6.9%) | 195 (7.8%) |
| 35 to 39 Years | 106 (3.8%) | 104 (4.2%) |
| 40 to 44 Years | 169 (6.1%) | 136 (5.5%) |
| 45 to 49 Years | 155 (5.6%) | 90 (3.6%) |
| 50 to 54 Years | 181 (6.5%) | 201 (8.1%) |
| 55 to 59 Years | 150 (5.4%) | 145 (5.8%) |
| 60 to 64 Years | 229 (8.2%) | 187 (7.5%) |
| 65 to 69 Years | 127 (4.6%) | 113 (4.5%) |
| 70 to 74 Years | 55 (2.0%) | 90 (3.6%) |
| 75 to 79 Years | 42 (1.5%) | 27 (1.1%) |
| 80 to 84 Years | 38 (1.4%) | 67 (2.7%) |
| 85 Years and over | 63 (2.3%) | 96 (3.9%) |
| Total | 2,780 (100.0%) | 2,490 (100.0%) |
Families and Households in Hansford County
Median Family Size in Hansford County
The median family size in Hansford County is 3.76 persons per family, with single female/mother families (126 | 10.5%) accounting for the largest median family size of 5.45 persons per family. On the other hand, married-couple families (1,049 | 87.6%) represent the smallest median family size with 3.54 persons per family.
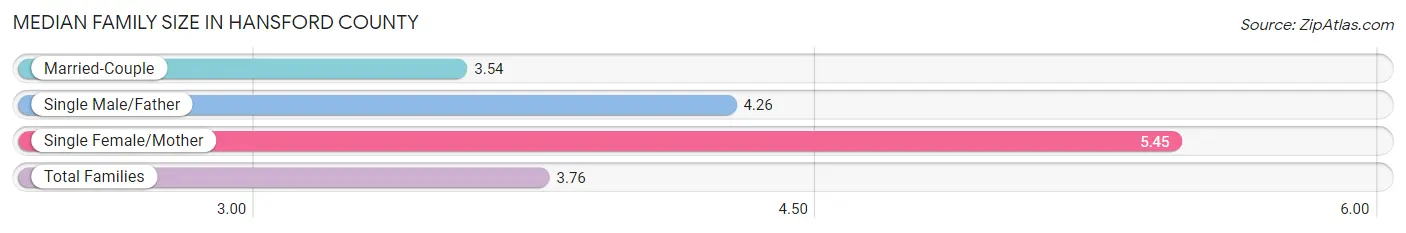
| Family Type | # Families | Family Size |
| Married-Couple | 1,049 (87.6%) | 3.54 |
| Single Male/Father | 23 (1.9%) | 4.26 |
| Single Female/Mother | 126 (10.5%) | 5.45 |
| Total Families | 1,198 (100.0%) | 3.76 |
Median Household Size in Hansford County
The median household size in Hansford County is 2.95 persons per household, with single female/mother households (126 | 7.1%) accounting for the largest median household size of 5.98 persons per household. non-family households (565 | 32.1%) represent the smallest median household size with 1.11 persons per household.

| Household Type | # Households | Household Size |
| Married-Couple | 1,049 (59.5%) | 3.54 |
| Single Male/Father | 23 (1.3%) | 4.26 |
| Single Female/Mother | 126 (7.1%) | 5.98 |
| Non-family | 565 (32.1%) | 1.11 |
| Total Households | 1,763 (100.0%) | 2.95 |
Household Size by Marriage Status in Hansford County
Out of a total of 1,763 households in Hansford County, 1,198 (67.9%) are family households, while 565 (32.1%) are nonfamily households. The most numerous type of family households are 2-person households, comprising 496, and the most common type of nonfamily households are 1-person households, comprising 534.
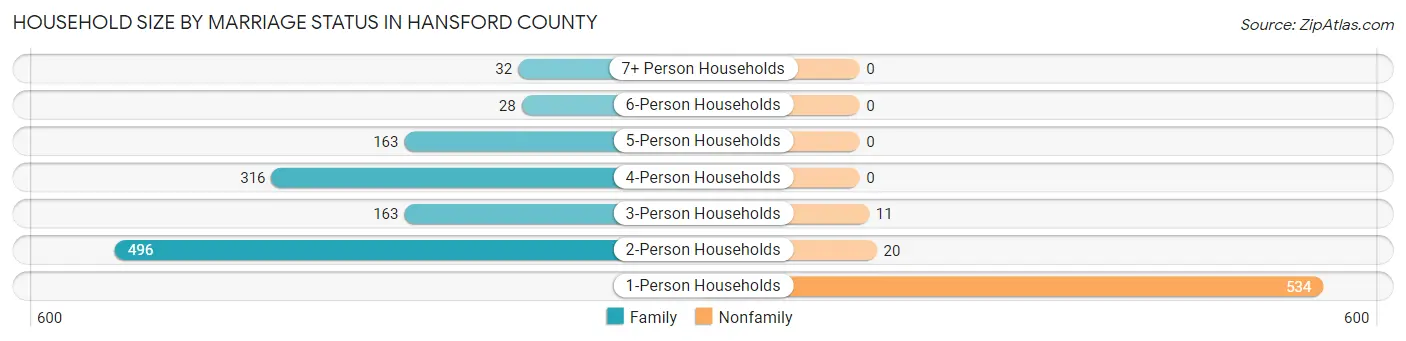
| Household Size | Family Households | Nonfamily Households |
| 1-Person Households | - | 534 (30.3%) |
| 2-Person Households | 496 (28.1%) | 20 (1.1%) |
| 3-Person Households | 163 (9.2%) | 11 (0.6%) |
| 4-Person Households | 316 (17.9%) | 0 (0.0%) |
| 5-Person Households | 163 (9.2%) | 0 (0.0%) |
| 6-Person Households | 28 (1.6%) | 0 (0.0%) |
| 7+ Person Households | 32 (1.8%) | 0 (0.0%) |
| Total | 1,198 (67.9%) | 565 (32.1%) |
Female Fertility in Hansford County
Fertility by Age in Hansford County
Average fertility rate in Hansford County is 23.0 births per 1,000 women. Women in the age bracket of 20 to 34 years have the highest fertility rate with 45.0 births per 1,000 women. Women in the age bracket of 20 to 34 years acount for 91.7% of all women with births.
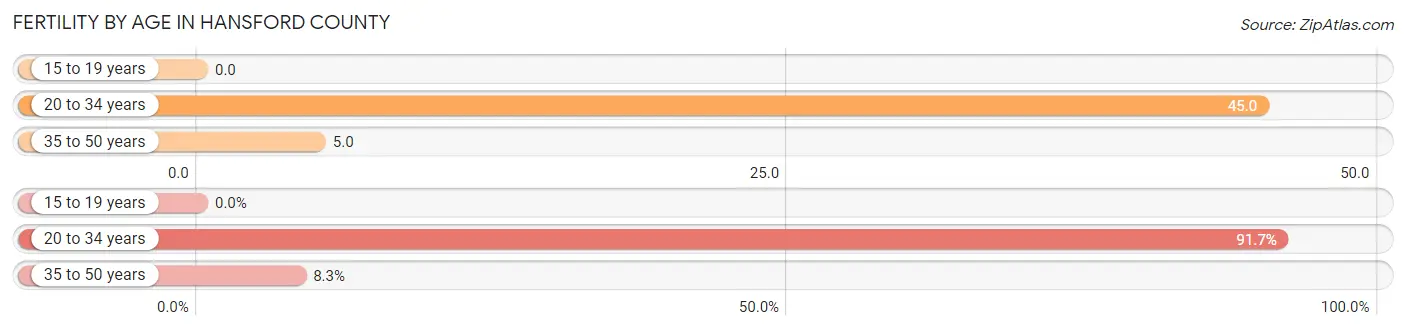
| Age Bracket | Women with Births | Births / 1,000 Women |
| 15 to 19 years | 0 (0.0%) | 0.0 |
| 20 to 34 years | 22 (91.7%) | 45.0 |
| 35 to 50 years | 2 (8.3%) | 5.0 |
| Total | 24 (100.0%) | 23.0 |
Fertility by Age by Marriage Status in Hansford County
91.7% of women with births (24) in Hansford County are married. The highest percentage of unmarried women with births falls into 20 to 34 years age bracket with 9.1% of them unmarried at the time of birth, while the lowest percentage of unmarried women with births belong to 35 to 50 years age bracket with 0.0% of them unmarried.
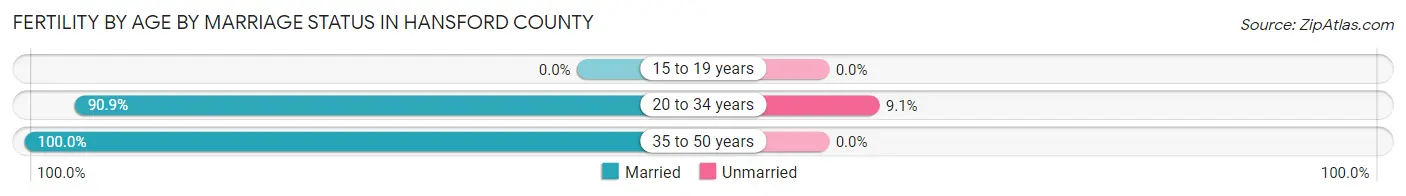
| Age Bracket | Married | Unmarried |
| 15 to 19 years | 0 (0.0%) | 0 (0.0%) |
| 20 to 34 years | 20 (90.9%) | 2 (9.1%) |
| 35 to 50 years | 2 (100.0%) | 0 (0.0%) |
| Total | 22 (91.7%) | 2 (8.3%) |
Fertility by Education in Hansford County
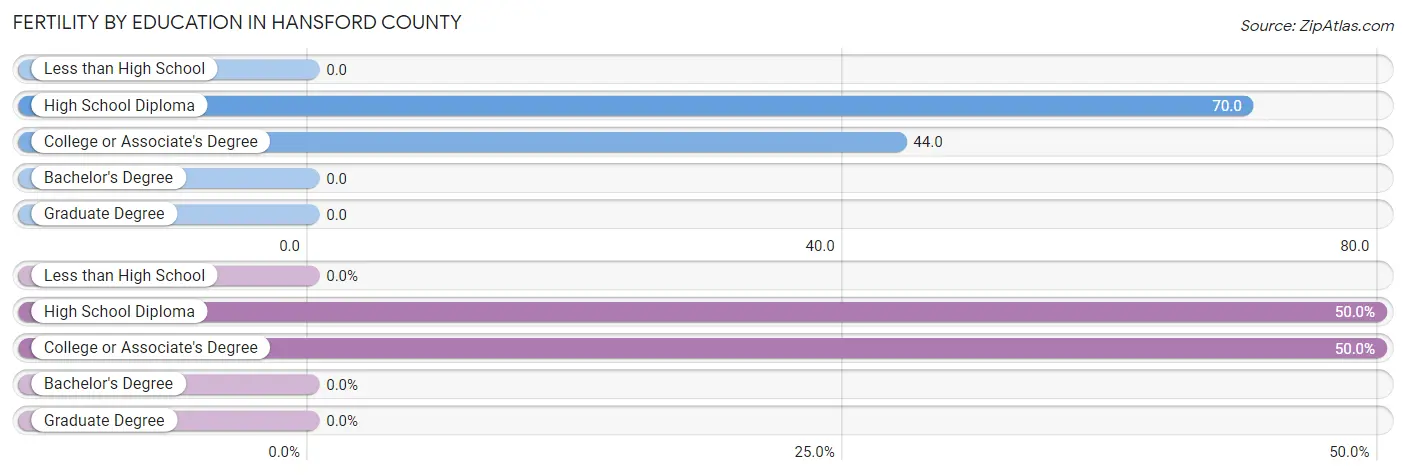
| Educational Attainment | Women with Births | Births / 1,000 Women |
| Less than High School | 0 (0.0%) | 0.0 |
| High School Diploma | 12 (50.0%) | 70.0 |
| College or Associate's Degree | 12 (50.0%) | 44.0 |
| Bachelor's Degree | 0 (0.0%) | 0.0 |
| Graduate Degree | 0 (0.0%) | 0.0 |
| Total | 24 (100.0%) | 23.0 |
Fertility by Education by Marriage Status in Hansford County
8.3% of women with births in Hansford County are unmarried. Women with the educational attainment of high school diploma are most likely to be married with 100.0% of them married at childbirth, while women with the educational attainment of college or associate's degree are least likely to be married with 16.7% of them unmarried at childbirth.
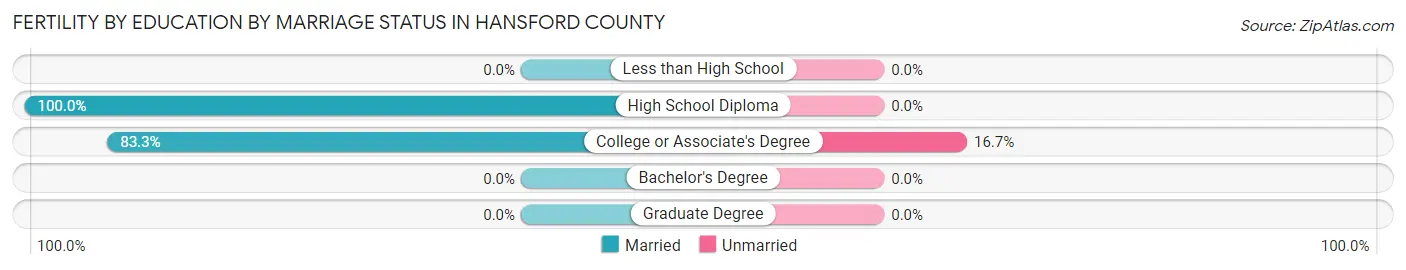
| Educational Attainment | Married | Unmarried |
| Less than High School | 0 (0.0%) | 0 (0.0%) |
| High School Diploma | 12 (100.0%) | 0 (0.0%) |
| College or Associate's Degree | 10 (83.3%) | 2 (16.7%) |
| Bachelor's Degree | 0 (0.0%) | 0 (0.0%) |
| Graduate Degree | 0 (0.0%) | 0 (0.0%) |
| Total | 22 (91.7%) | 2 (8.3%) |
Employment Characteristics in Hansford County
Employment by Class of Employer in Hansford County
Among the 2,429 employed individuals in Hansford County, private company employees (1,556 | 64.1%), local government employees (348 | 14.3%), and self-employed (not incorporated) (176 | 7.2%) make up the most common classes of employment.
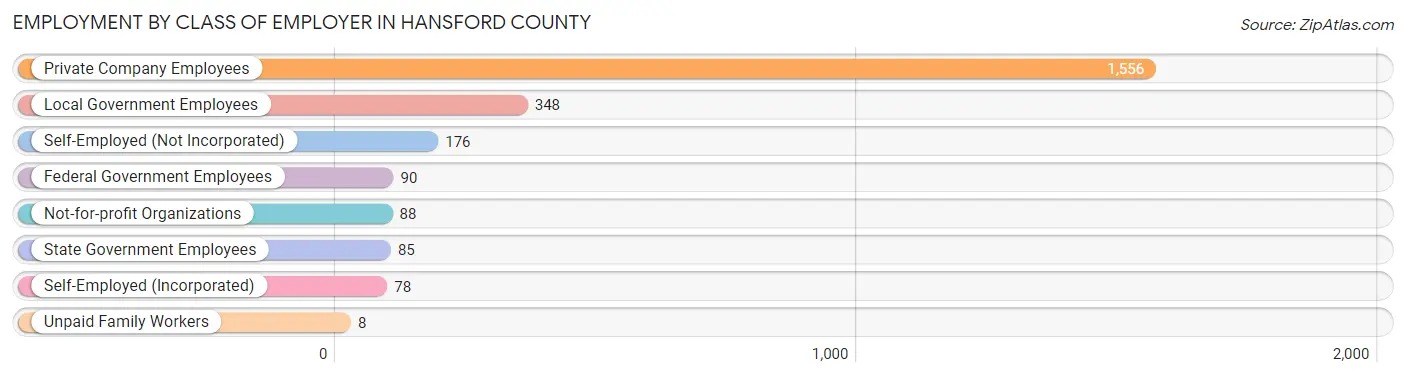
| Employer Class | # Employees | % Employees |
| Private Company Employees | 1,556 | 64.1% |
| Self-Employed (Incorporated) | 78 | 3.2% |
| Self-Employed (Not Incorporated) | 176 | 7.2% |
| Not-for-profit Organizations | 88 | 3.6% |
| Local Government Employees | 348 | 14.3% |
| State Government Employees | 85 | 3.5% |
| Federal Government Employees | 90 | 3.7% |
| Unpaid Family Workers | 8 | 0.3% |
| Total | 2,429 | 100.0% |
Employment Status by Age in Hansford County
According to the labor force statistics for Hansford County, out of the total population over 16 years of age (3,905), 65.1% or 2,542 individuals are in the labor force, with 4.3% or 109 of them unemployed. The age group with the highest labor force participation rate is 35 to 44 years, with 95.5% or 492 individuals in the labor force. Within the labor force, the 35 to 44 years age range has the highest percentage of unemployed individuals, with 18.9% or 93 of them being unemployed.
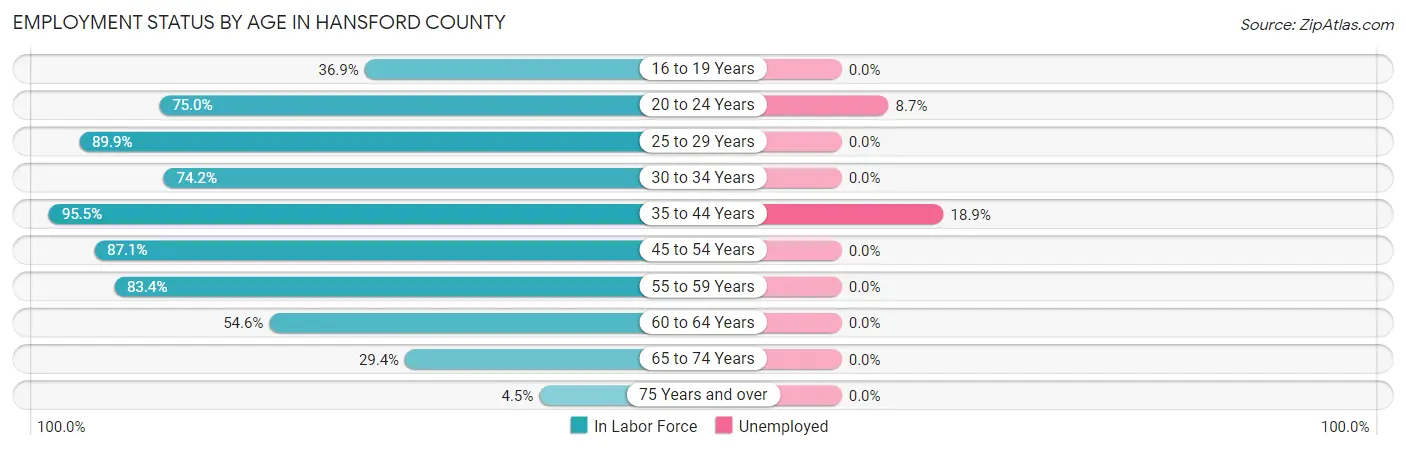
| Age Bracket | In Labor Force | Unemployed |
| 16 to 19 Years | 136 (36.9%) | 0 (0.0%) |
| 20 to 24 Years | 195 (75.0%) | 17 (8.7%) |
| 25 to 29 Years | 286 (89.9%) | 0 (0.0%) |
| 30 to 34 Years | 287 (74.2%) | 0 (0.0%) |
| 35 to 44 Years | 492 (95.5%) | 93 (18.9%) |
| 45 to 54 Years | 546 (87.1%) | 0 (0.0%) |
| 55 to 59 Years | 246 (83.4%) | 0 (0.0%) |
| 60 to 64 Years | 227 (54.6%) | 0 (0.0%) |
| 65 to 74 Years | 113 (29.4%) | 0 (0.0%) |
| 75 Years and over | 15 (4.5%) | 0 (0.0%) |
| Total | 2,542 (65.1%) | 109 (4.3%) |
Employment Status by Educational Attainment in Hansford County
According to labor force statistics for Hansford County, 81.5% of individuals (2,085) out of the total population between 25 and 64 years of age (2,558) are in the labor force, with 4.5% or 94 of them being unemployed. The group with the highest labor force participation rate are those with the educational attainment of college / associate degree, with 88.8% or 411 individuals in the labor force. Within the labor force, individuals with bachelor's degree or higher education have the highest percentage of unemployment, with 9.9% or 72 of them being unemployed.
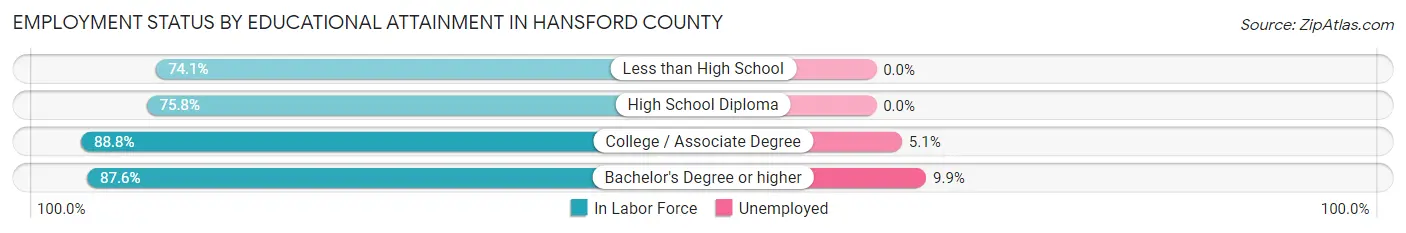
| Educational Attainment | In Labor Force | Unemployed |
| Less than High School | 568 (74.1%) | 0 (0.0%) |
| High School Diploma | 376 (75.8%) | 0 (0.0%) |
| College / Associate Degree | 411 (88.8%) | 24 (5.1%) |
| Bachelor's Degree or higher | 729 (87.6%) | 82 (9.9%) |
| Total | 2,085 (81.5%) | 115 (4.5%) |
Employment Occupations by Sex in Hansford County
Management, Business, Science and Arts Occupations
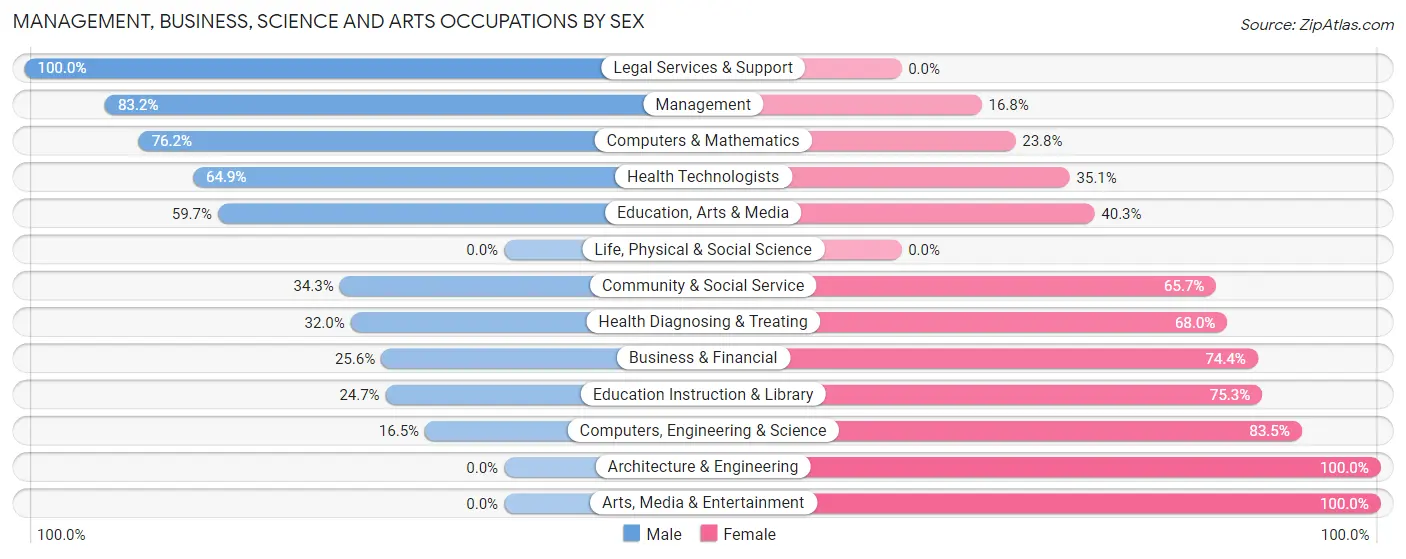
The most common Management, Business, Science and Arts occupations in Hansford County are Management (483 | 19.9%), Community & Social Service (277 | 11.4%), Education Instruction & Library (186 | 7.6%), Computers, Engineering & Science (97 | 4.0%), and Architecture & Engineering (76 | 3.1%).
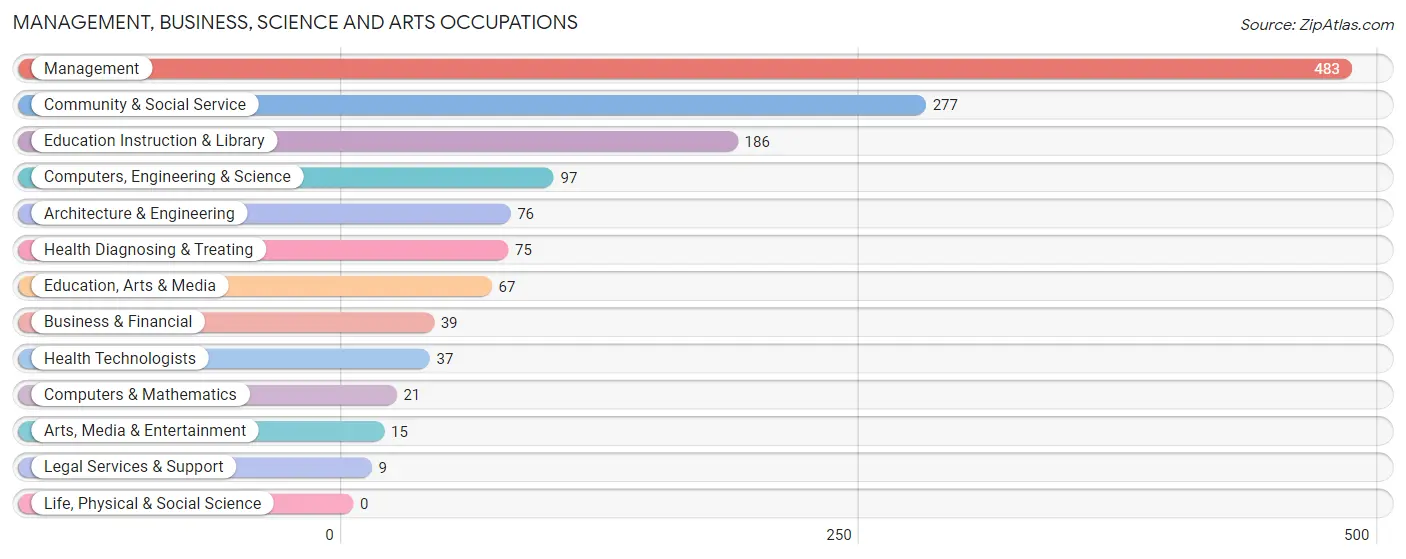
Management, Business, Science and Arts Occupations by Sex
Within the Management, Business, Science and Arts occupations in Hansford County, the most male-oriented occupations are Legal Services & Support (100.0%), Management (83.2%), and Computers & Mathematics (76.2%), while the most female-oriented occupations are Architecture & Engineering (100.0%), Arts, Media & Entertainment (100.0%), and Computers, Engineering & Science (83.5%).
| Occupation | Male | Female |
| Management | 402 (83.2%) | 81 (16.8%) |
| Business & Financial | 10 (25.6%) | 29 (74.4%) |
| Computers, Engineering & Science | 16 (16.5%) | 81 (83.5%) |
| Computers & Mathematics | 16 (76.2%) | 5 (23.8%) |
| Architecture & Engineering | 0 (0.0%) | 76 (100.0%) |
| Life, Physical & Social Science | 0 (0.0%) | 0 (0.0%) |
| Community & Social Service | 95 (34.3%) | 182 (65.7%) |
| Education, Arts & Media | 40 (59.7%) | 27 (40.3%) |
| Legal Services & Support | 9 (100.0%) | 0 (0.0%) |
| Education Instruction & Library | 46 (24.7%) | 140 (75.3%) |
| Arts, Media & Entertainment | 0 (0.0%) | 15 (100.0%) |
| Health Diagnosing & Treating | 24 (32.0%) | 51 (68.0%) |
| Health Technologists | 24 (64.9%) | 13 (35.1%) |
| Total (Category) | 547 (56.3%) | 424 (43.7%) |
| Total (Overall) | 1,377 (56.7%) | 1,053 (43.3%) |
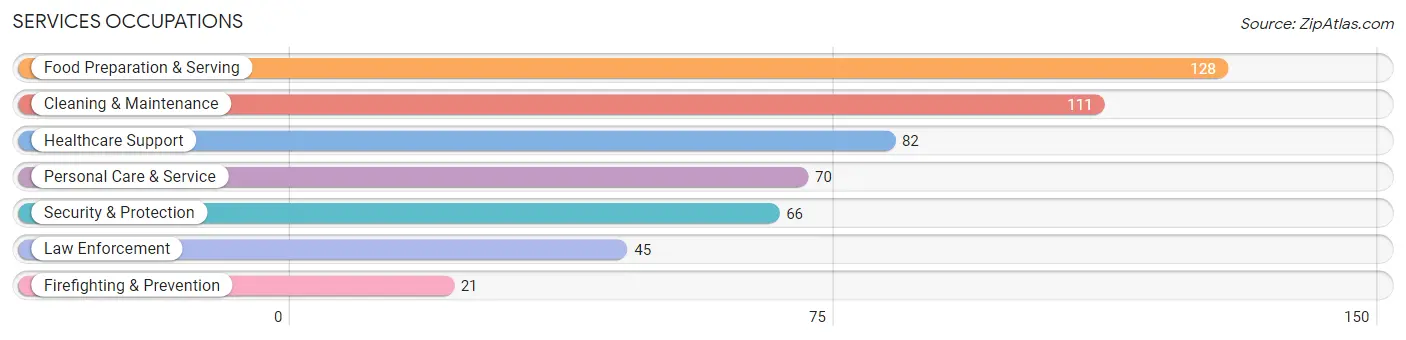
Services Occupations
The most common Services occupations in Hansford County are Food Preparation & Serving (128 | 5.3%), Cleaning & Maintenance (111 | 4.6%), Healthcare Support (82 | 3.4%), Personal Care & Service (70 | 2.9%), and Security & Protection (66 | 2.7%).
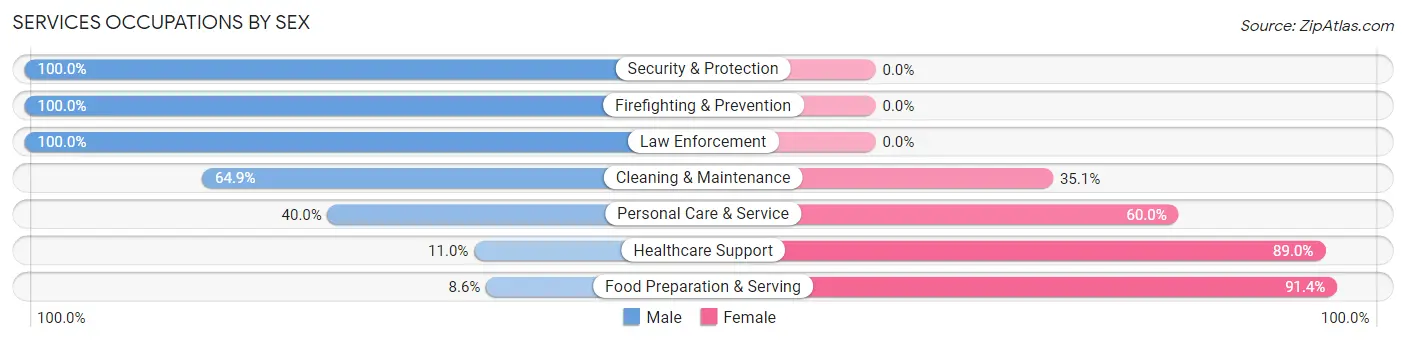
Services Occupations by Sex
Within the Services occupations in Hansford County, the most male-oriented occupations are Security & Protection (100.0%), Firefighting & Prevention (100.0%), and Law Enforcement (100.0%), while the most female-oriented occupations are Food Preparation & Serving (91.4%), Healthcare Support (89.0%), and Personal Care & Service (60.0%).
| Occupation | Male | Female |
| Healthcare Support | 9 (11.0%) | 73 (89.0%) |
| Security & Protection | 66 (100.0%) | 0 (0.0%) |
| Firefighting & Prevention | 21 (100.0%) | 0 (0.0%) |
| Law Enforcement | 45 (100.0%) | 0 (0.0%) |
| Food Preparation & Serving | 11 (8.6%) | 117 (91.4%) |
| Cleaning & Maintenance | 72 (64.9%) | 39 (35.1%) |
| Personal Care & Service | 28 (40.0%) | 42 (60.0%) |
| Total (Category) | 186 (40.7%) | 271 (59.3%) |
| Total (Overall) | 1,377 (56.7%) | 1,053 (43.3%) |
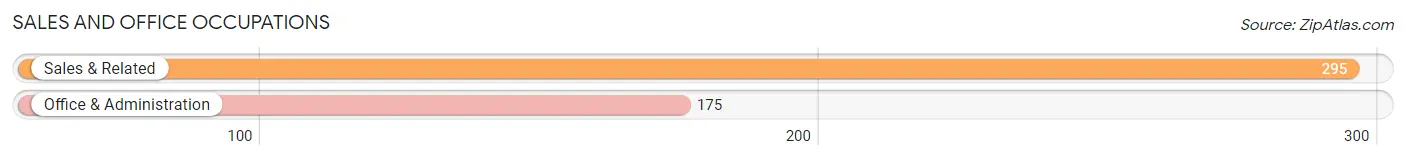
Sales and Office Occupations
The most common Sales and Office occupations in Hansford County are Sales & Related (295 | 12.1%), and Office & Administration (175 | 7.2%).
Sales and Office Occupations by Sex

| Occupation | Male | Female |
| Sales & Related | 101 (34.2%) | 194 (65.8%) |
| Office & Administration | 117 (66.9%) | 58 (33.1%) |
| Total (Category) | 218 (46.4%) | 252 (53.6%) |
| Total (Overall) | 1,377 (56.7%) | 1,053 (43.3%) |
Natural Resources, Construction and Maintenance Occupations
The most common Natural Resources, Construction and Maintenance occupations in Hansford County are Farming, Fishing & Forestry (217 | 8.9%), Installation, Maintenance & Repair (83 | 3.4%), and Construction & Extraction (82 | 3.4%).

Natural Resources, Construction and Maintenance Occupations by Sex
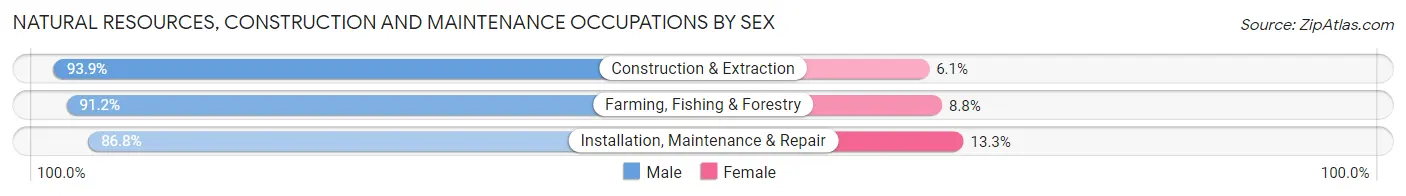
| Occupation | Male | Female |
| Farming, Fishing & Forestry | 198 (91.2%) | 19 (8.8%) |
| Construction & Extraction | 77 (93.9%) | 5 (6.1%) |
| Installation, Maintenance & Repair | 72 (86.8%) | 11 (13.3%) |
| Total (Category) | 347 (90.8%) | 35 (9.2%) |
| Total (Overall) | 1,377 (56.7%) | 1,053 (43.3%) |
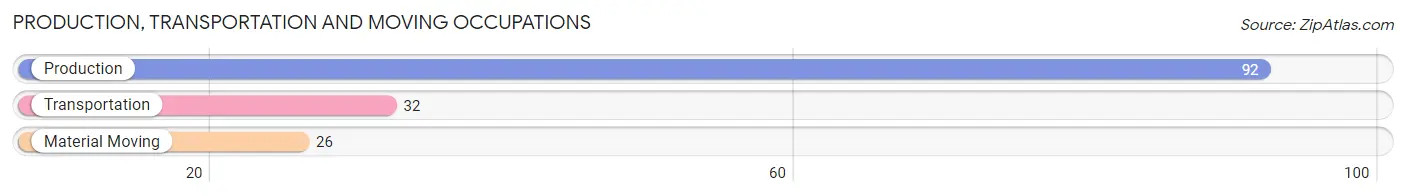
Production, Transportation and Moving Occupations
The most common Production, Transportation and Moving occupations in Hansford County are Production (92 | 3.8%), Transportation (32 | 1.3%), and Material Moving (26 | 1.1%).
Production, Transportation and Moving Occupations by Sex
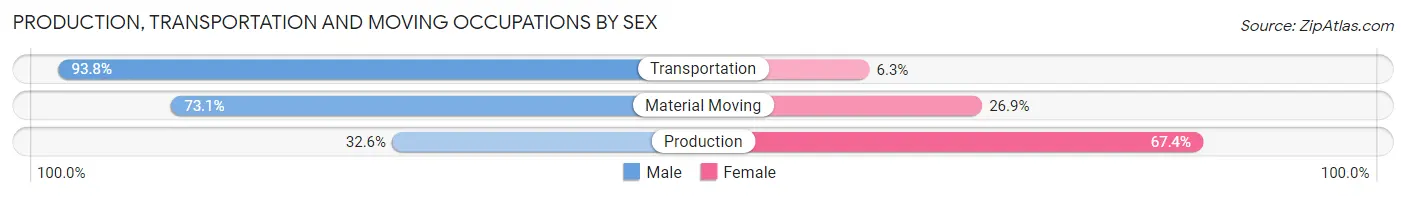
| Occupation | Male | Female |
| Production | 30 (32.6%) | 62 (67.4%) |
| Transportation | 30 (93.8%) | 2 (6.2%) |
| Material Moving | 19 (73.1%) | 7 (26.9%) |
| Total (Category) | 79 (52.7%) | 71 (47.3%) |
| Total (Overall) | 1,377 (56.7%) | 1,053 (43.3%) |
Employment Industries by Sex in Hansford County
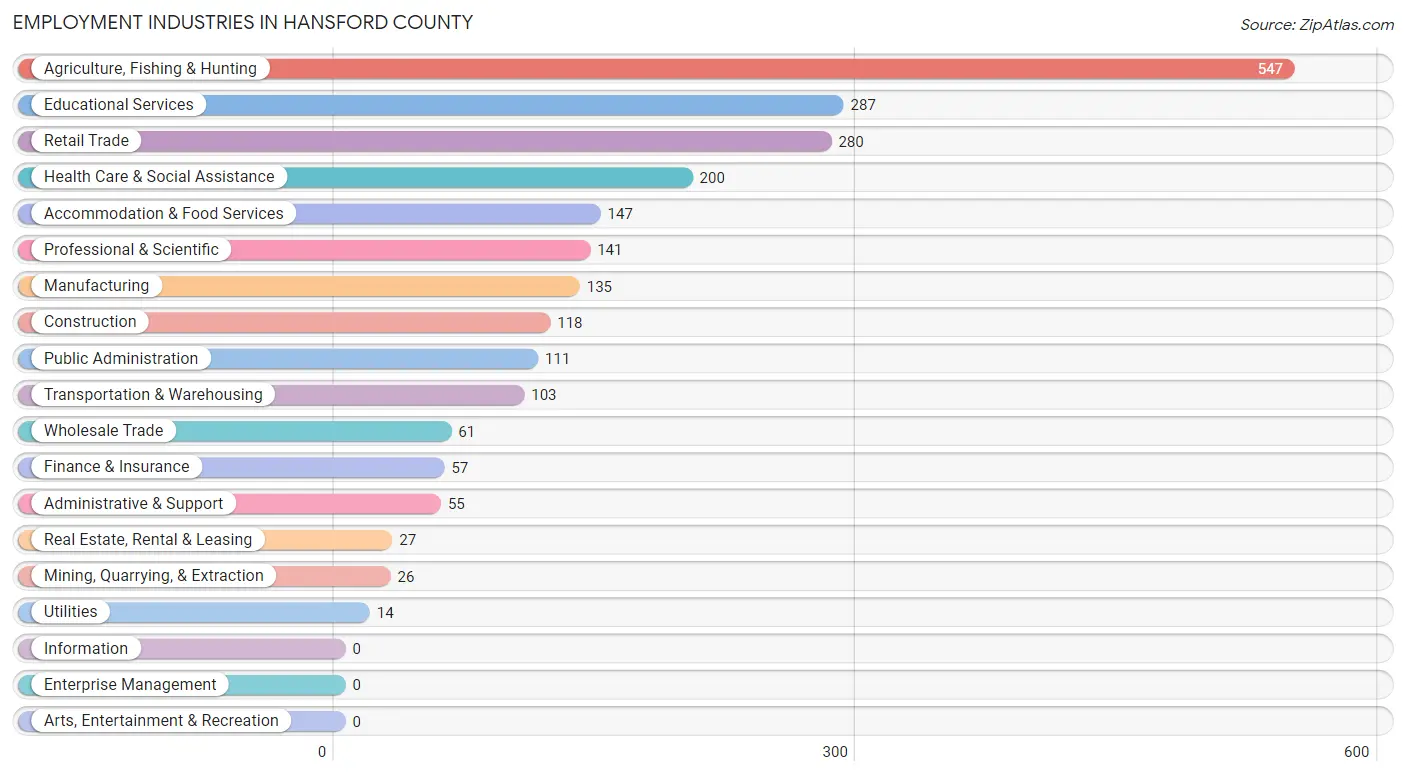
Employment Industries in Hansford County
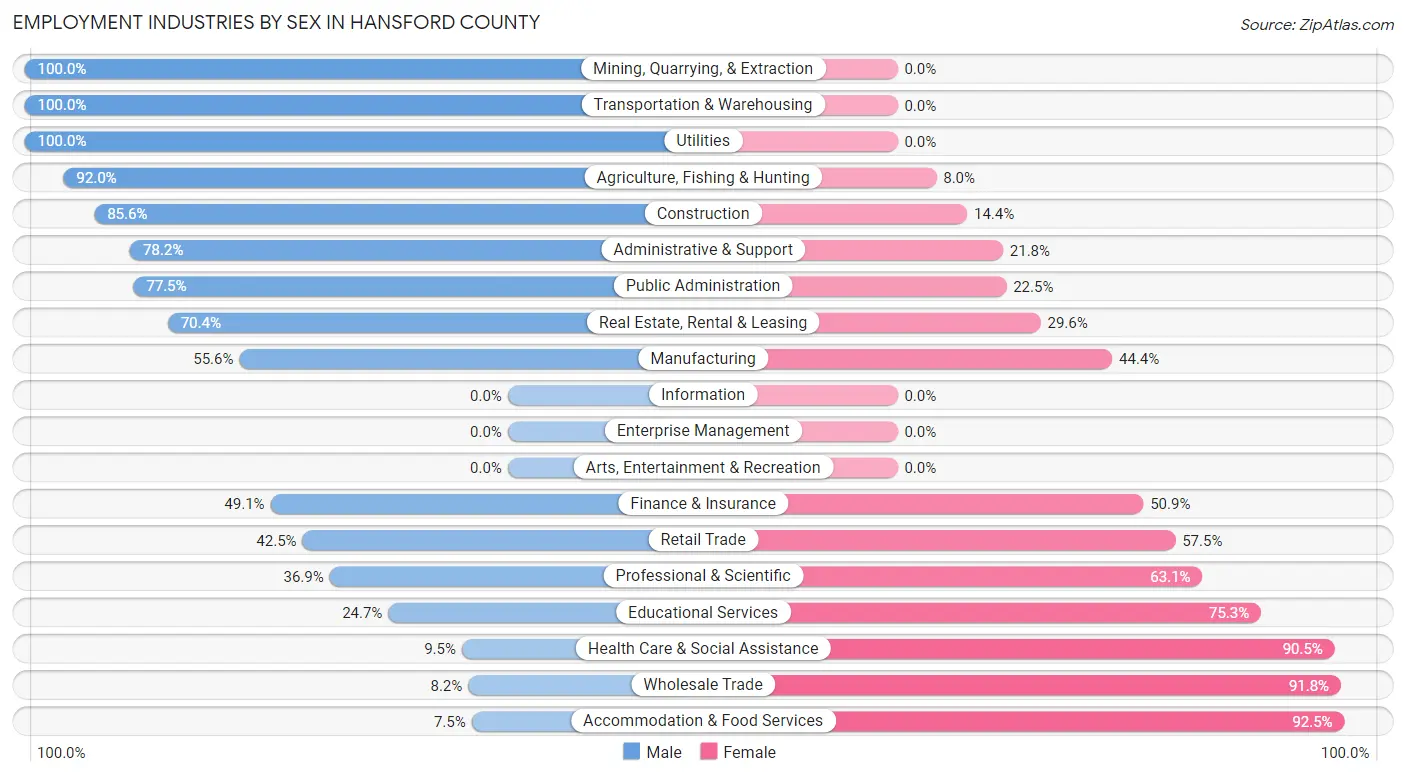
The major employment industries in Hansford County include Agriculture, Fishing & Hunting (547 | 22.5%), Educational Services (287 | 11.8%), Retail Trade (280 | 11.5%), Health Care & Social Assistance (200 | 8.2%), and Accommodation & Food Services (147 | 6.0%).
Employment Industries by Sex in Hansford County
The Hansford County industries that see more men than women are Mining, Quarrying, & Extraction (100.0%), Transportation & Warehousing (100.0%), and Utilities (100.0%), whereas the industries that tend to have a higher number of women are Accommodation & Food Services (92.5%), Wholesale Trade (91.8%), and Health Care & Social Assistance (90.5%).
| Industry | Male | Female |
| Agriculture, Fishing & Hunting | 503 (92.0%) | 44 (8.0%) |
| Mining, Quarrying, & Extraction | 26 (100.0%) | 0 (0.0%) |
| Construction | 101 (85.6%) | 17 (14.4%) |
| Manufacturing | 75 (55.6%) | 60 (44.4%) |
| Wholesale Trade | 5 (8.2%) | 56 (91.8%) |
| Retail Trade | 119 (42.5%) | 161 (57.5%) |
| Transportation & Warehousing | 103 (100.0%) | 0 (0.0%) |
| Utilities | 14 (100.0%) | 0 (0.0%) |
| Information | 0 (0.0%) | 0 (0.0%) |
| Finance & Insurance | 28 (49.1%) | 29 (50.9%) |
| Real Estate, Rental & Leasing | 19 (70.4%) | 8 (29.6%) |
| Professional & Scientific | 52 (36.9%) | 89 (63.1%) |
| Enterprise Management | 0 (0.0%) | 0 (0.0%) |
| Administrative & Support | 43 (78.2%) | 12 (21.8%) |
| Educational Services | 71 (24.7%) | 216 (75.3%) |
| Health Care & Social Assistance | 19 (9.5%) | 181 (90.5%) |
| Arts, Entertainment & Recreation | 0 (0.0%) | 0 (0.0%) |
| Accommodation & Food Services | 11 (7.5%) | 136 (92.5%) |
| Public Administration | 86 (77.5%) | 25 (22.5%) |
| Total | 1,377 (56.7%) | 1,053 (43.3%) |
Education in Hansford County
School Enrollment in Hansford County
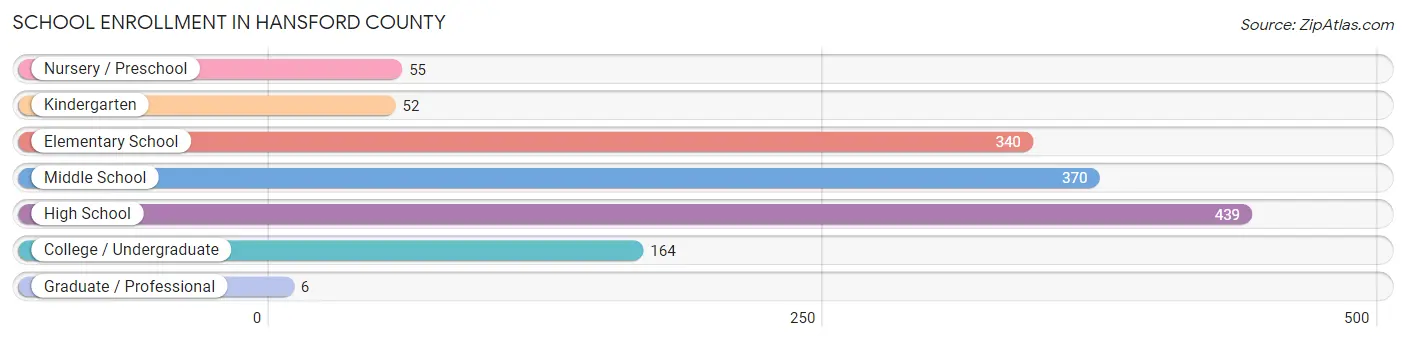
The most common levels of schooling among the 1,426 students in Hansford County are high school (439 | 30.8%), middle school (370 | 26.0%), and elementary school (340 | 23.8%).
| School Level | # Students | % Students |
| Nursery / Preschool | 55 | 3.9% |
| Kindergarten | 52 | 3.6% |
| Elementary School | 340 | 23.8% |
| Middle School | 370 | 26.0% |
| High School | 439 | 30.8% |
| College / Undergraduate | 164 | 11.5% |
| Graduate / Professional | 6 | 0.4% |
| Total | 1,426 | 100.0% |
School Enrollment by Age by Funding Source in Hansford County
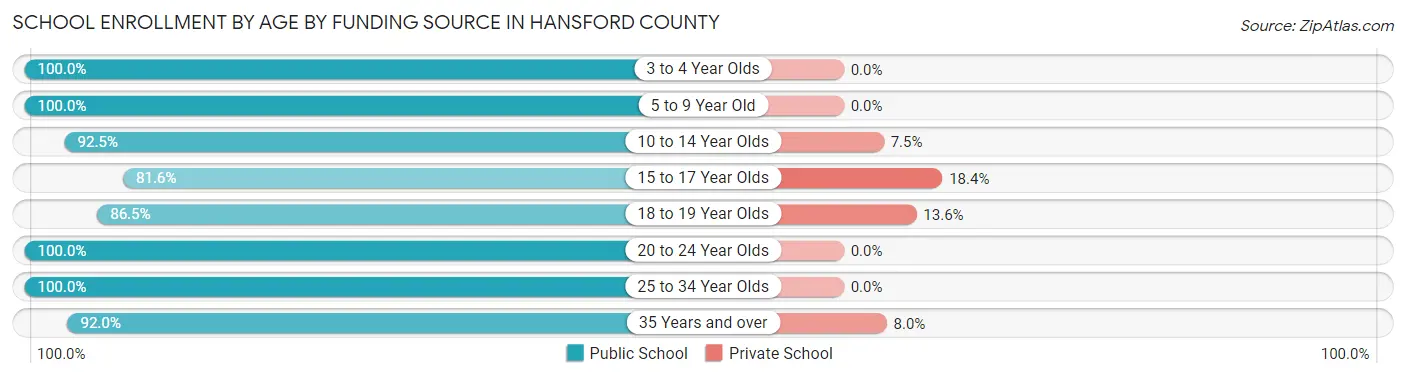
Out of a total of 1,426 students who are enrolled in schools in Hansford County, 108 (7.6%) attend a private institution, while the remaining 1,318 (92.4%) are enrolled in public schools. The age group of 15 to 17 year olds has the highest likelihood of being enrolled in private schools, with 56 (18.4% in the age bracket) enrolled. Conversely, the age group of 3 to 4 year olds has the lowest likelihood of being enrolled in a private school, with 46 (100.0% in the age bracket) attending a public institution.
| Age Bracket | Public School | Private School |
| 3 to 4 Year Olds | 46 (100.0%) | 0 (0.0%) |
| 5 to 9 Year Old | 404 (100.0%) | 0 (0.0%) |
| 10 to 14 Year Olds | 372 (92.5%) | 30 (7.5%) |
| 15 to 17 Year Olds | 249 (81.6%) | 56 (18.4%) |
| 18 to 19 Year Olds | 134 (86.5%) | 21 (13.6%) |
| 20 to 24 Year Olds | 51 (100.0%) | 0 (0.0%) |
| 25 to 34 Year Olds | 38 (100.0%) | 0 (0.0%) |
| 35 Years and over | 23 (92.0%) | 2 (8.0%) |
| Total | 1,318 (92.4%) | 108 (7.6%) |
Educational Attainment by Field of Study in Hansford County
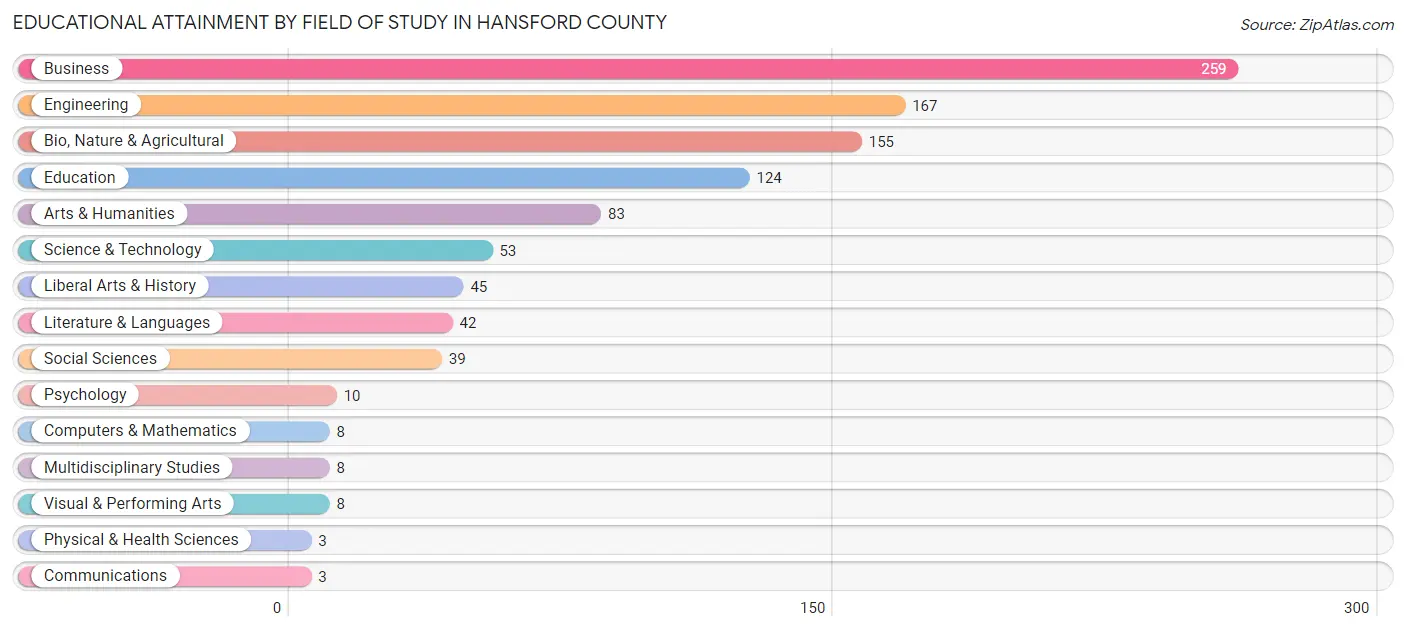
Business (259 | 25.7%), engineering (167 | 16.6%), bio, nature & agricultural (155 | 15.4%), education (124 | 12.3%), and arts & humanities (83 | 8.2%) are the most common fields of study among 1,007 individuals in Hansford County who have obtained a bachelor's degree or higher.
| Field of Study | # Graduates | % Graduates |
| Computers & Mathematics | 8 | 0.8% |
| Bio, Nature & Agricultural | 155 | 15.4% |
| Physical & Health Sciences | 3 | 0.3% |
| Psychology | 10 | 1.0% |
| Social Sciences | 39 | 3.9% |
| Engineering | 167 | 16.6% |
| Multidisciplinary Studies | 8 | 0.8% |
| Science & Technology | 53 | 5.3% |
| Business | 259 | 25.7% |
| Education | 124 | 12.3% |
| Literature & Languages | 42 | 4.2% |
| Liberal Arts & History | 45 | 4.5% |
| Visual & Performing Arts | 8 | 0.8% |
| Communications | 3 | 0.3% |
| Arts & Humanities | 83 | 8.2% |
| Total | 1,007 | 100.0% |
Transportation & Commute in Hansford County
Vehicle Availability by Sex in Hansford County
The most prevalent vehicle ownership categories in Hansford County are males with 2 vehicles (498, accounting for 36.1%) and females with 2 vehicles (267, making up 47.5%).
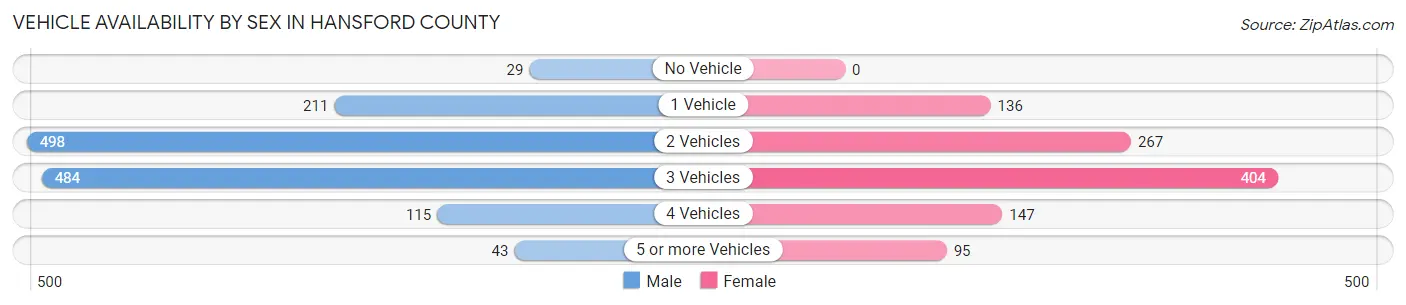
| Vehicles Available | Male | Female |
| No Vehicle | 29 (2.1%) | 0 (0.0%) |
| 1 Vehicle | 211 (15.3%) | 136 (13.0%) |
| 2 Vehicles | 498 (36.1%) | 267 (25.5%) |
| 3 Vehicles | 484 (35.1%) | 404 (38.5%) |
| 4 Vehicles | 115 (8.3%) | 147 (14.0%) |
| 5 or more Vehicles | 43 (3.1%) | 95 (9.1%) |
| Total | 1,380 (100.0%) | 1,049 (100.0%) |
Commute Time in Hansford County
The most frequently occuring commute durations in Hansford County are 5 to 9 minutes (615 commuters, 26.0%), less than 5 minutes (563 commuters, 23.8%), and 15 to 19 minutes (221 commuters, 9.3%).
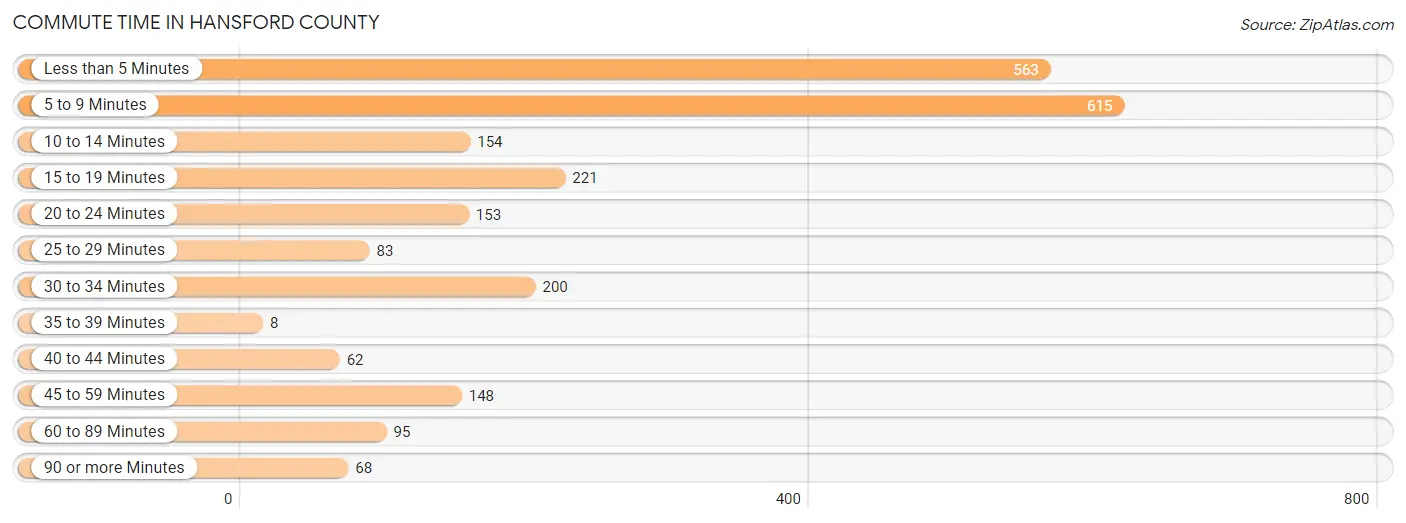
| Commute Time | # Commuters | % Commuters |
| Less than 5 Minutes | 563 | 23.8% |
| 5 to 9 Minutes | 615 | 26.0% |
| 10 to 14 Minutes | 154 | 6.5% |
| 15 to 19 Minutes | 221 | 9.3% |
| 20 to 24 Minutes | 153 | 6.5% |
| 25 to 29 Minutes | 83 | 3.5% |
| 30 to 34 Minutes | 200 | 8.4% |
| 35 to 39 Minutes | 8 | 0.3% |
| 40 to 44 Minutes | 62 | 2.6% |
| 45 to 59 Minutes | 148 | 6.2% |
| 60 to 89 Minutes | 95 | 4.0% |
| 90 or more Minutes | 68 | 2.9% |
Commute Time by Sex in Hansford County
The most common commute times in Hansford County are 5 to 9 minutes (338 commuters, 25.4%) for males and less than 5 minutes (339 commuters, 32.6%) for females.
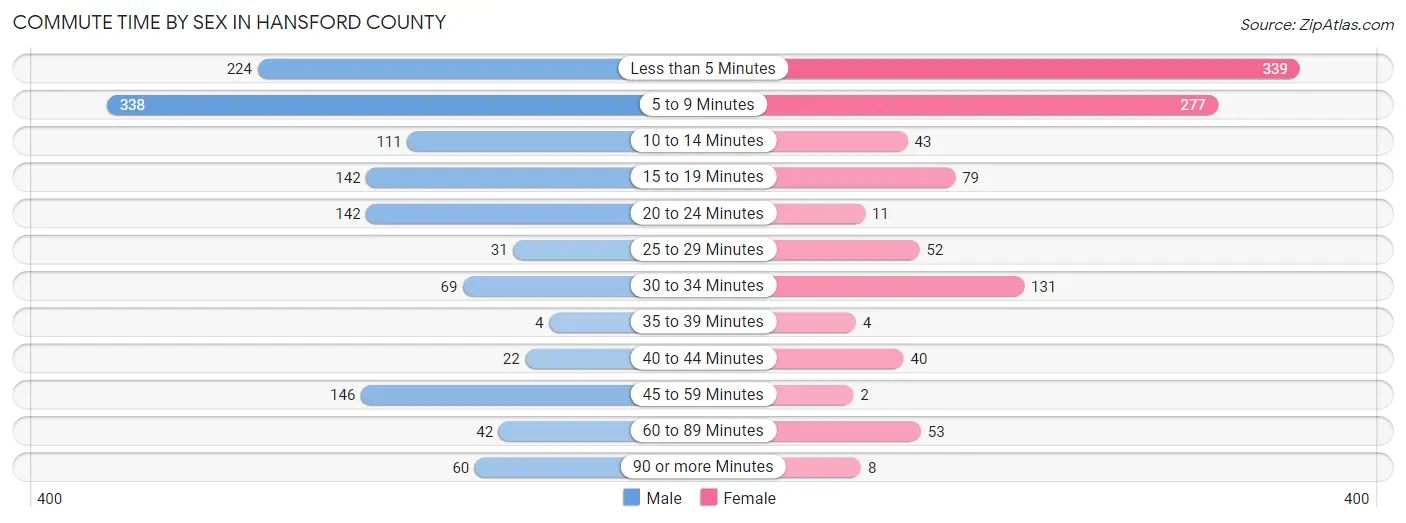
| Commute Time | Male | Female |
| Less than 5 Minutes | 224 (16.8%) | 339 (32.6%) |
| 5 to 9 Minutes | 338 (25.4%) | 277 (26.7%) |
| 10 to 14 Minutes | 111 (8.3%) | 43 (4.1%) |
| 15 to 19 Minutes | 142 (10.7%) | 79 (7.6%) |
| 20 to 24 Minutes | 142 (10.7%) | 11 (1.1%) |
| 25 to 29 Minutes | 31 (2.3%) | 52 (5.0%) |
| 30 to 34 Minutes | 69 (5.2%) | 131 (12.6%) |
| 35 to 39 Minutes | 4 (0.3%) | 4 (0.4%) |
| 40 to 44 Minutes | 22 (1.7%) | 40 (3.8%) |
| 45 to 59 Minutes | 146 (11.0%) | 2 (0.2%) |
| 60 to 89 Minutes | 42 (3.2%) | 53 (5.1%) |
| 90 or more Minutes | 60 (4.5%) | 8 (0.8%) |
Time of Departure to Work by Sex in Hansford County
The most frequent times of departure to work in Hansford County are 7:00 AM to 7:29 AM (360, 27.1%) for males and 7:30 AM to 7:59 AM (241, 23.2%) for females.
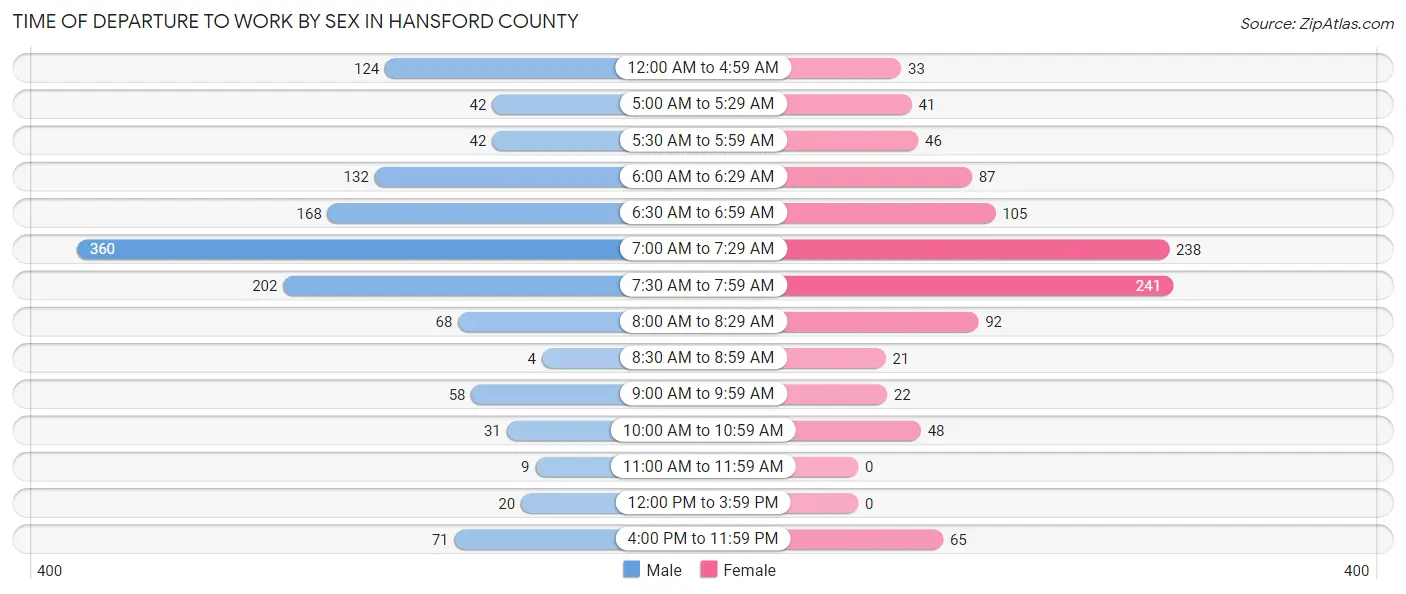
| Time of Departure | Male | Female |
| 12:00 AM to 4:59 AM | 124 (9.3%) | 33 (3.2%) |
| 5:00 AM to 5:29 AM | 42 (3.2%) | 41 (4.0%) |
| 5:30 AM to 5:59 AM | 42 (3.2%) | 46 (4.4%) |
| 6:00 AM to 6:29 AM | 132 (9.9%) | 87 (8.4%) |
| 6:30 AM to 6:59 AM | 168 (12.6%) | 105 (10.1%) |
| 7:00 AM to 7:29 AM | 360 (27.1%) | 238 (22.9%) |
| 7:30 AM to 7:59 AM | 202 (15.2%) | 241 (23.2%) |
| 8:00 AM to 8:29 AM | 68 (5.1%) | 92 (8.8%) |
| 8:30 AM to 8:59 AM | 4 (0.3%) | 21 (2.0%) |
| 9:00 AM to 9:59 AM | 58 (4.4%) | 22 (2.1%) |
| 10:00 AM to 10:59 AM | 31 (2.3%) | 48 (4.6%) |
| 11:00 AM to 11:59 AM | 9 (0.7%) | 0 (0.0%) |
| 12:00 PM to 3:59 PM | 20 (1.5%) | 0 (0.0%) |
| 4:00 PM to 11:59 PM | 71 (5.3%) | 65 (6.3%) |
| Total | 1,331 (100.0%) | 1,039 (100.0%) |
Housing Occupancy in Hansford County
Occupancy by Ownership in Hansford County
Of the total 1,763 dwellings in Hansford County, owner-occupied units account for 1,329 (75.4%), while renter-occupied units make up 434 (24.6%).
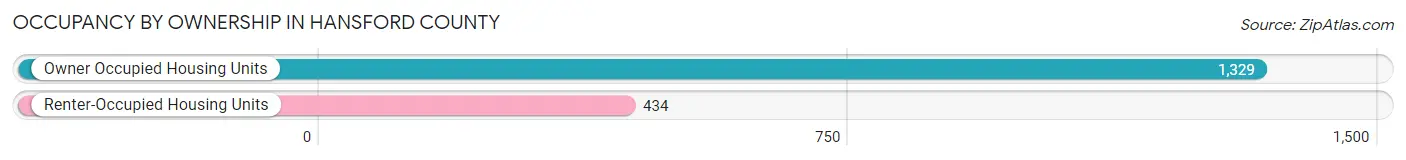
| Occupancy | # Housing Units | % Housing Units |
| Owner Occupied Housing Units | 1,329 | 75.4% |
| Renter-Occupied Housing Units | 434 | 24.6% |
| Total Occupied Housing Units | 1,763 | 100.0% |
Occupancy by Household Size in Hansford County
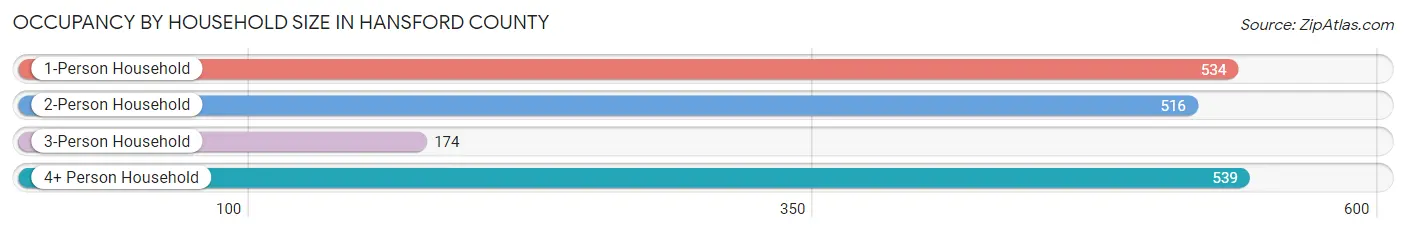
| Household Size | # Housing Units | % Housing Units |
| 1-Person Household | 534 | 30.3% |
| 2-Person Household | 516 | 29.3% |
| 3-Person Household | 174 | 9.9% |
| 4+ Person Household | 539 | 30.6% |
| Total Housing Units | 1,763 | 100.0% |
Occupancy by Ownership by Household Size in Hansford County
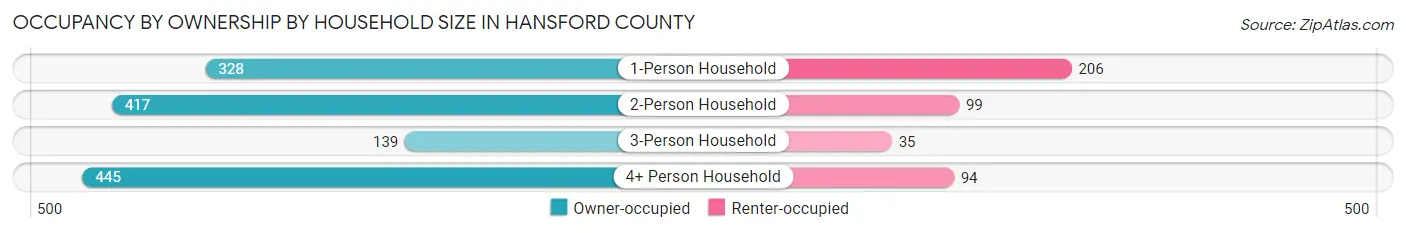
| Household Size | Owner-occupied | Renter-occupied |
| 1-Person Household | 328 (61.4%) | 206 (38.6%) |
| 2-Person Household | 417 (80.8%) | 99 (19.2%) |
| 3-Person Household | 139 (79.9%) | 35 (20.1%) |
| 4+ Person Household | 445 (82.6%) | 94 (17.4%) |
| Total Housing Units | 1,329 (75.4%) | 434 (24.6%) |
Occupancy by Educational Attainment in Hansford County
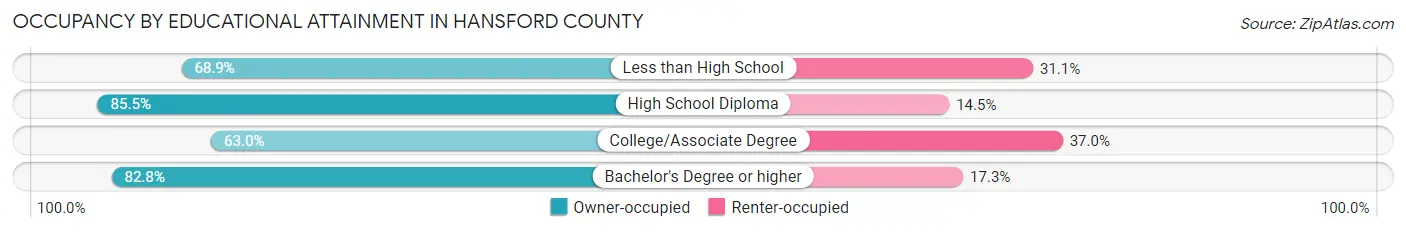
| Household Size | Owner-occupied | Renter-occupied |
| Less than High School | 319 (68.9%) | 144 (31.1%) |
| High School Diploma | 360 (85.5%) | 61 (14.5%) |
| College/Associate Degree | 247 (63.0%) | 145 (37.0%) |
| Bachelor's Degree or higher | 403 (82.8%) | 84 (17.2%) |
Occupancy by Age of Householder in Hansford County
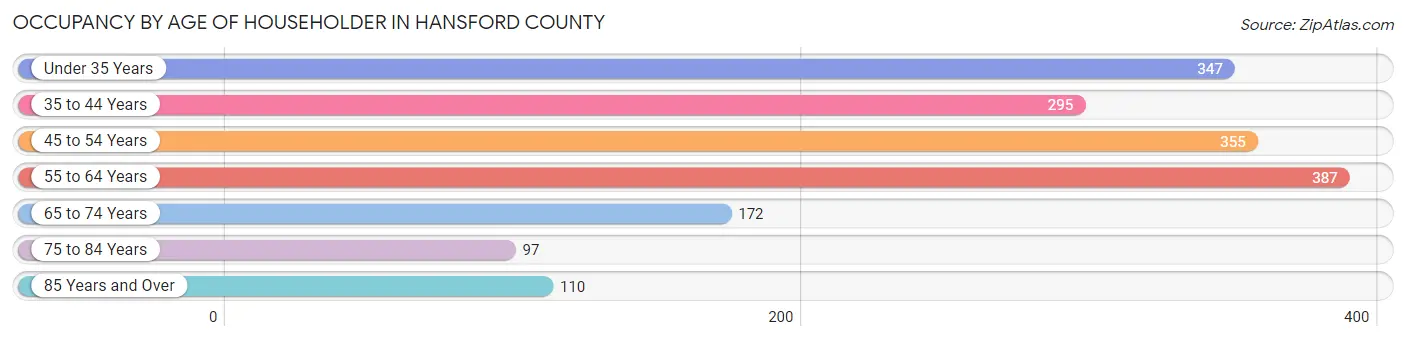
| Age Bracket | # Households | % Households |
| Under 35 Years | 347 | 19.7% |
| 35 to 44 Years | 295 | 16.7% |
| 45 to 54 Years | 355 | 20.1% |
| 55 to 64 Years | 387 | 22.0% |
| 65 to 74 Years | 172 | 9.8% |
| 75 to 84 Years | 97 | 5.5% |
| 85 Years and Over | 110 | 6.2% |
| Total | 1,763 | 100.0% |
Housing Finances in Hansford County
Median Income by Occupancy in Hansford County
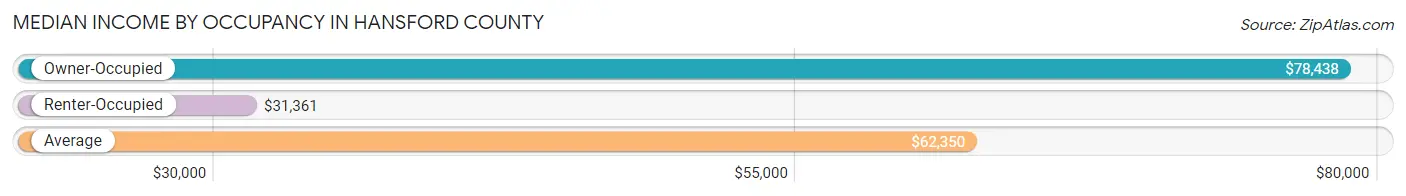
| Occupancy Type | # Households | Median Income |
| Owner-Occupied | 1,329 (75.4%) | $78,438 |
| Renter-Occupied | 434 (24.6%) | $31,361 |
| Average | 1,763 (100.0%) | $62,350 |
Occupancy by Householder Income Bracket in Hansford County
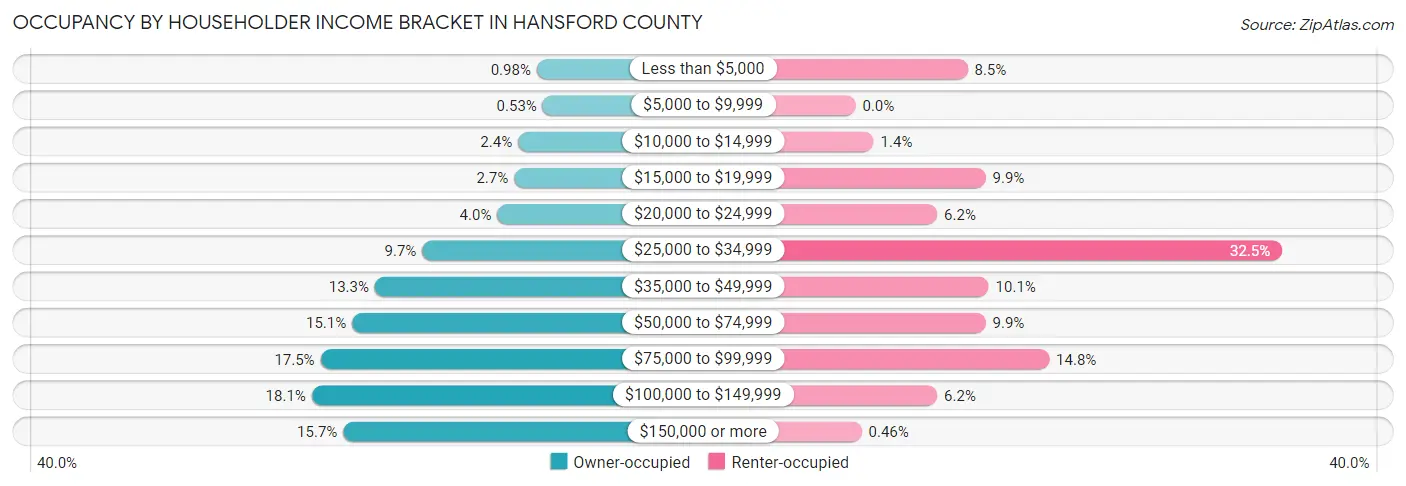
| Income Bracket | Owner-occupied | Renter-occupied |
| Less than $5,000 | 13 (1.0%) | 37 (8.5%) |
| $5,000 to $9,999 | 7 (0.5%) | 0 (0.0%) |
| $10,000 to $14,999 | 32 (2.4%) | 6 (1.4%) |
| $15,000 to $19,999 | 36 (2.7%) | 43 (9.9%) |
| $20,000 to $24,999 | 53 (4.0%) | 27 (6.2%) |
| $25,000 to $34,999 | 129 (9.7%) | 141 (32.5%) |
| $35,000 to $49,999 | 177 (13.3%) | 44 (10.1%) |
| $50,000 to $74,999 | 200 (15.0%) | 43 (9.9%) |
| $75,000 to $99,999 | 232 (17.5%) | 64 (14.7%) |
| $100,000 to $149,999 | 241 (18.1%) | 27 (6.2%) |
| $150,000 or more | 209 (15.7%) | 2 (0.5%) |
| Total | 1,329 (100.0%) | 434 (100.0%) |
Monthly Housing Cost Tiers in Hansford County
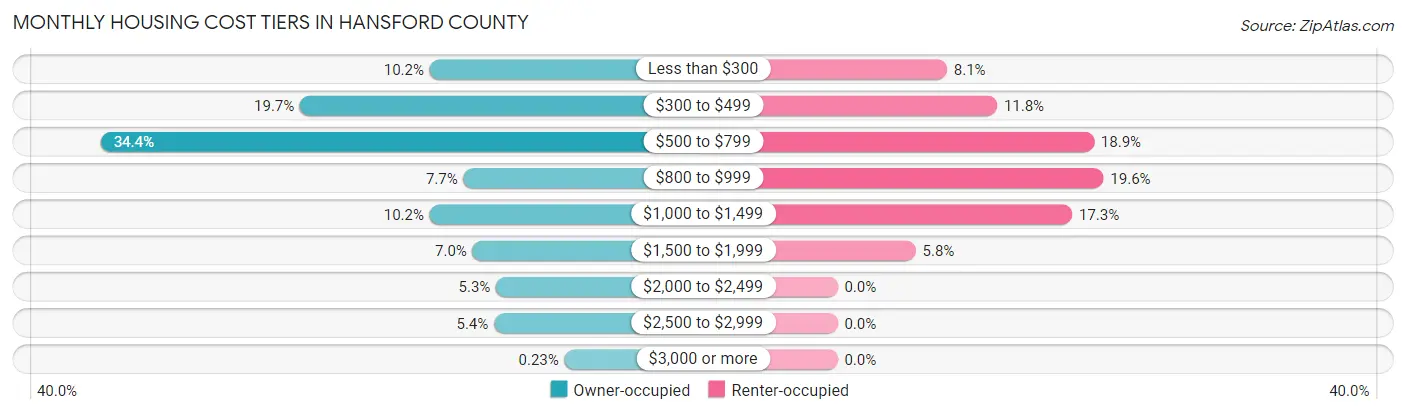
| Monthly Cost | Owner-occupied | Renter-occupied |
| Less than $300 | 135 (10.2%) | 35 (8.1%) |
| $300 to $499 | 262 (19.7%) | 51 (11.7%) |
| $500 to $799 | 457 (34.4%) | 82 (18.9%) |
| $800 to $999 | 102 (7.7%) | 85 (19.6%) |
| $1,000 to $1,499 | 135 (10.2%) | 75 (17.3%) |
| $1,500 to $1,999 | 93 (7.0%) | 25 (5.8%) |
| $2,000 to $2,499 | 70 (5.3%) | 0 (0.0%) |
| $2,500 to $2,999 | 72 (5.4%) | 0 (0.0%) |
| $3,000 or more | 3 (0.2%) | 0 (0.0%) |
| Total | 1,329 (100.0%) | 434 (100.0%) |
Physical Housing Characteristics in Hansford County
Housing Structures in Hansford County
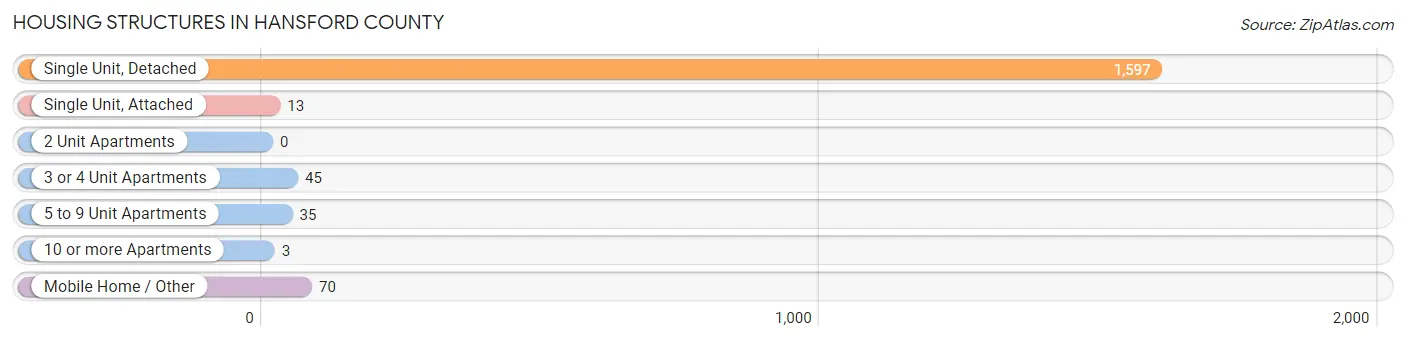
| Structure Type | # Housing Units | % Housing Units |
| Single Unit, Detached | 1,597 | 90.6% |
| Single Unit, Attached | 13 | 0.7% |
| 2 Unit Apartments | 0 | 0.0% |
| 3 or 4 Unit Apartments | 45 | 2.5% |
| 5 to 9 Unit Apartments | 35 | 2.0% |
| 10 or more Apartments | 3 | 0.2% |
| Mobile Home / Other | 70 | 4.0% |
| Total | 1,763 | 100.0% |
Housing Structures by Occupancy in Hansford County
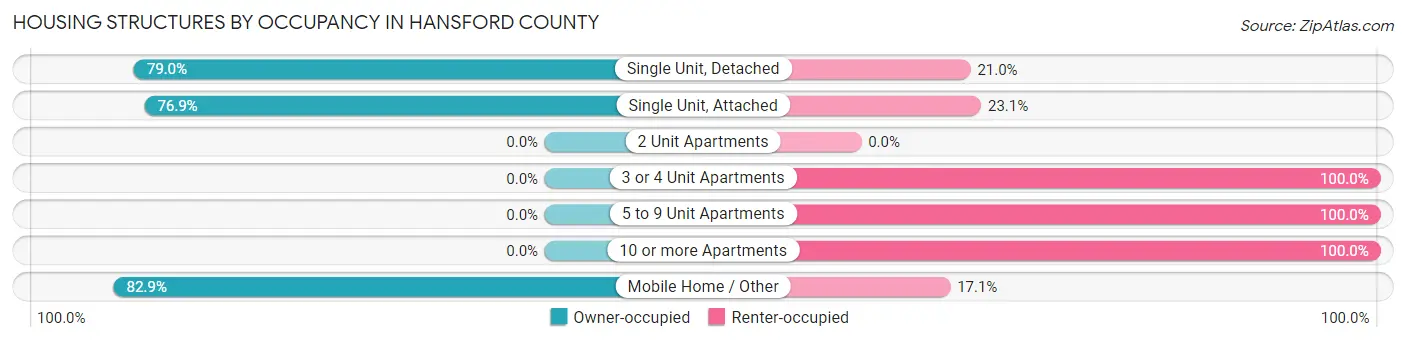
| Structure Type | Owner-occupied | Renter-occupied |
| Single Unit, Detached | 1,261 (79.0%) | 336 (21.0%) |
| Single Unit, Attached | 10 (76.9%) | 3 (23.1%) |
| 2 Unit Apartments | 0 (0.0%) | 0 (0.0%) |
| 3 or 4 Unit Apartments | 0 (0.0%) | 45 (100.0%) |
| 5 to 9 Unit Apartments | 0 (0.0%) | 35 (100.0%) |
| 10 or more Apartments | 0 (0.0%) | 3 (100.0%) |
| Mobile Home / Other | 58 (82.9%) | 12 (17.1%) |
| Total | 1,329 (75.4%) | 434 (24.6%) |
Housing Structures by Number of Rooms in Hansford County
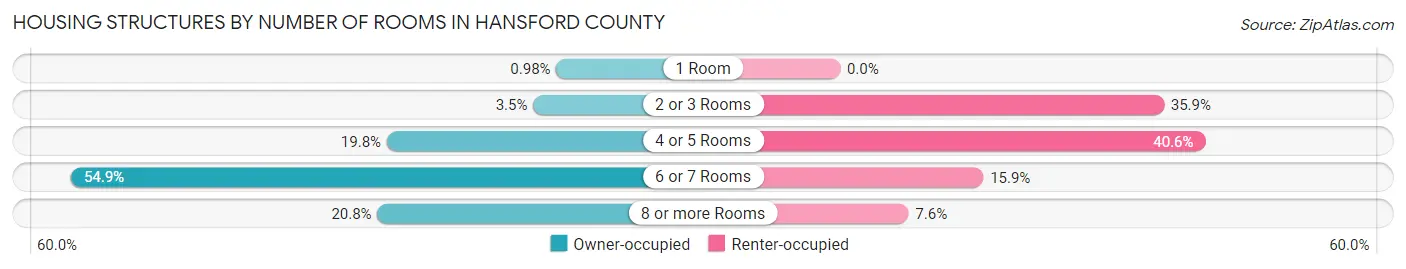
| Number of Rooms | Owner-occupied | Renter-occupied |
| 1 Room | 13 (1.0%) | 0 (0.0%) |
| 2 or 3 Rooms | 47 (3.5%) | 156 (35.9%) |
| 4 or 5 Rooms | 263 (19.8%) | 176 (40.6%) |
| 6 or 7 Rooms | 729 (54.8%) | 69 (15.9%) |
| 8 or more Rooms | 277 (20.8%) | 33 (7.6%) |
| Total | 1,329 (100.0%) | 434 (100.0%) |
Housing Structure by Heating Type in Hansford County
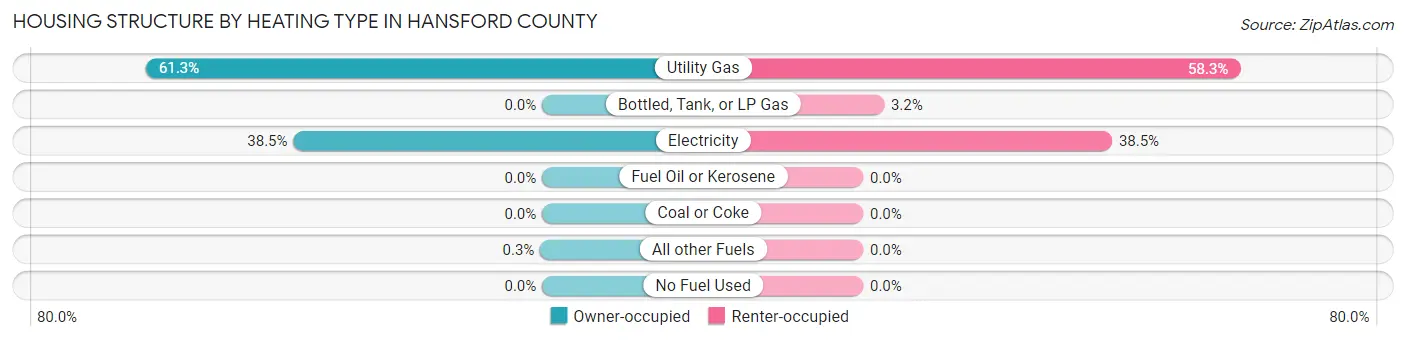
| Heating Type | Owner-occupied | Renter-occupied |
| Utility Gas | 814 (61.3%) | 253 (58.3%) |
| Bottled, Tank, or LP Gas | 0 (0.0%) | 14 (3.2%) |
| Electricity | 511 (38.5%) | 167 (38.5%) |
| Fuel Oil or Kerosene | 0 (0.0%) | 0 (0.0%) |
| Coal or Coke | 0 (0.0%) | 0 (0.0%) |
| All other Fuels | 4 (0.3%) | 0 (0.0%) |
| No Fuel Used | 0 (0.0%) | 0 (0.0%) |
| Total | 1,329 (100.0%) | 434 (100.0%) |
Household Vehicle Usage in Hansford County
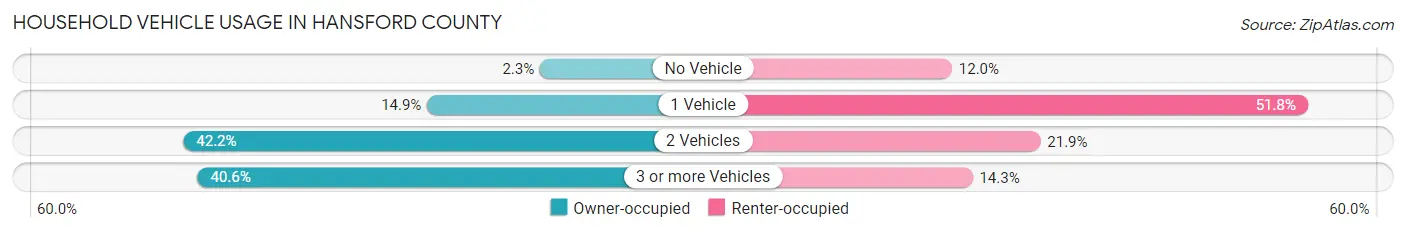
| Vehicles per Household | Owner-occupied | Renter-occupied |
| No Vehicle | 30 (2.3%) | 52 (12.0%) |
| 1 Vehicle | 198 (14.9%) | 225 (51.8%) |
| 2 Vehicles | 561 (42.2%) | 95 (21.9%) |
| 3 or more Vehicles | 540 (40.6%) | 62 (14.3%) |
| Total | 1,329 (100.0%) | 434 (100.0%) |
Real Estate & Mortgages in Hansford County
Real Estate and Mortgage Overview in Hansford County
| Characteristic | Without Mortgage | With Mortgage |
| Housing Units | 869 | 460 |
| Median Property Value | $88,100 | $188,100 |
| Median Household Income | $64,228 | $39 |
| Monthly Housing Costs | $517 | $3 |
| Real Estate Taxes | $1,662 | $17 |
Property Value by Mortgage Status in Hansford County
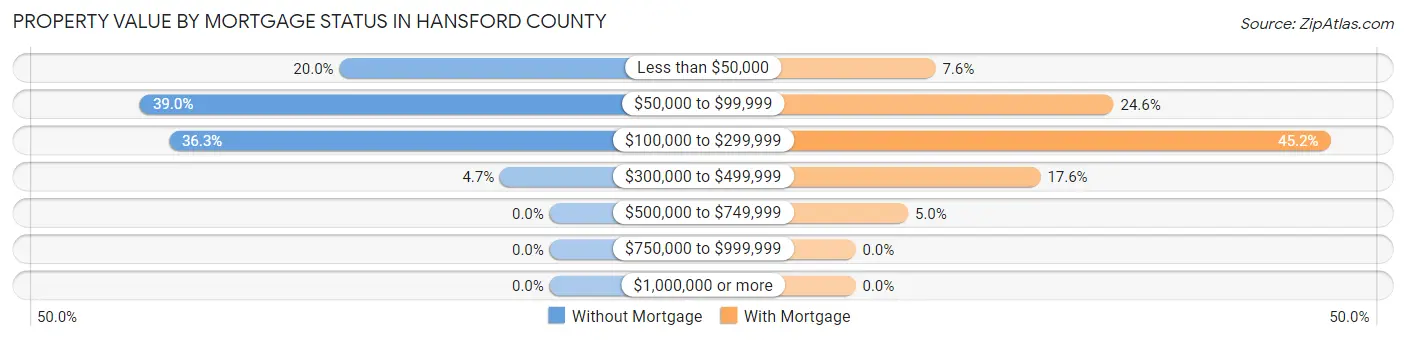
| Property Value | Without Mortgage | With Mortgage |
| Less than $50,000 | 174 (20.0%) | 35 (7.6%) |
| $50,000 to $99,999 | 339 (39.0%) | 113 (24.6%) |
| $100,000 to $299,999 | 315 (36.2%) | 208 (45.2%) |
| $300,000 to $499,999 | 41 (4.7%) | 81 (17.6%) |
| $500,000 to $749,999 | 0 (0.0%) | 23 (5.0%) |
| $750,000 to $999,999 | 0 (0.0%) | 0 (0.0%) |
| $1,000,000 or more | 0 (0.0%) | 0 (0.0%) |
| Total | 869 (100.0%) | 460 (100.0%) |
Household Income by Mortgage Status in Hansford County
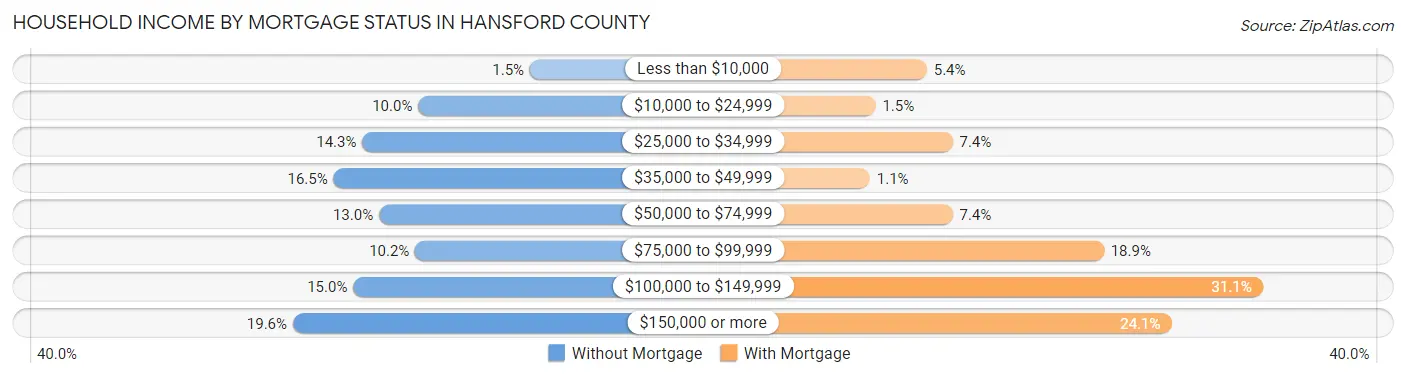
| Household Income | Without Mortgage | With Mortgage |
| Less than $10,000 | 13 (1.5%) | 25 (5.4%) |
| $10,000 to $24,999 | 87 (10.0%) | 7 (1.5%) |
| $25,000 to $34,999 | 124 (14.3%) | 34 (7.4%) |
| $35,000 to $49,999 | 143 (16.5%) | 5 (1.1%) |
| $50,000 to $74,999 | 113 (13.0%) | 34 (7.4%) |
| $75,000 to $99,999 | 89 (10.2%) | 87 (18.9%) |
| $100,000 to $149,999 | 130 (15.0%) | 143 (31.1%) |
| $150,000 or more | 170 (19.6%) | 111 (24.1%) |
| Total | 869 (100.0%) | 460 (100.0%) |
Property Value to Household Income Ratio in Hansford County
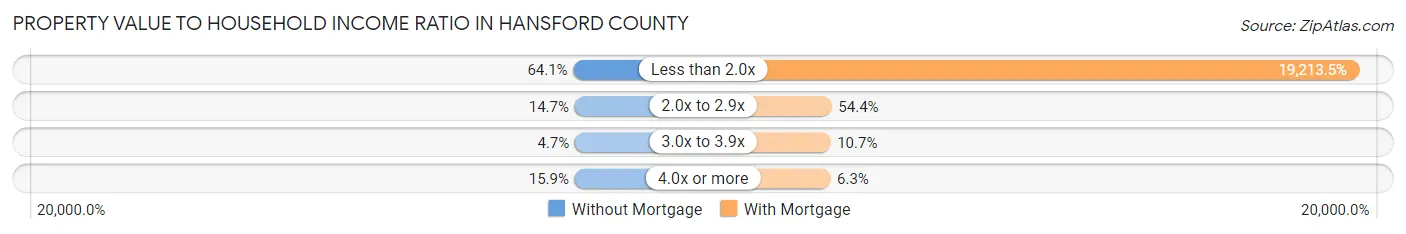
| Value-to-Income Ratio | Without Mortgage | With Mortgage |
| Less than 2.0x | 557 (64.1%) | 88,382 (19,213.5%) |
| 2.0x to 2.9x | 128 (14.7%) | 250 (54.3%) |
| 3.0x to 3.9x | 41 (4.7%) | 49 (10.6%) |
| 4.0x or more | 138 (15.9%) | 29 (6.3%) |
| Total | 869 (100.0%) | 460 (100.0%) |
Real Estate Taxes by Mortgage Status in Hansford County
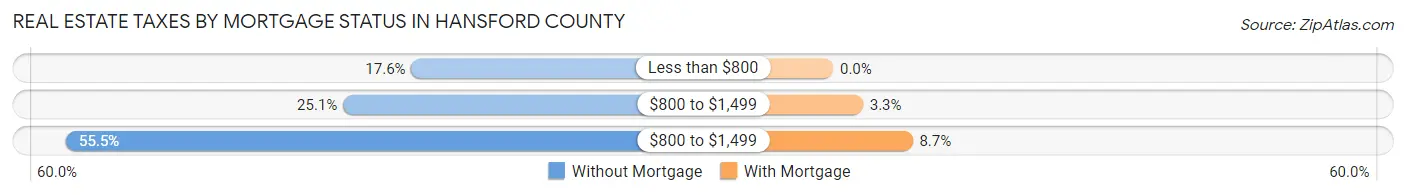
| Property Taxes | Without Mortgage | With Mortgage |
| Less than $800 | 153 (17.6%) | 0 (0.0%) |
| $800 to $1,499 | 218 (25.1%) | 15 (3.3%) |
| $800 to $1,499 | 482 (55.5%) | 40 (8.7%) |
| Total | 869 (100.0%) | 460 (100.0%) |
Health & Disability in Hansford County
Health Insurance Coverage by Age in Hansford County
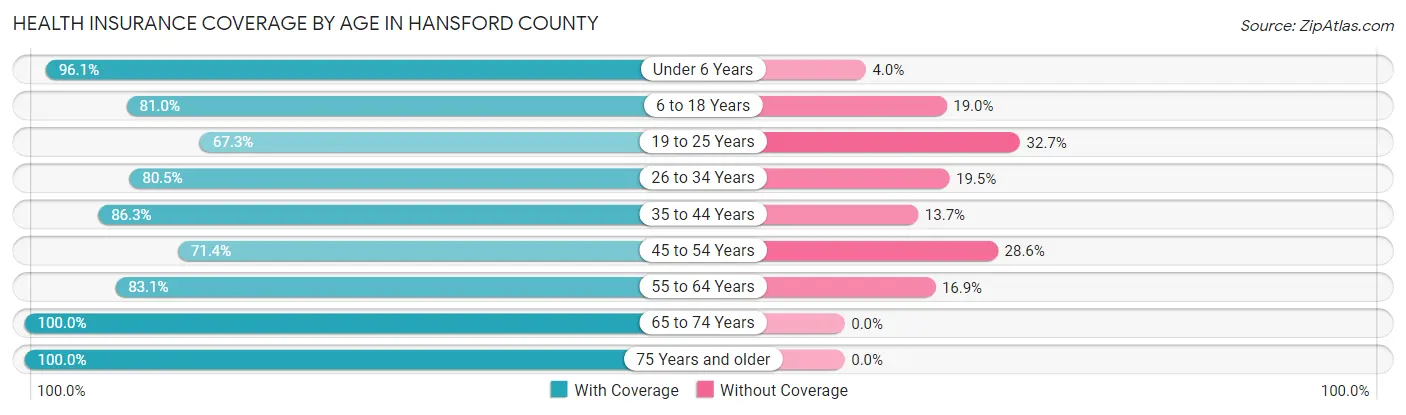
| Age Bracket | With Coverage | Without Coverage |
| Under 6 Years | 413 (96.1%) | 17 (4.0%) |
| 6 to 18 Years | 962 (81.0%) | 226 (19.0%) |
| 19 to 25 Years | 321 (67.3%) | 156 (32.7%) |
| 26 to 34 Years | 482 (80.5%) | 117 (19.5%) |
| 35 to 44 Years | 440 (86.3%) | 70 (13.7%) |
| 45 to 54 Years | 447 (71.4%) | 179 (28.6%) |
| 55 to 64 Years | 590 (83.1%) | 120 (16.9%) |
| 65 to 74 Years | 376 (100.0%) | 0 (0.0%) |
| 75 Years and older | 275 (100.0%) | 0 (0.0%) |
| Total | 4,306 (83.0%) | 885 (17.1%) |
Health Insurance Coverage by Citizenship Status in Hansford County
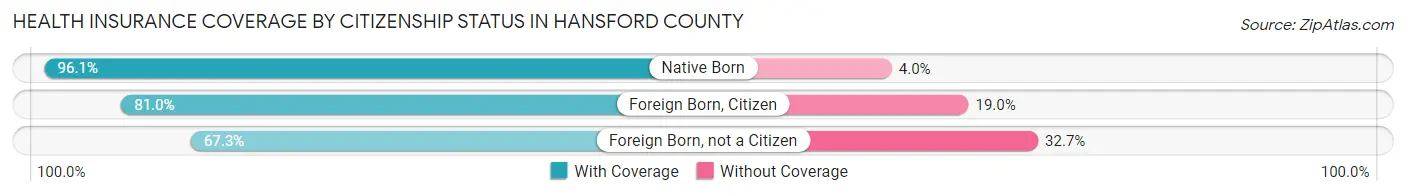
| Citizenship Status | With Coverage | Without Coverage |
| Native Born | 413 (96.1%) | 17 (4.0%) |
| Foreign Born, Citizen | 962 (81.0%) | 226 (19.0%) |
| Foreign Born, not a Citizen | 321 (67.3%) | 156 (32.7%) |
Health Insurance Coverage by Household Income in Hansford County
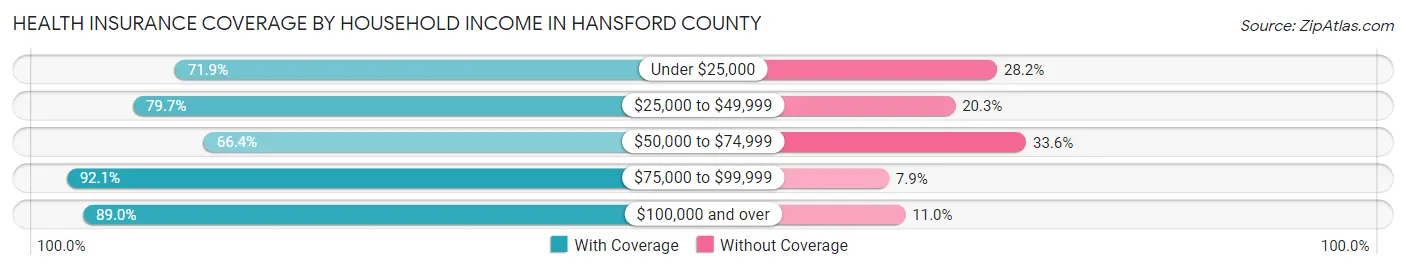
| Household Income | With Coverage | Without Coverage |
| Under $25,000 | 268 (71.9%) | 105 (28.1%) |
| $25,000 to $49,999 | 989 (79.7%) | 252 (20.3%) |
| $50,000 to $74,999 | 520 (66.4%) | 263 (33.6%) |
| $75,000 to $99,999 | 1,238 (92.1%) | 106 (7.9%) |
| $100,000 and over | 1,291 (89.0%) | 159 (11.0%) |
Public vs Private Health Insurance Coverage by Age in Hansford County
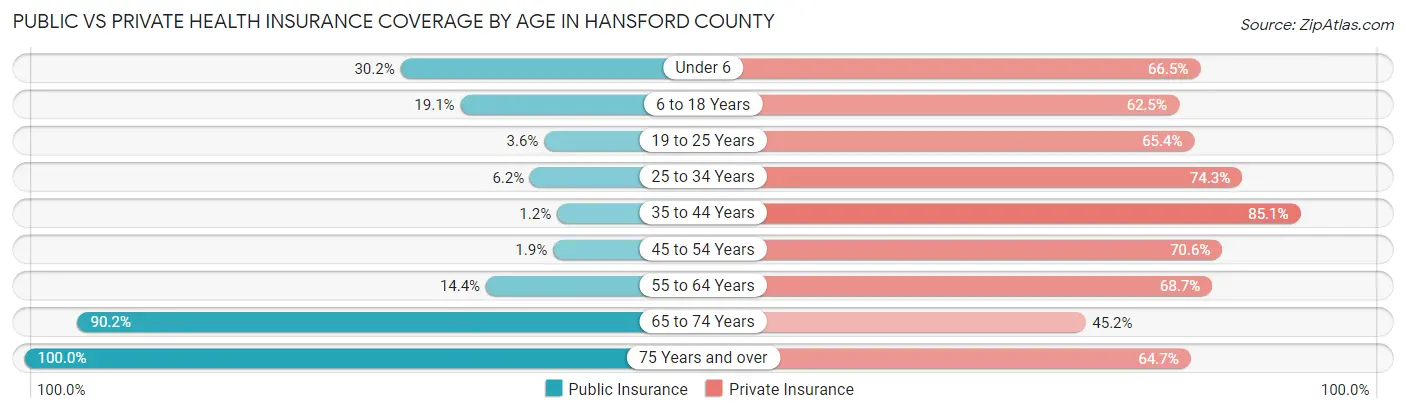
| Age Bracket | Public Insurance | Private Insurance |
| Under 6 | 130 (30.2%) | 286 (66.5%) |
| 6 to 18 Years | 227 (19.1%) | 743 (62.5%) |
| 19 to 25 Years | 17 (3.6%) | 312 (65.4%) |
| 25 to 34 Years | 37 (6.2%) | 445 (74.3%) |
| 35 to 44 Years | 6 (1.2%) | 434 (85.1%) |
| 45 to 54 Years | 12 (1.9%) | 442 (70.6%) |
| 55 to 64 Years | 102 (14.4%) | 488 (68.7%) |
| 65 to 74 Years | 339 (90.2%) | 170 (45.2%) |
| 75 Years and over | 275 (100.0%) | 178 (64.7%) |
| Total | 1,145 (22.1%) | 3,498 (67.4%) |
Disability Status by Sex by Age in Hansford County
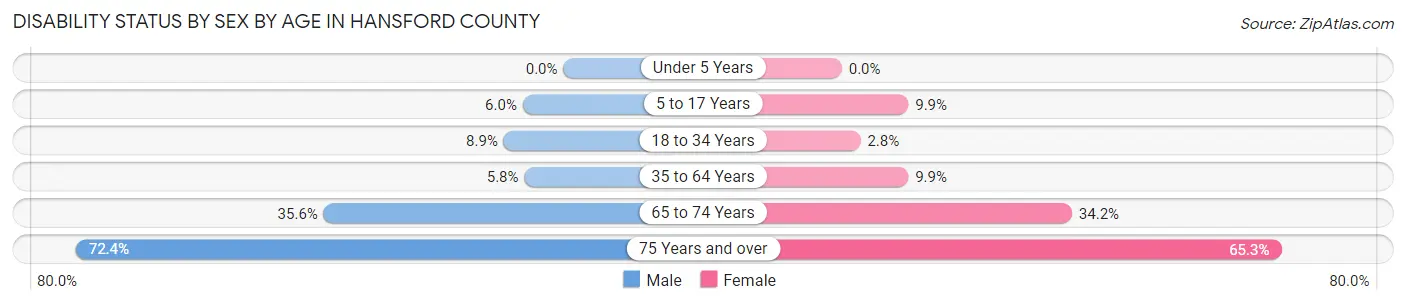
| Age Bracket | Male | Female |
| Under 5 Years | 0 (0.0%) | 0 (0.0%) |
| 5 to 17 Years | 41 (6.0%) | 45 (9.9%) |
| 18 to 34 Years | 53 (8.8%) | 16 (2.8%) |
| 35 to 64 Years | 57 (5.8%) | 85 (9.9%) |
| 65 to 74 Years | 63 (35.6%) | 68 (34.2%) |
| 75 Years and over | 97 (72.4%) | 92 (65.2%) |
Disability Class by Sex by Age in Hansford County
Disability Class: Hearing Difficulty
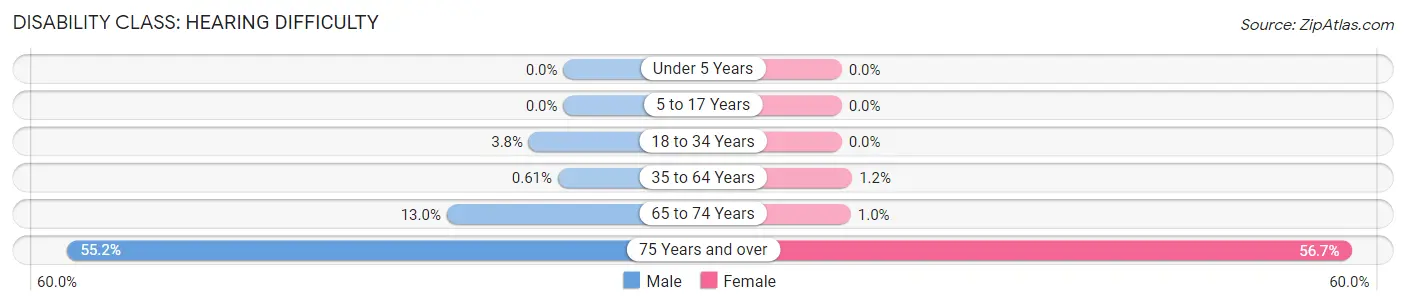
| Age Bracket | Male | Female |
| Under 5 Years | 0 (0.0%) | 0 (0.0%) |
| 5 to 17 Years | 0 (0.0%) | 0 (0.0%) |
| 18 to 34 Years | 23 (3.8%) | 0 (0.0%) |
| 35 to 64 Years | 6 (0.6%) | 10 (1.2%) |
| 65 to 74 Years | 23 (13.0%) | 2 (1.0%) |
| 75 Years and over | 74 (55.2%) | 80 (56.7%) |
Disability Class: Vision Difficulty
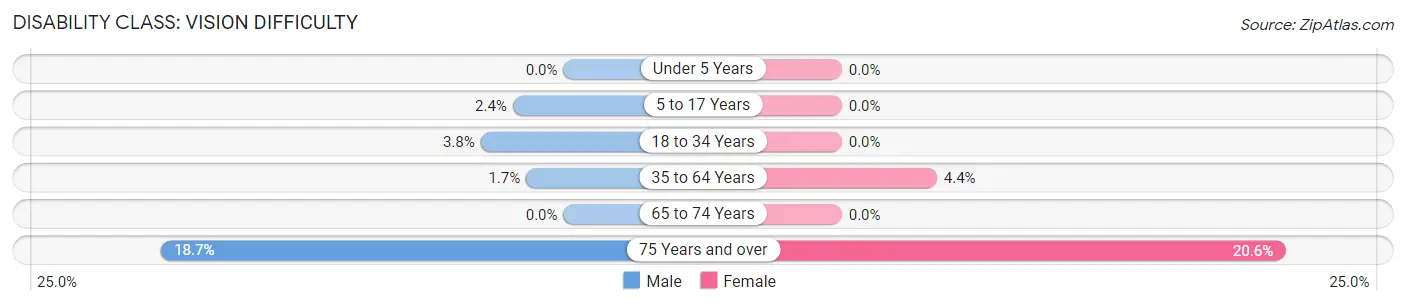
| Age Bracket | Male | Female |
| Under 5 Years | 0 (0.0%) | 0 (0.0%) |
| 5 to 17 Years | 16 (2.4%) | 0 (0.0%) |
| 18 to 34 Years | 23 (3.8%) | 0 (0.0%) |
| 35 to 64 Years | 17 (1.7%) | 38 (4.4%) |
| 65 to 74 Years | 0 (0.0%) | 0 (0.0%) |
| 75 Years and over | 25 (18.7%) | 29 (20.6%) |
Disability Class: Cognitive Difficulty
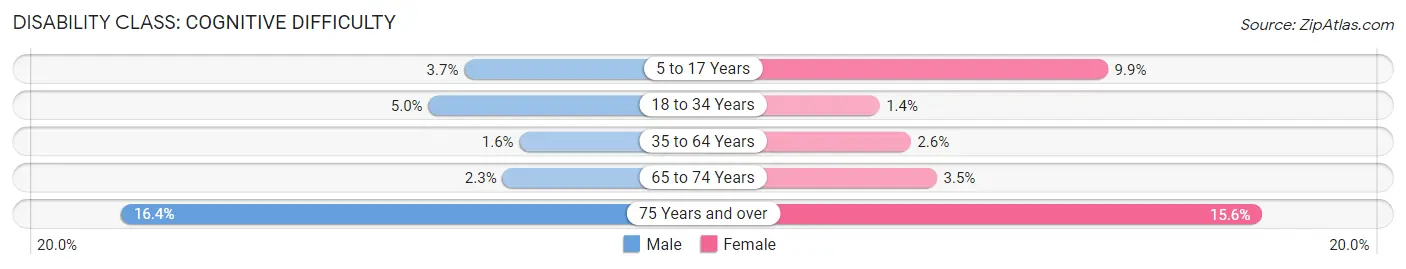
| Age Bracket | Male | Female |
| 5 to 17 Years | 25 (3.7%) | 45 (9.9%) |
| 18 to 34 Years | 30 (5.0%) | 8 (1.4%) |
| 35 to 64 Years | 16 (1.6%) | 22 (2.5%) |
| 65 to 74 Years | 4 (2.3%) | 7 (3.5%) |
| 75 Years and over | 22 (16.4%) | 22 (15.6%) |
Disability Class: Ambulatory Difficulty
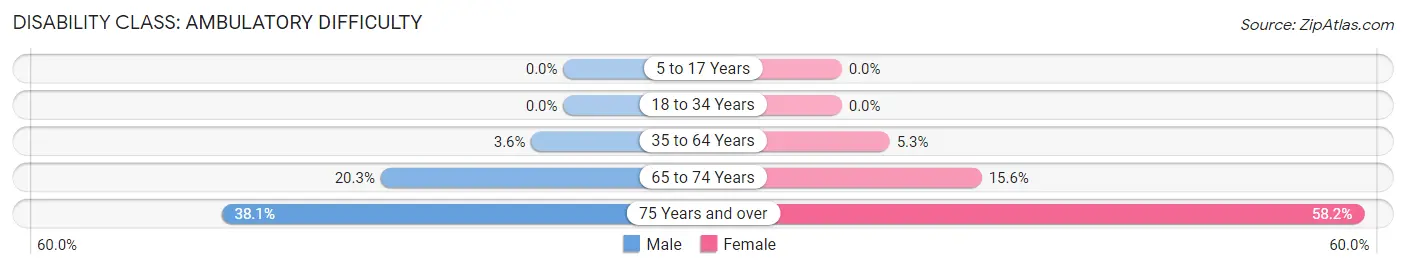
| Age Bracket | Male | Female |
| 5 to 17 Years | 0 (0.0%) | 0 (0.0%) |
| 18 to 34 Years | 0 (0.0%) | 0 (0.0%) |
| 35 to 64 Years | 35 (3.6%) | 46 (5.3%) |
| 65 to 74 Years | 36 (20.3%) | 31 (15.6%) |
| 75 Years and over | 51 (38.1%) | 82 (58.2%) |
Disability Class: Self-Care Difficulty
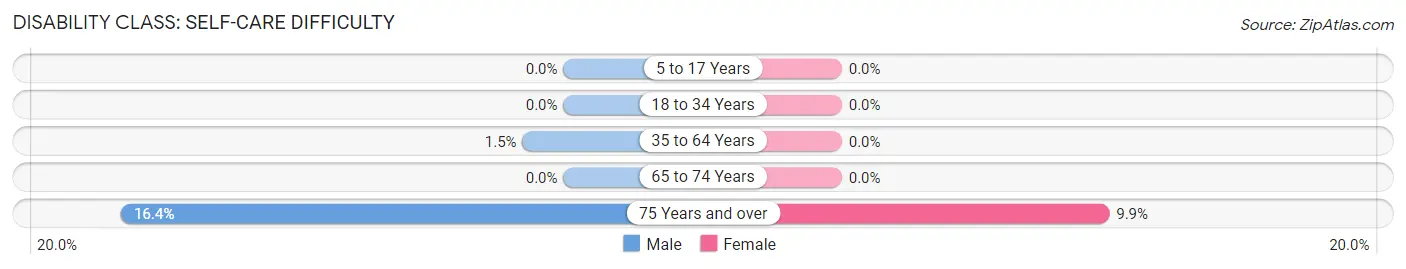
| Age Bracket | Male | Female |
| 5 to 17 Years | 0 (0.0%) | 0 (0.0%) |
| 18 to 34 Years | 0 (0.0%) | 0 (0.0%) |
| 35 to 64 Years | 15 (1.5%) | 0 (0.0%) |
| 65 to 74 Years | 0 (0.0%) | 0 (0.0%) |
| 75 Years and over | 22 (16.4%) | 14 (9.9%) |
Technology Access in Hansford County
Computing Device Access in Hansford County
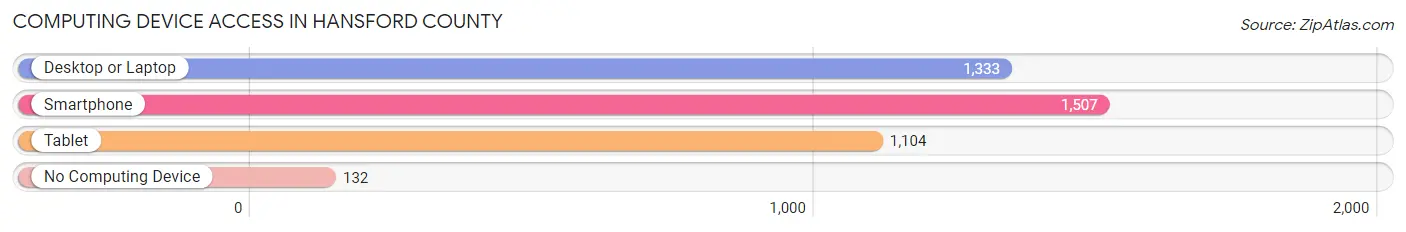
| Device Type | # Households | % Households |
| Desktop or Laptop | 1,333 | 75.6% |
| Smartphone | 1,507 | 85.5% |
| Tablet | 1,104 | 62.6% |
| No Computing Device | 132 | 7.5% |
| Total | 1,763 | 100.0% |
Internet Access in Hansford County
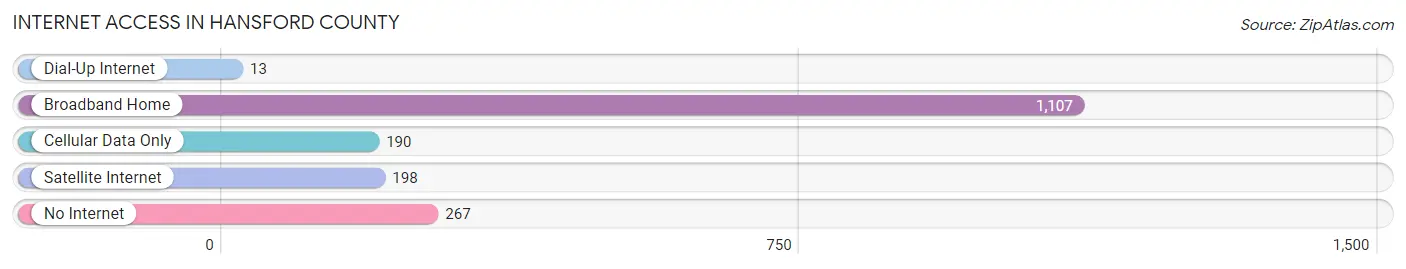
| Internet Type | # Households | % Households |
| Dial-Up Internet | 13 | 0.7% |
| Broadband Home | 1,107 | 62.8% |
| Cellular Data Only | 190 | 10.8% |
| Satellite Internet | 198 | 11.2% |
| No Internet | 267 | 15.1% |
| Total | 1,763 | 100.0% |
Hansford County Summary
Hansford County is located in the Texas Panhandle, in the northern part of the state. It is bordered by Sherman County to the north, Moore County to the east, Hutchinson County to the south, and Roberts County to the west. The county seat is Spearman, and the largest city is Gruver. The county was created in 1876 and named for John M. Hansford, a Texas state legislator and judge.
Geography
Hansford County covers an area of 902 square miles, of which 899 square miles is land and 3 square miles is water. The county is located in the High Plains region of the Texas Panhandle, and is mostly flat with some rolling hills. The Canadian River forms the northern border of the county, and the Salt Fork of the Red River forms the southern border. The county is home to several small lakes, including Lake Hansford, Lake Gruver, and Lake Spearman.
The climate of Hansford County is semi-arid, with hot summers and cold winters. Average temperatures range from a low of 33°F in January to a high of 94°F in July. Average annual precipitation is 19.5 inches, with most of it falling in the spring and summer months.
Economy
Agriculture is the main economic activity in Hansford County. The county is home to a variety of crops, including wheat, corn, sorghum, cotton, and hay. Cattle and sheep are also raised in the county. Oil and gas production is also an important part of the economy, and there are several oil and gas wells in the county.
Demographics
As of the 2010 census, there were 5,613 people, 2,093 households, and 1,521 families living in Hansford County. The population density was 6.2 people per square mile. The racial makeup of the county was 84.3% White, 0.7% African American, 0.9% Native American, 0.2% Asian, 11.7% from other races, and 2.2% from two or more races. Hispanic or Latino of any race were 24.3% of the population.
The median income for a household in the county was $41,944, and the median income for a family was $50,938. The per capita income for the county was $19,945. About 11.2% of families and 14.3% of the population were below the poverty line, including 18.2% of those under age 18 and 10.2% of those age 65 or over.
Education
Hansford County is served by the Gruver Independent School District, which includes Gruver Elementary School, Gruver Middle School, and Gruver High School. The county is also home to several private schools, including Spearman Christian School and Spearman Montessori School.
Conclusion
Hansford County is located in the Texas Panhandle, in the northern part of the state. It is bordered by Sherman County to the north, Moore County to the east, Hutchinson County to the south, and Roberts County to the west. The county has a semi-arid climate, with hot summers and cold winters. Agriculture is the main economic activity in the county, and oil and gas production is also an important part of the economy. As of the 2010 census, the population of Hansford County was 5,613. The county is served by the Gruver Independent School District, as well as several private schools.
Common Questions
What is Per Capita Income in Hansford County?
Per Capita income in Hansford County is $27,585.
What is the Median Family Income in Hansford County?
Median Family Income in Hansford County is $88,538.
What is the Median Household income in Hansford County?
Median Household Income in Hansford County is $62,350.
What is Income or Wage Gap in Hansford County?
Income or Wage Gap in Hansford County is 33.2%.
Women in Hansford County earn 66.8 cents for every dollar earned by a man.
What is Family Income Deficit in Hansford County?
Family Income Deficit in Hansford County is $5,736.
Families that are below poverty line in Hansford County earn $5,736 less on average than the poverty threshold level.
What is Inequality or Gini Index in Hansford County?
Inequality or Gini Index in Hansford County is 0.40.
What is the Total Population of Hansford County?
Total Population of Hansford County is 5,270.
What is the Total Male Population of Hansford County?
Total Male Population of Hansford County is 2,780.
What is the Total Female Population of Hansford County?
Total Female Population of Hansford County is 2,490.
What is the Ratio of Males per 100 Females in Hansford County?
There are 111.65 Males per 100 Females in Hansford County.
What is the Ratio of Females per 100 Males in Hansford County?
There are 89.57 Females per 100 Males in Hansford County.
What is the Median Population Age in Hansford County?
Median Population Age in Hansford County is 33.9 Years.
What is the Average Family Size in Hansford County
Average Family Size in Hansford County is 3.8 People.
What is the Average Household Size in Hansford County
Average Household Size in Hansford County is 3.0 People.
How Large is the Labor Force in Hansford County?
There are 2,542 People in the Labor Forcein in Hansford County.
What is the Percentage of People in the Labor Force in Hansford County?
65.1% of People are in the Labor Force in Hansford County.
What is the Unemployment Rate in Hansford County?
Unemployment Rate in Hansford County is 4.3%.