Hale County, TX Map & Demographics
Hale County Map
Hale County Overview
$23,696
PER CAPITA INCOME
$59,607
AVG FAMILY INCOME
$50,721
AVG HOUSEHOLD INCOME
41.6%
WAGE / INCOME GAP [ % ]
58.4¢/ $1
WAGE / INCOME GAP [ $ ]
$11,691
FAMILY INCOME DEFICIT
0.45
INEQUALITY / GINI INDEX
32,525
TOTAL POPULATION
16,851
MALE POPULATION
15,674
FEMALE POPULATION
107.51
MALES / 100 FEMALES
93.02
FEMALES / 100 MALES
33.4
MEDIAN AGE
3.3
AVG FAMILY SIZE
2.7
AVG HOUSEHOLD SIZE
14,652
LABOR FORCE [ PEOPLE ]
59.4%
PERCENT IN LABOR FORCE
4.7%
UNEMPLOYMENT RATE
Hale County Area Codes
Income in Hale County
Income Overview in Hale County
Per Capita Income in Hale County is $23,696, while median incomes of families and households are $59,607 and $50,721 respectively.
| Characteristic | Number | Measure |
| Per Capita Income | 32,525 | $23,696 |
| Median Family Income | 7,899 | $59,607 |
| Mean Family Income | 7,899 | $76,409 |
| Median Household Income | 10,997 | $50,721 |
| Mean Household Income | 10,997 | $67,058 |
| Income Deficit | 7,899 | $11,691 |
| Wage / Income Gap (%) | 32,525 | 41.58% |
| Wage / Income Gap ($) | 32,525 | 58.42¢ per $1 |
| Gini / Inequality Index | 32,525 | 0.45 |
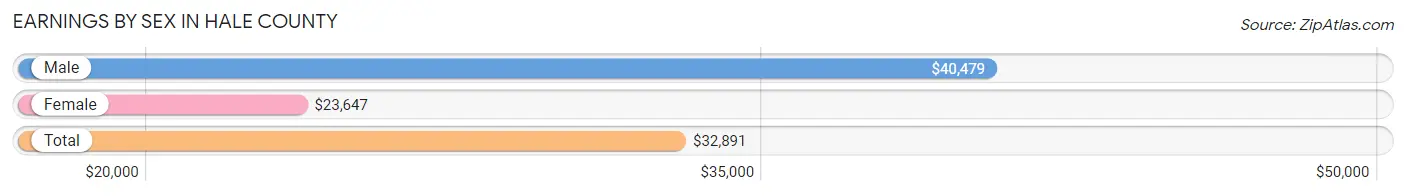
Earnings by Sex in Hale County
Average Earnings in Hale County are $32,891, $40,479 for men and $23,647 for women, a difference of 41.6%.
| Sex | Number | Average Earnings |
| Male | 8,443 (56.1%) | $40,479 |
| Female | 6,611 (43.9%) | $23,647 |
| Total | 15,054 (100.0%) | $32,891 |
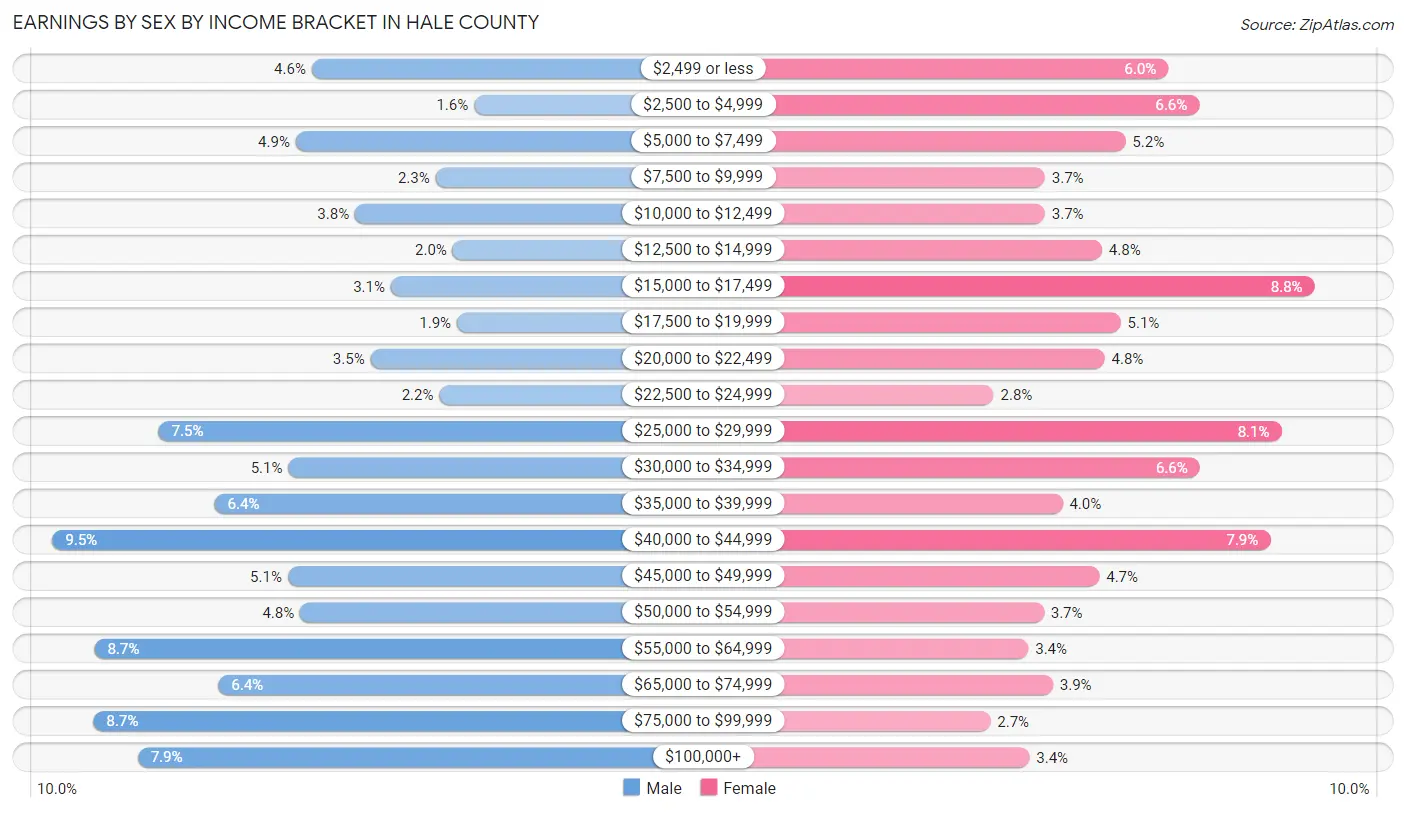
Earnings by Sex by Income Bracket in Hale County
The most common earnings brackets in Hale County are $40,000 to $44,999 for men (800 | 9.5%) and $15,000 to $17,499 for women (579 | 8.8%).
| Income | Male | Female |
| $2,499 or less | 390 (4.6%) | 398 (6.0%) |
| $2,500 to $4,999 | 133 (1.6%) | 436 (6.6%) |
| $5,000 to $7,499 | 415 (4.9%) | 345 (5.2%) |
| $7,500 to $9,999 | 194 (2.3%) | 245 (3.7%) |
| $10,000 to $12,499 | 322 (3.8%) | 245 (3.7%) |
| $12,500 to $14,999 | 167 (2.0%) | 316 (4.8%) |
| $15,000 to $17,499 | 265 (3.1%) | 579 (8.8%) |
| $17,500 to $19,999 | 160 (1.9%) | 339 (5.1%) |
| $20,000 to $22,499 | 297 (3.5%) | 319 (4.8%) |
| $22,500 to $24,999 | 188 (2.2%) | 182 (2.8%) |
| $25,000 to $29,999 | 632 (7.5%) | 538 (8.1%) |
| $30,000 to $34,999 | 427 (5.1%) | 437 (6.6%) |
| $35,000 to $39,999 | 544 (6.4%) | 267 (4.0%) |
| $40,000 to $44,999 | 800 (9.5%) | 524 (7.9%) |
| $45,000 to $49,999 | 428 (5.1%) | 313 (4.7%) |
| $50,000 to $54,999 | 409 (4.8%) | 244 (3.7%) |
| $55,000 to $64,999 | 734 (8.7%) | 225 (3.4%) |
| $65,000 to $74,999 | 538 (6.4%) | 255 (3.9%) |
| $75,000 to $99,999 | 735 (8.7%) | 178 (2.7%) |
| $100,000+ | 665 (7.9%) | 226 (3.4%) |
| Total | 8,443 (100.0%) | 6,611 (100.0%) |
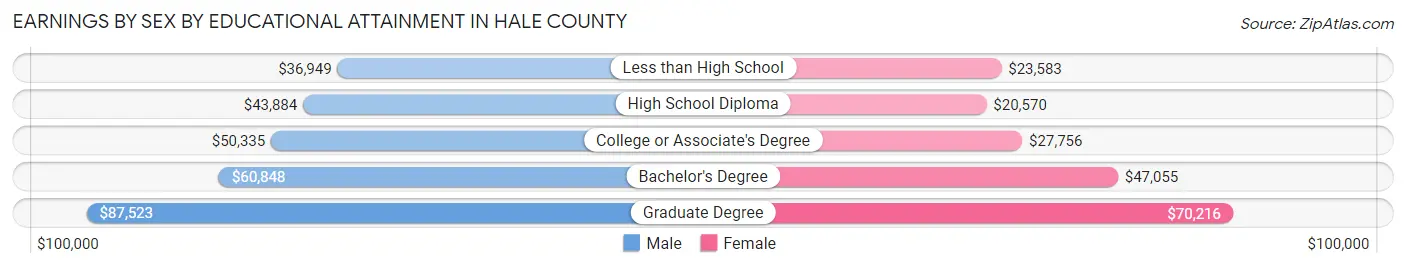
Earnings by Sex by Educational Attainment in Hale County
Average earnings in Hale County are $44,992 for men and $28,573 for women, a difference of 36.5%. Men with an educational attainment of graduate degree enjoy the highest average annual earnings of $87,523, while those with less than high school education earn the least with $36,949. Women with an educational attainment of graduate degree earn the most with the average annual earnings of $70,216, while those with high school diploma education have the smallest earnings of $20,570.
| Educational Attainment | Male Income | Female Income |
| Less than High School | $36,949 | $23,583 |
| High School Diploma | $43,884 | $20,570 |
| College or Associate's Degree | $50,335 | $27,756 |
| Bachelor's Degree | $60,848 | $47,055 |
| Graduate Degree | $87,523 | $70,216 |
| Total | $44,992 | $28,573 |
Family Income in Hale County
Family Income Brackets in Hale County
According to the Hale County family income data, there are 1,580 families falling into the $50,000 to $74,999 income range, which is the most common income bracket and makes up 20.0% of all families. Conversely, the $10,000 to $14,999 income bracket is the least frequent group with only 229 families (2.9%) belonging to this category.
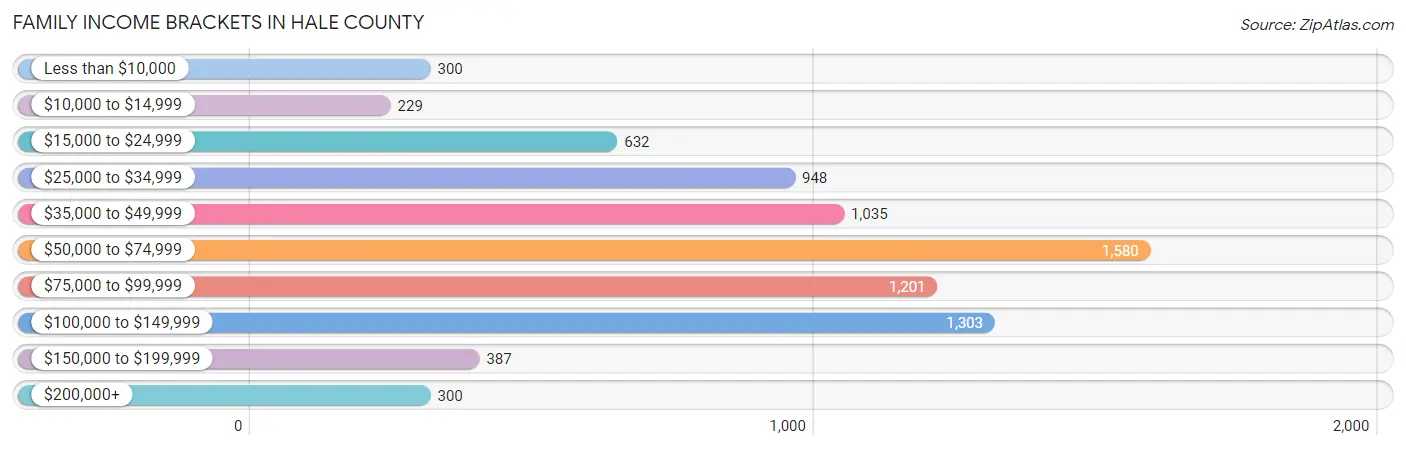
| Income Bracket | # Families | % Families |
| Less than $10,000 | 300 | 3.8% |
| $10,000 to $14,999 | 229 | 2.9% |
| $15,000 to $24,999 | 632 | 8.0% |
| $25,000 to $34,999 | 948 | 12.0% |
| $35,000 to $49,999 | 1,035 | 13.1% |
| $50,000 to $74,999 | 1,580 | 20.0% |
| $75,000 to $99,999 | 1,201 | 15.2% |
| $100,000 to $149,999 | 1,303 | 16.5% |
| $150,000 to $199,999 | 387 | 4.9% |
| $200,000+ | 300 | 3.8% |
Family Income by Famaliy Size in Hale County
6-person families (314 | 4.0%) account for the highest median family income in Hale County with $83,648 per family, while 2-person families (3,469 | 43.9%) have the highest median income of $28,176 per family member.
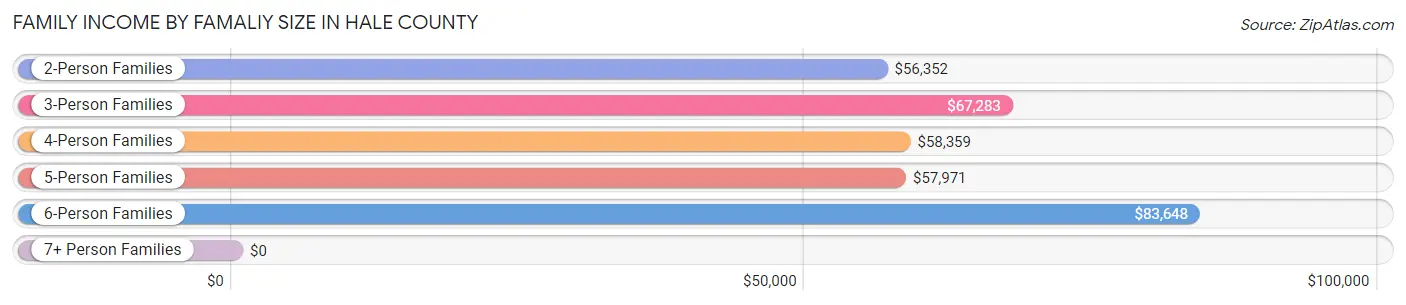
| Income Bracket | # Families | Median Income |
| 2-Person Families | 3,469 (43.9%) | $56,352 |
| 3-Person Families | 1,472 (18.6%) | $67,283 |
| 4-Person Families | 1,709 (21.6%) | $58,359 |
| 5-Person Families | 830 (10.5%) | $57,971 |
| 6-Person Families | 314 (4.0%) | $83,648 |
| 7+ Person Families | 105 (1.3%) | $0 |
| Total | 7,899 (100.0%) | $59,607 |
Family Income by Number of Earners in Hale County
The median family income in Hale County is $59,607, with families comprising 3+ earners (766) having the highest median family income of $103,646, while families with no earners (970) have the lowest median family income of $28,232, accounting for 9.7% and 12.3% of families, respectively.
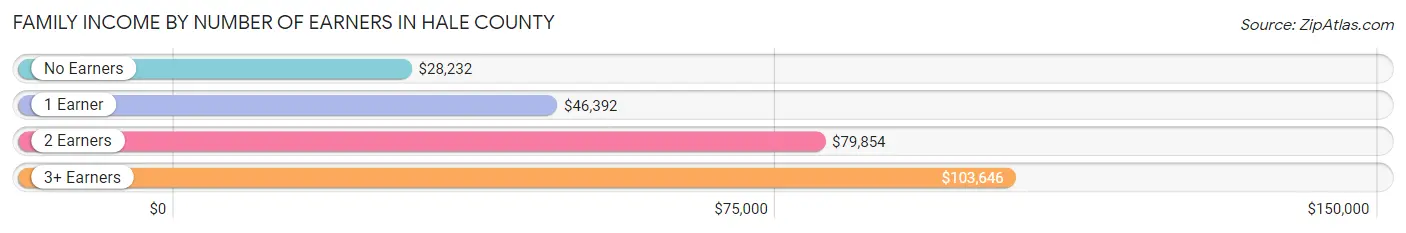
| Number of Earners | # Families | Median Income |
| No Earners | 970 (12.3%) | $28,232 |
| 1 Earner | 3,018 (38.2%) | $46,392 |
| 2 Earners | 3,145 (39.8%) | $79,854 |
| 3+ Earners | 766 (9.7%) | $103,646 |
| Total | 7,899 (100.0%) | $59,607 |
Household Income in Hale County
Household Income Brackets in Hale County
With 2,045 households falling in the category, the $50,000 to $74,999 income range is the most frequent in Hale County, accounting for 18.6% of all households. In contrast, only 341 households (3.1%) fall into the $200,000+ income bracket, making it the least populous group.
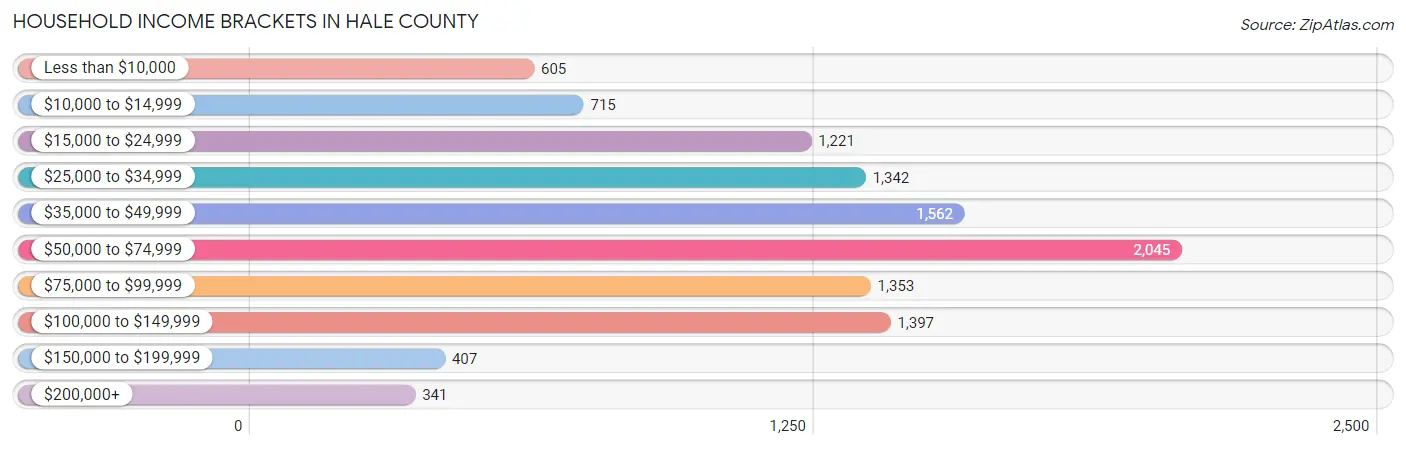
| Income Bracket | # Households | % Households |
| Less than $10,000 | 605 | 5.5% |
| $10,000 to $14,999 | 715 | 6.5% |
| $15,000 to $24,999 | 1,221 | 11.1% |
| $25,000 to $34,999 | 1,342 | 12.2% |
| $35,000 to $49,999 | 1,562 | 14.2% |
| $50,000 to $74,999 | 2,045 | 18.6% |
| $75,000 to $99,999 | 1,353 | 12.3% |
| $100,000 to $149,999 | 1,397 | 12.7% |
| $150,000 to $199,999 | 407 | 3.7% |
| $200,000+ | 341 | 3.1% |
Household Income by Householder Age in Hale County
The median household income in Hale County is $50,721, with the highest median household income of $59,614 found in the 45 to 64 years age bracket for the primary householder. A total of 3,895 households (35.4%) fall into this category. Meanwhile, the 65+ years age bracket for the primary householder has the lowest median household income of $33,480, with 2,886 households (26.2%) in this group.
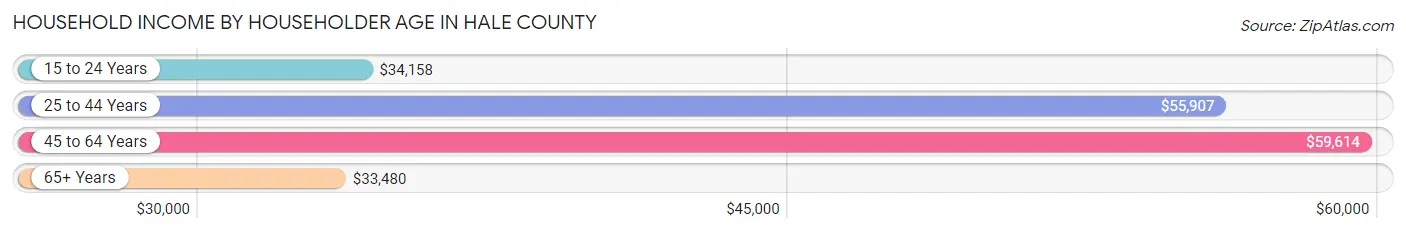
| Income Bracket | # Households | Median Income |
| 15 to 24 Years | 774 (7.0%) | $34,158 |
| 25 to 44 Years | 3,442 (31.3%) | $55,907 |
| 45 to 64 Years | 3,895 (35.4%) | $59,614 |
| 65+ Years | 2,886 (26.2%) | $33,480 |
| Total | 10,997 (100.0%) | $50,721 |
Poverty in Hale County
Income Below Poverty by Sex and Age in Hale County
With 14.2% poverty level for males and 22.7% for females among the residents of Hale County, 5 year old males and 15 year old females are the most vulnerable to poverty, with 92 males (73.0%) and 141 females (45.2%) in their respective age groups living below the poverty level.
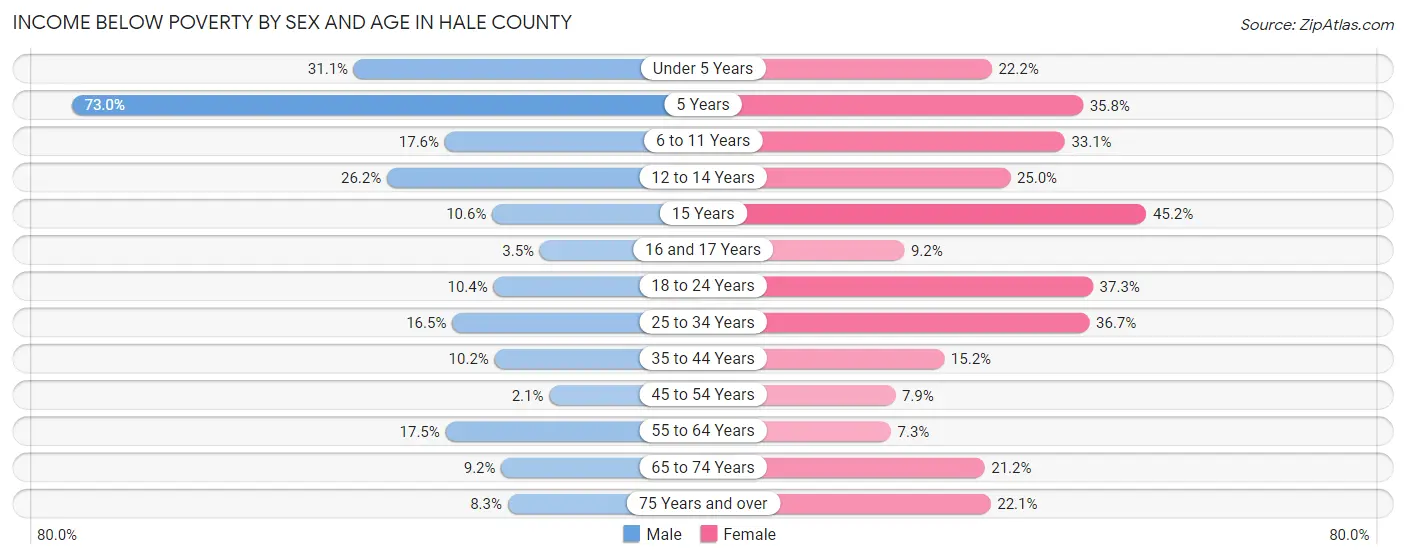
| Age Bracket | Male | Female |
| Under 5 Years | 316 (31.1%) | 223 (22.2%) |
| 5 Years | 92 (73.0%) | 49 (35.8%) |
| 6 to 11 Years | 285 (17.6%) | 563 (33.1%) |
| 12 to 14 Years | 210 (26.2%) | 191 (25.0%) |
| 15 Years | 38 (10.6%) | 141 (45.2%) |
| 16 and 17 Years | 15 (3.5%) | 42 (9.2%) |
| 18 to 24 Years | 174 (10.4%) | 606 (37.2%) |
| 25 to 34 Years | 298 (16.5%) | 618 (36.7%) |
| 35 to 44 Years | 182 (10.2%) | 281 (15.2%) |
| 45 to 54 Years | 34 (2.1%) | 138 (7.9%) |
| 55 to 64 Years | 295 (17.5%) | 123 (7.2%) |
| 65 to 74 Years | 103 (9.2%) | 281 (21.2%) |
| 75 Years and over | 66 (8.3%) | 232 (22.1%) |
| Total | 2,108 (14.2%) | 3,488 (22.7%) |
Income Above Poverty by Sex and Age in Hale County
According to the poverty statistics in Hale County, males aged 45 to 54 years and females aged 55 to 64 years are the age groups that are most secure financially, with 97.9% of males and 92.7% of females in these age groups living above the poverty line.
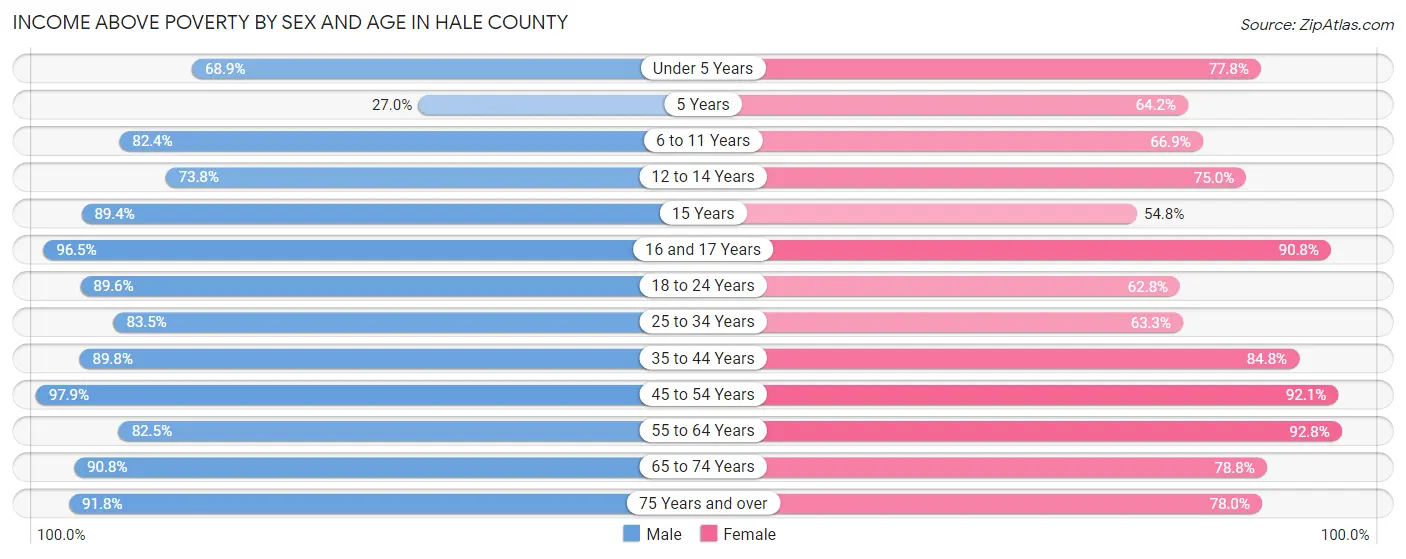
| Age Bracket | Male | Female |
| Under 5 Years | 700 (68.9%) | 780 (77.8%) |
| 5 Years | 34 (27.0%) | 88 (64.2%) |
| 6 to 11 Years | 1,335 (82.4%) | 1,140 (66.9%) |
| 12 to 14 Years | 592 (73.8%) | 574 (75.0%) |
| 15 Years | 322 (89.4%) | 171 (54.8%) |
| 16 and 17 Years | 416 (96.5%) | 413 (90.8%) |
| 18 to 24 Years | 1,506 (89.6%) | 1,021 (62.7%) |
| 25 to 34 Years | 1,508 (83.5%) | 1,065 (63.3%) |
| 35 to 44 Years | 1,603 (89.8%) | 1,572 (84.8%) |
| 45 to 54 Years | 1,600 (97.9%) | 1,609 (92.1%) |
| 55 to 64 Years | 1,393 (82.5%) | 1,573 (92.7%) |
| 65 to 74 Years | 1,017 (90.8%) | 1,047 (78.8%) |
| 75 Years and over | 734 (91.7%) | 820 (77.9%) |
| Total | 12,760 (85.8%) | 11,873 (77.3%) |
Income Below Poverty Among Married-Couple Families in Hale County
The poverty statistics for married-couple families in Hale County show that 5.7% or 306 of the total 5,411 families live below the poverty line. Families with 5 or more children have the highest poverty rate of 35.6%, comprising of 16 families. On the other hand, families with 3 or 4 children have the lowest poverty rate of 1.9%, which includes 13 families.
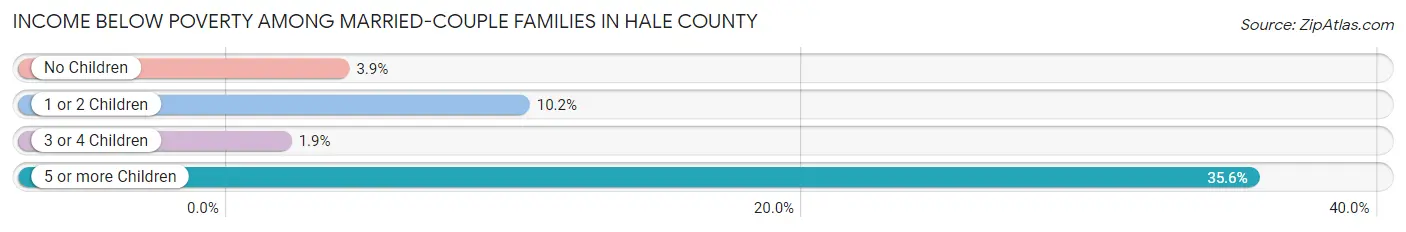
| Children | Above Poverty | Below Poverty |
| No Children | 3,022 (96.1%) | 122 (3.9%) |
| 1 or 2 Children | 1,371 (89.8%) | 155 (10.2%) |
| 3 or 4 Children | 683 (98.1%) | 13 (1.9%) |
| 5 or more Children | 29 (64.4%) | 16 (35.6%) |
| Total | 5,105 (94.3%) | 306 (5.7%) |
Income Below Poverty Among Single-Parent Households in Hale County
According to the poverty data in Hale County, 15.7% or 87 single-father households and 38.4% or 742 single-mother households are living below the poverty line. Among single-father households, those with 3 or 4 children have the highest poverty rate, with 53 households (40.8%) experiencing poverty. Likewise, among single-mother households, those with 3 or 4 children have the highest poverty rate, with 410 households (91.7%) falling below the poverty line.
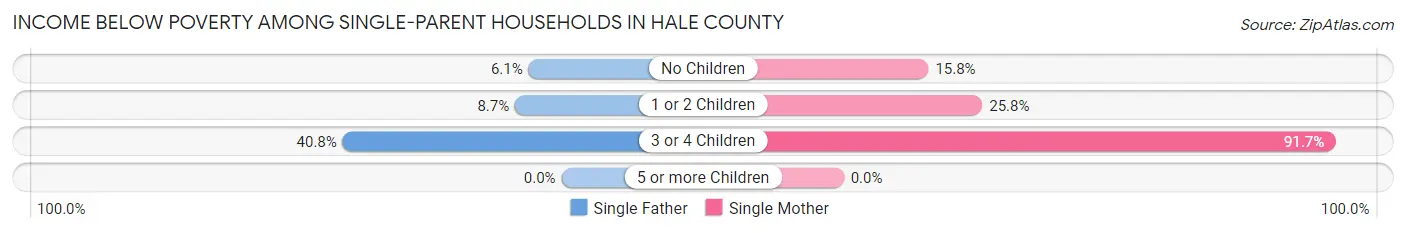
| Children | Single Father | Single Mother |
| No Children | 7 (6.1%) | 81 (15.8%) |
| 1 or 2 Children | 27 (8.6%) | 251 (25.8%) |
| 3 or 4 Children | 53 (40.8%) | 410 (91.7%) |
| 5 or more Children | 0 (0.0%) | 0 (0.0%) |
| Total | 87 (15.7%) | 742 (38.4%) |
Income Below Poverty Among Married-Couple vs Single-Parent Households in Hale County
The poverty data for Hale County shows that 306 of the married-couple family households (5.7%) and 829 of the single-parent households (33.3%) are living below the poverty level. Within the married-couple family households, those with 5 or more children have the highest poverty rate, with 16 households (35.6%) falling below the poverty line. Among the single-parent households, those with 3 or 4 children have the highest poverty rate, with 463 household (80.2%) living below poverty.
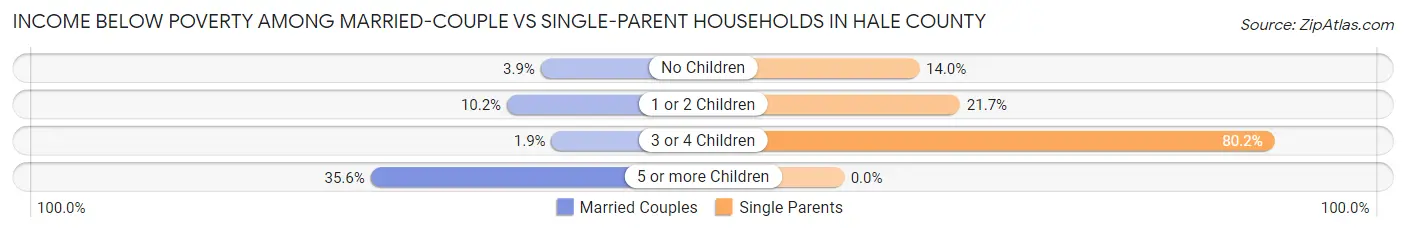
| Children | Married-Couple Families | Single-Parent Households |
| No Children | 122 (3.9%) | 88 (14.0%) |
| 1 or 2 Children | 155 (10.2%) | 278 (21.6%) |
| 3 or 4 Children | 13 (1.9%) | 463 (80.2%) |
| 5 or more Children | 16 (35.6%) | 0 (0.0%) |
| Total | 306 (5.7%) | 829 (33.3%) |
Race in Hale County
The most populous races in Hale County are White / Caucasian (22,133 | 68.0%), Hispanic or Latino (20,029 | 61.6%), and Two or more Races (5,282 | 16.2%).
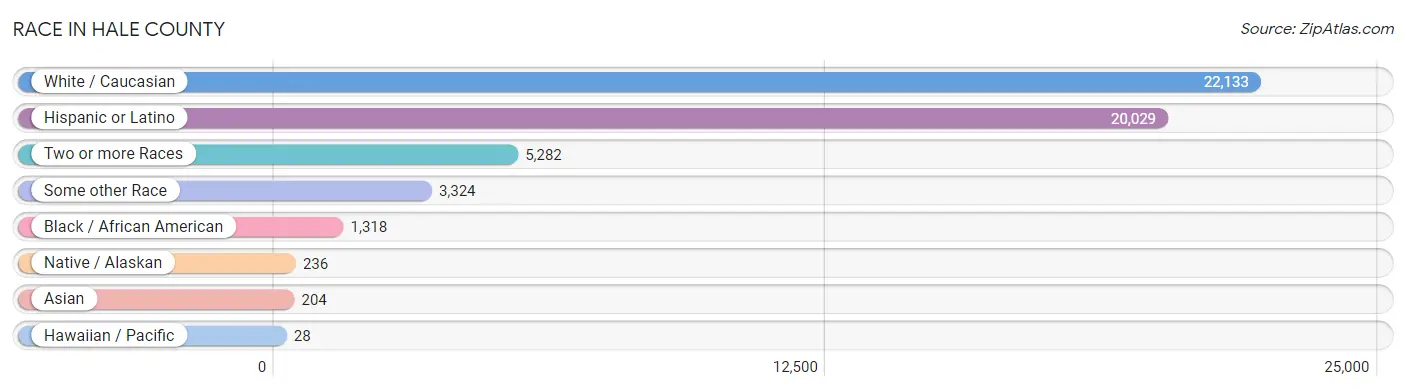
| Race | # Population | % Population |
| Asian | 204 | 0.6% |
| Black / African American | 1,318 | 4.1% |
| Hawaiian / Pacific | 28 | 0.1% |
| Hispanic or Latino | 20,029 | 61.6% |
| Native / Alaskan | 236 | 0.7% |
| White / Caucasian | 22,133 | 68.0% |
| Two or more Races | 5,282 | 16.2% |
| Some other Race | 3,324 | 10.2% |
| Total | 32,525 | 100.0% |
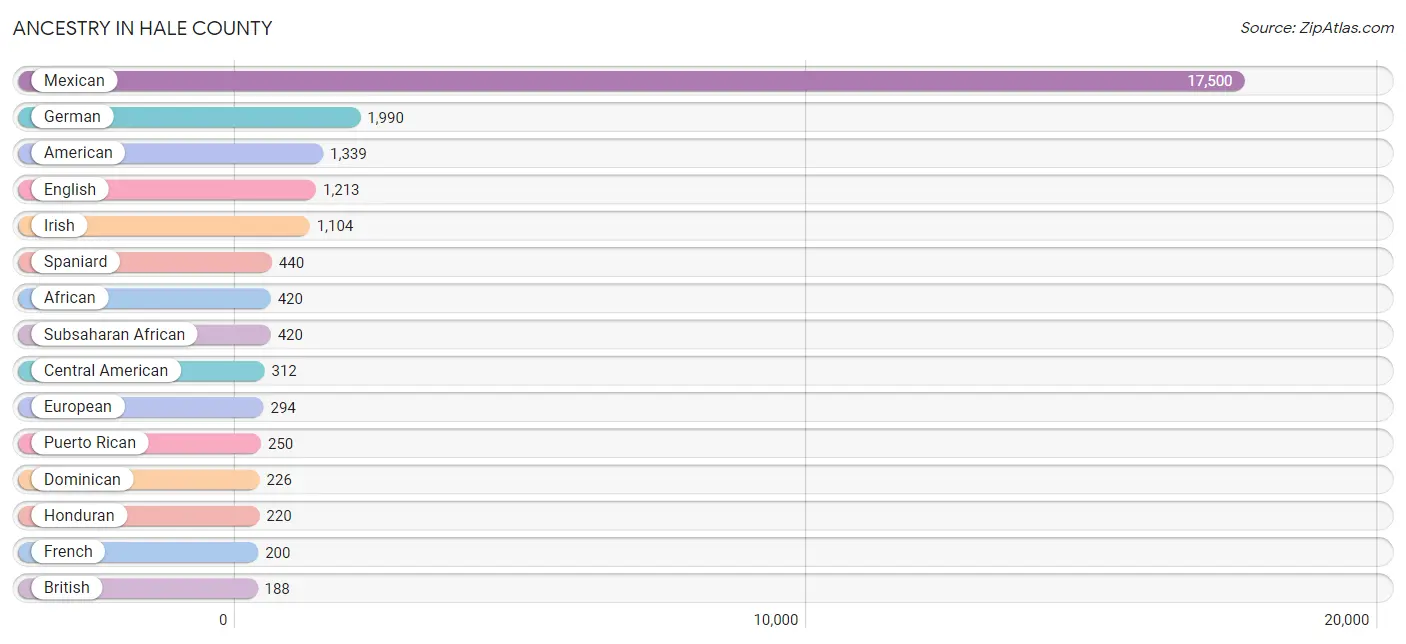
Ancestry in Hale County
The most populous ancestries reported in Hale County are Mexican (17,500 | 53.8%), German (1,990 | 6.1%), American (1,339 | 4.1%), English (1,213 | 3.7%), and Irish (1,104 | 3.4%), together accounting for 71.2% of all Hale County residents.
| Ancestry | # Population | % Population |
| African | 420 | 1.3% |
| American | 1,339 | 4.1% |
| Apache | 22 | 0.1% |
| Arab | 86 | 0.3% |
| Argentinean | 85 | 0.3% |
| Austrian | 4 | 0.0% |
| Bhutanese | 3 | 0.0% |
| Blackfeet | 5 | 0.0% |
| Bolivian | 39 | 0.1% |
| British | 188 | 0.6% |
| Burmese | 20 | 0.1% |
| Central American | 312 | 1.0% |
| Central American Indian | 28 | 0.1% |
| Cherokee | 104 | 0.3% |
| Chickasaw | 3 | 0.0% |
| Choctaw | 6 | 0.0% |
| Colombian | 45 | 0.1% |
| Comanche | 8 | 0.0% |
| Creek | 45 | 0.1% |
| Cuban | 11 | 0.0% |
| Czech | 28 | 0.1% |
| Danish | 20 | 0.1% |
| Delaware | 1 | 0.0% |
| Dominican | 226 | 0.7% |
| Dutch | 113 | 0.4% |
| Dutch West Indian | 25 | 0.1% |
| Eastern European | 3 | 0.0% |
| Egyptian | 20 | 0.1% |
| English | 1,213 | 3.7% |
| European | 294 | 0.9% |
| French | 200 | 0.6% |
| French Canadian | 6 | 0.0% |
| German | 1,990 | 6.1% |
| Greek | 81 | 0.3% |
| Guatemalan | 39 | 0.1% |
| Haitian | 32 | 0.1% |
| Honduran | 220 | 0.7% |
| Hungarian | 9 | 0.0% |
| Indian (Asian) | 27 | 0.1% |
| Irish | 1,104 | 3.4% |
| Italian | 135 | 0.4% |
| Jamaican | 55 | 0.2% |
| Korean | 89 | 0.3% |
| Mexican | 17,500 | 53.8% |
| Mexican American Indian | 17 | 0.1% |
| Native Hawaiian | 62 | 0.2% |
| Navajo | 76 | 0.2% |
| Norwegian | 37 | 0.1% |
| Osage | 9 | 0.0% |
| Pakistani | 29 | 0.1% |
| Polish | 102 | 0.3% |
| Portuguese | 187 | 0.6% |
| Puerto Rican | 250 | 0.8% |
| Russian | 45 | 0.1% |
| Salvadoran | 53 | 0.2% |
| Scandinavian | 13 | 0.0% |
| Scotch-Irish | 118 | 0.4% |
| Scottish | 103 | 0.3% |
| Sioux | 5 | 0.0% |
| South American | 169 | 0.5% |
| Spaniard | 440 | 1.3% |
| Spanish | 63 | 0.2% |
| Sri Lankan | 6 | 0.0% |
| Subsaharan African | 420 | 1.3% |
| Swedish | 57 | 0.2% |
| Swiss | 20 | 0.1% |
| Thai | 5 | 0.0% |
| Ukrainian | 16 | 0.1% |
| Welsh | 65 | 0.2% | View All 69 Rows |
Immigrants in Hale County
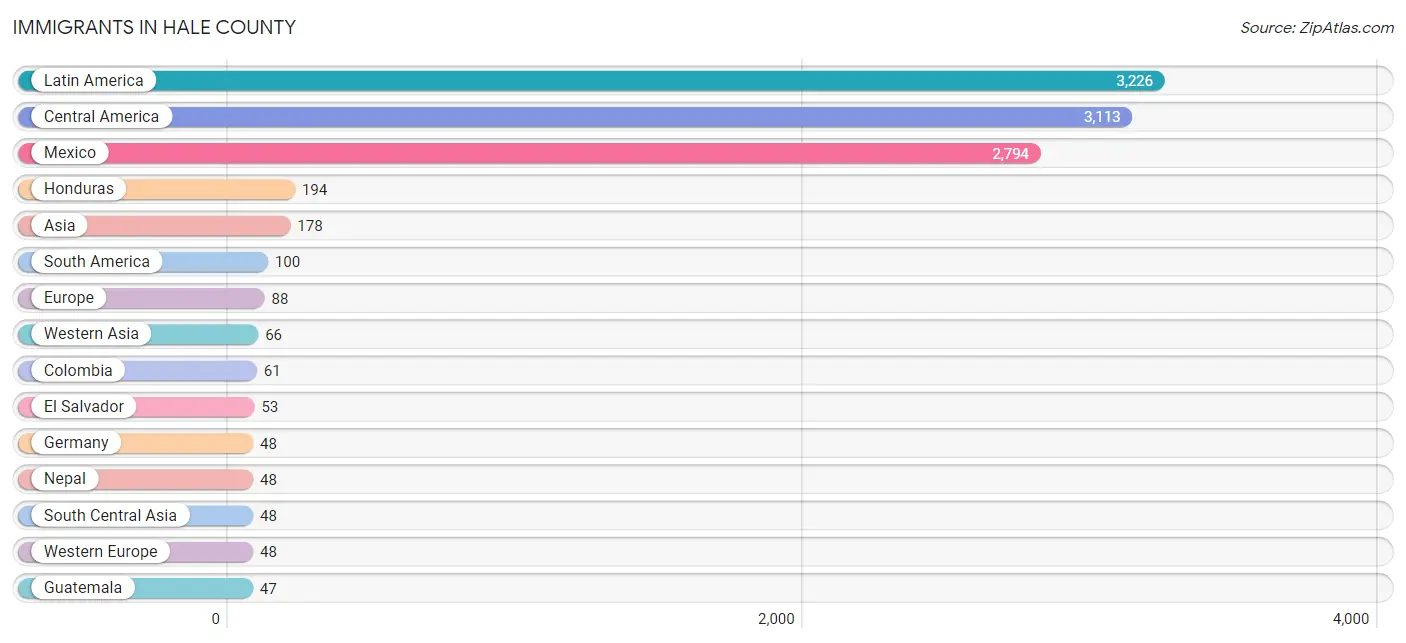
The most numerous immigrant groups reported in Hale County came from Latin America (3,226 | 9.9%), Central America (3,113 | 9.6%), Mexico (2,794 | 8.6%), Honduras (194 | 0.6%), and Asia (178 | 0.5%), together accounting for 29.2% of all Hale County residents.
| Immigration Origin | # Population | % Population |
| Asia | 178 | 0.5% |
| Belize | 25 | 0.1% |
| Bolivia | 39 | 0.1% |
| Caribbean | 13 | 0.0% |
| Central America | 3,113 | 9.6% |
| China | 13 | 0.0% |
| Colombia | 61 | 0.2% |
| Cuba | 7 | 0.0% |
| Eastern Asia | 23 | 0.1% |
| Eastern Europe | 34 | 0.1% |
| El Salvador | 53 | 0.2% |
| England | 3 | 0.0% |
| Europe | 88 | 0.3% |
| Germany | 48 | 0.2% |
| Guatemala | 47 | 0.1% |
| Honduras | 194 | 0.6% |
| Jamaica | 6 | 0.0% |
| Korea | 10 | 0.0% |
| Latin America | 3,226 | 9.9% |
| Mexico | 2,794 | 8.6% |
| Nepal | 48 | 0.2% |
| Northern Europe | 3 | 0.0% |
| Philippines | 12 | 0.0% |
| Poland | 34 | 0.1% |
| South America | 100 | 0.3% |
| South Central Asia | 48 | 0.2% |
| South Eastern Asia | 41 | 0.1% |
| Southern Europe | 3 | 0.0% |
| Spain | 3 | 0.0% |
| Thailand | 29 | 0.1% |
| Western Asia | 66 | 0.2% |
| Western Europe | 48 | 0.2% | View All 32 Rows |
Sex and Age in Hale County
Sex and Age in Hale County
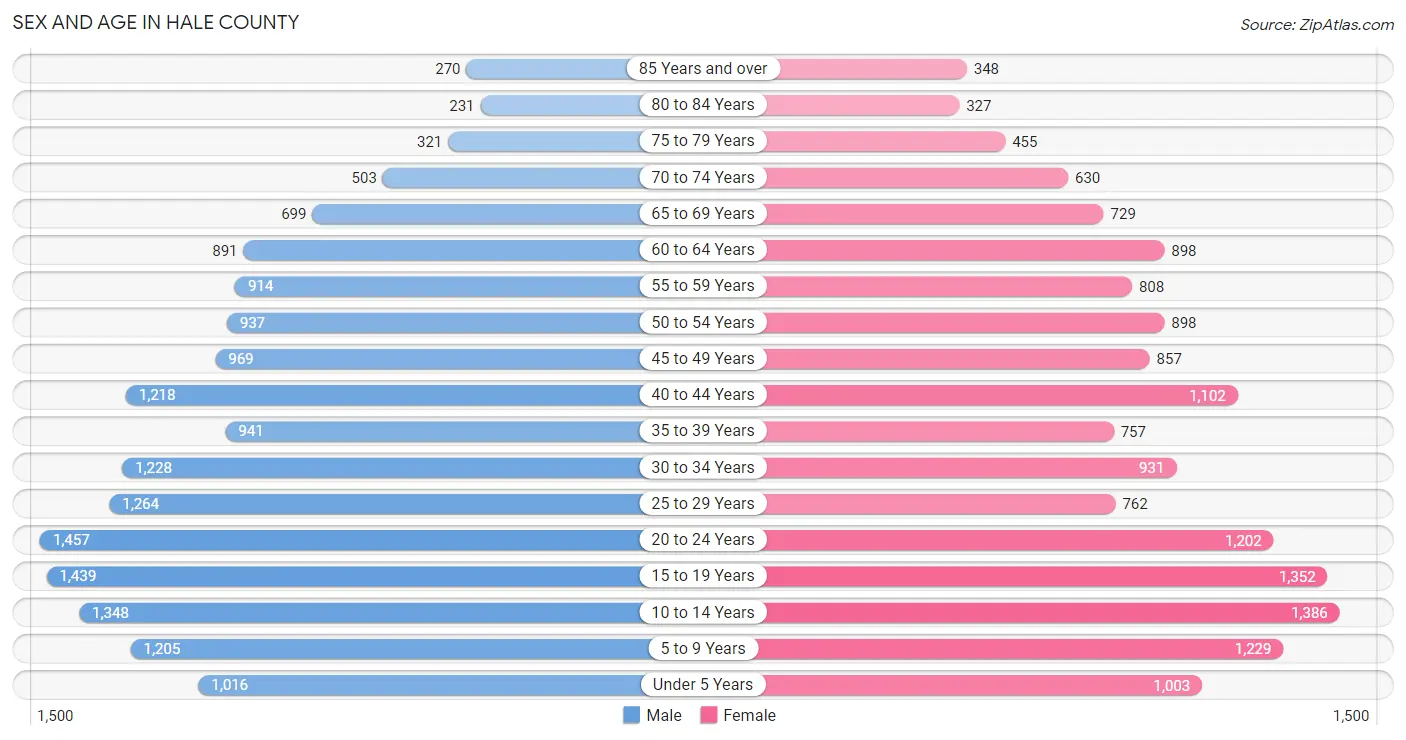
The most populous age groups in Hale County are 20 to 24 Years (1,457 | 8.6%) for men and 10 to 14 Years (1,386 | 8.8%) for women.
| Age Bracket | Male | Female |
| Under 5 Years | 1,016 (6.0%) | 1,003 (6.4%) |
| 5 to 9 Years | 1,205 (7.1%) | 1,229 (7.8%) |
| 10 to 14 Years | 1,348 (8.0%) | 1,386 (8.8%) |
| 15 to 19 Years | 1,439 (8.5%) | 1,352 (8.6%) |
| 20 to 24 Years | 1,457 (8.6%) | 1,202 (7.7%) |
| 25 to 29 Years | 1,264 (7.5%) | 762 (4.9%) |
| 30 to 34 Years | 1,228 (7.3%) | 931 (5.9%) |
| 35 to 39 Years | 941 (5.6%) | 757 (4.8%) |
| 40 to 44 Years | 1,218 (7.2%) | 1,102 (7.0%) |
| 45 to 49 Years | 969 (5.8%) | 857 (5.5%) |
| 50 to 54 Years | 937 (5.6%) | 898 (5.7%) |
| 55 to 59 Years | 914 (5.4%) | 808 (5.2%) |
| 60 to 64 Years | 891 (5.3%) | 898 (5.7%) |
| 65 to 69 Years | 699 (4.2%) | 729 (4.6%) |
| 70 to 74 Years | 503 (3.0%) | 630 (4.0%) |
| 75 to 79 Years | 321 (1.9%) | 455 (2.9%) |
| 80 to 84 Years | 231 (1.4%) | 327 (2.1%) |
| 85 Years and over | 270 (1.6%) | 348 (2.2%) |
| Total | 16,851 (100.0%) | 15,674 (100.0%) |
Families and Households in Hale County
Median Family Size in Hale County
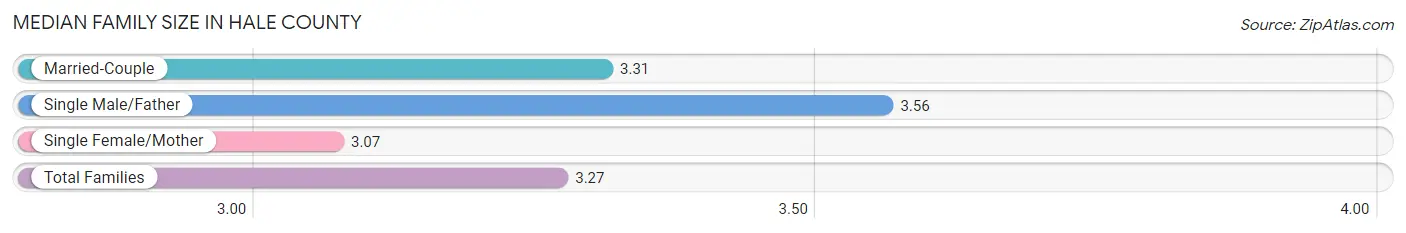
The median family size in Hale County is 3.27 persons per family, with single male/father families (556 | 7.0%) accounting for the largest median family size of 3.56 persons per family. On the other hand, single female/mother families (1,932 | 24.5%) represent the smallest median family size with 3.07 persons per family.
| Family Type | # Families | Family Size |
| Married-Couple | 5,411 (68.5%) | 3.31 |
| Single Male/Father | 556 (7.0%) | 3.56 |
| Single Female/Mother | 1,932 (24.5%) | 3.07 |
| Total Families | 7,899 (100.0%) | 3.27 |
Median Household Size in Hale County
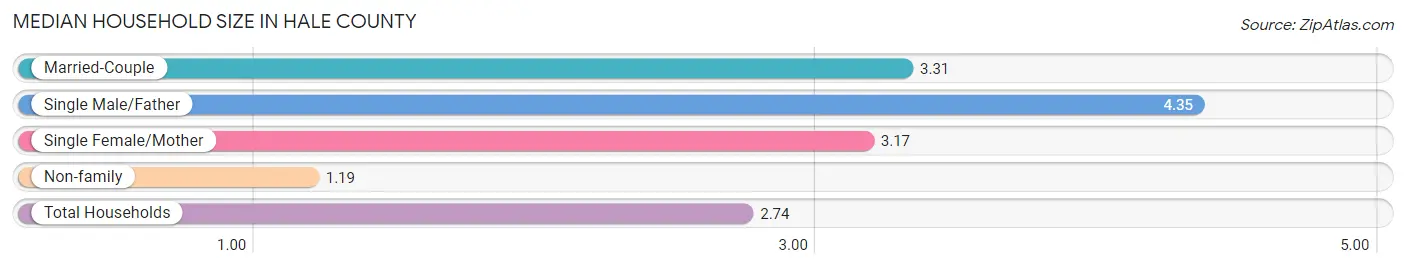
The median household size in Hale County is 2.74 persons per household, with single male/father households (556 | 5.1%) accounting for the largest median household size of 4.35 persons per household. non-family households (3,098 | 28.2%) represent the smallest median household size with 1.19 persons per household.
| Household Type | # Households | Household Size |
| Married-Couple | 5,411 (49.2%) | 3.31 |
| Single Male/Father | 556 (5.1%) | 4.35 |
| Single Female/Mother | 1,932 (17.6%) | 3.17 |
| Non-family | 3,098 (28.2%) | 1.19 |
| Total Households | 10,997 (100.0%) | 2.74 |
Household Size by Marriage Status in Hale County
Out of a total of 10,997 households in Hale County, 7,899 (71.8%) are family households, while 3,098 (28.2%) are nonfamily households. The most numerous type of family households are 2-person households, comprising 3,239, and the most common type of nonfamily households are 1-person households, comprising 2,712.
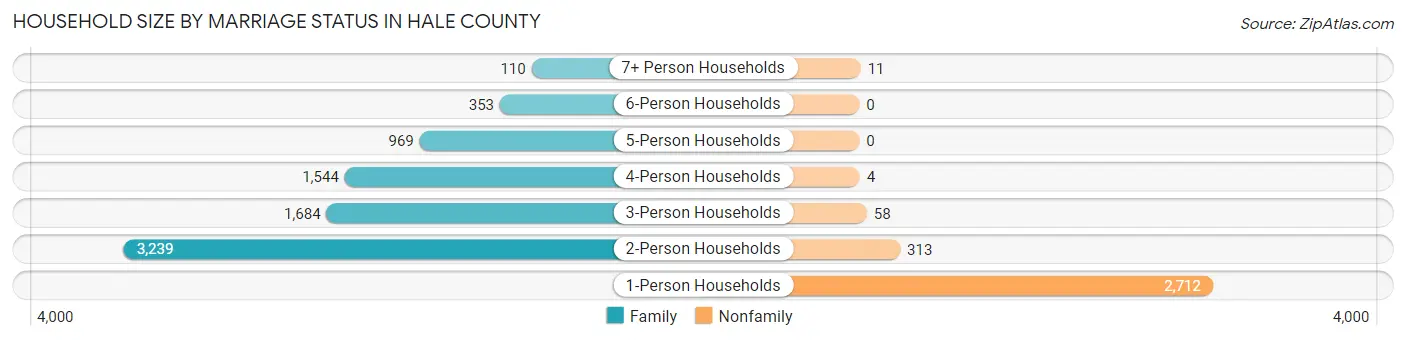
| Household Size | Family Households | Nonfamily Households |
| 1-Person Households | - | 2,712 (24.7%) |
| 2-Person Households | 3,239 (29.4%) | 313 (2.9%) |
| 3-Person Households | 1,684 (15.3%) | 58 (0.5%) |
| 4-Person Households | 1,544 (14.0%) | 4 (0.0%) |
| 5-Person Households | 969 (8.8%) | 0 (0.0%) |
| 6-Person Households | 353 (3.2%) | 0 (0.0%) |
| 7+ Person Households | 110 (1.0%) | 11 (0.1%) |
| Total | 7,899 (71.8%) | 3,098 (28.2%) |
Female Fertility in Hale County
Fertility by Age in Hale County
Average fertility rate in Hale County is 94.0 births per 1,000 women. Women in the age bracket of 20 to 34 years have the highest fertility rate with 210.0 births per 1,000 women. Women in the age bracket of 20 to 34 years acount for 91.3% of all women with births.
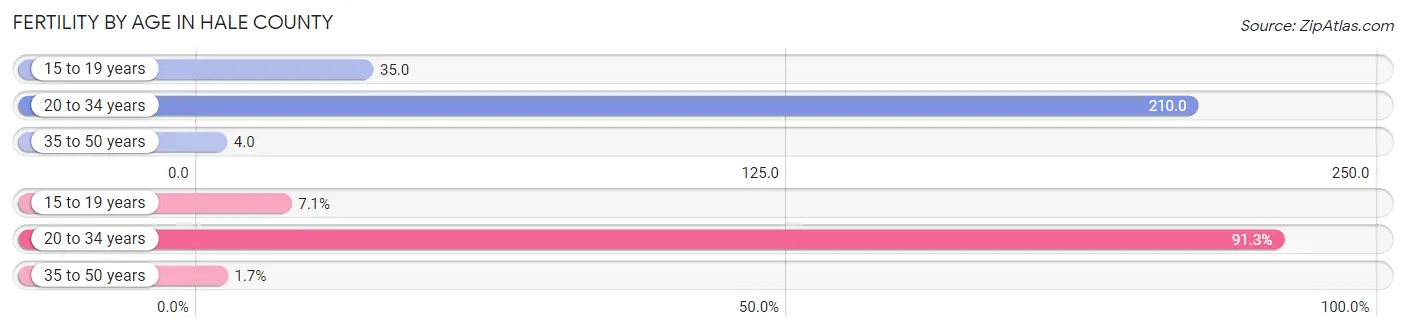
| Age Bracket | Women with Births | Births / 1,000 Women |
| 15 to 19 years | 47 (7.1%) | 35.0 |
| 20 to 34 years | 608 (91.3%) | 210.0 |
| 35 to 50 years | 11 (1.7%) | 4.0 |
| Total | 666 (100.0%) | 94.0 |
Fertility by Age by Marriage Status in Hale County
22.5% of women with births (666) in Hale County are married. The highest percentage of unmarried women with births falls into 20 to 34 years age bracket with 84.9% of them unmarried at the time of birth, while the lowest percentage of unmarried women with births belong to 15 to 19 years age bracket with 0.0% of them unmarried.
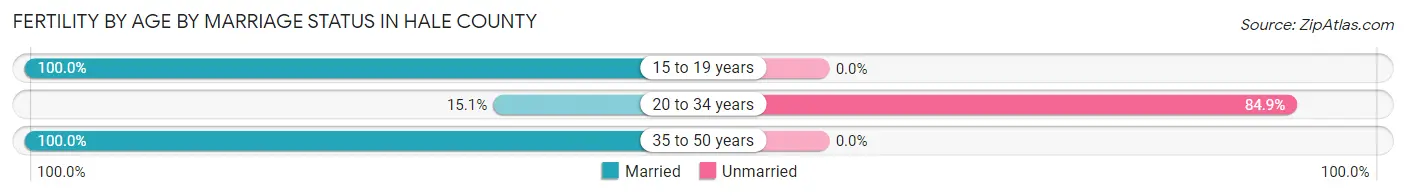
| Age Bracket | Married | Unmarried |
| 15 to 19 years | 47 (100.0%) | 0 (0.0%) |
| 20 to 34 years | 92 (15.1%) | 516 (84.9%) |
| 35 to 50 years | 11 (100.0%) | 0 (0.0%) |
| Total | 150 (22.5%) | 516 (77.5%) |
Fertility by Education in Hale County
Average fertility rate in Hale County is 94.0 births per 1,000 women. Women with the education attainment of college or associate's degree have the highest fertility rate of 117.0 births per 1,000 women, while women with the education attainment of graduate degree have the lowest fertility at 12.0 births per 1,000 women. Women with the education attainment of college or associate's degree represent 41.0% of all women with births.
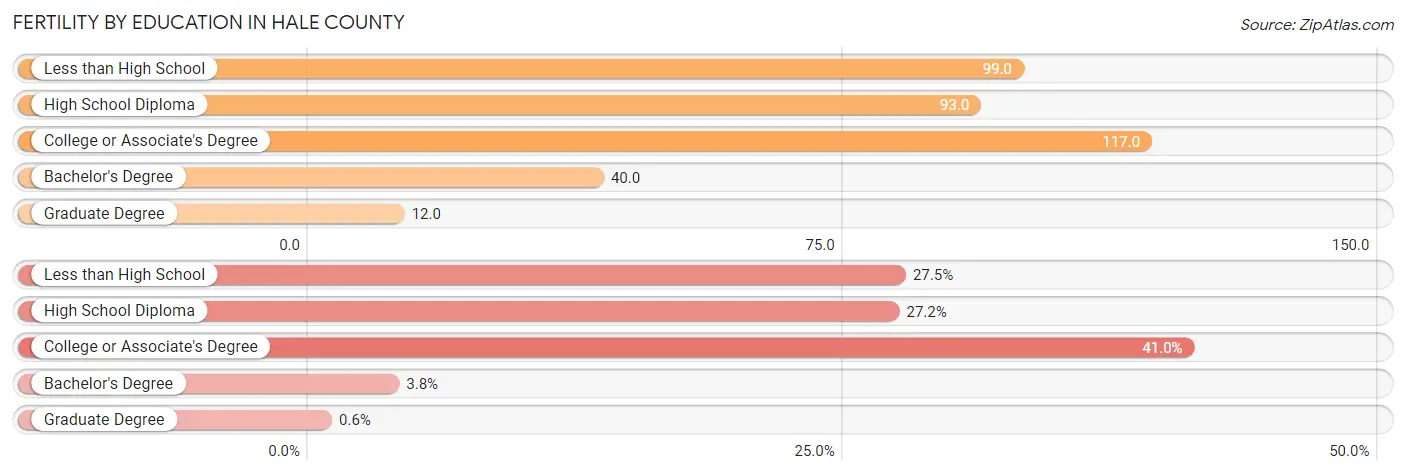
| Educational Attainment | Women with Births | Births / 1,000 Women |
| Less than High School | 183 (27.5%) | 99.0 |
| High School Diploma | 181 (27.2%) | 93.0 |
| College or Associate's Degree | 273 (41.0%) | 117.0 |
| Bachelor's Degree | 25 (3.7%) | 40.0 |
| Graduate Degree | 4 (0.6%) | 12.0 |
| Total | 666 (100.0%) | 94.0 |
Fertility by Education by Marriage Status in Hale County
77.5% of women with births in Hale County are unmarried. Women with the educational attainment of bachelor's degree are most likely to be married with 100.0% of them married at childbirth, while women with the educational attainment of less than high school are least likely to be married with 100.0% of them unmarried at childbirth.
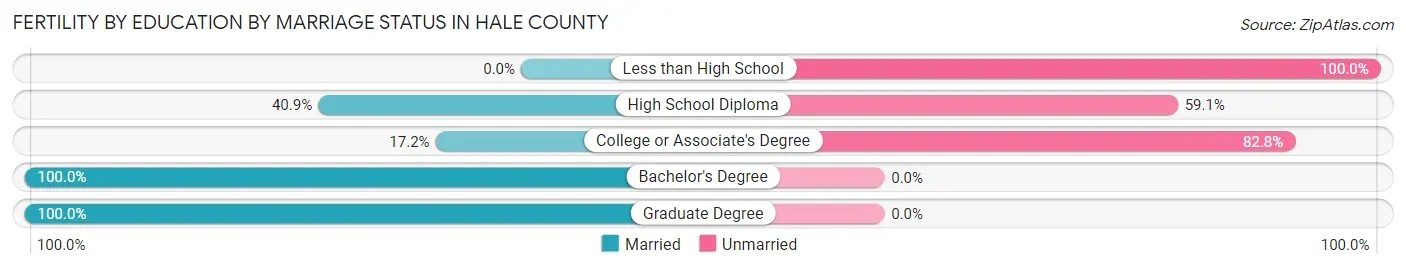
| Educational Attainment | Married | Unmarried |
| Less than High School | 0 (0.0%) | 183 (100.0%) |
| High School Diploma | 74 (40.9%) | 107 (59.1%) |
| College or Associate's Degree | 47 (17.2%) | 226 (82.8%) |
| Bachelor's Degree | 25 (100.0%) | 0 (0.0%) |
| Graduate Degree | 4 (100.0%) | 0 (0.0%) |
| Total | 150 (22.5%) | 516 (77.5%) |
Employment Characteristics in Hale County
Employment by Class of Employer in Hale County
Among the 13,458 employed individuals in Hale County, private company employees (9,001 | 66.9%), local government employees (1,216 | 9.0%), and state government employees (996 | 7.4%) make up the most common classes of employment.
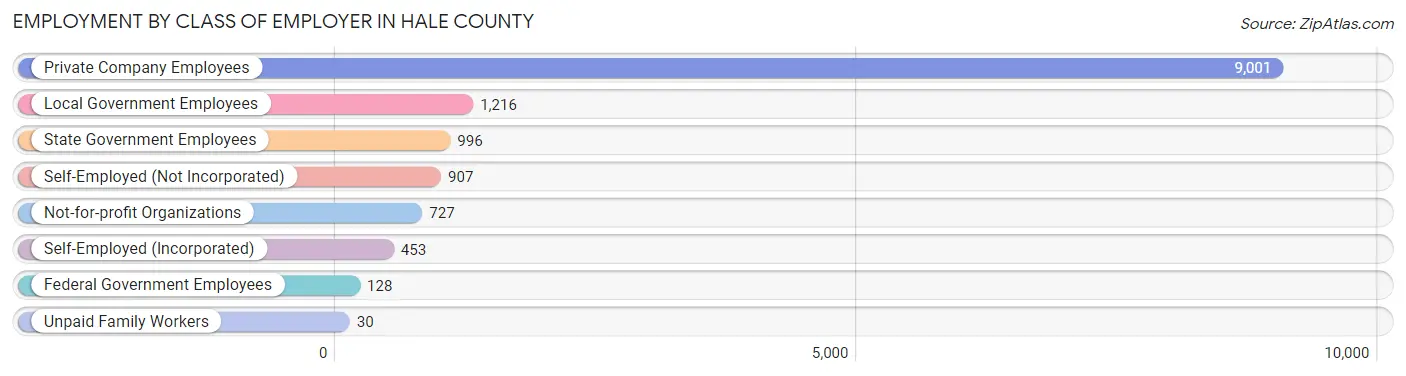
| Employer Class | # Employees | % Employees |
| Private Company Employees | 9,001 | 66.9% |
| Self-Employed (Incorporated) | 453 | 3.4% |
| Self-Employed (Not Incorporated) | 907 | 6.7% |
| Not-for-profit Organizations | 727 | 5.4% |
| Local Government Employees | 1,216 | 9.0% |
| State Government Employees | 996 | 7.4% |
| Federal Government Employees | 128 | 0.9% |
| Unpaid Family Workers | 30 | 0.2% |
| Total | 13,458 | 100.0% |
Employment Status by Age in Hale County
According to the labor force statistics for Hale County, out of the total population over 16 years of age (24,666), 59.4% or 14,652 individuals are in the labor force, with 4.7% or 689 of them unemployed. The age group with the highest labor force participation rate is 35 to 44 years, with 80.5% or 3,234 individuals in the labor force. Within the labor force, the 16 to 19 years age range has the highest percentage of unemployed individuals, with 20.2% or 198 of them being unemployed.
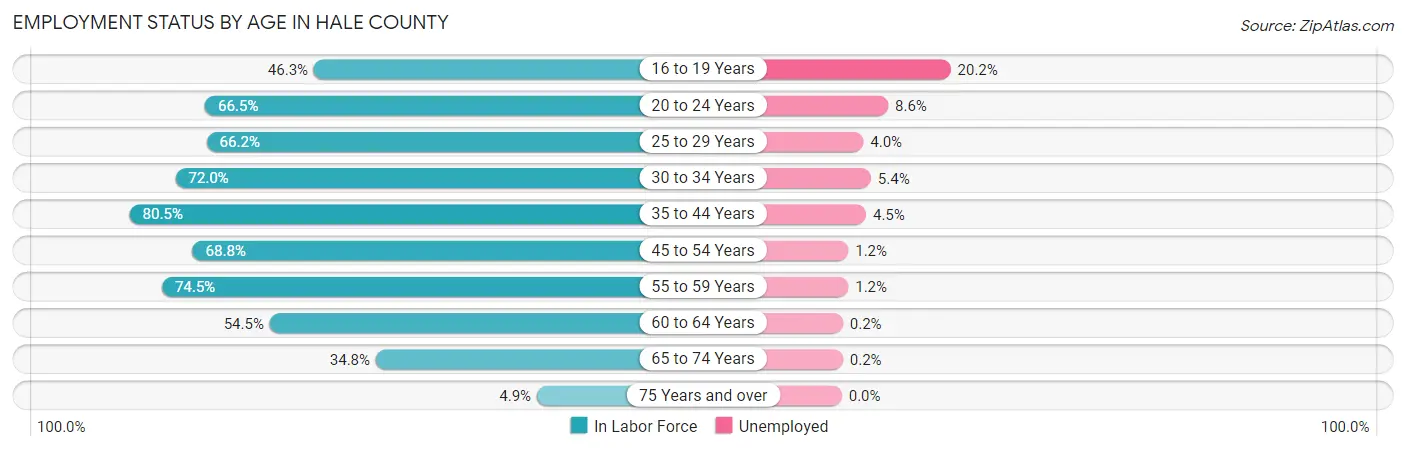
| Age Bracket | In Labor Force | Unemployed |
| 16 to 19 Years | 981 (46.3%) | 198 (20.2%) |
| 20 to 24 Years | 1,768 (66.5%) | 152 (8.6%) |
| 25 to 29 Years | 1,341 (66.2%) | 54 (4.0%) |
| 30 to 34 Years | 1,554 (72.0%) | 84 (5.4%) |
| 35 to 44 Years | 3,234 (80.5%) | 146 (4.5%) |
| 45 to 54 Years | 2,519 (68.8%) | 30 (1.2%) |
| 55 to 59 Years | 1,283 (74.5%) | 15 (1.2%) |
| 60 to 64 Years | 975 (54.5%) | 2 (0.2%) |
| 65 to 74 Years | 891 (34.8%) | 2 (0.2%) |
| 75 Years and over | 96 (4.9%) | 0 (0.0%) |
| Total | 14,652 (59.4%) | 689 (4.7%) |
Employment Status by Educational Attainment in Hale County
According to labor force statistics for Hale County, 70.9% of individuals (10,901) out of the total population between 25 and 64 years of age (15,375) are in the labor force, with 3.0% or 327 of them being unemployed. The group with the highest labor force participation rate are those with the educational attainment of bachelor's degree or higher, with 83.1% or 1,849 individuals in the labor force. Within the labor force, individuals with high school diploma education have the highest percentage of unemployment, with 4.5% or 170 of them being unemployed.
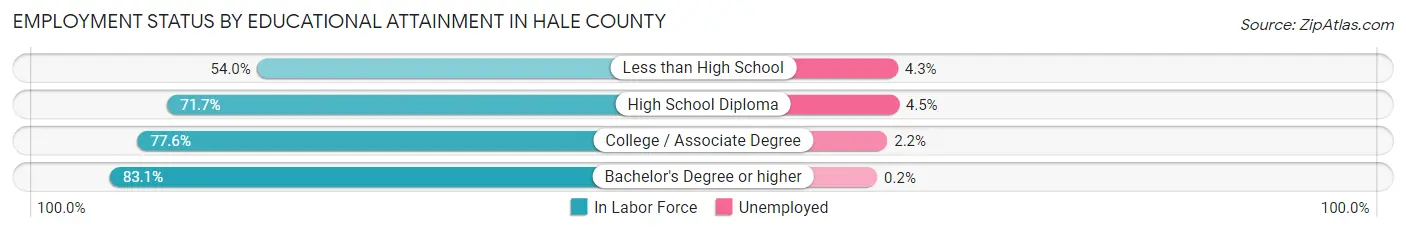
| Educational Attainment | In Labor Force | Unemployed |
| Less than High School | 1,915 (54.0%) | 152 (4.3%) |
| High School Diploma | 3,787 (71.7%) | 238 (4.5%) |
| College / Associate Degree | 3,354 (77.6%) | 95 (2.2%) |
| Bachelor's Degree or higher | 1,849 (83.1%) | 4 (0.2%) |
| Total | 10,901 (70.9%) | 461 (3.0%) |
Employment Occupations by Sex in Hale County
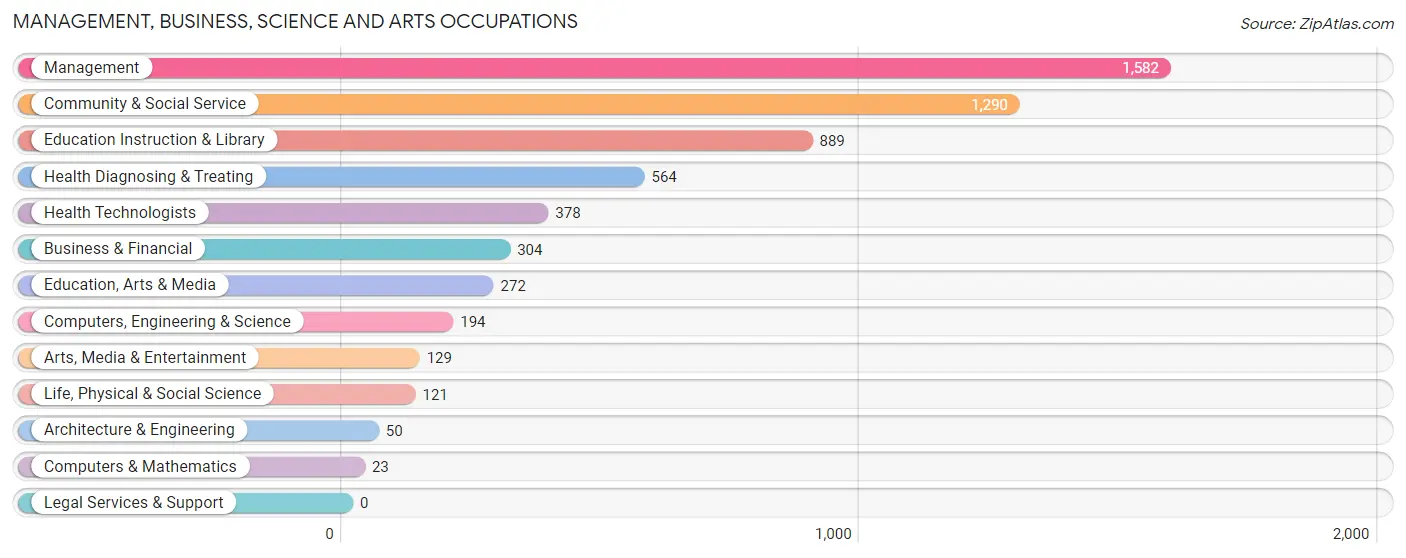
Management, Business, Science and Arts Occupations
The most common Management, Business, Science and Arts occupations in Hale County are Management (1,582 | 11.4%), Community & Social Service (1,290 | 9.3%), Education Instruction & Library (889 | 6.4%), Health Diagnosing & Treating (564 | 4.1%), and Health Technologists (378 | 2.7%).
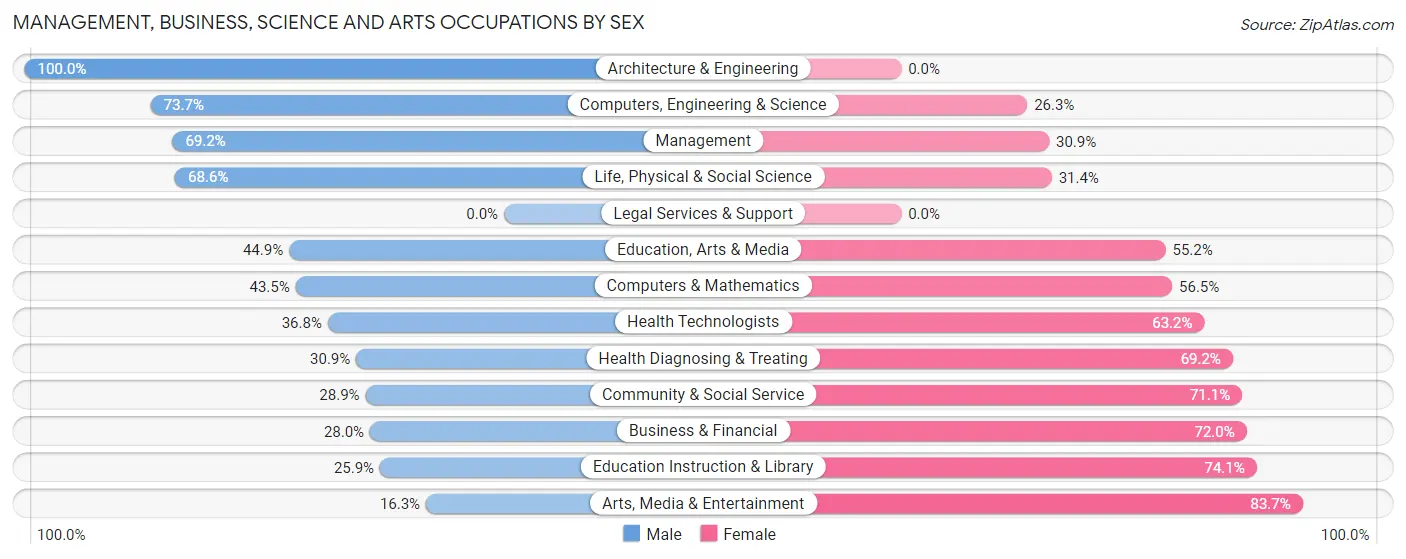
Management, Business, Science and Arts Occupations by Sex
Within the Management, Business, Science and Arts occupations in Hale County, the most male-oriented occupations are Architecture & Engineering (100.0%), Computers, Engineering & Science (73.7%), and Management (69.2%), while the most female-oriented occupations are Arts, Media & Entertainment (83.7%), Education Instruction & Library (74.1%), and Business & Financial (72.0%).
| Occupation | Male | Female |
| Management | 1,094 (69.2%) | 488 (30.8%) |
| Business & Financial | 85 (28.0%) | 219 (72.0%) |
| Computers, Engineering & Science | 143 (73.7%) | 51 (26.3%) |
| Computers & Mathematics | 10 (43.5%) | 13 (56.5%) |
| Architecture & Engineering | 50 (100.0%) | 0 (0.0%) |
| Life, Physical & Social Science | 83 (68.6%) | 38 (31.4%) |
| Community & Social Service | 373 (28.9%) | 917 (71.1%) |
| Education, Arts & Media | 122 (44.9%) | 150 (55.1%) |
| Legal Services & Support | 0 (0.0%) | 0 (0.0%) |
| Education Instruction & Library | 230 (25.9%) | 659 (74.1%) |
| Arts, Media & Entertainment | 21 (16.3%) | 108 (83.7%) |
| Health Diagnosing & Treating | 174 (30.8%) | 390 (69.2%) |
| Health Technologists | 139 (36.8%) | 239 (63.2%) |
| Total (Category) | 1,869 (47.5%) | 2,065 (52.5%) |
| Total (Overall) | 7,847 (56.4%) | 6,077 (43.6%) |
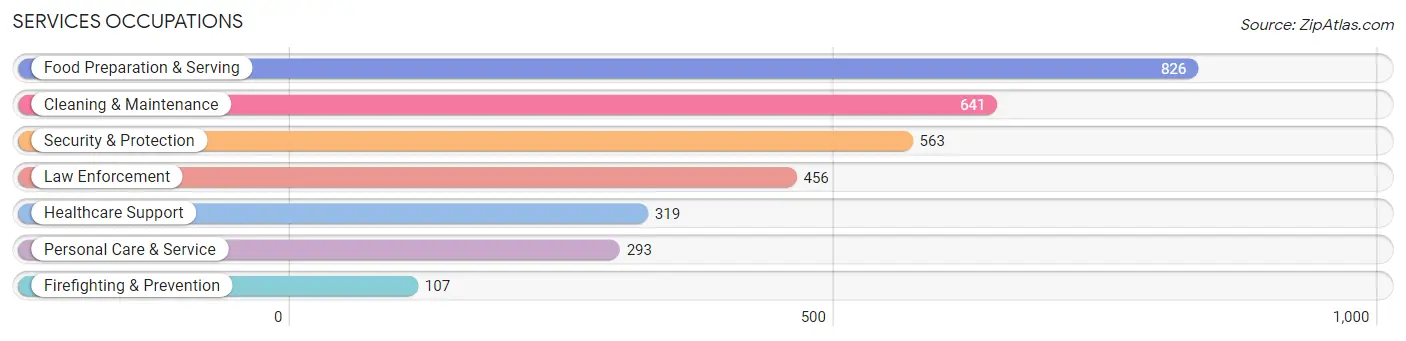
Services Occupations
The most common Services occupations in Hale County are Food Preparation & Serving (826 | 5.9%), Cleaning & Maintenance (641 | 4.6%), Security & Protection (563 | 4.0%), Law Enforcement (456 | 3.3%), and Healthcare Support (319 | 2.3%).
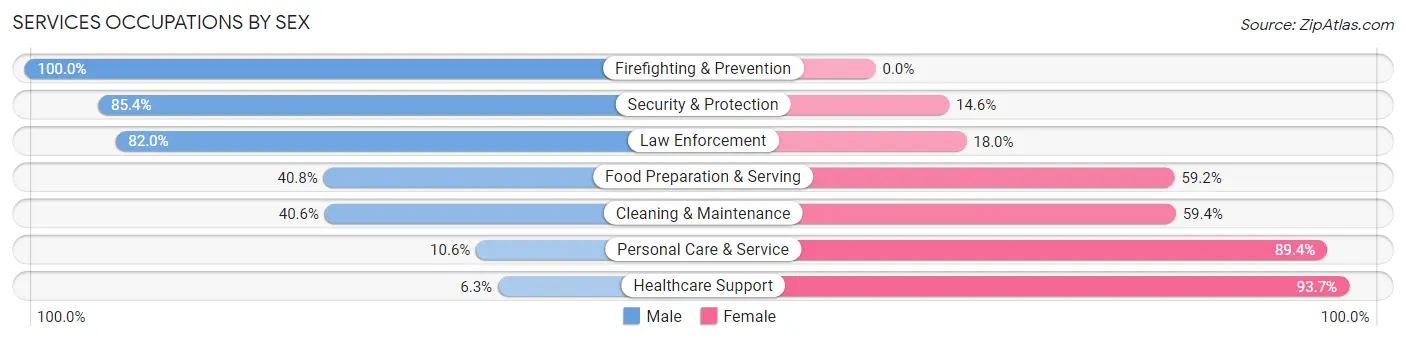
Services Occupations by Sex
Within the Services occupations in Hale County, the most male-oriented occupations are Firefighting & Prevention (100.0%), Security & Protection (85.4%), and Law Enforcement (82.0%), while the most female-oriented occupations are Healthcare Support (93.7%), Personal Care & Service (89.4%), and Cleaning & Maintenance (59.4%).
| Occupation | Male | Female |
| Healthcare Support | 20 (6.3%) | 299 (93.7%) |
| Security & Protection | 481 (85.4%) | 82 (14.6%) |
| Firefighting & Prevention | 107 (100.0%) | 0 (0.0%) |
| Law Enforcement | 374 (82.0%) | 82 (18.0%) |
| Food Preparation & Serving | 337 (40.8%) | 489 (59.2%) |
| Cleaning & Maintenance | 260 (40.6%) | 381 (59.4%) |
| Personal Care & Service | 31 (10.6%) | 262 (89.4%) |
| Total (Category) | 1,129 (42.7%) | 1,513 (57.3%) |
| Total (Overall) | 7,847 (56.4%) | 6,077 (43.6%) |
Sales and Office Occupations
The most common Sales and Office occupations in Hale County are Sales & Related (1,475 | 10.6%), and Office & Administration (1,475 | 10.6%).

Sales and Office Occupations by Sex

| Occupation | Male | Female |
| Sales & Related | 657 (44.5%) | 818 (55.5%) |
| Office & Administration | 258 (17.5%) | 1,217 (82.5%) |
| Total (Category) | 915 (31.0%) | 2,035 (69.0%) |
| Total (Overall) | 7,847 (56.4%) | 6,077 (43.6%) |
Natural Resources, Construction and Maintenance Occupations
The most common Natural Resources, Construction and Maintenance occupations in Hale County are Construction & Extraction (966 | 6.9%), Farming, Fishing & Forestry (498 | 3.6%), and Installation, Maintenance & Repair (361 | 2.6%).
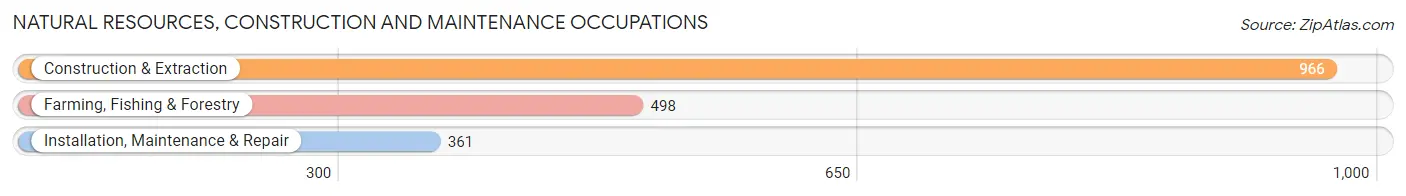
Natural Resources, Construction and Maintenance Occupations by Sex
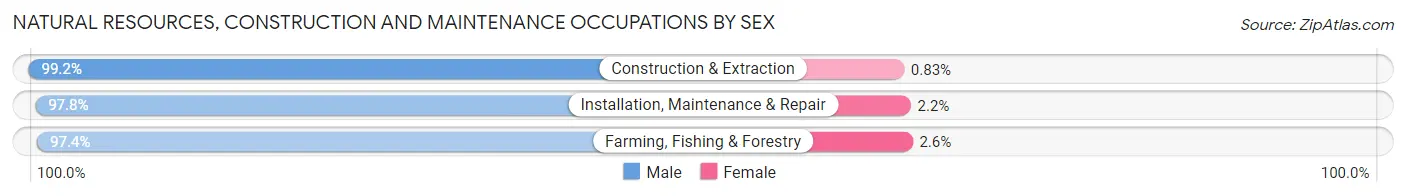
| Occupation | Male | Female |
| Farming, Fishing & Forestry | 485 (97.4%) | 13 (2.6%) |
| Construction & Extraction | 958 (99.2%) | 8 (0.8%) |
| Installation, Maintenance & Repair | 353 (97.8%) | 8 (2.2%) |
| Total (Category) | 1,796 (98.4%) | 29 (1.6%) |
| Total (Overall) | 7,847 (56.4%) | 6,077 (43.6%) |
Production, Transportation and Moving Occupations
The most common Production, Transportation and Moving occupations in Hale County are Material Moving (1,212 | 8.7%), Transportation (785 | 5.6%), and Production (576 | 4.1%).
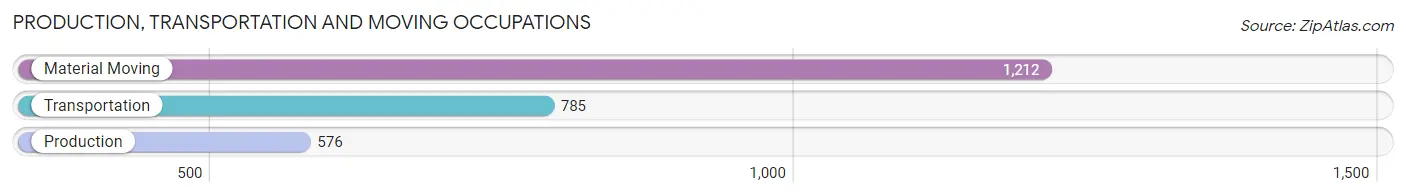
Production, Transportation and Moving Occupations by Sex
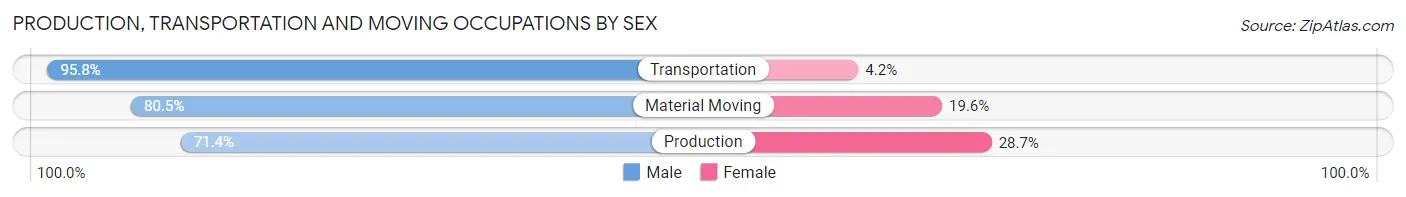
| Occupation | Male | Female |
| Production | 411 (71.4%) | 165 (28.6%) |
| Transportation | 752 (95.8%) | 33 (4.2%) |
| Material Moving | 975 (80.4%) | 237 (19.6%) |
| Total (Category) | 2,138 (83.1%) | 435 (16.9%) |
| Total (Overall) | 7,847 (56.4%) | 6,077 (43.6%) |
Employment Industries by Sex in Hale County
Employment Industries in Hale County
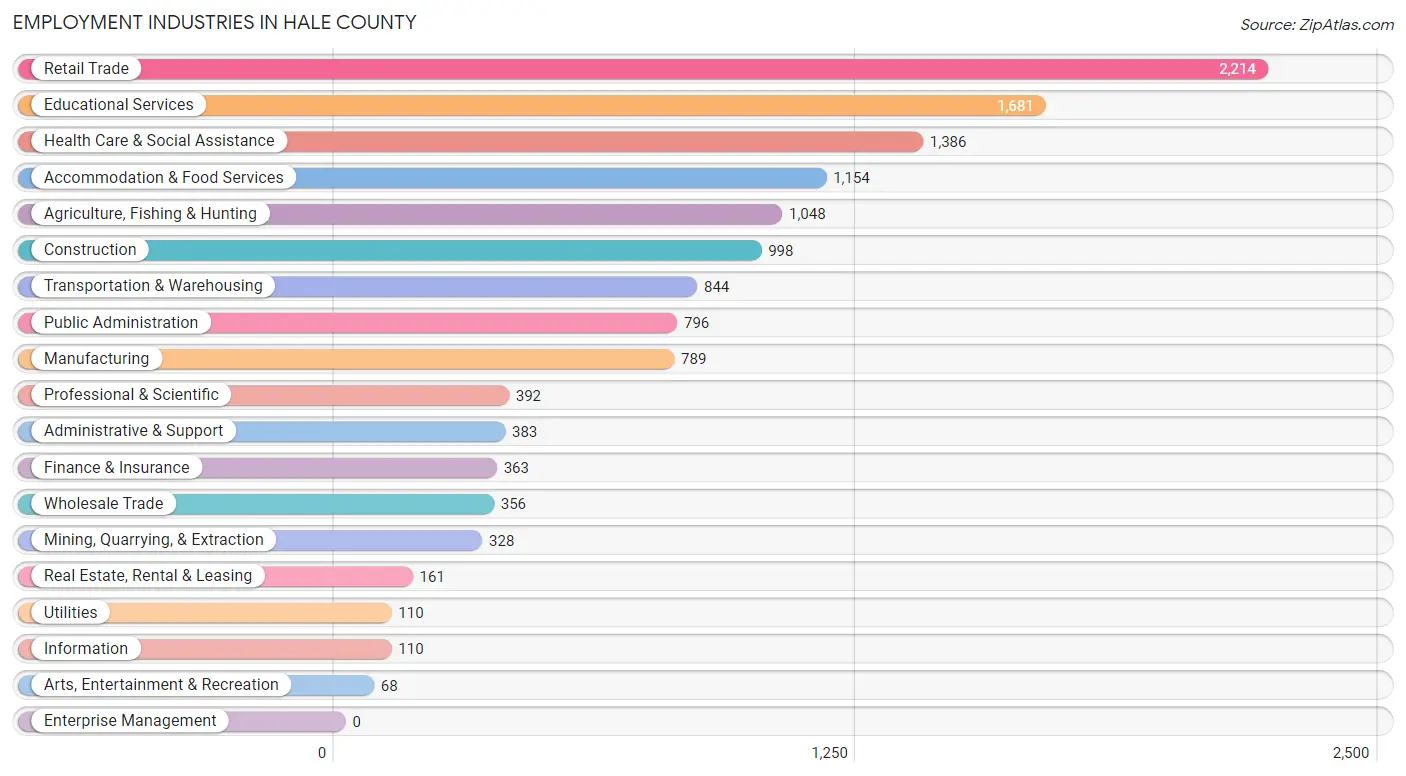
The major employment industries in Hale County include Retail Trade (2,214 | 15.9%), Educational Services (1,681 | 12.1%), Health Care & Social Assistance (1,386 | 10.0%), Accommodation & Food Services (1,154 | 8.3%), and Agriculture, Fishing & Hunting (1,048 | 7.5%).
Employment Industries by Sex in Hale County
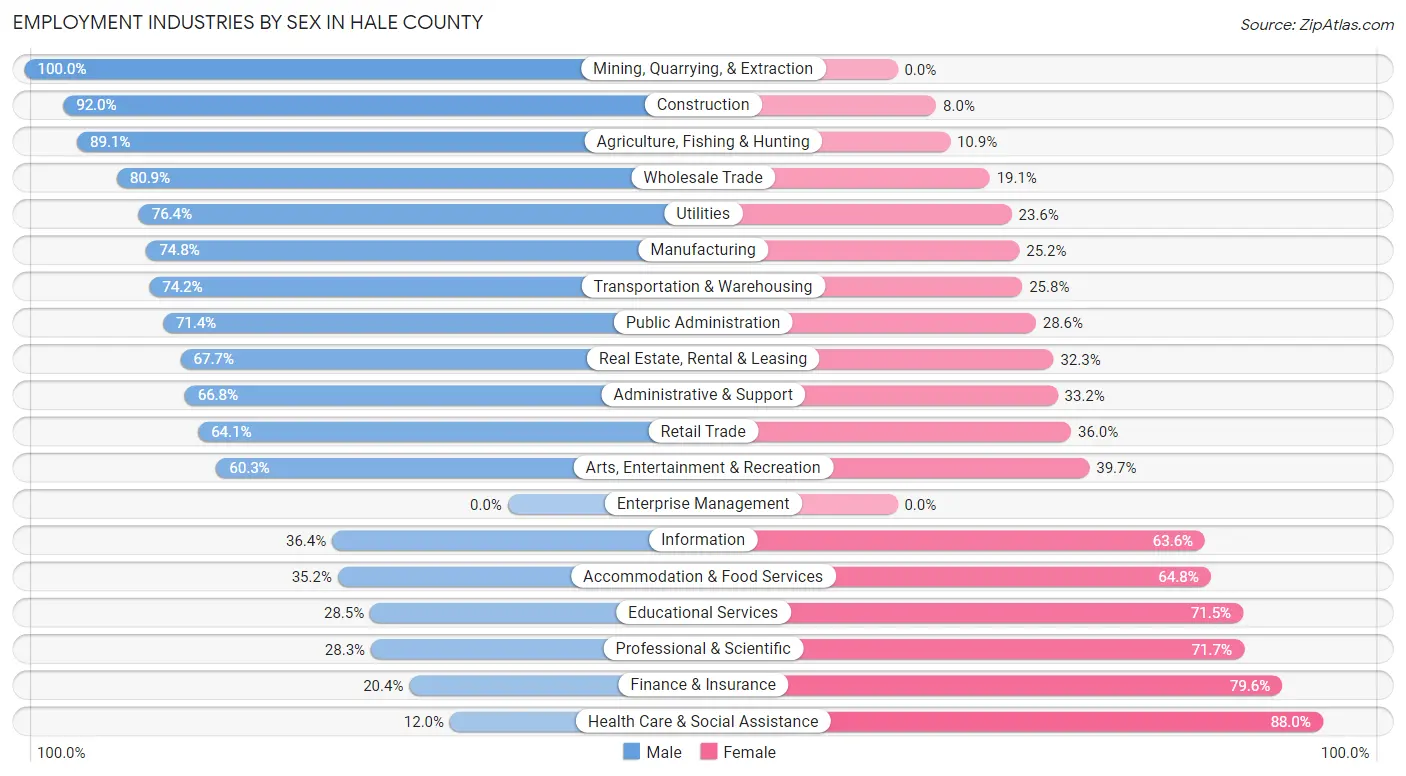
The Hale County industries that see more men than women are Mining, Quarrying, & Extraction (100.0%), Construction (92.0%), and Agriculture, Fishing & Hunting (89.1%), whereas the industries that tend to have a higher number of women are Health Care & Social Assistance (88.0%), Finance & Insurance (79.6%), and Professional & Scientific (71.7%).
| Industry | Male | Female |
| Agriculture, Fishing & Hunting | 934 (89.1%) | 114 (10.9%) |
| Mining, Quarrying, & Extraction | 328 (100.0%) | 0 (0.0%) |
| Construction | 918 (92.0%) | 80 (8.0%) |
| Manufacturing | 590 (74.8%) | 199 (25.2%) |
| Wholesale Trade | 288 (80.9%) | 68 (19.1%) |
| Retail Trade | 1,418 (64.0%) | 796 (35.9%) |
| Transportation & Warehousing | 626 (74.2%) | 218 (25.8%) |
| Utilities | 84 (76.4%) | 26 (23.6%) |
| Information | 40 (36.4%) | 70 (63.6%) |
| Finance & Insurance | 74 (20.4%) | 289 (79.6%) |
| Real Estate, Rental & Leasing | 109 (67.7%) | 52 (32.3%) |
| Professional & Scientific | 111 (28.3%) | 281 (71.7%) |
| Enterprise Management | 0 (0.0%) | 0 (0.0%) |
| Administrative & Support | 256 (66.8%) | 127 (33.2%) |
| Educational Services | 479 (28.5%) | 1,202 (71.5%) |
| Health Care & Social Assistance | 166 (12.0%) | 1,220 (88.0%) |
| Arts, Entertainment & Recreation | 41 (60.3%) | 27 (39.7%) |
| Accommodation & Food Services | 406 (35.2%) | 748 (64.8%) |
| Public Administration | 568 (71.4%) | 228 (28.6%) |
| Total | 7,847 (56.4%) | 6,077 (43.6%) |
Education in Hale County
School Enrollment in Hale County
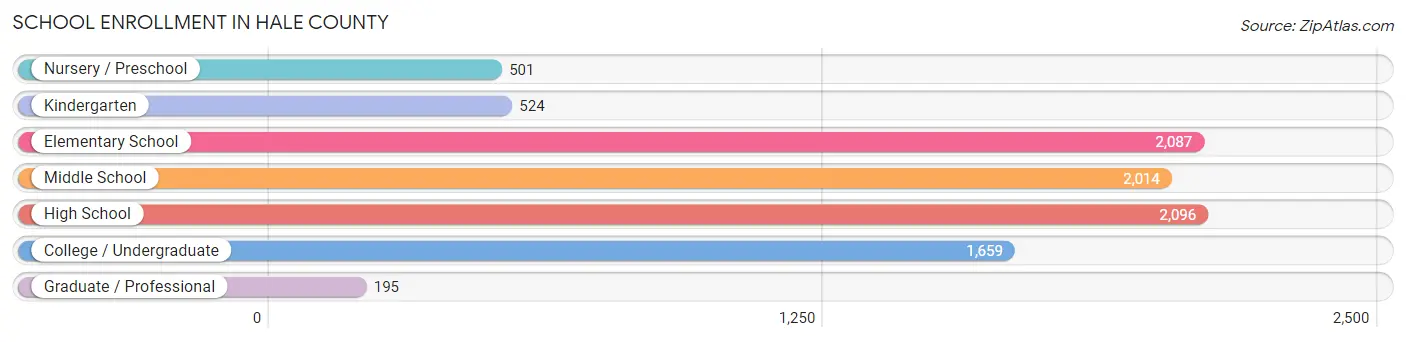
The most common levels of schooling among the 9,076 students in Hale County are high school (2,096 | 23.1%), elementary school (2,087 | 23.0%), and middle school (2,014 | 22.2%).
| School Level | # Students | % Students |
| Nursery / Preschool | 501 | 5.5% |
| Kindergarten | 524 | 5.8% |
| Elementary School | 2,087 | 23.0% |
| Middle School | 2,014 | 22.2% |
| High School | 2,096 | 23.1% |
| College / Undergraduate | 1,659 | 18.3% |
| Graduate / Professional | 195 | 2.1% |
| Total | 9,076 | 100.0% |
School Enrollment by Age by Funding Source in Hale County
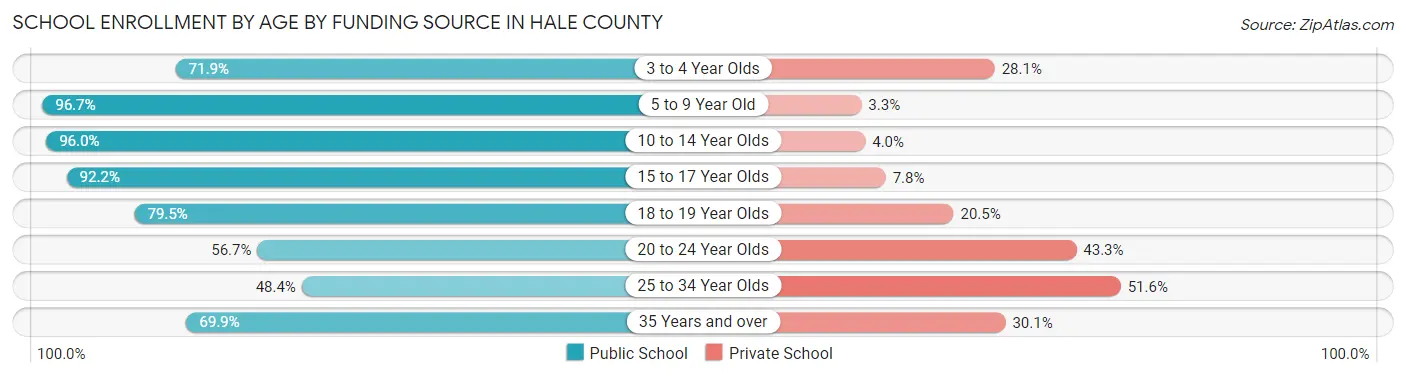
Out of a total of 9,076 students who are enrolled in schools in Hale County, 1,216 (13.4%) attend a private institution, while the remaining 7,860 (86.6%) are enrolled in public schools. The age group of 25 to 34 year olds has the highest likelihood of being enrolled in private schools, with 224 (51.6% in the age bracket) enrolled. Conversely, the age group of 5 to 9 year old has the lowest likelihood of being enrolled in a private school, with 2,314 (96.7% in the age bracket) attending a public institution.
| Age Bracket | Public School | Private School |
| 3 to 4 Year Olds | 286 (71.9%) | 112 (28.1%) |
| 5 to 9 Year Old | 2,314 (96.7%) | 79 (3.3%) |
| 10 to 14 Year Olds | 2,498 (96.0%) | 105 (4.0%) |
| 15 to 17 Year Olds | 1,331 (92.2%) | 113 (7.8%) |
| 18 to 19 Year Olds | 509 (79.5%) | 131 (20.5%) |
| 20 to 24 Year Olds | 417 (56.7%) | 319 (43.3%) |
| 25 to 34 Year Olds | 210 (48.4%) | 224 (51.6%) |
| 35 Years and over | 299 (69.9%) | 129 (30.1%) |
| Total | 7,860 (86.6%) | 1,216 (13.4%) |
Educational Attainment by Field of Study in Hale County
Education (679 | 22.7%), business (613 | 20.4%), bio, nature & agricultural (426 | 14.2%), arts & humanities (263 | 8.8%), and science & technology (190 | 6.3%) are the most common fields of study among 2,997 individuals in Hale County who have obtained a bachelor's degree or higher.
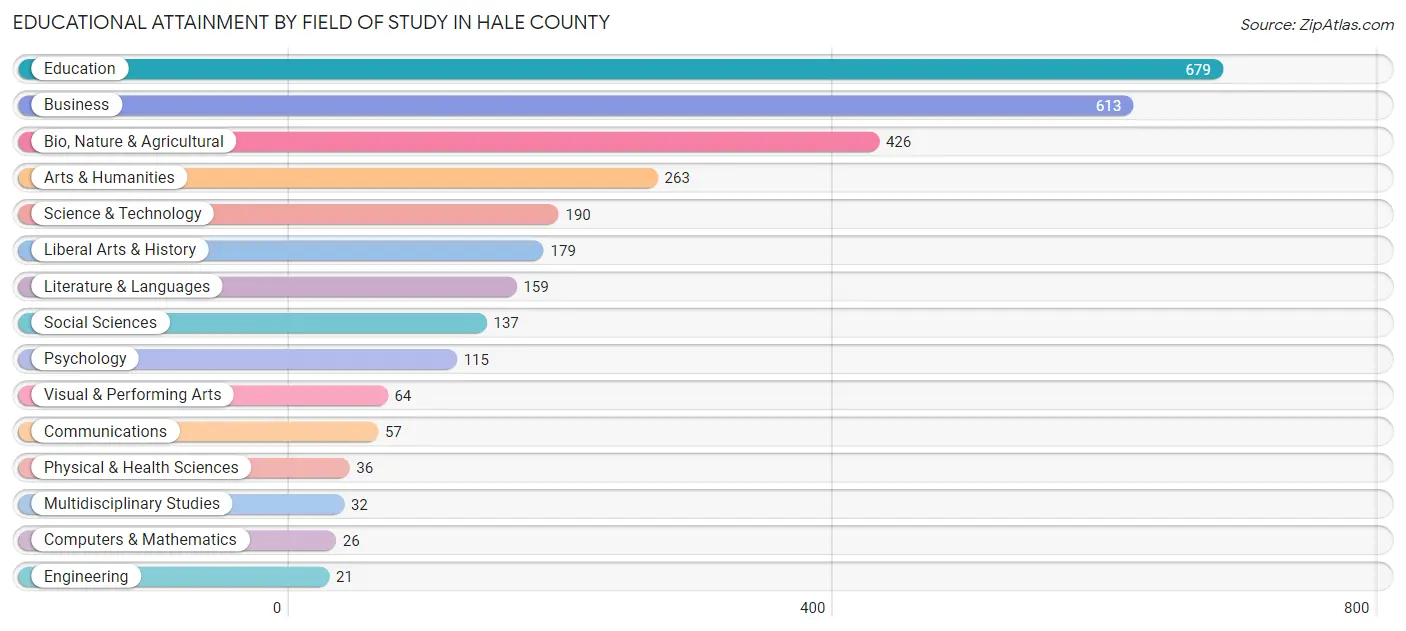
| Field of Study | # Graduates | % Graduates |
| Computers & Mathematics | 26 | 0.9% |
| Bio, Nature & Agricultural | 426 | 14.2% |
| Physical & Health Sciences | 36 | 1.2% |
| Psychology | 115 | 3.8% |
| Social Sciences | 137 | 4.6% |
| Engineering | 21 | 0.7% |
| Multidisciplinary Studies | 32 | 1.1% |
| Science & Technology | 190 | 6.3% |
| Business | 613 | 20.4% |
| Education | 679 | 22.7% |
| Literature & Languages | 159 | 5.3% |
| Liberal Arts & History | 179 | 6.0% |
| Visual & Performing Arts | 64 | 2.1% |
| Communications | 57 | 1.9% |
| Arts & Humanities | 263 | 8.8% |
| Total | 2,997 | 100.0% |
Transportation & Commute in Hale County
Vehicle Availability by Sex in Hale County
The most prevalent vehicle ownership categories in Hale County are males with 2 vehicles (3,046, accounting for 40.4%) and females with 2 vehicles (2,594, making up 52.5%).
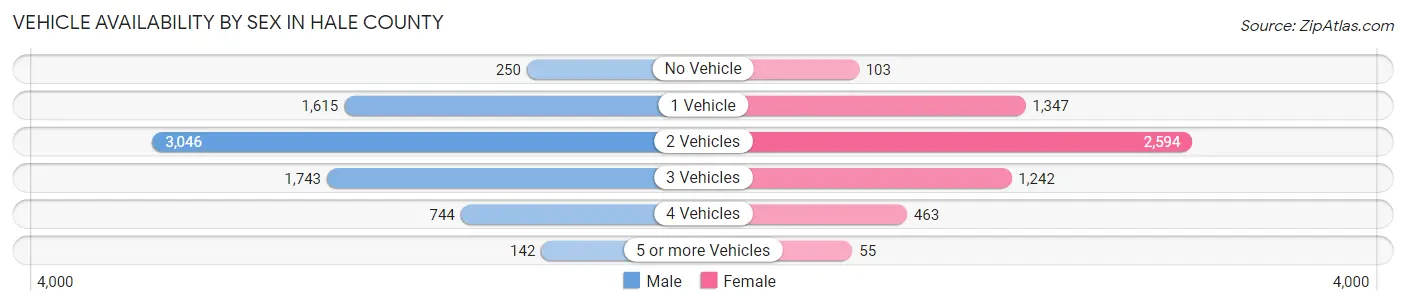
| Vehicles Available | Male | Female |
| No Vehicle | 250 (3.3%) | 103 (1.8%) |
| 1 Vehicle | 1,615 (21.4%) | 1,347 (23.2%) |
| 2 Vehicles | 3,046 (40.4%) | 2,594 (44.7%) |
| 3 Vehicles | 1,743 (23.1%) | 1,242 (21.4%) |
| 4 Vehicles | 744 (9.9%) | 463 (8.0%) |
| 5 or more Vehicles | 142 (1.9%) | 55 (0.9%) |
| Total | 7,540 (100.0%) | 5,804 (100.0%) |
Commute Time in Hale County
The most frequently occuring commute durations in Hale County are 5 to 9 minutes (3,460 commuters, 26.3%), 10 to 14 minutes (2,673 commuters, 20.3%), and 15 to 19 minutes (1,931 commuters, 14.7%).
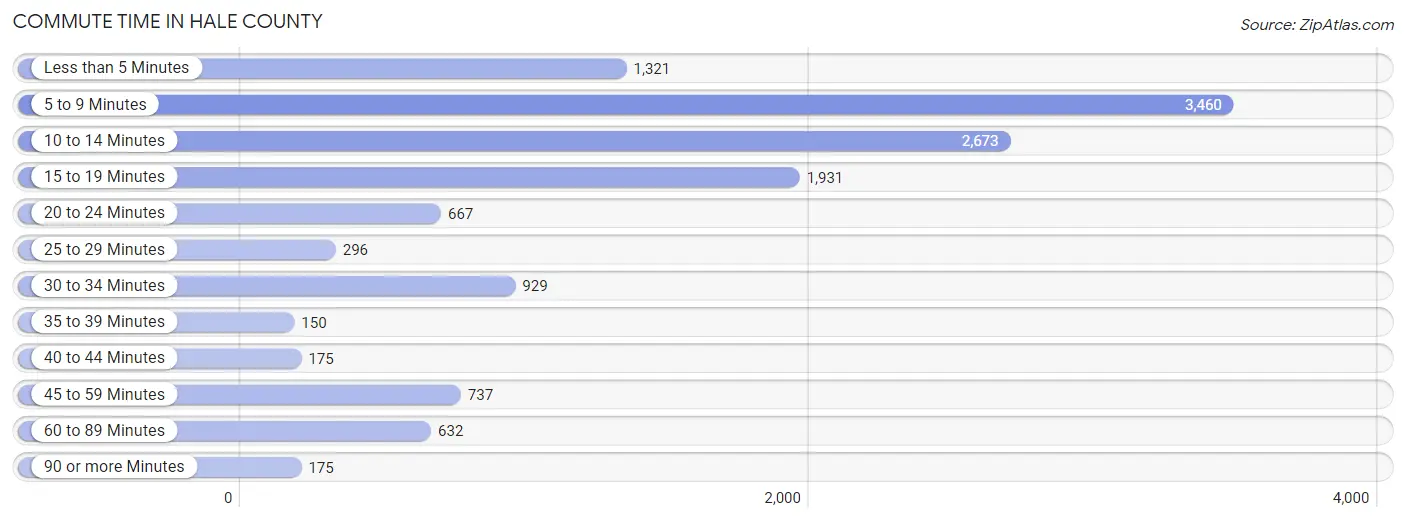
| Commute Time | # Commuters | % Commuters |
| Less than 5 Minutes | 1,321 | 10.1% |
| 5 to 9 Minutes | 3,460 | 26.3% |
| 10 to 14 Minutes | 2,673 | 20.3% |
| 15 to 19 Minutes | 1,931 | 14.7% |
| 20 to 24 Minutes | 667 | 5.1% |
| 25 to 29 Minutes | 296 | 2.2% |
| 30 to 34 Minutes | 929 | 7.1% |
| 35 to 39 Minutes | 150 | 1.1% |
| 40 to 44 Minutes | 175 | 1.3% |
| 45 to 59 Minutes | 737 | 5.6% |
| 60 to 89 Minutes | 632 | 4.8% |
| 90 or more Minutes | 175 | 1.3% |
Commute Time by Sex in Hale County
The most common commute times in Hale County are 5 to 9 minutes (1,671 commuters, 22.6%) for males and 5 to 9 minutes (1,789 commuters, 31.1%) for females.
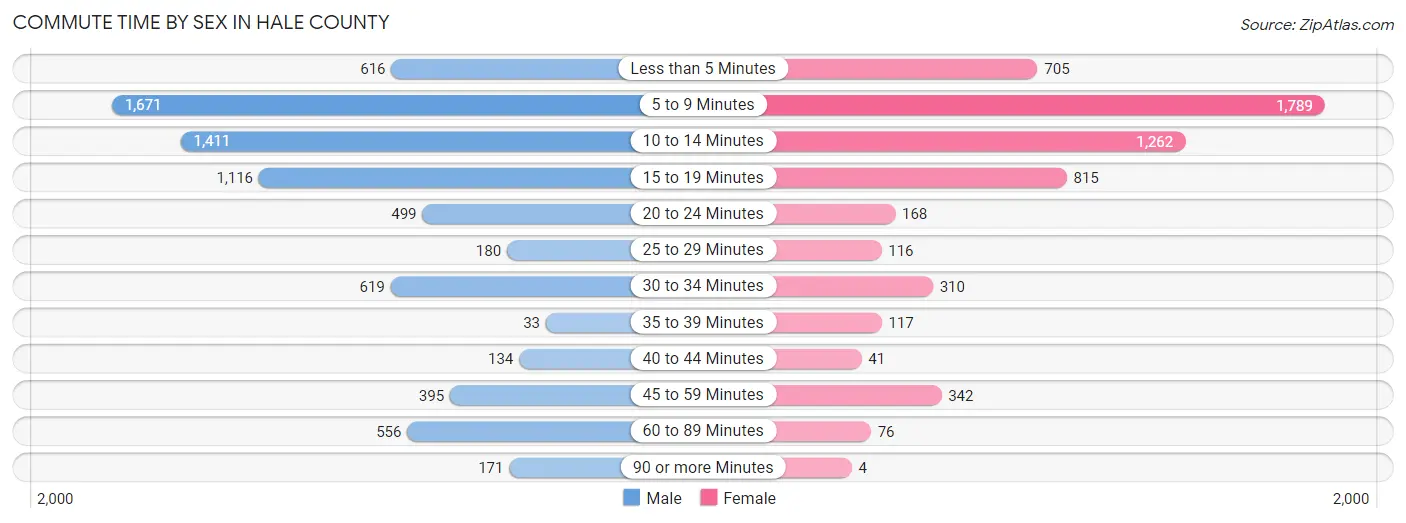
| Commute Time | Male | Female |
| Less than 5 Minutes | 616 (8.3%) | 705 (12.3%) |
| 5 to 9 Minutes | 1,671 (22.6%) | 1,789 (31.1%) |
| 10 to 14 Minutes | 1,411 (19.1%) | 1,262 (22.0%) |
| 15 to 19 Minutes | 1,116 (15.1%) | 815 (14.2%) |
| 20 to 24 Minutes | 499 (6.7%) | 168 (2.9%) |
| 25 to 29 Minutes | 180 (2.4%) | 116 (2.0%) |
| 30 to 34 Minutes | 619 (8.4%) | 310 (5.4%) |
| 35 to 39 Minutes | 33 (0.4%) | 117 (2.0%) |
| 40 to 44 Minutes | 134 (1.8%) | 41 (0.7%) |
| 45 to 59 Minutes | 395 (5.3%) | 342 (5.9%) |
| 60 to 89 Minutes | 556 (7.5%) | 76 (1.3%) |
| 90 or more Minutes | 171 (2.3%) | 4 (0.1%) |
Time of Departure to Work by Sex in Hale County
The most frequent times of departure to work in Hale County are 7:00 AM to 7:29 AM (1,209, 16.3%) for males and 7:30 AM to 7:59 AM (957, 16.7%) for females.
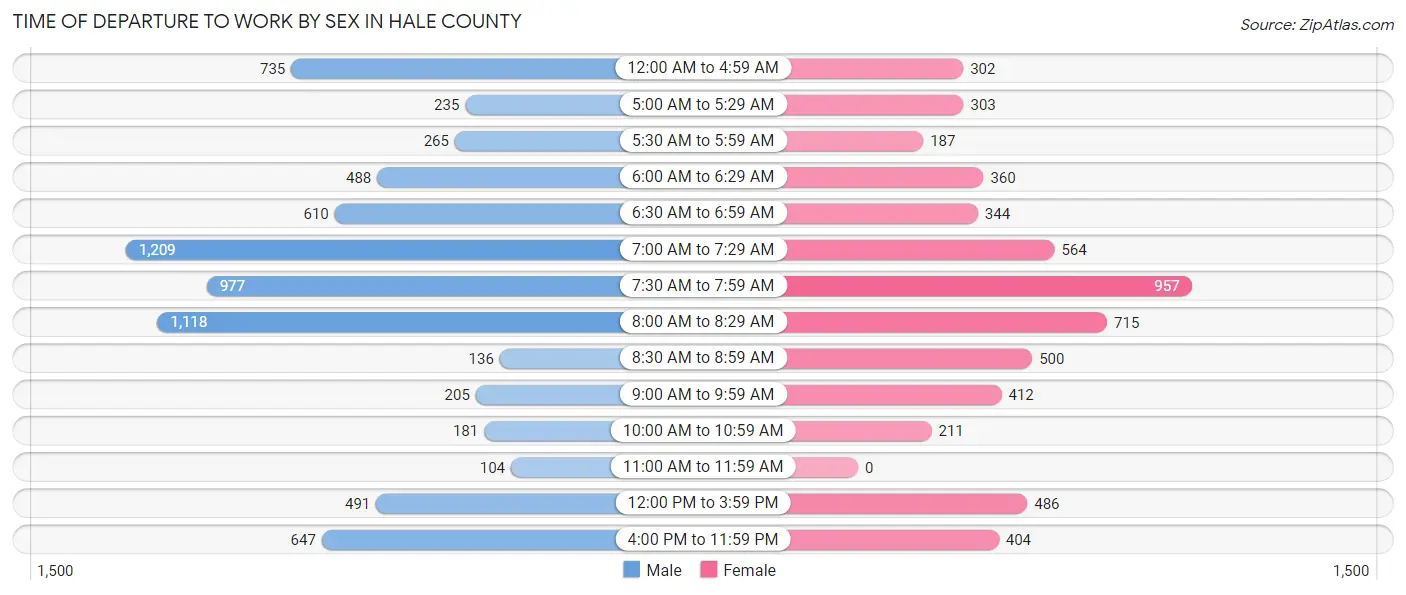
| Time of Departure | Male | Female |
| 12:00 AM to 4:59 AM | 735 (9.9%) | 302 (5.3%) |
| 5:00 AM to 5:29 AM | 235 (3.2%) | 303 (5.3%) |
| 5:30 AM to 5:59 AM | 265 (3.6%) | 187 (3.3%) |
| 6:00 AM to 6:29 AM | 488 (6.6%) | 360 (6.3%) |
| 6:30 AM to 6:59 AM | 610 (8.2%) | 344 (6.0%) |
| 7:00 AM to 7:29 AM | 1,209 (16.3%) | 564 (9.8%) |
| 7:30 AM to 7:59 AM | 977 (13.2%) | 957 (16.7%) |
| 8:00 AM to 8:29 AM | 1,118 (15.1%) | 715 (12.4%) |
| 8:30 AM to 8:59 AM | 136 (1.8%) | 500 (8.7%) |
| 9:00 AM to 9:59 AM | 205 (2.8%) | 412 (7.2%) |
| 10:00 AM to 10:59 AM | 181 (2.5%) | 211 (3.7%) |
| 11:00 AM to 11:59 AM | 104 (1.4%) | 0 (0.0%) |
| 12:00 PM to 3:59 PM | 491 (6.6%) | 486 (8.5%) |
| 4:00 PM to 11:59 PM | 647 (8.7%) | 404 (7.0%) |
| Total | 7,401 (100.0%) | 5,745 (100.0%) |
Housing Occupancy in Hale County
Occupancy by Ownership in Hale County
Of the total 10,997 dwellings in Hale County, owner-occupied units account for 6,789 (61.7%), while renter-occupied units make up 4,208 (38.3%).
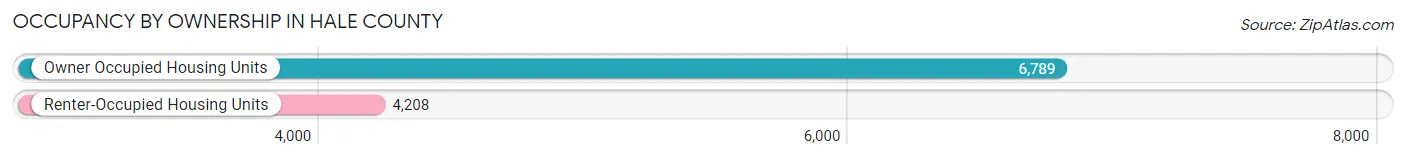
| Occupancy | # Housing Units | % Housing Units |
| Owner Occupied Housing Units | 6,789 | 61.7% |
| Renter-Occupied Housing Units | 4,208 | 38.3% |
| Total Occupied Housing Units | 10,997 | 100.0% |
Occupancy by Household Size in Hale County
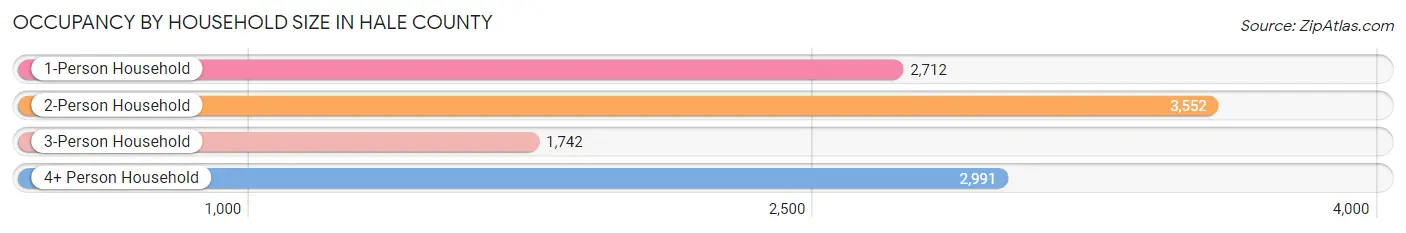
| Household Size | # Housing Units | % Housing Units |
| 1-Person Household | 2,712 | 24.7% |
| 2-Person Household | 3,552 | 32.3% |
| 3-Person Household | 1,742 | 15.8% |
| 4+ Person Household | 2,991 | 27.2% |
| Total Housing Units | 10,997 | 100.0% |
Occupancy by Ownership by Household Size in Hale County
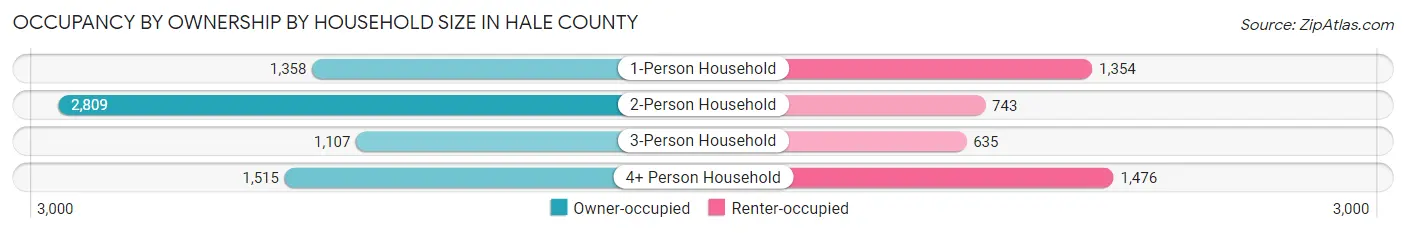
| Household Size | Owner-occupied | Renter-occupied |
| 1-Person Household | 1,358 (50.1%) | 1,354 (49.9%) |
| 2-Person Household | 2,809 (79.1%) | 743 (20.9%) |
| 3-Person Household | 1,107 (63.5%) | 635 (36.4%) |
| 4+ Person Household | 1,515 (50.6%) | 1,476 (49.3%) |
| Total Housing Units | 6,789 (61.7%) | 4,208 (38.3%) |
Occupancy by Educational Attainment in Hale County
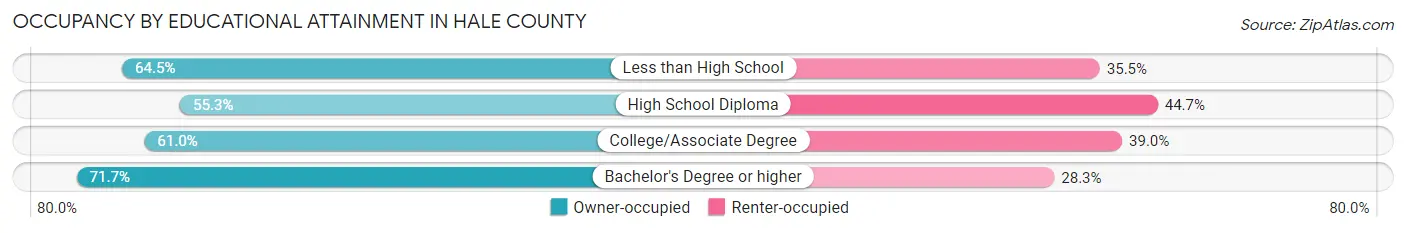
| Household Size | Owner-occupied | Renter-occupied |
| Less than High School | 1,720 (64.5%) | 946 (35.5%) |
| High School Diploma | 1,900 (55.3%) | 1,534 (44.7%) |
| College/Associate Degree | 1,953 (61.0%) | 1,249 (39.0%) |
| Bachelor's Degree or higher | 1,216 (71.7%) | 479 (28.3%) |
Occupancy by Age of Householder in Hale County
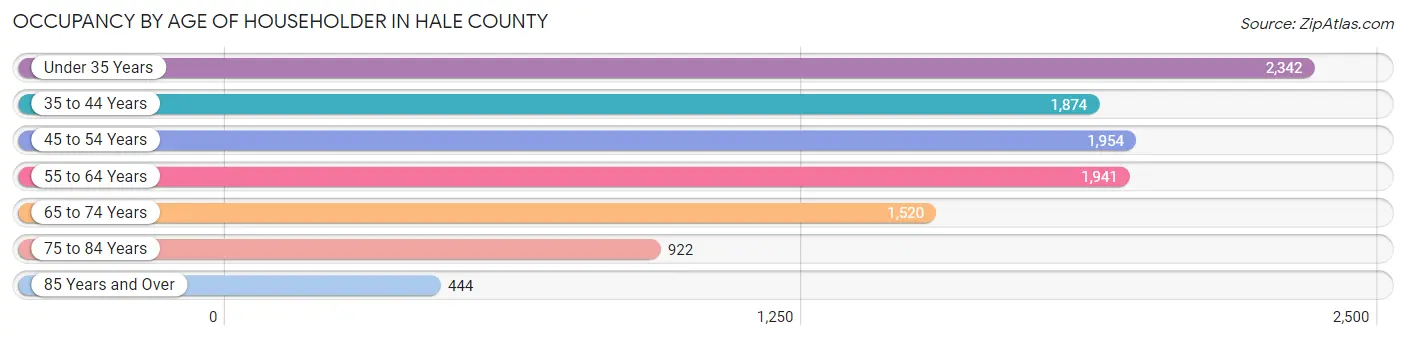
| Age Bracket | # Households | % Households |
| Under 35 Years | 2,342 | 21.3% |
| 35 to 44 Years | 1,874 | 17.0% |
| 45 to 54 Years | 1,954 | 17.8% |
| 55 to 64 Years | 1,941 | 17.6% |
| 65 to 74 Years | 1,520 | 13.8% |
| 75 to 84 Years | 922 | 8.4% |
| 85 Years and Over | 444 | 4.0% |
| Total | 10,997 | 100.0% |
Housing Finances in Hale County
Median Income by Occupancy in Hale County
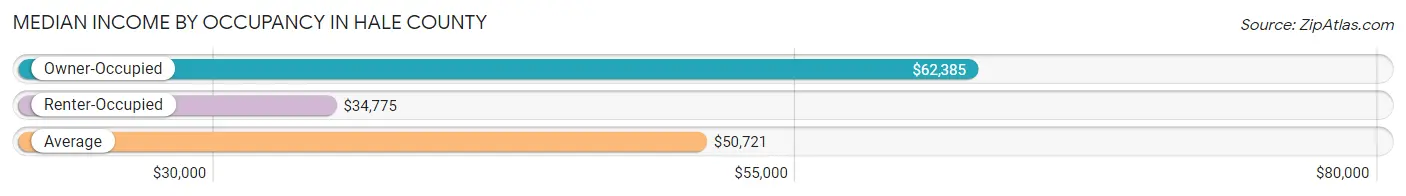
| Occupancy Type | # Households | Median Income |
| Owner-Occupied | 6,789 (61.7%) | $62,385 |
| Renter-Occupied | 4,208 (38.3%) | $34,775 |
| Average | 10,997 (100.0%) | $50,721 |
Occupancy by Householder Income Bracket in Hale County
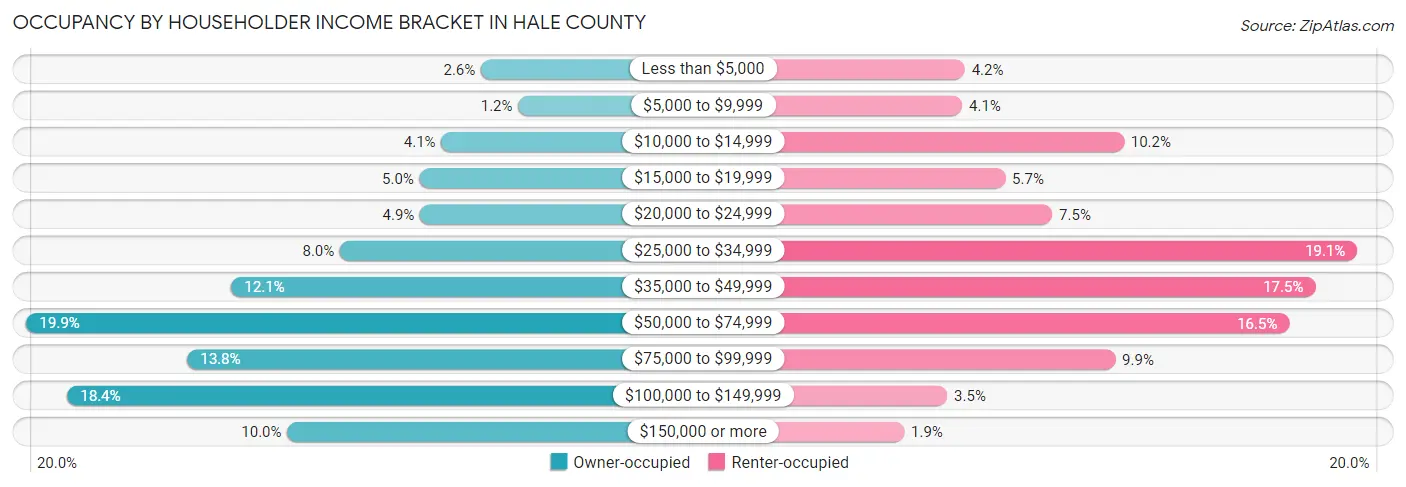
| Income Bracket | Owner-occupied | Renter-occupied |
| Less than $5,000 | 177 (2.6%) | 175 (4.2%) |
| $5,000 to $9,999 | 81 (1.2%) | 171 (4.1%) |
| $10,000 to $14,999 | 280 (4.1%) | 430 (10.2%) |
| $15,000 to $19,999 | 336 (5.0%) | 240 (5.7%) |
| $20,000 to $24,999 | 335 (4.9%) | 315 (7.5%) |
| $25,000 to $34,999 | 542 (8.0%) | 804 (19.1%) |
| $35,000 to $49,999 | 823 (12.1%) | 737 (17.5%) |
| $50,000 to $74,999 | 1,353 (19.9%) | 695 (16.5%) |
| $75,000 to $99,999 | 937 (13.8%) | 416 (9.9%) |
| $100,000 to $149,999 | 1,247 (18.4%) | 147 (3.5%) |
| $150,000 or more | 678 (10.0%) | 78 (1.8%) |
| Total | 6,789 (100.0%) | 4,208 (100.0%) |
Monthly Housing Cost Tiers in Hale County
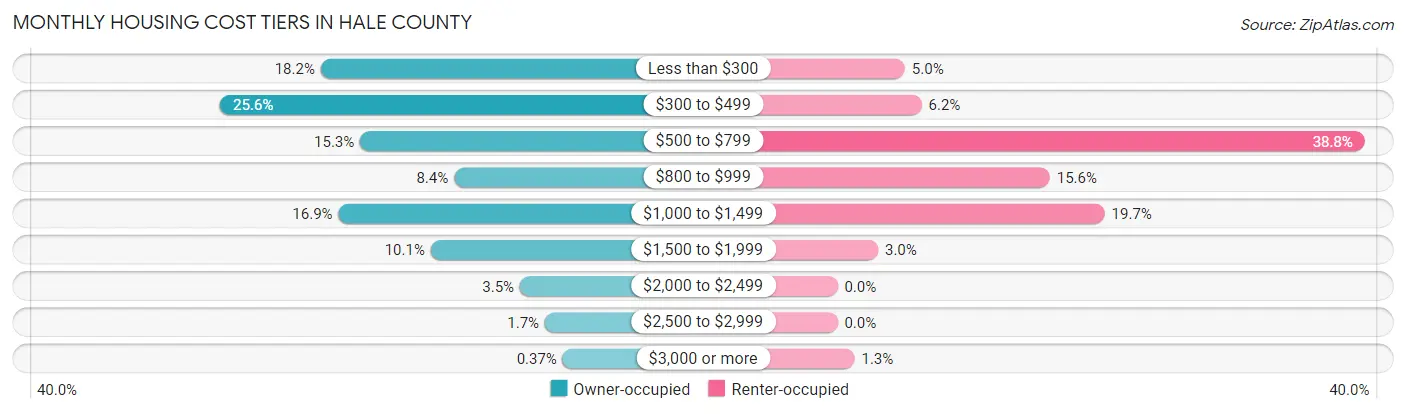
| Monthly Cost | Owner-occupied | Renter-occupied |
| Less than $300 | 1,235 (18.2%) | 209 (5.0%) |
| $300 to $499 | 1,738 (25.6%) | 261 (6.2%) |
| $500 to $799 | 1,038 (15.3%) | 1,634 (38.8%) |
| $800 to $999 | 568 (8.4%) | 658 (15.6%) |
| $1,000 to $1,499 | 1,147 (16.9%) | 828 (19.7%) |
| $1,500 to $1,999 | 685 (10.1%) | 126 (3.0%) |
| $2,000 to $2,499 | 239 (3.5%) | 0 (0.0%) |
| $2,500 to $2,999 | 114 (1.7%) | 0 (0.0%) |
| $3,000 or more | 25 (0.4%) | 53 (1.3%) |
| Total | 6,789 (100.0%) | 4,208 (100.0%) |
Physical Housing Characteristics in Hale County
Housing Structures in Hale County
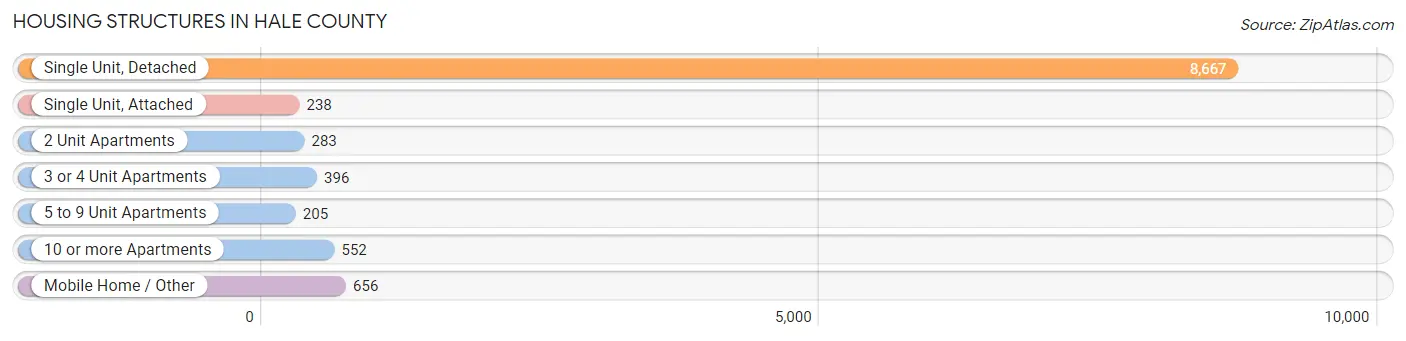
| Structure Type | # Housing Units | % Housing Units |
| Single Unit, Detached | 8,667 | 78.8% |
| Single Unit, Attached | 238 | 2.2% |
| 2 Unit Apartments | 283 | 2.6% |
| 3 or 4 Unit Apartments | 396 | 3.6% |
| 5 to 9 Unit Apartments | 205 | 1.9% |
| 10 or more Apartments | 552 | 5.0% |
| Mobile Home / Other | 656 | 6.0% |
| Total | 10,997 | 100.0% |
Housing Structures by Occupancy in Hale County
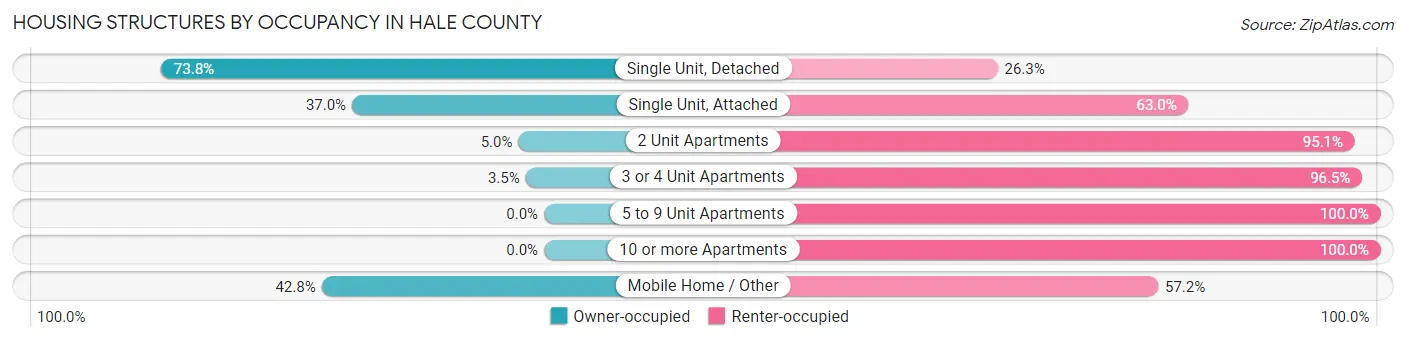
| Structure Type | Owner-occupied | Renter-occupied |
| Single Unit, Detached | 6,392 (73.8%) | 2,275 (26.3%) |
| Single Unit, Attached | 88 (37.0%) | 150 (63.0%) |
| 2 Unit Apartments | 14 (5.0%) | 269 (95.1%) |
| 3 or 4 Unit Apartments | 14 (3.5%) | 382 (96.5%) |
| 5 to 9 Unit Apartments | 0 (0.0%) | 205 (100.0%) |
| 10 or more Apartments | 0 (0.0%) | 552 (100.0%) |
| Mobile Home / Other | 281 (42.8%) | 375 (57.2%) |
| Total | 6,789 (61.7%) | 4,208 (38.3%) |
Housing Structures by Number of Rooms in Hale County
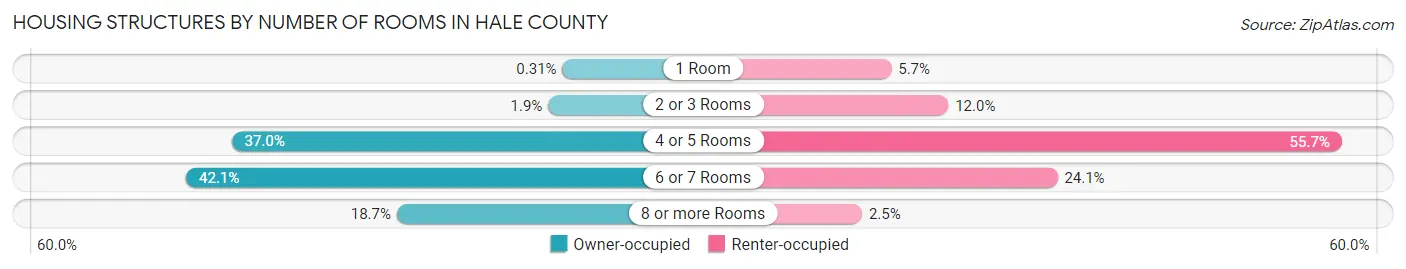
| Number of Rooms | Owner-occupied | Renter-occupied |
| 1 Room | 21 (0.3%) | 240 (5.7%) |
| 2 or 3 Rooms | 128 (1.9%) | 506 (12.0%) |
| 4 or 5 Rooms | 2,514 (37.0%) | 2,343 (55.7%) |
| 6 or 7 Rooms | 2,857 (42.1%) | 1,016 (24.1%) |
| 8 or more Rooms | 1,269 (18.7%) | 103 (2.5%) |
| Total | 6,789 (100.0%) | 4,208 (100.0%) |
Housing Structure by Heating Type in Hale County
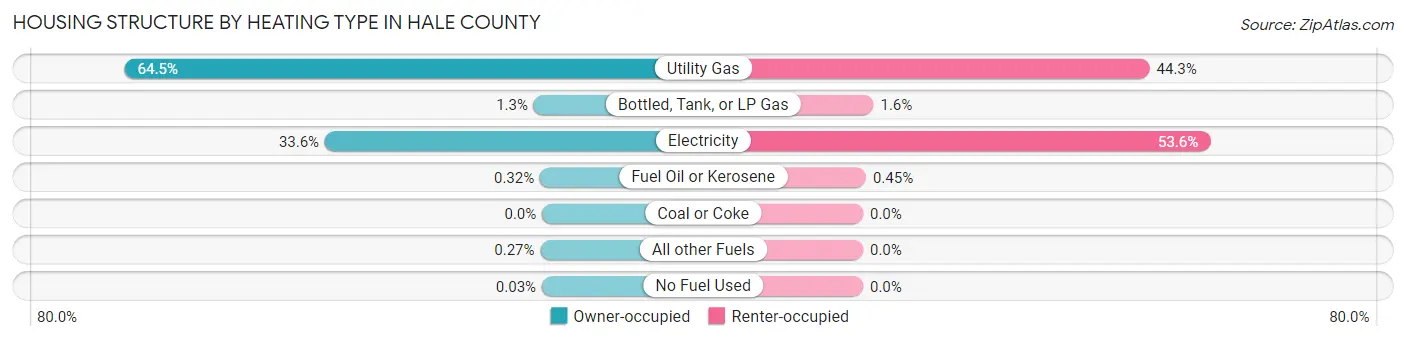
| Heating Type | Owner-occupied | Renter-occupied |
| Utility Gas | 4,381 (64.5%) | 1,864 (44.3%) |
| Bottled, Tank, or LP Gas | 87 (1.3%) | 68 (1.6%) |
| Electricity | 2,279 (33.6%) | 2,257 (53.6%) |
| Fuel Oil or Kerosene | 22 (0.3%) | 19 (0.4%) |
| Coal or Coke | 0 (0.0%) | 0 (0.0%) |
| All other Fuels | 18 (0.3%) | 0 (0.0%) |
| No Fuel Used | 2 (0.0%) | 0 (0.0%) |
| Total | 6,789 (100.0%) | 4,208 (100.0%) |
Household Vehicle Usage in Hale County
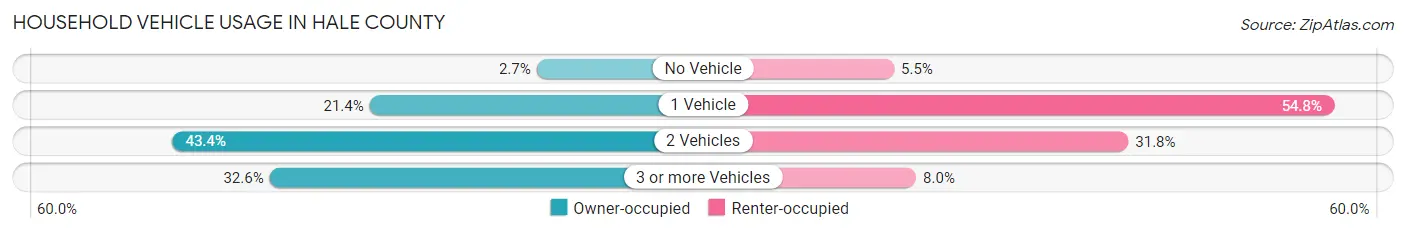
| Vehicles per Household | Owner-occupied | Renter-occupied |
| No Vehicle | 180 (2.6%) | 232 (5.5%) |
| 1 Vehicle | 1,450 (21.4%) | 2,304 (54.7%) |
| 2 Vehicles | 2,948 (43.4%) | 1,336 (31.8%) |
| 3 or more Vehicles | 2,211 (32.6%) | 336 (8.0%) |
| Total | 6,789 (100.0%) | 4,208 (100.0%) |
Real Estate & Mortgages in Hale County
Real Estate and Mortgage Overview in Hale County
| Characteristic | Without Mortgage | With Mortgage |
| Housing Units | 4,200 | 2,589 |
| Median Property Value | $75,200 | $142,100 |
| Median Household Income | $53,600 | $417 |
| Monthly Housing Costs | $391 | $16 |
| Real Estate Taxes | $1,006 | $56 |
Property Value by Mortgage Status in Hale County
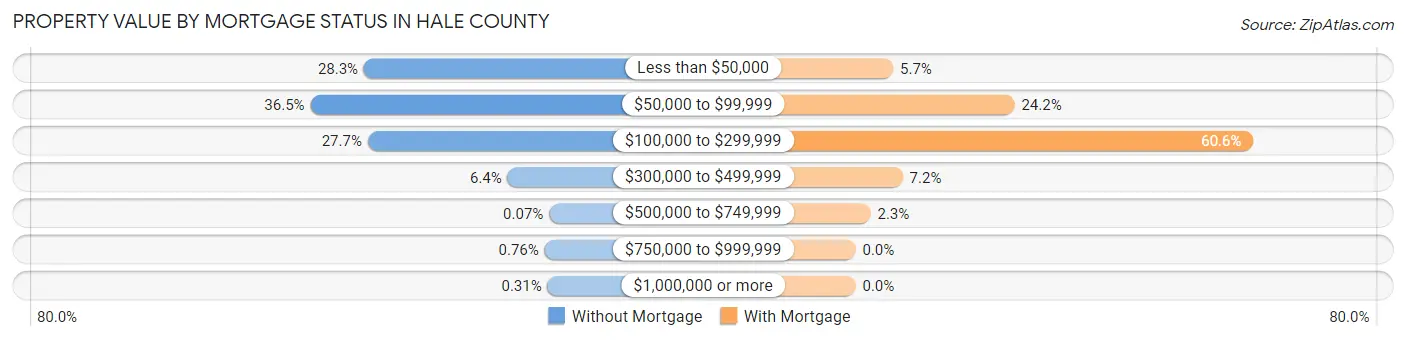
| Property Value | Without Mortgage | With Mortgage |
| Less than $50,000 | 1,188 (28.3%) | 148 (5.7%) |
| $50,000 to $99,999 | 1,531 (36.4%) | 627 (24.2%) |
| $100,000 to $299,999 | 1,164 (27.7%) | 1,569 (60.6%) |
| $300,000 to $499,999 | 269 (6.4%) | 186 (7.2%) |
| $500,000 to $749,999 | 3 (0.1%) | 59 (2.3%) |
| $750,000 to $999,999 | 32 (0.8%) | 0 (0.0%) |
| $1,000,000 or more | 13 (0.3%) | 0 (0.0%) |
| Total | 4,200 (100.0%) | 2,589 (100.0%) |
Household Income by Mortgage Status in Hale County
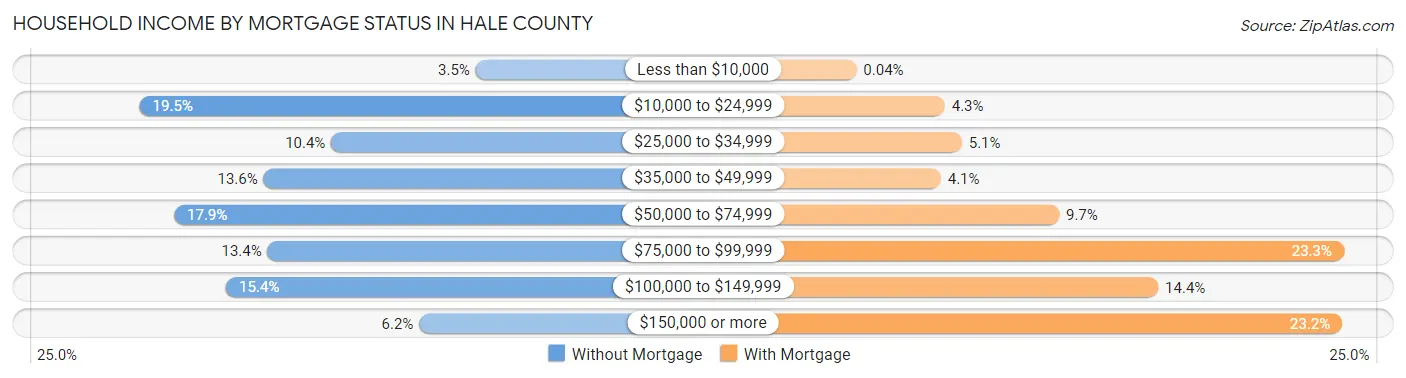
| Household Income | Without Mortgage | With Mortgage |
| Less than $10,000 | 148 (3.5%) | 1 (0.0%) |
| $10,000 to $24,999 | 820 (19.5%) | 110 (4.3%) |
| $25,000 to $34,999 | 437 (10.4%) | 131 (5.1%) |
| $35,000 to $49,999 | 572 (13.6%) | 105 (4.1%) |
| $50,000 to $74,999 | 751 (17.9%) | 251 (9.7%) |
| $75,000 to $99,999 | 564 (13.4%) | 602 (23.3%) |
| $100,000 to $149,999 | 647 (15.4%) | 373 (14.4%) |
| $150,000 or more | 261 (6.2%) | 600 (23.2%) |
| Total | 4,200 (100.0%) | 2,589 (100.0%) |
Property Value to Household Income Ratio in Hale County
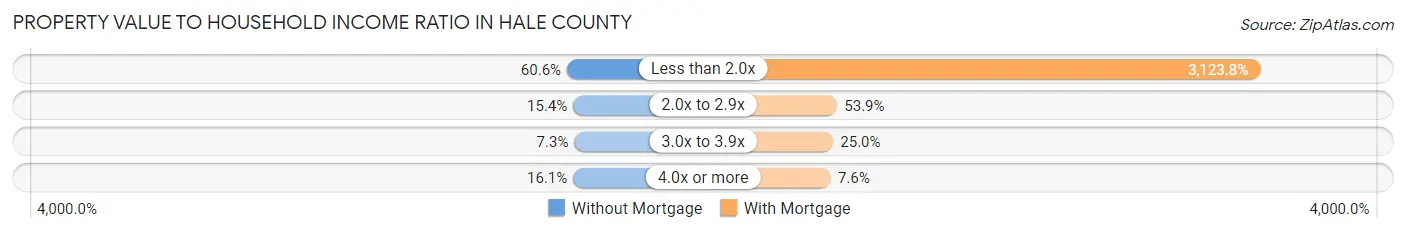
| Value-to-Income Ratio | Without Mortgage | With Mortgage |
| Less than 2.0x | 2,543 (60.6%) | 80,875 (3,123.8%) |
| 2.0x to 2.9x | 648 (15.4%) | 1,396 (53.9%) |
| 3.0x to 3.9x | 305 (7.3%) | 648 (25.0%) |
| 4.0x or more | 674 (16.1%) | 197 (7.6%) |
| Total | 4,200 (100.0%) | 2,589 (100.0%) |
Real Estate Taxes by Mortgage Status in Hale County

| Property Taxes | Without Mortgage | With Mortgage |
| Less than $800 | 1,644 (39.1%) | 41 (1.6%) |
| $800 to $1,499 | 1,137 (27.1%) | 230 (8.9%) |
| $800 to $1,499 | 1,280 (30.5%) | 534 (20.6%) |
| Total | 4,200 (100.0%) | 2,589 (100.0%) |
Health & Disability in Hale County
Health Insurance Coverage by Age in Hale County
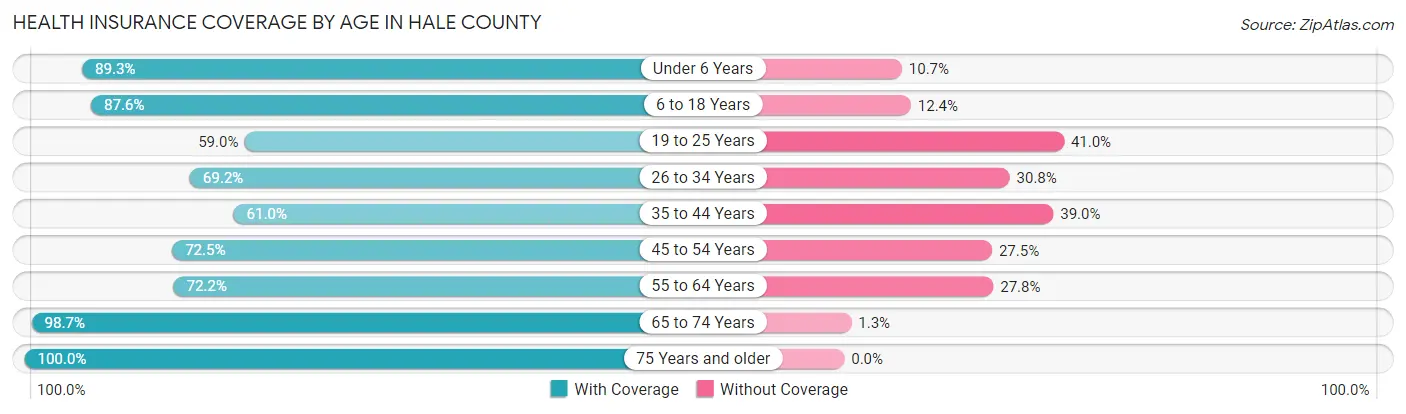
| Age Bracket | With Coverage | Without Coverage |
| Under 6 Years | 2,037 (89.3%) | 245 (10.7%) |
| 6 to 18 Years | 6,110 (87.6%) | 866 (12.4%) |
| 19 to 25 Years | 2,037 (59.0%) | 1,413 (41.0%) |
| 26 to 34 Years | 2,183 (69.2%) | 973 (30.8%) |
| 35 to 44 Years | 2,220 (61.0%) | 1,418 (39.0%) |
| 45 to 54 Years | 2,450 (72.5%) | 931 (27.5%) |
| 55 to 64 Years | 2,444 (72.2%) | 940 (27.8%) |
| 65 to 74 Years | 2,416 (98.7%) | 32 (1.3%) |
| 75 Years and older | 1,852 (100.0%) | 0 (0.0%) |
| Total | 23,749 (77.7%) | 6,818 (22.3%) |
Health Insurance Coverage by Citizenship Status in Hale County
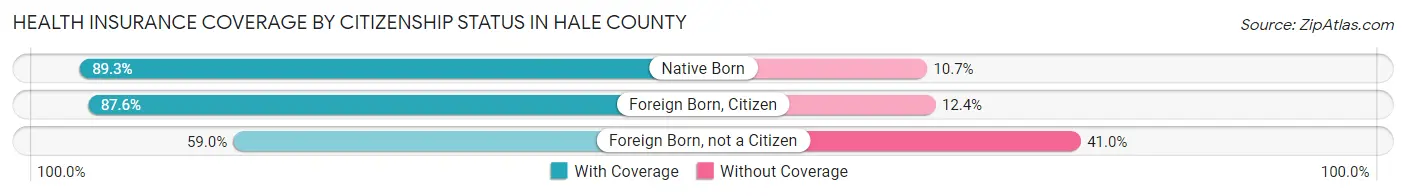
| Citizenship Status | With Coverage | Without Coverage |
| Native Born | 2,037 (89.3%) | 245 (10.7%) |
| Foreign Born, Citizen | 6,110 (87.6%) | 866 (12.4%) |
| Foreign Born, not a Citizen | 2,037 (59.0%) | 1,413 (41.0%) |
Health Insurance Coverage by Household Income in Hale County
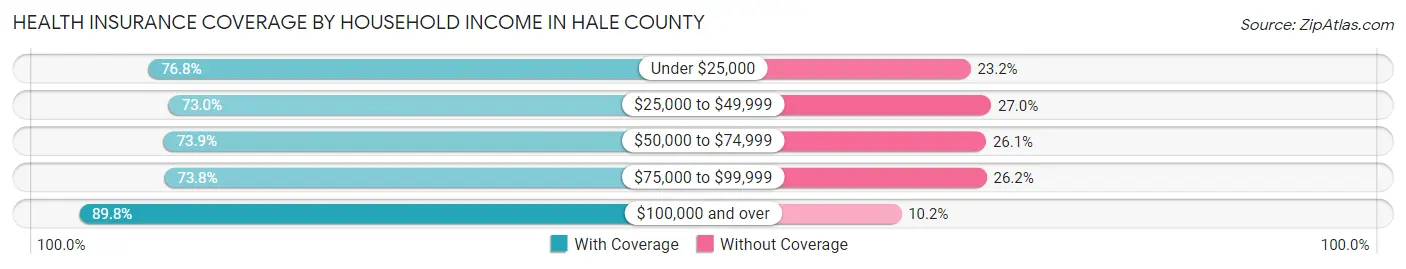
| Household Income | With Coverage | Without Coverage |
| Under $25,000 | 3,552 (76.8%) | 1,071 (23.2%) |
| $25,000 to $49,999 | 5,375 (73.0%) | 1,991 (27.0%) |
| $50,000 to $74,999 | 5,158 (73.9%) | 1,819 (26.1%) |
| $75,000 to $99,999 | 3,373 (73.8%) | 1,196 (26.2%) |
| $100,000 and over | 5,920 (89.8%) | 672 (10.2%) |
Public vs Private Health Insurance Coverage by Age in Hale County
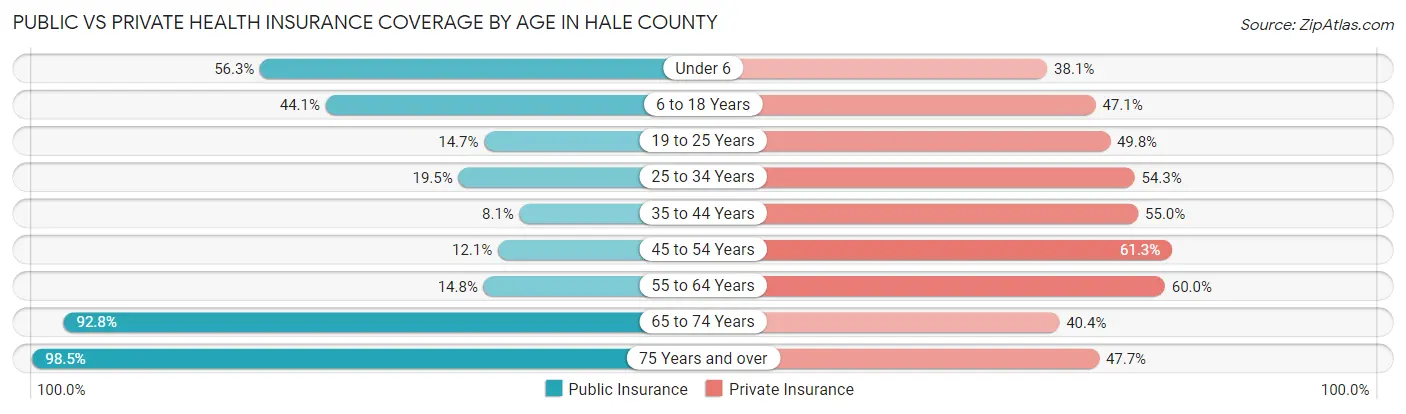
| Age Bracket | Public Insurance | Private Insurance |
| Under 6 | 1,284 (56.3%) | 870 (38.1%) |
| 6 to 18 Years | 3,076 (44.1%) | 3,285 (47.1%) |
| 19 to 25 Years | 506 (14.7%) | 1,717 (49.8%) |
| 25 to 34 Years | 614 (19.5%) | 1,715 (54.3%) |
| 35 to 44 Years | 295 (8.1%) | 2,001 (55.0%) |
| 45 to 54 Years | 410 (12.1%) | 2,073 (61.3%) |
| 55 to 64 Years | 500 (14.8%) | 2,029 (60.0%) |
| 65 to 74 Years | 2,271 (92.8%) | 988 (40.4%) |
| 75 Years and over | 1,825 (98.5%) | 884 (47.7%) |
| Total | 10,781 (35.3%) | 15,562 (50.9%) |
Disability Status by Sex by Age in Hale County
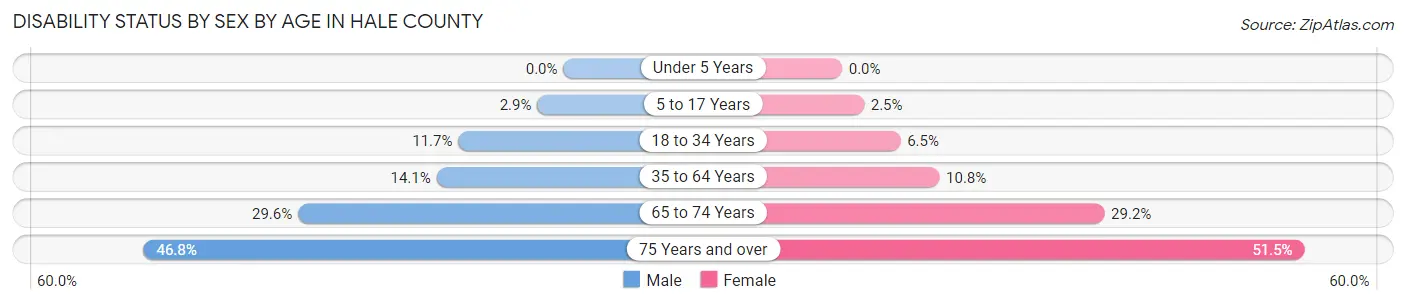
| Age Bracket | Male | Female |
| Under 5 Years | 0 (0.0%) | 0 (0.0%) |
| 5 to 17 Years | 98 (2.9%) | 83 (2.5%) |
| 18 to 34 Years | 423 (11.7%) | 226 (6.5%) |
| 35 to 64 Years | 721 (14.1%) | 574 (10.8%) |
| 65 to 74 Years | 331 (29.5%) | 388 (29.2%) |
| 75 Years and over | 374 (46.8%) | 542 (51.5%) |
Disability Class by Sex by Age in Hale County
Disability Class: Hearing Difficulty
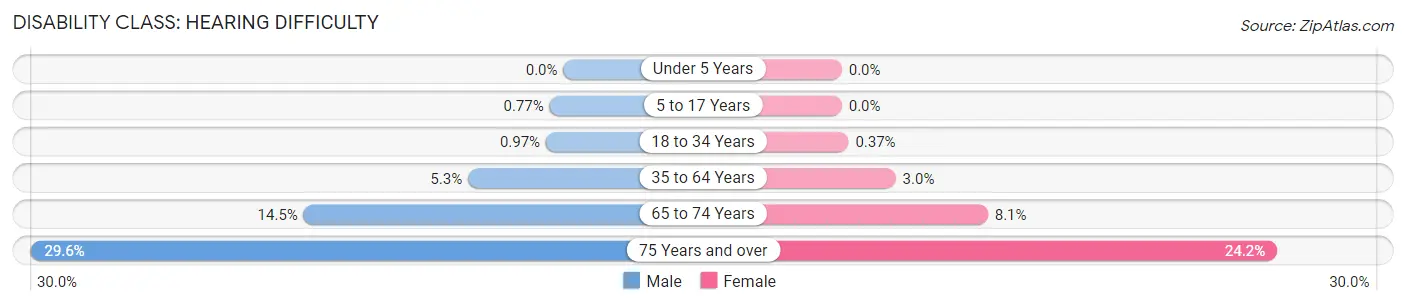
| Age Bracket | Male | Female |
| Under 5 Years | 0 (0.0%) | 0 (0.0%) |
| 5 to 17 Years | 26 (0.8%) | 0 (0.0%) |
| 18 to 34 Years | 35 (1.0%) | 13 (0.4%) |
| 35 to 64 Years | 271 (5.3%) | 159 (3.0%) |
| 65 to 74 Years | 162 (14.5%) | 108 (8.1%) |
| 75 Years and over | 237 (29.6%) | 255 (24.2%) |
Disability Class: Vision Difficulty
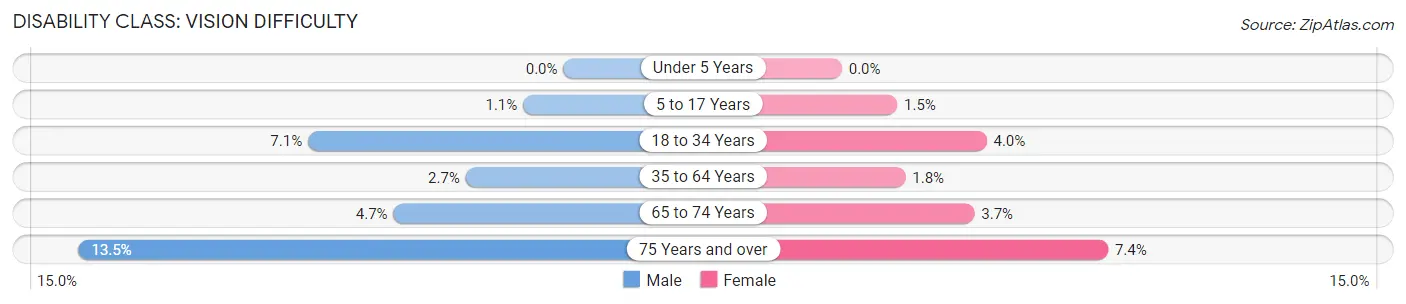
| Age Bracket | Male | Female |
| Under 5 Years | 0 (0.0%) | 0 (0.0%) |
| 5 to 17 Years | 38 (1.1%) | 52 (1.5%) |
| 18 to 34 Years | 257 (7.1%) | 140 (4.0%) |
| 35 to 64 Years | 139 (2.7%) | 94 (1.8%) |
| 65 to 74 Years | 53 (4.7%) | 49 (3.7%) |
| 75 Years and over | 108 (13.5%) | 78 (7.4%) |
Disability Class: Cognitive Difficulty
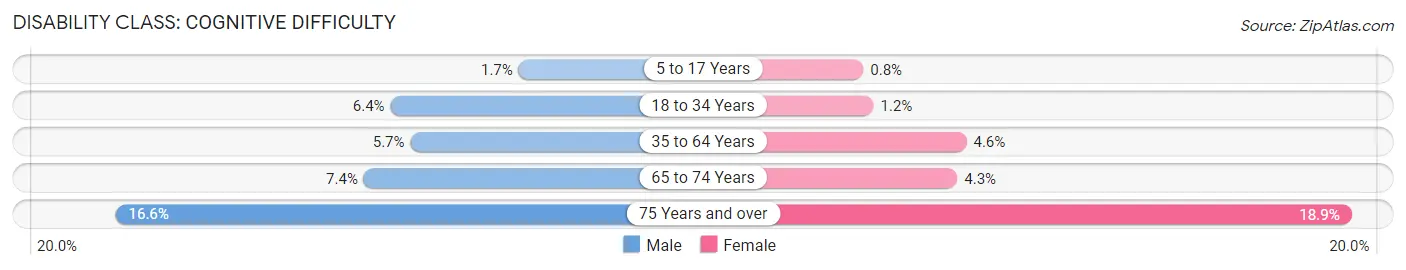
| Age Bracket | Male | Female |
| 5 to 17 Years | 56 (1.7%) | 27 (0.8%) |
| 18 to 34 Years | 232 (6.4%) | 41 (1.2%) |
| 35 to 64 Years | 290 (5.7%) | 245 (4.6%) |
| 65 to 74 Years | 83 (7.4%) | 57 (4.3%) |
| 75 Years and over | 133 (16.6%) | 199 (18.9%) |
Disability Class: Ambulatory Difficulty
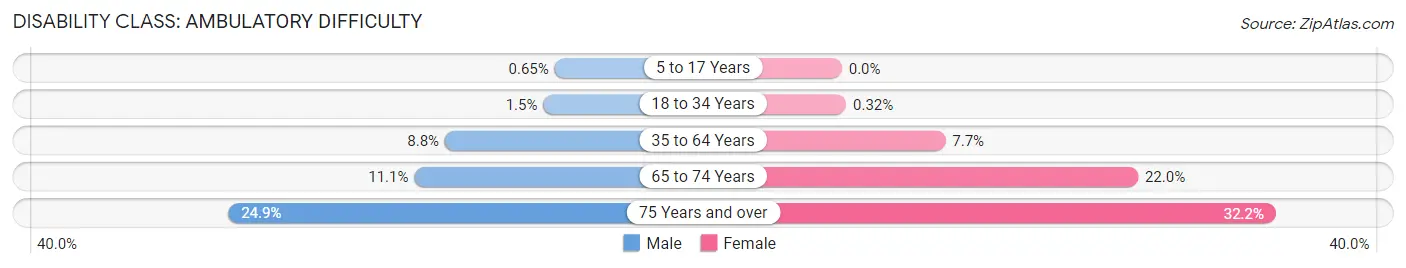
| Age Bracket | Male | Female |
| 5 to 17 Years | 22 (0.6%) | 0 (0.0%) |
| 18 to 34 Years | 54 (1.5%) | 11 (0.3%) |
| 35 to 64 Years | 449 (8.8%) | 407 (7.7%) |
| 65 to 74 Years | 124 (11.1%) | 292 (22.0%) |
| 75 Years and over | 199 (24.9%) | 339 (32.2%) |
Disability Class: Self-Care Difficulty
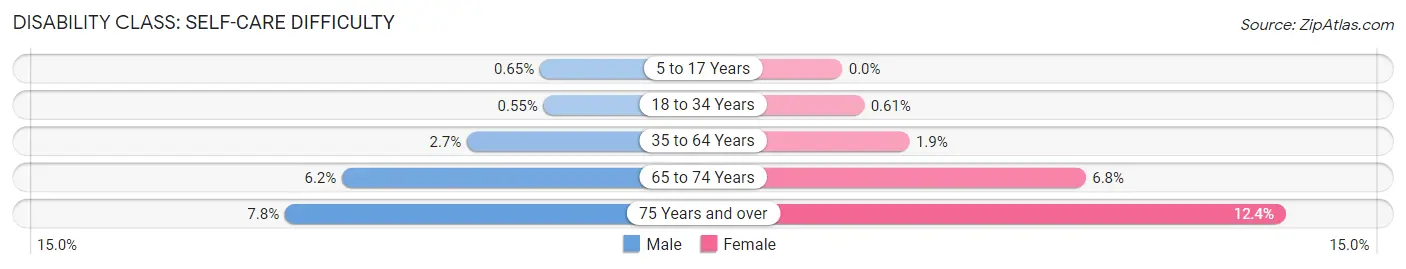
| Age Bracket | Male | Female |
| 5 to 17 Years | 22 (0.6%) | 0 (0.0%) |
| 18 to 34 Years | 20 (0.5%) | 21 (0.6%) |
| 35 to 64 Years | 137 (2.7%) | 99 (1.9%) |
| 65 to 74 Years | 69 (6.2%) | 90 (6.8%) |
| 75 Years and over | 62 (7.7%) | 130 (12.4%) |
Technology Access in Hale County
Computing Device Access in Hale County
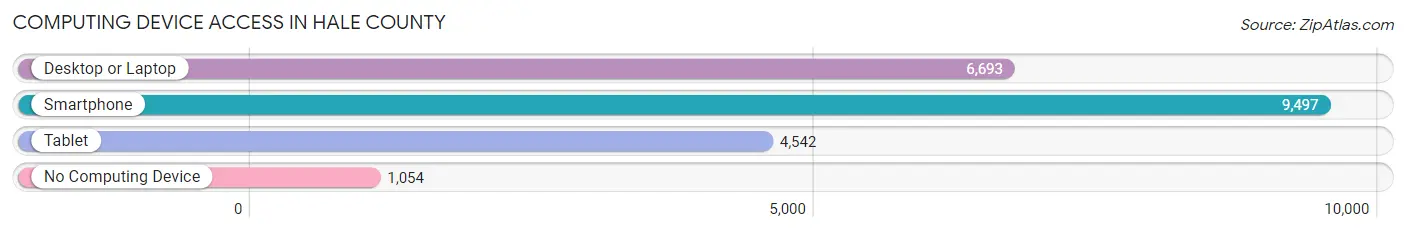
| Device Type | # Households | % Households |
| Desktop or Laptop | 6,693 | 60.9% |
| Smartphone | 9,497 | 86.4% |
| Tablet | 4,542 | 41.3% |
| No Computing Device | 1,054 | 9.6% |
| Total | 10,997 | 100.0% |
Internet Access in Hale County
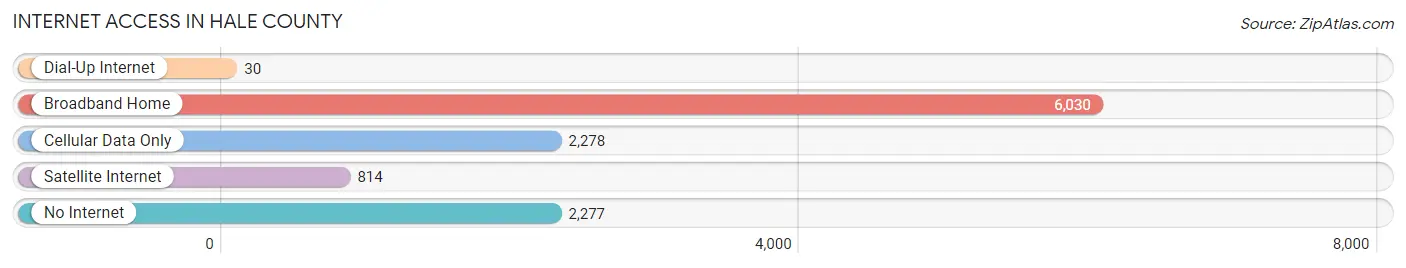
| Internet Type | # Households | % Households |
| Dial-Up Internet | 30 | 0.3% |
| Broadband Home | 6,030 | 54.8% |
| Cellular Data Only | 2,278 | 20.7% |
| Satellite Internet | 814 | 7.4% |
| No Internet | 2,277 | 20.7% |
| Total | 10,997 | 100.0% |
Hale County Summary
Hale County is located in the South Plains region of Texas, and is part of the Lubbock Metropolitan Statistical Area. The county was established in 1876 and named after Lt. John Hale, a Confederate soldier who was killed in the Battle of San Jacinto. The county seat is Plainview, and the population was 36,273 as of the 2010 census.
Geography
Hale County covers an area of 914 square miles, making it the second-largest county in the South Plains region. The terrain is mostly flat, with some rolling hills in the western part of the county. The county is drained by the North and South Canadian Rivers, which flow through the county from east to west. The county is also home to several small lakes, including Lake Mackenzie, Lake Hale, and Lake Meredith.
The climate of Hale County is semi-arid, with hot summers and mild winters. The average annual temperature is 64°F, and the average annual precipitation is 19.5 inches.
Demographics
As of the 2010 census, there were 36,273 people, 11,945 households, and 8,717 families living in Hale County. The population density was 40 people per square mile. The racial makeup of the county was 68.3% White, 4.2% African American, 0.7% Native American, 0.4% Asian, 0.1% Pacific Islander, 24.2% from other races, and 2.1% from two or more races. Hispanic or Latino of any race were 44.3% of the population.
The median income for a household in the county was $35,945, and the median income for a family was $43,945. The per capita income for the county was $17,845. About 17.2% of families and 22.2% of the population were below the poverty line, including 28.2% of those under age 18 and 14.2% of those age 65 or over.
Economy
Agriculture is the main economic activity in Hale County. The county is a major producer of cotton, wheat, sorghum, and hay. Other crops grown in the county include corn, peanuts, and vegetables. The county is also home to several large cattle ranches.
The county is home to several manufacturing companies, including a large meatpacking plant and a plastics factory. The county also has a large retail sector, with several shopping centers and malls.
History
Hale County was established in 1876 and named after Lt. John Hale, a Confederate soldier who was killed in the Battle of San Jacinto. The county seat is Plainview, which was founded in 1887.
The county was largely rural until the early 20th century, when the discovery of oil and natural gas in the area led to an economic boom. The county's population grew rapidly, and several new towns were established.
In the 1950s, the county's economy shifted from agriculture to manufacturing, and the county's population continued to grow. The county's population peaked in the 1970s, but has since declined due to the decline of the manufacturing sector.
Common Questions
What is Per Capita Income in Hale County?
Per Capita income in Hale County is $23,696.
What is the Median Family Income in Hale County?
Median Family Income in Hale County is $59,607.
What is the Median Household income in Hale County?
Median Household Income in Hale County is $50,721.
What is Income or Wage Gap in Hale County?
Income or Wage Gap in Hale County is 41.6%.
Women in Hale County earn 58.4 cents for every dollar earned by a man.
What is Family Income Deficit in Hale County?
Family Income Deficit in Hale County is $11,691.
Families that are below poverty line in Hale County earn $11,691 less on average than the poverty threshold level.
What is Inequality or Gini Index in Hale County?
Inequality or Gini Index in Hale County is 0.45.
What is the Total Population of Hale County?
Total Population of Hale County is 32,525.
What is the Total Male Population of Hale County?
Total Male Population of Hale County is 16,851.
What is the Total Female Population of Hale County?
Total Female Population of Hale County is 15,674.
What is the Ratio of Males per 100 Females in Hale County?
There are 107.51 Males per 100 Females in Hale County.
What is the Ratio of Females per 100 Males in Hale County?
There are 93.02 Females per 100 Males in Hale County.
What is the Median Population Age in Hale County?
Median Population Age in Hale County is 33.4 Years.
What is the Average Family Size in Hale County
Average Family Size in Hale County is 3.3 People.
What is the Average Household Size in Hale County
Average Household Size in Hale County is 2.7 People.
How Large is the Labor Force in Hale County?
There are 14,652 People in the Labor Forcein in Hale County.
What is the Percentage of People in the Labor Force in Hale County?
59.4% of People are in the Labor Force in Hale County.
What is the Unemployment Rate in Hale County?
Unemployment Rate in Hale County is 4.7%.