Gregg County, TX Map & Demographics
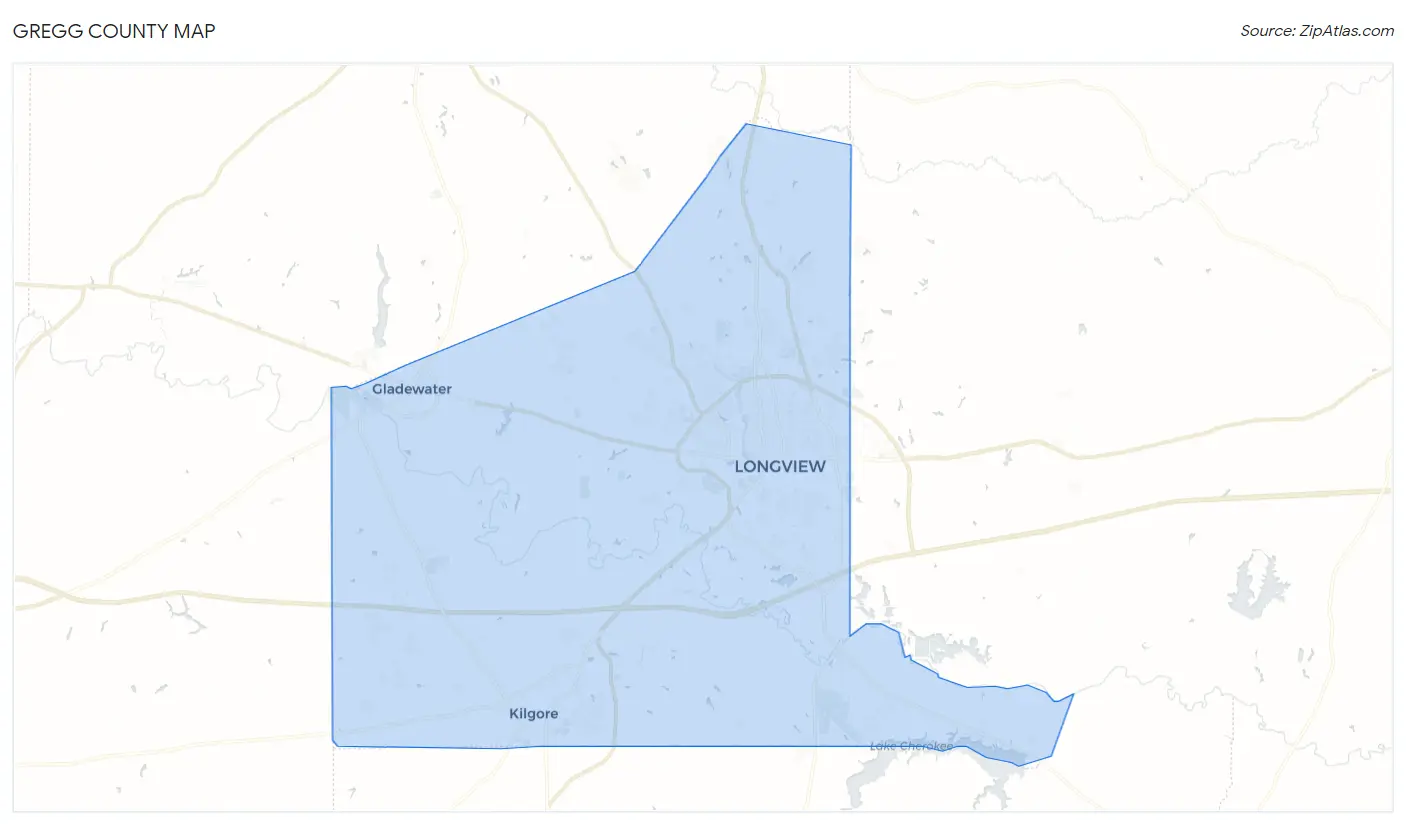
Gregg County Map
Gregg County Overview
$32,236
PER CAPITA INCOME
$76,549
AVG FAMILY INCOME
$63,811
AVG HOUSEHOLD INCOME
35.5%
WAGE / INCOME GAP [ % ]
64.5¢/ $1
WAGE / INCOME GAP [ $ ]
$11,050
FAMILY INCOME DEFICIT
0.46
INEQUALITY / GINI INDEX
124,245
TOTAL POPULATION
60,840
MALE POPULATION
63,405
FEMALE POPULATION
95.95
MALES / 100 FEMALES
104.22
FEMALES / 100 MALES
35.8
MEDIAN AGE
3.1
AVG FAMILY SIZE
2.5
AVG HOUSEHOLD SIZE
59,133
LABOR FORCE [ PEOPLE ]
61.7%
PERCENT IN LABOR FORCE
3.7%
UNEMPLOYMENT RATE
Income in Gregg County
Income Overview in Gregg County
Per Capita Income in Gregg County is $32,236, while median incomes of families and households are $76,549 and $63,811 respectively.
| Characteristic | Number | Measure |
| Per Capita Income | 124,245 | $32,236 |
| Median Family Income | 30,841 | $76,549 |
| Mean Family Income | 30,841 | $98,377 |
| Median Household Income | 47,008 | $63,811 |
| Mean Household Income | 47,008 | $84,850 |
| Income Deficit | 30,841 | $11,050 |
| Wage / Income Gap (%) | 124,245 | 35.52% |
| Wage / Income Gap ($) | 124,245 | 64.48¢ per $1 |
| Gini / Inequality Index | 124,245 | 0.46 |
Earnings by Sex in Gregg County
Average Earnings in Gregg County are $35,913, $44,679 for men and $28,811 for women, a difference of 35.5%.
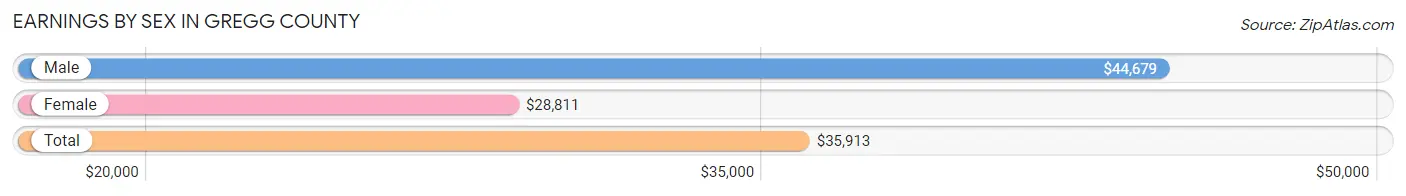
| Sex | Number | Average Earnings |
| Male | 33,056 (52.0%) | $44,679 |
| Female | 30,505 (48.0%) | $28,811 |
| Total | 63,561 (100.0%) | $35,913 |
Earnings by Sex by Income Bracket in Gregg County
The most common earnings brackets in Gregg County are $100,000+ for men (4,837 | 14.6%) and $25,000 to $29,999 for women (3,032 | 9.9%).
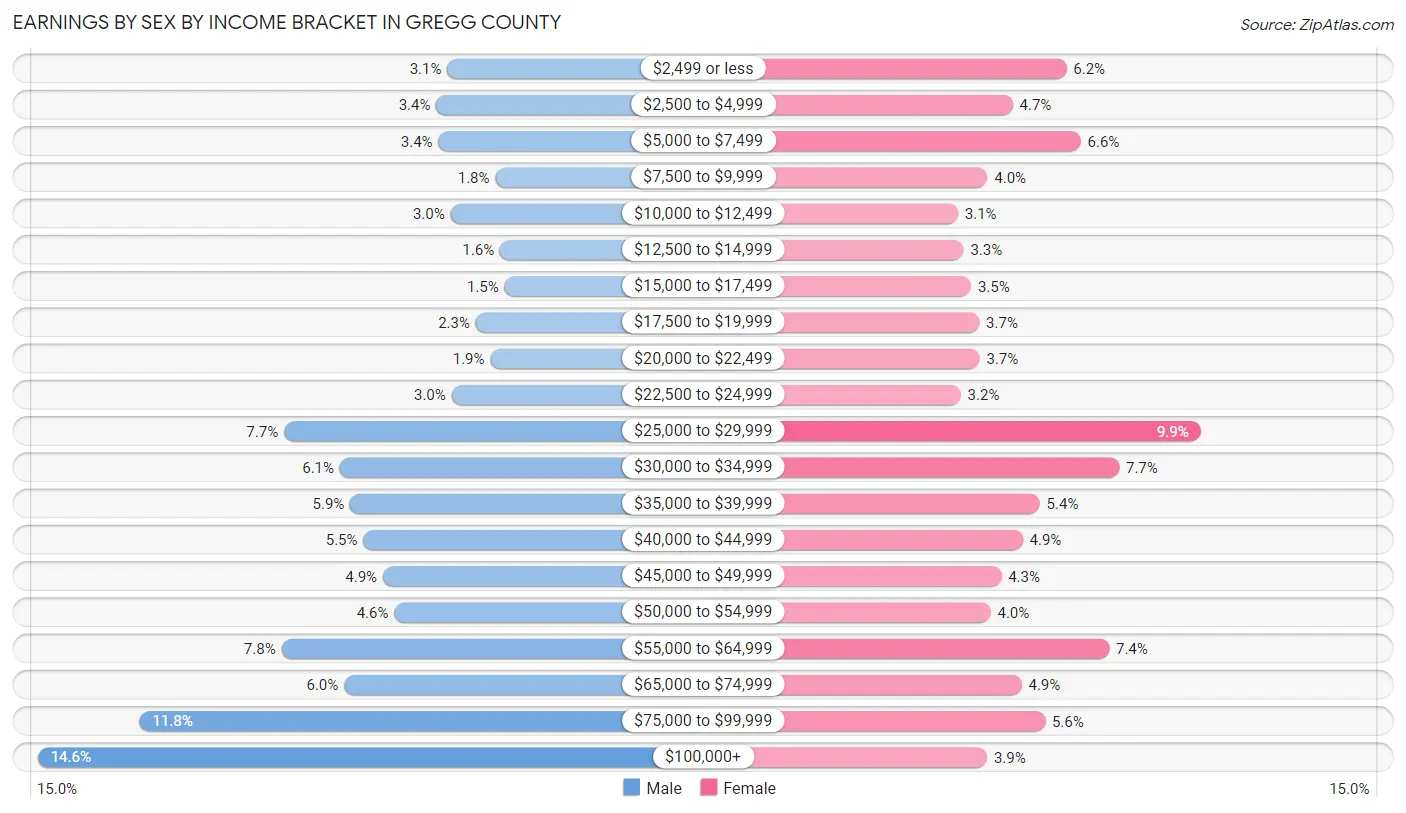
| Income | Male | Female |
| $2,499 or less | 1,030 (3.1%) | 1,882 (6.2%) |
| $2,500 to $4,999 | 1,134 (3.4%) | 1,421 (4.7%) |
| $5,000 to $7,499 | 1,114 (3.4%) | 2,005 (6.6%) |
| $7,500 to $9,999 | 584 (1.8%) | 1,204 (4.0%) |
| $10,000 to $12,499 | 1,000 (3.0%) | 952 (3.1%) |
| $12,500 to $14,999 | 543 (1.6%) | 1,000 (3.3%) |
| $15,000 to $17,499 | 499 (1.5%) | 1,065 (3.5%) |
| $17,500 to $19,999 | 766 (2.3%) | 1,135 (3.7%) |
| $20,000 to $22,499 | 633 (1.9%) | 1,137 (3.7%) |
| $22,500 to $24,999 | 991 (3.0%) | 975 (3.2%) |
| $25,000 to $29,999 | 2,547 (7.7%) | 3,032 (9.9%) |
| $30,000 to $34,999 | 2,029 (6.1%) | 2,333 (7.6%) |
| $35,000 to $39,999 | 1,933 (5.9%) | 1,654 (5.4%) |
| $40,000 to $44,999 | 1,810 (5.5%) | 1,508 (4.9%) |
| $45,000 to $49,999 | 1,630 (4.9%) | 1,324 (4.3%) |
| $50,000 to $54,999 | 1,524 (4.6%) | 1,231 (4.0%) |
| $55,000 to $64,999 | 2,571 (7.8%) | 2,247 (7.4%) |
| $65,000 to $74,999 | 1,991 (6.0%) | 1,498 (4.9%) |
| $75,000 to $99,999 | 3,890 (11.8%) | 1,700 (5.6%) |
| $100,000+ | 4,837 (14.6%) | 1,202 (3.9%) |
| Total | 33,056 (100.0%) | 30,505 (100.0%) |
Earnings by Sex by Educational Attainment in Gregg County
Average earnings in Gregg County are $52,488 for men and $33,268 for women, a difference of 36.6%. Men with an educational attainment of graduate degree enjoy the highest average annual earnings of $83,488, while those with less than high school education earn the least with $31,267. Women with an educational attainment of graduate degree earn the most with the average annual earnings of $59,167, while those with less than high school education have the smallest earnings of $21,342.
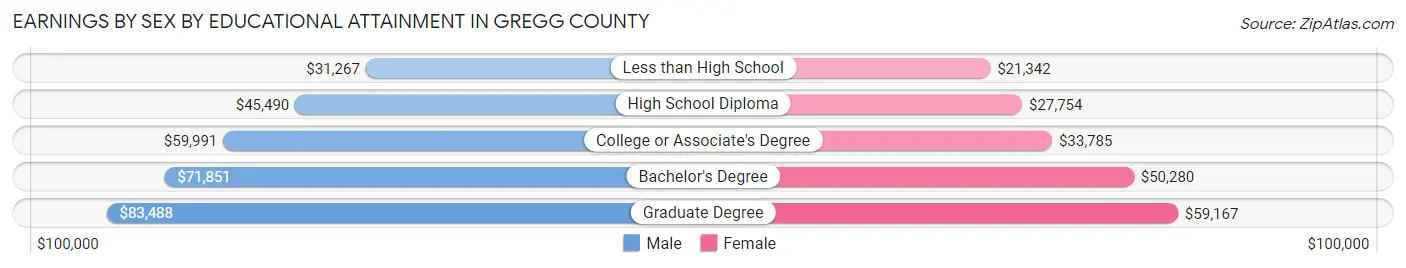
| Educational Attainment | Male Income | Female Income |
| Less than High School | $31,267 | $21,342 |
| High School Diploma | $45,490 | $27,754 |
| College or Associate's Degree | $59,991 | $33,785 |
| Bachelor's Degree | $71,851 | $50,280 |
| Graduate Degree | $83,488 | $59,167 |
| Total | $52,488 | $33,268 |
Family Income in Gregg County
Family Income Brackets in Gregg County
According to the Gregg County family income data, there are 6,230 families falling into the $50,000 to $74,999 income range, which is the most common income bracket and makes up 20.2% of all families. Conversely, the $10,000 to $14,999 income bracket is the least frequent group with only 740 families (2.4%) belonging to this category.
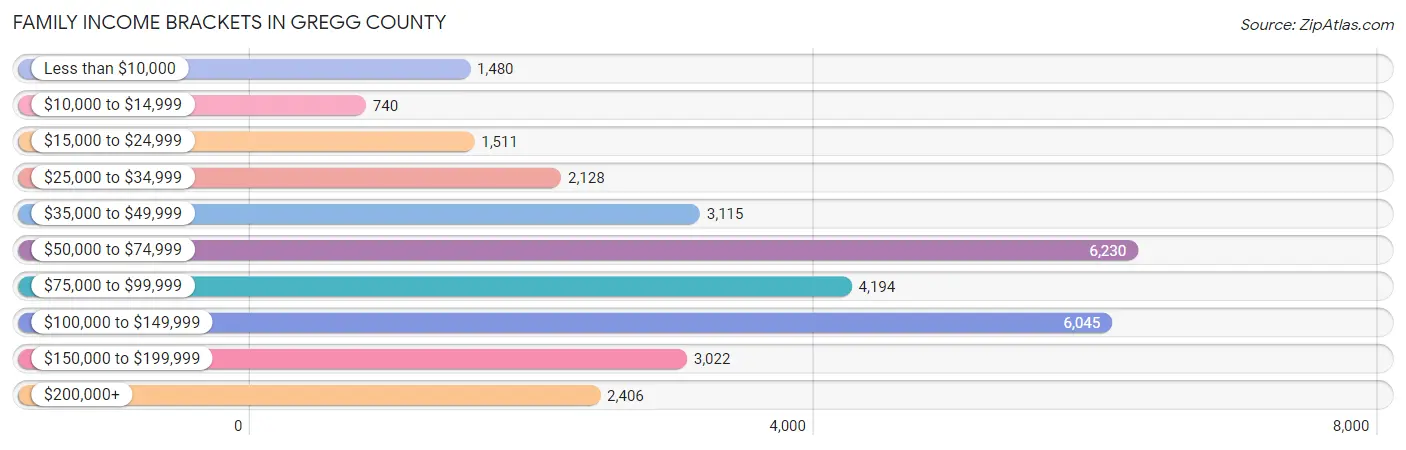
| Income Bracket | # Families | % Families |
| Less than $10,000 | 1,480 | 4.8% |
| $10,000 to $14,999 | 740 | 2.4% |
| $15,000 to $24,999 | 1,511 | 4.9% |
| $25,000 to $34,999 | 2,128 | 6.9% |
| $35,000 to $49,999 | 3,115 | 10.1% |
| $50,000 to $74,999 | 6,230 | 20.2% |
| $75,000 to $99,999 | 4,194 | 13.6% |
| $100,000 to $149,999 | 6,045 | 19.6% |
| $150,000 to $199,999 | 3,022 | 9.8% |
| $200,000+ | 2,406 | 7.8% |
Family Income by Famaliy Size in Gregg County
4-person families (5,750 | 18.6%) account for the highest median family income in Gregg County with $88,941 per family, while 2-person families (13,908 | 45.1%) have the highest median income of $35,060 per family member.
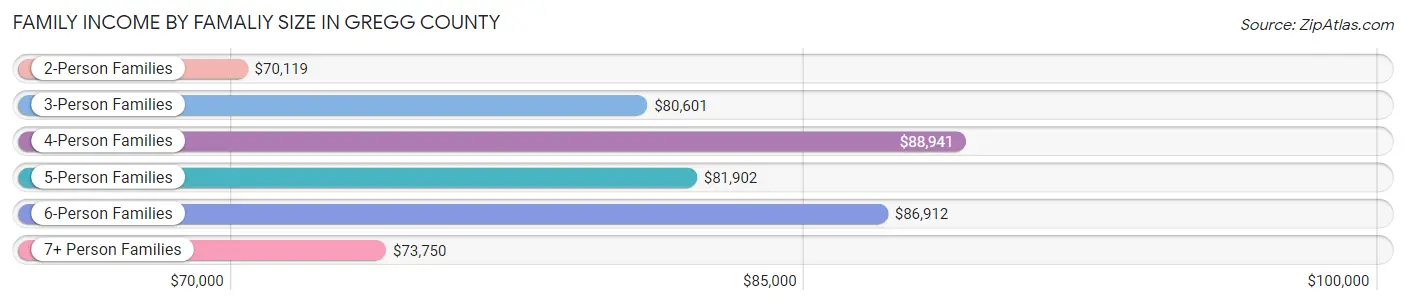
| Income Bracket | # Families | Median Income |
| 2-Person Families | 13,908 (45.1%) | $70,119 |
| 3-Person Families | 6,925 (22.5%) | $80,601 |
| 4-Person Families | 5,750 (18.6%) | $88,941 |
| 5-Person Families | 2,510 (8.1%) | $81,902 |
| 6-Person Families | 1,176 (3.8%) | $86,912 |
| 7+ Person Families | 572 (1.8%) | $73,750 |
| Total | 30,841 (100.0%) | $76,549 |
Family Income by Number of Earners in Gregg County
The median family income in Gregg County is $76,549, with families comprising 3+ earners (3,750) having the highest median family income of $123,448, while families with no earners (3,982) have the lowest median family income of $44,304, accounting for 12.2% and 12.9% of families, respectively.
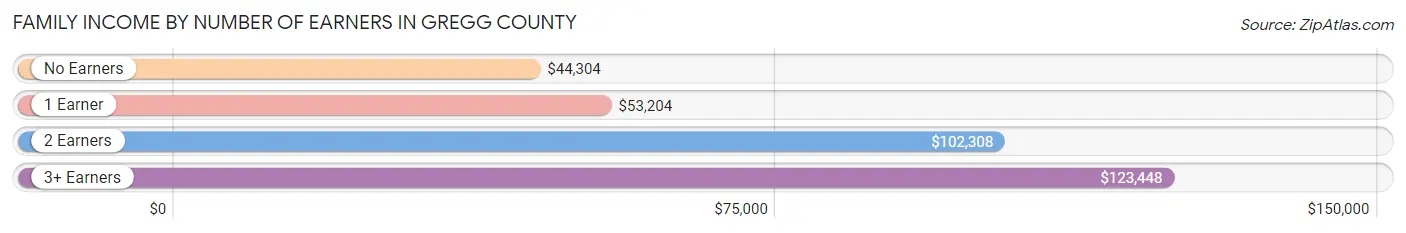
| Number of Earners | # Families | Median Income |
| No Earners | 3,982 (12.9%) | $44,304 |
| 1 Earner | 11,250 (36.5%) | $53,204 |
| 2 Earners | 11,859 (38.5%) | $102,308 |
| 3+ Earners | 3,750 (12.2%) | $123,448 |
| Total | 30,841 (100.0%) | $76,549 |
Household Income in Gregg County
Household Income Brackets in Gregg County
With 8,979 households falling in the category, the $50,000 to $74,999 income range is the most frequent in Gregg County, accounting for 19.1% of all households. In contrast, only 1,974 households (4.2%) fall into the $10,000 to $14,999 income bracket, making it the least populous group.
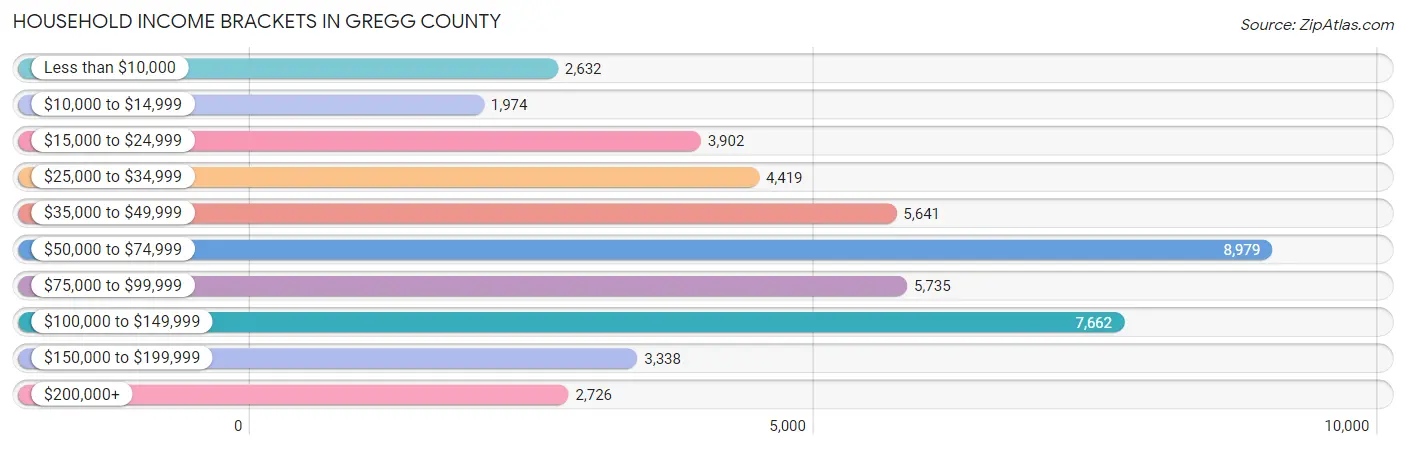
| Income Bracket | # Households | % Households |
| Less than $10,000 | 2,632 | 5.6% |
| $10,000 to $14,999 | 1,974 | 4.2% |
| $15,000 to $24,999 | 3,902 | 8.3% |
| $25,000 to $34,999 | 4,419 | 9.4% |
| $35,000 to $49,999 | 5,641 | 12.0% |
| $50,000 to $74,999 | 8,979 | 19.1% |
| $75,000 to $99,999 | 5,735 | 12.2% |
| $100,000 to $149,999 | 7,662 | 16.3% |
| $150,000 to $199,999 | 3,338 | 7.1% |
| $200,000+ | 2,726 | 5.8% |
Household Income by Householder Age in Gregg County
The median household income in Gregg County is $63,811, with the highest median household income of $78,338 found in the 45 to 64 years age bracket for the primary householder. A total of 16,441 households (35.0%) fall into this category. Meanwhile, the 15 to 24 years age bracket for the primary householder has the lowest median household income of $36,620, with 2,360 households (5.0%) in this group.
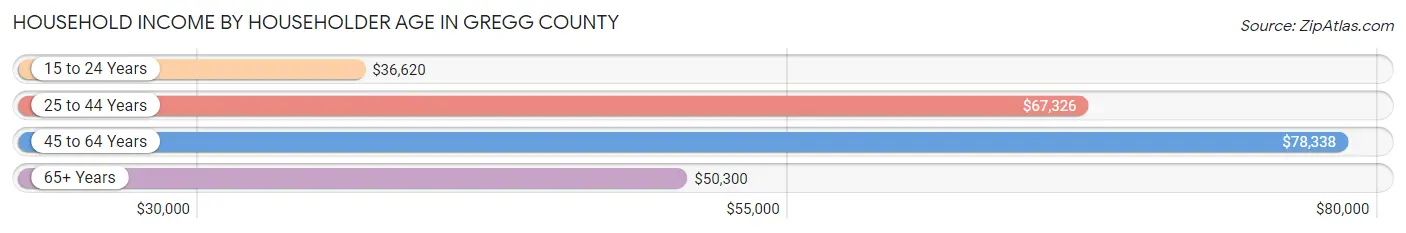
| Income Bracket | # Households | Median Income |
| 15 to 24 Years | 2,360 (5.0%) | $36,620 |
| 25 to 44 Years | 16,124 (34.3%) | $67,326 |
| 45 to 64 Years | 16,441 (35.0%) | $78,338 |
| 65+ Years | 12,083 (25.7%) | $50,300 |
| Total | 47,008 (100.0%) | $63,811 |
Poverty in Gregg County
Income Below Poverty by Sex and Age in Gregg County
With 13.9% poverty level for males and 19.1% for females among the residents of Gregg County, under 5 year old males and under 5 year old females are the most vulnerable to poverty, with 1,183 males (28.6%) and 1,287 females (32.5%) in their respective age groups living below the poverty level.
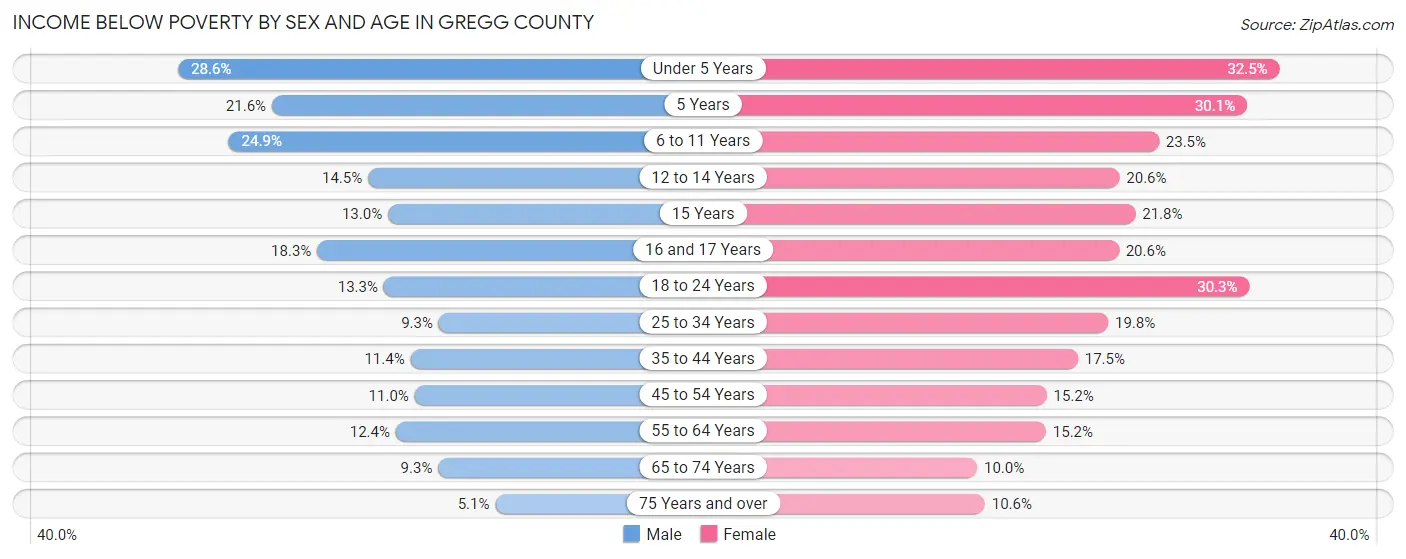
| Age Bracket | Male | Female |
| Under 5 Years | 1,183 (28.6%) | 1,287 (32.5%) |
| 5 Years | 177 (21.6%) | 280 (30.1%) |
| 6 to 11 Years | 1,356 (24.8%) | 1,123 (23.5%) |
| 12 to 14 Years | 435 (14.5%) | 660 (20.6%) |
| 15 Years | 144 (13.0%) | 161 (21.8%) |
| 16 and 17 Years | 320 (18.3%) | 369 (20.6%) |
| 18 to 24 Years | 702 (13.3%) | 1,617 (30.2%) |
| 25 to 34 Years | 720 (9.2%) | 1,660 (19.8%) |
| 35 to 44 Years | 844 (11.4%) | 1,344 (17.5%) |
| 45 to 54 Years | 732 (11.0%) | 1,061 (15.2%) |
| 55 to 64 Years | 875 (12.4%) | 1,147 (15.1%) |
| 65 to 74 Years | 482 (9.3%) | 605 (10.0%) |
| 75 Years and over | 141 (5.1%) | 482 (10.6%) |
| Total | 8,111 (13.9%) | 11,796 (19.1%) |
Income Above Poverty by Sex and Age in Gregg County
According to the poverty statistics in Gregg County, males aged 75 years and over and females aged 65 to 74 years are the age groups that are most secure financially, with 95.0% of males and 90.0% of females in these age groups living above the poverty line.
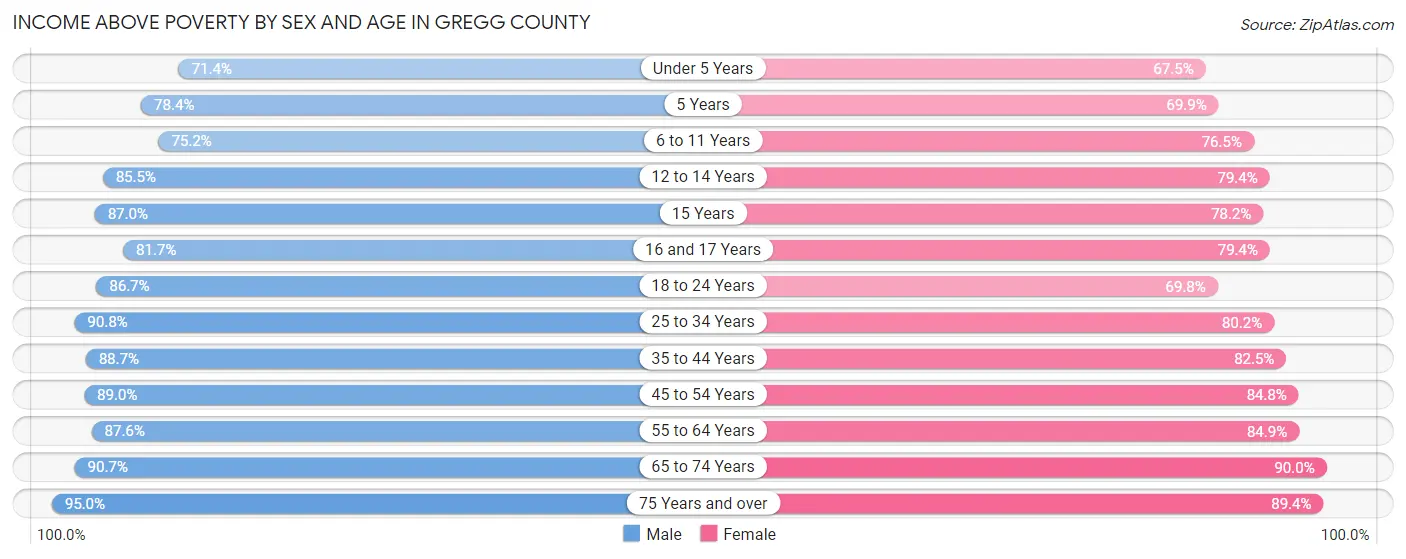
| Age Bracket | Male | Female |
| Under 5 Years | 2,954 (71.4%) | 2,674 (67.5%) |
| 5 Years | 641 (78.4%) | 651 (69.9%) |
| 6 to 11 Years | 4,100 (75.1%) | 3,647 (76.5%) |
| 12 to 14 Years | 2,564 (85.5%) | 2,543 (79.4%) |
| 15 Years | 962 (87.0%) | 578 (78.2%) |
| 16 and 17 Years | 1,431 (81.7%) | 1,426 (79.4%) |
| 18 to 24 Years | 4,564 (86.7%) | 3,729 (69.8%) |
| 25 to 34 Years | 7,063 (90.7%) | 6,737 (80.2%) |
| 35 to 44 Years | 6,589 (88.6%) | 6,326 (82.5%) |
| 45 to 54 Years | 5,899 (89.0%) | 5,918 (84.8%) |
| 55 to 64 Years | 6,161 (87.6%) | 6,423 (84.9%) |
| 65 to 74 Years | 4,706 (90.7%) | 5,422 (90.0%) |
| 75 Years and over | 2,652 (95.0%) | 4,056 (89.4%) |
| Total | 50,286 (86.1%) | 50,130 (80.9%) |
Income Below Poverty Among Married-Couple Families in Gregg County
The poverty statistics for married-couple families in Gregg County show that 5.8% or 1,246 of the total 21,664 families live below the poverty line. Families with 5 or more children have the highest poverty rate of 32.5%, comprising of 54 families. On the other hand, families with no children have the lowest poverty rate of 3.5%, which includes 438 families.
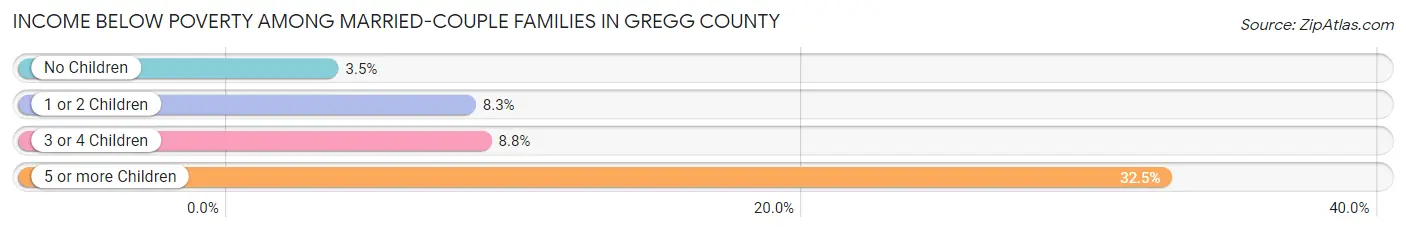
| Children | Above Poverty | Below Poverty |
| No Children | 12,089 (96.5%) | 438 (3.5%) |
| 1 or 2 Children | 6,296 (91.7%) | 568 (8.3%) |
| 3 or 4 Children | 1,921 (91.2%) | 186 (8.8%) |
| 5 or more Children | 112 (67.5%) | 54 (32.5%) |
| Total | 20,418 (94.3%) | 1,246 (5.8%) |
Income Below Poverty Among Single-Parent Households in Gregg County
According to the poverty data in Gregg County, 9.0% or 183 single-father households and 34.8% or 2,486 single-mother households are living below the poverty line. Among single-father households, those with 5 or more children have the highest poverty rate, with 29 households (100.0%) experiencing poverty. Likewise, among single-mother households, those with 3 or 4 children have the highest poverty rate, with 671 households (70.3%) falling below the poverty line.
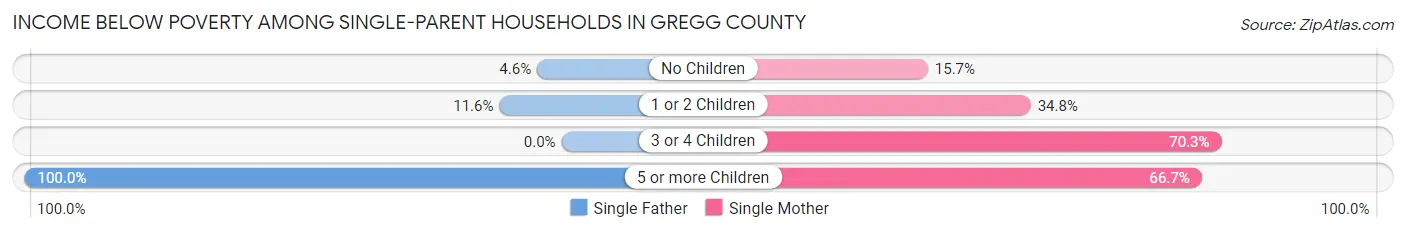
| Children | Single Father | Single Mother |
| No Children | 35 (4.6%) | 294 (15.7%) |
| 1 or 2 Children | 119 (11.6%) | 1,485 (34.8%) |
| 3 or 4 Children | 0 (0.0%) | 671 (70.3%) |
| 5 or more Children | 29 (100.0%) | 36 (66.7%) |
| Total | 183 (9.0%) | 2,486 (34.8%) |
Income Below Poverty Among Married-Couple vs Single-Parent Households in Gregg County
The poverty data for Gregg County shows that 1,246 of the married-couple family households (5.8%) and 2,669 of the single-parent households (29.1%) are living below the poverty level. Within the married-couple family households, those with 5 or more children have the highest poverty rate, with 54 households (32.5%) falling below the poverty line. Among the single-parent households, those with 5 or more children have the highest poverty rate, with 65 household (78.3%) living below poverty.
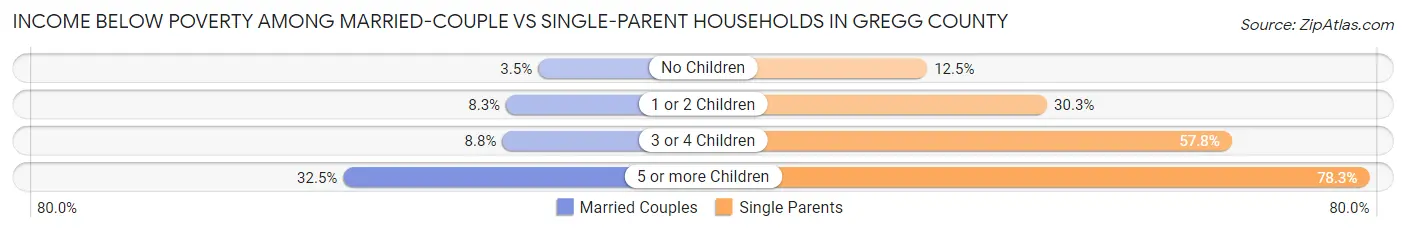
| Children | Married-Couple Families | Single-Parent Households |
| No Children | 438 (3.5%) | 329 (12.4%) |
| 1 or 2 Children | 568 (8.3%) | 1,604 (30.3%) |
| 3 or 4 Children | 186 (8.8%) | 671 (57.8%) |
| 5 or more Children | 54 (32.5%) | 65 (78.3%) |
| Total | 1,246 (5.8%) | 2,669 (29.1%) |
Race in Gregg County
The most populous races in Gregg County are White / Caucasian (79,841 | 64.3%), Hispanic or Latino (24,391 | 19.6%), and Black / African American (24,244 | 19.5%).
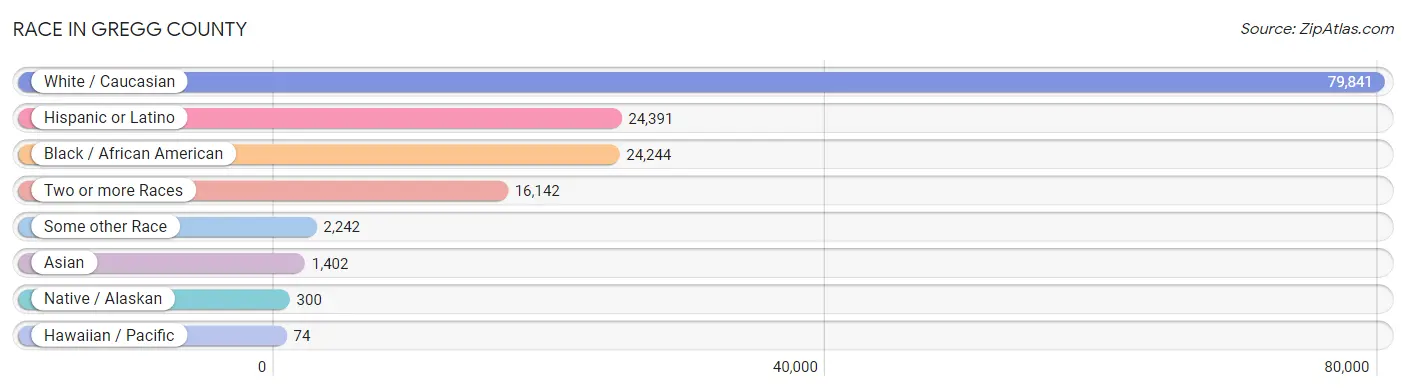
| Race | # Population | % Population |
| Asian | 1,402 | 1.1% |
| Black / African American | 24,244 | 19.5% |
| Hawaiian / Pacific | 74 | 0.1% |
| Hispanic or Latino | 24,391 | 19.6% |
| Native / Alaskan | 300 | 0.2% |
| White / Caucasian | 79,841 | 64.3% |
| Two or more Races | 16,142 | 13.0% |
| Some other Race | 2,242 | 1.8% |
| Total | 124,245 | 100.0% |
Ancestry in Gregg County
The most populous ancestries reported in Gregg County are Mexican (21,670 | 17.4%), American (14,240 | 11.5%), English (12,599 | 10.1%), Irish (11,088 | 8.9%), and German (9,564 | 7.7%), together accounting for 55.7% of all Gregg County residents.
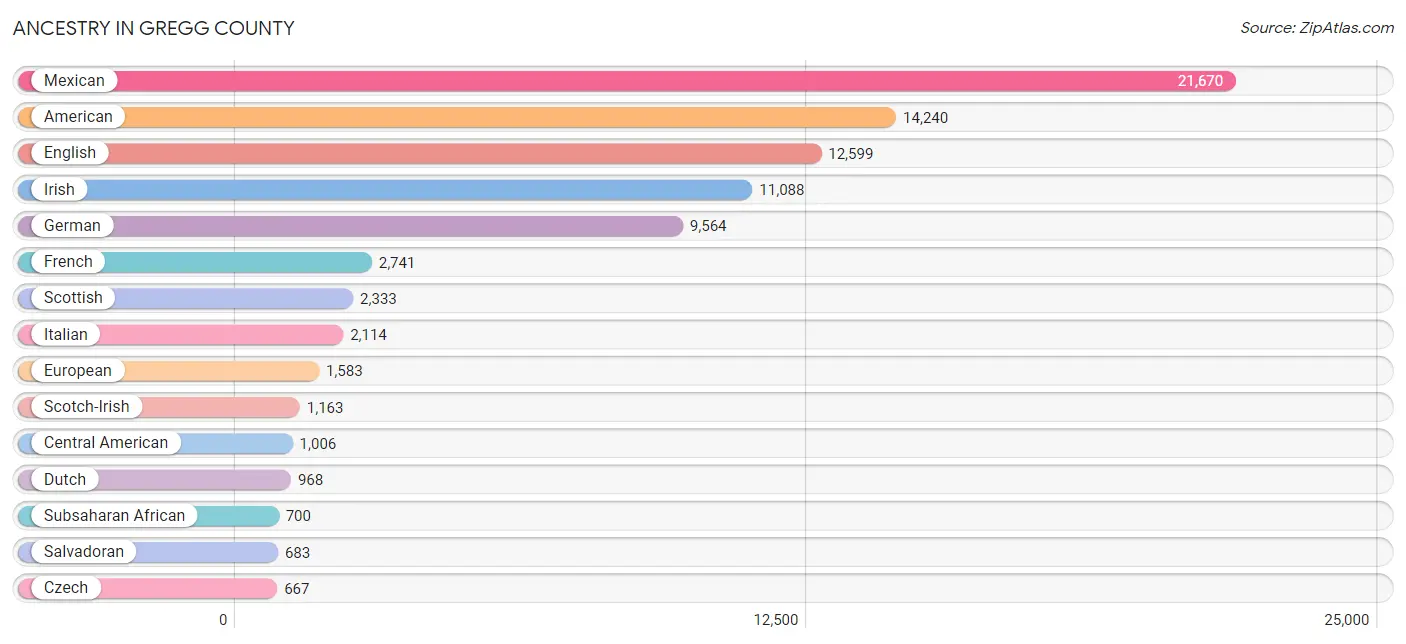
| Ancestry | # Population | % Population |
| African | 457 | 0.4% |
| Albanian | 14 | 0.0% |
| Aleut | 19 | 0.0% |
| American | 14,240 | 11.5% |
| Apache | 18 | 0.0% |
| Arab | 441 | 0.4% |
| Armenian | 52 | 0.0% |
| Australian | 26 | 0.0% |
| Austrian | 78 | 0.1% |
| Belgian | 14 | 0.0% |
| Bhutanese | 81 | 0.1% |
| Blackfeet | 119 | 0.1% |
| Brazilian | 68 | 0.1% |
| British | 629 | 0.5% |
| Burmese | 234 | 0.2% |
| Cambodian | 78 | 0.1% |
| Canadian | 145 | 0.1% |
| Central American | 1,006 | 0.8% |
| Central American Indian | 102 | 0.1% |
| Cherokee | 319 | 0.3% |
| Chickasaw | 5 | 0.0% |
| Chilean | 4 | 0.0% |
| Chippewa | 4 | 0.0% |
| Choctaw | 67 | 0.1% |
| Colombian | 72 | 0.1% |
| Comanche | 12 | 0.0% |
| Costa Rican | 13 | 0.0% |
| Creek | 101 | 0.1% |
| Croatian | 26 | 0.0% |
| Crow | 45 | 0.0% |
| Cuban | 135 | 0.1% |
| Czech | 667 | 0.5% |
| Czechoslovakian | 44 | 0.0% |
| Danish | 231 | 0.2% |
| Dutch | 968 | 0.8% |
| Dutch West Indian | 18 | 0.0% |
| Eastern European | 59 | 0.1% |
| Ecuadorian | 79 | 0.1% |
| English | 12,599 | 10.1% |
| European | 1,583 | 1.3% |
| Finnish | 7 | 0.0% |
| French | 2,741 | 2.2% |
| French Canadian | 269 | 0.2% |
| German | 9,564 | 7.7% |
| Greek | 43 | 0.0% |
| Guamanian / Chamorro | 69 | 0.1% |
| Guatemalan | 122 | 0.1% |
| Haitian | 10 | 0.0% |
| Honduran | 135 | 0.1% |
| Hungarian | 179 | 0.1% |
| Icelander | 31 | 0.0% |
| Indian (Asian) | 150 | 0.1% |
| Iranian | 28 | 0.0% |
| Irish | 11,088 | 8.9% |
| Italian | 2,114 | 1.7% |
| Jamaican | 36 | 0.0% |
| Japanese | 102 | 0.1% |
| Kenyan | 89 | 0.1% |
| Korean | 481 | 0.4% |
| Latvian | 6 | 0.0% |
| Lebanese | 122 | 0.1% |
| Liberian | 4 | 0.0% |
| Lithuanian | 43 | 0.0% |
| Lumbee | 5 | 0.0% |
| Luxembourger | 8 | 0.0% |
| Malaysian | 195 | 0.2% |
| Mexican | 21,670 | 17.4% |
| Mexican American Indian | 115 | 0.1% |
| Mongolian | 34 | 0.0% |
| Native Hawaiian | 53 | 0.0% |
| Navajo | 241 | 0.2% |
| New Zealander | 12 | 0.0% |
| Nicaraguan | 19 | 0.0% |
| Nigerian | 131 | 0.1% |
| Northern European | 92 | 0.1% |
| Norwegian | 380 | 0.3% |
| Pakistani | 137 | 0.1% |
| Palestinian | 138 | 0.1% |
| Panamanian | 34 | 0.0% |
| Peruvian | 24 | 0.0% |
| Polish | 588 | 0.5% |
| Portuguese | 34 | 0.0% |
| Puerto Rican | 515 | 0.4% |
| Romanian | 27 | 0.0% |
| Russian | 95 | 0.1% |
| Salvadoran | 683 | 0.5% |
| Samoan | 50 | 0.0% |
| Scandinavian | 314 | 0.3% |
| Scotch-Irish | 1,163 | 0.9% |
| Scottish | 2,333 | 1.9% |
| Serbian | 20 | 0.0% |
| Sioux | 40 | 0.0% |
| Slovak | 21 | 0.0% |
| Slovene | 18 | 0.0% |
| South American | 208 | 0.2% |
| Spaniard | 71 | 0.1% |
| Spanish | 353 | 0.3% |
| Sri Lankan | 453 | 0.4% |
| Subsaharan African | 700 | 0.6% |
| Swedish | 421 | 0.3% |
| Swiss | 56 | 0.1% |
| Thai | 194 | 0.2% |
| Turkish | 152 | 0.1% |
| Ukrainian | 8 | 0.0% |
| Venezuelan | 29 | 0.0% |
| Welsh | 348 | 0.3% |
| West Indian | 10 | 0.0% | View All 107 Rows |
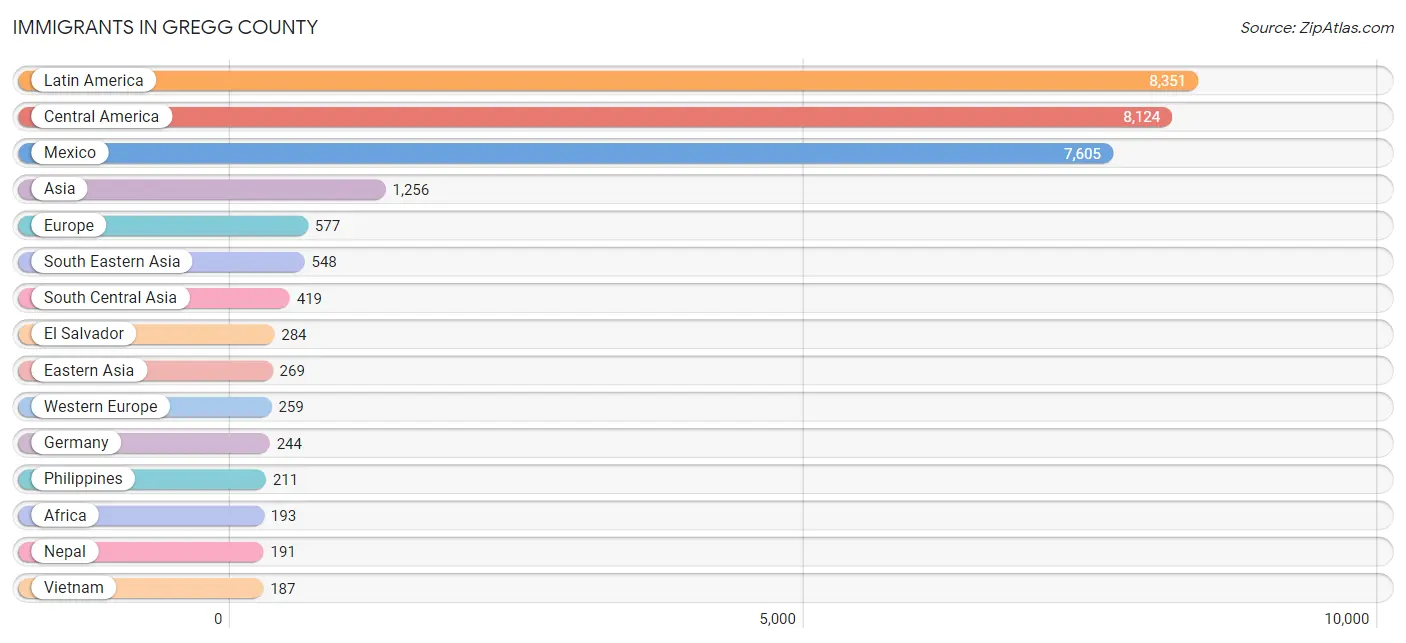
Immigrants in Gregg County
The most numerous immigrant groups reported in Gregg County came from Latin America (8,351 | 6.7%), Central America (8,124 | 6.5%), Mexico (7,605 | 6.1%), Asia (1,256 | 1.0%), and Europe (577 | 0.5%), together accounting for 20.8% of all Gregg County residents.
| Immigration Origin | # Population | % Population |
| Africa | 193 | 0.2% |
| Albania | 11 | 0.0% |
| Asia | 1,256 | 1.0% |
| Australia | 12 | 0.0% |
| Bangladesh | 40 | 0.0% |
| Belize | 17 | 0.0% |
| Bolivia | 3 | 0.0% |
| Brazil | 18 | 0.0% |
| Cambodia | 52 | 0.0% |
| Cameroon | 16 | 0.0% |
| Canada | 170 | 0.1% |
| Caribbean | 89 | 0.1% |
| Central America | 8,124 | 6.5% |
| Chile | 4 | 0.0% |
| China | 65 | 0.1% |
| Colombia | 55 | 0.0% |
| Costa Rica | 13 | 0.0% |
| Cuba | 63 | 0.1% |
| Denmark | 27 | 0.0% |
| Eastern Africa | 69 | 0.1% |
| Eastern Asia | 269 | 0.2% |
| Eastern Europe | 170 | 0.1% |
| Ecuador | 42 | 0.0% |
| El Salvador | 284 | 0.2% |
| England | 38 | 0.0% |
| Europe | 577 | 0.5% |
| Germany | 244 | 0.2% |
| Guatemala | 20 | 0.0% |
| Honduras | 116 | 0.1% |
| Hong Kong | 11 | 0.0% |
| Hungary | 50 | 0.0% |
| India | 79 | 0.1% |
| Iran | 28 | 0.0% |
| Italy | 17 | 0.0% |
| Jamaica | 26 | 0.0% |
| Japan | 18 | 0.0% |
| Kazakhstan | 9 | 0.0% |
| Kenya | 69 | 0.1% |
| Korea | 108 | 0.1% |
| Laos | 30 | 0.0% |
| Latin America | 8,351 | 6.7% |
| Latvia | 6 | 0.0% |
| Lithuania | 27 | 0.0% |
| Malaysia | 18 | 0.0% |
| Mexico | 7,605 | 6.1% |
| Middle Africa | 16 | 0.0% |
| Nepal | 191 | 0.2% |
| Netherlands | 15 | 0.0% |
| Nigeria | 105 | 0.1% |
| Northern Europe | 85 | 0.1% |
| Oceania | 24 | 0.0% |
| Pakistan | 35 | 0.0% |
| Panama | 69 | 0.1% |
| Philippines | 211 | 0.2% |
| Romania | 7 | 0.0% |
| Russia | 15 | 0.0% |
| Serbia | 46 | 0.0% |
| South Africa | 3 | 0.0% |
| South America | 138 | 0.1% |
| South Central Asia | 419 | 0.3% |
| South Eastern Asia | 548 | 0.4% |
| Southern Europe | 63 | 0.1% |
| Spain | 46 | 0.0% |
| Sri Lanka | 17 | 0.0% |
| Taiwan | 14 | 0.0% |
| Thailand | 50 | 0.0% |
| Ukraine | 8 | 0.0% |
| Venezuela | 16 | 0.0% |
| Vietnam | 187 | 0.2% |
| Western Africa | 105 | 0.1% |
| Western Europe | 259 | 0.2% | View All 71 Rows |
Sex and Age in Gregg County
Sex and Age in Gregg County
The most populous age groups in Gregg County are 10 to 14 Years (5,130 | 8.4%) for men and 10 to 14 Years (5,044 | 8.0%) for women.
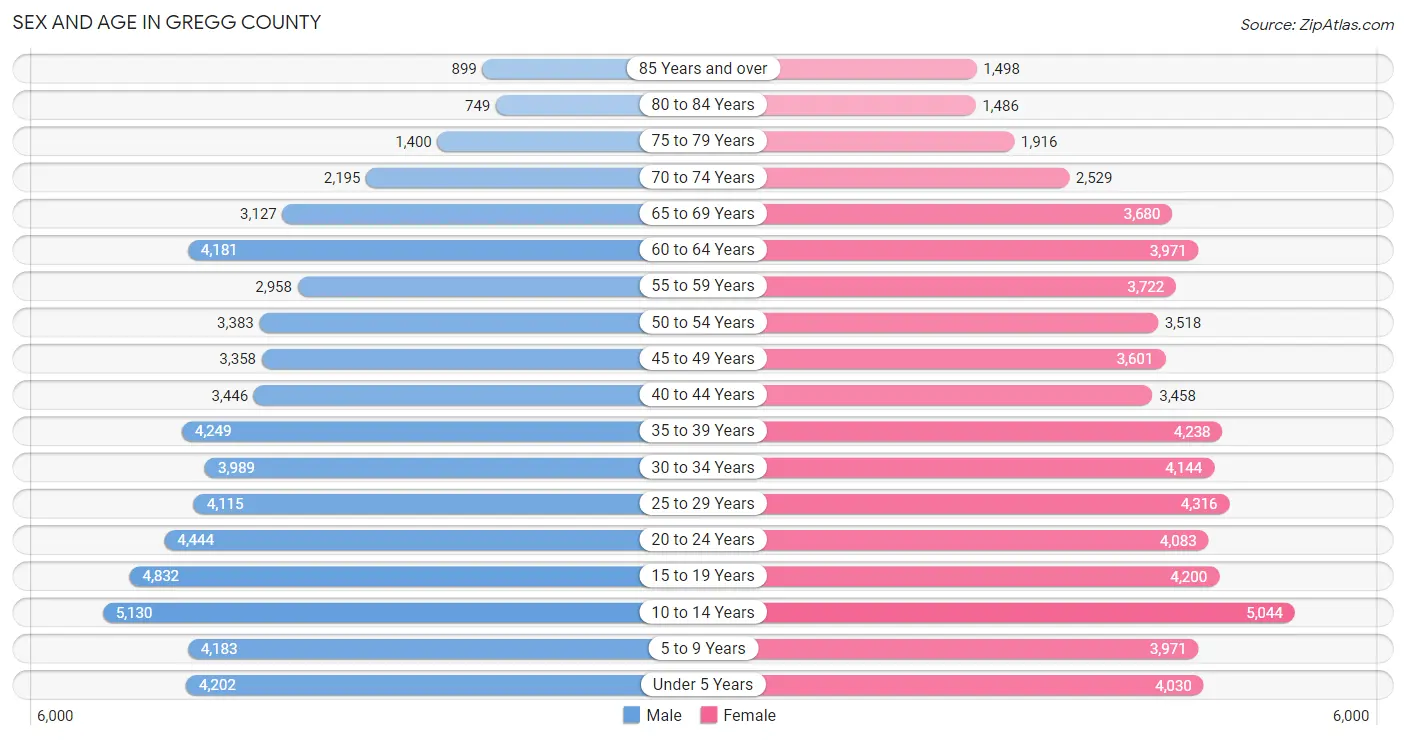
| Age Bracket | Male | Female |
| Under 5 Years | 4,202 (6.9%) | 4,030 (6.4%) |
| 5 to 9 Years | 4,183 (6.9%) | 3,971 (6.3%) |
| 10 to 14 Years | 5,130 (8.4%) | 5,044 (8.0%) |
| 15 to 19 Years | 4,832 (7.9%) | 4,200 (6.6%) |
| 20 to 24 Years | 4,444 (7.3%) | 4,083 (6.4%) |
| 25 to 29 Years | 4,115 (6.8%) | 4,316 (6.8%) |
| 30 to 34 Years | 3,989 (6.6%) | 4,144 (6.5%) |
| 35 to 39 Years | 4,249 (7.0%) | 4,238 (6.7%) |
| 40 to 44 Years | 3,446 (5.7%) | 3,458 (5.4%) |
| 45 to 49 Years | 3,358 (5.5%) | 3,601 (5.7%) |
| 50 to 54 Years | 3,383 (5.6%) | 3,518 (5.6%) |
| 55 to 59 Years | 2,958 (4.9%) | 3,722 (5.9%) |
| 60 to 64 Years | 4,181 (6.9%) | 3,971 (6.3%) |
| 65 to 69 Years | 3,127 (5.1%) | 3,680 (5.8%) |
| 70 to 74 Years | 2,195 (3.6%) | 2,529 (4.0%) |
| 75 to 79 Years | 1,400 (2.3%) | 1,916 (3.0%) |
| 80 to 84 Years | 749 (1.2%) | 1,486 (2.3%) |
| 85 Years and over | 899 (1.5%) | 1,498 (2.4%) |
| Total | 60,840 (100.0%) | 63,405 (100.0%) |
Families and Households in Gregg County
Median Family Size in Gregg County
The median family size in Gregg County is 3.15 persons per family, with married-couple families (21,664 | 70.2%) accounting for the largest median family size of 3.21 persons per family. On the other hand, single male/father families (2,032 | 6.6%) represent the smallest median family size with 2.88 persons per family.
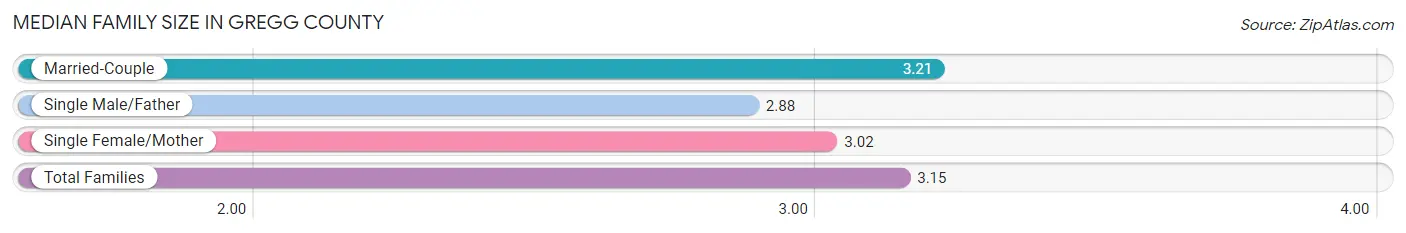
| Family Type | # Families | Family Size |
| Married-Couple | 21,664 (70.2%) | 3.21 |
| Single Male/Father | 2,032 (6.6%) | 2.88 |
| Single Female/Mother | 7,145 (23.2%) | 3.02 |
| Total Families | 30,841 (100.0%) | 3.15 |
Median Household Size in Gregg County
The median household size in Gregg County is 2.54 persons per household, with single male/father households (2,032 | 4.3%) accounting for the largest median household size of 3.27 persons per household. non-family households (16,167 | 34.4%) represent the smallest median household size with 1.22 persons per household.
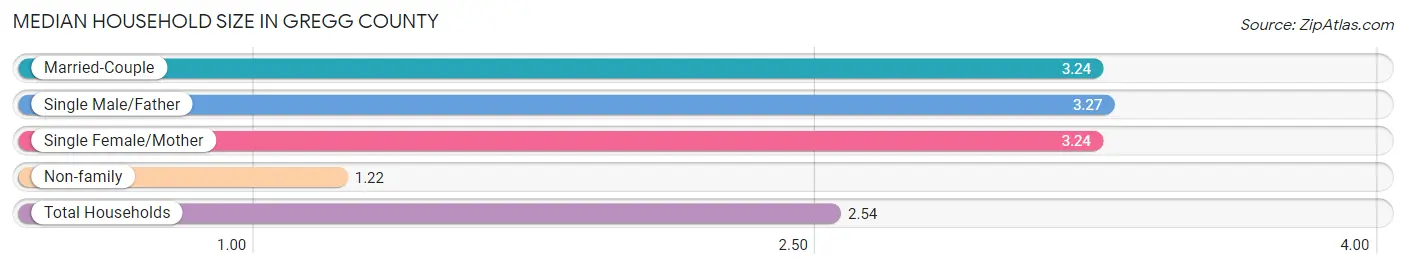
| Household Type | # Households | Household Size |
| Married-Couple | 21,664 (46.1%) | 3.24 |
| Single Male/Father | 2,032 (4.3%) | 3.27 |
| Single Female/Mother | 7,145 (15.2%) | 3.24 |
| Non-family | 16,167 (34.4%) | 1.22 |
| Total Households | 47,008 (100.0%) | 2.54 |
Household Size by Marriage Status in Gregg County
Out of a total of 47,008 households in Gregg County, 30,841 (65.6%) are family households, while 16,167 (34.4%) are nonfamily households. The most numerous type of family households are 2-person households, comprising 13,123, and the most common type of nonfamily households are 1-person households, comprising 13,108.
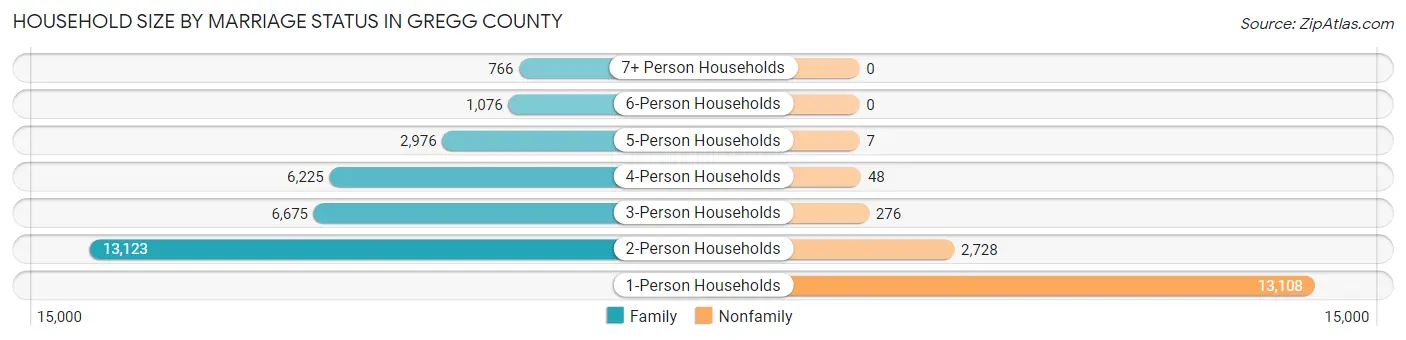
| Household Size | Family Households | Nonfamily Households |
| 1-Person Households | - | 13,108 (27.9%) |
| 2-Person Households | 13,123 (27.9%) | 2,728 (5.8%) |
| 3-Person Households | 6,675 (14.2%) | 276 (0.6%) |
| 4-Person Households | 6,225 (13.2%) | 48 (0.1%) |
| 5-Person Households | 2,976 (6.3%) | 7 (0.0%) |
| 6-Person Households | 1,076 (2.3%) | 0 (0.0%) |
| 7+ Person Households | 766 (1.6%) | 0 (0.0%) |
| Total | 30,841 (65.6%) | 16,167 (34.4%) |
Female Fertility in Gregg County
Fertility by Age in Gregg County
Average fertility rate in Gregg County is 41.0 births per 1,000 women. Women in the age bracket of 20 to 34 years have the highest fertility rate with 79.0 births per 1,000 women. Women in the age bracket of 20 to 34 years acount for 83.2% of all women with births.
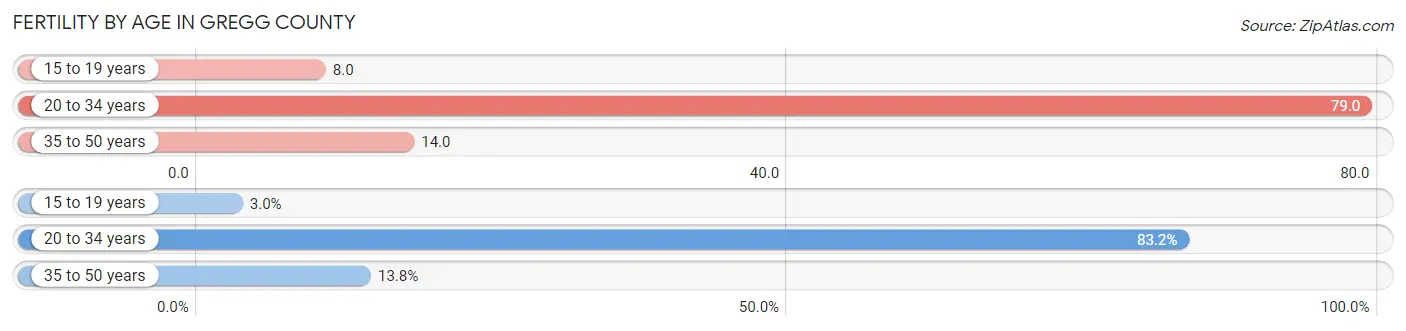
| Age Bracket | Women with Births | Births / 1,000 Women |
| 15 to 19 years | 35 (2.9%) | 8.0 |
| 20 to 34 years | 987 (83.2%) | 79.0 |
| 35 to 50 years | 164 (13.8%) | 14.0 |
| Total | 1,186 (100.0%) | 41.0 |
Fertility by Age by Marriage Status in Gregg County
38.7% of women with births (1,186) in Gregg County are married. The highest percentage of unmarried women with births falls into 15 to 19 years age bracket with 100.0% of them unmarried at the time of birth, while the lowest percentage of unmarried women with births belong to 35 to 50 years age bracket with 40.2% of them unmarried.
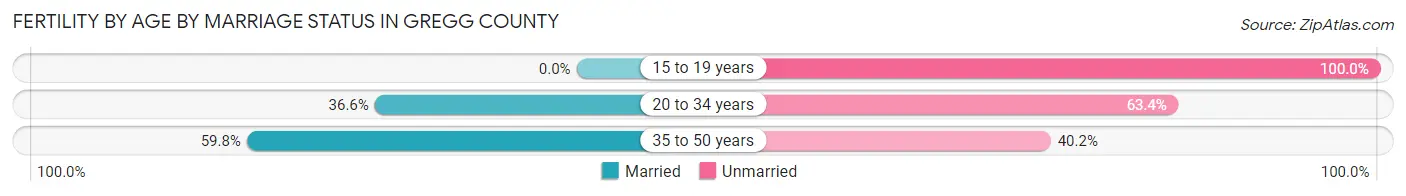
| Age Bracket | Married | Unmarried |
| 15 to 19 years | 0 (0.0%) | 35 (100.0%) |
| 20 to 34 years | 361 (36.6%) | 626 (63.4%) |
| 35 to 50 years | 98 (59.8%) | 66 (40.2%) |
| Total | 459 (38.7%) | 727 (61.3%) |
Fertility by Education in Gregg County
Average fertility rate in Gregg County is 41.0 births per 1,000 women. Women with the education attainment of high school diploma have the highest fertility rate of 57.0 births per 1,000 women, while women with the education attainment of less than high school have the lowest fertility at 16.0 births per 1,000 women. Women with the education attainment of college or associate's degree represent 45.1% of all women with births.
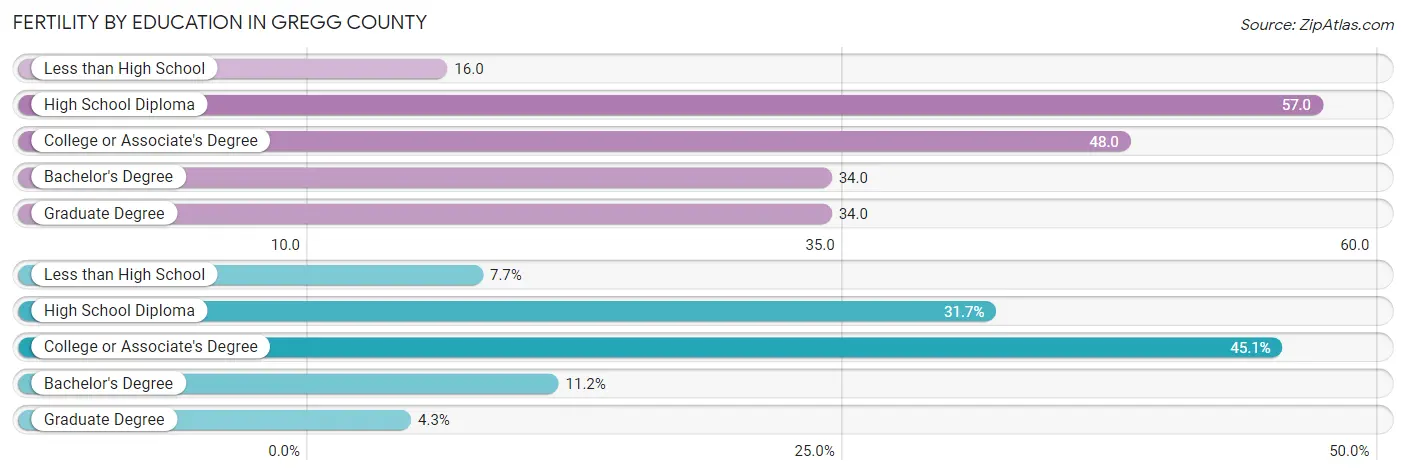
| Educational Attainment | Women with Births | Births / 1,000 Women |
| Less than High School | 91 (7.7%) | 16.0 |
| High School Diploma | 376 (31.7%) | 57.0 |
| College or Associate's Degree | 535 (45.1%) | 48.0 |
| Bachelor's Degree | 133 (11.2%) | 34.0 |
| Graduate Degree | 51 (4.3%) | 34.0 |
| Total | 1,186 (100.0%) | 41.0 |
Fertility by Education by Marriage Status in Gregg County
61.3% of women with births in Gregg County are unmarried. Women with the educational attainment of graduate degree are most likely to be married with 100.0% of them married at childbirth, while women with the educational attainment of less than high school are least likely to be married with 100.0% of them unmarried at childbirth.
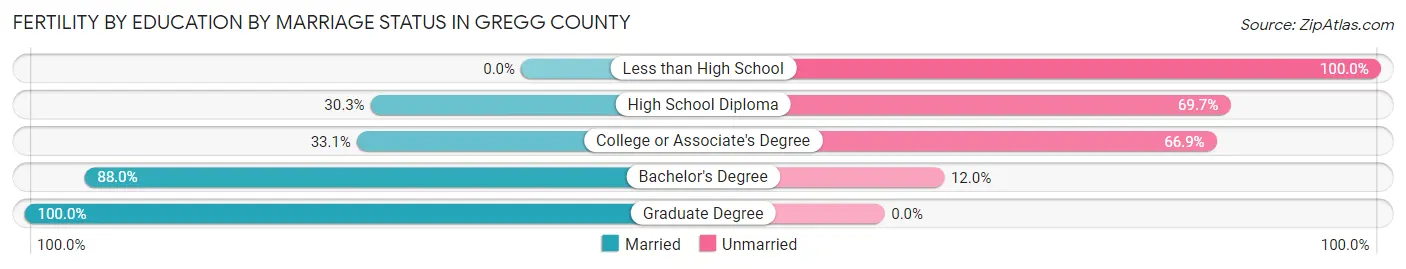
| Educational Attainment | Married | Unmarried |
| Less than High School | 0 (0.0%) | 91 (100.0%) |
| High School Diploma | 114 (30.3%) | 262 (69.7%) |
| College or Associate's Degree | 177 (33.1%) | 358 (66.9%) |
| Bachelor's Degree | 117 (88.0%) | 16 (12.0%) |
| Graduate Degree | 51 (100.0%) | 0 (0.0%) |
| Total | 459 (38.7%) | 727 (61.3%) |
Employment Characteristics in Gregg County
Employment by Class of Employer in Gregg County
Among the 56,334 employed individuals in Gregg County, private company employees (39,763 | 70.6%), not-for-profit organizations (4,372 | 7.8%), and self-employed (not incorporated) (3,664 | 6.5%) make up the most common classes of employment.
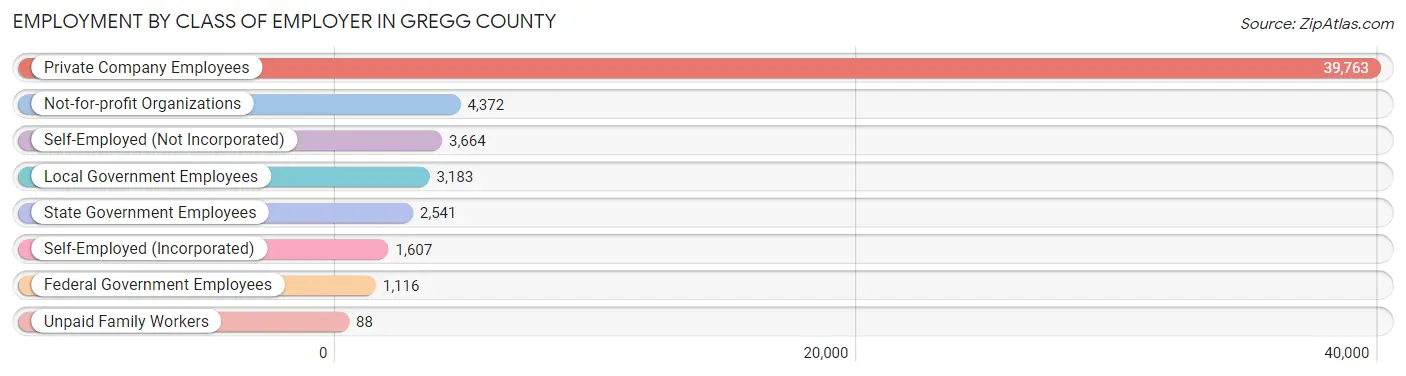
| Employer Class | # Employees | % Employees |
| Private Company Employees | 39,763 | 70.6% |
| Self-Employed (Incorporated) | 1,607 | 2.9% |
| Self-Employed (Not Incorporated) | 3,664 | 6.5% |
| Not-for-profit Organizations | 4,372 | 7.8% |
| Local Government Employees | 3,183 | 5.7% |
| State Government Employees | 2,541 | 4.5% |
| Federal Government Employees | 1,116 | 2.0% |
| Unpaid Family Workers | 88 | 0.2% |
| Total | 56,334 | 100.0% |
Employment Status by Age in Gregg County
According to the labor force statistics for Gregg County, out of the total population over 16 years of age (95,839), 61.7% or 59,133 individuals are in the labor force, with 3.7% or 2,188 of them unemployed. The age group with the highest labor force participation rate is 25 to 29 years, with 83.2% or 7,015 individuals in the labor force. Within the labor force, the 16 to 19 years age range has the highest percentage of unemployed individuals, with 9.4% or 265 of them being unemployed.
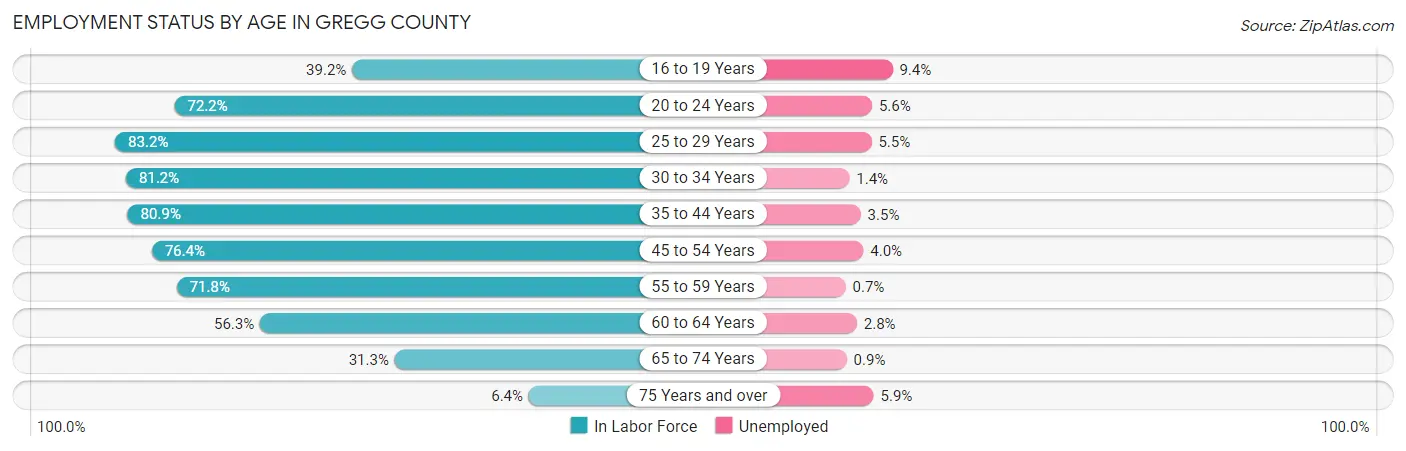
| Age Bracket | In Labor Force | Unemployed |
| 16 to 19 Years | 2,817 (39.2%) | 265 (9.4%) |
| 20 to 24 Years | 6,156 (72.2%) | 345 (5.6%) |
| 25 to 29 Years | 7,015 (83.2%) | 386 (5.5%) |
| 30 to 34 Years | 6,604 (81.2%) | 92 (1.4%) |
| 35 to 44 Years | 12,451 (80.9%) | 436 (3.5%) |
| 45 to 54 Years | 10,589 (76.4%) | 424 (4.0%) |
| 55 to 59 Years | 4,796 (71.8%) | 34 (0.7%) |
| 60 to 64 Years | 4,590 (56.3%) | 129 (2.8%) |
| 65 to 74 Years | 3,609 (31.3%) | 32 (0.9%) |
| 75 Years and over | 509 (6.4%) | 30 (5.9%) |
| Total | 59,133 (61.7%) | 2,188 (3.7%) |
Employment Status by Educational Attainment in Gregg County
According to labor force statistics for Gregg County, 75.9% of individuals (46,031) out of the total population between 25 and 64 years of age (60,647) are in the labor force, with 3.3% or 1,519 of them being unemployed. The group with the highest labor force participation rate are those with the educational attainment of bachelor's degree or higher, with 84.7% or 11,213 individuals in the labor force. Within the labor force, individuals with college / associate degree education have the highest percentage of unemployment, with 4.2% or 709 of them being unemployed.
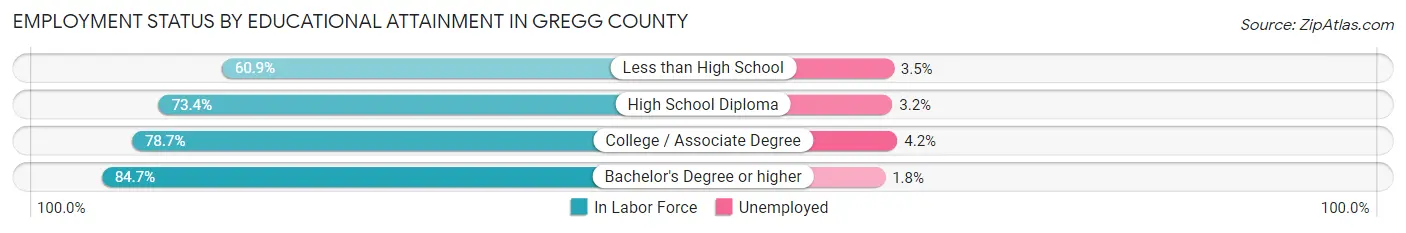
| Educational Attainment | In Labor Force | Unemployed |
| Less than High School | 5,396 (60.9%) | 310 (3.5%) |
| High School Diploma | 12,556 (73.4%) | 547 (3.2%) |
| College / Associate Degree | 16,874 (78.7%) | 901 (4.2%) |
| Bachelor's Degree or higher | 11,213 (84.7%) | 238 (1.8%) |
| Total | 46,031 (75.9%) | 2,001 (3.3%) |
Employment Occupations by Sex in Gregg County
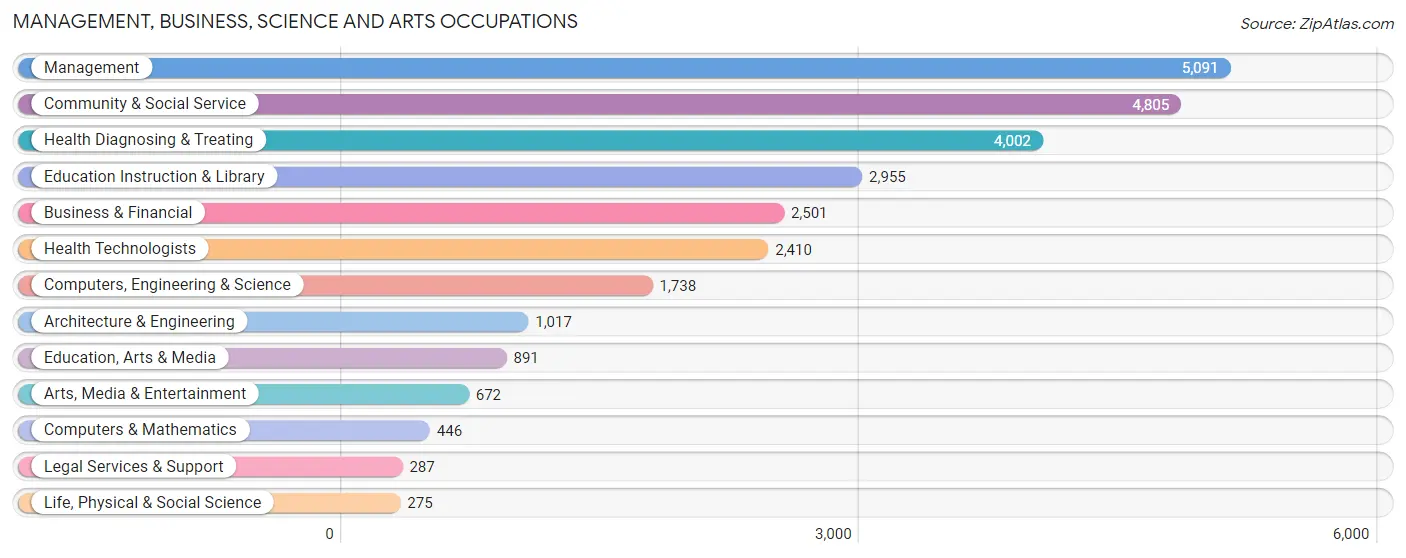
Management, Business, Science and Arts Occupations
The most common Management, Business, Science and Arts occupations in Gregg County are Management (5,091 | 8.9%), Community & Social Service (4,805 | 8.5%), Health Diagnosing & Treating (4,002 | 7.0%), Education Instruction & Library (2,955 | 5.2%), and Business & Financial (2,501 | 4.4%).
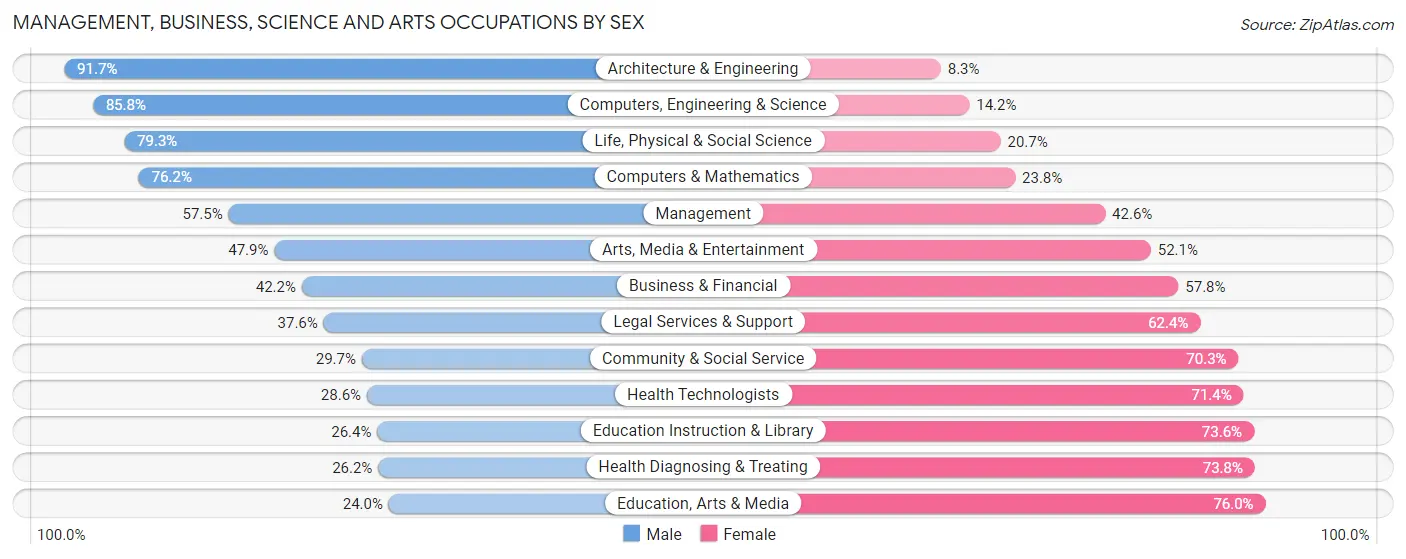
Management, Business, Science and Arts Occupations by Sex
Within the Management, Business, Science and Arts occupations in Gregg County, the most male-oriented occupations are Architecture & Engineering (91.7%), Computers, Engineering & Science (85.8%), and Life, Physical & Social Science (79.3%), while the most female-oriented occupations are Education, Arts & Media (76.0%), Health Diagnosing & Treating (73.8%), and Education Instruction & Library (73.6%).
| Occupation | Male | Female |
| Management | 2,925 (57.5%) | 2,166 (42.5%) |
| Business & Financial | 1,055 (42.2%) | 1,446 (57.8%) |
| Computers, Engineering & Science | 1,491 (85.8%) | 247 (14.2%) |
| Computers & Mathematics | 340 (76.2%) | 106 (23.8%) |
| Architecture & Engineering | 933 (91.7%) | 84 (8.3%) |
| Life, Physical & Social Science | 218 (79.3%) | 57 (20.7%) |
| Community & Social Service | 1,425 (29.7%) | 3,380 (70.3%) |
| Education, Arts & Media | 214 (24.0%) | 677 (76.0%) |
| Legal Services & Support | 108 (37.6%) | 179 (62.4%) |
| Education Instruction & Library | 781 (26.4%) | 2,174 (73.6%) |
| Arts, Media & Entertainment | 322 (47.9%) | 350 (52.1%) |
| Health Diagnosing & Treating | 1,050 (26.2%) | 2,952 (73.8%) |
| Health Technologists | 689 (28.6%) | 1,721 (71.4%) |
| Total (Category) | 7,946 (43.8%) | 10,191 (56.2%) |
| Total (Overall) | 29,778 (52.4%) | 27,084 (47.6%) |
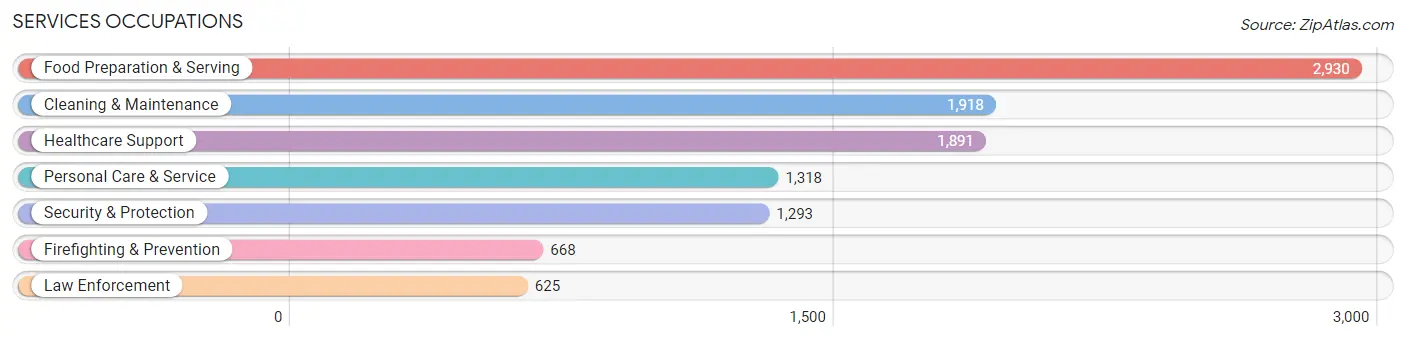
Services Occupations
The most common Services occupations in Gregg County are Food Preparation & Serving (2,930 | 5.1%), Cleaning & Maintenance (1,918 | 3.4%), Healthcare Support (1,891 | 3.3%), Personal Care & Service (1,318 | 2.3%), and Security & Protection (1,293 | 2.3%).
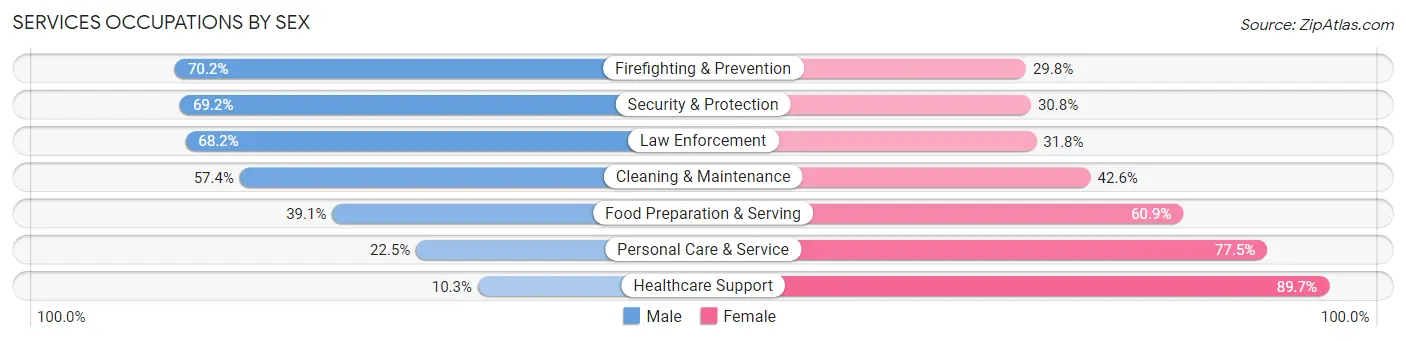
Services Occupations by Sex
Within the Services occupations in Gregg County, the most male-oriented occupations are Firefighting & Prevention (70.2%), Security & Protection (69.2%), and Law Enforcement (68.2%), while the most female-oriented occupations are Healthcare Support (89.7%), Personal Care & Service (77.5%), and Food Preparation & Serving (60.9%).
| Occupation | Male | Female |
| Healthcare Support | 194 (10.3%) | 1,697 (89.7%) |
| Security & Protection | 895 (69.2%) | 398 (30.8%) |
| Firefighting & Prevention | 469 (70.2%) | 199 (29.8%) |
| Law Enforcement | 426 (68.2%) | 199 (31.8%) |
| Food Preparation & Serving | 1,145 (39.1%) | 1,785 (60.9%) |
| Cleaning & Maintenance | 1,101 (57.4%) | 817 (42.6%) |
| Personal Care & Service | 296 (22.5%) | 1,022 (77.5%) |
| Total (Category) | 3,631 (38.8%) | 5,719 (61.2%) |
| Total (Overall) | 29,778 (52.4%) | 27,084 (47.6%) |
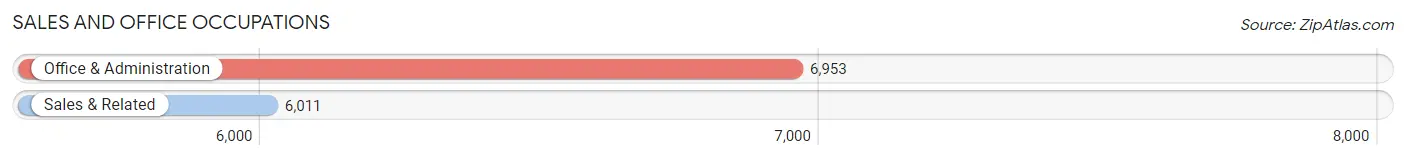
Sales and Office Occupations
The most common Sales and Office occupations in Gregg County are Office & Administration (6,953 | 12.2%), and Sales & Related (6,011 | 10.6%).
Sales and Office Occupations by Sex
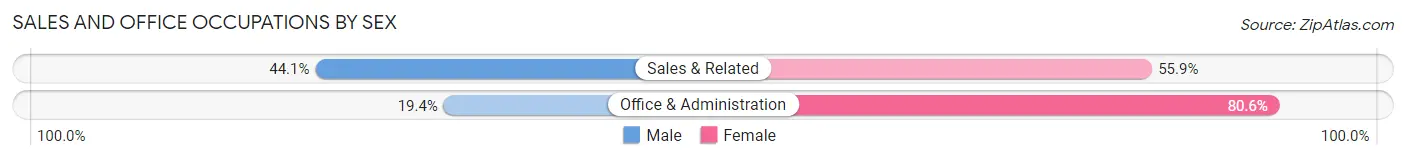
| Occupation | Male | Female |
| Sales & Related | 2,651 (44.1%) | 3,360 (55.9%) |
| Office & Administration | 1,349 (19.4%) | 5,604 (80.6%) |
| Total (Category) | 4,000 (30.8%) | 8,964 (69.2%) |
| Total (Overall) | 29,778 (52.4%) | 27,084 (47.6%) |
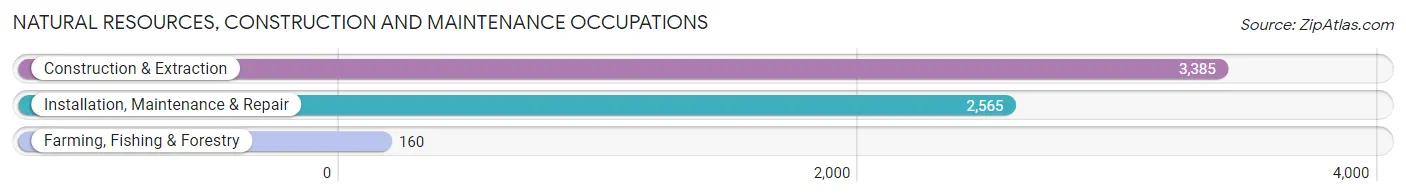
Natural Resources, Construction and Maintenance Occupations
The most common Natural Resources, Construction and Maintenance occupations in Gregg County are Construction & Extraction (3,385 | 5.9%), Installation, Maintenance & Repair (2,565 | 4.5%), and Farming, Fishing & Forestry (160 | 0.3%).
Natural Resources, Construction and Maintenance Occupations by Sex
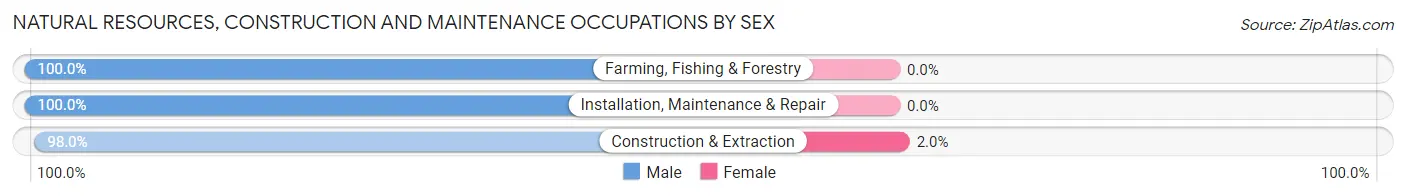
| Occupation | Male | Female |
| Farming, Fishing & Forestry | 160 (100.0%) | 0 (0.0%) |
| Construction & Extraction | 3,316 (98.0%) | 69 (2.0%) |
| Installation, Maintenance & Repair | 2,565 (100.0%) | 0 (0.0%) |
| Total (Category) | 6,041 (98.9%) | 69 (1.1%) |
| Total (Overall) | 29,778 (52.4%) | 27,084 (47.6%) |
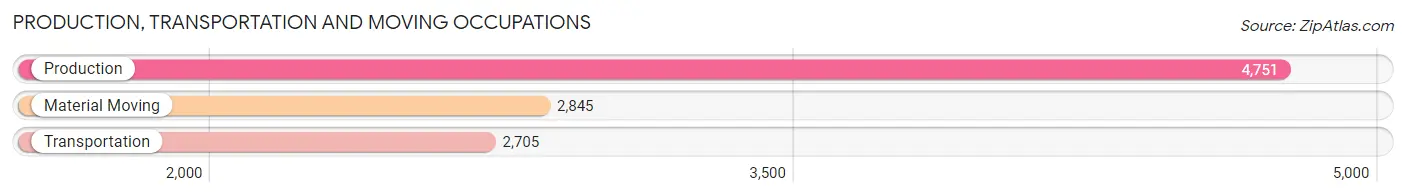
Production, Transportation and Moving Occupations
The most common Production, Transportation and Moving occupations in Gregg County are Production (4,751 | 8.4%), Material Moving (2,845 | 5.0%), and Transportation (2,705 | 4.8%).
Production, Transportation and Moving Occupations by Sex
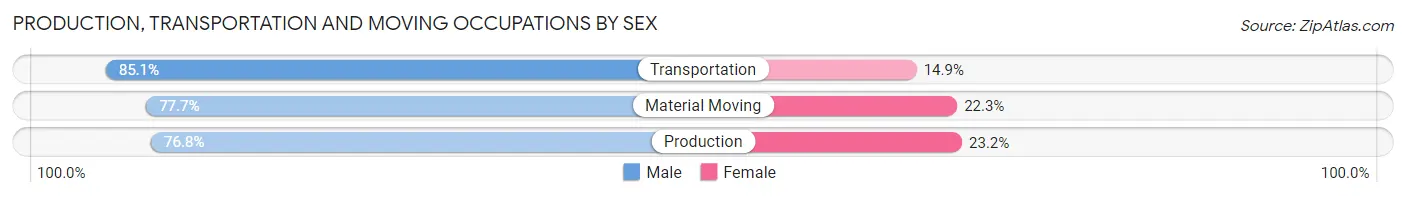
| Occupation | Male | Female |
| Production | 3,648 (76.8%) | 1,103 (23.2%) |
| Transportation | 2,302 (85.1%) | 403 (14.9%) |
| Material Moving | 2,210 (77.7%) | 635 (22.3%) |
| Total (Category) | 8,160 (79.2%) | 2,141 (20.8%) |
| Total (Overall) | 29,778 (52.4%) | 27,084 (47.6%) |
Employment Industries by Sex in Gregg County
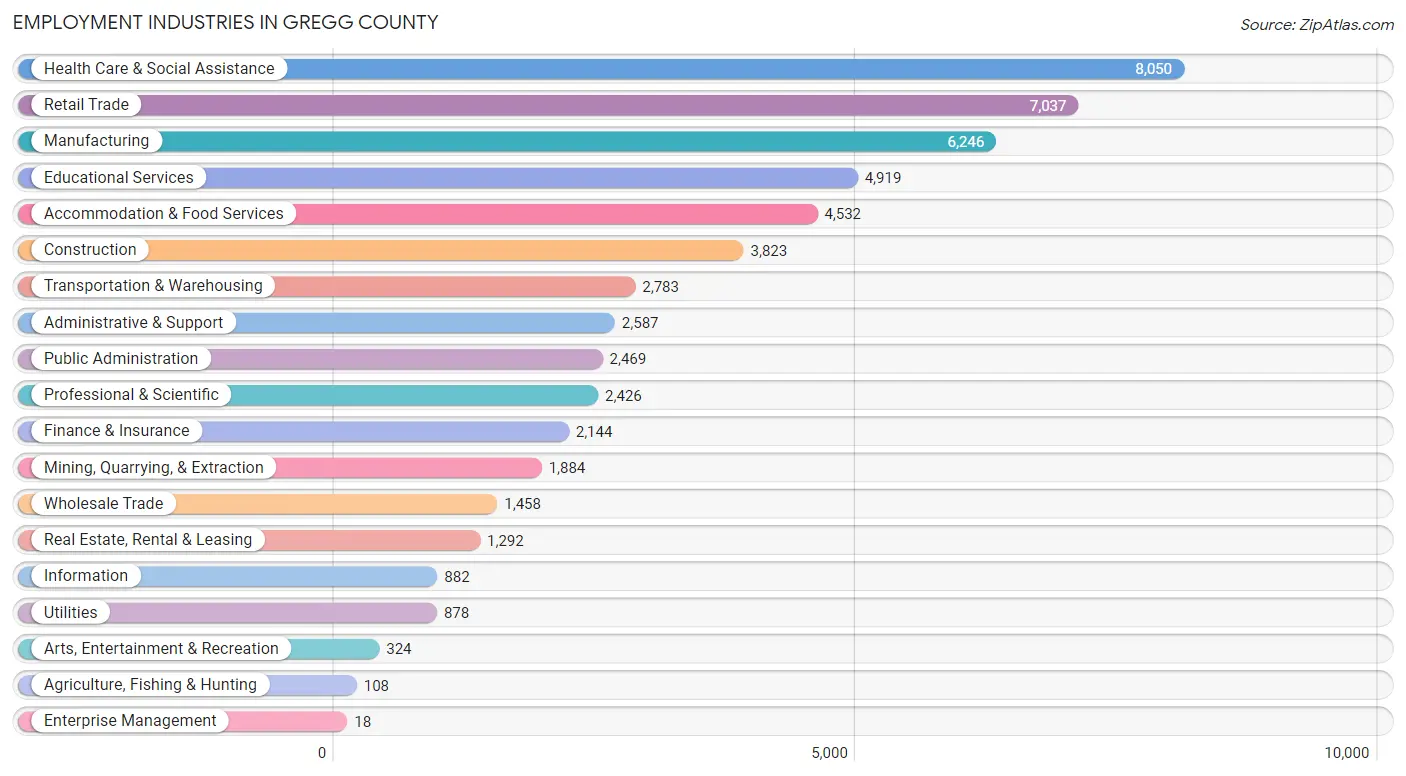
Employment Industries in Gregg County
The major employment industries in Gregg County include Health Care & Social Assistance (8,050 | 14.2%), Retail Trade (7,037 | 12.4%), Manufacturing (6,246 | 11.0%), Educational Services (4,919 | 8.6%), and Accommodation & Food Services (4,532 | 8.0%).
Employment Industries by Sex in Gregg County
The Gregg County industries that see more men than women are Enterprise Management (100.0%), Agriculture, Fishing & Hunting (96.3%), and Construction (91.5%), whereas the industries that tend to have a higher number of women are Health Care & Social Assistance (81.8%), Finance & Insurance (74.4%), and Educational Services (70.8%).
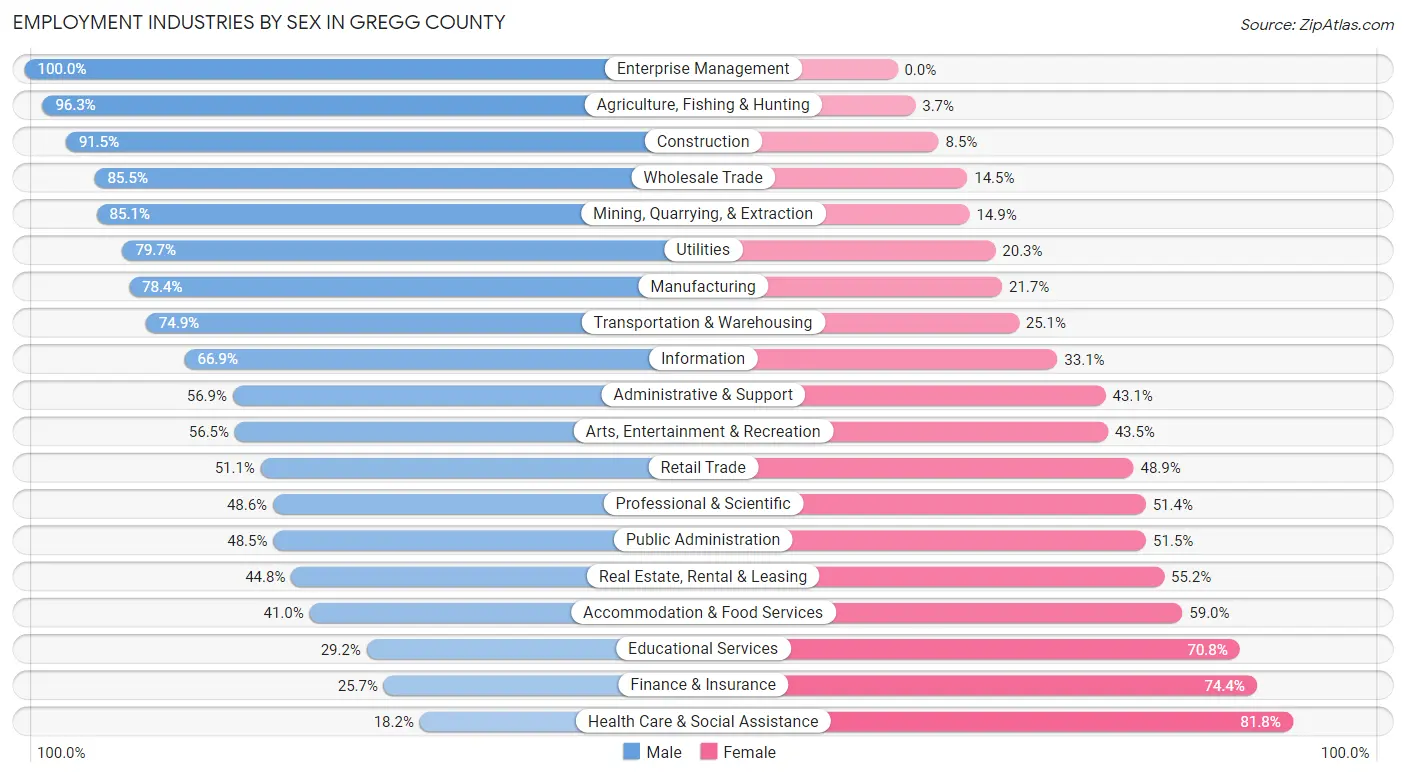
| Industry | Male | Female |
| Agriculture, Fishing & Hunting | 104 (96.3%) | 4 (3.7%) |
| Mining, Quarrying, & Extraction | 1,603 (85.1%) | 281 (14.9%) |
| Construction | 3,497 (91.5%) | 326 (8.5%) |
| Manufacturing | 4,894 (78.3%) | 1,352 (21.6%) |
| Wholesale Trade | 1,247 (85.5%) | 211 (14.5%) |
| Retail Trade | 3,598 (51.1%) | 3,439 (48.9%) |
| Transportation & Warehousing | 2,084 (74.9%) | 699 (25.1%) |
| Utilities | 700 (79.7%) | 178 (20.3%) |
| Information | 590 (66.9%) | 292 (33.1%) |
| Finance & Insurance | 550 (25.7%) | 1,594 (74.4%) |
| Real Estate, Rental & Leasing | 579 (44.8%) | 713 (55.2%) |
| Professional & Scientific | 1,179 (48.6%) | 1,247 (51.4%) |
| Enterprise Management | 18 (100.0%) | 0 (0.0%) |
| Administrative & Support | 1,472 (56.9%) | 1,115 (43.1%) |
| Educational Services | 1,436 (29.2%) | 3,483 (70.8%) |
| Health Care & Social Assistance | 1,466 (18.2%) | 6,584 (81.8%) |
| Arts, Entertainment & Recreation | 183 (56.5%) | 141 (43.5%) |
| Accommodation & Food Services | 1,859 (41.0%) | 2,673 (59.0%) |
| Public Administration | 1,198 (48.5%) | 1,271 (51.5%) |
| Total | 29,778 (52.4%) | 27,084 (47.6%) |
Education in Gregg County
School Enrollment in Gregg County
The most common levels of schooling among the 31,034 students in Gregg County are middle school (8,000 | 25.8%), elementary school (6,743 | 21.7%), and high school (6,665 | 21.5%).
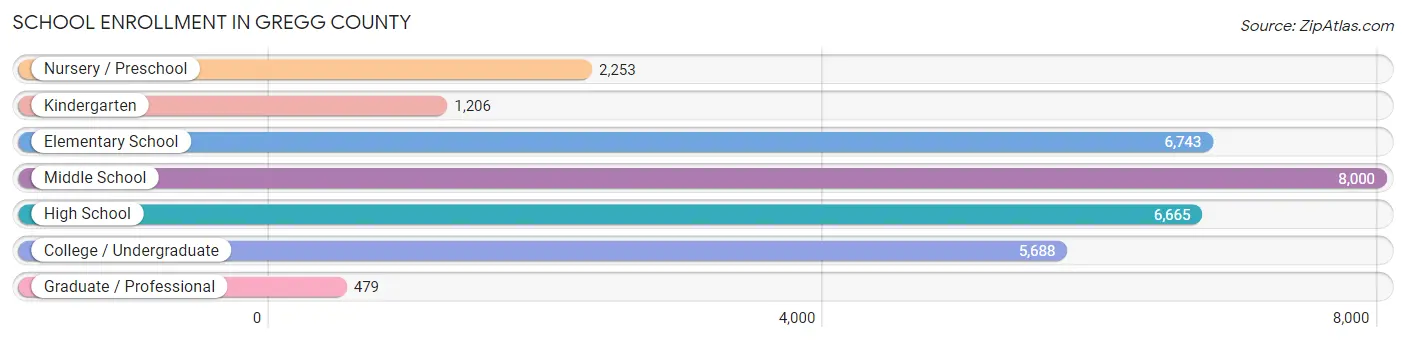
| School Level | # Students | % Students |
| Nursery / Preschool | 2,253 | 7.3% |
| Kindergarten | 1,206 | 3.9% |
| Elementary School | 6,743 | 21.7% |
| Middle School | 8,000 | 25.8% |
| High School | 6,665 | 21.5% |
| College / Undergraduate | 5,688 | 18.3% |
| Graduate / Professional | 479 | 1.5% |
| Total | 31,034 | 100.0% |
School Enrollment by Age by Funding Source in Gregg County
Out of a total of 31,034 students who are enrolled in schools in Gregg County, 3,693 (11.9%) attend a private institution, while the remaining 27,341 (88.1%) are enrolled in public schools. The age group of 3 to 4 year olds has the highest likelihood of being enrolled in private schools, with 423 (27.3% in the age bracket) enrolled. Conversely, the age group of 15 to 17 year olds has the lowest likelihood of being enrolled in a private school, with 4,762 (94.6% in the age bracket) attending a public institution.
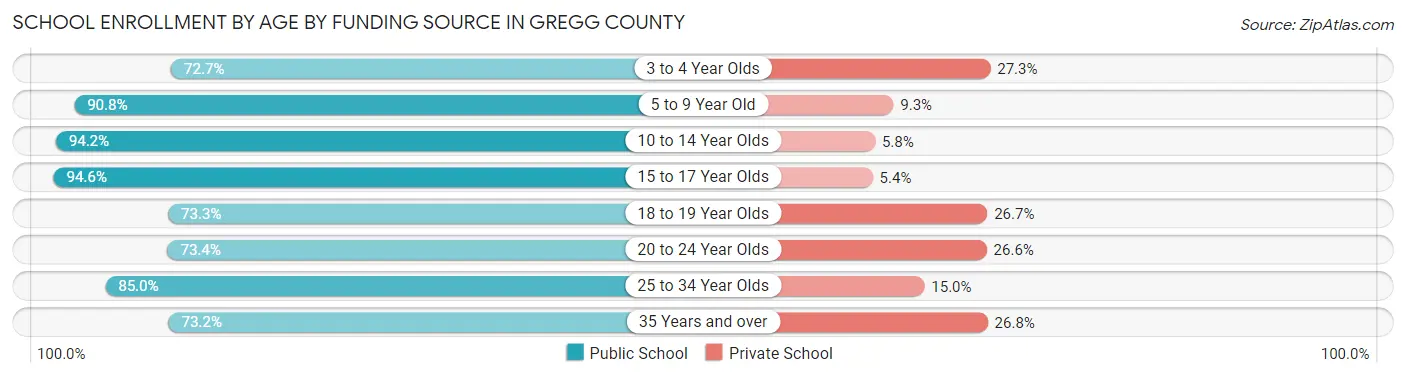
| Age Bracket | Public School | Private School |
| 3 to 4 Year Olds | 1,126 (72.7%) | 423 (27.3%) |
| 5 to 9 Year Old | 6,840 (90.7%) | 697 (9.2%) |
| 10 to 14 Year Olds | 9,362 (94.2%) | 580 (5.8%) |
| 15 to 17 Year Olds | 4,762 (94.6%) | 272 (5.4%) |
| 18 to 19 Year Olds | 1,688 (73.3%) | 616 (26.7%) |
| 20 to 24 Year Olds | 1,857 (73.4%) | 674 (26.6%) |
| 25 to 34 Year Olds | 1,046 (85.0%) | 185 (15.0%) |
| 35 Years and over | 663 (73.2%) | 243 (26.8%) |
| Total | 27,341 (88.1%) | 3,693 (11.9%) |
Educational Attainment by Field of Study in Gregg County
Business (4,074 | 20.9%), education (3,634 | 18.7%), science & technology (2,748 | 14.1%), arts & humanities (1,742 | 8.9%), and bio, nature & agricultural (1,150 | 5.9%) are the most common fields of study among 19,457 individuals in Gregg County who have obtained a bachelor's degree or higher.
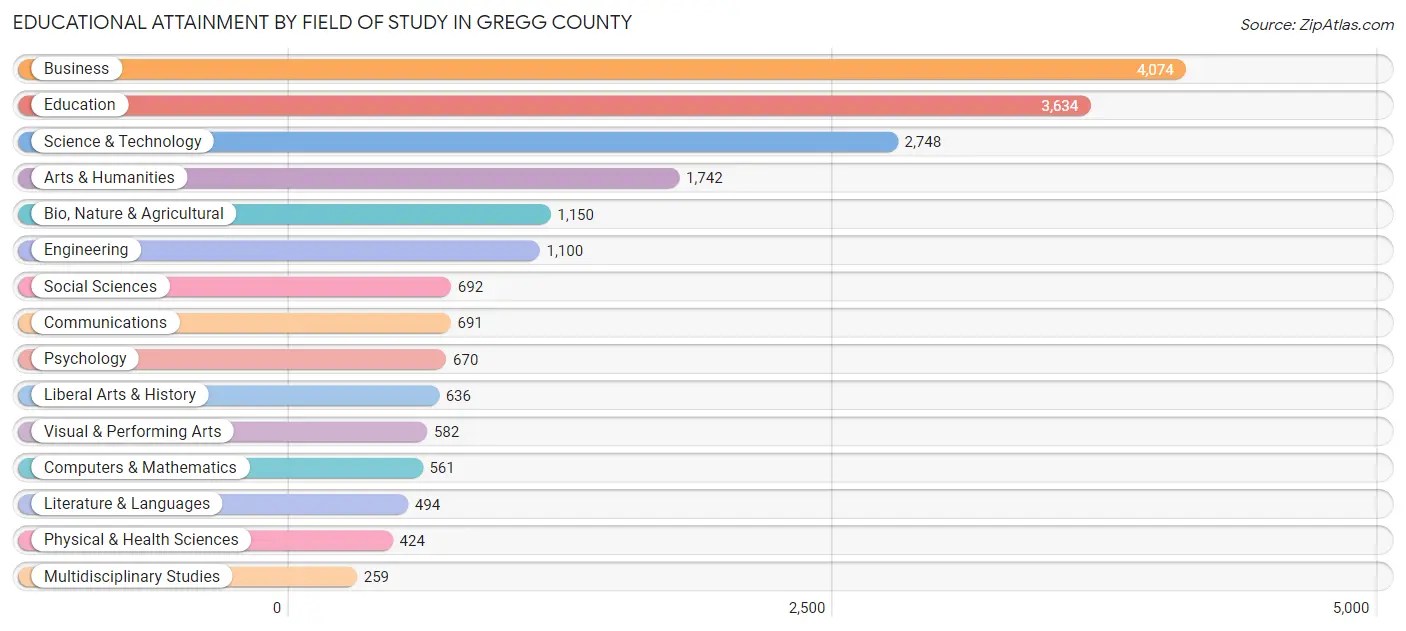
| Field of Study | # Graduates | % Graduates |
| Computers & Mathematics | 561 | 2.9% |
| Bio, Nature & Agricultural | 1,150 | 5.9% |
| Physical & Health Sciences | 424 | 2.2% |
| Psychology | 670 | 3.4% |
| Social Sciences | 692 | 3.6% |
| Engineering | 1,100 | 5.7% |
| Multidisciplinary Studies | 259 | 1.3% |
| Science & Technology | 2,748 | 14.1% |
| Business | 4,074 | 20.9% |
| Education | 3,634 | 18.7% |
| Literature & Languages | 494 | 2.5% |
| Liberal Arts & History | 636 | 3.3% |
| Visual & Performing Arts | 582 | 3.0% |
| Communications | 691 | 3.5% |
| Arts & Humanities | 1,742 | 8.9% |
| Total | 19,457 | 100.0% |
Transportation & Commute in Gregg County
Vehicle Availability by Sex in Gregg County
The most prevalent vehicle ownership categories in Gregg County are males with 2 vehicles (13,550, accounting for 46.4%) and females with 2 vehicles (10,670, making up 51.0%).
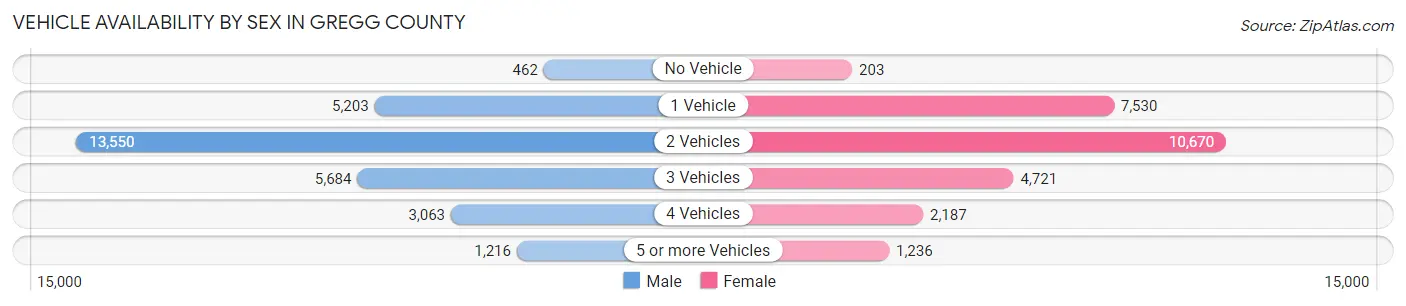
| Vehicles Available | Male | Female |
| No Vehicle | 462 (1.6%) | 203 (0.8%) |
| 1 Vehicle | 5,203 (17.8%) | 7,530 (28.4%) |
| 2 Vehicles | 13,550 (46.4%) | 10,670 (40.2%) |
| 3 Vehicles | 5,684 (19.5%) | 4,721 (17.8%) |
| 4 Vehicles | 3,063 (10.5%) | 2,187 (8.2%) |
| 5 or more Vehicles | 1,216 (4.2%) | 1,236 (4.7%) |
| Total | 29,178 (100.0%) | 26,547 (100.0%) |
Commute Time in Gregg County
The most frequently occuring commute durations in Gregg County are 15 to 19 minutes (11,376 commuters, 21.2%), 10 to 14 minutes (10,409 commuters, 19.4%), and 20 to 24 minutes (8,525 commuters, 15.9%).
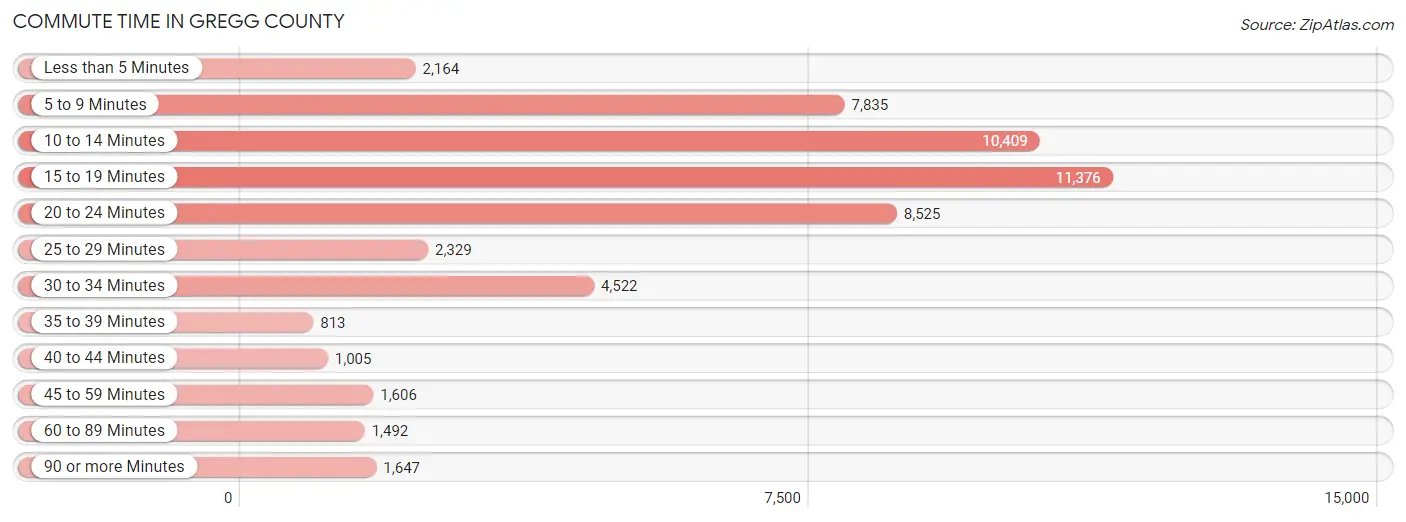
| Commute Time | # Commuters | % Commuters |
| Less than 5 Minutes | 2,164 | 4.0% |
| 5 to 9 Minutes | 7,835 | 14.6% |
| 10 to 14 Minutes | 10,409 | 19.4% |
| 15 to 19 Minutes | 11,376 | 21.2% |
| 20 to 24 Minutes | 8,525 | 15.9% |
| 25 to 29 Minutes | 2,329 | 4.3% |
| 30 to 34 Minutes | 4,522 | 8.4% |
| 35 to 39 Minutes | 813 | 1.5% |
| 40 to 44 Minutes | 1,005 | 1.9% |
| 45 to 59 Minutes | 1,606 | 3.0% |
| 60 to 89 Minutes | 1,492 | 2.8% |
| 90 or more Minutes | 1,647 | 3.1% |
Commute Time by Sex in Gregg County
The most common commute times in Gregg County are 15 to 19 minutes (6,521 commuters, 22.8%) for males and 10 to 14 minutes (5,262 commuters, 20.9%) for females.
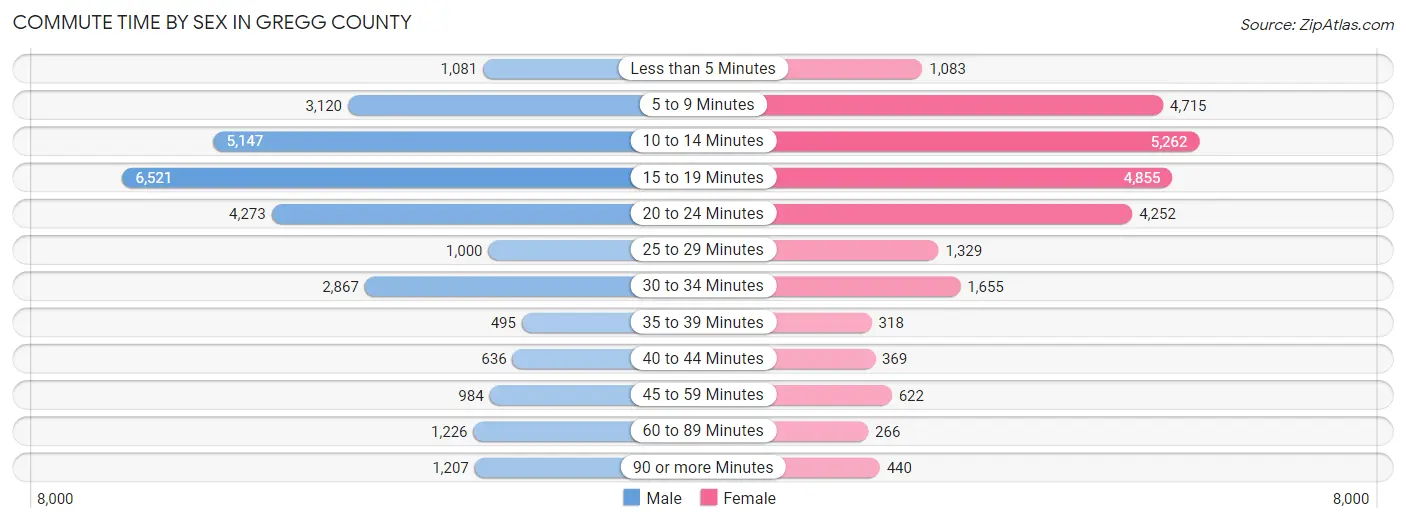
| Commute Time | Male | Female |
| Less than 5 Minutes | 1,081 (3.8%) | 1,083 (4.3%) |
| 5 to 9 Minutes | 3,120 (10.9%) | 4,715 (18.7%) |
| 10 to 14 Minutes | 5,147 (18.0%) | 5,262 (20.9%) |
| 15 to 19 Minutes | 6,521 (22.8%) | 4,855 (19.3%) |
| 20 to 24 Minutes | 4,273 (15.0%) | 4,252 (16.9%) |
| 25 to 29 Minutes | 1,000 (3.5%) | 1,329 (5.3%) |
| 30 to 34 Minutes | 2,867 (10.0%) | 1,655 (6.6%) |
| 35 to 39 Minutes | 495 (1.7%) | 318 (1.3%) |
| 40 to 44 Minutes | 636 (2.2%) | 369 (1.5%) |
| 45 to 59 Minutes | 984 (3.5%) | 622 (2.5%) |
| 60 to 89 Minutes | 1,226 (4.3%) | 266 (1.1%) |
| 90 or more Minutes | 1,207 (4.2%) | 440 (1.8%) |
Time of Departure to Work by Sex in Gregg County
The most frequent times of departure to work in Gregg County are 7:00 AM to 7:29 AM (3,881, 13.6%) for males and 7:30 AM to 7:59 AM (4,498, 17.9%) for females.
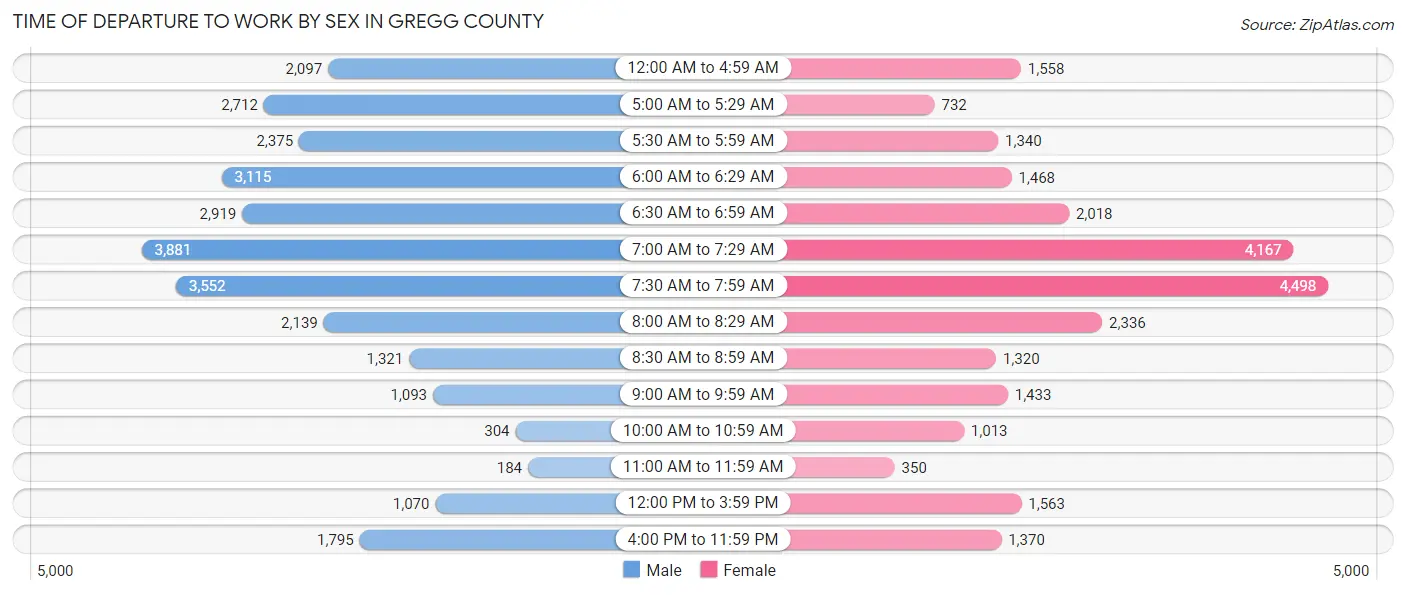
| Time of Departure | Male | Female |
| 12:00 AM to 4:59 AM | 2,097 (7.3%) | 1,558 (6.2%) |
| 5:00 AM to 5:29 AM | 2,712 (9.5%) | 732 (2.9%) |
| 5:30 AM to 5:59 AM | 2,375 (8.3%) | 1,340 (5.3%) |
| 6:00 AM to 6:29 AM | 3,115 (10.9%) | 1,468 (5.8%) |
| 6:30 AM to 6:59 AM | 2,919 (10.2%) | 2,018 (8.0%) |
| 7:00 AM to 7:29 AM | 3,881 (13.6%) | 4,167 (16.6%) |
| 7:30 AM to 7:59 AM | 3,552 (12.4%) | 4,498 (17.9%) |
| 8:00 AM to 8:29 AM | 2,139 (7.5%) | 2,336 (9.3%) |
| 8:30 AM to 8:59 AM | 1,321 (4.6%) | 1,320 (5.2%) |
| 9:00 AM to 9:59 AM | 1,093 (3.8%) | 1,433 (5.7%) |
| 10:00 AM to 10:59 AM | 304 (1.1%) | 1,013 (4.0%) |
| 11:00 AM to 11:59 AM | 184 (0.6%) | 350 (1.4%) |
| 12:00 PM to 3:59 PM | 1,070 (3.7%) | 1,563 (6.2%) |
| 4:00 PM to 11:59 PM | 1,795 (6.3%) | 1,370 (5.4%) |
| Total | 28,557 (100.0%) | 25,166 (100.0%) |
Housing Occupancy in Gregg County
Occupancy by Ownership in Gregg County
Of the total 47,008 dwellings in Gregg County, owner-occupied units account for 27,982 (59.5%), while renter-occupied units make up 19,026 (40.5%).
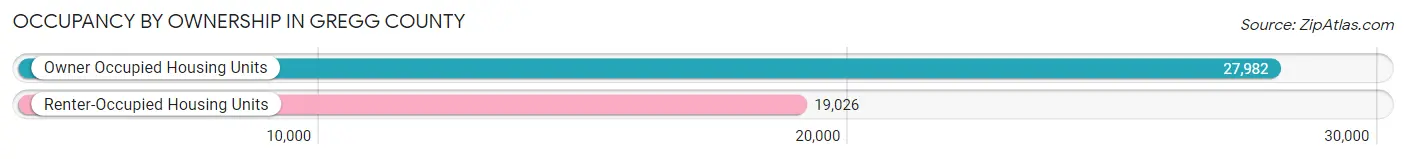
| Occupancy | # Housing Units | % Housing Units |
| Owner Occupied Housing Units | 27,982 | 59.5% |
| Renter-Occupied Housing Units | 19,026 | 40.5% |
| Total Occupied Housing Units | 47,008 | 100.0% |
Occupancy by Household Size in Gregg County
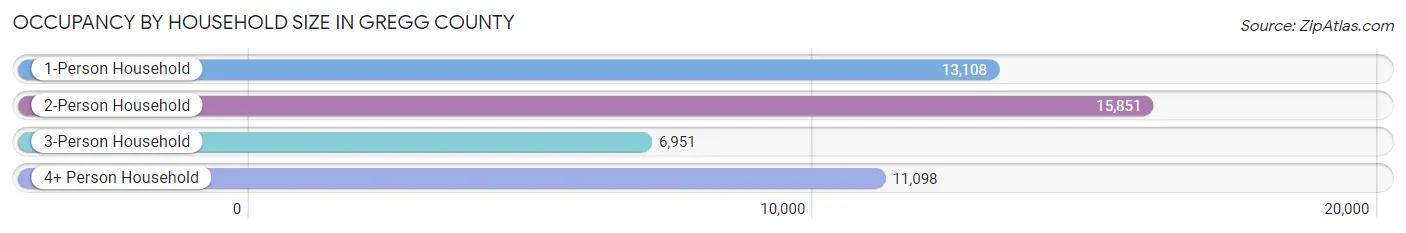
| Household Size | # Housing Units | % Housing Units |
| 1-Person Household | 13,108 | 27.9% |
| 2-Person Household | 15,851 | 33.7% |
| 3-Person Household | 6,951 | 14.8% |
| 4+ Person Household | 11,098 | 23.6% |
| Total Housing Units | 47,008 | 100.0% |
Occupancy by Ownership by Household Size in Gregg County
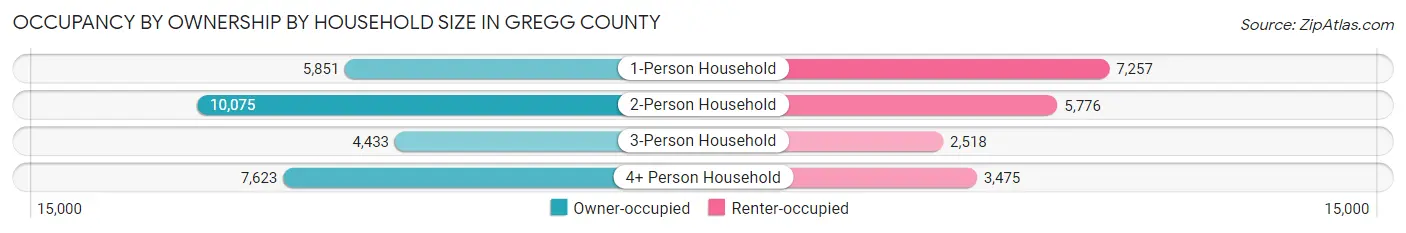
| Household Size | Owner-occupied | Renter-occupied |
| 1-Person Household | 5,851 (44.6%) | 7,257 (55.4%) |
| 2-Person Household | 10,075 (63.6%) | 5,776 (36.4%) |
| 3-Person Household | 4,433 (63.8%) | 2,518 (36.2%) |
| 4+ Person Household | 7,623 (68.7%) | 3,475 (31.3%) |
| Total Housing Units | 27,982 (59.5%) | 19,026 (40.5%) |
Occupancy by Educational Attainment in Gregg County
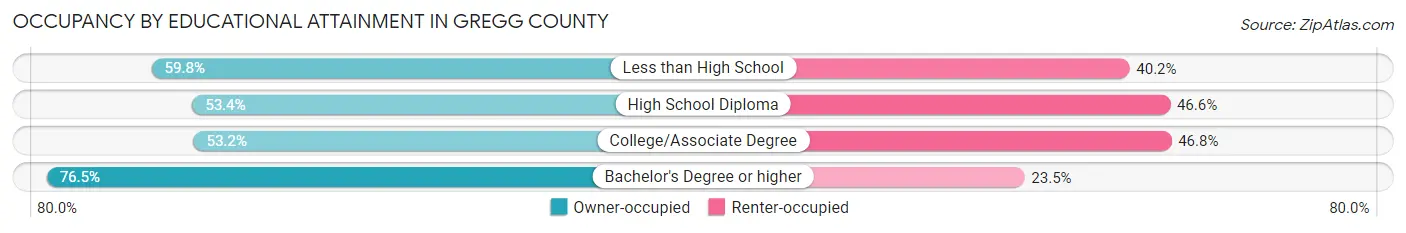
| Household Size | Owner-occupied | Renter-occupied |
| Less than High School | 3,076 (59.8%) | 2,064 (40.2%) |
| High School Diploma | 6,324 (53.4%) | 5,519 (46.6%) |
| College/Associate Degree | 10,013 (53.2%) | 8,809 (46.8%) |
| Bachelor's Degree or higher | 8,569 (76.5%) | 2,634 (23.5%) |
Occupancy by Age of Householder in Gregg County
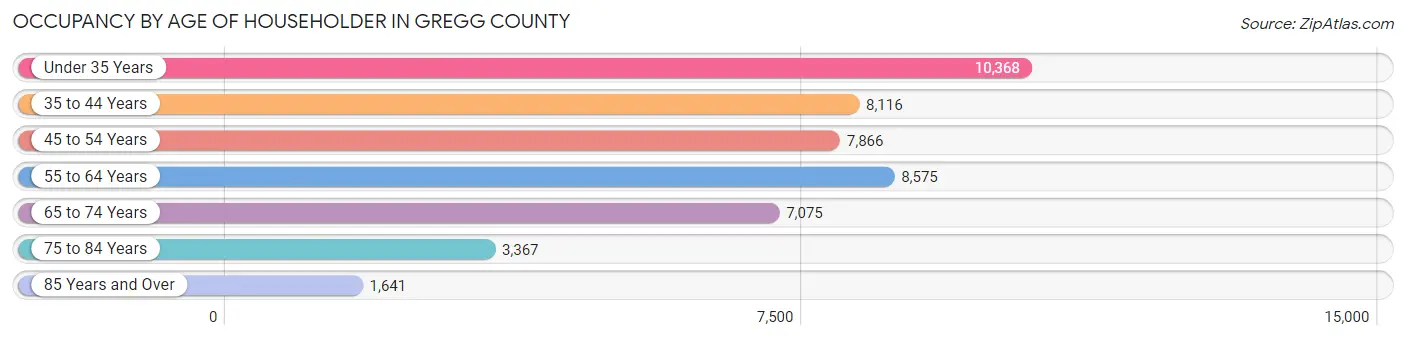
| Age Bracket | # Households | % Households |
| Under 35 Years | 10,368 | 22.1% |
| 35 to 44 Years | 8,116 | 17.3% |
| 45 to 54 Years | 7,866 | 16.7% |
| 55 to 64 Years | 8,575 | 18.2% |
| 65 to 74 Years | 7,075 | 15.0% |
| 75 to 84 Years | 3,367 | 7.2% |
| 85 Years and Over | 1,641 | 3.5% |
| Total | 47,008 | 100.0% |
Housing Finances in Gregg County
Median Income by Occupancy in Gregg County
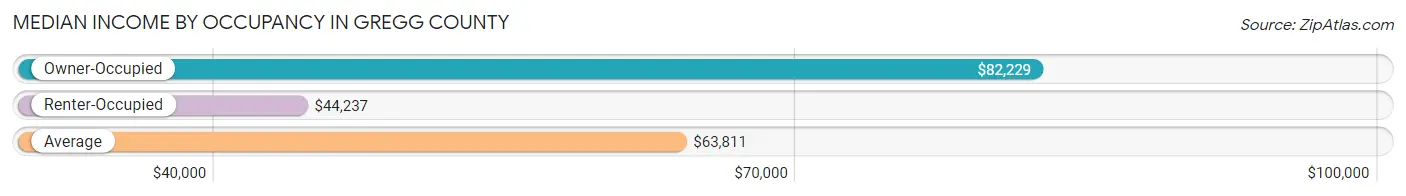
| Occupancy Type | # Households | Median Income |
| Owner-Occupied | 27,982 (59.5%) | $82,229 |
| Renter-Occupied | 19,026 (40.5%) | $44,237 |
| Average | 47,008 (100.0%) | $63,811 |
Occupancy by Householder Income Bracket in Gregg County
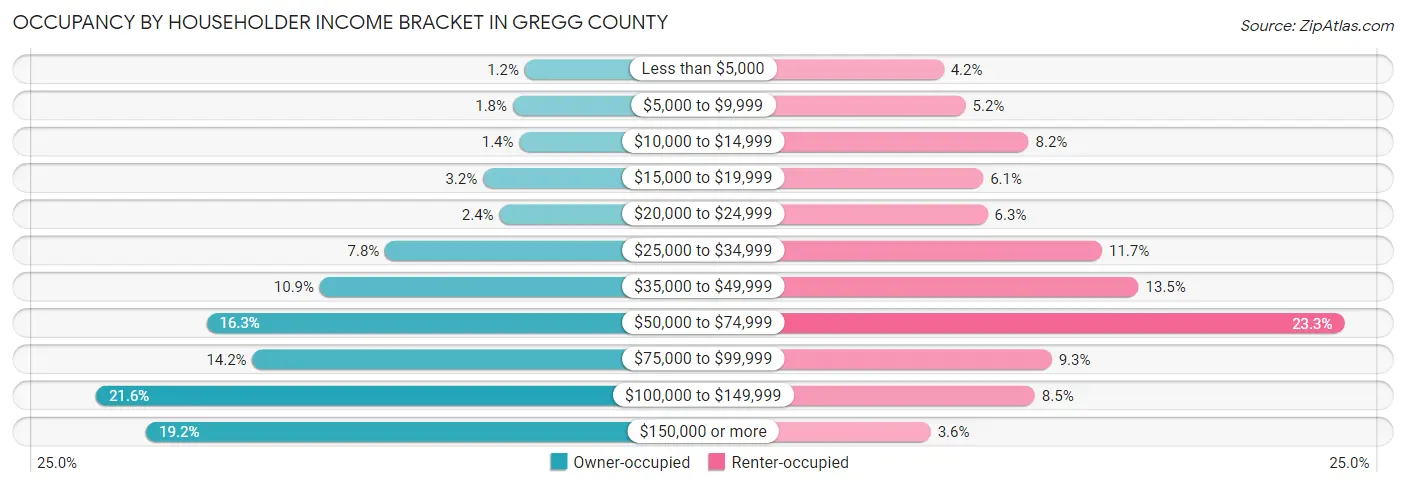
| Income Bracket | Owner-occupied | Renter-occupied |
| Less than $5,000 | 330 (1.2%) | 799 (4.2%) |
| $5,000 to $9,999 | 489 (1.8%) | 997 (5.2%) |
| $10,000 to $14,999 | 403 (1.4%) | 1,568 (8.2%) |
| $15,000 to $19,999 | 887 (3.2%) | 1,157 (6.1%) |
| $20,000 to $24,999 | 668 (2.4%) | 1,197 (6.3%) |
| $25,000 to $34,999 | 2,191 (7.8%) | 2,234 (11.7%) |
| $35,000 to $49,999 | 3,062 (10.9%) | 2,564 (13.5%) |
| $50,000 to $74,999 | 4,573 (16.3%) | 4,427 (23.3%) |
| $75,000 to $99,999 | 3,959 (14.1%) | 1,777 (9.3%) |
| $100,000 to $149,999 | 6,044 (21.6%) | 1,625 (8.5%) |
| $150,000 or more | 5,376 (19.2%) | 681 (3.6%) |
| Total | 27,982 (100.0%) | 19,026 (100.0%) |
Monthly Housing Cost Tiers in Gregg County
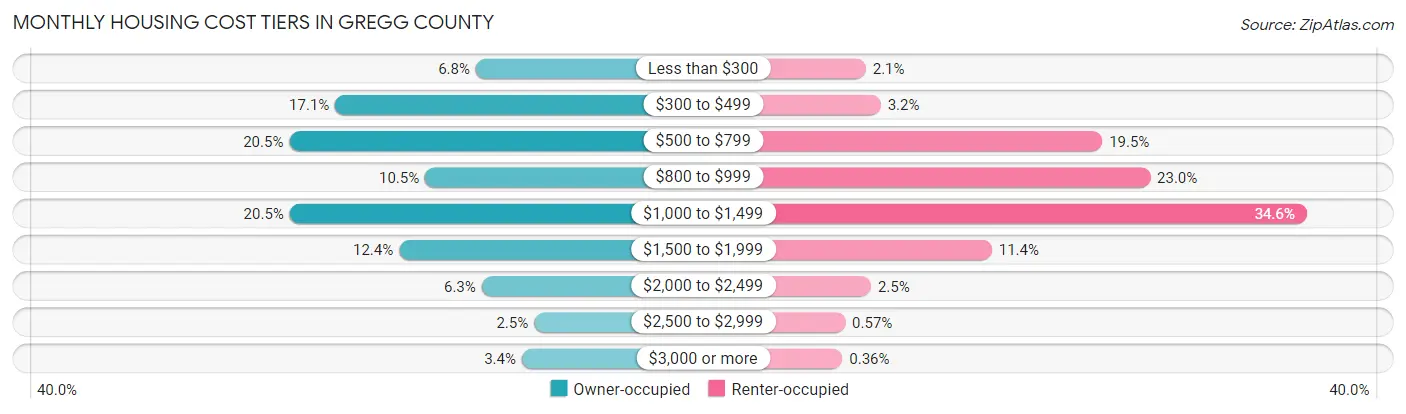
| Monthly Cost | Owner-occupied | Renter-occupied |
| Less than $300 | 1,893 (6.8%) | 398 (2.1%) |
| $300 to $499 | 4,792 (17.1%) | 606 (3.2%) |
| $500 to $799 | 5,739 (20.5%) | 3,711 (19.5%) |
| $800 to $999 | 2,940 (10.5%) | 4,381 (23.0%) |
| $1,000 to $1,499 | 5,731 (20.5%) | 6,576 (34.6%) |
| $1,500 to $1,999 | 3,474 (12.4%) | 2,164 (11.4%) |
| $2,000 to $2,499 | 1,773 (6.3%) | 470 (2.5%) |
| $2,500 to $2,999 | 695 (2.5%) | 109 (0.6%) |
| $3,000 or more | 945 (3.4%) | 69 (0.4%) |
| Total | 27,982 (100.0%) | 19,026 (100.0%) |
Physical Housing Characteristics in Gregg County
Housing Structures in Gregg County
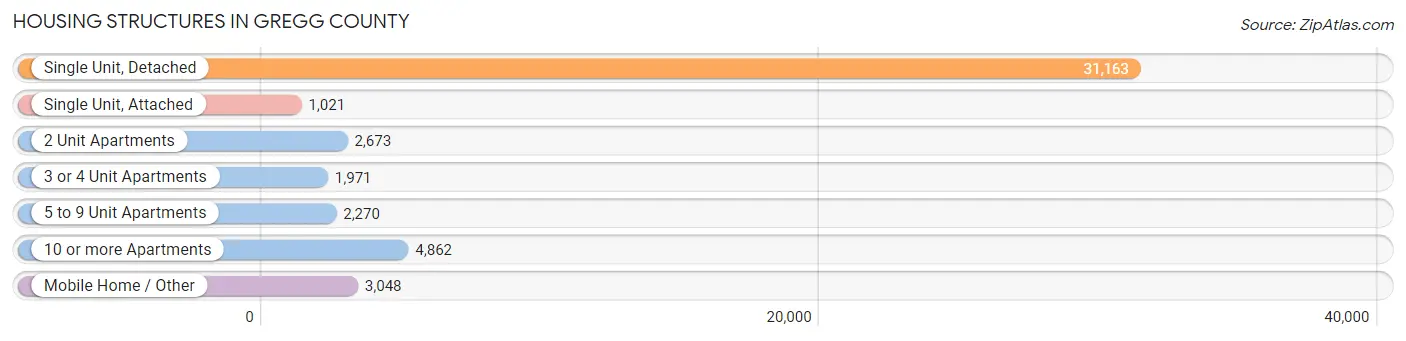
| Structure Type | # Housing Units | % Housing Units |
| Single Unit, Detached | 31,163 | 66.3% |
| Single Unit, Attached | 1,021 | 2.2% |
| 2 Unit Apartments | 2,673 | 5.7% |
| 3 or 4 Unit Apartments | 1,971 | 4.2% |
| 5 to 9 Unit Apartments | 2,270 | 4.8% |
| 10 or more Apartments | 4,862 | 10.3% |
| Mobile Home / Other | 3,048 | 6.5% |
| Total | 47,008 | 100.0% |
Housing Structures by Occupancy in Gregg County
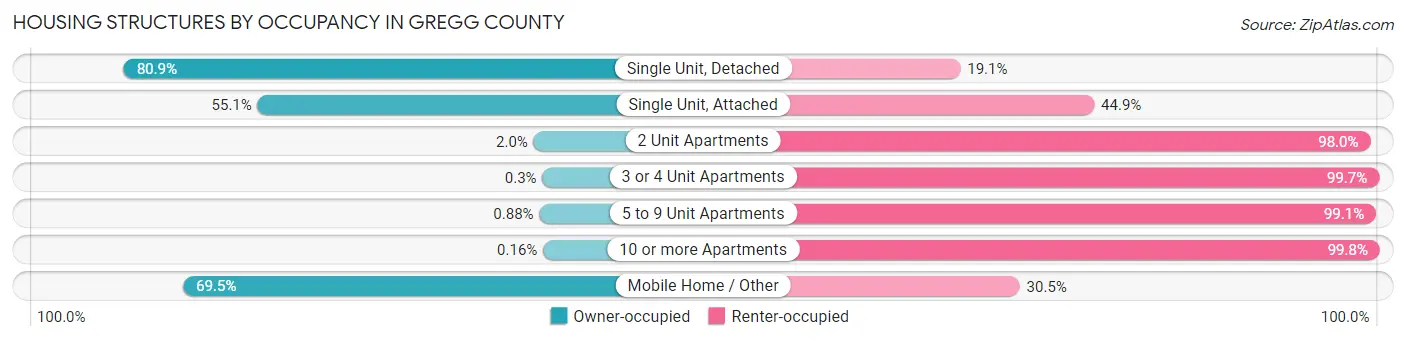
| Structure Type | Owner-occupied | Renter-occupied |
| Single Unit, Detached | 25,214 (80.9%) | 5,949 (19.1%) |
| Single Unit, Attached | 563 (55.1%) | 458 (44.9%) |
| 2 Unit Apartments | 53 (2.0%) | 2,620 (98.0%) |
| 3 or 4 Unit Apartments | 6 (0.3%) | 1,965 (99.7%) |
| 5 to 9 Unit Apartments | 20 (0.9%) | 2,250 (99.1%) |
| 10 or more Apartments | 8 (0.2%) | 4,854 (99.8%) |
| Mobile Home / Other | 2,118 (69.5%) | 930 (30.5%) |
| Total | 27,982 (59.5%) | 19,026 (40.5%) |
Housing Structures by Number of Rooms in Gregg County
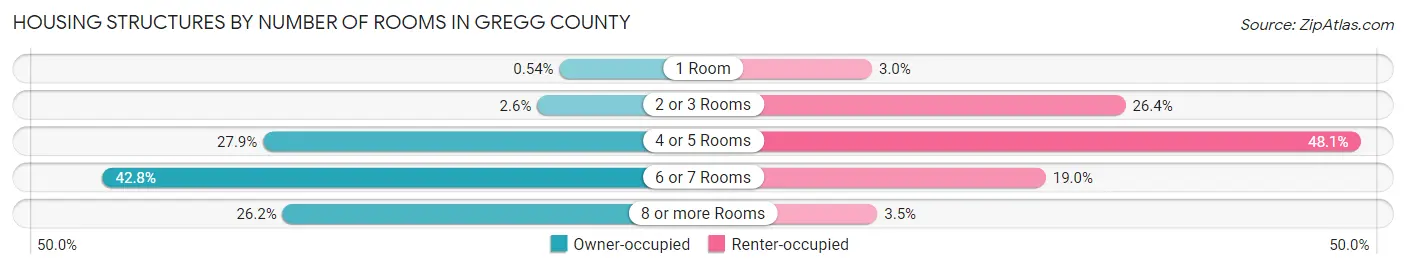
| Number of Rooms | Owner-occupied | Renter-occupied |
| 1 Room | 151 (0.5%) | 566 (3.0%) |
| 2 or 3 Rooms | 725 (2.6%) | 5,024 (26.4%) |
| 4 or 5 Rooms | 7,818 (27.9%) | 9,155 (48.1%) |
| 6 or 7 Rooms | 11,971 (42.8%) | 3,622 (19.0%) |
| 8 or more Rooms | 7,317 (26.2%) | 659 (3.5%) |
| Total | 27,982 (100.0%) | 19,026 (100.0%) |
Housing Structure by Heating Type in Gregg County
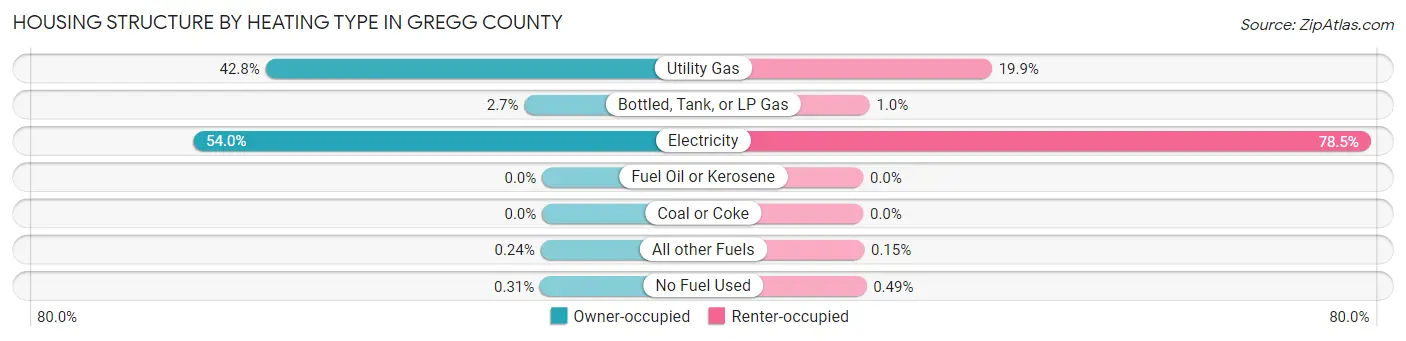
| Heating Type | Owner-occupied | Renter-occupied |
| Utility Gas | 11,961 (42.7%) | 3,785 (19.9%) |
| Bottled, Tank, or LP Gas | 768 (2.7%) | 190 (1.0%) |
| Electricity | 15,100 (54.0%) | 14,929 (78.5%) |
| Fuel Oil or Kerosene | 0 (0.0%) | 0 (0.0%) |
| Coal or Coke | 0 (0.0%) | 0 (0.0%) |
| All other Fuels | 67 (0.2%) | 28 (0.2%) |
| No Fuel Used | 86 (0.3%) | 94 (0.5%) |
| Total | 27,982 (100.0%) | 19,026 (100.0%) |
Household Vehicle Usage in Gregg County
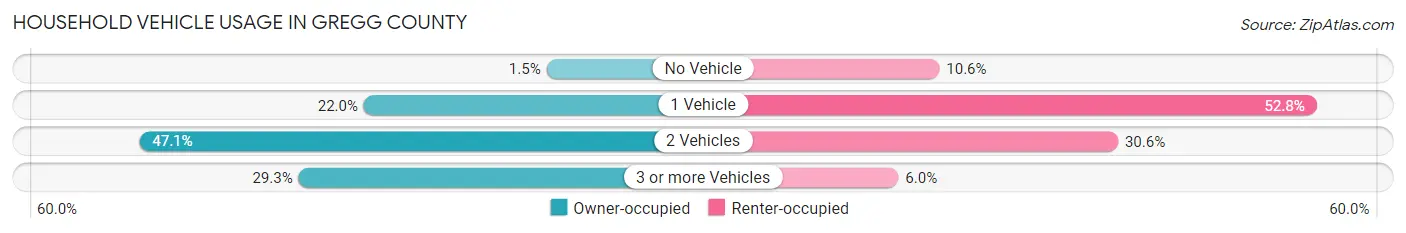
| Vehicles per Household | Owner-occupied | Renter-occupied |
| No Vehicle | 432 (1.5%) | 2,012 (10.6%) |
| 1 Vehicle | 6,157 (22.0%) | 10,054 (52.8%) |
| 2 Vehicles | 13,190 (47.1%) | 5,820 (30.6%) |
| 3 or more Vehicles | 8,203 (29.3%) | 1,140 (6.0%) |
| Total | 27,982 (100.0%) | 19,026 (100.0%) |
Real Estate & Mortgages in Gregg County
Real Estate and Mortgage Overview in Gregg County
| Characteristic | Without Mortgage | With Mortgage |
| Housing Units | 13,824 | 14,158 |
| Median Property Value | $160,100 | $182,400 |
| Median Household Income | $61,184 | $3,224 |
| Monthly Housing Costs | $516 | $893 |
| Real Estate Taxes | $1,598 | $563 |
Property Value by Mortgage Status in Gregg County
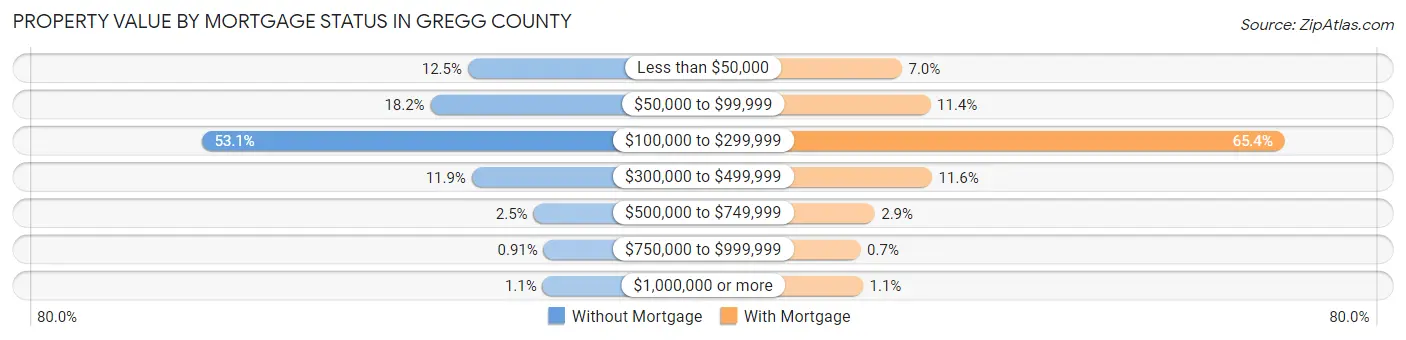
| Property Value | Without Mortgage | With Mortgage |
| Less than $50,000 | 1,723 (12.5%) | 993 (7.0%) |
| $50,000 to $99,999 | 2,510 (18.2%) | 1,608 (11.4%) |
| $100,000 to $299,999 | 7,334 (53.0%) | 9,261 (65.4%) |
| $300,000 to $499,999 | 1,641 (11.9%) | 1,641 (11.6%) |
| $500,000 to $749,999 | 342 (2.5%) | 405 (2.9%) |
| $750,000 to $999,999 | 126 (0.9%) | 99 (0.7%) |
| $1,000,000 or more | 148 (1.1%) | 151 (1.1%) |
| Total | 13,824 (100.0%) | 14,158 (100.0%) |
Household Income by Mortgage Status in Gregg County
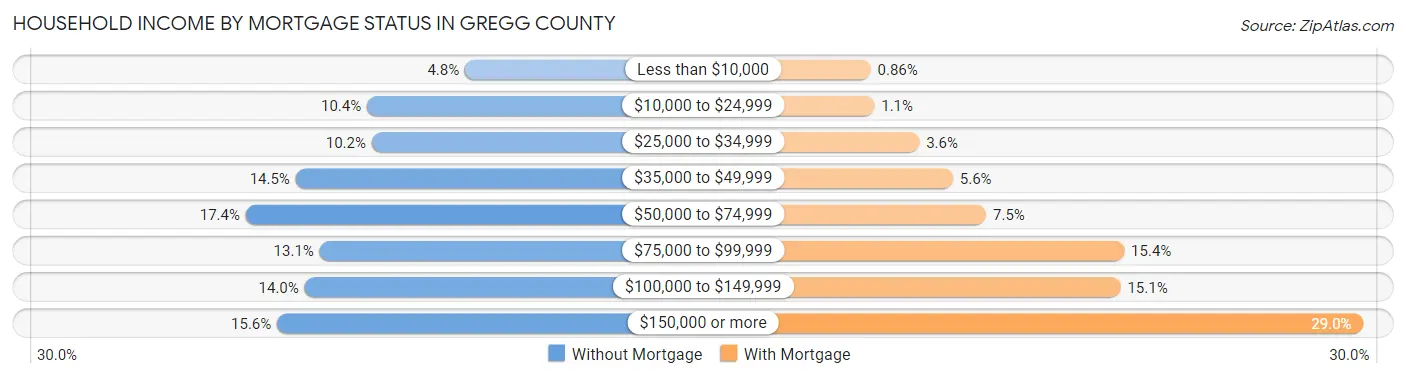
| Household Income | Without Mortgage | With Mortgage |
| Less than $10,000 | 668 (4.8%) | 122 (0.9%) |
| $10,000 to $24,999 | 1,442 (10.4%) | 151 (1.1%) |
| $25,000 to $34,999 | 1,404 (10.2%) | 516 (3.6%) |
| $35,000 to $49,999 | 2,006 (14.5%) | 787 (5.6%) |
| $50,000 to $74,999 | 2,400 (17.4%) | 1,056 (7.5%) |
| $75,000 to $99,999 | 1,816 (13.1%) | 2,173 (15.3%) |
| $100,000 to $149,999 | 1,936 (14.0%) | 2,143 (15.1%) |
| $150,000 or more | 2,152 (15.6%) | 4,108 (29.0%) |
| Total | 13,824 (100.0%) | 14,158 (100.0%) |
Property Value to Household Income Ratio in Gregg County
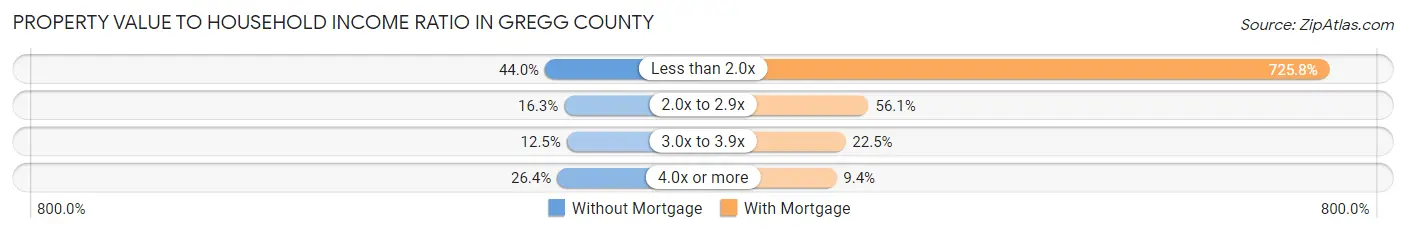
| Value-to-Income Ratio | Without Mortgage | With Mortgage |
| Less than 2.0x | 6,083 (44.0%) | 102,760 (725.8%) |
| 2.0x to 2.9x | 2,250 (16.3%) | 7,944 (56.1%) |
| 3.0x to 3.9x | 1,727 (12.5%) | 3,184 (22.5%) |
| 4.0x or more | 3,646 (26.4%) | 1,330 (9.4%) |
| Total | 13,824 (100.0%) | 14,158 (100.0%) |
Real Estate Taxes by Mortgage Status in Gregg County
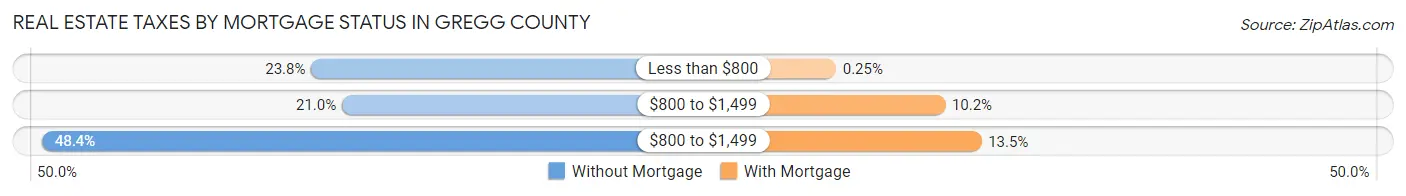
| Property Taxes | Without Mortgage | With Mortgage |
| Less than $800 | 3,293 (23.8%) | 36 (0.3%) |
| $800 to $1,499 | 2,904 (21.0%) | 1,447 (10.2%) |
| $800 to $1,499 | 6,693 (48.4%) | 1,916 (13.5%) |
| Total | 13,824 (100.0%) | 14,158 (100.0%) |
Health & Disability in Gregg County
Health Insurance Coverage by Age in Gregg County
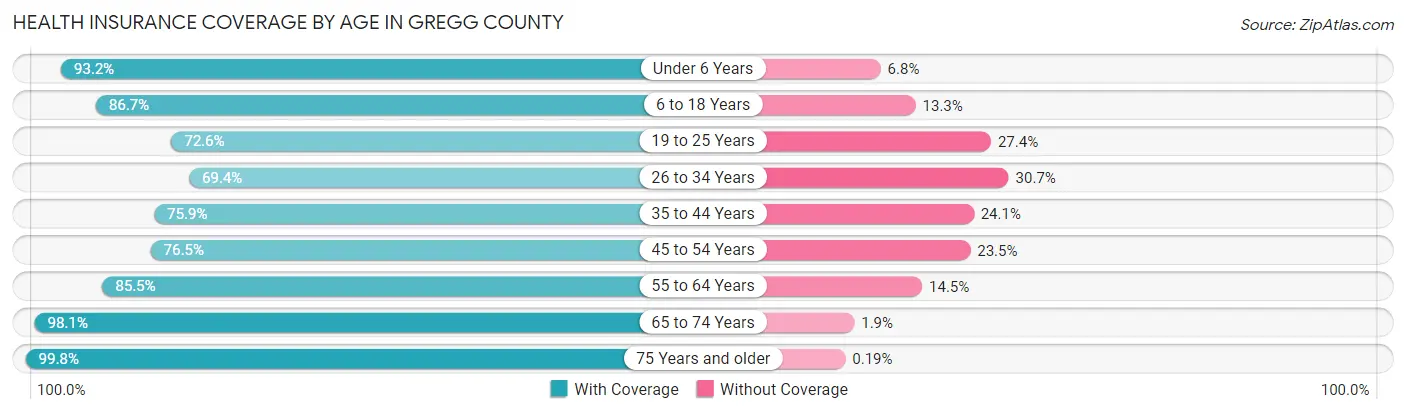
| Age Bracket | With Coverage | Without Coverage |
| Under 6 Years | 9,333 (93.2%) | 679 (6.8%) |
| 6 to 18 Years | 20,711 (86.7%) | 3,177 (13.3%) |
| 19 to 25 Years | 8,571 (72.6%) | 3,229 (27.4%) |
| 26 to 34 Years | 10,047 (69.4%) | 4,440 (30.6%) |
| 35 to 44 Years | 11,418 (75.9%) | 3,634 (24.1%) |
| 45 to 54 Years | 10,399 (76.5%) | 3,194 (23.5%) |
| 55 to 64 Years | 12,487 (85.5%) | 2,119 (14.5%) |
| 65 to 74 Years | 11,006 (98.1%) | 209 (1.9%) |
| 75 Years and older | 7,317 (99.8%) | 14 (0.2%) |
| Total | 101,289 (83.0%) | 20,695 (17.0%) |
Health Insurance Coverage by Citizenship Status in Gregg County
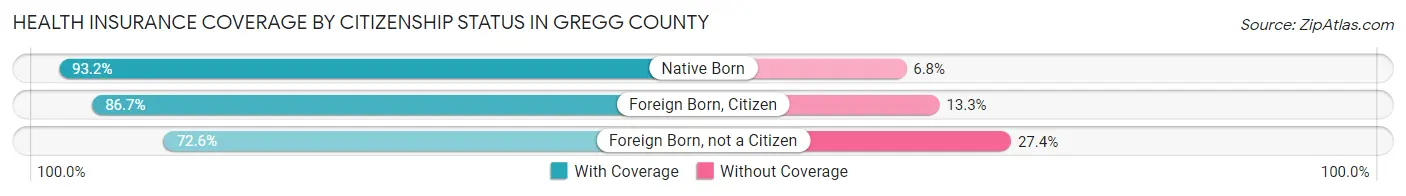
| Citizenship Status | With Coverage | Without Coverage |
| Native Born | 9,333 (93.2%) | 679 (6.8%) |
| Foreign Born, Citizen | 20,711 (86.7%) | 3,177 (13.3%) |
| Foreign Born, not a Citizen | 8,571 (72.6%) | 3,229 (27.4%) |
Health Insurance Coverage by Household Income in Gregg County
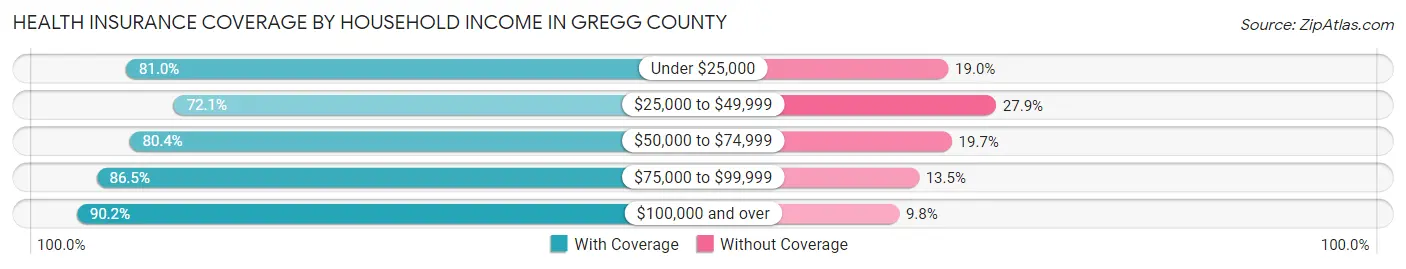
| Household Income | With Coverage | Without Coverage |
| Under $25,000 | 12,198 (81.0%) | 2,860 (19.0%) |
| $25,000 to $49,999 | 16,124 (72.1%) | 6,252 (27.9%) |
| $50,000 to $74,999 | 18,904 (80.3%) | 4,624 (19.7%) |
| $75,000 to $99,999 | 14,750 (86.5%) | 2,298 (13.5%) |
| $100,000 and over | 37,426 (90.2%) | 4,056 (9.8%) |
Public vs Private Health Insurance Coverage by Age in Gregg County
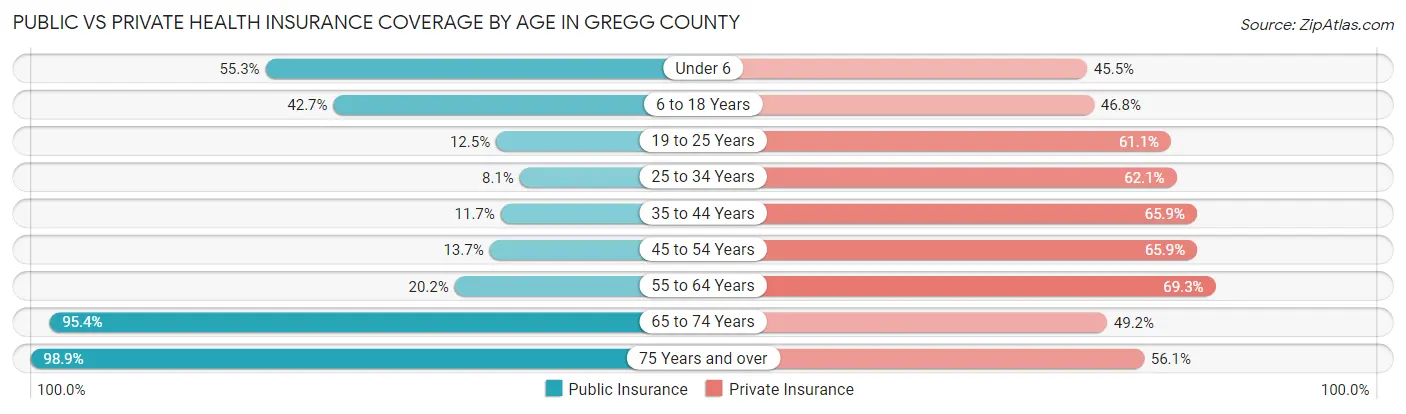
| Age Bracket | Public Insurance | Private Insurance |
| Under 6 | 5,537 (55.3%) | 4,555 (45.5%) |
| 6 to 18 Years | 10,198 (42.7%) | 11,173 (46.8%) |
| 19 to 25 Years | 1,475 (12.5%) | 7,209 (61.1%) |
| 25 to 34 Years | 1,177 (8.1%) | 8,998 (62.1%) |
| 35 to 44 Years | 1,753 (11.7%) | 9,916 (65.9%) |
| 45 to 54 Years | 1,863 (13.7%) | 8,960 (65.9%) |
| 55 to 64 Years | 2,951 (20.2%) | 10,128 (69.3%) |
| 65 to 74 Years | 10,703 (95.4%) | 5,518 (49.2%) |
| 75 Years and over | 7,252 (98.9%) | 4,110 (56.1%) |
| Total | 42,909 (35.2%) | 70,567 (57.9%) |
Disability Status by Sex by Age in Gregg County
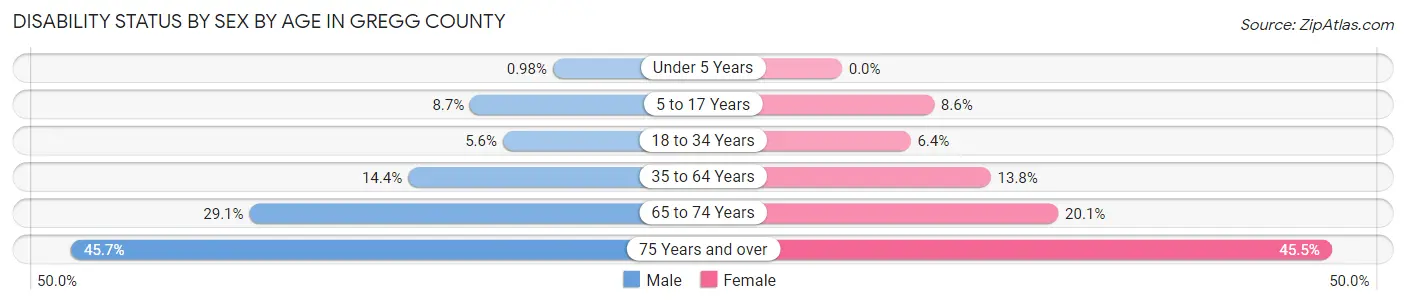
| Age Bracket | Male | Female |
| Under 5 Years | 41 (1.0%) | 0 (0.0%) |
| 5 to 17 Years | 1,053 (8.7%) | 988 (8.6%) |
| 18 to 34 Years | 793 (5.6%) | 900 (6.4%) |
| 35 to 64 Years | 3,033 (14.4%) | 3,068 (13.8%) |
| 65 to 74 Years | 1,512 (29.1%) | 1,210 (20.1%) |
| 75 Years and over | 1,276 (45.7%) | 2,063 (45.5%) |
Disability Class by Sex by Age in Gregg County
Disability Class: Hearing Difficulty
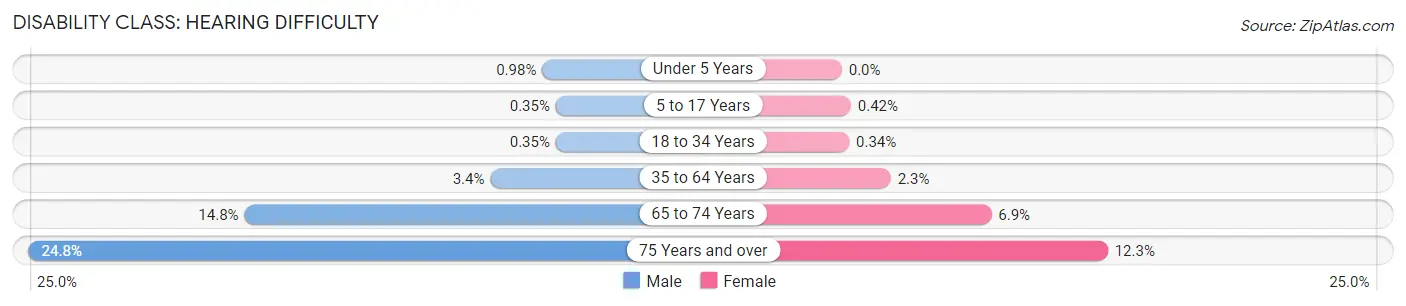
| Age Bracket | Male | Female |
| Under 5 Years | 41 (1.0%) | 0 (0.0%) |
| 5 to 17 Years | 43 (0.4%) | 49 (0.4%) |
| 18 to 34 Years | 49 (0.4%) | 48 (0.3%) |
| 35 to 64 Years | 712 (3.4%) | 504 (2.3%) |
| 65 to 74 Years | 768 (14.8%) | 418 (6.9%) |
| 75 Years and over | 693 (24.8%) | 560 (12.3%) |
Disability Class: Vision Difficulty
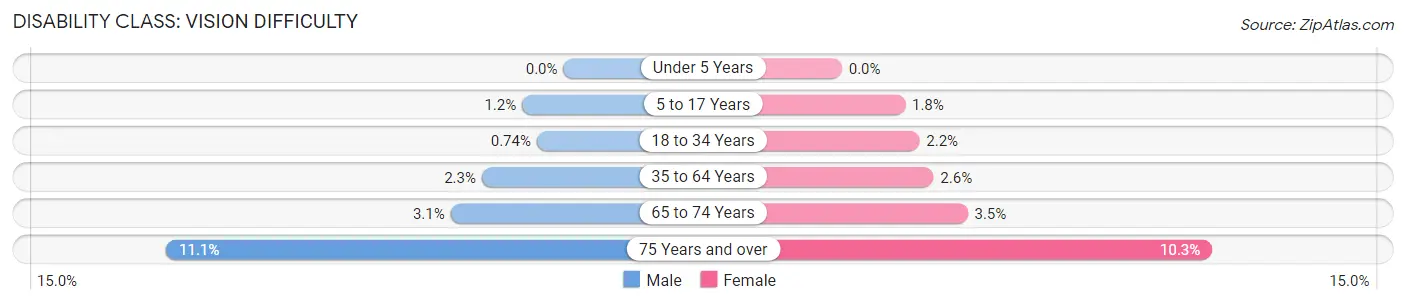
| Age Bracket | Male | Female |
| Under 5 Years | 0 (0.0%) | 0 (0.0%) |
| 5 to 17 Years | 140 (1.1%) | 203 (1.8%) |
| 18 to 34 Years | 105 (0.7%) | 305 (2.2%) |
| 35 to 64 Years | 478 (2.3%) | 567 (2.5%) |
| 65 to 74 Years | 163 (3.1%) | 211 (3.5%) |
| 75 Years and over | 309 (11.1%) | 468 (10.3%) |
Disability Class: Cognitive Difficulty
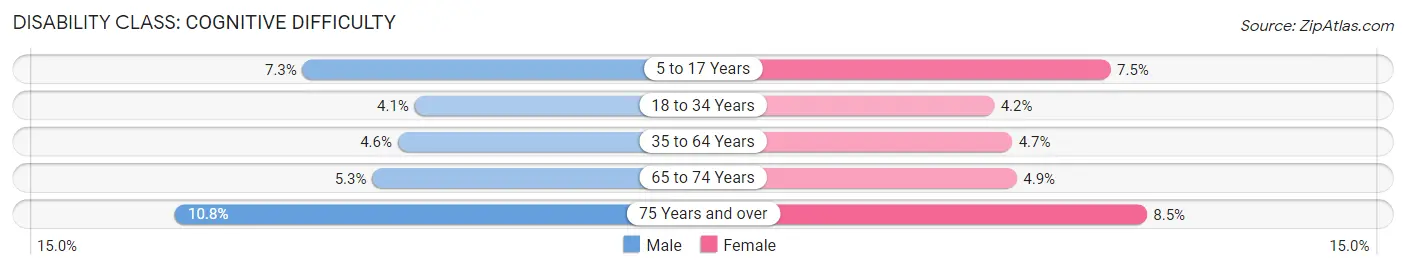
| Age Bracket | Male | Female |
| 5 to 17 Years | 883 (7.3%) | 863 (7.5%) |
| 18 to 34 Years | 584 (4.1%) | 598 (4.2%) |
| 35 to 64 Years | 969 (4.6%) | 1,051 (4.7%) |
| 65 to 74 Years | 276 (5.3%) | 293 (4.9%) |
| 75 Years and over | 302 (10.8%) | 385 (8.5%) |
Disability Class: Ambulatory Difficulty
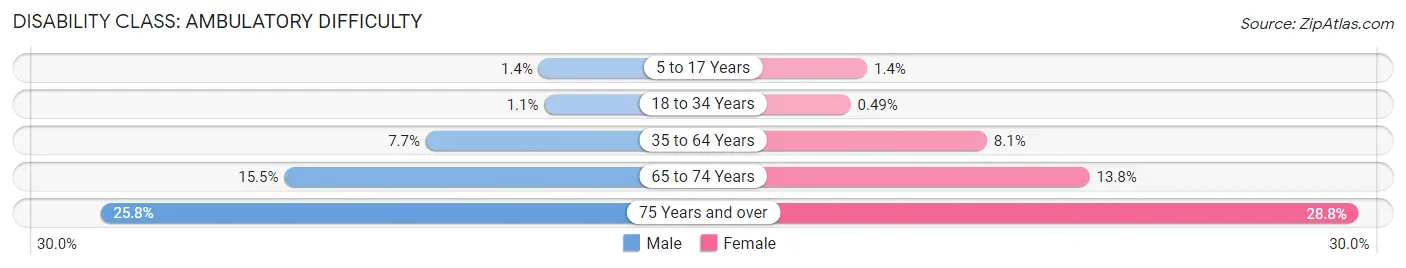
| Age Bracket | Male | Female |
| 5 to 17 Years | 167 (1.4%) | 163 (1.4%) |
| 18 to 34 Years | 150 (1.1%) | 69 (0.5%) |
| 35 to 64 Years | 1,610 (7.7%) | 1,795 (8.1%) |
| 65 to 74 Years | 806 (15.5%) | 832 (13.8%) |
| 75 Years and over | 720 (25.8%) | 1,306 (28.8%) |
Disability Class: Self-Care Difficulty
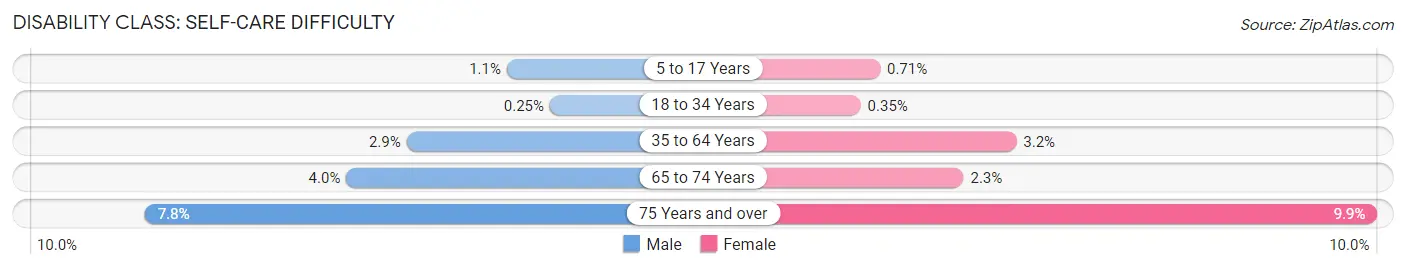
| Age Bracket | Male | Female |
| 5 to 17 Years | 128 (1.1%) | 82 (0.7%) |
| 18 to 34 Years | 35 (0.3%) | 49 (0.4%) |
| 35 to 64 Years | 611 (2.9%) | 721 (3.2%) |
| 65 to 74 Years | 209 (4.0%) | 136 (2.3%) |
| 75 Years and over | 217 (7.8%) | 451 (9.9%) |
Technology Access in Gregg County
Computing Device Access in Gregg County
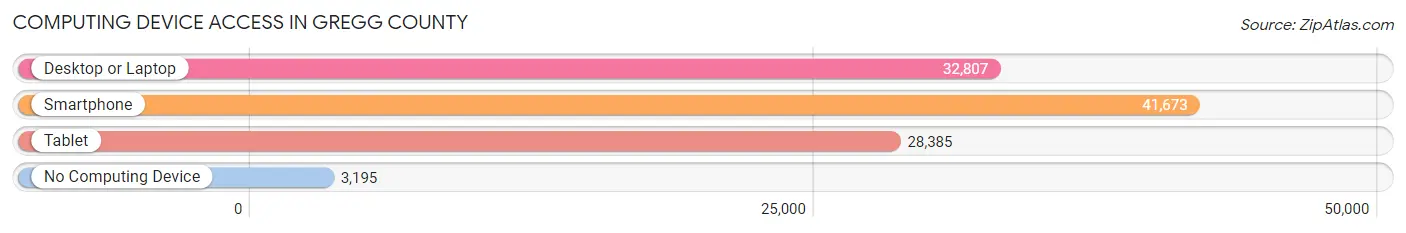
| Device Type | # Households | % Households |
| Desktop or Laptop | 32,807 | 69.8% |
| Smartphone | 41,673 | 88.6% |
| Tablet | 28,385 | 60.4% |
| No Computing Device | 3,195 | 6.8% |
| Total | 47,008 | 100.0% |
Internet Access in Gregg County
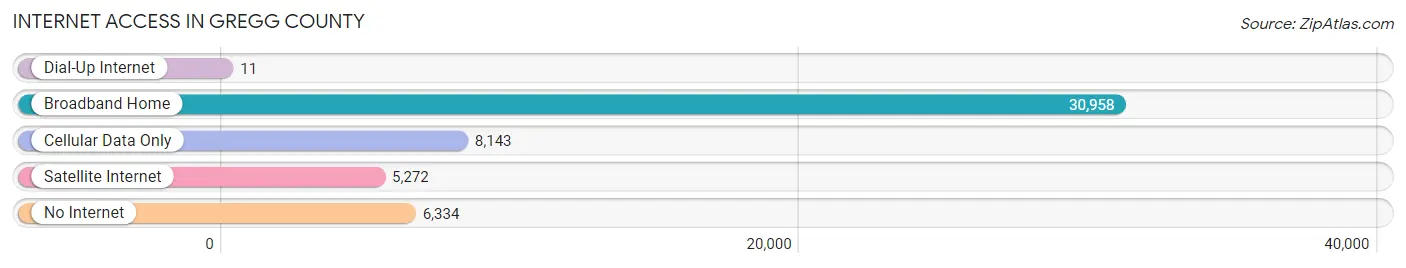
| Internet Type | # Households | % Households |
| Dial-Up Internet | 11 | 0.0% |
| Broadband Home | 30,958 | 65.9% |
| Cellular Data Only | 8,143 | 17.3% |
| Satellite Internet | 5,272 | 11.2% |
| No Internet | 6,334 | 13.5% |
| Total | 47,008 | 100.0% |
Gregg County Summary
Gregg County is located in the northeastern part of Texas, in the United States. It is part of the Longview Metropolitan Statistical Area and is bordered by Harrison, Upshur, Rusk, Smith, and Harrison counties. The county seat is Longview, and the largest city is Longview. The county was named for John Gregg, a Confederate general in the Civil War.
Geography
Gregg County is located in the northeastern part of Texas, in the United States. It is part of the Longview Metropolitan Statistical Area and is bordered by Harrison, Upshur, Rusk, Smith, and Harrison counties. The county has a total area of 576 square miles, of which 573 square miles is land and 3 square miles (0.5%) is water. The terrain is mostly flat with some rolling hills. The Sabine River forms the eastern border of the county.
History
Gregg County was established in 1873 from portions of Upshur and Rusk counties. It was named for John Gregg, a Confederate general in the Civil War. The county seat was originally located in the town of Liberty City, but was moved to Longview in 1930.
The economy of Gregg County was largely based on agriculture until the early 20th century. Cotton was the main crop, and the county was home to several cotton gins. In the 1920s, oil was discovered in the county, and the economy shifted to oil production. The discovery of oil led to a population boom in the county, and Longview became the largest city in the county.
Economy
The economy of Gregg County is largely based on oil and gas production, manufacturing, and services. The county is home to several oil and gas companies, including ExxonMobil, Chevron, and ConocoPhillips. Manufacturing is also a major industry in the county, with companies such as Eastman Chemical, Georgia-Pacific, and Owens Corning having operations in the area. The service sector is also important to the economy, with healthcare, education, and retail being the largest employers.
Demographics
As of the 2010 census, there were 121,730 people, 45,945 households, and 32,845 families living in Gregg County. The population density was 211.3 people per square mile. The racial makeup of the county was 68.2% White, 24.2% African American, 0.7% Native American, 1.7% Asian, 0.1% Pacific Islander, 3.2% from other races, and 1.9% from two or more races. Hispanic or Latino of any race were 8.3% of the population.
The median income for a household in the county was $41,945, and the median income for a family was $50,945. The per capita income for the county was $21,845. About 14.2% of families and 17.7% of the population were below the poverty line, including 25.2% of those under age 18 and 10.2% of those age 65 or over.
Gregg County is served by the Longview Independent School District, which includes seven elementary schools, three middle schools, and two high schools. The county is also home to Kilgore College, a two-year community college.
Common Questions
What is Per Capita Income in Gregg County?
Per Capita income in Gregg County is $32,236.
What is the Median Family Income in Gregg County?
Median Family Income in Gregg County is $76,549.
What is the Median Household income in Gregg County?
Median Household Income in Gregg County is $63,811.
What is Income or Wage Gap in Gregg County?
Income or Wage Gap in Gregg County is 35.5%.
Women in Gregg County earn 64.5 cents for every dollar earned by a man.
What is Family Income Deficit in Gregg County?
Family Income Deficit in Gregg County is $11,050.
Families that are below poverty line in Gregg County earn $11,050 less on average than the poverty threshold level.
What is Inequality or Gini Index in Gregg County?
Inequality or Gini Index in Gregg County is 0.46.
What is the Total Population of Gregg County?
Total Population of Gregg County is 124,245.
What is the Total Male Population of Gregg County?
Total Male Population of Gregg County is 60,840.
What is the Total Female Population of Gregg County?
Total Female Population of Gregg County is 63,405.
What is the Ratio of Males per 100 Females in Gregg County?
There are 95.95 Males per 100 Females in Gregg County.
What is the Ratio of Females per 100 Males in Gregg County?
There are 104.22 Females per 100 Males in Gregg County.
What is the Median Population Age in Gregg County?
Median Population Age in Gregg County is 35.8 Years.
What is the Average Family Size in Gregg County
Average Family Size in Gregg County is 3.1 People.
What is the Average Household Size in Gregg County
Average Household Size in Gregg County is 2.5 People.
How Large is the Labor Force in Gregg County?
There are 59,133 People in the Labor Forcein in Gregg County.
What is the Percentage of People in the Labor Force in Gregg County?
61.7% of People are in the Labor Force in Gregg County.
What is the Unemployment Rate in Gregg County?
Unemployment Rate in Gregg County is 3.7%.