Grayson County, TX Map & Demographics
Grayson County Map
Grayson County Overview
$34,643
PER CAPITA INCOME
$80,421
AVG FAMILY INCOME
$66,608
AVG HOUSEHOLD INCOME
31.8%
WAGE / INCOME GAP [ % ]
68.2¢/ $1
WAGE / INCOME GAP [ $ ]
$9,636
FAMILY INCOME DEFICIT
0.45
INEQUALITY / GINI INDEX
137,008
TOTAL POPULATION
67,315
MALE POPULATION
69,693
FEMALE POPULATION
96.59
MALES / 100 FEMALES
103.53
FEMALES / 100 MALES
39.2
MEDIAN AGE
3.1
AVG FAMILY SIZE
2.6
AVG HOUSEHOLD SIZE
67,265
LABOR FORCE [ PEOPLE ]
62.2%
PERCENT IN LABOR FORCE
3.9%
UNEMPLOYMENT RATE
Income in Grayson County
Income Overview in Grayson County
Per Capita Income in Grayson County is $34,643, while median incomes of families and households are $80,421 and $66,608 respectively.
| Characteristic | Number | Measure |
| Per Capita Income | 137,008 | $34,643 |
| Median Family Income | 35,720 | $80,421 |
| Mean Family Income | 35,720 | $103,544 |
| Median Household Income | 52,084 | $66,608 |
| Mean Household Income | 52,084 | $88,868 |
| Income Deficit | 35,720 | $9,636 |
| Wage / Income Gap (%) | 137,008 | 31.83% |
| Wage / Income Gap ($) | 137,008 | 68.17¢ per $1 |
| Gini / Inequality Index | 137,008 | 0.45 |
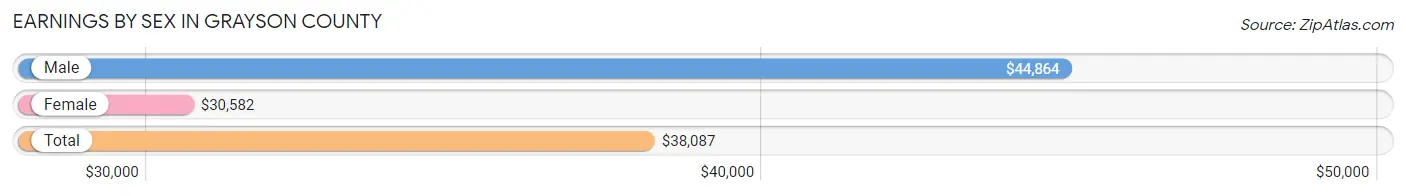
Earnings by Sex in Grayson County
Average Earnings in Grayson County are $38,087, $44,864 for men and $30,582 for women, a difference of 31.8%.
| Sex | Number | Average Earnings |
| Male | 36,956 (52.5%) | $44,864 |
| Female | 33,406 (47.5%) | $30,582 |
| Total | 70,362 (100.0%) | $38,087 |
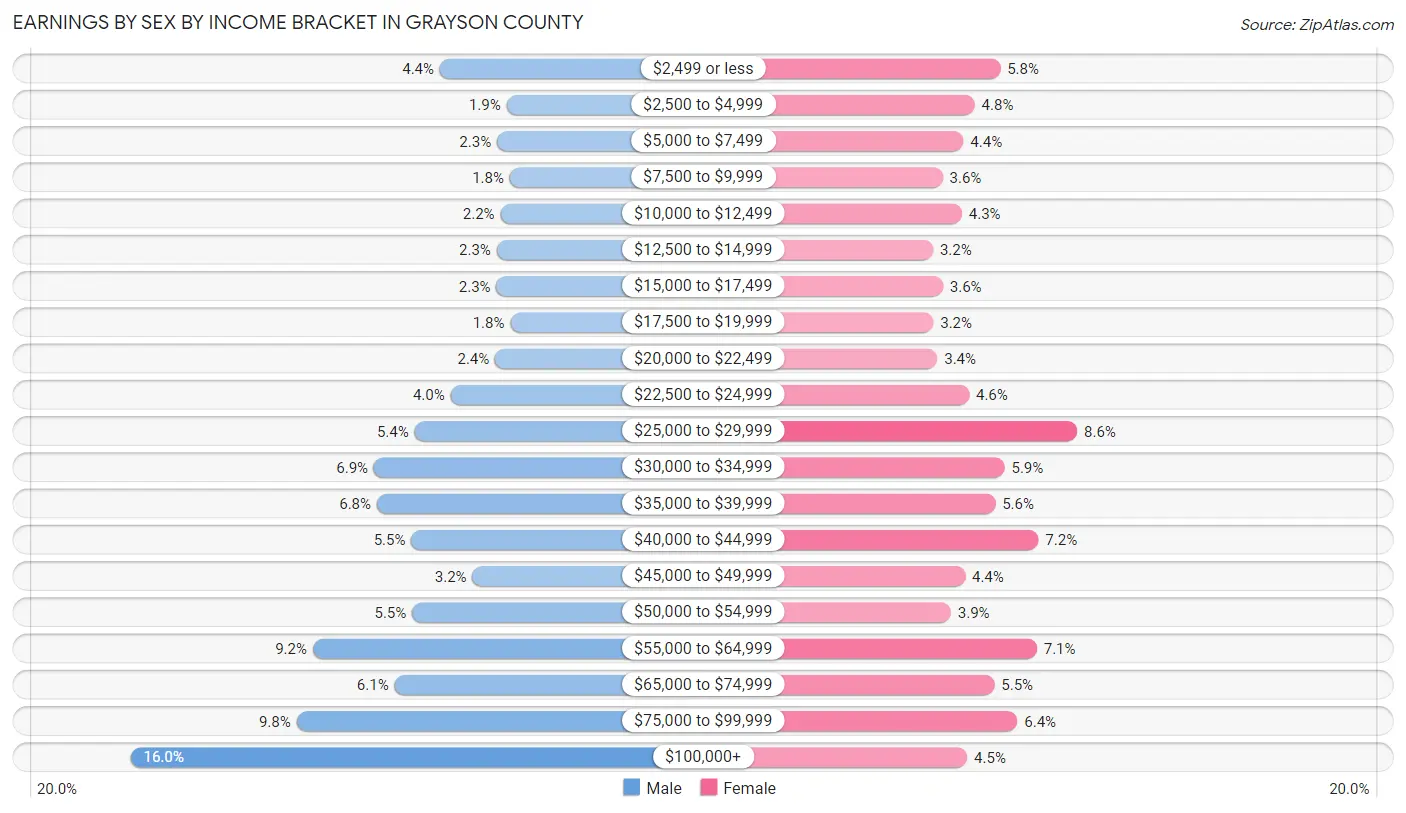
Earnings by Sex by Income Bracket in Grayson County
The most common earnings brackets in Grayson County are $100,000+ for men (5,923 | 16.0%) and $25,000 to $29,999 for women (2,884 | 8.6%).
| Income | Male | Female |
| $2,499 or less | 1,641 (4.4%) | 1,920 (5.8%) |
| $2,500 to $4,999 | 717 (1.9%) | 1,599 (4.8%) |
| $5,000 to $7,499 | 849 (2.3%) | 1,460 (4.4%) |
| $7,500 to $9,999 | 673 (1.8%) | 1,200 (3.6%) |
| $10,000 to $12,499 | 803 (2.2%) | 1,441 (4.3%) |
| $12,500 to $14,999 | 853 (2.3%) | 1,078 (3.2%) |
| $15,000 to $17,499 | 857 (2.3%) | 1,204 (3.6%) |
| $17,500 to $19,999 | 664 (1.8%) | 1,083 (3.2%) |
| $20,000 to $22,499 | 876 (2.4%) | 1,133 (3.4%) |
| $22,500 to $24,999 | 1,492 (4.0%) | 1,530 (4.6%) |
| $25,000 to $29,999 | 1,992 (5.4%) | 2,884 (8.6%) |
| $30,000 to $34,999 | 2,553 (6.9%) | 1,973 (5.9%) |
| $35,000 to $39,999 | 2,513 (6.8%) | 1,856 (5.6%) |
| $40,000 to $44,999 | 2,038 (5.5%) | 2,399 (7.2%) |
| $45,000 to $49,999 | 1,191 (3.2%) | 1,479 (4.4%) |
| $50,000 to $54,999 | 2,024 (5.5%) | 1,304 (3.9%) |
| $55,000 to $64,999 | 3,400 (9.2%) | 2,377 (7.1%) |
| $65,000 to $74,999 | 2,270 (6.1%) | 1,846 (5.5%) |
| $75,000 to $99,999 | 3,627 (9.8%) | 2,134 (6.4%) |
| $100,000+ | 5,923 (16.0%) | 1,506 (4.5%) |
| Total | 36,956 (100.0%) | 33,406 (100.0%) |
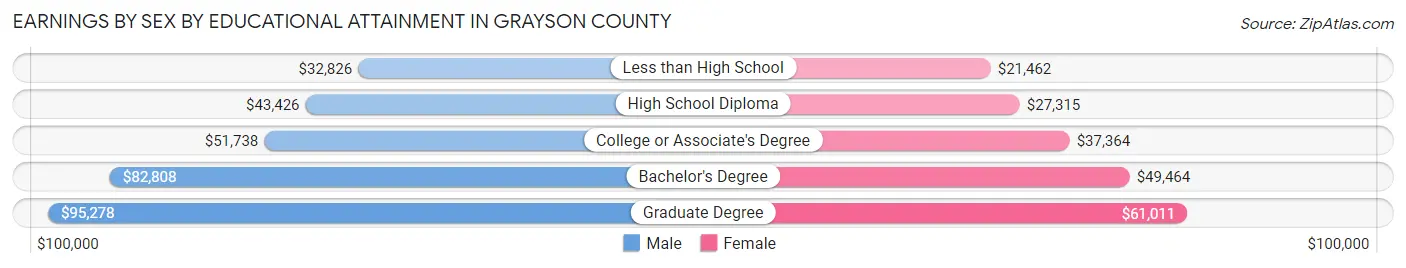
Earnings by Sex by Educational Attainment in Grayson County
Average earnings in Grayson County are $52,104 for men and $36,320 for women, a difference of 30.3%. Men with an educational attainment of graduate degree enjoy the highest average annual earnings of $95,278, while those with less than high school education earn the least with $32,826. Women with an educational attainment of graduate degree earn the most with the average annual earnings of $61,011, while those with less than high school education have the smallest earnings of $21,462.
| Educational Attainment | Male Income | Female Income |
| Less than High School | $32,826 | $21,462 |
| High School Diploma | $43,426 | $27,315 |
| College or Associate's Degree | $51,738 | $37,364 |
| Bachelor's Degree | $82,808 | $49,464 |
| Graduate Degree | $95,278 | $61,011 |
| Total | $52,104 | $36,320 |
Family Income in Grayson County
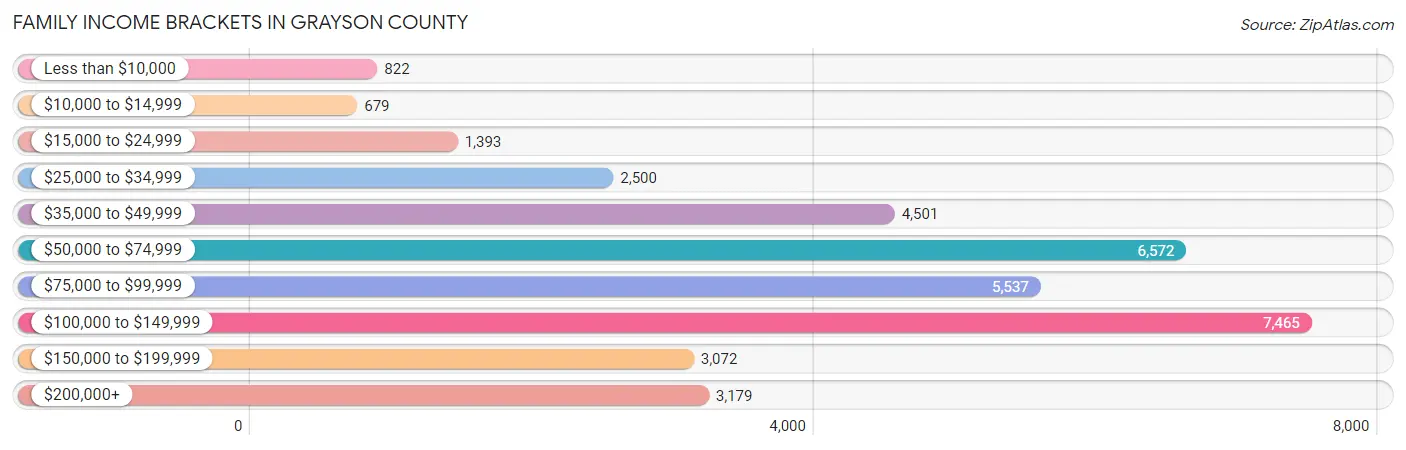
Family Income Brackets in Grayson County
According to the Grayson County family income data, there are 7,465 families falling into the $100,000 to $149,999 income range, which is the most common income bracket and makes up 20.9% of all families. Conversely, the $10,000 to $14,999 income bracket is the least frequent group with only 679 families (1.9%) belonging to this category.
| Income Bracket | # Families | % Families |
| Less than $10,000 | 822 | 2.3% |
| $10,000 to $14,999 | 679 | 1.9% |
| $15,000 to $24,999 | 1,393 | 3.9% |
| $25,000 to $34,999 | 2,500 | 7.0% |
| $35,000 to $49,999 | 4,501 | 12.6% |
| $50,000 to $74,999 | 6,572 | 18.4% |
| $75,000 to $99,999 | 5,537 | 15.5% |
| $100,000 to $149,999 | 7,465 | 20.9% |
| $150,000 to $199,999 | 3,072 | 8.6% |
| $200,000+ | 3,179 | 8.9% |
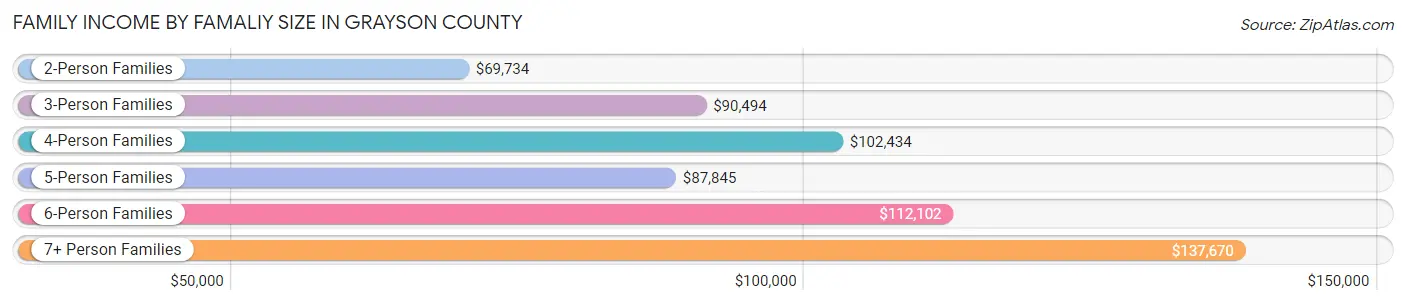
Family Income by Famaliy Size in Grayson County
7+ person families (373 | 1.0%) account for the highest median family income in Grayson County with $137,670 per family, while 2-person families (17,528 | 49.1%) have the highest median income of $34,867 per family member.
| Income Bracket | # Families | Median Income |
| 2-Person Families | 17,528 (49.1%) | $69,734 |
| 3-Person Families | 7,706 (21.6%) | $90,494 |
| 4-Person Families | 6,102 (17.1%) | $102,434 |
| 5-Person Families | 2,770 (7.7%) | $87,845 |
| 6-Person Families | 1,241 (3.5%) | $112,102 |
| 7+ Person Families | 373 (1.0%) | $137,670 |
| Total | 35,720 (100.0%) | $80,421 |
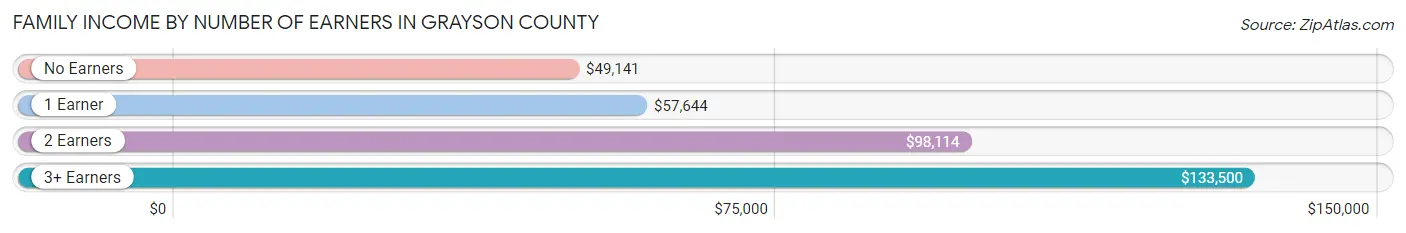
Family Income by Number of Earners in Grayson County
The median family income in Grayson County is $80,421, with families comprising 3+ earners (3,630) having the highest median family income of $133,500, while families with no earners (5,492) have the lowest median family income of $49,141, accounting for 10.2% and 15.4% of families, respectively.
| Number of Earners | # Families | Median Income |
| No Earners | 5,492 (15.4%) | $49,141 |
| 1 Earner | 11,500 (32.2%) | $57,644 |
| 2 Earners | 15,098 (42.3%) | $98,114 |
| 3+ Earners | 3,630 (10.2%) | $133,500 |
| Total | 35,720 (100.0%) | $80,421 |
Household Income in Grayson County
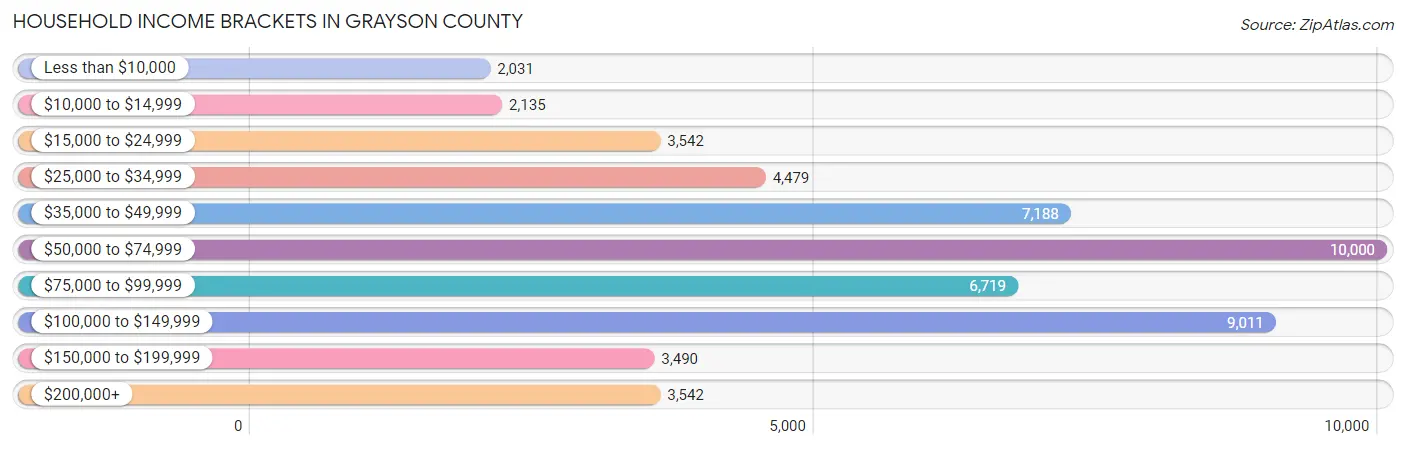
Household Income Brackets in Grayson County
With 10,000 households falling in the category, the $50,000 to $74,999 income range is the most frequent in Grayson County, accounting for 19.2% of all households. In contrast, only 2,031 households (3.9%) fall into the less than $10,000 income bracket, making it the least populous group.
| Income Bracket | # Households | % Households |
| Less than $10,000 | 2,031 | 3.9% |
| $10,000 to $14,999 | 2,135 | 4.1% |
| $15,000 to $24,999 | 3,542 | 6.8% |
| $25,000 to $34,999 | 4,479 | 8.6% |
| $35,000 to $49,999 | 7,188 | 13.8% |
| $50,000 to $74,999 | 10,000 | 19.2% |
| $75,000 to $99,999 | 6,719 | 12.9% |
| $100,000 to $149,999 | 9,011 | 17.3% |
| $150,000 to $199,999 | 3,490 | 6.7% |
| $200,000+ | 3,542 | 6.8% |
Household Income by Householder Age in Grayson County
The median household income in Grayson County is $66,608, with the highest median household income of $79,643 found in the 45 to 64 years age bracket for the primary householder. A total of 19,068 households (36.6%) fall into this category. Meanwhile, the 15 to 24 years age bracket for the primary householder has the lowest median household income of $42,161, with 2,191 households (4.2%) in this group.
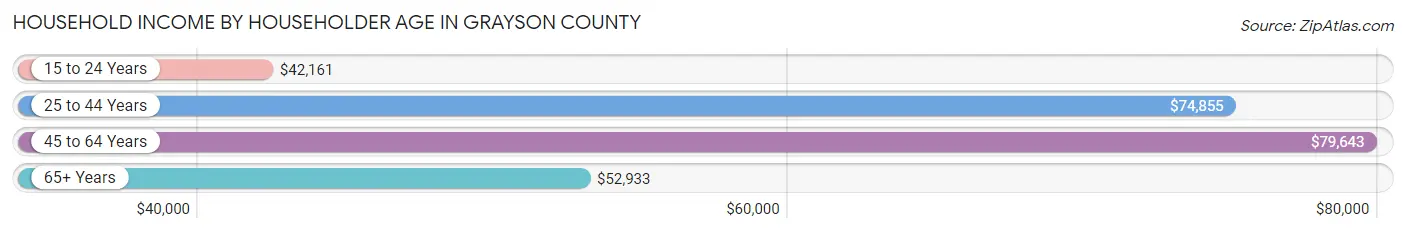
| Income Bracket | # Households | Median Income |
| 15 to 24 Years | 2,191 (4.2%) | $42,161 |
| 25 to 44 Years | 15,161 (29.1%) | $74,855 |
| 45 to 64 Years | 19,068 (36.6%) | $79,643 |
| 65+ Years | 15,664 (30.1%) | $52,933 |
| Total | 52,084 (100.0%) | $66,608 |
Poverty in Grayson County
Income Below Poverty by Sex and Age in Grayson County
With 10.4% poverty level for males and 12.4% for females among the residents of Grayson County, 5 year old males and 18 to 24 year old females are the most vulnerable to poverty, with 170 males (27.9%) and 1,153 females (21.1%) in their respective age groups living below the poverty level.
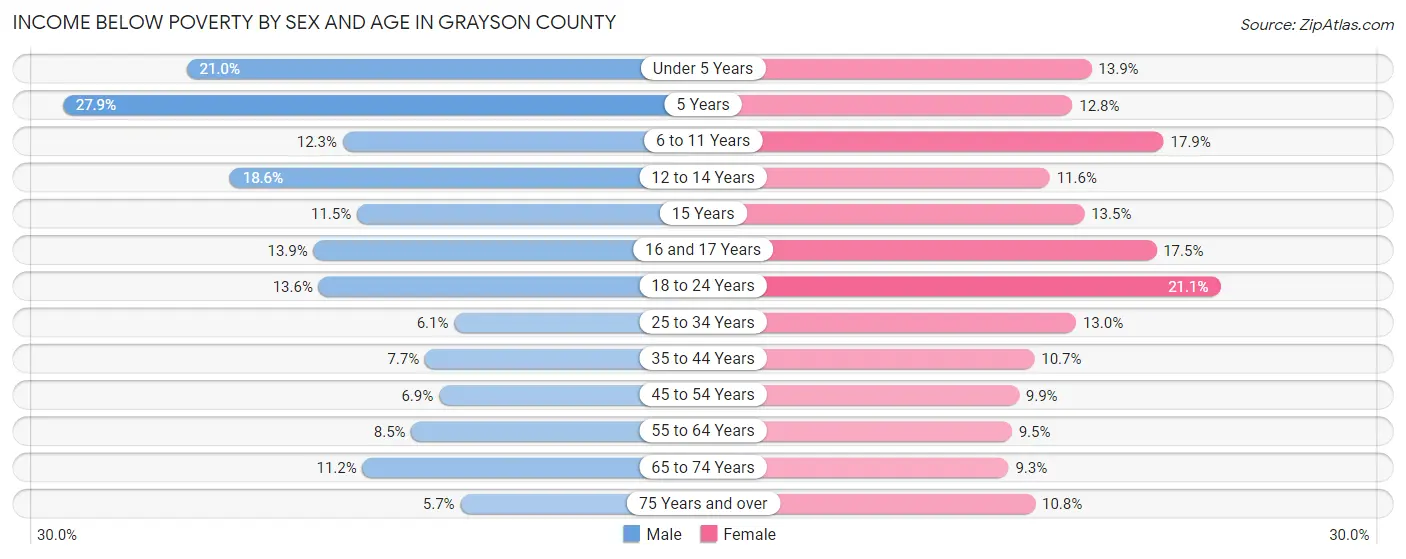
| Age Bracket | Male | Female |
| Under 5 Years | 875 (21.0%) | 563 (13.9%) |
| 5 Years | 170 (27.9%) | 128 (12.8%) |
| 6 to 11 Years | 670 (12.3%) | 906 (17.9%) |
| 12 to 14 Years | 617 (18.6%) | 321 (11.6%) |
| 15 Years | 128 (11.5%) | 121 (13.5%) |
| 16 and 17 Years | 250 (13.9%) | 322 (17.5%) |
| 18 to 24 Years | 755 (13.6%) | 1,153 (21.1%) |
| 25 to 34 Years | 491 (6.1%) | 1,065 (13.0%) |
| 35 to 44 Years | 613 (7.7%) | 879 (10.7%) |
| 45 to 54 Years | 565 (6.9%) | 823 (9.9%) |
| 55 to 64 Years | 759 (8.5%) | 899 (9.5%) |
| 65 to 74 Years | 767 (11.2%) | 708 (9.3%) |
| 75 Years and over | 231 (5.7%) | 582 (10.8%) |
| Total | 6,891 (10.4%) | 8,470 (12.4%) |
Income Above Poverty by Sex and Age in Grayson County
According to the poverty statistics in Grayson County, males aged 75 years and over and females aged 65 to 74 years are the age groups that are most secure financially, with 94.3% of males and 90.7% of females in these age groups living above the poverty line.
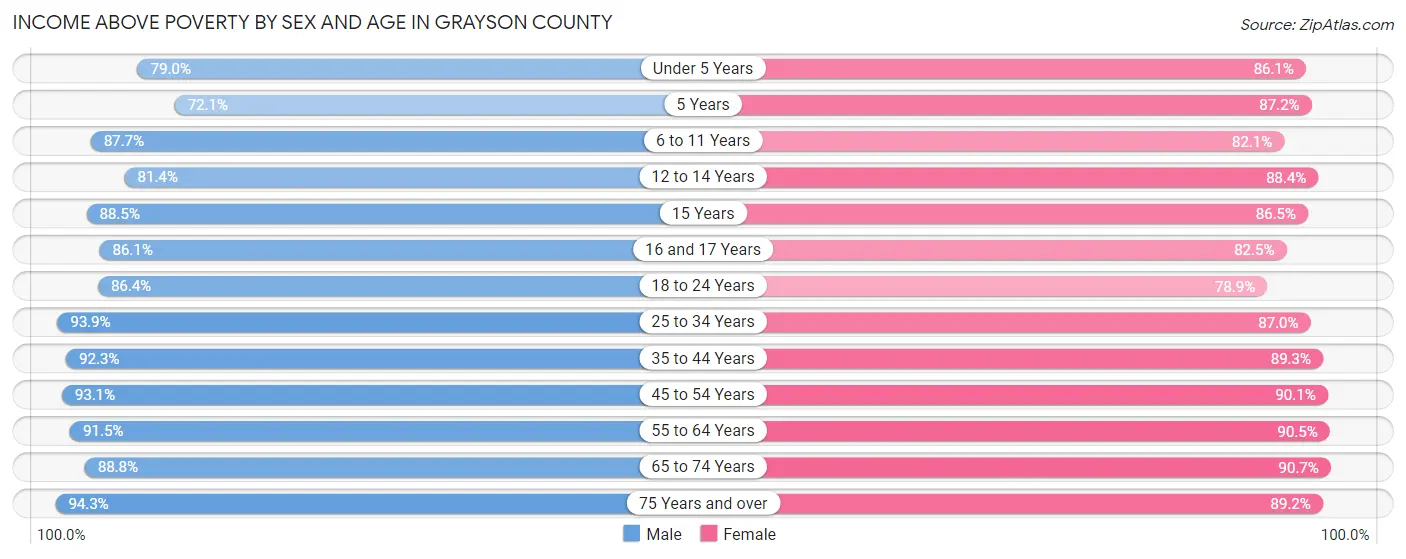
| Age Bracket | Male | Female |
| Under 5 Years | 3,296 (79.0%) | 3,488 (86.1%) |
| 5 Years | 440 (72.1%) | 869 (87.2%) |
| 6 to 11 Years | 4,785 (87.7%) | 4,149 (82.1%) |
| 12 to 14 Years | 2,706 (81.4%) | 2,451 (88.4%) |
| 15 Years | 986 (88.5%) | 775 (86.5%) |
| 16 and 17 Years | 1,547 (86.1%) | 1,517 (82.5%) |
| 18 to 24 Years | 4,790 (86.4%) | 4,320 (78.9%) |
| 25 to 34 Years | 7,595 (93.9%) | 7,102 (87.0%) |
| 35 to 44 Years | 7,349 (92.3%) | 7,317 (89.3%) |
| 45 to 54 Years | 7,604 (93.1%) | 7,522 (90.1%) |
| 55 to 64 Years | 8,211 (91.5%) | 8,603 (90.5%) |
| 65 to 74 Years | 6,094 (88.8%) | 6,919 (90.7%) |
| 75 Years and over | 3,801 (94.3%) | 4,828 (89.2%) |
| Total | 59,204 (89.6%) | 59,860 (87.6%) |
Income Below Poverty Among Married-Couple Families in Grayson County
The poverty statistics for married-couple families in Grayson County show that 4.0% or 1,062 of the total 26,763 families live below the poverty line. Families with 5 or more children have the highest poverty rate of 38.9%, comprising of 51 families. On the other hand, families with 1 or 2 children have the lowest poverty rate of 3.0%, which includes 270 families.
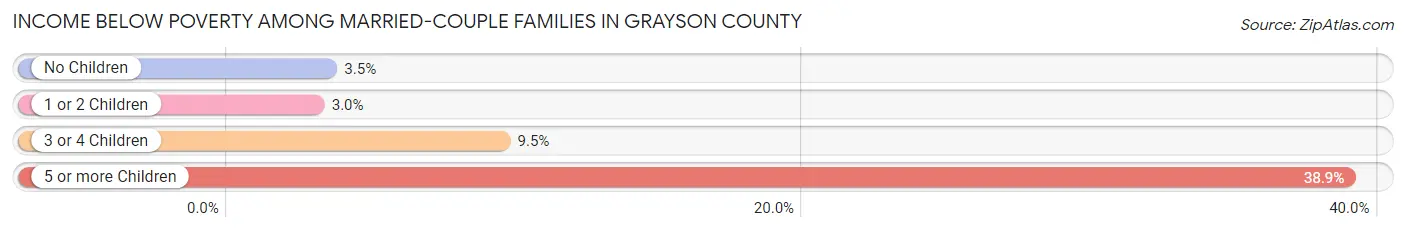
| Children | Above Poverty | Below Poverty |
| No Children | 15,020 (96.5%) | 539 (3.5%) |
| 1 or 2 Children | 8,675 (97.0%) | 270 (3.0%) |
| 3 or 4 Children | 1,926 (90.5%) | 202 (9.5%) |
| 5 or more Children | 80 (61.1%) | 51 (38.9%) |
| Total | 25,701 (96.0%) | 1,062 (4.0%) |
Income Below Poverty Among Single-Parent Households in Grayson County
According to the poverty data in Grayson County, 17.4% or 428 single-father households and 21.6% or 1,403 single-mother households are living below the poverty line. Among single-father households, those with 1 or 2 children have the highest poverty rate, with 252 households (20.3%) experiencing poverty. Likewise, among single-mother households, those with 3 or 4 children have the highest poverty rate, with 347 households (65.7%) falling below the poverty line.
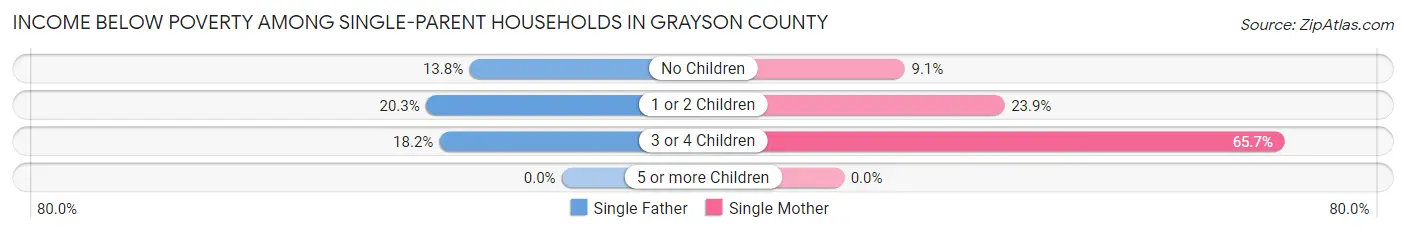
| Children | Single Father | Single Mother |
| No Children | 141 (13.8%) | 227 (9.1%) |
| 1 or 2 Children | 252 (20.3%) | 829 (23.9%) |
| 3 or 4 Children | 35 (18.2%) | 347 (65.7%) |
| 5 or more Children | 0 (0.0%) | 0 (0.0%) |
| Total | 428 (17.4%) | 1,403 (21.6%) |
Income Below Poverty Among Married-Couple vs Single-Parent Households in Grayson County
The poverty data for Grayson County shows that 1,062 of the married-couple family households (4.0%) and 1,831 of the single-parent households (20.4%) are living below the poverty level. Within the married-couple family households, those with 5 or more children have the highest poverty rate, with 51 households (38.9%) falling below the poverty line. Among the single-parent households, those with 3 or 4 children have the highest poverty rate, with 382 household (53.1%) living below poverty.
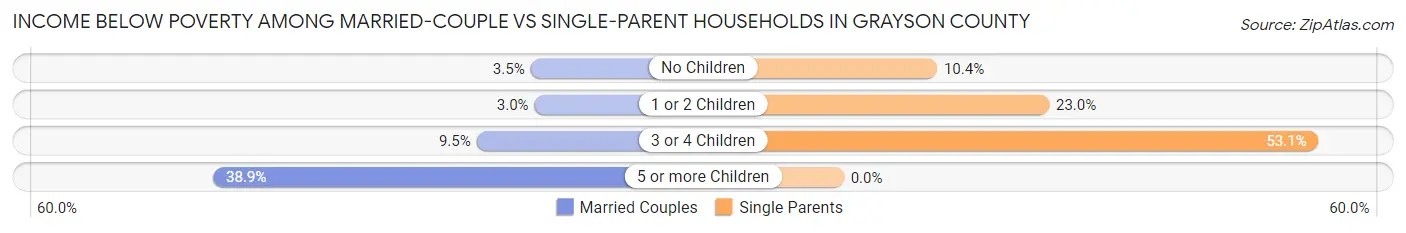
| Children | Married-Couple Families | Single-Parent Households |
| No Children | 539 (3.5%) | 368 (10.4%) |
| 1 or 2 Children | 270 (3.0%) | 1,081 (23.0%) |
| 3 or 4 Children | 202 (9.5%) | 382 (53.1%) |
| 5 or more Children | 51 (38.9%) | 0 (0.0%) |
| Total | 1,062 (4.0%) | 1,831 (20.4%) |
Race in Grayson County
The most populous races in Grayson County are White / Caucasian (111,394 | 81.3%), Hispanic or Latino (19,982 | 14.6%), and Two or more Races (11,444 | 8.4%).
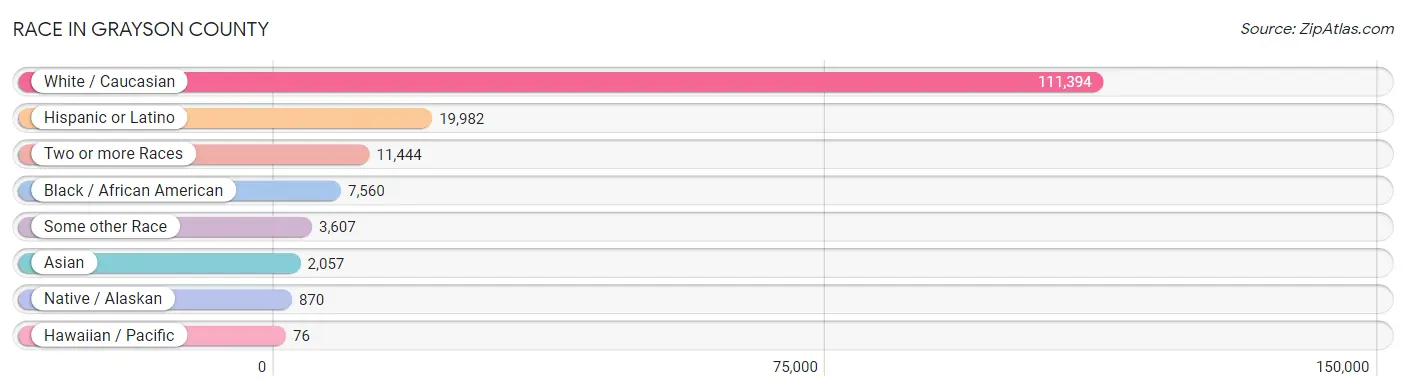
| Race | # Population | % Population |
| Asian | 2,057 | 1.5% |
| Black / African American | 7,560 | 5.5% |
| Hawaiian / Pacific | 76 | 0.1% |
| Hispanic or Latino | 19,982 | 14.6% |
| Native / Alaskan | 870 | 0.6% |
| White / Caucasian | 111,394 | 81.3% |
| Two or more Races | 11,444 | 8.4% |
| Some other Race | 3,607 | 2.6% |
| Total | 137,008 | 100.0% |
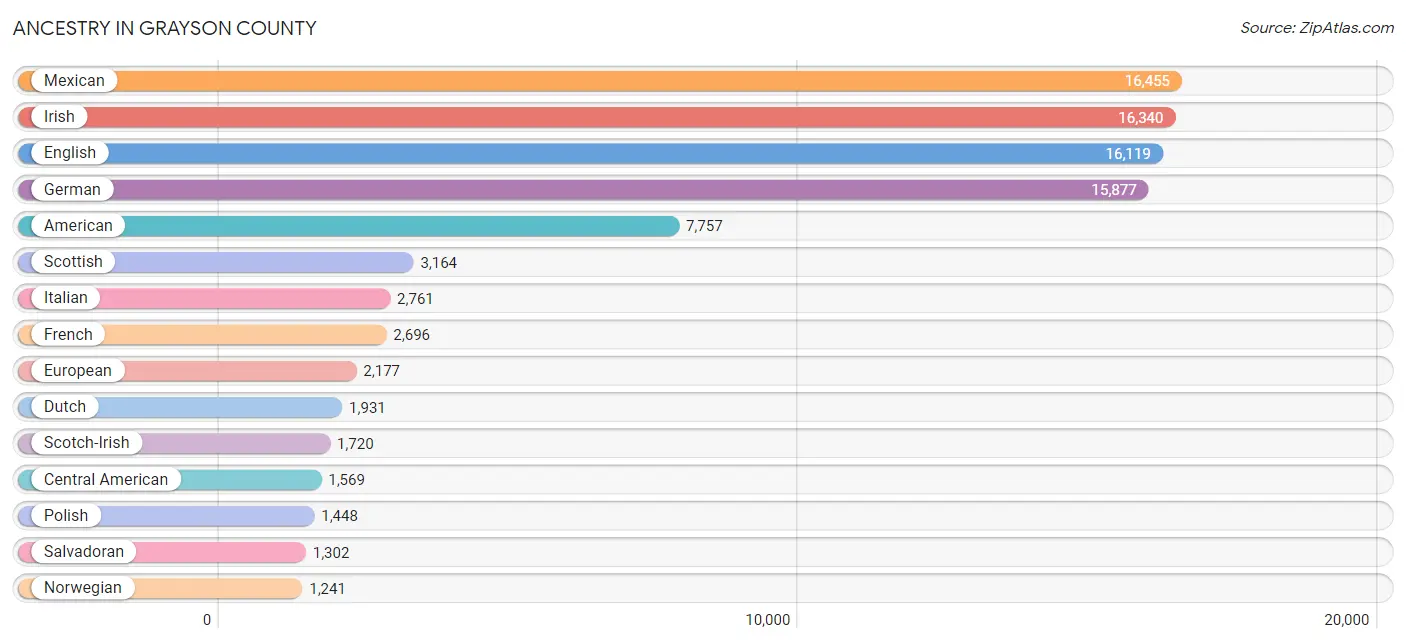
Ancestry in Grayson County
The most populous ancestries reported in Grayson County are Mexican (16,455 | 12.0%), Irish (16,340 | 11.9%), English (16,119 | 11.8%), German (15,877 | 11.6%), and American (7,757 | 5.7%), together accounting for 53.0% of all Grayson County residents.
| Ancestry | # Population | % Population |
| African | 244 | 0.2% |
| American | 7,757 | 5.7% |
| Apache | 35 | 0.0% |
| Arab | 173 | 0.1% |
| Armenian | 48 | 0.0% |
| Austrian | 217 | 0.2% |
| Bahamian | 41 | 0.0% |
| Basque | 14 | 0.0% |
| Belgian | 60 | 0.0% |
| Bhutanese | 85 | 0.1% |
| Blackfeet | 299 | 0.2% |
| British | 605 | 0.4% |
| British West Indian | 27 | 0.0% |
| Bulgarian | 9 | 0.0% |
| Burmese | 308 | 0.2% |
| Cajun | 109 | 0.1% |
| Cambodian | 3 | 0.0% |
| Canadian | 22 | 0.0% |
| Celtic | 253 | 0.2% |
| Central American | 1,569 | 1.1% |
| Central American Indian | 16 | 0.0% |
| Cherokee | 839 | 0.6% |
| Chickasaw | 707 | 0.5% |
| Chilean | 14 | 0.0% |
| Chippewa | 31 | 0.0% |
| Choctaw | 1,005 | 0.7% |
| Colombian | 74 | 0.1% |
| Comanche | 59 | 0.0% |
| Creek | 16 | 0.0% |
| Croatian | 7 | 0.0% |
| Cuban | 184 | 0.1% |
| Czech | 571 | 0.4% |
| Czechoslovakian | 31 | 0.0% |
| Danish | 87 | 0.1% |
| Dominican | 64 | 0.1% |
| Dutch | 1,931 | 1.4% |
| Dutch West Indian | 117 | 0.1% |
| Eastern European | 270 | 0.2% |
| Egyptian | 33 | 0.0% |
| English | 16,119 | 11.8% |
| European | 2,177 | 1.6% |
| Filipino | 34 | 0.0% |
| Finnish | 134 | 0.1% |
| French | 2,696 | 2.0% |
| French American Indian | 16 | 0.0% |
| French Canadian | 285 | 0.2% |
| German | 15,877 | 11.6% |
| Greek | 308 | 0.2% |
| Guatemalan | 93 | 0.1% |
| Guyanese | 32 | 0.0% |
| Honduran | 153 | 0.1% |
| Hungarian | 163 | 0.1% |
| Icelander | 6 | 0.0% |
| Indian (Asian) | 258 | 0.2% |
| Indonesian | 272 | 0.2% |
| Iranian | 3 | 0.0% |
| Irish | 16,340 | 11.9% |
| Iroquois | 9 | 0.0% |
| Israeli | 14 | 0.0% |
| Italian | 2,761 | 2.0% |
| Korean | 279 | 0.2% |
| Lebanese | 69 | 0.1% |
| Lithuanian | 38 | 0.0% |
| Mexican | 16,455 | 12.0% |
| Mexican American Indian | 270 | 0.2% |
| Native Hawaiian | 50 | 0.0% |
| Navajo | 122 | 0.1% |
| Nicaraguan | 21 | 0.0% |
| Nigerian | 18 | 0.0% |
| Northern European | 28 | 0.0% |
| Norwegian | 1,241 | 0.9% |
| Osage | 3 | 0.0% |
| Pakistani | 60 | 0.0% |
| Palestinian | 5 | 0.0% |
| Pennsylvania German | 21 | 0.0% |
| Polish | 1,448 | 1.1% |
| Portuguese | 200 | 0.2% |
| Potawatomi | 49 | 0.0% |
| Puerto Rican | 372 | 0.3% |
| Romanian | 137 | 0.1% |
| Russian | 343 | 0.3% |
| Salvadoran | 1,302 | 0.9% |
| Scandinavian | 425 | 0.3% |
| Scotch-Irish | 1,720 | 1.3% |
| Scottish | 3,164 | 2.3% |
| Sioux | 45 | 0.0% |
| Slovak | 13 | 0.0% |
| South American | 119 | 0.1% |
| Spaniard | 231 | 0.2% |
| Spanish | 238 | 0.2% |
| Sri Lankan | 299 | 0.2% |
| Subsaharan African | 658 | 0.5% |
| Swedish | 849 | 0.6% |
| Swiss | 154 | 0.1% |
| Syrian | 7 | 0.0% |
| Thai | 647 | 0.5% |
| Tohono O'Odham | 21 | 0.0% |
| Tongan | 10 | 0.0% |
| Ukrainian | 138 | 0.1% |
| Venezuelan | 31 | 0.0% |
| Vietnamese | 72 | 0.1% |
| Welsh | 717 | 0.5% |
| West Indian | 16 | 0.0% |
| Yugoslavian | 16 | 0.0% |
| Yuman | 6 | 0.0% | View All 105 Rows |
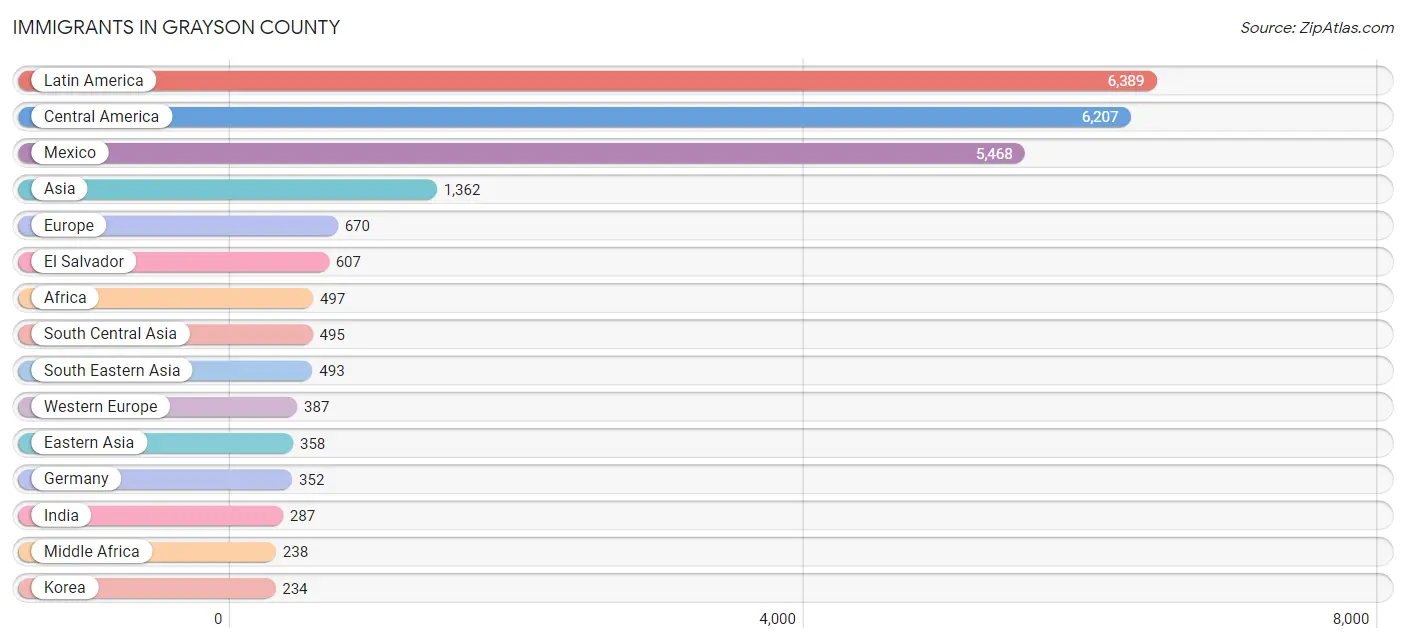
Immigrants in Grayson County
The most numerous immigrant groups reported in Grayson County came from Latin America (6,389 | 4.7%), Central America (6,207 | 4.5%), Mexico (5,468 | 4.0%), Asia (1,362 | 1.0%), and Europe (670 | 0.5%), together accounting for 14.7% of all Grayson County residents.
| Immigration Origin | # Population | % Population |
| Africa | 497 | 0.4% |
| Asia | 1,362 | 1.0% |
| Australia | 13 | 0.0% |
| Bangladesh | 55 | 0.0% |
| Brazil | 13 | 0.0% |
| Canada | 216 | 0.2% |
| Caribbean | 78 | 0.1% |
| Central America | 6,207 | 4.5% |
| Chile | 10 | 0.0% |
| China | 122 | 0.1% |
| Colombia | 43 | 0.0% |
| Cuba | 15 | 0.0% |
| Czechoslovakia | 55 | 0.0% |
| Dominican Republic | 16 | 0.0% |
| Eastern Africa | 13 | 0.0% |
| Eastern Asia | 358 | 0.3% |
| Eastern Europe | 150 | 0.1% |
| El Salvador | 607 | 0.4% |
| England | 69 | 0.1% |
| Europe | 670 | 0.5% |
| France | 11 | 0.0% |
| Germany | 352 | 0.3% |
| Grenada | 16 | 0.0% |
| Guatemala | 60 | 0.0% |
| Guyana | 32 | 0.0% |
| Honduras | 51 | 0.0% |
| Hong Kong | 6 | 0.0% |
| India | 287 | 0.2% |
| Iran | 3 | 0.0% |
| Israel | 5 | 0.0% |
| Japan | 2 | 0.0% |
| Kazakhstan | 3 | 0.0% |
| Kenya | 2 | 0.0% |
| Korea | 234 | 0.2% |
| Latin America | 6,389 | 4.7% |
| Lebanon | 11 | 0.0% |
| Lithuania | 14 | 0.0% |
| Malaysia | 21 | 0.0% |
| Mexico | 5,468 | 4.0% |
| Middle Africa | 238 | 0.2% |
| Nepal | 135 | 0.1% |
| Netherlands | 24 | 0.0% |
| Nicaragua | 21 | 0.0% |
| Nigeria | 51 | 0.0% |
| North Macedonia | 3 | 0.0% |
| Northern Europe | 133 | 0.1% |
| Norway | 10 | 0.0% |
| Oceania | 23 | 0.0% |
| Pakistan | 12 | 0.0% |
| Philippines | 125 | 0.1% |
| Poland | 5 | 0.0% |
| Russia | 73 | 0.1% |
| South Africa | 32 | 0.0% |
| South America | 104 | 0.1% |
| South Central Asia | 495 | 0.4% |
| South Eastern Asia | 493 | 0.4% |
| St. Vincent and the Grenadines | 7 | 0.0% |
| Taiwan | 89 | 0.1% |
| Thailand | 35 | 0.0% |
| Trinidad and Tobago | 10 | 0.0% |
| Venezuela | 6 | 0.0% |
| Vietnam | 103 | 0.1% |
| Western Africa | 51 | 0.0% |
| Western Asia | 16 | 0.0% |
| Western Europe | 387 | 0.3% |
| Zimbabwe | 11 | 0.0% | View All 66 Rows |
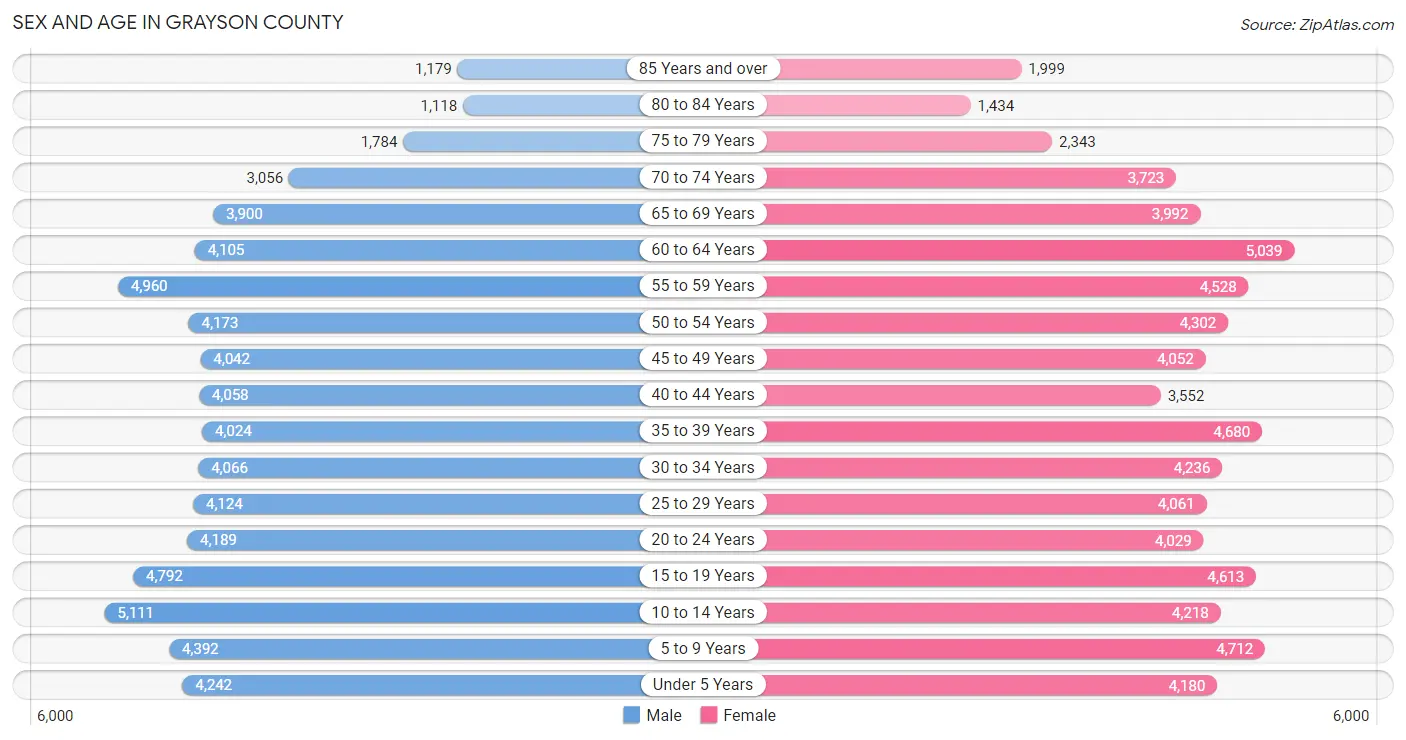
Sex and Age in Grayson County
Sex and Age in Grayson County
The most populous age groups in Grayson County are 10 to 14 Years (5,111 | 7.6%) for men and 60 to 64 Years (5,039 | 7.2%) for women.
| Age Bracket | Male | Female |
| Under 5 Years | 4,242 (6.3%) | 4,180 (6.0%) |
| 5 to 9 Years | 4,392 (6.5%) | 4,712 (6.8%) |
| 10 to 14 Years | 5,111 (7.6%) | 4,218 (6.0%) |
| 15 to 19 Years | 4,792 (7.1%) | 4,613 (6.6%) |
| 20 to 24 Years | 4,189 (6.2%) | 4,029 (5.8%) |
| 25 to 29 Years | 4,124 (6.1%) | 4,061 (5.8%) |
| 30 to 34 Years | 4,066 (6.0%) | 4,236 (6.1%) |
| 35 to 39 Years | 4,024 (6.0%) | 4,680 (6.7%) |
| 40 to 44 Years | 4,058 (6.0%) | 3,552 (5.1%) |
| 45 to 49 Years | 4,042 (6.0%) | 4,052 (5.8%) |
| 50 to 54 Years | 4,173 (6.2%) | 4,302 (6.2%) |
| 55 to 59 Years | 4,960 (7.4%) | 4,528 (6.5%) |
| 60 to 64 Years | 4,105 (6.1%) | 5,039 (7.2%) |
| 65 to 69 Years | 3,900 (5.8%) | 3,992 (5.7%) |
| 70 to 74 Years | 3,056 (4.5%) | 3,723 (5.3%) |
| 75 to 79 Years | 1,784 (2.6%) | 2,343 (3.4%) |
| 80 to 84 Years | 1,118 (1.7%) | 1,434 (2.1%) |
| 85 Years and over | 1,179 (1.8%) | 1,999 (2.9%) |
| Total | 67,315 (100.0%) | 69,693 (100.0%) |
Families and Households in Grayson County
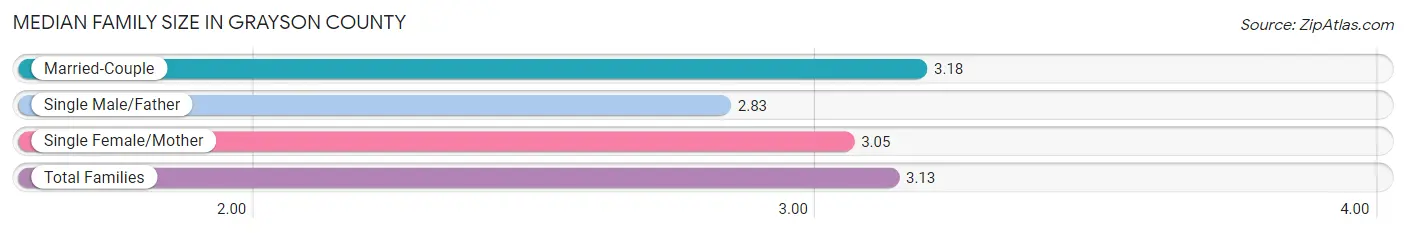
Median Family Size in Grayson County
The median family size in Grayson County is 3.13 persons per family, with married-couple families (26,763 | 74.9%) accounting for the largest median family size of 3.18 persons per family. On the other hand, single male/father families (2,459 | 6.9%) represent the smallest median family size with 2.83 persons per family.
| Family Type | # Families | Family Size |
| Married-Couple | 26,763 (74.9%) | 3.18 |
| Single Male/Father | 2,459 (6.9%) | 2.83 |
| Single Female/Mother | 6,498 (18.2%) | 3.05 |
| Total Families | 35,720 (100.0%) | 3.13 |
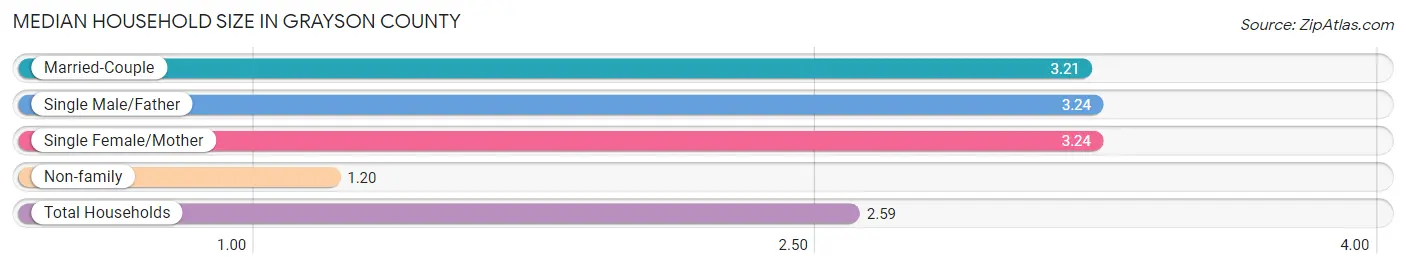
Median Household Size in Grayson County
The median household size in Grayson County is 2.59 persons per household, with single male/father households (2,459 | 4.7%) accounting for the largest median household size of 3.24 persons per household. non-family households (16,364 | 31.4%) represent the smallest median household size with 1.20 persons per household.
| Household Type | # Households | Household Size |
| Married-Couple | 26,763 (51.4%) | 3.21 |
| Single Male/Father | 2,459 (4.7%) | 3.24 |
| Single Female/Mother | 6,498 (12.5%) | 3.24 |
| Non-family | 16,364 (31.4%) | 1.20 |
| Total Households | 52,084 (100.0%) | 2.59 |
Household Size by Marriage Status in Grayson County
Out of a total of 52,084 households in Grayson County, 35,720 (68.6%) are family households, while 16,364 (31.4%) are nonfamily households. The most numerous type of family households are 2-person households, comprising 16,434, and the most common type of nonfamily households are 1-person households, comprising 13,731.
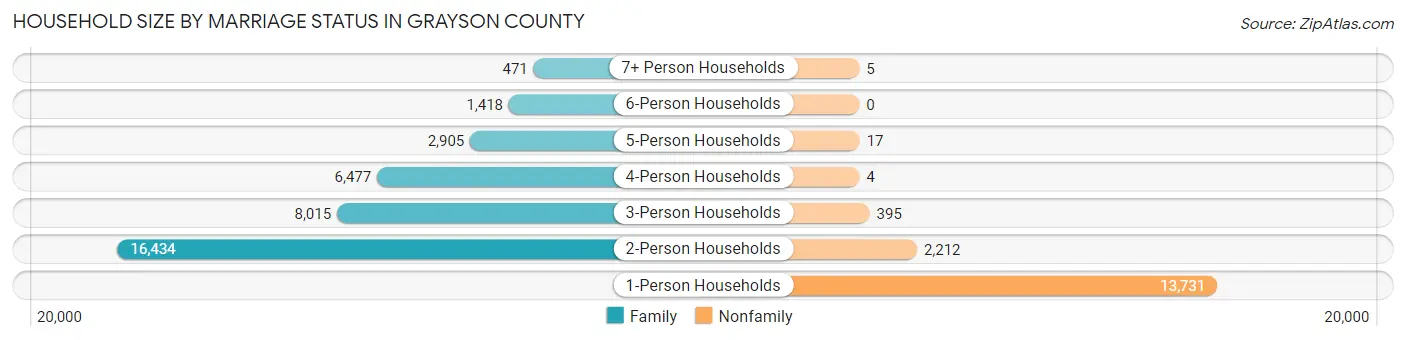
| Household Size | Family Households | Nonfamily Households |
| 1-Person Households | - | 13,731 (26.4%) |
| 2-Person Households | 16,434 (31.6%) | 2,212 (4.3%) |
| 3-Person Households | 8,015 (15.4%) | 395 (0.8%) |
| 4-Person Households | 6,477 (12.4%) | 4 (0.0%) |
| 5-Person Households | 2,905 (5.6%) | 17 (0.0%) |
| 6-Person Households | 1,418 (2.7%) | 0 (0.0%) |
| 7+ Person Households | 471 (0.9%) | 5 (0.0%) |
| Total | 35,720 (68.6%) | 16,364 (31.4%) |
Female Fertility in Grayson County
Fertility by Age in Grayson County
Average fertility rate in Grayson County is 50.0 births per 1,000 women. Women in the age bracket of 20 to 34 years have the highest fertility rate with 92.0 births per 1,000 women. Women in the age bracket of 20 to 34 years acount for 75.9% of all women with births.
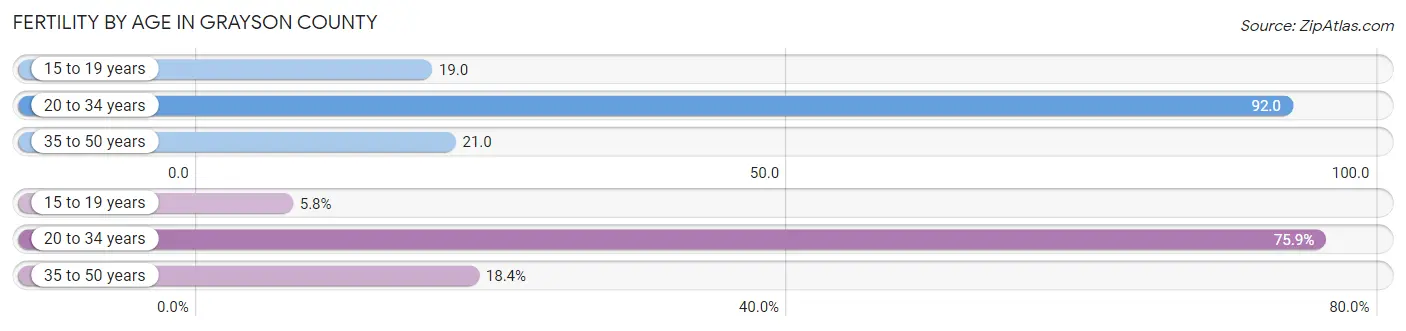
| Age Bracket | Women with Births | Births / 1,000 Women |
| 15 to 19 years | 86 (5.8%) | 19.0 |
| 20 to 34 years | 1,135 (75.9%) | 92.0 |
| 35 to 50 years | 275 (18.4%) | 21.0 |
| Total | 1,496 (100.0%) | 50.0 |
Fertility by Age by Marriage Status in Grayson County
73.3% of women with births (1,496) in Grayson County are married. The highest percentage of unmarried women with births falls into 15 to 19 years age bracket with 100.0% of them unmarried at the time of birth, while the lowest percentage of unmarried women with births belong to 35 to 50 years age bracket with 10.6% of them unmarried.
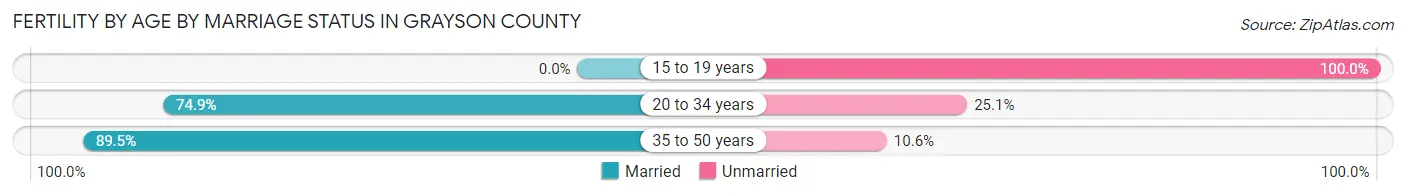
| Age Bracket | Married | Unmarried |
| 15 to 19 years | 0 (0.0%) | 86 (100.0%) |
| 20 to 34 years | 850 (74.9%) | 285 (25.1%) |
| 35 to 50 years | 246 (89.4%) | 29 (10.5%) |
| Total | 1,097 (73.3%) | 399 (26.7%) |
Fertility by Education in Grayson County
Average fertility rate in Grayson County is 50.0 births per 1,000 women. Women with the education attainment of high school diploma have the highest fertility rate of 81.0 births per 1,000 women, while women with the education attainment of less than high school have the lowest fertility at 27.0 births per 1,000 women. Women with the education attainment of high school diploma represent 45.1% of all women with births.
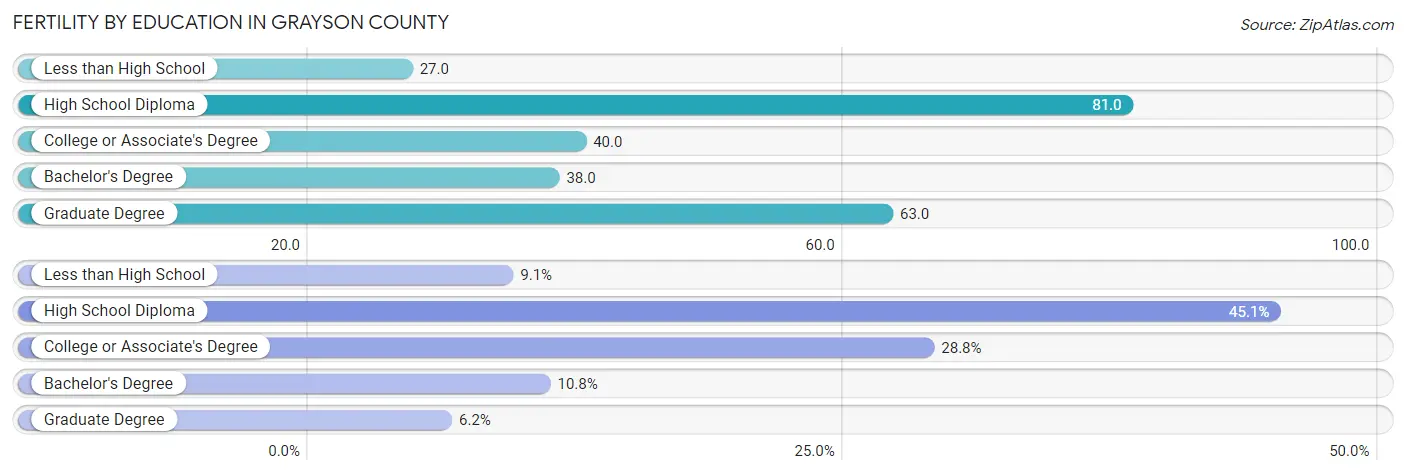
| Educational Attainment | Women with Births | Births / 1,000 Women |
| Less than High School | 136 (9.1%) | 27.0 |
| High School Diploma | 674 (45.1%) | 81.0 |
| College or Associate's Degree | 431 (28.8%) | 40.0 |
| Bachelor's Degree | 162 (10.8%) | 38.0 |
| Graduate Degree | 93 (6.2%) | 63.0 |
| Total | 1,496 (100.0%) | 50.0 |
Fertility by Education by Marriage Status in Grayson County
26.7% of women with births in Grayson County are unmarried. Women with the educational attainment of bachelor's degree are most likely to be married with 100.0% of them married at childbirth, while women with the educational attainment of high school diploma are least likely to be married with 40.9% of them unmarried at childbirth.
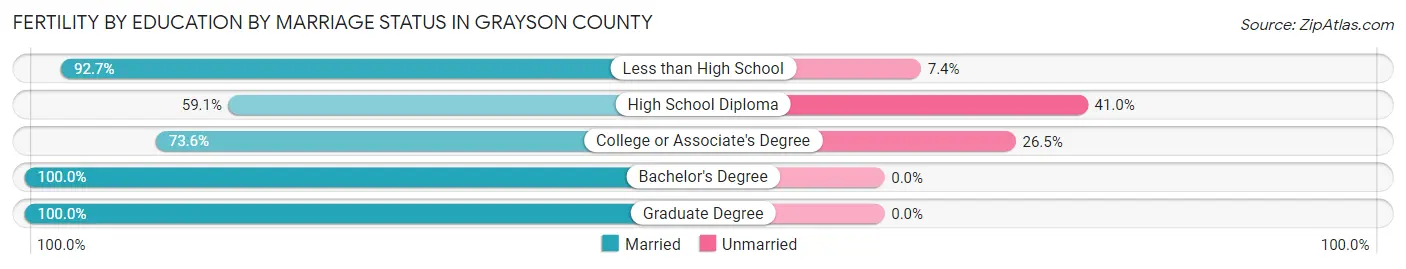
| Educational Attainment | Married | Unmarried |
| Less than High School | 126 (92.6%) | 10 (7.3%) |
| High School Diploma | 398 (59.1%) | 276 (40.9%) |
| College or Associate's Degree | 317 (73.6%) | 114 (26.5%) |
| Bachelor's Degree | 162 (100.0%) | 0 (0.0%) |
| Graduate Degree | 93 (100.0%) | 0 (0.0%) |
| Total | 1,097 (73.3%) | 399 (26.7%) |
Employment Characteristics in Grayson County
Employment by Class of Employer in Grayson County
Among the 63,791 employed individuals in Grayson County, private company employees (45,828 | 71.8%), local government employees (5,406 | 8.5%), and self-employed (not incorporated) (4,396 | 6.9%) make up the most common classes of employment.
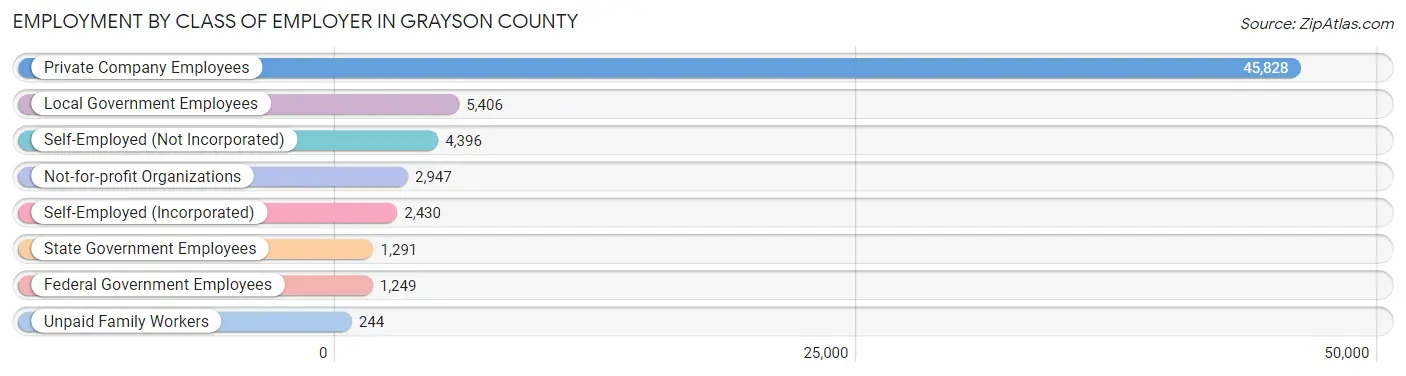
| Employer Class | # Employees | % Employees |
| Private Company Employees | 45,828 | 71.8% |
| Self-Employed (Incorporated) | 2,430 | 3.8% |
| Self-Employed (Not Incorporated) | 4,396 | 6.9% |
| Not-for-profit Organizations | 2,947 | 4.6% |
| Local Government Employees | 5,406 | 8.5% |
| State Government Employees | 1,291 | 2.0% |
| Federal Government Employees | 1,249 | 2.0% |
| Unpaid Family Workers | 244 | 0.4% |
| Total | 63,791 | 100.0% |
Employment Status by Age in Grayson County
According to the labor force statistics for Grayson County, out of the total population over 16 years of age (108,143), 62.2% or 67,265 individuals are in the labor force, with 3.9% or 2,623 of them unemployed. The age group with the highest labor force participation rate is 35 to 44 years, with 82.6% or 13,475 individuals in the labor force. Within the labor force, the 16 to 19 years age range has the highest percentage of unemployed individuals, with 8.8% or 262 of them being unemployed.
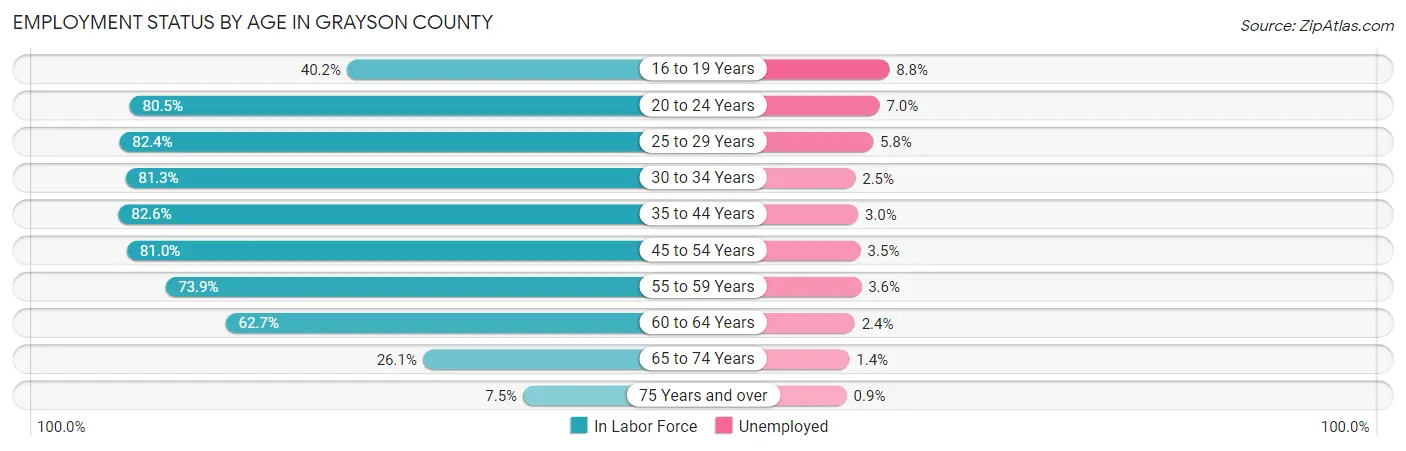
| Age Bracket | In Labor Force | Unemployed |
| 16 to 19 Years | 2,973 (40.2%) | 262 (8.8%) |
| 20 to 24 Years | 6,615 (80.5%) | 463 (7.0%) |
| 25 to 29 Years | 6,744 (82.4%) | 391 (5.8%) |
| 30 to 34 Years | 6,750 (81.3%) | 169 (2.5%) |
| 35 to 44 Years | 13,475 (82.6%) | 404 (3.0%) |
| 45 to 54 Years | 13,421 (81.0%) | 470 (3.5%) |
| 55 to 59 Years | 7,012 (73.9%) | 252 (3.6%) |
| 60 to 64 Years | 5,733 (62.7%) | 138 (2.4%) |
| 65 to 74 Years | 3,829 (26.1%) | 54 (1.4%) |
| 75 Years and over | 739 (7.5%) | 7 (0.9%) |
| Total | 67,265 (62.2%) | 2,623 (3.9%) |
Employment Status by Educational Attainment in Grayson County
According to labor force statistics for Grayson County, 78.1% of individuals (53,110) out of the total population between 25 and 64 years of age (68,002) are in the labor force, with 3.4% or 1,806 of them being unemployed. The group with the highest labor force participation rate are those with the educational attainment of bachelor's degree or higher, with 85.6% or 12,951 individuals in the labor force. Within the labor force, individuals with less than high school education have the highest percentage of unemployment, with 4.3% or 186 of them being unemployed.
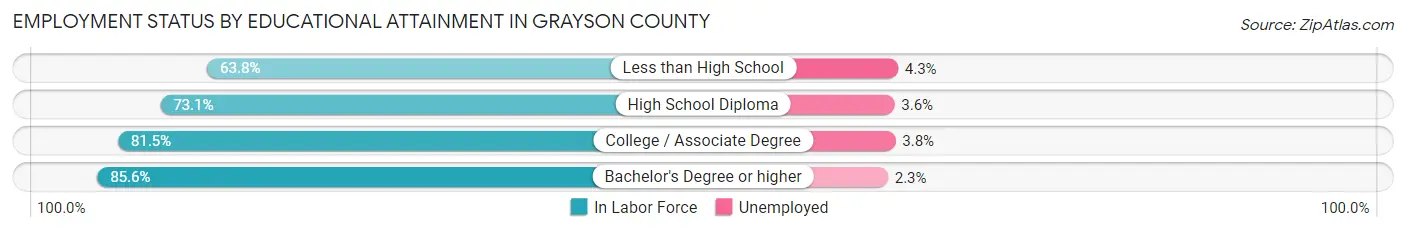
| Educational Attainment | In Labor Force | Unemployed |
| Less than High School | 4,315 (63.8%) | 291 (4.3%) |
| High School Diploma | 14,841 (73.1%) | 731 (3.6%) |
| College / Associate Degree | 21,032 (81.5%) | 981 (3.8%) |
| Bachelor's Degree or higher | 12,951 (85.6%) | 348 (2.3%) |
| Total | 53,110 (78.1%) | 2,312 (3.4%) |
Employment Occupations by Sex in Grayson County
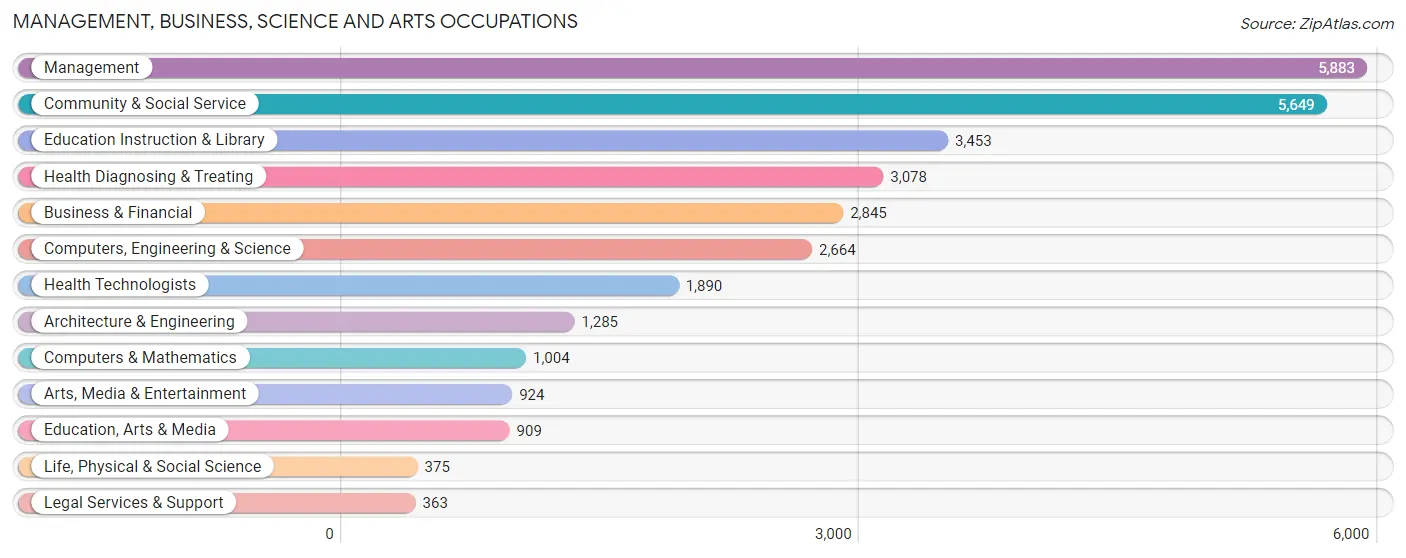
Management, Business, Science and Arts Occupations
The most common Management, Business, Science and Arts occupations in Grayson County are Management (5,883 | 9.1%), Community & Social Service (5,649 | 8.7%), Education Instruction & Library (3,453 | 5.3%), Health Diagnosing & Treating (3,078 | 4.8%), and Business & Financial (2,845 | 4.4%).
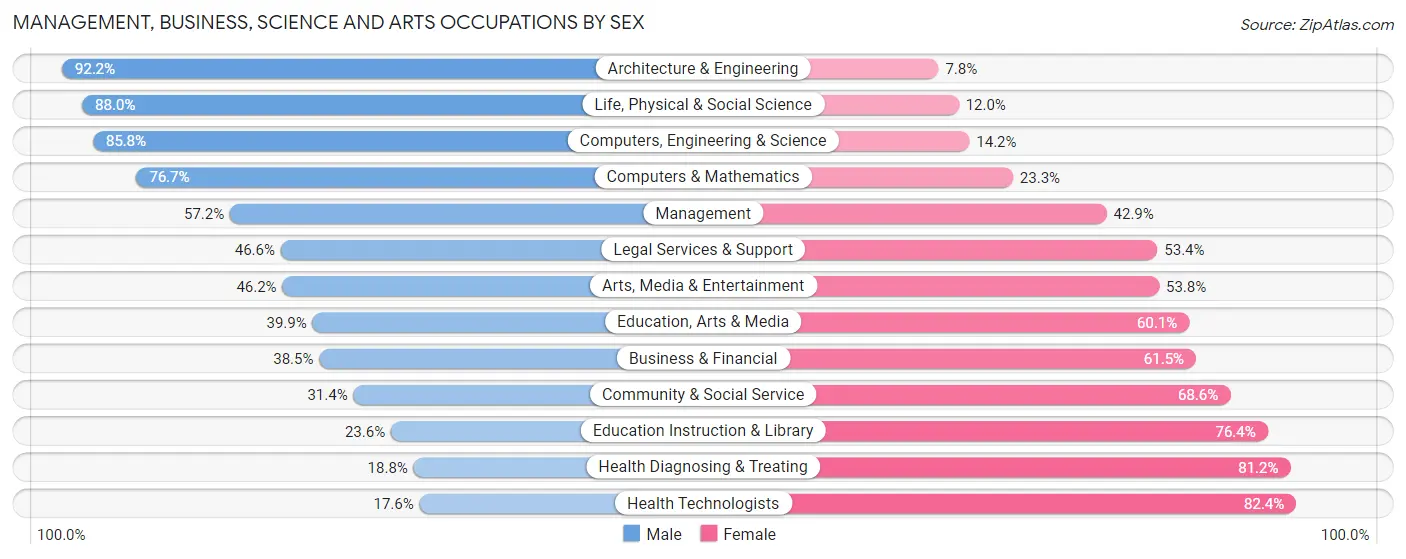
Management, Business, Science and Arts Occupations by Sex
Within the Management, Business, Science and Arts occupations in Grayson County, the most male-oriented occupations are Architecture & Engineering (92.2%), Life, Physical & Social Science (88.0%), and Computers, Engineering & Science (85.8%), while the most female-oriented occupations are Health Technologists (82.4%), Health Diagnosing & Treating (81.2%), and Education Instruction & Library (76.4%).
| Occupation | Male | Female |
| Management | 3,362 (57.2%) | 2,521 (42.8%) |
| Business & Financial | 1,096 (38.5%) | 1,749 (61.5%) |
| Computers, Engineering & Science | 2,285 (85.8%) | 379 (14.2%) |
| Computers & Mathematics | 770 (76.7%) | 234 (23.3%) |
| Architecture & Engineering | 1,185 (92.2%) | 100 (7.8%) |
| Life, Physical & Social Science | 330 (88.0%) | 45 (12.0%) |
| Community & Social Service | 1,773 (31.4%) | 3,876 (68.6%) |
| Education, Arts & Media | 363 (39.9%) | 546 (60.1%) |
| Legal Services & Support | 169 (46.6%) | 194 (53.4%) |
| Education Instruction & Library | 814 (23.6%) | 2,639 (76.4%) |
| Arts, Media & Entertainment | 427 (46.2%) | 497 (53.8%) |
| Health Diagnosing & Treating | 580 (18.8%) | 2,498 (81.2%) |
| Health Technologists | 333 (17.6%) | 1,557 (82.4%) |
| Total (Category) | 9,096 (45.2%) | 11,023 (54.8%) |
| Total (Overall) | 34,320 (53.1%) | 30,296 (46.9%) |
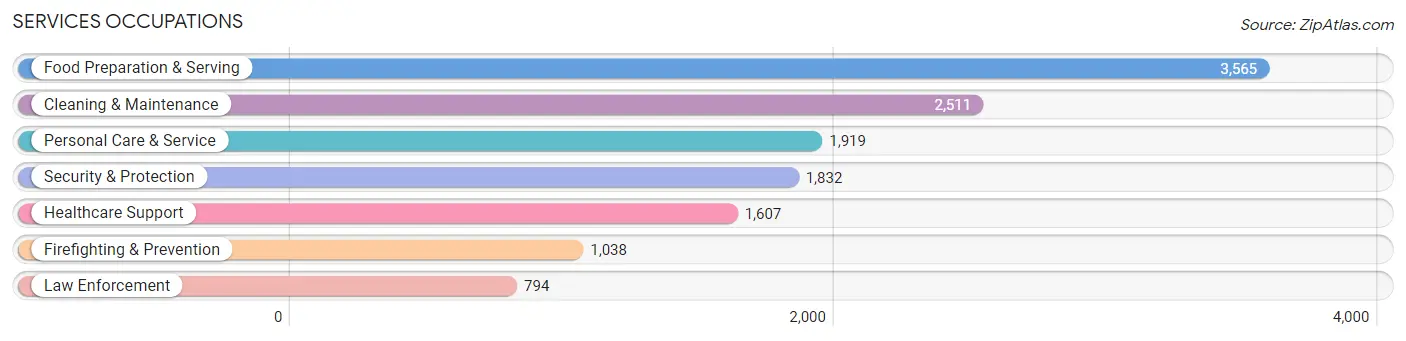
Services Occupations
The most common Services occupations in Grayson County are Food Preparation & Serving (3,565 | 5.5%), Cleaning & Maintenance (2,511 | 3.9%), Personal Care & Service (1,919 | 3.0%), Security & Protection (1,832 | 2.8%), and Healthcare Support (1,607 | 2.5%).
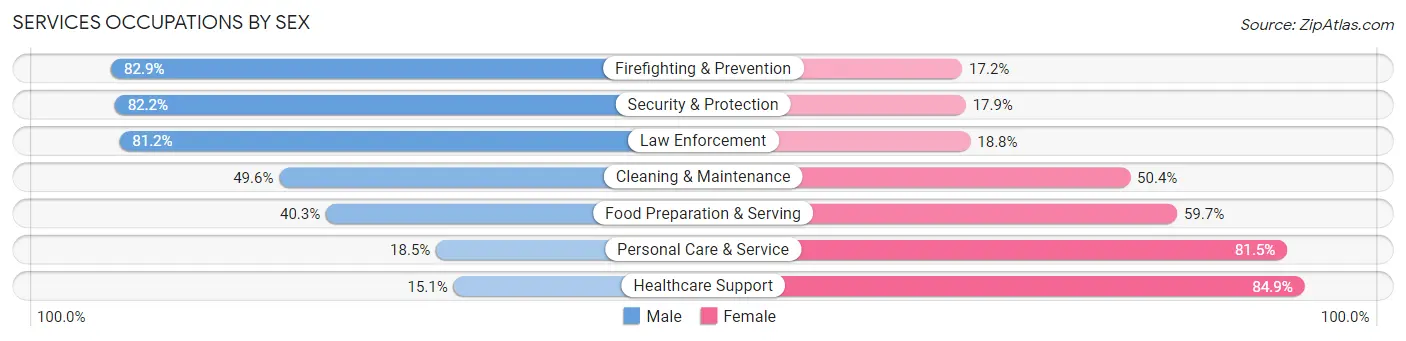
Services Occupations by Sex
Within the Services occupations in Grayson County, the most male-oriented occupations are Firefighting & Prevention (82.9%), Security & Protection (82.2%), and Law Enforcement (81.2%), while the most female-oriented occupations are Healthcare Support (84.9%), Personal Care & Service (81.5%), and Food Preparation & Serving (59.7%).
| Occupation | Male | Female |
| Healthcare Support | 242 (15.1%) | 1,365 (84.9%) |
| Security & Protection | 1,505 (82.2%) | 327 (17.8%) |
| Firefighting & Prevention | 860 (82.9%) | 178 (17.2%) |
| Law Enforcement | 645 (81.2%) | 149 (18.8%) |
| Food Preparation & Serving | 1,437 (40.3%) | 2,128 (59.7%) |
| Cleaning & Maintenance | 1,245 (49.6%) | 1,266 (50.4%) |
| Personal Care & Service | 355 (18.5%) | 1,564 (81.5%) |
| Total (Category) | 4,784 (41.8%) | 6,650 (58.2%) |
| Total (Overall) | 34,320 (53.1%) | 30,296 (46.9%) |
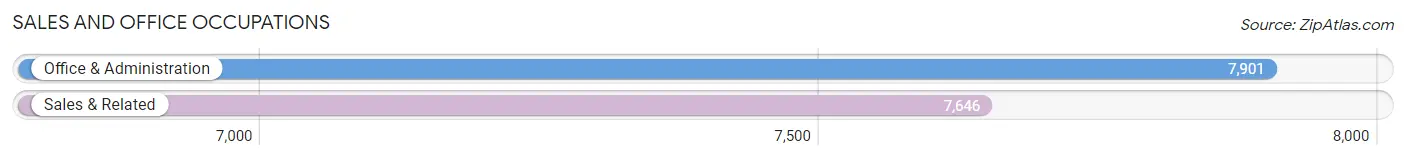
Sales and Office Occupations
The most common Sales and Office occupations in Grayson County are Office & Administration (7,901 | 12.2%), and Sales & Related (7,646 | 11.8%).
Sales and Office Occupations by Sex
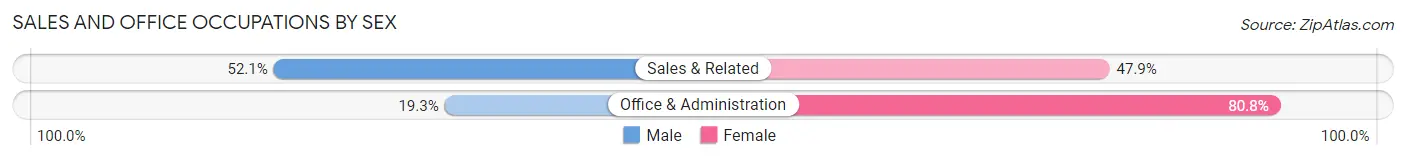
| Occupation | Male | Female |
| Sales & Related | 3,985 (52.1%) | 3,661 (47.9%) |
| Office & Administration | 1,521 (19.3%) | 6,380 (80.7%) |
| Total (Category) | 5,506 (35.4%) | 10,041 (64.6%) |
| Total (Overall) | 34,320 (53.1%) | 30,296 (46.9%) |
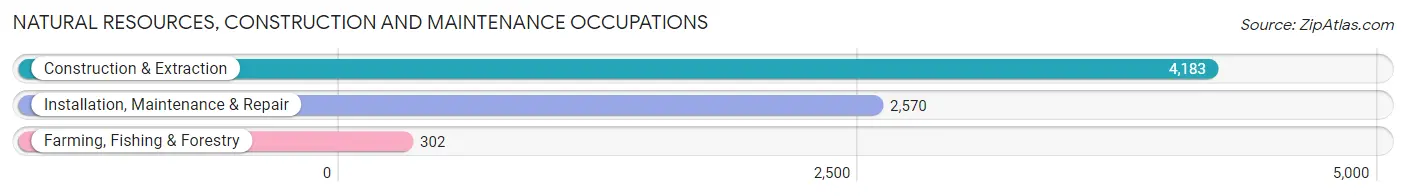
Natural Resources, Construction and Maintenance Occupations
The most common Natural Resources, Construction and Maintenance occupations in Grayson County are Construction & Extraction (4,183 | 6.5%), Installation, Maintenance & Repair (2,570 | 4.0%), and Farming, Fishing & Forestry (302 | 0.5%).
Natural Resources, Construction and Maintenance Occupations by Sex
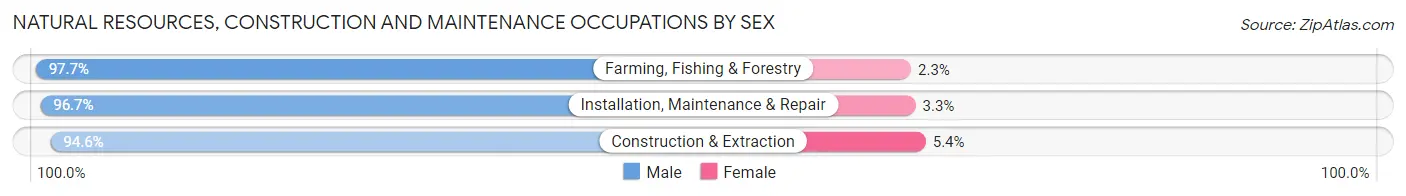
| Occupation | Male | Female |
| Farming, Fishing & Forestry | 295 (97.7%) | 7 (2.3%) |
| Construction & Extraction | 3,958 (94.6%) | 225 (5.4%) |
| Installation, Maintenance & Repair | 2,486 (96.7%) | 84 (3.3%) |
| Total (Category) | 6,739 (95.5%) | 316 (4.5%) |
| Total (Overall) | 34,320 (53.1%) | 30,296 (46.9%) |
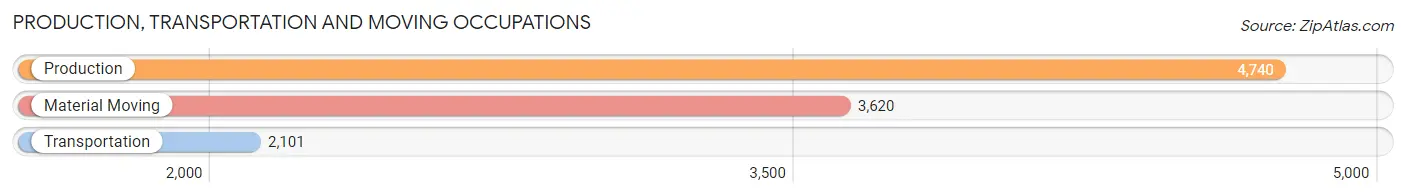
Production, Transportation and Moving Occupations
The most common Production, Transportation and Moving occupations in Grayson County are Production (4,740 | 7.3%), Material Moving (3,620 | 5.6%), and Transportation (2,101 | 3.3%).
Production, Transportation and Moving Occupations by Sex
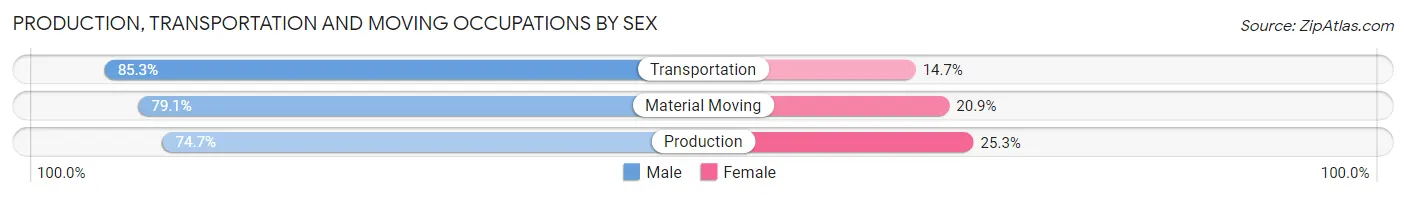
| Occupation | Male | Female |
| Production | 3,539 (74.7%) | 1,201 (25.3%) |
| Transportation | 1,792 (85.3%) | 309 (14.7%) |
| Material Moving | 2,864 (79.1%) | 756 (20.9%) |
| Total (Category) | 8,195 (78.3%) | 2,266 (21.7%) |
| Total (Overall) | 34,320 (53.1%) | 30,296 (46.9%) |
Employment Industries by Sex in Grayson County
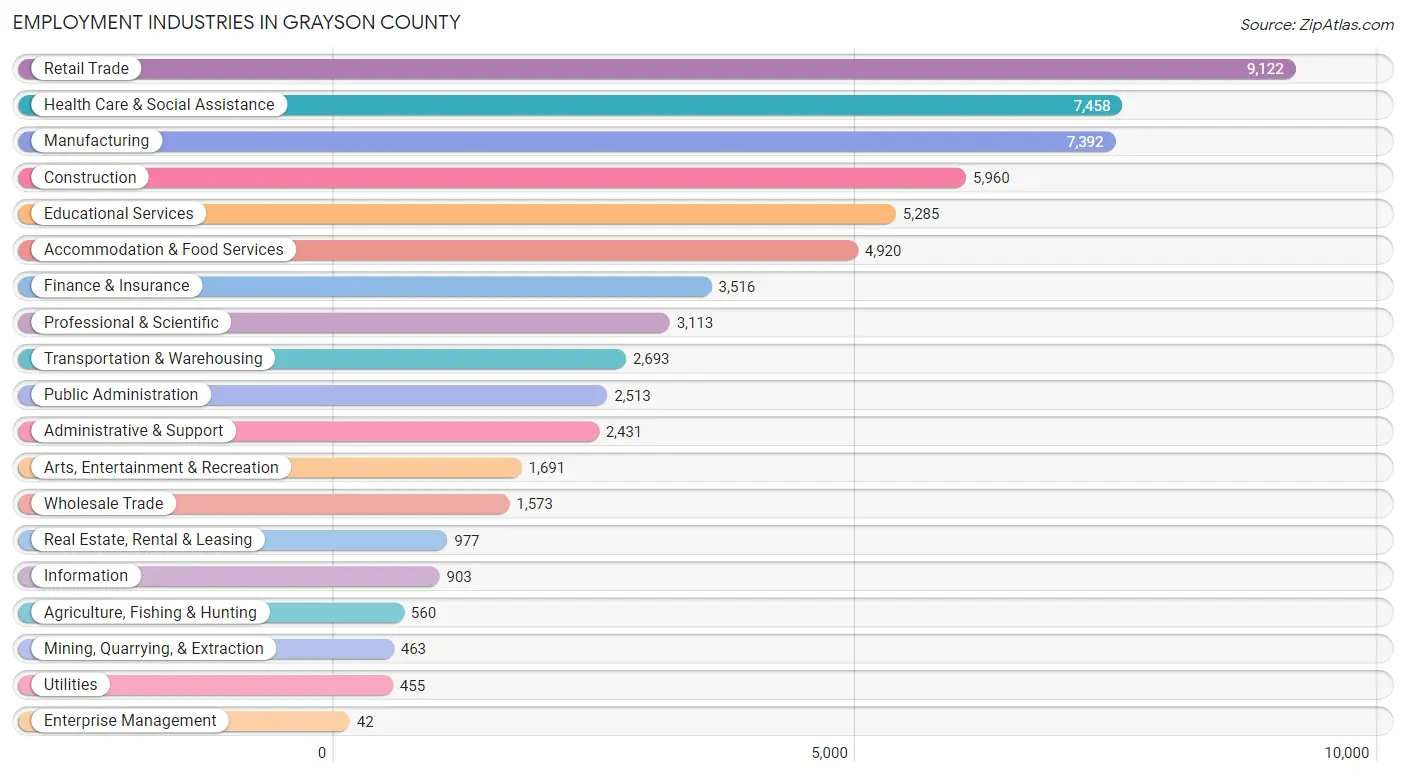
Employment Industries in Grayson County
The major employment industries in Grayson County include Retail Trade (9,122 | 14.1%), Health Care & Social Assistance (7,458 | 11.5%), Manufacturing (7,392 | 11.4%), Construction (5,960 | 9.2%), and Educational Services (5,285 | 8.2%).
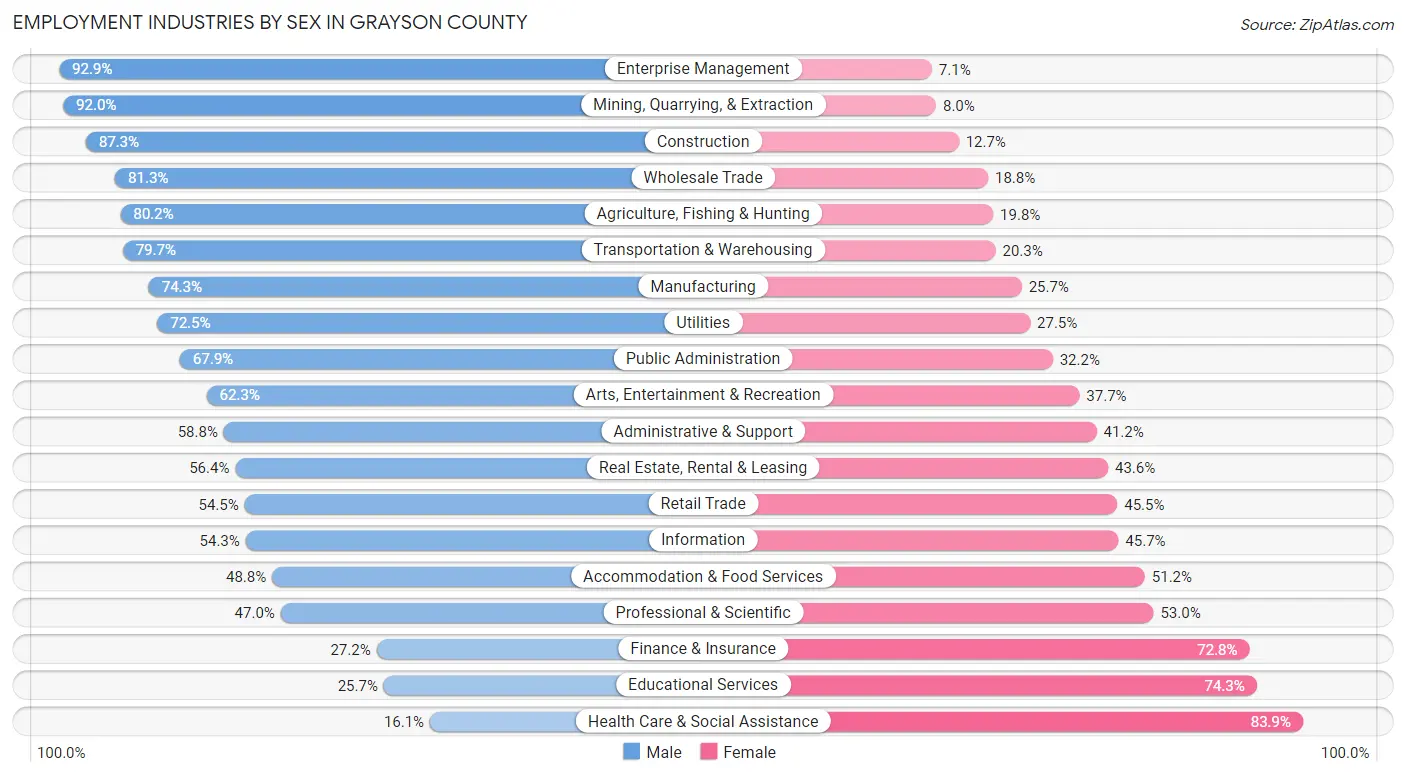
Employment Industries by Sex in Grayson County
The Grayson County industries that see more men than women are Enterprise Management (92.9%), Mining, Quarrying, & Extraction (92.0%), and Construction (87.3%), whereas the industries that tend to have a higher number of women are Health Care & Social Assistance (83.9%), Educational Services (74.3%), and Finance & Insurance (72.8%).
| Industry | Male | Female |
| Agriculture, Fishing & Hunting | 449 (80.2%) | 111 (19.8%) |
| Mining, Quarrying, & Extraction | 426 (92.0%) | 37 (8.0%) |
| Construction | 5,204 (87.3%) | 756 (12.7%) |
| Manufacturing | 5,491 (74.3%) | 1,901 (25.7%) |
| Wholesale Trade | 1,278 (81.2%) | 295 (18.8%) |
| Retail Trade | 4,970 (54.5%) | 4,152 (45.5%) |
| Transportation & Warehousing | 2,146 (79.7%) | 547 (20.3%) |
| Utilities | 330 (72.5%) | 125 (27.5%) |
| Information | 490 (54.3%) | 413 (45.7%) |
| Finance & Insurance | 955 (27.2%) | 2,561 (72.8%) |
| Real Estate, Rental & Leasing | 551 (56.4%) | 426 (43.6%) |
| Professional & Scientific | 1,463 (47.0%) | 1,650 (53.0%) |
| Enterprise Management | 39 (92.9%) | 3 (7.1%) |
| Administrative & Support | 1,429 (58.8%) | 1,002 (41.2%) |
| Educational Services | 1,356 (25.7%) | 3,929 (74.3%) |
| Health Care & Social Assistance | 1,201 (16.1%) | 6,257 (83.9%) |
| Arts, Entertainment & Recreation | 1,054 (62.3%) | 637 (37.7%) |
| Accommodation & Food Services | 2,400 (48.8%) | 2,520 (51.2%) |
| Public Administration | 1,705 (67.8%) | 808 (32.2%) |
| Total | 34,320 (53.1%) | 30,296 (46.9%) |
Education in Grayson County
School Enrollment in Grayson County
The most common levels of schooling among the 32,277 students in Grayson County are middle school (7,559 | 23.4%), high school (7,105 | 22.0%), and elementary school (6,832 | 21.2%).
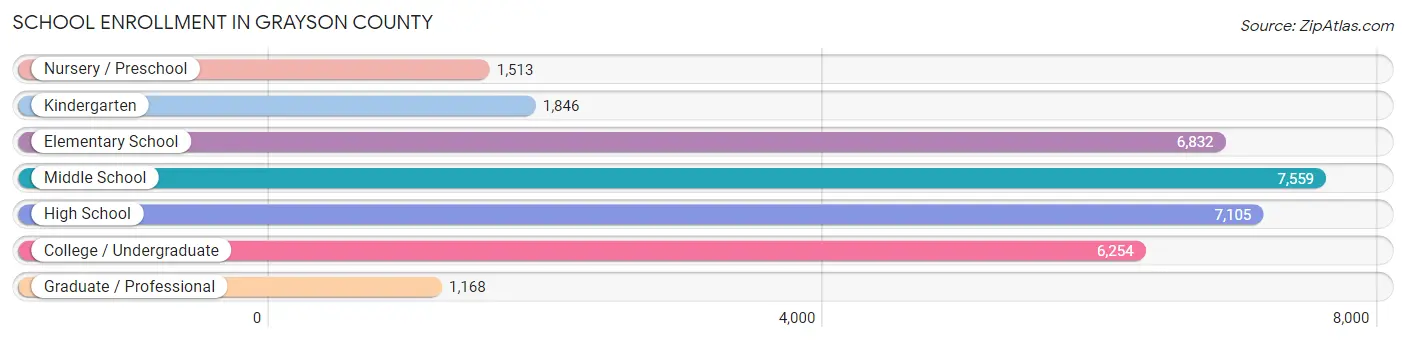
| School Level | # Students | % Students |
| Nursery / Preschool | 1,513 | 4.7% |
| Kindergarten | 1,846 | 5.7% |
| Elementary School | 6,832 | 21.2% |
| Middle School | 7,559 | 23.4% |
| High School | 7,105 | 22.0% |
| College / Undergraduate | 6,254 | 19.4% |
| Graduate / Professional | 1,168 | 3.6% |
| Total | 32,277 | 100.0% |
School Enrollment by Age by Funding Source in Grayson County
Out of a total of 32,277 students who are enrolled in schools in Grayson County, 3,228 (10.0%) attend a private institution, while the remaining 29,049 (90.0%) are enrolled in public schools. The age group of 3 to 4 year olds has the highest likelihood of being enrolled in private schools, with 441 (36.4% in the age bracket) enrolled. Conversely, the age group of 10 to 14 year olds has the lowest likelihood of being enrolled in a private school, with 8,625 (96.2% in the age bracket) attending a public institution.
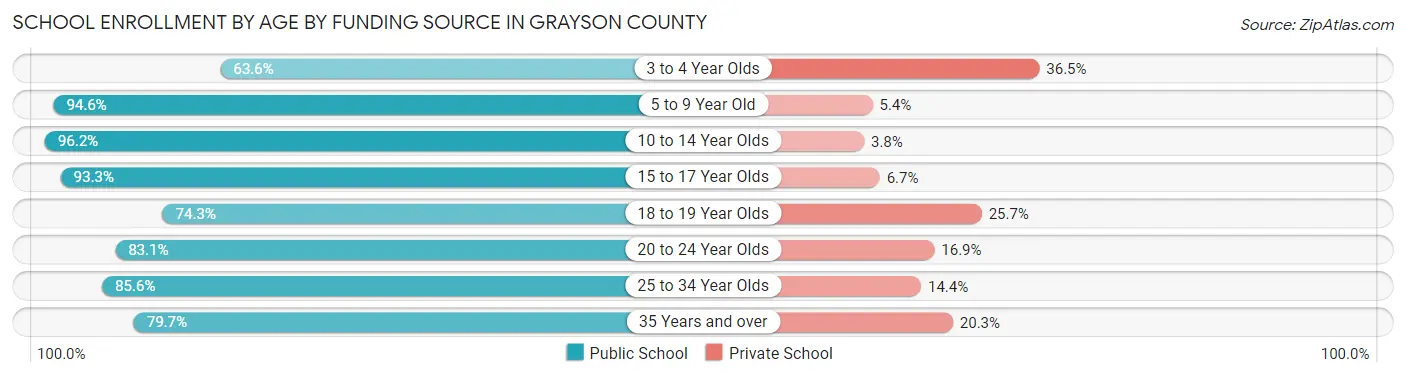
| Age Bracket | Public School | Private School |
| 3 to 4 Year Olds | 769 (63.5%) | 441 (36.4%) |
| 5 to 9 Year Old | 7,849 (94.6%) | 446 (5.4%) |
| 10 to 14 Year Olds | 8,625 (96.2%) | 340 (3.8%) |
| 15 to 17 Year Olds | 5,049 (93.3%) | 363 (6.7%) |
| 18 to 19 Year Olds | 1,855 (74.3%) | 642 (25.7%) |
| 20 to 24 Year Olds | 2,155 (83.1%) | 438 (16.9%) |
| 25 to 34 Year Olds | 1,436 (85.6%) | 242 (14.4%) |
| 35 Years and over | 1,296 (79.7%) | 331 (20.3%) |
| Total | 29,049 (90.0%) | 3,228 (10.0%) |
Educational Attainment by Field of Study in Grayson County
Business (4,926 | 21.6%), education (3,710 | 16.3%), science & technology (2,922 | 12.8%), arts & humanities (1,936 | 8.5%), and bio, nature & agricultural (1,447 | 6.4%) are the most common fields of study among 22,788 individuals in Grayson County who have obtained a bachelor's degree or higher.
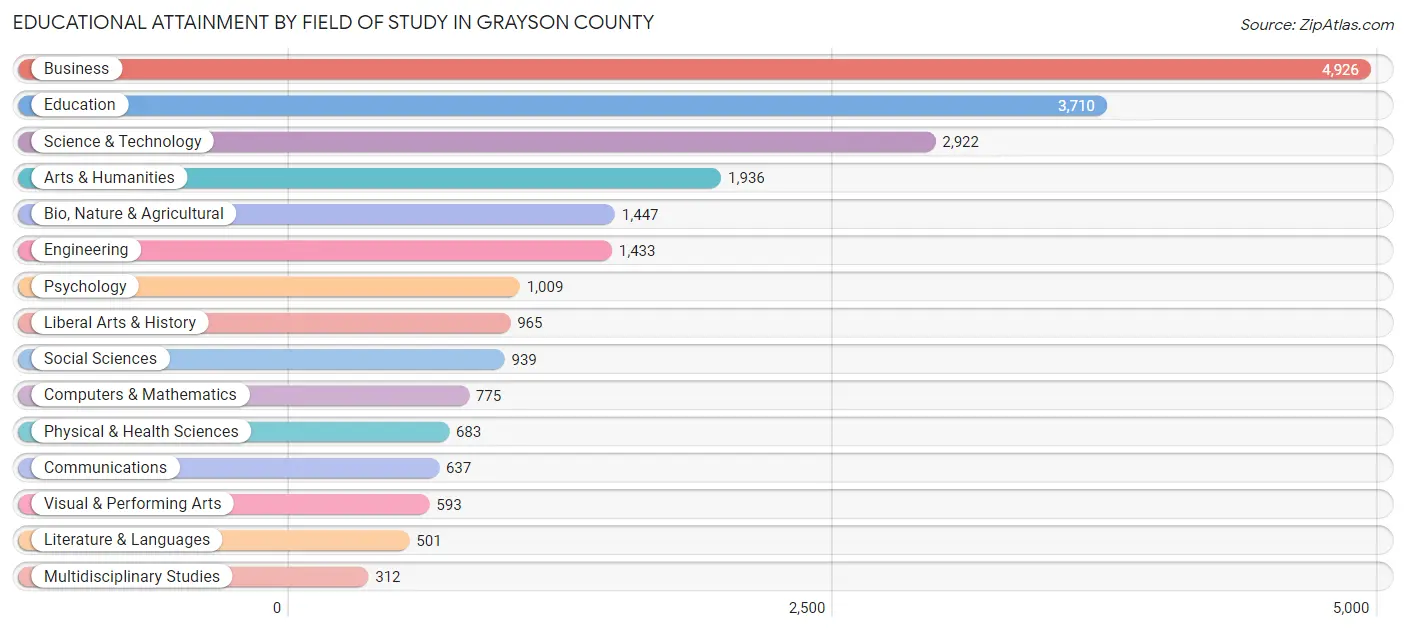
| Field of Study | # Graduates | % Graduates |
| Computers & Mathematics | 775 | 3.4% |
| Bio, Nature & Agricultural | 1,447 | 6.4% |
| Physical & Health Sciences | 683 | 3.0% |
| Psychology | 1,009 | 4.4% |
| Social Sciences | 939 | 4.1% |
| Engineering | 1,433 | 6.3% |
| Multidisciplinary Studies | 312 | 1.4% |
| Science & Technology | 2,922 | 12.8% |
| Business | 4,926 | 21.6% |
| Education | 3,710 | 16.3% |
| Literature & Languages | 501 | 2.2% |
| Liberal Arts & History | 965 | 4.2% |
| Visual & Performing Arts | 593 | 2.6% |
| Communications | 637 | 2.8% |
| Arts & Humanities | 1,936 | 8.5% |
| Total | 22,788 | 100.0% |
Transportation & Commute in Grayson County
Vehicle Availability by Sex in Grayson County
The most prevalent vehicle ownership categories in Grayson County are males with 2 vehicles (14,735, accounting for 43.5%) and females with 2 vehicles (11,482, making up 50.0%).
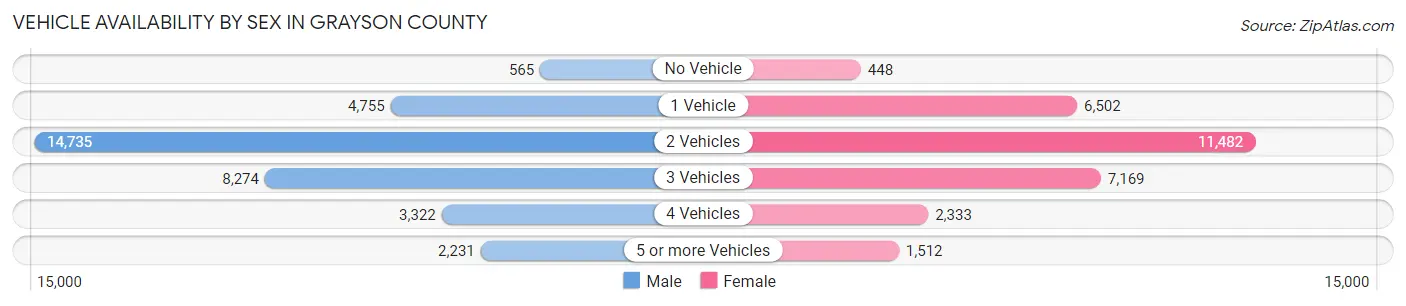
| Vehicles Available | Male | Female |
| No Vehicle | 565 (1.7%) | 448 (1.5%) |
| 1 Vehicle | 4,755 (14.0%) | 6,502 (22.1%) |
| 2 Vehicles | 14,735 (43.5%) | 11,482 (39.0%) |
| 3 Vehicles | 8,274 (24.4%) | 7,169 (24.3%) |
| 4 Vehicles | 3,322 (9.8%) | 2,333 (7.9%) |
| 5 or more Vehicles | 2,231 (6.6%) | 1,512 (5.1%) |
| Total | 33,882 (100.0%) | 29,446 (100.0%) |
Commute Time in Grayson County
The most frequently occuring commute durations in Grayson County are 10 to 14 minutes (9,842 commuters, 17.0%), 15 to 19 minutes (9,153 commuters, 15.8%), and 5 to 9 minutes (7,282 commuters, 12.5%).
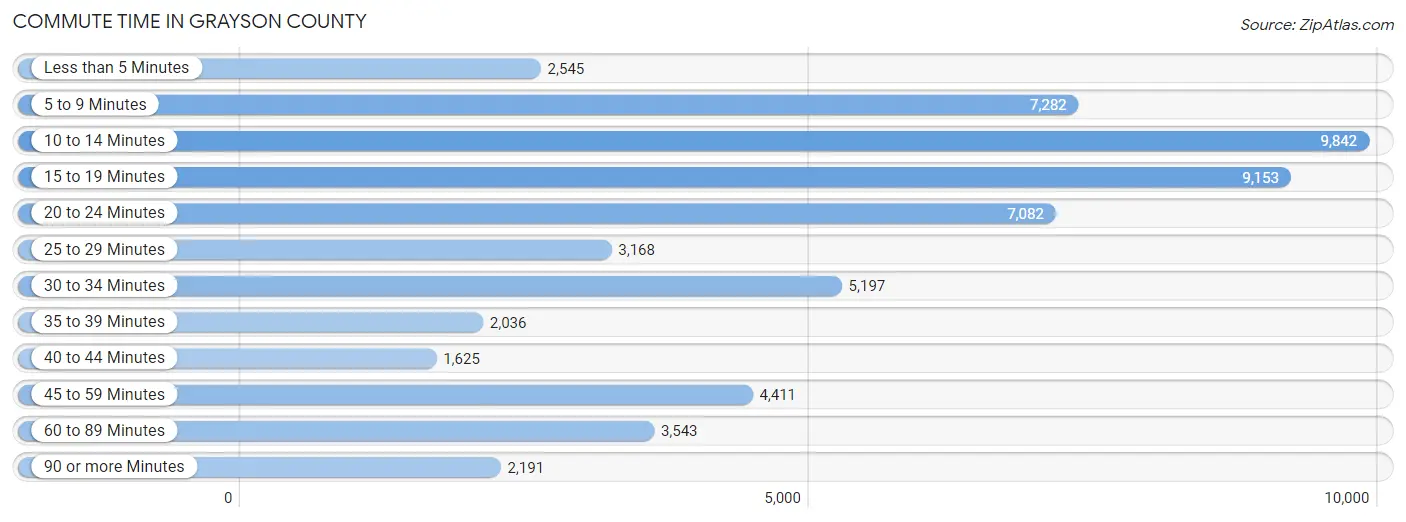
| Commute Time | # Commuters | % Commuters |
| Less than 5 Minutes | 2,545 | 4.4% |
| 5 to 9 Minutes | 7,282 | 12.5% |
| 10 to 14 Minutes | 9,842 | 17.0% |
| 15 to 19 Minutes | 9,153 | 15.8% |
| 20 to 24 Minutes | 7,082 | 12.2% |
| 25 to 29 Minutes | 3,168 | 5.5% |
| 30 to 34 Minutes | 5,197 | 8.9% |
| 35 to 39 Minutes | 2,036 | 3.5% |
| 40 to 44 Minutes | 1,625 | 2.8% |
| 45 to 59 Minutes | 4,411 | 7.6% |
| 60 to 89 Minutes | 3,543 | 6.1% |
| 90 or more Minutes | 2,191 | 3.8% |
Commute Time by Sex in Grayson County
The most common commute times in Grayson County are 10 to 14 minutes (5,152 commuters, 16.3%) for males and 10 to 14 minutes (4,690 commuters, 17.7%) for females.
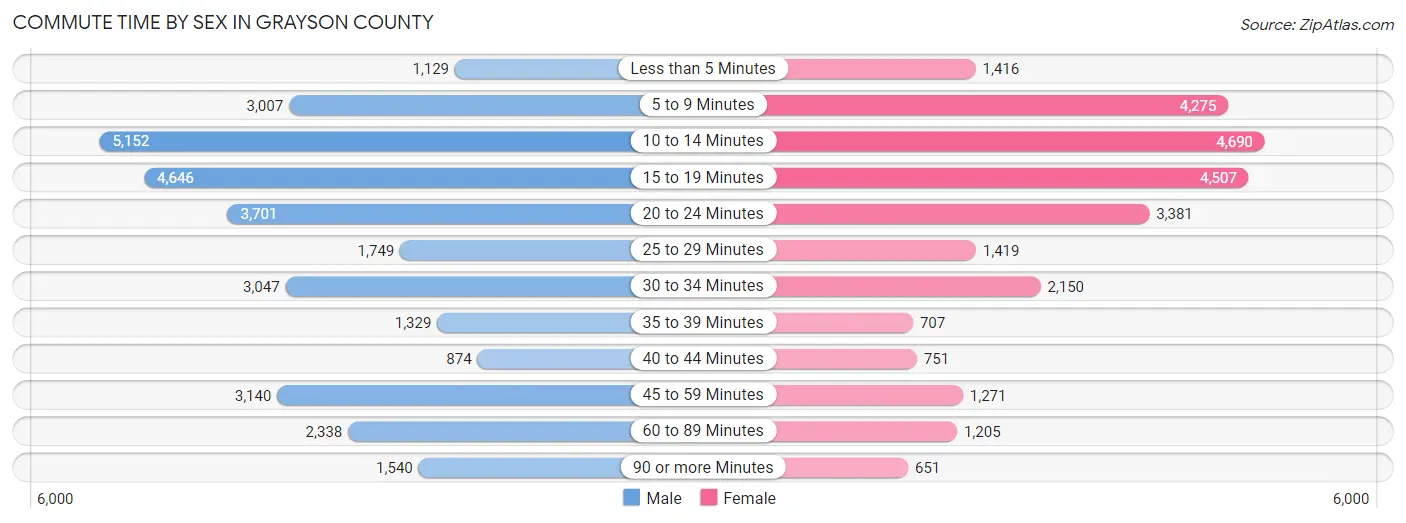
| Commute Time | Male | Female |
| Less than 5 Minutes | 1,129 (3.6%) | 1,416 (5.4%) |
| 5 to 9 Minutes | 3,007 (9.5%) | 4,275 (16.2%) |
| 10 to 14 Minutes | 5,152 (16.3%) | 4,690 (17.7%) |
| 15 to 19 Minutes | 4,646 (14.7%) | 4,507 (17.1%) |
| 20 to 24 Minutes | 3,701 (11.7%) | 3,381 (12.8%) |
| 25 to 29 Minutes | 1,749 (5.5%) | 1,419 (5.4%) |
| 30 to 34 Minutes | 3,047 (9.6%) | 2,150 (8.1%) |
| 35 to 39 Minutes | 1,329 (4.2%) | 707 (2.7%) |
| 40 to 44 Minutes | 874 (2.8%) | 751 (2.8%) |
| 45 to 59 Minutes | 3,140 (9.9%) | 1,271 (4.8%) |
| 60 to 89 Minutes | 2,338 (7.4%) | 1,205 (4.6%) |
| 90 or more Minutes | 1,540 (4.9%) | 651 (2.5%) |
Time of Departure to Work by Sex in Grayson County
The most frequent times of departure to work in Grayson County are 7:00 AM to 7:29 AM (4,830, 15.3%) for males and 7:00 AM to 7:29 AM (4,641, 17.6%) for females.
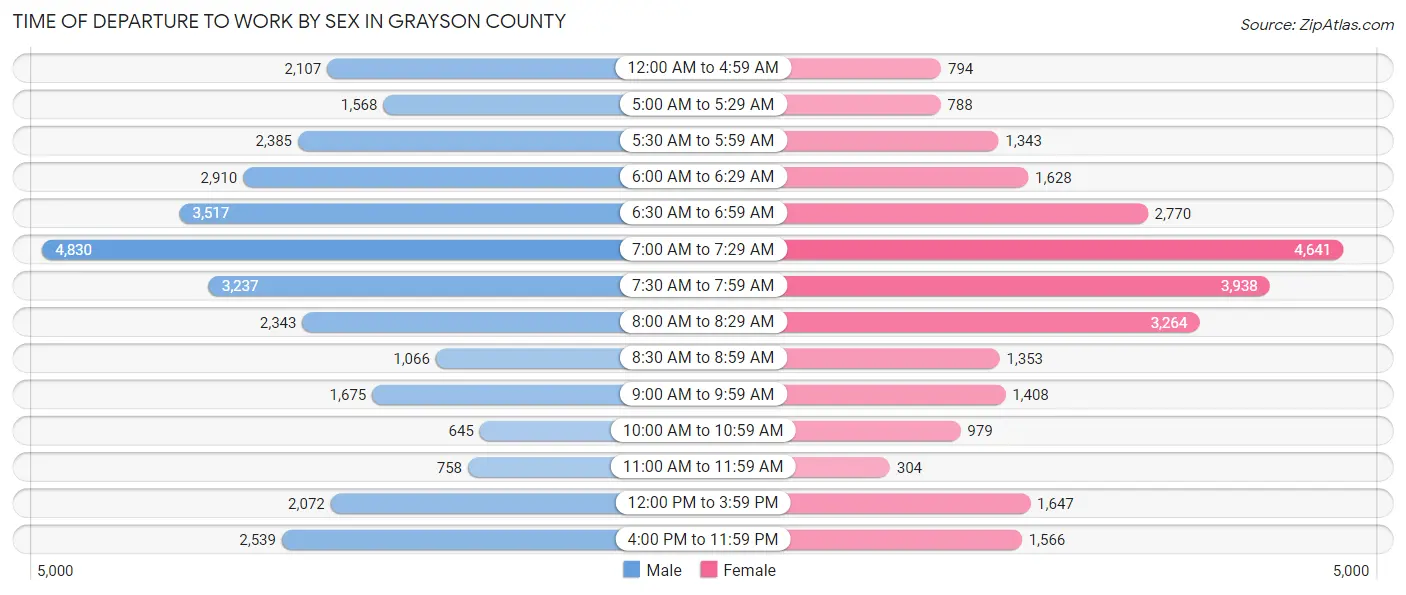
| Time of Departure | Male | Female |
| 12:00 AM to 4:59 AM | 2,107 (6.7%) | 794 (3.0%) |
| 5:00 AM to 5:29 AM | 1,568 (5.0%) | 788 (3.0%) |
| 5:30 AM to 5:59 AM | 2,385 (7.5%) | 1,343 (5.1%) |
| 6:00 AM to 6:29 AM | 2,910 (9.2%) | 1,628 (6.2%) |
| 6:30 AM to 6:59 AM | 3,517 (11.1%) | 2,770 (10.5%) |
| 7:00 AM to 7:29 AM | 4,830 (15.3%) | 4,641 (17.6%) |
| 7:30 AM to 7:59 AM | 3,237 (10.2%) | 3,938 (14.9%) |
| 8:00 AM to 8:29 AM | 2,343 (7.4%) | 3,264 (12.3%) |
| 8:30 AM to 8:59 AM | 1,066 (3.4%) | 1,353 (5.1%) |
| 9:00 AM to 9:59 AM | 1,675 (5.3%) | 1,408 (5.3%) |
| 10:00 AM to 10:59 AM | 645 (2.0%) | 979 (3.7%) |
| 11:00 AM to 11:59 AM | 758 (2.4%) | 304 (1.1%) |
| 12:00 PM to 3:59 PM | 2,072 (6.6%) | 1,647 (6.2%) |
| 4:00 PM to 11:59 PM | 2,539 (8.0%) | 1,566 (5.9%) |
| Total | 31,652 (100.0%) | 26,423 (100.0%) |
Housing Occupancy in Grayson County
Occupancy by Ownership in Grayson County
Of the total 52,084 dwellings in Grayson County, owner-occupied units account for 34,954 (67.1%), while renter-occupied units make up 17,130 (32.9%).
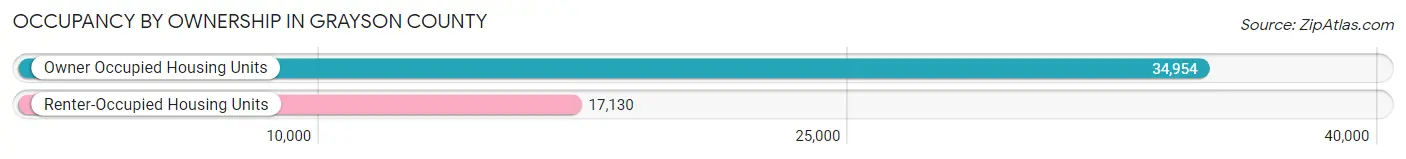
| Occupancy | # Housing Units | % Housing Units |
| Owner Occupied Housing Units | 34,954 | 67.1% |
| Renter-Occupied Housing Units | 17,130 | 32.9% |
| Total Occupied Housing Units | 52,084 | 100.0% |
Occupancy by Household Size in Grayson County
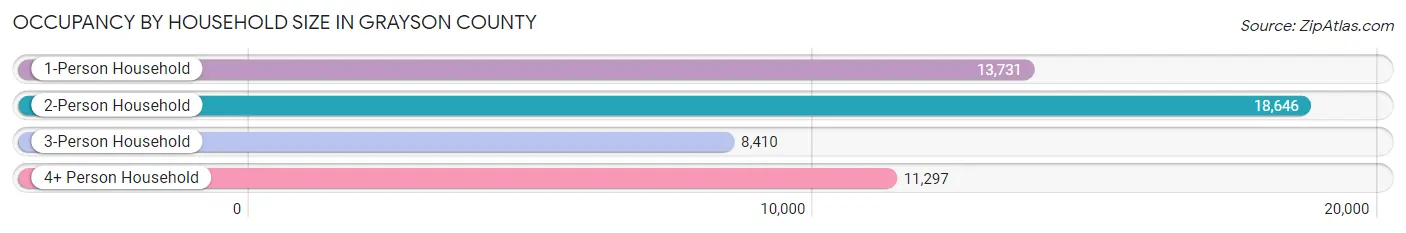
| Household Size | # Housing Units | % Housing Units |
| 1-Person Household | 13,731 | 26.4% |
| 2-Person Household | 18,646 | 35.8% |
| 3-Person Household | 8,410 | 16.2% |
| 4+ Person Household | 11,297 | 21.7% |
| Total Housing Units | 52,084 | 100.0% |
Occupancy by Ownership by Household Size in Grayson County
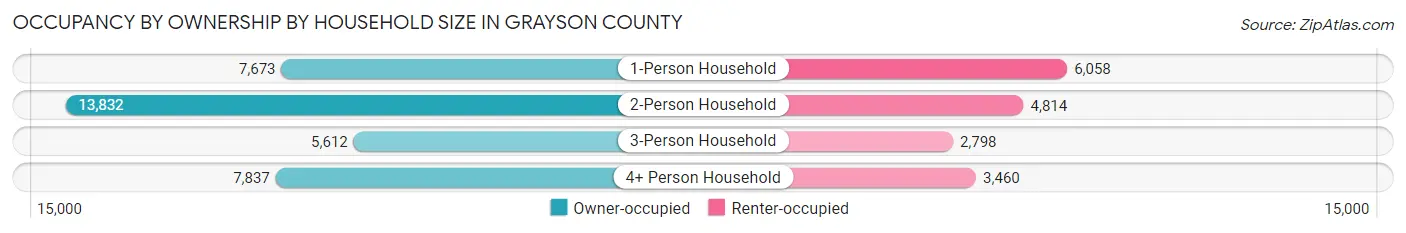
| Household Size | Owner-occupied | Renter-occupied |
| 1-Person Household | 7,673 (55.9%) | 6,058 (44.1%) |
| 2-Person Household | 13,832 (74.2%) | 4,814 (25.8%) |
| 3-Person Household | 5,612 (66.7%) | 2,798 (33.3%) |
| 4+ Person Household | 7,837 (69.4%) | 3,460 (30.6%) |
| Total Housing Units | 34,954 (67.1%) | 17,130 (32.9%) |
Occupancy by Educational Attainment in Grayson County
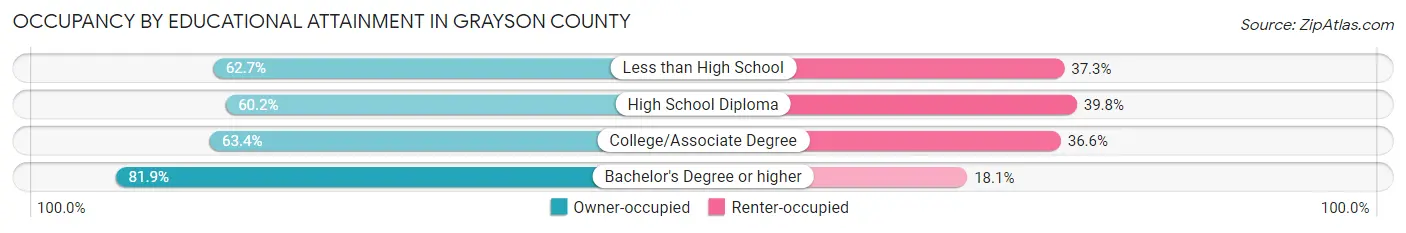
| Household Size | Owner-occupied | Renter-occupied |
| Less than High School | 2,674 (62.7%) | 1,591 (37.3%) |
| High School Diploma | 7,916 (60.2%) | 5,230 (39.8%) |
| College/Associate Degree | 13,845 (63.4%) | 7,991 (36.6%) |
| Bachelor's Degree or higher | 10,519 (81.9%) | 2,318 (18.1%) |
Occupancy by Age of Householder in Grayson County
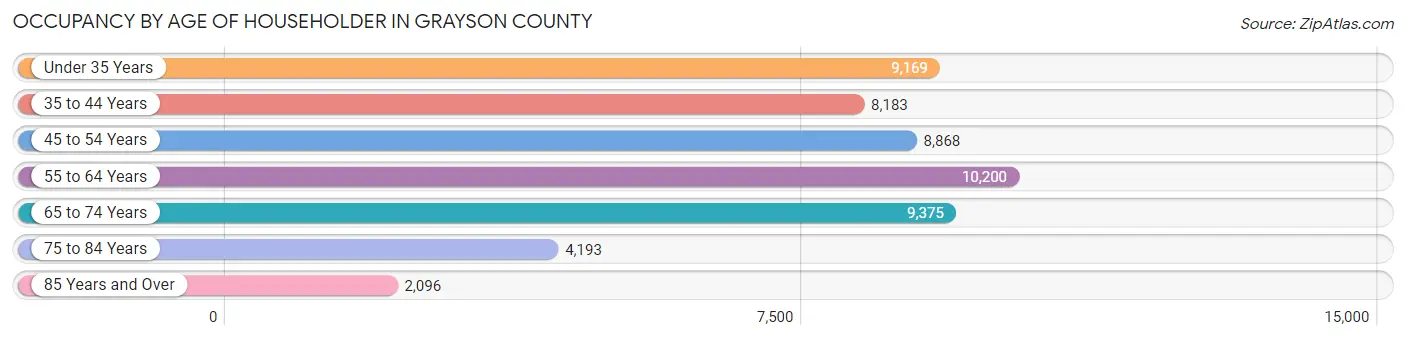
| Age Bracket | # Households | % Households |
| Under 35 Years | 9,169 | 17.6% |
| 35 to 44 Years | 8,183 | 15.7% |
| 45 to 54 Years | 8,868 | 17.0% |
| 55 to 64 Years | 10,200 | 19.6% |
| 65 to 74 Years | 9,375 | 18.0% |
| 75 to 84 Years | 4,193 | 8.1% |
| 85 Years and Over | 2,096 | 4.0% |
| Total | 52,084 | 100.0% |
Housing Finances in Grayson County
Median Income by Occupancy in Grayson County
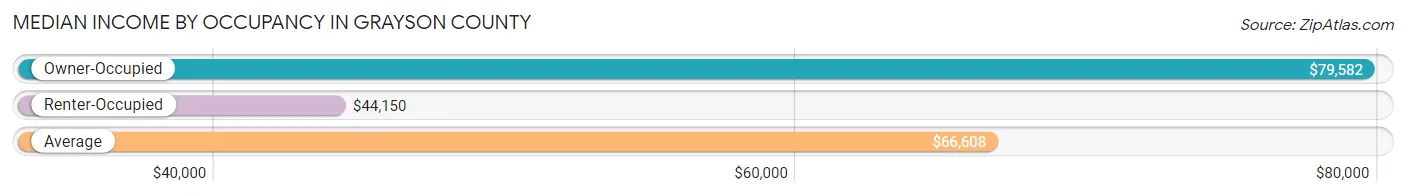
| Occupancy Type | # Households | Median Income |
| Owner-Occupied | 34,954 (67.1%) | $79,582 |
| Renter-Occupied | 17,130 (32.9%) | $44,150 |
| Average | 52,084 (100.0%) | $66,608 |
Occupancy by Householder Income Bracket in Grayson County
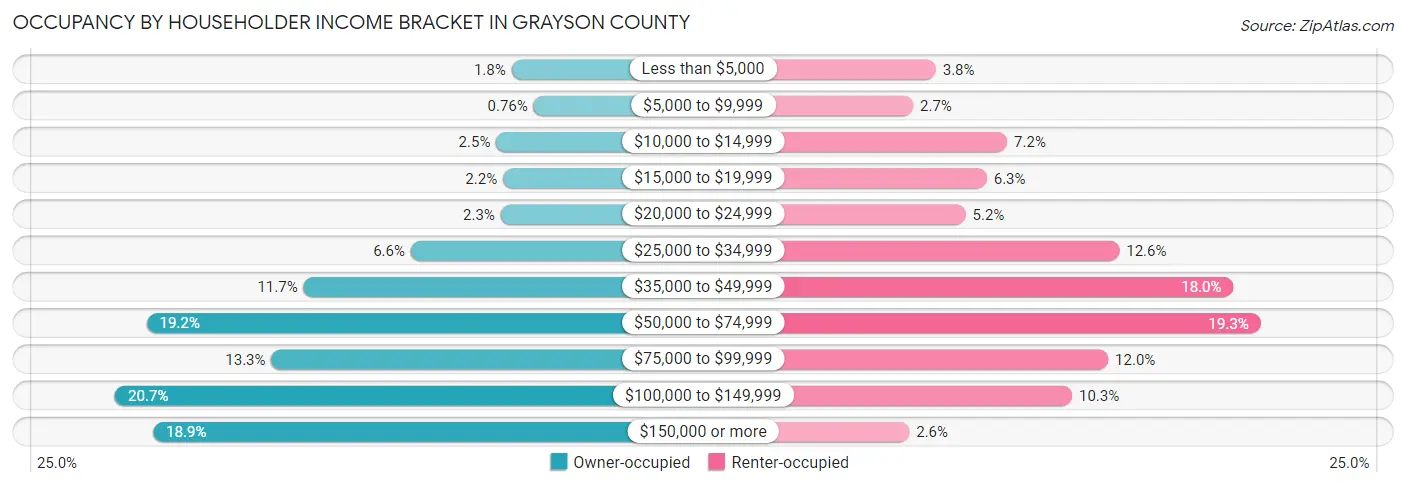
| Income Bracket | Owner-occupied | Renter-occupied |
| Less than $5,000 | 634 (1.8%) | 654 (3.8%) |
| $5,000 to $9,999 | 265 (0.8%) | 469 (2.7%) |
| $10,000 to $14,999 | 888 (2.5%) | 1,236 (7.2%) |
| $15,000 to $19,999 | 777 (2.2%) | 1,070 (6.2%) |
| $20,000 to $24,999 | 813 (2.3%) | 898 (5.2%) |
| $25,000 to $34,999 | 2,310 (6.6%) | 2,151 (12.6%) |
| $35,000 to $49,999 | 4,095 (11.7%) | 3,082 (18.0%) |
| $50,000 to $74,999 | 6,709 (19.2%) | 3,304 (19.3%) |
| $75,000 to $99,999 | 4,632 (13.3%) | 2,061 (12.0%) |
| $100,000 to $149,999 | 7,231 (20.7%) | 1,766 (10.3%) |
| $150,000 or more | 6,600 (18.9%) | 439 (2.6%) |
| Total | 34,954 (100.0%) | 17,130 (100.0%) |
Monthly Housing Cost Tiers in Grayson County
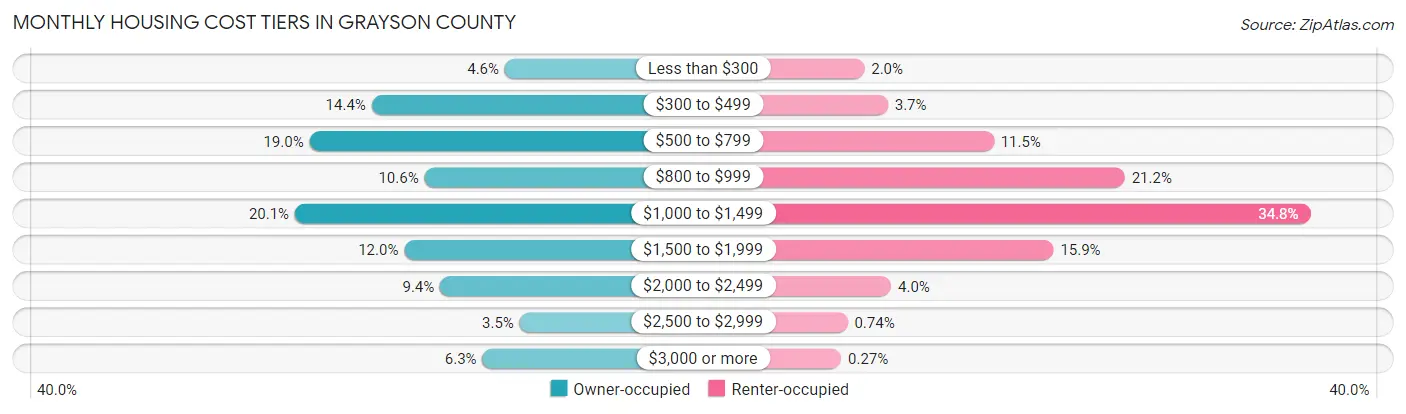
| Monthly Cost | Owner-occupied | Renter-occupied |
| Less than $300 | 1,620 (4.6%) | 339 (2.0%) |
| $300 to $499 | 5,048 (14.4%) | 636 (3.7%) |
| $500 to $799 | 6,649 (19.0%) | 1,971 (11.5%) |
| $800 to $999 | 3,688 (10.5%) | 3,624 (21.2%) |
| $1,000 to $1,499 | 7,021 (20.1%) | 5,967 (34.8%) |
| $1,500 to $1,999 | 4,210 (12.0%) | 2,726 (15.9%) |
| $2,000 to $2,499 | 3,287 (9.4%) | 676 (4.0%) |
| $2,500 to $2,999 | 1,236 (3.5%) | 127 (0.7%) |
| $3,000 or more | 2,195 (6.3%) | 47 (0.3%) |
| Total | 34,954 (100.0%) | 17,130 (100.0%) |
Physical Housing Characteristics in Grayson County
Housing Structures in Grayson County
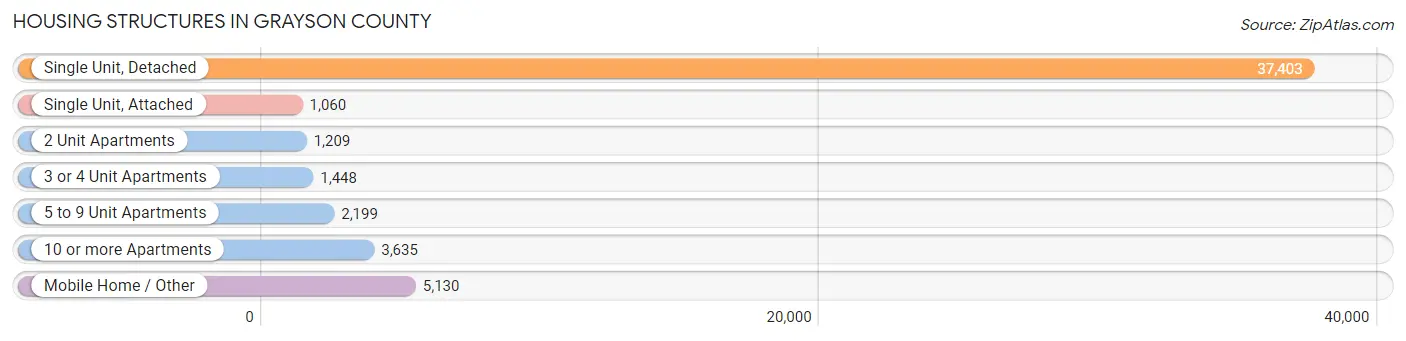
| Structure Type | # Housing Units | % Housing Units |
| Single Unit, Detached | 37,403 | 71.8% |
| Single Unit, Attached | 1,060 | 2.0% |
| 2 Unit Apartments | 1,209 | 2.3% |
| 3 or 4 Unit Apartments | 1,448 | 2.8% |
| 5 to 9 Unit Apartments | 2,199 | 4.2% |
| 10 or more Apartments | 3,635 | 7.0% |
| Mobile Home / Other | 5,130 | 9.9% |
| Total | 52,084 | 100.0% |
Housing Structures by Occupancy in Grayson County
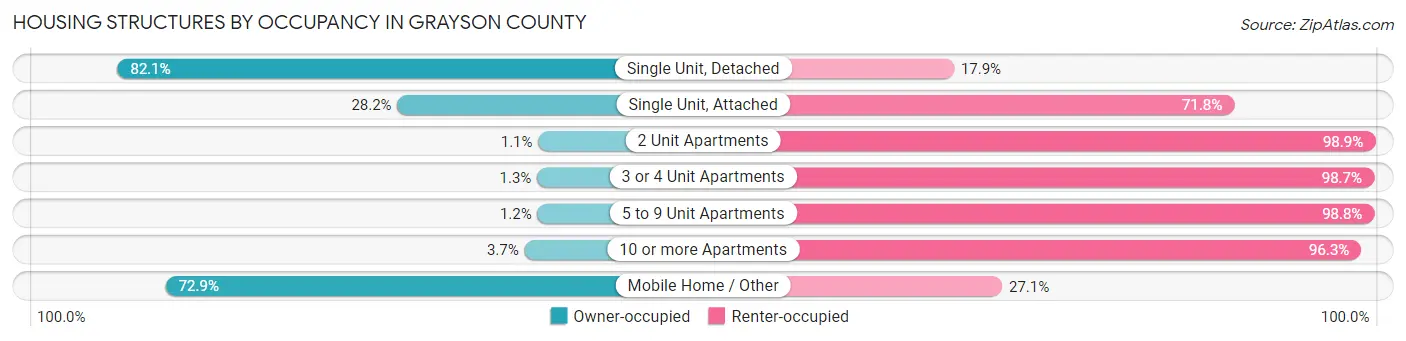
| Structure Type | Owner-occupied | Renter-occupied |
| Single Unit, Detached | 30,722 (82.1%) | 6,681 (17.9%) |
| Single Unit, Attached | 299 (28.2%) | 761 (71.8%) |
| 2 Unit Apartments | 13 (1.1%) | 1,196 (98.9%) |
| 3 or 4 Unit Apartments | 19 (1.3%) | 1,429 (98.7%) |
| 5 to 9 Unit Apartments | 27 (1.2%) | 2,172 (98.8%) |
| 10 or more Apartments | 136 (3.7%) | 3,499 (96.3%) |
| Mobile Home / Other | 3,738 (72.9%) | 1,392 (27.1%) |
| Total | 34,954 (67.1%) | 17,130 (32.9%) |
Housing Structures by Number of Rooms in Grayson County
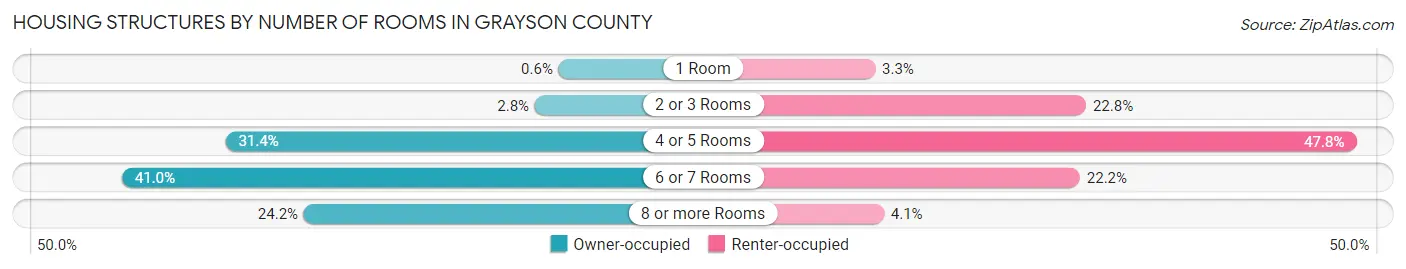
| Number of Rooms | Owner-occupied | Renter-occupied |
| 1 Room | 211 (0.6%) | 556 (3.3%) |
| 2 or 3 Rooms | 978 (2.8%) | 3,898 (22.8%) |
| 4 or 5 Rooms | 10,981 (31.4%) | 8,179 (47.7%) |
| 6 or 7 Rooms | 14,335 (41.0%) | 3,801 (22.2%) |
| 8 or more Rooms | 8,449 (24.2%) | 696 (4.1%) |
| Total | 34,954 (100.0%) | 17,130 (100.0%) |
Housing Structure by Heating Type in Grayson County
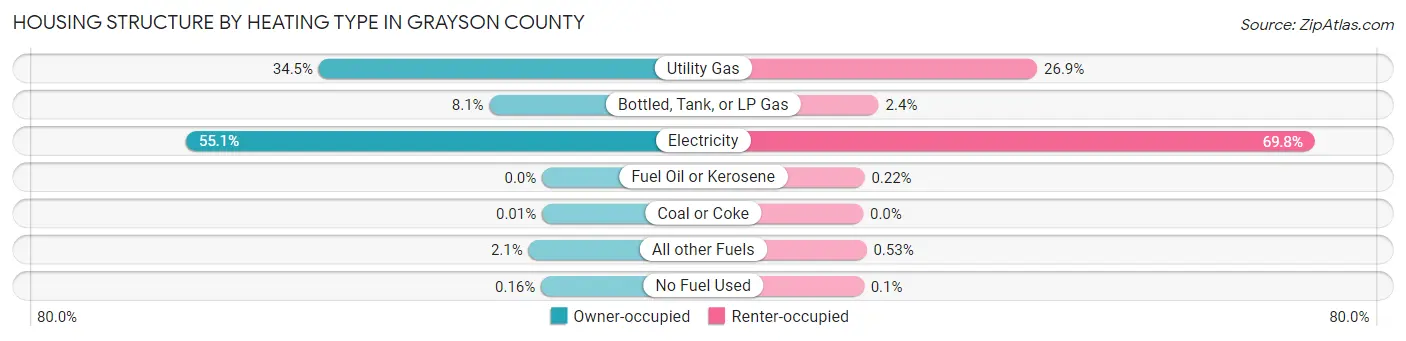
| Heating Type | Owner-occupied | Renter-occupied |
| Utility Gas | 12,064 (34.5%) | 4,610 (26.9%) |
| Bottled, Tank, or LP Gas | 2,844 (8.1%) | 413 (2.4%) |
| Electricity | 19,253 (55.1%) | 11,962 (69.8%) |
| Fuel Oil or Kerosene | 0 (0.0%) | 37 (0.2%) |
| Coal or Coke | 4 (0.0%) | 0 (0.0%) |
| All other Fuels | 732 (2.1%) | 91 (0.5%) |
| No Fuel Used | 57 (0.2%) | 17 (0.1%) |
| Total | 34,954 (100.0%) | 17,130 (100.0%) |
Household Vehicle Usage in Grayson County
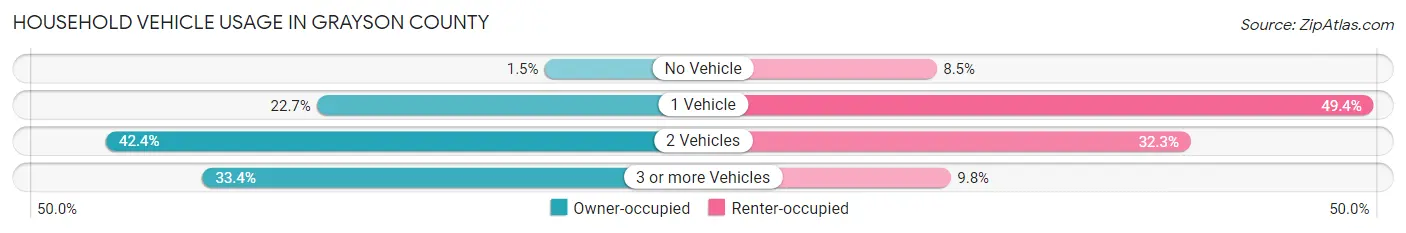
| Vehicles per Household | Owner-occupied | Renter-occupied |
| No Vehicle | 519 (1.5%) | 1,461 (8.5%) |
| 1 Vehicle | 7,949 (22.7%) | 8,454 (49.3%) |
| 2 Vehicles | 14,816 (42.4%) | 5,530 (32.3%) |
| 3 or more Vehicles | 11,670 (33.4%) | 1,685 (9.8%) |
| Total | 34,954 (100.0%) | 17,130 (100.0%) |
Real Estate & Mortgages in Grayson County
Real Estate and Mortgage Overview in Grayson County
| Characteristic | Without Mortgage | With Mortgage |
| Housing Units | 16,715 | 18,239 |
| Median Property Value | $179,200 | $234,500 |
| Median Household Income | $62,740 | $4,531 |
| Monthly Housing Costs | $576 | $2,158 |
| Real Estate Taxes | $1,850 | $459 |
Property Value by Mortgage Status in Grayson County
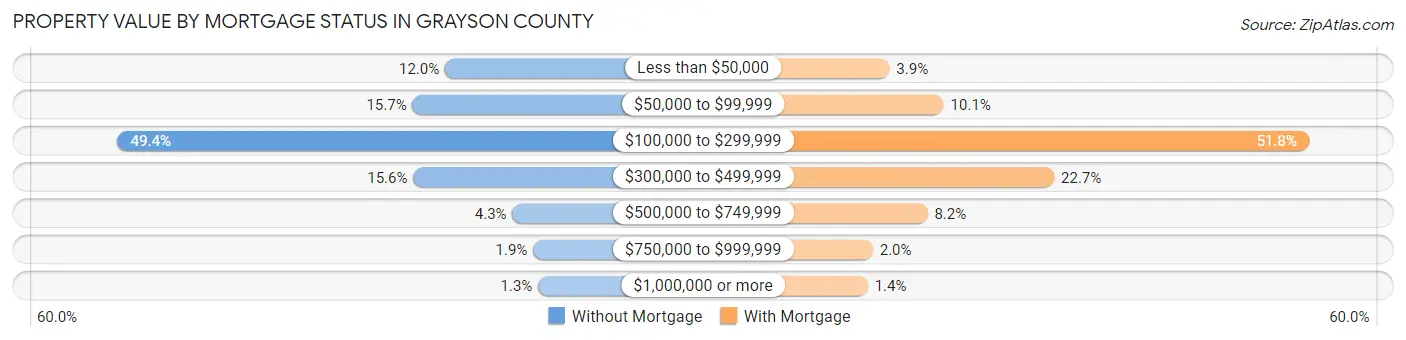
| Property Value | Without Mortgage | With Mortgage |
| Less than $50,000 | 1,997 (11.9%) | 705 (3.9%) |
| $50,000 to $99,999 | 2,620 (15.7%) | 1,837 (10.1%) |
| $100,000 to $299,999 | 8,250 (49.4%) | 9,446 (51.8%) |
| $300,000 to $499,999 | 2,605 (15.6%) | 4,138 (22.7%) |
| $500,000 to $749,999 | 710 (4.3%) | 1,499 (8.2%) |
| $750,000 to $999,999 | 314 (1.9%) | 360 (2.0%) |
| $1,000,000 or more | 219 (1.3%) | 254 (1.4%) |
| Total | 16,715 (100.0%) | 18,239 (100.0%) |
Household Income by Mortgage Status in Grayson County
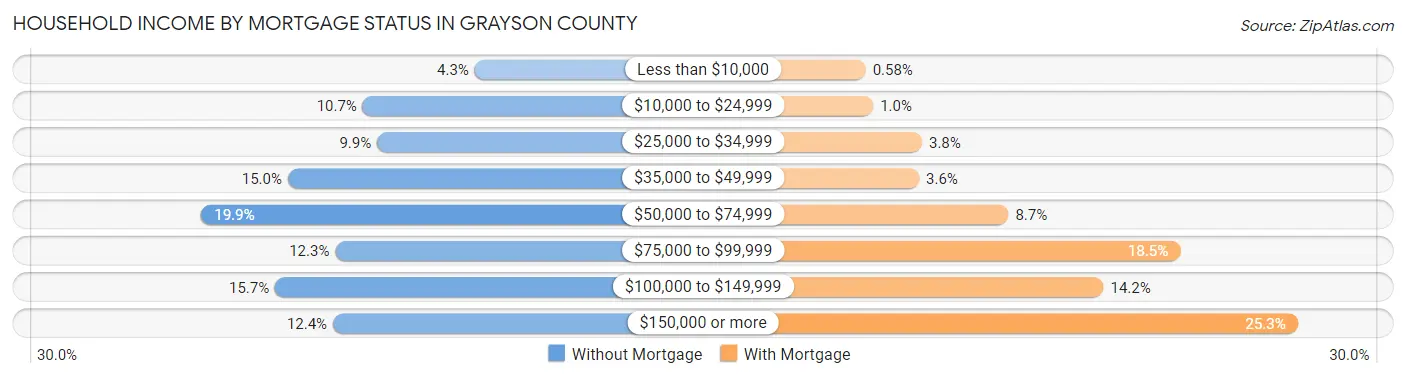
| Household Income | Without Mortgage | With Mortgage |
| Less than $10,000 | 715 (4.3%) | 106 (0.6%) |
| $10,000 to $24,999 | 1,785 (10.7%) | 184 (1.0%) |
| $25,000 to $34,999 | 1,648 (9.9%) | 693 (3.8%) |
| $35,000 to $49,999 | 2,500 (15.0%) | 662 (3.6%) |
| $50,000 to $74,999 | 3,327 (19.9%) | 1,595 (8.7%) |
| $75,000 to $99,999 | 2,048 (12.2%) | 3,382 (18.5%) |
| $100,000 to $149,999 | 2,623 (15.7%) | 2,584 (14.2%) |
| $150,000 or more | 2,069 (12.4%) | 4,608 (25.3%) |
| Total | 16,715 (100.0%) | 18,239 (100.0%) |
Property Value to Household Income Ratio in Grayson County
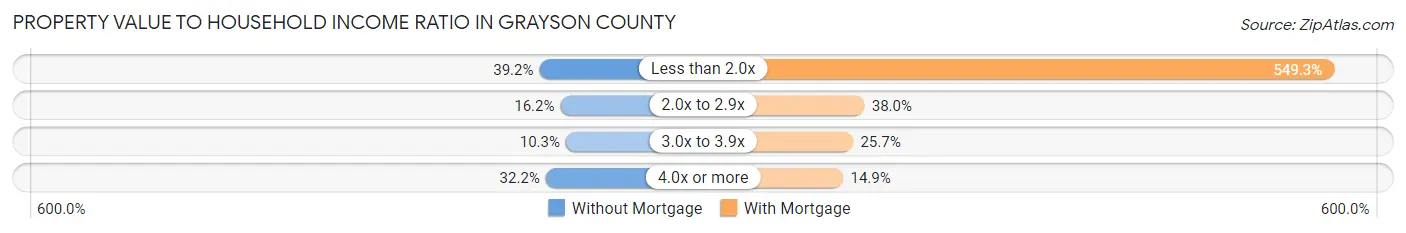
| Value-to-Income Ratio | Without Mortgage | With Mortgage |
| Less than 2.0x | 6,551 (39.2%) | 100,192 (549.3%) |
| 2.0x to 2.9x | 2,713 (16.2%) | 6,929 (38.0%) |
| 3.0x to 3.9x | 1,721 (10.3%) | 4,682 (25.7%) |
| 4.0x or more | 5,385 (32.2%) | 2,714 (14.9%) |
| Total | 16,715 (100.0%) | 18,239 (100.0%) |
Real Estate Taxes by Mortgage Status in Grayson County
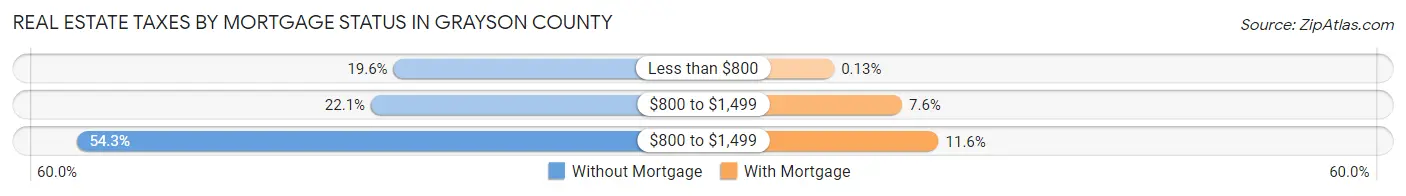
| Property Taxes | Without Mortgage | With Mortgage |
| Less than $800 | 3,273 (19.6%) | 24 (0.1%) |
| $800 to $1,499 | 3,686 (22.1%) | 1,380 (7.6%) |
| $800 to $1,499 | 9,078 (54.3%) | 2,110 (11.6%) |
| Total | 16,715 (100.0%) | 18,239 (100.0%) |
Health & Disability in Grayson County
Health Insurance Coverage by Age in Grayson County
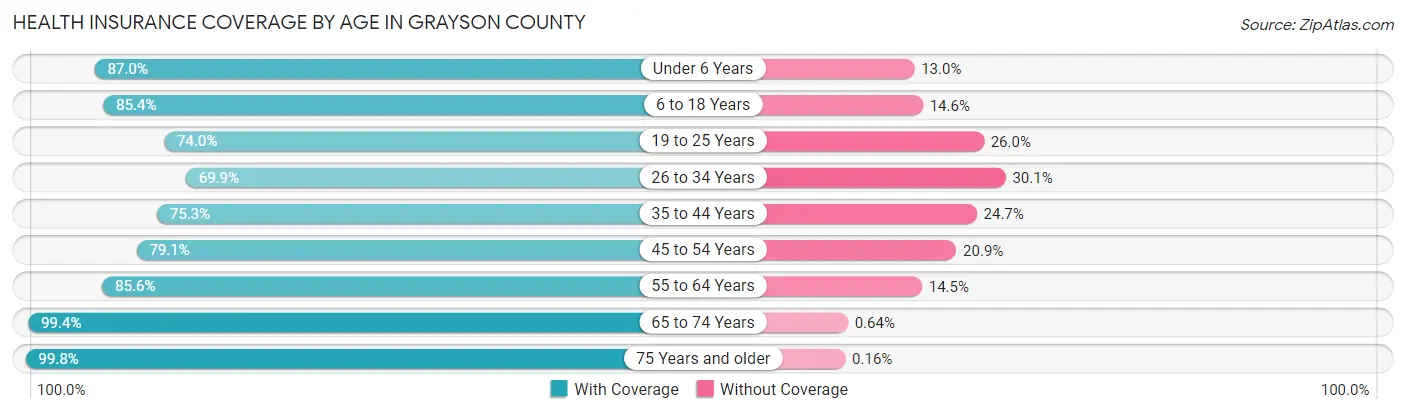
| Age Bracket | With Coverage | Without Coverage |
| Under 6 Years | 8,721 (87.0%) | 1,308 (13.0%) |
| 6 to 18 Years | 20,719 (85.4%) | 3,550 (14.6%) |
| 19 to 25 Years | 8,602 (74.0%) | 3,022 (26.0%) |
| 26 to 34 Years | 10,382 (69.9%) | 4,462 (30.1%) |
| 35 to 44 Years | 12,157 (75.3%) | 3,981 (24.7%) |
| 45 to 54 Years | 13,062 (79.1%) | 3,442 (20.9%) |
| 55 to 64 Years | 15,803 (85.6%) | 2,669 (14.4%) |
| 65 to 74 Years | 14,395 (99.4%) | 93 (0.6%) |
| 75 Years and older | 9,427 (99.8%) | 15 (0.2%) |
| Total | 113,268 (83.4%) | 22,542 (16.6%) |
Health Insurance Coverage by Citizenship Status in Grayson County
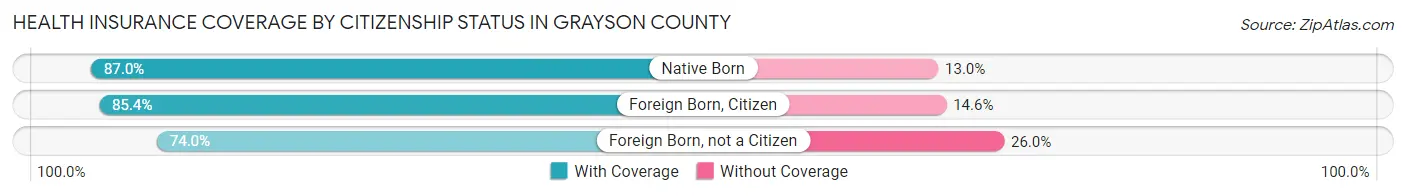
| Citizenship Status | With Coverage | Without Coverage |
| Native Born | 8,721 (87.0%) | 1,308 (13.0%) |
| Foreign Born, Citizen | 20,719 (85.4%) | 3,550 (14.6%) |
| Foreign Born, not a Citizen | 8,602 (74.0%) | 3,022 (26.0%) |
Health Insurance Coverage by Household Income in Grayson County
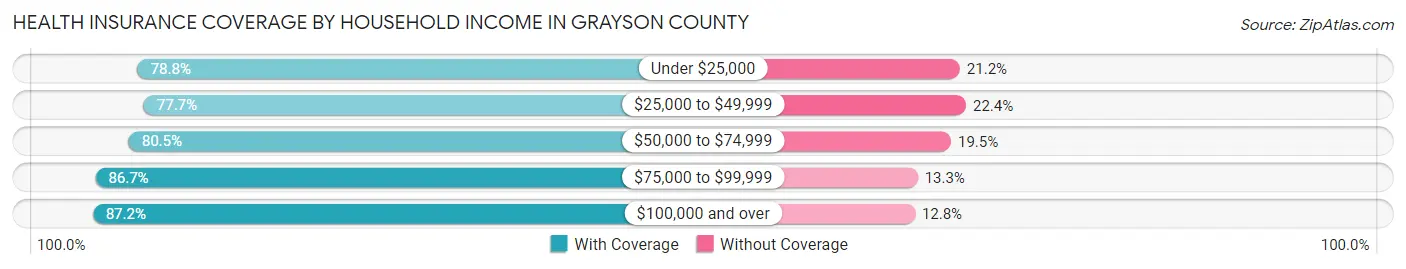
| Household Income | With Coverage | Without Coverage |
| Under $25,000 | 10,627 (78.8%) | 2,858 (21.2%) |
| $25,000 to $49,999 | 19,216 (77.6%) | 5,532 (22.4%) |
| $50,000 to $74,999 | 19,503 (80.5%) | 4,734 (19.5%) |
| $75,000 to $99,999 | 17,005 (86.7%) | 2,605 (13.3%) |
| $100,000 and over | 45,806 (87.2%) | 6,704 (12.8%) |
Public vs Private Health Insurance Coverage by Age in Grayson County
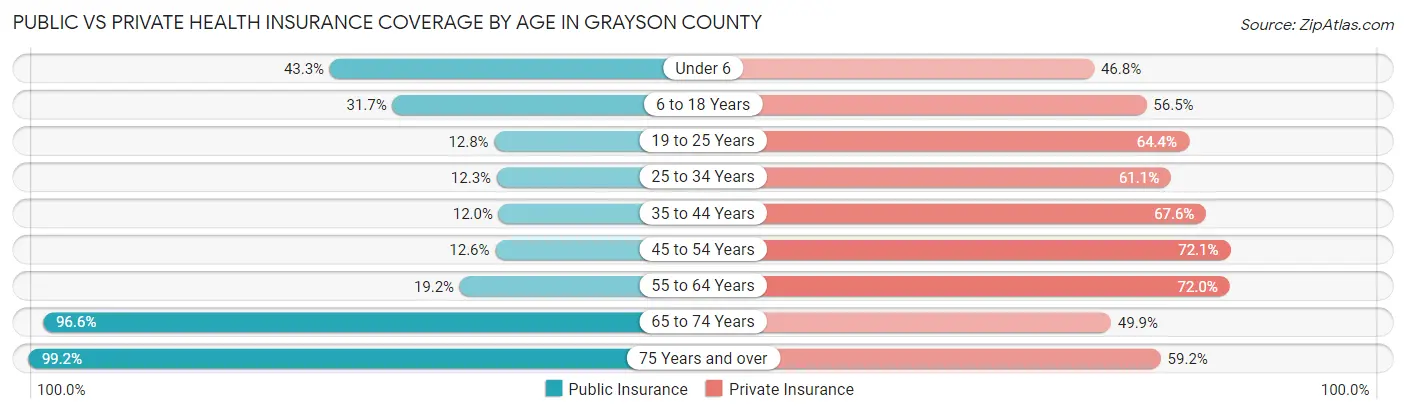
| Age Bracket | Public Insurance | Private Insurance |
| Under 6 | 4,345 (43.3%) | 4,695 (46.8%) |
| 6 to 18 Years | 7,695 (31.7%) | 13,721 (56.5%) |
| 19 to 25 Years | 1,487 (12.8%) | 7,487 (64.4%) |
| 25 to 34 Years | 1,831 (12.3%) | 9,070 (61.1%) |
| 35 to 44 Years | 1,933 (12.0%) | 10,914 (67.6%) |
| 45 to 54 Years | 2,083 (12.6%) | 11,902 (72.1%) |
| 55 to 64 Years | 3,545 (19.2%) | 13,298 (72.0%) |
| 65 to 74 Years | 13,993 (96.6%) | 7,235 (49.9%) |
| 75 Years and over | 9,369 (99.2%) | 5,589 (59.2%) |
| Total | 46,281 (34.1%) | 83,911 (61.8%) |
Disability Status by Sex by Age in Grayson County
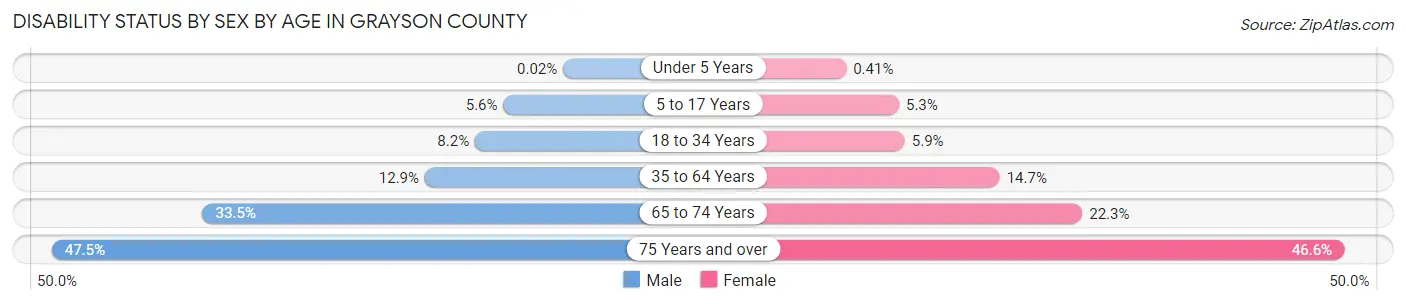
| Age Bracket | Male | Female |
| Under 5 Years | 1 (0.0%) | 17 (0.4%) |
| 5 to 17 Years | 692 (5.6%) | 621 (5.3%) |
| 18 to 34 Years | 1,158 (8.2%) | 826 (5.9%) |
| 35 to 64 Years | 3,221 (12.9%) | 3,818 (14.7%) |
| 65 to 74 Years | 2,297 (33.5%) | 1,702 (22.3%) |
| 75 Years and over | 1,914 (47.5%) | 2,521 (46.6%) |
Disability Class by Sex by Age in Grayson County
Disability Class: Hearing Difficulty

| Age Bracket | Male | Female |
| Under 5 Years | 0 (0.0%) | 17 (0.4%) |
| 5 to 17 Years | 78 (0.6%) | 63 (0.5%) |
| 18 to 34 Years | 227 (1.6%) | 76 (0.5%) |
| 35 to 64 Years | 741 (3.0%) | 590 (2.3%) |
| 65 to 74 Years | 872 (12.7%) | 506 (6.6%) |
| 75 Years and over | 1,266 (31.4%) | 829 (15.3%) |
Disability Class: Vision Difficulty
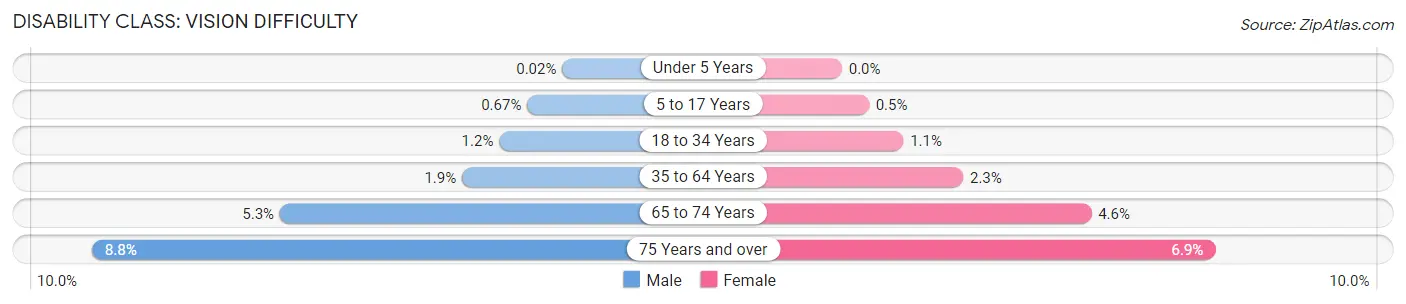
| Age Bracket | Male | Female |
| Under 5 Years | 1 (0.0%) | 0 (0.0%) |
| 5 to 17 Years | 83 (0.7%) | 58 (0.5%) |
| 18 to 34 Years | 168 (1.2%) | 161 (1.1%) |
| 35 to 64 Years | 471 (1.9%) | 586 (2.2%) |
| 65 to 74 Years | 361 (5.3%) | 353 (4.6%) |
| 75 Years and over | 353 (8.7%) | 375 (6.9%) |
Disability Class: Cognitive Difficulty
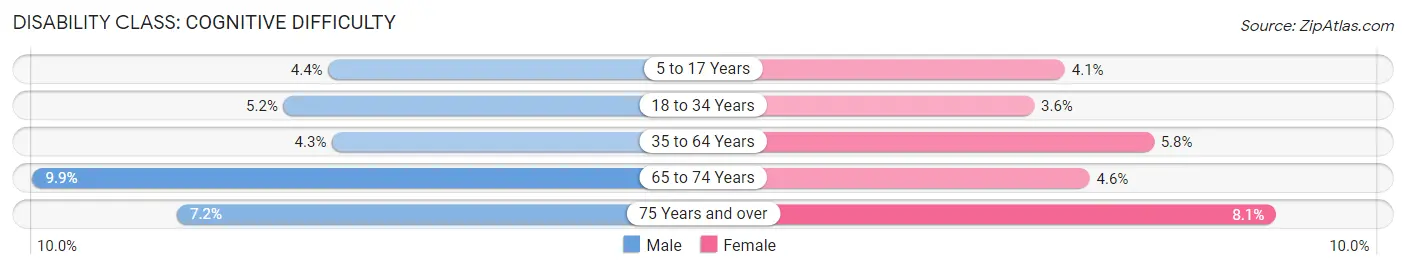
| Age Bracket | Male | Female |
| 5 to 17 Years | 541 (4.4%) | 484 (4.1%) |
| 18 to 34 Years | 733 (5.2%) | 504 (3.6%) |
| 35 to 64 Years | 1,076 (4.3%) | 1,507 (5.8%) |
| 65 to 74 Years | 676 (9.9%) | 351 (4.6%) |
| 75 Years and over | 289 (7.2%) | 436 (8.1%) |
Disability Class: Ambulatory Difficulty
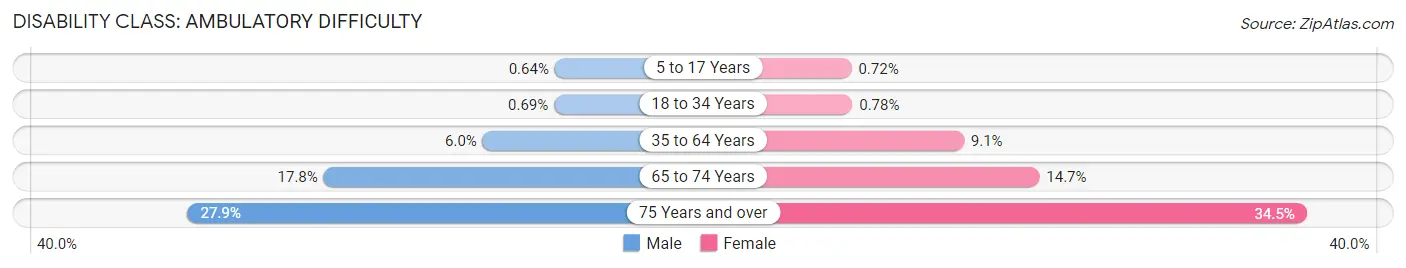
| Age Bracket | Male | Female |
| 5 to 17 Years | 80 (0.6%) | 84 (0.7%) |
| 18 to 34 Years | 97 (0.7%) | 110 (0.8%) |
| 35 to 64 Years | 1,503 (6.0%) | 2,359 (9.1%) |
| 65 to 74 Years | 1,221 (17.8%) | 1,119 (14.7%) |
| 75 Years and over | 1,125 (27.9%) | 1,867 (34.5%) |
Disability Class: Self-Care Difficulty
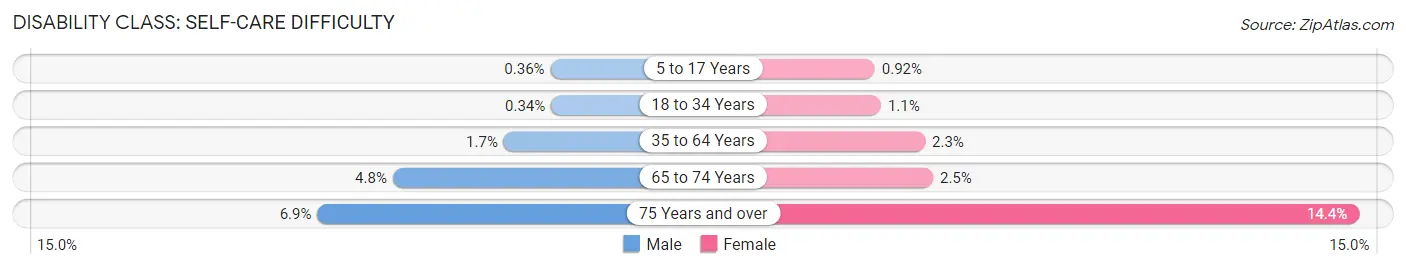
| Age Bracket | Male | Female |
| 5 to 17 Years | 45 (0.4%) | 108 (0.9%) |
| 18 to 34 Years | 48 (0.3%) | 154 (1.1%) |
| 35 to 64 Years | 417 (1.7%) | 605 (2.3%) |
| 65 to 74 Years | 326 (4.8%) | 194 (2.5%) |
| 75 Years and over | 276 (6.9%) | 779 (14.4%) |
Technology Access in Grayson County
Computing Device Access in Grayson County
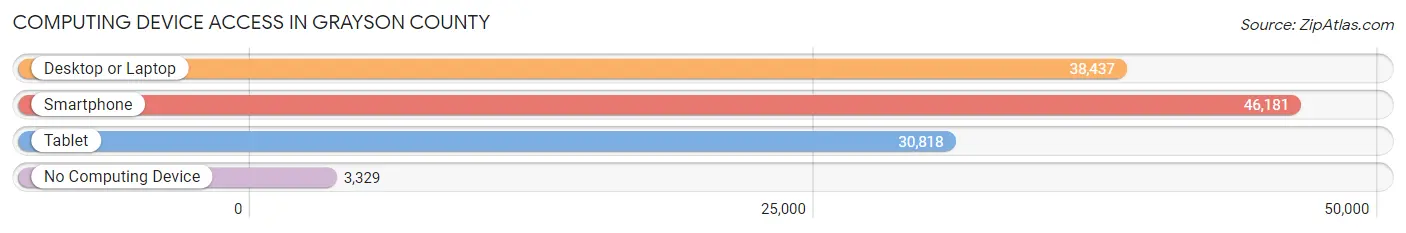
| Device Type | # Households | % Households |
| Desktop or Laptop | 38,437 | 73.8% |
| Smartphone | 46,181 | 88.7% |
| Tablet | 30,818 | 59.2% |
| No Computing Device | 3,329 | 6.4% |
| Total | 52,084 | 100.0% |
Internet Access in Grayson County
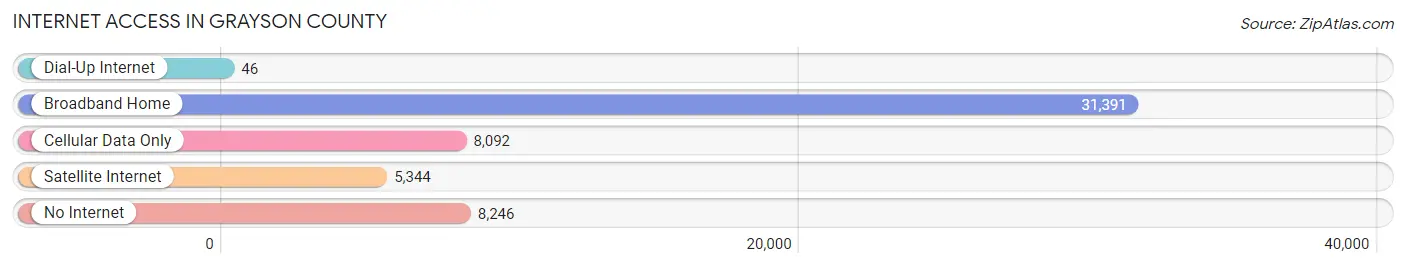
| Internet Type | # Households | % Households |
| Dial-Up Internet | 46 | 0.1% |
| Broadband Home | 31,391 | 60.3% |
| Cellular Data Only | 8,092 | 15.5% |
| Satellite Internet | 5,344 | 10.3% |
| No Internet | 8,246 | 15.8% |
| Total | 52,084 | 100.0% |
Grayson County Summary
Grayson County is located in the north-central region of Texas, and is part of the Texoma region. It is bordered by Fannin County to the north, Collin County to the east, Hunt County to the south, and Cooke County to the west. The county seat is Sherman, and the largest city is Denison. The county was named after Peter Wagener Grayson, a Texas attorney general and secretary of state.
Geography
Grayson County covers an area of 877 square miles, making it the 33rd largest county in Texas. It is mostly flat, with some rolling hills in the western part of the county. The terrain is mostly covered in grasslands, with some wooded areas in the eastern part of the county. The county is drained by the Red River, which forms its western border, and the Sulphur River, which flows through the county.
The climate of Grayson County is humid subtropical, with hot summers and mild winters. The average annual temperature is 64°F, and the average annual precipitation is 37 inches.
Economy
Grayson County has a diverse economy, with a mix of manufacturing, agriculture, and services. The largest employers in the county are the Denison Independent School District, the Sherman Independent School District, and the Texoma Medical Center.
Agriculture is an important part of the county’s economy, with cattle, hay, and wheat being the main crops. Manufacturing is also important, with companies such as Denison Industries, Denison Plastics, and Denison Foundry producing a variety of products.
Demographics
As of the 2010 census, Grayson County had a population of 120,877. The racial makeup of the county was 79.2% White, 11.7% Black or African American, 0.7% Native American, 1.3% Asian, 0.1% Pacific Islander, 5.2% from other races, and 2.0% from two or more races. Hispanic or Latino of any race were 14.3% of the population.
The median household income in the county was $45,945, and the median family income was $54,945. The per capita income was $22,945. About 11.2% of the population was below the poverty line.
Conclusion
Grayson County is a diverse county located in the north-central region of Texas. It has a mix of manufacturing, agriculture, and services, and is home to a population of 120,877. The county has a humid subtropical climate, with hot summers and mild winters. It is an important part of the Texoma region, and is a great place to live and work.
Common Questions
What is Per Capita Income in Grayson County?
Per Capita income in Grayson County is $34,643.
What is the Median Family Income in Grayson County?
Median Family Income in Grayson County is $80,421.
What is the Median Household income in Grayson County?
Median Household Income in Grayson County is $66,608.
What is Income or Wage Gap in Grayson County?
Income or Wage Gap in Grayson County is 31.8%.
Women in Grayson County earn 68.2 cents for every dollar earned by a man.
What is Family Income Deficit in Grayson County?
Family Income Deficit in Grayson County is $9,636.
Families that are below poverty line in Grayson County earn $9,636 less on average than the poverty threshold level.
What is Inequality or Gini Index in Grayson County?
Inequality or Gini Index in Grayson County is 0.45.
What is the Total Population of Grayson County?
Total Population of Grayson County is 137,008.
What is the Total Male Population of Grayson County?
Total Male Population of Grayson County is 67,315.
What is the Total Female Population of Grayson County?
Total Female Population of Grayson County is 69,693.
What is the Ratio of Males per 100 Females in Grayson County?
There are 96.59 Males per 100 Females in Grayson County.
What is the Ratio of Females per 100 Males in Grayson County?
There are 103.53 Females per 100 Males in Grayson County.
What is the Median Population Age in Grayson County?
Median Population Age in Grayson County is 39.2 Years.
What is the Average Family Size in Grayson County
Average Family Size in Grayson County is 3.1 People.
What is the Average Household Size in Grayson County
Average Household Size in Grayson County is 2.6 People.
How Large is the Labor Force in Grayson County?
There are 67,265 People in the Labor Forcein in Grayson County.
What is the Percentage of People in the Labor Force in Grayson County?
62.2% of People are in the Labor Force in Grayson County.
What is the Unemployment Rate in Grayson County?
Unemployment Rate in Grayson County is 3.9%.