Gray County, TX Map & Demographics
Gray County Map
Gray County Overview
$30,303
PER CAPITA INCOME
$63,681
AVG FAMILY INCOME
$54,563
AVG HOUSEHOLD INCOME
40.4%
WAGE / INCOME GAP [ % ]
59.6¢/ $1
WAGE / INCOME GAP [ $ ]
$8,598
FAMILY INCOME DEFICIT
0.49
INEQUALITY / GINI INDEX
21,272
TOTAL POPULATION
11,382
MALE POPULATION
9,890
FEMALE POPULATION
115.09
MALES / 100 FEMALES
86.89
FEMALES / 100 MALES
36.6
MEDIAN AGE
3.0
AVG FAMILY SIZE
2.5
AVG HOUSEHOLD SIZE
9,550
LABOR FORCE [ PEOPLE ]
57.6%
PERCENT IN LABOR FORCE
5.4%
UNEMPLOYMENT RATE
Gray County Area Codes
Income in Gray County
Income Overview in Gray County
Per Capita Income in Gray County is $30,303, while median incomes of families and households are $63,681 and $54,563 respectively.
| Characteristic | Number | Measure |
| Per Capita Income | 21,272 | $30,303 |
| Median Family Income | 5,379 | $63,681 |
| Mean Family Income | 5,379 | $94,858 |
| Median Household Income | 8,021 | $54,563 |
| Mean Household Income | 8,021 | $77,997 |
| Income Deficit | 5,379 | $8,598 |
| Wage / Income Gap (%) | 21,272 | 40.44% |
| Wage / Income Gap ($) | 21,272 | 59.56¢ per $1 |
| Gini / Inequality Index | 21,272 | 0.49 |
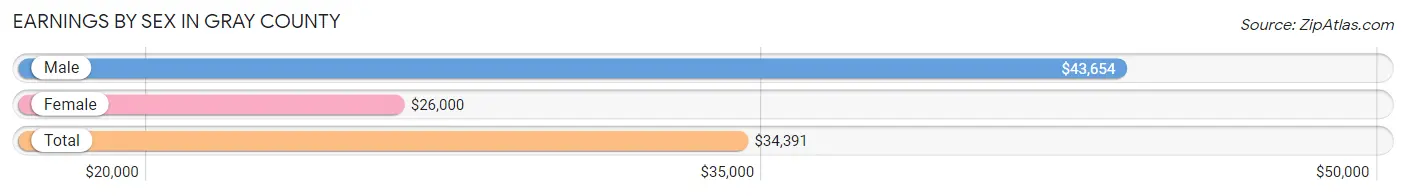
Earnings by Sex in Gray County
Average Earnings in Gray County are $34,391, $43,654 for men and $26,000 for women, a difference of 40.4%.
| Sex | Number | Average Earnings |
| Male | 5,298 (53.2%) | $43,654 |
| Female | 4,658 (46.8%) | $26,000 |
| Total | 9,956 (100.0%) | $34,391 |
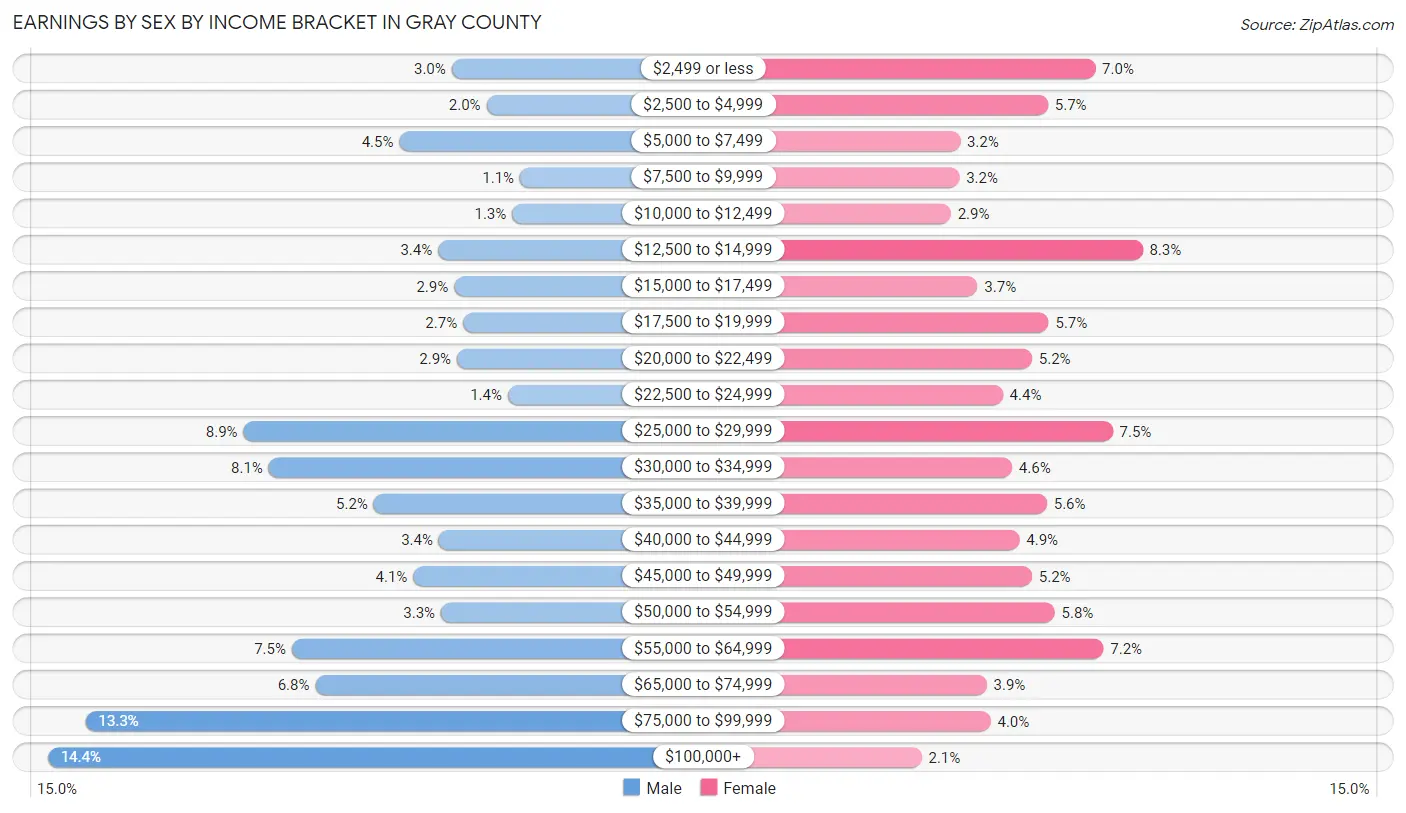
Earnings by Sex by Income Bracket in Gray County
The most common earnings brackets in Gray County are $100,000+ for men (760 | 14.3%) and $12,500 to $14,999 for women (387 | 8.3%).
| Income | Male | Female |
| $2,499 or less | 159 (3.0%) | 325 (7.0%) |
| $2,500 to $4,999 | 107 (2.0%) | 263 (5.7%) |
| $5,000 to $7,499 | 237 (4.5%) | 148 (3.2%) |
| $7,500 to $9,999 | 57 (1.1%) | 147 (3.2%) |
| $10,000 to $12,499 | 69 (1.3%) | 136 (2.9%) |
| $12,500 to $14,999 | 179 (3.4%) | 387 (8.3%) |
| $15,000 to $17,499 | 155 (2.9%) | 171 (3.7%) |
| $17,500 to $19,999 | 142 (2.7%) | 264 (5.7%) |
| $20,000 to $22,499 | 151 (2.9%) | 242 (5.2%) |
| $22,500 to $24,999 | 75 (1.4%) | 204 (4.4%) |
| $25,000 to $29,999 | 469 (8.8%) | 348 (7.5%) |
| $30,000 to $34,999 | 431 (8.1%) | 216 (4.6%) |
| $35,000 to $39,999 | 275 (5.2%) | 262 (5.6%) |
| $40,000 to $44,999 | 178 (3.4%) | 226 (4.9%) |
| $45,000 to $49,999 | 216 (4.1%) | 242 (5.2%) |
| $50,000 to $54,999 | 175 (3.3%) | 272 (5.8%) |
| $55,000 to $64,999 | 397 (7.5%) | 336 (7.2%) |
| $65,000 to $74,999 | 362 (6.8%) | 183 (3.9%) |
| $75,000 to $99,999 | 704 (13.3%) | 188 (4.0%) |
| $100,000+ | 760 (14.3%) | 98 (2.1%) |
| Total | 5,298 (100.0%) | 4,658 (100.0%) |
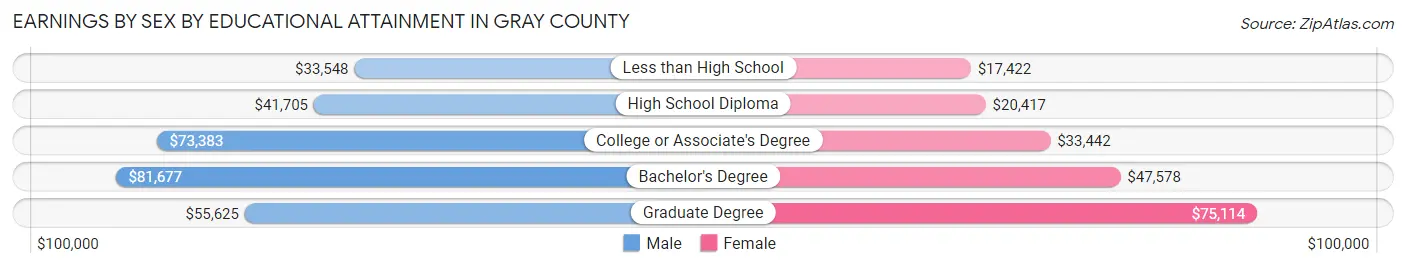
Earnings by Sex by Educational Attainment in Gray County
Average earnings in Gray County are $52,987 for men and $29,295 for women, a difference of 44.7%. Men with an educational attainment of bachelor's degree enjoy the highest average annual earnings of $81,677, while those with less than high school education earn the least with $33,548. Women with an educational attainment of graduate degree earn the most with the average annual earnings of $75,114, while those with less than high school education have the smallest earnings of $17,422.
| Educational Attainment | Male Income | Female Income |
| Less than High School | $33,548 | $17,422 |
| High School Diploma | $41,705 | $20,417 |
| College or Associate's Degree | $73,383 | $33,442 |
| Bachelor's Degree | $81,677 | $47,578 |
| Graduate Degree | $55,625 | $75,114 |
| Total | $52,987 | $29,295 |
Family Income in Gray County
Family Income Brackets in Gray County
According to the Gray County family income data, there are 957 families falling into the $100,000 to $149,999 income range, which is the most common income bracket and makes up 17.8% of all families. Conversely, the less than $10,000 income bracket is the least frequent group with only 118 families (2.2%) belonging to this category.
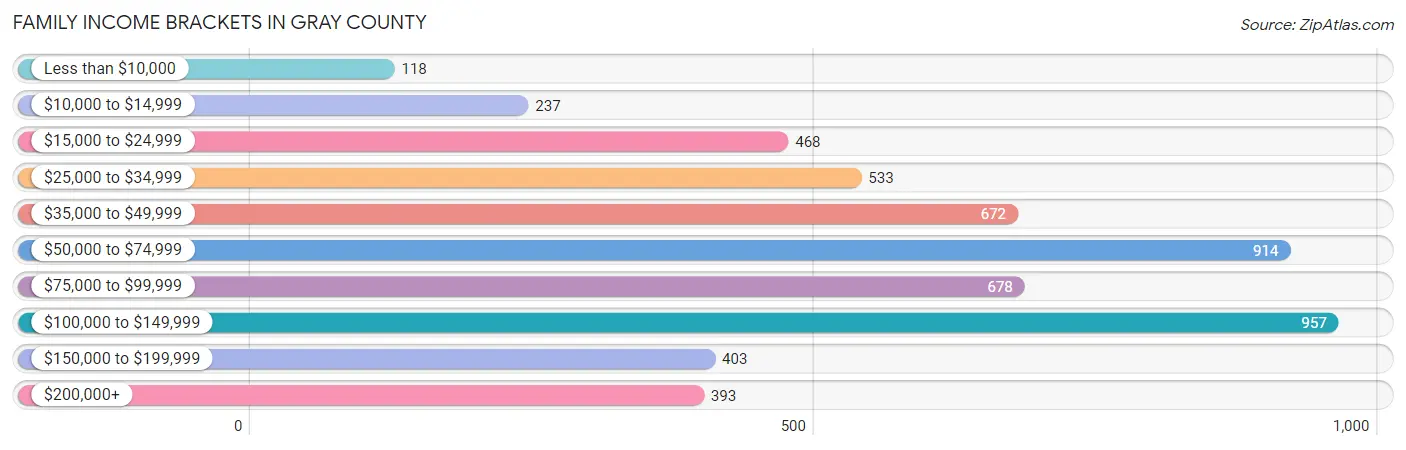
| Income Bracket | # Families | % Families |
| Less than $10,000 | 118 | 2.2% |
| $10,000 to $14,999 | 237 | 4.4% |
| $15,000 to $24,999 | 468 | 8.7% |
| $25,000 to $34,999 | 533 | 9.9% |
| $35,000 to $49,999 | 672 | 12.5% |
| $50,000 to $74,999 | 914 | 17.0% |
| $75,000 to $99,999 | 678 | 12.6% |
| $100,000 to $149,999 | 957 | 17.8% |
| $150,000 to $199,999 | 403 | 7.5% |
| $200,000+ | 393 | 7.3% |
Family Income by Famaliy Size in Gray County
7+ person families (26 | 0.5%) account for the highest median family income in Gray County with $157,500 per family, while 2-person families (2,572 | 47.8%) have the highest median income of $28,338 per family member.
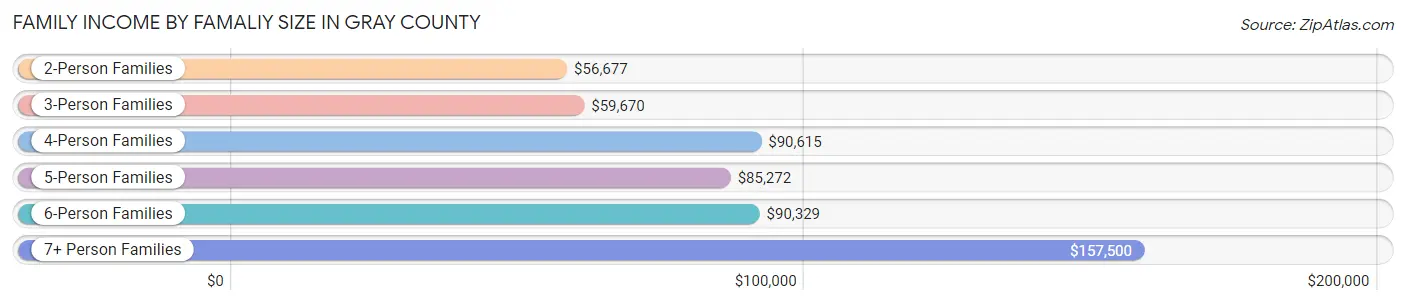
| Income Bracket | # Families | Median Income |
| 2-Person Families | 2,572 (47.8%) | $56,677 |
| 3-Person Families | 1,156 (21.5%) | $59,670 |
| 4-Person Families | 844 (15.7%) | $90,615 |
| 5-Person Families | 497 (9.2%) | $85,272 |
| 6-Person Families | 284 (5.3%) | $90,329 |
| 7+ Person Families | 26 (0.5%) | $157,500 |
| Total | 5,379 (100.0%) | $63,681 |
Family Income by Number of Earners in Gray County
The median family income in Gray County is $63,681, with families comprising 3+ earners (408) having the highest median family income of $116,250, while families with no earners (822) have the lowest median family income of $38,000, accounting for 7.6% and 15.3% of families, respectively.
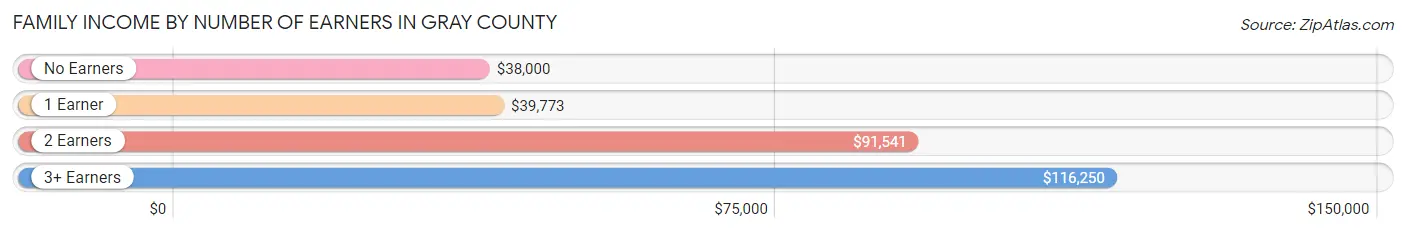
| Number of Earners | # Families | Median Income |
| No Earners | 822 (15.3%) | $38,000 |
| 1 Earner | 1,738 (32.3%) | $39,773 |
| 2 Earners | 2,411 (44.8%) | $91,541 |
| 3+ Earners | 408 (7.6%) | $116,250 |
| Total | 5,379 (100.0%) | $63,681 |
Household Income in Gray County
Household Income Brackets in Gray County
With 1,436 households falling in the category, the $50,000 to $74,999 income range is the most frequent in Gray County, accounting for 17.9% of all households. In contrast, only 401 households (5.0%) fall into the $10,000 to $14,999 income bracket, making it the least populous group.
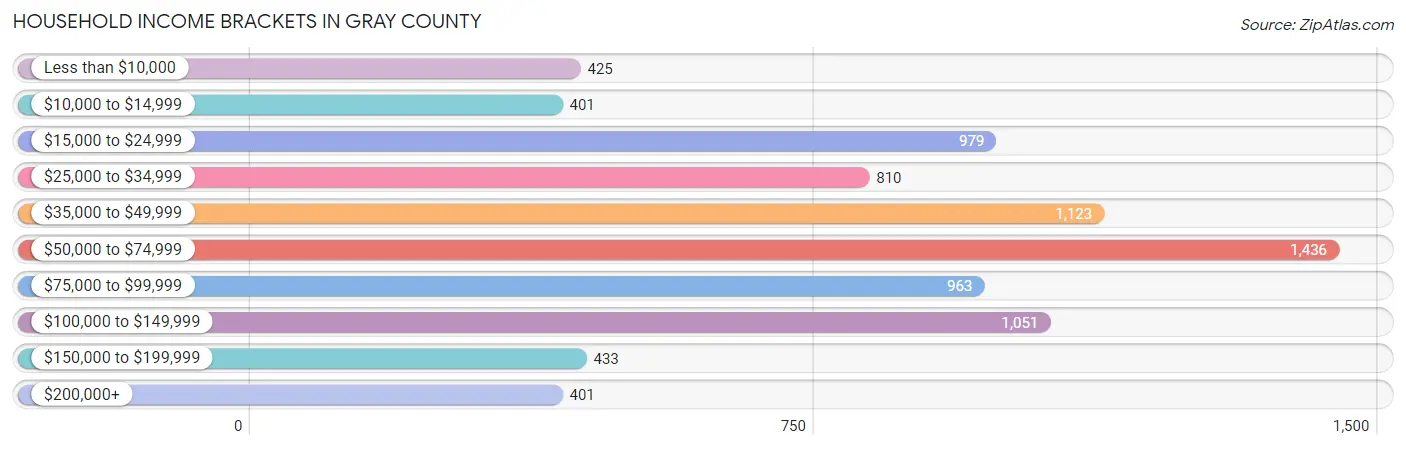
| Income Bracket | # Households | % Households |
| Less than $10,000 | 425 | 5.3% |
| $10,000 to $14,999 | 401 | 5.0% |
| $15,000 to $24,999 | 979 | 12.2% |
| $25,000 to $34,999 | 810 | 10.1% |
| $35,000 to $49,999 | 1,123 | 14.0% |
| $50,000 to $74,999 | 1,436 | 17.9% |
| $75,000 to $99,999 | 963 | 12.0% |
| $100,000 to $149,999 | 1,051 | 13.1% |
| $150,000 to $199,999 | 433 | 5.4% |
| $200,000+ | 401 | 5.0% |
Household Income by Householder Age in Gray County
The median household income in Gray County is $54,563, with the highest median household income of $61,531 found in the 45 to 64 years age bracket for the primary householder. A total of 2,613 households (32.6%) fall into this category. Meanwhile, the 15 to 24 years age bracket for the primary householder has the lowest median household income of $35,929, with 680 households (8.5%) in this group.
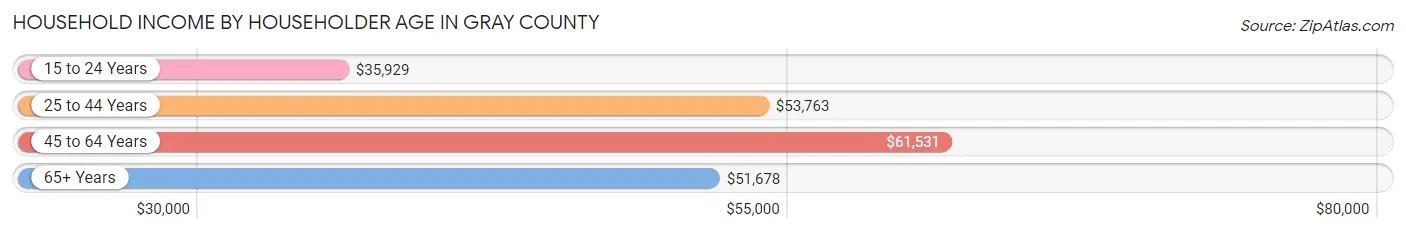
| Income Bracket | # Households | Median Income |
| 15 to 24 Years | 680 (8.5%) | $35,929 |
| 25 to 44 Years | 2,460 (30.7%) | $53,763 |
| 45 to 64 Years | 2,613 (32.6%) | $61,531 |
| 65+ Years | 2,268 (28.3%) | $51,678 |
| Total | 8,021 (100.0%) | $54,563 |
Poverty in Gray County
Income Below Poverty by Sex and Age in Gray County
With 15.5% poverty level for males and 18.5% for females among the residents of Gray County, under 5 year old males and 18 to 24 year old females are the most vulnerable to poverty, with 251 males (38.1%) and 276 females (35.4%) in their respective age groups living below the poverty level.
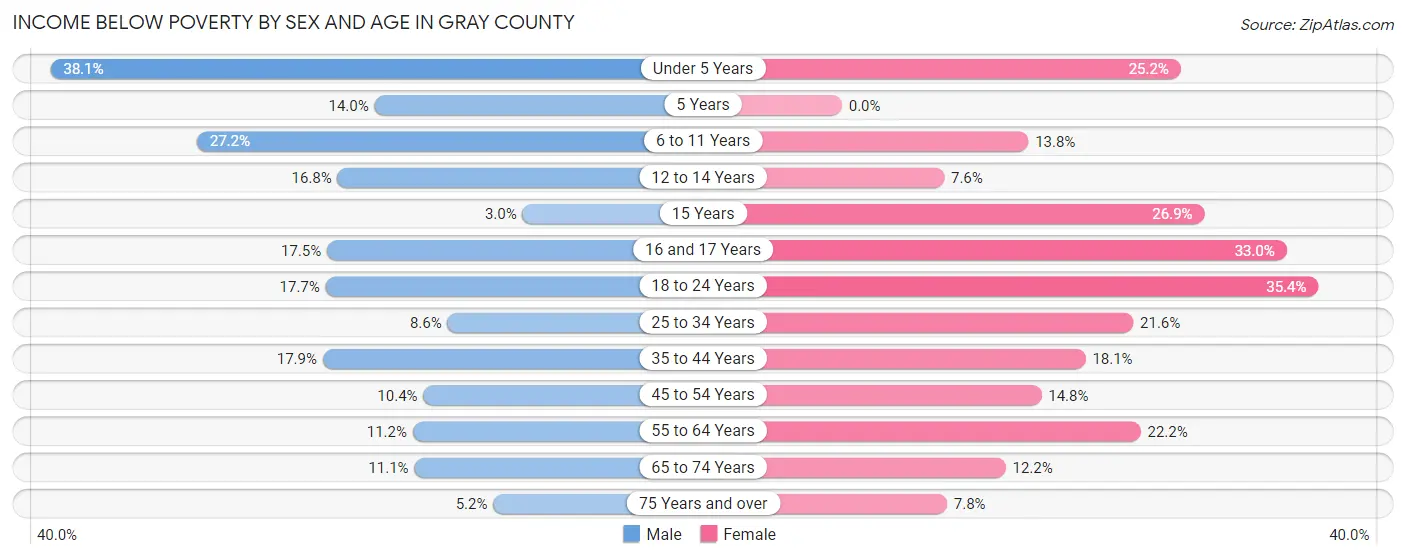
| Age Bracket | Male | Female |
| Under 5 Years | 251 (38.1%) | 156 (25.2%) |
| 5 Years | 15 (14.0%) | 0 (0.0%) |
| 6 to 11 Years | 243 (27.2%) | 128 (13.8%) |
| 12 to 14 Years | 94 (16.8%) | 34 (7.6%) |
| 15 Years | 5 (3.0%) | 14 (26.9%) |
| 16 and 17 Years | 60 (17.5%) | 110 (33.0%) |
| 18 to 24 Years | 173 (17.6%) | 276 (35.4%) |
| 25 to 34 Years | 99 (8.6%) | 270 (21.6%) |
| 35 to 44 Years | 202 (17.9%) | 212 (18.1%) |
| 45 to 54 Years | 120 (10.4%) | 164 (14.8%) |
| 55 to 64 Years | 134 (11.2%) | 248 (22.2%) |
| 65 to 74 Years | 95 (11.1%) | 118 (12.2%) |
| 75 Years and over | 31 (5.2%) | 64 (7.8%) |
| Total | 1,522 (15.5%) | 1,794 (18.5%) |
Income Above Poverty by Sex and Age in Gray County
According to the poverty statistics in Gray County, males aged 15 years and females aged 5 years are the age groups that are most secure financially, with 97.0% of males and 100.0% of females in these age groups living above the poverty line.
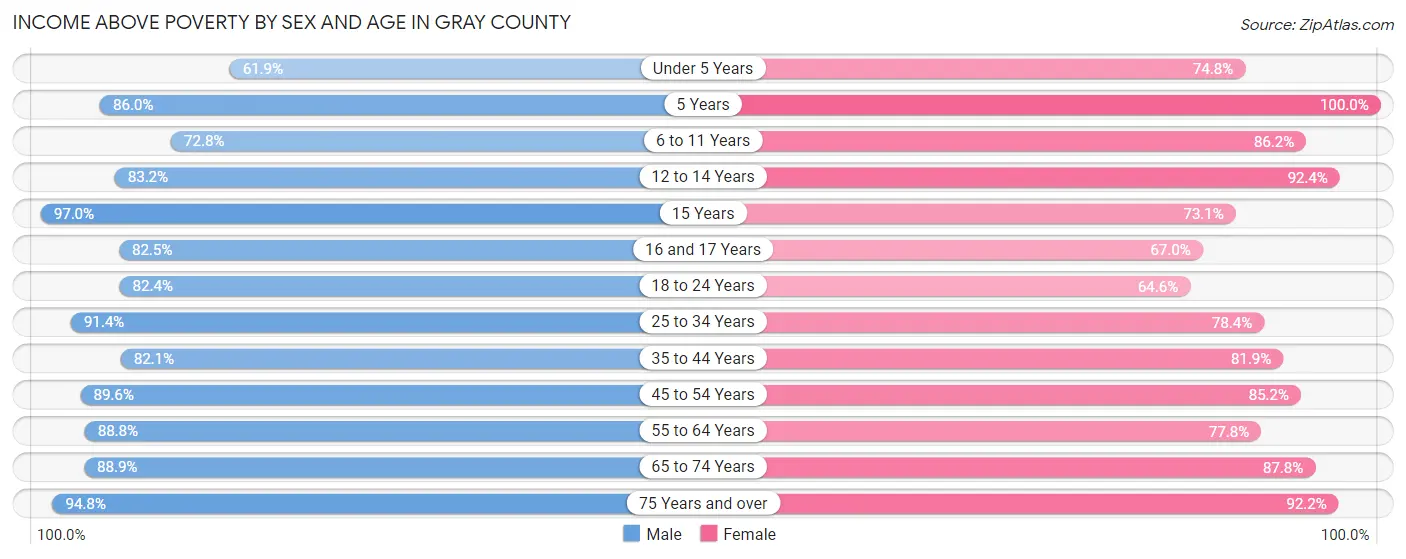
| Age Bracket | Male | Female |
| Under 5 Years | 408 (61.9%) | 464 (74.8%) |
| 5 Years | 92 (86.0%) | 118 (100.0%) |
| 6 to 11 Years | 650 (72.8%) | 797 (86.2%) |
| 12 to 14 Years | 467 (83.2%) | 414 (92.4%) |
| 15 Years | 160 (97.0%) | 38 (73.1%) |
| 16 and 17 Years | 282 (82.5%) | 223 (67.0%) |
| 18 to 24 Years | 807 (82.4%) | 504 (64.6%) |
| 25 to 34 Years | 1,052 (91.4%) | 978 (78.4%) |
| 35 to 44 Years | 929 (82.1%) | 960 (81.9%) |
| 45 to 54 Years | 1,035 (89.6%) | 943 (85.2%) |
| 55 to 64 Years | 1,065 (88.8%) | 870 (77.8%) |
| 65 to 74 Years | 764 (88.9%) | 852 (87.8%) |
| 75 Years and over | 565 (94.8%) | 757 (92.2%) |
| Total | 8,276 (84.5%) | 7,918 (81.5%) |
Income Below Poverty Among Married-Couple Families in Gray County
The poverty statistics for married-couple families in Gray County show that 11.1% or 451 of the total 4,059 families live below the poverty line. Families with 3 or 4 children have the highest poverty rate of 19.6%, comprising of 102 families. On the other hand, families with 5 or more children have the lowest poverty rate of 0.0%, which includes 0 families.
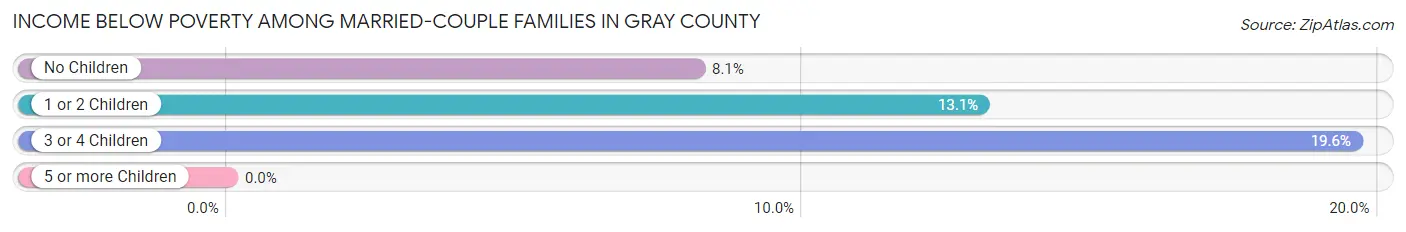
| Children | Above Poverty | Below Poverty |
| No Children | 2,090 (91.9%) | 185 (8.1%) |
| 1 or 2 Children | 1,089 (86.9%) | 164 (13.1%) |
| 3 or 4 Children | 419 (80.4%) | 102 (19.6%) |
| 5 or more Children | 10 (100.0%) | 0 (0.0%) |
| Total | 3,608 (88.9%) | 451 (11.1%) |
Income Below Poverty Among Single-Parent Households in Gray County
According to the poverty data in Gray County, 7.8% or 31 single-father households and 30.5% or 281 single-mother households are living below the poverty line. Among single-father households, those with 1 or 2 children have the highest poverty rate, with 29 households (19.1%) experiencing poverty. Likewise, among single-mother households, those with 3 or 4 children have the highest poverty rate, with 29 households (78.4%) falling below the poverty line.
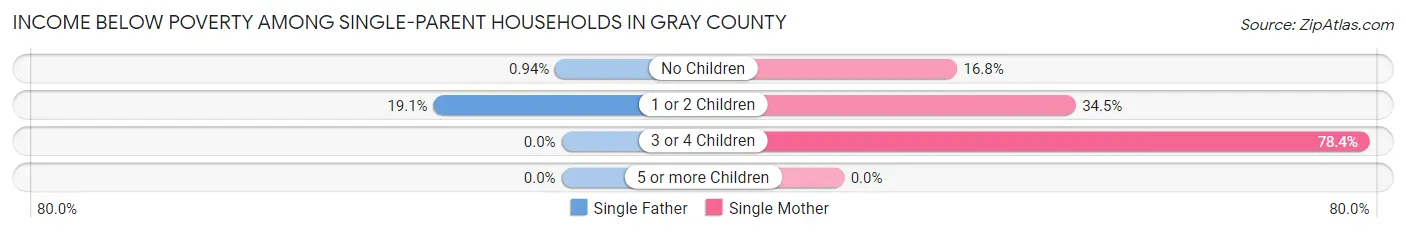
| Children | Single Father | Single Mother |
| No Children | 2 (0.9%) | 36 (16.8%) |
| 1 or 2 Children | 29 (19.1%) | 216 (34.5%) |
| 3 or 4 Children | 0 (0.0%) | 29 (78.4%) |
| 5 or more Children | 0 (0.0%) | 0 (0.0%) |
| Total | 31 (7.8%) | 281 (30.5%) |
Income Below Poverty Among Married-Couple vs Single-Parent Households in Gray County
The poverty data for Gray County shows that 451 of the married-couple family households (11.1%) and 312 of the single-parent households (23.6%) are living below the poverty level. Within the married-couple family households, those with 3 or 4 children have the highest poverty rate, with 102 households (19.6%) falling below the poverty line. Among the single-parent households, those with 3 or 4 children have the highest poverty rate, with 29 household (47.5%) living below poverty.
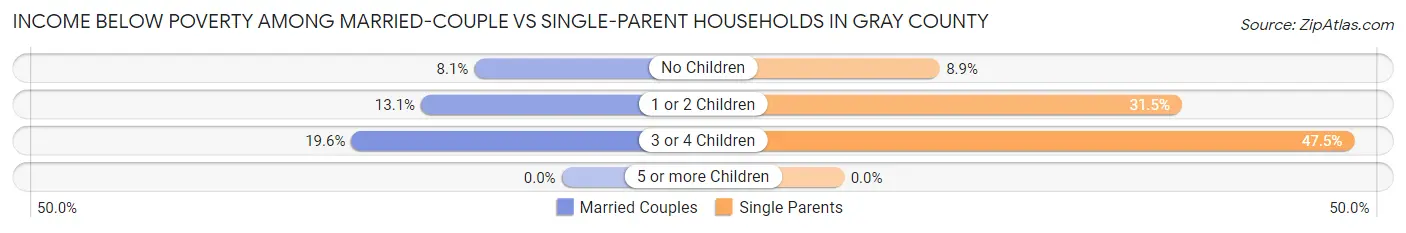
| Children | Married-Couple Families | Single-Parent Households |
| No Children | 185 (8.1%) | 38 (8.9%) |
| 1 or 2 Children | 164 (13.1%) | 245 (31.5%) |
| 3 or 4 Children | 102 (19.6%) | 29 (47.5%) |
| 5 or more Children | 0 (0.0%) | 0 (0.0%) |
| Total | 451 (11.1%) | 312 (23.6%) |
Race in Gray County
The most populous races in Gray County are White / Caucasian (16,510 | 77.6%), Hispanic or Latino (6,475 | 30.4%), and Some other Race (1,749 | 8.2%).
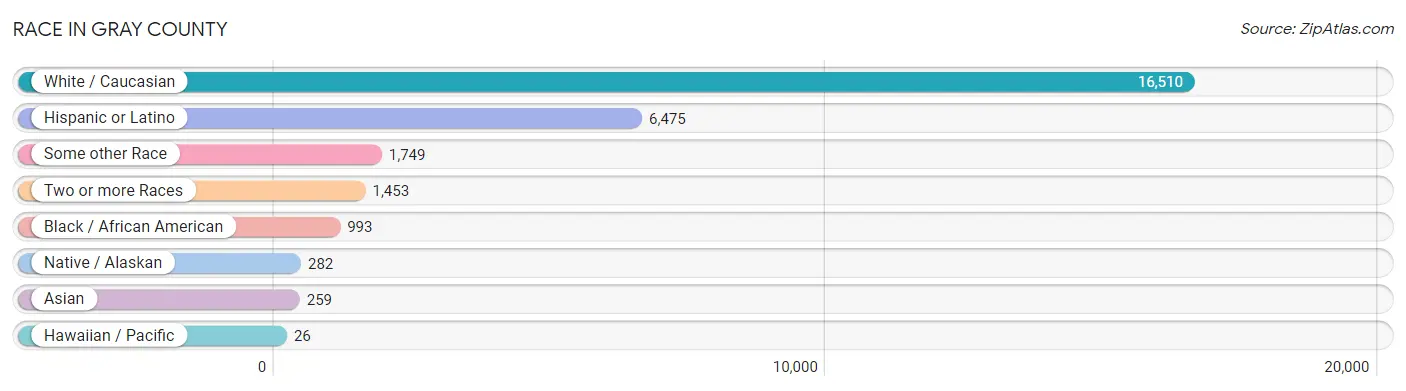
| Race | # Population | % Population |
| Asian | 259 | 1.2% |
| Black / African American | 993 | 4.7% |
| Hawaiian / Pacific | 26 | 0.1% |
| Hispanic or Latino | 6,475 | 30.4% |
| Native / Alaskan | 282 | 1.3% |
| White / Caucasian | 16,510 | 77.6% |
| Two or more Races | 1,453 | 6.8% |
| Some other Race | 1,749 | 8.2% |
| Total | 21,272 | 100.0% |
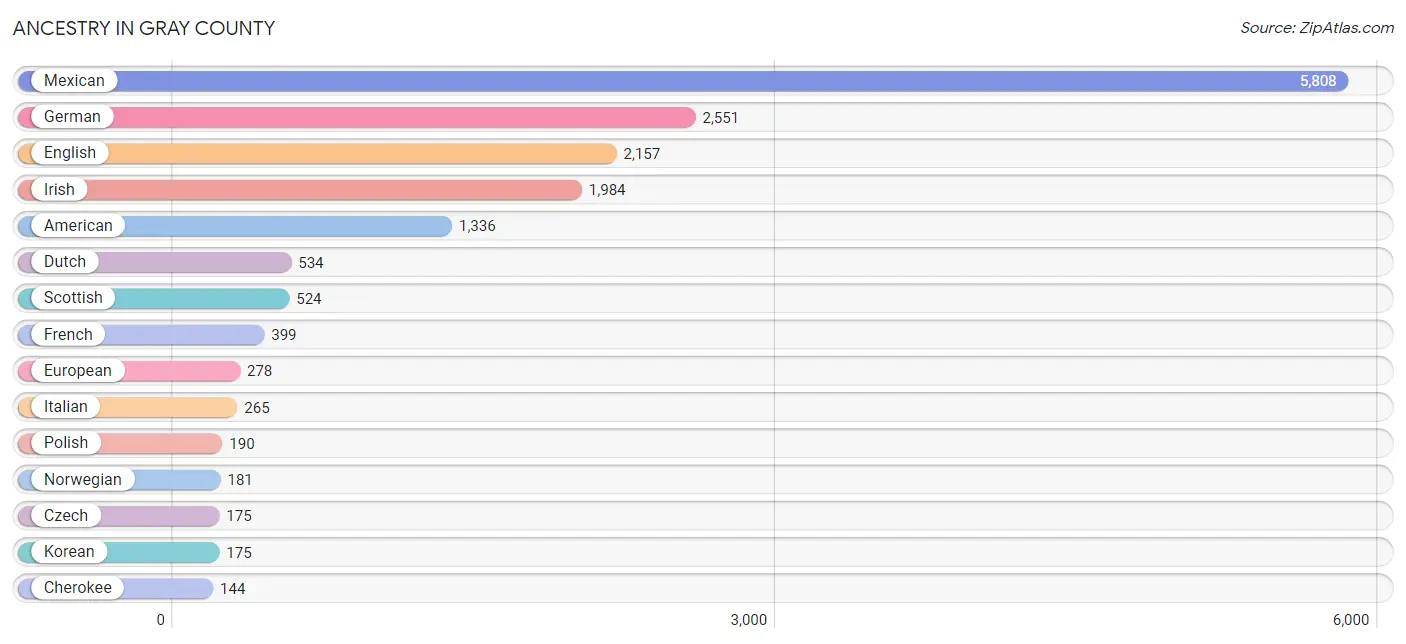
Ancestry in Gray County
The most populous ancestries reported in Gray County are Mexican (5,808 | 27.3%), German (2,551 | 12.0%), English (2,157 | 10.1%), Irish (1,984 | 9.3%), and American (1,336 | 6.3%), together accounting for 65.0% of all Gray County residents.
| Ancestry | # Population | % Population |
| African | 37 | 0.2% |
| American | 1,336 | 6.3% |
| Apache | 8 | 0.0% |
| Arab | 7 | 0.0% |
| Argentinean | 2 | 0.0% |
| Bhutanese | 23 | 0.1% |
| Blackfeet | 66 | 0.3% |
| British | 114 | 0.5% |
| Burmese | 25 | 0.1% |
| Cajun | 16 | 0.1% |
| Canadian | 18 | 0.1% |
| Central American | 52 | 0.2% |
| Central American Indian | 18 | 0.1% |
| Cherokee | 144 | 0.7% |
| Chickasaw | 28 | 0.1% |
| Choctaw | 29 | 0.1% |
| Colombian | 6 | 0.0% |
| Creek | 26 | 0.1% |
| Czech | 175 | 0.8% |
| Czechoslovakian | 16 | 0.1% |
| Danish | 20 | 0.1% |
| Dutch | 534 | 2.5% |
| Dutch West Indian | 105 | 0.5% |
| Ecuadorian | 12 | 0.1% |
| English | 2,157 | 10.1% |
| European | 278 | 1.3% |
| French | 399 | 1.9% |
| German | 2,551 | 12.0% |
| Greek | 2 | 0.0% |
| Guatemalan | 27 | 0.1% |
| Haitian | 7 | 0.0% |
| Irish | 1,984 | 9.3% |
| Italian | 265 | 1.3% |
| Korean | 175 | 0.8% |
| Malaysian | 4 | 0.0% |
| Mexican | 5,808 | 27.3% |
| Norwegian | 181 | 0.9% |
| Osage | 2 | 0.0% |
| Polish | 190 | 0.9% |
| Potawatomi | 23 | 0.1% |
| Puerto Rican | 44 | 0.2% |
| Salvadoran | 25 | 0.1% |
| Scandinavian | 15 | 0.1% |
| Scotch-Irish | 92 | 0.4% |
| Scottish | 524 | 2.5% |
| Sioux | 3 | 0.0% |
| South American | 94 | 0.4% |
| South American Indian | 5 | 0.0% |
| Spaniard | 138 | 0.6% |
| Spanish | 129 | 0.6% |
| Sri Lankan | 14 | 0.1% |
| Subsaharan African | 40 | 0.2% |
| Swedish | 70 | 0.3% |
| Swiss | 9 | 0.0% |
| Thai | 28 | 0.1% |
| Trinidadian and Tobagonian | 12 | 0.1% |
| Venezuelan | 74 | 0.4% |
| Welsh | 2 | 0.0% |
| Yaqui | 27 | 0.1% |
| Yup'ik | 9 | 0.0% | View All 60 Rows |
Immigrants in Gray County
The most numerous immigrant groups reported in Gray County came from Latin America (2,007 | 9.4%), Central America (1,975 | 9.3%), Mexico (1,928 | 9.1%), Asia (111 | 0.5%), and South Eastern Asia (111 | 0.5%), together accounting for 28.8% of all Gray County residents.
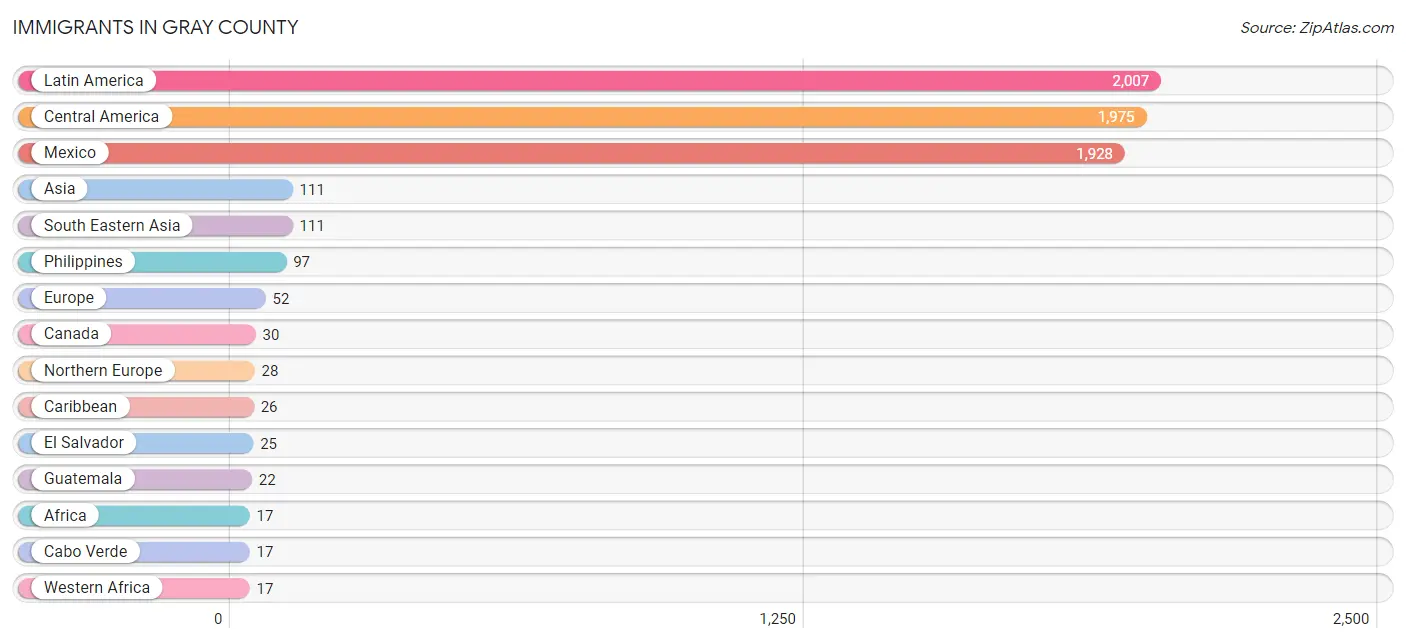
| Immigration Origin | # Population | % Population |
| Africa | 17 | 0.1% |
| Asia | 111 | 0.5% |
| Belgium | 4 | 0.0% |
| Cabo Verde | 17 | 0.1% |
| Canada | 30 | 0.1% |
| Caribbean | 26 | 0.1% |
| Central America | 1,975 | 9.3% |
| Colombia | 6 | 0.0% |
| Cuba | 14 | 0.1% |
| Eastern Europe | 9 | 0.0% |
| El Salvador | 25 | 0.1% |
| Europe | 52 | 0.2% |
| Germany | 11 | 0.1% |
| Guatemala | 22 | 0.1% |
| Latin America | 2,007 | 9.4% |
| Mexico | 1,928 | 9.1% |
| Northern Europe | 28 | 0.1% |
| Philippines | 97 | 0.5% |
| Russia | 9 | 0.0% |
| South America | 6 | 0.0% |
| South Eastern Asia | 111 | 0.5% |
| Trinidad and Tobago | 12 | 0.1% |
| Vietnam | 14 | 0.1% |
| Western Africa | 17 | 0.1% |
| Western Europe | 15 | 0.1% | View All 25 Rows |
Sex and Age in Gray County
Sex and Age in Gray County
The most populous age groups in Gray County are 30 to 34 Years (875 | 7.7%) for men and 10 to 14 Years (830 | 8.4%) for women.
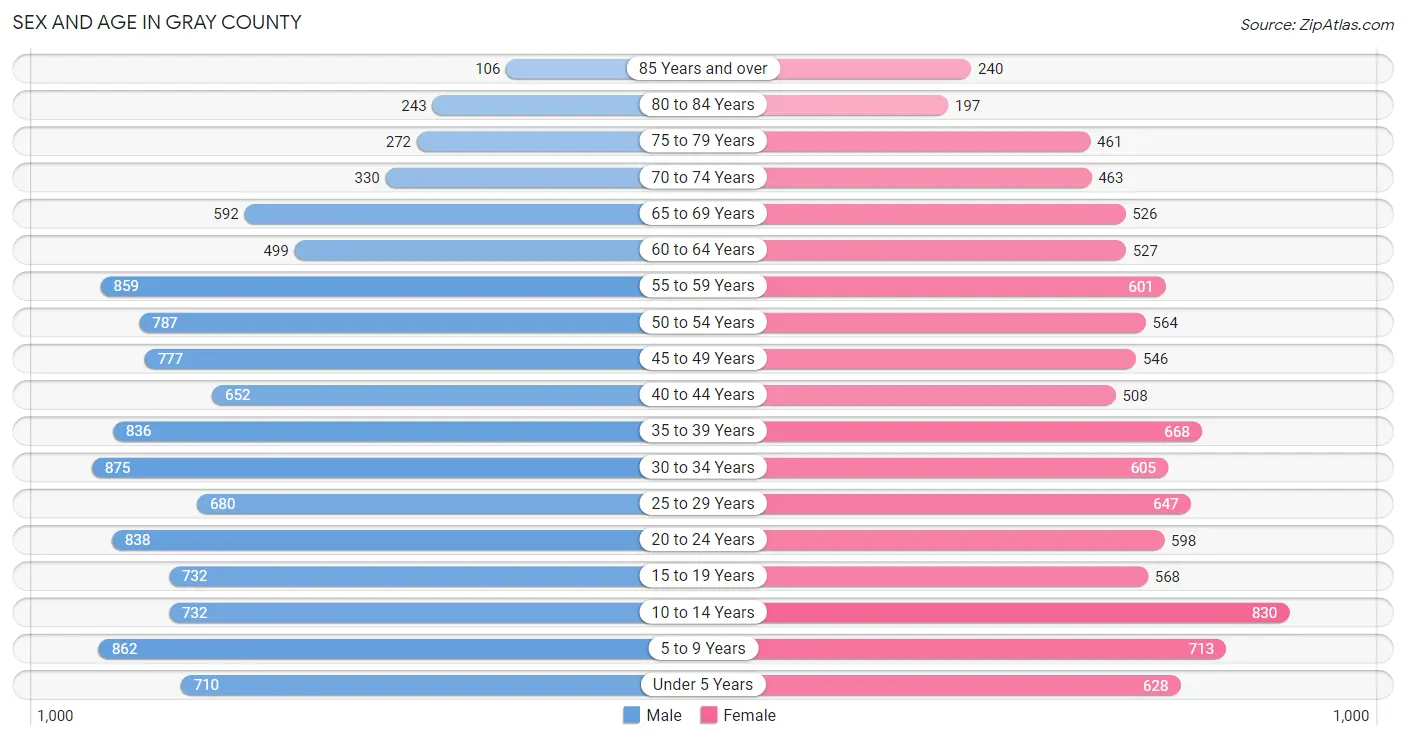
| Age Bracket | Male | Female |
| Under 5 Years | 710 (6.2%) | 628 (6.4%) |
| 5 to 9 Years | 862 (7.6%) | 713 (7.2%) |
| 10 to 14 Years | 732 (6.4%) | 830 (8.4%) |
| 15 to 19 Years | 732 (6.4%) | 568 (5.7%) |
| 20 to 24 Years | 838 (7.4%) | 598 (6.0%) |
| 25 to 29 Years | 680 (6.0%) | 647 (6.5%) |
| 30 to 34 Years | 875 (7.7%) | 605 (6.1%) |
| 35 to 39 Years | 836 (7.3%) | 668 (6.8%) |
| 40 to 44 Years | 652 (5.7%) | 508 (5.1%) |
| 45 to 49 Years | 777 (6.8%) | 546 (5.5%) |
| 50 to 54 Years | 787 (6.9%) | 564 (5.7%) |
| 55 to 59 Years | 859 (7.5%) | 601 (6.1%) |
| 60 to 64 Years | 499 (4.4%) | 527 (5.3%) |
| 65 to 69 Years | 592 (5.2%) | 526 (5.3%) |
| 70 to 74 Years | 330 (2.9%) | 463 (4.7%) |
| 75 to 79 Years | 272 (2.4%) | 461 (4.7%) |
| 80 to 84 Years | 243 (2.1%) | 197 (2.0%) |
| 85 Years and over | 106 (0.9%) | 240 (2.4%) |
| Total | 11,382 (100.0%) | 9,890 (100.0%) |
Families and Households in Gray County
Median Family Size in Gray County
The median family size in Gray County is 3.02 persons per family, with single female/mother families (921 | 17.1%) accounting for the largest median family size of 3.1 persons per family. On the other hand, single male/father families (399 | 7.4%) represent the smallest median family size with 2.47 persons per family.
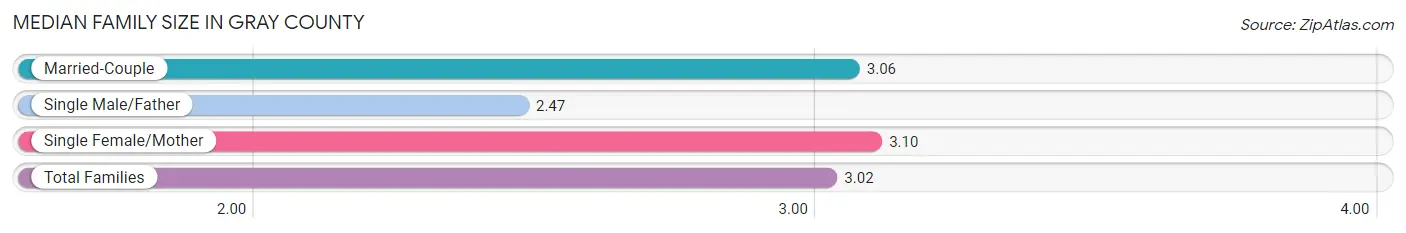
| Family Type | # Families | Family Size |
| Married-Couple | 4,059 (75.5%) | 3.06 |
| Single Male/Father | 399 (7.4%) | 2.47 |
| Single Female/Mother | 921 (17.1%) | 3.10 |
| Total Families | 5,379 (100.0%) | 3.02 |
Median Household Size in Gray County
The median household size in Gray County is 2.45 persons per household, with single female/mother households (921 | 11.5%) accounting for the largest median household size of 3.26 persons per household. non-family households (2,642 | 32.9%) represent the smallest median household size with 1.12 persons per household.
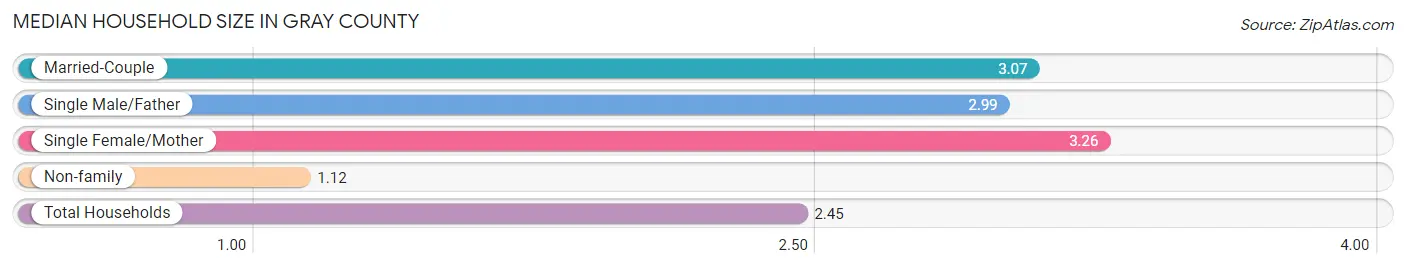
| Household Type | # Households | Household Size |
| Married-Couple | 4,059 (50.6%) | 3.07 |
| Single Male/Father | 399 (5.0%) | 2.99 |
| Single Female/Mother | 921 (11.5%) | 3.26 |
| Non-family | 2,642 (32.9%) | 1.12 |
| Total Households | 8,021 (100.0%) | 2.45 |
Household Size by Marriage Status in Gray County
Out of a total of 8,021 households in Gray County, 5,379 (67.1%) are family households, while 2,642 (32.9%) are nonfamily households. The most numerous type of family households are 2-person households, comprising 2,478, and the most common type of nonfamily households are 1-person households, comprising 2,309.
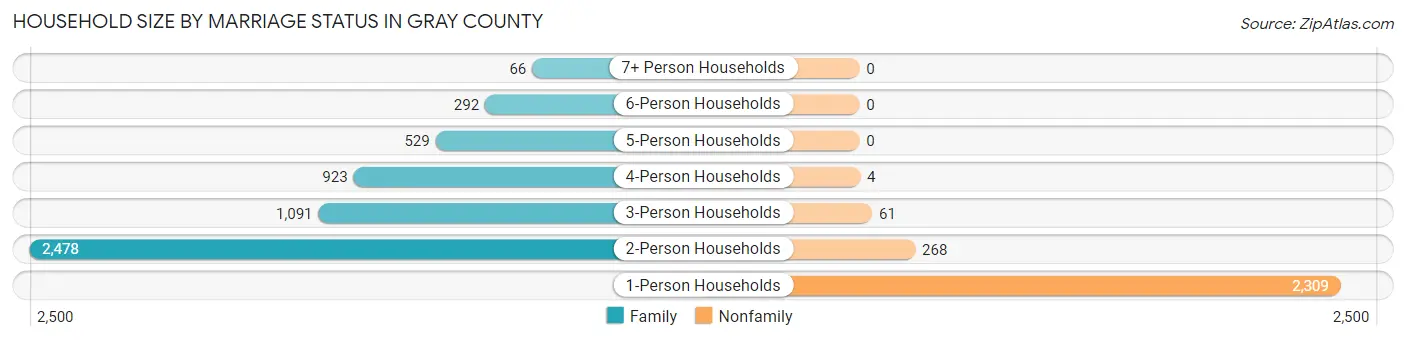
| Household Size | Family Households | Nonfamily Households |
| 1-Person Households | - | 2,309 (28.8%) |
| 2-Person Households | 2,478 (30.9%) | 268 (3.3%) |
| 3-Person Households | 1,091 (13.6%) | 61 (0.8%) |
| 4-Person Households | 923 (11.5%) | 4 (0.1%) |
| 5-Person Households | 529 (6.6%) | 0 (0.0%) |
| 6-Person Households | 292 (3.6%) | 0 (0.0%) |
| 7+ Person Households | 66 (0.8%) | 0 (0.0%) |
| Total | 5,379 (67.1%) | 2,642 (32.9%) |
Female Fertility in Gray County
Fertility by Age in Gray County
Average fertility rate in Gray County is 64.0 births per 1,000 women. Women in the age bracket of 15 to 19 years have the highest fertility rate with 165.0 births per 1,000 women. Women in the age bracket of 20 to 34 years acount for 56.9% of all women with births.
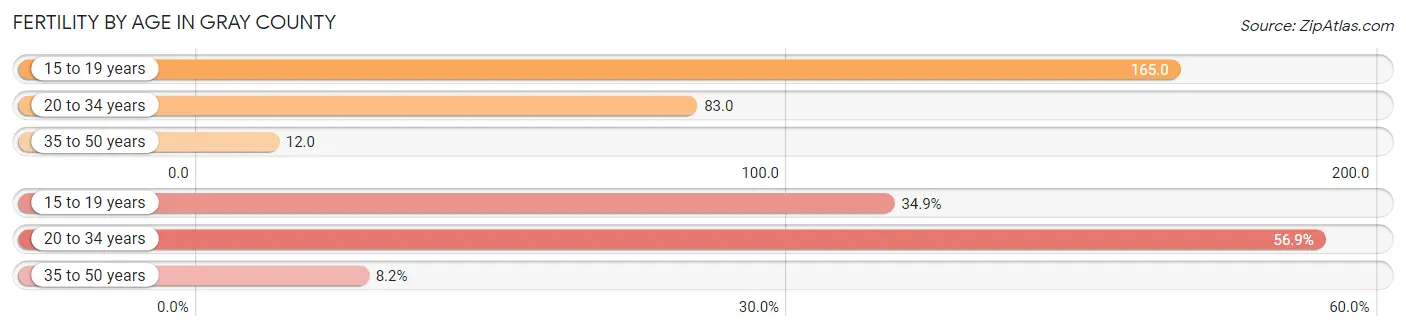
| Age Bracket | Women with Births | Births / 1,000 Women |
| 15 to 19 years | 94 (34.9%) | 165.0 |
| 20 to 34 years | 153 (56.9%) | 83.0 |
| 35 to 50 years | 22 (8.2%) | 12.0 |
| Total | 269 (100.0%) | 64.0 |
Fertility by Age by Marriage Status in Gray County
34.9% of women with births (269) in Gray County are married. The highest percentage of unmarried women with births falls into 15 to 19 years age bracket with 100.0% of them unmarried at the time of birth, while the lowest percentage of unmarried women with births belong to 35 to 50 years age bracket with 31.8% of them unmarried.
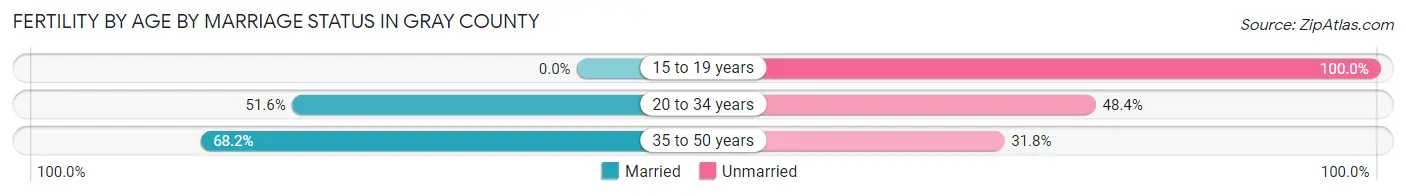
| Age Bracket | Married | Unmarried |
| 15 to 19 years | 0 (0.0%) | 94 (100.0%) |
| 20 to 34 years | 79 (51.6%) | 74 (48.4%) |
| 35 to 50 years | 15 (68.2%) | 7 (31.8%) |
| Total | 94 (34.9%) | 175 (65.1%) |
Fertility by Education in Gray County
Average fertility rate in Gray County is 64.0 births per 1,000 women. Women with the education attainment of less than high school have the highest fertility rate of 79.0 births per 1,000 women, while women with the education attainment of bachelor's degree have the lowest fertility at 21.0 births per 1,000 women. Women with the education attainment of college or associate's degree represent 39.4% of all women with births.
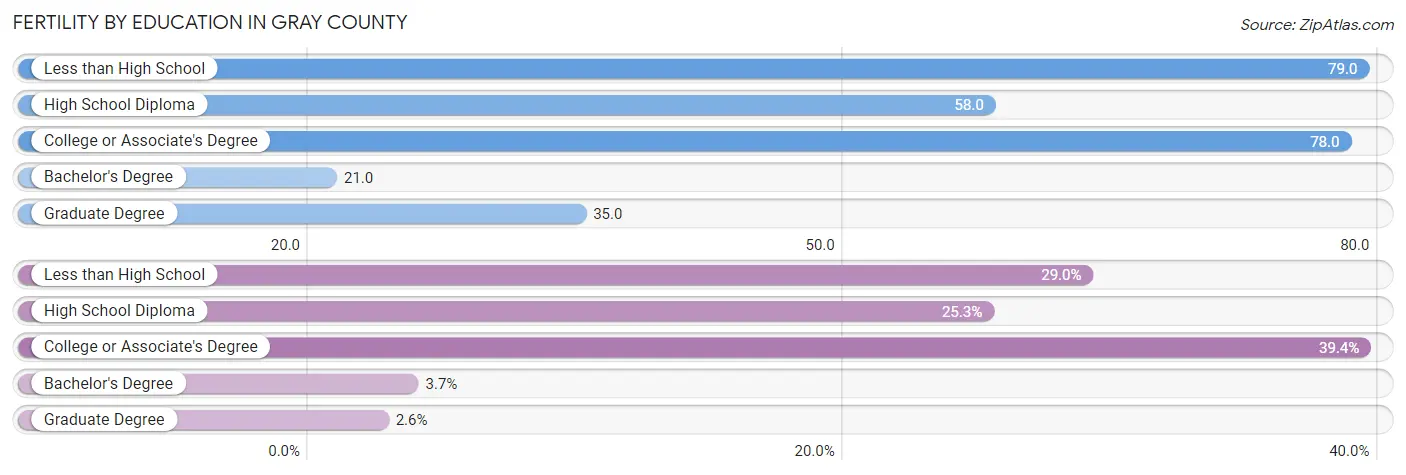
| Educational Attainment | Women with Births | Births / 1,000 Women |
| Less than High School | 78 (29.0%) | 79.0 |
| High School Diploma | 68 (25.3%) | 58.0 |
| College or Associate's Degree | 106 (39.4%) | 78.0 |
| Bachelor's Degree | 10 (3.7%) | 21.0 |
| Graduate Degree | 7 (2.6%) | 35.0 |
| Total | 269 (100.0%) | 64.0 |
Fertility by Education by Marriage Status in Gray County
65.1% of women with births in Gray County are unmarried. Women with the educational attainment of bachelor's degree are most likely to be married with 100.0% of them married at childbirth, while women with the educational attainment of less than high school are least likely to be married with 100.0% of them unmarried at childbirth.
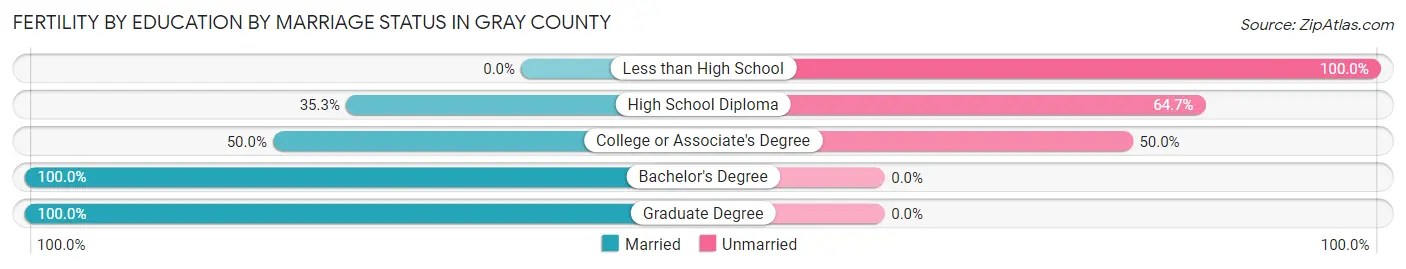
| Educational Attainment | Married | Unmarried |
| Less than High School | 0 (0.0%) | 78 (100.0%) |
| High School Diploma | 24 (35.3%) | 44 (64.7%) |
| College or Associate's Degree | 53 (50.0%) | 53 (50.0%) |
| Bachelor's Degree | 10 (100.0%) | 0 (0.0%) |
| Graduate Degree | 7 (100.0%) | 0 (0.0%) |
| Total | 94 (34.9%) | 175 (65.1%) |
Employment Characteristics in Gray County
Employment by Class of Employer in Gray County
Among the 8,829 employed individuals in Gray County, private company employees (5,666 | 64.2%), local government employees (1,252 | 14.2%), and self-employed (not incorporated) (739 | 8.4%) make up the most common classes of employment.
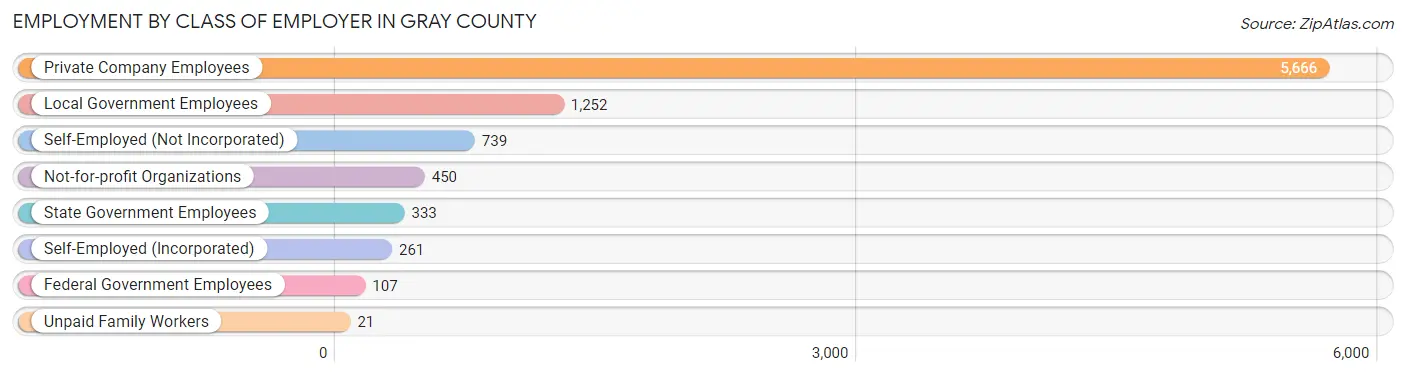
| Employer Class | # Employees | % Employees |
| Private Company Employees | 5,666 | 64.2% |
| Self-Employed (Incorporated) | 261 | 3.0% |
| Self-Employed (Not Incorporated) | 739 | 8.4% |
| Not-for-profit Organizations | 450 | 5.1% |
| Local Government Employees | 1,252 | 14.2% |
| State Government Employees | 333 | 3.8% |
| Federal Government Employees | 107 | 1.2% |
| Unpaid Family Workers | 21 | 0.2% |
| Total | 8,829 | 100.0% |
Employment Status by Age in Gray County
According to the labor force statistics for Gray County, out of the total population over 16 years of age (16,579), 57.6% or 9,550 individuals are in the labor force, with 5.4% or 516 of them unemployed. The age group with the highest labor force participation rate is 20 to 24 years, with 85.0% or 1,221 individuals in the labor force. Within the labor force, the 20 to 24 years age range has the highest percentage of unemployed individuals, with 9.7% or 118 of them being unemployed.
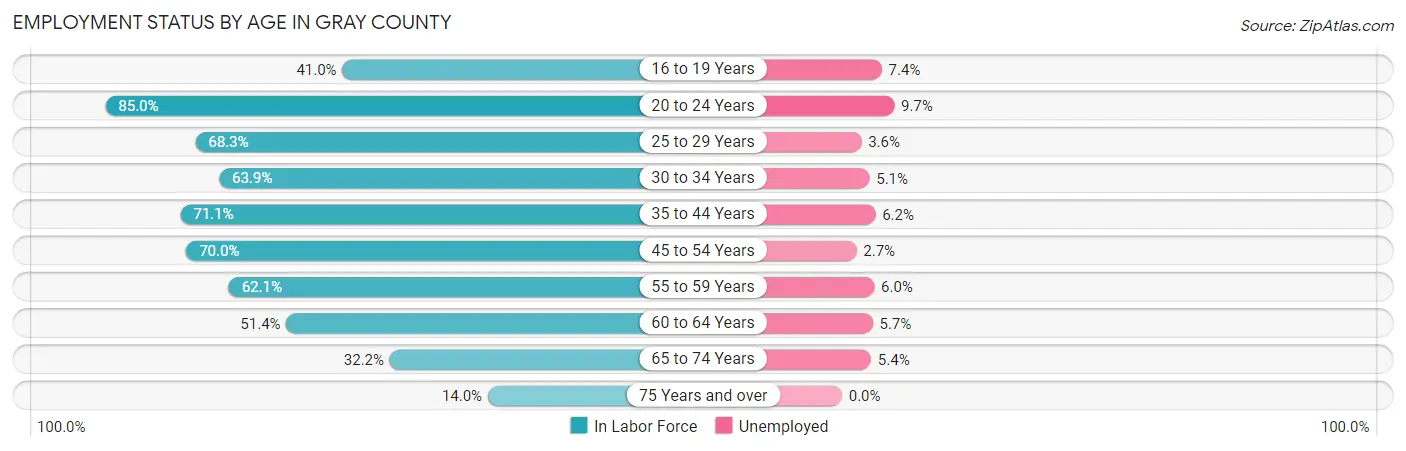
| Age Bracket | In Labor Force | Unemployed |
| 16 to 19 Years | 444 (41.0%) | 33 (7.4%) |
| 20 to 24 Years | 1,221 (85.0%) | 118 (9.7%) |
| 25 to 29 Years | 906 (68.3%) | 33 (3.6%) |
| 30 to 34 Years | 946 (63.9%) | 48 (5.1%) |
| 35 to 44 Years | 1,894 (71.1%) | 117 (6.2%) |
| 45 to 54 Years | 1,872 (70.0%) | 51 (2.7%) |
| 55 to 59 Years | 907 (62.1%) | 54 (6.0%) |
| 60 to 64 Years | 527 (51.4%) | 30 (5.7%) |
| 65 to 74 Years | 615 (32.2%) | 33 (5.4%) |
| 75 Years and over | 213 (14.0%) | 0 (0.0%) |
| Total | 9,550 (57.6%) | 516 (5.4%) |
Employment Status by Educational Attainment in Gray County
According to labor force statistics for Gray County, 66.3% of individuals (7,048) out of the total population between 25 and 64 years of age (10,631) are in the labor force, with 4.7% or 331 of them being unemployed. The group with the highest labor force participation rate are those with the educational attainment of bachelor's degree or higher, with 83.9% or 1,316 individuals in the labor force. Within the labor force, individuals with high school diploma education have the highest percentage of unemployment, with 7.3% or 167 of them being unemployed.
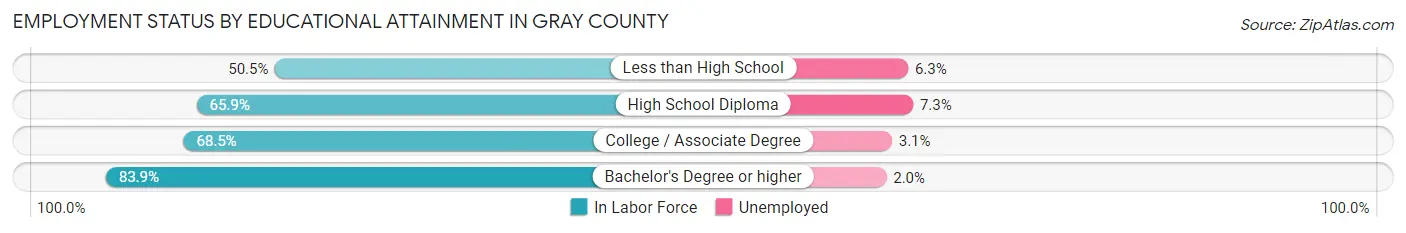
| Educational Attainment | In Labor Force | Unemployed |
| Less than High School | 1,072 (50.5%) | 134 (6.3%) |
| High School Diploma | 2,284 (65.9%) | 253 (7.3%) |
| College / Associate Degree | 2,380 (68.5%) | 108 (3.1%) |
| Bachelor's Degree or higher | 1,316 (83.9%) | 31 (2.0%) |
| Total | 7,048 (66.3%) | 500 (4.7%) |
Employment Occupations by Sex in Gray County
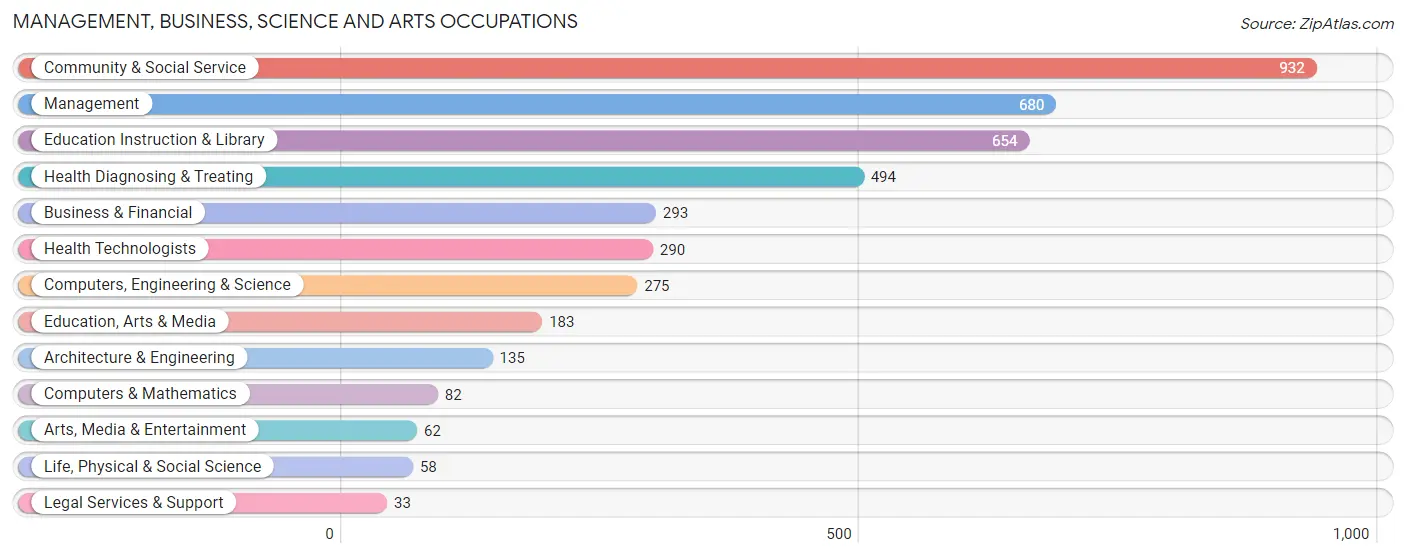
Management, Business, Science and Arts Occupations
The most common Management, Business, Science and Arts occupations in Gray County are Community & Social Service (932 | 10.3%), Management (680 | 7.5%), Education Instruction & Library (654 | 7.2%), Health Diagnosing & Treating (494 | 5.5%), and Business & Financial (293 | 3.3%).
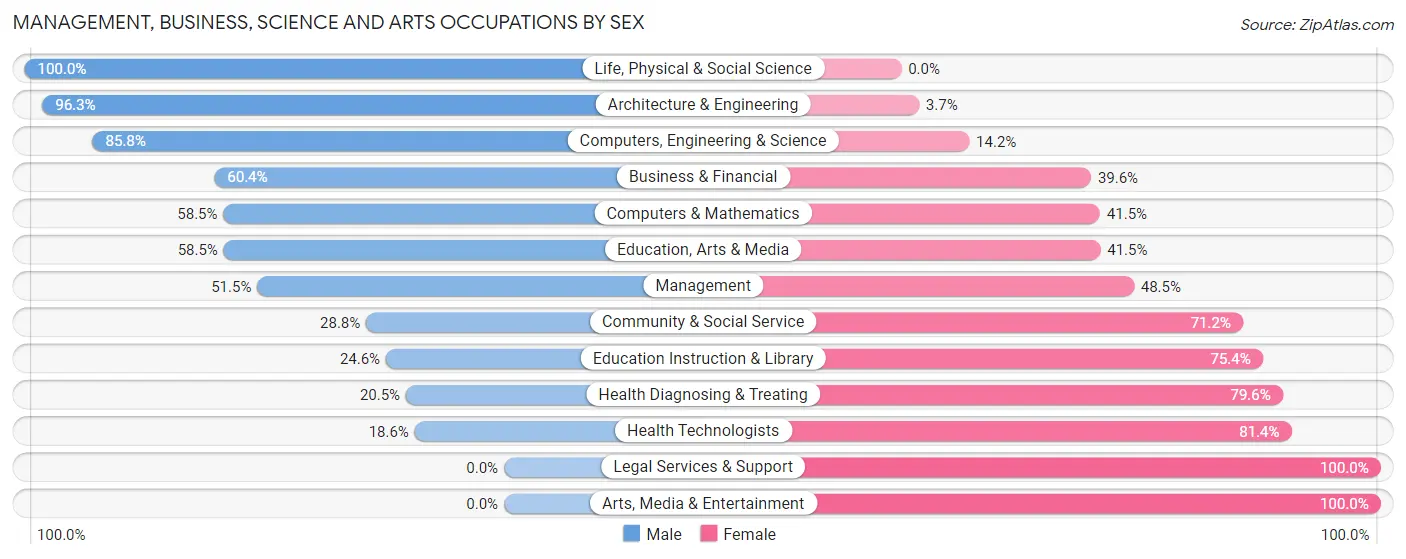
Management, Business, Science and Arts Occupations by Sex
Within the Management, Business, Science and Arts occupations in Gray County, the most male-oriented occupations are Life, Physical & Social Science (100.0%), Architecture & Engineering (96.3%), and Computers, Engineering & Science (85.8%), while the most female-oriented occupations are Legal Services & Support (100.0%), Arts, Media & Entertainment (100.0%), and Health Technologists (81.4%).
| Occupation | Male | Female |
| Management | 350 (51.5%) | 330 (48.5%) |
| Business & Financial | 177 (60.4%) | 116 (39.6%) |
| Computers, Engineering & Science | 236 (85.8%) | 39 (14.2%) |
| Computers & Mathematics | 48 (58.5%) | 34 (41.5%) |
| Architecture & Engineering | 130 (96.3%) | 5 (3.7%) |
| Life, Physical & Social Science | 58 (100.0%) | 0 (0.0%) |
| Community & Social Service | 268 (28.8%) | 664 (71.2%) |
| Education, Arts & Media | 107 (58.5%) | 76 (41.5%) |
| Legal Services & Support | 0 (0.0%) | 33 (100.0%) |
| Education Instruction & Library | 161 (24.6%) | 493 (75.4%) |
| Arts, Media & Entertainment | 0 (0.0%) | 62 (100.0%) |
| Health Diagnosing & Treating | 101 (20.4%) | 393 (79.5%) |
| Health Technologists | 54 (18.6%) | 236 (81.4%) |
| Total (Category) | 1,132 (42.3%) | 1,542 (57.7%) |
| Total (Overall) | 4,936 (54.7%) | 4,092 (45.3%) |
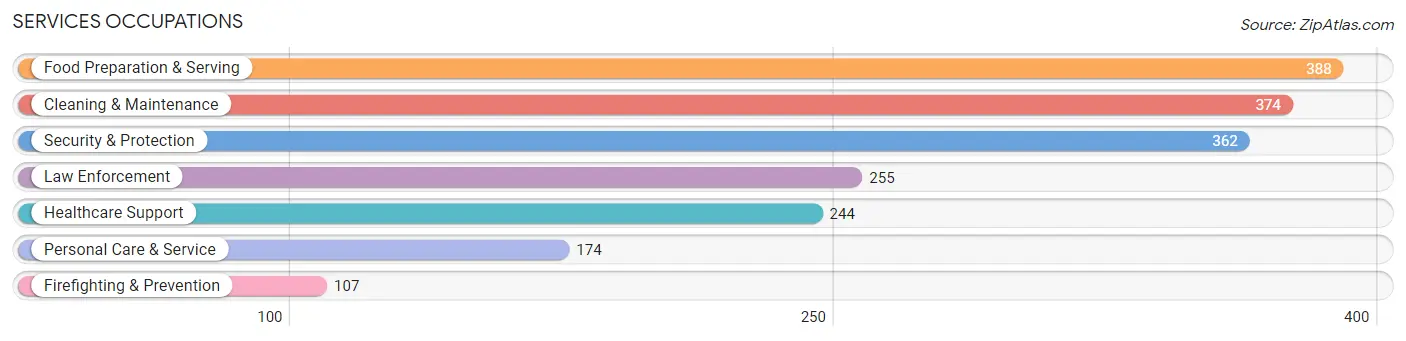
Services Occupations
The most common Services occupations in Gray County are Food Preparation & Serving (388 | 4.3%), Cleaning & Maintenance (374 | 4.1%), Security & Protection (362 | 4.0%), Law Enforcement (255 | 2.8%), and Healthcare Support (244 | 2.7%).
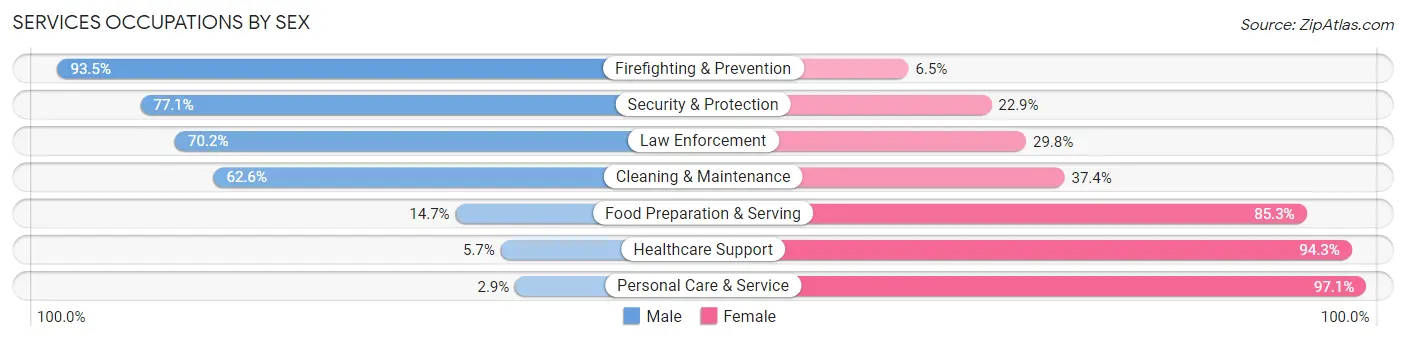
Services Occupations by Sex
Within the Services occupations in Gray County, the most male-oriented occupations are Firefighting & Prevention (93.5%), Security & Protection (77.1%), and Law Enforcement (70.2%), while the most female-oriented occupations are Personal Care & Service (97.1%), Healthcare Support (94.3%), and Food Preparation & Serving (85.3%).
| Occupation | Male | Female |
| Healthcare Support | 14 (5.7%) | 230 (94.3%) |
| Security & Protection | 279 (77.1%) | 83 (22.9%) |
| Firefighting & Prevention | 100 (93.5%) | 7 (6.5%) |
| Law Enforcement | 179 (70.2%) | 76 (29.8%) |
| Food Preparation & Serving | 57 (14.7%) | 331 (85.3%) |
| Cleaning & Maintenance | 234 (62.6%) | 140 (37.4%) |
| Personal Care & Service | 5 (2.9%) | 169 (97.1%) |
| Total (Category) | 589 (38.2%) | 953 (61.8%) |
| Total (Overall) | 4,936 (54.7%) | 4,092 (45.3%) |
Sales and Office Occupations
The most common Sales and Office occupations in Gray County are Office & Administration (1,036 | 11.5%), and Sales & Related (920 | 10.2%).

Sales and Office Occupations by Sex

| Occupation | Male | Female |
| Sales & Related | 416 (45.2%) | 504 (54.8%) |
| Office & Administration | 344 (33.2%) | 692 (66.8%) |
| Total (Category) | 760 (38.9%) | 1,196 (61.2%) |
| Total (Overall) | 4,936 (54.7%) | 4,092 (45.3%) |
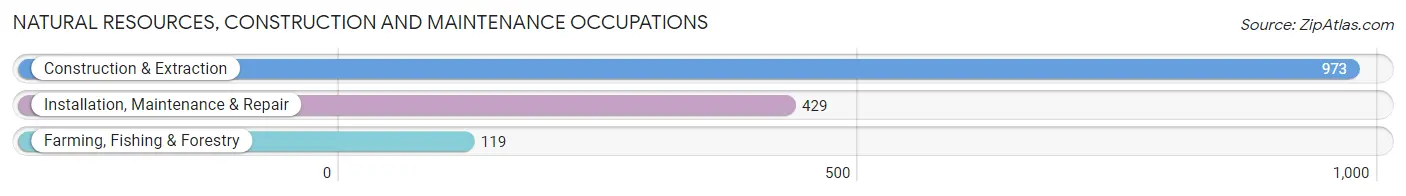
Natural Resources, Construction and Maintenance Occupations
The most common Natural Resources, Construction and Maintenance occupations in Gray County are Construction & Extraction (973 | 10.8%), Installation, Maintenance & Repair (429 | 4.8%), and Farming, Fishing & Forestry (119 | 1.3%).
Natural Resources, Construction and Maintenance Occupations by Sex
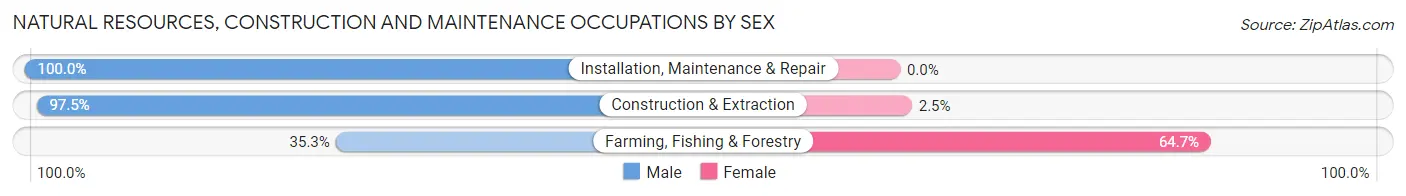
| Occupation | Male | Female |
| Farming, Fishing & Forestry | 42 (35.3%) | 77 (64.7%) |
| Construction & Extraction | 949 (97.5%) | 24 (2.5%) |
| Installation, Maintenance & Repair | 429 (100.0%) | 0 (0.0%) |
| Total (Category) | 1,420 (93.4%) | 101 (6.6%) |
| Total (Overall) | 4,936 (54.7%) | 4,092 (45.3%) |
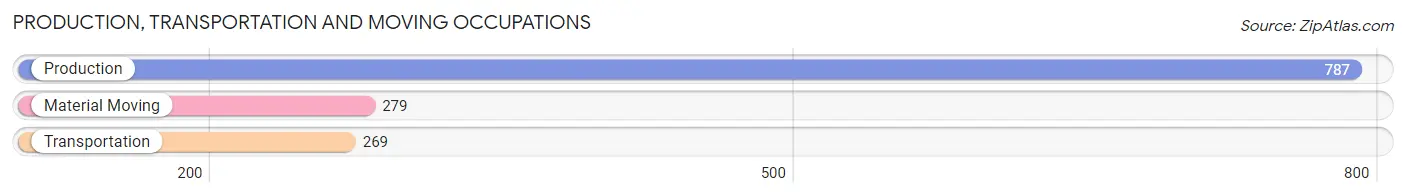
Production, Transportation and Moving Occupations
The most common Production, Transportation and Moving occupations in Gray County are Production (787 | 8.7%), Material Moving (279 | 3.1%), and Transportation (269 | 3.0%).
Production, Transportation and Moving Occupations by Sex
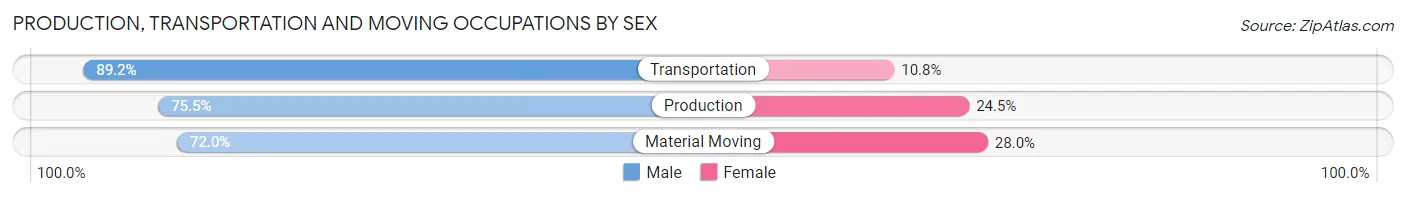
| Occupation | Male | Female |
| Production | 594 (75.5%) | 193 (24.5%) |
| Transportation | 240 (89.2%) | 29 (10.8%) |
| Material Moving | 201 (72.0%) | 78 (28.0%) |
| Total (Category) | 1,035 (77.5%) | 300 (22.5%) |
| Total (Overall) | 4,936 (54.7%) | 4,092 (45.3%) |
Employment Industries by Sex in Gray County
Employment Industries in Gray County
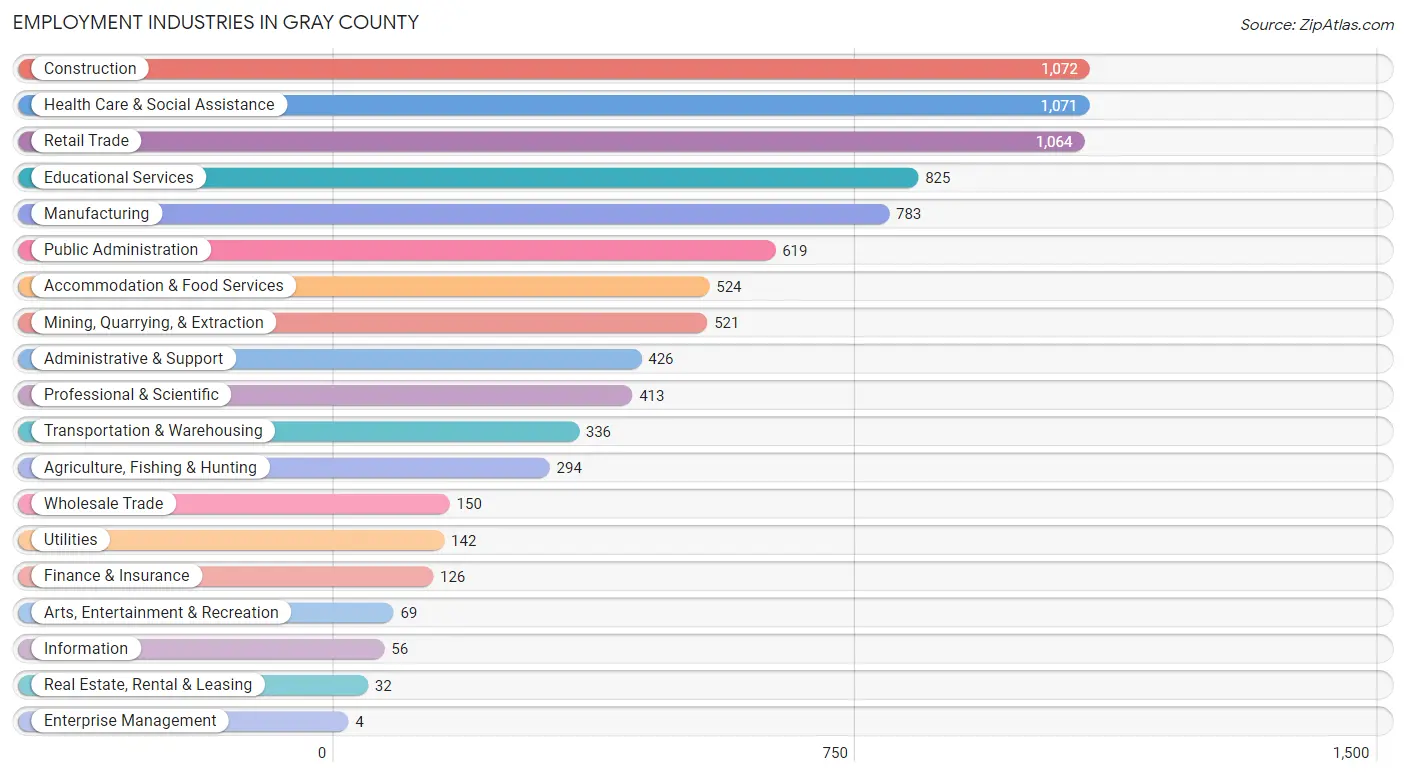
The major employment industries in Gray County include Construction (1,072 | 11.9%), Health Care & Social Assistance (1,071 | 11.9%), Retail Trade (1,064 | 11.8%), Educational Services (825 | 9.1%), and Manufacturing (783 | 8.7%).
Employment Industries by Sex in Gray County
The Gray County industries that see more men than women are Mining, Quarrying, & Extraction (95.2%), Construction (89.5%), and Utilities (80.3%), whereas the industries that tend to have a higher number of women are Real Estate, Rental & Leasing (100.0%), Enterprise Management (100.0%), and Accommodation & Food Services (91.0%).

| Industry | Male | Female |
| Agriculture, Fishing & Hunting | 214 (72.8%) | 80 (27.2%) |
| Mining, Quarrying, & Extraction | 496 (95.2%) | 25 (4.8%) |
| Construction | 960 (89.5%) | 112 (10.4%) |
| Manufacturing | 593 (75.7%) | 190 (24.3%) |
| Wholesale Trade | 86 (57.3%) | 64 (42.7%) |
| Retail Trade | 536 (50.4%) | 528 (49.6%) |
| Transportation & Warehousing | 237 (70.5%) | 99 (29.5%) |
| Utilities | 114 (80.3%) | 28 (19.7%) |
| Information | 41 (73.2%) | 15 (26.8%) |
| Finance & Insurance | 19 (15.1%) | 107 (84.9%) |
| Real Estate, Rental & Leasing | 0 (0.0%) | 32 (100.0%) |
| Professional & Scientific | 284 (68.8%) | 129 (31.2%) |
| Enterprise Management | 0 (0.0%) | 4 (100.0%) |
| Administrative & Support | 282 (66.2%) | 144 (33.8%) |
| Educational Services | 156 (18.9%) | 669 (81.1%) |
| Health Care & Social Assistance | 205 (19.1%) | 866 (80.9%) |
| Arts, Entertainment & Recreation | 42 (60.9%) | 27 (39.1%) |
| Accommodation & Food Services | 47 (9.0%) | 477 (91.0%) |
| Public Administration | 367 (59.3%) | 252 (40.7%) |
| Total | 4,936 (54.7%) | 4,092 (45.3%) |
Education in Gray County
School Enrollment in Gray County
The most common levels of schooling among the 4,937 students in Gray County are elementary school (1,379 | 27.9%), middle school (1,213 | 24.6%), and high school (1,114 | 22.6%).
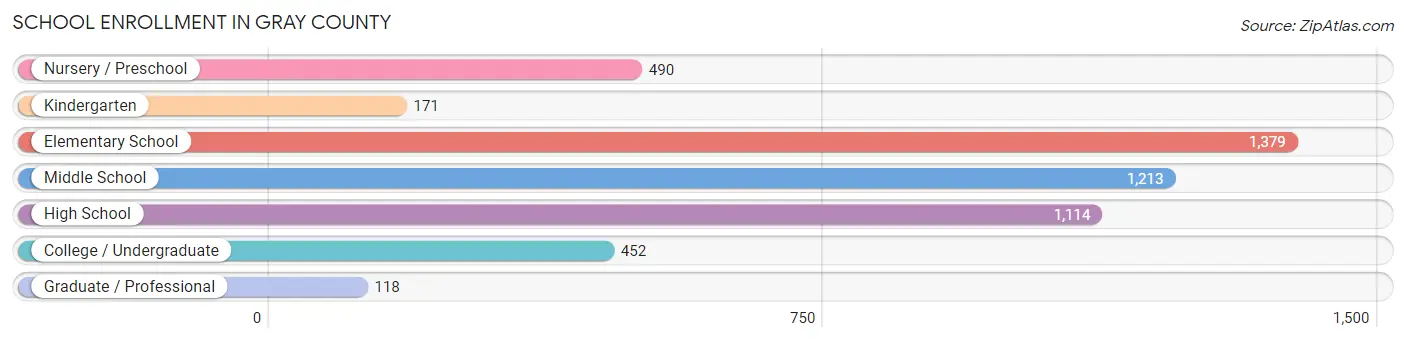
| School Level | # Students | % Students |
| Nursery / Preschool | 490 | 9.9% |
| Kindergarten | 171 | 3.5% |
| Elementary School | 1,379 | 27.9% |
| Middle School | 1,213 | 24.6% |
| High School | 1,114 | 22.6% |
| College / Undergraduate | 452 | 9.2% |
| Graduate / Professional | 118 | 2.4% |
| Total | 4,937 | 100.0% |
School Enrollment by Age by Funding Source in Gray County
Out of a total of 4,937 students who are enrolled in schools in Gray County, 370 (7.5%) attend a private institution, while the remaining 4,567 (92.5%) are enrolled in public schools. The age group of 20 to 24 year olds has the highest likelihood of being enrolled in private schools, with 81 (30.6% in the age bracket) enrolled. Conversely, the age group of 25 to 34 year olds has the lowest likelihood of being enrolled in a private school, with 84 (100.0% in the age bracket) attending a public institution.
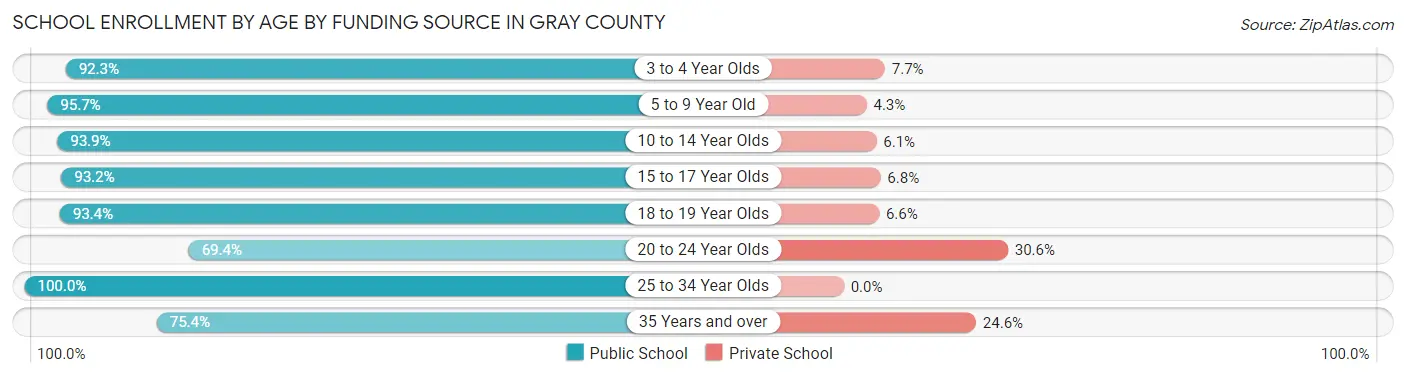
| Age Bracket | Public School | Private School |
| 3 to 4 Year Olds | 373 (92.3%) | 31 (7.7%) |
| 5 to 9 Year Old | 1,417 (95.7%) | 63 (4.3%) |
| 10 to 14 Year Olds | 1,418 (93.9%) | 92 (6.1%) |
| 15 to 17 Year Olds | 803 (93.2%) | 59 (6.8%) |
| 18 to 19 Year Olds | 185 (93.4%) | 13 (6.6%) |
| 20 to 24 Year Olds | 184 (69.4%) | 81 (30.6%) |
| 25 to 34 Year Olds | 84 (100.0%) | 0 (0.0%) |
| 35 Years and over | 101 (75.4%) | 33 (24.6%) |
| Total | 4,567 (92.5%) | 370 (7.5%) |
Educational Attainment by Field of Study in Gray County
Education (585 | 24.9%), business (425 | 18.1%), bio, nature & agricultural (252 | 10.7%), liberal arts & history (206 | 8.8%), and science & technology (177 | 7.5%) are the most common fields of study among 2,350 individuals in Gray County who have obtained a bachelor's degree or higher.
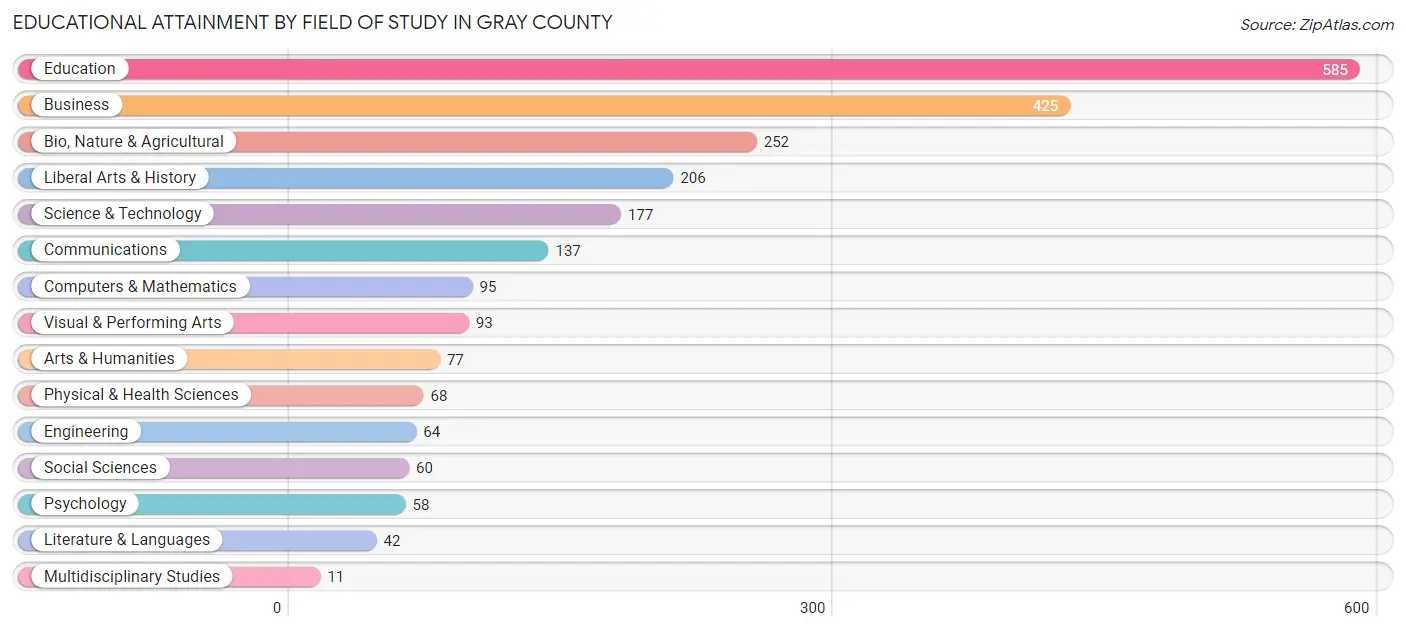
| Field of Study | # Graduates | % Graduates |
| Computers & Mathematics | 95 | 4.0% |
| Bio, Nature & Agricultural | 252 | 10.7% |
| Physical & Health Sciences | 68 | 2.9% |
| Psychology | 58 | 2.5% |
| Social Sciences | 60 | 2.5% |
| Engineering | 64 | 2.7% |
| Multidisciplinary Studies | 11 | 0.5% |
| Science & Technology | 177 | 7.5% |
| Business | 425 | 18.1% |
| Education | 585 | 24.9% |
| Literature & Languages | 42 | 1.8% |
| Liberal Arts & History | 206 | 8.8% |
| Visual & Performing Arts | 93 | 4.0% |
| Communications | 137 | 5.8% |
| Arts & Humanities | 77 | 3.3% |
| Total | 2,350 | 100.0% |
Transportation & Commute in Gray County
Vehicle Availability by Sex in Gray County
The most prevalent vehicle ownership categories in Gray County are males with 2 vehicles (2,220, accounting for 45.7%) and females with 2 vehicles (1,710, making up 55.8%).
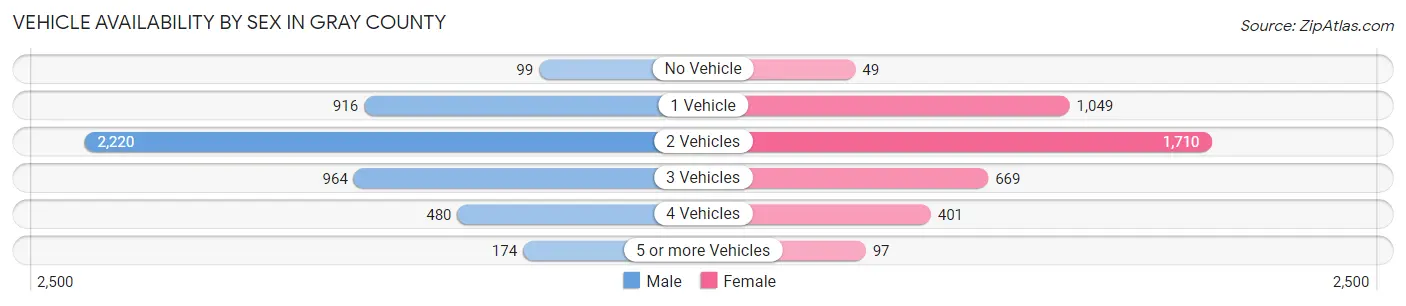
| Vehicles Available | Male | Female |
| No Vehicle | 99 (2.0%) | 49 (1.2%) |
| 1 Vehicle | 916 (18.9%) | 1,049 (26.4%) |
| 2 Vehicles | 2,220 (45.7%) | 1,710 (43.0%) |
| 3 Vehicles | 964 (19.9%) | 669 (16.8%) |
| 4 Vehicles | 480 (9.9%) | 401 (10.1%) |
| 5 or more Vehicles | 174 (3.6%) | 97 (2.4%) |
| Total | 4,853 (100.0%) | 3,975 (100.0%) |
Commute Time in Gray County
The most frequently occuring commute durations in Gray County are 5 to 9 minutes (2,259 commuters, 26.6%), 10 to 14 minutes (1,733 commuters, 20.4%), and less than 5 minutes (1,301 commuters, 15.3%).
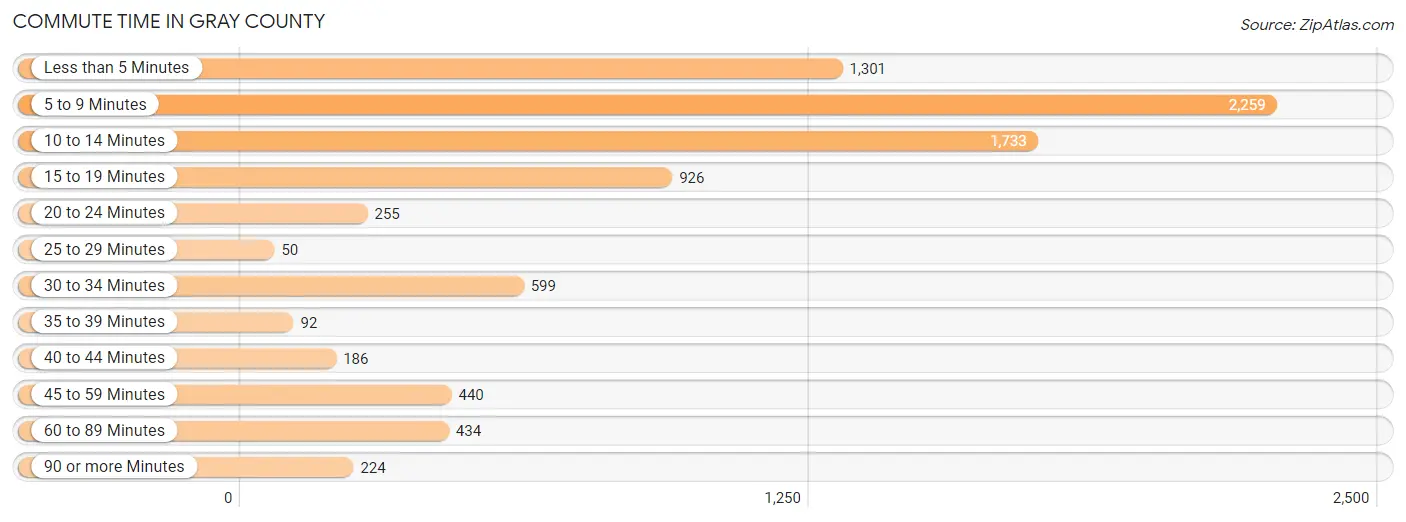
| Commute Time | # Commuters | % Commuters |
| Less than 5 Minutes | 1,301 | 15.3% |
| 5 to 9 Minutes | 2,259 | 26.6% |
| 10 to 14 Minutes | 1,733 | 20.4% |
| 15 to 19 Minutes | 926 | 10.9% |
| 20 to 24 Minutes | 255 | 3.0% |
| 25 to 29 Minutes | 50 | 0.6% |
| 30 to 34 Minutes | 599 | 7.0% |
| 35 to 39 Minutes | 92 | 1.1% |
| 40 to 44 Minutes | 186 | 2.2% |
| 45 to 59 Minutes | 440 | 5.2% |
| 60 to 89 Minutes | 434 | 5.1% |
| 90 or more Minutes | 224 | 2.6% |
Commute Time by Sex in Gray County
The most common commute times in Gray County are 10 to 14 minutes (1,020 commuters, 21.8%) for males and 5 to 9 minutes (1,320 commuters, 34.5%) for females.
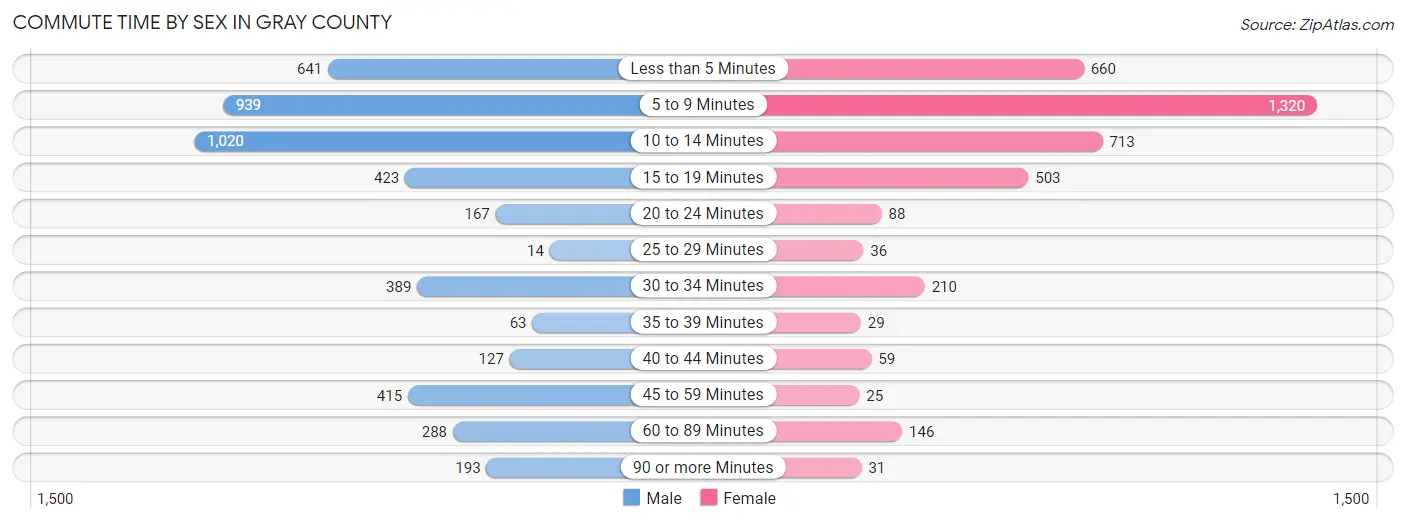
| Commute Time | Male | Female |
| Less than 5 Minutes | 641 (13.7%) | 660 (17.3%) |
| 5 to 9 Minutes | 939 (20.1%) | 1,320 (34.5%) |
| 10 to 14 Minutes | 1,020 (21.8%) | 713 (18.7%) |
| 15 to 19 Minutes | 423 (9.0%) | 503 (13.2%) |
| 20 to 24 Minutes | 167 (3.6%) | 88 (2.3%) |
| 25 to 29 Minutes | 14 (0.3%) | 36 (0.9%) |
| 30 to 34 Minutes | 389 (8.3%) | 210 (5.5%) |
| 35 to 39 Minutes | 63 (1.3%) | 29 (0.8%) |
| 40 to 44 Minutes | 127 (2.7%) | 59 (1.5%) |
| 45 to 59 Minutes | 415 (8.9%) | 25 (0.6%) |
| 60 to 89 Minutes | 288 (6.2%) | 146 (3.8%) |
| 90 or more Minutes | 193 (4.1%) | 31 (0.8%) |
Time of Departure to Work by Sex in Gray County
The most frequent times of departure to work in Gray County are 7:00 AM to 7:29 AM (759, 16.2%) for males and 7:00 AM to 7:29 AM (818, 21.4%) for females.
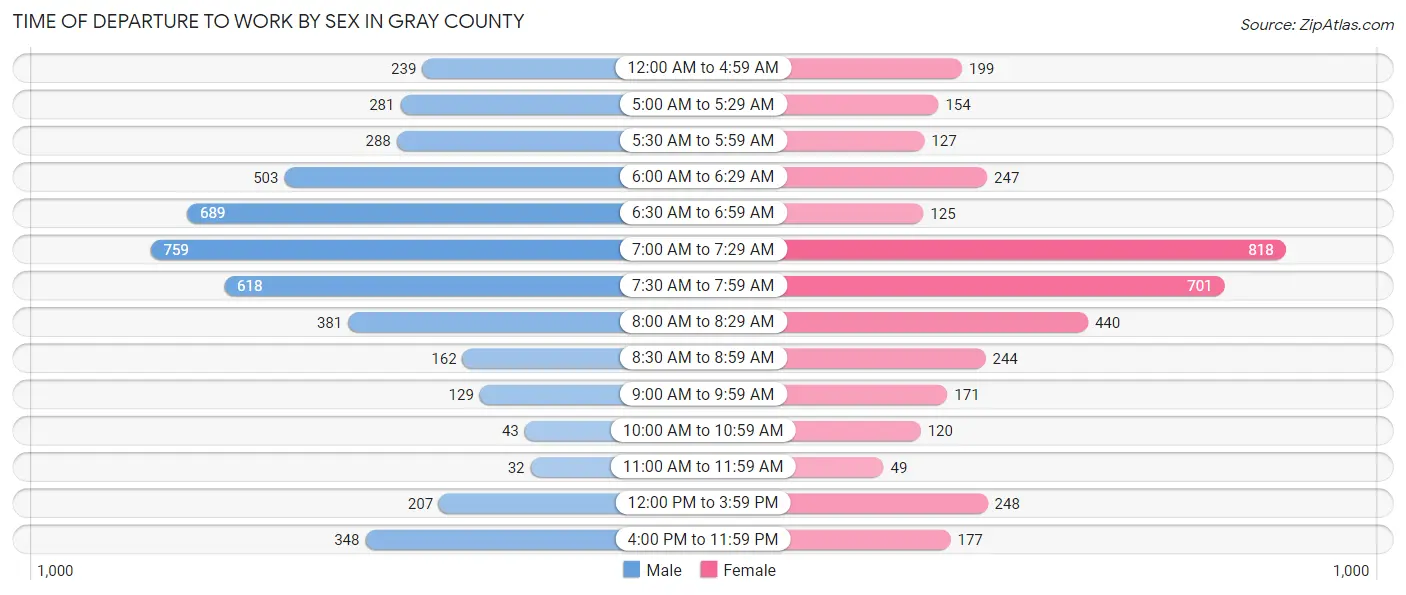
| Time of Departure | Male | Female |
| 12:00 AM to 4:59 AM | 239 (5.1%) | 199 (5.2%) |
| 5:00 AM to 5:29 AM | 281 (6.0%) | 154 (4.0%) |
| 5:30 AM to 5:59 AM | 288 (6.2%) | 127 (3.3%) |
| 6:00 AM to 6:29 AM | 503 (10.7%) | 247 (6.5%) |
| 6:30 AM to 6:59 AM | 689 (14.7%) | 125 (3.3%) |
| 7:00 AM to 7:29 AM | 759 (16.2%) | 818 (21.4%) |
| 7:30 AM to 7:59 AM | 618 (13.2%) | 701 (18.3%) |
| 8:00 AM to 8:29 AM | 381 (8.1%) | 440 (11.5%) |
| 8:30 AM to 8:59 AM | 162 (3.5%) | 244 (6.4%) |
| 9:00 AM to 9:59 AM | 129 (2.8%) | 171 (4.5%) |
| 10:00 AM to 10:59 AM | 43 (0.9%) | 120 (3.1%) |
| 11:00 AM to 11:59 AM | 32 (0.7%) | 49 (1.3%) |
| 12:00 PM to 3:59 PM | 207 (4.4%) | 248 (6.5%) |
| 4:00 PM to 11:59 PM | 348 (7.4%) | 177 (4.6%) |
| Total | 4,679 (100.0%) | 3,820 (100.0%) |
Housing Occupancy in Gray County
Occupancy by Ownership in Gray County
Of the total 8,021 dwellings in Gray County, owner-occupied units account for 5,648 (70.4%), while renter-occupied units make up 2,373 (29.6%).
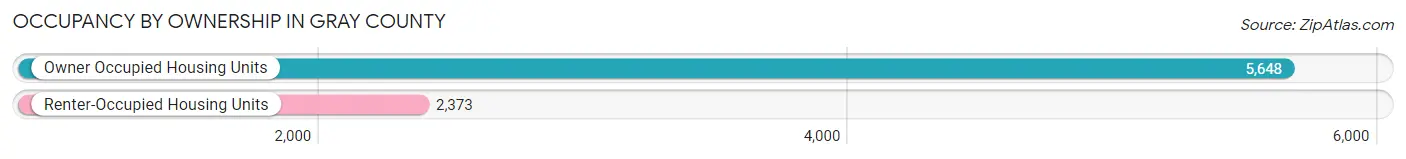
| Occupancy | # Housing Units | % Housing Units |
| Owner Occupied Housing Units | 5,648 | 70.4% |
| Renter-Occupied Housing Units | 2,373 | 29.6% |
| Total Occupied Housing Units | 8,021 | 100.0% |
Occupancy by Household Size in Gray County
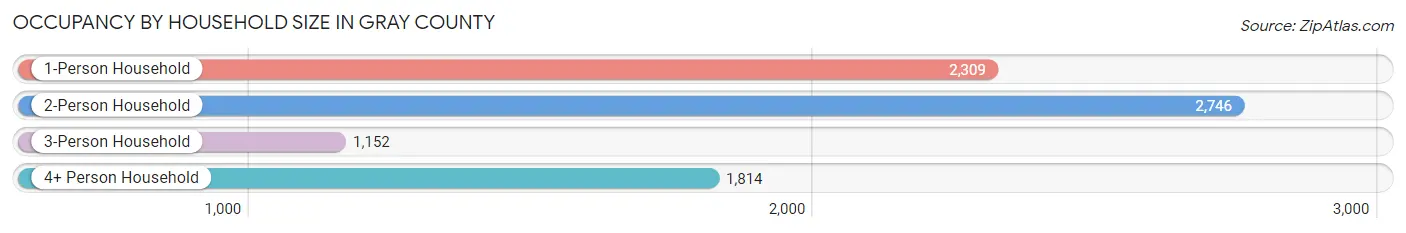
| Household Size | # Housing Units | % Housing Units |
| 1-Person Household | 2,309 | 28.8% |
| 2-Person Household | 2,746 | 34.2% |
| 3-Person Household | 1,152 | 14.4% |
| 4+ Person Household | 1,814 | 22.6% |
| Total Housing Units | 8,021 | 100.0% |
Occupancy by Ownership by Household Size in Gray County
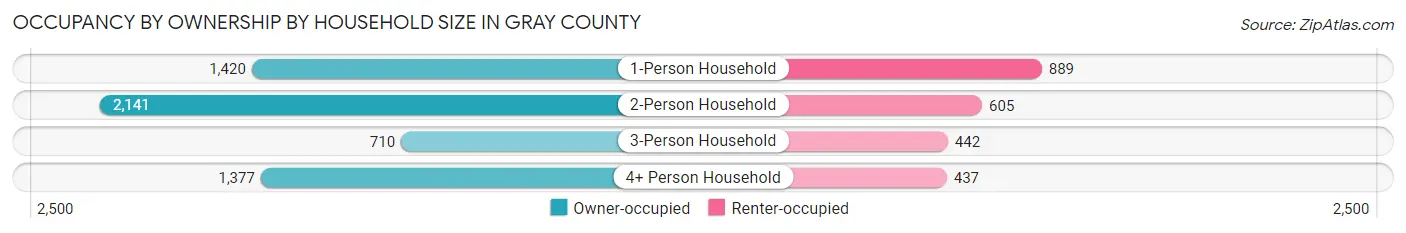
| Household Size | Owner-occupied | Renter-occupied |
| 1-Person Household | 1,420 (61.5%) | 889 (38.5%) |
| 2-Person Household | 2,141 (78.0%) | 605 (22.0%) |
| 3-Person Household | 710 (61.6%) | 442 (38.4%) |
| 4+ Person Household | 1,377 (75.9%) | 437 (24.1%) |
| Total Housing Units | 5,648 (70.4%) | 2,373 (29.6%) |
Occupancy by Educational Attainment in Gray County
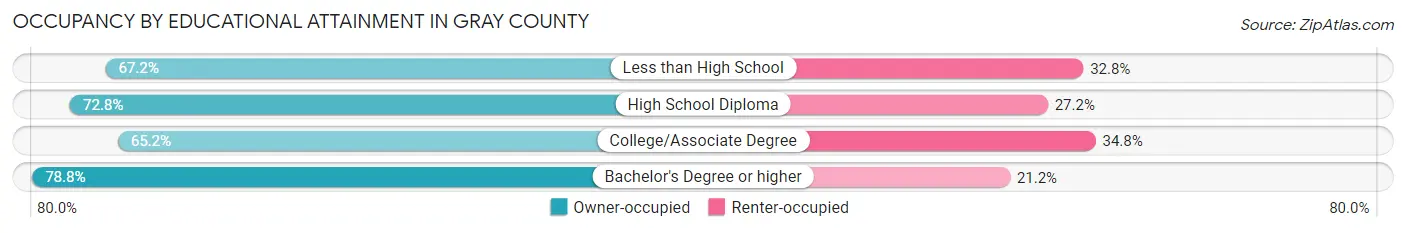
| Household Size | Owner-occupied | Renter-occupied |
| Less than High School | 824 (67.2%) | 403 (32.8%) |
| High School Diploma | 1,883 (72.8%) | 704 (27.2%) |
| College/Associate Degree | 1,794 (65.2%) | 957 (34.8%) |
| Bachelor's Degree or higher | 1,147 (78.8%) | 309 (21.2%) |
Occupancy by Age of Householder in Gray County
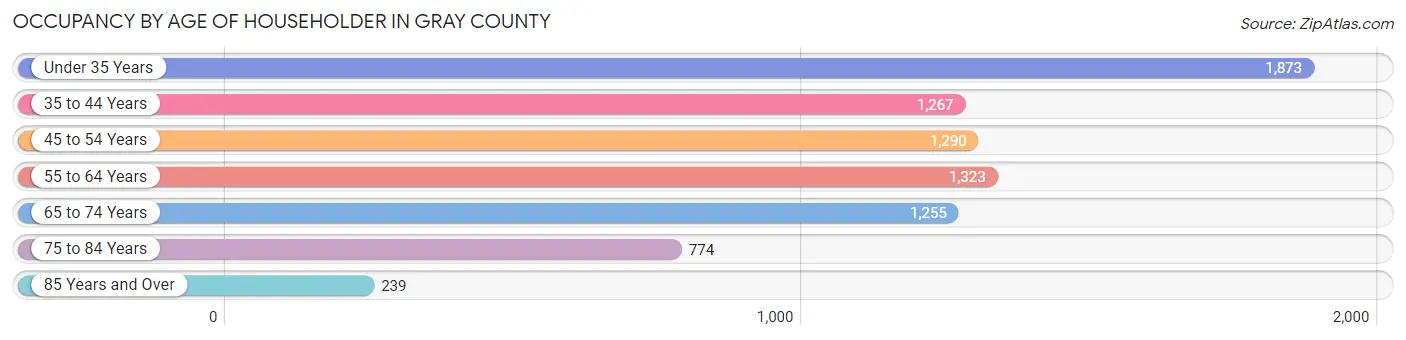
| Age Bracket | # Households | % Households |
| Under 35 Years | 1,873 | 23.4% |
| 35 to 44 Years | 1,267 | 15.8% |
| 45 to 54 Years | 1,290 | 16.1% |
| 55 to 64 Years | 1,323 | 16.5% |
| 65 to 74 Years | 1,255 | 15.7% |
| 75 to 84 Years | 774 | 9.7% |
| 85 Years and Over | 239 | 3.0% |
| Total | 8,021 | 100.0% |
Housing Finances in Gray County
Median Income by Occupancy in Gray County
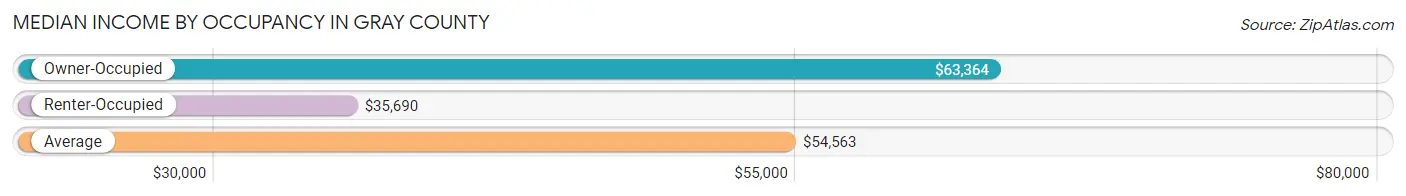
| Occupancy Type | # Households | Median Income |
| Owner-Occupied | 5,648 (70.4%) | $63,364 |
| Renter-Occupied | 2,373 (29.6%) | $35,690 |
| Average | 8,021 (100.0%) | $54,563 |
Occupancy by Householder Income Bracket in Gray County
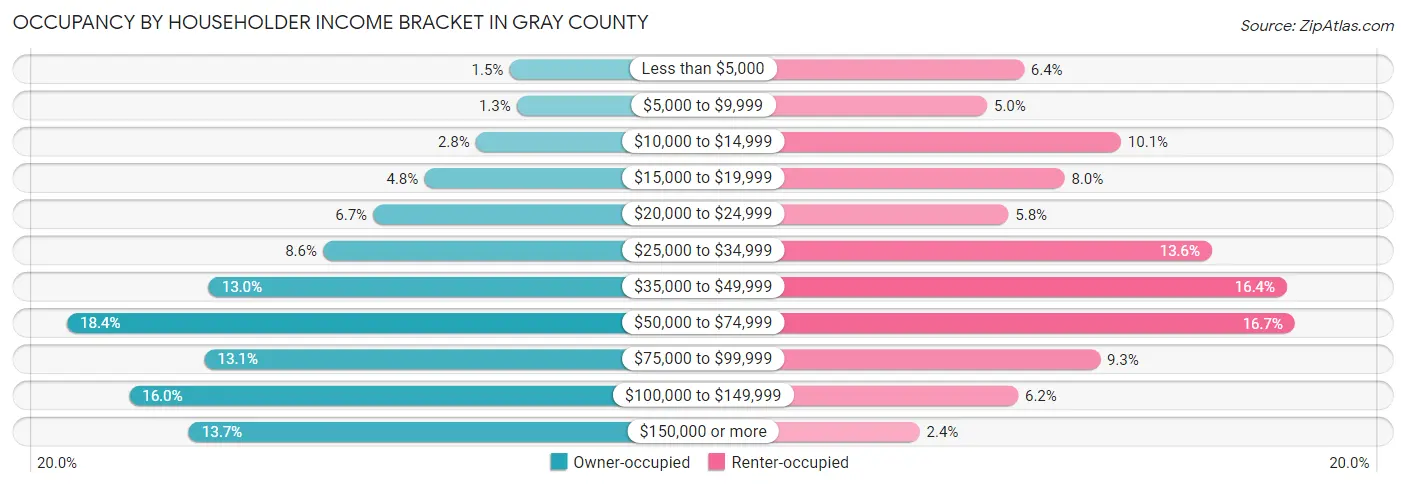
| Income Bracket | Owner-occupied | Renter-occupied |
| Less than $5,000 | 87 (1.5%) | 152 (6.4%) |
| $5,000 to $9,999 | 71 (1.3%) | 119 (5.0%) |
| $10,000 to $14,999 | 159 (2.8%) | 240 (10.1%) |
| $15,000 to $19,999 | 270 (4.8%) | 189 (8.0%) |
| $20,000 to $24,999 | 380 (6.7%) | 138 (5.8%) |
| $25,000 to $34,999 | 488 (8.6%) | 322 (13.6%) |
| $35,000 to $49,999 | 733 (13.0%) | 390 (16.4%) |
| $50,000 to $74,999 | 1,038 (18.4%) | 397 (16.7%) |
| $75,000 to $99,999 | 742 (13.1%) | 221 (9.3%) |
| $100,000 to $149,999 | 904 (16.0%) | 147 (6.2%) |
| $150,000 or more | 776 (13.7%) | 58 (2.4%) |
| Total | 5,648 (100.0%) | 2,373 (100.0%) |
Monthly Housing Cost Tiers in Gray County
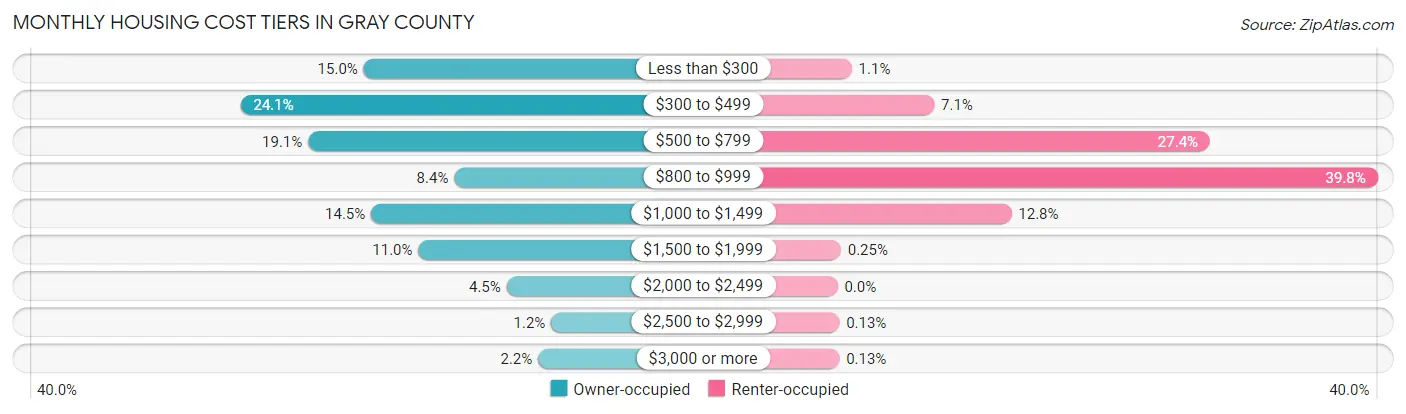
| Monthly Cost | Owner-occupied | Renter-occupied |
| Less than $300 | 849 (15.0%) | 25 (1.1%) |
| $300 to $499 | 1,362 (24.1%) | 169 (7.1%) |
| $500 to $799 | 1,080 (19.1%) | 651 (27.4%) |
| $800 to $999 | 472 (8.4%) | 944 (39.8%) |
| $1,000 to $1,499 | 818 (14.5%) | 304 (12.8%) |
| $1,500 to $1,999 | 621 (11.0%) | 6 (0.3%) |
| $2,000 to $2,499 | 254 (4.5%) | 0 (0.0%) |
| $2,500 to $2,999 | 69 (1.2%) | 3 (0.1%) |
| $3,000 or more | 123 (2.2%) | 3 (0.1%) |
| Total | 5,648 (100.0%) | 2,373 (100.0%) |
Physical Housing Characteristics in Gray County
Housing Structures in Gray County
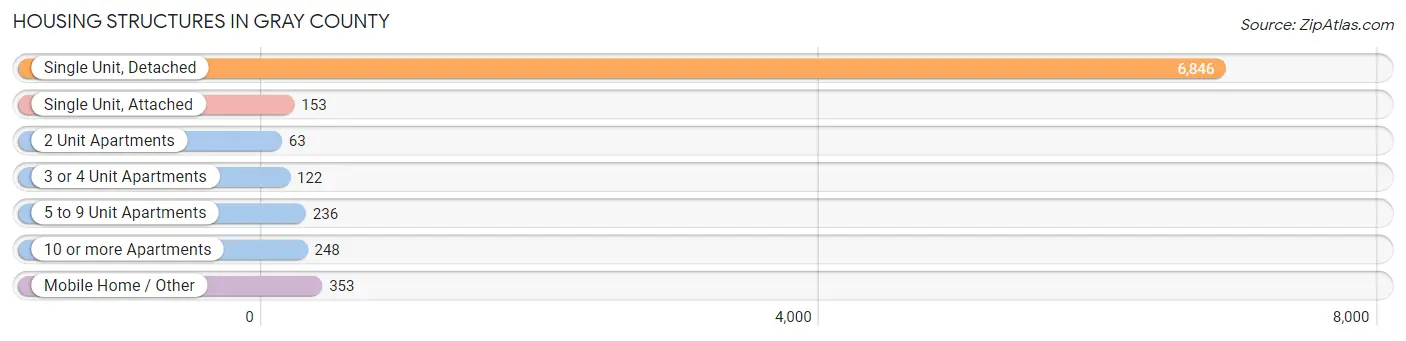
| Structure Type | # Housing Units | % Housing Units |
| Single Unit, Detached | 6,846 | 85.4% |
| Single Unit, Attached | 153 | 1.9% |
| 2 Unit Apartments | 63 | 0.8% |
| 3 or 4 Unit Apartments | 122 | 1.5% |
| 5 to 9 Unit Apartments | 236 | 2.9% |
| 10 or more Apartments | 248 | 3.1% |
| Mobile Home / Other | 353 | 4.4% |
| Total | 8,021 | 100.0% |
Housing Structures by Occupancy in Gray County
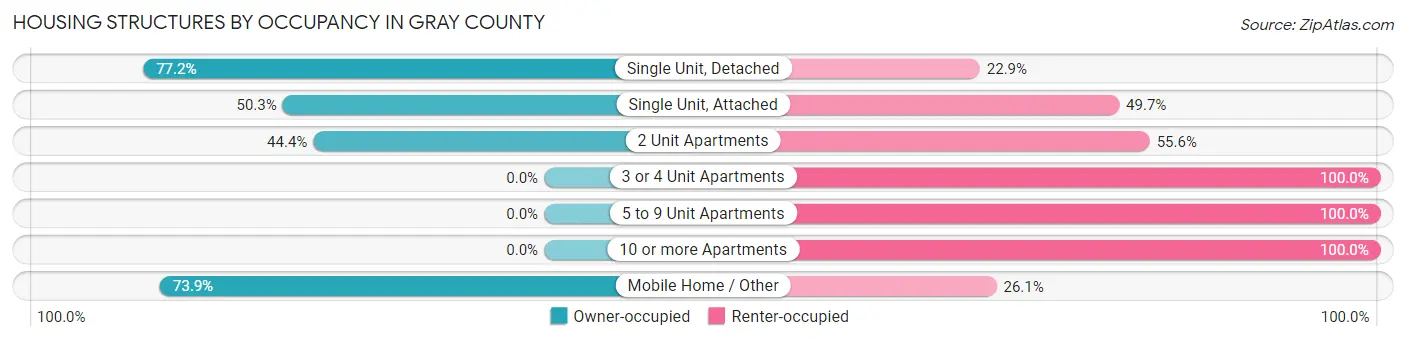
| Structure Type | Owner-occupied | Renter-occupied |
| Single Unit, Detached | 5,282 (77.1%) | 1,564 (22.9%) |
| Single Unit, Attached | 77 (50.3%) | 76 (49.7%) |
| 2 Unit Apartments | 28 (44.4%) | 35 (55.6%) |
| 3 or 4 Unit Apartments | 0 (0.0%) | 122 (100.0%) |
| 5 to 9 Unit Apartments | 0 (0.0%) | 236 (100.0%) |
| 10 or more Apartments | 0 (0.0%) | 248 (100.0%) |
| Mobile Home / Other | 261 (73.9%) | 92 (26.1%) |
| Total | 5,648 (70.4%) | 2,373 (29.6%) |
Housing Structures by Number of Rooms in Gray County
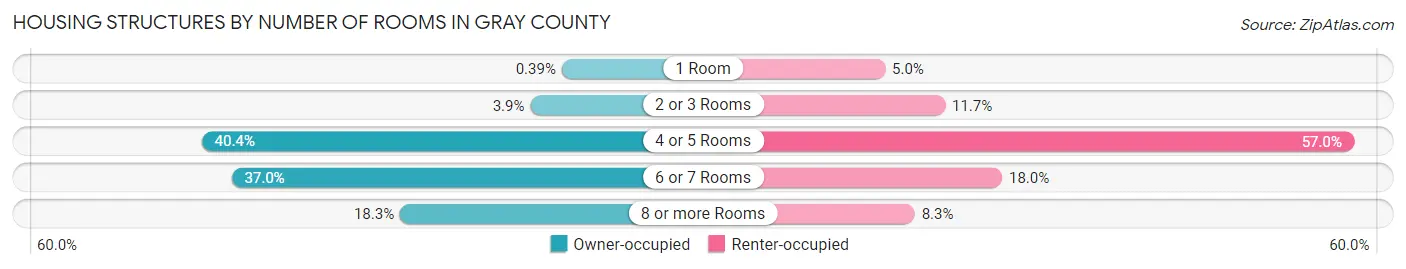
| Number of Rooms | Owner-occupied | Renter-occupied |
| 1 Room | 22 (0.4%) | 119 (5.0%) |
| 2 or 3 Rooms | 219 (3.9%) | 277 (11.7%) |
| 4 or 5 Rooms | 2,279 (40.4%) | 1,353 (57.0%) |
| 6 or 7 Rooms | 2,092 (37.0%) | 427 (18.0%) |
| 8 or more Rooms | 1,036 (18.3%) | 197 (8.3%) |
| Total | 5,648 (100.0%) | 2,373 (100.0%) |
Housing Structure by Heating Type in Gray County
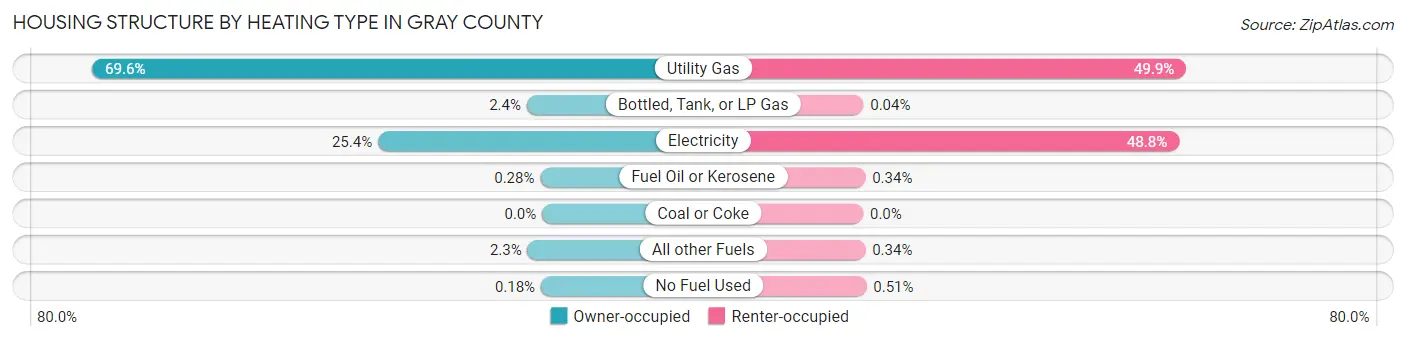
| Heating Type | Owner-occupied | Renter-occupied |
| Utility Gas | 3,928 (69.6%) | 1,185 (49.9%) |
| Bottled, Tank, or LP Gas | 134 (2.4%) | 1 (0.0%) |
| Electricity | 1,433 (25.4%) | 1,159 (48.8%) |
| Fuel Oil or Kerosene | 16 (0.3%) | 8 (0.3%) |
| Coal or Coke | 0 (0.0%) | 0 (0.0%) |
| All other Fuels | 127 (2.2%) | 8 (0.3%) |
| No Fuel Used | 10 (0.2%) | 12 (0.5%) |
| Total | 5,648 (100.0%) | 2,373 (100.0%) |
Household Vehicle Usage in Gray County
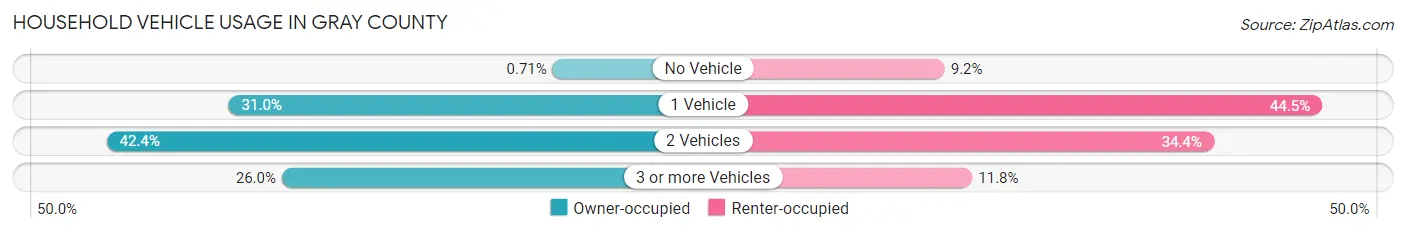
| Vehicles per Household | Owner-occupied | Renter-occupied |
| No Vehicle | 40 (0.7%) | 219 (9.2%) |
| 1 Vehicle | 1,748 (30.9%) | 1,057 (44.5%) |
| 2 Vehicles | 2,392 (42.3%) | 817 (34.4%) |
| 3 or more Vehicles | 1,468 (26.0%) | 280 (11.8%) |
| Total | 5,648 (100.0%) | 2,373 (100.0%) |
Real Estate & Mortgages in Gray County
Real Estate and Mortgage Overview in Gray County
| Characteristic | Without Mortgage | With Mortgage |
| Housing Units | 3,449 | 2,199 |
| Median Property Value | $77,800 | $144,000 |
| Median Household Income | $54,297 | $423 |
| Monthly Housing Costs | $436 | $105 |
| Real Estate Taxes | $731 | $71 |
Property Value by Mortgage Status in Gray County
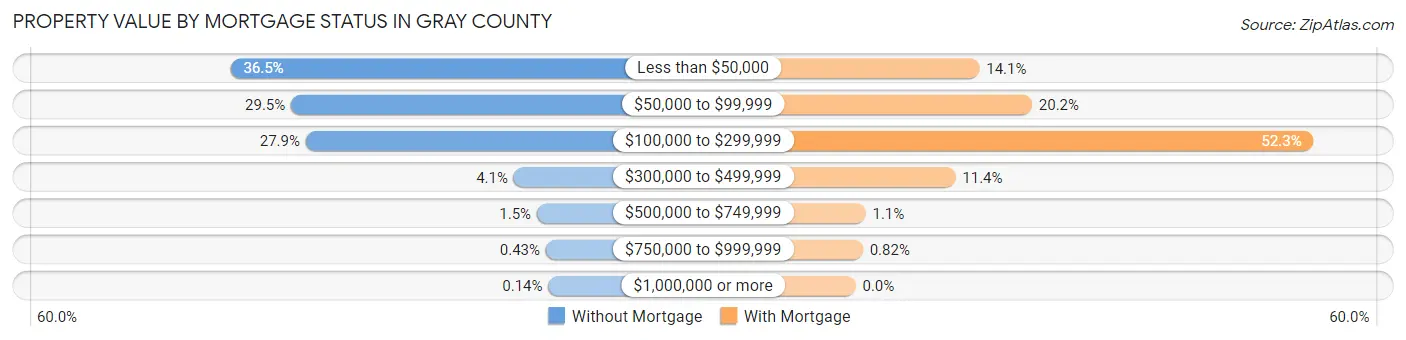
| Property Value | Without Mortgage | With Mortgage |
| Less than $50,000 | 1,258 (36.5%) | 311 (14.1%) |
| $50,000 to $99,999 | 1,019 (29.5%) | 443 (20.2%) |
| $100,000 to $299,999 | 961 (27.9%) | 1,151 (52.3%) |
| $300,000 to $499,999 | 141 (4.1%) | 251 (11.4%) |
| $500,000 to $749,999 | 50 (1.5%) | 25 (1.1%) |
| $750,000 to $999,999 | 15 (0.4%) | 18 (0.8%) |
| $1,000,000 or more | 5 (0.1%) | 0 (0.0%) |
| Total | 3,449 (100.0%) | 2,199 (100.0%) |
Household Income by Mortgage Status in Gray County
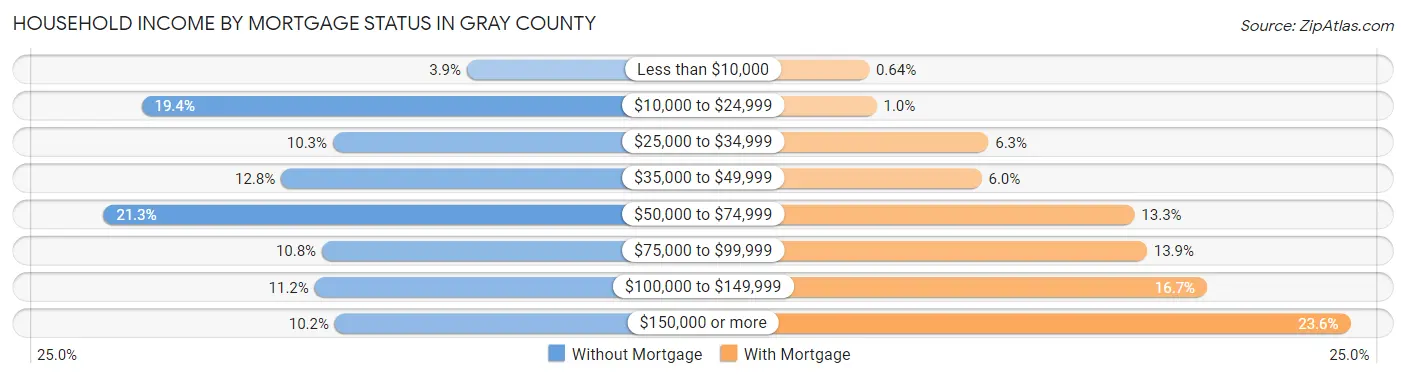
| Household Income | Without Mortgage | With Mortgage |
| Less than $10,000 | 136 (3.9%) | 14 (0.6%) |
| $10,000 to $24,999 | 670 (19.4%) | 22 (1.0%) |
| $25,000 to $34,999 | 356 (10.3%) | 139 (6.3%) |
| $35,000 to $49,999 | 441 (12.8%) | 132 (6.0%) |
| $50,000 to $74,999 | 733 (21.2%) | 292 (13.3%) |
| $75,000 to $99,999 | 374 (10.8%) | 305 (13.9%) |
| $100,000 to $149,999 | 386 (11.2%) | 368 (16.7%) |
| $150,000 or more | 353 (10.2%) | 518 (23.6%) |
| Total | 3,449 (100.0%) | 2,199 (100.0%) |
Property Value to Household Income Ratio in Gray County
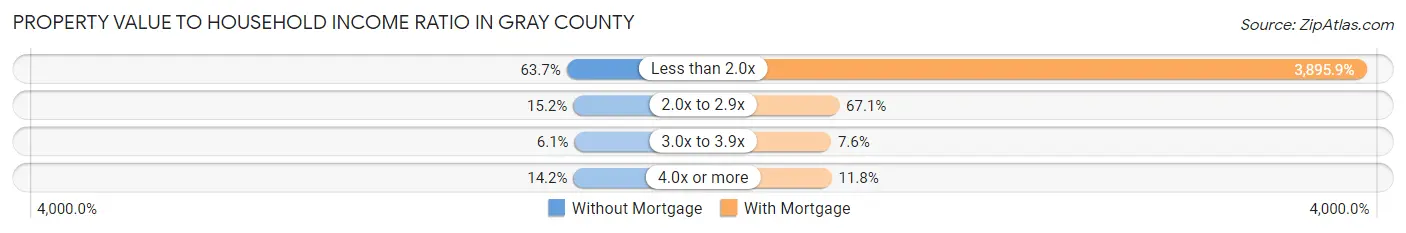
| Value-to-Income Ratio | Without Mortgage | With Mortgage |
| Less than 2.0x | 2,196 (63.7%) | 85,670 (3,895.9%) |
| 2.0x to 2.9x | 525 (15.2%) | 1,476 (67.1%) |
| 3.0x to 3.9x | 209 (6.1%) | 168 (7.6%) |
| 4.0x or more | 489 (14.2%) | 259 (11.8%) |
| Total | 3,449 (100.0%) | 2,199 (100.0%) |
Real Estate Taxes by Mortgage Status in Gray County
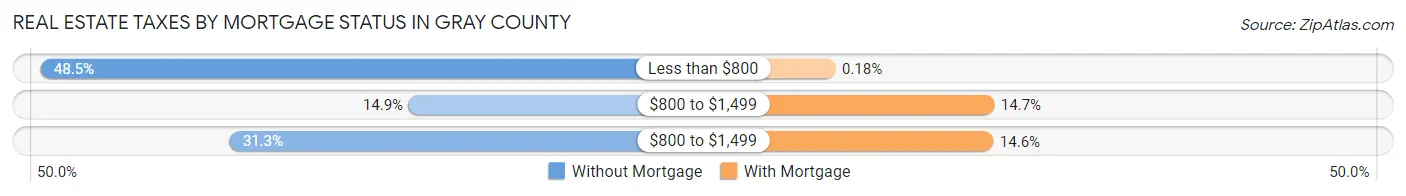
| Property Taxes | Without Mortgage | With Mortgage |
| Less than $800 | 1,673 (48.5%) | 4 (0.2%) |
| $800 to $1,499 | 514 (14.9%) | 323 (14.7%) |
| $800 to $1,499 | 1,078 (31.3%) | 321 (14.6%) |
| Total | 3,449 (100.0%) | 2,199 (100.0%) |
Health & Disability in Gray County
Health Insurance Coverage by Age in Gray County
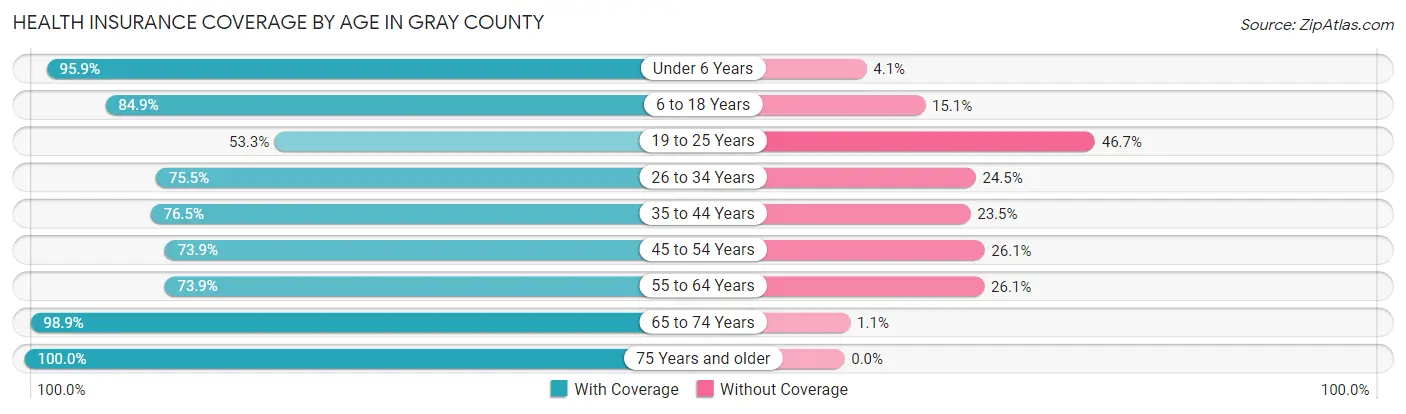
| Age Bracket | With Coverage | Without Coverage |
| Under 6 Years | 1,517 (95.9%) | 65 (4.1%) |
| 6 to 18 Years | 3,339 (84.9%) | 592 (15.1%) |
| 19 to 25 Years | 1,030 (53.3%) | 903 (46.7%) |
| 26 to 34 Years | 1,570 (75.5%) | 509 (24.5%) |
| 35 to 44 Years | 1,762 (76.5%) | 541 (23.5%) |
| 45 to 54 Years | 1,671 (73.9%) | 591 (26.1%) |
| 55 to 64 Years | 1,713 (73.9%) | 604 (26.1%) |
| 65 to 74 Years | 1,809 (98.9%) | 20 (1.1%) |
| 75 Years and older | 1,417 (100.0%) | 0 (0.0%) |
| Total | 15,828 (80.5%) | 3,825 (19.5%) |
Health Insurance Coverage by Citizenship Status in Gray County
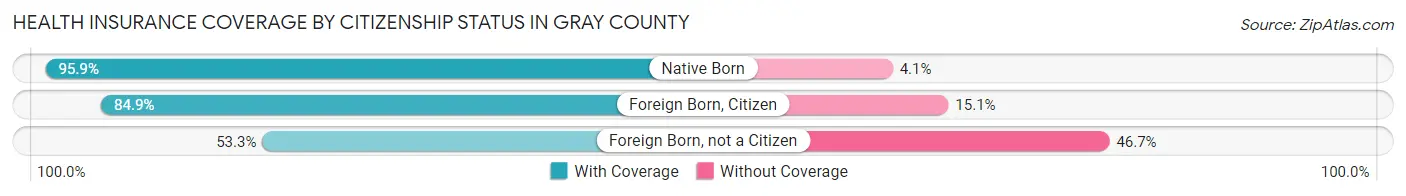
| Citizenship Status | With Coverage | Without Coverage |
| Native Born | 1,517 (95.9%) | 65 (4.1%) |
| Foreign Born, Citizen | 3,339 (84.9%) | 592 (15.1%) |
| Foreign Born, not a Citizen | 1,030 (53.3%) | 903 (46.7%) |
Health Insurance Coverage by Household Income in Gray County
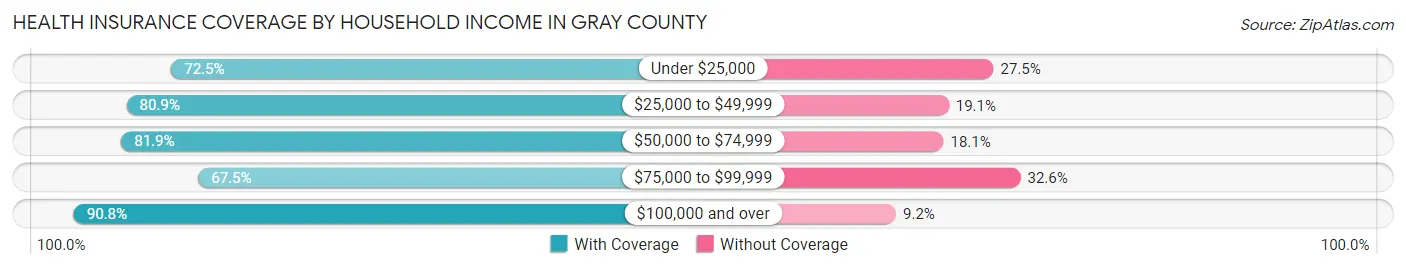
| Household Income | With Coverage | Without Coverage |
| Under $25,000 | 2,411 (72.5%) | 914 (27.5%) |
| $25,000 to $49,999 | 3,563 (80.9%) | 842 (19.1%) |
| $50,000 to $74,999 | 2,632 (81.9%) | 583 (18.1%) |
| $75,000 to $99,999 | 1,969 (67.4%) | 950 (32.6%) |
| $100,000 and over | 5,231 (90.8%) | 532 (9.2%) |
Public vs Private Health Insurance Coverage by Age in Gray County
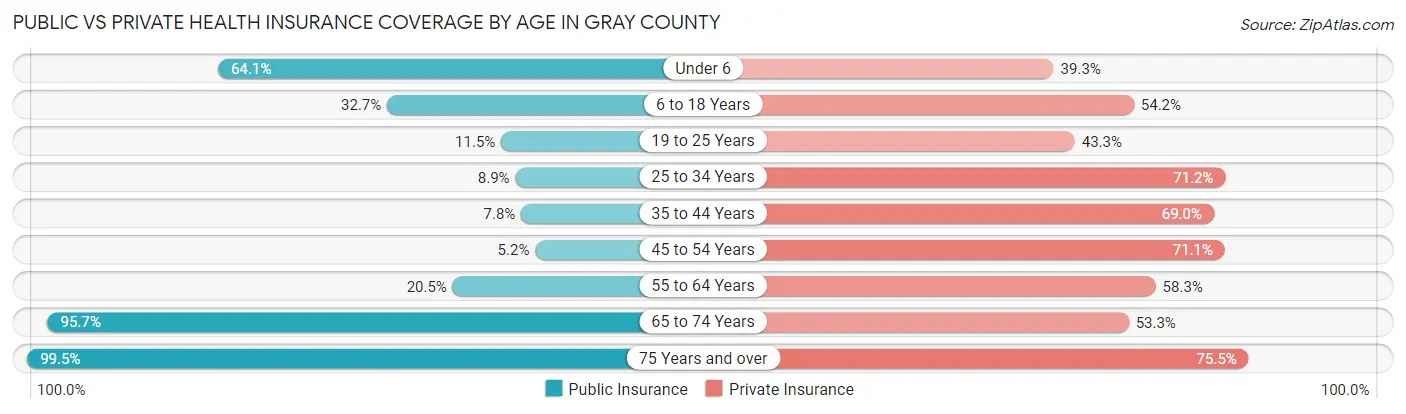
| Age Bracket | Public Insurance | Private Insurance |
| Under 6 | 1,014 (64.1%) | 622 (39.3%) |
| 6 to 18 Years | 1,286 (32.7%) | 2,131 (54.2%) |
| 19 to 25 Years | 223 (11.5%) | 836 (43.2%) |
| 25 to 34 Years | 185 (8.9%) | 1,480 (71.2%) |
| 35 to 44 Years | 180 (7.8%) | 1,590 (69.0%) |
| 45 to 54 Years | 118 (5.2%) | 1,608 (71.1%) |
| 55 to 64 Years | 476 (20.5%) | 1,350 (58.3%) |
| 65 to 74 Years | 1,751 (95.7%) | 974 (53.2%) |
| 75 Years and over | 1,410 (99.5%) | 1,070 (75.5%) |
| Total | 6,643 (33.8%) | 11,661 (59.3%) |
Disability Status by Sex by Age in Gray County
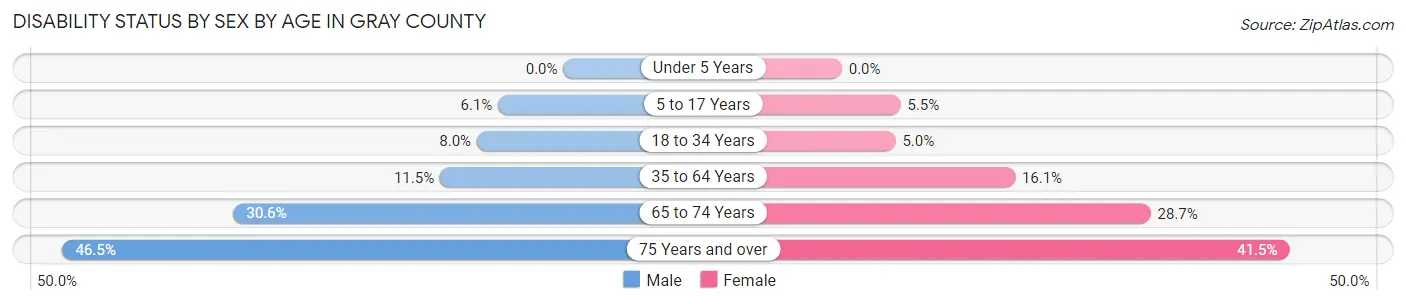
| Age Bracket | Male | Female |
| Under 5 Years | 0 (0.0%) | 0 (0.0%) |
| 5 to 17 Years | 127 (6.0%) | 105 (5.4%) |
| 18 to 34 Years | 171 (8.0%) | 101 (5.0%) |
| 35 to 64 Years | 399 (11.5%) | 546 (16.1%) |
| 65 to 74 Years | 263 (30.6%) | 278 (28.7%) |
| 75 Years and over | 277 (46.5%) | 341 (41.5%) |
Disability Class by Sex by Age in Gray County
Disability Class: Hearing Difficulty
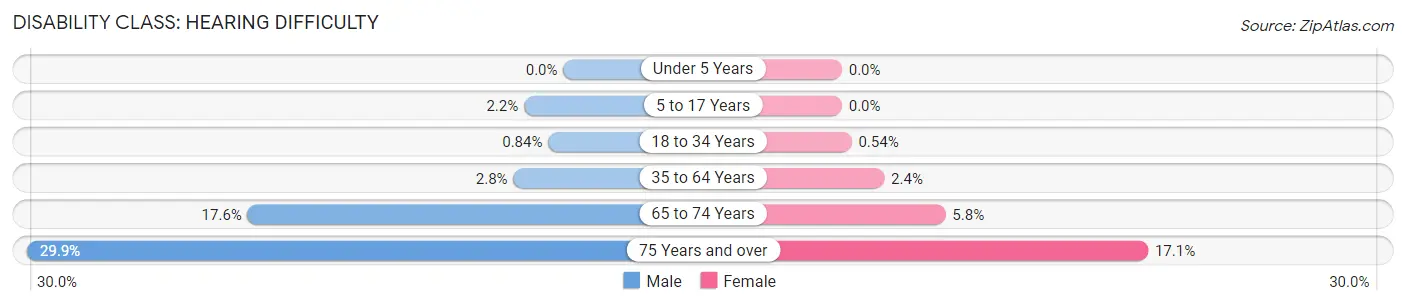
| Age Bracket | Male | Female |
| Under 5 Years | 0 (0.0%) | 0 (0.0%) |
| 5 to 17 Years | 46 (2.2%) | 0 (0.0%) |
| 18 to 34 Years | 18 (0.8%) | 11 (0.5%) |
| 35 to 64 Years | 97 (2.8%) | 80 (2.4%) |
| 65 to 74 Years | 151 (17.6%) | 56 (5.8%) |
| 75 Years and over | 178 (29.9%) | 140 (17.1%) |
Disability Class: Vision Difficulty
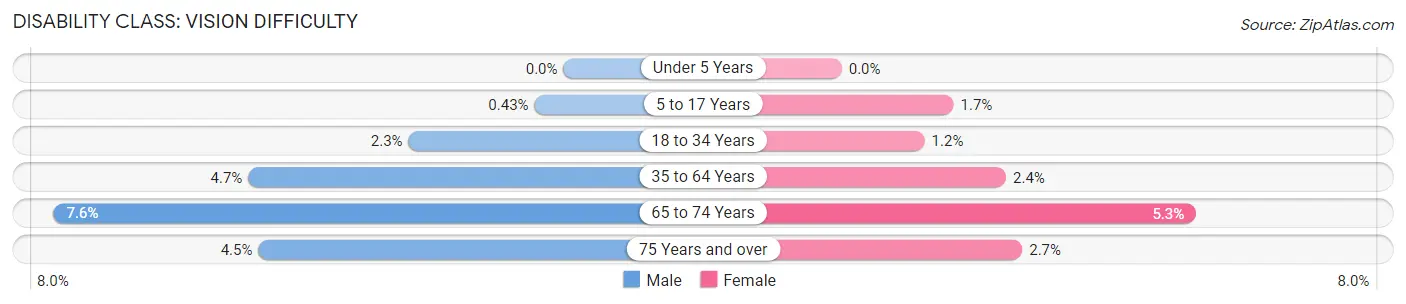
| Age Bracket | Male | Female |
| Under 5 Years | 0 (0.0%) | 0 (0.0%) |
| 5 to 17 Years | 9 (0.4%) | 32 (1.7%) |
| 18 to 34 Years | 49 (2.3%) | 25 (1.2%) |
| 35 to 64 Years | 163 (4.7%) | 83 (2.4%) |
| 65 to 74 Years | 65 (7.6%) | 51 (5.3%) |
| 75 Years and over | 27 (4.5%) | 22 (2.7%) |
Disability Class: Cognitive Difficulty
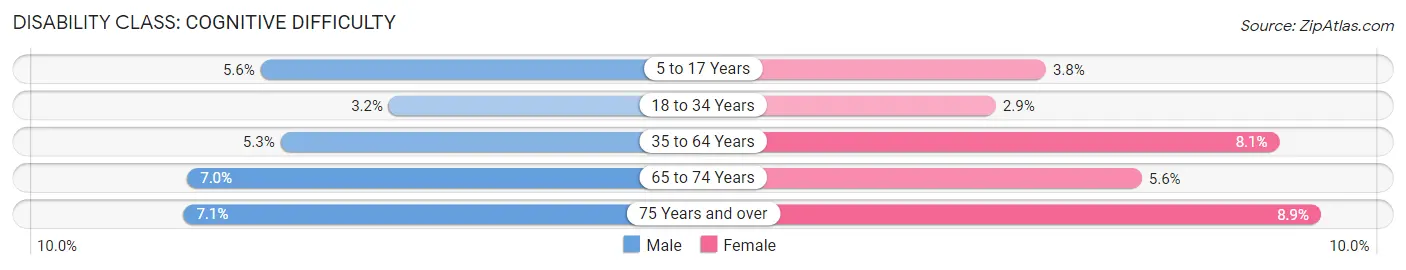
| Age Bracket | Male | Female |
| 5 to 17 Years | 118 (5.6%) | 73 (3.8%) |
| 18 to 34 Years | 69 (3.2%) | 58 (2.9%) |
| 35 to 64 Years | 183 (5.2%) | 276 (8.1%) |
| 65 to 74 Years | 60 (7.0%) | 54 (5.6%) |
| 75 Years and over | 42 (7.0%) | 73 (8.9%) |
Disability Class: Ambulatory Difficulty
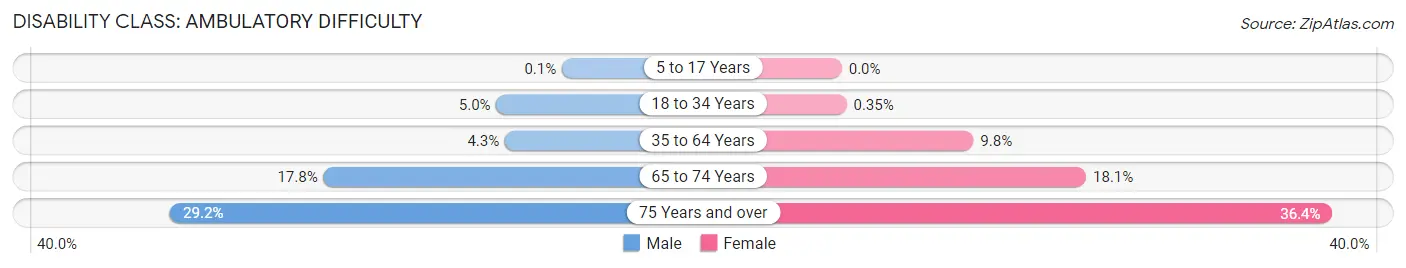
| Age Bracket | Male | Female |
| 5 to 17 Years | 2 (0.1%) | 0 (0.0%) |
| 18 to 34 Years | 106 (5.0%) | 7 (0.4%) |
| 35 to 64 Years | 151 (4.3%) | 332 (9.8%) |
| 65 to 74 Years | 153 (17.8%) | 176 (18.1%) |
| 75 Years and over | 174 (29.2%) | 299 (36.4%) |
Disability Class: Self-Care Difficulty
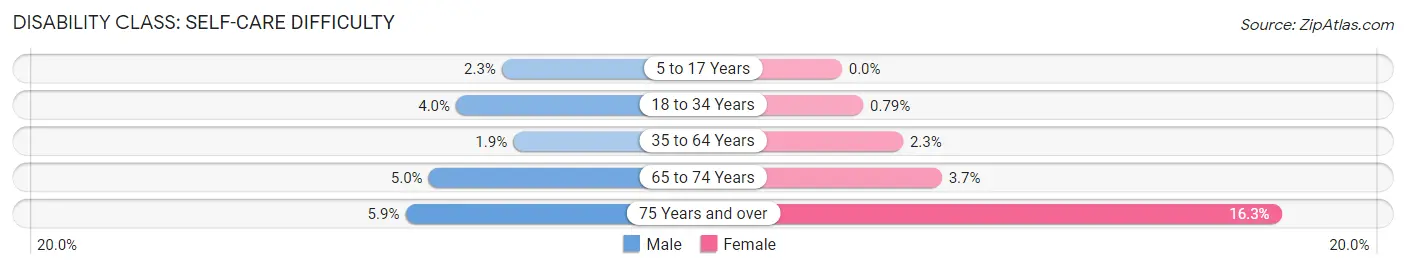
| Age Bracket | Male | Female |
| 5 to 17 Years | 48 (2.3%) | 0 (0.0%) |
| 18 to 34 Years | 85 (4.0%) | 16 (0.8%) |
| 35 to 64 Years | 65 (1.9%) | 77 (2.3%) |
| 65 to 74 Years | 43 (5.0%) | 36 (3.7%) |
| 75 Years and over | 35 (5.9%) | 134 (16.3%) |
Technology Access in Gray County
Computing Device Access in Gray County
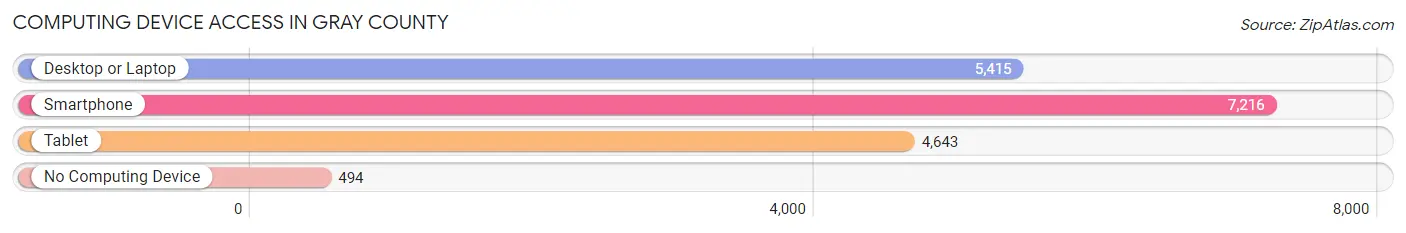
| Device Type | # Households | % Households |
| Desktop or Laptop | 5,415 | 67.5% |
| Smartphone | 7,216 | 90.0% |
| Tablet | 4,643 | 57.9% |
| No Computing Device | 494 | 6.2% |
| Total | 8,021 | 100.0% |
Internet Access in Gray County
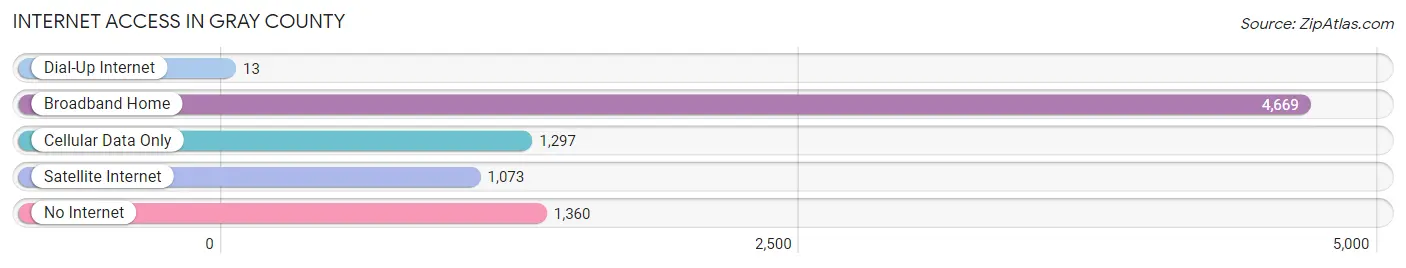
| Internet Type | # Households | % Households |
| Dial-Up Internet | 13 | 0.2% |
| Broadband Home | 4,669 | 58.2% |
| Cellular Data Only | 1,297 | 16.2% |
| Satellite Internet | 1,073 | 13.4% |
| No Internet | 1,360 | 17.0% |
| Total | 8,021 | 100.0% |
Gray County Summary
Gray County is located in the Texas Panhandle, in the northern part of the state. It is bordered by Wheeler County to the north, Roberts County to the east, Donley County to the south, and Carson County to the west. The county seat is Pampa, and the largest city is also Pampa. The county was named for Peter W. Gray, a Texas state legislator.
Geography
Gray County covers an area of 902 square miles, making it the second-smallest county in the state. The terrain is mostly flat, with some rolling hills in the western part of the county. The county is drained by the Canadian River, which flows through the northern part of the county. The county is part of the High Plains region of Texas, and is mostly covered in grasslands.
Demographics
As of the 2010 census, the population of Gray County was 22,535. The racial makeup of the county was 79.2% White, 4.3% African American, 0.7% Native American, 0.4% Asian, 0.1% Pacific Islander, 13.2% from other races, and 2.1% from two or more races. Hispanic or Latino of any race were 24.3% of the population.
The median household income in Gray County was $41,945, and the median family income was $50,845. The per capita income was $20,945. About 14.2% of the population was below the poverty line.
Economy
The economy of Gray County is largely based on agriculture and oil and gas production. The county is home to several large ranches, and the main crops grown in the county are wheat, sorghum, and cotton. The county is also home to several oil and gas fields, and the production of oil and gas is a major contributor to the local economy.
In addition to agriculture and oil and gas production, Gray County is home to several manufacturing companies. The largest employer in the county is Pampa Industries, which produces a variety of products, including automotive parts, industrial equipment, and medical supplies. Other major employers in the county include the Pampa Regional Medical Center, the Pampa Independent School District, and the Pampa Air Force Base.
History
Gray County was established in 1876, and was named for Peter W. Gray, a Texas state legislator. The county was originally part of the XIT Ranch, which was one of the largest ranches in the world at the time. The ranch was broken up in the early 1900s, and the land was sold to settlers.
The county seat was originally located in Lefors, but was moved to Pampa in 1909. Pampa quickly became the largest city in the county, and remains so today.
In the early 1900s, the county was largely agricultural, and the main crops grown were wheat, sorghum, and cotton. The discovery of oil and gas in the county in the 1920s led to an economic boom, and the county quickly became one of the leading producers of oil and gas in the state.
The county continued to grow throughout the 20th century, and today it is a thriving agricultural and energy-producing county. The county is home to several large ranches, and the main crops grown in the county are wheat, sorghum, and cotton. The county is also home to several oil and gas fields, and the production of oil and gas is a major contributor to the local economy.
Common Questions
What is Per Capita Income in Gray County?
Per Capita income in Gray County is $30,303.
What is the Median Family Income in Gray County?
Median Family Income in Gray County is $63,681.
What is the Median Household income in Gray County?
Median Household Income in Gray County is $54,563.
What is Income or Wage Gap in Gray County?
Income or Wage Gap in Gray County is 40.4%.
Women in Gray County earn 59.6 cents for every dollar earned by a man.
What is Family Income Deficit in Gray County?
Family Income Deficit in Gray County is $8,598.
Families that are below poverty line in Gray County earn $8,598 less on average than the poverty threshold level.
What is Inequality or Gini Index in Gray County?
Inequality or Gini Index in Gray County is 0.49.
What is the Total Population of Gray County?
Total Population of Gray County is 21,272.
What is the Total Male Population of Gray County?
Total Male Population of Gray County is 11,382.
What is the Total Female Population of Gray County?
Total Female Population of Gray County is 9,890.
What is the Ratio of Males per 100 Females in Gray County?
There are 115.09 Males per 100 Females in Gray County.
What is the Ratio of Females per 100 Males in Gray County?
There are 86.89 Females per 100 Males in Gray County.
What is the Median Population Age in Gray County?
Median Population Age in Gray County is 36.6 Years.
What is the Average Family Size in Gray County
Average Family Size in Gray County is 3.0 People.
What is the Average Household Size in Gray County
Average Household Size in Gray County is 2.5 People.
How Large is the Labor Force in Gray County?
There are 9,550 People in the Labor Forcein in Gray County.
What is the Percentage of People in the Labor Force in Gray County?
57.6% of People are in the Labor Force in Gray County.
What is the Unemployment Rate in Gray County?
Unemployment Rate in Gray County is 5.4%.