Goliad County, TX Map & Demographics
Goliad County Map
Goliad County Overview
$36,114
PER CAPITA INCOME
$86,639
AVG FAMILY INCOME
$58,125
AVG HOUSEHOLD INCOME
29.6%
WAGE / INCOME GAP [ % ]
70.4¢/ $1
WAGE / INCOME GAP [ $ ]
0.52
INEQUALITY / GINI INDEX
7,092
TOTAL POPULATION
3,522
MALE POPULATION
3,570
FEMALE POPULATION
98.66
MALES / 100 FEMALES
101.36
FEMALES / 100 MALES
44.7
MEDIAN AGE
3.4
AVG FAMILY SIZE
2.6
AVG HOUSEHOLD SIZE
3,027
LABOR FORCE [ PEOPLE ]
52.9%
PERCENT IN LABOR FORCE
4.8%
UNEMPLOYMENT RATE
Goliad County Area Codes
Income in Goliad County
Income Overview in Goliad County
Per Capita Income in Goliad County is $36,114, while median incomes of families and households are $86,639 and $58,125 respectively.
| Characteristic | Number | Measure |
| Per Capita Income | 7,092 | $36,114 |
| Median Family Income | 1,741 | $86,639 |
| Mean Family Income | 1,741 | $120,643 |
| Median Household Income | 2,720 | $58,125 |
| Mean Household Income | 2,720 | $91,740 |
| Income Deficit | 1,741 | $0 |
| Wage / Income Gap (%) | 7,092 | 29.57% |
| Wage / Income Gap ($) | 7,092 | 70.43¢ per $1 |
| Gini / Inequality Index | 7,092 | 0.52 |
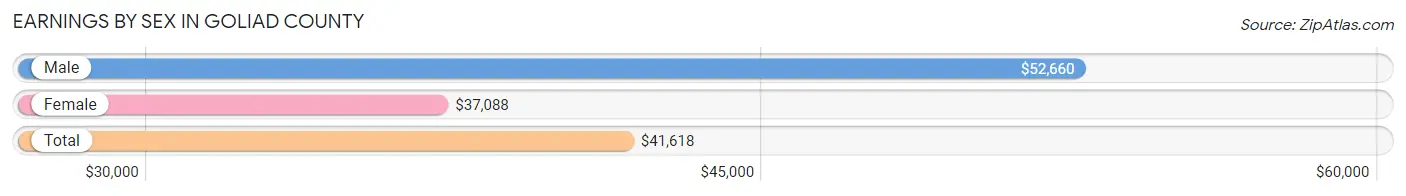
Earnings by Sex in Goliad County
Average Earnings in Goliad County are $41,618, $52,660 for men and $37,088 for women, a difference of 29.6%.
| Sex | Number | Average Earnings |
| Male | 1,686 (53.5%) | $52,660 |
| Female | 1,463 (46.5%) | $37,088 |
| Total | 3,149 (100.0%) | $41,618 |
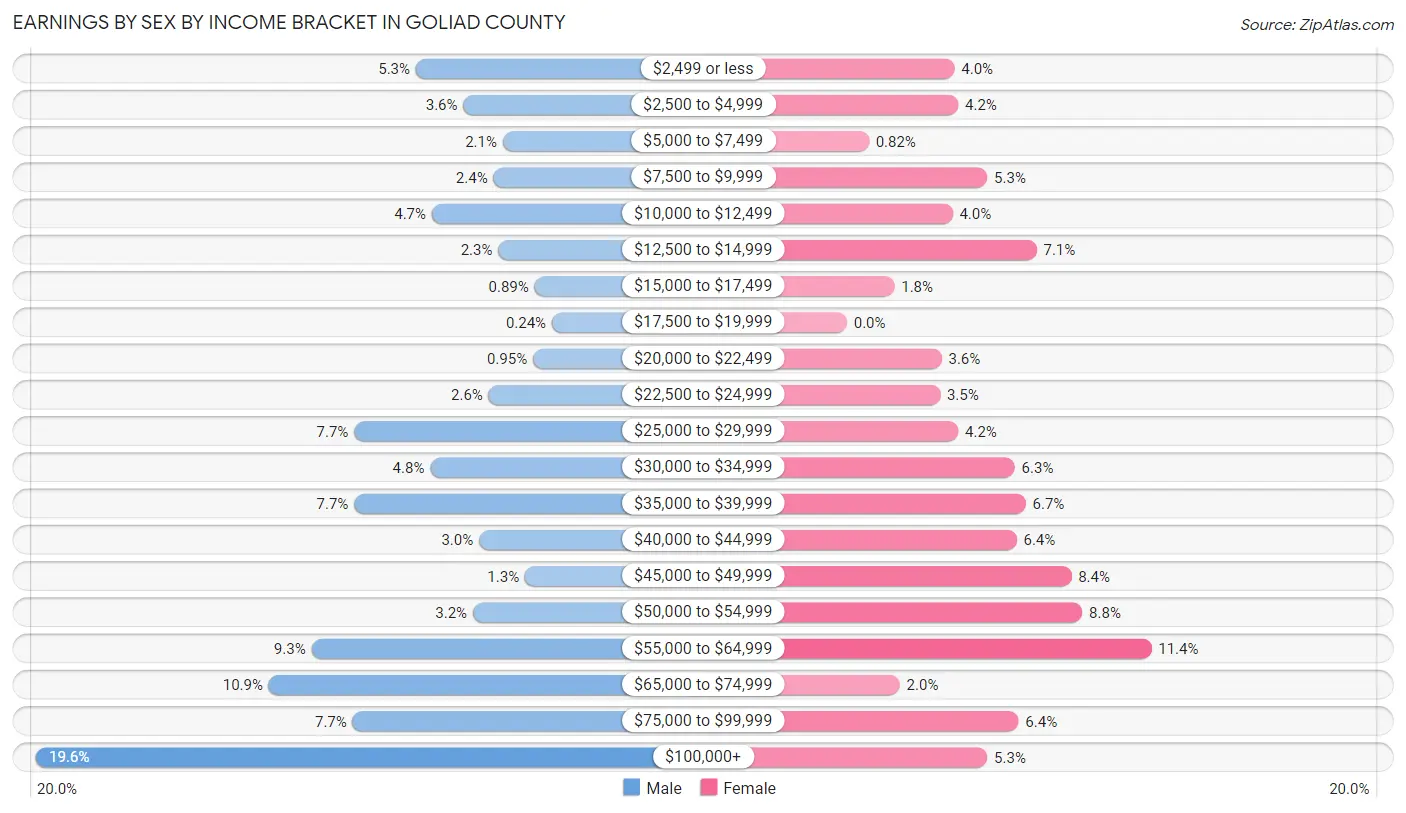
Earnings by Sex by Income Bracket in Goliad County
The most common earnings brackets in Goliad County are $100,000+ for men (330 | 19.6%) and $55,000 to $64,999 for women (167 | 11.4%).
| Income | Male | Female |
| $2,499 or less | 90 (5.3%) | 59 (4.0%) |
| $2,500 to $4,999 | 60 (3.6%) | 61 (4.2%) |
| $5,000 to $7,499 | 35 (2.1%) | 12 (0.8%) |
| $7,500 to $9,999 | 41 (2.4%) | 77 (5.3%) |
| $10,000 to $12,499 | 80 (4.7%) | 58 (4.0%) |
| $12,500 to $14,999 | 38 (2.2%) | 104 (7.1%) |
| $15,000 to $17,499 | 15 (0.9%) | 26 (1.8%) |
| $17,500 to $19,999 | 4 (0.2%) | 0 (0.0%) |
| $20,000 to $22,499 | 16 (0.9%) | 52 (3.5%) |
| $22,500 to $24,999 | 44 (2.6%) | 51 (3.5%) |
| $25,000 to $29,999 | 129 (7.6%) | 61 (4.2%) |
| $30,000 to $34,999 | 81 (4.8%) | 92 (6.3%) |
| $35,000 to $39,999 | 129 (7.6%) | 98 (6.7%) |
| $40,000 to $44,999 | 50 (3.0%) | 93 (6.4%) |
| $45,000 to $49,999 | 21 (1.3%) | 123 (8.4%) |
| $50,000 to $54,999 | 54 (3.2%) | 129 (8.8%) |
| $55,000 to $64,999 | 156 (9.2%) | 167 (11.4%) |
| $65,000 to $74,999 | 183 (10.8%) | 29 (2.0%) |
| $75,000 to $99,999 | 130 (7.7%) | 94 (6.4%) |
| $100,000+ | 330 (19.6%) | 77 (5.3%) |
| Total | 1,686 (100.0%) | 1,463 (100.0%) |
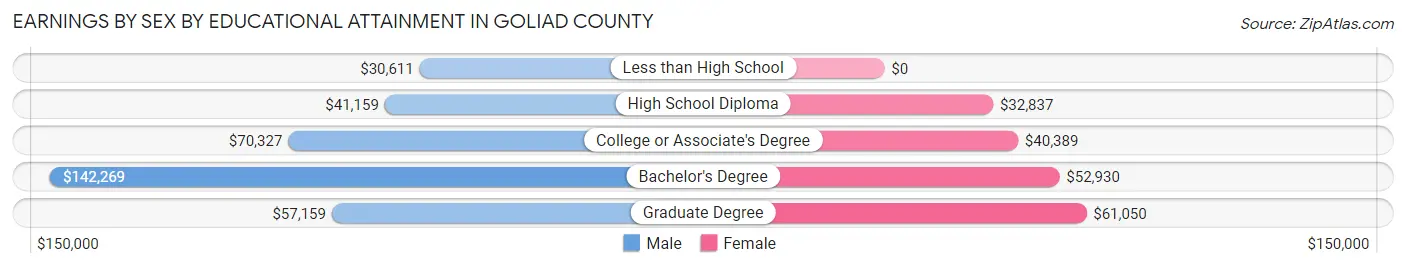
Earnings by Sex by Educational Attainment in Goliad County
Average earnings in Goliad County are $56,299 for men and $41,343 for women, a difference of 26.6%. Men with an educational attainment of bachelor's degree enjoy the highest average annual earnings of $142,269, while those with less than high school education earn the least with $30,611. Women with an educational attainment of graduate degree earn the most with the average annual earnings of $61,050, while those with high school diploma education have the smallest earnings of $32,837.
| Educational Attainment | Male Income | Female Income |
| Less than High School | $30,611 | $0 |
| High School Diploma | $41,159 | $32,837 |
| College or Associate's Degree | $70,327 | $40,389 |
| Bachelor's Degree | $142,269 | $52,930 |
| Graduate Degree | $57,159 | $61,050 |
| Total | $56,299 | $41,343 |
Family Income in Goliad County
Family Income Brackets in Goliad County
According to the Goliad County family income data, there are 348 families falling into the $100,000 to $149,999 income range, which is the most common income bracket and makes up 20.0% of all families. Conversely, the less than $10,000 income bracket is the least frequent group with only 28 families (1.6%) belonging to this category.

| Income Bracket | # Families | % Families |
| Less than $10,000 | 28 | 1.6% |
| $10,000 to $14,999 | 40 | 2.3% |
| $15,000 to $24,999 | 52 | 3.0% |
| $25,000 to $34,999 | 103 | 5.9% |
| $35,000 to $49,999 | 225 | 12.9% |
| $50,000 to $74,999 | 291 | 16.7% |
| $75,000 to $99,999 | 202 | 11.6% |
| $100,000 to $149,999 | 348 | 20.0% |
| $150,000 to $199,999 | 207 | 11.9% |
| $200,000+ | 247 | 14.2% |
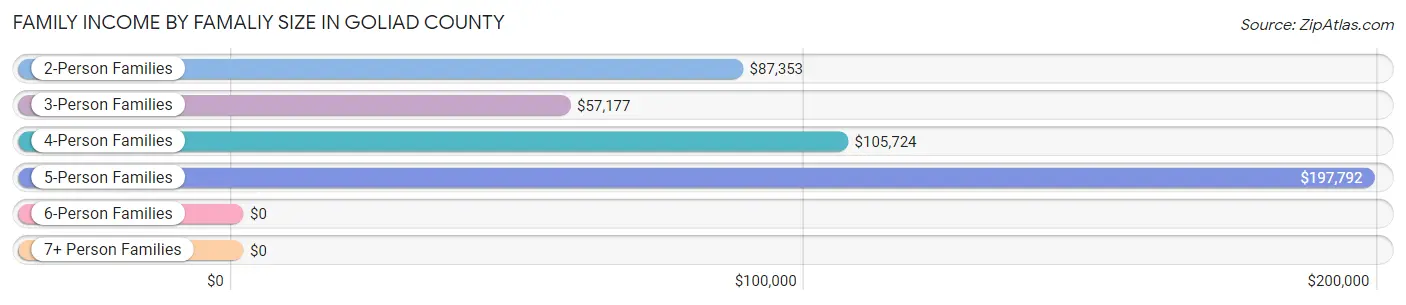
Family Income by Famaliy Size in Goliad County
5-person families (175 | 10.1%) account for the highest median family income in Goliad County with $197,792 per family, while 2-person families (844 | 48.5%) have the highest median income of $43,676 per family member.
| Income Bracket | # Families | Median Income |
| 2-Person Families | 844 (48.5%) | $87,353 |
| 3-Person Families | 325 (18.7%) | $57,177 |
| 4-Person Families | 355 (20.4%) | $105,724 |
| 5-Person Families | 175 (10.1%) | $197,792 |
| 6-Person Families | 32 (1.8%) | $0 |
| 7+ Person Families | 10 (0.6%) | $0 |
| Total | 1,741 (100.0%) | $86,639 |
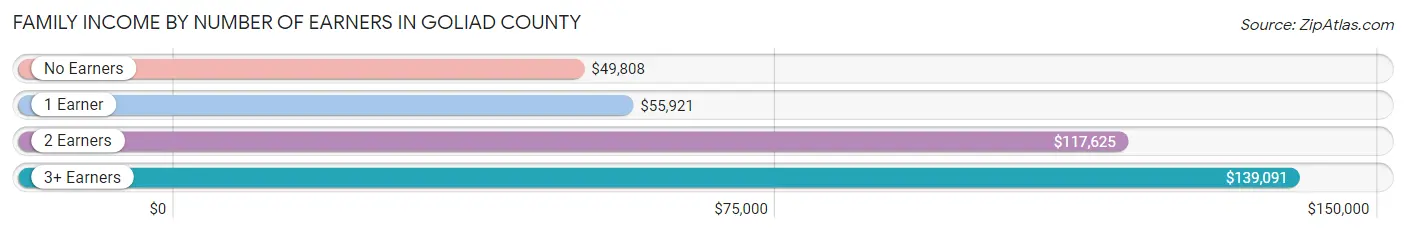
Family Income by Number of Earners in Goliad County
The median family income in Goliad County is $86,639, with families comprising 3+ earners (128) having the highest median family income of $139,091, while families with no earners (328) have the lowest median family income of $49,808, accounting for 7.3% and 18.8% of families, respectively.
| Number of Earners | # Families | Median Income |
| No Earners | 328 (18.8%) | $49,808 |
| 1 Earner | 536 (30.8%) | $55,921 |
| 2 Earners | 749 (43.0%) | $117,625 |
| 3+ Earners | 128 (7.3%) | $139,091 |
| Total | 1,741 (100.0%) | $86,639 |
Household Income in Goliad County
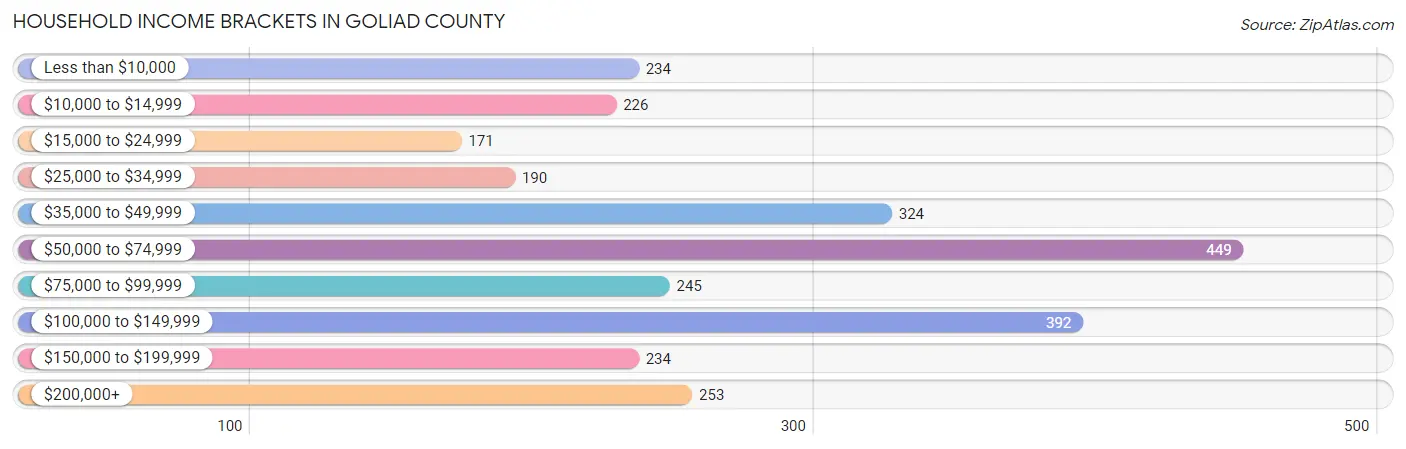
Household Income Brackets in Goliad County
With 449 households falling in the category, the $50,000 to $74,999 income range is the most frequent in Goliad County, accounting for 16.5% of all households. In contrast, only 171 households (6.3%) fall into the $15,000 to $24,999 income bracket, making it the least populous group.
| Income Bracket | # Households | % Households |
| Less than $10,000 | 234 | 8.6% |
| $10,000 to $14,999 | 226 | 8.3% |
| $15,000 to $24,999 | 171 | 6.3% |
| $25,000 to $34,999 | 190 | 7.0% |
| $35,000 to $49,999 | 324 | 11.9% |
| $50,000 to $74,999 | 449 | 16.5% |
| $75,000 to $99,999 | 245 | 9.0% |
| $100,000 to $149,999 | 392 | 14.4% |
| $150,000 to $199,999 | 234 | 8.6% |
| $200,000+ | 253 | 9.3% |
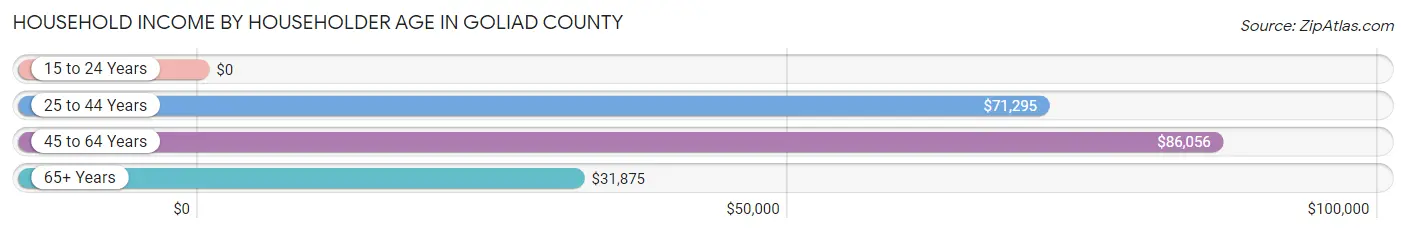
Household Income by Householder Age in Goliad County
The median household income in Goliad County is $58,125, with the highest median household income of $86,056 found in the 45 to 64 years age bracket for the primary householder. A total of 1,000 households (36.8%) fall into this category.
| Income Bracket | # Households | Median Income |
| 15 to 24 Years | 0 (0.0%) | $0 |
| 25 to 44 Years | 673 (24.7%) | $71,295 |
| 45 to 64 Years | 1,000 (36.8%) | $86,056 |
| 65+ Years | 1,047 (38.5%) | $31,875 |
| Total | 2,720 (100.0%) | $58,125 |
Poverty in Goliad County
Income Below Poverty by Sex and Age in Goliad County
With 7.7% poverty level for males and 12.2% for females among the residents of Goliad County, 45 to 54 year old males and 75 year old and over females are the most vulnerable to poverty, with 79 males (20.0%) and 126 females (37.6%) in their respective age groups living below the poverty level.
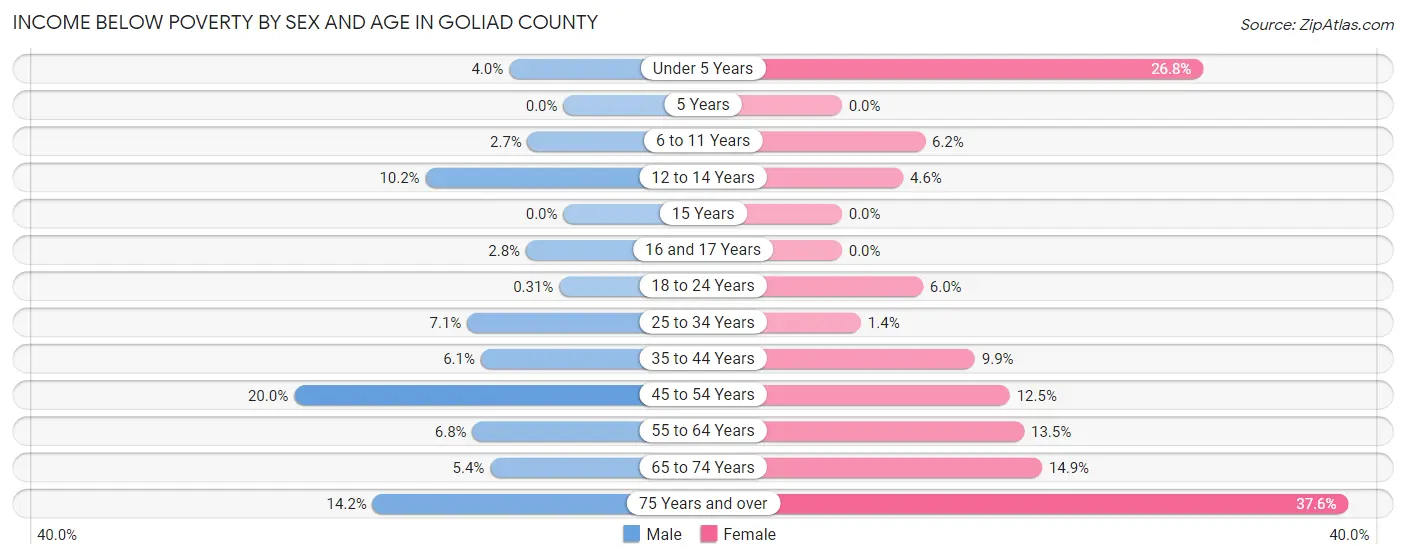
| Age Bracket | Male | Female |
| Under 5 Years | 5 (4.0%) | 33 (26.8%) |
| 5 Years | 0 (0.0%) | 0 (0.0%) |
| 6 to 11 Years | 6 (2.6%) | 17 (6.2%) |
| 12 to 14 Years | 21 (10.2%) | 5 (4.5%) |
| 15 Years | 0 (0.0%) | 0 (0.0%) |
| 16 and 17 Years | 1 (2.8%) | 0 (0.0%) |
| 18 to 24 Years | 1 (0.3%) | 13 (6.0%) |
| 25 to 34 Years | 30 (7.1%) | 7 (1.4%) |
| 35 to 44 Years | 16 (6.1%) | 32 (9.9%) |
| 45 to 54 Years | 79 (20.0%) | 50 (12.5%) |
| 55 to 64 Years | 34 (6.8%) | 72 (13.5%) |
| 65 to 74 Years | 25 (5.4%) | 78 (14.9%) |
| 75 Years and over | 47 (14.2%) | 126 (37.6%) |
| Total | 265 (7.7%) | 433 (12.2%) |
Income Above Poverty by Sex and Age in Goliad County
According to the poverty statistics in Goliad County, males aged 5 years and females aged 5 years are the age groups that are most secure financially, with 100.0% of males and 100.0% of females in these age groups living above the poverty line.
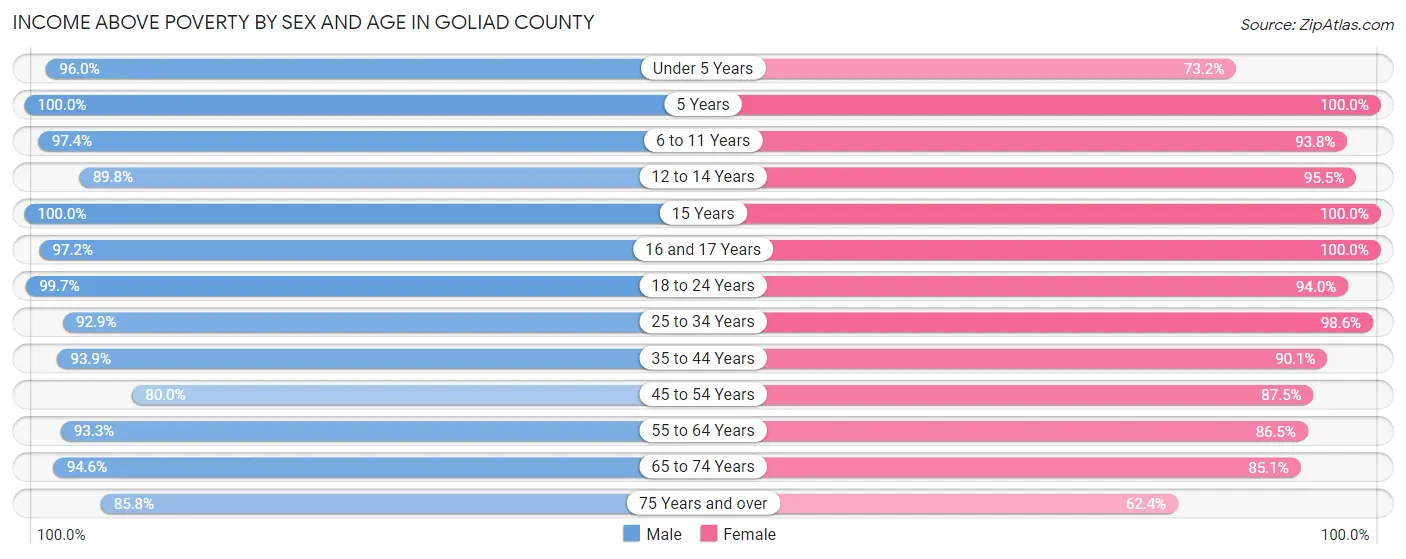
| Age Bracket | Male | Female |
| Under 5 Years | 119 (96.0%) | 90 (73.2%) |
| 5 Years | 80 (100.0%) | 75 (100.0%) |
| 6 to 11 Years | 220 (97.4%) | 258 (93.8%) |
| 12 to 14 Years | 184 (89.8%) | 105 (95.5%) |
| 15 Years | 83 (100.0%) | 65 (100.0%) |
| 16 and 17 Years | 35 (97.2%) | 72 (100.0%) |
| 18 to 24 Years | 320 (99.7%) | 203 (94.0%) |
| 25 to 34 Years | 390 (92.9%) | 485 (98.6%) |
| 35 to 44 Years | 245 (93.9%) | 292 (90.1%) |
| 45 to 54 Years | 316 (80.0%) | 351 (87.5%) |
| 55 to 64 Years | 470 (93.2%) | 460 (86.5%) |
| 65 to 74 Years | 435 (94.6%) | 447 (85.1%) |
| 75 Years and over | 285 (85.8%) | 209 (62.4%) |
| Total | 3,182 (92.3%) | 3,112 (87.8%) |
Income Below Poverty Among Married-Couple Families in Goliad County
The poverty statistics for married-couple families in Goliad County show that 4.3% or 62 of the total 1,446 families live below the poverty line. Families with 1 or 2 children have the highest poverty rate of 11.1%, comprising of 46 families. On the other hand, families with 3 or 4 children have the lowest poverty rate of 0.0%, which includes 0 families.
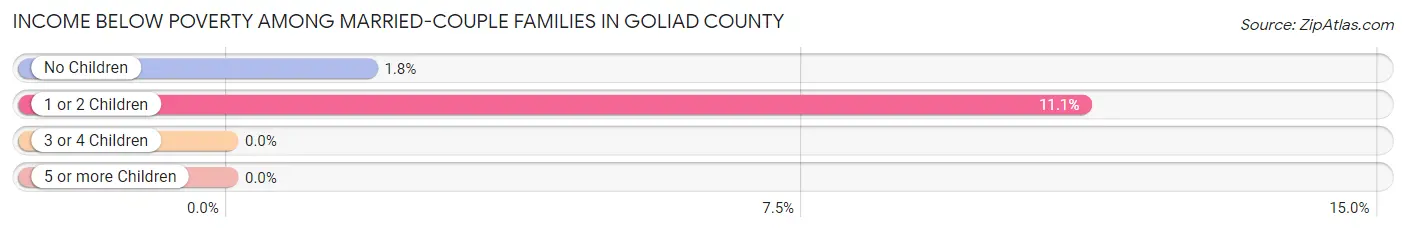
| Children | Above Poverty | Below Poverty |
| No Children | 861 (98.2%) | 16 (1.8%) |
| 1 or 2 Children | 367 (88.9%) | 46 (11.1%) |
| 3 or 4 Children | 156 (100.0%) | 0 (0.0%) |
| 5 or more Children | 0 (0.0%) | 0 (0.0%) |
| Total | 1,384 (95.7%) | 62 (4.3%) |
Income Below Poverty Among Single-Parent Households in Goliad County
According to the poverty data in Goliad County, 26.2% or 16 single-father households and 9.8% or 23 single-mother households are living below the poverty line. Among single-father households, those with 1 or 2 children have the highest poverty rate, with 7 households (30.4%) experiencing poverty. Likewise, among single-mother households, those with 1 or 2 children have the highest poverty rate, with 14 households (14.6%) falling below the poverty line.
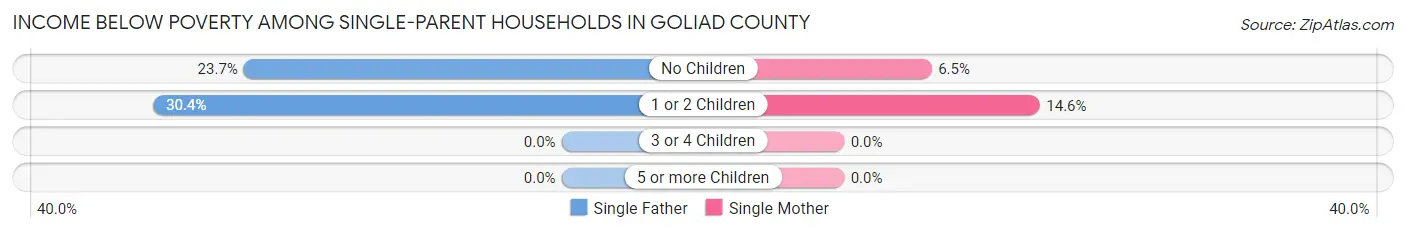
| Children | Single Father | Single Mother |
| No Children | 9 (23.7%) | 9 (6.5%) |
| 1 or 2 Children | 7 (30.4%) | 14 (14.6%) |
| 3 or 4 Children | 0 (0.0%) | 0 (0.0%) |
| 5 or more Children | 0 (0.0%) | 0 (0.0%) |
| Total | 16 (26.2%) | 23 (9.8%) |
Income Below Poverty Among Married-Couple vs Single-Parent Households in Goliad County
The poverty data for Goliad County shows that 62 of the married-couple family households (4.3%) and 39 of the single-parent households (13.2%) are living below the poverty level. Within the married-couple family households, those with 1 or 2 children have the highest poverty rate, with 46 households (11.1%) falling below the poverty line. Among the single-parent households, those with 1 or 2 children have the highest poverty rate, with 21 household (17.6%) living below poverty.
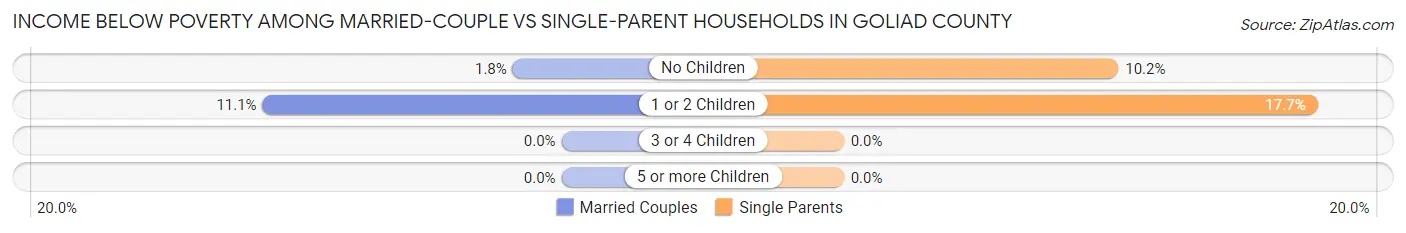
| Children | Married-Couple Families | Single-Parent Households |
| No Children | 16 (1.8%) | 18 (10.2%) |
| 1 or 2 Children | 46 (11.1%) | 21 (17.6%) |
| 3 or 4 Children | 0 (0.0%) | 0 (0.0%) |
| 5 or more Children | 0 (0.0%) | 0 (0.0%) |
| Total | 62 (4.3%) | 39 (13.2%) |
Race in Goliad County
The most populous races in Goliad County are White / Caucasian (5,546 | 78.2%), Hispanic or Latino (2,543 | 35.9%), and Two or more Races (897 | 12.7%).
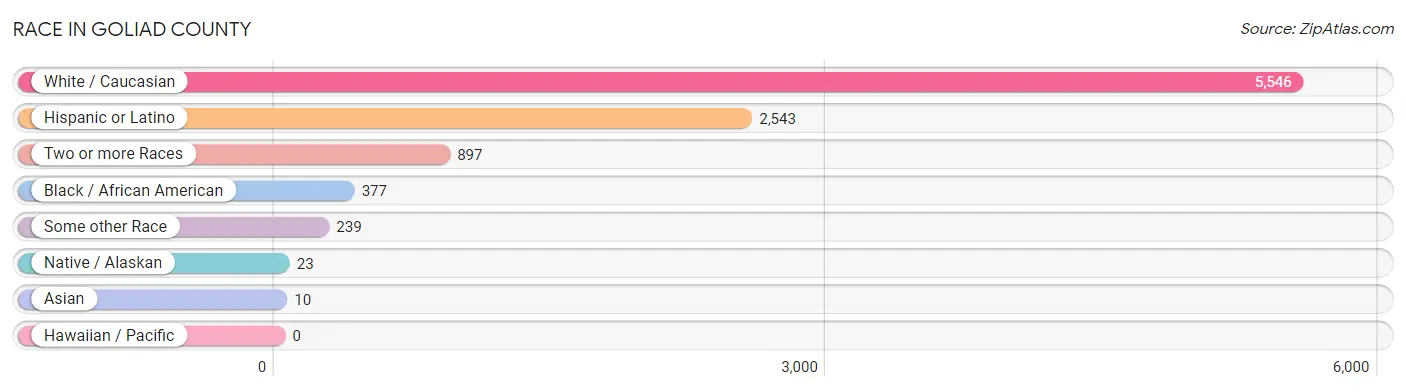
| Race | # Population | % Population |
| Asian | 10 | 0.1% |
| Black / African American | 377 | 5.3% |
| Hawaiian / Pacific | 0 | 0.0% |
| Hispanic or Latino | 2,543 | 35.9% |
| Native / Alaskan | 23 | 0.3% |
| White / Caucasian | 5,546 | 78.2% |
| Two or more Races | 897 | 12.7% |
| Some other Race | 239 | 3.4% |
| Total | 7,092 | 100.0% |
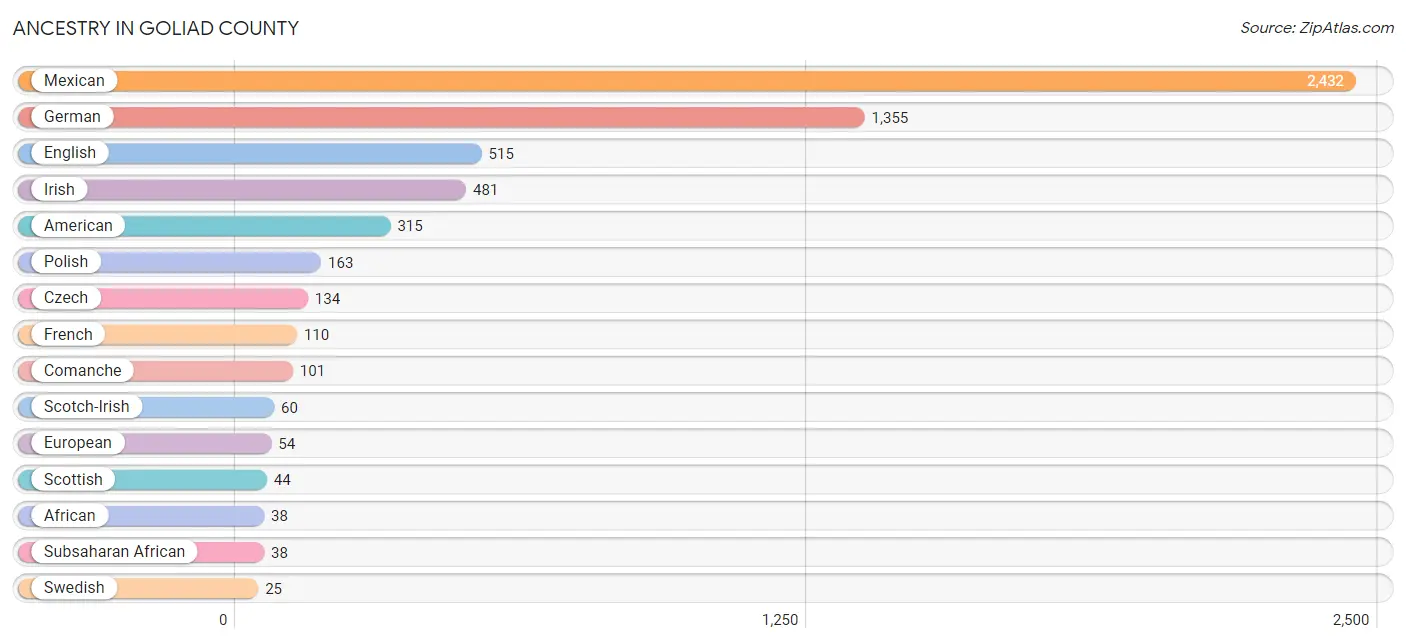
Ancestry in Goliad County
The most populous ancestries reported in Goliad County are Mexican (2,432 | 34.3%), German (1,355 | 19.1%), English (515 | 7.3%), Irish (481 | 6.8%), and American (315 | 4.4%), together accounting for 71.9% of all Goliad County residents.
| Ancestry | # Population | % Population |
| African | 38 | 0.5% |
| American | 315 | 4.4% |
| Arab | 12 | 0.2% |
| Central American | 6 | 0.1% |
| Cherokee | 4 | 0.1% |
| Comanche | 101 | 1.4% |
| Czech | 134 | 1.9% |
| Danish | 1 | 0.0% |
| Dutch | 5 | 0.1% |
| English | 515 | 7.3% |
| European | 54 | 0.8% |
| French | 110 | 1.5% |
| French Canadian | 5 | 0.1% |
| German | 1,355 | 19.1% |
| Honduran | 1 | 0.0% |
| Irish | 481 | 6.8% |
| Italian | 11 | 0.2% |
| Lebanese | 12 | 0.2% |
| Mexican | 2,432 | 34.3% |
| Norwegian | 18 | 0.3% |
| Polish | 163 | 2.3% |
| Russian | 24 | 0.3% |
| Salvadoran | 5 | 0.1% |
| Scotch-Irish | 60 | 0.9% |
| Scottish | 44 | 0.6% |
| Spaniard | 23 | 0.3% |
| Spanish | 3 | 0.0% |
| Sri Lankan | 10 | 0.1% |
| Subsaharan African | 38 | 0.5% |
| Swedish | 25 | 0.4% |
| Swiss | 7 | 0.1% | View All 31 Rows |
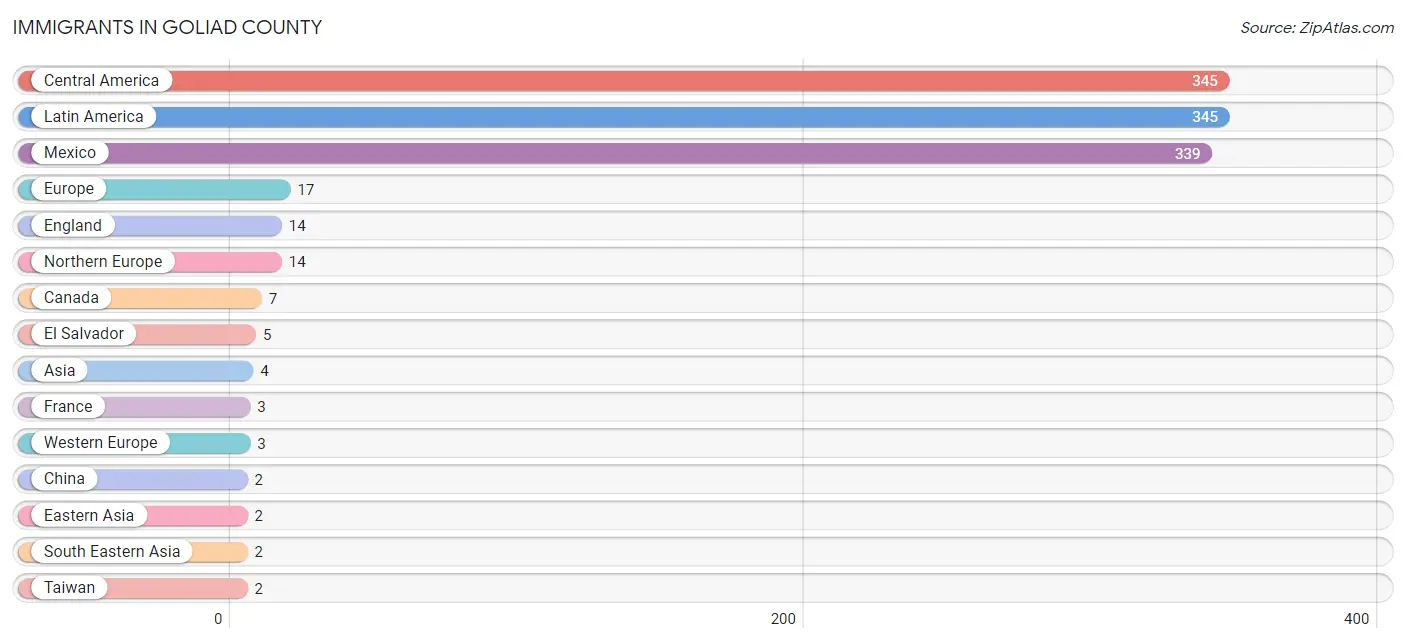
Immigrants in Goliad County
The most numerous immigrant groups reported in Goliad County came from Central America (345 | 4.9%), Latin America (345 | 4.9%), Mexico (339 | 4.8%), Europe (17 | 0.2%), and England (14 | 0.2%), together accounting for 14.9% of all Goliad County residents.
| Immigration Origin | # Population | % Population |
| Asia | 4 | 0.1% |
| Canada | 7 | 0.1% |
| Central America | 345 | 4.9% |
| China | 2 | 0.0% |
| Eastern Asia | 2 | 0.0% |
| El Salvador | 5 | 0.1% |
| England | 14 | 0.2% |
| Europe | 17 | 0.2% |
| France | 3 | 0.0% |
| Honduras | 1 | 0.0% |
| Latin America | 345 | 4.9% |
| Mexico | 339 | 4.8% |
| Northern Europe | 14 | 0.2% |
| South Eastern Asia | 2 | 0.0% |
| Taiwan | 2 | 0.0% |
| Vietnam | 2 | 0.0% |
| Western Europe | 3 | 0.0% | View All 17 Rows |
Sex and Age in Goliad County
Sex and Age in Goliad County
The most populous age groups in Goliad County are 30 to 34 Years (315 | 8.9%) for men and 55 to 59 Years (352 | 9.9%) for women.
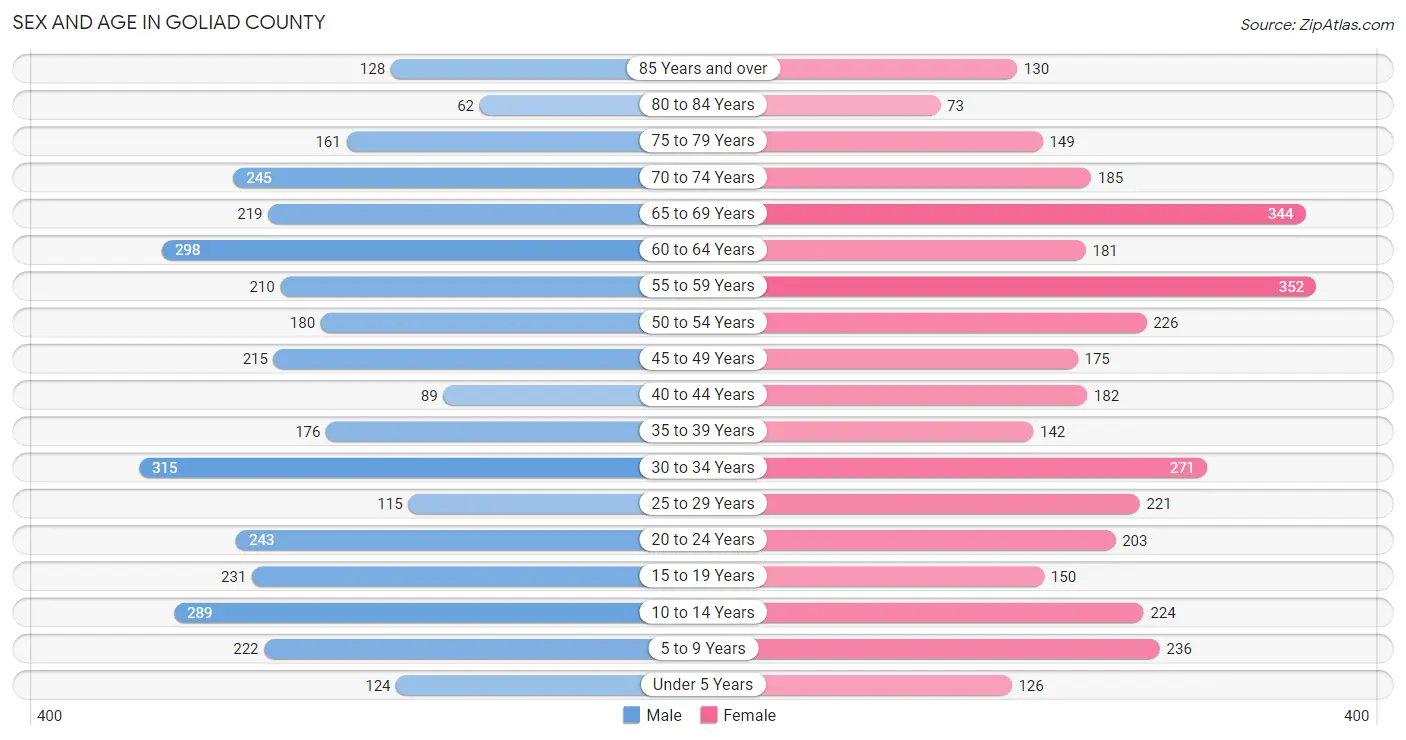
| Age Bracket | Male | Female |
| Under 5 Years | 124 (3.5%) | 126 (3.5%) |
| 5 to 9 Years | 222 (6.3%) | 236 (6.6%) |
| 10 to 14 Years | 289 (8.2%) | 224 (6.3%) |
| 15 to 19 Years | 231 (6.6%) | 150 (4.2%) |
| 20 to 24 Years | 243 (6.9%) | 203 (5.7%) |
| 25 to 29 Years | 115 (3.3%) | 221 (6.2%) |
| 30 to 34 Years | 315 (8.9%) | 271 (7.6%) |
| 35 to 39 Years | 176 (5.0%) | 142 (4.0%) |
| 40 to 44 Years | 89 (2.5%) | 182 (5.1%) |
| 45 to 49 Years | 215 (6.1%) | 175 (4.9%) |
| 50 to 54 Years | 180 (5.1%) | 226 (6.3%) |
| 55 to 59 Years | 210 (6.0%) | 352 (9.9%) |
| 60 to 64 Years | 298 (8.5%) | 181 (5.1%) |
| 65 to 69 Years | 219 (6.2%) | 344 (9.6%) |
| 70 to 74 Years | 245 (7.0%) | 185 (5.2%) |
| 75 to 79 Years | 161 (4.6%) | 149 (4.2%) |
| 80 to 84 Years | 62 (1.8%) | 73 (2.0%) |
| 85 Years and over | 128 (3.6%) | 130 (3.6%) |
| Total | 3,522 (100.0%) | 3,570 (100.0%) |
Families and Households in Goliad County
Median Family Size in Goliad County
The median family size in Goliad County is 3.38 persons per family, with single female/mother families (234 | 13.4%) accounting for the largest median family size of 3.61 persons per family. On the other hand, single male/father families (61 | 3.5%) represent the smallest median family size with 3.25 persons per family.
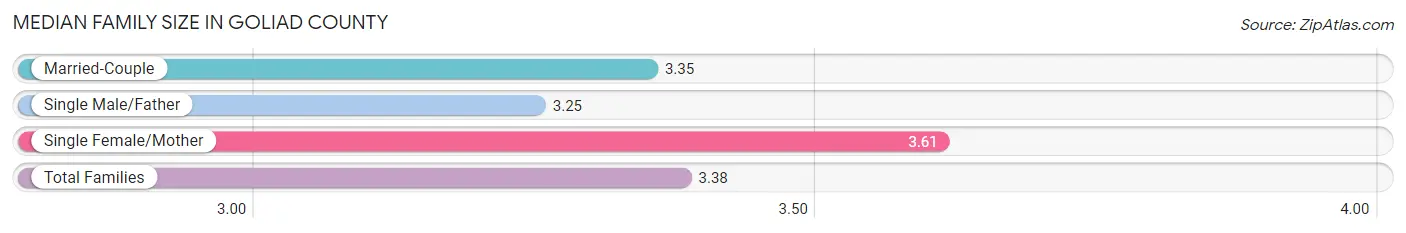
| Family Type | # Families | Family Size |
| Married-Couple | 1,446 (83.1%) | 3.35 |
| Single Male/Father | 61 (3.5%) | 3.25 |
| Single Female/Mother | 234 (13.4%) | 3.61 |
| Total Families | 1,741 (100.0%) | 3.38 |
Median Household Size in Goliad County
The median household size in Goliad County is 2.57 persons per household, with single female/mother households (234 | 8.6%) accounting for the largest median household size of 3.82 persons per household. non-family households (979 | 36.0%) represent the smallest median household size with 1.08 persons per household.
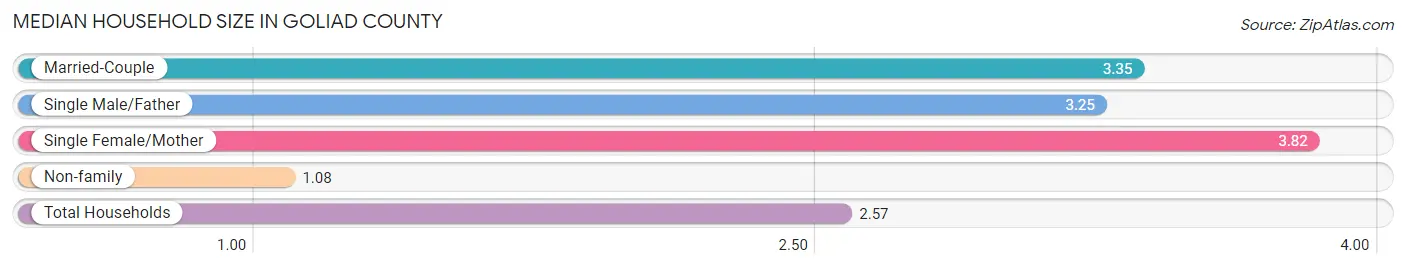
| Household Type | # Households | Household Size |
| Married-Couple | 1,446 (53.2%) | 3.35 |
| Single Male/Father | 61 (2.2%) | 3.25 |
| Single Female/Mother | 234 (8.6%) | 3.82 |
| Non-family | 979 (36.0%) | 1.08 |
| Total Households | 2,720 (100.0%) | 2.57 |
Household Size by Marriage Status in Goliad County
Out of a total of 2,720 households in Goliad County, 1,741 (64.0%) are family households, while 979 (36.0%) are nonfamily households. The most numerous type of family households are 2-person households, comprising 815, and the most common type of nonfamily households are 1-person households, comprising 910.
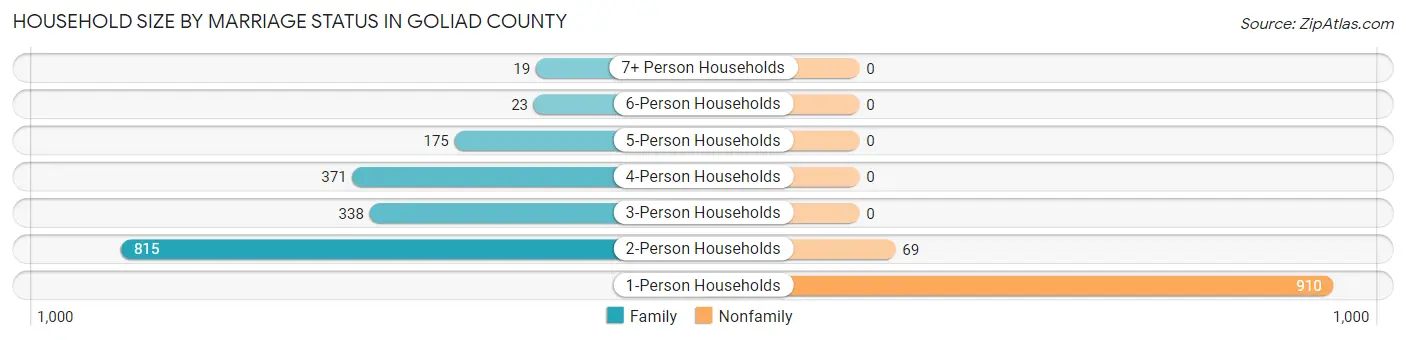
| Household Size | Family Households | Nonfamily Households |
| 1-Person Households | - | 910 (33.5%) |
| 2-Person Households | 815 (30.0%) | 69 (2.5%) |
| 3-Person Households | 338 (12.4%) | 0 (0.0%) |
| 4-Person Households | 371 (13.6%) | 0 (0.0%) |
| 5-Person Households | 175 (6.4%) | 0 (0.0%) |
| 6-Person Households | 23 (0.9%) | 0 (0.0%) |
| 7+ Person Households | 19 (0.7%) | 0 (0.0%) |
| Total | 1,741 (64.0%) | 979 (36.0%) |
Female Fertility in Goliad County
Fertility by Age in Goliad County
Average fertility rate in Goliad County is 29.0 births per 1,000 women. Women in the age bracket of 20 to 34 years have the highest fertility rate with 58.0 births per 1,000 women. Women in the age bracket of 20 to 34 years acount for 100.0% of all women with births.
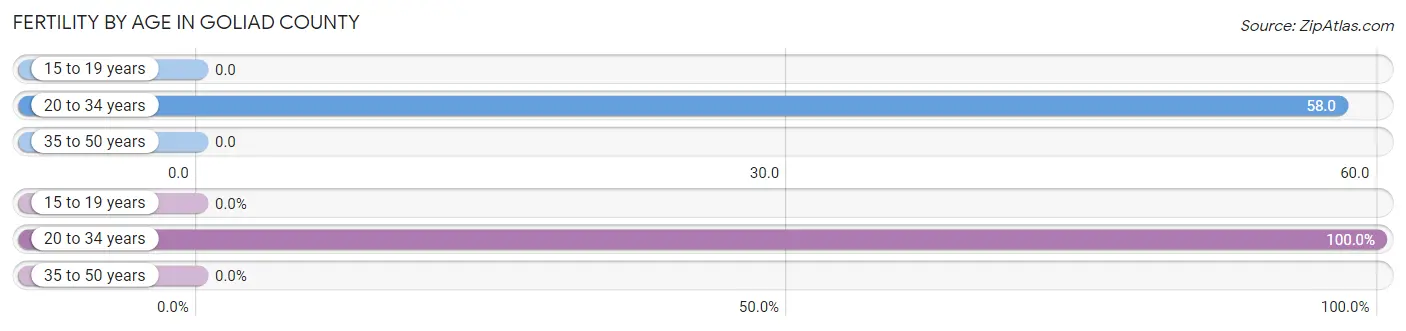
| Age Bracket | Women with Births | Births / 1,000 Women |
| 15 to 19 years | 0 (0.0%) | 0.0 |
| 20 to 34 years | 40 (100.0%) | 58.0 |
| 35 to 50 years | 0 (0.0%) | 0.0 |
| Total | 40 (100.0%) | 29.0 |
Fertility by Age by Marriage Status in Goliad County
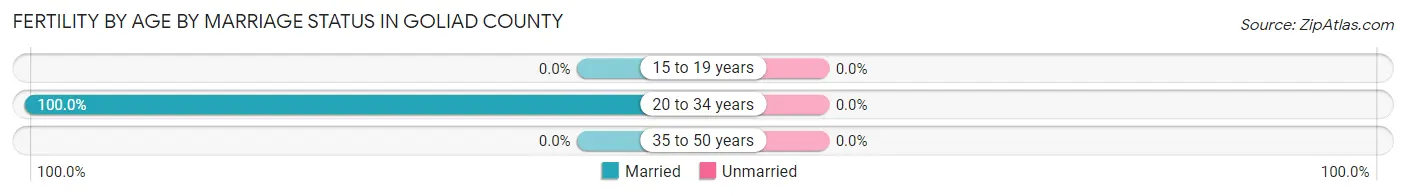
| Age Bracket | Married | Unmarried |
| 15 to 19 years | 0 (0.0%) | 0 (0.0%) |
| 20 to 34 years | 40 (100.0%) | 0 (0.0%) |
| 35 to 50 years | 0 (0.0%) | 0 (0.0%) |
| Total | 40 (100.0%) | 0 (0.0%) |
Fertility by Education in Goliad County
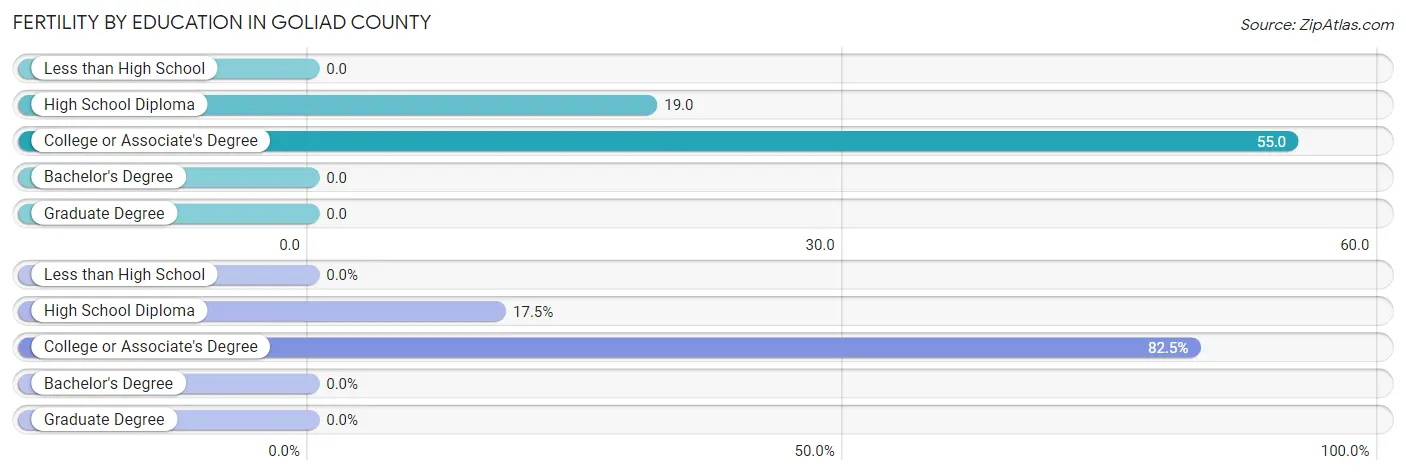
| Educational Attainment | Women with Births | Births / 1,000 Women |
| Less than High School | 0 (0.0%) | 0.0 |
| High School Diploma | 7 (17.5%) | 19.0 |
| College or Associate's Degree | 33 (82.5%) | 55.0 |
| Bachelor's Degree | 0 (0.0%) | 0.0 |
| Graduate Degree | 0 (0.0%) | 0.0 |
| Total | 40 (100.0%) | 29.0 |
Fertility by Education by Marriage Status in Goliad County
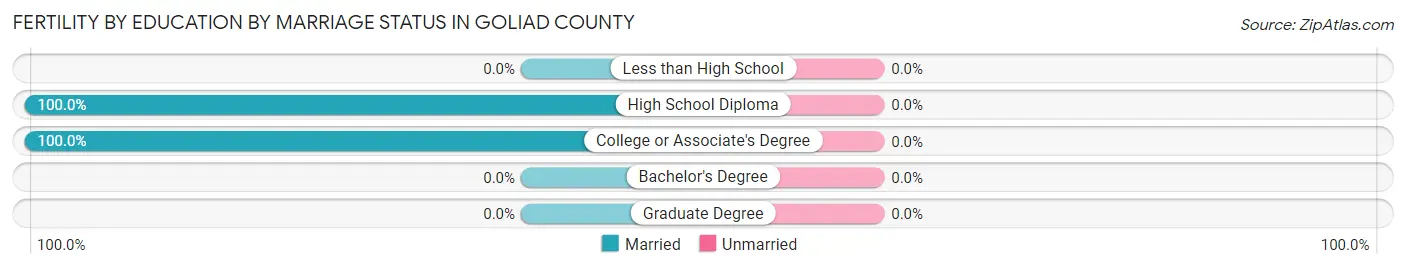
| Educational Attainment | Married | Unmarried |
| Less than High School | 0 (0.0%) | 0 (0.0%) |
| High School Diploma | 7 (100.0%) | 0 (0.0%) |
| College or Associate's Degree | 33 (100.0%) | 0 (0.0%) |
| Bachelor's Degree | 0 (0.0%) | 0 (0.0%) |
| Graduate Degree | 0 (0.0%) | 0 (0.0%) |
| Total | 40 (100.0%) | 0 (0.0%) |
Employment Characteristics in Goliad County
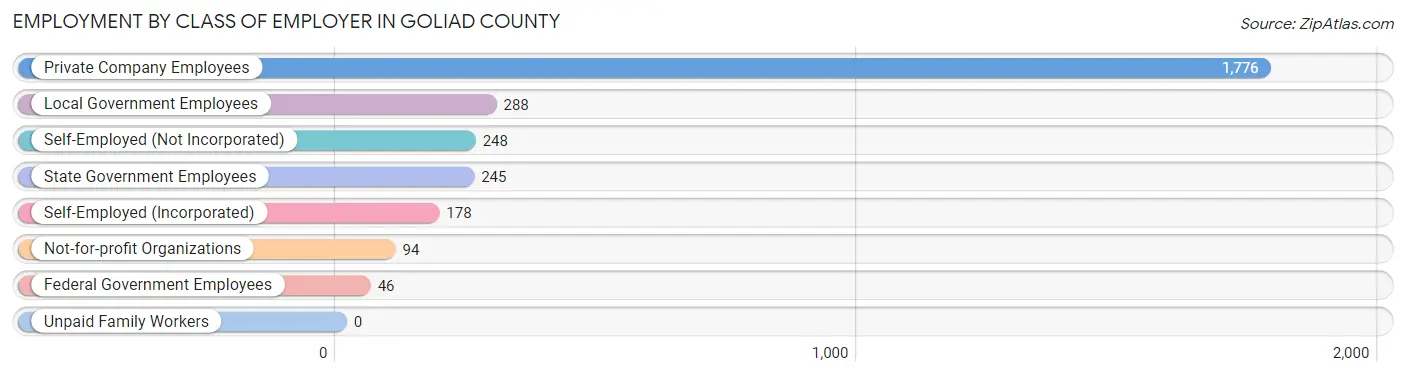
Employment by Class of Employer in Goliad County
Among the 2,875 employed individuals in Goliad County, private company employees (1,776 | 61.8%), local government employees (288 | 10.0%), and self-employed (not incorporated) (248 | 8.6%) make up the most common classes of employment.
| Employer Class | # Employees | % Employees |
| Private Company Employees | 1,776 | 61.8% |
| Self-Employed (Incorporated) | 178 | 6.2% |
| Self-Employed (Not Incorporated) | 248 | 8.6% |
| Not-for-profit Organizations | 94 | 3.3% |
| Local Government Employees | 288 | 10.0% |
| State Government Employees | 245 | 8.5% |
| Federal Government Employees | 46 | 1.6% |
| Unpaid Family Workers | 0 | 0.0% |
| Total | 2,875 | 100.0% |
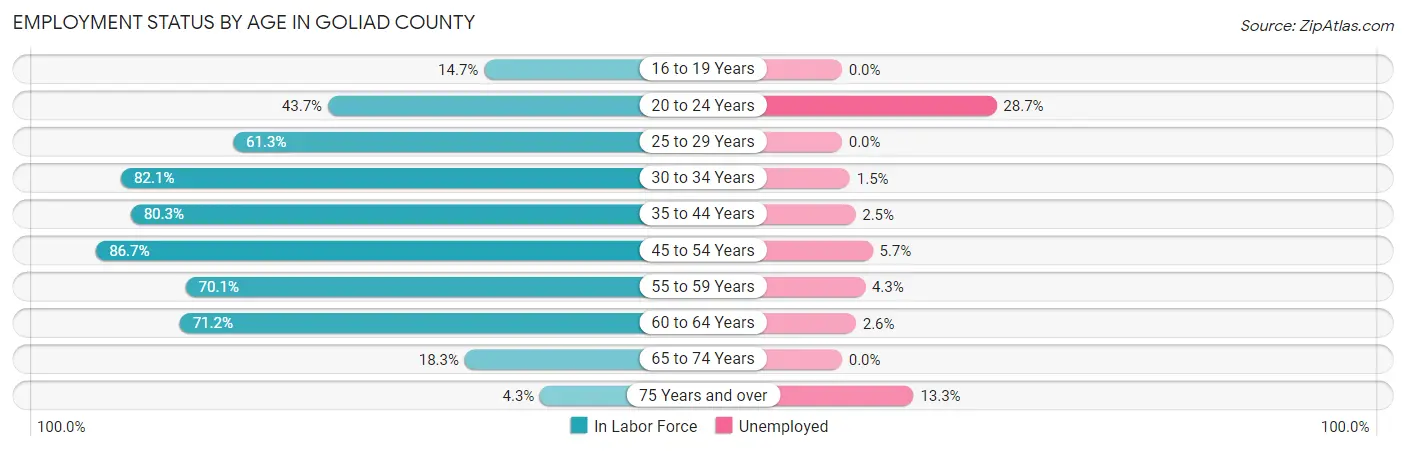
Employment Status by Age in Goliad County
According to the labor force statistics for Goliad County, out of the total population over 16 years of age (5,722), 52.9% or 3,027 individuals are in the labor force, with 4.8% or 145 of them unemployed. The age group with the highest labor force participation rate is 45 to 54 years, with 86.7% or 690 individuals in the labor force. Within the labor force, the 20 to 24 years age range has the highest percentage of unemployed individuals, with 28.7% or 56 of them being unemployed.
| Age Bracket | In Labor Force | Unemployed |
| 16 to 19 Years | 34 (14.7%) | 0 (0.0%) |
| 20 to 24 Years | 195 (43.7%) | 56 (28.7%) |
| 25 to 29 Years | 206 (61.3%) | 0 (0.0%) |
| 30 to 34 Years | 481 (82.1%) | 7 (1.5%) |
| 35 to 44 Years | 473 (80.3%) | 12 (2.5%) |
| 45 to 54 Years | 690 (86.7%) | 39 (5.7%) |
| 55 to 59 Years | 394 (70.1%) | 17 (4.3%) |
| 60 to 64 Years | 341 (71.2%) | 9 (2.6%) |
| 65 to 74 Years | 182 (18.3%) | 0 (0.0%) |
| 75 Years and over | 30 (4.3%) | 4 (13.3%) |
| Total | 3,027 (52.9%) | 145 (4.8%) |
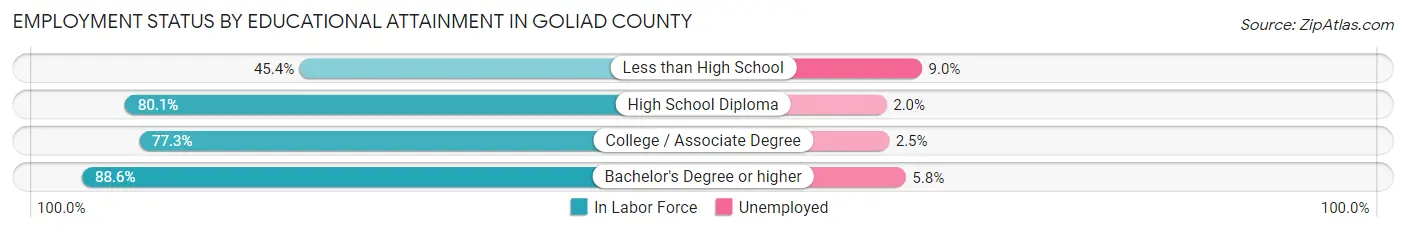
Employment Status by Educational Attainment in Goliad County
According to labor force statistics for Goliad County, 77.2% of individuals (2,585) out of the total population between 25 and 64 years of age (3,348) are in the labor force, with 3.2% or 83 of them being unemployed. The group with the highest labor force participation rate are those with the educational attainment of bachelor's degree or higher, with 88.6% or 465 individuals in the labor force. Within the labor force, individuals with less than high school education have the highest percentage of unemployment, with 9.0% or 12 of them being unemployed.
| Educational Attainment | In Labor Force | Unemployed |
| Less than High School | 134 (45.4%) | 27 (9.0%) |
| High School Diploma | 928 (80.1%) | 23 (2.0%) |
| College / Associate Degree | 1,059 (77.3%) | 34 (2.5%) |
| Bachelor's Degree or higher | 465 (88.6%) | 30 (5.8%) |
| Total | 2,585 (77.2%) | 107 (3.2%) |
Employment Occupations by Sex in Goliad County
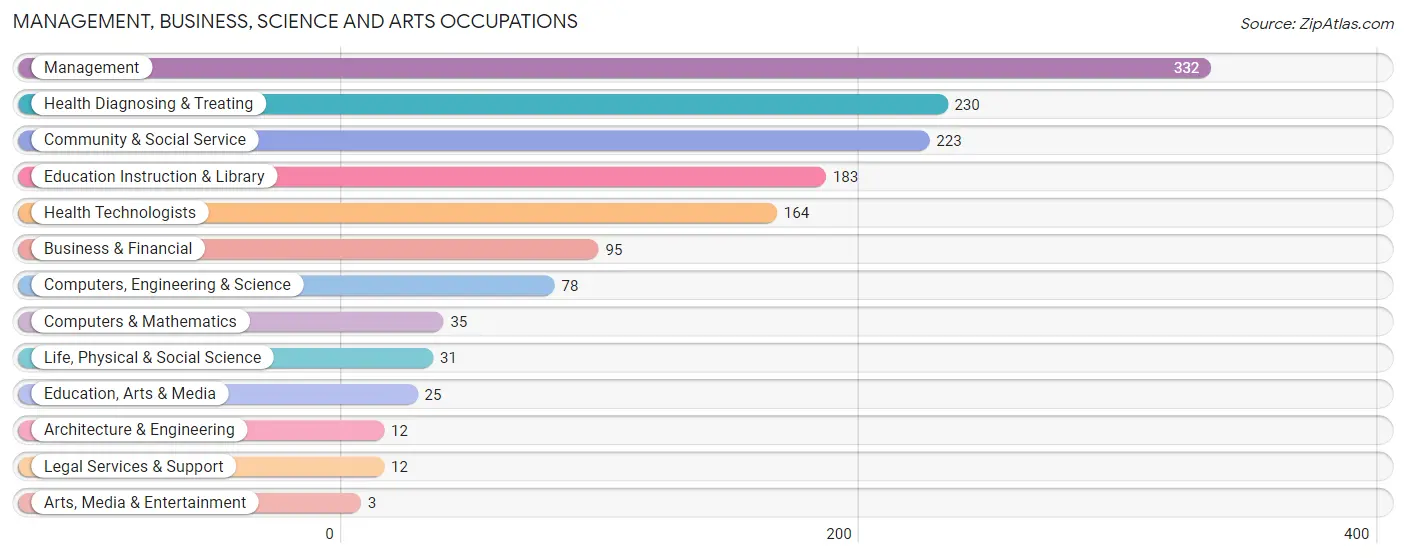
Management, Business, Science and Arts Occupations
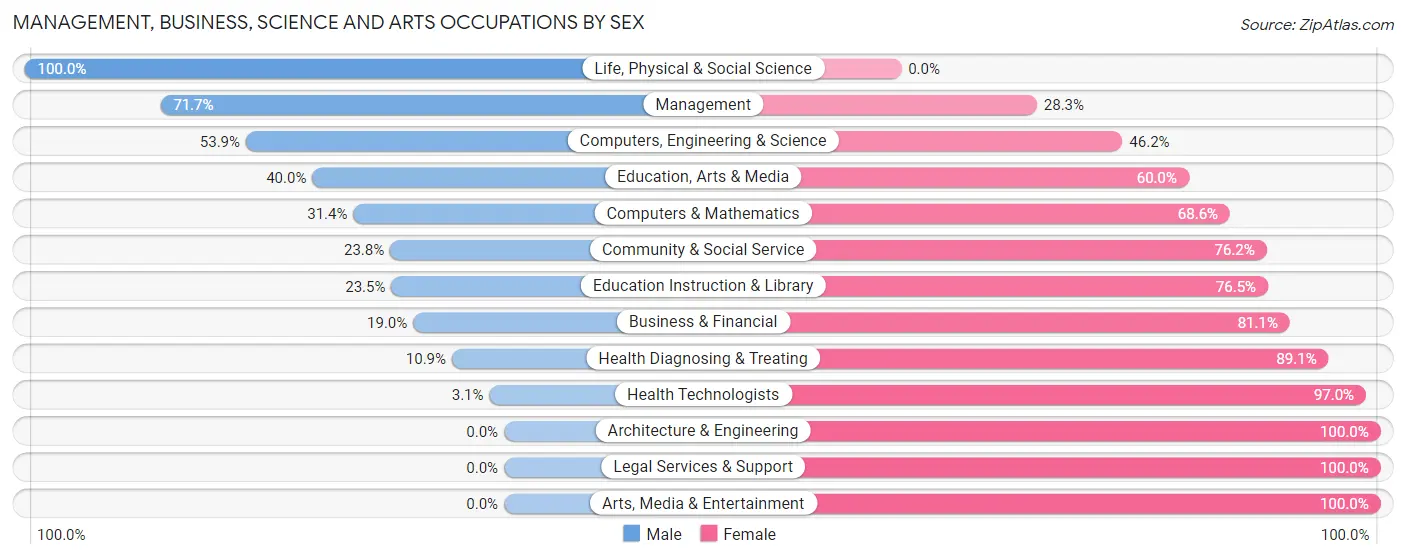
The most common Management, Business, Science and Arts occupations in Goliad County are Management (332 | 11.5%), Health Diagnosing & Treating (230 | 8.0%), Community & Social Service (223 | 7.7%), Education Instruction & Library (183 | 6.4%), and Health Technologists (164 | 5.7%).
Management, Business, Science and Arts Occupations by Sex
Within the Management, Business, Science and Arts occupations in Goliad County, the most male-oriented occupations are Life, Physical & Social Science (100.0%), Management (71.7%), and Computers, Engineering & Science (53.8%), while the most female-oriented occupations are Architecture & Engineering (100.0%), Legal Services & Support (100.0%), and Arts, Media & Entertainment (100.0%).
| Occupation | Male | Female |
| Management | 238 (71.7%) | 94 (28.3%) |
| Business & Financial | 18 (19.0%) | 77 (81.0%) |
| Computers, Engineering & Science | 42 (53.8%) | 36 (46.2%) |
| Computers & Mathematics | 11 (31.4%) | 24 (68.6%) |
| Architecture & Engineering | 0 (0.0%) | 12 (100.0%) |
| Life, Physical & Social Science | 31 (100.0%) | 0 (0.0%) |
| Community & Social Service | 53 (23.8%) | 170 (76.2%) |
| Education, Arts & Media | 10 (40.0%) | 15 (60.0%) |
| Legal Services & Support | 0 (0.0%) | 12 (100.0%) |
| Education Instruction & Library | 43 (23.5%) | 140 (76.5%) |
| Arts, Media & Entertainment | 0 (0.0%) | 3 (100.0%) |
| Health Diagnosing & Treating | 25 (10.9%) | 205 (89.1%) |
| Health Technologists | 5 (3.0%) | 159 (97.0%) |
| Total (Category) | 376 (39.3%) | 582 (60.8%) |
| Total (Overall) | 1,524 (52.9%) | 1,358 (47.1%) |
Services Occupations
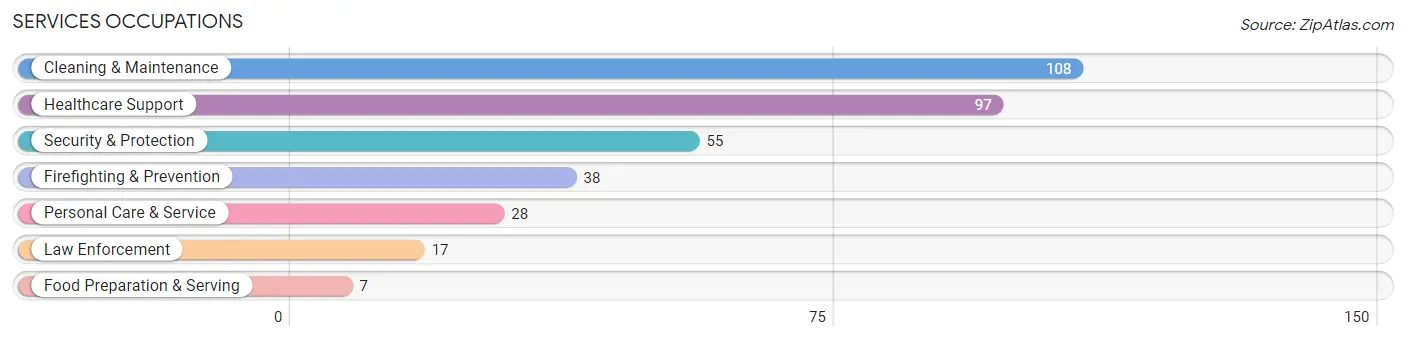
The most common Services occupations in Goliad County are Cleaning & Maintenance (108 | 3.7%), Healthcare Support (97 | 3.4%), Security & Protection (55 | 1.9%), Firefighting & Prevention (38 | 1.3%), and Personal Care & Service (28 | 1.0%).
Services Occupations by Sex
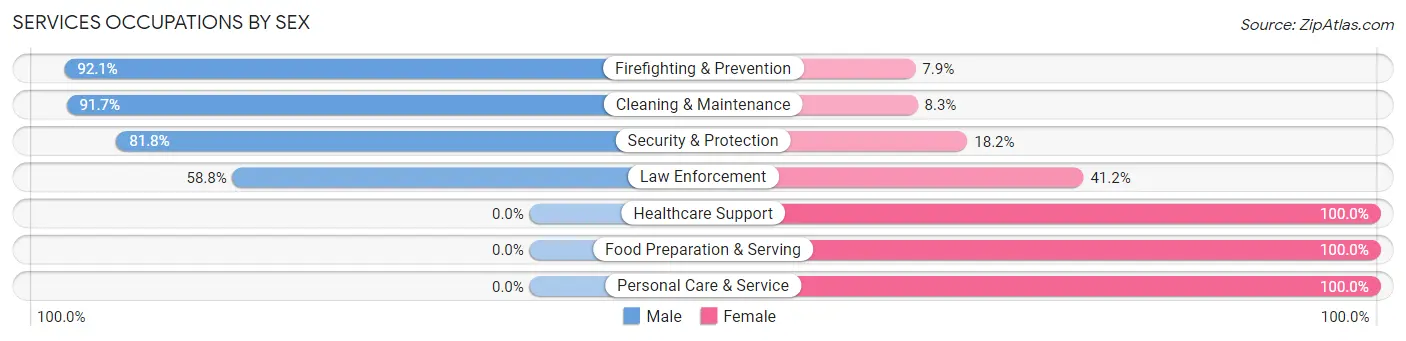
Within the Services occupations in Goliad County, the most male-oriented occupations are Firefighting & Prevention (92.1%), Cleaning & Maintenance (91.7%), and Security & Protection (81.8%), while the most female-oriented occupations are Healthcare Support (100.0%), Food Preparation & Serving (100.0%), and Personal Care & Service (100.0%).
| Occupation | Male | Female |
| Healthcare Support | 0 (0.0%) | 97 (100.0%) |
| Security & Protection | 45 (81.8%) | 10 (18.2%) |
| Firefighting & Prevention | 35 (92.1%) | 3 (7.9%) |
| Law Enforcement | 10 (58.8%) | 7 (41.2%) |
| Food Preparation & Serving | 0 (0.0%) | 7 (100.0%) |
| Cleaning & Maintenance | 99 (91.7%) | 9 (8.3%) |
| Personal Care & Service | 0 (0.0%) | 28 (100.0%) |
| Total (Category) | 144 (48.8%) | 151 (51.2%) |
| Total (Overall) | 1,524 (52.9%) | 1,358 (47.1%) |
Sales and Office Occupations
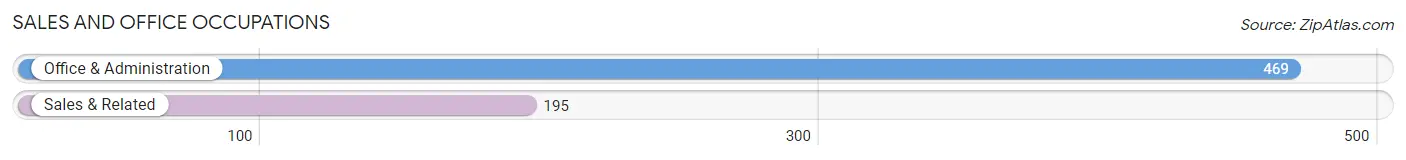
The most common Sales and Office occupations in Goliad County are Office & Administration (469 | 16.3%), and Sales & Related (195 | 6.8%).
Sales and Office Occupations by Sex
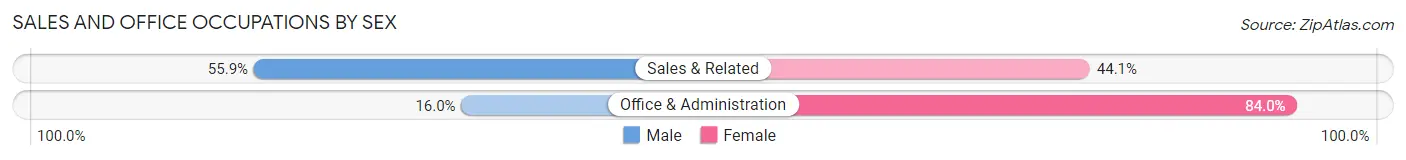
| Occupation | Male | Female |
| Sales & Related | 109 (55.9%) | 86 (44.1%) |
| Office & Administration | 75 (16.0%) | 394 (84.0%) |
| Total (Category) | 184 (27.7%) | 480 (72.3%) |
| Total (Overall) | 1,524 (52.9%) | 1,358 (47.1%) |
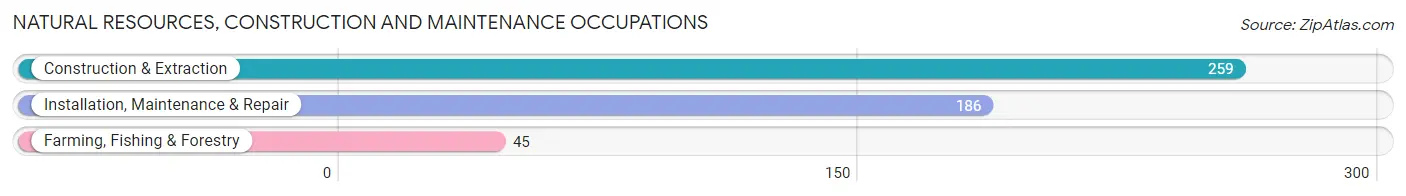
Natural Resources, Construction and Maintenance Occupations
The most common Natural Resources, Construction and Maintenance occupations in Goliad County are Construction & Extraction (259 | 9.0%), Installation, Maintenance & Repair (186 | 6.5%), and Farming, Fishing & Forestry (45 | 1.6%).
Natural Resources, Construction and Maintenance Occupations by Sex
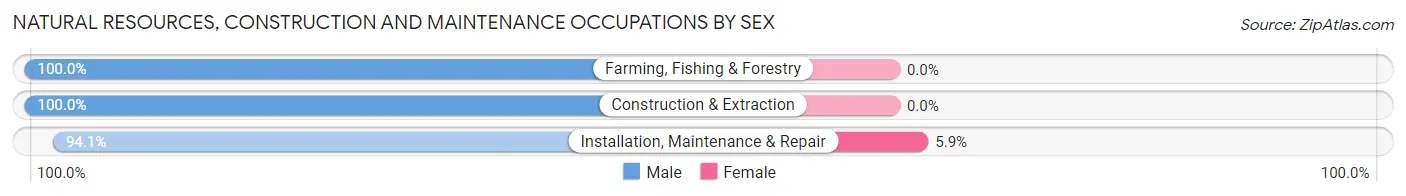
| Occupation | Male | Female |
| Farming, Fishing & Forestry | 45 (100.0%) | 0 (0.0%) |
| Construction & Extraction | 259 (100.0%) | 0 (0.0%) |
| Installation, Maintenance & Repair | 175 (94.1%) | 11 (5.9%) |
| Total (Category) | 479 (97.8%) | 11 (2.2%) |
| Total (Overall) | 1,524 (52.9%) | 1,358 (47.1%) |
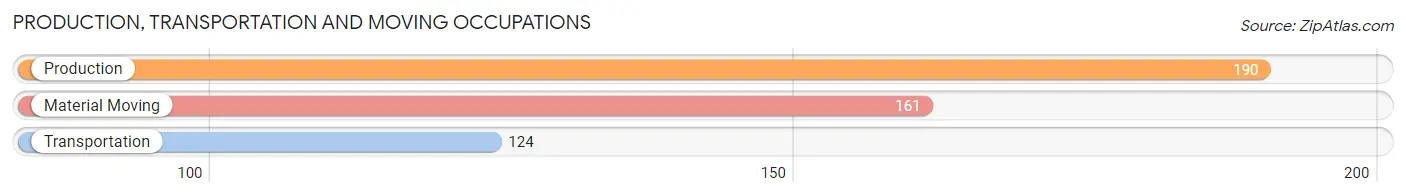
Production, Transportation and Moving Occupations
The most common Production, Transportation and Moving occupations in Goliad County are Production (190 | 6.6%), Material Moving (161 | 5.6%), and Transportation (124 | 4.3%).
Production, Transportation and Moving Occupations by Sex
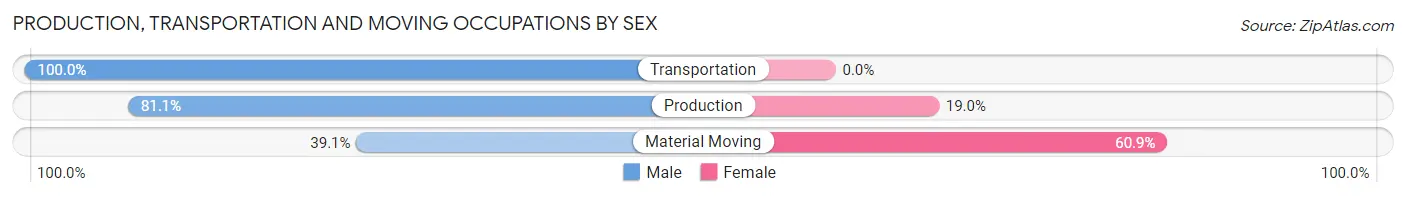
| Occupation | Male | Female |
| Production | 154 (81.0%) | 36 (19.0%) |
| Transportation | 124 (100.0%) | 0 (0.0%) |
| Material Moving | 63 (39.1%) | 98 (60.9%) |
| Total (Category) | 341 (71.8%) | 134 (28.2%) |
| Total (Overall) | 1,524 (52.9%) | 1,358 (47.1%) |
Employment Industries by Sex in Goliad County
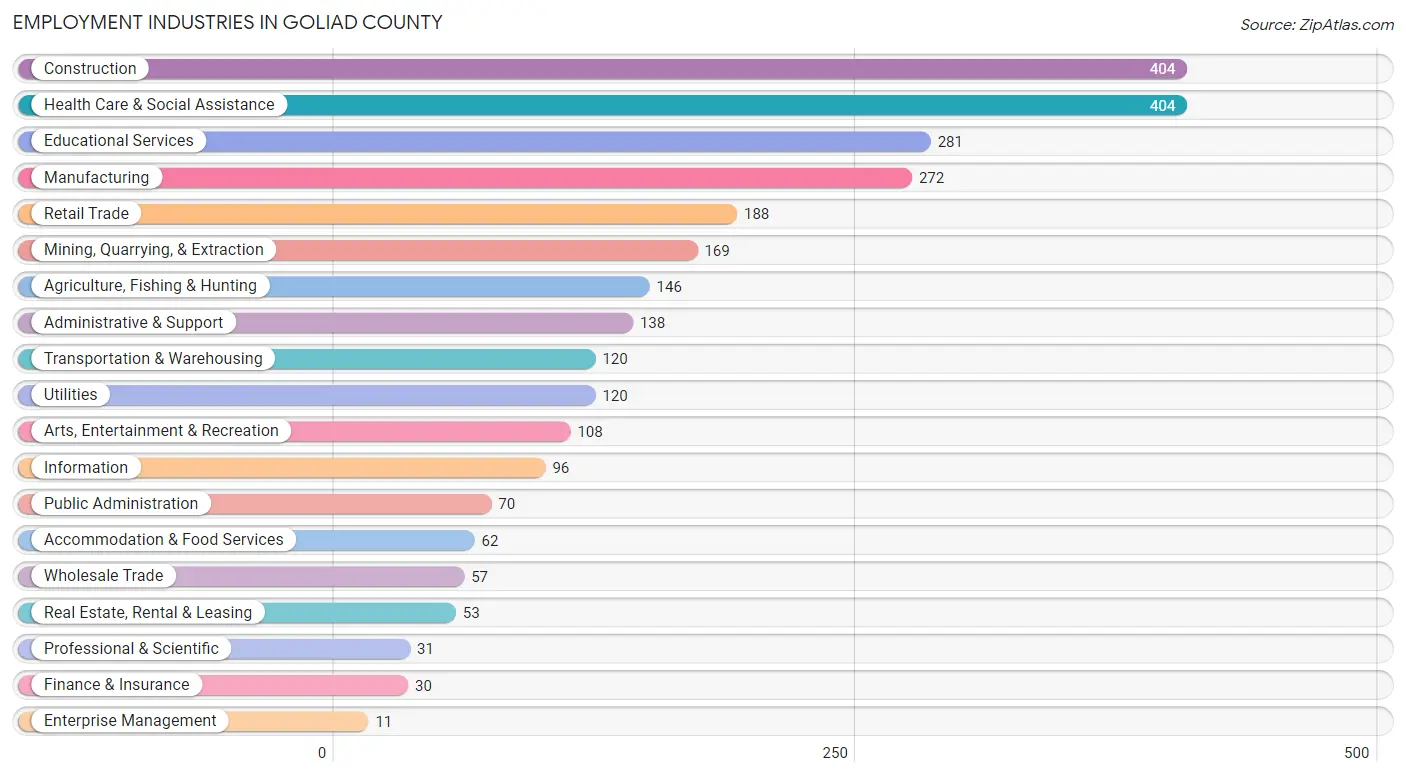
Employment Industries in Goliad County
The major employment industries in Goliad County include Construction (404 | 14.0%), Health Care & Social Assistance (404 | 14.0%), Educational Services (281 | 9.8%), Manufacturing (272 | 9.4%), and Retail Trade (188 | 6.5%).
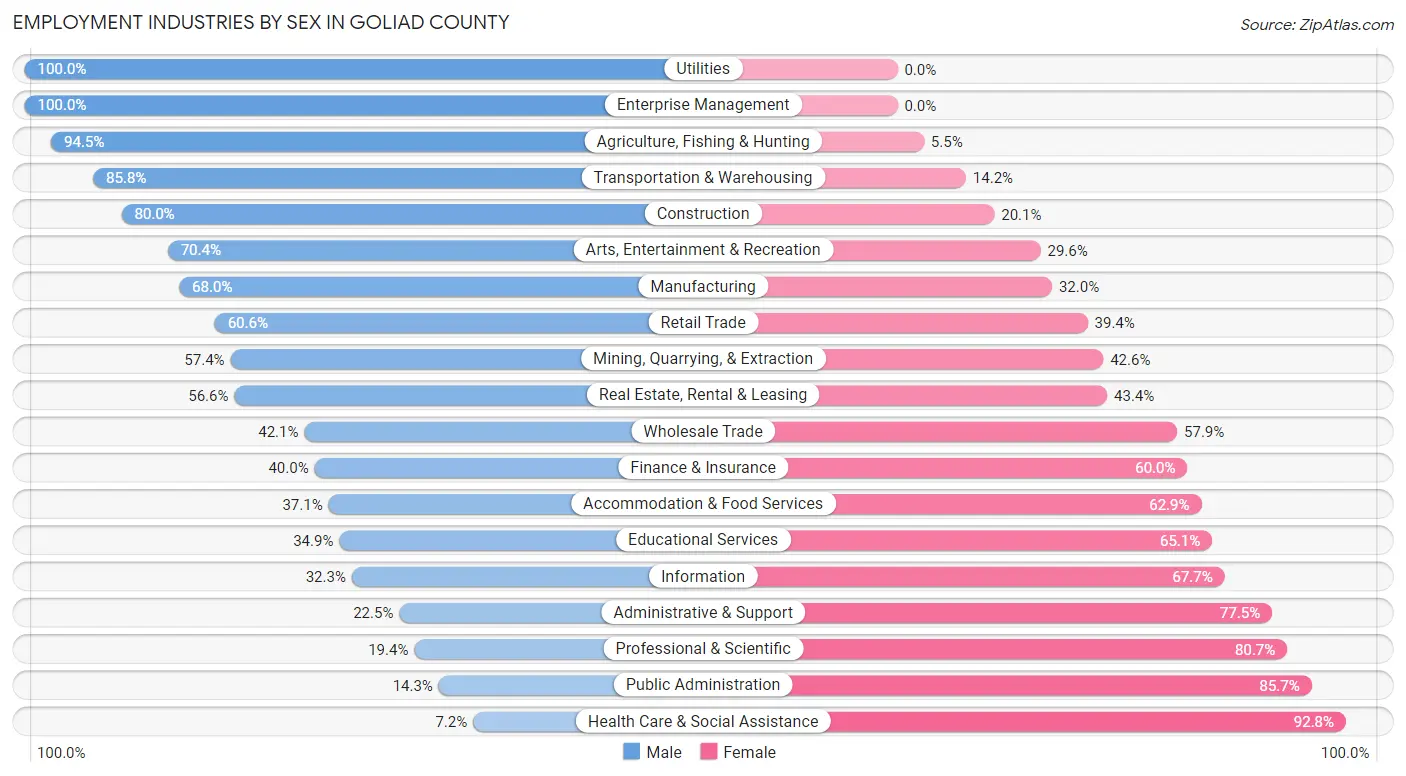
Employment Industries by Sex in Goliad County
The Goliad County industries that see more men than women are Utilities (100.0%), Enterprise Management (100.0%), and Agriculture, Fishing & Hunting (94.5%), whereas the industries that tend to have a higher number of women are Health Care & Social Assistance (92.8%), Public Administration (85.7%), and Professional & Scientific (80.6%).
| Industry | Male | Female |
| Agriculture, Fishing & Hunting | 138 (94.5%) | 8 (5.5%) |
| Mining, Quarrying, & Extraction | 97 (57.4%) | 72 (42.6%) |
| Construction | 323 (79.9%) | 81 (20.1%) |
| Manufacturing | 185 (68.0%) | 87 (32.0%) |
| Wholesale Trade | 24 (42.1%) | 33 (57.9%) |
| Retail Trade | 114 (60.6%) | 74 (39.4%) |
| Transportation & Warehousing | 103 (85.8%) | 17 (14.2%) |
| Utilities | 120 (100.0%) | 0 (0.0%) |
| Information | 31 (32.3%) | 65 (67.7%) |
| Finance & Insurance | 12 (40.0%) | 18 (60.0%) |
| Real Estate, Rental & Leasing | 30 (56.6%) | 23 (43.4%) |
| Professional & Scientific | 6 (19.4%) | 25 (80.6%) |
| Enterprise Management | 11 (100.0%) | 0 (0.0%) |
| Administrative & Support | 31 (22.5%) | 107 (77.5%) |
| Educational Services | 98 (34.9%) | 183 (65.1%) |
| Health Care & Social Assistance | 29 (7.2%) | 375 (92.8%) |
| Arts, Entertainment & Recreation | 76 (70.4%) | 32 (29.6%) |
| Accommodation & Food Services | 23 (37.1%) | 39 (62.9%) |
| Public Administration | 10 (14.3%) | 60 (85.7%) |
| Total | 1,524 (52.9%) | 1,358 (47.1%) |
Education in Goliad County
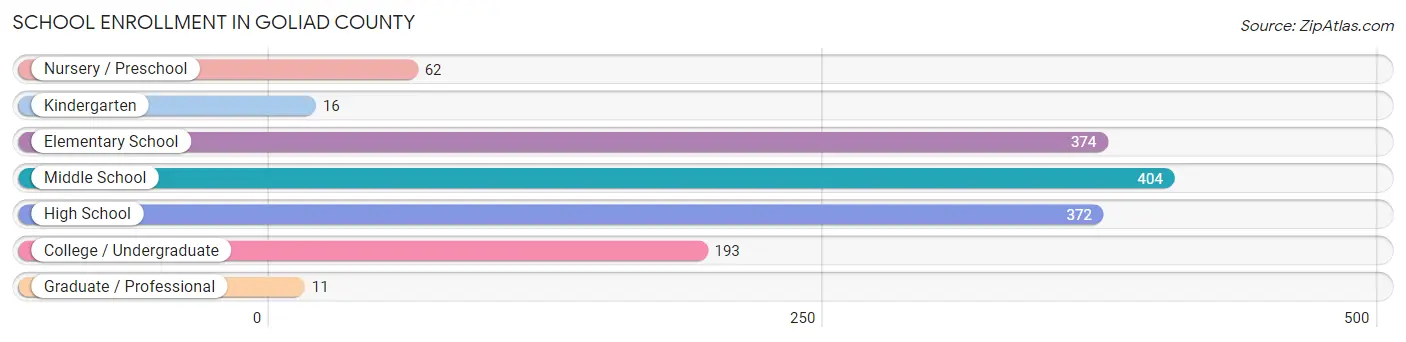
School Enrollment in Goliad County
The most common levels of schooling among the 1,432 students in Goliad County are middle school (404 | 28.2%), elementary school (374 | 26.1%), and high school (372 | 26.0%).
| School Level | # Students | % Students |
| Nursery / Preschool | 62 | 4.3% |
| Kindergarten | 16 | 1.1% |
| Elementary School | 374 | 26.1% |
| Middle School | 404 | 28.2% |
| High School | 372 | 26.0% |
| College / Undergraduate | 193 | 13.5% |
| Graduate / Professional | 11 | 0.8% |
| Total | 1,432 | 100.0% |
School Enrollment by Age by Funding Source in Goliad County
Out of a total of 1,432 students who are enrolled in schools in Goliad County, 176 (12.3%) attend a private institution, while the remaining 1,256 (87.7%) are enrolled in public schools. The age group of 3 to 4 year olds has the highest likelihood of being enrolled in private schools, with 14 (50.0% in the age bracket) enrolled. Conversely, the age group of 20 to 24 year olds has the lowest likelihood of being enrolled in a private school, with 86 (100.0% in the age bracket) attending a public institution.
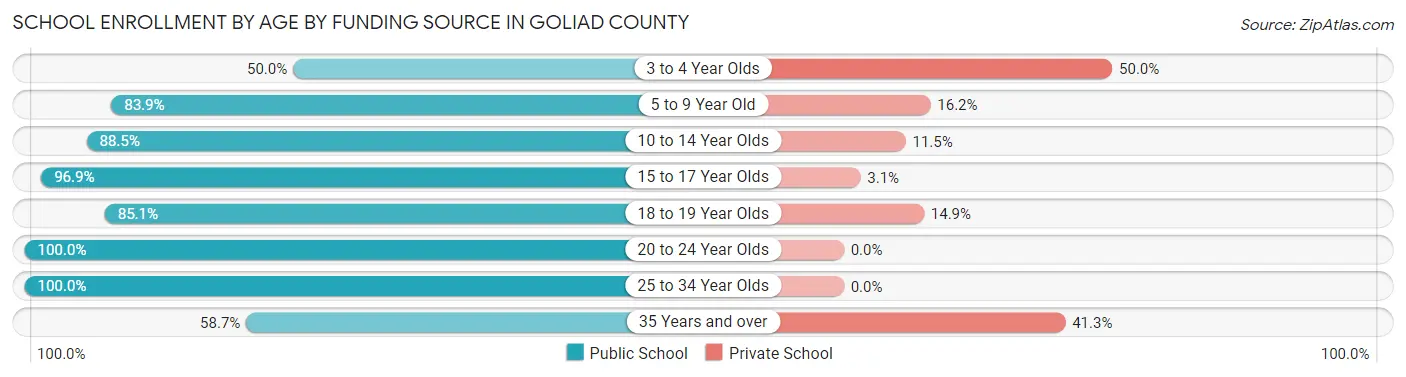
| Age Bracket | Public School | Private School |
| 3 to 4 Year Olds | 14 (50.0%) | 14 (50.0%) |
| 5 to 9 Year Old | 296 (83.9%) | 57 (16.2%) |
| 10 to 14 Year Olds | 445 (88.5%) | 58 (11.5%) |
| 15 to 17 Year Olds | 249 (96.9%) | 8 (3.1%) |
| 18 to 19 Year Olds | 74 (85.1%) | 13 (14.9%) |
| 20 to 24 Year Olds | 86 (100.0%) | 0 (0.0%) |
| 25 to 34 Year Olds | 55 (100.0%) | 0 (0.0%) |
| 35 Years and over | 37 (58.7%) | 26 (41.3%) |
| Total | 1,256 (87.7%) | 176 (12.3%) |
Educational Attainment by Field of Study in Goliad County
Business (185 | 19.8%), education (170 | 18.2%), arts & humanities (112 | 12.0%), bio, nature & agricultural (98 | 10.5%), and science & technology (79 | 8.5%) are the most common fields of study among 933 individuals in Goliad County who have obtained a bachelor's degree or higher.
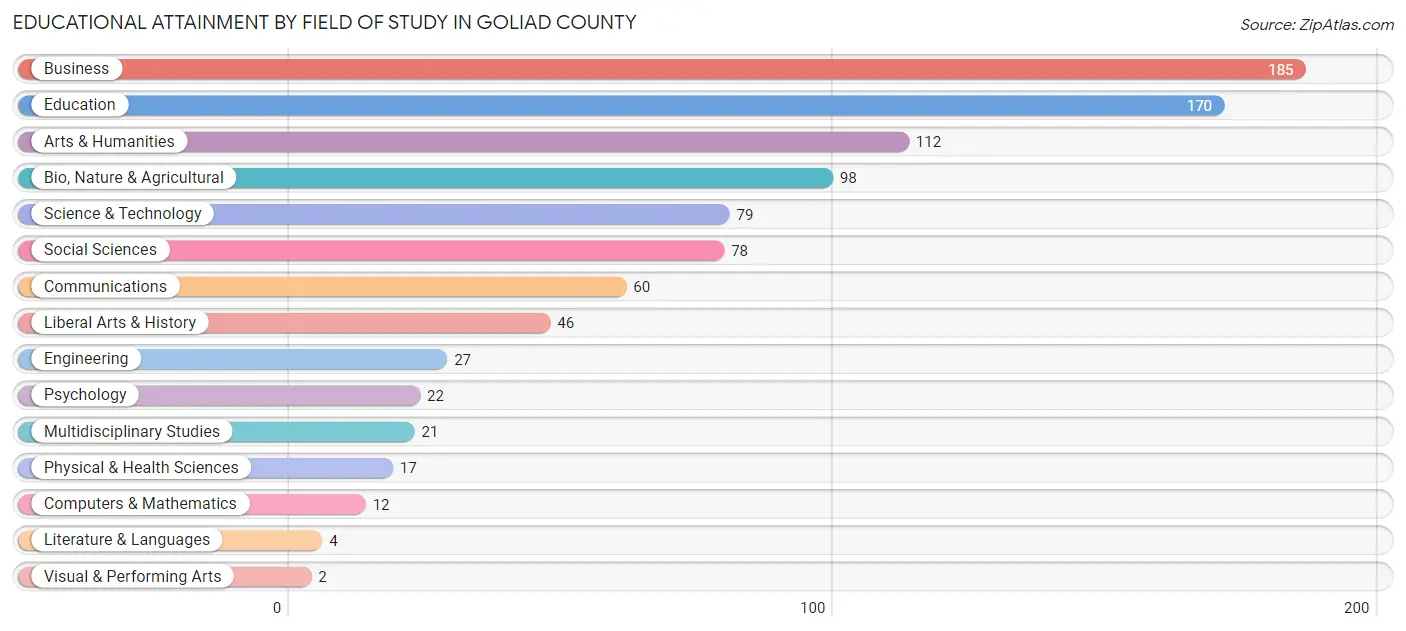
| Field of Study | # Graduates | % Graduates |
| Computers & Mathematics | 12 | 1.3% |
| Bio, Nature & Agricultural | 98 | 10.5% |
| Physical & Health Sciences | 17 | 1.8% |
| Psychology | 22 | 2.4% |
| Social Sciences | 78 | 8.4% |
| Engineering | 27 | 2.9% |
| Multidisciplinary Studies | 21 | 2.2% |
| Science & Technology | 79 | 8.5% |
| Business | 185 | 19.8% |
| Education | 170 | 18.2% |
| Literature & Languages | 4 | 0.4% |
| Liberal Arts & History | 46 | 4.9% |
| Visual & Performing Arts | 2 | 0.2% |
| Communications | 60 | 6.4% |
| Arts & Humanities | 112 | 12.0% |
| Total | 933 | 100.0% |
Transportation & Commute in Goliad County
Vehicle Availability by Sex in Goliad County
The most prevalent vehicle ownership categories in Goliad County are males with 2 vehicles (535, accounting for 35.3%) and females with 2 vehicles (522, making up 39.5%).
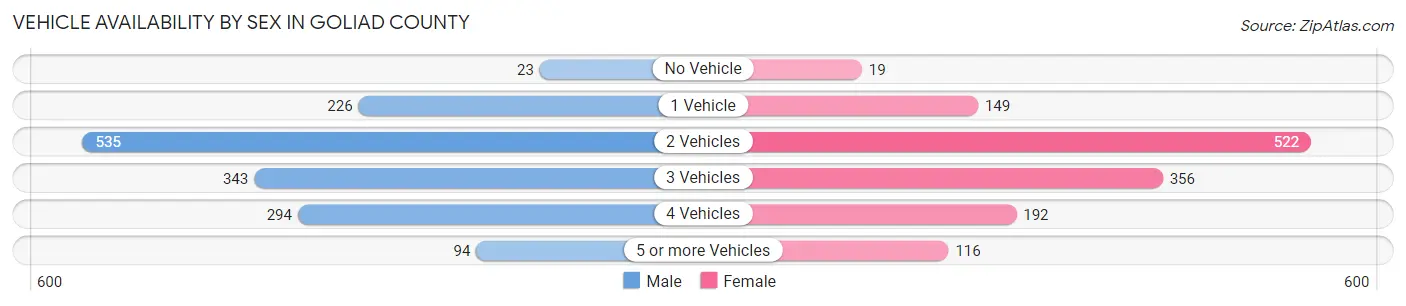
| Vehicles Available | Male | Female |
| No Vehicle | 23 (1.5%) | 19 (1.4%) |
| 1 Vehicle | 226 (14.9%) | 149 (11.0%) |
| 2 Vehicles | 535 (35.3%) | 522 (38.6%) |
| 3 Vehicles | 343 (22.6%) | 356 (26.3%) |
| 4 Vehicles | 294 (19.4%) | 192 (14.2%) |
| 5 or more Vehicles | 94 (6.2%) | 116 (8.6%) |
| Total | 1,515 (100.0%) | 1,354 (100.0%) |
Commute Time in Goliad County
The most frequently occuring commute durations in Goliad County are 30 to 34 minutes (571 commuters, 21.9%), 45 to 59 minutes (307 commuters, 11.8%), and 10 to 14 minutes (294 commuters, 11.3%).
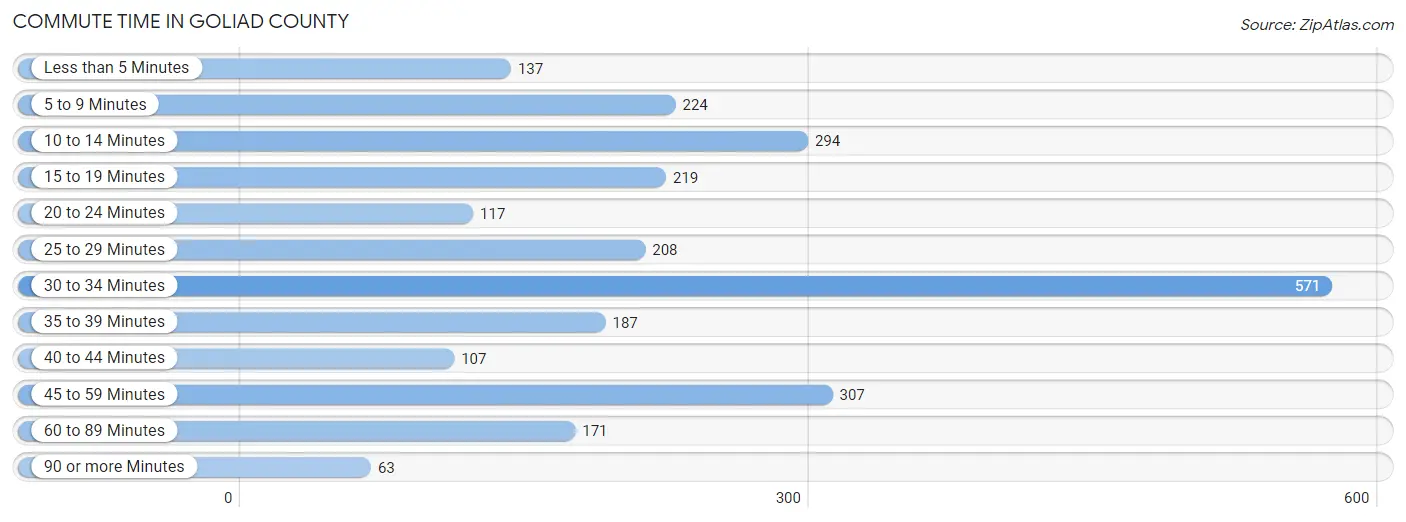
| Commute Time | # Commuters | % Commuters |
| Less than 5 Minutes | 137 | 5.3% |
| 5 to 9 Minutes | 224 | 8.6% |
| 10 to 14 Minutes | 294 | 11.3% |
| 15 to 19 Minutes | 219 | 8.4% |
| 20 to 24 Minutes | 117 | 4.5% |
| 25 to 29 Minutes | 208 | 8.0% |
| 30 to 34 Minutes | 571 | 21.9% |
| 35 to 39 Minutes | 187 | 7.2% |
| 40 to 44 Minutes | 107 | 4.1% |
| 45 to 59 Minutes | 307 | 11.8% |
| 60 to 89 Minutes | 171 | 6.6% |
| 90 or more Minutes | 63 | 2.4% |
Commute Time by Sex in Goliad County
The most common commute times in Goliad County are 30 to 34 minutes (270 commuters, 19.4%) for males and 30 to 34 minutes (301 commuters, 24.8%) for females.
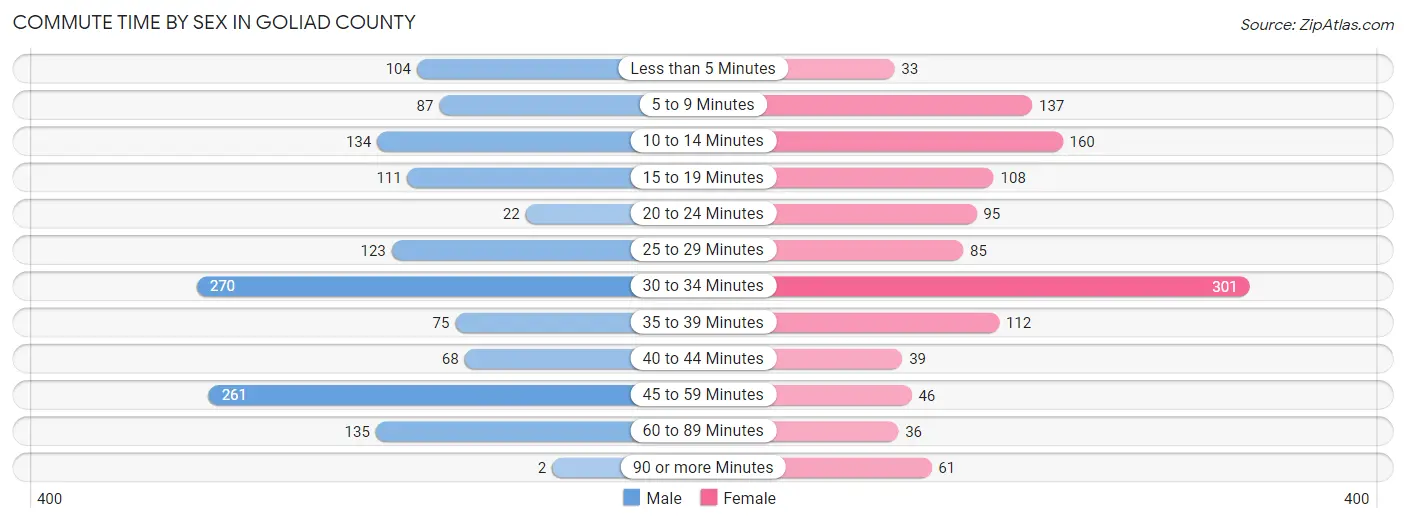
| Commute Time | Male | Female |
| Less than 5 Minutes | 104 (7.5%) | 33 (2.7%) |
| 5 to 9 Minutes | 87 (6.2%) | 137 (11.3%) |
| 10 to 14 Minutes | 134 (9.6%) | 160 (13.2%) |
| 15 to 19 Minutes | 111 (8.0%) | 108 (8.9%) |
| 20 to 24 Minutes | 22 (1.6%) | 95 (7.8%) |
| 25 to 29 Minutes | 123 (8.8%) | 85 (7.0%) |
| 30 to 34 Minutes | 270 (19.4%) | 301 (24.8%) |
| 35 to 39 Minutes | 75 (5.4%) | 112 (9.2%) |
| 40 to 44 Minutes | 68 (4.9%) | 39 (3.2%) |
| 45 to 59 Minutes | 261 (18.8%) | 46 (3.8%) |
| 60 to 89 Minutes | 135 (9.7%) | 36 (3.0%) |
| 90 or more Minutes | 2 (0.1%) | 61 (5.0%) |
Time of Departure to Work by Sex in Goliad County
The most frequent times of departure to work in Goliad County are 6:00 AM to 6:29 AM (299, 21.5%) for males and 7:30 AM to 7:59 AM (313, 25.8%) for females.
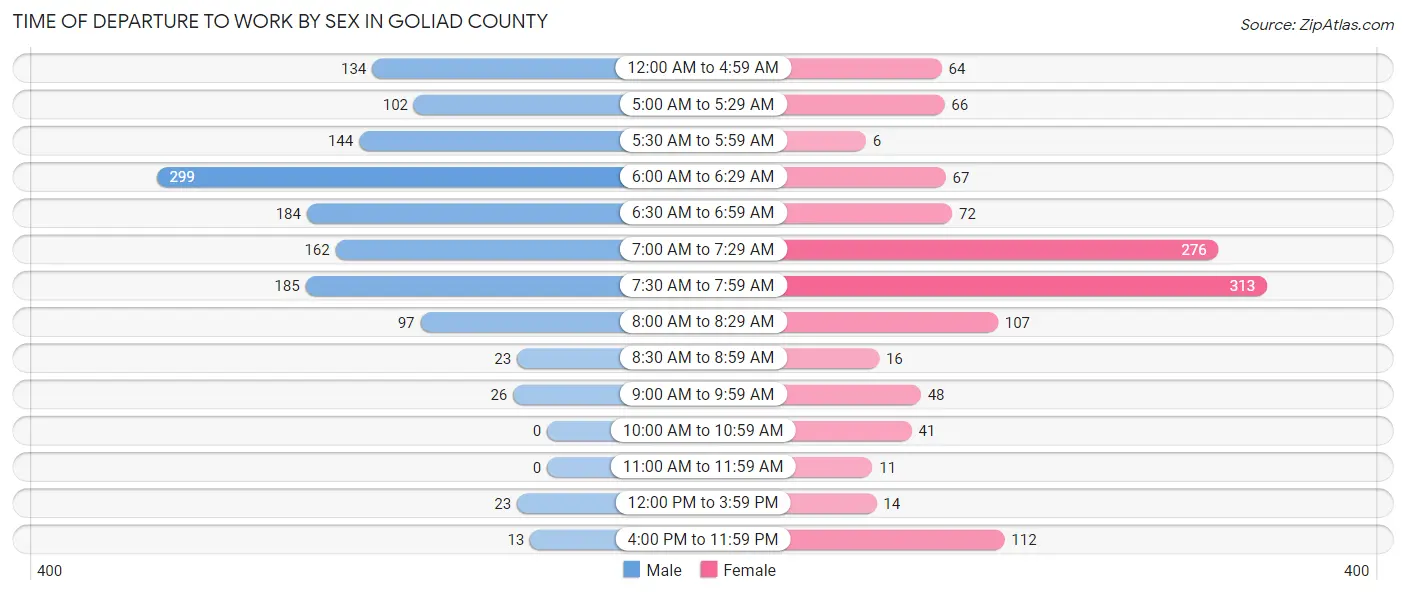
| Time of Departure | Male | Female |
| 12:00 AM to 4:59 AM | 134 (9.6%) | 64 (5.3%) |
| 5:00 AM to 5:29 AM | 102 (7.3%) | 66 (5.4%) |
| 5:30 AM to 5:59 AM | 144 (10.3%) | 6 (0.5%) |
| 6:00 AM to 6:29 AM | 299 (21.5%) | 67 (5.5%) |
| 6:30 AM to 6:59 AM | 184 (13.2%) | 72 (5.9%) |
| 7:00 AM to 7:29 AM | 162 (11.6%) | 276 (22.8%) |
| 7:30 AM to 7:59 AM | 185 (13.3%) | 313 (25.8%) |
| 8:00 AM to 8:29 AM | 97 (7.0%) | 107 (8.8%) |
| 8:30 AM to 8:59 AM | 23 (1.7%) | 16 (1.3%) |
| 9:00 AM to 9:59 AM | 26 (1.9%) | 48 (4.0%) |
| 10:00 AM to 10:59 AM | 0 (0.0%) | 41 (3.4%) |
| 11:00 AM to 11:59 AM | 0 (0.0%) | 11 (0.9%) |
| 12:00 PM to 3:59 PM | 23 (1.7%) | 14 (1.1%) |
| 4:00 PM to 11:59 PM | 13 (0.9%) | 112 (9.2%) |
| Total | 1,392 (100.0%) | 1,213 (100.0%) |
Housing Occupancy in Goliad County
Occupancy by Ownership in Goliad County
Of the total 2,720 dwellings in Goliad County, owner-occupied units account for 2,249 (82.7%), while renter-occupied units make up 471 (17.3%).
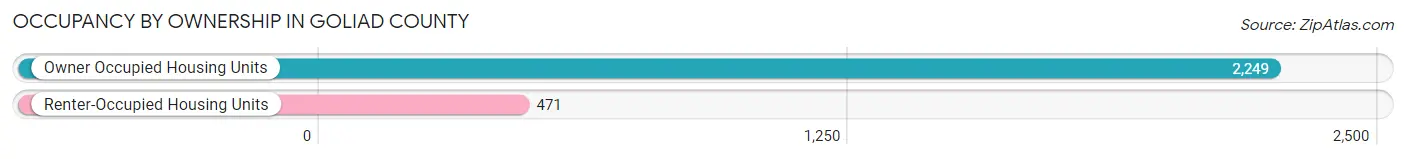
| Occupancy | # Housing Units | % Housing Units |
| Owner Occupied Housing Units | 2,249 | 82.7% |
| Renter-Occupied Housing Units | 471 | 17.3% |
| Total Occupied Housing Units | 2,720 | 100.0% |
Occupancy by Household Size in Goliad County
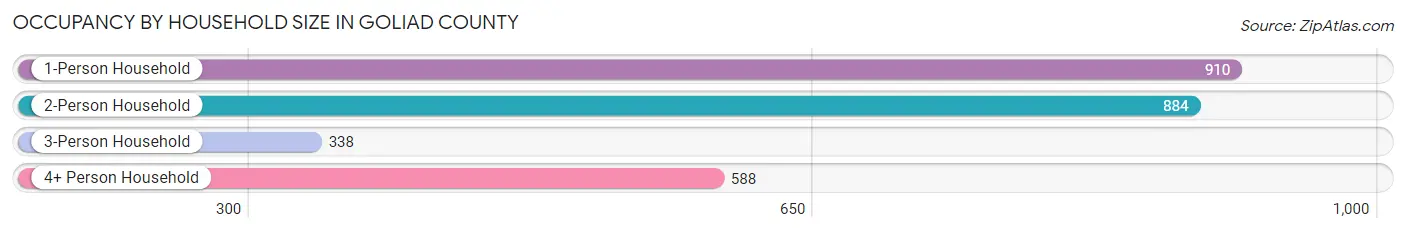
| Household Size | # Housing Units | % Housing Units |
| 1-Person Household | 910 | 33.5% |
| 2-Person Household | 884 | 32.5% |
| 3-Person Household | 338 | 12.4% |
| 4+ Person Household | 588 | 21.6% |
| Total Housing Units | 2,720 | 100.0% |
Occupancy by Ownership by Household Size in Goliad County
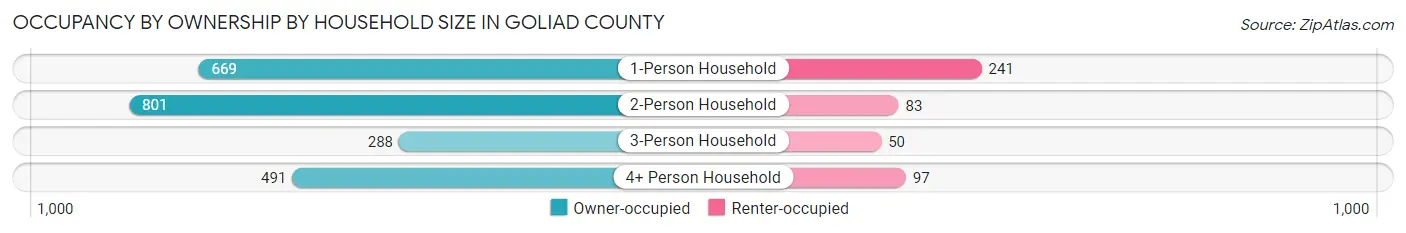
| Household Size | Owner-occupied | Renter-occupied |
| 1-Person Household | 669 (73.5%) | 241 (26.5%) |
| 2-Person Household | 801 (90.6%) | 83 (9.4%) |
| 3-Person Household | 288 (85.2%) | 50 (14.8%) |
| 4+ Person Household | 491 (83.5%) | 97 (16.5%) |
| Total Housing Units | 2,249 (82.7%) | 471 (17.3%) |
Occupancy by Educational Attainment in Goliad County
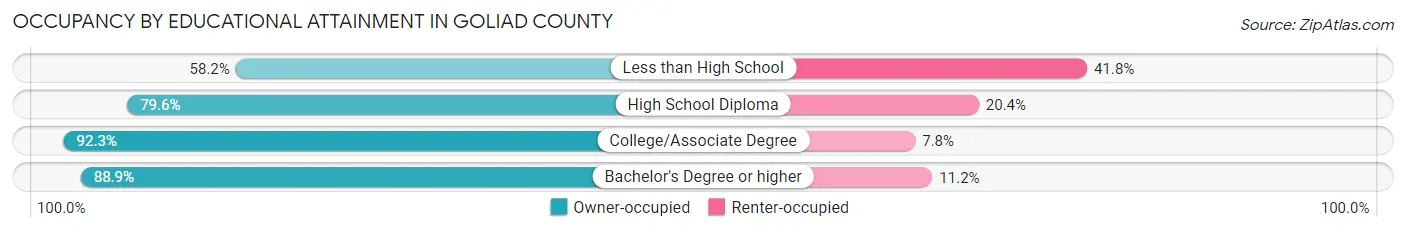
| Household Size | Owner-occupied | Renter-occupied |
| Less than High School | 260 (58.2%) | 187 (41.8%) |
| High School Diploma | 571 (79.6%) | 146 (20.4%) |
| College/Associate Degree | 964 (92.2%) | 81 (7.7%) |
| Bachelor's Degree or higher | 454 (88.8%) | 57 (11.2%) |
Occupancy by Age of Householder in Goliad County
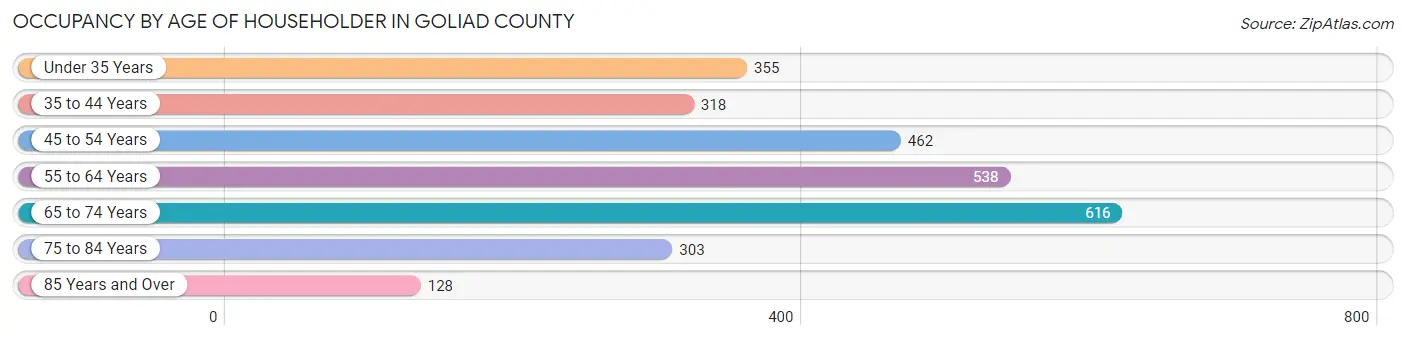
| Age Bracket | # Households | % Households |
| Under 35 Years | 355 | 13.1% |
| 35 to 44 Years | 318 | 11.7% |
| 45 to 54 Years | 462 | 17.0% |
| 55 to 64 Years | 538 | 19.8% |
| 65 to 74 Years | 616 | 22.7% |
| 75 to 84 Years | 303 | 11.1% |
| 85 Years and Over | 128 | 4.7% |
| Total | 2,720 | 100.0% |
Housing Finances in Goliad County
Median Income by Occupancy in Goliad County
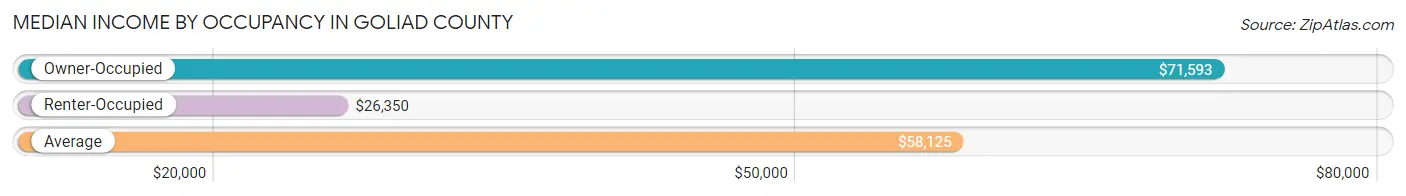
| Occupancy Type | # Households | Median Income |
| Owner-Occupied | 2,249 (82.7%) | $71,593 |
| Renter-Occupied | 471 (17.3%) | $26,350 |
| Average | 2,720 (100.0%) | $58,125 |
Occupancy by Householder Income Bracket in Goliad County
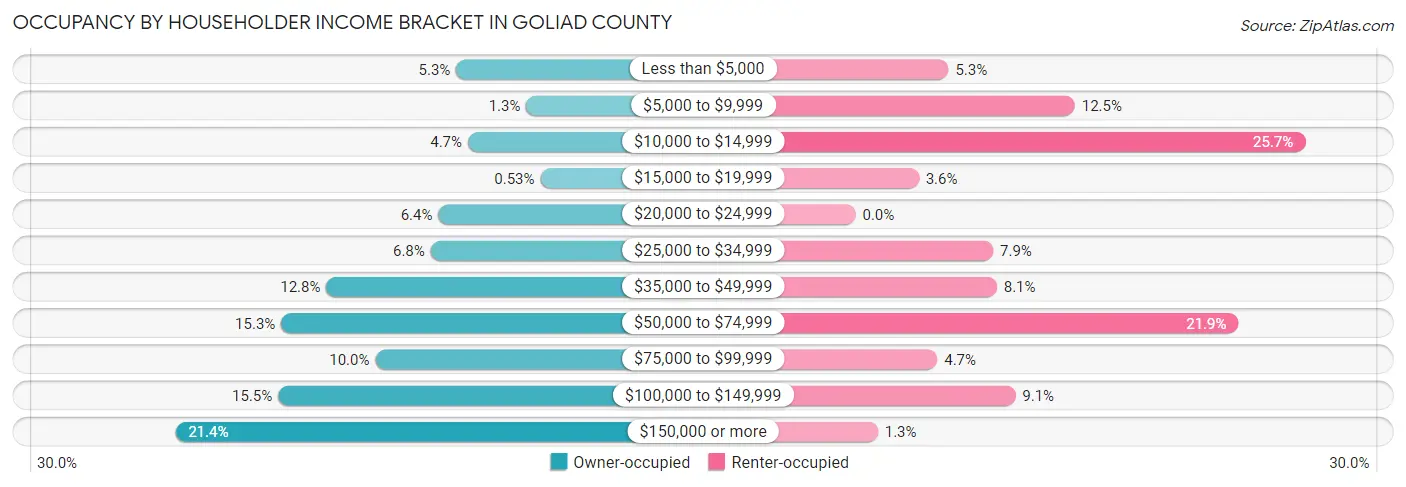
| Income Bracket | Owner-occupied | Renter-occupied |
| Less than $5,000 | 120 (5.3%) | 25 (5.3%) |
| $5,000 to $9,999 | 30 (1.3%) | 59 (12.5%) |
| $10,000 to $14,999 | 105 (4.7%) | 121 (25.7%) |
| $15,000 to $19,999 | 12 (0.5%) | 17 (3.6%) |
| $20,000 to $24,999 | 143 (6.4%) | 0 (0.0%) |
| $25,000 to $34,999 | 153 (6.8%) | 37 (7.9%) |
| $35,000 to $49,999 | 287 (12.8%) | 38 (8.1%) |
| $50,000 to $74,999 | 345 (15.3%) | 103 (21.9%) |
| $75,000 to $99,999 | 224 (10.0%) | 22 (4.7%) |
| $100,000 to $149,999 | 349 (15.5%) | 43 (9.1%) |
| $150,000 or more | 481 (21.4%) | 6 (1.3%) |
| Total | 2,249 (100.0%) | 471 (100.0%) |
Monthly Housing Cost Tiers in Goliad County
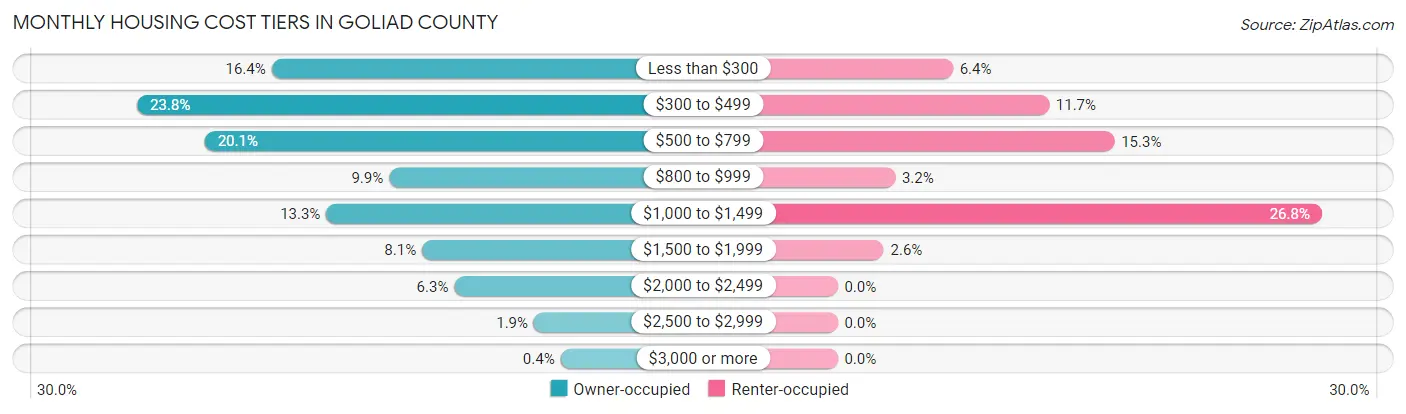
| Monthly Cost | Owner-occupied | Renter-occupied |
| Less than $300 | 368 (16.4%) | 30 (6.4%) |
| $300 to $499 | 535 (23.8%) | 55 (11.7%) |
| $500 to $799 | 451 (20.1%) | 72 (15.3%) |
| $800 to $999 | 222 (9.9%) | 15 (3.2%) |
| $1,000 to $1,499 | 300 (13.3%) | 126 (26.8%) |
| $1,500 to $1,999 | 181 (8.1%) | 12 (2.5%) |
| $2,000 to $2,499 | 141 (6.3%) | 0 (0.0%) |
| $2,500 to $2,999 | 42 (1.9%) | 0 (0.0%) |
| $3,000 or more | 9 (0.4%) | 0 (0.0%) |
| Total | 2,249 (100.0%) | 471 (100.0%) |
Physical Housing Characteristics in Goliad County
Housing Structures in Goliad County
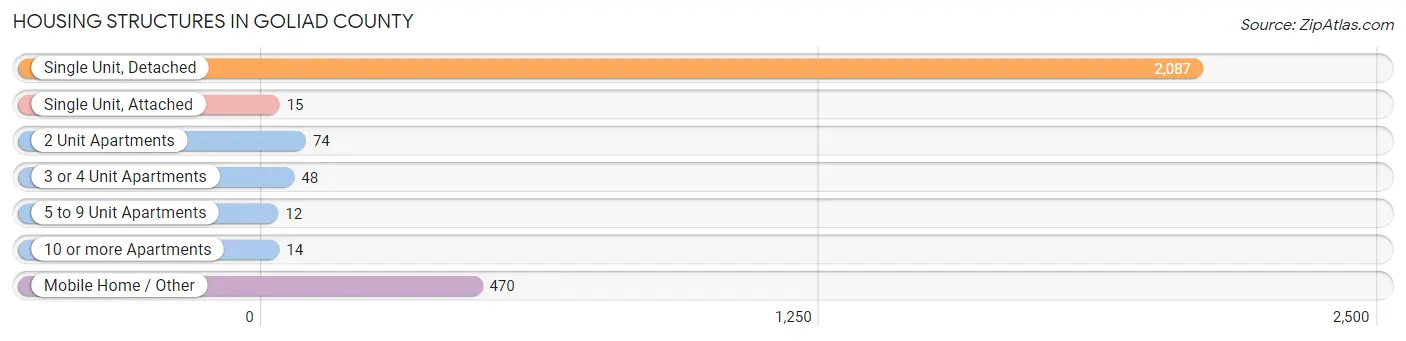
| Structure Type | # Housing Units | % Housing Units |
| Single Unit, Detached | 2,087 | 76.7% |
| Single Unit, Attached | 15 | 0.5% |
| 2 Unit Apartments | 74 | 2.7% |
| 3 or 4 Unit Apartments | 48 | 1.8% |
| 5 to 9 Unit Apartments | 12 | 0.4% |
| 10 or more Apartments | 14 | 0.5% |
| Mobile Home / Other | 470 | 17.3% |
| Total | 2,720 | 100.0% |
Housing Structures by Occupancy in Goliad County
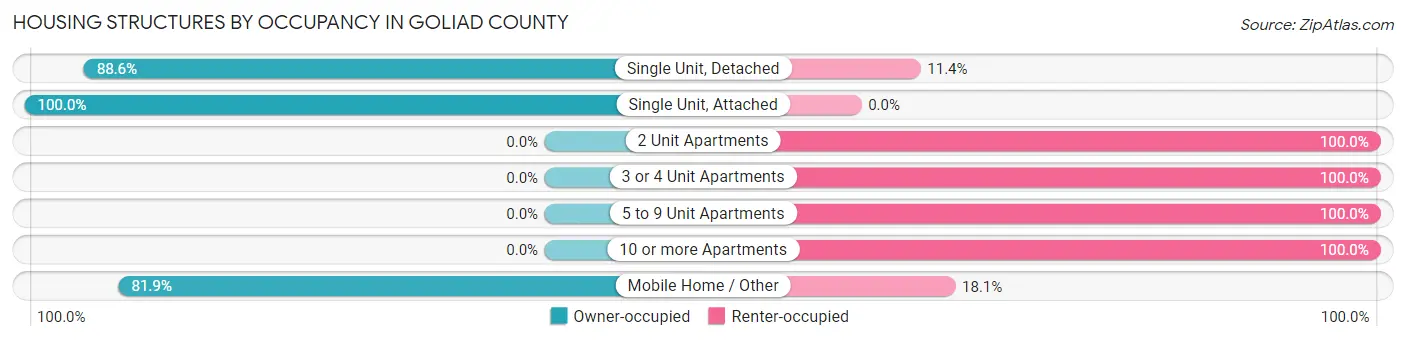
| Structure Type | Owner-occupied | Renter-occupied |
| Single Unit, Detached | 1,849 (88.6%) | 238 (11.4%) |
| Single Unit, Attached | 15 (100.0%) | 0 (0.0%) |
| 2 Unit Apartments | 0 (0.0%) | 74 (100.0%) |
| 3 or 4 Unit Apartments | 0 (0.0%) | 48 (100.0%) |
| 5 to 9 Unit Apartments | 0 (0.0%) | 12 (100.0%) |
| 10 or more Apartments | 0 (0.0%) | 14 (100.0%) |
| Mobile Home / Other | 385 (81.9%) | 85 (18.1%) |
| Total | 2,249 (82.7%) | 471 (17.3%) |
Housing Structures by Number of Rooms in Goliad County
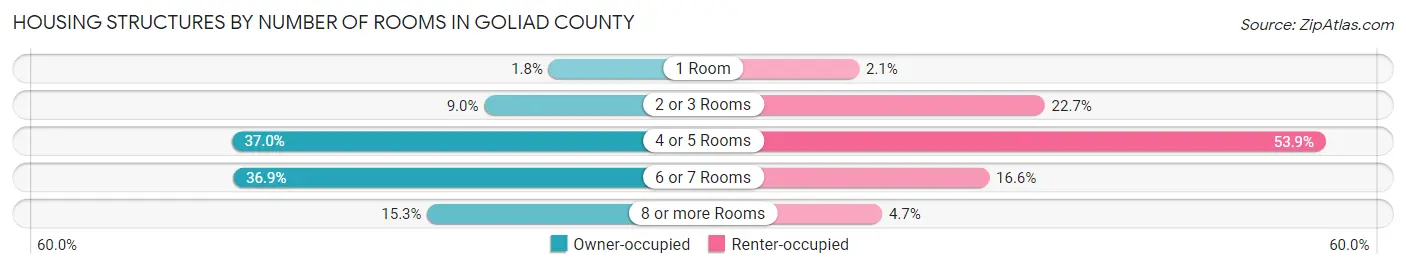
| Number of Rooms | Owner-occupied | Renter-occupied |
| 1 Room | 41 (1.8%) | 10 (2.1%) |
| 2 or 3 Rooms | 202 (9.0%) | 107 (22.7%) |
| 4 or 5 Rooms | 833 (37.0%) | 254 (53.9%) |
| 6 or 7 Rooms | 829 (36.9%) | 78 (16.6%) |
| 8 or more Rooms | 344 (15.3%) | 22 (4.7%) |
| Total | 2,249 (100.0%) | 471 (100.0%) |
Housing Structure by Heating Type in Goliad County
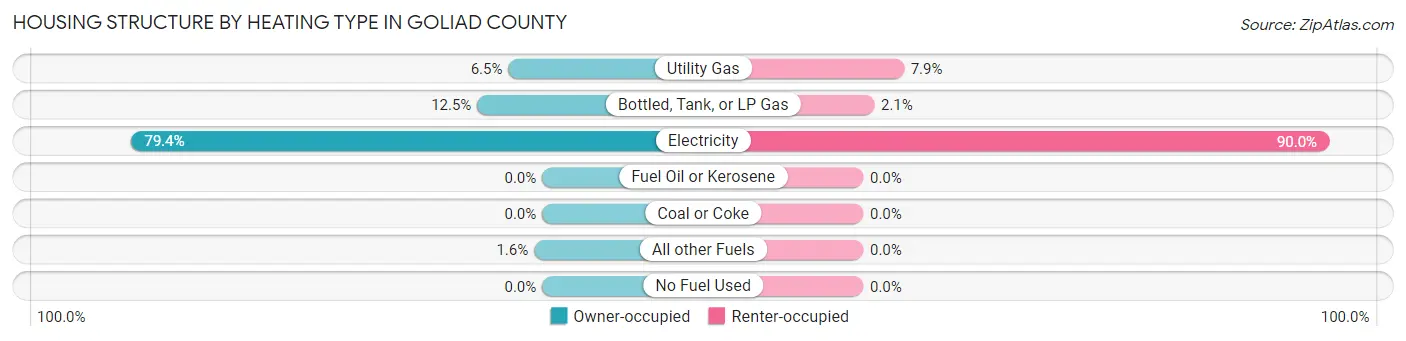
| Heating Type | Owner-occupied | Renter-occupied |
| Utility Gas | 147 (6.5%) | 37 (7.9%) |
| Bottled, Tank, or LP Gas | 282 (12.5%) | 10 (2.1%) |
| Electricity | 1,785 (79.4%) | 424 (90.0%) |
| Fuel Oil or Kerosene | 0 (0.0%) | 0 (0.0%) |
| Coal or Coke | 0 (0.0%) | 0 (0.0%) |
| All other Fuels | 35 (1.6%) | 0 (0.0%) |
| No Fuel Used | 0 (0.0%) | 0 (0.0%) |
| Total | 2,249 (100.0%) | 471 (100.0%) |
Household Vehicle Usage in Goliad County
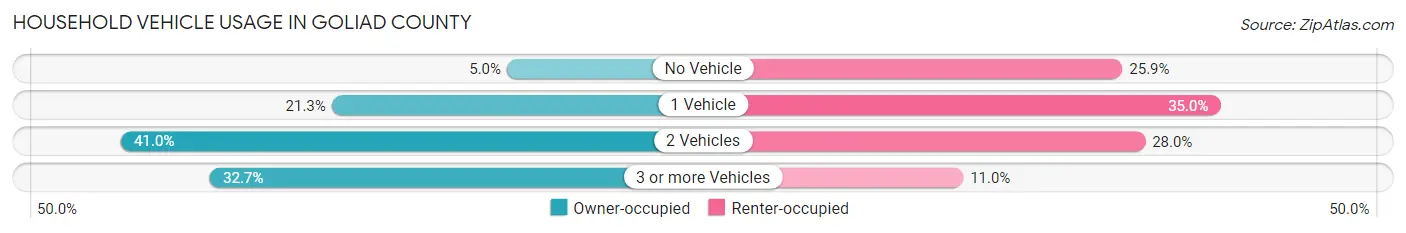
| Vehicles per Household | Owner-occupied | Renter-occupied |
| No Vehicle | 112 (5.0%) | 122 (25.9%) |
| 1 Vehicle | 480 (21.3%) | 165 (35.0%) |
| 2 Vehicles | 922 (41.0%) | 132 (28.0%) |
| 3 or more Vehicles | 735 (32.7%) | 52 (11.0%) |
| Total | 2,249 (100.0%) | 471 (100.0%) |
Real Estate & Mortgages in Goliad County
Real Estate and Mortgage Overview in Goliad County
| Characteristic | Without Mortgage | With Mortgage |
| Housing Units | 1,549 | 700 |
| Median Property Value | $144,100 | $206,500 |
| Median Household Income | $52,835 | $296 |
| Monthly Housing Costs | $461 | $2 |
| Real Estate Taxes | $1,400 | $17 |
Property Value by Mortgage Status in Goliad County
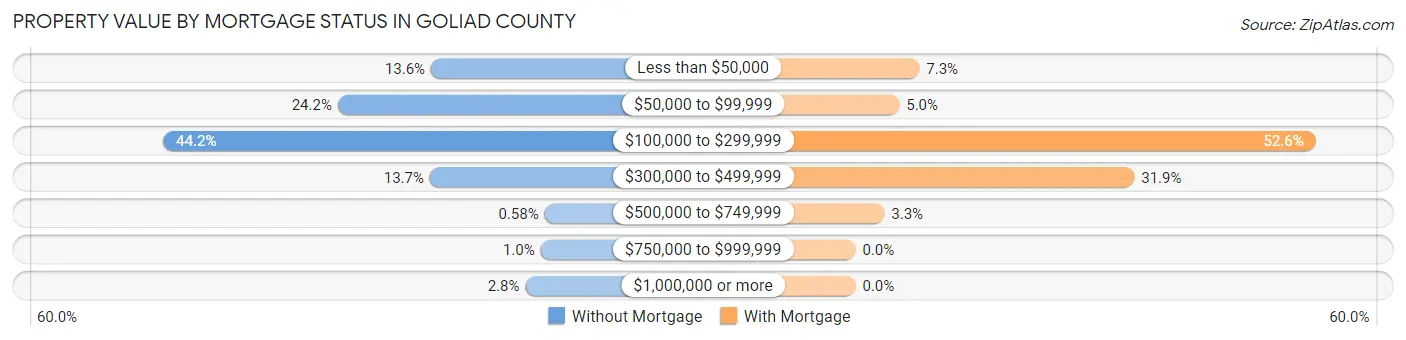
| Property Value | Without Mortgage | With Mortgage |
| Less than $50,000 | 210 (13.6%) | 51 (7.3%) |
| $50,000 to $99,999 | 375 (24.2%) | 35 (5.0%) |
| $100,000 to $299,999 | 684 (44.2%) | 368 (52.6%) |
| $300,000 to $499,999 | 212 (13.7%) | 223 (31.9%) |
| $500,000 to $749,999 | 9 (0.6%) | 23 (3.3%) |
| $750,000 to $999,999 | 16 (1.0%) | 0 (0.0%) |
| $1,000,000 or more | 43 (2.8%) | 0 (0.0%) |
| Total | 1,549 (100.0%) | 700 (100.0%) |
Household Income by Mortgage Status in Goliad County
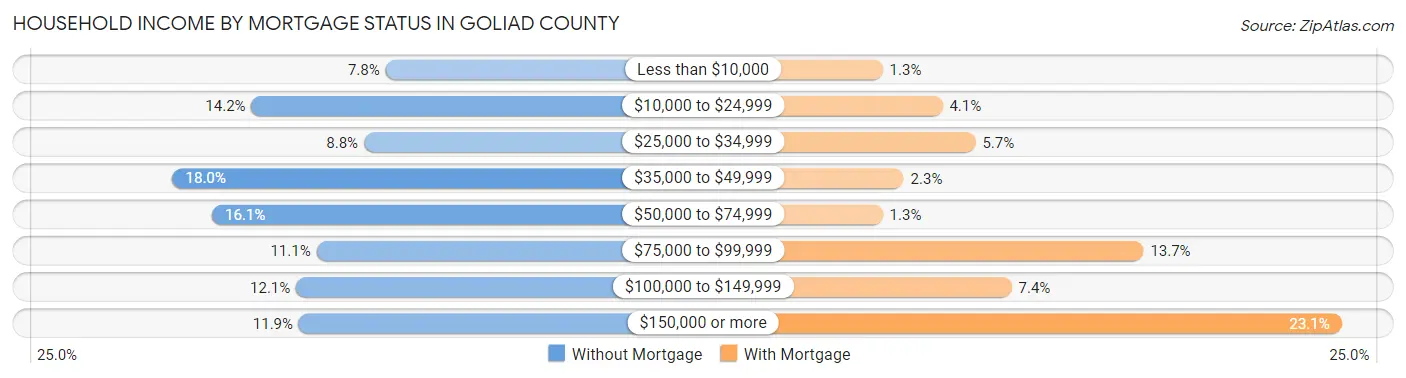
| Household Income | Without Mortgage | With Mortgage |
| Less than $10,000 | 121 (7.8%) | 9 (1.3%) |
| $10,000 to $24,999 | 220 (14.2%) | 29 (4.1%) |
| $25,000 to $34,999 | 137 (8.8%) | 40 (5.7%) |
| $35,000 to $49,999 | 278 (17.9%) | 16 (2.3%) |
| $50,000 to $74,999 | 249 (16.1%) | 9 (1.3%) |
| $75,000 to $99,999 | 172 (11.1%) | 96 (13.7%) |
| $100,000 to $149,999 | 187 (12.1%) | 52 (7.4%) |
| $150,000 or more | 185 (11.9%) | 162 (23.1%) |
| Total | 1,549 (100.0%) | 700 (100.0%) |
Property Value to Household Income Ratio in Goliad County
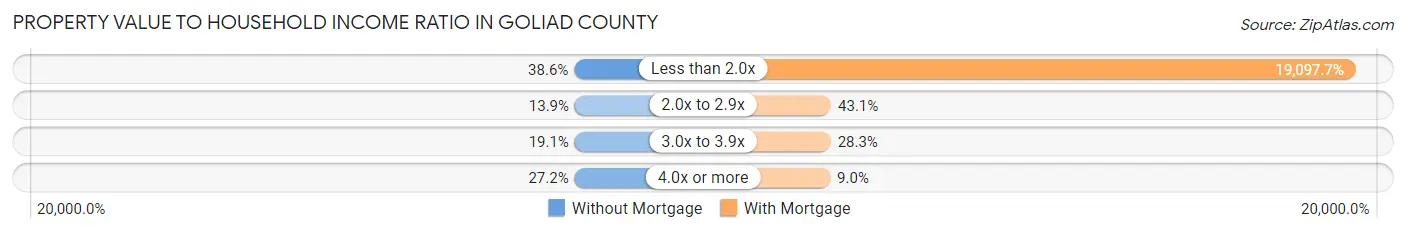
| Value-to-Income Ratio | Without Mortgage | With Mortgage |
| Less than 2.0x | 598 (38.6%) | 133,684 (19,097.7%) |
| 2.0x to 2.9x | 215 (13.9%) | 302 (43.1%) |
| 3.0x to 3.9x | 296 (19.1%) | 198 (28.3%) |
| 4.0x or more | 422 (27.2%) | 63 (9.0%) |
| Total | 1,549 (100.0%) | 700 (100.0%) |
Real Estate Taxes by Mortgage Status in Goliad County
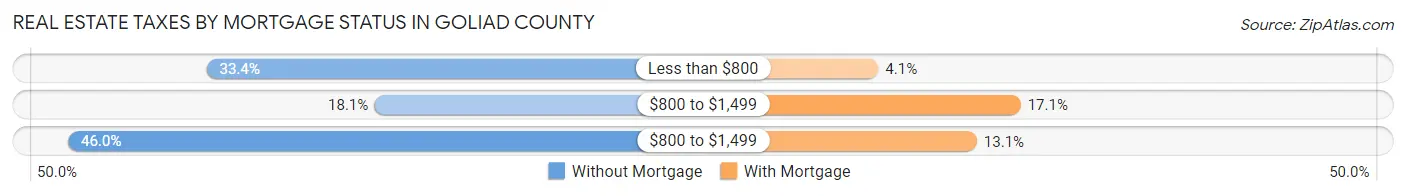
| Property Taxes | Without Mortgage | With Mortgage |
| Less than $800 | 517 (33.4%) | 29 (4.1%) |
| $800 to $1,499 | 280 (18.1%) | 120 (17.1%) |
| $800 to $1,499 | 713 (46.0%) | 92 (13.1%) |
| Total | 1,549 (100.0%) | 700 (100.0%) |
Health & Disability in Goliad County
Health Insurance Coverage by Age in Goliad County
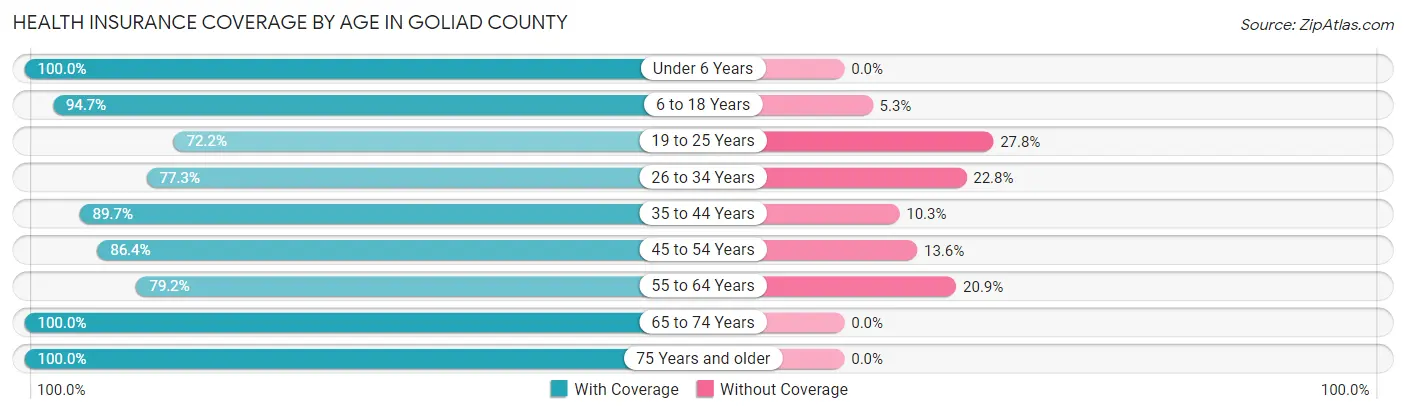
| Age Bracket | With Coverage | Without Coverage |
| Under 6 Years | 405 (100.0%) | 0 (0.0%) |
| 6 to 18 Years | 1,112 (94.7%) | 62 (5.3%) |
| 19 to 25 Years | 411 (72.2%) | 158 (27.8%) |
| 26 to 34 Years | 601 (77.2%) | 177 (22.8%) |
| 35 to 44 Years | 525 (89.7%) | 60 (10.3%) |
| 45 to 54 Years | 688 (86.4%) | 108 (13.6%) |
| 55 to 64 Years | 820 (79.1%) | 216 (20.8%) |
| 65 to 74 Years | 985 (100.0%) | 0 (0.0%) |
| 75 Years and older | 667 (100.0%) | 0 (0.0%) |
| Total | 6,214 (88.8%) | 781 (11.2%) |
Health Insurance Coverage by Citizenship Status in Goliad County
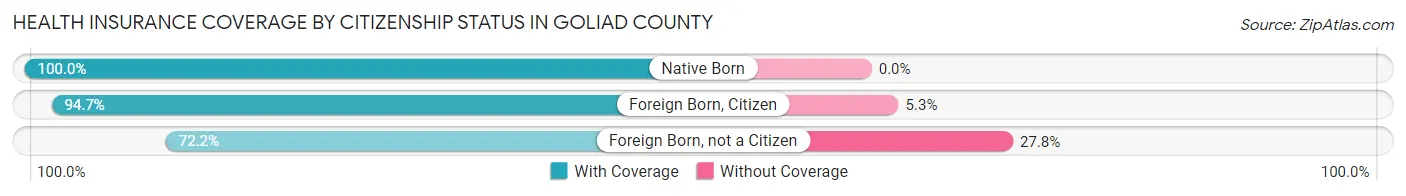
| Citizenship Status | With Coverage | Without Coverage |
| Native Born | 405 (100.0%) | 0 (0.0%) |
| Foreign Born, Citizen | 1,112 (94.7%) | 62 (5.3%) |
| Foreign Born, not a Citizen | 411 (72.2%) | 158 (27.8%) |
Health Insurance Coverage by Household Income in Goliad County
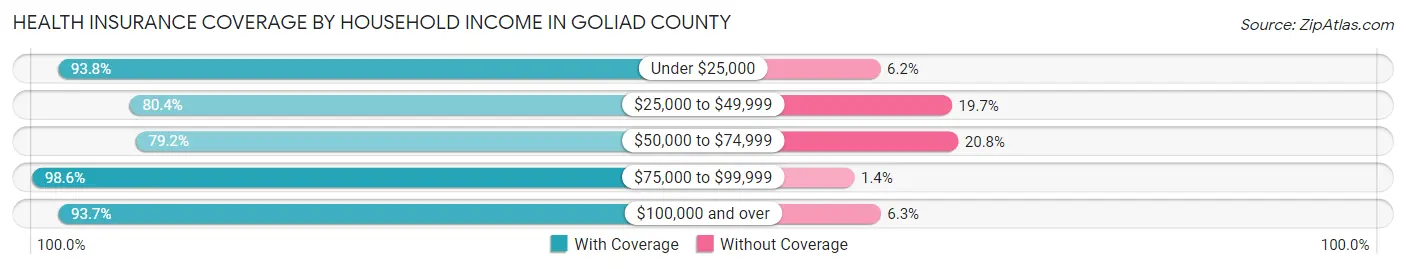
| Household Income | With Coverage | Without Coverage |
| Under $25,000 | 782 (93.8%) | 52 (6.2%) |
| $25,000 to $49,999 | 773 (80.3%) | 189 (19.7%) |
| $50,000 to $74,999 | 1,332 (79.2%) | 350 (20.8%) |
| $75,000 to $99,999 | 724 (98.6%) | 10 (1.4%) |
| $100,000 and over | 2,596 (93.7%) | 174 (6.3%) |
Public vs Private Health Insurance Coverage by Age in Goliad County
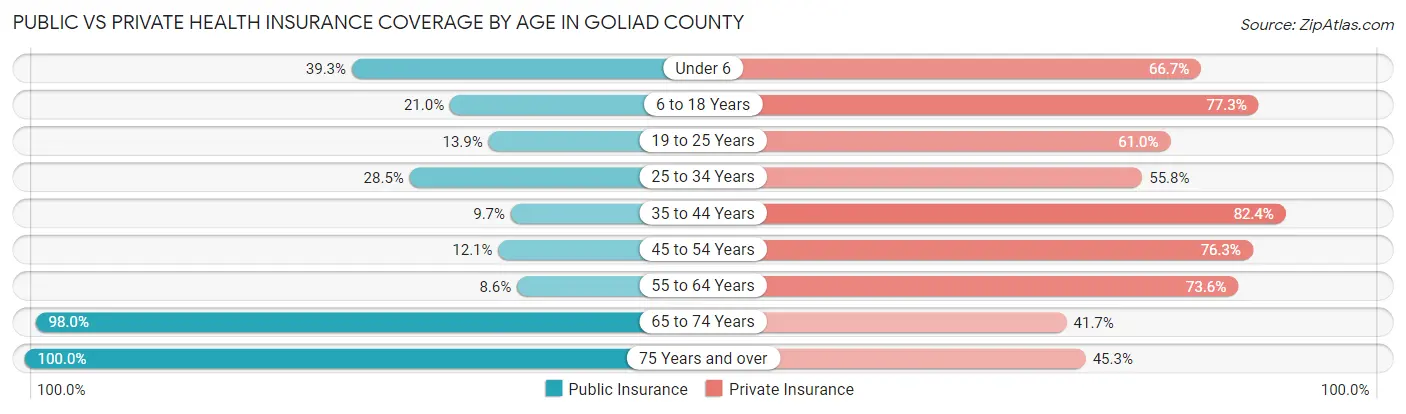
| Age Bracket | Public Insurance | Private Insurance |
| Under 6 | 159 (39.3%) | 270 (66.7%) |
| 6 to 18 Years | 247 (21.0%) | 908 (77.3%) |
| 19 to 25 Years | 79 (13.9%) | 347 (61.0%) |
| 25 to 34 Years | 222 (28.5%) | 434 (55.8%) |
| 35 to 44 Years | 57 (9.7%) | 482 (82.4%) |
| 45 to 54 Years | 96 (12.1%) | 607 (76.3%) |
| 55 to 64 Years | 89 (8.6%) | 762 (73.6%) |
| 65 to 74 Years | 965 (98.0%) | 411 (41.7%) |
| 75 Years and over | 667 (100.0%) | 302 (45.3%) |
| Total | 2,581 (36.9%) | 4,523 (64.7%) |
Disability Status by Sex by Age in Goliad County
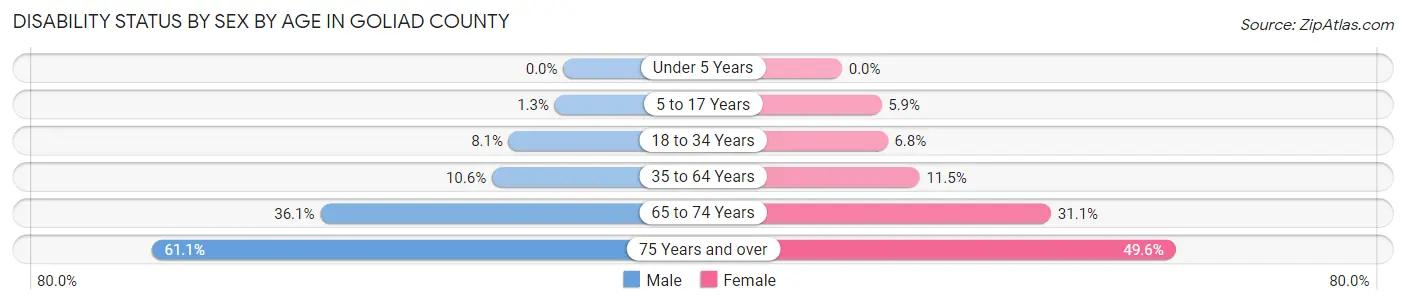
| Age Bracket | Male | Female |
| Under 5 Years | 0 (0.0%) | 0 (0.0%) |
| 5 to 17 Years | 8 (1.3%) | 35 (5.9%) |
| 18 to 34 Years | 60 (8.1%) | 48 (6.8%) |
| 35 to 64 Years | 123 (10.6%) | 145 (11.5%) |
| 65 to 74 Years | 166 (36.1%) | 163 (31.0%) |
| 75 Years and over | 203 (61.1%) | 166 (49.5%) |
Disability Class by Sex by Age in Goliad County
Disability Class: Hearing Difficulty
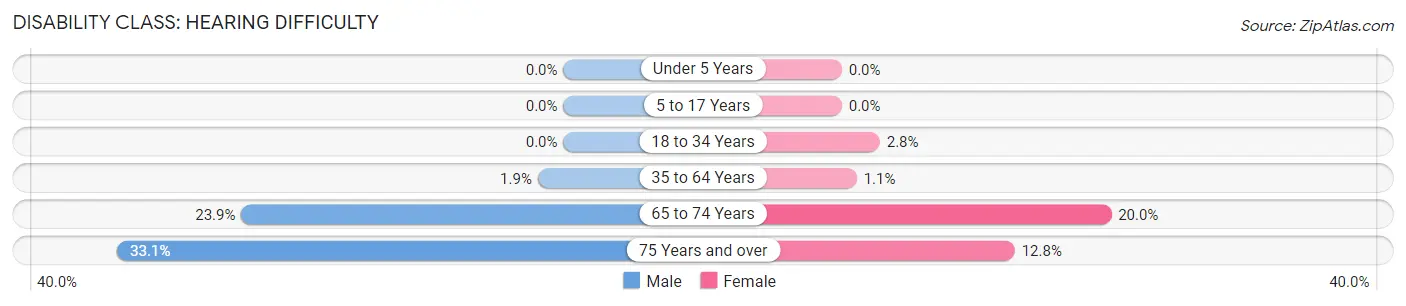
| Age Bracket | Male | Female |
| Under 5 Years | 0 (0.0%) | 0 (0.0%) |
| 5 to 17 Years | 0 (0.0%) | 0 (0.0%) |
| 18 to 34 Years | 0 (0.0%) | 20 (2.8%) |
| 35 to 64 Years | 22 (1.9%) | 14 (1.1%) |
| 65 to 74 Years | 110 (23.9%) | 105 (20.0%) |
| 75 Years and over | 110 (33.1%) | 43 (12.8%) |
Disability Class: Vision Difficulty
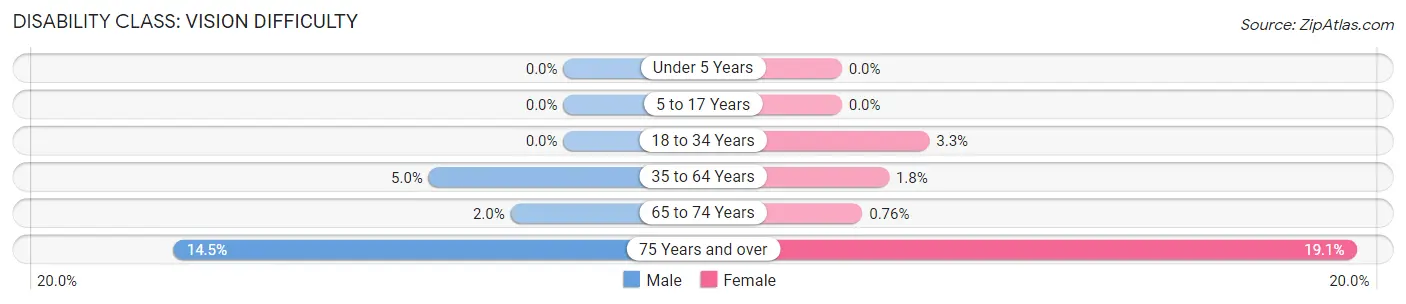
| Age Bracket | Male | Female |
| Under 5 Years | 0 (0.0%) | 0 (0.0%) |
| 5 to 17 Years | 0 (0.0%) | 0 (0.0%) |
| 18 to 34 Years | 0 (0.0%) | 23 (3.3%) |
| 35 to 64 Years | 58 (5.0%) | 22 (1.8%) |
| 65 to 74 Years | 9 (2.0%) | 4 (0.8%) |
| 75 Years and over | 48 (14.5%) | 64 (19.1%) |
Disability Class: Cognitive Difficulty
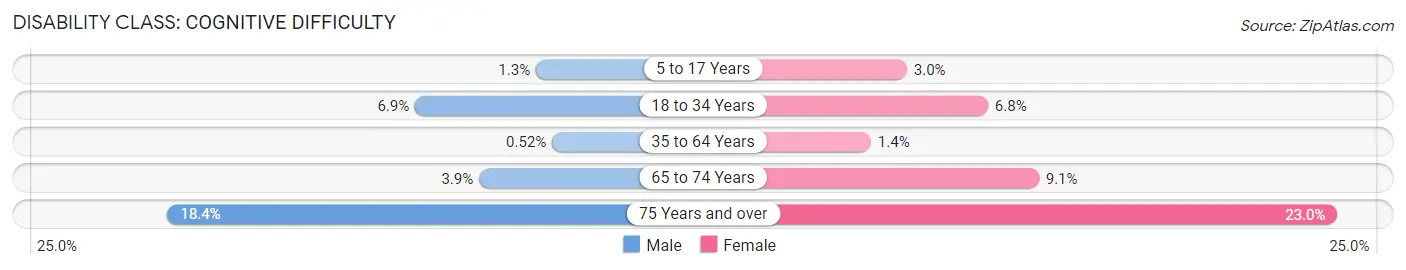
| Age Bracket | Male | Female |
| 5 to 17 Years | 8 (1.3%) | 18 (3.0%) |
| 18 to 34 Years | 51 (6.9%) | 48 (6.8%) |
| 35 to 64 Years | 6 (0.5%) | 17 (1.3%) |
| 65 to 74 Years | 18 (3.9%) | 48 (9.1%) |
| 75 Years and over | 61 (18.4%) | 77 (23.0%) |
Disability Class: Ambulatory Difficulty
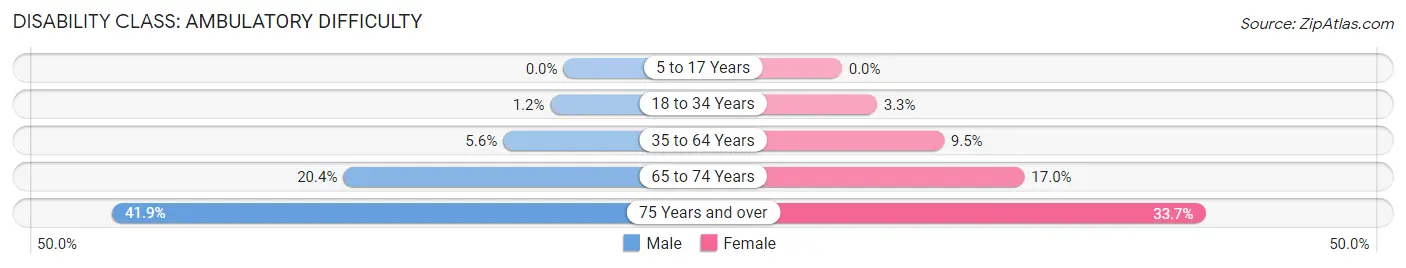
| Age Bracket | Male | Female |
| 5 to 17 Years | 0 (0.0%) | 0 (0.0%) |
| 18 to 34 Years | 9 (1.2%) | 23 (3.3%) |
| 35 to 64 Years | 65 (5.6%) | 119 (9.5%) |
| 65 to 74 Years | 94 (20.4%) | 89 (17.0%) |
| 75 Years and over | 139 (41.9%) | 113 (33.7%) |
Disability Class: Self-Care Difficulty
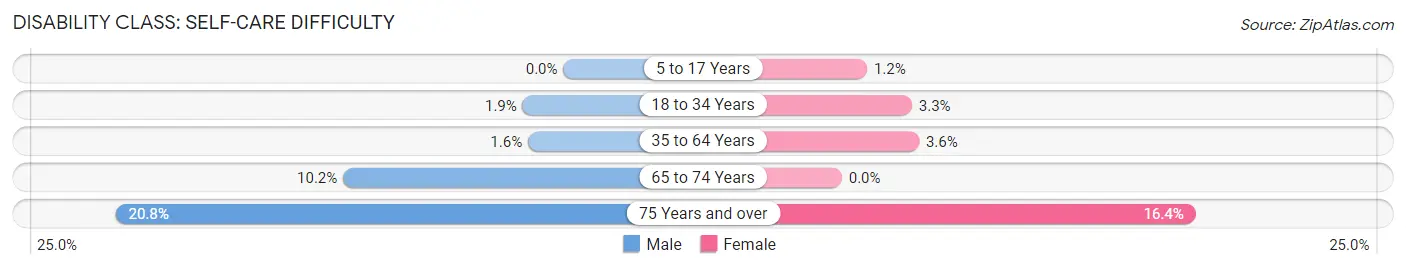
| Age Bracket | Male | Female |
| 5 to 17 Years | 0 (0.0%) | 7 (1.2%) |
| 18 to 34 Years | 14 (1.9%) | 23 (3.3%) |
| 35 to 64 Years | 19 (1.6%) | 45 (3.6%) |
| 65 to 74 Years | 47 (10.2%) | 0 (0.0%) |
| 75 Years and over | 69 (20.8%) | 55 (16.4%) |
Technology Access in Goliad County
Computing Device Access in Goliad County
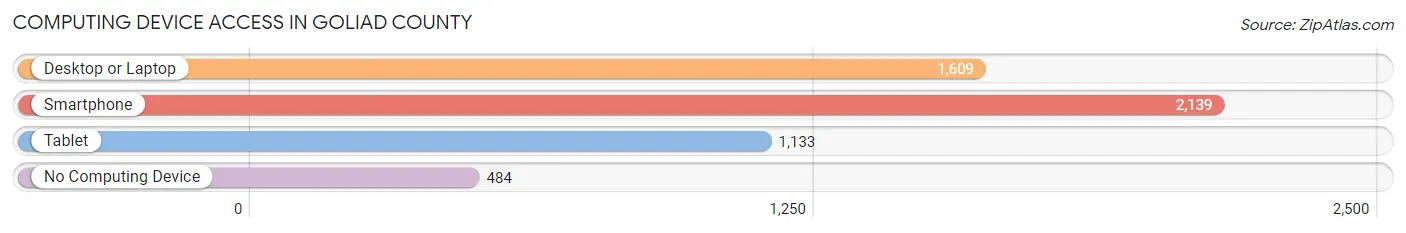
| Device Type | # Households | % Households |
| Desktop or Laptop | 1,609 | 59.2% |
| Smartphone | 2,139 | 78.6% |
| Tablet | 1,133 | 41.6% |
| No Computing Device | 484 | 17.8% |
| Total | 2,720 | 100.0% |
Internet Access in Goliad County
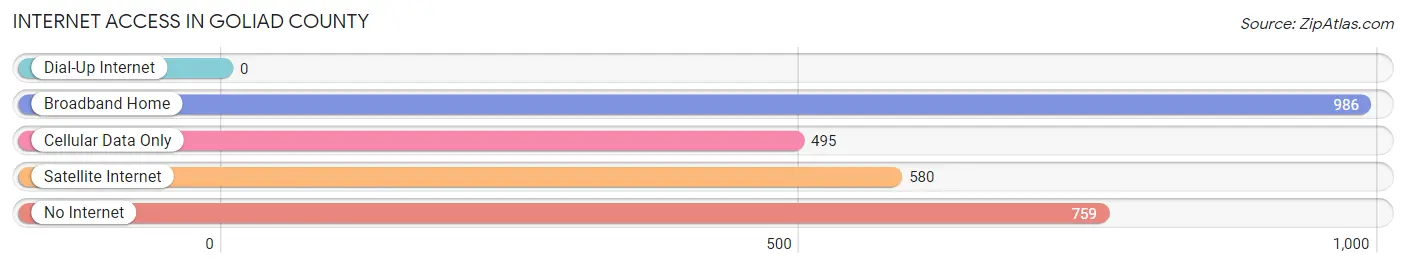
| Internet Type | # Households | % Households |
| Dial-Up Internet | 0 | 0.0% |
| Broadband Home | 986 | 36.2% |
| Cellular Data Only | 495 | 18.2% |
| Satellite Internet | 580 | 21.3% |
| No Internet | 759 | 27.9% |
| Total | 2,720 | 100.0% |
Goliad County Summary
Goliad County is located in the south-central region of Texas, and is part of the Victoria Metropolitan Statistical Area. The county is bordered by Victoria County to the north, Refugio County to the east, Bee County to the south, and Karnes and DeWitt counties to the west. The county seat is Goliad, and the county has a total area of 890 square miles.
History
Goliad County was established in 1836, and is named after Mission Nuestra Señora del Espíritu Santo de Zúñiga, which was founded in 1722 by the Spanish explorer, Alonso de León. The mission was named after the Spanish explorer, Father Goliad, who was killed in the Battle of Goliad in 1836. The county was originally part of the Mexican state of Coahuila y Tejas, and was part of the Republic of Texas after the Texas Revolution.
Geography
Goliad County is located in the south-central region of Texas, and is part of the Victoria Metropolitan Statistical Area. The county is bordered by Victoria County to the north, Refugio County to the east, Bee County to the south, and Karnes and DeWitt counties to the west. The county seat is Goliad, and the county has a total area of 890 square miles.
The terrain of Goliad County is mostly flat, with some rolling hills in the western part of the county. The county is drained by the San Antonio River, which flows through the county from north to south. The county is also home to several small lakes, including Lake Texana, Lake Goliad, and Lake Victoria.
Economy
The economy of Goliad County is largely based on agriculture, with the main crops being cotton, corn, sorghum, and wheat. The county is also home to several oil and gas fields, and is a major producer of oil and natural gas.
The county is also home to several manufacturing companies, including Goliad Manufacturing, which produces agricultural equipment, and Goliad Plastics, which produces plastic products.
Demographics
As of the 2010 census, Goliad County had a population of 7,210. The racial makeup of the county was 75.3% White, 0.9% African American, 0.7% Native American, 0.3% Asian, 0.1% Pacific Islander, 20.2% from other races, and 2.5% from two or more races. Hispanic or Latino of any race were 44.2% of the population.
The median income for a household in the county was $37,945, and the median income for a family was $45,938. The per capita income for the county was $17,945. About 17.2% of families and 22.2% of the population were below the poverty line, including 28.3% of those under age 18 and 16.2% of those age 65 or over.
Common Questions
What is Per Capita Income in Goliad County?
Per Capita income in Goliad County is $36,114.
What is the Median Family Income in Goliad County?
Median Family Income in Goliad County is $86,639.
What is the Median Household income in Goliad County?
Median Household Income in Goliad County is $58,125.
What is Income or Wage Gap in Goliad County?
Income or Wage Gap in Goliad County is 29.6%.
Women in Goliad County earn 70.4 cents for every dollar earned by a man.
What is Inequality or Gini Index in Goliad County?
Inequality or Gini Index in Goliad County is 0.52.
What is the Total Population of Goliad County?
Total Population of Goliad County is 7,092.
What is the Total Male Population of Goliad County?
Total Male Population of Goliad County is 3,522.
What is the Total Female Population of Goliad County?
Total Female Population of Goliad County is 3,570.
What is the Ratio of Males per 100 Females in Goliad County?
There are 98.66 Males per 100 Females in Goliad County.
What is the Ratio of Females per 100 Males in Goliad County?
There are 101.36 Females per 100 Males in Goliad County.
What is the Median Population Age in Goliad County?
Median Population Age in Goliad County is 44.7 Years.
What is the Average Family Size in Goliad County
Average Family Size in Goliad County is 3.4 People.
What is the Average Household Size in Goliad County
Average Household Size in Goliad County is 2.6 People.
How Large is the Labor Force in Goliad County?
There are 3,027 People in the Labor Forcein in Goliad County.
What is the Percentage of People in the Labor Force in Goliad County?
52.9% of People are in the Labor Force in Goliad County.
What is the Unemployment Rate in Goliad County?
Unemployment Rate in Goliad County is 4.8%.