Gillespie County, TX Map & Demographics
Gillespie County Map
Gillespie County Overview
$42,067
PER CAPITA INCOME
$93,241
AVG FAMILY INCOME
$70,162
AVG HOUSEHOLD INCOME
31.3%
WAGE / INCOME GAP [ % ]
68.7¢/ $1
WAGE / INCOME GAP [ $ ]
$8,060
FAMILY INCOME DEFICIT
0.47
INEQUALITY / GINI INDEX
26,953
TOTAL POPULATION
13,224
MALE POPULATION
13,729
FEMALE POPULATION
96.32
MALES / 100 FEMALES
103.82
FEMALES / 100 MALES
49.7
MEDIAN AGE
3.0
AVG FAMILY SIZE
2.4
AVG HOUSEHOLD SIZE
12,840
LABOR FORCE [ PEOPLE ]
57.5%
PERCENT IN LABOR FORCE
3.5%
UNEMPLOYMENT RATE
Gillespie County Area Codes
Income in Gillespie County
Income Overview in Gillespie County
Per Capita Income in Gillespie County is $42,067, while median incomes of families and households are $93,241 and $70,162 respectively.
| Characteristic | Number | Measure |
| Per Capita Income | 26,953 | $42,067 |
| Median Family Income | 7,329 | $93,241 |
| Mean Family Income | 7,329 | $120,636 |
| Median Household Income | 11,035 | $70,162 |
| Mean Household Income | 11,035 | $99,768 |
| Income Deficit | 7,329 | $8,060 |
| Wage / Income Gap (%) | 26,953 | 31.27% |
| Wage / Income Gap ($) | 26,953 | 68.73¢ per $1 |
| Gini / Inequality Index | 26,953 | 0.47 |
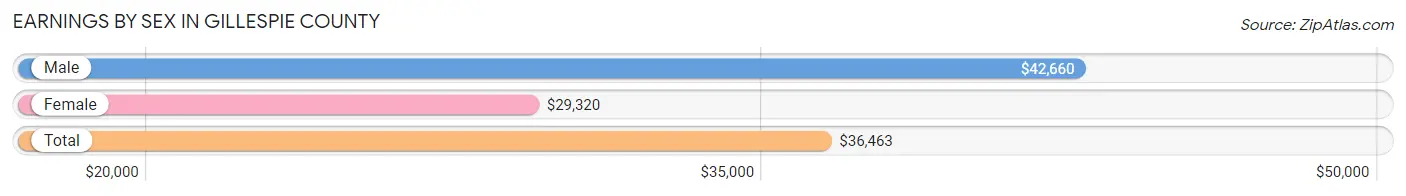
Earnings by Sex in Gillespie County
Average Earnings in Gillespie County are $36,463, $42,660 for men and $29,320 for women, a difference of 31.3%.
| Sex | Number | Average Earnings |
| Male | 7,238 (53.3%) | $42,660 |
| Female | 6,329 (46.7%) | $29,320 |
| Total | 13,567 (100.0%) | $36,463 |
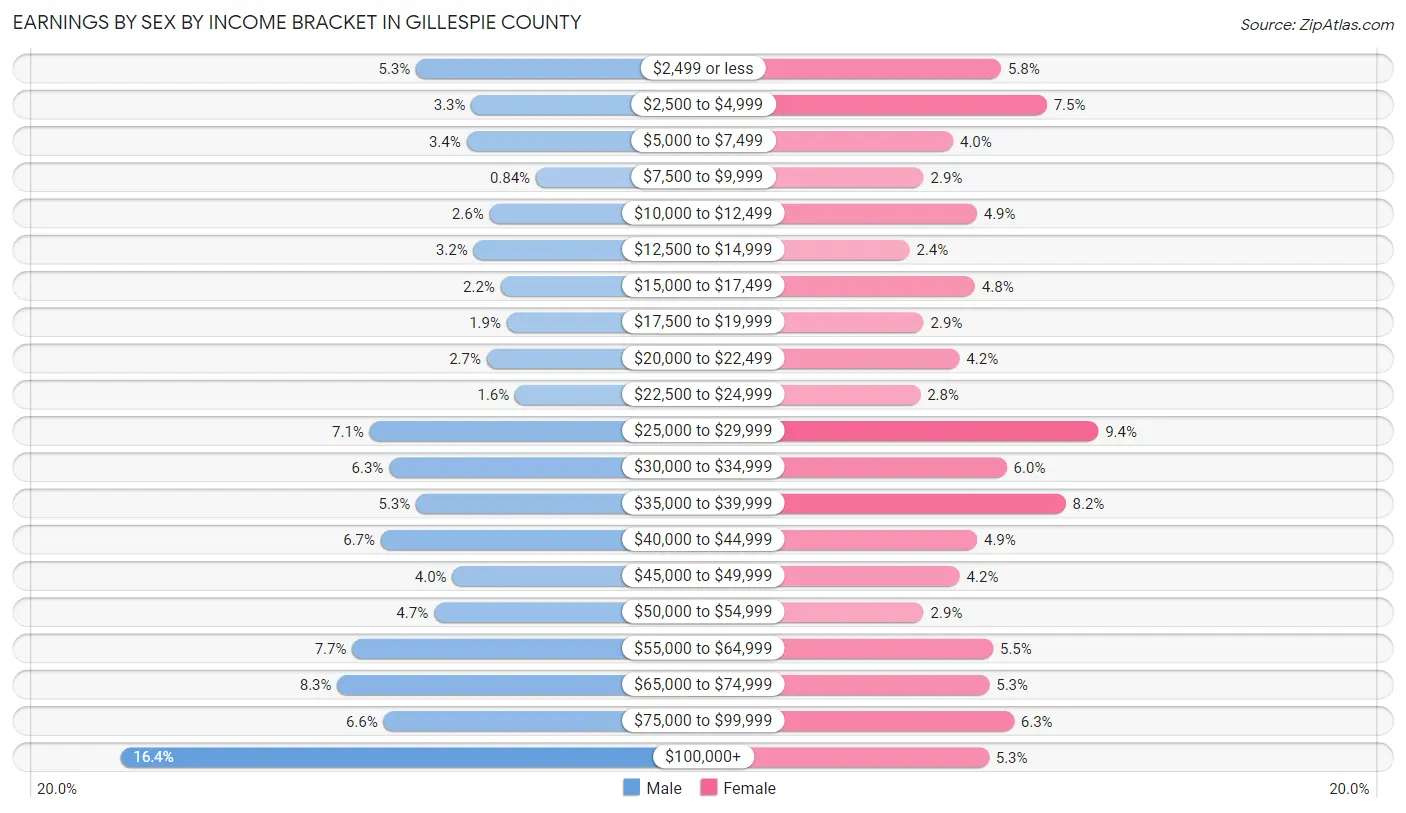
Earnings by Sex by Income Bracket in Gillespie County
The most common earnings brackets in Gillespie County are $100,000+ for men (1,188 | 16.4%) and $25,000 to $29,999 for women (596 | 9.4%).
| Income | Male | Female |
| $2,499 or less | 386 (5.3%) | 366 (5.8%) |
| $2,500 to $4,999 | 236 (3.3%) | 474 (7.5%) |
| $5,000 to $7,499 | 249 (3.4%) | 252 (4.0%) |
| $7,500 to $9,999 | 61 (0.8%) | 182 (2.9%) |
| $10,000 to $12,499 | 187 (2.6%) | 308 (4.9%) |
| $12,500 to $14,999 | 230 (3.2%) | 149 (2.4%) |
| $15,000 to $17,499 | 156 (2.2%) | 304 (4.8%) |
| $17,500 to $19,999 | 140 (1.9%) | 182 (2.9%) |
| $20,000 to $22,499 | 194 (2.7%) | 267 (4.2%) |
| $22,500 to $24,999 | 117 (1.6%) | 174 (2.8%) |
| $25,000 to $29,999 | 512 (7.1%) | 596 (9.4%) |
| $30,000 to $34,999 | 459 (6.3%) | 379 (6.0%) |
| $35,000 to $39,999 | 386 (5.3%) | 519 (8.2%) |
| $40,000 to $44,999 | 481 (6.7%) | 309 (4.9%) |
| $45,000 to $49,999 | 287 (4.0%) | 268 (4.2%) |
| $50,000 to $54,999 | 337 (4.7%) | 182 (2.9%) |
| $55,000 to $64,999 | 559 (7.7%) | 347 (5.5%) |
| $65,000 to $74,999 | 599 (8.3%) | 338 (5.3%) |
| $75,000 to $99,999 | 474 (6.6%) | 396 (6.3%) |
| $100,000+ | 1,188 (16.4%) | 337 (5.3%) |
| Total | 7,238 (100.0%) | 6,329 (100.0%) |
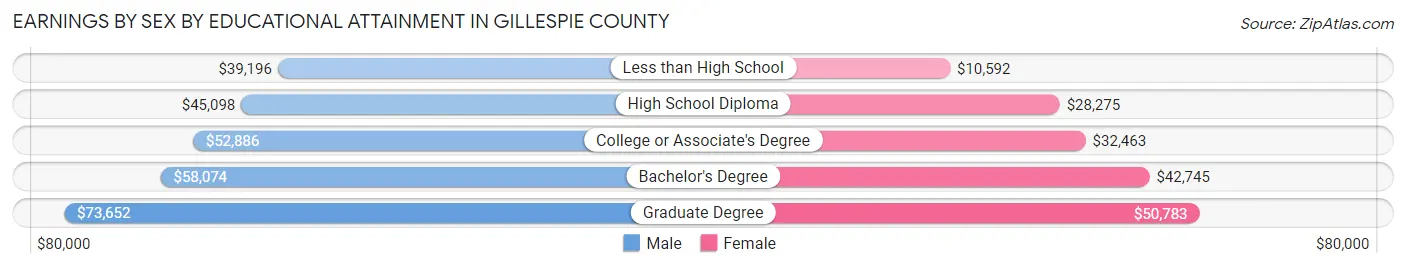
Earnings by Sex by Educational Attainment in Gillespie County
Average earnings in Gillespie County are $51,192 for men and $34,235 for women, a difference of 33.1%. Men with an educational attainment of graduate degree enjoy the highest average annual earnings of $73,652, while those with less than high school education earn the least with $39,196. Women with an educational attainment of graduate degree earn the most with the average annual earnings of $50,783, while those with less than high school education have the smallest earnings of $10,592.
| Educational Attainment | Male Income | Female Income |
| Less than High School | $39,196 | $10,592 |
| High School Diploma | $45,098 | $28,275 |
| College or Associate's Degree | $52,886 | $32,463 |
| Bachelor's Degree | $58,074 | $42,745 |
| Graduate Degree | $73,652 | $50,783 |
| Total | $51,192 | $34,235 |
Family Income in Gillespie County
Family Income Brackets in Gillespie County
According to the Gillespie County family income data, there are 1,788 families falling into the $100,000 to $149,999 income range, which is the most common income bracket and makes up 24.4% of all families. Conversely, the less than $10,000 income bracket is the least frequent group with only 117 families (1.6%) belonging to this category.
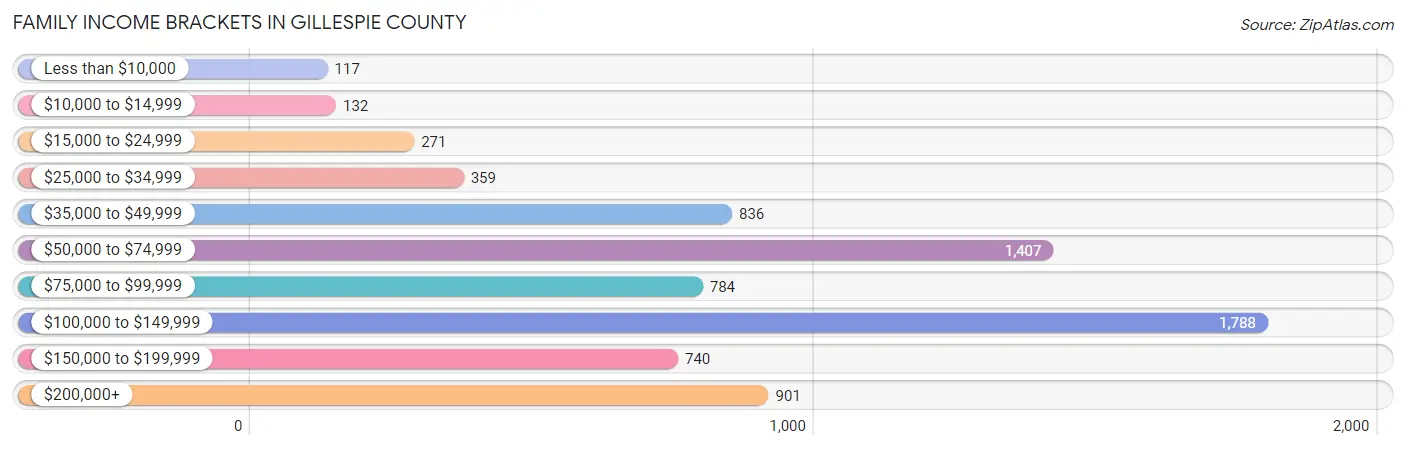
| Income Bracket | # Families | % Families |
| Less than $10,000 | 117 | 1.6% |
| $10,000 to $14,999 | 132 | 1.8% |
| $15,000 to $24,999 | 271 | 3.7% |
| $25,000 to $34,999 | 359 | 4.9% |
| $35,000 to $49,999 | 836 | 11.4% |
| $50,000 to $74,999 | 1,407 | 19.2% |
| $75,000 to $99,999 | 784 | 10.7% |
| $100,000 to $149,999 | 1,788 | 24.4% |
| $150,000 to $199,999 | 740 | 10.1% |
| $200,000+ | 901 | 12.3% |
Family Income by Famaliy Size in Gillespie County
7+ person families (198 | 2.7%) account for the highest median family income in Gillespie County with $153,854 per family, while 2-person families (4,249 | 58.0%) have the highest median income of $44,830 per family member.
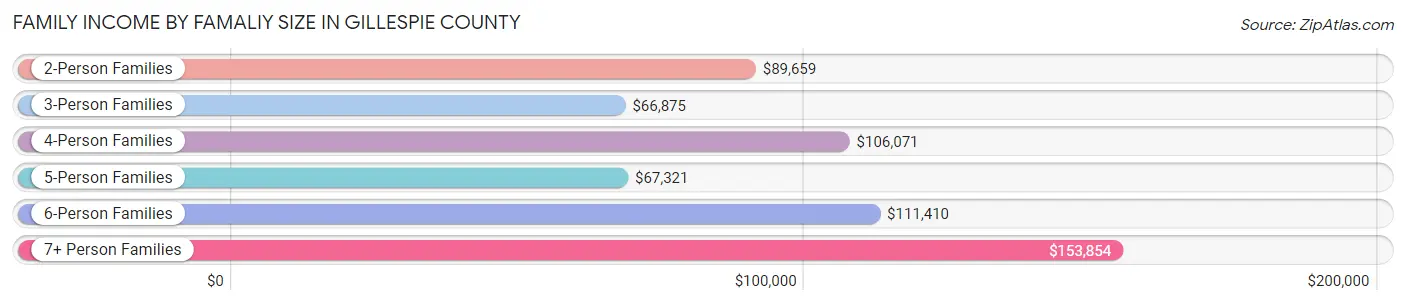
| Income Bracket | # Families | Median Income |
| 2-Person Families | 4,249 (58.0%) | $89,659 |
| 3-Person Families | 1,044 (14.2%) | $66,875 |
| 4-Person Families | 990 (13.5%) | $106,071 |
| 5-Person Families | 539 (7.3%) | $67,321 |
| 6-Person Families | 309 (4.2%) | $111,410 |
| 7+ Person Families | 198 (2.7%) | $153,854 |
| Total | 7,329 (100.0%) | $93,241 |
Family Income by Number of Earners in Gillespie County
The median family income in Gillespie County is $93,241, with families comprising 3+ earners (928) having the highest median family income of $129,167, while families with no earners (1,613) have the lowest median family income of $69,652, accounting for 12.7% and 22.0% of families, respectively.
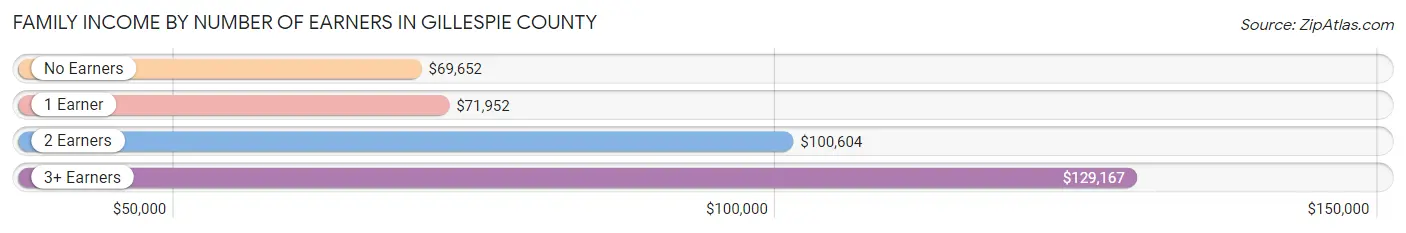
| Number of Earners | # Families | Median Income |
| No Earners | 1,613 (22.0%) | $69,652 |
| 1 Earner | 1,863 (25.4%) | $71,952 |
| 2 Earners | 2,925 (39.9%) | $100,604 |
| 3+ Earners | 928 (12.7%) | $129,167 |
| Total | 7,329 (100.0%) | $93,241 |
Household Income in Gillespie County
Household Income Brackets in Gillespie County
With 2,152 households falling in the category, the $50,000 to $74,999 income range is the most frequent in Gillespie County, accounting for 19.5% of all households. In contrast, only 331 households (3.0%) fall into the $10,000 to $14,999 income bracket, making it the least populous group.
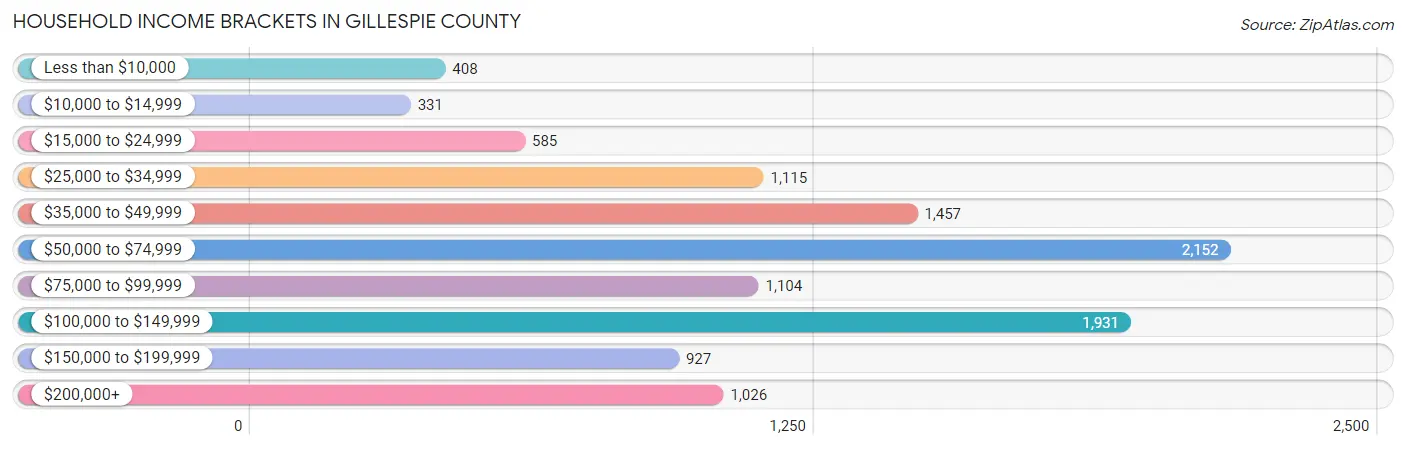
| Income Bracket | # Households | % Households |
| Less than $10,000 | 408 | 3.7% |
| $10,000 to $14,999 | 331 | 3.0% |
| $15,000 to $24,999 | 585 | 5.3% |
| $25,000 to $34,999 | 1,115 | 10.1% |
| $35,000 to $49,999 | 1,457 | 13.2% |
| $50,000 to $74,999 | 2,152 | 19.5% |
| $75,000 to $99,999 | 1,104 | 10.0% |
| $100,000 to $149,999 | 1,931 | 17.5% |
| $150,000 to $199,999 | 927 | 8.4% |
| $200,000+ | 1,026 | 9.3% |
Household Income by Householder Age in Gillespie County
The median household income in Gillespie County is $70,162, with the highest median household income of $92,929 found in the 45 to 64 years age bracket for the primary householder. A total of 3,748 households (34.0%) fall into this category. Meanwhile, the 15 to 24 years age bracket for the primary householder has the lowest median household income of $0, with 235 households (2.1%) in this group.
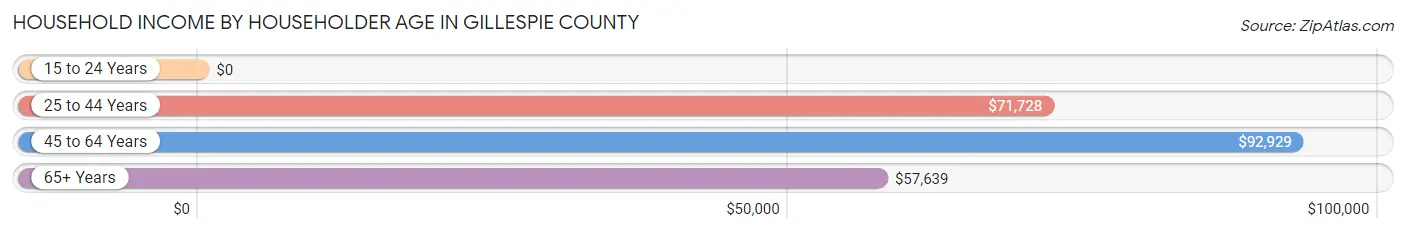
| Income Bracket | # Households | Median Income |
| 15 to 24 Years | 235 (2.1%) | $0 |
| 25 to 44 Years | 2,257 (20.4%) | $71,728 |
| 45 to 64 Years | 3,748 (34.0%) | $92,929 |
| 65+ Years | 4,795 (43.4%) | $57,639 |
| Total | 11,035 (100.0%) | $70,162 |
Poverty in Gillespie County
Income Below Poverty by Sex and Age in Gillespie County
With 8.2% poverty level for males and 9.9% for females among the residents of Gillespie County, 12 to 14 year old males and under 5 year old females are the most vulnerable to poverty, with 61 males (18.6%) and 149 females (23.9%) in their respective age groups living below the poverty level.
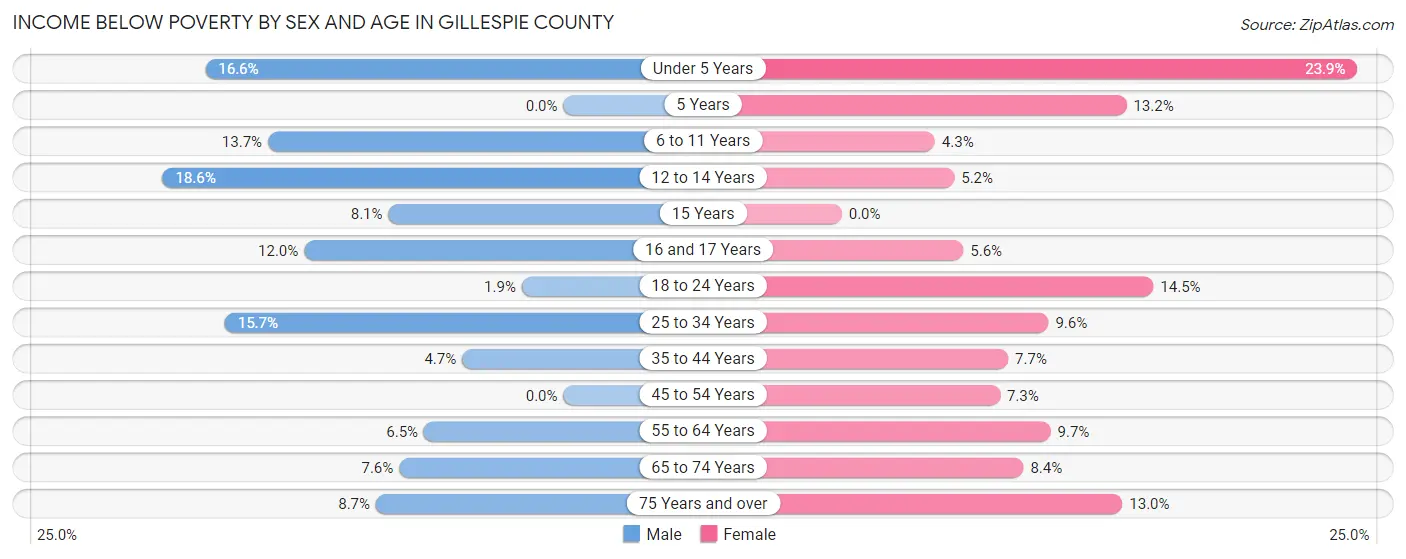
| Age Bracket | Male | Female |
| Under 5 Years | 107 (16.6%) | 149 (23.9%) |
| 5 Years | 0 (0.0%) | 35 (13.2%) |
| 6 to 11 Years | 159 (13.7%) | 36 (4.3%) |
| 12 to 14 Years | 61 (18.6%) | 19 (5.2%) |
| 15 Years | 19 (8.1%) | 0 (0.0%) |
| 16 and 17 Years | 42 (12.0%) | 22 (5.6%) |
| 18 to 24 Years | 19 (1.9%) | 128 (14.5%) |
| 25 to 34 Years | 180 (15.7%) | 109 (9.6%) |
| 35 to 44 Years | 67 (4.7%) | 117 (7.7%) |
| 45 to 54 Years | 0 (0.0%) | 93 (7.3%) |
| 55 to 64 Years | 130 (6.5%) | 203 (9.7%) |
| 65 to 74 Years | 147 (7.6%) | 186 (8.4%) |
| 75 Years and over | 135 (8.7%) | 250 (13.0%) |
| Total | 1,066 (8.2%) | 1,347 (9.9%) |
Income Above Poverty by Sex and Age in Gillespie County
According to the poverty statistics in Gillespie County, males aged 5 years and females aged 15 years are the age groups that are most secure financially, with 100.0% of males and 100.0% of females in these age groups living above the poverty line.
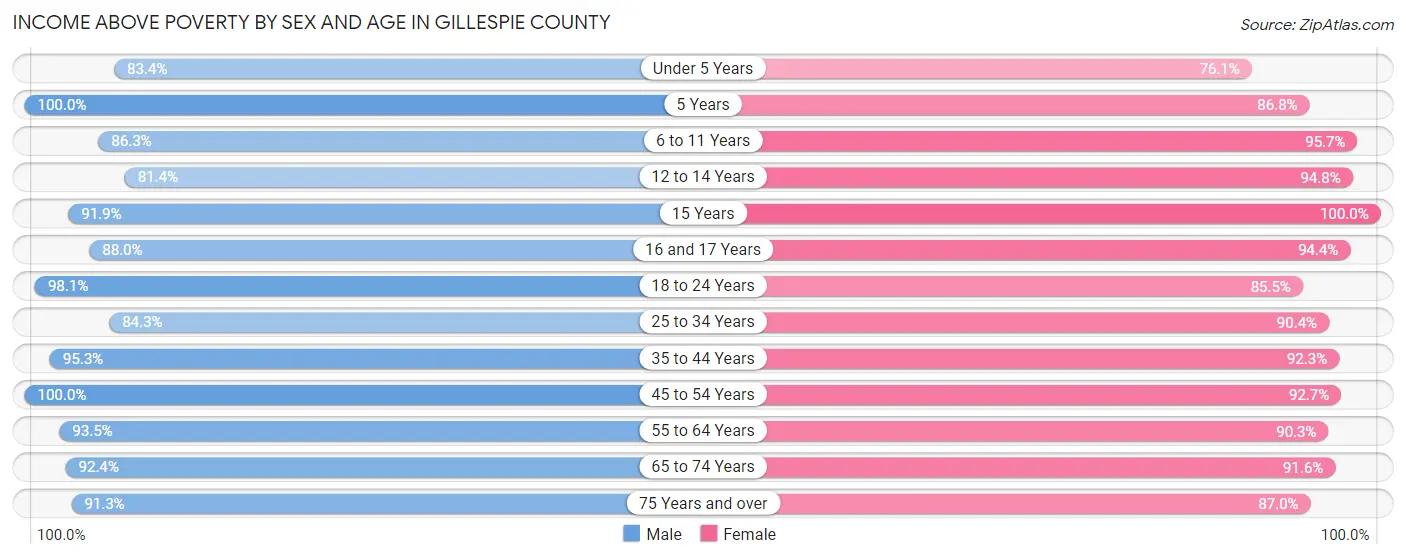
| Age Bracket | Male | Female |
| Under 5 Years | 537 (83.4%) | 474 (76.1%) |
| 5 Years | 72 (100.0%) | 230 (86.8%) |
| 6 to 11 Years | 1,001 (86.3%) | 798 (95.7%) |
| 12 to 14 Years | 267 (81.4%) | 345 (94.8%) |
| 15 Years | 215 (91.9%) | 74 (100.0%) |
| 16 and 17 Years | 307 (88.0%) | 368 (94.4%) |
| 18 to 24 Years | 967 (98.1%) | 757 (85.5%) |
| 25 to 34 Years | 966 (84.3%) | 1,028 (90.4%) |
| 35 to 44 Years | 1,359 (95.3%) | 1,398 (92.3%) |
| 45 to 54 Years | 1,193 (100.0%) | 1,174 (92.7%) |
| 55 to 64 Years | 1,880 (93.5%) | 1,892 (90.3%) |
| 65 to 74 Years | 1,781 (92.4%) | 2,021 (91.6%) |
| 75 Years and over | 1,416 (91.3%) | 1,670 (87.0%) |
| Total | 11,961 (91.8%) | 12,229 (90.1%) |
Income Below Poverty Among Married-Couple Families in Gillespie County
The poverty statistics for married-couple families in Gillespie County show that 6.6% or 413 of the total 6,256 families live below the poverty line. Families with 1 or 2 children have the highest poverty rate of 9.3%, comprising of 145 families. On the other hand, families with 5 or more children have the lowest poverty rate of 0.0%, which includes 0 families.
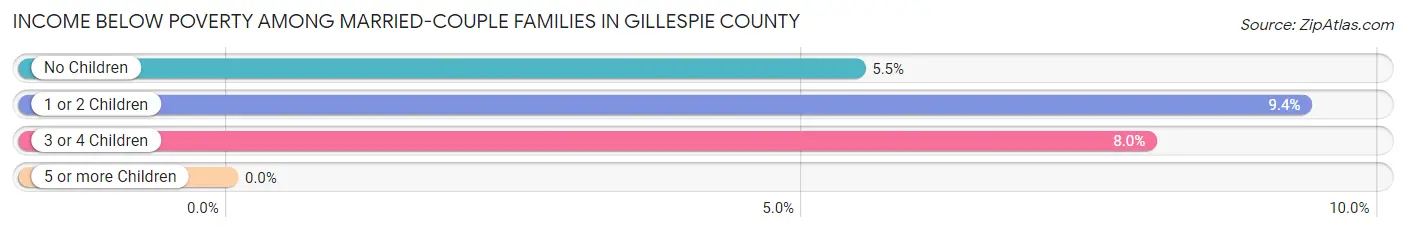
| Children | Above Poverty | Below Poverty |
| No Children | 3,985 (94.5%) | 230 (5.5%) |
| 1 or 2 Children | 1,405 (90.6%) | 145 (9.3%) |
| 3 or 4 Children | 437 (92.0%) | 38 (8.0%) |
| 5 or more Children | 16 (100.0%) | 0 (0.0%) |
| Total | 5,843 (93.4%) | 413 (6.6%) |
Income Below Poverty Among Single-Parent Households in Gillespie County
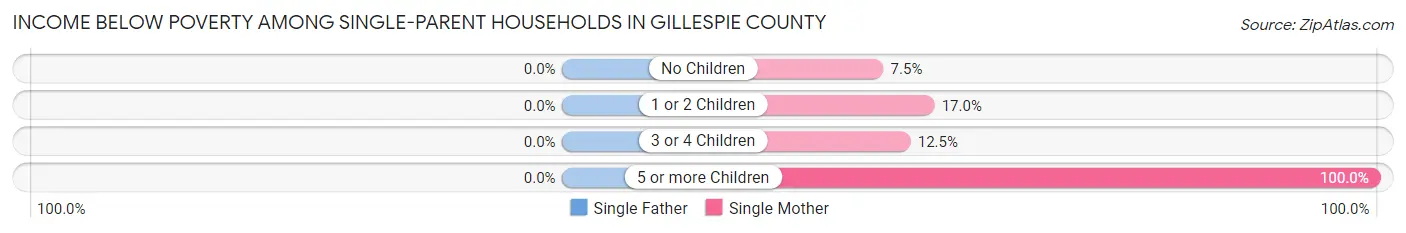
| Children | Single Father | Single Mother |
| No Children | 0 (0.0%) | 24 (7.4%) |
| 1 or 2 Children | 0 (0.0%) | 87 (17.0%) |
| 3 or 4 Children | 0 (0.0%) | 4 (12.5%) |
| 5 or more Children | 0 (0.0%) | 7 (100.0%) |
| Total | 0 (0.0%) | 122 (14.0%) |
Income Below Poverty Among Married-Couple vs Single-Parent Households in Gillespie County
The poverty data for Gillespie County shows that 413 of the married-couple family households (6.6%) and 122 of the single-parent households (11.4%) are living below the poverty level. Within the married-couple family households, those with 1 or 2 children have the highest poverty rate, with 145 households (9.3%) falling below the poverty line. Among the single-parent households, those with 5 or more children have the highest poverty rate, with 7 household (100.0%) living below poverty.
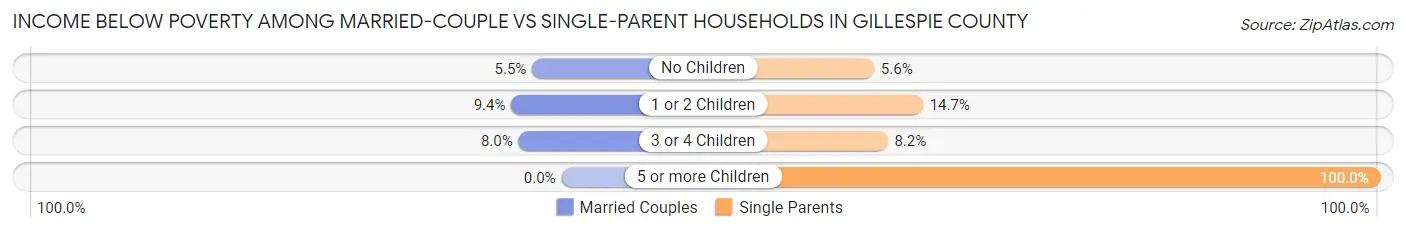
| Children | Married-Couple Families | Single-Parent Households |
| No Children | 230 (5.5%) | 24 (5.6%) |
| 1 or 2 Children | 145 (9.3%) | 87 (14.7%) |
| 3 or 4 Children | 38 (8.0%) | 4 (8.2%) |
| 5 or more Children | 0 (0.0%) | 7 (100.0%) |
| Total | 413 (6.6%) | 122 (11.4%) |
Race in Gillespie County
The most populous races in Gillespie County are White / Caucasian (23,047 | 85.5%), Hispanic or Latino (6,574 | 24.4%), and Two or more Races (1,805 | 6.7%).
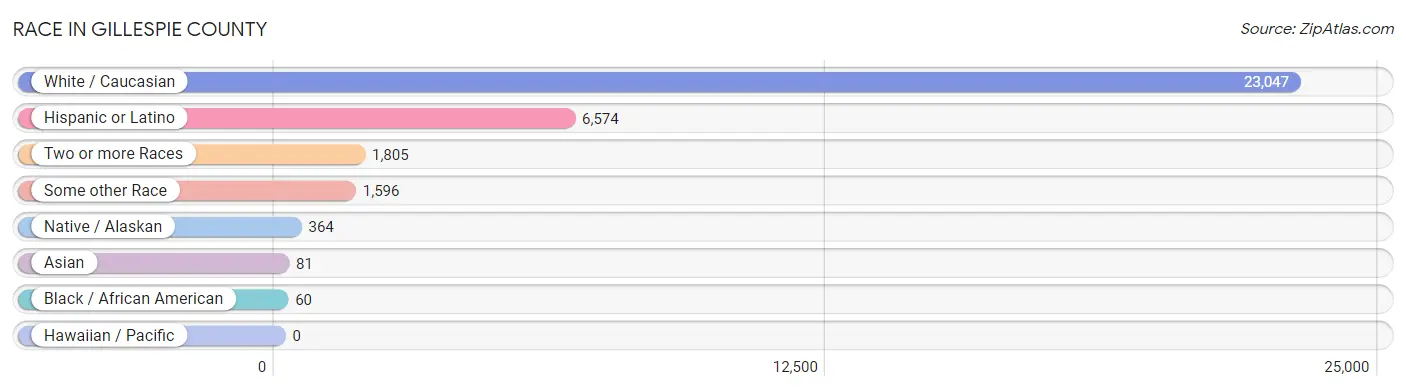
| Race | # Population | % Population |
| Asian | 81 | 0.3% |
| Black / African American | 60 | 0.2% |
| Hawaiian / Pacific | 0 | 0.0% |
| Hispanic or Latino | 6,574 | 24.4% |
| Native / Alaskan | 364 | 1.3% |
| White / Caucasian | 23,047 | 85.5% |
| Two or more Races | 1,805 | 6.7% |
| Some other Race | 1,596 | 5.9% |
| Total | 26,953 | 100.0% |
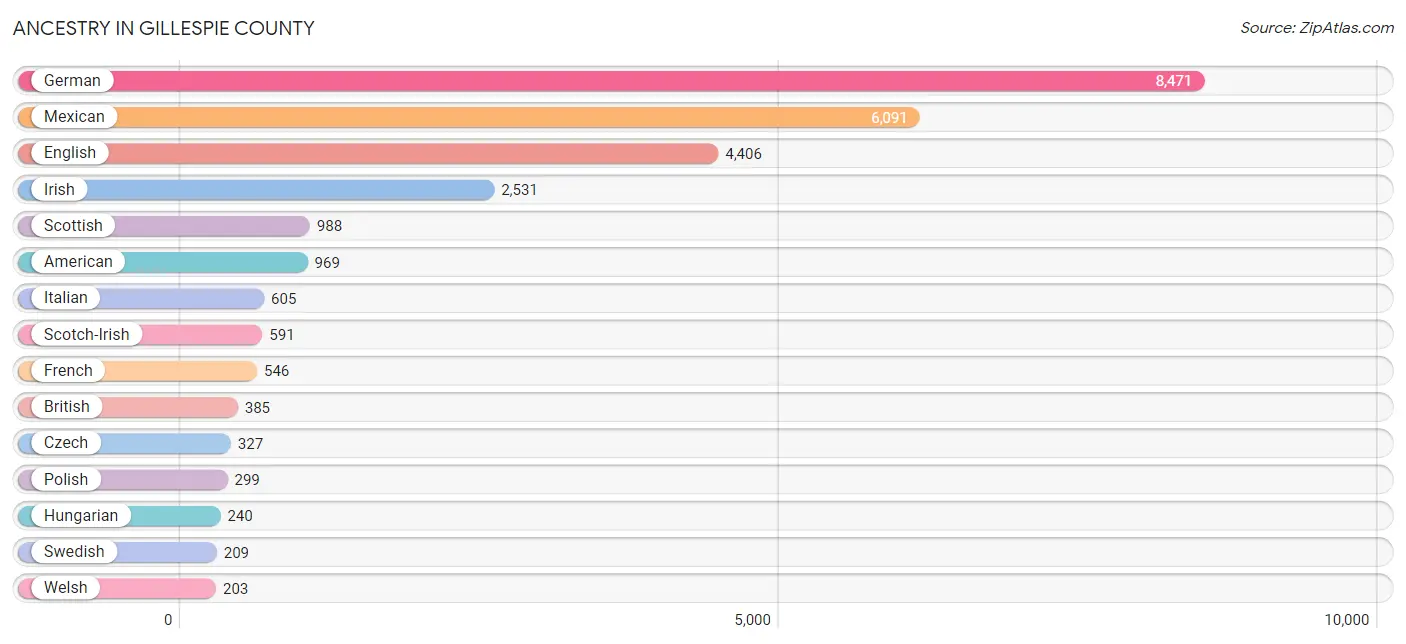
Ancestry in Gillespie County
The most populous ancestries reported in Gillespie County are German (8,471 | 31.4%), Mexican (6,091 | 22.6%), English (4,406 | 16.4%), Irish (2,531 | 9.4%), and Scottish (988 | 3.7%), together accounting for 83.4% of all Gillespie County residents.
| Ancestry | # Population | % Population |
| American | 969 | 3.6% |
| Arab | 11 | 0.0% |
| Austrian | 46 | 0.2% |
| Belgian | 2 | 0.0% |
| Bhutanese | 1 | 0.0% |
| Blackfeet | 8 | 0.0% |
| British | 385 | 1.4% |
| Burmese | 54 | 0.2% |
| Canadian | 10 | 0.0% |
| Carpatho Rusyn | 12 | 0.0% |
| Central American | 27 | 0.1% |
| Central American Indian | 14 | 0.1% |
| Cherokee | 54 | 0.2% |
| Chickasaw | 69 | 0.3% |
| Choctaw | 1 | 0.0% |
| Comanche | 101 | 0.4% |
| Creek | 42 | 0.2% |
| Croatian | 108 | 0.4% |
| Czech | 327 | 1.2% |
| Czechoslovakian | 12 | 0.0% |
| Danish | 135 | 0.5% |
| Dutch | 158 | 0.6% |
| Dutch West Indian | 42 | 0.2% |
| Eastern European | 9 | 0.0% |
| English | 4,406 | 16.4% |
| European | 201 | 0.7% |
| Finnish | 193 | 0.7% |
| French | 546 | 2.0% |
| French American Indian | 8 | 0.0% |
| French Canadian | 13 | 0.1% |
| German | 8,471 | 31.4% |
| Greek | 157 | 0.6% |
| Guatemalan | 14 | 0.1% |
| Hmong | 1 | 0.0% |
| Hungarian | 240 | 0.9% |
| Indian (Asian) | 17 | 0.1% |
| Indonesian | 32 | 0.1% |
| Irish | 2,531 | 9.4% |
| Italian | 605 | 2.2% |
| Korean | 23 | 0.1% |
| Lebanese | 11 | 0.0% |
| Lithuanian | 14 | 0.1% |
| Mexican | 6,091 | 22.6% |
| Mexican American Indian | 30 | 0.1% |
| Northern European | 80 | 0.3% |
| Norwegian | 84 | 0.3% |
| Pakistani | 41 | 0.2% |
| Pennsylvania German | 24 | 0.1% |
| Polish | 299 | 1.1% |
| Portuguese | 93 | 0.4% |
| Puerto Rican | 23 | 0.1% |
| Russian | 60 | 0.2% |
| Salvadoran | 13 | 0.1% |
| Scandinavian | 93 | 0.4% |
| Scotch-Irish | 591 | 2.2% |
| Scottish | 988 | 3.7% |
| Slovene | 50 | 0.2% |
| South American Indian | 1 | 0.0% |
| Spaniard | 73 | 0.3% |
| Spanish | 18 | 0.1% |
| Swedish | 209 | 0.8% |
| Swiss | 175 | 0.6% |
| Welsh | 203 | 0.7% |
| Yugoslavian | 9 | 0.0% | View All 64 Rows |
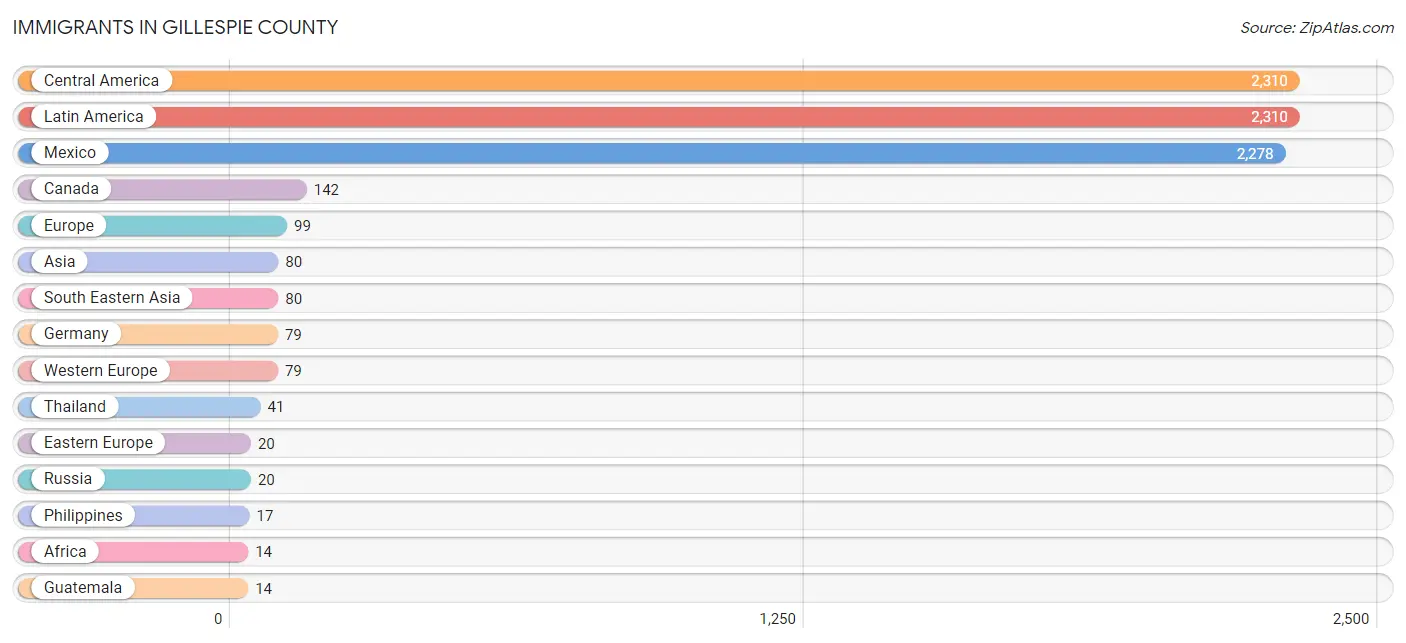
Immigrants in Gillespie County
The most numerous immigrant groups reported in Gillespie County came from Central America (2,310 | 8.6%), Latin America (2,310 | 8.6%), Mexico (2,278 | 8.5%), Canada (142 | 0.5%), and Europe (99 | 0.4%), together accounting for 26.5% of all Gillespie County residents.
| Immigration Origin | # Population | % Population |
| Africa | 14 | 0.1% |
| Asia | 80 | 0.3% |
| Canada | 142 | 0.5% |
| Central America | 2,310 | 8.6% |
| Eastern Europe | 20 | 0.1% |
| El Salvador | 13 | 0.1% |
| Europe | 99 | 0.4% |
| Germany | 79 | 0.3% |
| Guatemala | 14 | 0.1% |
| Latin America | 2,310 | 8.6% |
| Mexico | 2,278 | 8.5% |
| Panama | 5 | 0.0% |
| Philippines | 17 | 0.1% |
| Russia | 20 | 0.1% |
| Singapore | 13 | 0.1% |
| South Africa | 14 | 0.1% |
| South Eastern Asia | 80 | 0.3% |
| Thailand | 41 | 0.2% |
| Western Europe | 79 | 0.3% | View All 19 Rows |
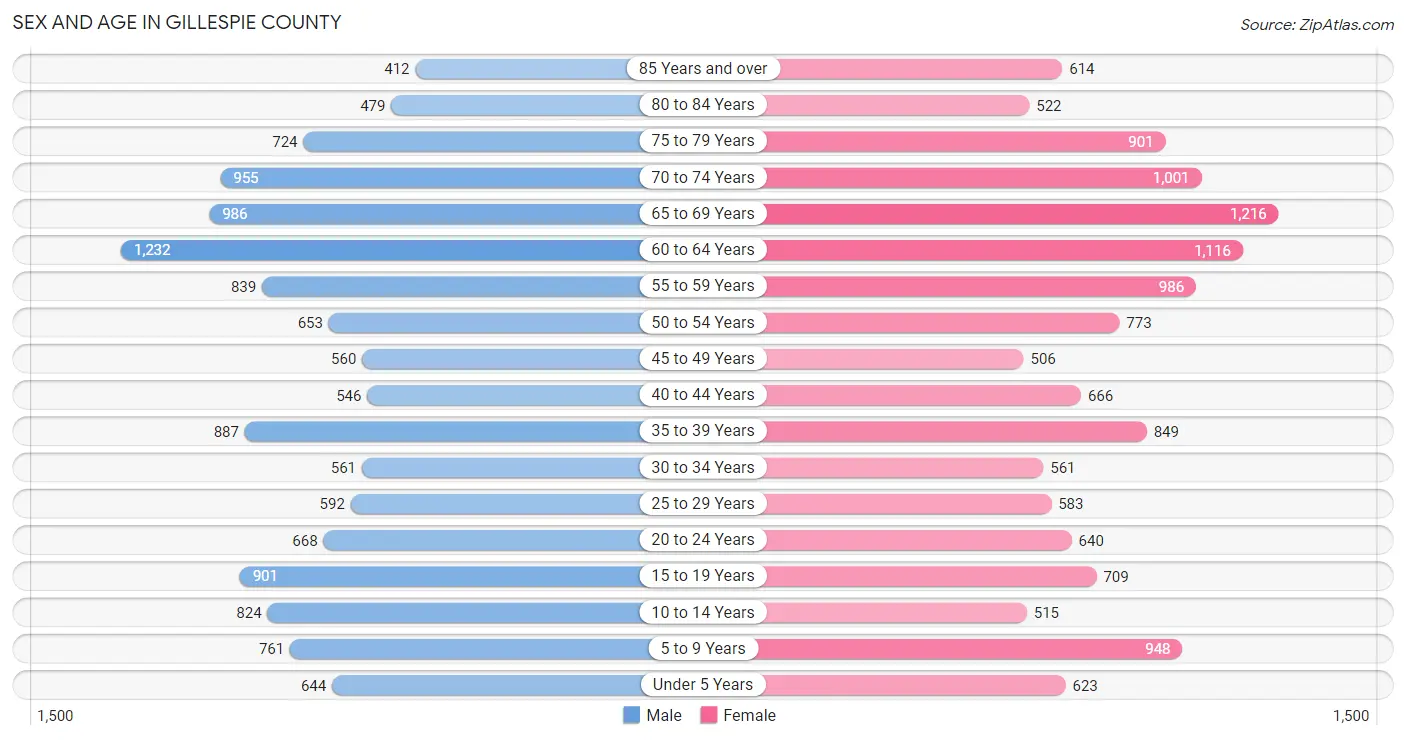
Sex and Age in Gillespie County
Sex and Age in Gillespie County
The most populous age groups in Gillespie County are 60 to 64 Years (1,232 | 9.3%) for men and 65 to 69 Years (1,216 | 8.9%) for women.
| Age Bracket | Male | Female |
| Under 5 Years | 644 (4.9%) | 623 (4.5%) |
| 5 to 9 Years | 761 (5.8%) | 948 (6.9%) |
| 10 to 14 Years | 824 (6.2%) | 515 (3.7%) |
| 15 to 19 Years | 901 (6.8%) | 709 (5.2%) |
| 20 to 24 Years | 668 (5.1%) | 640 (4.7%) |
| 25 to 29 Years | 592 (4.5%) | 583 (4.3%) |
| 30 to 34 Years | 561 (4.2%) | 561 (4.1%) |
| 35 to 39 Years | 887 (6.7%) | 849 (6.2%) |
| 40 to 44 Years | 546 (4.1%) | 666 (4.9%) |
| 45 to 49 Years | 560 (4.2%) | 506 (3.7%) |
| 50 to 54 Years | 653 (4.9%) | 773 (5.6%) |
| 55 to 59 Years | 839 (6.3%) | 986 (7.2%) |
| 60 to 64 Years | 1,232 (9.3%) | 1,116 (8.1%) |
| 65 to 69 Years | 986 (7.5%) | 1,216 (8.9%) |
| 70 to 74 Years | 955 (7.2%) | 1,001 (7.3%) |
| 75 to 79 Years | 724 (5.5%) | 901 (6.6%) |
| 80 to 84 Years | 479 (3.6%) | 522 (3.8%) |
| 85 Years and over | 412 (3.1%) | 614 (4.5%) |
| Total | 13,224 (100.0%) | 13,729 (100.0%) |
Families and Households in Gillespie County
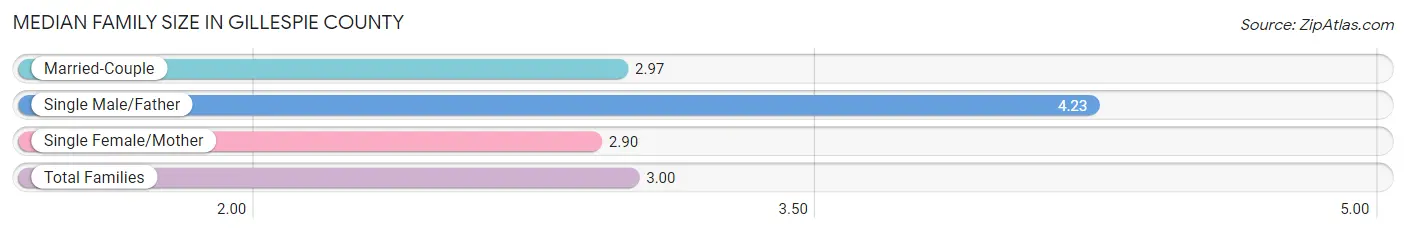
Median Family Size in Gillespie County
The median family size in Gillespie County is 3.00 persons per family, with single male/father families (199 | 2.7%) accounting for the largest median family size of 4.23 persons per family. On the other hand, single female/mother families (874 | 11.9%) represent the smallest median family size with 2.90 persons per family.
| Family Type | # Families | Family Size |
| Married-Couple | 6,256 (85.4%) | 2.97 |
| Single Male/Father | 199 (2.7%) | 4.23 |
| Single Female/Mother | 874 (11.9%) | 2.90 |
| Total Families | 7,329 (100.0%) | 3.00 |
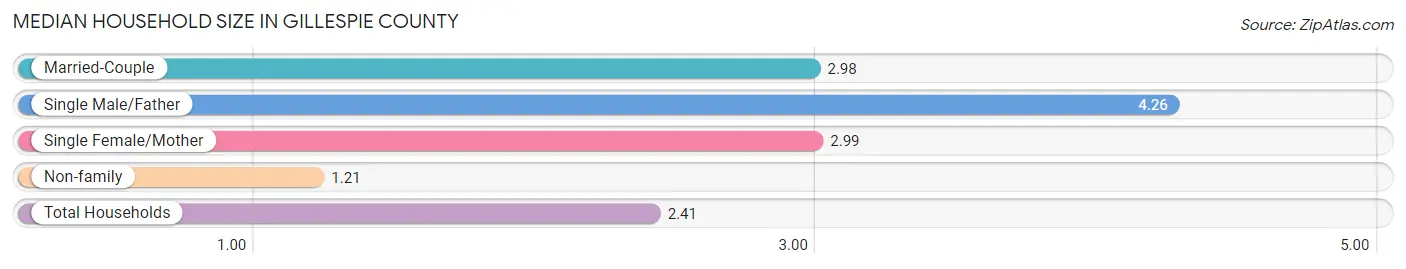
Median Household Size in Gillespie County
The median household size in Gillespie County is 2.41 persons per household, with single male/father households (199 | 1.8%) accounting for the largest median household size of 4.26 persons per household. non-family households (3,706 | 33.6%) represent the smallest median household size with 1.21 persons per household.
| Household Type | # Households | Household Size |
| Married-Couple | 6,256 (56.7%) | 2.98 |
| Single Male/Father | 199 (1.8%) | 4.26 |
| Single Female/Mother | 874 (7.9%) | 2.99 |
| Non-family | 3,706 (33.6%) | 1.21 |
| Total Households | 11,035 (100.0%) | 2.41 |
Household Size by Marriage Status in Gillespie County
Out of a total of 11,035 households in Gillespie County, 7,329 (66.4%) are family households, while 3,706 (33.6%) are nonfamily households. The most numerous type of family households are 2-person households, comprising 4,203, and the most common type of nonfamily households are 1-person households, comprising 3,144.
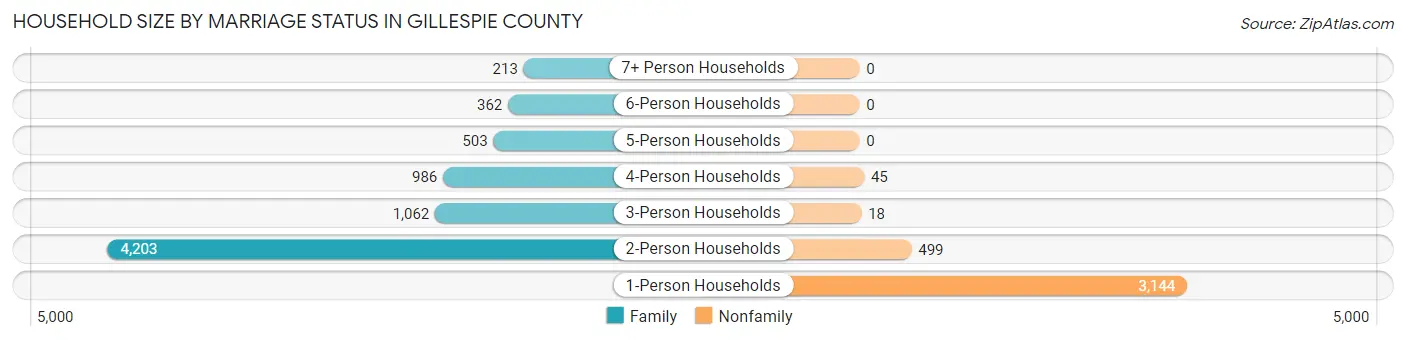
| Household Size | Family Households | Nonfamily Households |
| 1-Person Households | - | 3,144 (28.5%) |
| 2-Person Households | 4,203 (38.1%) | 499 (4.5%) |
| 3-Person Households | 1,062 (9.6%) | 18 (0.2%) |
| 4-Person Households | 986 (8.9%) | 45 (0.4%) |
| 5-Person Households | 503 (4.6%) | 0 (0.0%) |
| 6-Person Households | 362 (3.3%) | 0 (0.0%) |
| 7+ Person Households | 213 (1.9%) | 0 (0.0%) |
| Total | 7,329 (66.4%) | 3,706 (33.6%) |
Female Fertility in Gillespie County
Fertility by Age in Gillespie County
Average fertility rate in Gillespie County is 28.0 births per 1,000 women. Women in the age bracket of 20 to 34 years have the highest fertility rate with 53.0 births per 1,000 women. Women in the age bracket of 20 to 34 years acount for 73.1% of all women with births.
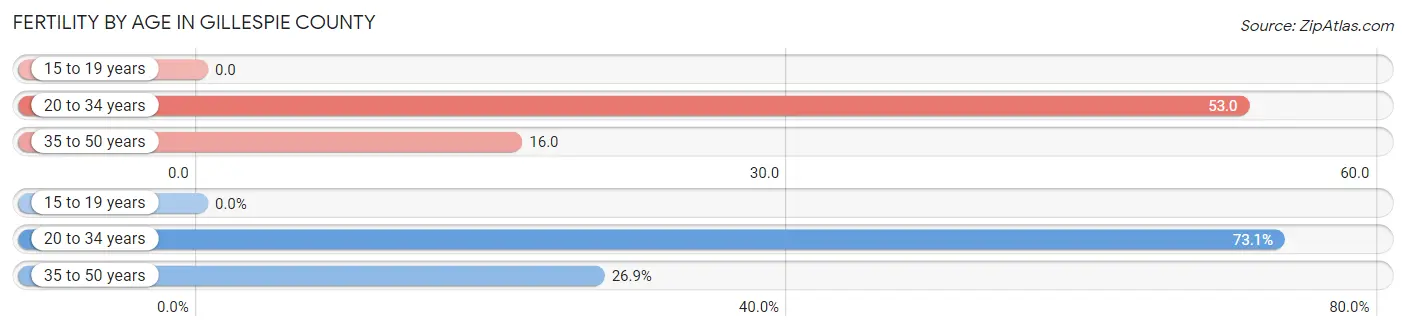
| Age Bracket | Women with Births | Births / 1,000 Women |
| 15 to 19 years | 0 (0.0%) | 0.0 |
| 20 to 34 years | 95 (73.1%) | 53.0 |
| 35 to 50 years | 35 (26.9%) | 16.0 |
| Total | 130 (100.0%) | 28.0 |
Fertility by Age by Marriage Status in Gillespie County
93.1% of women with births (130) in Gillespie County are married. The highest percentage of unmarried women with births falls into 20 to 34 years age bracket with 9.5% of them unmarried at the time of birth, while the lowest percentage of unmarried women with births belong to 35 to 50 years age bracket with 0.0% of them unmarried.
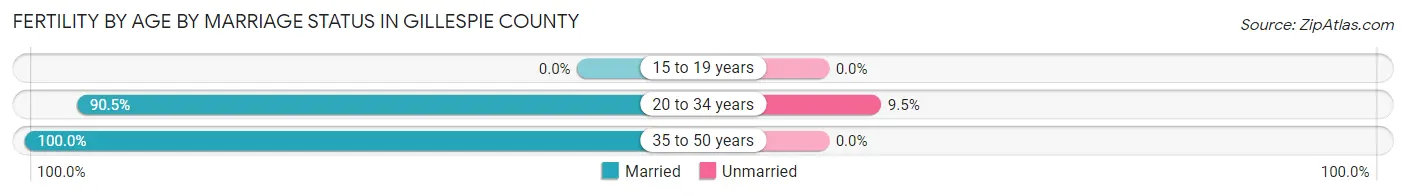
| Age Bracket | Married | Unmarried |
| 15 to 19 years | 0 (0.0%) | 0 (0.0%) |
| 20 to 34 years | 86 (90.5%) | 9 (9.5%) |
| 35 to 50 years | 35 (100.0%) | 0 (0.0%) |
| Total | 121 (93.1%) | 9 (6.9%) |
Fertility by Education in Gillespie County
Average fertility rate in Gillespie County is 28.0 births per 1,000 women. Women with the education attainment of bachelor's degree have the highest fertility rate of 39.0 births per 1,000 women, while women with the education attainment of college or associate's degree have the lowest fertility at 10.0 births per 1,000 women. Women with the education attainment of less than high school represent 28.5% of all women with births.
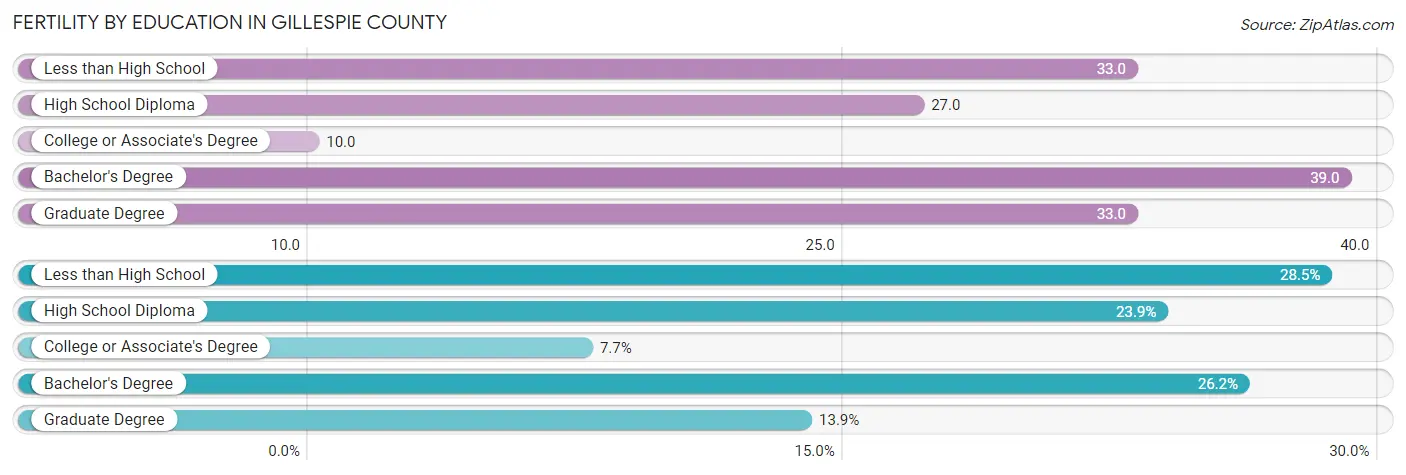
| Educational Attainment | Women with Births | Births / 1,000 Women |
| Less than High School | 37 (28.5%) | 33.0 |
| High School Diploma | 31 (23.8%) | 27.0 |
| College or Associate's Degree | 10 (7.7%) | 10.0 |
| Bachelor's Degree | 34 (26.2%) | 39.0 |
| Graduate Degree | 18 (13.9%) | 33.0 |
| Total | 130 (100.0%) | 28.0 |
Fertility by Education by Marriage Status in Gillespie County
6.9% of women with births in Gillespie County are unmarried. Women with the educational attainment of less than high school are most likely to be married with 100.0% of them married at childbirth, while women with the educational attainment of high school diploma are least likely to be married with 29.0% of them unmarried at childbirth.
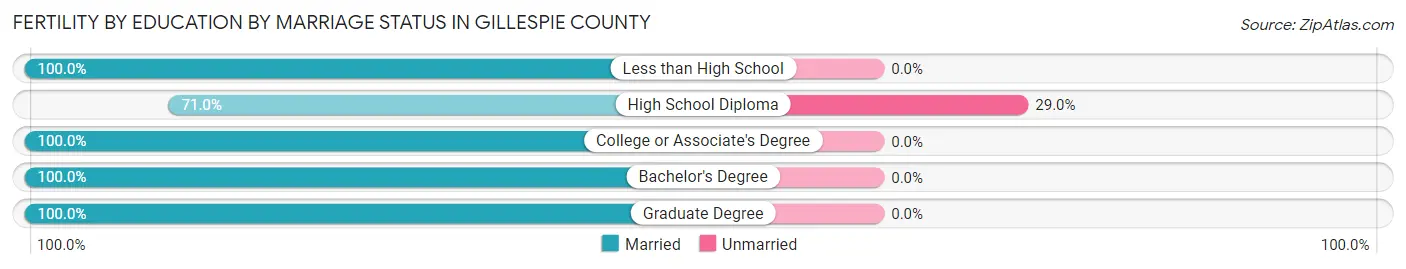
| Educational Attainment | Married | Unmarried |
| Less than High School | 37 (100.0%) | 0 (0.0%) |
| High School Diploma | 22 (71.0%) | 9 (29.0%) |
| College or Associate's Degree | 10 (100.0%) | 0 (0.0%) |
| Bachelor's Degree | 34 (100.0%) | 0 (0.0%) |
| Graduate Degree | 18 (100.0%) | 0 (0.0%) |
| Total | 121 (93.1%) | 9 (6.9%) |
Employment Characteristics in Gillespie County
Employment by Class of Employer in Gillespie County
Among the 12,087 employed individuals in Gillespie County, private company employees (7,517 | 62.2%), self-employed (not incorporated) (1,663 | 13.8%), and local government employees (908 | 7.5%) make up the most common classes of employment.
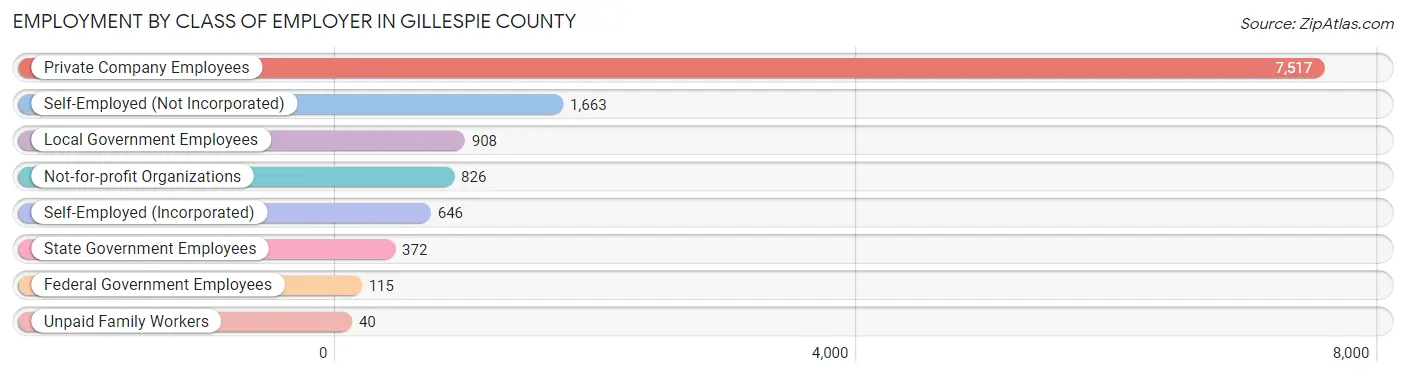
| Employer Class | # Employees | % Employees |
| Private Company Employees | 7,517 | 62.2% |
| Self-Employed (Incorporated) | 646 | 5.3% |
| Self-Employed (Not Incorporated) | 1,663 | 13.8% |
| Not-for-profit Organizations | 826 | 6.8% |
| Local Government Employees | 908 | 7.5% |
| State Government Employees | 372 | 3.1% |
| Federal Government Employees | 115 | 0.9% |
| Unpaid Family Workers | 40 | 0.3% |
| Total | 12,087 | 100.0% |
Employment Status by Age in Gillespie County
According to the labor force statistics for Gillespie County, out of the total population over 16 years of age (22,330), 57.5% or 12,840 individuals are in the labor force, with 3.5% or 449 of them unemployed. The age group with the highest labor force participation rate is 25 to 29 years, with 90.1% or 1,059 individuals in the labor force. Within the labor force, the 16 to 19 years age range has the highest percentage of unemployed individuals, with 12.2% or 88 of them being unemployed.
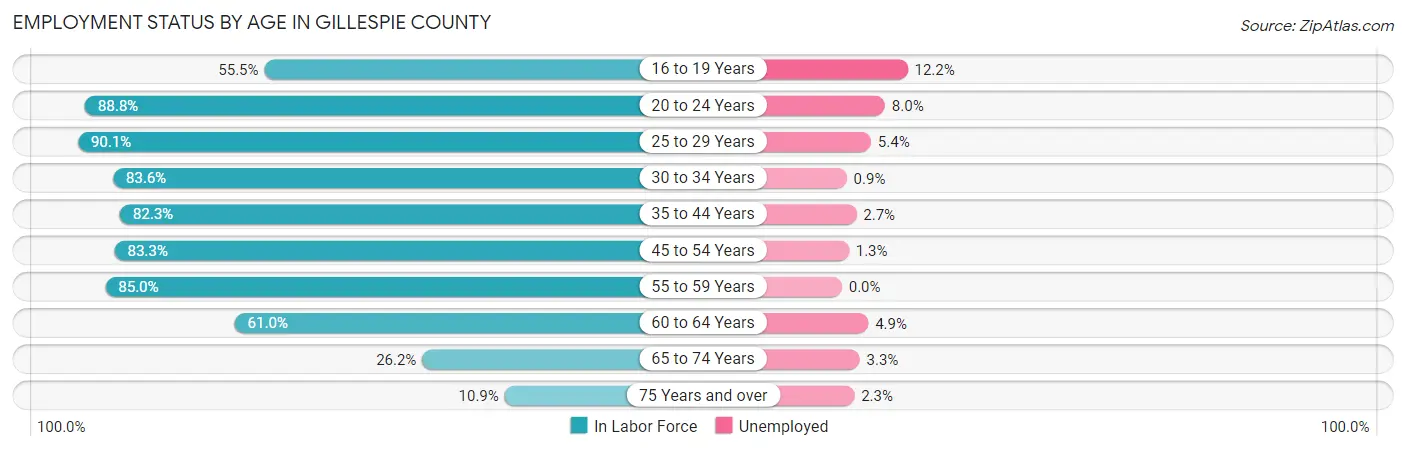
| Age Bracket | In Labor Force | Unemployed |
| 16 to 19 Years | 723 (55.5%) | 88 (12.2%) |
| 20 to 24 Years | 1,162 (88.8%) | 93 (8.0%) |
| 25 to 29 Years | 1,059 (90.1%) | 57 (5.4%) |
| 30 to 34 Years | 938 (83.6%) | 8 (0.9%) |
| 35 to 44 Years | 2,426 (82.3%) | 66 (2.7%) |
| 45 to 54 Years | 2,076 (83.3%) | 27 (1.3%) |
| 55 to 59 Years | 1,551 (85.0%) | 0 (0.0%) |
| 60 to 64 Years | 1,432 (61.0%) | 70 (4.9%) |
| 65 to 74 Years | 1,089 (26.2%) | 36 (3.3%) |
| 75 Years and over | 398 (10.9%) | 9 (2.3%) |
| Total | 12,840 (57.5%) | 449 (3.5%) |
Employment Status by Educational Attainment in Gillespie County
According to labor force statistics for Gillespie County, 79.6% of individuals (9,480) out of the total population between 25 and 64 years of age (11,910) are in the labor force, with 2.4% or 228 of them being unemployed. The group with the highest labor force participation rate are those with the educational attainment of bachelor's degree or higher, with 85.6% or 3,342 individuals in the labor force. Within the labor force, individuals with less than high school education have the highest percentage of unemployment, with 4.0% or 45 of them being unemployed.
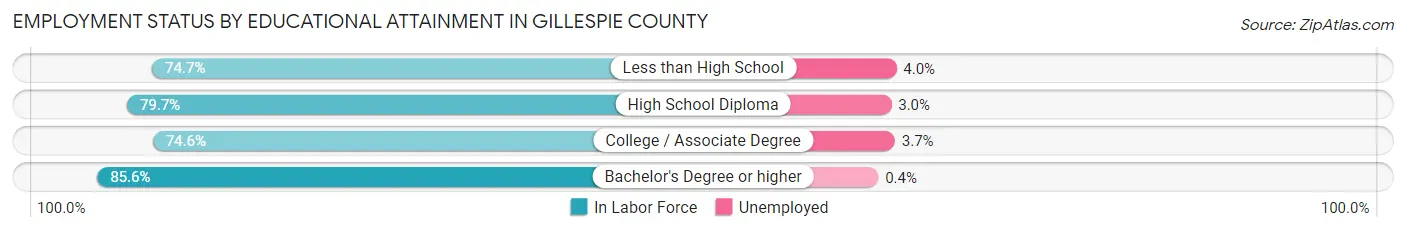
| Educational Attainment | In Labor Force | Unemployed |
| Less than High School | 1,120 (74.7%) | 60 (4.0%) |
| High School Diploma | 2,589 (79.7%) | 97 (3.0%) |
| College / Associate Degree | 2,430 (74.6%) | 121 (3.7%) |
| Bachelor's Degree or higher | 3,342 (85.6%) | 16 (0.4%) |
| Total | 9,480 (79.6%) | 286 (2.4%) |
Employment Occupations by Sex in Gillespie County
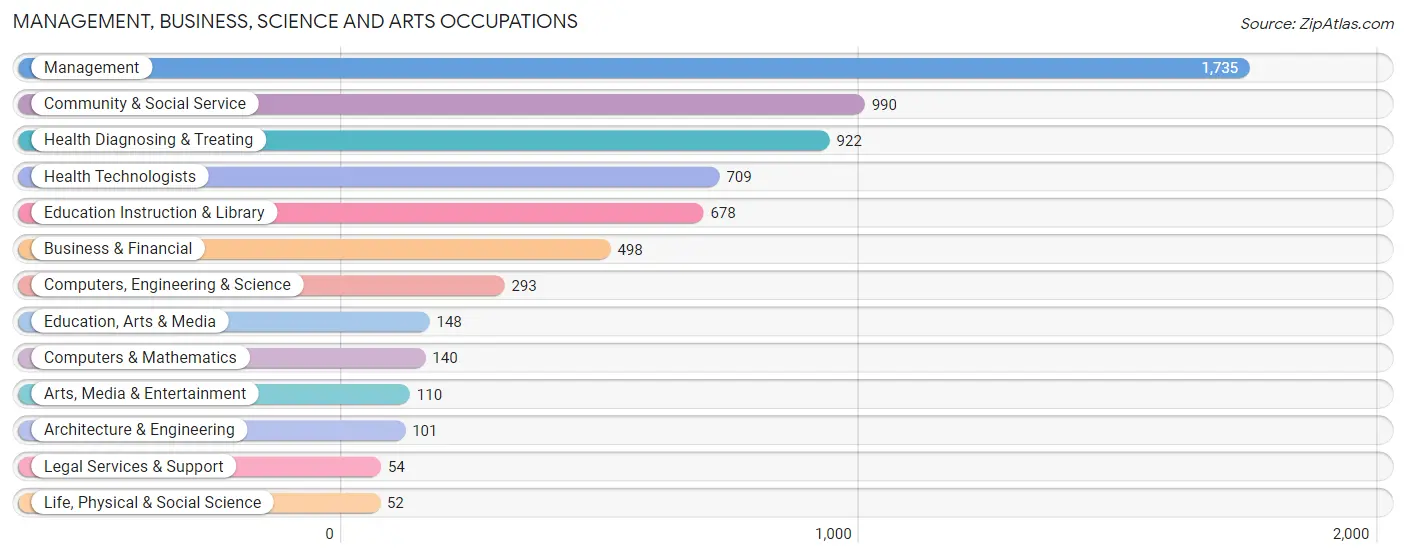
Management, Business, Science and Arts Occupations
The most common Management, Business, Science and Arts occupations in Gillespie County are Management (1,735 | 14.0%), Community & Social Service (990 | 8.0%), Health Diagnosing & Treating (922 | 7.4%), Health Technologists (709 | 5.7%), and Education Instruction & Library (678 | 5.5%).
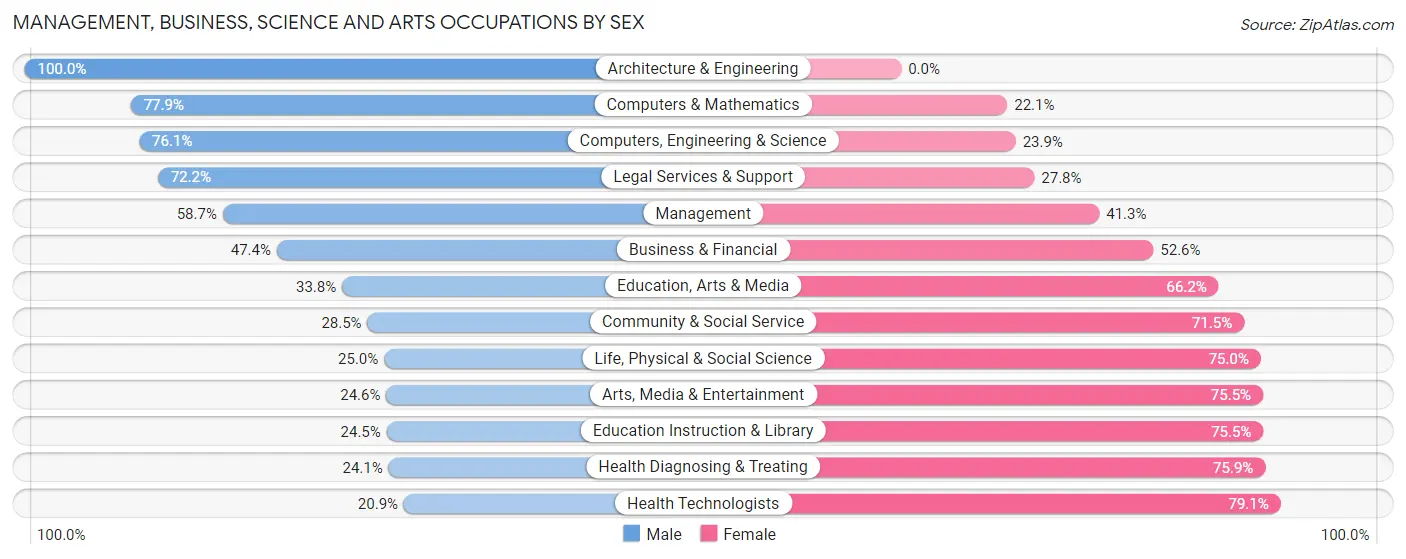
Management, Business, Science and Arts Occupations by Sex
Within the Management, Business, Science and Arts occupations in Gillespie County, the most male-oriented occupations are Architecture & Engineering (100.0%), Computers & Mathematics (77.9%), and Computers, Engineering & Science (76.1%), while the most female-oriented occupations are Health Technologists (79.1%), Health Diagnosing & Treating (75.9%), and Education Instruction & Library (75.5%).
| Occupation | Male | Female |
| Management | 1,018 (58.7%) | 717 (41.3%) |
| Business & Financial | 236 (47.4%) | 262 (52.6%) |
| Computers, Engineering & Science | 223 (76.1%) | 70 (23.9%) |
| Computers & Mathematics | 109 (77.9%) | 31 (22.1%) |
| Architecture & Engineering | 101 (100.0%) | 0 (0.0%) |
| Life, Physical & Social Science | 13 (25.0%) | 39 (75.0%) |
| Community & Social Service | 282 (28.5%) | 708 (71.5%) |
| Education, Arts & Media | 50 (33.8%) | 98 (66.2%) |
| Legal Services & Support | 39 (72.2%) | 15 (27.8%) |
| Education Instruction & Library | 166 (24.5%) | 512 (75.5%) |
| Arts, Media & Entertainment | 27 (24.5%) | 83 (75.4%) |
| Health Diagnosing & Treating | 222 (24.1%) | 700 (75.9%) |
| Health Technologists | 148 (20.9%) | 561 (79.1%) |
| Total (Category) | 1,981 (44.6%) | 2,457 (55.4%) |
| Total (Overall) | 6,586 (53.1%) | 5,810 (46.9%) |
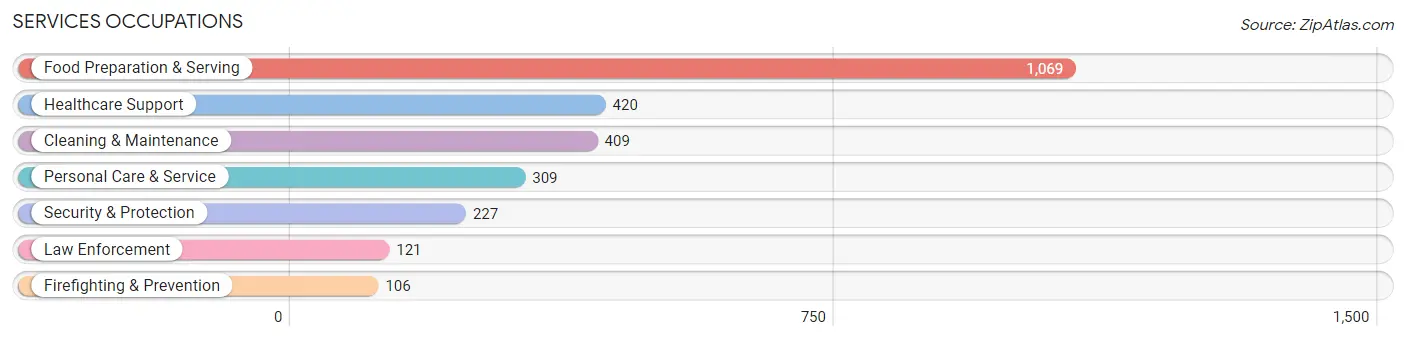
Services Occupations
The most common Services occupations in Gillespie County are Food Preparation & Serving (1,069 | 8.6%), Healthcare Support (420 | 3.4%), Cleaning & Maintenance (409 | 3.3%), Personal Care & Service (309 | 2.5%), and Security & Protection (227 | 1.8%).
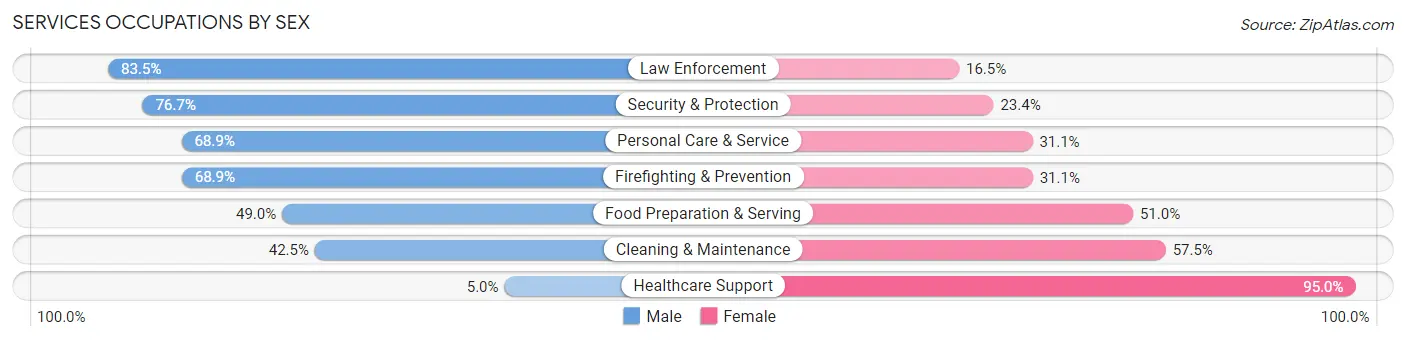
Services Occupations by Sex
Within the Services occupations in Gillespie County, the most male-oriented occupations are Law Enforcement (83.5%), Security & Protection (76.6%), and Personal Care & Service (68.9%), while the most female-oriented occupations are Healthcare Support (95.0%), Cleaning & Maintenance (57.5%), and Food Preparation & Serving (51.0%).
| Occupation | Male | Female |
| Healthcare Support | 21 (5.0%) | 399 (95.0%) |
| Security & Protection | 174 (76.6%) | 53 (23.4%) |
| Firefighting & Prevention | 73 (68.9%) | 33 (31.1%) |
| Law Enforcement | 101 (83.5%) | 20 (16.5%) |
| Food Preparation & Serving | 524 (49.0%) | 545 (51.0%) |
| Cleaning & Maintenance | 174 (42.5%) | 235 (57.5%) |
| Personal Care & Service | 213 (68.9%) | 96 (31.1%) |
| Total (Category) | 1,106 (45.4%) | 1,328 (54.6%) |
| Total (Overall) | 6,586 (53.1%) | 5,810 (46.9%) |
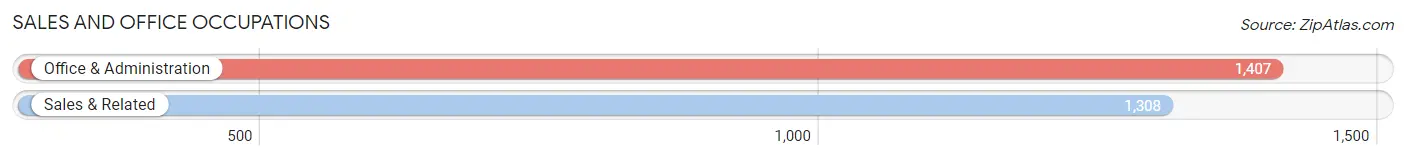
Sales and Office Occupations
The most common Sales and Office occupations in Gillespie County are Office & Administration (1,407 | 11.4%), and Sales & Related (1,308 | 10.5%).
Sales and Office Occupations by Sex
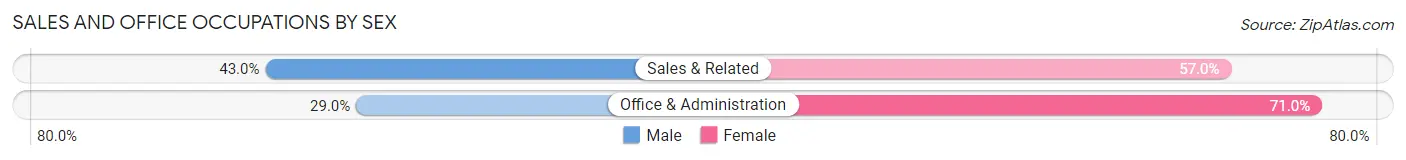
| Occupation | Male | Female |
| Sales & Related | 562 (43.0%) | 746 (57.0%) |
| Office & Administration | 408 (29.0%) | 999 (71.0%) |
| Total (Category) | 970 (35.7%) | 1,745 (64.3%) |
| Total (Overall) | 6,586 (53.1%) | 5,810 (46.9%) |
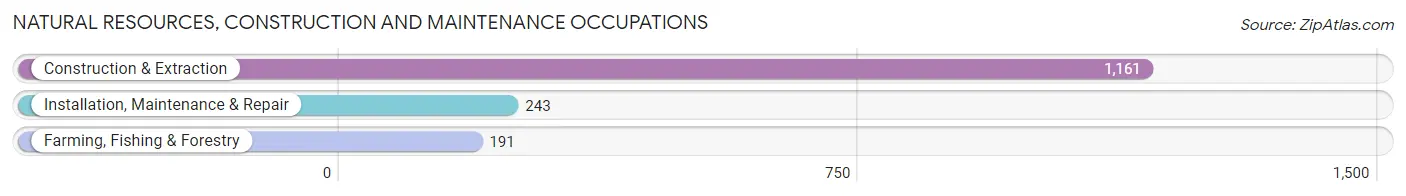
Natural Resources, Construction and Maintenance Occupations
The most common Natural Resources, Construction and Maintenance occupations in Gillespie County are Construction & Extraction (1,161 | 9.4%), Installation, Maintenance & Repair (243 | 2.0%), and Farming, Fishing & Forestry (191 | 1.5%).
Natural Resources, Construction and Maintenance Occupations by Sex
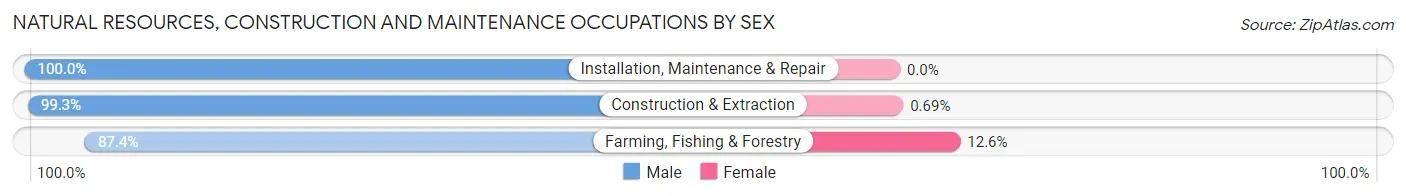
| Occupation | Male | Female |
| Farming, Fishing & Forestry | 167 (87.4%) | 24 (12.6%) |
| Construction & Extraction | 1,153 (99.3%) | 8 (0.7%) |
| Installation, Maintenance & Repair | 243 (100.0%) | 0 (0.0%) |
| Total (Category) | 1,563 (98.0%) | 32 (2.0%) |
| Total (Overall) | 6,586 (53.1%) | 5,810 (46.9%) |
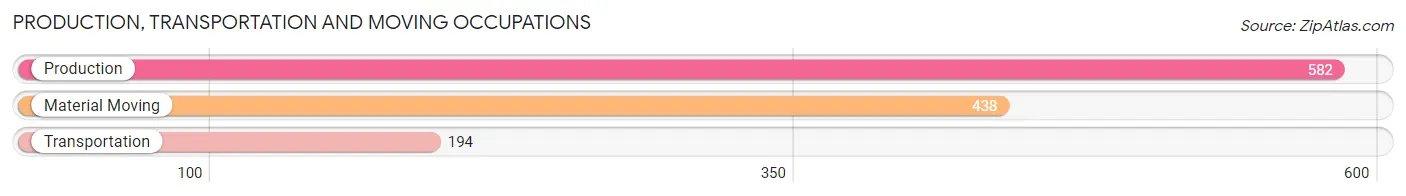
Production, Transportation and Moving Occupations
The most common Production, Transportation and Moving occupations in Gillespie County are Production (582 | 4.7%), Material Moving (438 | 3.5%), and Transportation (194 | 1.6%).
Production, Transportation and Moving Occupations by Sex
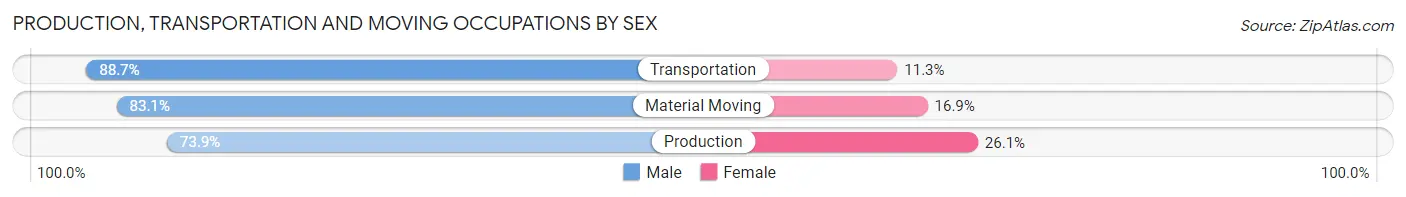
| Occupation | Male | Female |
| Production | 430 (73.9%) | 152 (26.1%) |
| Transportation | 172 (88.7%) | 22 (11.3%) |
| Material Moving | 364 (83.1%) | 74 (16.9%) |
| Total (Category) | 966 (79.6%) | 248 (20.4%) |
| Total (Overall) | 6,586 (53.1%) | 5,810 (46.9%) |
Employment Industries by Sex in Gillespie County
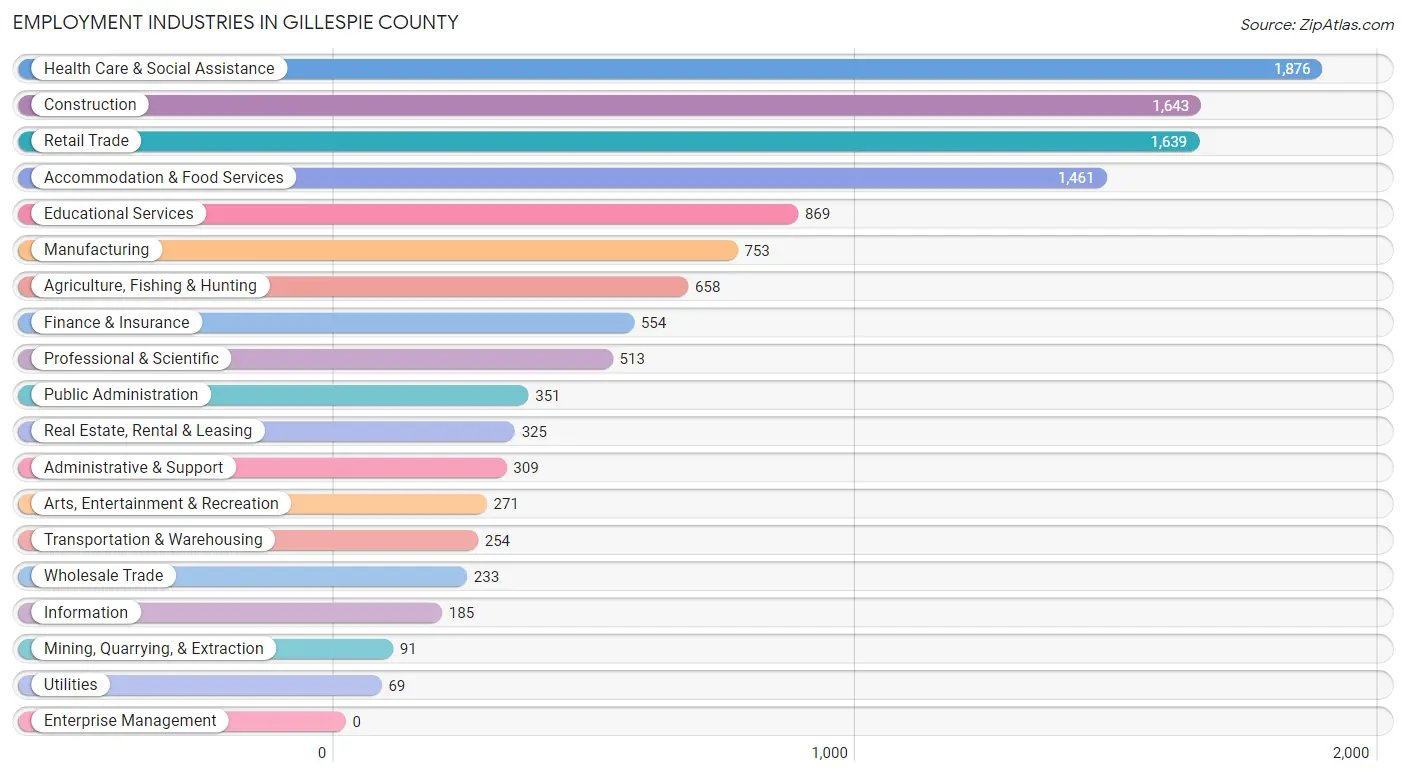
Employment Industries in Gillespie County
The major employment industries in Gillespie County include Health Care & Social Assistance (1,876 | 15.1%), Construction (1,643 | 13.3%), Retail Trade (1,639 | 13.2%), Accommodation & Food Services (1,461 | 11.8%), and Educational Services (869 | 7.0%).
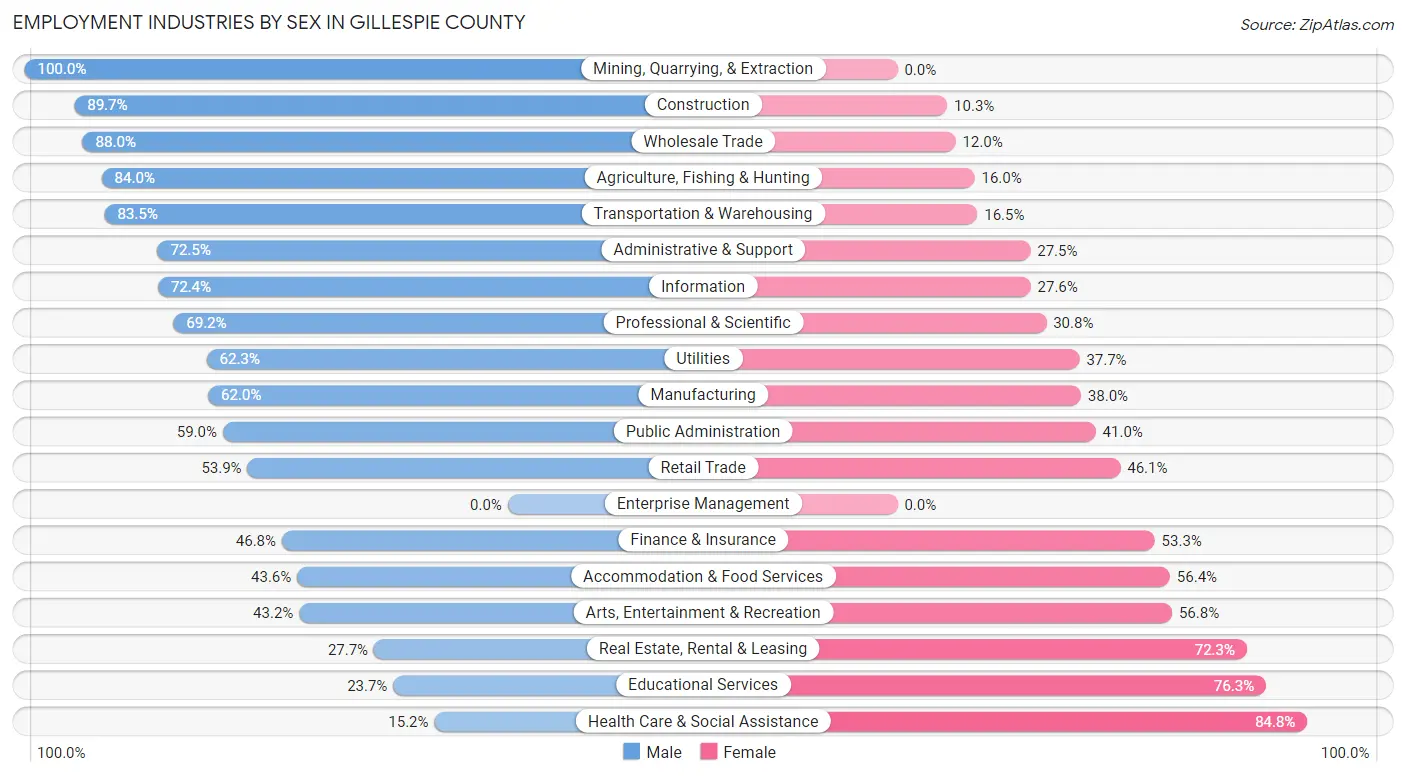
Employment Industries by Sex in Gillespie County
The Gillespie County industries that see more men than women are Mining, Quarrying, & Extraction (100.0%), Construction (89.7%), and Wholesale Trade (88.0%), whereas the industries that tend to have a higher number of women are Health Care & Social Assistance (84.8%), Educational Services (76.3%), and Real Estate, Rental & Leasing (72.3%).
| Industry | Male | Female |
| Agriculture, Fishing & Hunting | 553 (84.0%) | 105 (16.0%) |
| Mining, Quarrying, & Extraction | 91 (100.0%) | 0 (0.0%) |
| Construction | 1,474 (89.7%) | 169 (10.3%) |
| Manufacturing | 467 (62.0%) | 286 (38.0%) |
| Wholesale Trade | 205 (88.0%) | 28 (12.0%) |
| Retail Trade | 883 (53.9%) | 756 (46.1%) |
| Transportation & Warehousing | 212 (83.5%) | 42 (16.5%) |
| Utilities | 43 (62.3%) | 26 (37.7%) |
| Information | 134 (72.4%) | 51 (27.6%) |
| Finance & Insurance | 259 (46.8%) | 295 (53.2%) |
| Real Estate, Rental & Leasing | 90 (27.7%) | 235 (72.3%) |
| Professional & Scientific | 355 (69.2%) | 158 (30.8%) |
| Enterprise Management | 0 (0.0%) | 0 (0.0%) |
| Administrative & Support | 224 (72.5%) | 85 (27.5%) |
| Educational Services | 206 (23.7%) | 663 (76.3%) |
| Health Care & Social Assistance | 285 (15.2%) | 1,591 (84.8%) |
| Arts, Entertainment & Recreation | 117 (43.2%) | 154 (56.8%) |
| Accommodation & Food Services | 637 (43.6%) | 824 (56.4%) |
| Public Administration | 207 (59.0%) | 144 (41.0%) |
| Total | 6,586 (53.1%) | 5,810 (46.9%) |
Education in Gillespie County
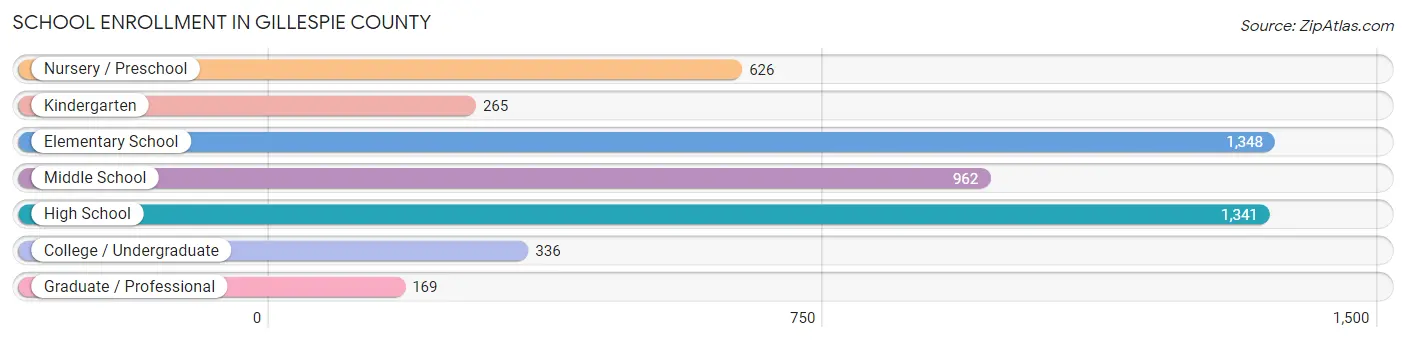
School Enrollment in Gillespie County
The most common levels of schooling among the 5,047 students in Gillespie County are elementary school (1,348 | 26.7%), high school (1,341 | 26.6%), and middle school (962 | 19.1%).
| School Level | # Students | % Students |
| Nursery / Preschool | 626 | 12.4% |
| Kindergarten | 265 | 5.2% |
| Elementary School | 1,348 | 26.7% |
| Middle School | 962 | 19.1% |
| High School | 1,341 | 26.6% |
| College / Undergraduate | 336 | 6.7% |
| Graduate / Professional | 169 | 3.4% |
| Total | 5,047 | 100.0% |
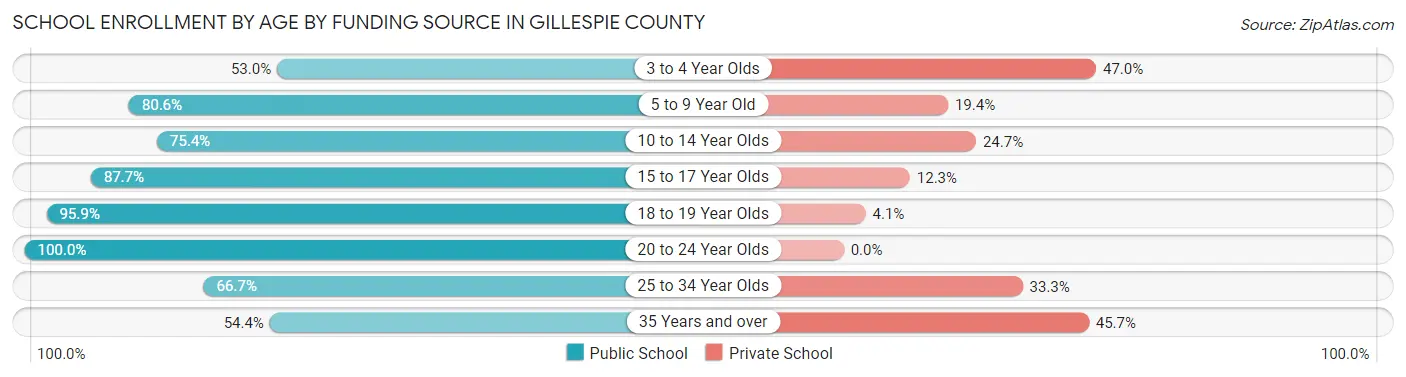
School Enrollment by Age by Funding Source in Gillespie County
Out of a total of 5,047 students who are enrolled in schools in Gillespie County, 1,075 (21.3%) attend a private institution, while the remaining 3,972 (78.7%) are enrolled in public schools. The age group of 3 to 4 year olds has the highest likelihood of being enrolled in private schools, with 212 (47.0% in the age bracket) enrolled. Conversely, the age group of 20 to 24 year olds has the lowest likelihood of being enrolled in a private school, with 173 (100.0% in the age bracket) attending a public institution.
| Age Bracket | Public School | Private School |
| 3 to 4 Year Olds | 239 (53.0%) | 212 (47.0%) |
| 5 to 9 Year Old | 1,298 (80.6%) | 313 (19.4%) |
| 10 to 14 Year Olds | 920 (75.3%) | 301 (24.6%) |
| 15 to 17 Year Olds | 846 (87.7%) | 119 (12.3%) |
| 18 to 19 Year Olds | 329 (95.9%) | 14 (4.1%) |
| 20 to 24 Year Olds | 173 (100.0%) | 0 (0.0%) |
| 25 to 34 Year Olds | 66 (66.7%) | 33 (33.3%) |
| 35 Years and over | 100 (54.3%) | 84 (45.7%) |
| Total | 3,972 (78.7%) | 1,075 (21.3%) |
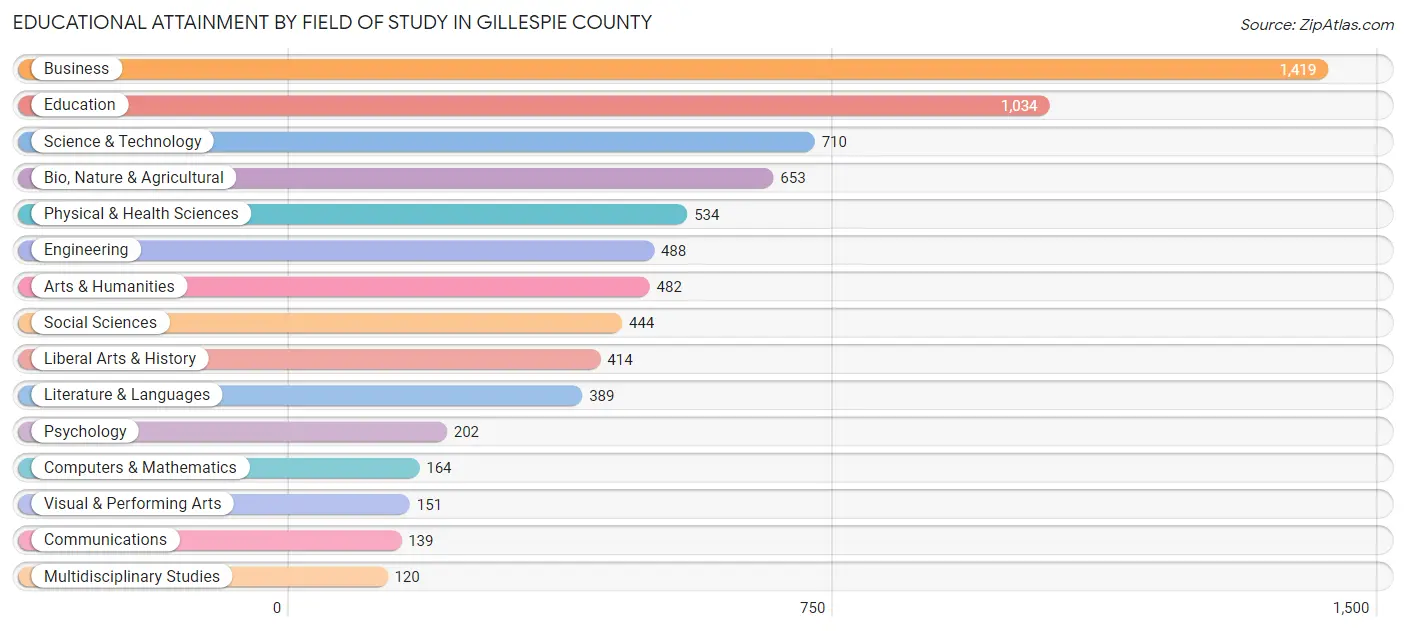
Educational Attainment by Field of Study in Gillespie County
Business (1,419 | 19.3%), education (1,034 | 14.1%), science & technology (710 | 9.7%), bio, nature & agricultural (653 | 8.9%), and physical & health sciences (534 | 7.3%) are the most common fields of study among 7,343 individuals in Gillespie County who have obtained a bachelor's degree or higher.
| Field of Study | # Graduates | % Graduates |
| Computers & Mathematics | 164 | 2.2% |
| Bio, Nature & Agricultural | 653 | 8.9% |
| Physical & Health Sciences | 534 | 7.3% |
| Psychology | 202 | 2.8% |
| Social Sciences | 444 | 6.0% |
| Engineering | 488 | 6.7% |
| Multidisciplinary Studies | 120 | 1.6% |
| Science & Technology | 710 | 9.7% |
| Business | 1,419 | 19.3% |
| Education | 1,034 | 14.1% |
| Literature & Languages | 389 | 5.3% |
| Liberal Arts & History | 414 | 5.6% |
| Visual & Performing Arts | 151 | 2.1% |
| Communications | 139 | 1.9% |
| Arts & Humanities | 482 | 6.6% |
| Total | 7,343 | 100.0% |
Transportation & Commute in Gillespie County
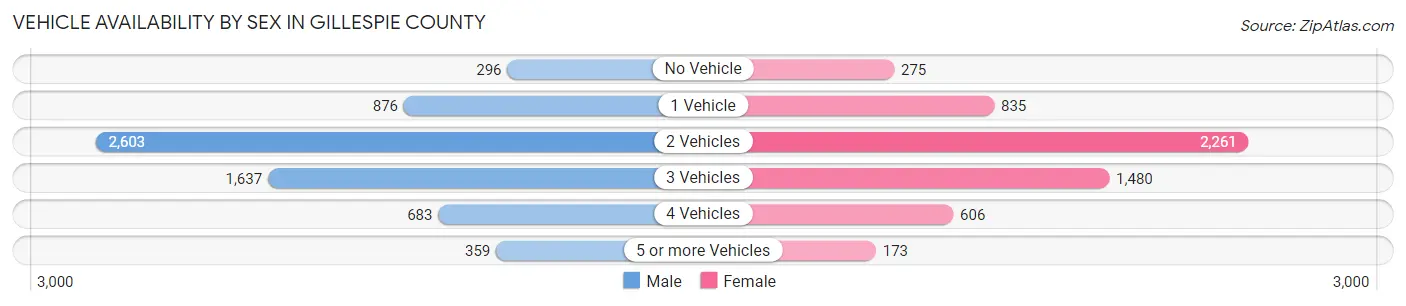
Vehicle Availability by Sex in Gillespie County
The most prevalent vehicle ownership categories in Gillespie County are males with 2 vehicles (2,603, accounting for 40.3%) and females with 2 vehicles (2,261, making up 46.2%).
| Vehicles Available | Male | Female |
| No Vehicle | 296 (4.6%) | 275 (4.9%) |
| 1 Vehicle | 876 (13.6%) | 835 (14.8%) |
| 2 Vehicles | 2,603 (40.3%) | 2,261 (40.2%) |
| 3 Vehicles | 1,637 (25.4%) | 1,480 (26.3%) |
| 4 Vehicles | 683 (10.6%) | 606 (10.8%) |
| 5 or more Vehicles | 359 (5.6%) | 173 (3.1%) |
| Total | 6,454 (100.0%) | 5,630 (100.0%) |
Commute Time in Gillespie County
The most frequently occuring commute durations in Gillespie County are 10 to 14 minutes (2,873 commuters, 26.2%), 5 to 9 minutes (2,300 commuters, 21.0%), and 15 to 19 minutes (1,362 commuters, 12.4%).
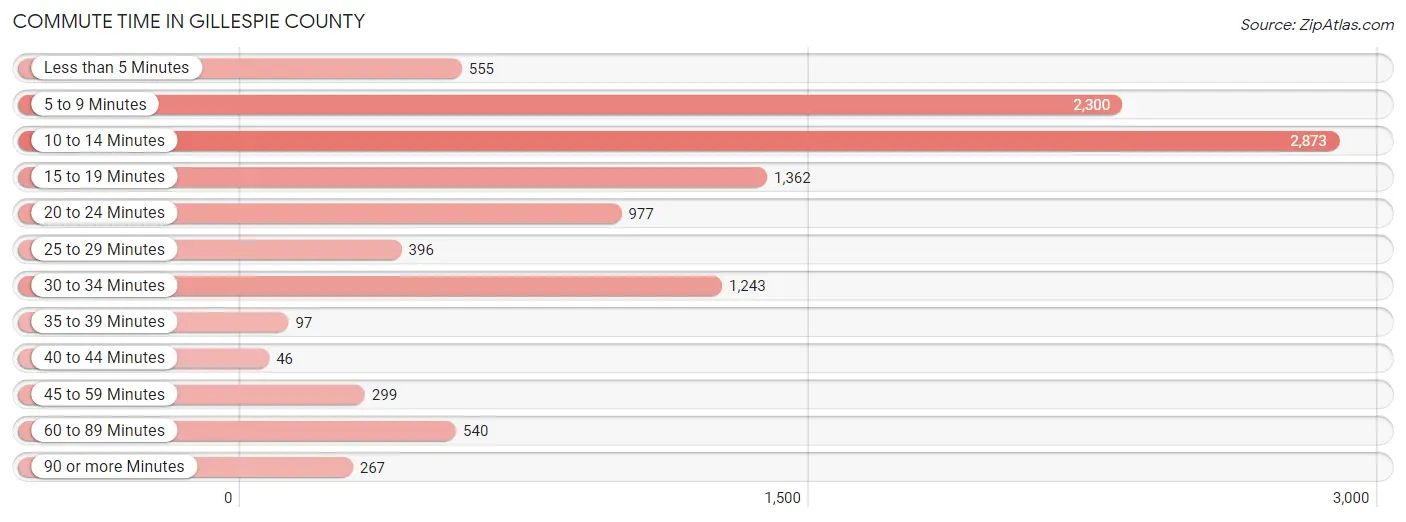
| Commute Time | # Commuters | % Commuters |
| Less than 5 Minutes | 555 | 5.1% |
| 5 to 9 Minutes | 2,300 | 21.0% |
| 10 to 14 Minutes | 2,873 | 26.2% |
| 15 to 19 Minutes | 1,362 | 12.4% |
| 20 to 24 Minutes | 977 | 8.9% |
| 25 to 29 Minutes | 396 | 3.6% |
| 30 to 34 Minutes | 1,243 | 11.4% |
| 35 to 39 Minutes | 97 | 0.9% |
| 40 to 44 Minutes | 46 | 0.4% |
| 45 to 59 Minutes | 299 | 2.7% |
| 60 to 89 Minutes | 540 | 4.9% |
| 90 or more Minutes | 267 | 2.4% |
Commute Time by Sex in Gillespie County
The most common commute times in Gillespie County are 10 to 14 minutes (1,606 commuters, 27.2%) for males and 10 to 14 minutes (1,267 commuters, 25.1%) for females.
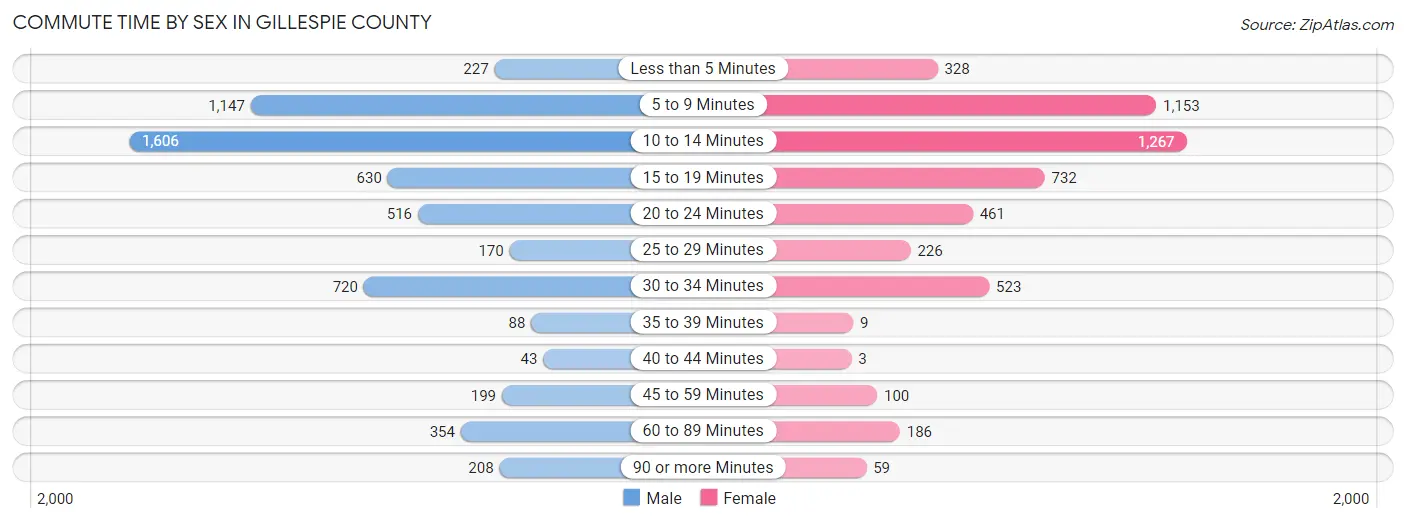
| Commute Time | Male | Female |
| Less than 5 Minutes | 227 (3.8%) | 328 (6.5%) |
| 5 to 9 Minutes | 1,147 (19.4%) | 1,153 (22.9%) |
| 10 to 14 Minutes | 1,606 (27.2%) | 1,267 (25.1%) |
| 15 to 19 Minutes | 630 (10.7%) | 732 (14.5%) |
| 20 to 24 Minutes | 516 (8.7%) | 461 (9.1%) |
| 25 to 29 Minutes | 170 (2.9%) | 226 (4.5%) |
| 30 to 34 Minutes | 720 (12.2%) | 523 (10.4%) |
| 35 to 39 Minutes | 88 (1.5%) | 9 (0.2%) |
| 40 to 44 Minutes | 43 (0.7%) | 3 (0.1%) |
| 45 to 59 Minutes | 199 (3.4%) | 100 (2.0%) |
| 60 to 89 Minutes | 354 (6.0%) | 186 (3.7%) |
| 90 or more Minutes | 208 (3.5%) | 59 (1.2%) |
Time of Departure to Work by Sex in Gillespie County
The most frequent times of departure to work in Gillespie County are 7:00 AM to 7:29 AM (1,118, 18.9%) for males and 7:30 AM to 7:59 AM (1,057, 20.9%) for females.
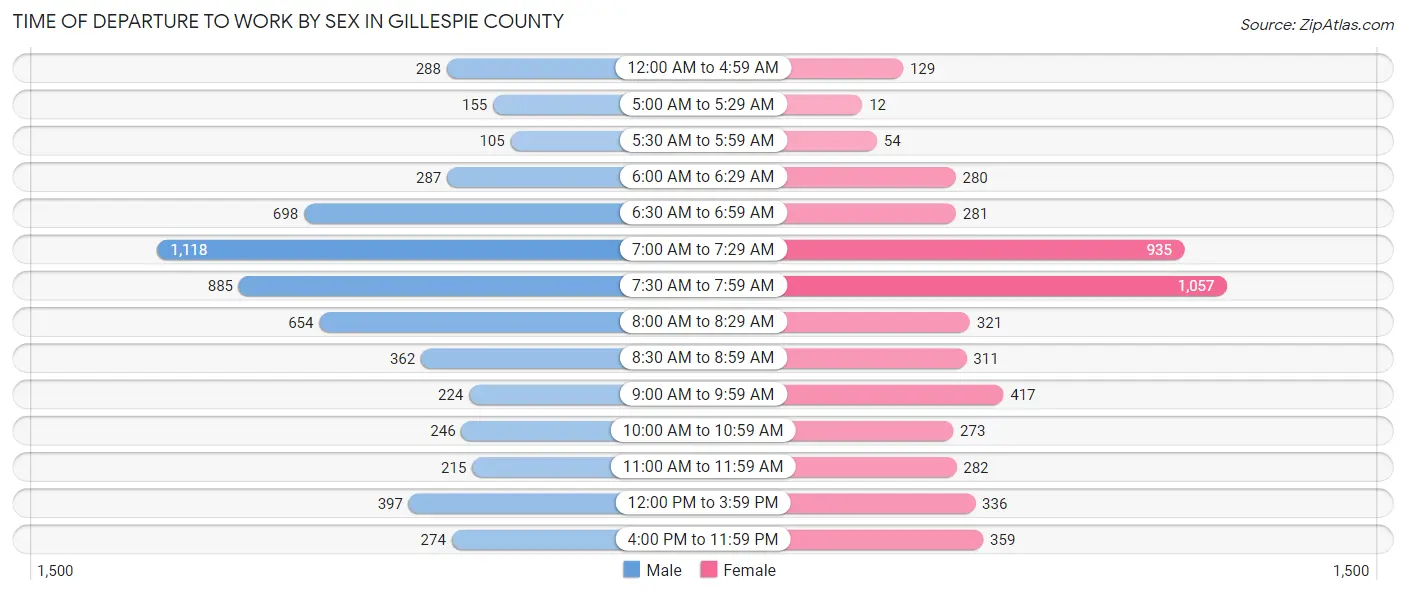
| Time of Departure | Male | Female |
| 12:00 AM to 4:59 AM | 288 (4.9%) | 129 (2.6%) |
| 5:00 AM to 5:29 AM | 155 (2.6%) | 12 (0.2%) |
| 5:30 AM to 5:59 AM | 105 (1.8%) | 54 (1.1%) |
| 6:00 AM to 6:29 AM | 287 (4.9%) | 280 (5.6%) |
| 6:30 AM to 6:59 AM | 698 (11.8%) | 281 (5.6%) |
| 7:00 AM to 7:29 AM | 1,118 (18.9%) | 935 (18.5%) |
| 7:30 AM to 7:59 AM | 885 (15.0%) | 1,057 (20.9%) |
| 8:00 AM to 8:29 AM | 654 (11.1%) | 321 (6.4%) |
| 8:30 AM to 8:59 AM | 362 (6.1%) | 311 (6.2%) |
| 9:00 AM to 9:59 AM | 224 (3.8%) | 417 (8.3%) |
| 10:00 AM to 10:59 AM | 246 (4.2%) | 273 (5.4%) |
| 11:00 AM to 11:59 AM | 215 (3.6%) | 282 (5.6%) |
| 12:00 PM to 3:59 PM | 397 (6.7%) | 336 (6.7%) |
| 4:00 PM to 11:59 PM | 274 (4.6%) | 359 (7.1%) |
| Total | 5,908 (100.0%) | 5,047 (100.0%) |
Housing Occupancy in Gillespie County
Occupancy by Ownership in Gillespie County
Of the total 11,035 dwellings in Gillespie County, owner-occupied units account for 7,705 (69.8%), while renter-occupied units make up 3,330 (30.2%).
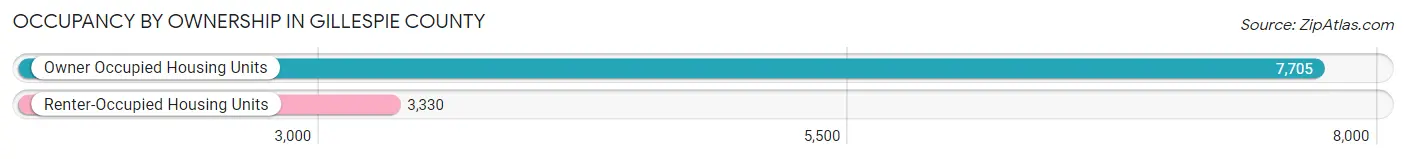
| Occupancy | # Housing Units | % Housing Units |
| Owner Occupied Housing Units | 7,705 | 69.8% |
| Renter-Occupied Housing Units | 3,330 | 30.2% |
| Total Occupied Housing Units | 11,035 | 100.0% |
Occupancy by Household Size in Gillespie County
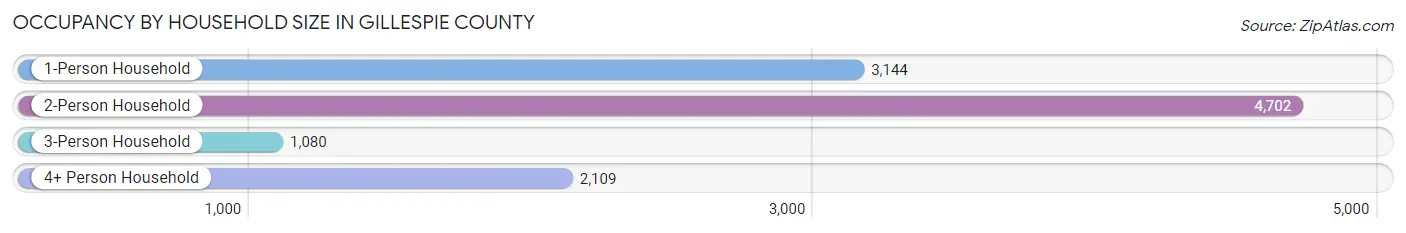
| Household Size | # Housing Units | % Housing Units |
| 1-Person Household | 3,144 | 28.5% |
| 2-Person Household | 4,702 | 42.6% |
| 3-Person Household | 1,080 | 9.8% |
| 4+ Person Household | 2,109 | 19.1% |
| Total Housing Units | 11,035 | 100.0% |
Occupancy by Ownership by Household Size in Gillespie County
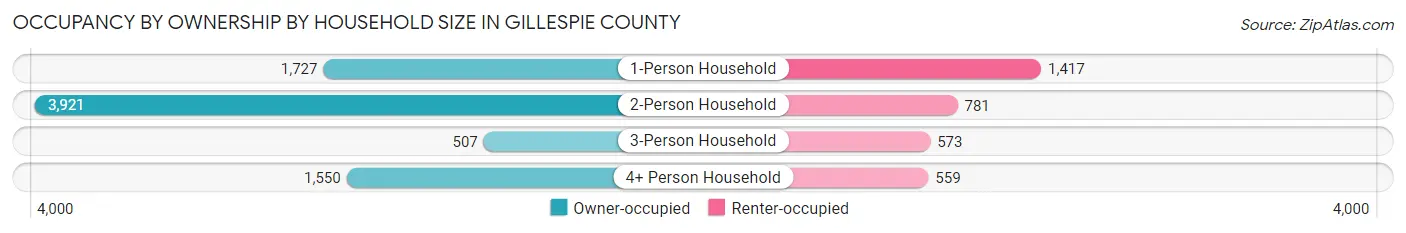
| Household Size | Owner-occupied | Renter-occupied |
| 1-Person Household | 1,727 (54.9%) | 1,417 (45.1%) |
| 2-Person Household | 3,921 (83.4%) | 781 (16.6%) |
| 3-Person Household | 507 (46.9%) | 573 (53.1%) |
| 4+ Person Household | 1,550 (73.5%) | 559 (26.5%) |
| Total Housing Units | 7,705 (69.8%) | 3,330 (30.2%) |
Occupancy by Educational Attainment in Gillespie County
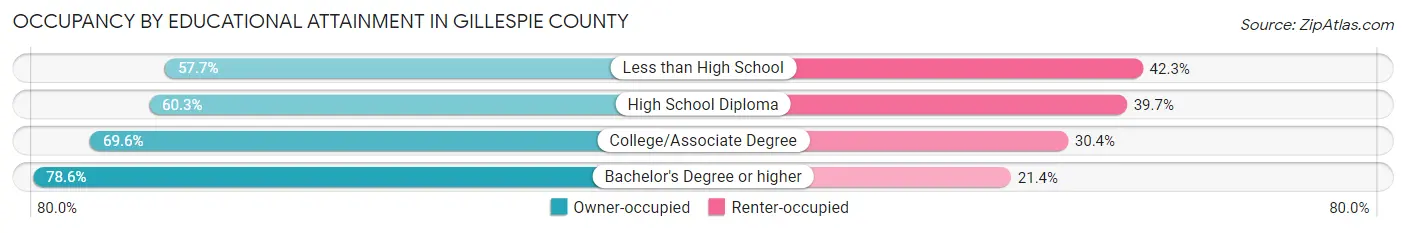
| Household Size | Owner-occupied | Renter-occupied |
| Less than High School | 523 (57.7%) | 383 (42.3%) |
| High School Diploma | 1,594 (60.3%) | 1,051 (39.7%) |
| College/Associate Degree | 2,289 (69.6%) | 1,000 (30.4%) |
| Bachelor's Degree or higher | 3,299 (78.6%) | 896 (21.4%) |
Occupancy by Age of Householder in Gillespie County
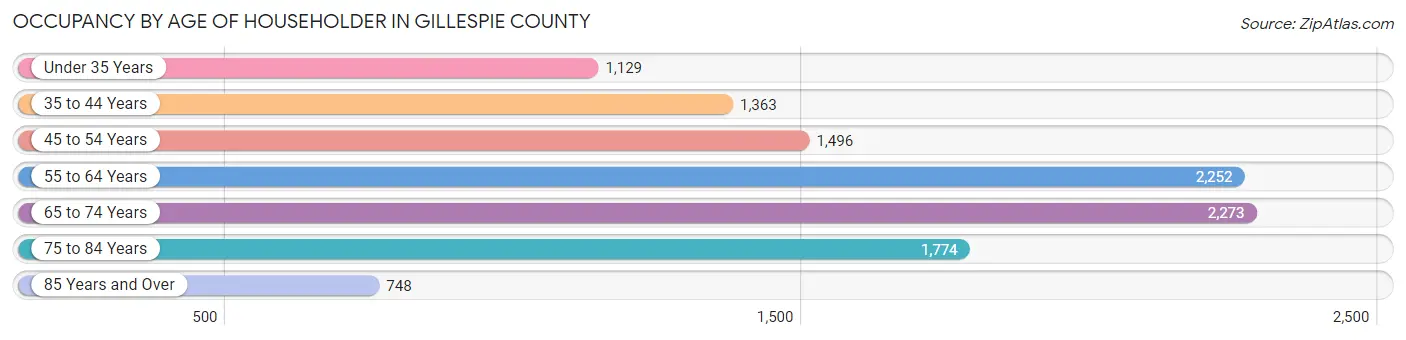
| Age Bracket | # Households | % Households |
| Under 35 Years | 1,129 | 10.2% |
| 35 to 44 Years | 1,363 | 12.3% |
| 45 to 54 Years | 1,496 | 13.6% |
| 55 to 64 Years | 2,252 | 20.4% |
| 65 to 74 Years | 2,273 | 20.6% |
| 75 to 84 Years | 1,774 | 16.1% |
| 85 Years and Over | 748 | 6.8% |
| Total | 11,035 | 100.0% |
Housing Finances in Gillespie County
Median Income by Occupancy in Gillespie County
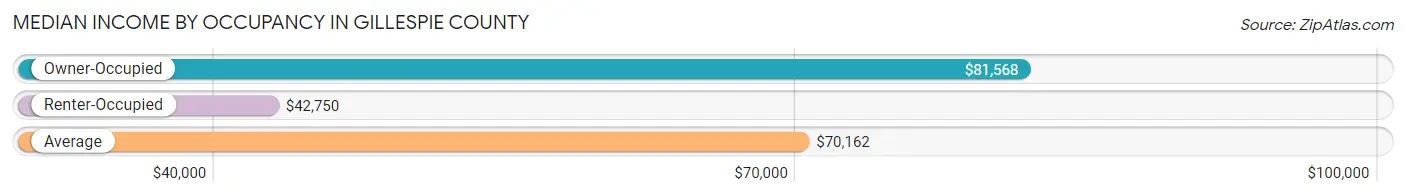
| Occupancy Type | # Households | Median Income |
| Owner-Occupied | 7,705 (69.8%) | $81,568 |
| Renter-Occupied | 3,330 (30.2%) | $42,750 |
| Average | 11,035 (100.0%) | $70,162 |
Occupancy by Householder Income Bracket in Gillespie County
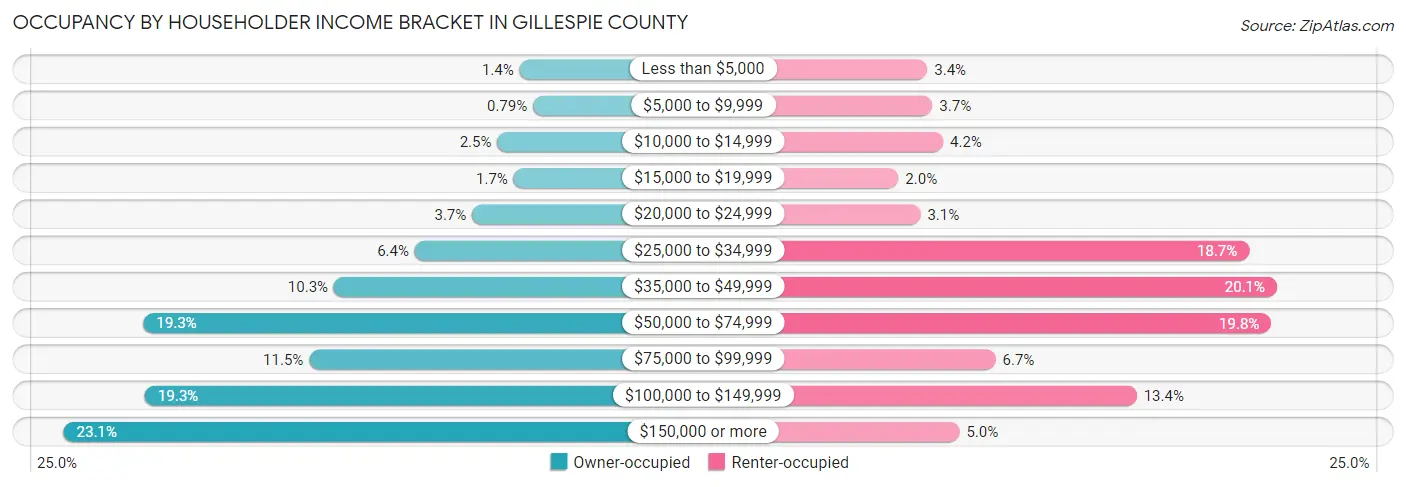
| Income Bracket | Owner-occupied | Renter-occupied |
| Less than $5,000 | 110 (1.4%) | 114 (3.4%) |
| $5,000 to $9,999 | 61 (0.8%) | 122 (3.7%) |
| $10,000 to $14,999 | 192 (2.5%) | 139 (4.2%) |
| $15,000 to $19,999 | 132 (1.7%) | 68 (2.0%) |
| $20,000 to $24,999 | 284 (3.7%) | 103 (3.1%) |
| $25,000 to $34,999 | 495 (6.4%) | 624 (18.7%) |
| $35,000 to $49,999 | 791 (10.3%) | 668 (20.1%) |
| $50,000 to $74,999 | 1,490 (19.3%) | 659 (19.8%) |
| $75,000 to $99,999 | 882 (11.5%) | 222 (6.7%) |
| $100,000 to $149,999 | 1,485 (19.3%) | 446 (13.4%) |
| $150,000 or more | 1,783 (23.1%) | 165 (5.0%) |
| Total | 7,705 (100.0%) | 3,330 (100.0%) |
Monthly Housing Cost Tiers in Gillespie County
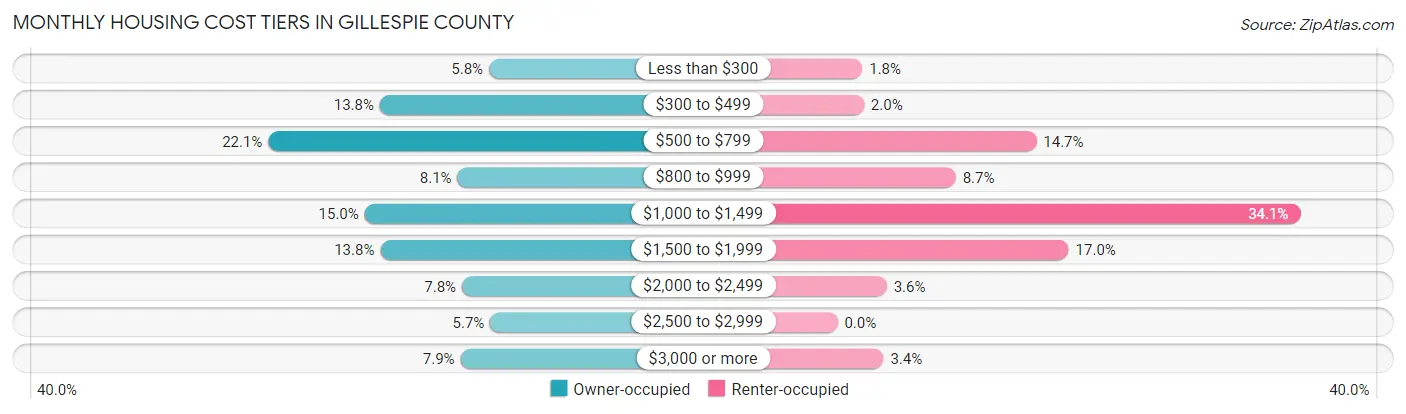
| Monthly Cost | Owner-occupied | Renter-occupied |
| Less than $300 | 447 (5.8%) | 61 (1.8%) |
| $300 to $499 | 1,066 (13.8%) | 65 (1.9%) |
| $500 to $799 | 1,700 (22.1%) | 488 (14.6%) |
| $800 to $999 | 626 (8.1%) | 290 (8.7%) |
| $1,000 to $1,499 | 1,153 (15.0%) | 1,135 (34.1%) |
| $1,500 to $1,999 | 1,064 (13.8%) | 567 (17.0%) |
| $2,000 to $2,499 | 600 (7.8%) | 121 (3.6%) |
| $2,500 to $2,999 | 440 (5.7%) | 0 (0.0%) |
| $3,000 or more | 609 (7.9%) | 113 (3.4%) |
| Total | 7,705 (100.0%) | 3,330 (100.0%) |
Physical Housing Characteristics in Gillespie County
Housing Structures in Gillespie County
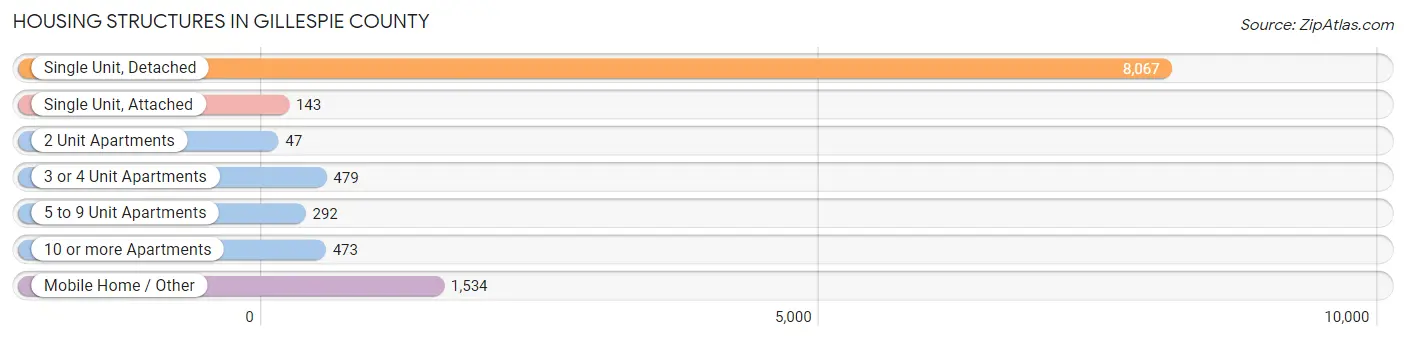
| Structure Type | # Housing Units | % Housing Units |
| Single Unit, Detached | 8,067 | 73.1% |
| Single Unit, Attached | 143 | 1.3% |
| 2 Unit Apartments | 47 | 0.4% |
| 3 or 4 Unit Apartments | 479 | 4.3% |
| 5 to 9 Unit Apartments | 292 | 2.6% |
| 10 or more Apartments | 473 | 4.3% |
| Mobile Home / Other | 1,534 | 13.9% |
| Total | 11,035 | 100.0% |
Housing Structures by Occupancy in Gillespie County
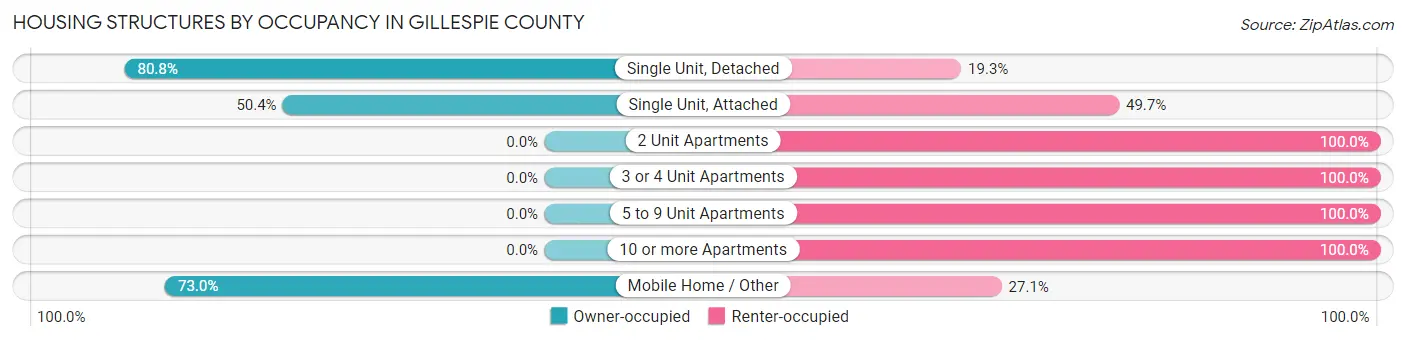
| Structure Type | Owner-occupied | Renter-occupied |
| Single Unit, Detached | 6,514 (80.7%) | 1,553 (19.3%) |
| Single Unit, Attached | 72 (50.3%) | 71 (49.6%) |
| 2 Unit Apartments | 0 (0.0%) | 47 (100.0%) |
| 3 or 4 Unit Apartments | 0 (0.0%) | 479 (100.0%) |
| 5 to 9 Unit Apartments | 0 (0.0%) | 292 (100.0%) |
| 10 or more Apartments | 0 (0.0%) | 473 (100.0%) |
| Mobile Home / Other | 1,119 (73.0%) | 415 (27.1%) |
| Total | 7,705 (69.8%) | 3,330 (30.2%) |
Housing Structures by Number of Rooms in Gillespie County
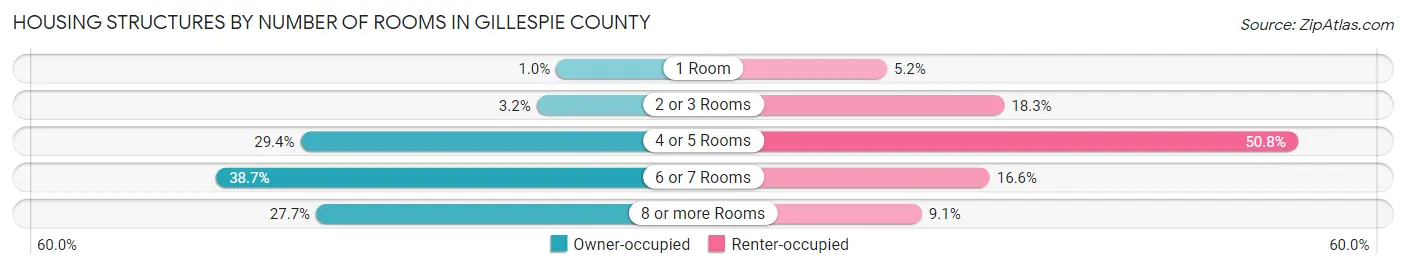
| Number of Rooms | Owner-occupied | Renter-occupied |
| 1 Room | 78 (1.0%) | 174 (5.2%) |
| 2 or 3 Rooms | 246 (3.2%) | 608 (18.3%) |
| 4 or 5 Rooms | 2,265 (29.4%) | 1,691 (50.8%) |
| 6 or 7 Rooms | 2,984 (38.7%) | 554 (16.6%) |
| 8 or more Rooms | 2,132 (27.7%) | 303 (9.1%) |
| Total | 7,705 (100.0%) | 3,330 (100.0%) |
Housing Structure by Heating Type in Gillespie County
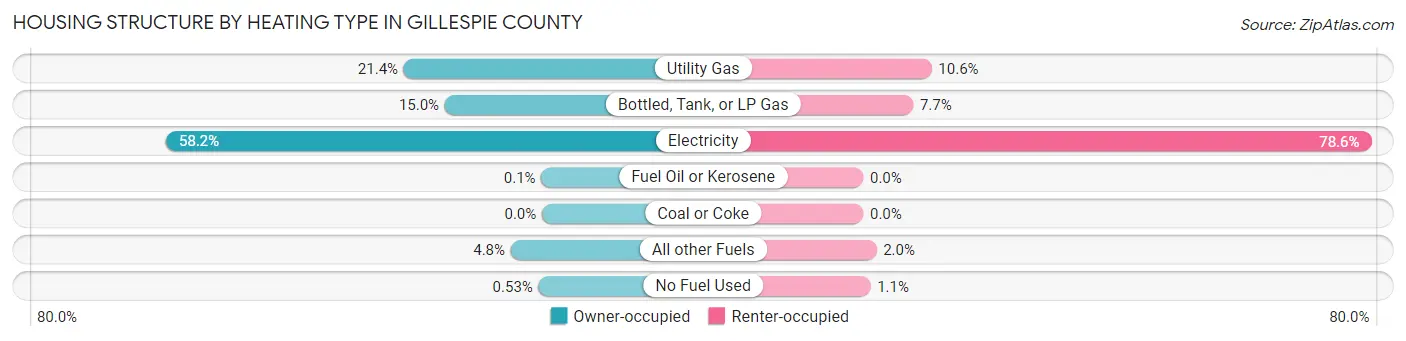
| Heating Type | Owner-occupied | Renter-occupied |
| Utility Gas | 1,646 (21.4%) | 352 (10.6%) |
| Bottled, Tank, or LP Gas | 1,157 (15.0%) | 257 (7.7%) |
| Electricity | 4,481 (58.2%) | 2,616 (78.6%) |
| Fuel Oil or Kerosene | 8 (0.1%) | 0 (0.0%) |
| Coal or Coke | 0 (0.0%) | 0 (0.0%) |
| All other Fuels | 372 (4.8%) | 68 (2.0%) |
| No Fuel Used | 41 (0.5%) | 37 (1.1%) |
| Total | 7,705 (100.0%) | 3,330 (100.0%) |
Household Vehicle Usage in Gillespie County
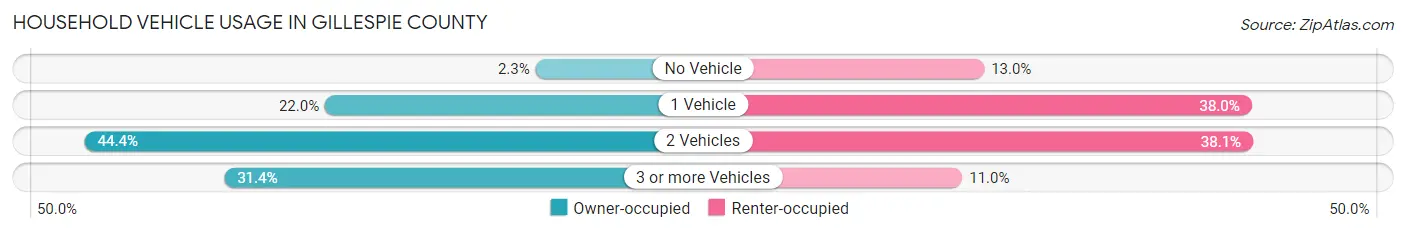
| Vehicles per Household | Owner-occupied | Renter-occupied |
| No Vehicle | 177 (2.3%) | 433 (13.0%) |
| 1 Vehicle | 1,692 (22.0%) | 1,264 (38.0%) |
| 2 Vehicles | 3,420 (44.4%) | 1,268 (38.1%) |
| 3 or more Vehicles | 2,416 (31.4%) | 365 (11.0%) |
| Total | 7,705 (100.0%) | 3,330 (100.0%) |
Real Estate & Mortgages in Gillespie County
Real Estate and Mortgage Overview in Gillespie County
| Characteristic | Without Mortgage | With Mortgage |
| Housing Units | 4,467 | 3,238 |
| Median Property Value | $348,900 | $444,100 |
| Median Household Income | $65,820 | $1,038 |
| Monthly Housing Costs | $663 | $567 |
| Real Estate Taxes | $3,525 | $69 |
Property Value by Mortgage Status in Gillespie County
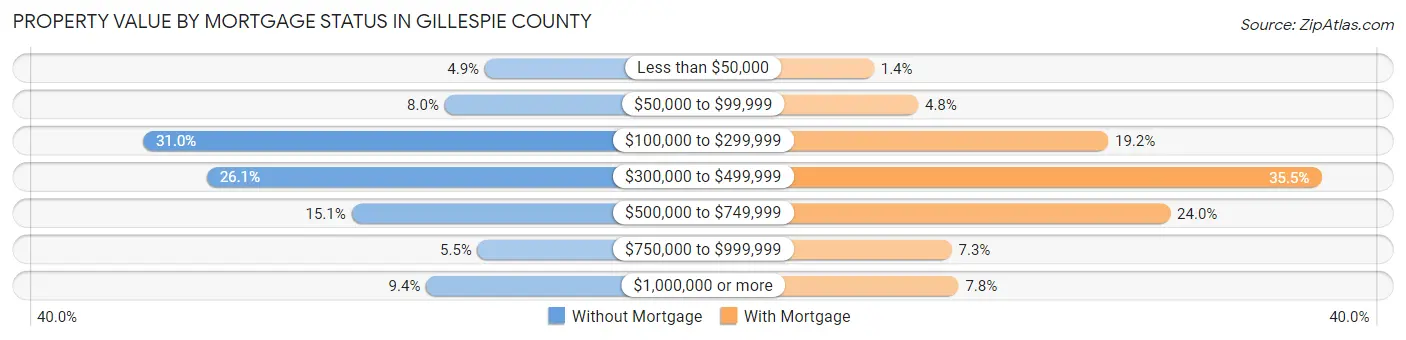
| Property Value | Without Mortgage | With Mortgage |
| Less than $50,000 | 220 (4.9%) | 45 (1.4%) |
| $50,000 to $99,999 | 357 (8.0%) | 154 (4.8%) |
| $100,000 to $299,999 | 1,384 (31.0%) | 623 (19.2%) |
| $300,000 to $499,999 | 1,167 (26.1%) | 1,149 (35.5%) |
| $500,000 to $749,999 | 674 (15.1%) | 776 (24.0%) |
| $750,000 to $999,999 | 245 (5.5%) | 237 (7.3%) |
| $1,000,000 or more | 420 (9.4%) | 254 (7.8%) |
| Total | 4,467 (100.0%) | 3,238 (100.0%) |
Household Income by Mortgage Status in Gillespie County
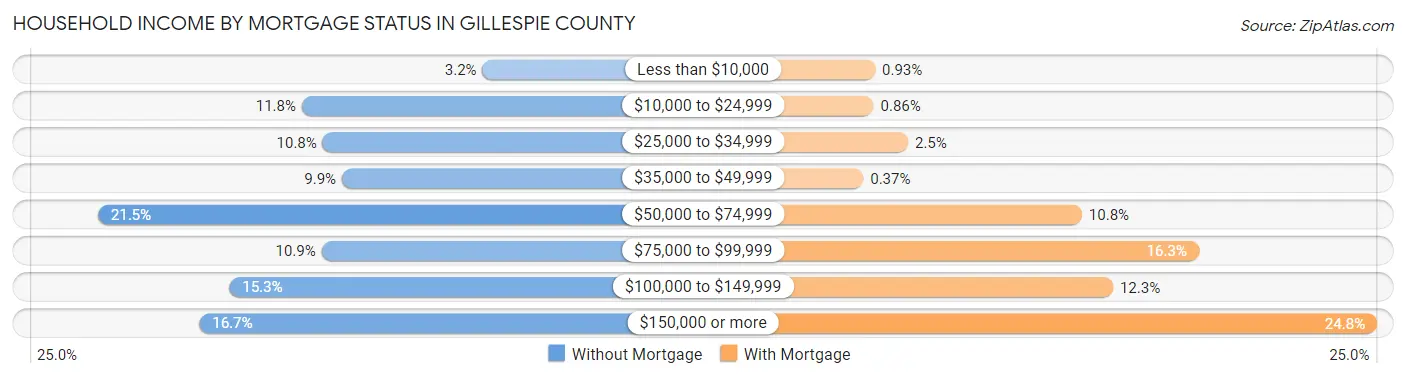
| Household Income | Without Mortgage | With Mortgage |
| Less than $10,000 | 143 (3.2%) | 30 (0.9%) |
| $10,000 to $24,999 | 527 (11.8%) | 28 (0.9%) |
| $25,000 to $34,999 | 483 (10.8%) | 81 (2.5%) |
| $35,000 to $49,999 | 442 (9.9%) | 12 (0.4%) |
| $50,000 to $74,999 | 961 (21.5%) | 349 (10.8%) |
| $75,000 to $99,999 | 485 (10.9%) | 529 (16.3%) |
| $100,000 to $149,999 | 681 (15.2%) | 397 (12.3%) |
| $150,000 or more | 745 (16.7%) | 804 (24.8%) |
| Total | 4,467 (100.0%) | 3,238 (100.0%) |
Property Value to Household Income Ratio in Gillespie County
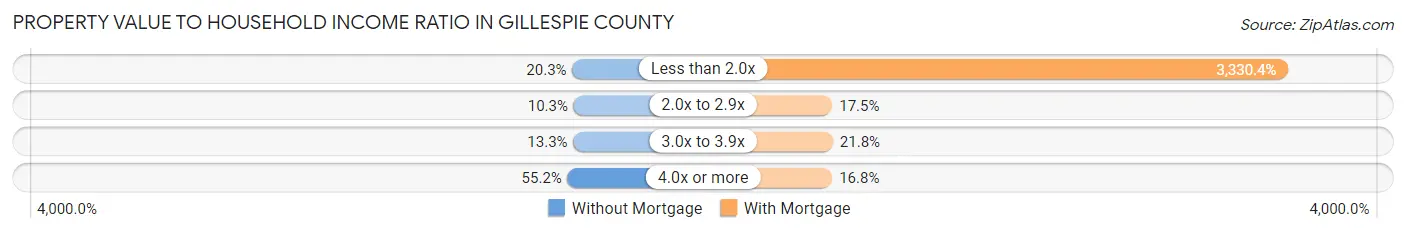
| Value-to-Income Ratio | Without Mortgage | With Mortgage |
| Less than 2.0x | 907 (20.3%) | 107,838 (3,330.4%) |
| 2.0x to 2.9x | 462 (10.3%) | 566 (17.5%) |
| 3.0x to 3.9x | 594 (13.3%) | 705 (21.8%) |
| 4.0x or more | 2,465 (55.2%) | 544 (16.8%) |
| Total | 4,467 (100.0%) | 3,238 (100.0%) |
Real Estate Taxes by Mortgage Status in Gillespie County
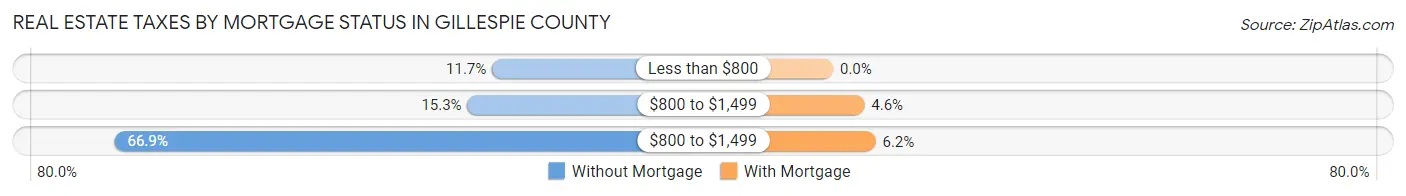
| Property Taxes | Without Mortgage | With Mortgage |
| Less than $800 | 522 (11.7%) | 0 (0.0%) |
| $800 to $1,499 | 683 (15.3%) | 148 (4.6%) |
| $800 to $1,499 | 2,986 (66.8%) | 201 (6.2%) |
| Total | 4,467 (100.0%) | 3,238 (100.0%) |
Health & Disability in Gillespie County
Health Insurance Coverage by Age in Gillespie County
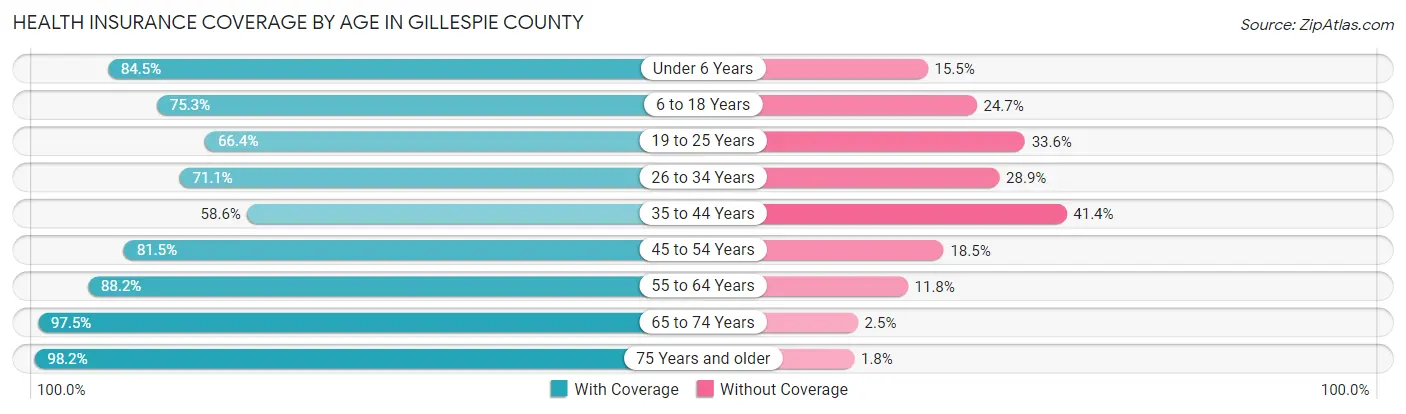
| Age Bracket | With Coverage | Without Coverage |
| Under 6 Years | 1,355 (84.5%) | 249 (15.5%) |
| 6 to 18 Years | 3,043 (75.3%) | 996 (24.7%) |
| 19 to 25 Years | 1,233 (66.4%) | 625 (33.6%) |
| 26 to 34 Years | 1,433 (71.1%) | 582 (28.9%) |
| 35 to 44 Years | 1,723 (58.6%) | 1,218 (41.4%) |
| 45 to 54 Years | 2,005 (81.5%) | 455 (18.5%) |
| 55 to 64 Years | 3,620 (88.2%) | 485 (11.8%) |
| 65 to 74 Years | 4,032 (97.5%) | 103 (2.5%) |
| 75 Years and older | 3,408 (98.2%) | 63 (1.8%) |
| Total | 21,852 (82.1%) | 4,776 (17.9%) |
Health Insurance Coverage by Citizenship Status in Gillespie County
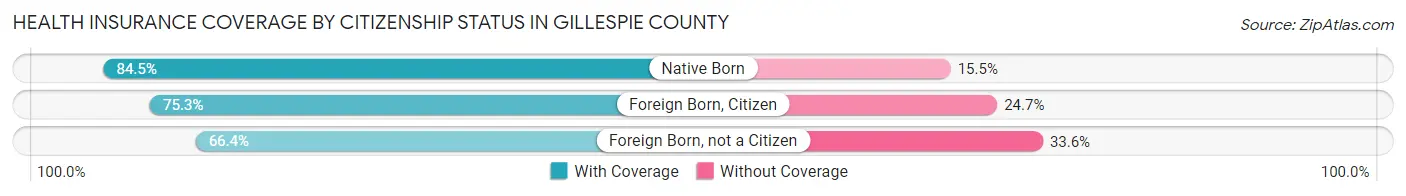
| Citizenship Status | With Coverage | Without Coverage |
| Native Born | 1,355 (84.5%) | 249 (15.5%) |
| Foreign Born, Citizen | 3,043 (75.3%) | 996 (24.7%) |
| Foreign Born, not a Citizen | 1,233 (66.4%) | 625 (33.6%) |
Health Insurance Coverage by Household Income in Gillespie County
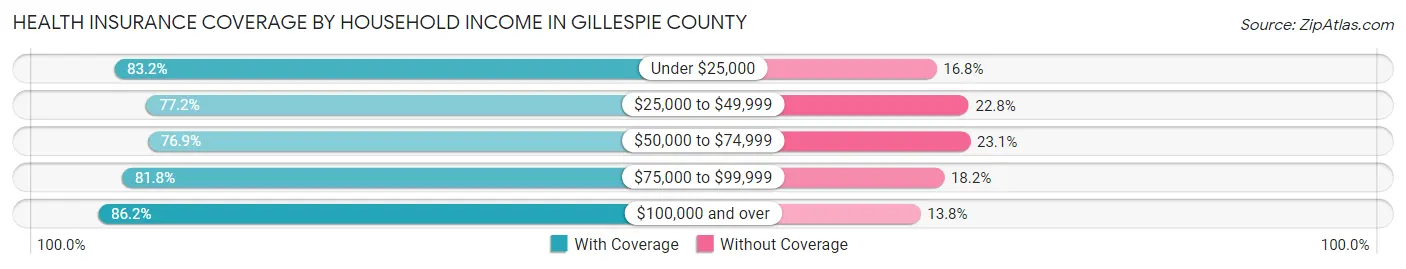
| Household Income | With Coverage | Without Coverage |
| Under $25,000 | 1,689 (83.2%) | 340 (16.8%) |
| $25,000 to $49,999 | 3,854 (77.2%) | 1,139 (22.8%) |
| $50,000 to $74,999 | 3,867 (76.9%) | 1,161 (23.1%) |
| $75,000 to $99,999 | 2,246 (81.8%) | 500 (18.2%) |
| $100,000 and over | 10,192 (86.2%) | 1,629 (13.8%) |
Public vs Private Health Insurance Coverage by Age in Gillespie County
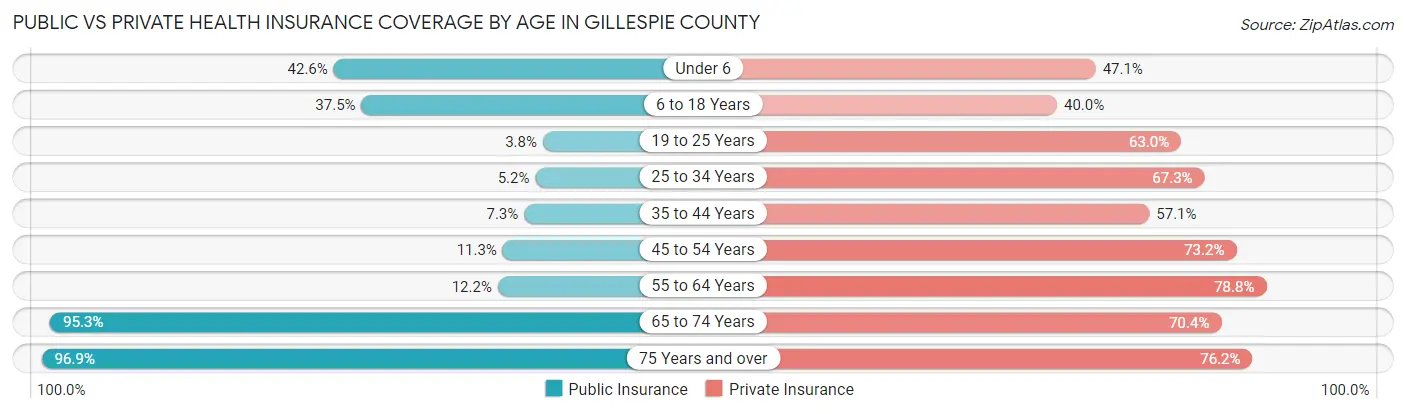
| Age Bracket | Public Insurance | Private Insurance |
| Under 6 | 684 (42.6%) | 756 (47.1%) |
| 6 to 18 Years | 1,514 (37.5%) | 1,614 (40.0%) |
| 19 to 25 Years | 71 (3.8%) | 1,170 (63.0%) |
| 25 to 34 Years | 105 (5.2%) | 1,356 (67.3%) |
| 35 to 44 Years | 214 (7.3%) | 1,679 (57.1%) |
| 45 to 54 Years | 277 (11.3%) | 1,801 (73.2%) |
| 55 to 64 Years | 500 (12.2%) | 3,234 (78.8%) |
| 65 to 74 Years | 3,939 (95.3%) | 2,912 (70.4%) |
| 75 Years and over | 3,362 (96.9%) | 2,645 (76.2%) |
| Total | 10,666 (40.1%) | 17,167 (64.5%) |
Disability Status by Sex by Age in Gillespie County
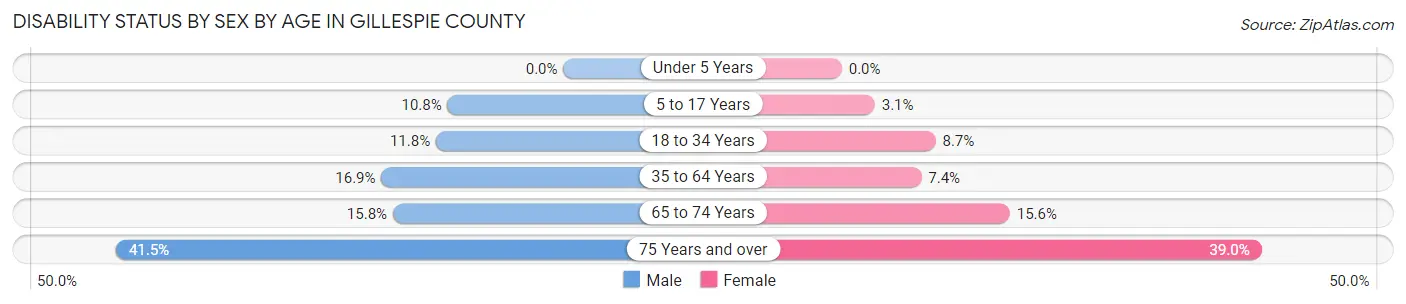
| Age Bracket | Male | Female |
| Under 5 Years | 0 (0.0%) | 0 (0.0%) |
| 5 to 17 Years | 233 (10.7%) | 59 (3.1%) |
| 18 to 34 Years | 252 (11.8%) | 176 (8.7%) |
| 35 to 64 Years | 782 (16.9%) | 360 (7.4%) |
| 65 to 74 Years | 305 (15.8%) | 344 (15.6%) |
| 75 Years and over | 644 (41.5%) | 748 (39.0%) |
Disability Class by Sex by Age in Gillespie County
Disability Class: Hearing Difficulty
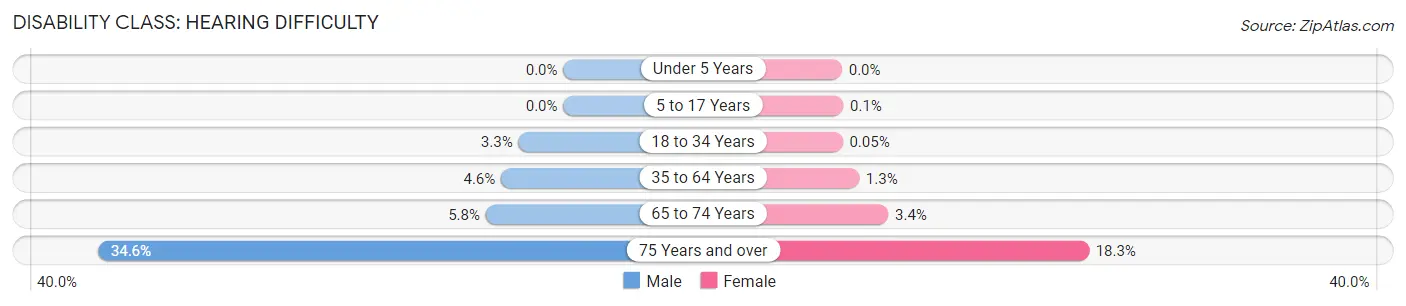
| Age Bracket | Male | Female |
| Under 5 Years | 0 (0.0%) | 0 (0.0%) |
| 5 to 17 Years | 0 (0.0%) | 2 (0.1%) |
| 18 to 34 Years | 71 (3.3%) | 1 (0.1%) |
| 35 to 64 Years | 214 (4.6%) | 62 (1.3%) |
| 65 to 74 Years | 111 (5.8%) | 76 (3.4%) |
| 75 Years and over | 536 (34.6%) | 352 (18.3%) |
Disability Class: Vision Difficulty
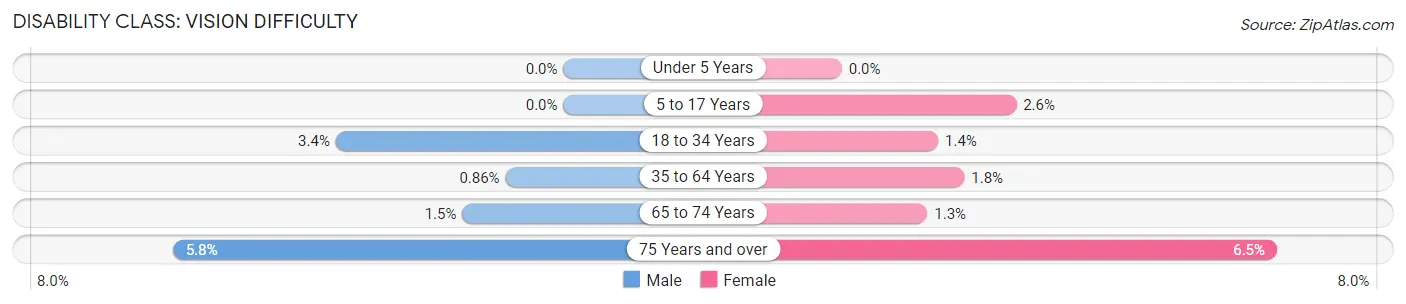
| Age Bracket | Male | Female |
| Under 5 Years | 0 (0.0%) | 0 (0.0%) |
| 5 to 17 Years | 0 (0.0%) | 50 (2.6%) |
| 18 to 34 Years | 72 (3.4%) | 29 (1.4%) |
| 35 to 64 Years | 40 (0.9%) | 89 (1.8%) |
| 65 to 74 Years | 29 (1.5%) | 28 (1.3%) |
| 75 Years and over | 90 (5.8%) | 124 (6.5%) |
Disability Class: Cognitive Difficulty
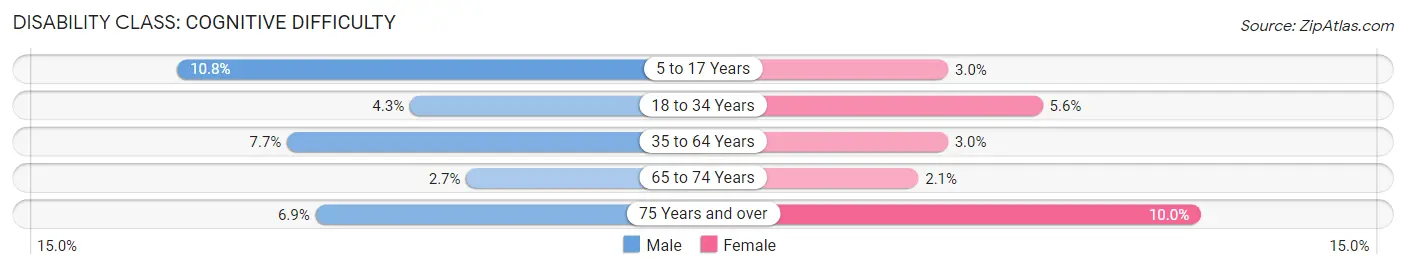
| Age Bracket | Male | Female |
| 5 to 17 Years | 233 (10.7%) | 57 (3.0%) |
| 18 to 34 Years | 91 (4.3%) | 113 (5.6%) |
| 35 to 64 Years | 356 (7.7%) | 144 (2.9%) |
| 65 to 74 Years | 52 (2.7%) | 47 (2.1%) |
| 75 Years and over | 107 (6.9%) | 192 (10.0%) |
Disability Class: Ambulatory Difficulty
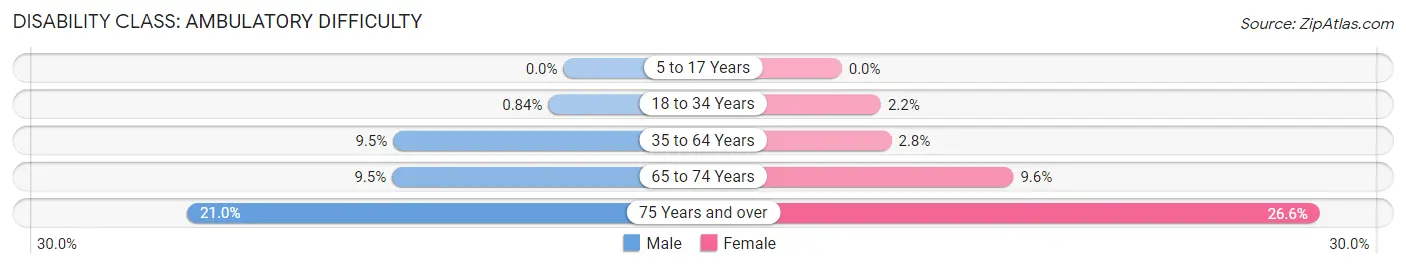
| Age Bracket | Male | Female |
| 5 to 17 Years | 0 (0.0%) | 0 (0.0%) |
| 18 to 34 Years | 18 (0.8%) | 44 (2.2%) |
| 35 to 64 Years | 439 (9.5%) | 135 (2.8%) |
| 65 to 74 Years | 184 (9.5%) | 211 (9.6%) |
| 75 Years and over | 325 (20.9%) | 511 (26.6%) |
Disability Class: Self-Care Difficulty
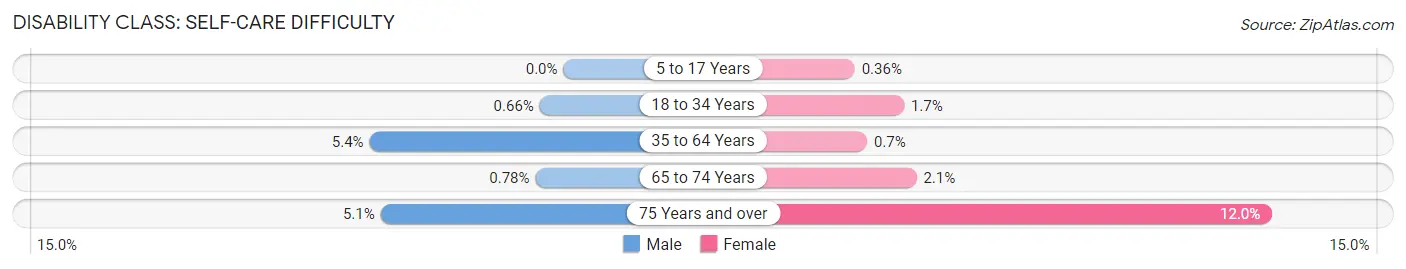
| Age Bracket | Male | Female |
| 5 to 17 Years | 0 (0.0%) | 7 (0.4%) |
| 18 to 34 Years | 14 (0.7%) | 35 (1.7%) |
| 35 to 64 Years | 250 (5.4%) | 34 (0.7%) |
| 65 to 74 Years | 15 (0.8%) | 46 (2.1%) |
| 75 Years and over | 79 (5.1%) | 230 (12.0%) |
Technology Access in Gillespie County
Computing Device Access in Gillespie County
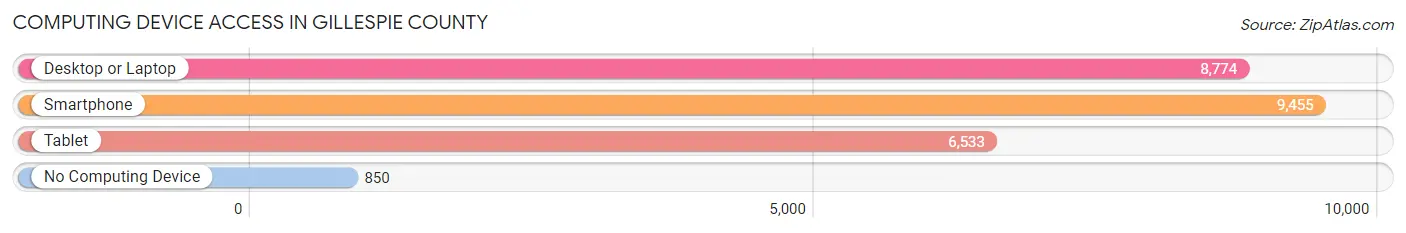
| Device Type | # Households | % Households |
| Desktop or Laptop | 8,774 | 79.5% |
| Smartphone | 9,455 | 85.7% |
| Tablet | 6,533 | 59.2% |
| No Computing Device | 850 | 7.7% |
| Total | 11,035 | 100.0% |
Internet Access in Gillespie County
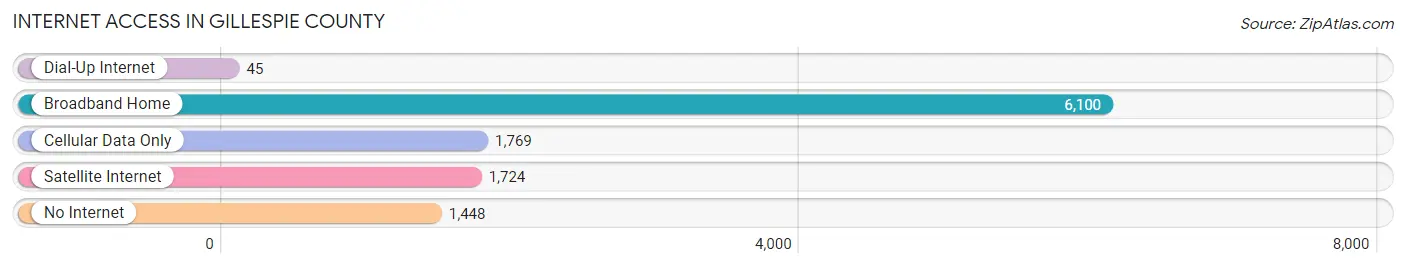
| Internet Type | # Households | % Households |
| Dial-Up Internet | 45 | 0.4% |
| Broadband Home | 6,100 | 55.3% |
| Cellular Data Only | 1,769 | 16.0% |
| Satellite Internet | 1,724 | 15.6% |
| No Internet | 1,448 | 13.1% |
| Total | 11,035 | 100.0% |
Gillespie County Summary
Gillespie County is located in the heart of the Texas Hill Country, in the south-central part of the state. It is bordered by Blanco, Kendall, Kerr, and Llano counties. The county seat is Fredericksburg, which is also the largest city in the county. Gillespie County was established in 1848 and named after Robert Addison Gillespie, a soldier in the Texas Revolution.
Geography
Gillespie County covers an area of 1,062 square miles, making it the fourth-largest county in Texas. The terrain is mostly hilly, with elevations ranging from 1,000 to 2,000 feet. The Pedernales River and its tributaries, including the Llano and San Saba rivers, flow through the county. The county is home to several state parks, including Enchanted Rock State Natural Area, Pedernales Falls State Park, and Lyndon B. Johnson State Park and Historic Site.
Demographics
As of the 2010 census, Gillespie County had a population of 24,837. The racial makeup of the county was 87.3% White, 0.7% African American, 0.7% Native American, 0.4% Asian, 0.1% Pacific Islander, 9.7% from other races, and 1.2% from two or more races. Hispanic or Latino of any race were 24.3% of the population.
Economy
Gillespie County has a diverse economy, with a mix of agriculture, manufacturing, and tourism. Agriculture is the largest sector, with cattle, sheep, goats, and hay being the main products. Manufacturing is also important, with companies such as H-E-B, Texas Industries, and Schlumberger having operations in the county. Tourism is also a major contributor to the economy, with Fredericksburg being a popular destination for visitors.
History
Gillespie County was established in 1848 and named after Robert Addison Gillespie, a soldier in the Texas Revolution. The county was originally part of Bexar County, but was later divided into its own county. The first settlers in the area were German immigrants, who began arriving in the 1840s. The town of Fredericksburg was founded in 1846 and quickly became the county seat.
In the late 19th century, Gillespie County was a major producer of wool and mohair. The county also had a thriving agricultural industry, with cotton, corn, and wheat being the main crops. The county was also home to several ranches, including the 6666 Ranch, which is still in operation today.
In the early 20th century, Gillespie County began to diversify its economy. Manufacturing and tourism became increasingly important, and the county began to attract more visitors. Today, Gillespie County is a popular tourist destination, with attractions such as the National Museum of the Pacific War, the Pioneer Museum Complex, and the Enchanted Rock State Natural Area.
Common Questions
What is Per Capita Income in Gillespie County?
Per Capita income in Gillespie County is $42,067.
What is the Median Family Income in Gillespie County?
Median Family Income in Gillespie County is $93,241.
What is the Median Household income in Gillespie County?
Median Household Income in Gillespie County is $70,162.
What is Income or Wage Gap in Gillespie County?
Income or Wage Gap in Gillespie County is 31.3%.
Women in Gillespie County earn 68.7 cents for every dollar earned by a man.
What is Family Income Deficit in Gillespie County?
Family Income Deficit in Gillespie County is $8,060.
Families that are below poverty line in Gillespie County earn $8,060 less on average than the poverty threshold level.
What is Inequality or Gini Index in Gillespie County?
Inequality or Gini Index in Gillespie County is 0.47.
What is the Total Population of Gillespie County?
Total Population of Gillespie County is 26,953.
What is the Total Male Population of Gillespie County?
Total Male Population of Gillespie County is 13,224.
What is the Total Female Population of Gillespie County?
Total Female Population of Gillespie County is 13,729.
What is the Ratio of Males per 100 Females in Gillespie County?
There are 96.32 Males per 100 Females in Gillespie County.
What is the Ratio of Females per 100 Males in Gillespie County?
There are 103.82 Females per 100 Males in Gillespie County.
What is the Median Population Age in Gillespie County?
Median Population Age in Gillespie County is 49.7 Years.
What is the Average Family Size in Gillespie County
Average Family Size in Gillespie County is 3.0 People.
What is the Average Household Size in Gillespie County
Average Household Size in Gillespie County is 2.4 People.
How Large is the Labor Force in Gillespie County?
There are 12,840 People in the Labor Forcein in Gillespie County.
What is the Percentage of People in the Labor Force in Gillespie County?
57.5% of People are in the Labor Force in Gillespie County.
What is the Unemployment Rate in Gillespie County?
Unemployment Rate in Gillespie County is 3.5%.