Garza County, TX Map & Demographics
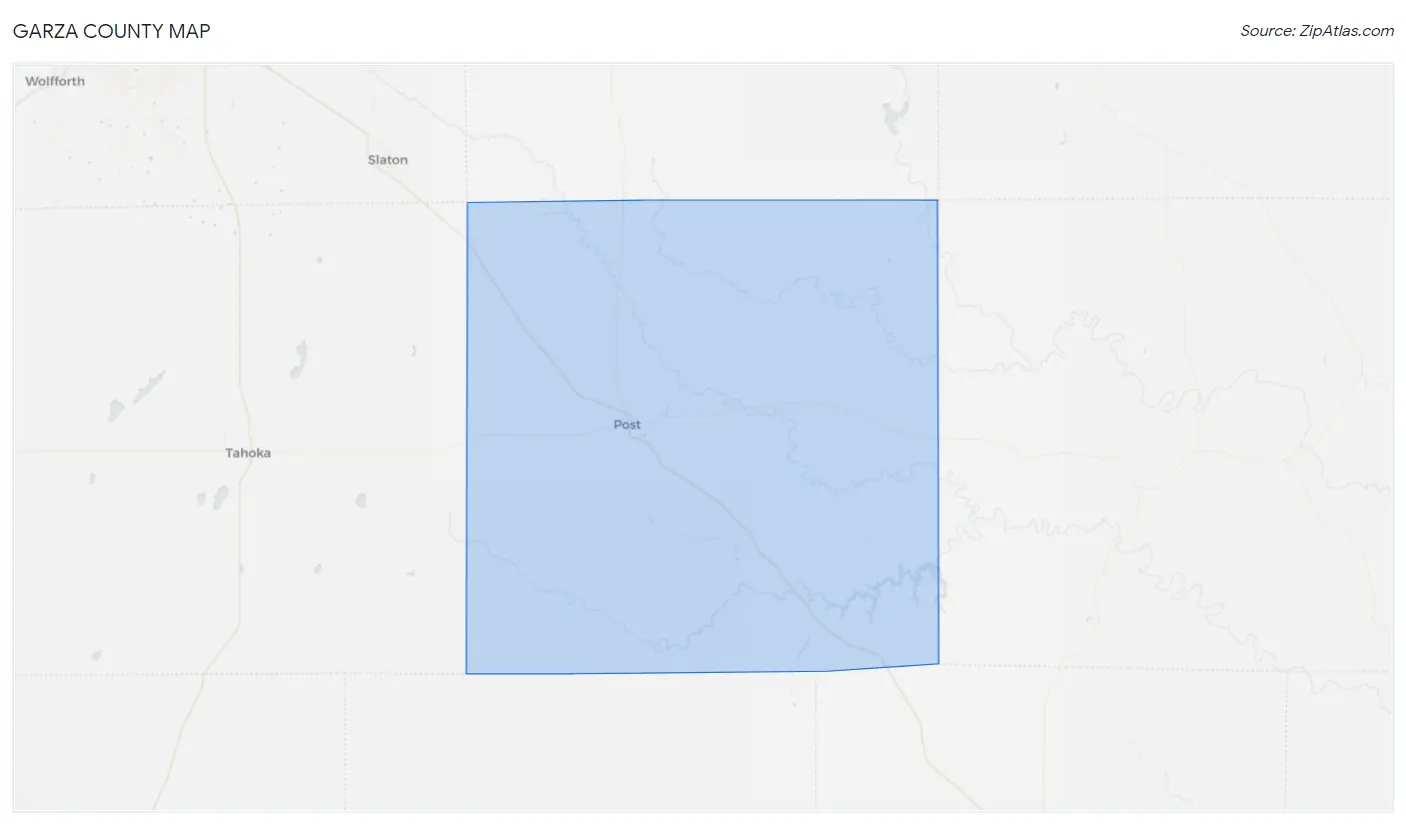
Garza County Map
Garza County Overview
$22,188
PER CAPITA INCOME
$82,386
AVG FAMILY INCOME
$56,215
AVG HOUSEHOLD INCOME
27.6%
WAGE / INCOME GAP [ % ]
72.4¢/ $1
WAGE / INCOME GAP [ $ ]
$6,704
FAMILY INCOME DEFICIT
0.40
INEQUALITY / GINI INDEX
5,735
TOTAL POPULATION
3,485
MALE POPULATION
2,250
FEMALE POPULATION
154.89
MALES / 100 FEMALES
64.56
FEMALES / 100 MALES
41.8
MEDIAN AGE
3.1
AVG FAMILY SIZE
2.6
AVG HOUSEHOLD SIZE
1,843
LABOR FORCE [ PEOPLE ]
37.1%
PERCENT IN LABOR FORCE
9.9%
UNEMPLOYMENT RATE
Garza County Area Codes
Income in Garza County
Income Overview in Garza County
Per Capita Income in Garza County is $22,188, while median incomes of families and households are $82,386 and $56,215 respectively.
| Characteristic | Number | Measure |
| Per Capita Income | 5,735 | $22,188 |
| Median Family Income | 1,161 | $82,386 |
| Mean Family Income | 1,161 | $86,788 |
| Median Household Income | 1,677 | $56,215 |
| Mean Household Income | 1,677 | $72,497 |
| Income Deficit | 1,161 | $6,704 |
| Wage / Income Gap (%) | 5,735 | 27.64% |
| Wage / Income Gap ($) | 5,735 | 72.36¢ per $1 |
| Gini / Inequality Index | 5,735 | 0.40 |
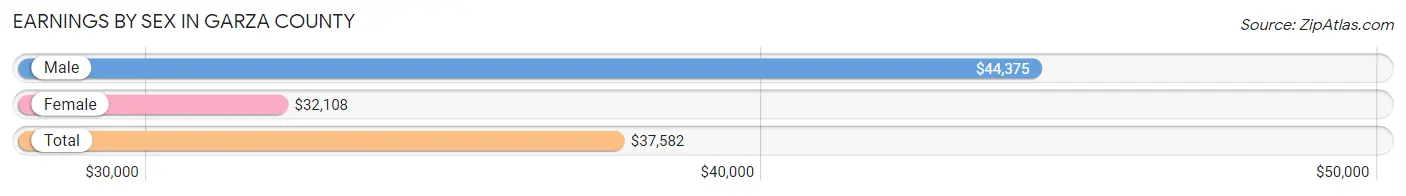
Earnings by Sex in Garza County
Average Earnings in Garza County are $37,582, $44,375 for men and $32,108 for women, a difference of 27.6%.
| Sex | Number | Average Earnings |
| Male | 1,168 (59.3%) | $44,375 |
| Female | 802 (40.7%) | $32,108 |
| Total | 1,970 (100.0%) | $37,582 |
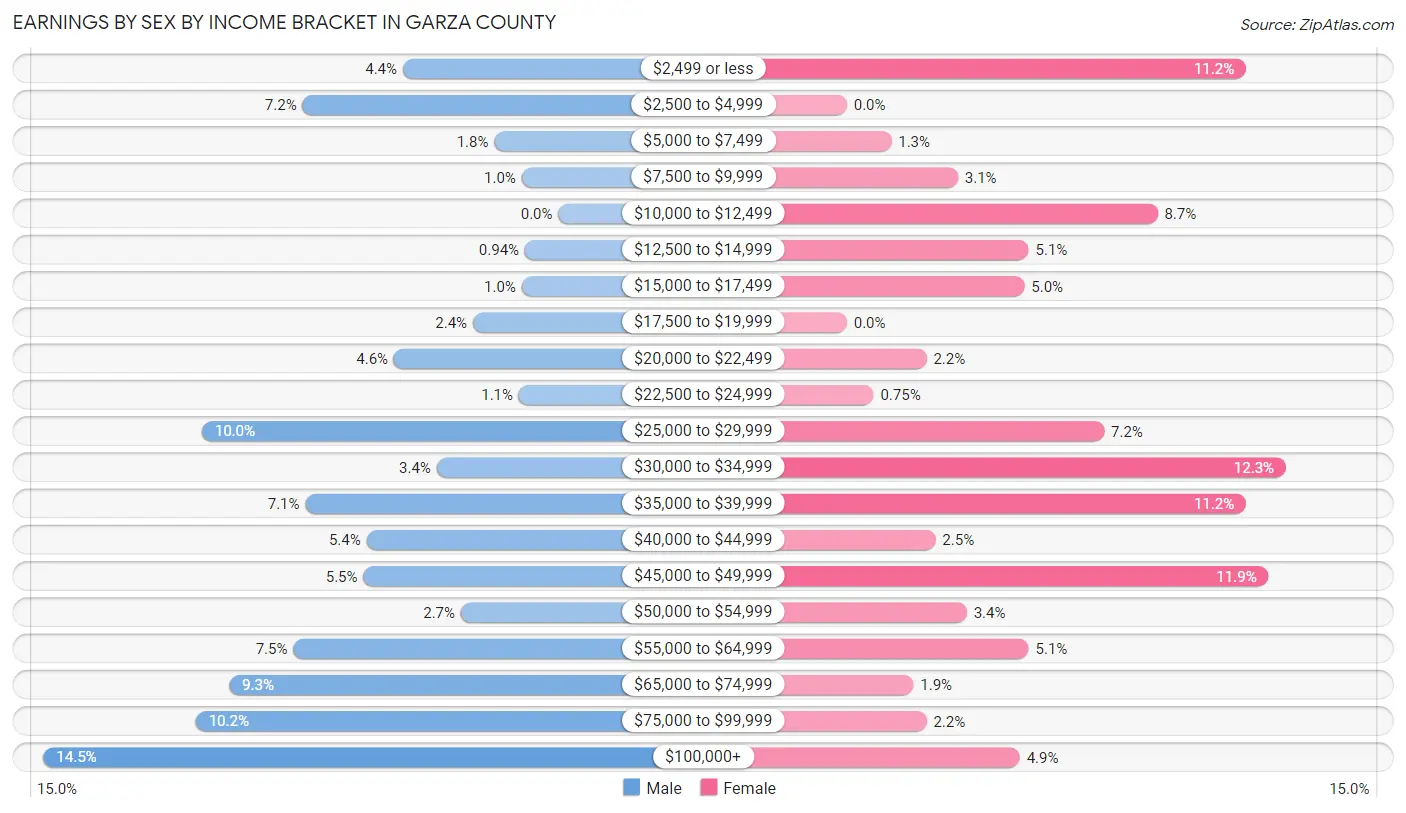
Earnings by Sex by Income Bracket in Garza County
The most common earnings brackets in Garza County are $100,000+ for men (169 | 14.5%) and $30,000 to $34,999 for women (99 | 12.3%).
| Income | Male | Female |
| $2,499 or less | 51 (4.4%) | 90 (11.2%) |
| $2,500 to $4,999 | 84 (7.2%) | 0 (0.0%) |
| $5,000 to $7,499 | 21 (1.8%) | 10 (1.3%) |
| $7,500 to $9,999 | 12 (1.0%) | 25 (3.1%) |
| $10,000 to $12,499 | 0 (0.0%) | 70 (8.7%) |
| $12,500 to $14,999 | 11 (0.9%) | 41 (5.1%) |
| $15,000 to $17,499 | 12 (1.0%) | 40 (5.0%) |
| $17,500 to $19,999 | 28 (2.4%) | 0 (0.0%) |
| $20,000 to $22,499 | 54 (4.6%) | 18 (2.2%) |
| $22,500 to $24,999 | 13 (1.1%) | 6 (0.7%) |
| $25,000 to $29,999 | 117 (10.0%) | 58 (7.2%) |
| $30,000 to $34,999 | 40 (3.4%) | 99 (12.3%) |
| $35,000 to $39,999 | 83 (7.1%) | 90 (11.2%) |
| $40,000 to $44,999 | 63 (5.4%) | 20 (2.5%) |
| $45,000 to $49,999 | 64 (5.5%) | 95 (11.8%) |
| $50,000 to $54,999 | 32 (2.7%) | 27 (3.4%) |
| $55,000 to $64,999 | 87 (7.4%) | 41 (5.1%) |
| $65,000 to $74,999 | 108 (9.2%) | 15 (1.9%) |
| $75,000 to $99,999 | 119 (10.2%) | 18 (2.2%) |
| $100,000+ | 169 (14.5%) | 39 (4.9%) |
| Total | 1,168 (100.0%) | 802 (100.0%) |
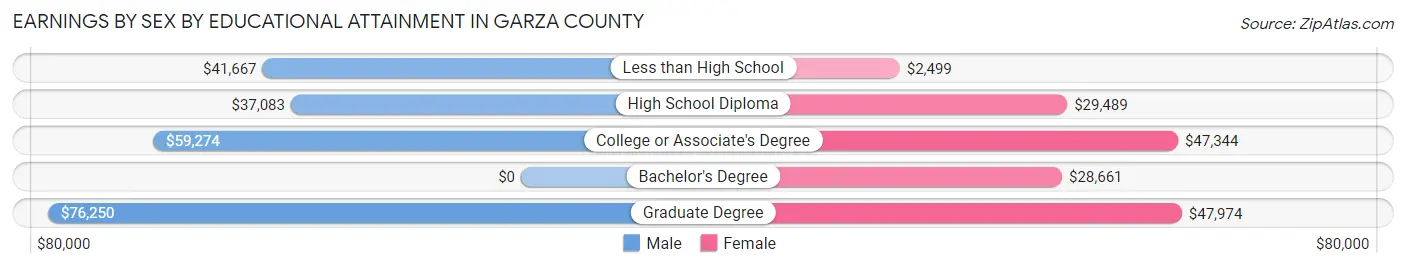
Earnings by Sex by Educational Attainment in Garza County
Average earnings in Garza County are $50,739 for men and $35,469 for women, a difference of 30.1%. Men with an educational attainment of graduate degree enjoy the highest average annual earnings of $76,250, while those with high school diploma education earn the least with $37,083. Women with an educational attainment of graduate degree earn the most with the average annual earnings of $47,974, while those with less than high school education have the smallest earnings of $2,499.
| Educational Attainment | Male Income | Female Income |
| Less than High School | $41,667 | $2,499 |
| High School Diploma | $37,083 | $29,489 |
| College or Associate's Degree | $59,274 | $47,344 |
| Bachelor's Degree | - | - |
| Graduate Degree | $76,250 | $47,974 |
| Total | $50,739 | $35,469 |
Family Income in Garza County
Family Income Brackets in Garza County
According to the Garza County family income data, there are 368 families falling into the $100,000 to $149,999 income range, which is the most common income bracket and makes up 31.7% of all families. Conversely, the less than $10,000 income bracket is the least frequent group with only 6 families (0.5%) belonging to this category.
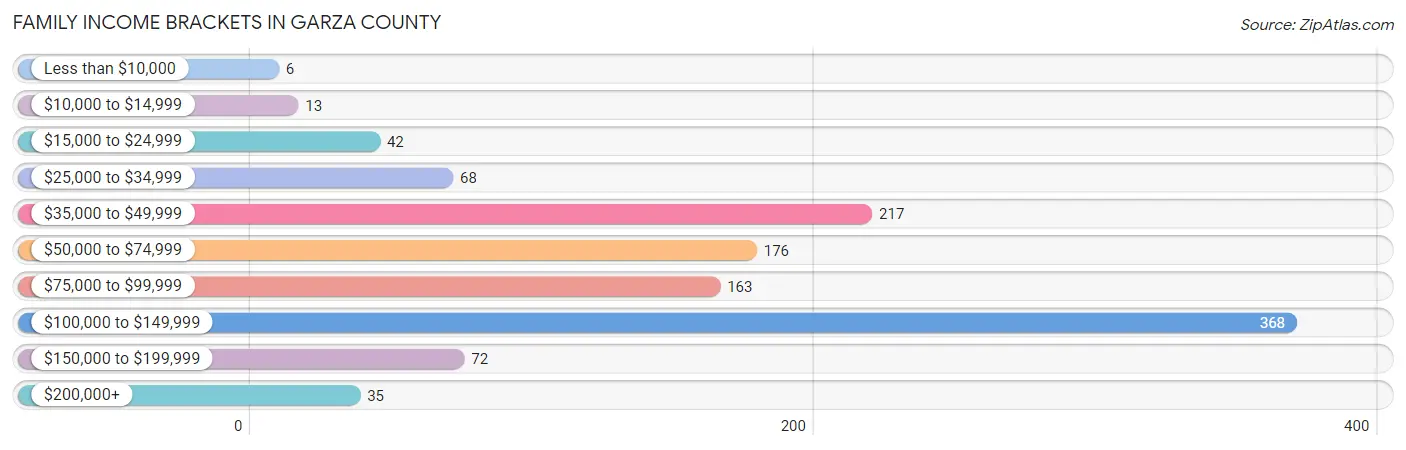
| Income Bracket | # Families | % Families |
| Less than $10,000 | 6 | 0.5% |
| $10,000 to $14,999 | 13 | 1.1% |
| $15,000 to $24,999 | 42 | 3.6% |
| $25,000 to $34,999 | 68 | 5.9% |
| $35,000 to $49,999 | 217 | 18.7% |
| $50,000 to $74,999 | 176 | 15.2% |
| $75,000 to $99,999 | 163 | 14.0% |
| $100,000 to $149,999 | 368 | 31.7% |
| $150,000 to $199,999 | 72 | 6.2% |
| $200,000+ | 35 | 3.0% |
Family Income by Famaliy Size in Garza County
5-person families (14 | 1.2%) account for the highest median family income in Garza County with $103,929 per family, while 2-person families (596 | 51.3%) have the highest median income of $37,165 per family member.
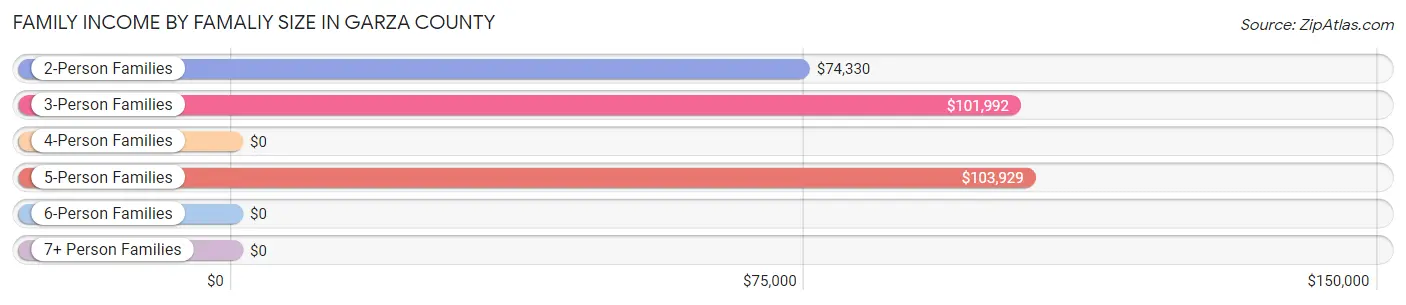
| Income Bracket | # Families | Median Income |
| 2-Person Families | 596 (51.3%) | $74,330 |
| 3-Person Families | 221 (19.0%) | $101,992 |
| 4-Person Families | 237 (20.4%) | $0 |
| 5-Person Families | 14 (1.2%) | $103,929 |
| 6-Person Families | 24 (2.1%) | $0 |
| 7+ Person Families | 69 (5.9%) | $0 |
| Total | 1,161 (100.0%) | $82,386 |
Family Income by Number of Earners in Garza County
The median family income in Garza County is $82,386, with families comprising 3+ earners (93) having the highest median family income of $111,953, while families with no earners (184) have the lowest median family income of $58,077, accounting for 8.0% and 15.9% of families, respectively.
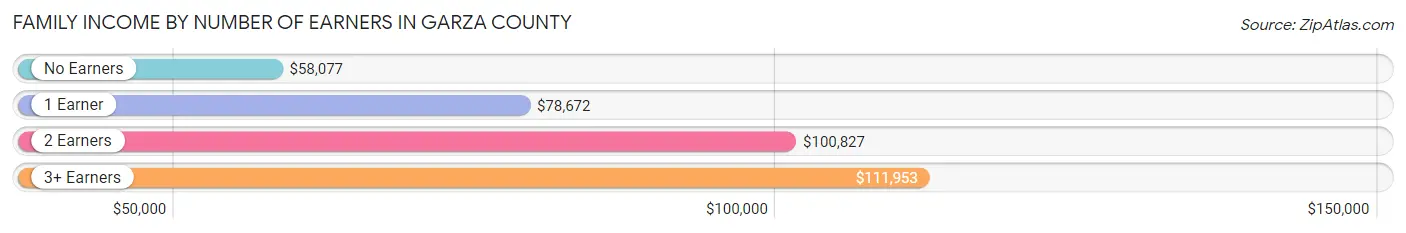
| Number of Earners | # Families | Median Income |
| No Earners | 184 (15.9%) | $58,077 |
| 1 Earner | 479 (41.3%) | $78,672 |
| 2 Earners | 405 (34.9%) | $100,827 |
| 3+ Earners | 93 (8.0%) | $111,953 |
| Total | 1,161 (100.0%) | $82,386 |
Household Income in Garza County
Household Income Brackets in Garza County
With 382 households falling in the category, the $100,000 to $149,999 income range is the most frequent in Garza County, accounting for 22.8% of all households. In contrast, only 20 households (1.2%) fall into the less than $10,000 income bracket, making it the least populous group.
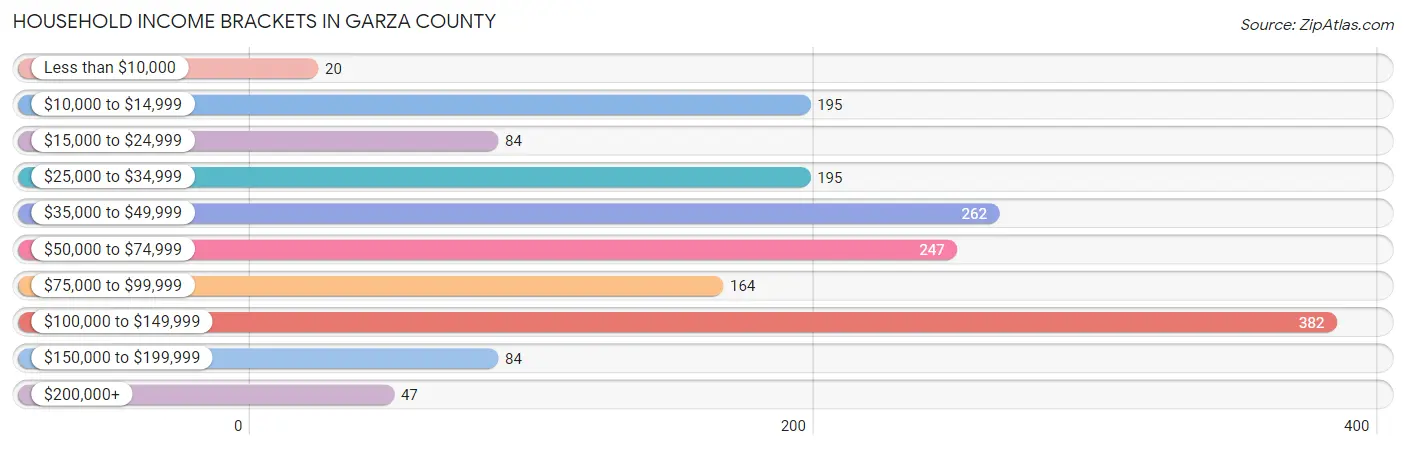
| Income Bracket | # Households | % Households |
| Less than $10,000 | 20 | 1.2% |
| $10,000 to $14,999 | 195 | 11.6% |
| $15,000 to $24,999 | 84 | 5.0% |
| $25,000 to $34,999 | 195 | 11.6% |
| $35,000 to $49,999 | 262 | 15.6% |
| $50,000 to $74,999 | 247 | 14.7% |
| $75,000 to $99,999 | 164 | 9.8% |
| $100,000 to $149,999 | 382 | 22.8% |
| $150,000 to $199,999 | 84 | 5.0% |
| $200,000+ | 47 | 2.8% |
Household Income by Householder Age in Garza County
The median household income in Garza County is $56,215, with the highest median household income of $81,402 found in the 45 to 64 years age bracket for the primary householder. A total of 649 households (38.7%) fall into this category. Meanwhile, the 15 to 24 years age bracket for the primary householder has the lowest median household income of $0, with 23 households (1.4%) in this group.
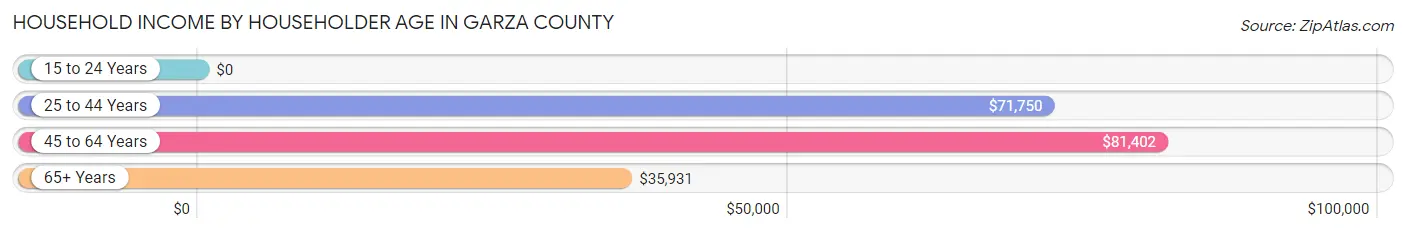
| Income Bracket | # Households | Median Income |
| 15 to 24 Years | 23 (1.4%) | $0 |
| 25 to 44 Years | 371 (22.1%) | $71,750 |
| 45 to 64 Years | 649 (38.7%) | $81,402 |
| 65+ Years | 634 (37.8%) | $35,931 |
| Total | 1,677 (100.0%) | $56,215 |
Poverty in Garza County
Income Below Poverty by Sex and Age in Garza County
With 17.4% poverty level for males and 13.5% for females among the residents of Garza County, 6 to 11 year old males and 16 and 17 year old females are the most vulnerable to poverty, with 133 males (75.1%) and 22 females (56.4%) in their respective age groups living below the poverty level.
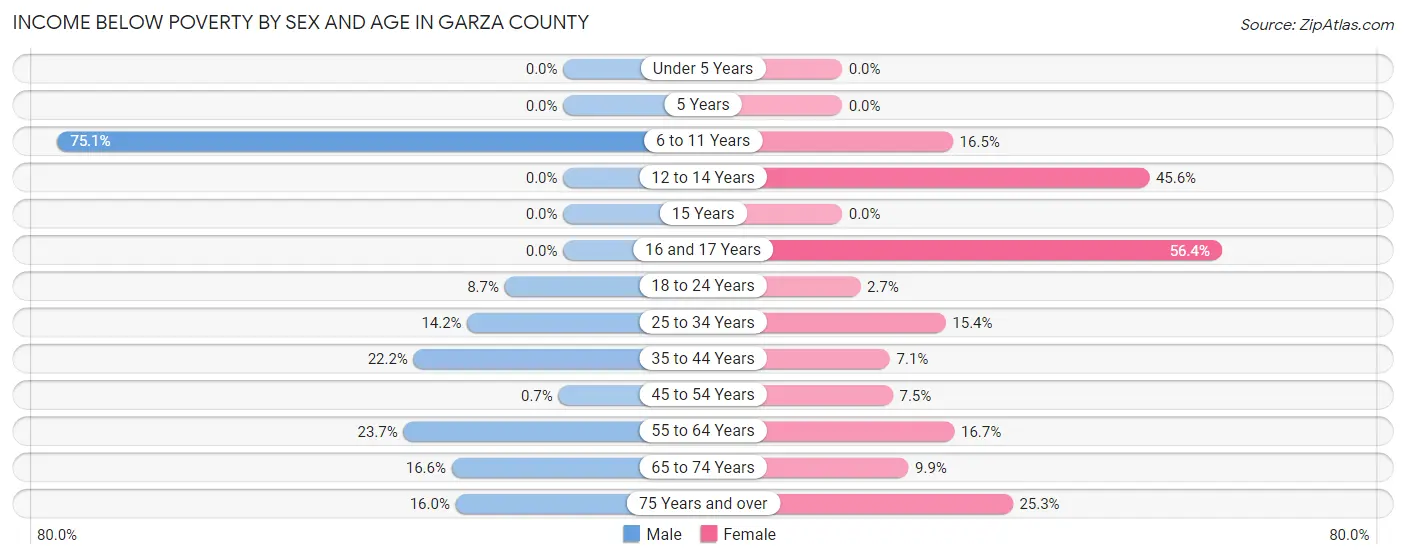
| Age Bracket | Male | Female |
| Under 5 Years | 0 (0.0%) | 0 (0.0%) |
| 5 Years | 0 (0.0%) | 0 (0.0%) |
| 6 to 11 Years | 133 (75.1%) | 27 (16.5%) |
| 12 to 14 Years | 0 (0.0%) | 26 (45.6%) |
| 15 Years | 0 (0.0%) | 0 (0.0%) |
| 16 and 17 Years | 0 (0.0%) | 22 (56.4%) |
| 18 to 24 Years | 24 (8.7%) | 9 (2.7%) |
| 25 to 34 Years | 44 (14.2%) | 30 (15.4%) |
| 35 to 44 Years | 26 (22.2%) | 13 (7.1%) |
| 45 to 54 Years | 2 (0.7%) | 22 (7.5%) |
| 55 to 64 Years | 75 (23.7%) | 52 (16.7%) |
| 65 to 74 Years | 29 (16.6%) | 20 (9.9%) |
| 75 Years and over | 35 (16.0%) | 74 (25.3%) |
| Total | 368 (17.4%) | 295 (13.5%) |
Income Above Poverty by Sex and Age in Garza County
According to the poverty statistics in Garza County, males aged under 5 years and females aged under 5 years are the age groups that are most secure financially, with 100.0% of males and 100.0% of females in these age groups living above the poverty line.
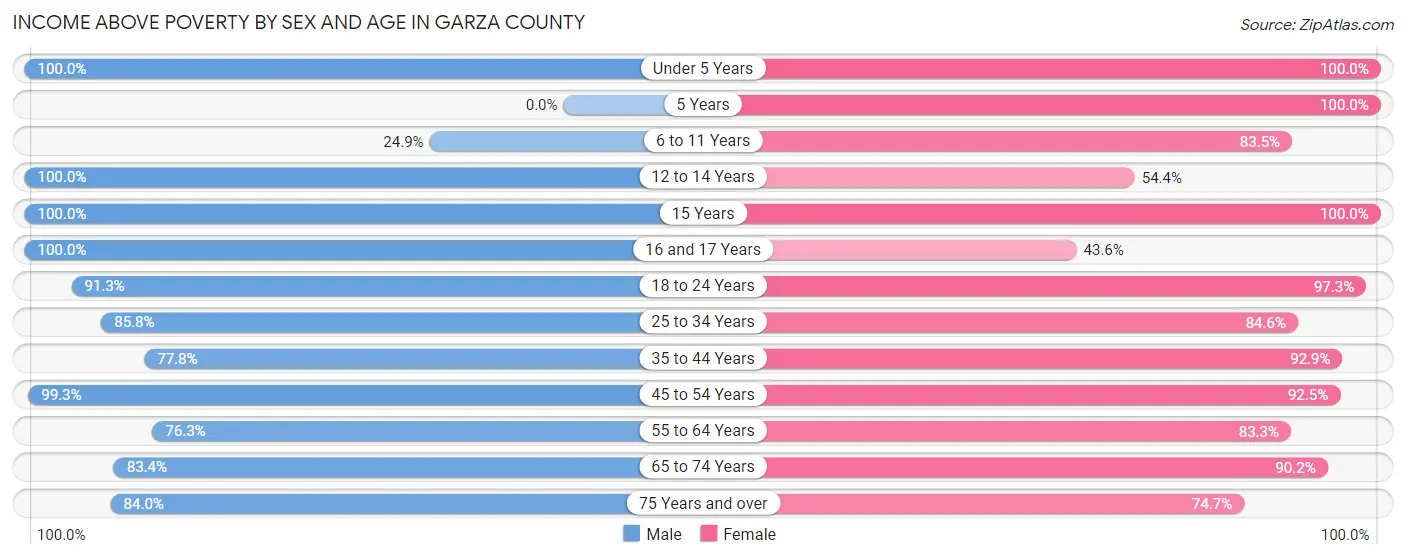
| Age Bracket | Male | Female |
| Under 5 Years | 104 (100.0%) | 61 (100.0%) |
| 5 Years | 0 (0.0%) | 19 (100.0%) |
| 6 to 11 Years | 44 (24.9%) | 137 (83.5%) |
| 12 to 14 Years | 56 (100.0%) | 31 (54.4%) |
| 15 Years | 31 (100.0%) | 40 (100.0%) |
| 16 and 17 Years | 55 (100.0%) | 17 (43.6%) |
| 18 to 24 Years | 252 (91.3%) | 323 (97.3%) |
| 25 to 34 Years | 265 (85.8%) | 165 (84.6%) |
| 35 to 44 Years | 91 (77.8%) | 170 (92.9%) |
| 45 to 54 Years | 282 (99.3%) | 270 (92.5%) |
| 55 to 64 Years | 241 (76.3%) | 260 (83.3%) |
| 65 to 74 Years | 146 (83.4%) | 183 (90.1%) |
| 75 Years and over | 184 (84.0%) | 218 (74.7%) |
| Total | 1,751 (82.6%) | 1,894 (86.5%) |
Income Below Poverty Among Married-Couple Families in Garza County
The poverty statistics for married-couple families in Garza County show that 4.5% or 44 of the total 967 families live below the poverty line. Families with 3 or 4 children have the highest poverty rate of 74.1%, comprising of 20 families. On the other hand, families with 1 or 2 children have the lowest poverty rate of 0.0%, which includes 0 families.
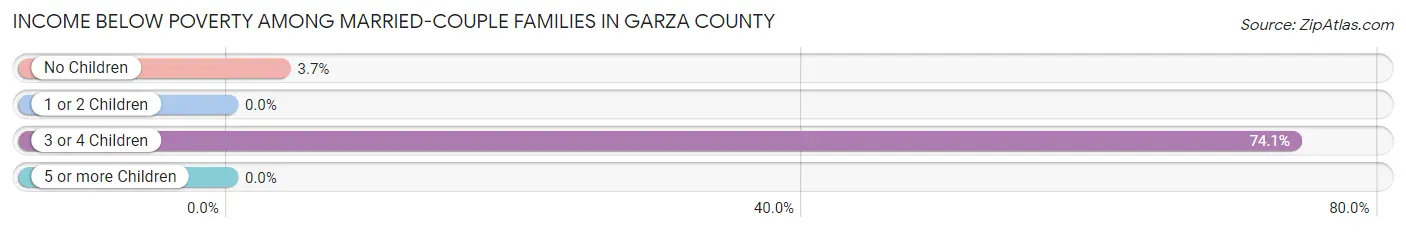
| Children | Above Poverty | Below Poverty |
| No Children | 632 (96.3%) | 24 (3.7%) |
| 1 or 2 Children | 222 (100.0%) | 0 (0.0%) |
| 3 or 4 Children | 7 (25.9%) | 20 (74.1%) |
| 5 or more Children | 62 (100.0%) | 0 (0.0%) |
| Total | 923 (95.5%) | 44 (4.5%) |
Income Below Poverty Among Single-Parent Households in Garza County
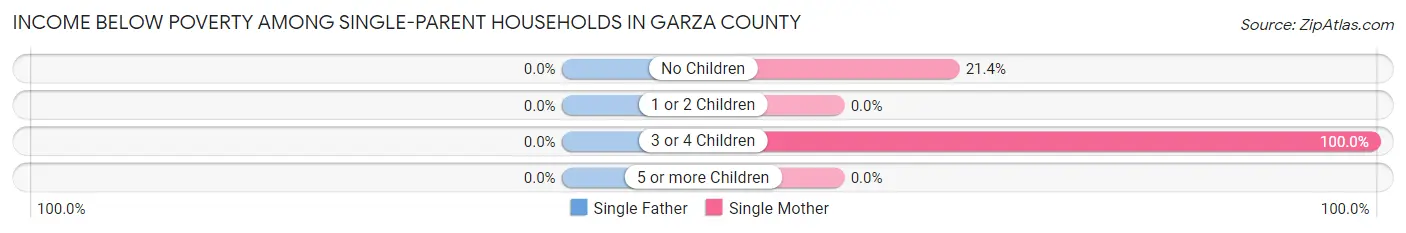
| Children | Single Father | Single Mother |
| No Children | 0 (0.0%) | 24 (21.4%) |
| 1 or 2 Children | 0 (0.0%) | 0 (0.0%) |
| 3 or 4 Children | 0 (0.0%) | 13 (100.0%) |
| 5 or more Children | 0 (0.0%) | 0 (0.0%) |
| Total | 0 (0.0%) | 37 (21.0%) |
Income Below Poverty Among Married-Couple vs Single-Parent Households in Garza County
The poverty data for Garza County shows that 44 of the married-couple family households (4.5%) and 37 of the single-parent households (19.1%) are living below the poverty level. Within the married-couple family households, those with 3 or 4 children have the highest poverty rate, with 20 households (74.1%) falling below the poverty line. Among the single-parent households, those with 3 or 4 children have the highest poverty rate, with 13 household (100.0%) living below poverty.
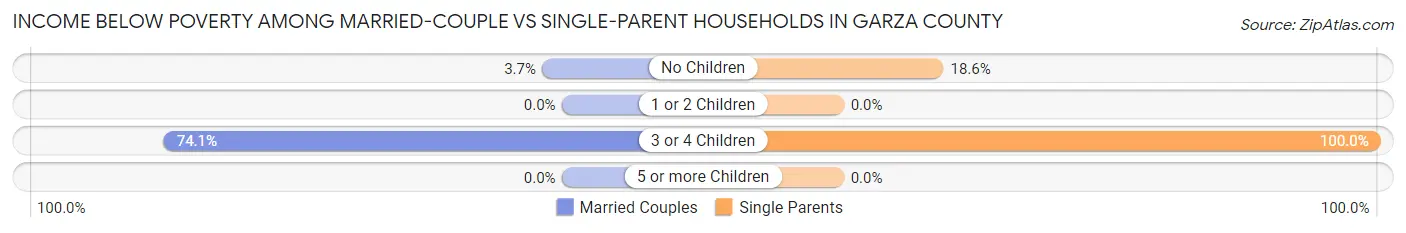
| Children | Married-Couple Families | Single-Parent Households |
| No Children | 24 (3.7%) | 24 (18.6%) |
| 1 or 2 Children | 0 (0.0%) | 0 (0.0%) |
| 3 or 4 Children | 20 (74.1%) | 13 (100.0%) |
| 5 or more Children | 0 (0.0%) | 0 (0.0%) |
| Total | 44 (4.5%) | 37 (19.1%) |
Race in Garza County
The most populous races in Garza County are White / Caucasian (4,026 | 70.2%), Hispanic or Latino (2,684 | 46.8%), and Two or more Races (728 | 12.7%).
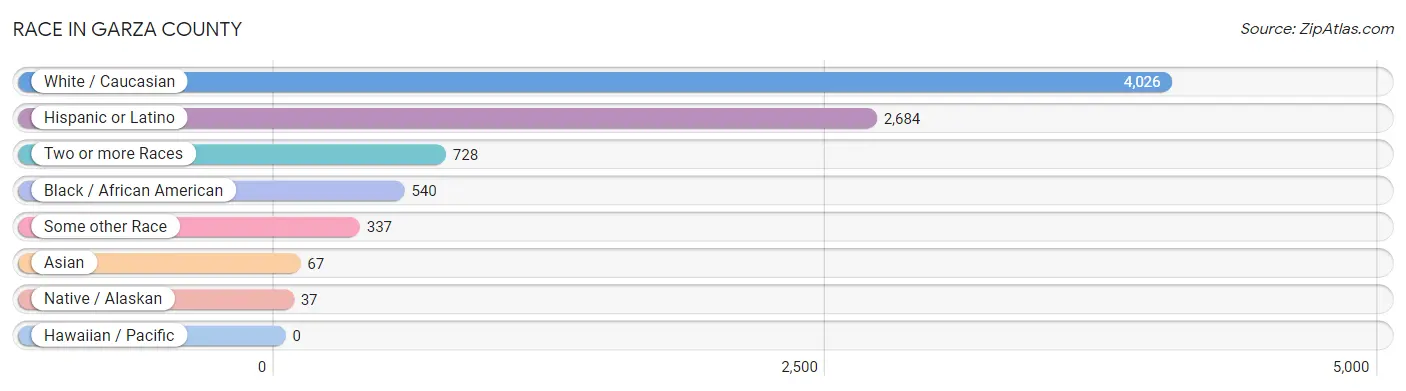
| Race | # Population | % Population |
| Asian | 67 | 1.2% |
| Black / African American | 540 | 9.4% |
| Hawaiian / Pacific | 0 | 0.0% |
| Hispanic or Latino | 2,684 | 46.8% |
| Native / Alaskan | 37 | 0.6% |
| White / Caucasian | 4,026 | 70.2% |
| Two or more Races | 728 | 12.7% |
| Some other Race | 337 | 5.9% |
| Total | 5,735 | 100.0% |
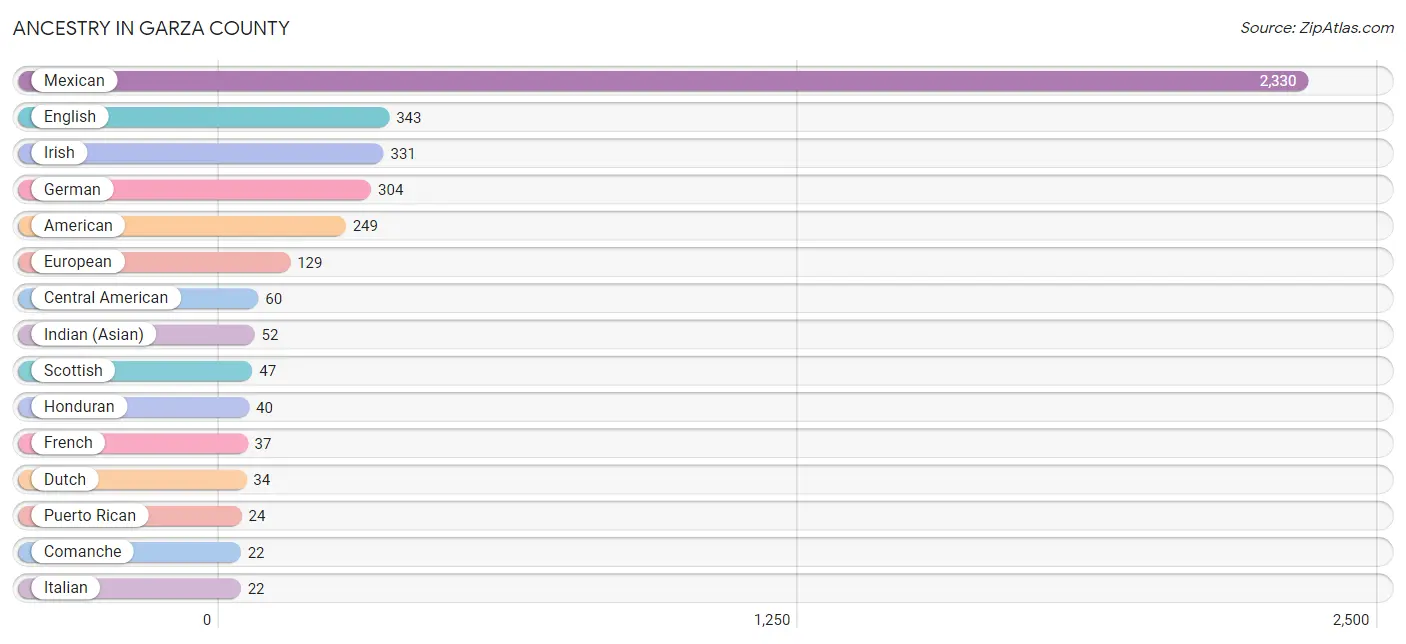
Ancestry in Garza County
The most populous ancestries reported in Garza County are Mexican (2,330 | 40.6%), English (343 | 6.0%), Irish (331 | 5.8%), German (304 | 5.3%), and American (249 | 4.3%), together accounting for 62.0% of all Garza County residents.
| Ancestry | # Population | % Population |
| American | 249 | 4.3% |
| Apache | 2 | 0.0% |
| Austrian | 12 | 0.2% |
| Basque | 7 | 0.1% |
| Central American | 60 | 1.1% |
| Cherokee | 1 | 0.0% |
| Choctaw | 1 | 0.0% |
| Colombian | 7 | 0.1% |
| Comanche | 22 | 0.4% |
| Cuban | 7 | 0.1% |
| Dominican | 12 | 0.2% |
| Dutch | 34 | 0.6% |
| Ecuadorian | 12 | 0.2% |
| English | 343 | 6.0% |
| European | 129 | 2.2% |
| French | 37 | 0.6% |
| French Canadian | 2 | 0.0% |
| German | 304 | 5.3% |
| Guatemalan | 20 | 0.4% |
| Honduran | 40 | 0.7% |
| Hopi | 2 | 0.0% |
| Indian (Asian) | 52 | 0.9% |
| Irish | 331 | 5.8% |
| Italian | 22 | 0.4% |
| Jamaican | 17 | 0.3% |
| Korean | 15 | 0.3% |
| Mexican | 2,330 | 40.6% |
| Northern European | 8 | 0.1% |
| Norwegian | 3 | 0.1% |
| Pennsylvania German | 12 | 0.2% |
| Polish | 8 | 0.1% |
| Puerto Rican | 24 | 0.4% |
| Scotch-Irish | 5 | 0.1% |
| Scottish | 47 | 0.8% |
| South American | 19 | 0.3% |
| Spaniard | 21 | 0.4% |
| Spanish | 21 | 0.4% |
| Swiss | 11 | 0.2% |
| Welsh | 15 | 0.3% | View All 39 Rows |
Immigrants in Garza County
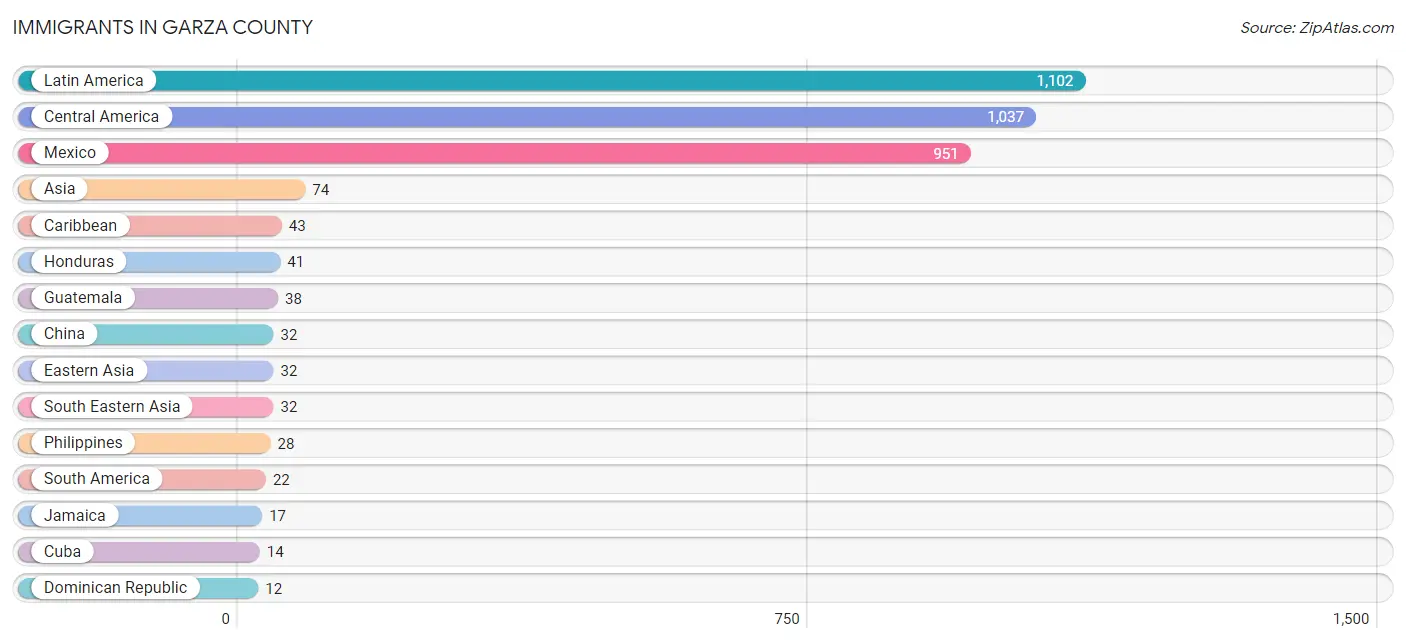
The most numerous immigrant groups reported in Garza County came from Latin America (1,102 | 19.2%), Central America (1,037 | 18.1%), Mexico (951 | 16.6%), Asia (74 | 1.3%), and Caribbean (43 | 0.7%), together accounting for 55.9% of all Garza County residents.
| Immigration Origin | # Population | % Population |
| Asia | 74 | 1.3% |
| Canada | 7 | 0.1% |
| Caribbean | 43 | 0.7% |
| Central America | 1,037 | 18.1% |
| China | 32 | 0.6% |
| Colombia | 10 | 0.2% |
| Cuba | 14 | 0.2% |
| Dominican Republic | 12 | 0.2% |
| Eastern Asia | 32 | 0.6% |
| Ecuador | 12 | 0.2% |
| El Salvador | 7 | 0.1% |
| Guatemala | 38 | 0.7% |
| Honduras | 41 | 0.7% |
| Israel | 10 | 0.2% |
| Jamaica | 17 | 0.3% |
| Latin America | 1,102 | 19.2% |
| Mexico | 951 | 16.6% |
| Philippines | 28 | 0.5% |
| South America | 22 | 0.4% |
| South Eastern Asia | 32 | 0.6% |
| Thailand | 4 | 0.1% |
| Western Asia | 10 | 0.2% | View All 22 Rows |
Sex and Age in Garza County
Sex and Age in Garza County
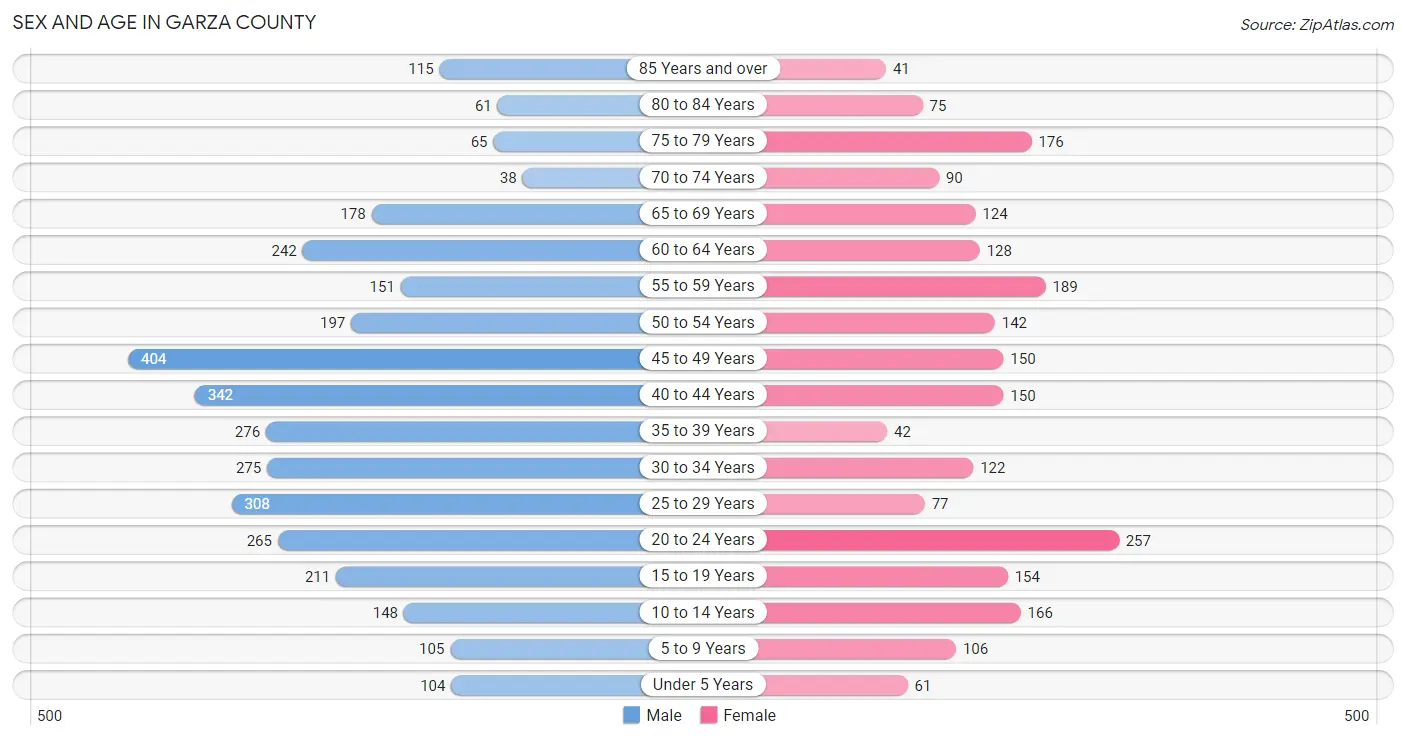
The most populous age groups in Garza County are 45 to 49 Years (404 | 11.6%) for men and 20 to 24 Years (257 | 11.4%) for women.
| Age Bracket | Male | Female |
| Under 5 Years | 104 (3.0%) | 61 (2.7%) |
| 5 to 9 Years | 105 (3.0%) | 106 (4.7%) |
| 10 to 14 Years | 148 (4.3%) | 166 (7.4%) |
| 15 to 19 Years | 211 (6.0%) | 154 (6.8%) |
| 20 to 24 Years | 265 (7.6%) | 257 (11.4%) |
| 25 to 29 Years | 308 (8.8%) | 77 (3.4%) |
| 30 to 34 Years | 275 (7.9%) | 122 (5.4%) |
| 35 to 39 Years | 276 (7.9%) | 42 (1.9%) |
| 40 to 44 Years | 342 (9.8%) | 150 (6.7%) |
| 45 to 49 Years | 404 (11.6%) | 150 (6.7%) |
| 50 to 54 Years | 197 (5.7%) | 142 (6.3%) |
| 55 to 59 Years | 151 (4.3%) | 189 (8.4%) |
| 60 to 64 Years | 242 (6.9%) | 128 (5.7%) |
| 65 to 69 Years | 178 (5.1%) | 124 (5.5%) |
| 70 to 74 Years | 38 (1.1%) | 90 (4.0%) |
| 75 to 79 Years | 65 (1.9%) | 176 (7.8%) |
| 80 to 84 Years | 61 (1.8%) | 75 (3.3%) |
| 85 Years and over | 115 (3.3%) | 41 (1.8%) |
| Total | 3,485 (100.0%) | 2,250 (100.0%) |
Families and Households in Garza County
Median Family Size in Garza County
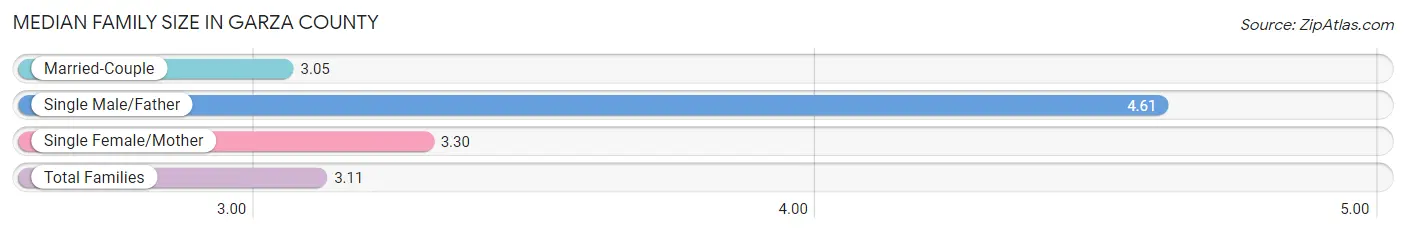
The median family size in Garza County is 3.11 persons per family, with single male/father families (18 | 1.5%) accounting for the largest median family size of 4.61 persons per family. On the other hand, married-couple families (967 | 83.3%) represent the smallest median family size with 3.05 persons per family.
| Family Type | # Families | Family Size |
| Married-Couple | 967 (83.3%) | 3.05 |
| Single Male/Father | 18 (1.5%) | 4.61 |
| Single Female/Mother | 176 (15.2%) | 3.30 |
| Total Families | 1,161 (100.0%) | 3.11 |
Median Household Size in Garza County
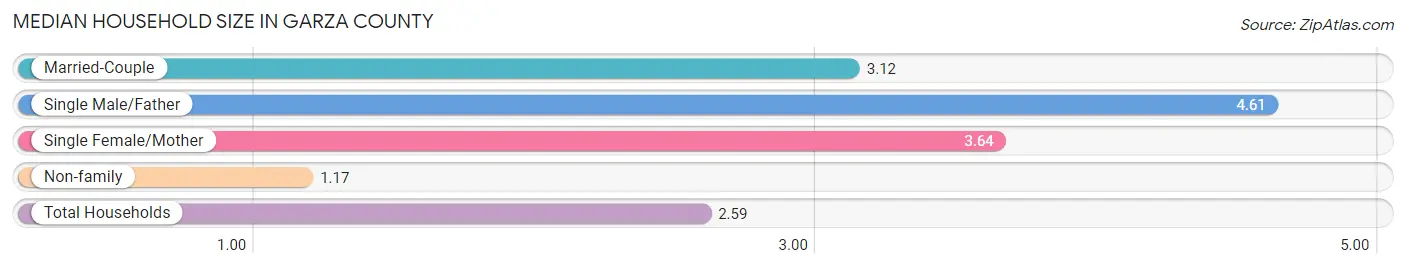
The median household size in Garza County is 2.59 persons per household, with single male/father households (18 | 1.1%) accounting for the largest median household size of 4.61 persons per household. non-family households (516 | 30.8%) represent the smallest median household size with 1.17 persons per household.
| Household Type | # Households | Household Size |
| Married-Couple | 967 (57.7%) | 3.12 |
| Single Male/Father | 18 (1.1%) | 4.61 |
| Single Female/Mother | 176 (10.5%) | 3.64 |
| Non-family | 516 (30.8%) | 1.17 |
| Total Households | 1,677 (100.0%) | 2.59 |
Household Size by Marriage Status in Garza County
Out of a total of 1,677 households in Garza County, 1,161 (69.2%) are family households, while 516 (30.8%) are nonfamily households. The most numerous type of family households are 2-person households, comprising 579, and the most common type of nonfamily households are 1-person households, comprising 442.
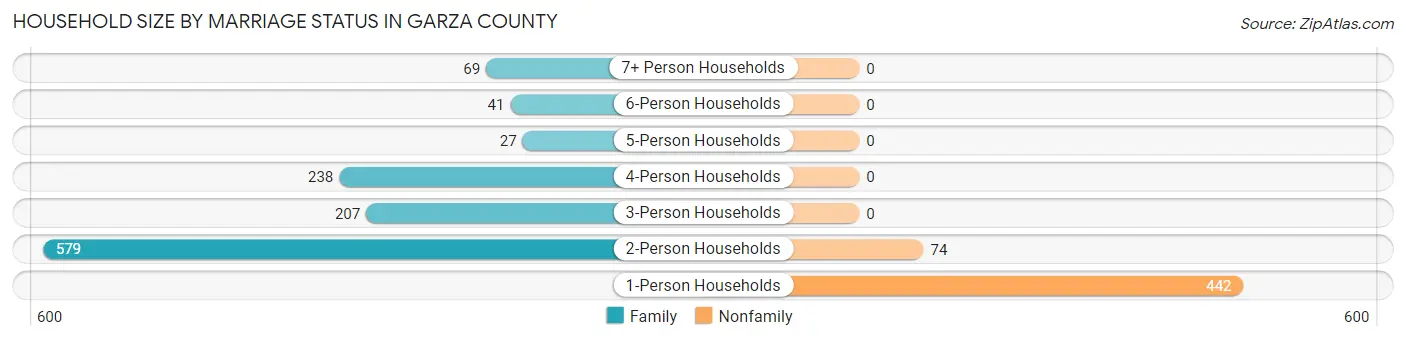
| Household Size | Family Households | Nonfamily Households |
| 1-Person Households | - | 442 (26.4%) |
| 2-Person Households | 579 (34.5%) | 74 (4.4%) |
| 3-Person Households | 207 (12.3%) | 0 (0.0%) |
| 4-Person Households | 238 (14.2%) | 0 (0.0%) |
| 5-Person Households | 27 (1.6%) | 0 (0.0%) |
| 6-Person Households | 41 (2.4%) | 0 (0.0%) |
| 7+ Person Households | 69 (4.1%) | 0 (0.0%) |
| Total | 1,161 (69.2%) | 516 (30.8%) |
Female Fertility in Garza County
Fertility by Age in Garza County
Average fertility rate in Garza County is 2.0 births per 1,000 women. Women in the age bracket of 20 to 34 years have the highest fertility rate with 4.0 births per 1,000 women. Women in the age bracket of 20 to 34 years acount for 100.0% of all women with births.
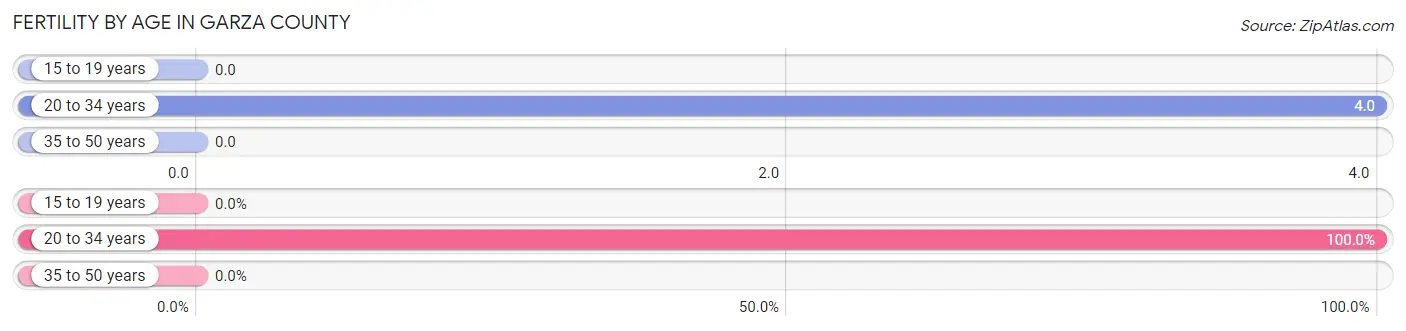
| Age Bracket | Women with Births | Births / 1,000 Women |
| 15 to 19 years | 0 (0.0%) | 0.0 |
| 20 to 34 years | 2 (100.0%) | 4.0 |
| 35 to 50 years | 0 (0.0%) | 0.0 |
| Total | 2 (100.0%) | 2.0 |
Fertility by Age by Marriage Status in Garza County
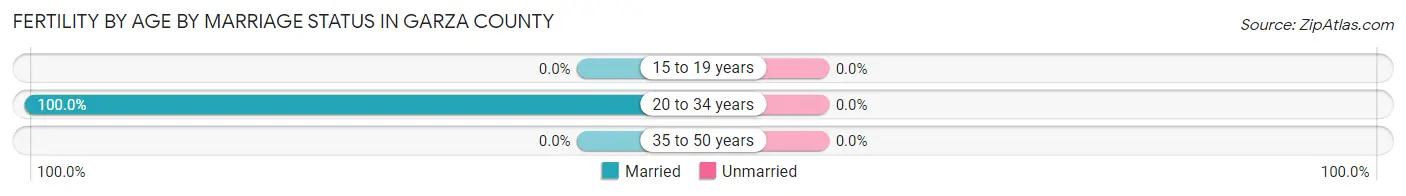
| Age Bracket | Married | Unmarried |
| 15 to 19 years | 0 (0.0%) | 0 (0.0%) |
| 20 to 34 years | 2 (100.0%) | 0 (0.0%) |
| 35 to 50 years | 0 (0.0%) | 0 (0.0%) |
| Total | 2 (100.0%) | 0 (0.0%) |
Fertility by Education in Garza County
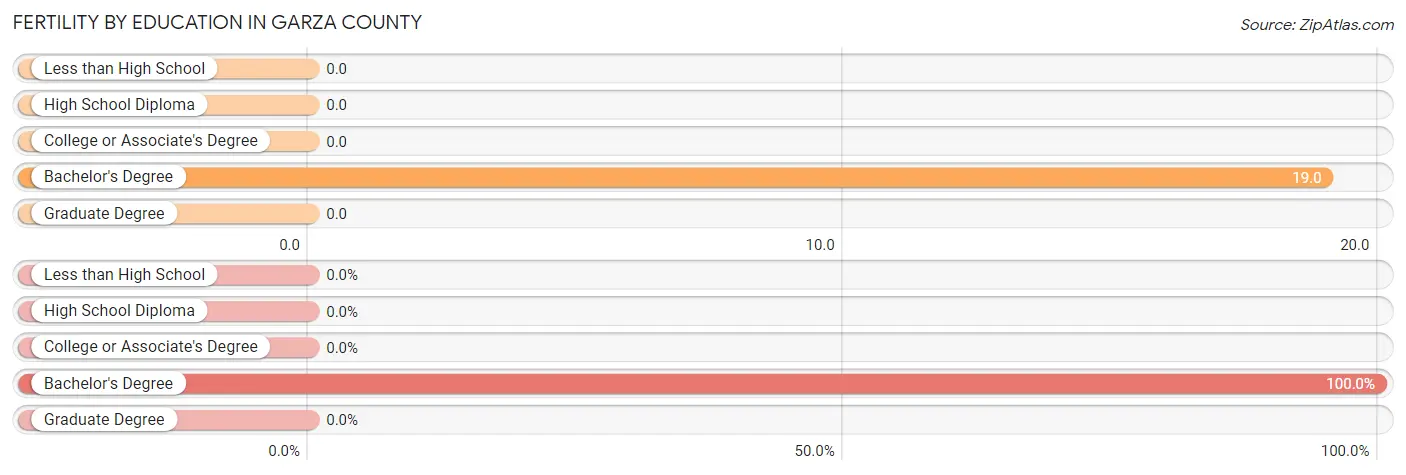
| Educational Attainment | Women with Births | Births / 1,000 Women |
| Less than High School | 0 (0.0%) | 0.0 |
| High School Diploma | 0 (0.0%) | 0.0 |
| College or Associate's Degree | 0 (0.0%) | 0.0 |
| Bachelor's Degree | 2 (100.0%) | 19.0 |
| Graduate Degree | 0 (0.0%) | 0.0 |
| Total | 2 (100.0%) | 2.0 |
Fertility by Education by Marriage Status in Garza County
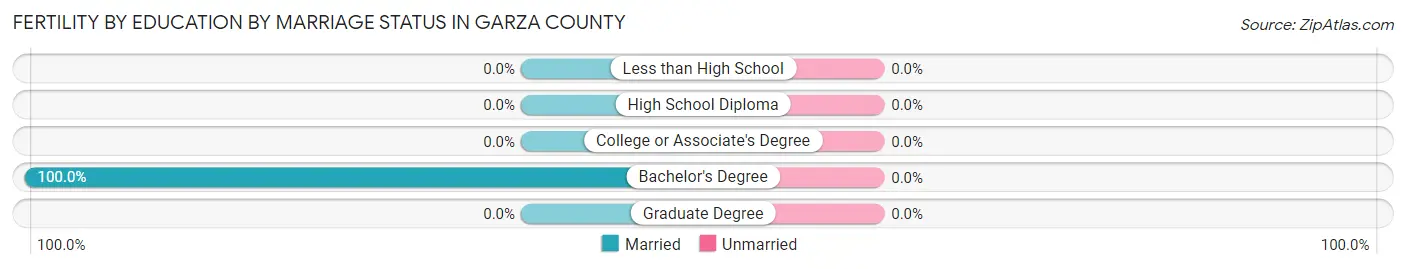
| Educational Attainment | Married | Unmarried |
| Less than High School | 0 (0.0%) | 0 (0.0%) |
| High School Diploma | 0 (0.0%) | 0 (0.0%) |
| College or Associate's Degree | 0 (0.0%) | 0 (0.0%) |
| Bachelor's Degree | 2 (100.0%) | 0 (0.0%) |
| Graduate Degree | 0 (0.0%) | 0 (0.0%) |
| Total | 2 (100.0%) | 0 (0.0%) |
Employment Characteristics in Garza County
Employment by Class of Employer in Garza County
Among the 1,616 employed individuals in Garza County, private company employees (893 | 55.3%), local government employees (200 | 12.4%), and not-for-profit organizations (144 | 8.9%) make up the most common classes of employment.
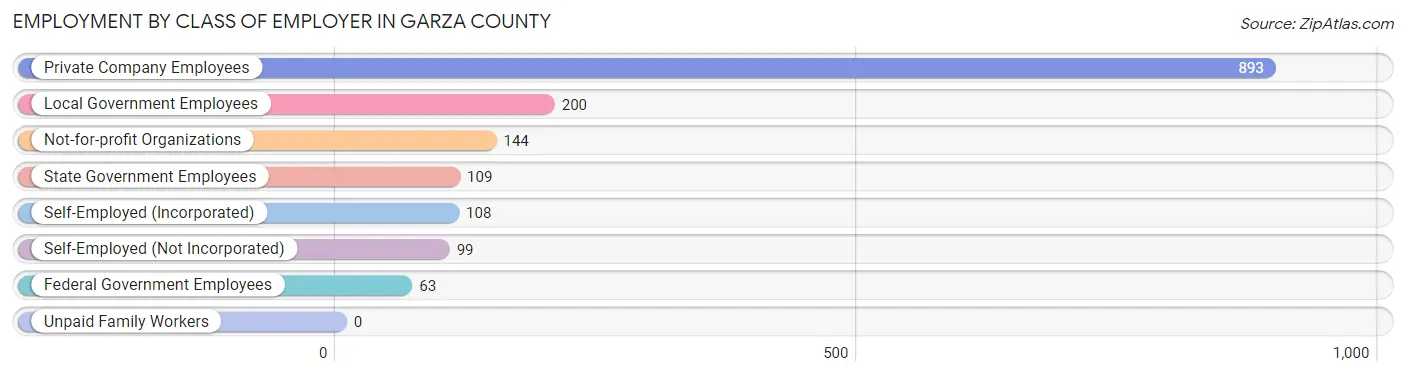
| Employer Class | # Employees | % Employees |
| Private Company Employees | 893 | 55.3% |
| Self-Employed (Incorporated) | 108 | 6.7% |
| Self-Employed (Not Incorporated) | 99 | 6.1% |
| Not-for-profit Organizations | 144 | 8.9% |
| Local Government Employees | 200 | 12.4% |
| State Government Employees | 109 | 6.8% |
| Federal Government Employees | 63 | 3.9% |
| Unpaid Family Workers | 0 | 0.0% |
| Total | 1,616 | 100.0% |
Employment Status by Age in Garza County
According to the labor force statistics for Garza County, out of the total population over 16 years of age (4,969), 37.1% or 1,843 individuals are in the labor force, with 9.9% or 182 of them unemployed. The age group with the highest labor force participation rate is 30 to 34 years, with 70.3% or 279 individuals in the labor force. Within the labor force, the 20 to 24 years age range has the highest percentage of unemployed individuals, with 36.7% or 109 of them being unemployed.
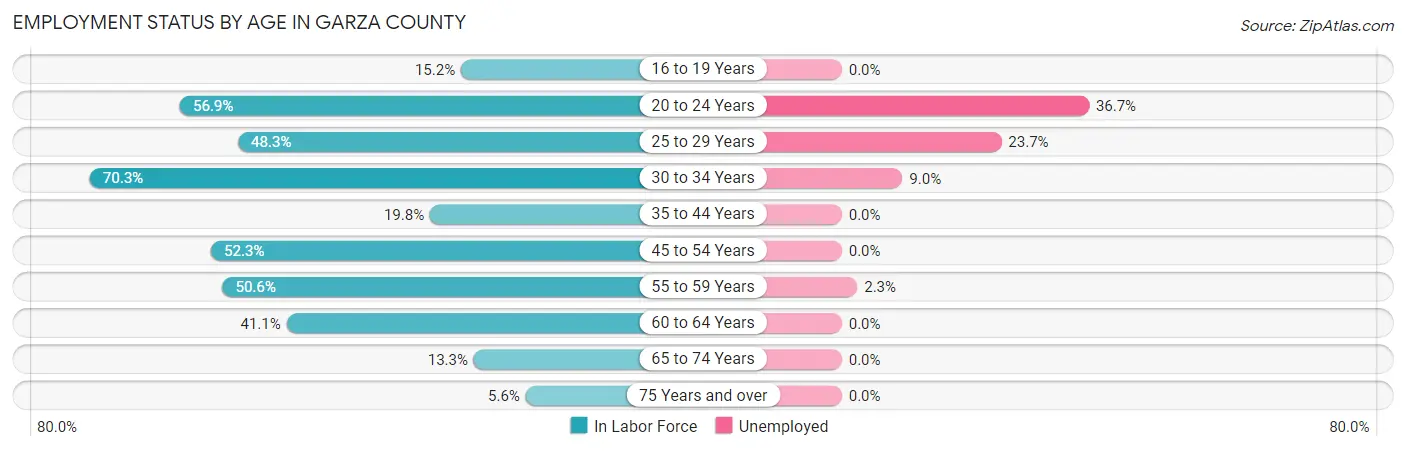
| Age Bracket | In Labor Force | Unemployed |
| 16 to 19 Years | 44 (15.2%) | 0 (0.0%) |
| 20 to 24 Years | 297 (56.9%) | 109 (36.7%) |
| 25 to 29 Years | 186 (48.3%) | 44 (23.7%) |
| 30 to 34 Years | 279 (70.3%) | 25 (9.0%) |
| 35 to 44 Years | 160 (19.8%) | 0 (0.0%) |
| 45 to 54 Years | 467 (52.3%) | 0 (0.0%) |
| 55 to 59 Years | 172 (50.6%) | 4 (2.3%) |
| 60 to 64 Years | 152 (41.1%) | 0 (0.0%) |
| 65 to 74 Years | 57 (13.3%) | 0 (0.0%) |
| 75 Years and over | 30 (5.6%) | 0 (0.0%) |
| Total | 1,843 (37.1%) | 182 (9.9%) |
Employment Status by Educational Attainment in Garza County
According to labor force statistics for Garza County, 44.3% of individuals (1,415) out of the total population between 25 and 64 years of age (3,195) are in the labor force, with 5.2% or 74 of them being unemployed. The group with the highest labor force participation rate are those with the educational attainment of bachelor's degree or higher, with 77.4% or 318 individuals in the labor force. Within the labor force, individuals with high school diploma education have the highest percentage of unemployment, with 9.3% or 44 of them being unemployed.
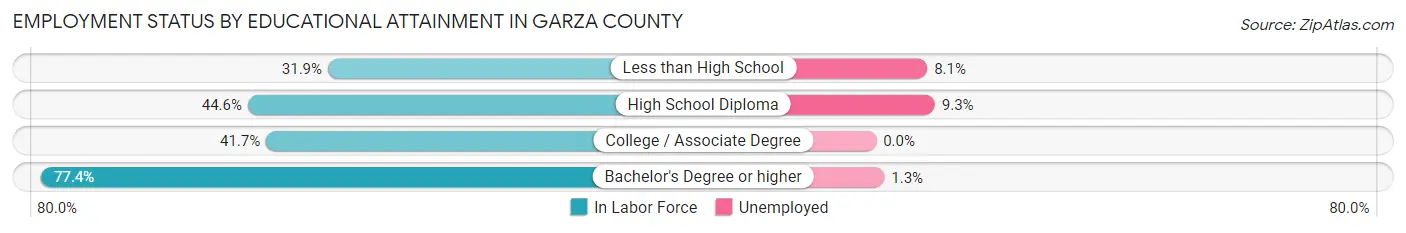
| Educational Attainment | In Labor Force | Unemployed |
| Less than High School | 307 (31.9%) | 78 (8.1%) |
| High School Diploma | 475 (44.6%) | 99 (9.3%) |
| College / Associate Degree | 316 (41.7%) | 0 (0.0%) |
| Bachelor's Degree or higher | 318 (77.4%) | 5 (1.3%) |
| Total | 1,415 (44.3%) | 166 (5.2%) |
Employment Occupations by Sex in Garza County
Management, Business, Science and Arts Occupations
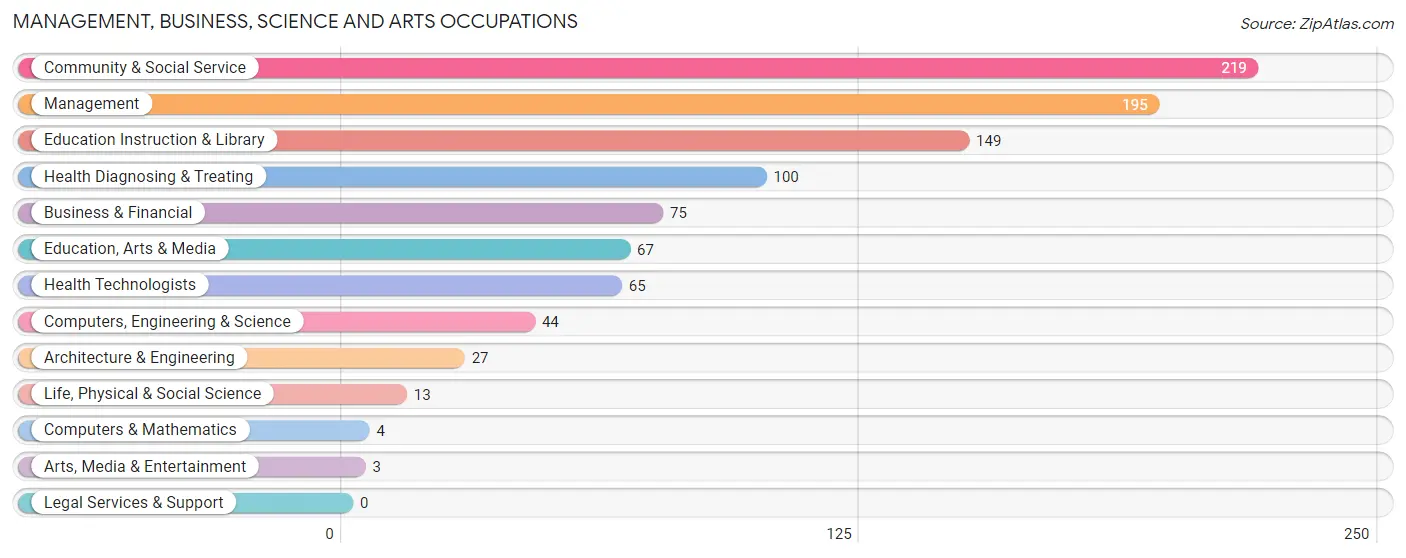
The most common Management, Business, Science and Arts occupations in Garza County are Community & Social Service (219 | 13.2%), Management (195 | 11.7%), Education Instruction & Library (149 | 9.0%), Health Diagnosing & Treating (100 | 6.0%), and Business & Financial (75 | 4.5%).
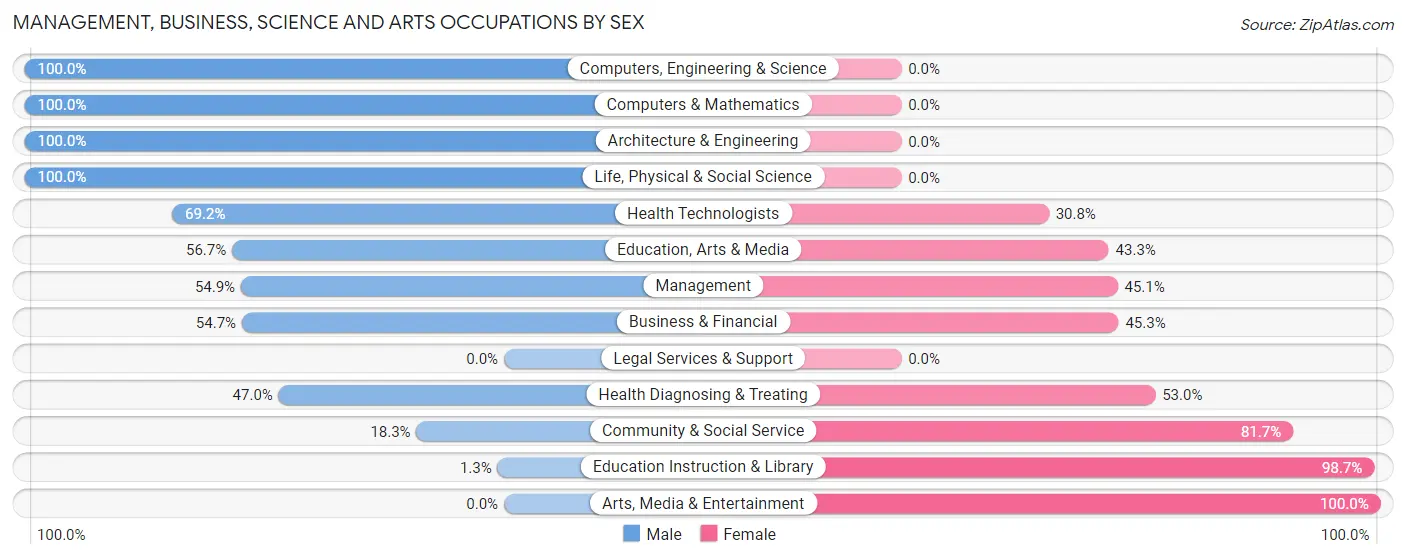
Management, Business, Science and Arts Occupations by Sex
Within the Management, Business, Science and Arts occupations in Garza County, the most male-oriented occupations are Computers, Engineering & Science (100.0%), Computers & Mathematics (100.0%), and Architecture & Engineering (100.0%), while the most female-oriented occupations are Arts, Media & Entertainment (100.0%), Education Instruction & Library (98.7%), and Community & Social Service (81.7%).
| Occupation | Male | Female |
| Management | 107 (54.9%) | 88 (45.1%) |
| Business & Financial | 41 (54.7%) | 34 (45.3%) |
| Computers, Engineering & Science | 44 (100.0%) | 0 (0.0%) |
| Computers & Mathematics | 4 (100.0%) | 0 (0.0%) |
| Architecture & Engineering | 27 (100.0%) | 0 (0.0%) |
| Life, Physical & Social Science | 13 (100.0%) | 0 (0.0%) |
| Community & Social Service | 40 (18.3%) | 179 (81.7%) |
| Education, Arts & Media | 38 (56.7%) | 29 (43.3%) |
| Legal Services & Support | 0 (0.0%) | 0 (0.0%) |
| Education Instruction & Library | 2 (1.3%) | 147 (98.7%) |
| Arts, Media & Entertainment | 0 (0.0%) | 3 (100.0%) |
| Health Diagnosing & Treating | 47 (47.0%) | 53 (53.0%) |
| Health Technologists | 45 (69.2%) | 20 (30.8%) |
| Total (Category) | 279 (44.1%) | 354 (55.9%) |
| Total (Overall) | 940 (56.6%) | 722 (43.4%) |
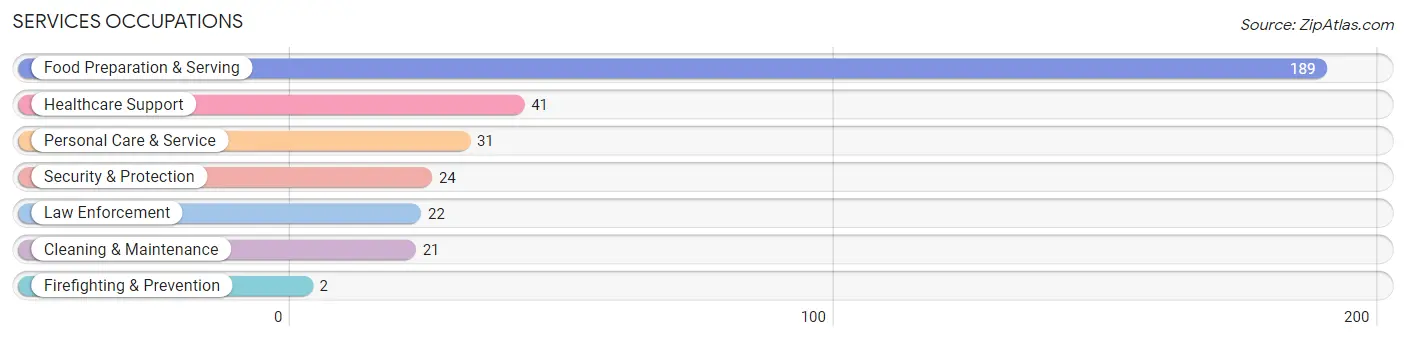
Services Occupations
The most common Services occupations in Garza County are Food Preparation & Serving (189 | 11.4%), Healthcare Support (41 | 2.5%), Personal Care & Service (31 | 1.9%), Security & Protection (24 | 1.4%), and Law Enforcement (22 | 1.3%).
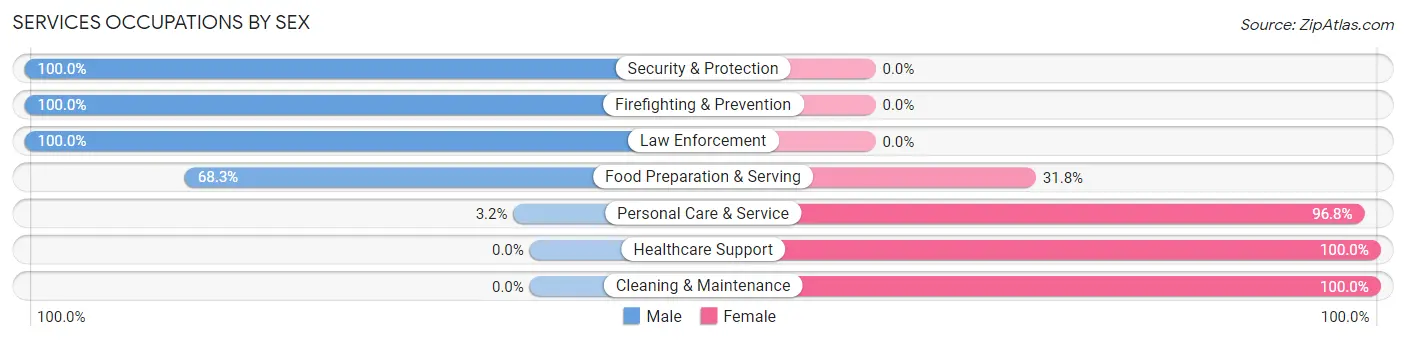
Services Occupations by Sex
Within the Services occupations in Garza County, the most male-oriented occupations are Security & Protection (100.0%), Firefighting & Prevention (100.0%), and Law Enforcement (100.0%), while the most female-oriented occupations are Healthcare Support (100.0%), Cleaning & Maintenance (100.0%), and Personal Care & Service (96.8%).
| Occupation | Male | Female |
| Healthcare Support | 0 (0.0%) | 41 (100.0%) |
| Security & Protection | 24 (100.0%) | 0 (0.0%) |
| Firefighting & Prevention | 2 (100.0%) | 0 (0.0%) |
| Law Enforcement | 22 (100.0%) | 0 (0.0%) |
| Food Preparation & Serving | 129 (68.2%) | 60 (31.8%) |
| Cleaning & Maintenance | 0 (0.0%) | 21 (100.0%) |
| Personal Care & Service | 1 (3.2%) | 30 (96.8%) |
| Total (Category) | 154 (50.3%) | 152 (49.7%) |
| Total (Overall) | 940 (56.6%) | 722 (43.4%) |
Sales and Office Occupations
The most common Sales and Office occupations in Garza County are Office & Administration (159 | 9.6%), and Sales & Related (91 | 5.5%).

Sales and Office Occupations by Sex

| Occupation | Male | Female |
| Sales & Related | 48 (52.7%) | 43 (47.2%) |
| Office & Administration | 22 (13.8%) | 137 (86.2%) |
| Total (Category) | 70 (28.0%) | 180 (72.0%) |
| Total (Overall) | 940 (56.6%) | 722 (43.4%) |
Natural Resources, Construction and Maintenance Occupations
The most common Natural Resources, Construction and Maintenance occupations in Garza County are Construction & Extraction (115 | 6.9%), Installation, Maintenance & Repair (15 | 0.9%), and Farming, Fishing & Forestry (10 | 0.6%).
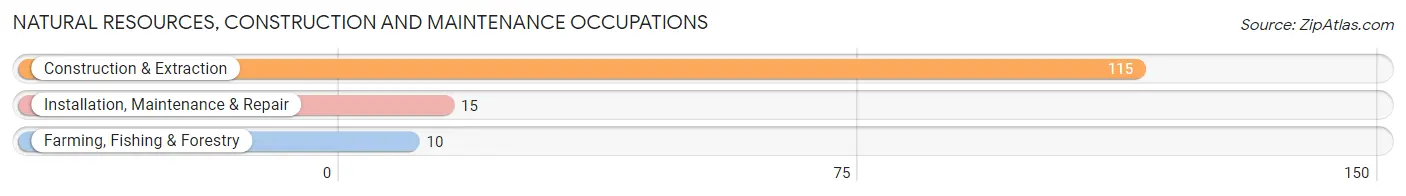
Natural Resources, Construction and Maintenance Occupations by Sex
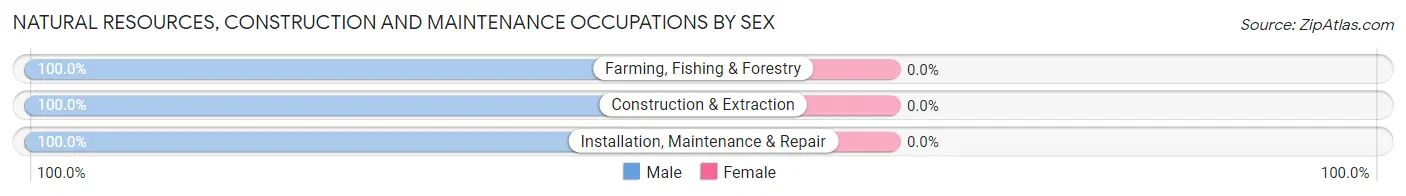
| Occupation | Male | Female |
| Farming, Fishing & Forestry | 10 (100.0%) | 0 (0.0%) |
| Construction & Extraction | 115 (100.0%) | 0 (0.0%) |
| Installation, Maintenance & Repair | 15 (100.0%) | 0 (0.0%) |
| Total (Category) | 140 (100.0%) | 0 (0.0%) |
| Total (Overall) | 940 (56.6%) | 722 (43.4%) |
Production, Transportation and Moving Occupations
The most common Production, Transportation and Moving occupations in Garza County are Transportation (180 | 10.8%), Production (106 | 6.4%), and Material Moving (47 | 2.8%).
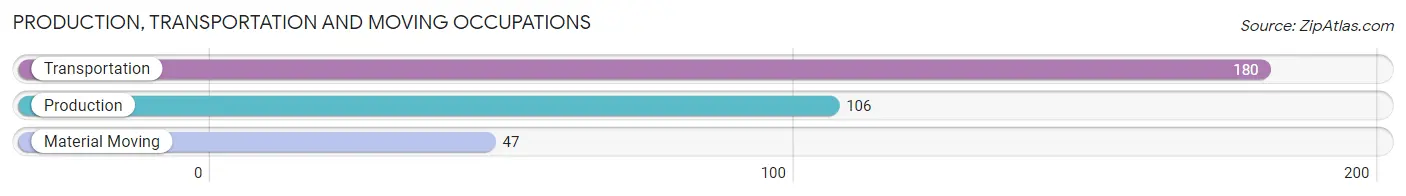
Production, Transportation and Moving Occupations by Sex
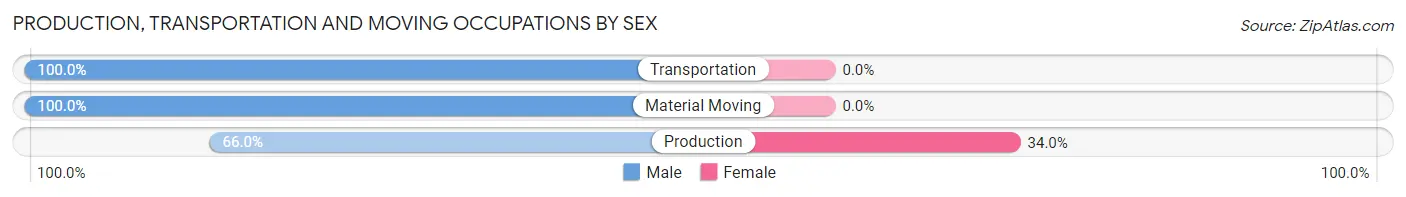
| Occupation | Male | Female |
| Production | 70 (66.0%) | 36 (34.0%) |
| Transportation | 180 (100.0%) | 0 (0.0%) |
| Material Moving | 47 (100.0%) | 0 (0.0%) |
| Total (Category) | 297 (89.2%) | 36 (10.8%) |
| Total (Overall) | 940 (56.6%) | 722 (43.4%) |
Employment Industries by Sex in Garza County
Employment Industries in Garza County
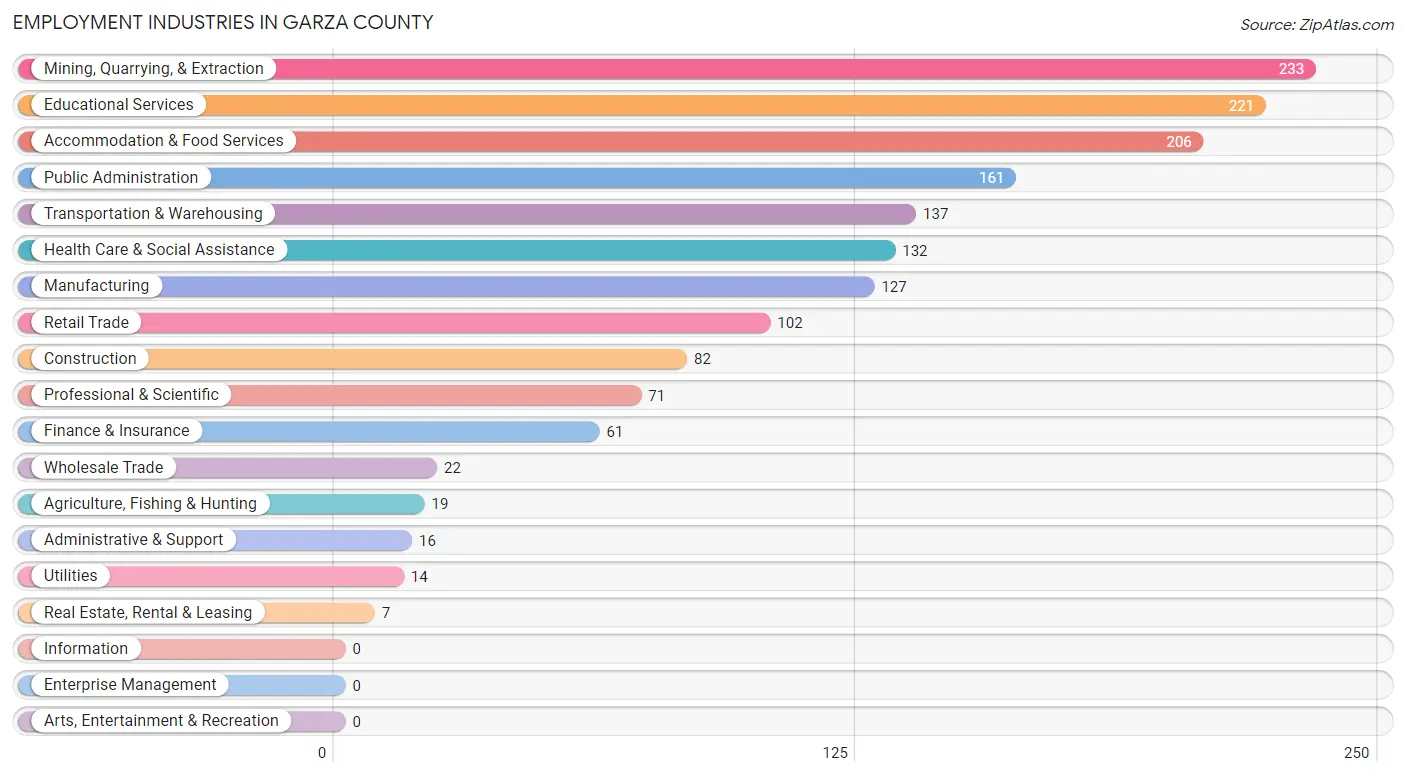
The major employment industries in Garza County include Mining, Quarrying, & Extraction (233 | 14.0%), Educational Services (221 | 13.3%), Accommodation & Food Services (206 | 12.4%), Public Administration (161 | 9.7%), and Transportation & Warehousing (137 | 8.2%).
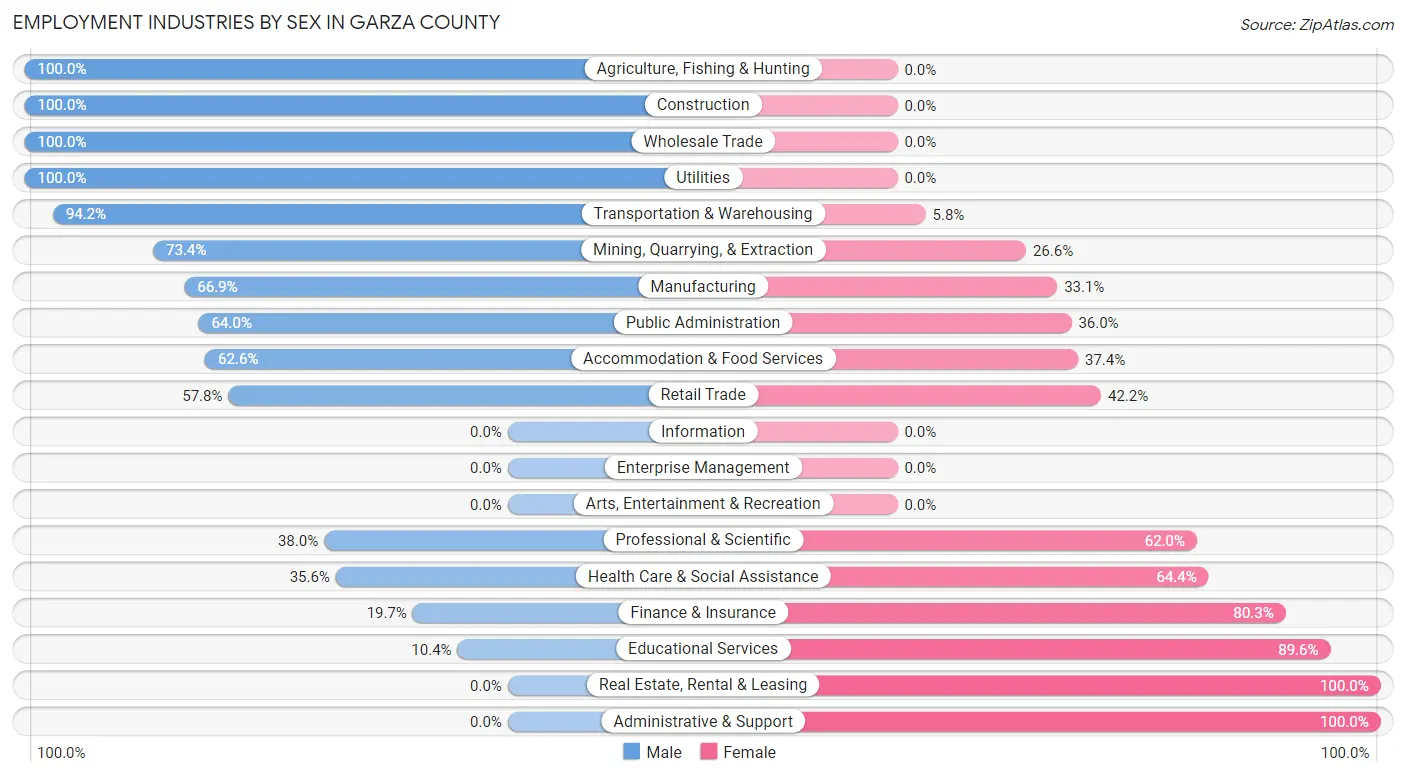
Employment Industries by Sex in Garza County
The Garza County industries that see more men than women are Agriculture, Fishing & Hunting (100.0%), Construction (100.0%), and Wholesale Trade (100.0%), whereas the industries that tend to have a higher number of women are Real Estate, Rental & Leasing (100.0%), Administrative & Support (100.0%), and Educational Services (89.6%).
| Industry | Male | Female |
| Agriculture, Fishing & Hunting | 19 (100.0%) | 0 (0.0%) |
| Mining, Quarrying, & Extraction | 171 (73.4%) | 62 (26.6%) |
| Construction | 82 (100.0%) | 0 (0.0%) |
| Manufacturing | 85 (66.9%) | 42 (33.1%) |
| Wholesale Trade | 22 (100.0%) | 0 (0.0%) |
| Retail Trade | 59 (57.8%) | 43 (42.2%) |
| Transportation & Warehousing | 129 (94.2%) | 8 (5.8%) |
| Utilities | 14 (100.0%) | 0 (0.0%) |
| Information | 0 (0.0%) | 0 (0.0%) |
| Finance & Insurance | 12 (19.7%) | 49 (80.3%) |
| Real Estate, Rental & Leasing | 0 (0.0%) | 7 (100.0%) |
| Professional & Scientific | 27 (38.0%) | 44 (62.0%) |
| Enterprise Management | 0 (0.0%) | 0 (0.0%) |
| Administrative & Support | 0 (0.0%) | 16 (100.0%) |
| Educational Services | 23 (10.4%) | 198 (89.6%) |
| Health Care & Social Assistance | 47 (35.6%) | 85 (64.4%) |
| Arts, Entertainment & Recreation | 0 (0.0%) | 0 (0.0%) |
| Accommodation & Food Services | 129 (62.6%) | 77 (37.4%) |
| Public Administration | 103 (64.0%) | 58 (36.0%) |
| Total | 940 (56.6%) | 722 (43.4%) |
Education in Garza County
School Enrollment in Garza County
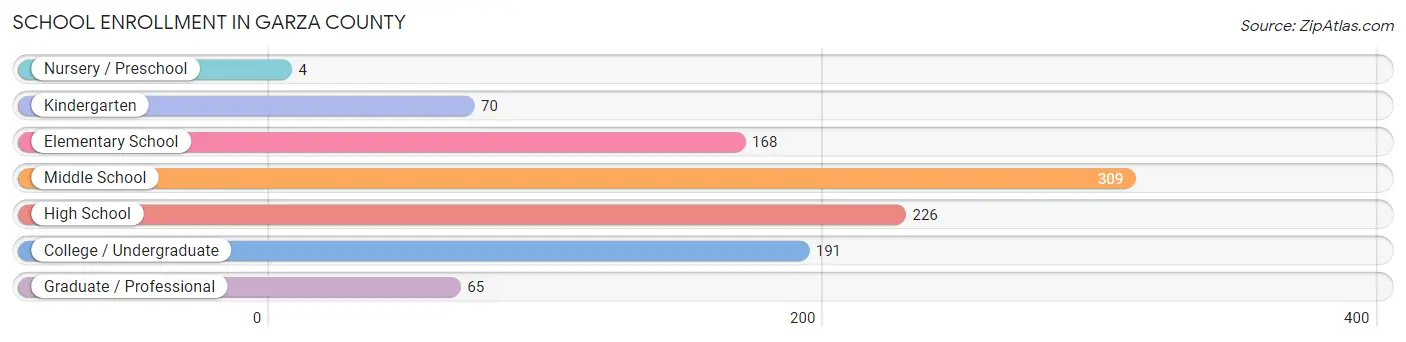
The most common levels of schooling among the 1,033 students in Garza County are middle school (309 | 29.9%), high school (226 | 21.9%), and college / undergraduate (191 | 18.5%).
| School Level | # Students | % Students |
| Nursery / Preschool | 4 | 0.4% |
| Kindergarten | 70 | 6.8% |
| Elementary School | 168 | 16.3% |
| Middle School | 309 | 29.9% |
| High School | 226 | 21.9% |
| College / Undergraduate | 191 | 18.5% |
| Graduate / Professional | 65 | 6.3% |
| Total | 1,033 | 100.0% |
School Enrollment by Age by Funding Source in Garza County
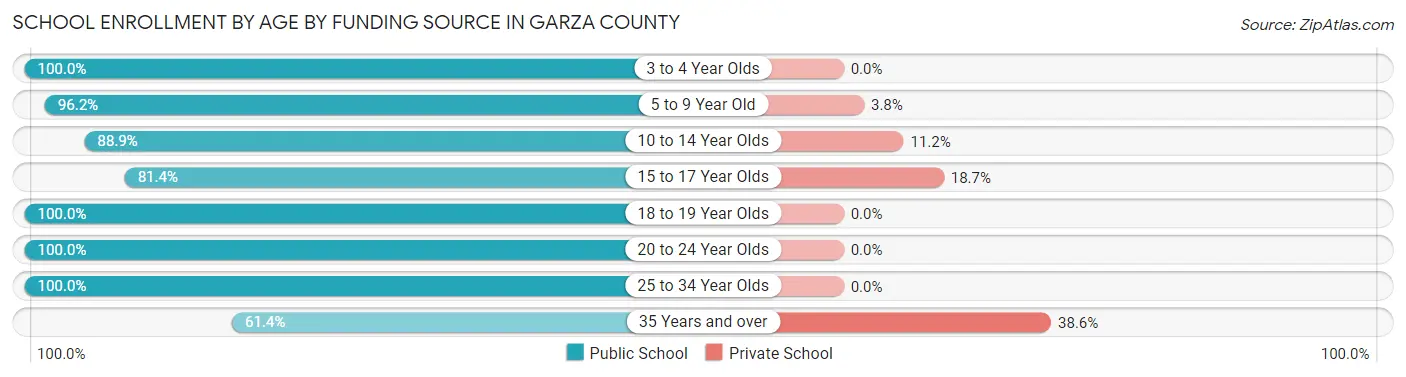
Out of a total of 1,033 students who are enrolled in schools in Garza County, 96 (9.3%) attend a private institution, while the remaining 937 (90.7%) are enrolled in public schools. The age group of 35 years and over has the highest likelihood of being enrolled in private schools, with 17 (38.6% in the age bracket) enrolled. Conversely, the age group of 3 to 4 year olds has the lowest likelihood of being enrolled in a private school, with 4 (100.0% in the age bracket) attending a public institution.
| Age Bracket | Public School | Private School |
| 3 to 4 Year Olds | 4 (100.0%) | 0 (0.0%) |
| 5 to 9 Year Old | 203 (96.2%) | 8 (3.8%) |
| 10 to 14 Year Olds | 279 (88.8%) | 35 (11.2%) |
| 15 to 17 Year Olds | 157 (81.4%) | 36 (18.6%) |
| 18 to 19 Year Olds | 87 (100.0%) | 0 (0.0%) |
| 20 to 24 Year Olds | 168 (100.0%) | 0 (0.0%) |
| 25 to 34 Year Olds | 12 (100.0%) | 0 (0.0%) |
| 35 Years and over | 27 (61.4%) | 17 (38.6%) |
| Total | 937 (90.7%) | 96 (9.3%) |
Educational Attainment by Field of Study in Garza County
Bio, nature & agricultural (137 | 23.2%), business (88 | 14.9%), arts & humanities (67 | 11.3%), communications (56 | 9.5%), and science & technology (54 | 9.1%) are the most common fields of study among 591 individuals in Garza County who have obtained a bachelor's degree or higher.
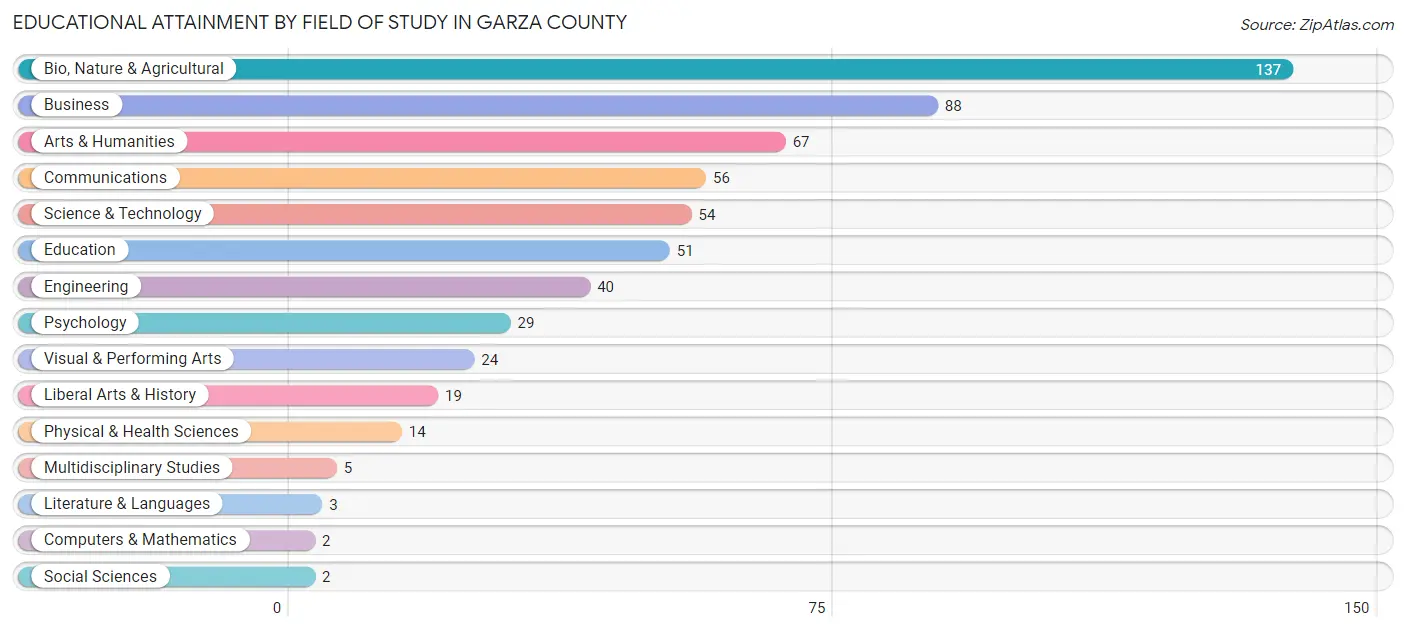
| Field of Study | # Graduates | % Graduates |
| Computers & Mathematics | 2 | 0.3% |
| Bio, Nature & Agricultural | 137 | 23.2% |
| Physical & Health Sciences | 14 | 2.4% |
| Psychology | 29 | 4.9% |
| Social Sciences | 2 | 0.3% |
| Engineering | 40 | 6.8% |
| Multidisciplinary Studies | 5 | 0.9% |
| Science & Technology | 54 | 9.1% |
| Business | 88 | 14.9% |
| Education | 51 | 8.6% |
| Literature & Languages | 3 | 0.5% |
| Liberal Arts & History | 19 | 3.2% |
| Visual & Performing Arts | 24 | 4.1% |
| Communications | 56 | 9.5% |
| Arts & Humanities | 67 | 11.3% |
| Total | 591 | 100.0% |
Transportation & Commute in Garza County
Vehicle Availability by Sex in Garza County
The most prevalent vehicle ownership categories in Garza County are males with 2 vehicles (309, accounting for 32.9%) and females with 2 vehicles (294, making up 45.7%).
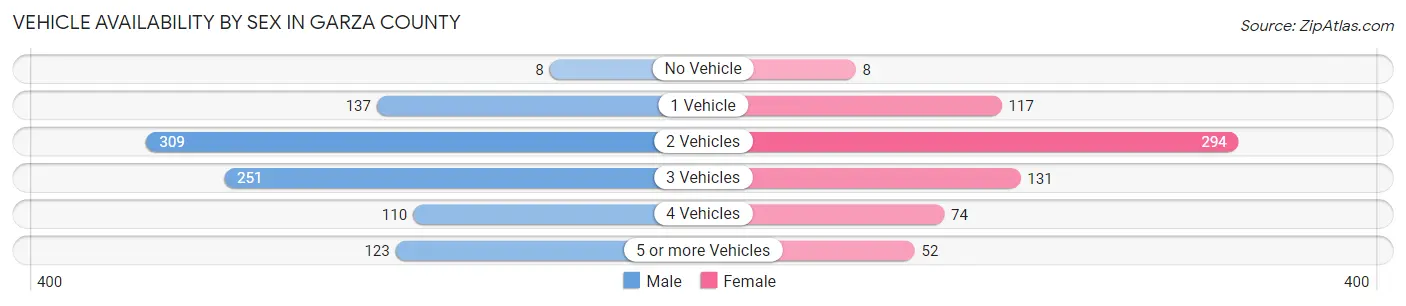
| Vehicles Available | Male | Female |
| No Vehicle | 8 (0.9%) | 8 (1.2%) |
| 1 Vehicle | 137 (14.6%) | 117 (17.3%) |
| 2 Vehicles | 309 (32.9%) | 294 (43.5%) |
| 3 Vehicles | 251 (26.8%) | 131 (19.4%) |
| 4 Vehicles | 110 (11.7%) | 74 (11.0%) |
| 5 or more Vehicles | 123 (13.1%) | 52 (7.7%) |
| Total | 938 (100.0%) | 676 (100.0%) |
Commute Time in Garza County
The most frequently occuring commute durations in Garza County are less than 5 minutes (438 commuters, 27.1%), 5 to 9 minutes (343 commuters, 21.2%), and 10 to 14 minutes (244 commuters, 15.1%).
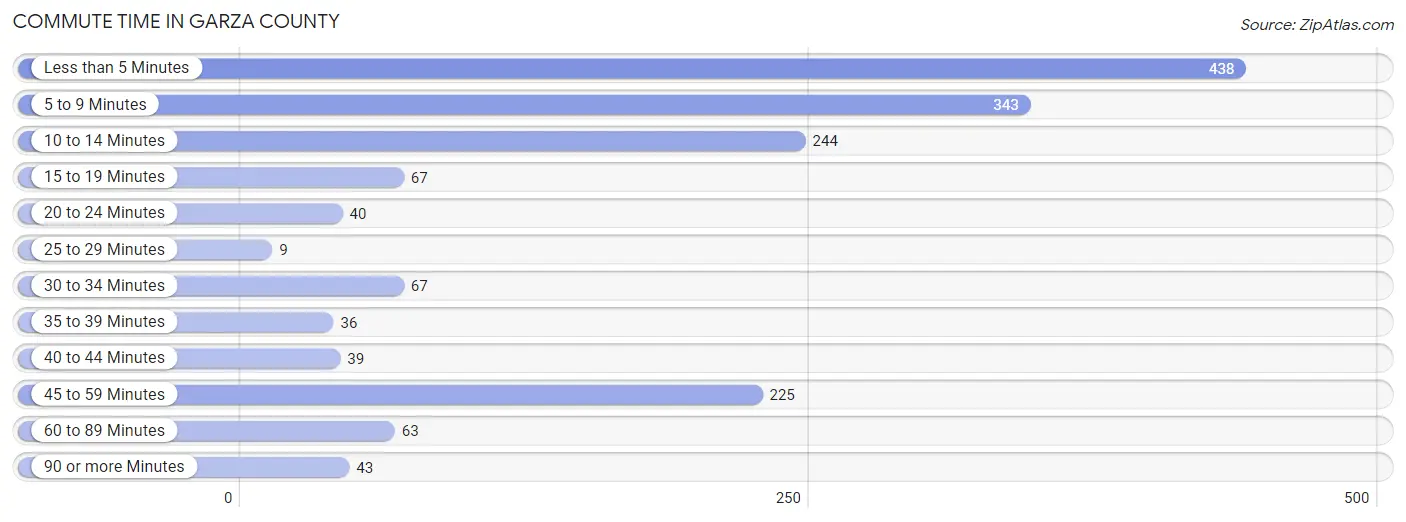
| Commute Time | # Commuters | % Commuters |
| Less than 5 Minutes | 438 | 27.1% |
| 5 to 9 Minutes | 343 | 21.2% |
| 10 to 14 Minutes | 244 | 15.1% |
| 15 to 19 Minutes | 67 | 4.2% |
| 20 to 24 Minutes | 40 | 2.5% |
| 25 to 29 Minutes | 9 | 0.6% |
| 30 to 34 Minutes | 67 | 4.2% |
| 35 to 39 Minutes | 36 | 2.2% |
| 40 to 44 Minutes | 39 | 2.4% |
| 45 to 59 Minutes | 225 | 13.9% |
| 60 to 89 Minutes | 63 | 3.9% |
| 90 or more Minutes | 43 | 2.7% |
Commute Time by Sex in Garza County
The most common commute times in Garza County are less than 5 minutes (225 commuters, 24.0%) for males and less than 5 minutes (213 commuters, 31.5%) for females.
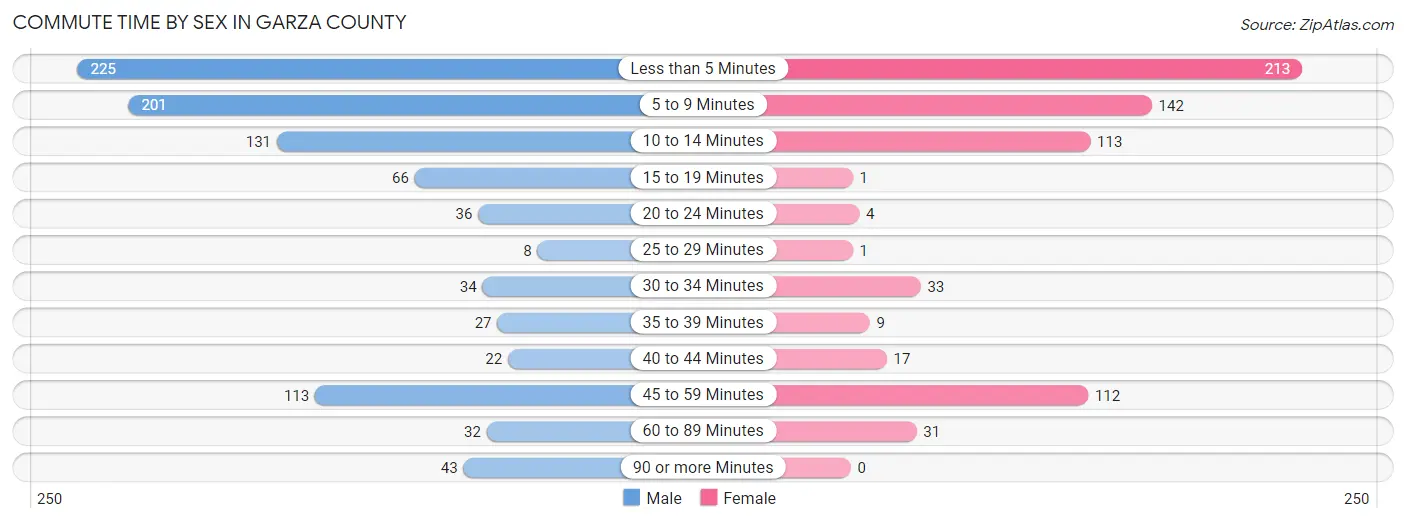
| Commute Time | Male | Female |
| Less than 5 Minutes | 225 (24.0%) | 213 (31.5%) |
| 5 to 9 Minutes | 201 (21.4%) | 142 (21.0%) |
| 10 to 14 Minutes | 131 (14.0%) | 113 (16.7%) |
| 15 to 19 Minutes | 66 (7.0%) | 1 (0.2%) |
| 20 to 24 Minutes | 36 (3.8%) | 4 (0.6%) |
| 25 to 29 Minutes | 8 (0.9%) | 1 (0.2%) |
| 30 to 34 Minutes | 34 (3.6%) | 33 (4.9%) |
| 35 to 39 Minutes | 27 (2.9%) | 9 (1.3%) |
| 40 to 44 Minutes | 22 (2.4%) | 17 (2.5%) |
| 45 to 59 Minutes | 113 (12.0%) | 112 (16.6%) |
| 60 to 89 Minutes | 32 (3.4%) | 31 (4.6%) |
| 90 or more Minutes | 43 (4.6%) | 0 (0.0%) |
Time of Departure to Work by Sex in Garza County
The most frequent times of departure to work in Garza County are 8:00 AM to 8:29 AM (189, 20.2%) for males and 7:30 AM to 7:59 AM (128, 18.9%) for females.
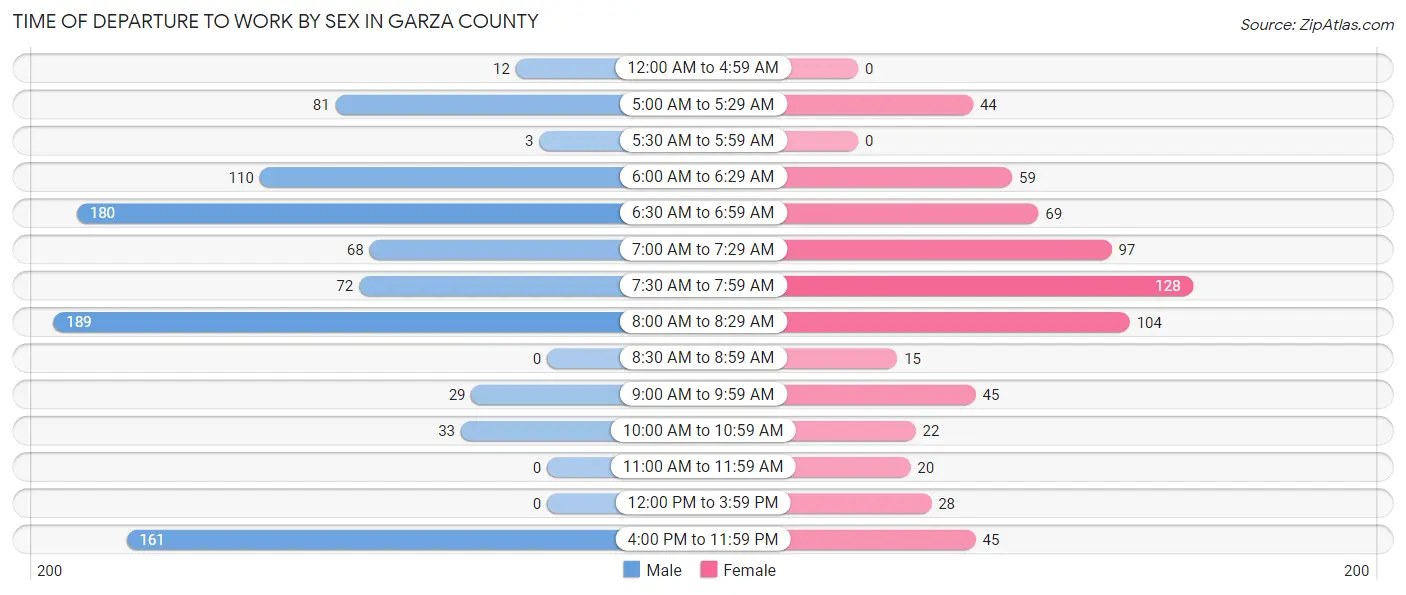
| Time of Departure | Male | Female |
| 12:00 AM to 4:59 AM | 12 (1.3%) | 0 (0.0%) |
| 5:00 AM to 5:29 AM | 81 (8.6%) | 44 (6.5%) |
| 5:30 AM to 5:59 AM | 3 (0.3%) | 0 (0.0%) |
| 6:00 AM to 6:29 AM | 110 (11.7%) | 59 (8.7%) |
| 6:30 AM to 6:59 AM | 180 (19.2%) | 69 (10.2%) |
| 7:00 AM to 7:29 AM | 68 (7.2%) | 97 (14.3%) |
| 7:30 AM to 7:59 AM | 72 (7.7%) | 128 (18.9%) |
| 8:00 AM to 8:29 AM | 189 (20.2%) | 104 (15.4%) |
| 8:30 AM to 8:59 AM | 0 (0.0%) | 15 (2.2%) |
| 9:00 AM to 9:59 AM | 29 (3.1%) | 45 (6.7%) |
| 10:00 AM to 10:59 AM | 33 (3.5%) | 22 (3.3%) |
| 11:00 AM to 11:59 AM | 0 (0.0%) | 20 (3.0%) |
| 12:00 PM to 3:59 PM | 0 (0.0%) | 28 (4.1%) |
| 4:00 PM to 11:59 PM | 161 (17.2%) | 45 (6.7%) |
| Total | 938 (100.0%) | 676 (100.0%) |
Housing Occupancy in Garza County
Occupancy by Ownership in Garza County
Of the total 1,677 dwellings in Garza County, owner-occupied units account for 1,167 (69.6%), while renter-occupied units make up 510 (30.4%).
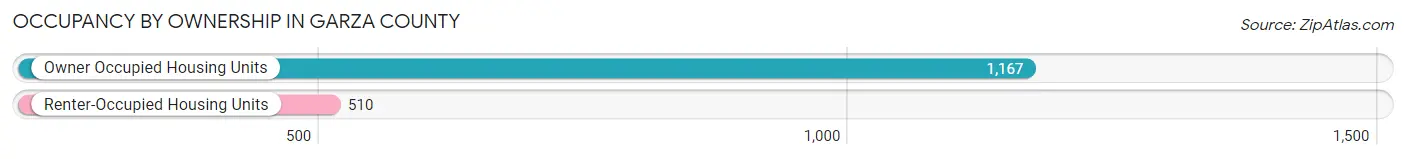
| Occupancy | # Housing Units | % Housing Units |
| Owner Occupied Housing Units | 1,167 | 69.6% |
| Renter-Occupied Housing Units | 510 | 30.4% |
| Total Occupied Housing Units | 1,677 | 100.0% |
Occupancy by Household Size in Garza County
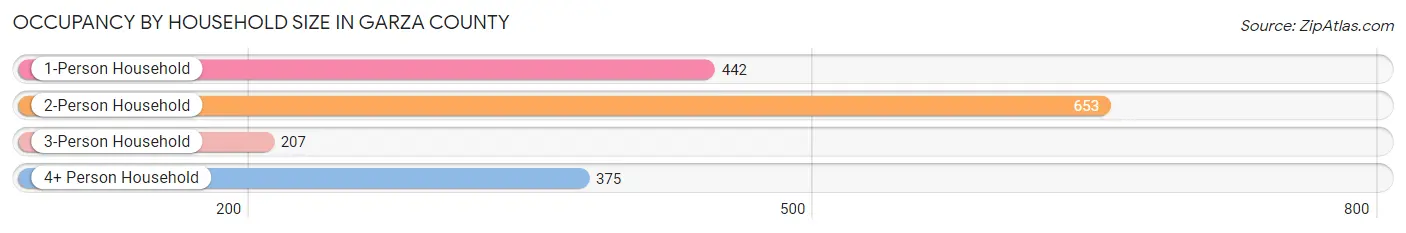
| Household Size | # Housing Units | % Housing Units |
| 1-Person Household | 442 | 26.4% |
| 2-Person Household | 653 | 38.9% |
| 3-Person Household | 207 | 12.3% |
| 4+ Person Household | 375 | 22.4% |
| Total Housing Units | 1,677 | 100.0% |
Occupancy by Ownership by Household Size in Garza County
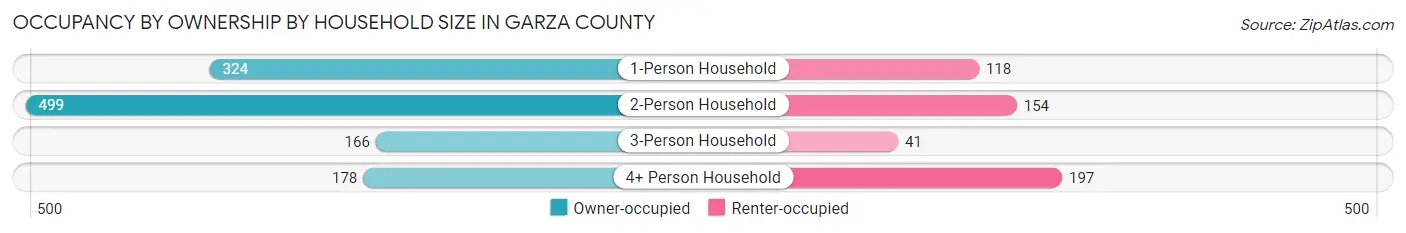
| Household Size | Owner-occupied | Renter-occupied |
| 1-Person Household | 324 (73.3%) | 118 (26.7%) |
| 2-Person Household | 499 (76.4%) | 154 (23.6%) |
| 3-Person Household | 166 (80.2%) | 41 (19.8%) |
| 4+ Person Household | 178 (47.5%) | 197 (52.5%) |
| Total Housing Units | 1,167 (69.6%) | 510 (30.4%) |
Occupancy by Educational Attainment in Garza County
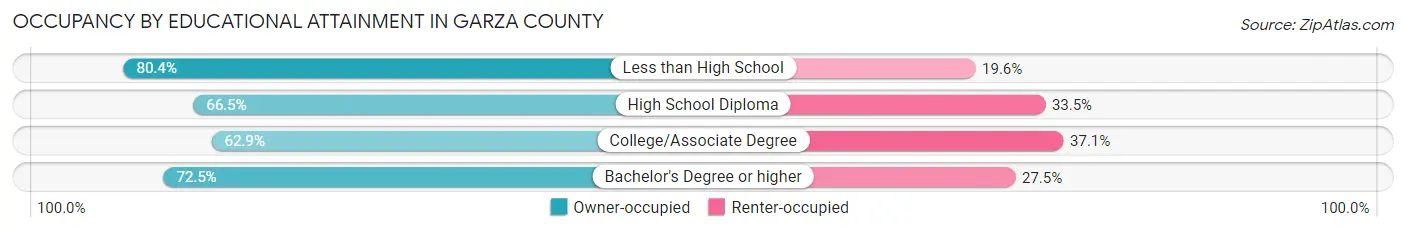
| Household Size | Owner-occupied | Renter-occupied |
| Less than High School | 295 (80.4%) | 72 (19.6%) |
| High School Diploma | 342 (66.5%) | 172 (33.5%) |
| College/Associate Degree | 309 (62.9%) | 182 (37.1%) |
| Bachelor's Degree or higher | 221 (72.5%) | 84 (27.5%) |
Occupancy by Age of Householder in Garza County
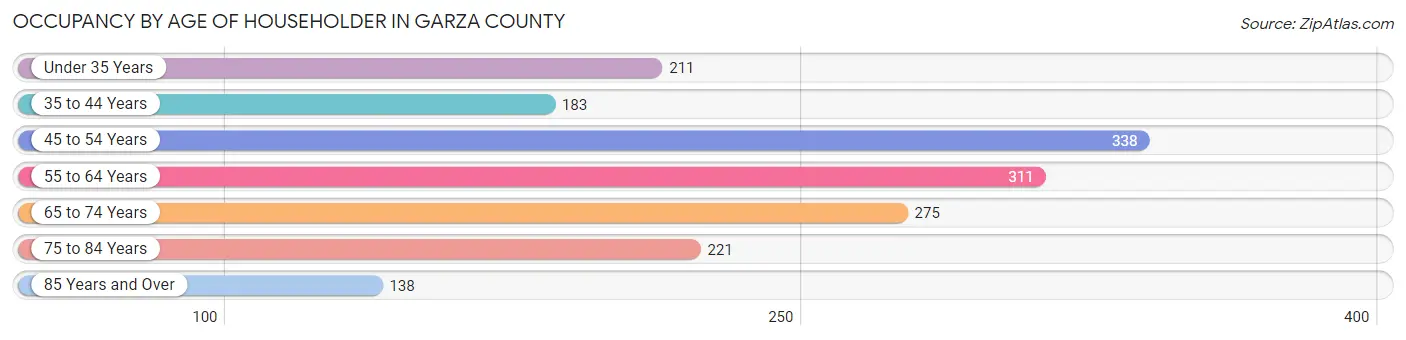
| Age Bracket | # Households | % Households |
| Under 35 Years | 211 | 12.6% |
| 35 to 44 Years | 183 | 10.9% |
| 45 to 54 Years | 338 | 20.2% |
| 55 to 64 Years | 311 | 18.5% |
| 65 to 74 Years | 275 | 16.4% |
| 75 to 84 Years | 221 | 13.2% |
| 85 Years and Over | 138 | 8.2% |
| Total | 1,677 | 100.0% |
Housing Finances in Garza County
Median Income by Occupancy in Garza County
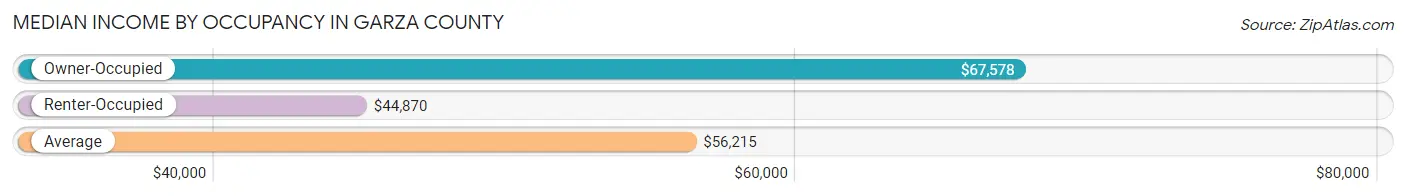
| Occupancy Type | # Households | Median Income |
| Owner-Occupied | 1,167 (69.6%) | $67,578 |
| Renter-Occupied | 510 (30.4%) | $44,870 |
| Average | 1,677 (100.0%) | $56,215 |
Occupancy by Householder Income Bracket in Garza County
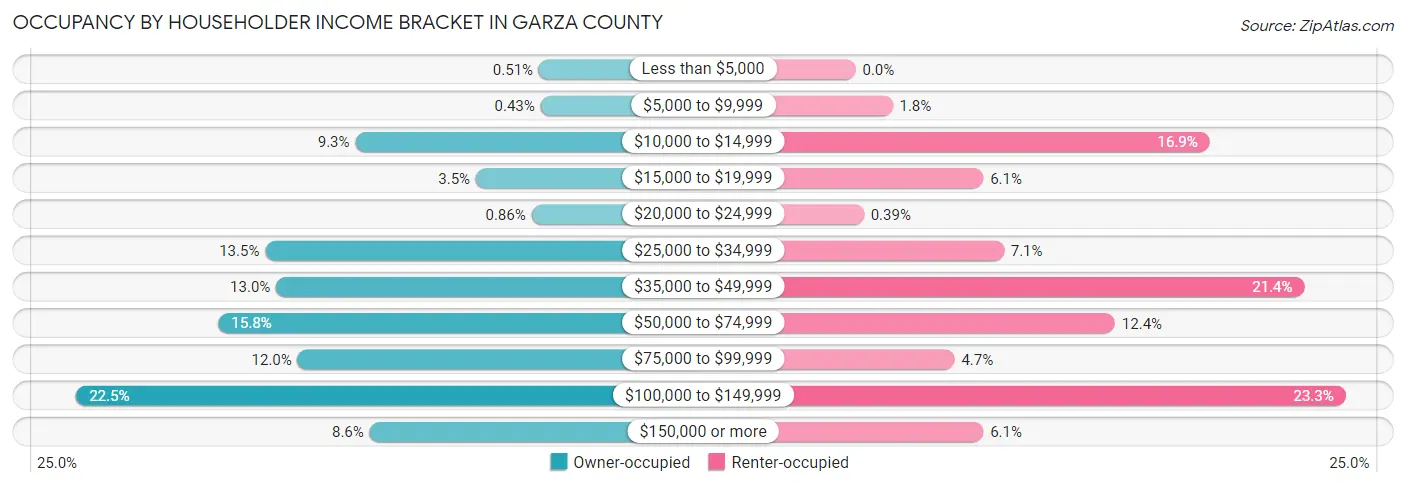
| Income Bracket | Owner-occupied | Renter-occupied |
| Less than $5,000 | 6 (0.5%) | 0 (0.0%) |
| $5,000 to $9,999 | 5 (0.4%) | 9 (1.8%) |
| $10,000 to $14,999 | 108 (9.2%) | 86 (16.9%) |
| $15,000 to $19,999 | 41 (3.5%) | 31 (6.1%) |
| $20,000 to $24,999 | 10 (0.9%) | 2 (0.4%) |
| $25,000 to $34,999 | 158 (13.5%) | 36 (7.1%) |
| $35,000 to $49,999 | 152 (13.0%) | 109 (21.4%) |
| $50,000 to $74,999 | 184 (15.8%) | 63 (12.3%) |
| $75,000 to $99,999 | 140 (12.0%) | 24 (4.7%) |
| $100,000 to $149,999 | 263 (22.5%) | 119 (23.3%) |
| $150,000 or more | 100 (8.6%) | 31 (6.1%) |
| Total | 1,167 (100.0%) | 510 (100.0%) |
Monthly Housing Cost Tiers in Garza County
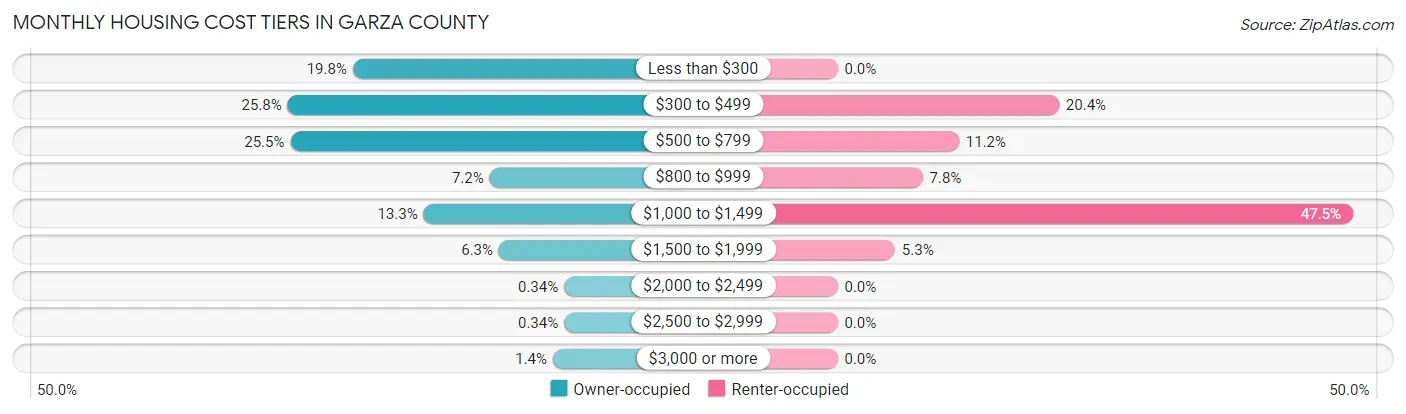
| Monthly Cost | Owner-occupied | Renter-occupied |
| Less than $300 | 231 (19.8%) | 0 (0.0%) |
| $300 to $499 | 301 (25.8%) | 104 (20.4%) |
| $500 to $799 | 298 (25.5%) | 57 (11.2%) |
| $800 to $999 | 84 (7.2%) | 40 (7.8%) |
| $1,000 to $1,499 | 155 (13.3%) | 242 (47.4%) |
| $1,500 to $1,999 | 74 (6.3%) | 27 (5.3%) |
| $2,000 to $2,499 | 4 (0.3%) | 0 (0.0%) |
| $2,500 to $2,999 | 4 (0.3%) | 0 (0.0%) |
| $3,000 or more | 16 (1.4%) | 0 (0.0%) |
| Total | 1,167 (100.0%) | 510 (100.0%) |
Physical Housing Characteristics in Garza County
Housing Structures in Garza County
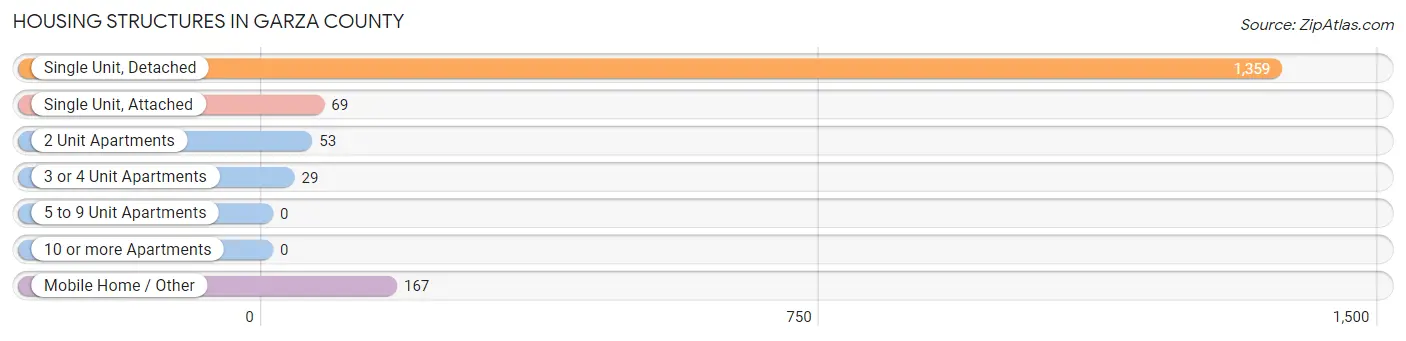
| Structure Type | # Housing Units | % Housing Units |
| Single Unit, Detached | 1,359 | 81.0% |
| Single Unit, Attached | 69 | 4.1% |
| 2 Unit Apartments | 53 | 3.2% |
| 3 or 4 Unit Apartments | 29 | 1.7% |
| 5 to 9 Unit Apartments | 0 | 0.0% |
| 10 or more Apartments | 0 | 0.0% |
| Mobile Home / Other | 167 | 10.0% |
| Total | 1,677 | 100.0% |
Housing Structures by Occupancy in Garza County
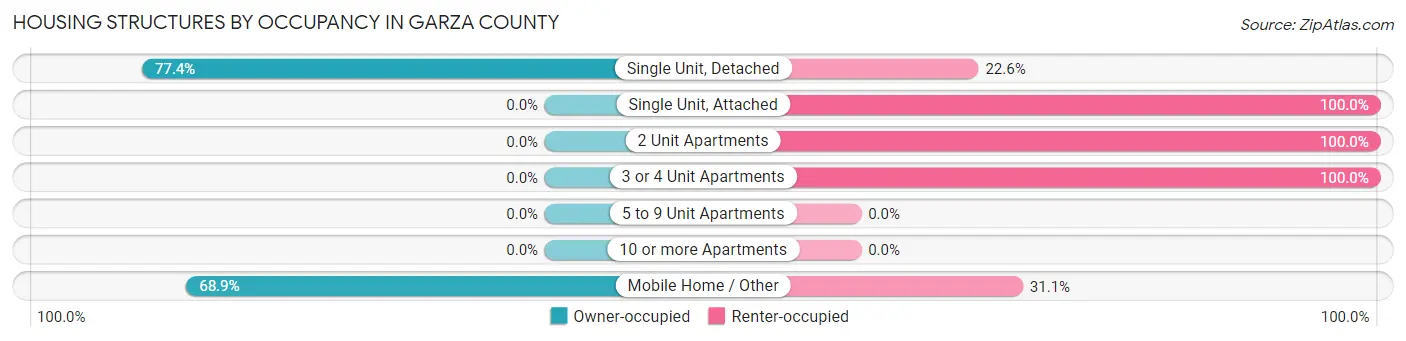
| Structure Type | Owner-occupied | Renter-occupied |
| Single Unit, Detached | 1,052 (77.4%) | 307 (22.6%) |
| Single Unit, Attached | 0 (0.0%) | 69 (100.0%) |
| 2 Unit Apartments | 0 (0.0%) | 53 (100.0%) |
| 3 or 4 Unit Apartments | 0 (0.0%) | 29 (100.0%) |
| 5 to 9 Unit Apartments | 0 (0.0%) | 0 (0.0%) |
| 10 or more Apartments | 0 (0.0%) | 0 (0.0%) |
| Mobile Home / Other | 115 (68.9%) | 52 (31.1%) |
| Total | 1,167 (69.6%) | 510 (30.4%) |
Housing Structures by Number of Rooms in Garza County
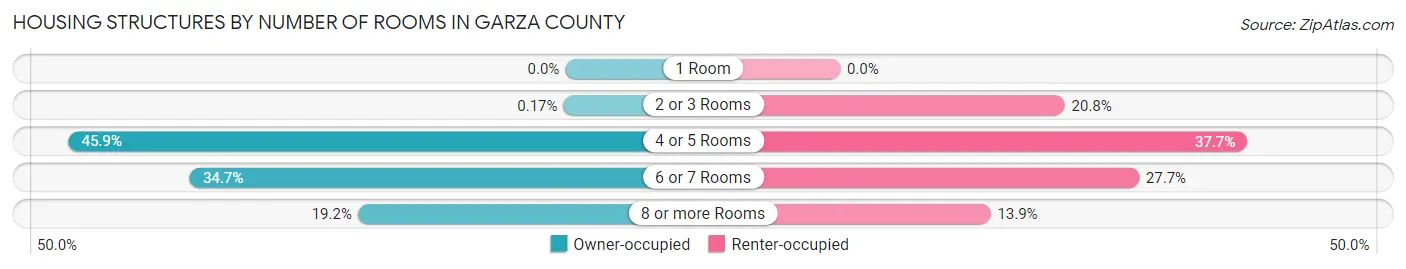
| Number of Rooms | Owner-occupied | Renter-occupied |
| 1 Room | 0 (0.0%) | 0 (0.0%) |
| 2 or 3 Rooms | 2 (0.2%) | 106 (20.8%) |
| 4 or 5 Rooms | 536 (45.9%) | 192 (37.7%) |
| 6 or 7 Rooms | 405 (34.7%) | 141 (27.7%) |
| 8 or more Rooms | 224 (19.2%) | 71 (13.9%) |
| Total | 1,167 (100.0%) | 510 (100.0%) |
Housing Structure by Heating Type in Garza County
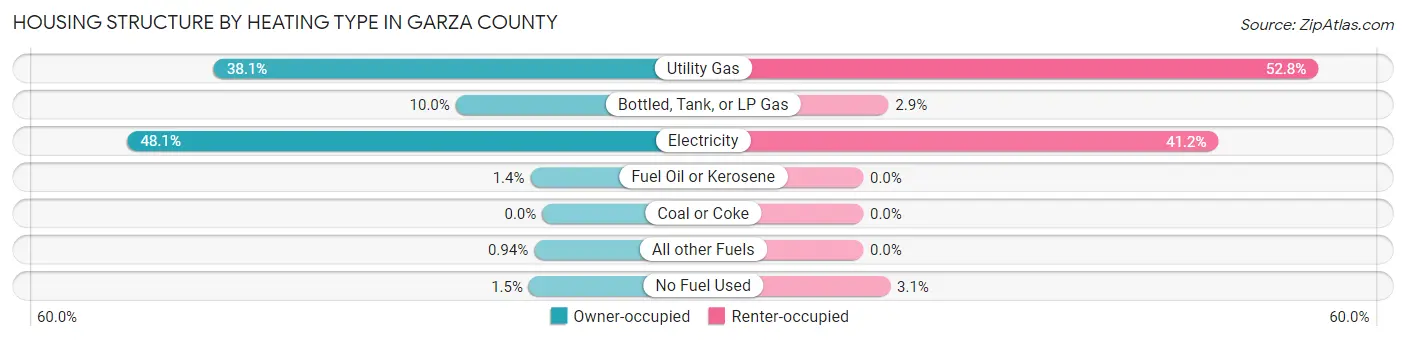
| Heating Type | Owner-occupied | Renter-occupied |
| Utility Gas | 444 (38.1%) | 269 (52.7%) |
| Bottled, Tank, or LP Gas | 117 (10.0%) | 15 (2.9%) |
| Electricity | 561 (48.1%) | 210 (41.2%) |
| Fuel Oil or Kerosene | 16 (1.4%) | 0 (0.0%) |
| Coal or Coke | 0 (0.0%) | 0 (0.0%) |
| All other Fuels | 11 (0.9%) | 0 (0.0%) |
| No Fuel Used | 18 (1.5%) | 16 (3.1%) |
| Total | 1,167 (100.0%) | 510 (100.0%) |
Household Vehicle Usage in Garza County
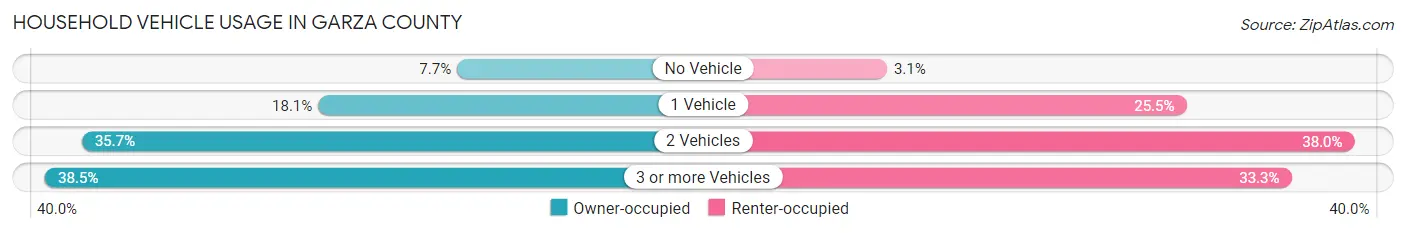
| Vehicles per Household | Owner-occupied | Renter-occupied |
| No Vehicle | 90 (7.7%) | 16 (3.1%) |
| 1 Vehicle | 211 (18.1%) | 130 (25.5%) |
| 2 Vehicles | 417 (35.7%) | 194 (38.0%) |
| 3 or more Vehicles | 449 (38.5%) | 170 (33.3%) |
| Total | 1,167 (100.0%) | 510 (100.0%) |
Real Estate & Mortgages in Garza County
Real Estate and Mortgage Overview in Garza County
| Characteristic | Without Mortgage | With Mortgage |
| Housing Units | 932 | 235 |
| Median Property Value | $73,600 | $141,400 |
| Median Household Income | $49,118 | $57 |
| Monthly Housing Costs | $450 | $16 |
| Real Estate Taxes | $1,259 | $0 |
Property Value by Mortgage Status in Garza County
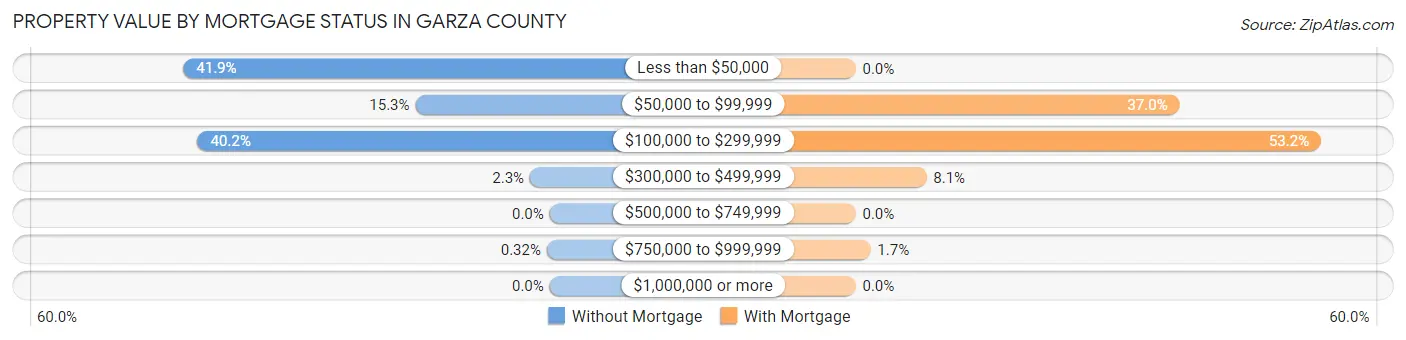
| Property Value | Without Mortgage | With Mortgage |
| Less than $50,000 | 390 (41.8%) | 0 (0.0%) |
| $50,000 to $99,999 | 143 (15.3%) | 87 (37.0%) |
| $100,000 to $299,999 | 375 (40.2%) | 125 (53.2%) |
| $300,000 to $499,999 | 21 (2.2%) | 19 (8.1%) |
| $500,000 to $749,999 | 0 (0.0%) | 0 (0.0%) |
| $750,000 to $999,999 | 3 (0.3%) | 4 (1.7%) |
| $1,000,000 or more | 0 (0.0%) | 0 (0.0%) |
| Total | 932 (100.0%) | 235 (100.0%) |
Household Income by Mortgage Status in Garza County
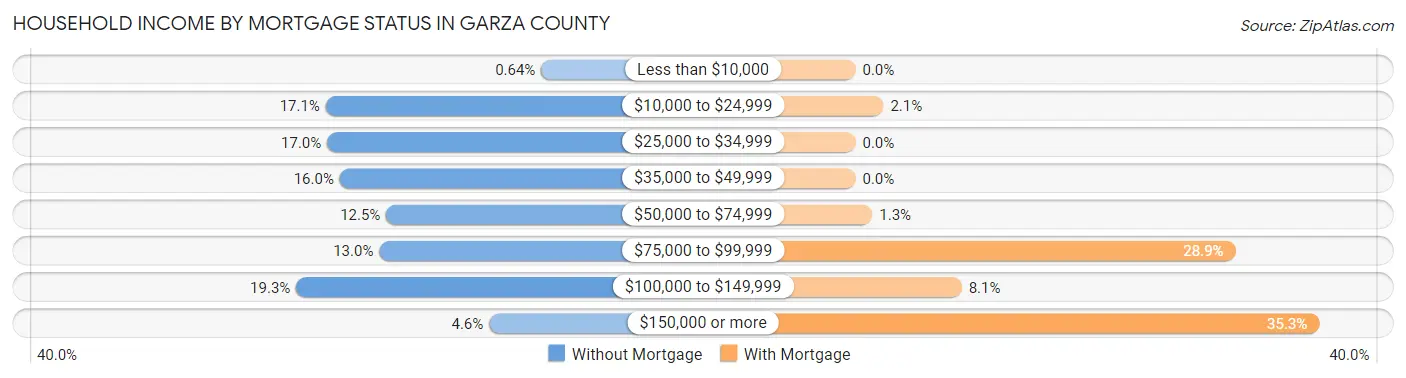
| Household Income | Without Mortgage | With Mortgage |
| Less than $10,000 | 6 (0.6%) | 0 (0.0%) |
| $10,000 to $24,999 | 159 (17.1%) | 5 (2.1%) |
| $25,000 to $34,999 | 158 (17.0%) | 0 (0.0%) |
| $35,000 to $49,999 | 149 (16.0%) | 0 (0.0%) |
| $50,000 to $74,999 | 116 (12.4%) | 3 (1.3%) |
| $75,000 to $99,999 | 121 (13.0%) | 68 (28.9%) |
| $100,000 to $149,999 | 180 (19.3%) | 19 (8.1%) |
| $150,000 or more | 43 (4.6%) | 83 (35.3%) |
| Total | 932 (100.0%) | 235 (100.0%) |
Property Value to Household Income Ratio in Garza County
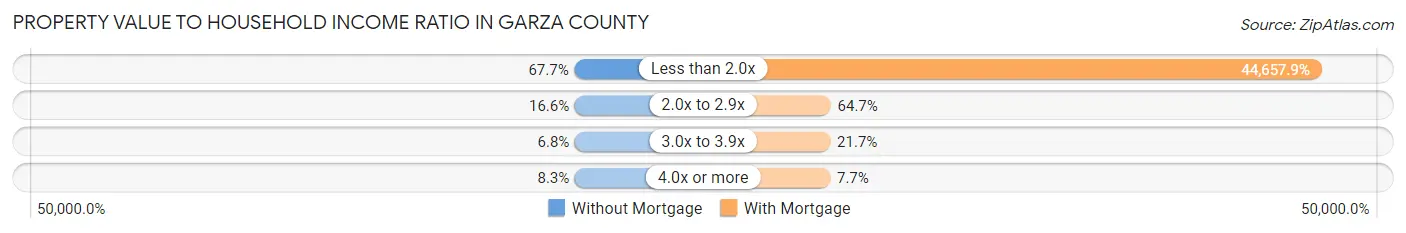
| Value-to-Income Ratio | Without Mortgage | With Mortgage |
| Less than 2.0x | 631 (67.7%) | 104,946 (44,657.9%) |
| 2.0x to 2.9x | 155 (16.6%) | 152 (64.7%) |
| 3.0x to 3.9x | 63 (6.8%) | 51 (21.7%) |
| 4.0x or more | 77 (8.3%) | 18 (7.7%) |
| Total | 932 (100.0%) | 235 (100.0%) |
Real Estate Taxes by Mortgage Status in Garza County
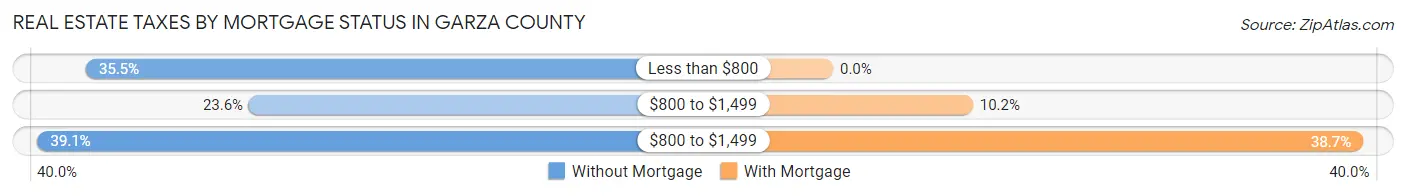
| Property Taxes | Without Mortgage | With Mortgage |
| Less than $800 | 331 (35.5%) | 0 (0.0%) |
| $800 to $1,499 | 220 (23.6%) | 24 (10.2%) |
| $800 to $1,499 | 364 (39.1%) | 91 (38.7%) |
| Total | 932 (100.0%) | 235 (100.0%) |
Health & Disability in Garza County
Health Insurance Coverage by Age in Garza County
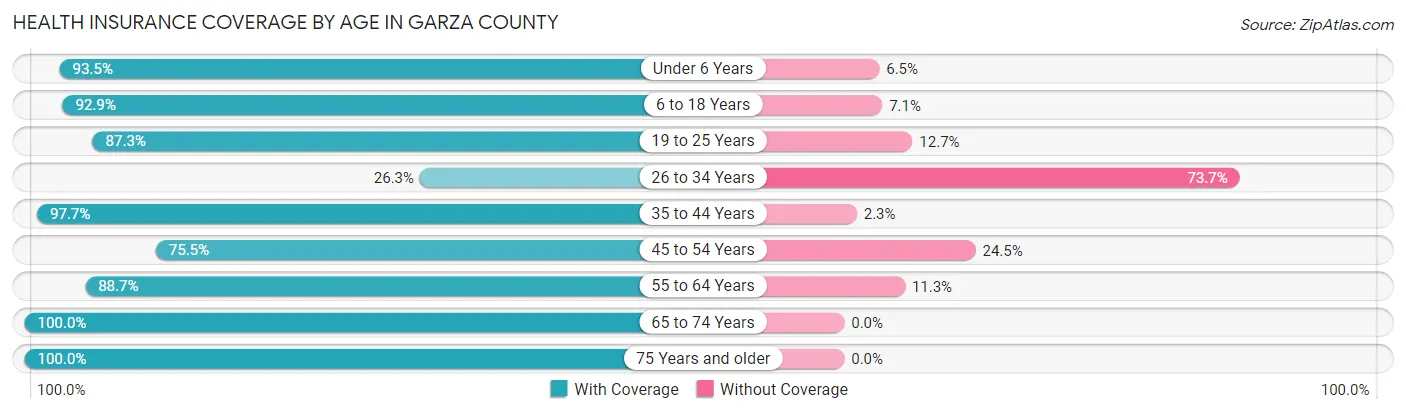
| Age Bracket | With Coverage | Without Coverage |
| Under 6 Years | 172 (93.5%) | 12 (6.5%) |
| 6 to 18 Years | 670 (92.9%) | 51 (7.1%) |
| 19 to 25 Years | 502 (87.3%) | 73 (12.7%) |
| 26 to 34 Years | 127 (26.3%) | 356 (73.7%) |
| 35 to 44 Years | 293 (97.7%) | 7 (2.3%) |
| 45 to 54 Years | 435 (75.5%) | 141 (24.5%) |
| 55 to 64 Years | 557 (88.7%) | 71 (11.3%) |
| 65 to 74 Years | 378 (100.0%) | 0 (0.0%) |
| 75 Years and older | 511 (100.0%) | 0 (0.0%) |
| Total | 3,645 (83.7%) | 711 (16.3%) |
Health Insurance Coverage by Citizenship Status in Garza County

| Citizenship Status | With Coverage | Without Coverage |
| Native Born | 172 (93.5%) | 12 (6.5%) |
| Foreign Born, Citizen | 670 (92.9%) | 51 (7.1%) |
| Foreign Born, not a Citizen | 502 (87.3%) | 73 (12.7%) |
Health Insurance Coverage by Household Income in Garza County
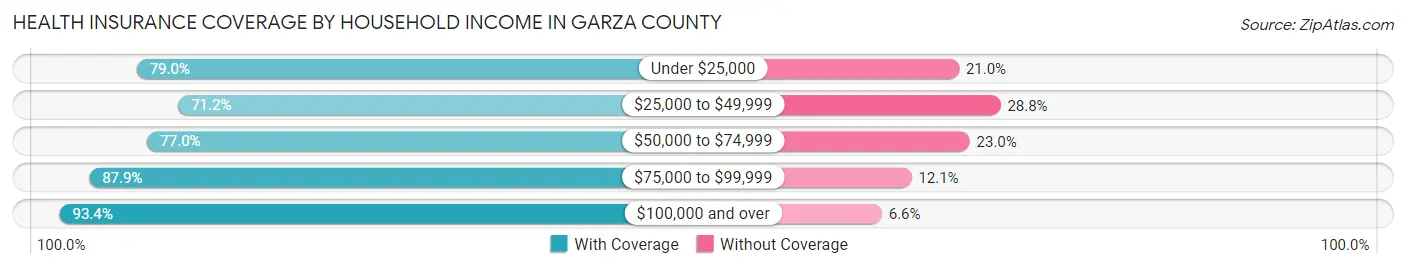
| Household Income | With Coverage | Without Coverage |
| Under $25,000 | 361 (79.0%) | 96 (21.0%) |
| $25,000 to $49,999 | 737 (71.2%) | 298 (28.8%) |
| $50,000 to $74,999 | 455 (77.0%) | 136 (23.0%) |
| $75,000 to $99,999 | 392 (87.9%) | 54 (12.1%) |
| $100,000 and over | 1,696 (93.4%) | 119 (6.6%) |
Public vs Private Health Insurance Coverage by Age in Garza County
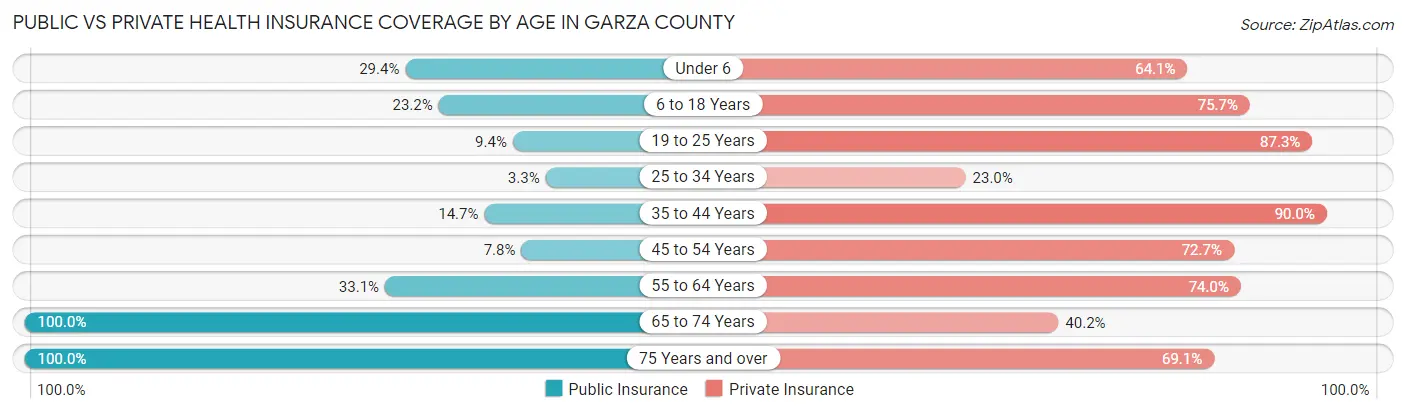
| Age Bracket | Public Insurance | Private Insurance |
| Under 6 | 54 (29.3%) | 118 (64.1%) |
| 6 to 18 Years | 167 (23.2%) | 546 (75.7%) |
| 19 to 25 Years | 54 (9.4%) | 502 (87.3%) |
| 25 to 34 Years | 16 (3.3%) | 111 (23.0%) |
| 35 to 44 Years | 44 (14.7%) | 270 (90.0%) |
| 45 to 54 Years | 45 (7.8%) | 419 (72.7%) |
| 55 to 64 Years | 208 (33.1%) | 465 (74.0%) |
| 65 to 74 Years | 378 (100.0%) | 152 (40.2%) |
| 75 Years and over | 511 (100.0%) | 353 (69.1%) |
| Total | 1,477 (33.9%) | 2,936 (67.4%) |
Disability Status by Sex by Age in Garza County
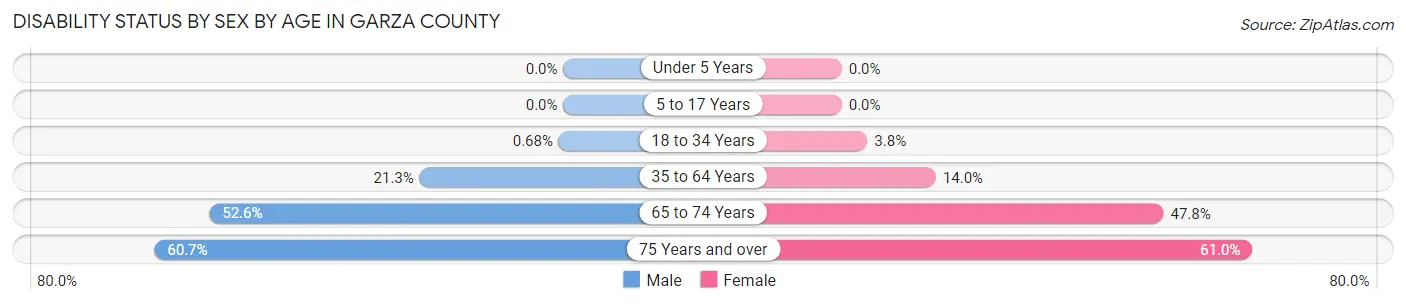
| Age Bracket | Male | Female |
| Under 5 Years | 0 (0.0%) | 0 (0.0%) |
| 5 to 17 Years | 0 (0.0%) | 0 (0.0%) |
| 18 to 34 Years | 4 (0.7%) | 20 (3.8%) |
| 35 to 64 Years | 153 (21.3%) | 110 (14.0%) |
| 65 to 74 Years | 92 (52.6%) | 97 (47.8%) |
| 75 Years and over | 133 (60.7%) | 178 (61.0%) |
Disability Class by Sex by Age in Garza County
Disability Class: Hearing Difficulty
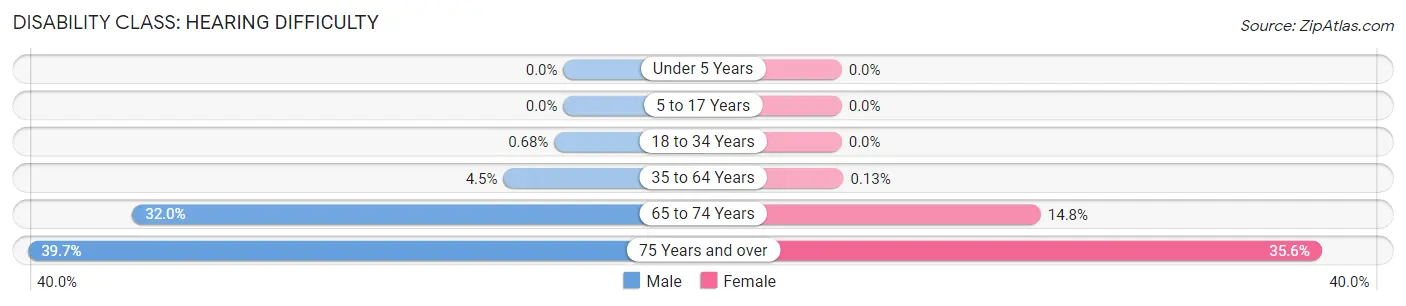
| Age Bracket | Male | Female |
| Under 5 Years | 0 (0.0%) | 0 (0.0%) |
| 5 to 17 Years | 0 (0.0%) | 0 (0.0%) |
| 18 to 34 Years | 4 (0.7%) | 0 (0.0%) |
| 35 to 64 Years | 32 (4.5%) | 1 (0.1%) |
| 65 to 74 Years | 56 (32.0%) | 30 (14.8%) |
| 75 Years and over | 87 (39.7%) | 104 (35.6%) |
Disability Class: Vision Difficulty
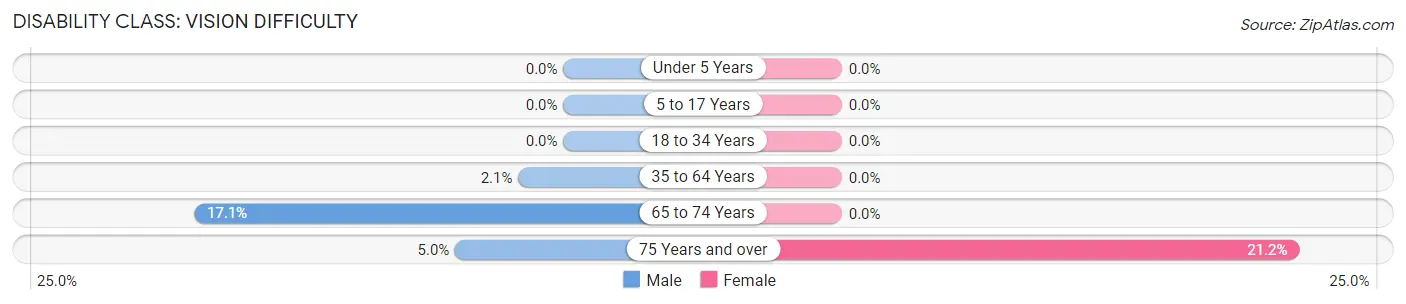
| Age Bracket | Male | Female |
| Under 5 Years | 0 (0.0%) | 0 (0.0%) |
| 5 to 17 Years | 0 (0.0%) | 0 (0.0%) |
| 18 to 34 Years | 0 (0.0%) | 0 (0.0%) |
| 35 to 64 Years | 15 (2.1%) | 0 (0.0%) |
| 65 to 74 Years | 30 (17.1%) | 0 (0.0%) |
| 75 Years and over | 11 (5.0%) | 62 (21.2%) |
Disability Class: Cognitive Difficulty
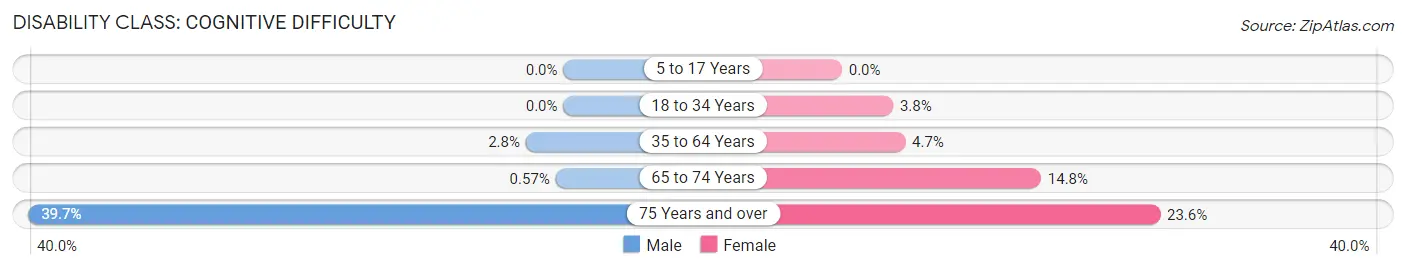
| Age Bracket | Male | Female |
| 5 to 17 Years | 0 (0.0%) | 0 (0.0%) |
| 18 to 34 Years | 0 (0.0%) | 20 (3.8%) |
| 35 to 64 Years | 20 (2.8%) | 37 (4.7%) |
| 65 to 74 Years | 1 (0.6%) | 30 (14.8%) |
| 75 Years and over | 87 (39.7%) | 69 (23.6%) |
Disability Class: Ambulatory Difficulty
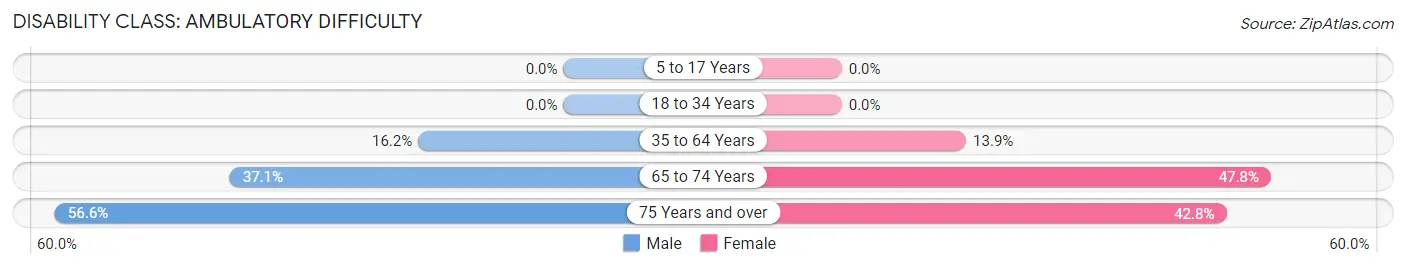
| Age Bracket | Male | Female |
| 5 to 17 Years | 0 (0.0%) | 0 (0.0%) |
| 18 to 34 Years | 0 (0.0%) | 0 (0.0%) |
| 35 to 64 Years | 116 (16.2%) | 109 (13.9%) |
| 65 to 74 Years | 65 (37.1%) | 97 (47.8%) |
| 75 Years and over | 124 (56.6%) | 125 (42.8%) |
Disability Class: Self-Care Difficulty
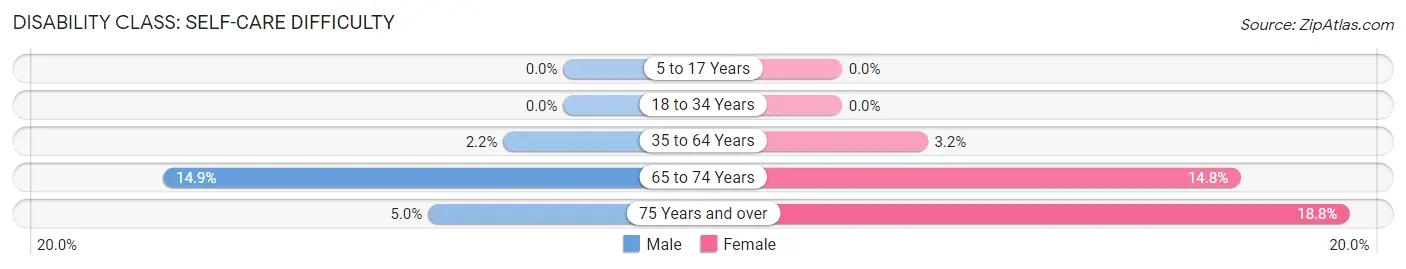
| Age Bracket | Male | Female |
| 5 to 17 Years | 0 (0.0%) | 0 (0.0%) |
| 18 to 34 Years | 0 (0.0%) | 0 (0.0%) |
| 35 to 64 Years | 16 (2.2%) | 25 (3.2%) |
| 65 to 74 Years | 26 (14.9%) | 30 (14.8%) |
| 75 Years and over | 11 (5.0%) | 55 (18.8%) |
Technology Access in Garza County
Computing Device Access in Garza County
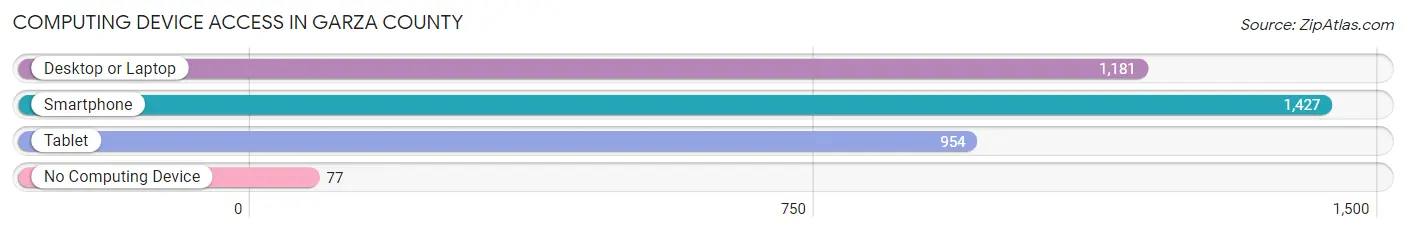
| Device Type | # Households | % Households |
| Desktop or Laptop | 1,181 | 70.4% |
| Smartphone | 1,427 | 85.1% |
| Tablet | 954 | 56.9% |
| No Computing Device | 77 | 4.6% |
| Total | 1,677 | 100.0% |
Internet Access in Garza County
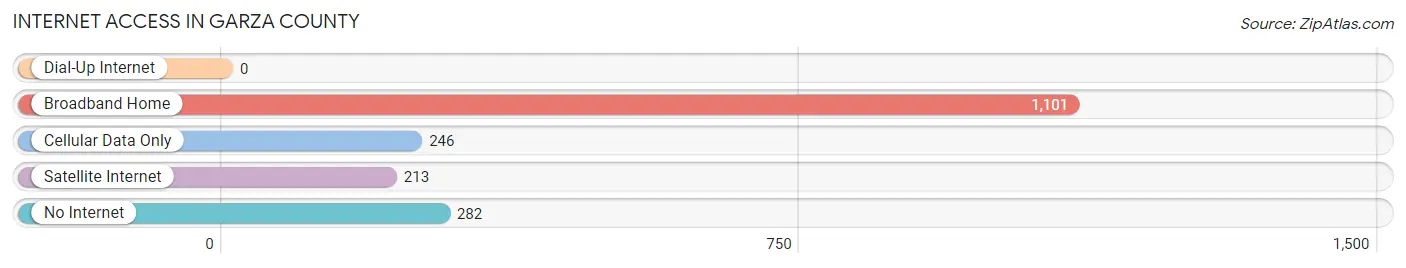
| Internet Type | # Households | % Households |
| Dial-Up Internet | 0 | 0.0% |
| Broadband Home | 1,101 | 65.6% |
| Cellular Data Only | 246 | 14.7% |
| Satellite Internet | 213 | 12.7% |
| No Internet | 282 | 16.8% |
| Total | 1,677 | 100.0% |
Garza County Summary
Garza County is located in the western part of the state of Texas, in the South Plains region of the state. It is bordered by Lynn County to the north, Borden County to the east, Kent County to the south, and Crosby County to the west. The county seat is Post, and the largest city is Post. As of the 2010 census, the population was 6,461.
Geography
Garza County is located in the South Plains region of Texas, and is part of the Llano Estacado. The county is mostly flat, with some rolling hills in the northern part of the county. The county is drained by the Double Mountain Fork of the Brazos River, which flows through the county from north to south. The county is mostly covered in grasslands, with some mesquite and cedar trees in the northern part of the county.
History
Garza County was established in 1876 from portions of Bexar and Young counties. It was named for a prominent early settler, John Garza. The county was originally populated by Native Americans, including the Comanche and Kiowa tribes. The first settlers in the county were ranchers, who established large cattle ranches in the area. The county was also home to several small farming communities, which were established in the late 19th century.
Economy
The economy of Garza County is largely based on agriculture and ranching. The county is home to several large cattle ranches, as well as some smaller farms. The county is also home to several oil and gas wells, which provide jobs and revenue for the county. The county is also home to several manufacturing plants, which produce a variety of products, including furniture, clothing, and food products.
Demographics
As of the 2010 census, the population of Garza County was 6,461. The racial makeup of the county was 79.2% White, 0.7% African American, 0.7% Native American, 0.2% Asian, 0.1% Pacific Islander, 17.3% from other races, and 2.0% from two or more races. Hispanic or Latino of any race were 37.2% of the population.
The median income for a household in the county was $31,944, and the median income for a family was $37,917. The per capita income for the county was $15,945. About 17.2% of families and 21.2% of the population were below the poverty line, including 28.2% of those under age 18 and 15.2% of those age 65 or over.
Garza County is served by the Post Independent School District, which includes two elementary schools, one middle school, and one high school. The county is also home to several private schools, including a Catholic school and a Christian school. The county is also home to South Plains College, a two-year college located in Post.
Common Questions
What is Per Capita Income in Garza County?
Per Capita income in Garza County is $22,188.
What is the Median Family Income in Garza County?
Median Family Income in Garza County is $82,386.
What is the Median Household income in Garza County?
Median Household Income in Garza County is $56,215.
What is Income or Wage Gap in Garza County?
Income or Wage Gap in Garza County is 27.6%.
Women in Garza County earn 72.4 cents for every dollar earned by a man.
What is Family Income Deficit in Garza County?
Family Income Deficit in Garza County is $6,704.
Families that are below poverty line in Garza County earn $6,704 less on average than the poverty threshold level.
What is Inequality or Gini Index in Garza County?
Inequality or Gini Index in Garza County is 0.40.
What is the Total Population of Garza County?
Total Population of Garza County is 5,735.
What is the Total Male Population of Garza County?
Total Male Population of Garza County is 3,485.
What is the Total Female Population of Garza County?
Total Female Population of Garza County is 2,250.
What is the Ratio of Males per 100 Females in Garza County?
There are 154.89 Males per 100 Females in Garza County.
What is the Ratio of Females per 100 Males in Garza County?
There are 64.56 Females per 100 Males in Garza County.
What is the Median Population Age in Garza County?
Median Population Age in Garza County is 41.8 Years.
What is the Average Family Size in Garza County
Average Family Size in Garza County is 3.1 People.
What is the Average Household Size in Garza County
Average Household Size in Garza County is 2.6 People.
How Large is the Labor Force in Garza County?
There are 1,843 People in the Labor Forcein in Garza County.
What is the Percentage of People in the Labor Force in Garza County?
37.1% of People are in the Labor Force in Garza County.
What is the Unemployment Rate in Garza County?
Unemployment Rate in Garza County is 9.9%.