Frio County, TX Map & Demographics
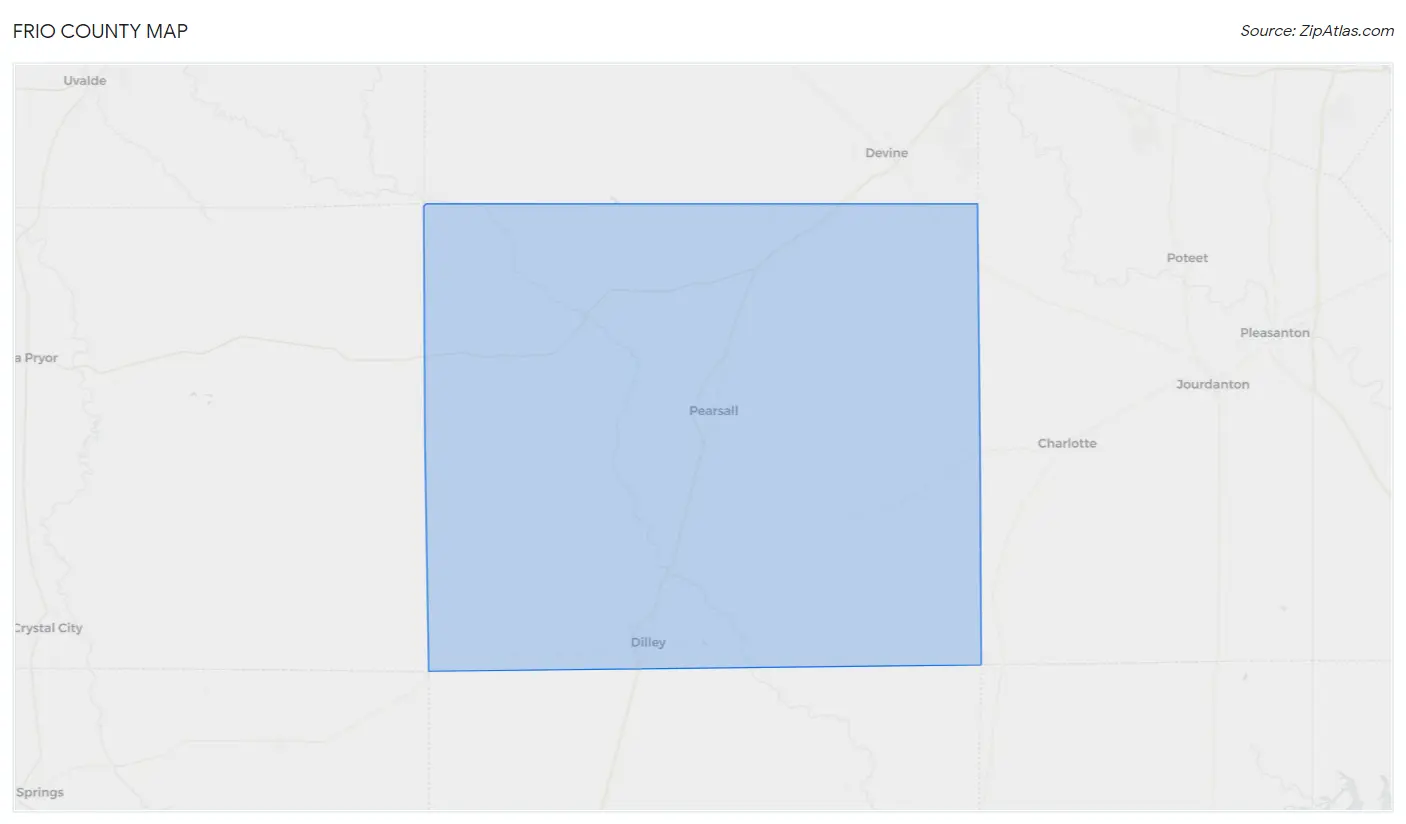
Frio County Map
Frio County Overview
$22,779
PER CAPITA INCOME
$65,499
AVG FAMILY INCOME
$56,042
AVG HOUSEHOLD INCOME
42.8%
WAGE / INCOME GAP [ % ]
57.2¢/ $1
WAGE / INCOME GAP [ $ ]
$10,370
FAMILY INCOME DEFICIT
0.47
INEQUALITY / GINI INDEX
18,151
TOTAL POPULATION
11,026
MALE POPULATION
7,125
FEMALE POPULATION
154.75
MALES / 100 FEMALES
64.62
FEMALES / 100 MALES
33.1
MEDIAN AGE
3.8
AVG FAMILY SIZE
3.1
AVG HOUSEHOLD SIZE
7,109
LABOR FORCE [ PEOPLE ]
48.9%
PERCENT IN LABOR FORCE
2.6%
UNEMPLOYMENT RATE
Frio County Area Codes
Income in Frio County
Income Overview in Frio County
Per Capita Income in Frio County is $22,779, while median incomes of families and households are $65,499 and $56,042 respectively.
| Characteristic | Number | Measure |
| Per Capita Income | 18,151 | $22,779 |
| Median Family Income | 3,363 | $65,499 |
| Mean Family Income | 3,363 | $78,480 |
| Median Household Income | 4,709 | $56,042 |
| Mean Household Income | 4,709 | $69,861 |
| Income Deficit | 3,363 | $10,370 |
| Wage / Income Gap (%) | 18,151 | 42.84% |
| Wage / Income Gap ($) | 18,151 | 57.16¢ per $1 |
| Gini / Inequality Index | 18,151 | 0.47 |
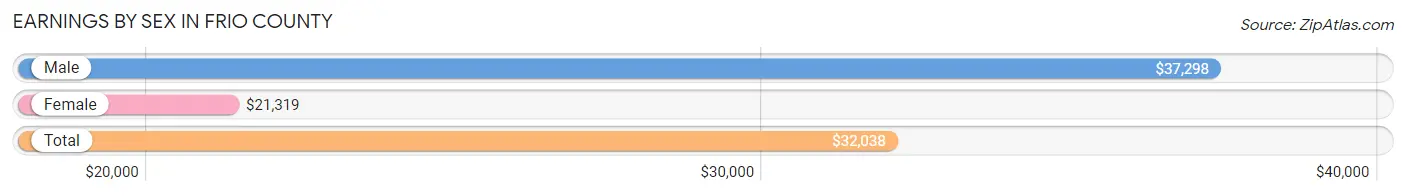
Earnings by Sex in Frio County
Average Earnings in Frio County are $32,038, $37,298 for men and $21,319 for women, a difference of 42.8%.
| Sex | Number | Average Earnings |
| Male | 5,409 (65.5%) | $37,298 |
| Female | 2,851 (34.5%) | $21,319 |
| Total | 8,260 (100.0%) | $32,038 |
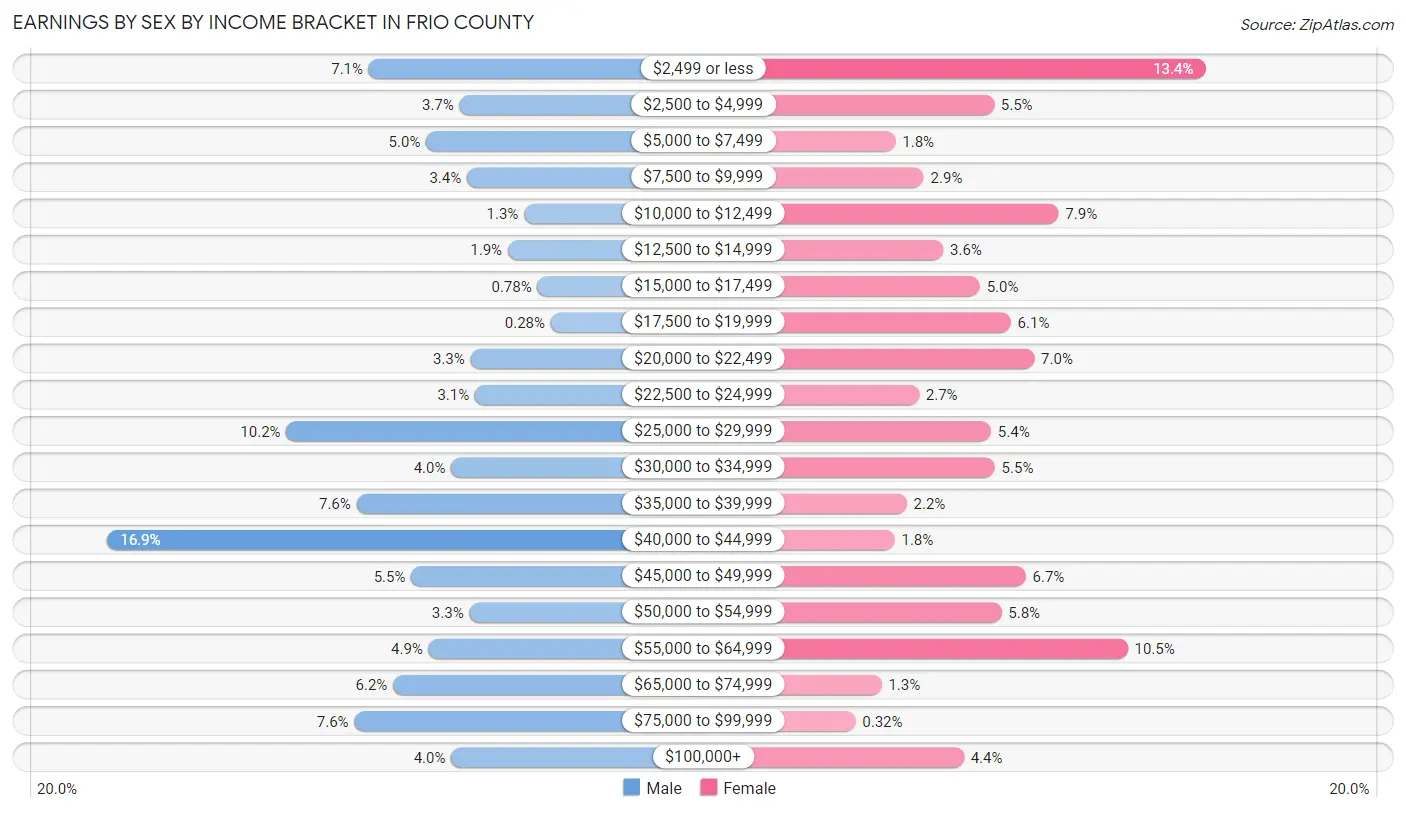
Earnings by Sex by Income Bracket in Frio County
The most common earnings brackets in Frio County are $40,000 to $44,999 for men (914 | 16.9%) and $2,499 or less for women (383 | 13.4%).
| Income | Male | Female |
| $2,499 or less | 384 (7.1%) | 383 (13.4%) |
| $2,500 to $4,999 | 200 (3.7%) | 157 (5.5%) |
| $5,000 to $7,499 | 268 (5.0%) | 52 (1.8%) |
| $7,500 to $9,999 | 185 (3.4%) | 82 (2.9%) |
| $10,000 to $12,499 | 69 (1.3%) | 226 (7.9%) |
| $12,500 to $14,999 | 102 (1.9%) | 103 (3.6%) |
| $15,000 to $17,499 | 42 (0.8%) | 142 (5.0%) |
| $17,500 to $19,999 | 15 (0.3%) | 175 (6.1%) |
| $20,000 to $22,499 | 178 (3.3%) | 200 (7.0%) |
| $22,500 to $24,999 | 169 (3.1%) | 77 (2.7%) |
| $25,000 to $29,999 | 551 (10.2%) | 154 (5.4%) |
| $30,000 to $34,999 | 217 (4.0%) | 158 (5.5%) |
| $35,000 to $39,999 | 409 (7.6%) | 64 (2.2%) |
| $40,000 to $44,999 | 914 (16.9%) | 51 (1.8%) |
| $45,000 to $49,999 | 298 (5.5%) | 191 (6.7%) |
| $50,000 to $54,999 | 180 (3.3%) | 165 (5.8%) |
| $55,000 to $64,999 | 263 (4.9%) | 300 (10.5%) |
| $65,000 to $74,999 | 335 (6.2%) | 37 (1.3%) |
| $75,000 to $99,999 | 413 (7.6%) | 9 (0.3%) |
| $100,000+ | 217 (4.0%) | 125 (4.4%) |
| Total | 5,409 (100.0%) | 2,851 (100.0%) |
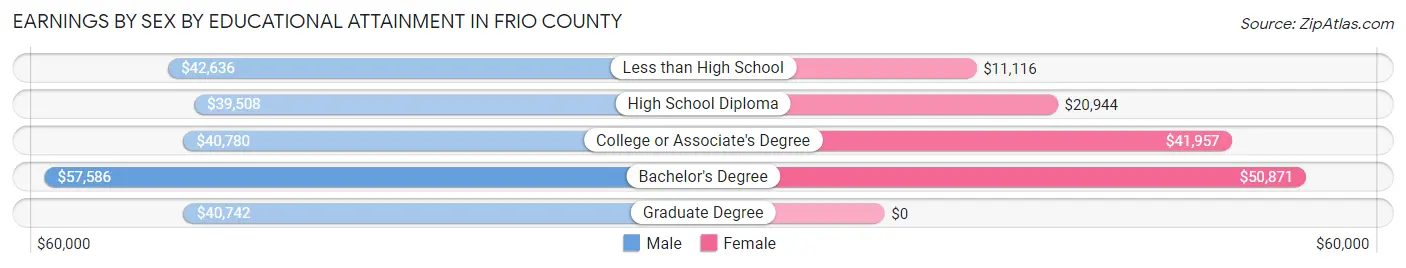
Earnings by Sex by Educational Attainment in Frio County
Average earnings in Frio County are $41,557 for men and $26,389 for women, a difference of 36.5%. Men with an educational attainment of bachelor's degree enjoy the highest average annual earnings of $57,586, while those with high school diploma education earn the least with $39,508. Women with an educational attainment of bachelor's degree earn the most with the average annual earnings of $50,871, while those with less than high school education have the smallest earnings of $11,116.
| Educational Attainment | Male Income | Female Income |
| Less than High School | $42,636 | $11,116 |
| High School Diploma | $39,508 | $20,944 |
| College or Associate's Degree | $40,780 | $41,957 |
| Bachelor's Degree | $57,586 | $50,871 |
| Graduate Degree | $40,742 | $0 |
| Total | $41,557 | $26,389 |
Family Income in Frio County
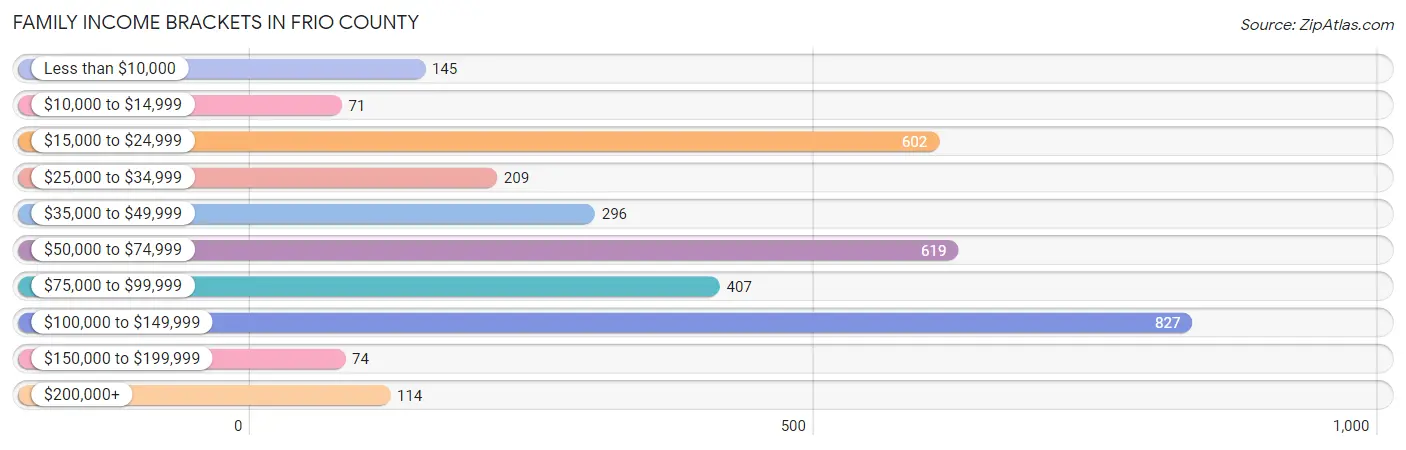
Family Income Brackets in Frio County
According to the Frio County family income data, there are 827 families falling into the $100,000 to $149,999 income range, which is the most common income bracket and makes up 24.6% of all families. Conversely, the $10,000 to $14,999 income bracket is the least frequent group with only 71 families (2.1%) belonging to this category.
| Income Bracket | # Families | % Families |
| Less than $10,000 | 145 | 4.3% |
| $10,000 to $14,999 | 71 | 2.1% |
| $15,000 to $24,999 | 602 | 17.9% |
| $25,000 to $34,999 | 209 | 6.2% |
| $35,000 to $49,999 | 296 | 8.8% |
| $50,000 to $74,999 | 619 | 18.4% |
| $75,000 to $99,999 | 407 | 12.1% |
| $100,000 to $149,999 | 827 | 24.6% |
| $150,000 to $199,999 | 74 | 2.2% |
| $200,000+ | 114 | 3.4% |
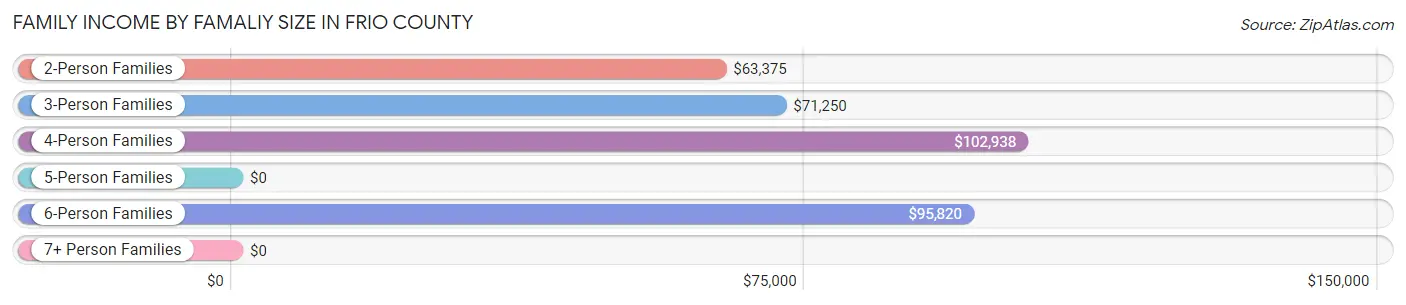
Family Income by Famaliy Size in Frio County
4-person families (456 | 13.6%) account for the highest median family income in Frio County with $102,938 per family, while 2-person families (1,675 | 49.8%) have the highest median income of $31,688 per family member.
| Income Bracket | # Families | Median Income |
| 2-Person Families | 1,675 (49.8%) | $63,375 |
| 3-Person Families | 614 (18.3%) | $71,250 |
| 4-Person Families | 456 (13.6%) | $102,938 |
| 5-Person Families | 464 (13.8%) | $0 |
| 6-Person Families | 79 (2.4%) | $95,820 |
| 7+ Person Families | 75 (2.2%) | $0 |
| Total | 3,363 (100.0%) | $65,499 |
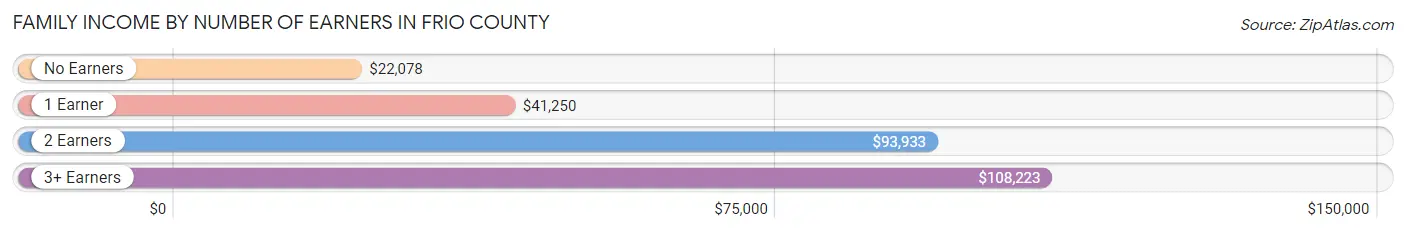
Family Income by Number of Earners in Frio County
The median family income in Frio County is $65,499, with families comprising 3+ earners (218) having the highest median family income of $108,223, while families with no earners (535) have the lowest median family income of $22,078, accounting for 6.5% and 15.9% of families, respectively.
| Number of Earners | # Families | Median Income |
| No Earners | 535 (15.9%) | $22,078 |
| 1 Earner | 1,426 (42.4%) | $41,250 |
| 2 Earners | 1,184 (35.2%) | $93,933 |
| 3+ Earners | 218 (6.5%) | $108,223 |
| Total | 3,363 (100.0%) | $65,499 |
Household Income in Frio County
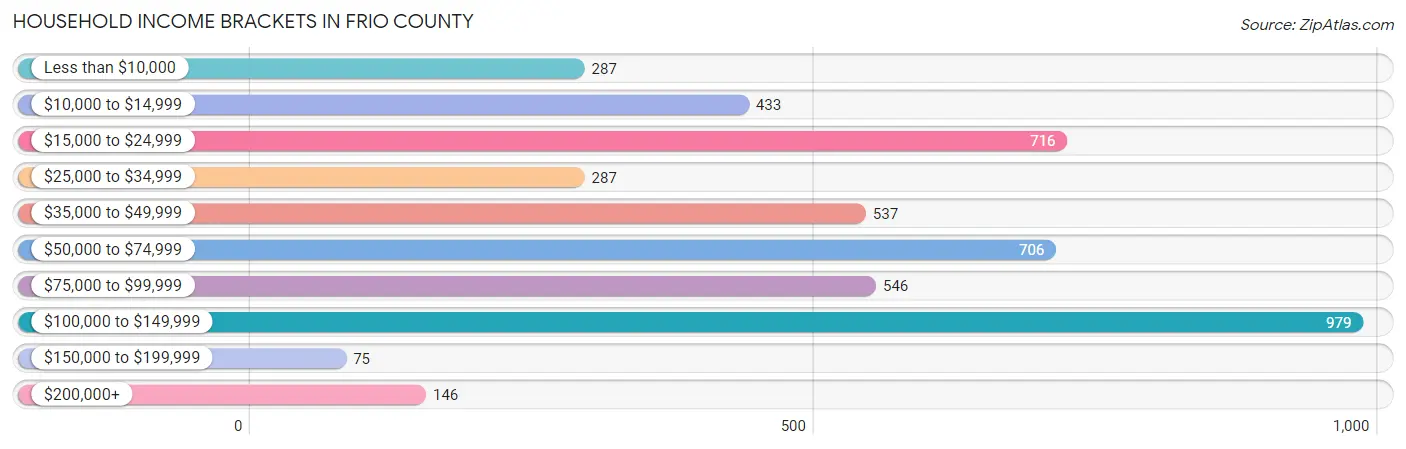
Household Income Brackets in Frio County
With 979 households falling in the category, the $100,000 to $149,999 income range is the most frequent in Frio County, accounting for 20.8% of all households. In contrast, only 75 households (1.6%) fall into the $150,000 to $199,999 income bracket, making it the least populous group.
| Income Bracket | # Households | % Households |
| Less than $10,000 | 287 | 6.1% |
| $10,000 to $14,999 | 433 | 9.2% |
| $15,000 to $24,999 | 716 | 15.2% |
| $25,000 to $34,999 | 287 | 6.1% |
| $35,000 to $49,999 | 537 | 11.4% |
| $50,000 to $74,999 | 706 | 15.0% |
| $75,000 to $99,999 | 546 | 11.6% |
| $100,000 to $149,999 | 979 | 20.8% |
| $150,000 to $199,999 | 75 | 1.6% |
| $200,000+ | 146 | 3.1% |
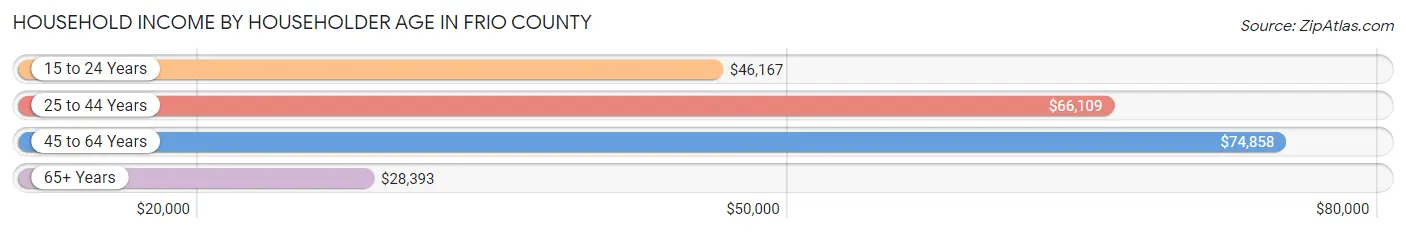
Household Income by Householder Age in Frio County
The median household income in Frio County is $56,042, with the highest median household income of $74,858 found in the 45 to 64 years age bracket for the primary householder. A total of 1,447 households (30.7%) fall into this category. Meanwhile, the 65+ years age bracket for the primary householder has the lowest median household income of $28,393, with 1,514 households (32.2%) in this group.
| Income Bracket | # Households | Median Income |
| 15 to 24 Years | 182 (3.9%) | $46,167 |
| 25 to 44 Years | 1,566 (33.3%) | $66,109 |
| 45 to 64 Years | 1,447 (30.7%) | $74,858 |
| 65+ Years | 1,514 (32.2%) | $28,393 |
| Total | 4,709 (100.0%) | $56,042 |
Poverty in Frio County
Income Below Poverty by Sex and Age in Frio County
With 15.2% poverty level for males and 27.7% for females among the residents of Frio County, under 5 year old males and 16 and 17 year old females are the most vulnerable to poverty, with 242 males (46.1%) and 67 females (67.0%) in their respective age groups living below the poverty level.
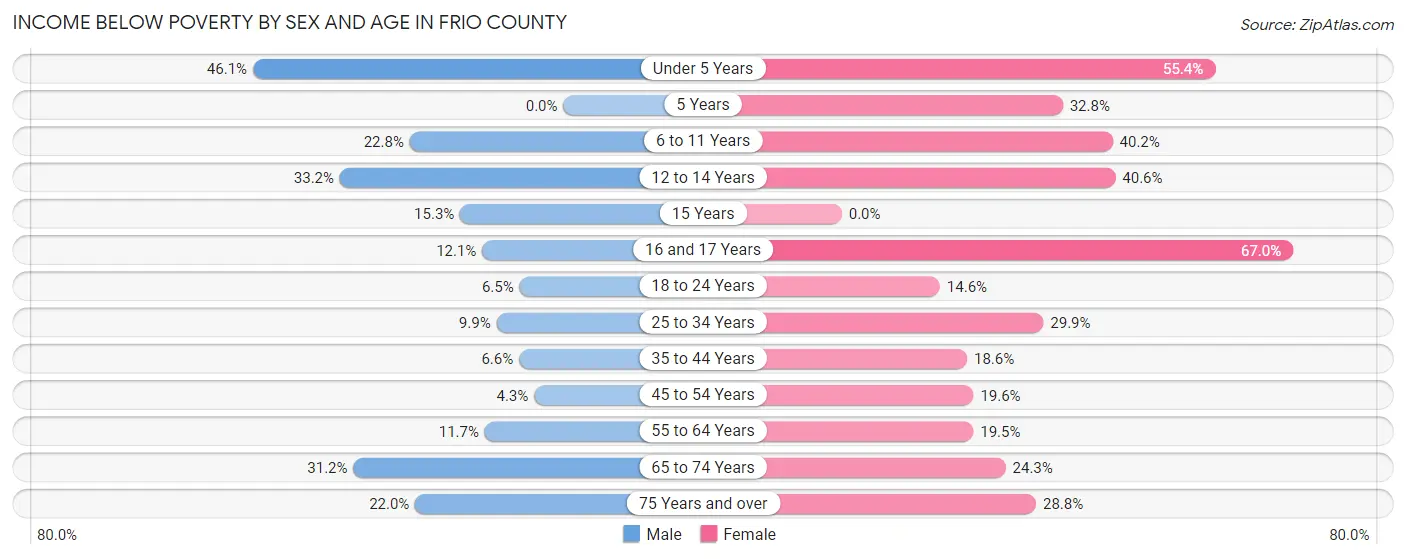
| Age Bracket | Male | Female |
| Under 5 Years | 242 (46.1%) | 276 (55.4%) |
| 5 Years | 0 (0.0%) | 21 (32.8%) |
| 6 to 11 Years | 224 (22.8%) | 232 (40.2%) |
| 12 to 14 Years | 78 (33.2%) | 78 (40.6%) |
| 15 Years | 17 (15.3%) | 0 (0.0%) |
| 16 and 17 Years | 47 (12.0%) | 67 (67.0%) |
| 18 to 24 Years | 64 (6.5%) | 89 (14.6%) |
| 25 to 34 Years | 143 (9.9%) | 249 (29.9%) |
| 35 to 44 Years | 83 (6.6%) | 149 (18.6%) |
| 45 to 54 Years | 31 (4.3%) | 147 (19.6%) |
| 55 to 64 Years | 78 (11.7%) | 157 (19.5%) |
| 65 to 74 Years | 164 (31.2%) | 127 (24.3%) |
| 75 Years and over | 90 (22.0%) | 186 (28.8%) |
| Total | 1,261 (15.2%) | 1,778 (27.7%) |
Income Above Poverty by Sex and Age in Frio County
According to the poverty statistics in Frio County, males aged 5 years and females aged 15 years are the age groups that are most secure financially, with 100.0% of males and 100.0% of females in these age groups living above the poverty line.
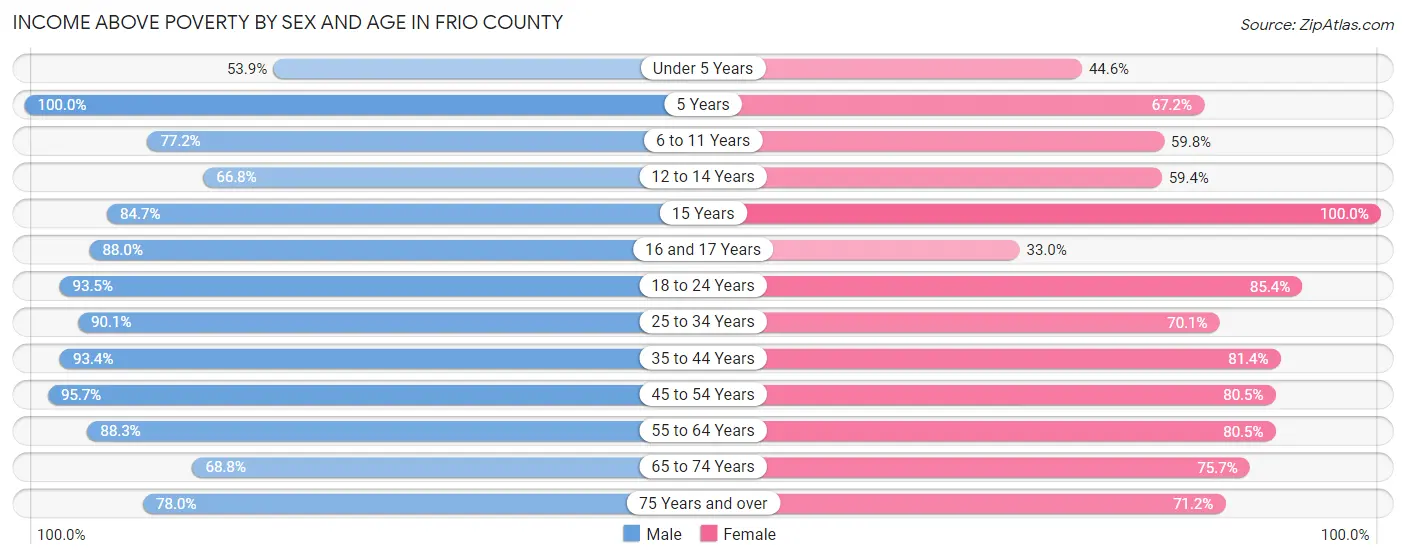
| Age Bracket | Male | Female |
| Under 5 Years | 283 (53.9%) | 222 (44.6%) |
| 5 Years | 39 (100.0%) | 43 (67.2%) |
| 6 to 11 Years | 758 (77.2%) | 345 (59.8%) |
| 12 to 14 Years | 157 (66.8%) | 114 (59.4%) |
| 15 Years | 94 (84.7%) | 24 (100.0%) |
| 16 and 17 Years | 343 (87.9%) | 33 (33.0%) |
| 18 to 24 Years | 919 (93.5%) | 522 (85.4%) |
| 25 to 34 Years | 1,297 (90.1%) | 583 (70.1%) |
| 35 to 44 Years | 1,179 (93.4%) | 652 (81.4%) |
| 45 to 54 Years | 684 (95.7%) | 605 (80.4%) |
| 55 to 64 Years | 591 (88.3%) | 647 (80.5%) |
| 65 to 74 Years | 362 (68.8%) | 395 (75.7%) |
| 75 Years and over | 319 (78.0%) | 459 (71.2%) |
| Total | 7,025 (84.8%) | 4,644 (72.3%) |
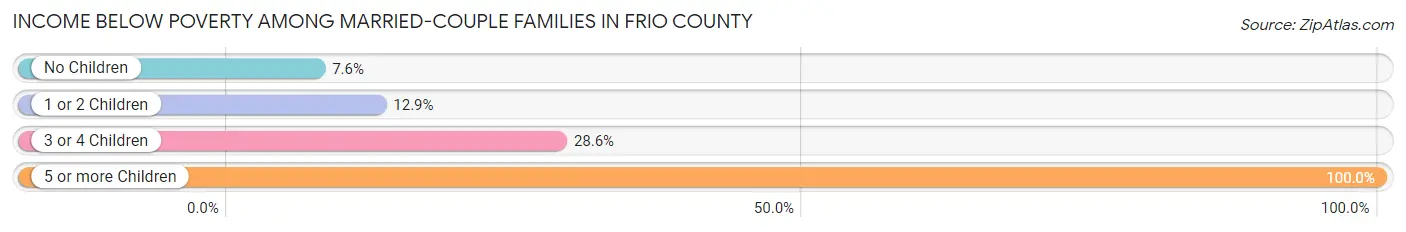
Income Below Poverty Among Married-Couple Families in Frio County
The poverty statistics for married-couple families in Frio County show that 11.7% or 265 of the total 2,275 families live below the poverty line. Families with 5 or more children have the highest poverty rate of 100.0%, comprising of 8 families. On the other hand, families with no children have the lowest poverty rate of 7.6%, which includes 102 families.
| Children | Above Poverty | Below Poverty |
| No Children | 1,241 (92.4%) | 102 (7.6%) |
| 1 or 2 Children | 607 (87.1%) | 90 (12.9%) |
| 3 or 4 Children | 162 (71.4%) | 65 (28.6%) |
| 5 or more Children | 0 (0.0%) | 8 (100.0%) |
| Total | 2,010 (88.3%) | 265 (11.7%) |
Income Below Poverty Among Single-Parent Households in Frio County
According to the poverty data in Frio County, 24.1% or 50 single-father households and 44.2% or 389 single-mother households are living below the poverty line. Among single-father households, those with 3 or 4 children have the highest poverty rate, with 44 households (100.0%) experiencing poverty. Likewise, among single-mother households, those with 3 or 4 children have the highest poverty rate, with 173 households (97.7%) falling below the poverty line.
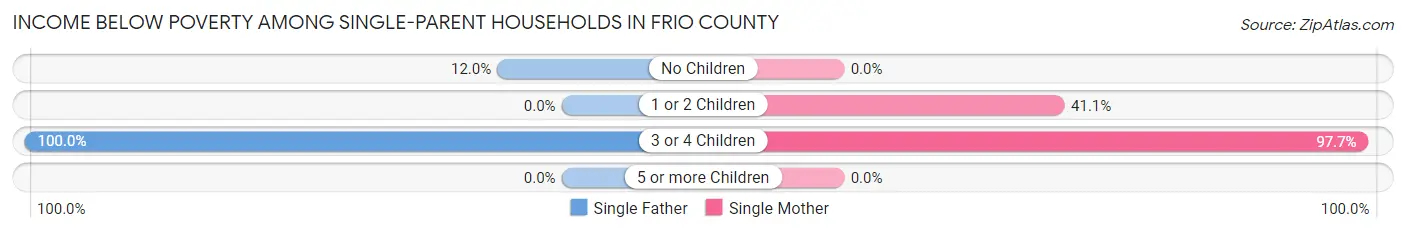
| Children | Single Father | Single Mother |
| No Children | 6 (12.0%) | 0 (0.0%) |
| 1 or 2 Children | 0 (0.0%) | 216 (41.1%) |
| 3 or 4 Children | 44 (100.0%) | 173 (97.7%) |
| 5 or more Children | 0 (0.0%) | 0 (0.0%) |
| Total | 50 (24.1%) | 389 (44.2%) |
Income Below Poverty Among Married-Couple vs Single-Parent Households in Frio County
The poverty data for Frio County shows that 265 of the married-couple family households (11.7%) and 439 of the single-parent households (40.4%) are living below the poverty level. Within the married-couple family households, those with 5 or more children have the highest poverty rate, with 8 households (100.0%) falling below the poverty line. Among the single-parent households, those with 3 or 4 children have the highest poverty rate, with 217 household (98.2%) living below poverty.
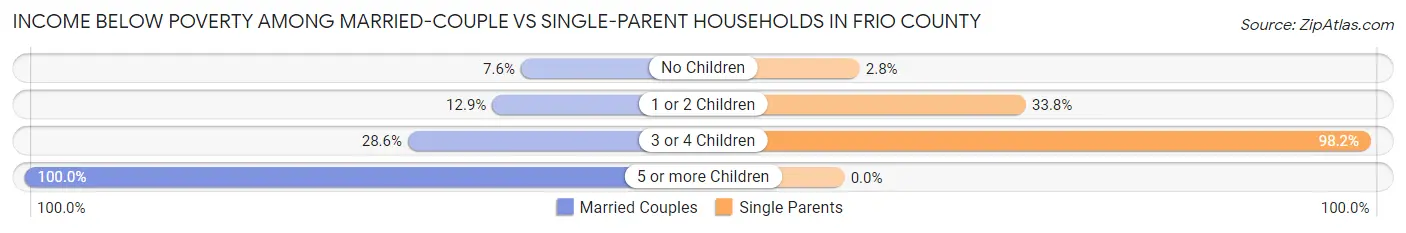
| Children | Married-Couple Families | Single-Parent Households |
| No Children | 102 (7.6%) | 6 (2.8%) |
| 1 or 2 Children | 90 (12.9%) | 216 (33.8%) |
| 3 or 4 Children | 65 (28.6%) | 217 (98.2%) |
| 5 or more Children | 8 (100.0%) | 0 (0.0%) |
| Total | 265 (11.7%) | 439 (40.4%) |
Race in Frio County
The most populous races in Frio County are Hispanic or Latino (14,415 | 79.4%), White / Caucasian (11,674 | 64.3%), and Two or more Races (4,502 | 24.8%).
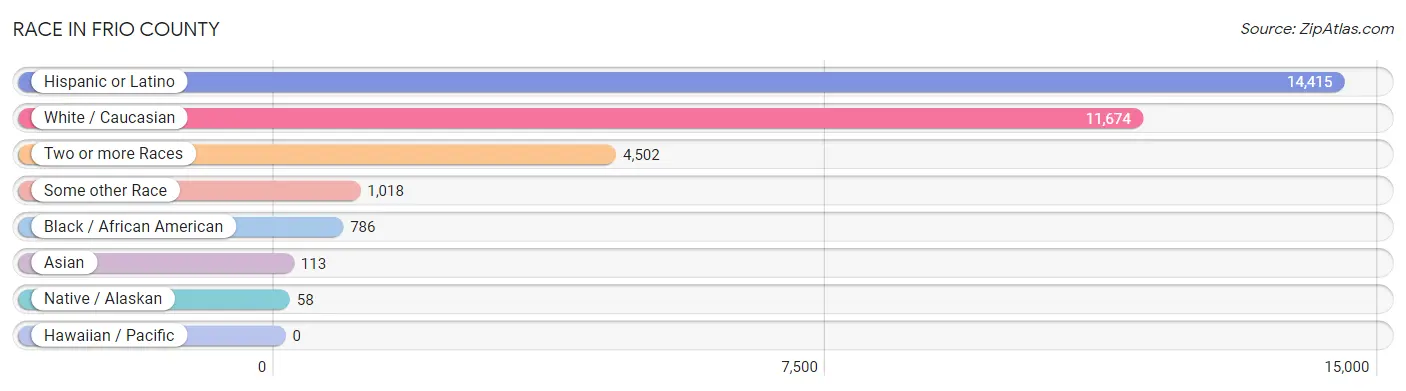
| Race | # Population | % Population |
| Asian | 113 | 0.6% |
| Black / African American | 786 | 4.3% |
| Hawaiian / Pacific | 0 | 0.0% |
| Hispanic or Latino | 14,415 | 79.4% |
| Native / Alaskan | 58 | 0.3% |
| White / Caucasian | 11,674 | 64.3% |
| Two or more Races | 4,502 | 24.8% |
| Some other Race | 1,018 | 5.6% |
| Total | 18,151 | 100.0% |
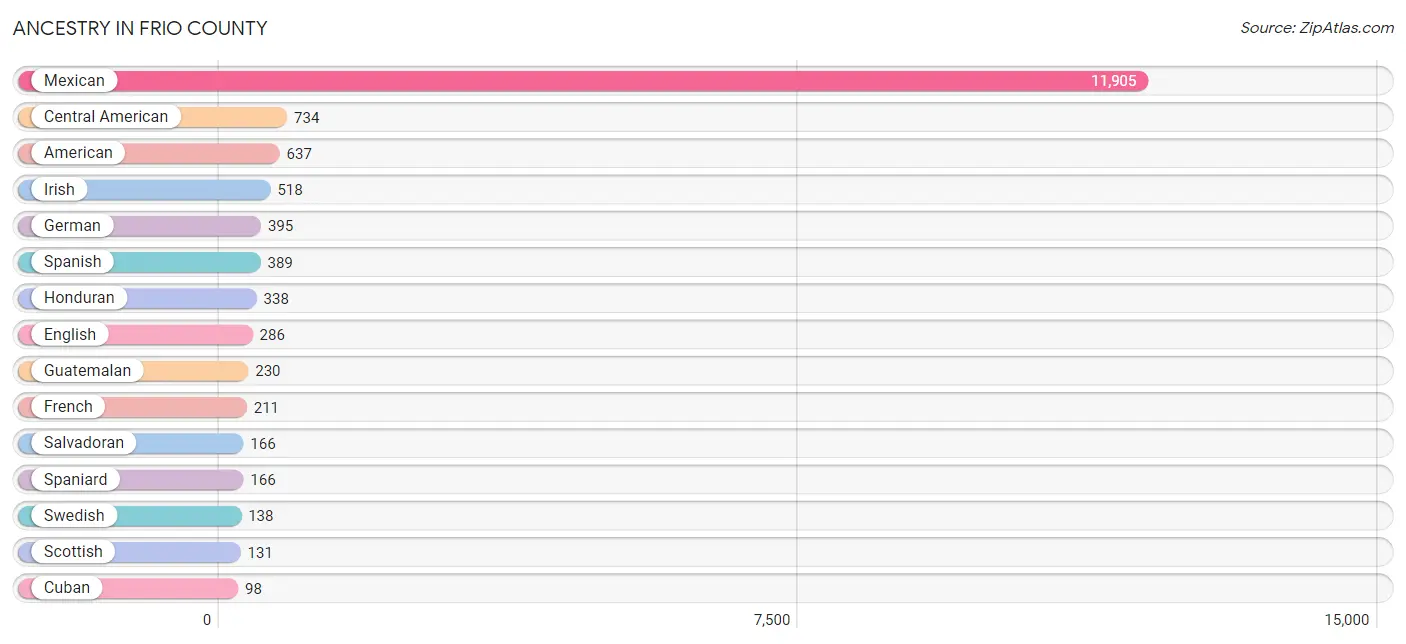
Ancestry in Frio County
The most populous ancestries reported in Frio County are Mexican (11,905 | 65.6%), Central American (734 | 4.0%), American (637 | 3.5%), Irish (518 | 2.9%), and German (395 | 2.2%), together accounting for 78.2% of all Frio County residents.
| Ancestry | # Population | % Population |
| African | 56 | 0.3% |
| American | 637 | 3.5% |
| Apache | 88 | 0.5% |
| Bhutanese | 11 | 0.1% |
| Blackfeet | 5 | 0.0% |
| Brazilian | 11 | 0.1% |
| British | 88 | 0.5% |
| Burmese | 5 | 0.0% |
| Canadian | 33 | 0.2% |
| Central American | 734 | 4.0% |
| Central American Indian | 11 | 0.1% |
| Cherokee | 1 | 0.0% |
| Cuban | 98 | 0.5% |
| Czech | 70 | 0.4% |
| Dutch | 56 | 0.3% |
| English | 286 | 1.6% |
| Ethiopian | 11 | 0.1% |
| European | 15 | 0.1% |
| Finnish | 9 | 0.1% |
| French | 211 | 1.2% |
| French Canadian | 6 | 0.0% |
| German | 395 | 2.2% |
| Guatemalan | 230 | 1.3% |
| Honduran | 338 | 1.9% |
| Hungarian | 5 | 0.0% |
| Indian (Asian) | 34 | 0.2% |
| Irish | 518 | 2.9% |
| Italian | 42 | 0.2% |
| Mexican | 11,905 | 65.6% |
| Mexican American Indian | 22 | 0.1% |
| Nigerian | 8 | 0.0% |
| Norwegian | 20 | 0.1% |
| Polish | 86 | 0.5% |
| Puerto Rican | 50 | 0.3% |
| Salvadoran | 166 | 0.9% |
| Scandinavian | 9 | 0.1% |
| Scotch-Irish | 72 | 0.4% |
| Scottish | 131 | 0.7% |
| Spaniard | 166 | 0.9% |
| Spanish | 389 | 2.1% |
| Subsaharan African | 97 | 0.5% |
| Swedish | 138 | 0.8% |
| Thai | 36 | 0.2% |
| Welsh | 50 | 0.3% | View All 44 Rows |
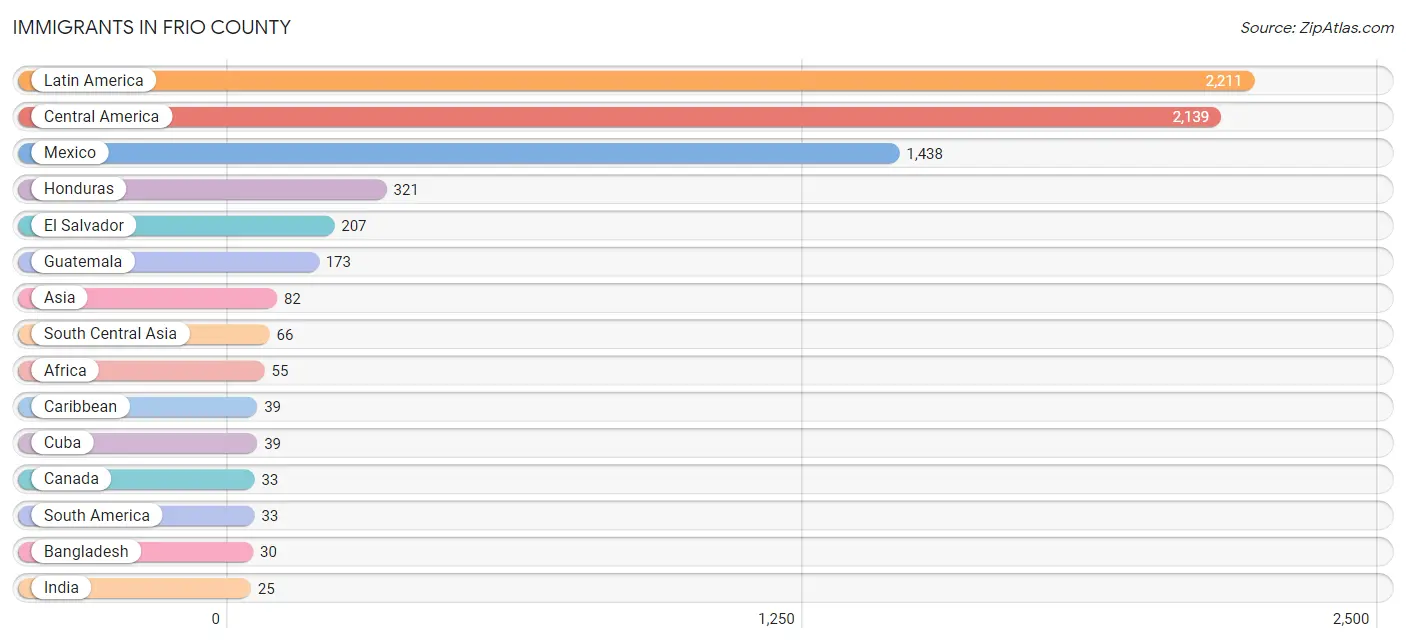
Immigrants in Frio County
The most numerous immigrant groups reported in Frio County came from Latin America (2,211 | 12.2%), Central America (2,139 | 11.8%), Mexico (1,438 | 7.9%), Honduras (321 | 1.8%), and El Salvador (207 | 1.1%), together accounting for 34.8% of all Frio County residents.
| Immigration Origin | # Population | % Population |
| Africa | 55 | 0.3% |
| Asia | 82 | 0.4% |
| Bangladesh | 30 | 0.2% |
| Brazil | 11 | 0.1% |
| Canada | 33 | 0.2% |
| Caribbean | 39 | 0.2% |
| Central America | 2,139 | 11.8% |
| Congo | 11 | 0.1% |
| Cuba | 39 | 0.2% |
| Eastern Africa | 11 | 0.1% |
| Eastern Asia | 5 | 0.0% |
| Ecuador | 11 | 0.1% |
| El Salvador | 207 | 1.1% |
| England | 10 | 0.1% |
| Eritrea | 11 | 0.1% |
| Europe | 15 | 0.1% |
| Guatemala | 173 | 0.9% |
| Honduras | 321 | 1.8% |
| India | 25 | 0.1% |
| Ireland | 5 | 0.0% |
| Korea | 5 | 0.0% |
| Latin America | 2,211 | 12.2% |
| Liberia | 11 | 0.1% |
| Mexico | 1,438 | 7.9% |
| Middle Africa | 22 | 0.1% |
| Northern Europe | 15 | 0.1% |
| Peru | 11 | 0.1% |
| South America | 33 | 0.2% |
| South Central Asia | 66 | 0.4% |
| Sri Lanka | 11 | 0.1% |
| Western Africa | 22 | 0.1% |
| Western Asia | 11 | 0.1% |
| Zaire | 11 | 0.1% | View All 33 Rows |
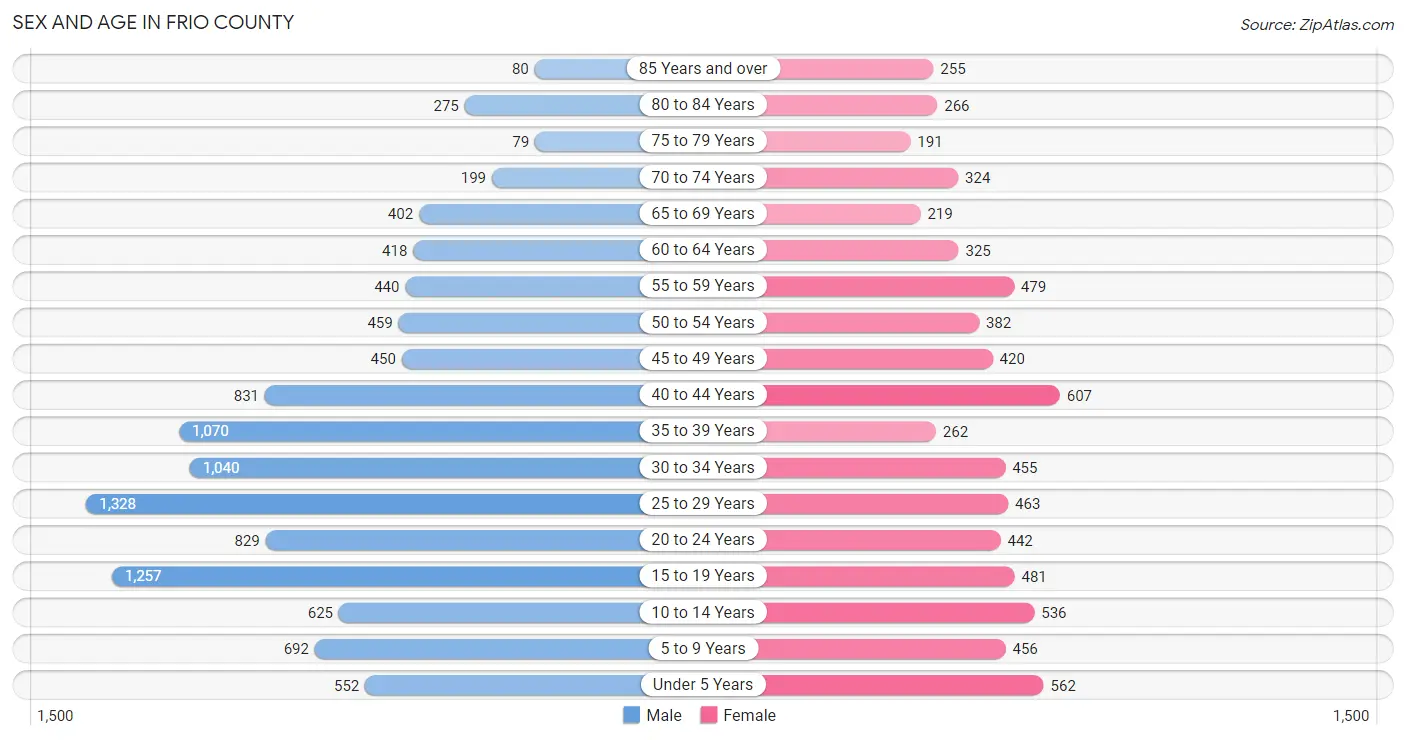
Sex and Age in Frio County
Sex and Age in Frio County
The most populous age groups in Frio County are 25 to 29 Years (1,328 | 12.0%) for men and 40 to 44 Years (607 | 8.5%) for women.
| Age Bracket | Male | Female |
| Under 5 Years | 552 (5.0%) | 562 (7.9%) |
| 5 to 9 Years | 692 (6.3%) | 456 (6.4%) |
| 10 to 14 Years | 625 (5.7%) | 536 (7.5%) |
| 15 to 19 Years | 1,257 (11.4%) | 481 (6.8%) |
| 20 to 24 Years | 829 (7.5%) | 442 (6.2%) |
| 25 to 29 Years | 1,328 (12.0%) | 463 (6.5%) |
| 30 to 34 Years | 1,040 (9.4%) | 455 (6.4%) |
| 35 to 39 Years | 1,070 (9.7%) | 262 (3.7%) |
| 40 to 44 Years | 831 (7.5%) | 607 (8.5%) |
| 45 to 49 Years | 450 (4.1%) | 420 (5.9%) |
| 50 to 54 Years | 459 (4.2%) | 382 (5.4%) |
| 55 to 59 Years | 440 (4.0%) | 479 (6.7%) |
| 60 to 64 Years | 418 (3.8%) | 325 (4.6%) |
| 65 to 69 Years | 402 (3.6%) | 219 (3.1%) |
| 70 to 74 Years | 199 (1.8%) | 324 (4.5%) |
| 75 to 79 Years | 79 (0.7%) | 191 (2.7%) |
| 80 to 84 Years | 275 (2.5%) | 266 (3.7%) |
| 85 Years and over | 80 (0.7%) | 255 (3.6%) |
| Total | 11,026 (100.0%) | 7,125 (100.0%) |
Families and Households in Frio County
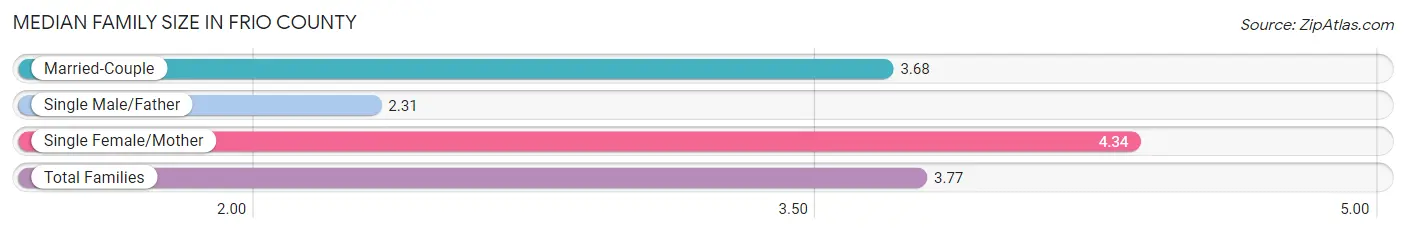
Median Family Size in Frio County
The median family size in Frio County is 3.77 persons per family, with single female/mother families (881 | 26.2%) accounting for the largest median family size of 4.34 persons per family. On the other hand, single male/father families (207 | 6.2%) represent the smallest median family size with 2.31 persons per family.
| Family Type | # Families | Family Size |
| Married-Couple | 2,275 (67.6%) | 3.68 |
| Single Male/Father | 207 (6.2%) | 2.31 |
| Single Female/Mother | 881 (26.2%) | 4.34 |
| Total Families | 3,363 (100.0%) | 3.77 |
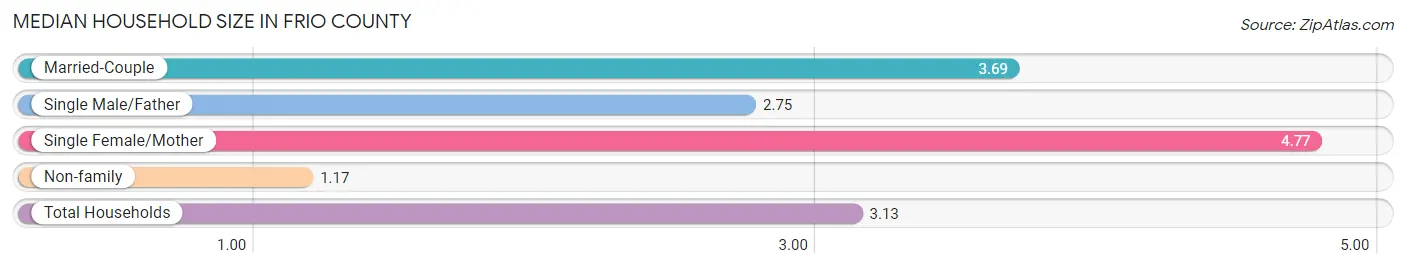
Median Household Size in Frio County
The median household size in Frio County is 3.13 persons per household, with single female/mother households (881 | 18.7%) accounting for the largest median household size of 4.77 persons per household. non-family households (1,346 | 28.6%) represent the smallest median household size with 1.17 persons per household.
| Household Type | # Households | Household Size |
| Married-Couple | 2,275 (48.3%) | 3.69 |
| Single Male/Father | 207 (4.4%) | 2.75 |
| Single Female/Mother | 881 (18.7%) | 4.77 |
| Non-family | 1,346 (28.6%) | 1.17 |
| Total Households | 4,709 (100.0%) | 3.13 |
Household Size by Marriage Status in Frio County
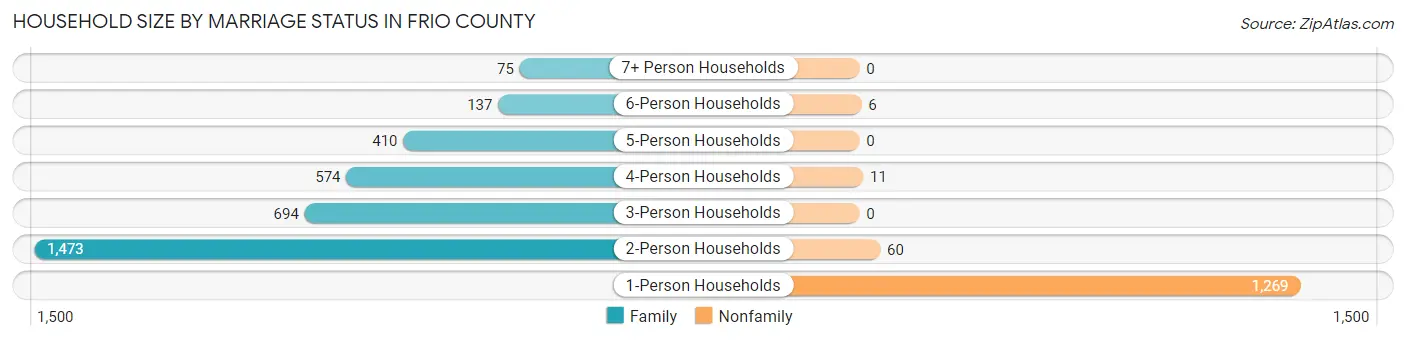
Out of a total of 4,709 households in Frio County, 3,363 (71.4%) are family households, while 1,346 (28.6%) are nonfamily households. The most numerous type of family households are 2-person households, comprising 1,473, and the most common type of nonfamily households are 1-person households, comprising 1,269.
| Household Size | Family Households | Nonfamily Households |
| 1-Person Households | - | 1,269 (27.0%) |
| 2-Person Households | 1,473 (31.3%) | 60 (1.3%) |
| 3-Person Households | 694 (14.7%) | 0 (0.0%) |
| 4-Person Households | 574 (12.2%) | 11 (0.2%) |
| 5-Person Households | 410 (8.7%) | 0 (0.0%) |
| 6-Person Households | 137 (2.9%) | 6 (0.1%) |
| 7+ Person Households | 75 (1.6%) | 0 (0.0%) |
| Total | 3,363 (71.4%) | 1,346 (28.6%) |
Female Fertility in Frio County
Fertility by Age in Frio County
Average fertility rate in Frio County is 76.0 births per 1,000 women. Women in the age bracket of 15 to 19 years have the highest fertility rate with 139.0 births per 1,000 women. Women in the age bracket of 20 to 34 years acount for 57.0% of all women with births.
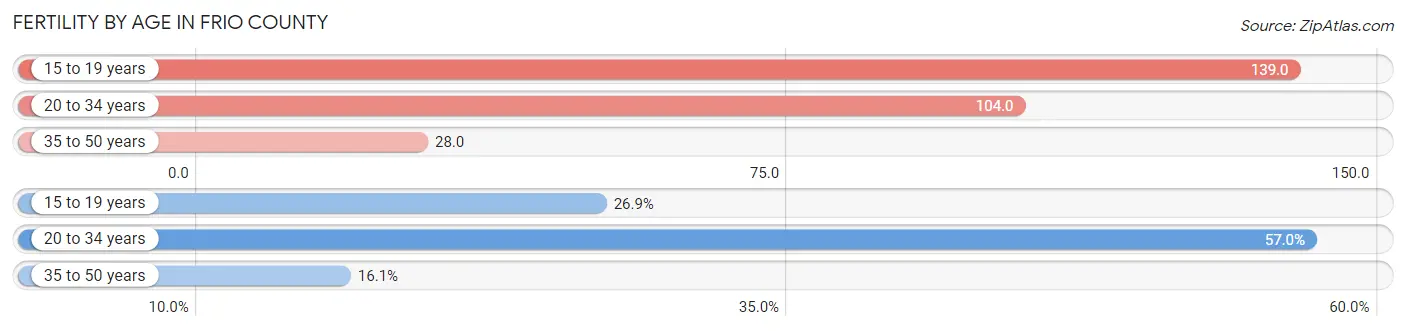
| Age Bracket | Women with Births | Births / 1,000 Women |
| 15 to 19 years | 67 (26.9%) | 139.0 |
| 20 to 34 years | 142 (57.0%) | 104.0 |
| 35 to 50 years | 40 (16.1%) | 28.0 |
| Total | 249 (100.0%) | 76.0 |
Fertility by Age by Marriage Status in Frio County
63.9% of women with births (249) in Frio County are married. The highest percentage of unmarried women with births falls into 15 to 19 years age bracket with 100.0% of them unmarried at the time of birth, while the lowest percentage of unmarried women with births belong to 35 to 50 years age bracket with 0.0% of them unmarried.
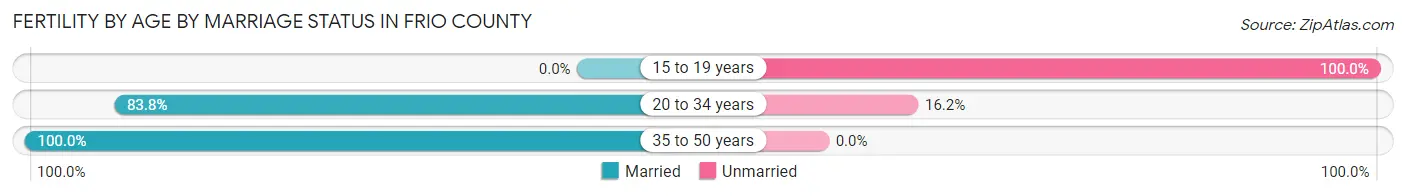
| Age Bracket | Married | Unmarried |
| 15 to 19 years | 0 (0.0%) | 67 (100.0%) |
| 20 to 34 years | 119 (83.8%) | 23 (16.2%) |
| 35 to 50 years | 40 (100.0%) | 0 (0.0%) |
| Total | 159 (63.9%) | 90 (36.1%) |
Fertility by Education in Frio County
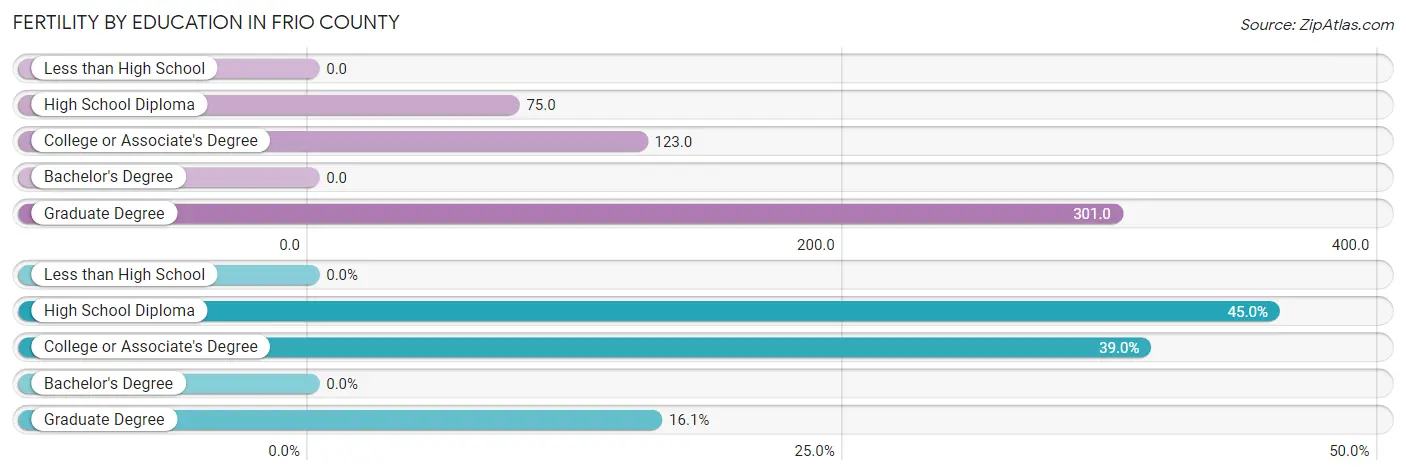
| Educational Attainment | Women with Births | Births / 1,000 Women |
| Less than High School | 0 (0.0%) | 0.0 |
| High School Diploma | 112 (45.0%) | 75.0 |
| College or Associate's Degree | 97 (39.0%) | 123.0 |
| Bachelor's Degree | 0 (0.0%) | 0.0 |
| Graduate Degree | 40 (16.1%) | 301.0 |
| Total | 249 (100.0%) | 76.0 |
Fertility by Education by Marriage Status in Frio County
36.1% of women with births in Frio County are unmarried. Women with the educational attainment of college or associate's degree are most likely to be married with 100.0% of them married at childbirth, while women with the educational attainment of high school diploma are least likely to be married with 80.4% of them unmarried at childbirth.
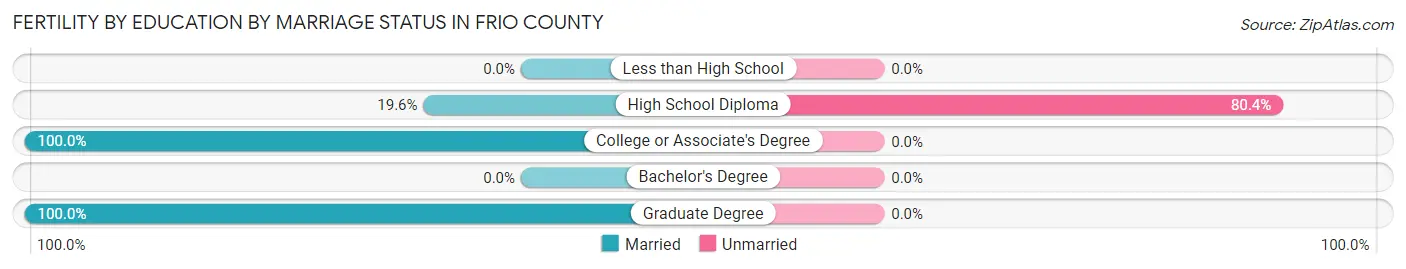
| Educational Attainment | Married | Unmarried |
| Less than High School | 0 (0.0%) | 0 (0.0%) |
| High School Diploma | 22 (19.6%) | 90 (80.4%) |
| College or Associate's Degree | 97 (100.0%) | 0 (0.0%) |
| Bachelor's Degree | 0 (0.0%) | 0 (0.0%) |
| Graduate Degree | 40 (100.0%) | 0 (0.0%) |
| Total | 159 (63.9%) | 90 (36.1%) |
Employment Characteristics in Frio County
Employment by Class of Employer in Frio County
Among the 6,830 employed individuals in Frio County, private company employees (4,934 | 72.2%), local government employees (811 | 11.9%), and not-for-profit organizations (427 | 6.2%) make up the most common classes of employment.
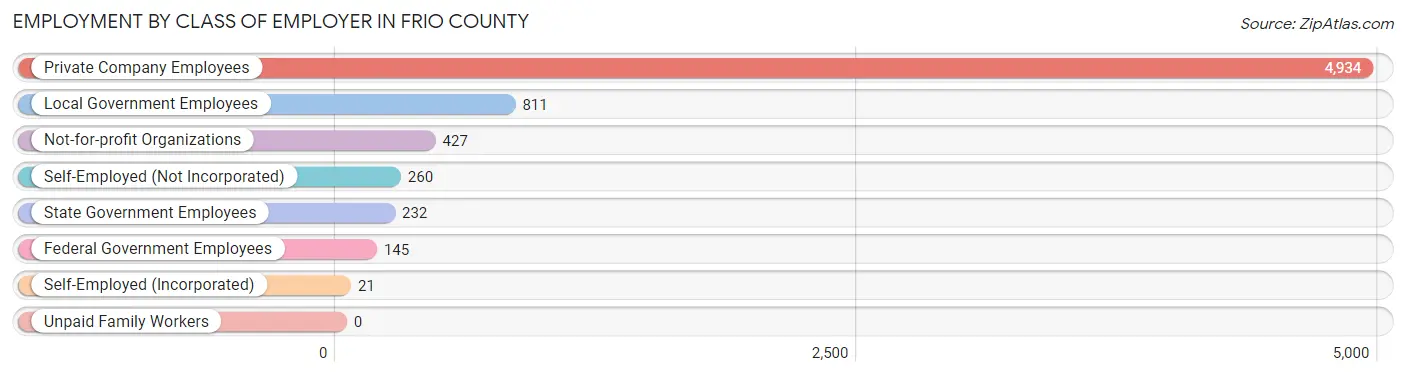
| Employer Class | # Employees | % Employees |
| Private Company Employees | 4,934 | 72.2% |
| Self-Employed (Incorporated) | 21 | 0.3% |
| Self-Employed (Not Incorporated) | 260 | 3.8% |
| Not-for-profit Organizations | 427 | 6.2% |
| Local Government Employees | 811 | 11.9% |
| State Government Employees | 232 | 3.4% |
| Federal Government Employees | 145 | 2.1% |
| Unpaid Family Workers | 0 | 0.0% |
| Total | 6,830 | 100.0% |
Employment Status by Age in Frio County
According to the labor force statistics for Frio County, out of the total population over 16 years of age (14,538), 48.9% or 7,109 individuals are in the labor force, with 2.6% or 185 of them unemployed. The age group with the highest labor force participation rate is 45 to 54 years, with 67.6% or 1,157 individuals in the labor force. Within the labor force, the 55 to 59 years age range has the highest percentage of unemployed individuals, with 27.1% or 120 of them being unemployed.
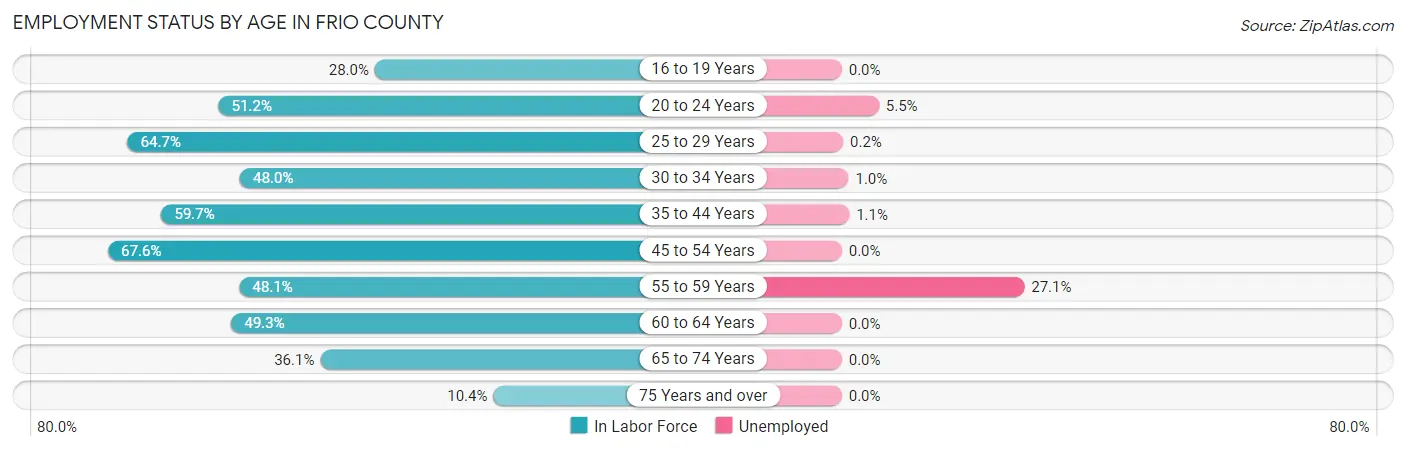
| Age Bracket | In Labor Force | Unemployed |
| 16 to 19 Years | 433 (28.0%) | 0 (0.0%) |
| 20 to 24 Years | 651 (51.2%) | 36 (5.5%) |
| 25 to 29 Years | 1,159 (64.7%) | 2 (0.2%) |
| 30 to 34 Years | 718 (48.0%) | 7 (1.0%) |
| 35 to 44 Years | 1,654 (59.7%) | 18 (1.1%) |
| 45 to 54 Years | 1,157 (67.6%) | 0 (0.0%) |
| 55 to 59 Years | 442 (48.1%) | 120 (27.1%) |
| 60 to 64 Years | 366 (49.3%) | 0 (0.0%) |
| 65 to 74 Years | 413 (36.1%) | 0 (0.0%) |
| 75 Years and over | 119 (10.4%) | 0 (0.0%) |
| Total | 7,109 (48.9%) | 185 (2.6%) |
Employment Status by Educational Attainment in Frio County
According to labor force statistics for Frio County, 58.3% of individuals (5,497) out of the total population between 25 and 64 years of age (9,429) are in the labor force, with 2.7% or 148 of them being unemployed. The group with the highest labor force participation rate are those with the educational attainment of bachelor's degree or higher, with 68.1% or 525 individuals in the labor force. Within the labor force, individuals with college / associate degree education have the highest percentage of unemployment, with 6.6% or 81 of them being unemployed.
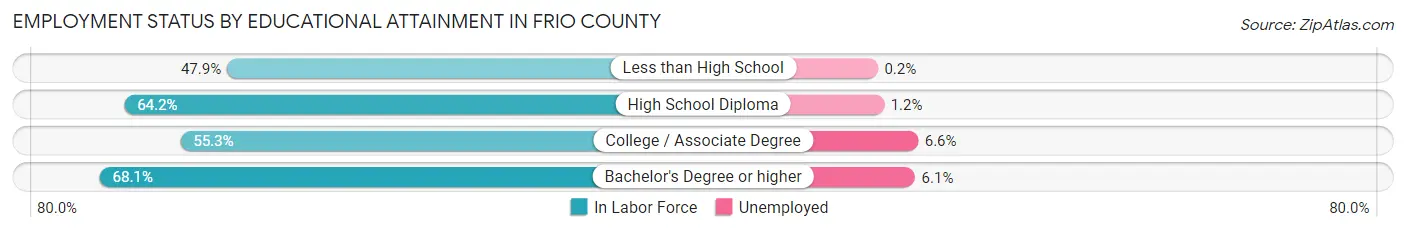
| Educational Attainment | In Labor Force | Unemployed |
| Less than High School | 1,145 (47.9%) | 5 (0.2%) |
| High School Diploma | 2,597 (64.2%) | 49 (1.2%) |
| College / Associate Degree | 1,229 (55.3%) | 147 (6.6%) |
| Bachelor's Degree or higher | 525 (68.1%) | 47 (6.1%) |
| Total | 5,497 (58.3%) | 255 (2.7%) |
Employment Occupations by Sex in Frio County
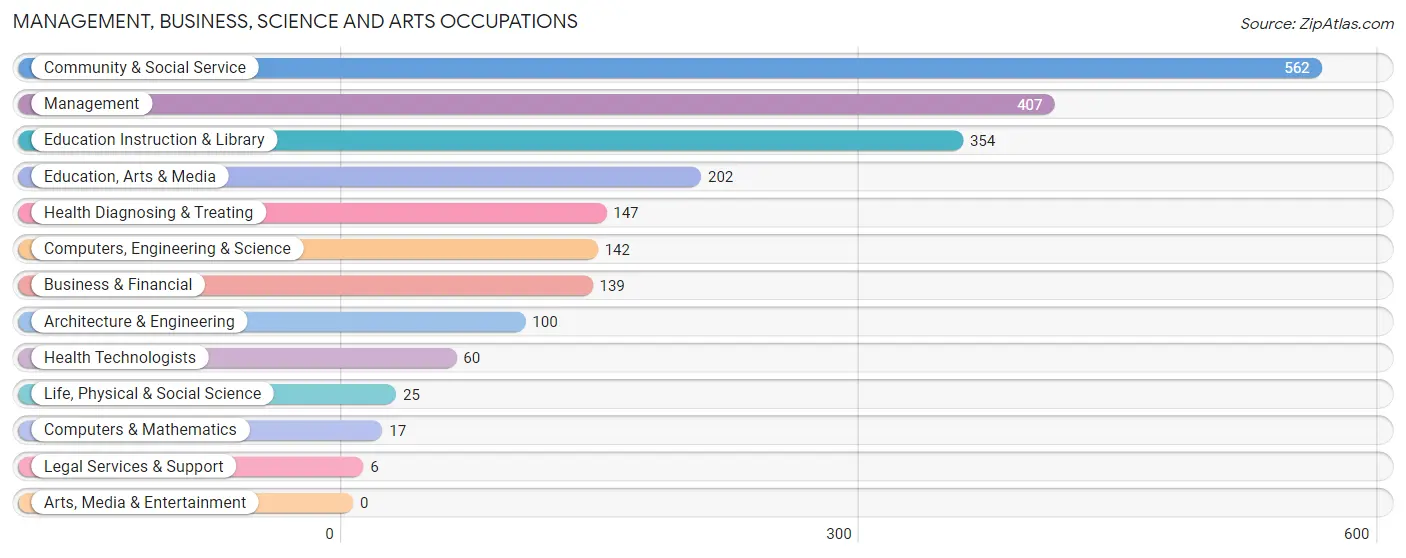
Management, Business, Science and Arts Occupations
The most common Management, Business, Science and Arts occupations in Frio County are Community & Social Service (562 | 8.1%), Management (407 | 5.9%), Education Instruction & Library (354 | 5.1%), Education, Arts & Media (202 | 2.9%), and Health Diagnosing & Treating (147 | 2.1%).
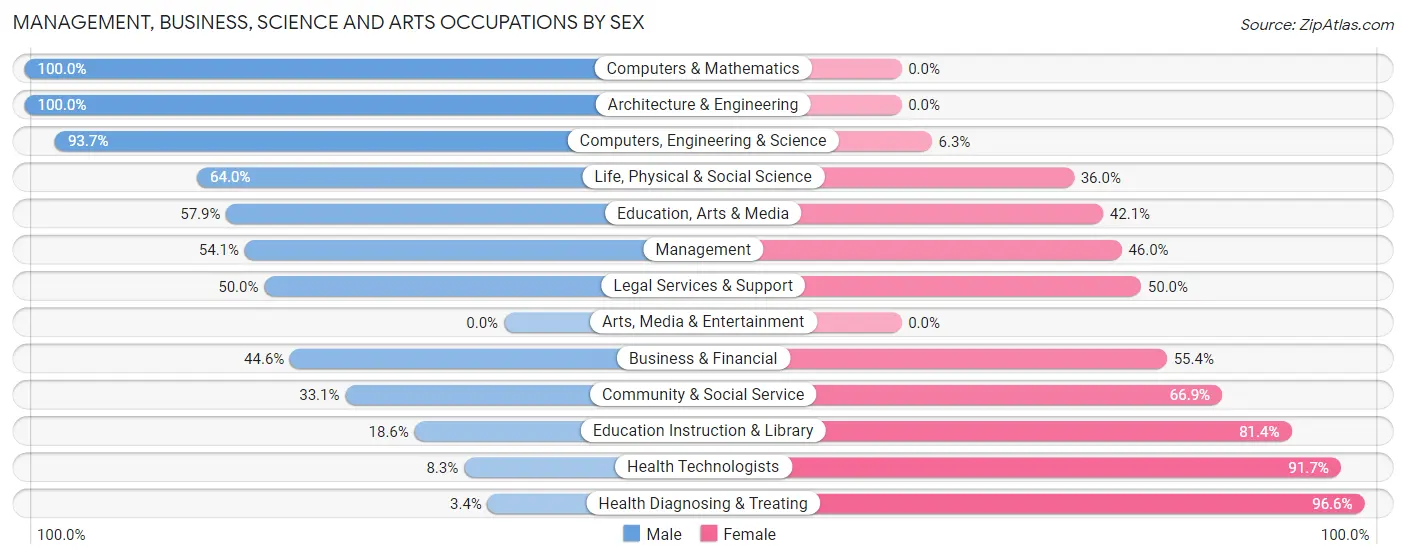
Management, Business, Science and Arts Occupations by Sex
Within the Management, Business, Science and Arts occupations in Frio County, the most male-oriented occupations are Computers & Mathematics (100.0%), Architecture & Engineering (100.0%), and Computers, Engineering & Science (93.7%), while the most female-oriented occupations are Health Diagnosing & Treating (96.6%), Health Technologists (91.7%), and Education Instruction & Library (81.4%).
| Occupation | Male | Female |
| Management | 220 (54.0%) | 187 (46.0%) |
| Business & Financial | 62 (44.6%) | 77 (55.4%) |
| Computers, Engineering & Science | 133 (93.7%) | 9 (6.3%) |
| Computers & Mathematics | 17 (100.0%) | 0 (0.0%) |
| Architecture & Engineering | 100 (100.0%) | 0 (0.0%) |
| Life, Physical & Social Science | 16 (64.0%) | 9 (36.0%) |
| Community & Social Service | 186 (33.1%) | 376 (66.9%) |
| Education, Arts & Media | 117 (57.9%) | 85 (42.1%) |
| Legal Services & Support | 3 (50.0%) | 3 (50.0%) |
| Education Instruction & Library | 66 (18.6%) | 288 (81.4%) |
| Arts, Media & Entertainment | 0 (0.0%) | 0 (0.0%) |
| Health Diagnosing & Treating | 5 (3.4%) | 142 (96.6%) |
| Health Technologists | 5 (8.3%) | 55 (91.7%) |
| Total (Category) | 606 (43.4%) | 791 (56.6%) |
| Total (Overall) | 4,528 (65.3%) | 2,402 (34.7%) |
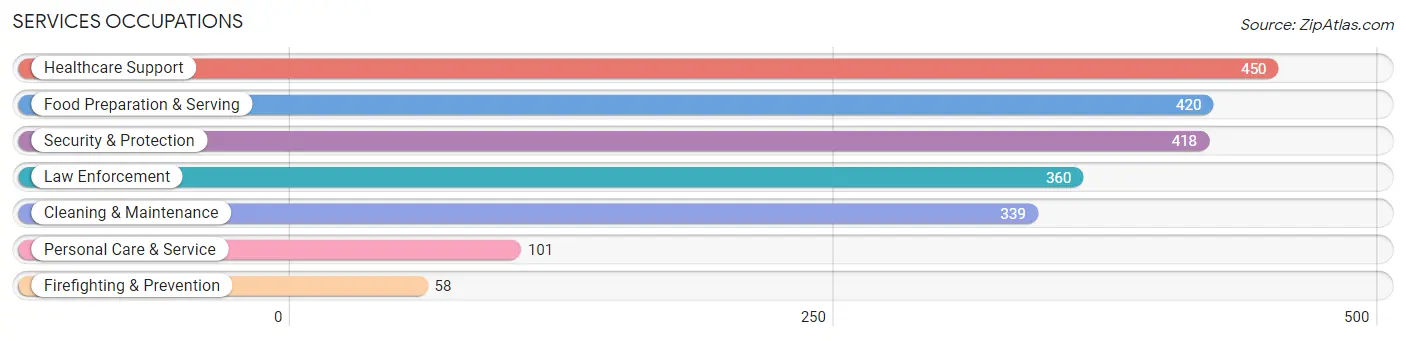
Services Occupations
The most common Services occupations in Frio County are Healthcare Support (450 | 6.5%), Food Preparation & Serving (420 | 6.1%), Security & Protection (418 | 6.0%), Law Enforcement (360 | 5.2%), and Cleaning & Maintenance (339 | 4.9%).
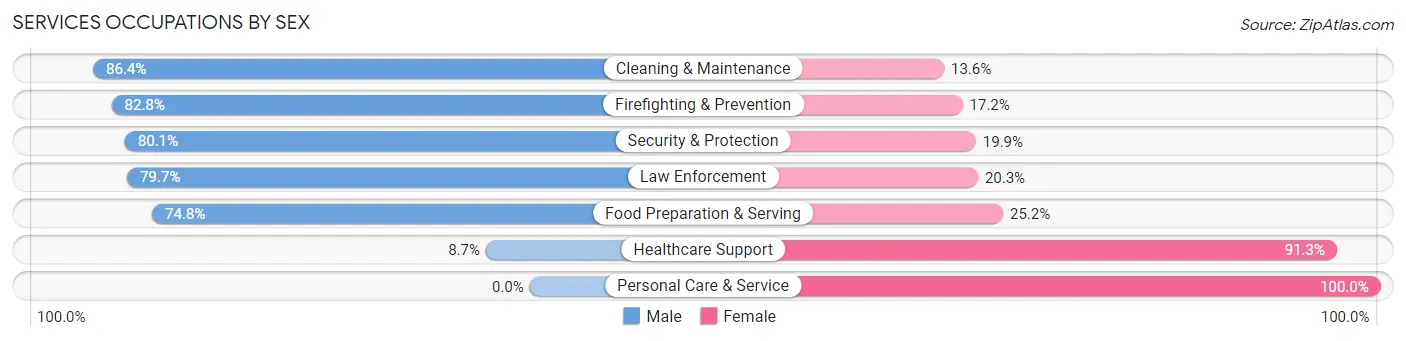
Services Occupations by Sex
Within the Services occupations in Frio County, the most male-oriented occupations are Cleaning & Maintenance (86.4%), Firefighting & Prevention (82.8%), and Security & Protection (80.1%), while the most female-oriented occupations are Personal Care & Service (100.0%), Healthcare Support (91.3%), and Food Preparation & Serving (25.2%).
| Occupation | Male | Female |
| Healthcare Support | 39 (8.7%) | 411 (91.3%) |
| Security & Protection | 335 (80.1%) | 83 (19.9%) |
| Firefighting & Prevention | 48 (82.8%) | 10 (17.2%) |
| Law Enforcement | 287 (79.7%) | 73 (20.3%) |
| Food Preparation & Serving | 314 (74.8%) | 106 (25.2%) |
| Cleaning & Maintenance | 293 (86.4%) | 46 (13.6%) |
| Personal Care & Service | 0 (0.0%) | 101 (100.0%) |
| Total (Category) | 981 (56.8%) | 747 (43.2%) |
| Total (Overall) | 4,528 (65.3%) | 2,402 (34.7%) |
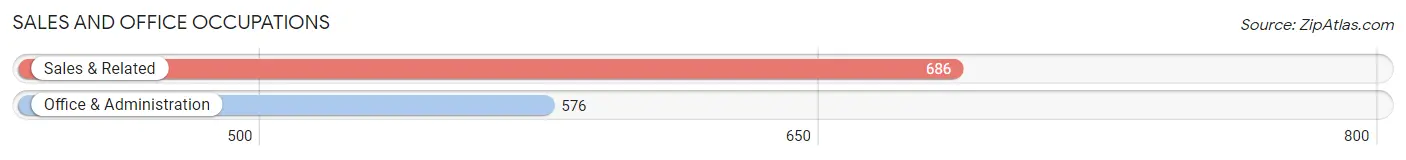
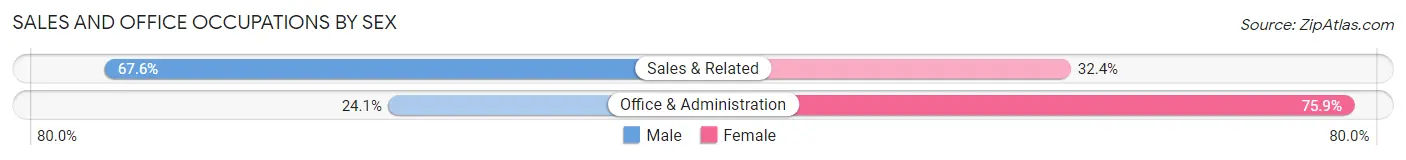
Sales and Office Occupations
The most common Sales and Office occupations in Frio County are Sales & Related (686 | 9.9%), and Office & Administration (576 | 8.3%).
Sales and Office Occupations by Sex
| Occupation | Male | Female |
| Sales & Related | 464 (67.6%) | 222 (32.4%) |
| Office & Administration | 139 (24.1%) | 437 (75.9%) |
| Total (Category) | 603 (47.8%) | 659 (52.2%) |
| Total (Overall) | 4,528 (65.3%) | 2,402 (34.7%) |
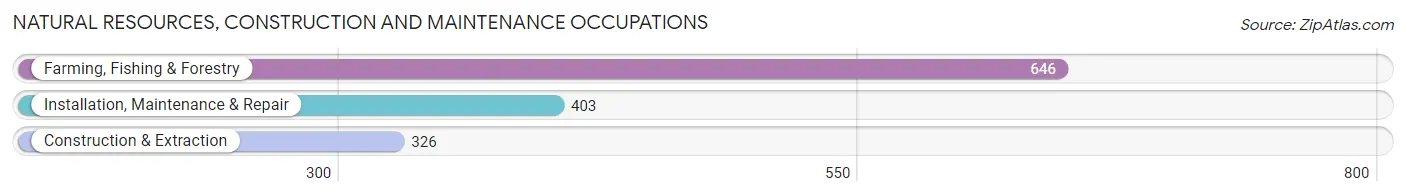
Natural Resources, Construction and Maintenance Occupations
The most common Natural Resources, Construction and Maintenance occupations in Frio County are Farming, Fishing & Forestry (646 | 9.3%), Installation, Maintenance & Repair (403 | 5.8%), and Construction & Extraction (326 | 4.7%).
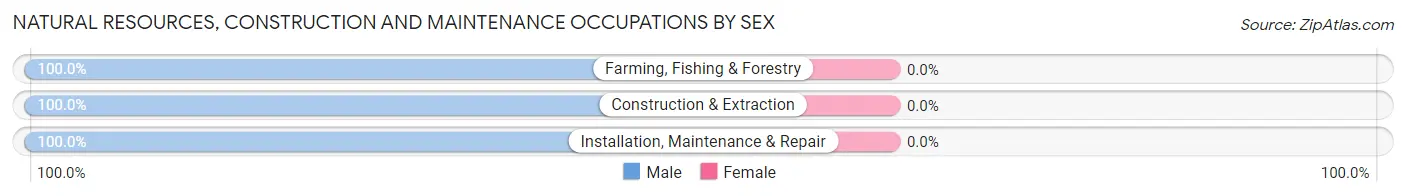
Natural Resources, Construction and Maintenance Occupations by Sex
| Occupation | Male | Female |
| Farming, Fishing & Forestry | 646 (100.0%) | 0 (0.0%) |
| Construction & Extraction | 326 (100.0%) | 0 (0.0%) |
| Installation, Maintenance & Repair | 403 (100.0%) | 0 (0.0%) |
| Total (Category) | 1,375 (100.0%) | 0 (0.0%) |
| Total (Overall) | 4,528 (65.3%) | 2,402 (34.7%) |
Production, Transportation and Moving Occupations
The most common Production, Transportation and Moving occupations in Frio County are Transportation (453 | 6.5%), Material Moving (392 | 5.7%), and Production (323 | 4.7%).
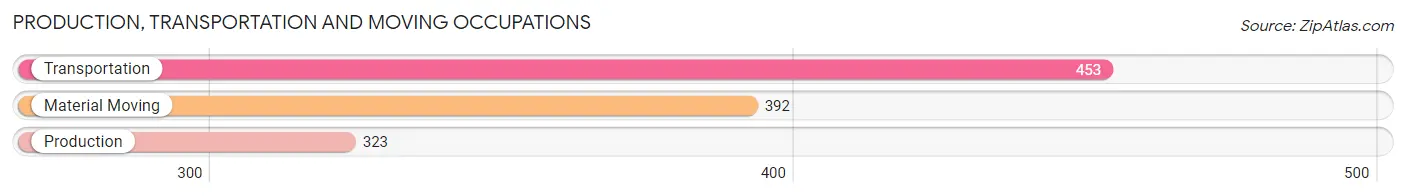
Production, Transportation and Moving Occupations by Sex
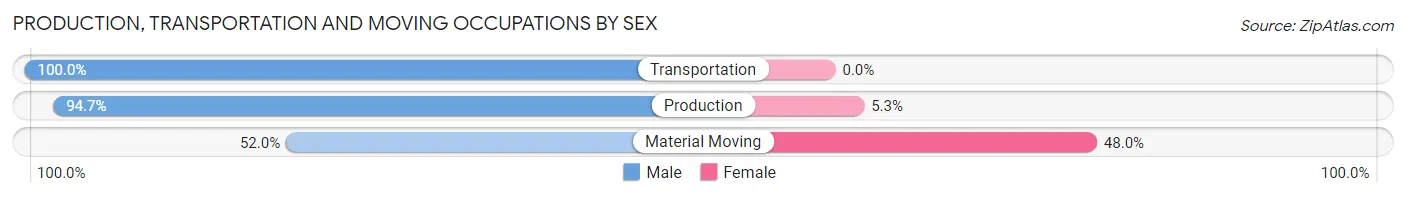
| Occupation | Male | Female |
| Production | 306 (94.7%) | 17 (5.3%) |
| Transportation | 453 (100.0%) | 0 (0.0%) |
| Material Moving | 204 (52.0%) | 188 (48.0%) |
| Total (Category) | 963 (82.5%) | 205 (17.5%) |
| Total (Overall) | 4,528 (65.3%) | 2,402 (34.7%) |
Employment Industries by Sex in Frio County
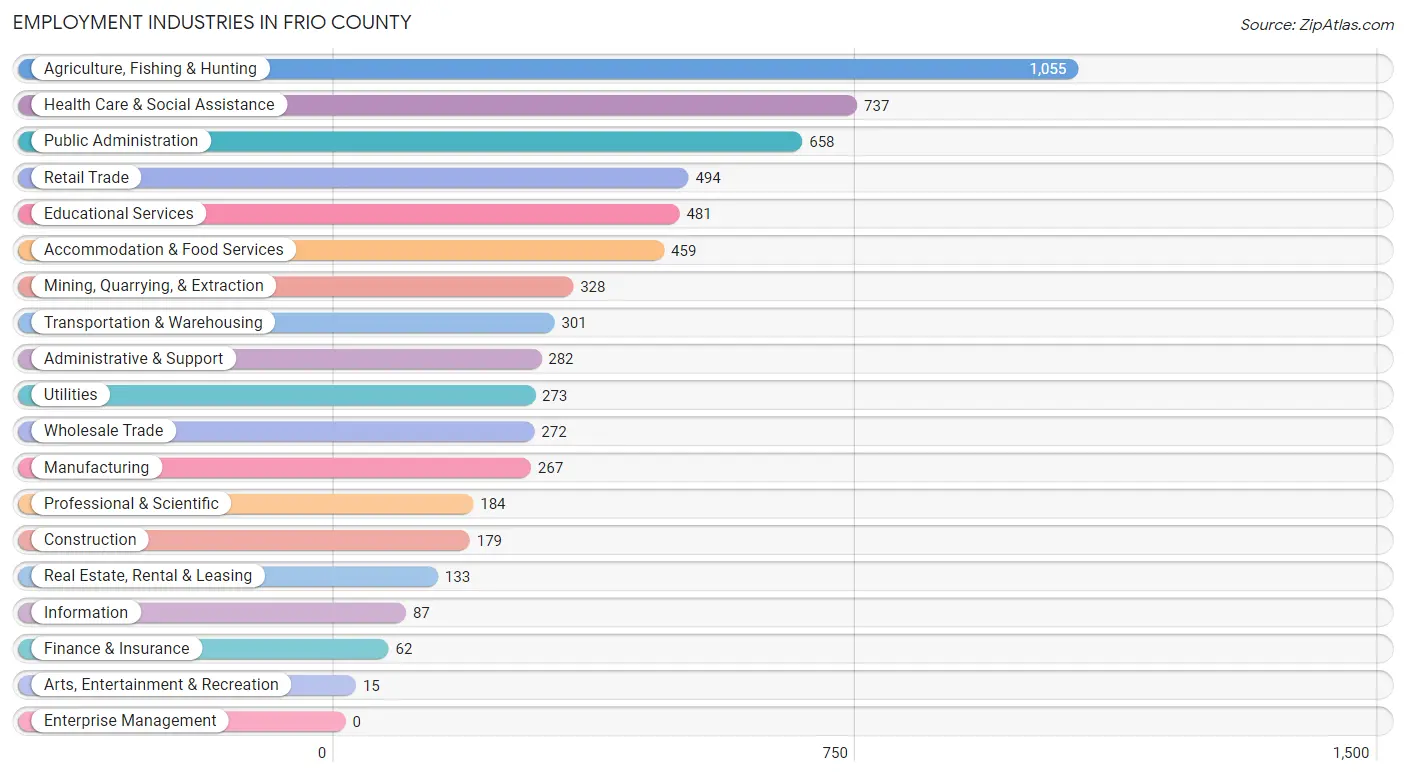
Employment Industries in Frio County
The major employment industries in Frio County include Agriculture, Fishing & Hunting (1,055 | 15.2%), Health Care & Social Assistance (737 | 10.6%), Public Administration (658 | 9.5%), Retail Trade (494 | 7.1%), and Educational Services (481 | 6.9%).
Employment Industries by Sex in Frio County
The Frio County industries that see more men than women are Construction (100.0%), Information (100.0%), and Real Estate, Rental & Leasing (100.0%), whereas the industries that tend to have a higher number of women are Health Care & Social Assistance (84.4%), Educational Services (80.2%), and Professional & Scientific (54.3%).
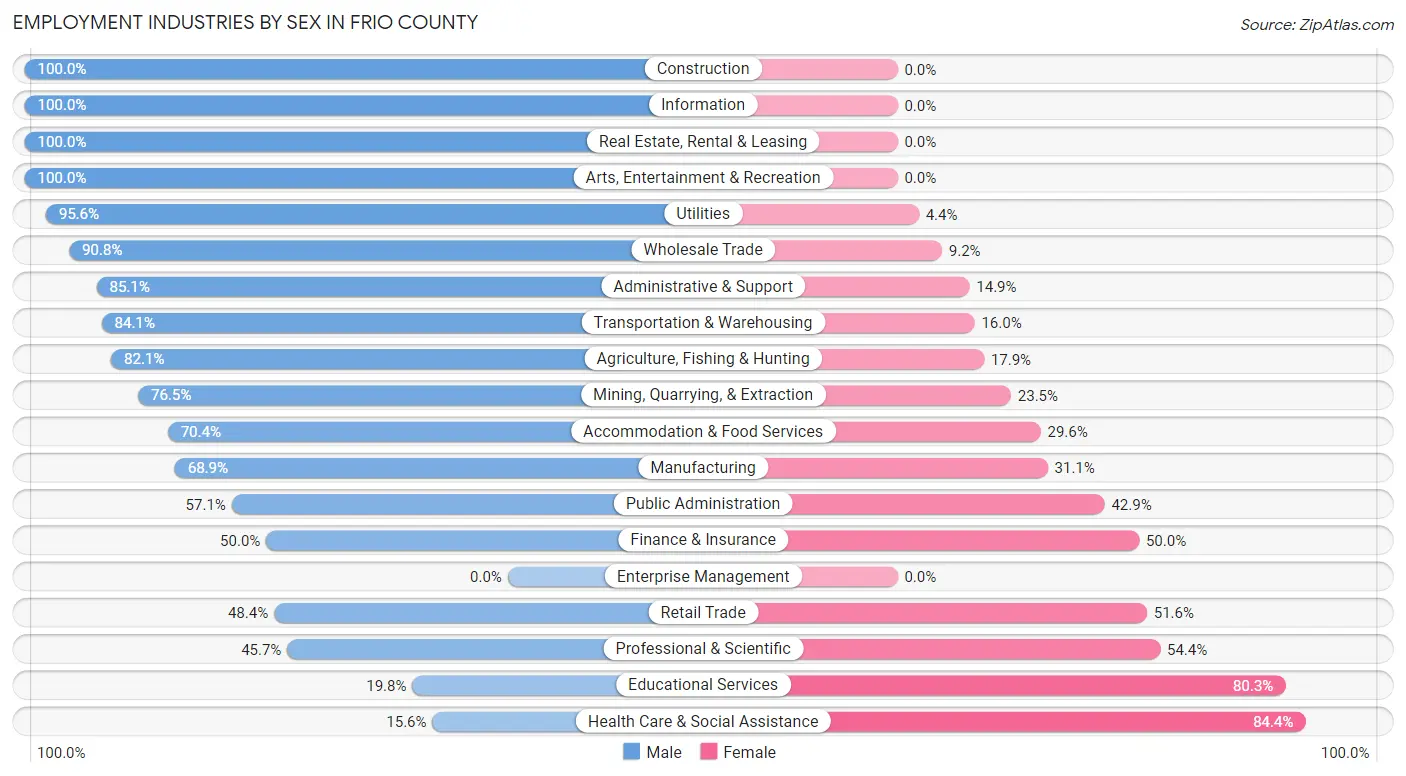
| Industry | Male | Female |
| Agriculture, Fishing & Hunting | 866 (82.1%) | 189 (17.9%) |
| Mining, Quarrying, & Extraction | 251 (76.5%) | 77 (23.5%) |
| Construction | 179 (100.0%) | 0 (0.0%) |
| Manufacturing | 184 (68.9%) | 83 (31.1%) |
| Wholesale Trade | 247 (90.8%) | 25 (9.2%) |
| Retail Trade | 239 (48.4%) | 255 (51.6%) |
| Transportation & Warehousing | 253 (84.1%) | 48 (16.0%) |
| Utilities | 261 (95.6%) | 12 (4.4%) |
| Information | 87 (100.0%) | 0 (0.0%) |
| Finance & Insurance | 31 (50.0%) | 31 (50.0%) |
| Real Estate, Rental & Leasing | 133 (100.0%) | 0 (0.0%) |
| Professional & Scientific | 84 (45.7%) | 100 (54.3%) |
| Enterprise Management | 0 (0.0%) | 0 (0.0%) |
| Administrative & Support | 240 (85.1%) | 42 (14.9%) |
| Educational Services | 95 (19.8%) | 386 (80.2%) |
| Health Care & Social Assistance | 115 (15.6%) | 622 (84.4%) |
| Arts, Entertainment & Recreation | 15 (100.0%) | 0 (0.0%) |
| Accommodation & Food Services | 323 (70.4%) | 136 (29.6%) |
| Public Administration | 376 (57.1%) | 282 (42.9%) |
| Total | 4,528 (65.3%) | 2,402 (34.7%) |
Education in Frio County
School Enrollment in Frio County
The most common levels of schooling among the 4,461 students in Frio County are high school (1,217 | 27.3%), elementary school (1,199 | 26.9%), and college / undergraduate (860 | 19.3%).
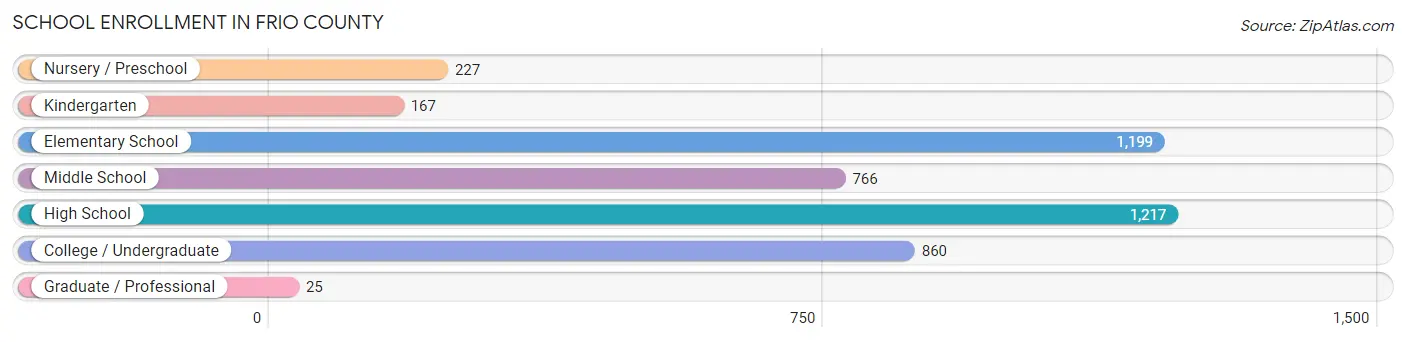
| School Level | # Students | % Students |
| Nursery / Preschool | 227 | 5.1% |
| Kindergarten | 167 | 3.7% |
| Elementary School | 1,199 | 26.9% |
| Middle School | 766 | 17.2% |
| High School | 1,217 | 27.3% |
| College / Undergraduate | 860 | 19.3% |
| Graduate / Professional | 25 | 0.6% |
| Total | 4,461 | 100.0% |
School Enrollment by Age by Funding Source in Frio County
Out of a total of 4,461 students who are enrolled in schools in Frio County, 352 (7.9%) attend a private institution, while the remaining 4,109 (92.1%) are enrolled in public schools. The age group of 18 to 19 year olds has the highest likelihood of being enrolled in private schools, with 137 (33.9% in the age bracket) enrolled. Conversely, the age group of 3 to 4 year olds has the lowest likelihood of being enrolled in a private school, with 204 (100.0% in the age bracket) attending a public institution.
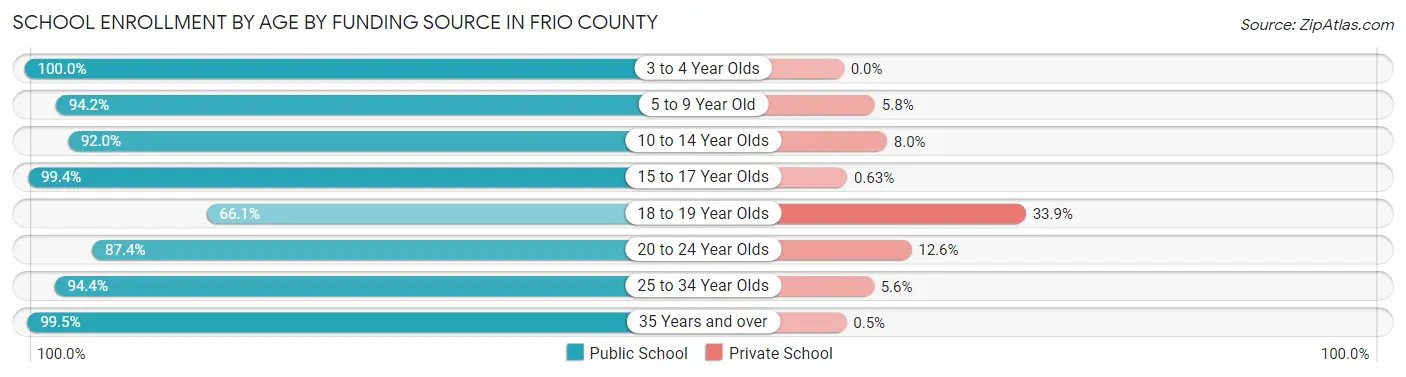
| Age Bracket | Public School | Private School |
| 3 to 4 Year Olds | 204 (100.0%) | 0 (0.0%) |
| 5 to 9 Year Old | 1,036 (94.2%) | 64 (5.8%) |
| 10 to 14 Year Olds | 1,052 (92.0%) | 92 (8.0%) |
| 15 to 17 Year Olds | 792 (99.4%) | 5 (0.6%) |
| 18 to 19 Year Olds | 267 (66.1%) | 137 (33.9%) |
| 20 to 24 Year Olds | 236 (87.4%) | 34 (12.6%) |
| 25 to 34 Year Olds | 321 (94.4%) | 19 (5.6%) |
| 35 Years and over | 201 (99.5%) | 1 (0.5%) |
| Total | 4,109 (92.1%) | 352 (7.9%) |
Educational Attainment by Field of Study in Frio County
Education (213 | 20.9%), business (189 | 18.5%), physical & health sciences (93 | 9.1%), communications (80 | 7.9%), and arts & humanities (77 | 7.6%) are the most common fields of study among 1,019 individuals in Frio County who have obtained a bachelor's degree or higher.
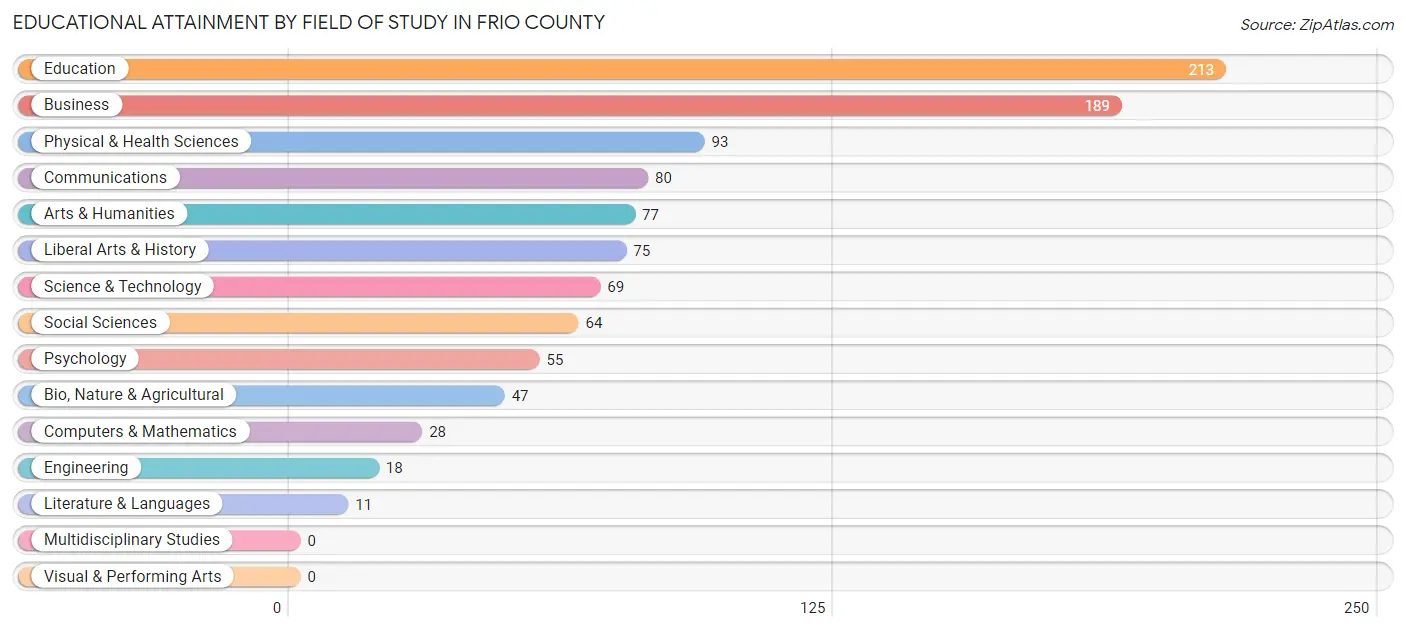
| Field of Study | # Graduates | % Graduates |
| Computers & Mathematics | 28 | 2.8% |
| Bio, Nature & Agricultural | 47 | 4.6% |
| Physical & Health Sciences | 93 | 9.1% |
| Psychology | 55 | 5.4% |
| Social Sciences | 64 | 6.3% |
| Engineering | 18 | 1.8% |
| Multidisciplinary Studies | 0 | 0.0% |
| Science & Technology | 69 | 6.8% |
| Business | 189 | 18.5% |
| Education | 213 | 20.9% |
| Literature & Languages | 11 | 1.1% |
| Liberal Arts & History | 75 | 7.4% |
| Visual & Performing Arts | 0 | 0.0% |
| Communications | 80 | 7.9% |
| Arts & Humanities | 77 | 7.6% |
| Total | 1,019 | 100.0% |
Transportation & Commute in Frio County
Vehicle Availability by Sex in Frio County
The most prevalent vehicle ownership categories in Frio County are males with 2 vehicles (1,966, accounting for 44.3%) and females with 2 vehicles (888, making up 83.4%).
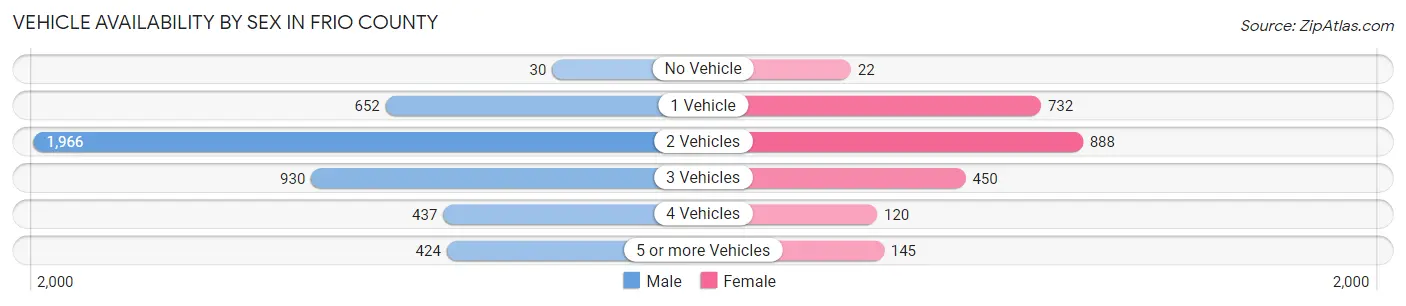
| Vehicles Available | Male | Female |
| No Vehicle | 30 (0.7%) | 22 (0.9%) |
| 1 Vehicle | 652 (14.7%) | 732 (31.1%) |
| 2 Vehicles | 1,966 (44.3%) | 888 (37.7%) |
| 3 Vehicles | 930 (20.9%) | 450 (19.1%) |
| 4 Vehicles | 437 (9.8%) | 120 (5.1%) |
| 5 or more Vehicles | 424 (9.6%) | 145 (6.1%) |
| Total | 4,439 (100.0%) | 2,357 (100.0%) |
Commute Time in Frio County
The most frequently occuring commute durations in Frio County are 5 to 9 minutes (1,386 commuters, 21.1%), 20 to 24 minutes (1,383 commuters, 21.1%), and 10 to 14 minutes (1,160 commuters, 17.7%).
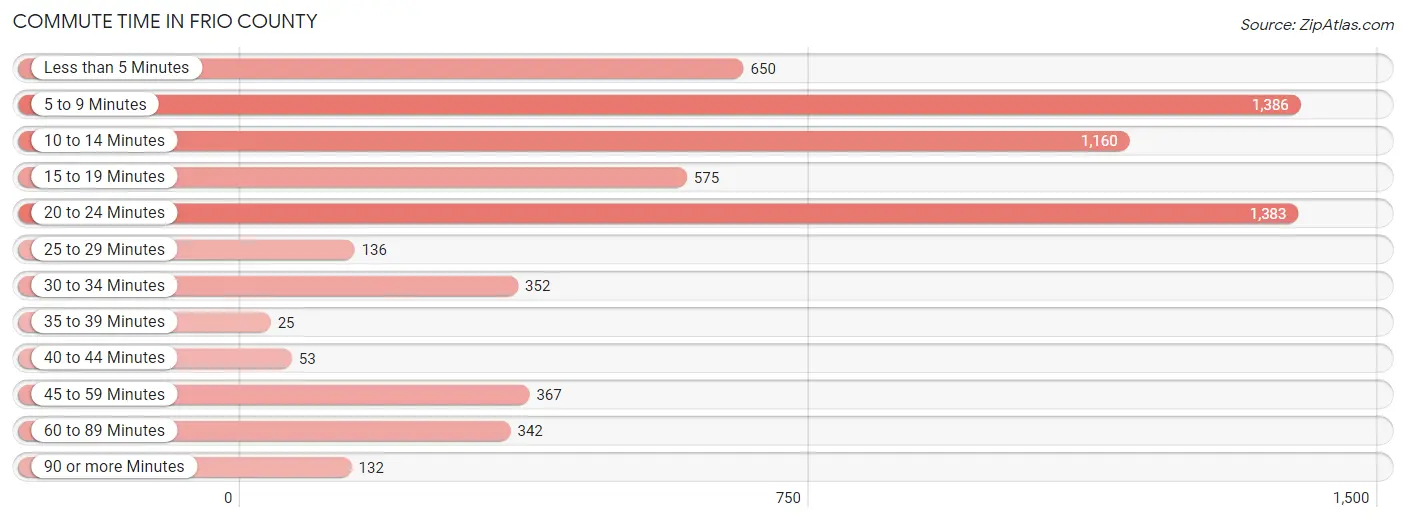
| Commute Time | # Commuters | % Commuters |
| Less than 5 Minutes | 650 | 9.9% |
| 5 to 9 Minutes | 1,386 | 21.1% |
| 10 to 14 Minutes | 1,160 | 17.7% |
| 15 to 19 Minutes | 575 | 8.8% |
| 20 to 24 Minutes | 1,383 | 21.1% |
| 25 to 29 Minutes | 136 | 2.1% |
| 30 to 34 Minutes | 352 | 5.4% |
| 35 to 39 Minutes | 25 | 0.4% |
| 40 to 44 Minutes | 53 | 0.8% |
| 45 to 59 Minutes | 367 | 5.6% |
| 60 to 89 Minutes | 342 | 5.2% |
| 90 or more Minutes | 132 | 2.0% |
Commute Time by Sex in Frio County
The most common commute times in Frio County are 20 to 24 minutes (1,093 commuters, 24.7%) for males and 10 to 14 minutes (563 commuters, 26.3%) for females.
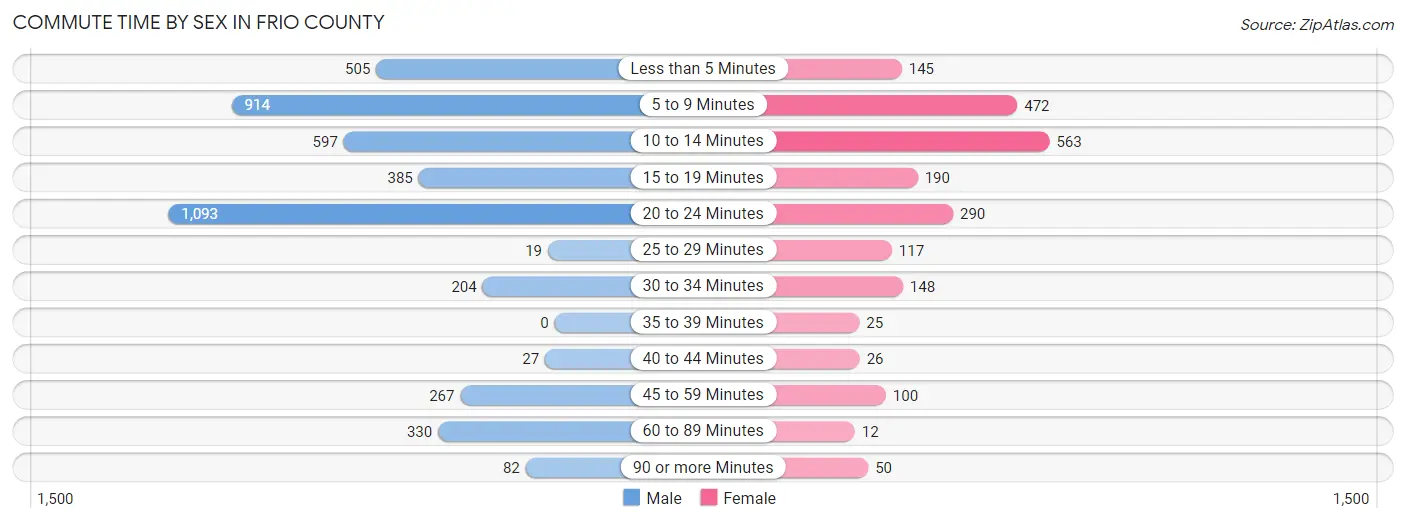
| Commute Time | Male | Female |
| Less than 5 Minutes | 505 (11.4%) | 145 (6.8%) |
| 5 to 9 Minutes | 914 (20.7%) | 472 (22.1%) |
| 10 to 14 Minutes | 597 (13.5%) | 563 (26.3%) |
| 15 to 19 Minutes | 385 (8.7%) | 190 (8.9%) |
| 20 to 24 Minutes | 1,093 (24.7%) | 290 (13.6%) |
| 25 to 29 Minutes | 19 (0.4%) | 117 (5.5%) |
| 30 to 34 Minutes | 204 (4.6%) | 148 (6.9%) |
| 35 to 39 Minutes | 0 (0.0%) | 25 (1.2%) |
| 40 to 44 Minutes | 27 (0.6%) | 26 (1.2%) |
| 45 to 59 Minutes | 267 (6.0%) | 100 (4.7%) |
| 60 to 89 Minutes | 330 (7.5%) | 12 (0.6%) |
| 90 or more Minutes | 82 (1.8%) | 50 (2.3%) |
Time of Departure to Work by Sex in Frio County
The most frequent times of departure to work in Frio County are 7:30 AM to 7:59 AM (818, 18.5%) for males and 7:30 AM to 7:59 AM (755, 35.3%) for females.
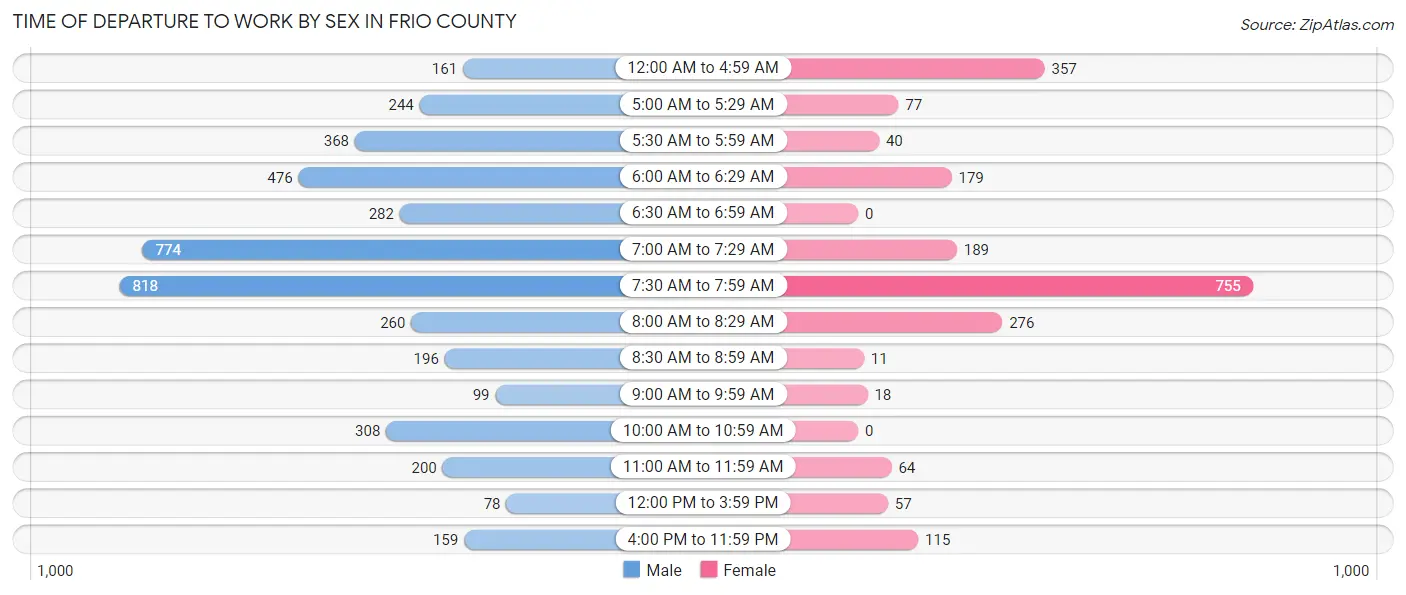
| Time of Departure | Male | Female |
| 12:00 AM to 4:59 AM | 161 (3.6%) | 357 (16.7%) |
| 5:00 AM to 5:29 AM | 244 (5.5%) | 77 (3.6%) |
| 5:30 AM to 5:59 AM | 368 (8.3%) | 40 (1.9%) |
| 6:00 AM to 6:29 AM | 476 (10.8%) | 179 (8.4%) |
| 6:30 AM to 6:59 AM | 282 (6.4%) | 0 (0.0%) |
| 7:00 AM to 7:29 AM | 774 (17.5%) | 189 (8.8%) |
| 7:30 AM to 7:59 AM | 818 (18.5%) | 755 (35.3%) |
| 8:00 AM to 8:29 AM | 260 (5.9%) | 276 (12.9%) |
| 8:30 AM to 8:59 AM | 196 (4.4%) | 11 (0.5%) |
| 9:00 AM to 9:59 AM | 99 (2.2%) | 18 (0.8%) |
| 10:00 AM to 10:59 AM | 308 (7.0%) | 0 (0.0%) |
| 11:00 AM to 11:59 AM | 200 (4.5%) | 64 (3.0%) |
| 12:00 PM to 3:59 PM | 78 (1.8%) | 57 (2.7%) |
| 4:00 PM to 11:59 PM | 159 (3.6%) | 115 (5.4%) |
| Total | 4,423 (100.0%) | 2,138 (100.0%) |
Housing Occupancy in Frio County
Occupancy by Ownership in Frio County
Of the total 4,709 dwellings in Frio County, owner-occupied units account for 2,894 (61.5%), while renter-occupied units make up 1,815 (38.5%).
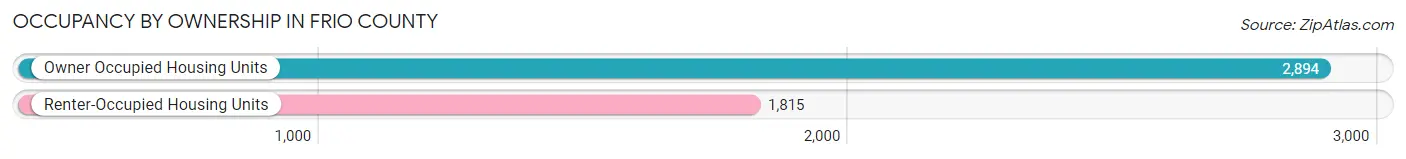
| Occupancy | # Housing Units | % Housing Units |
| Owner Occupied Housing Units | 2,894 | 61.5% |
| Renter-Occupied Housing Units | 1,815 | 38.5% |
| Total Occupied Housing Units | 4,709 | 100.0% |
Occupancy by Household Size in Frio County
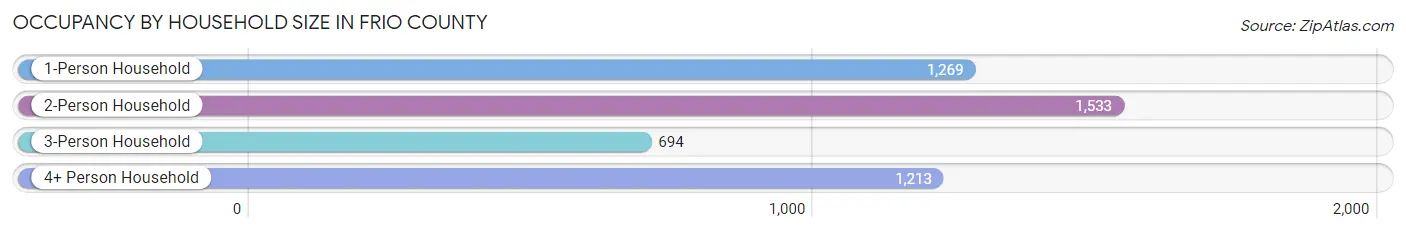
| Household Size | # Housing Units | % Housing Units |
| 1-Person Household | 1,269 | 27.0% |
| 2-Person Household | 1,533 | 32.6% |
| 3-Person Household | 694 | 14.7% |
| 4+ Person Household | 1,213 | 25.8% |
| Total Housing Units | 4,709 | 100.0% |
Occupancy by Ownership by Household Size in Frio County
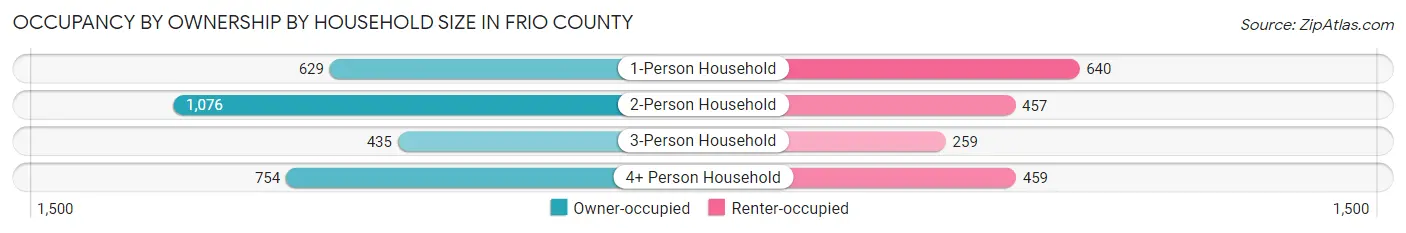
| Household Size | Owner-occupied | Renter-occupied |
| 1-Person Household | 629 (49.6%) | 640 (50.4%) |
| 2-Person Household | 1,076 (70.2%) | 457 (29.8%) |
| 3-Person Household | 435 (62.7%) | 259 (37.3%) |
| 4+ Person Household | 754 (62.2%) | 459 (37.8%) |
| Total Housing Units | 2,894 (61.5%) | 1,815 (38.5%) |
Occupancy by Educational Attainment in Frio County
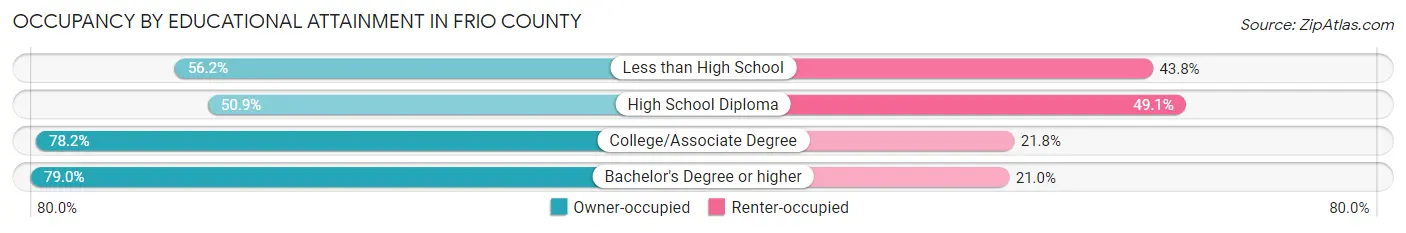
| Household Size | Owner-occupied | Renter-occupied |
| Less than High School | 850 (56.2%) | 663 (43.8%) |
| High School Diploma | 856 (50.9%) | 825 (49.1%) |
| College/Associate Degree | 820 (78.2%) | 229 (21.8%) |
| Bachelor's Degree or higher | 368 (79.0%) | 98 (21.0%) |
Occupancy by Age of Householder in Frio County
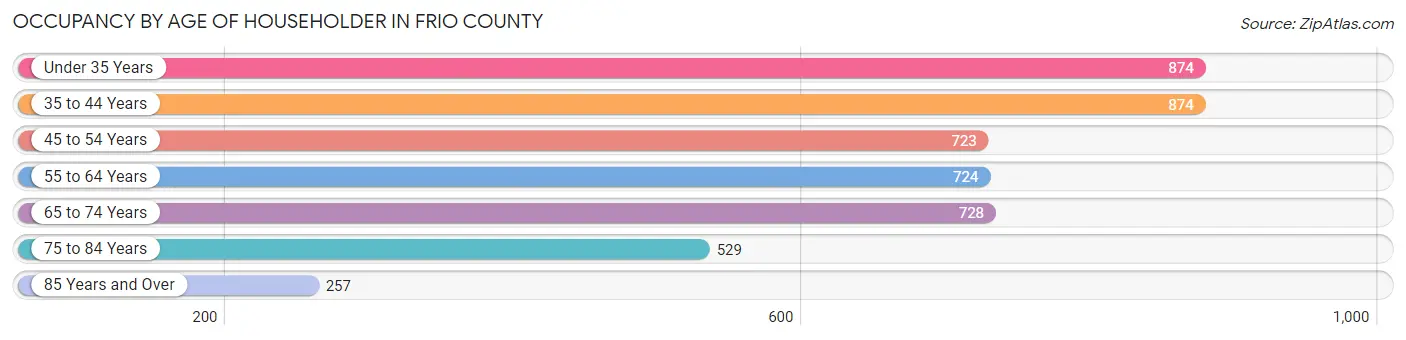
| Age Bracket | # Households | % Households |
| Under 35 Years | 874 | 18.6% |
| 35 to 44 Years | 874 | 18.6% |
| 45 to 54 Years | 723 | 15.3% |
| 55 to 64 Years | 724 | 15.4% |
| 65 to 74 Years | 728 | 15.5% |
| 75 to 84 Years | 529 | 11.2% |
| 85 Years and Over | 257 | 5.5% |
| Total | 4,709 | 100.0% |
Housing Finances in Frio County
Median Income by Occupancy in Frio County
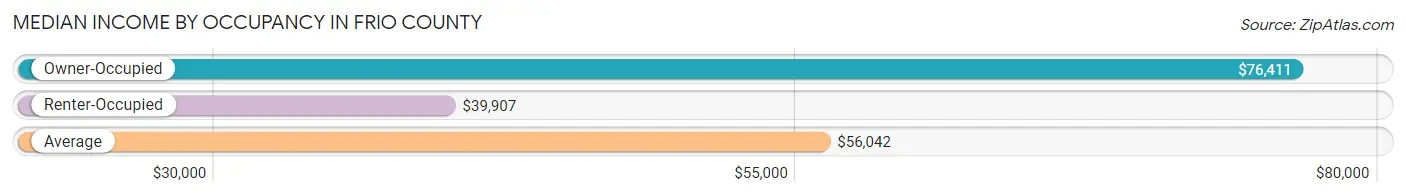
| Occupancy Type | # Households | Median Income |
| Owner-Occupied | 2,894 (61.5%) | $76,411 |
| Renter-Occupied | 1,815 (38.5%) | $39,907 |
| Average | 4,709 (100.0%) | $56,042 |
Occupancy by Householder Income Bracket in Frio County
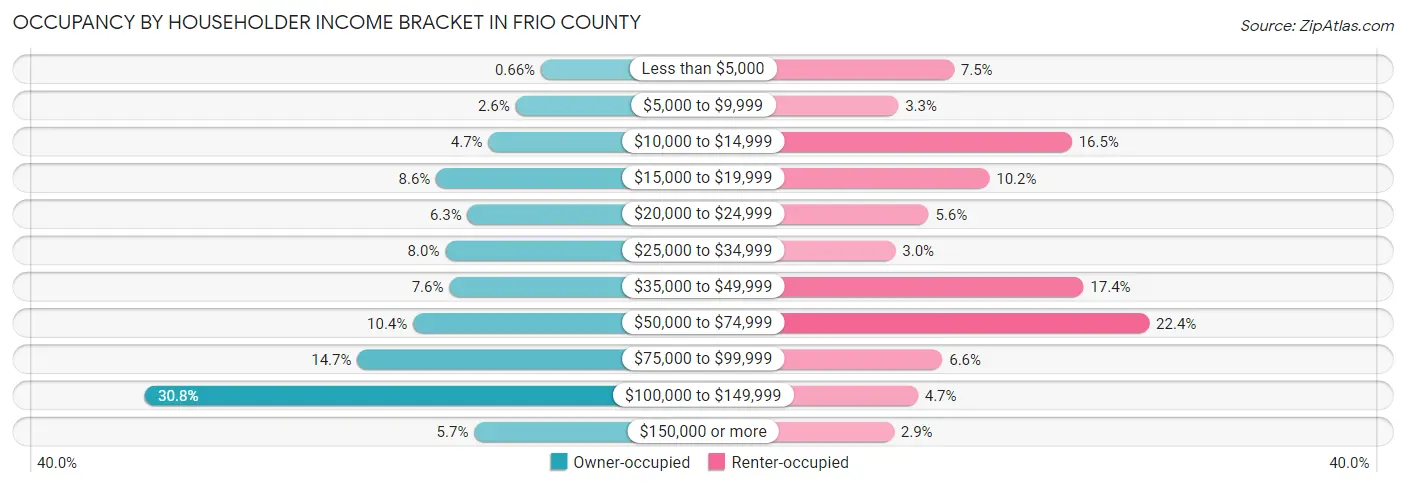
| Income Bracket | Owner-occupied | Renter-occupied |
| Less than $5,000 | 19 (0.7%) | 136 (7.5%) |
| $5,000 to $9,999 | 75 (2.6%) | 59 (3.3%) |
| $10,000 to $14,999 | 135 (4.7%) | 299 (16.5%) |
| $15,000 to $19,999 | 250 (8.6%) | 185 (10.2%) |
| $20,000 to $24,999 | 181 (6.2%) | 101 (5.6%) |
| $25,000 to $34,999 | 230 (8.0%) | 55 (3.0%) |
| $35,000 to $49,999 | 221 (7.6%) | 315 (17.4%) |
| $50,000 to $74,999 | 301 (10.4%) | 406 (22.4%) |
| $75,000 to $99,999 | 424 (14.6%) | 120 (6.6%) |
| $100,000 to $149,999 | 892 (30.8%) | 86 (4.7%) |
| $150,000 or more | 166 (5.7%) | 53 (2.9%) |
| Total | 2,894 (100.0%) | 1,815 (100.0%) |
Monthly Housing Cost Tiers in Frio County
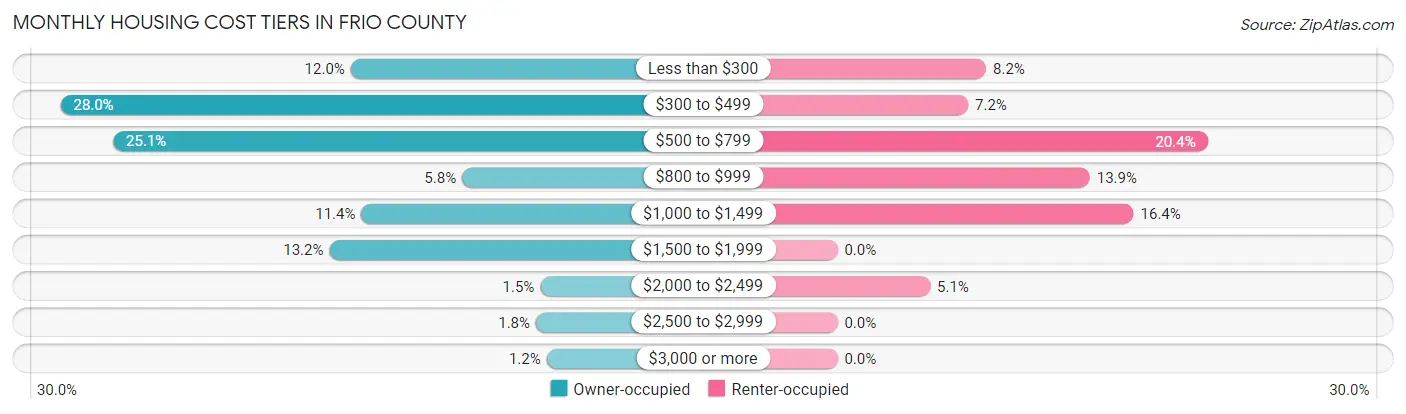
| Monthly Cost | Owner-occupied | Renter-occupied |
| Less than $300 | 347 (12.0%) | 149 (8.2%) |
| $300 to $499 | 811 (28.0%) | 131 (7.2%) |
| $500 to $799 | 727 (25.1%) | 371 (20.4%) |
| $800 to $999 | 169 (5.8%) | 253 (13.9%) |
| $1,000 to $1,499 | 330 (11.4%) | 297 (16.4%) |
| $1,500 to $1,999 | 381 (13.2%) | 0 (0.0%) |
| $2,000 to $2,499 | 44 (1.5%) | 93 (5.1%) |
| $2,500 to $2,999 | 51 (1.8%) | 0 (0.0%) |
| $3,000 or more | 34 (1.2%) | 0 (0.0%) |
| Total | 2,894 (100.0%) | 1,815 (100.0%) |
Physical Housing Characteristics in Frio County
Housing Structures in Frio County
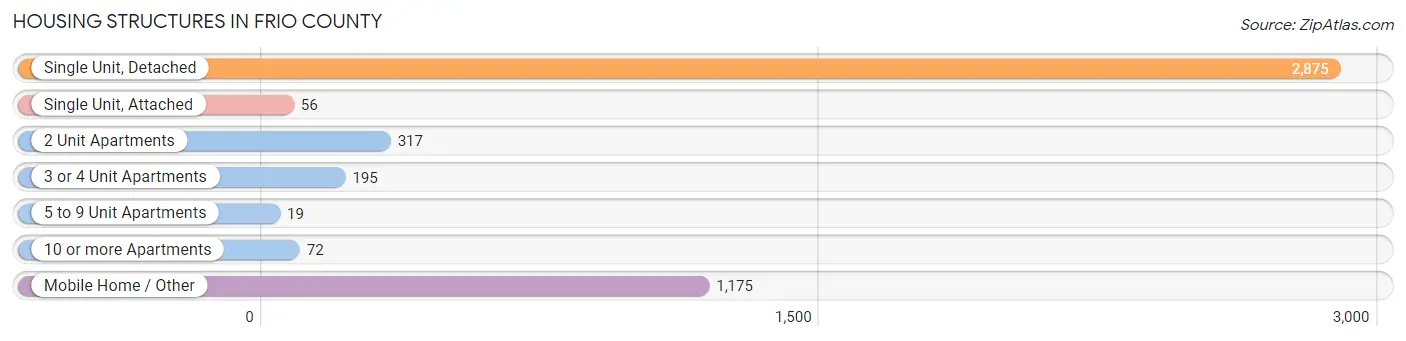
| Structure Type | # Housing Units | % Housing Units |
| Single Unit, Detached | 2,875 | 61.1% |
| Single Unit, Attached | 56 | 1.2% |
| 2 Unit Apartments | 317 | 6.7% |
| 3 or 4 Unit Apartments | 195 | 4.1% |
| 5 to 9 Unit Apartments | 19 | 0.4% |
| 10 or more Apartments | 72 | 1.5% |
| Mobile Home / Other | 1,175 | 24.9% |
| Total | 4,709 | 100.0% |
Housing Structures by Occupancy in Frio County
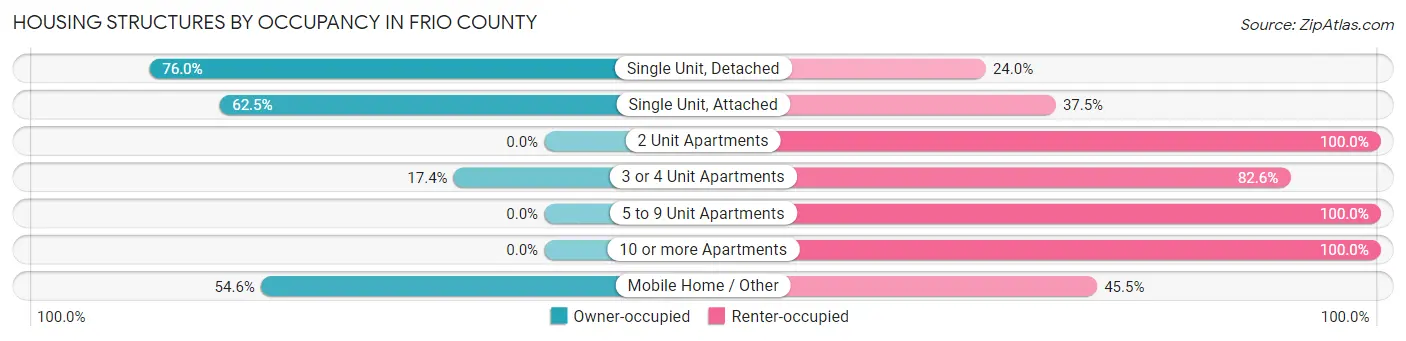
| Structure Type | Owner-occupied | Renter-occupied |
| Single Unit, Detached | 2,184 (76.0%) | 691 (24.0%) |
| Single Unit, Attached | 35 (62.5%) | 21 (37.5%) |
| 2 Unit Apartments | 0 (0.0%) | 317 (100.0%) |
| 3 or 4 Unit Apartments | 34 (17.4%) | 161 (82.6%) |
| 5 to 9 Unit Apartments | 0 (0.0%) | 19 (100.0%) |
| 10 or more Apartments | 0 (0.0%) | 72 (100.0%) |
| Mobile Home / Other | 641 (54.5%) | 534 (45.5%) |
| Total | 2,894 (61.5%) | 1,815 (38.5%) |
Housing Structures by Number of Rooms in Frio County
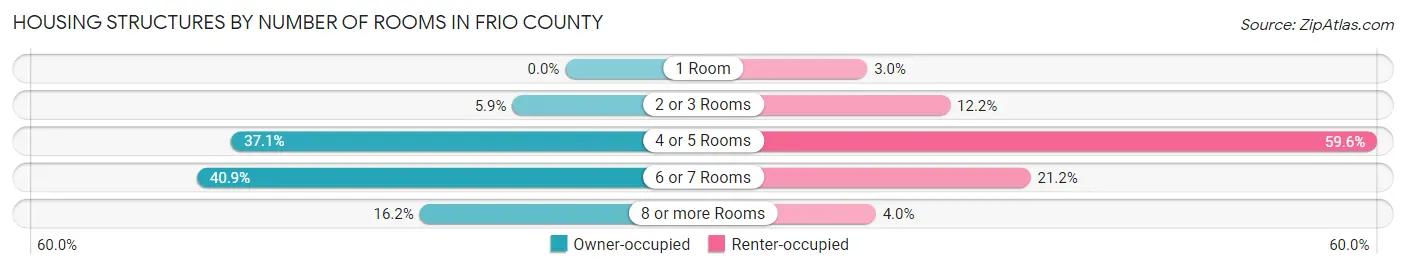
| Number of Rooms | Owner-occupied | Renter-occupied |
| 1 Room | 0 (0.0%) | 55 (3.0%) |
| 2 or 3 Rooms | 170 (5.9%) | 222 (12.2%) |
| 4 or 5 Rooms | 1,073 (37.1%) | 1,082 (59.6%) |
| 6 or 7 Rooms | 1,183 (40.9%) | 384 (21.2%) |
| 8 or more Rooms | 468 (16.2%) | 72 (4.0%) |
| Total | 2,894 (100.0%) | 1,815 (100.0%) |
Housing Structure by Heating Type in Frio County
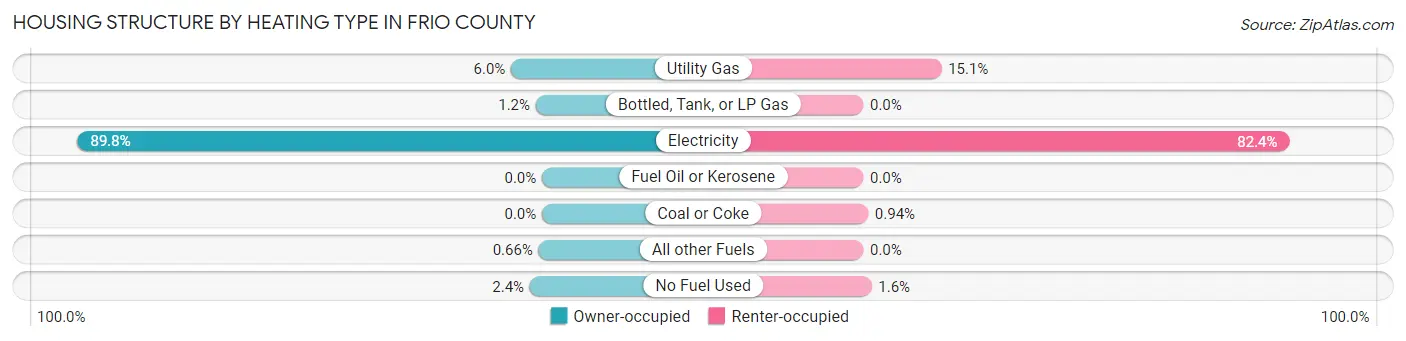
| Heating Type | Owner-occupied | Renter-occupied |
| Utility Gas | 173 (6.0%) | 274 (15.1%) |
| Bottled, Tank, or LP Gas | 35 (1.2%) | 0 (0.0%) |
| Electricity | 2,599 (89.8%) | 1,495 (82.4%) |
| Fuel Oil or Kerosene | 0 (0.0%) | 0 (0.0%) |
| Coal or Coke | 0 (0.0%) | 17 (0.9%) |
| All other Fuels | 19 (0.7%) | 0 (0.0%) |
| No Fuel Used | 68 (2.4%) | 29 (1.6%) |
| Total | 2,894 (100.0%) | 1,815 (100.0%) |
Household Vehicle Usage in Frio County
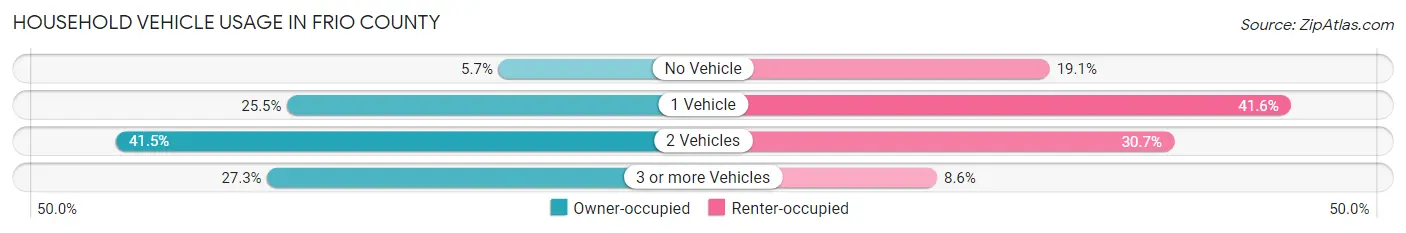
| Vehicles per Household | Owner-occupied | Renter-occupied |
| No Vehicle | 166 (5.7%) | 347 (19.1%) |
| 1 Vehicle | 737 (25.5%) | 755 (41.6%) |
| 2 Vehicles | 1,200 (41.5%) | 557 (30.7%) |
| 3 or more Vehicles | 791 (27.3%) | 156 (8.6%) |
| Total | 2,894 (100.0%) | 1,815 (100.0%) |
Real Estate & Mortgages in Frio County
Real Estate and Mortgage Overview in Frio County
| Characteristic | Without Mortgage | With Mortgage |
| Housing Units | 1,979 | 915 |
| Median Property Value | $88,100 | $116,200 |
| Median Household Income | $60,675 | $52 |
| Monthly Housing Costs | $478 | $34 |
| Real Estate Taxes | $1,527 | $75 |
Property Value by Mortgage Status in Frio County
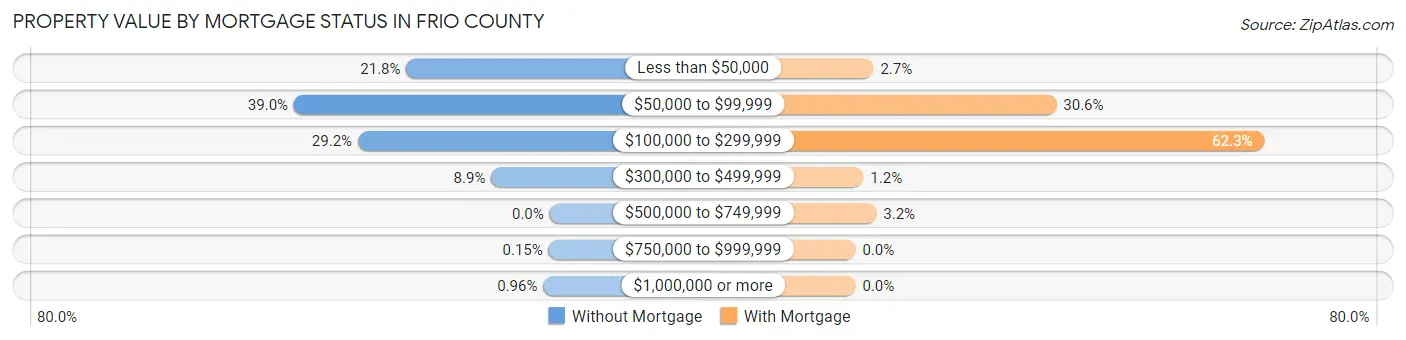
| Property Value | Without Mortgage | With Mortgage |
| Less than $50,000 | 432 (21.8%) | 25 (2.7%) |
| $50,000 to $99,999 | 771 (39.0%) | 280 (30.6%) |
| $100,000 to $299,999 | 578 (29.2%) | 570 (62.3%) |
| $300,000 to $499,999 | 176 (8.9%) | 11 (1.2%) |
| $500,000 to $749,999 | 0 (0.0%) | 29 (3.2%) |
| $750,000 to $999,999 | 3 (0.2%) | 0 (0.0%) |
| $1,000,000 or more | 19 (1.0%) | 0 (0.0%) |
| Total | 1,979 (100.0%) | 915 (100.0%) |
Household Income by Mortgage Status in Frio County
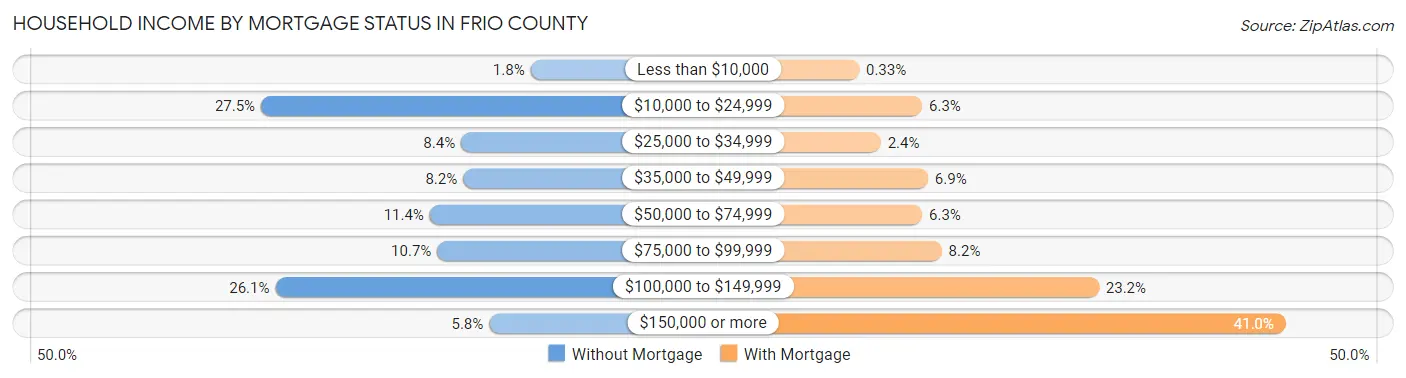
| Household Income | Without Mortgage | With Mortgage |
| Less than $10,000 | 36 (1.8%) | 3 (0.3%) |
| $10,000 to $24,999 | 544 (27.5%) | 58 (6.3%) |
| $25,000 to $34,999 | 167 (8.4%) | 22 (2.4%) |
| $35,000 to $49,999 | 163 (8.2%) | 63 (6.9%) |
| $50,000 to $74,999 | 226 (11.4%) | 58 (6.3%) |
| $75,000 to $99,999 | 212 (10.7%) | 75 (8.2%) |
| $100,000 to $149,999 | 517 (26.1%) | 212 (23.2%) |
| $150,000 or more | 114 (5.8%) | 375 (41.0%) |
| Total | 1,979 (100.0%) | 915 (100.0%) |
Property Value to Household Income Ratio in Frio County
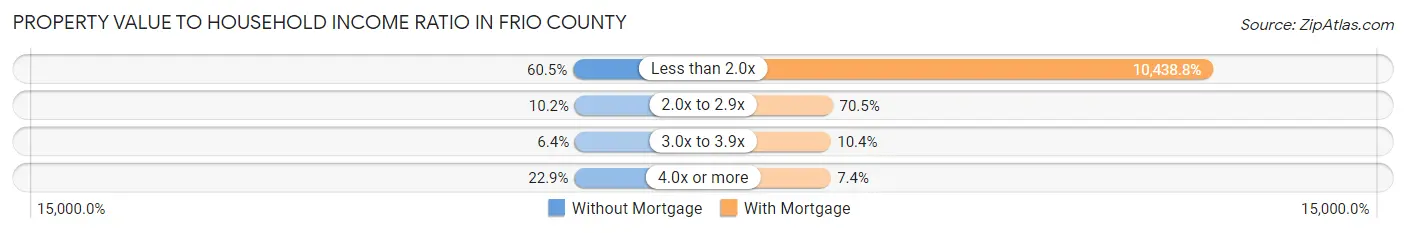
| Value-to-Income Ratio | Without Mortgage | With Mortgage |
| Less than 2.0x | 1,198 (60.5%) | 95,515 (10,438.8%) |
| 2.0x to 2.9x | 201 (10.2%) | 645 (70.5%) |
| 3.0x to 3.9x | 127 (6.4%) | 95 (10.4%) |
| 4.0x or more | 453 (22.9%) | 68 (7.4%) |
| Total | 1,979 (100.0%) | 915 (100.0%) |
Real Estate Taxes by Mortgage Status in Frio County
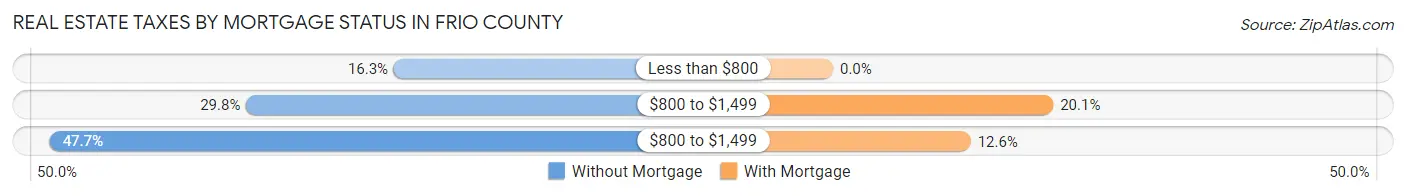
| Property Taxes | Without Mortgage | With Mortgage |
| Less than $800 | 322 (16.3%) | 0 (0.0%) |
| $800 to $1,499 | 589 (29.8%) | 184 (20.1%) |
| $800 to $1,499 | 944 (47.7%) | 115 (12.6%) |
| Total | 1,979 (100.0%) | 915 (100.0%) |
Health & Disability in Frio County
Health Insurance Coverage by Age in Frio County
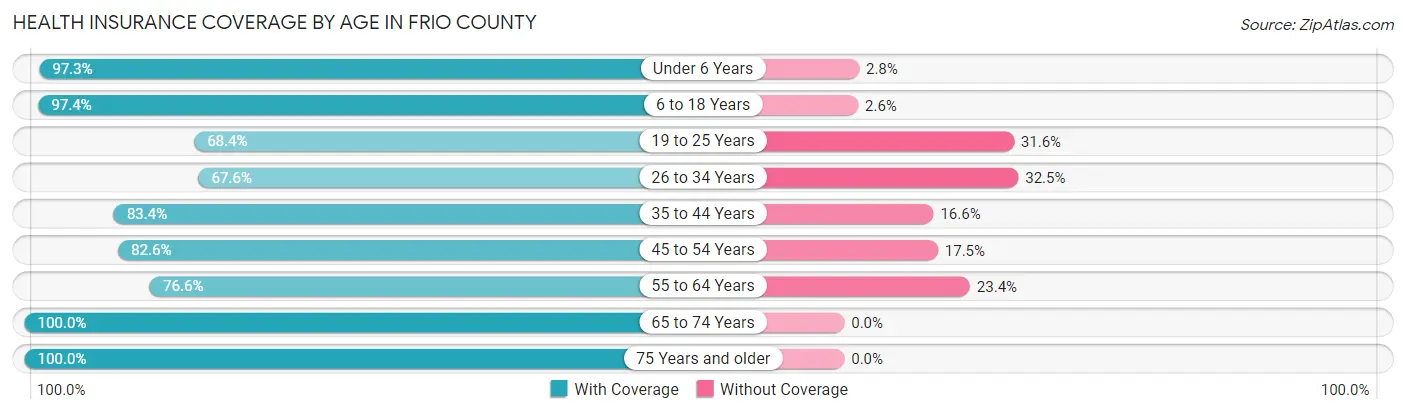
| Age Bracket | With Coverage | Without Coverage |
| Under 6 Years | 1,168 (97.3%) | 33 (2.8%) |
| 6 to 18 Years | 3,140 (97.4%) | 83 (2.6%) |
| 19 to 25 Years | 791 (68.4%) | 366 (31.6%) |
| 26 to 34 Years | 1,424 (67.5%) | 684 (32.5%) |
| 35 to 44 Years | 1,720 (83.4%) | 343 (16.6%) |
| 45 to 54 Years | 1,211 (82.6%) | 256 (17.4%) |
| 55 to 64 Years | 1,128 (76.6%) | 345 (23.4%) |
| 65 to 74 Years | 1,048 (100.0%) | 0 (0.0%) |
| 75 Years and older | 1,054 (100.0%) | 0 (0.0%) |
| Total | 12,684 (85.7%) | 2,110 (14.3%) |
Health Insurance Coverage by Citizenship Status in Frio County
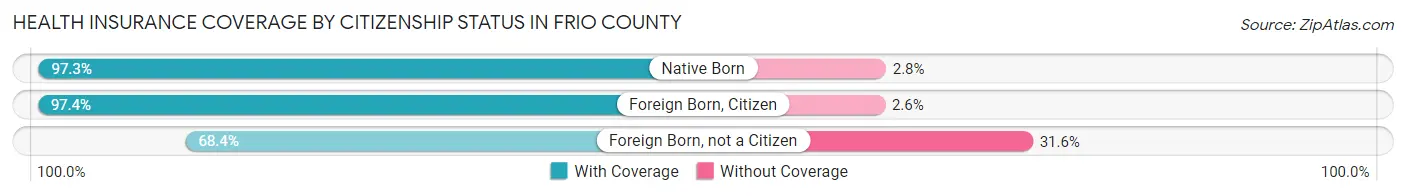
| Citizenship Status | With Coverage | Without Coverage |
| Native Born | 1,168 (97.3%) | 33 (2.8%) |
| Foreign Born, Citizen | 3,140 (97.4%) | 83 (2.6%) |
| Foreign Born, not a Citizen | 791 (68.4%) | 366 (31.6%) |
Health Insurance Coverage by Household Income in Frio County
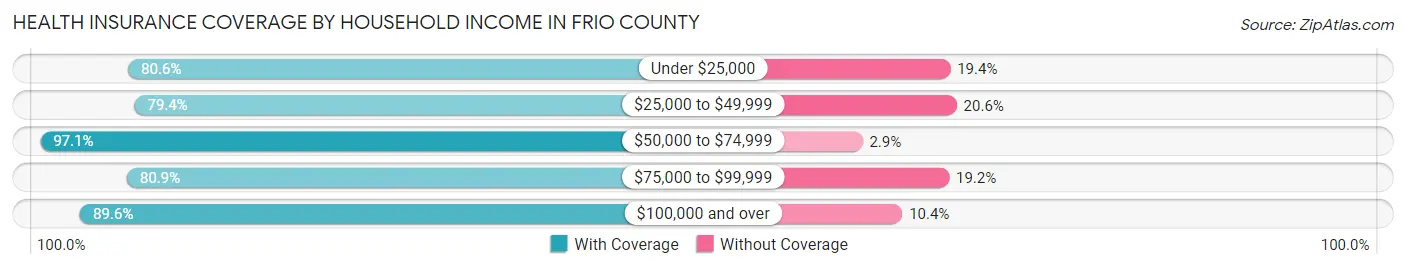
| Household Income | With Coverage | Without Coverage |
| Under $25,000 | 2,355 (80.6%) | 566 (19.4%) |
| $25,000 to $49,999 | 1,837 (79.4%) | 476 (20.6%) |
| $50,000 to $74,999 | 2,251 (97.1%) | 68 (2.9%) |
| $75,000 to $99,999 | 2,140 (80.8%) | 507 (19.2%) |
| $100,000 and over | 4,076 (89.6%) | 472 (10.4%) |
Public vs Private Health Insurance Coverage by Age in Frio County
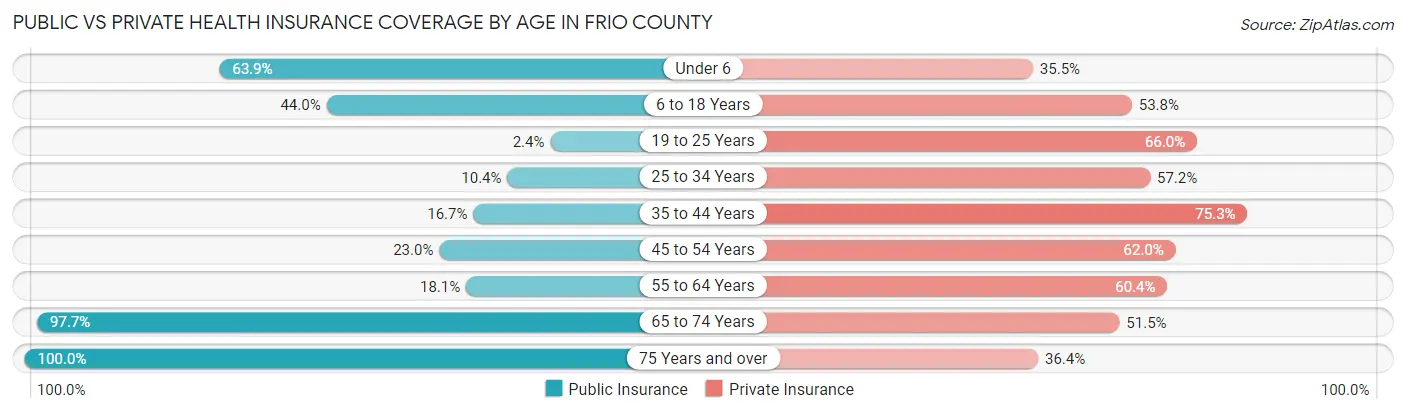
| Age Bracket | Public Insurance | Private Insurance |
| Under 6 | 767 (63.9%) | 426 (35.5%) |
| 6 to 18 Years | 1,417 (44.0%) | 1,735 (53.8%) |
| 19 to 25 Years | 28 (2.4%) | 763 (65.9%) |
| 25 to 34 Years | 219 (10.4%) | 1,206 (57.2%) |
| 35 to 44 Years | 345 (16.7%) | 1,553 (75.3%) |
| 45 to 54 Years | 338 (23.0%) | 909 (62.0%) |
| 55 to 64 Years | 266 (18.1%) | 890 (60.4%) |
| 65 to 74 Years | 1,024 (97.7%) | 540 (51.5%) |
| 75 Years and over | 1,054 (100.0%) | 384 (36.4%) |
| Total | 5,458 (36.9%) | 8,406 (56.8%) |
Disability Status by Sex by Age in Frio County
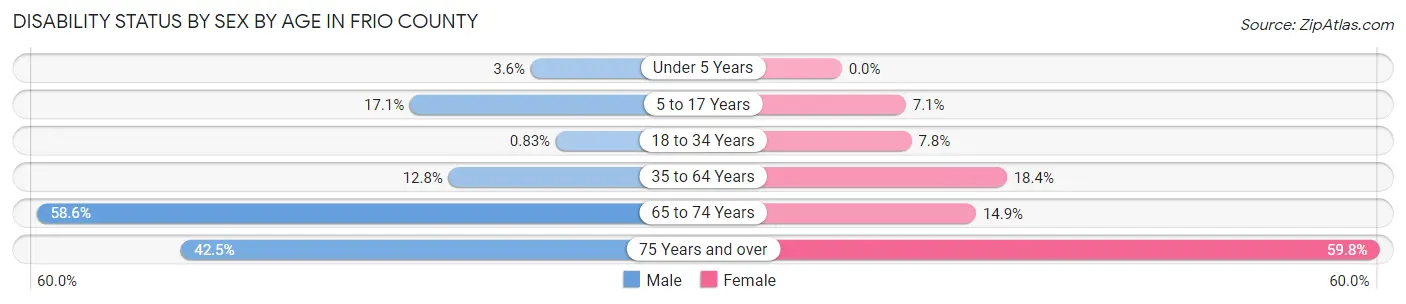
| Age Bracket | Male | Female |
| Under 5 Years | 20 (3.6%) | 0 (0.0%) |
| 5 to 17 Years | 300 (17.1%) | 69 (7.1%) |
| 18 to 34 Years | 20 (0.8%) | 112 (7.8%) |
| 35 to 64 Years | 338 (12.8%) | 433 (18.4%) |
| 65 to 74 Years | 308 (58.6%) | 78 (14.9%) |
| 75 Years and over | 174 (42.5%) | 386 (59.8%) |
Disability Class by Sex by Age in Frio County
Disability Class: Hearing Difficulty
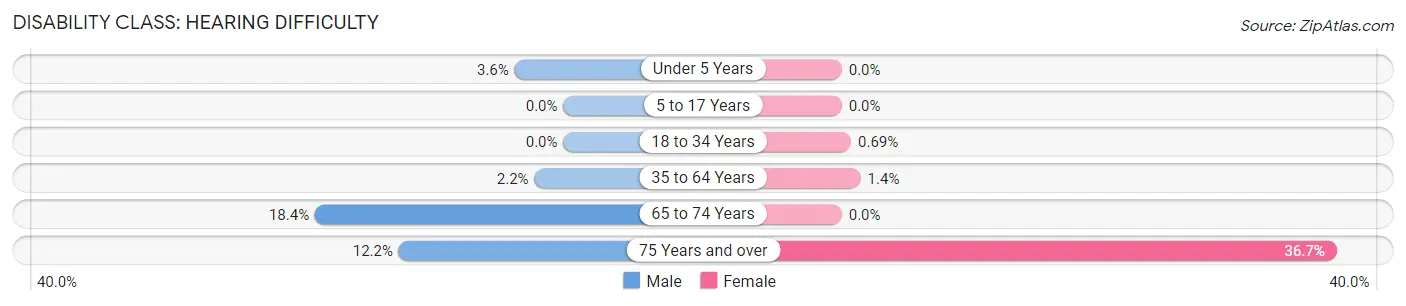
| Age Bracket | Male | Female |
| Under 5 Years | 20 (3.6%) | 0 (0.0%) |
| 5 to 17 Years | 0 (0.0%) | 0 (0.0%) |
| 18 to 34 Years | 0 (0.0%) | 10 (0.7%) |
| 35 to 64 Years | 57 (2.1%) | 33 (1.4%) |
| 65 to 74 Years | 97 (18.4%) | 0 (0.0%) |
| 75 Years and over | 50 (12.2%) | 237 (36.7%) |
Disability Class: Vision Difficulty
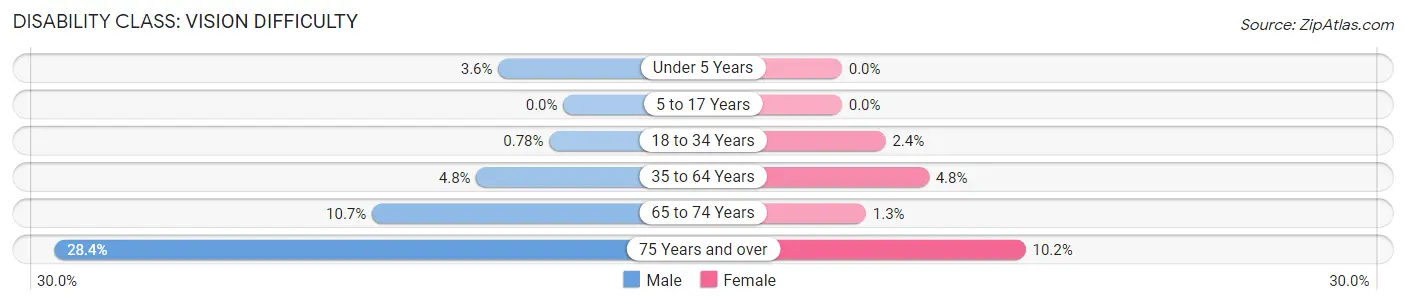
| Age Bracket | Male | Female |
| Under 5 Years | 20 (3.6%) | 0 (0.0%) |
| 5 to 17 Years | 0 (0.0%) | 0 (0.0%) |
| 18 to 34 Years | 19 (0.8%) | 35 (2.4%) |
| 35 to 64 Years | 128 (4.8%) | 114 (4.8%) |
| 65 to 74 Years | 56 (10.6%) | 7 (1.3%) |
| 75 Years and over | 116 (28.4%) | 66 (10.2%) |
Disability Class: Cognitive Difficulty
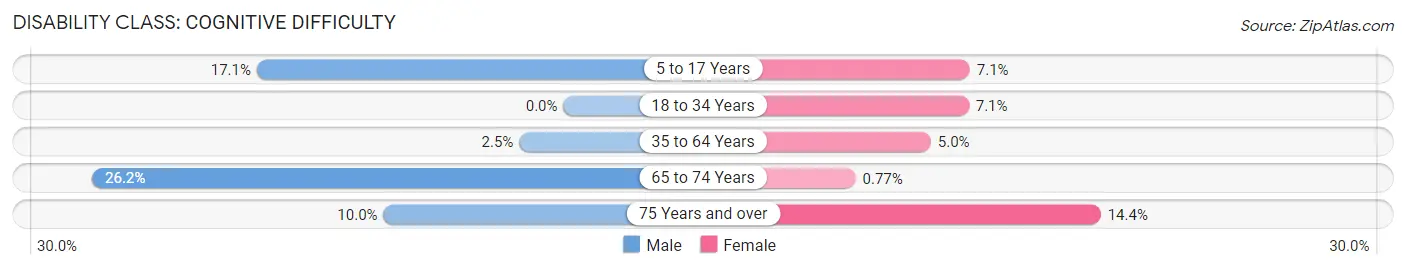
| Age Bracket | Male | Female |
| 5 to 17 Years | 300 (17.1%) | 69 (7.1%) |
| 18 to 34 Years | 0 (0.0%) | 102 (7.1%) |
| 35 to 64 Years | 65 (2.5%) | 117 (5.0%) |
| 65 to 74 Years | 138 (26.2%) | 4 (0.8%) |
| 75 Years and over | 41 (10.0%) | 93 (14.4%) |
Disability Class: Ambulatory Difficulty
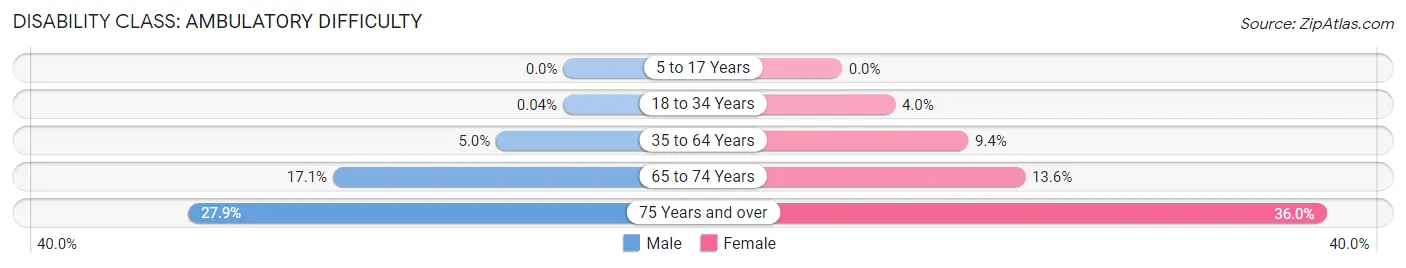
| Age Bracket | Male | Female |
| 5 to 17 Years | 0 (0.0%) | 0 (0.0%) |
| 18 to 34 Years | 1 (0.0%) | 57 (4.0%) |
| 35 to 64 Years | 132 (5.0%) | 221 (9.4%) |
| 65 to 74 Years | 90 (17.1%) | 71 (13.6%) |
| 75 Years and over | 114 (27.9%) | 232 (36.0%) |
Disability Class: Self-Care Difficulty
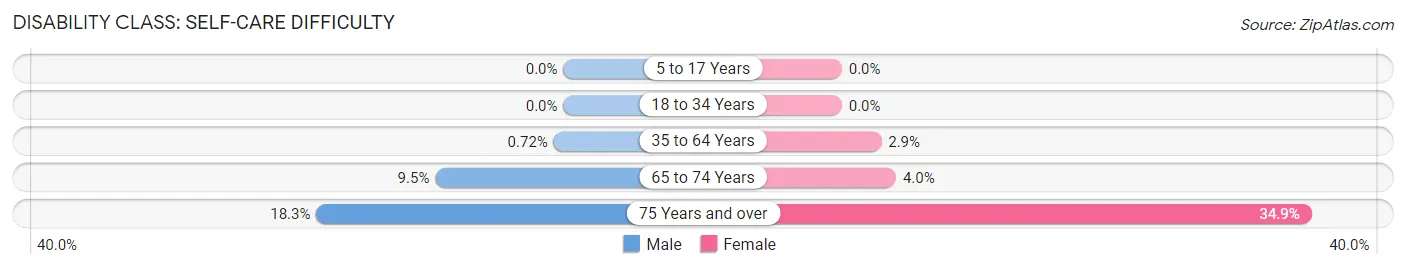
| Age Bracket | Male | Female |
| 5 to 17 Years | 0 (0.0%) | 0 (0.0%) |
| 18 to 34 Years | 0 (0.0%) | 0 (0.0%) |
| 35 to 64 Years | 19 (0.7%) | 69 (2.9%) |
| 65 to 74 Years | 50 (9.5%) | 21 (4.0%) |
| 75 Years and over | 75 (18.3%) | 225 (34.9%) |
Technology Access in Frio County
Computing Device Access in Frio County
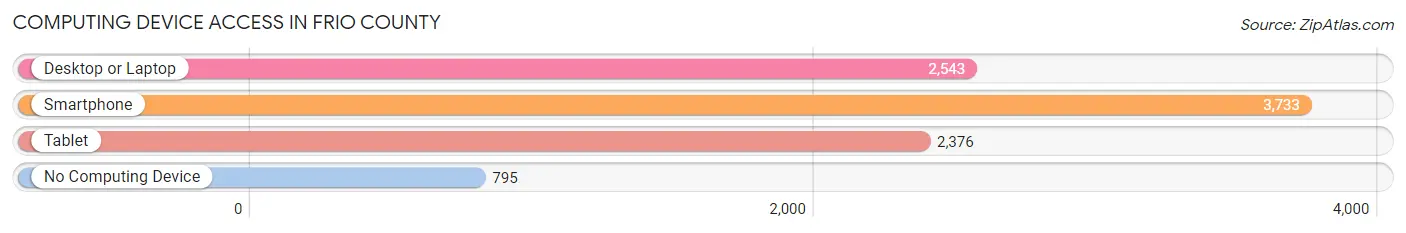
| Device Type | # Households | % Households |
| Desktop or Laptop | 2,543 | 54.0% |
| Smartphone | 3,733 | 79.3% |
| Tablet | 2,376 | 50.5% |
| No Computing Device | 795 | 16.9% |
| Total | 4,709 | 100.0% |
Internet Access in Frio County
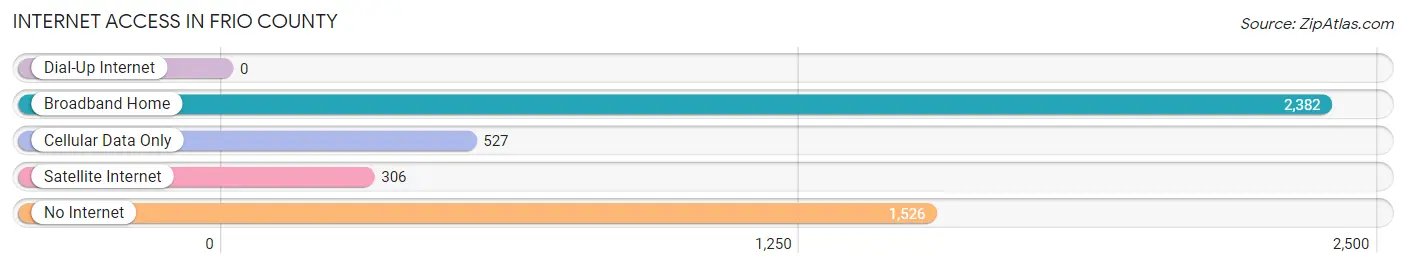
| Internet Type | # Households | % Households |
| Dial-Up Internet | 0 | 0.0% |
| Broadband Home | 2,382 | 50.6% |
| Cellular Data Only | 527 | 11.2% |
| Satellite Internet | 306 | 6.5% |
| No Internet | 1,526 | 32.4% |
| Total | 4,709 | 100.0% |
Frio County Summary
Frio County is located in the south-central region of Texas, and is part of the San Antonio-New Braunfels Metropolitan Statistical Area. The county is bordered by Atascosa County to the north, La Salle County to the east, McMullen County to the south, and Medina and Uvalde Counties to the west. The county seat is Pearsall, and the largest city is Dilley. As of the 2010 census, the population of Frio County was 17,217.
Geography
Frio County covers an area of 1,134 square miles, making it the second-largest county in Texas by area. The terrain is mostly flat, with some rolling hills in the western part of the county. The Frio River runs through the county, and is a major source of water for the area. The county is also home to several creeks, including the Nueces, Atascosa, and San Miguel.
The climate of Frio County is semi-arid, with hot summers and mild winters. The average annual temperature is 68°F, and the average annual precipitation is 22 inches.
History
Frio County was established in 1858, and was named after the Frio River. The county was originally part of Bexar County, but was later split off to form its own county. The county seat was originally located in Frio Town, but was moved to Pearsall in 1876.
The economy of Frio County was largely based on ranching and farming in the 19th century. The county was also home to several oil and gas fields, which provided jobs and revenue for the area.
Economy
The economy of Frio County is largely based on agriculture and oil and gas production. The county is home to several large ranches, and is a major producer of cotton, sorghum, and wheat. The county is also home to several oil and gas fields, which provide jobs and revenue for the area.
The county is home to several manufacturing companies, including a steel mill and a plastics plant. The county is also home to several retail stores, restaurants, and other businesses.
Demographics
As of the 2010 census, the population of Frio County was 17,217. The racial makeup of the county was 79.3% White, 0.7% African American, 0.5% Native American, 0.2% Asian, 0.1% Pacific Islander, 16.7% from other races, and 2.5% from two or more races. Hispanic or Latino of any race were 81.2% of the population.
The median household income in Frio County was $30,945, and the median family income was $35,945. The per capita income was $14,945. About 22.2% of the population was below the poverty line.
Common Questions
What is Per Capita Income in Frio County?
Per Capita income in Frio County is $22,779.
What is the Median Family Income in Frio County?
Median Family Income in Frio County is $65,499.
What is the Median Household income in Frio County?
Median Household Income in Frio County is $56,042.
What is Income or Wage Gap in Frio County?
Income or Wage Gap in Frio County is 42.8%.
Women in Frio County earn 57.2 cents for every dollar earned by a man.
What is Family Income Deficit in Frio County?
Family Income Deficit in Frio County is $10,370.
Families that are below poverty line in Frio County earn $10,370 less on average than the poverty threshold level.
What is Inequality or Gini Index in Frio County?
Inequality or Gini Index in Frio County is 0.47.
What is the Total Population of Frio County?
Total Population of Frio County is 18,151.
What is the Total Male Population of Frio County?
Total Male Population of Frio County is 11,026.
What is the Total Female Population of Frio County?
Total Female Population of Frio County is 7,125.
What is the Ratio of Males per 100 Females in Frio County?
There are 154.75 Males per 100 Females in Frio County.
What is the Ratio of Females per 100 Males in Frio County?
There are 64.62 Females per 100 Males in Frio County.
What is the Median Population Age in Frio County?
Median Population Age in Frio County is 33.1 Years.
What is the Average Family Size in Frio County
Average Family Size in Frio County is 3.8 People.
What is the Average Household Size in Frio County
Average Household Size in Frio County is 3.1 People.
How Large is the Labor Force in Frio County?
There are 7,109 People in the Labor Forcein in Frio County.
What is the Percentage of People in the Labor Force in Frio County?
48.9% of People are in the Labor Force in Frio County.
What is the Unemployment Rate in Frio County?
Unemployment Rate in Frio County is 2.6%.