Freestone County, TX Map & Demographics
Freestone County Map
Freestone County Overview
$28,201
PER CAPITA INCOME
$80,034
AVG FAMILY INCOME
$55,902
AVG HOUSEHOLD INCOME
32.9%
WAGE / INCOME GAP [ % ]
67.1¢/ $1
WAGE / INCOME GAP [ $ ]
$12,432
FAMILY INCOME DEFICIT
0.45
INEQUALITY / GINI INDEX
19,599
TOTAL POPULATION
10,221
MALE POPULATION
9,378
FEMALE POPULATION
108.99
MALES / 100 FEMALES
91.75
FEMALES / 100 MALES
41.8
MEDIAN AGE
3.5
AVG FAMILY SIZE
2.7
AVG HOUSEHOLD SIZE
7,391
LABOR FORCE [ PEOPLE ]
47.1%
PERCENT IN LABOR FORCE
3.5%
UNEMPLOYMENT RATE
Income in Freestone County
Income Overview in Freestone County
Per Capita Income in Freestone County is $28,201, while median incomes of families and households are $80,034 and $55,902 respectively.
| Characteristic | Number | Measure |
| Per Capita Income | 19,599 | $28,201 |
| Median Family Income | 4,330 | $80,034 |
| Mean Family Income | 4,330 | $93,182 |
| Median Household Income | 6,701 | $55,902 |
| Mean Household Income | 6,701 | $75,009 |
| Income Deficit | 4,330 | $12,432 |
| Wage / Income Gap (%) | 19,599 | 32.90% |
| Wage / Income Gap ($) | 19,599 | 67.10¢ per $1 |
| Gini / Inequality Index | 19,599 | 0.45 |
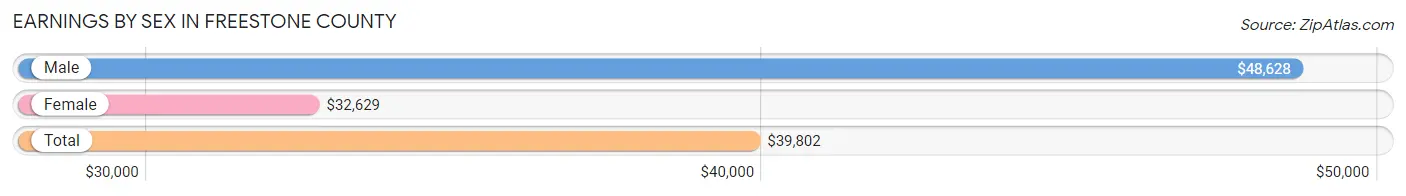
Earnings by Sex in Freestone County
Average Earnings in Freestone County are $39,802, $48,628 for men and $32,629 for women, a difference of 32.9%.
| Sex | Number | Average Earnings |
| Male | 4,171 (54.1%) | $48,628 |
| Female | 3,539 (45.9%) | $32,629 |
| Total | 7,710 (100.0%) | $39,802 |
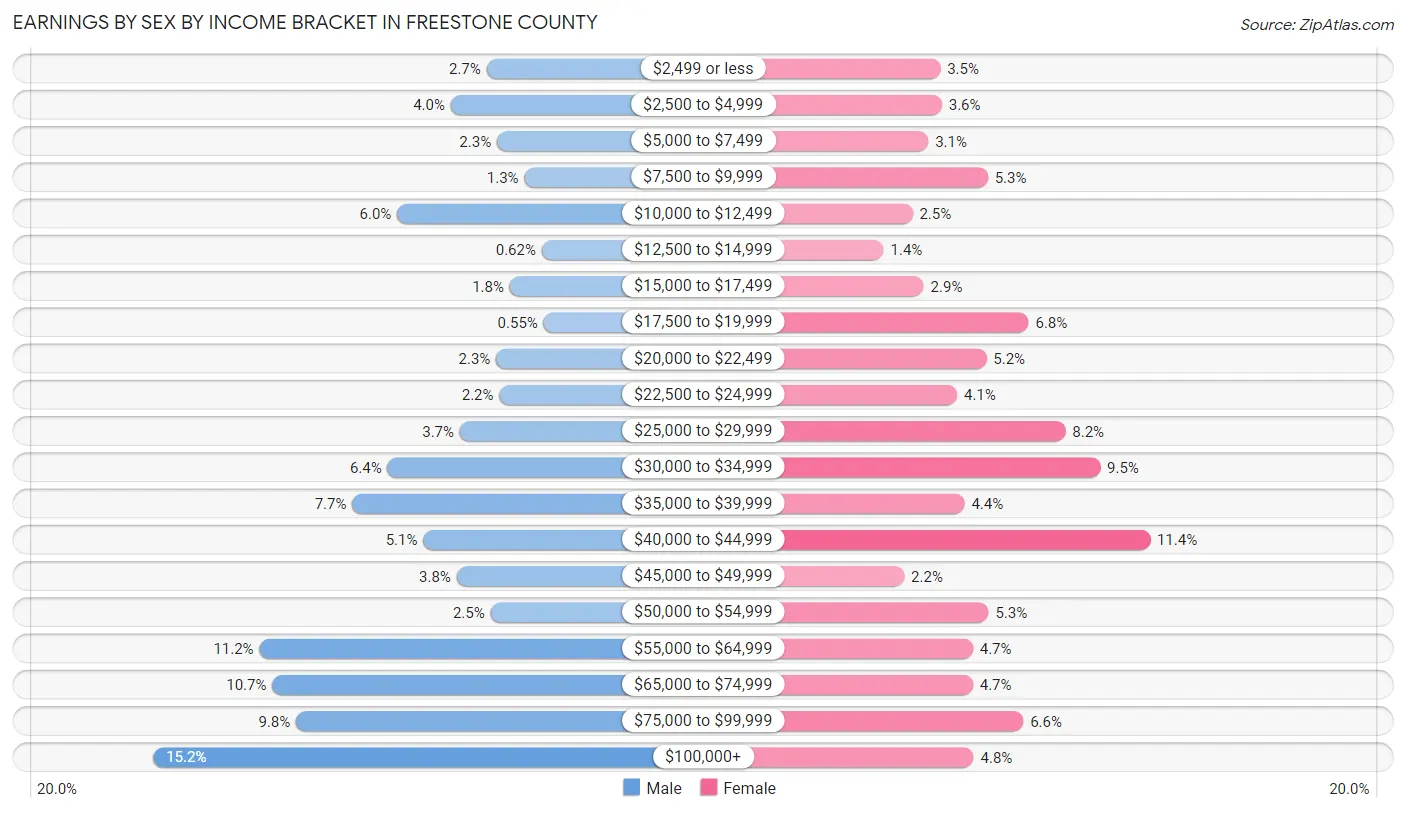
Earnings by Sex by Income Bracket in Freestone County
The most common earnings brackets in Freestone County are $100,000+ for men (633 | 15.2%) and $40,000 to $44,999 for women (402 | 11.4%).
| Income | Male | Female |
| $2,499 or less | 112 (2.7%) | 124 (3.5%) |
| $2,500 to $4,999 | 168 (4.0%) | 126 (3.6%) |
| $5,000 to $7,499 | 96 (2.3%) | 108 (3.0%) |
| $7,500 to $9,999 | 53 (1.3%) | 187 (5.3%) |
| $10,000 to $12,499 | 252 (6.0%) | 87 (2.5%) |
| $12,500 to $14,999 | 26 (0.6%) | 49 (1.4%) |
| $15,000 to $17,499 | 76 (1.8%) | 102 (2.9%) |
| $17,500 to $19,999 | 23 (0.5%) | 241 (6.8%) |
| $20,000 to $22,499 | 97 (2.3%) | 185 (5.2%) |
| $22,500 to $24,999 | 92 (2.2%) | 146 (4.1%) |
| $25,000 to $29,999 | 154 (3.7%) | 290 (8.2%) |
| $30,000 to $34,999 | 267 (6.4%) | 336 (9.5%) |
| $35,000 to $39,999 | 322 (7.7%) | 156 (4.4%) |
| $40,000 to $44,999 | 211 (5.1%) | 402 (11.4%) |
| $45,000 to $49,999 | 159 (3.8%) | 76 (2.1%) |
| $50,000 to $54,999 | 106 (2.5%) | 188 (5.3%) |
| $55,000 to $64,999 | 467 (11.2%) | 167 (4.7%) |
| $65,000 to $74,999 | 447 (10.7%) | 167 (4.7%) |
| $75,000 to $99,999 | 410 (9.8%) | 234 (6.6%) |
| $100,000+ | 633 (15.2%) | 168 (4.8%) |
| Total | 4,171 (100.0%) | 3,539 (100.0%) |
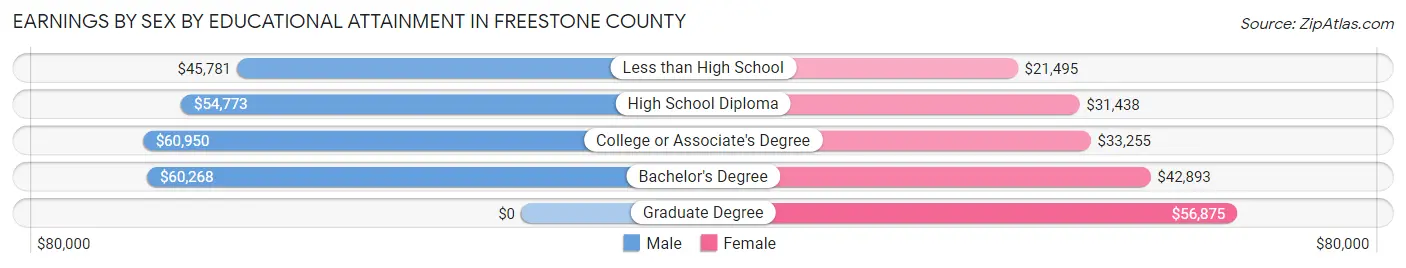
Earnings by Sex by Educational Attainment in Freestone County
Average earnings in Freestone County are $56,250 for men and $34,305 for women, a difference of 39.0%. Men with an educational attainment of college or associate's degree enjoy the highest average annual earnings of $60,950, while those with less than high school education earn the least with $45,781. Women with an educational attainment of graduate degree earn the most with the average annual earnings of $56,875, while those with less than high school education have the smallest earnings of $21,495.
| Educational Attainment | Male Income | Female Income |
| Less than High School | $45,781 | $21,495 |
| High School Diploma | $54,773 | $31,438 |
| College or Associate's Degree | $60,950 | $33,255 |
| Bachelor's Degree | $60,268 | $42,893 |
| Graduate Degree | - | - |
| Total | $56,250 | $34,305 |
Family Income in Freestone County
Family Income Brackets in Freestone County
According to the Freestone County family income data, there are 888 families falling into the $100,000 to $149,999 income range, which is the most common income bracket and makes up 20.5% of all families. Conversely, the $10,000 to $14,999 income bracket is the least frequent group with only 104 families (2.4%) belonging to this category.
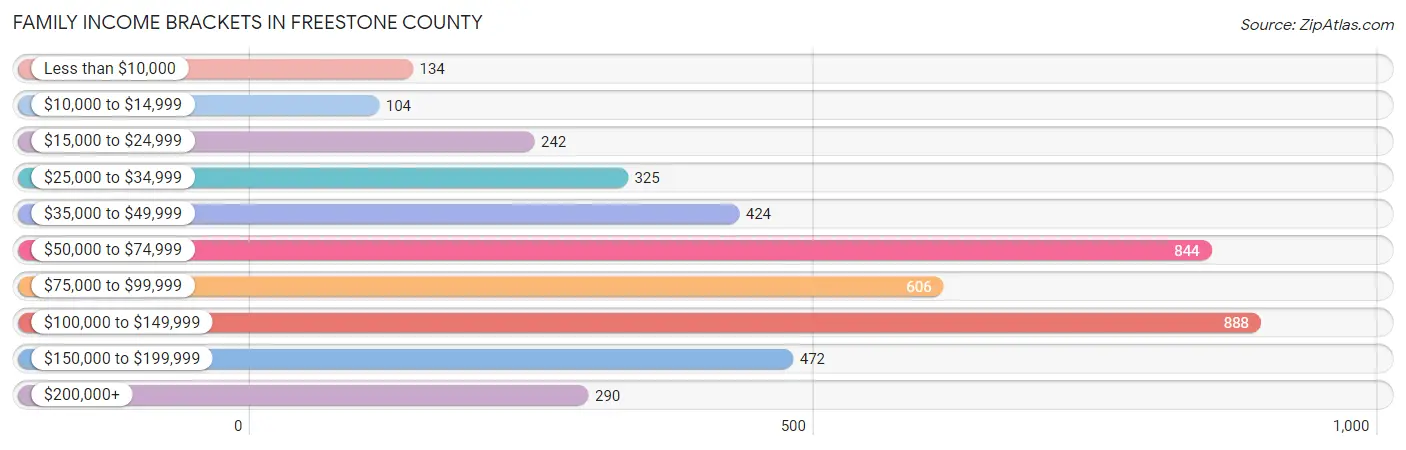
| Income Bracket | # Families | % Families |
| Less than $10,000 | 134 | 3.1% |
| $10,000 to $14,999 | 104 | 2.4% |
| $15,000 to $24,999 | 242 | 5.6% |
| $25,000 to $34,999 | 325 | 7.5% |
| $35,000 to $49,999 | 424 | 9.8% |
| $50,000 to $74,999 | 844 | 19.5% |
| $75,000 to $99,999 | 606 | 14.0% |
| $100,000 to $149,999 | 888 | 20.5% |
| $150,000 to $199,999 | 472 | 10.9% |
| $200,000+ | 290 | 6.7% |
Family Income by Famaliy Size in Freestone County
4-person families (573 | 13.2%) account for the highest median family income in Freestone County with $128,259 per family, while 2-person families (2,235 | 51.6%) have the highest median income of $38,646 per family member.
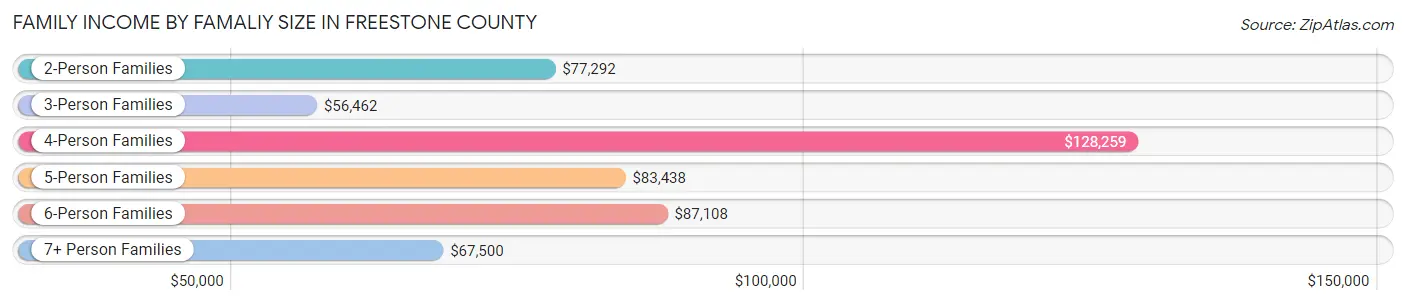
| Income Bracket | # Families | Median Income |
| 2-Person Families | 2,235 (51.6%) | $77,292 |
| 3-Person Families | 699 (16.1%) | $56,462 |
| 4-Person Families | 573 (13.2%) | $128,259 |
| 5-Person Families | 450 (10.4%) | $83,438 |
| 6-Person Families | 243 (5.6%) | $87,108 |
| 7+ Person Families | 130 (3.0%) | $67,500 |
| Total | 4,330 (100.0%) | $80,034 |
Family Income by Number of Earners in Freestone County
The median family income in Freestone County is $80,034, with families comprising 3+ earners (243) having the highest median family income of $139,886, while families with no earners (971) have the lowest median family income of $41,750, accounting for 5.6% and 22.4% of families, respectively.
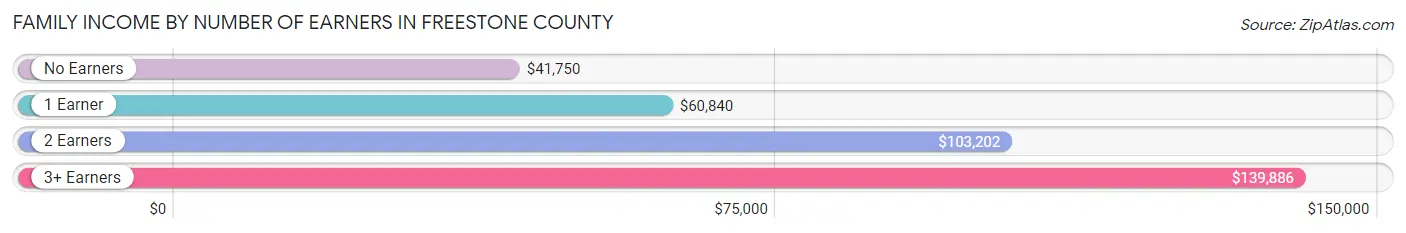
| Number of Earners | # Families | Median Income |
| No Earners | 971 (22.4%) | $41,750 |
| 1 Earner | 1,395 (32.2%) | $60,840 |
| 2 Earners | 1,721 (39.8%) | $103,202 |
| 3+ Earners | 243 (5.6%) | $139,886 |
| Total | 4,330 (100.0%) | $80,034 |
Household Income in Freestone County
Household Income Brackets in Freestone County
With 1,132 households falling in the category, the $50,000 to $74,999 income range is the most frequent in Freestone County, accounting for 16.9% of all households. In contrast, only 315 households (4.7%) fall into the $200,000+ income bracket, making it the least populous group.
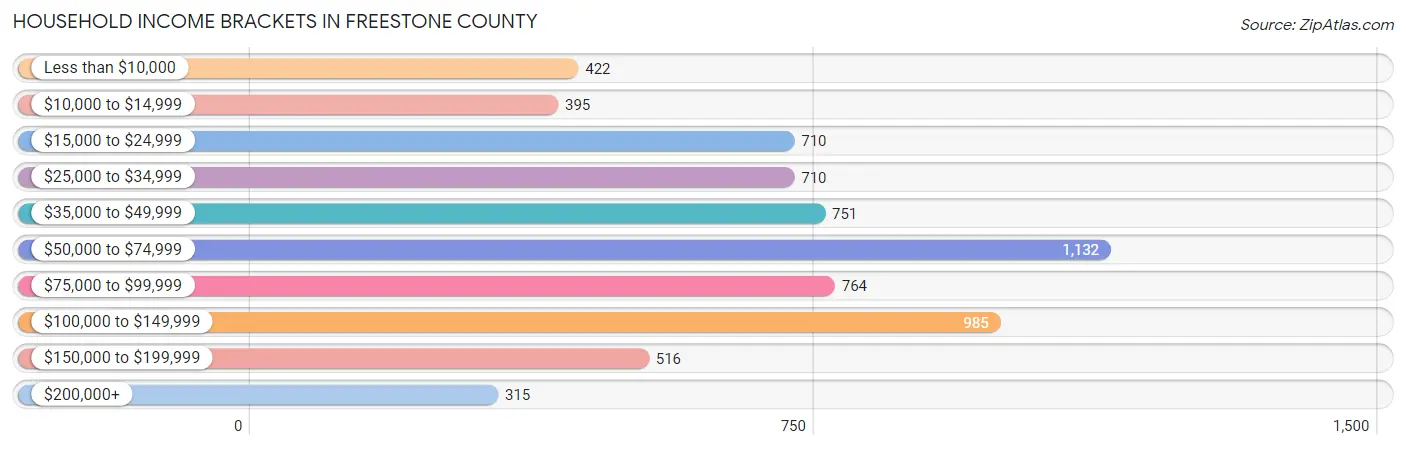
| Income Bracket | # Households | % Households |
| Less than $10,000 | 422 | 6.3% |
| $10,000 to $14,999 | 395 | 5.9% |
| $15,000 to $24,999 | 710 | 10.6% |
| $25,000 to $34,999 | 710 | 10.6% |
| $35,000 to $49,999 | 751 | 11.2% |
| $50,000 to $74,999 | 1,132 | 16.9% |
| $75,000 to $99,999 | 764 | 11.4% |
| $100,000 to $149,999 | 985 | 14.7% |
| $150,000 to $199,999 | 516 | 7.7% |
| $200,000+ | 315 | 4.7% |
Household Income by Householder Age in Freestone County
The median household income in Freestone County is $55,902, with the highest median household income of $69,310 found in the 25 to 44 years age bracket for the primary householder. A total of 2,042 households (30.5%) fall into this category. Meanwhile, the 15 to 24 years age bracket for the primary householder has the lowest median household income of $0, with 107 households (1.6%) in this group.
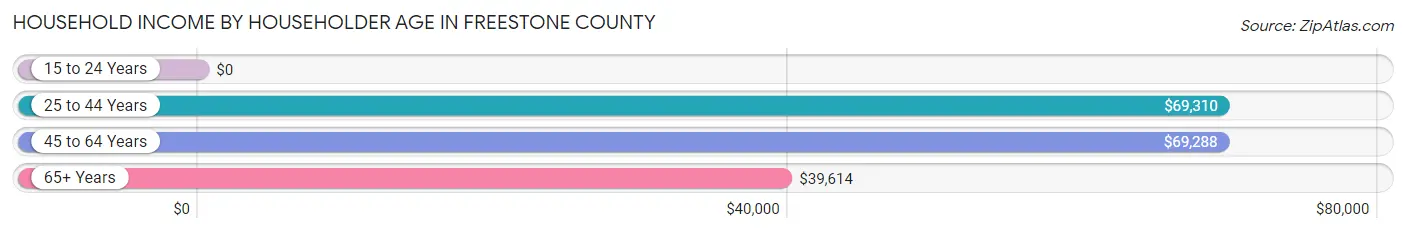
| Income Bracket | # Households | Median Income |
| 15 to 24 Years | 107 (1.6%) | $0 |
| 25 to 44 Years | 2,042 (30.5%) | $69,310 |
| 45 to 64 Years | 2,161 (32.3%) | $69,288 |
| 65+ Years | 2,391 (35.7%) | $39,614 |
| Total | 6,701 (100.0%) | $55,902 |
Poverty in Freestone County
Income Below Poverty by Sex and Age in Freestone County
With 11.9% poverty level for males and 13.4% for females among the residents of Freestone County, 5 year old males and 5 year old females are the most vulnerable to poverty, with 61 males (56.0%) and 25 females (25.3%) in their respective age groups living below the poverty level.
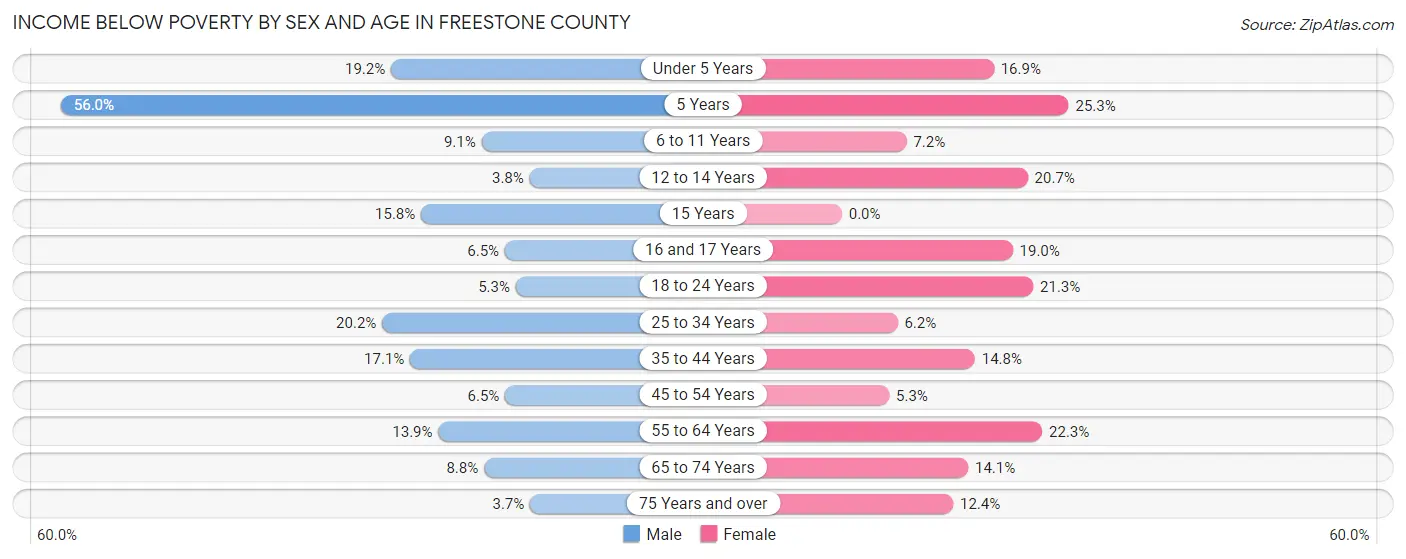
| Age Bracket | Male | Female |
| Under 5 Years | 95 (19.2%) | 90 (16.9%) |
| 5 Years | 61 (56.0%) | 25 (25.3%) |
| 6 to 11 Years | 76 (9.1%) | 54 (7.2%) |
| 12 to 14 Years | 14 (3.8%) | 83 (20.7%) |
| 15 Years | 16 (15.8%) | 0 (0.0%) |
| 16 and 17 Years | 22 (6.5%) | 31 (19.0%) |
| 18 to 24 Years | 37 (5.3%) | 124 (21.3%) |
| 25 to 34 Years | 207 (20.2%) | 71 (6.2%) |
| 35 to 44 Years | 208 (17.1%) | 154 (14.8%) |
| 45 to 54 Years | 65 (6.5%) | 54 (5.3%) |
| 55 to 64 Years | 153 (13.9%) | 280 (22.3%) |
| 65 to 74 Years | 91 (8.8%) | 148 (14.1%) |
| 75 Years and over | 25 (3.7%) | 116 (12.4%) |
| Total | 1,070 (11.9%) | 1,230 (13.4%) |
Income Above Poverty by Sex and Age in Freestone County
According to the poverty statistics in Freestone County, males aged 75 years and over and females aged 15 years are the age groups that are most secure financially, with 96.3% of males and 100.0% of females in these age groups living above the poverty line.
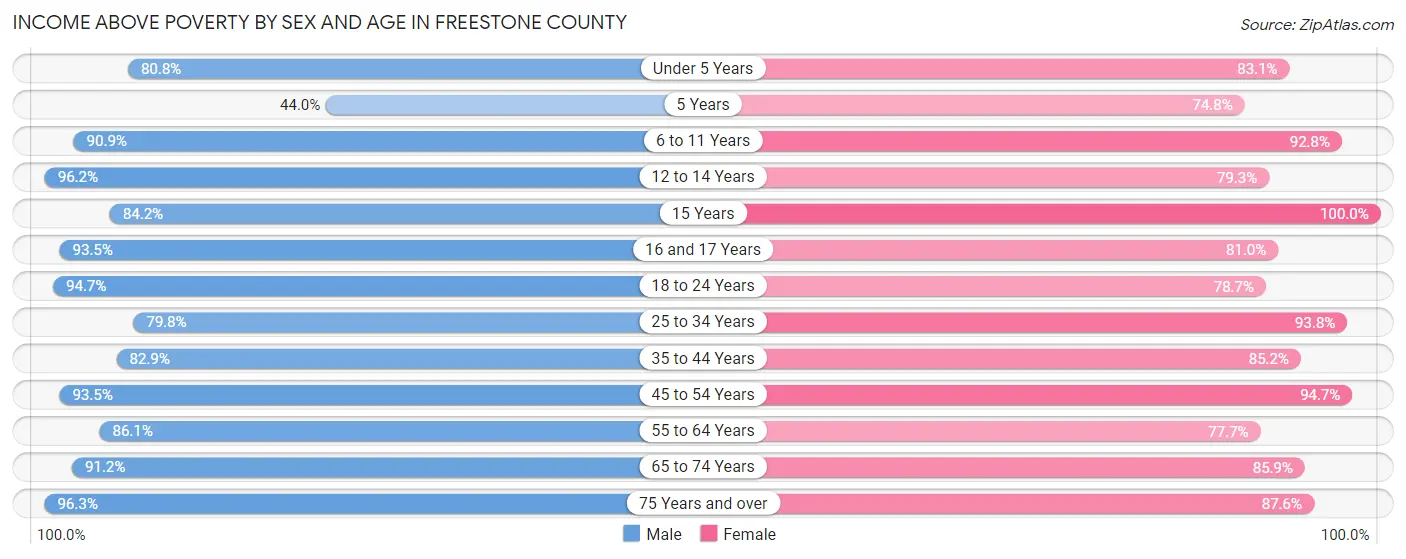
| Age Bracket | Male | Female |
| Under 5 Years | 400 (80.8%) | 442 (83.1%) |
| 5 Years | 48 (44.0%) | 74 (74.8%) |
| 6 to 11 Years | 758 (90.9%) | 696 (92.8%) |
| 12 to 14 Years | 358 (96.2%) | 318 (79.3%) |
| 15 Years | 85 (84.2%) | 188 (100.0%) |
| 16 and 17 Years | 316 (93.5%) | 132 (81.0%) |
| 18 to 24 Years | 661 (94.7%) | 458 (78.7%) |
| 25 to 34 Years | 819 (79.8%) | 1,074 (93.8%) |
| 35 to 44 Years | 1,011 (82.9%) | 886 (85.2%) |
| 45 to 54 Years | 938 (93.5%) | 971 (94.7%) |
| 55 to 64 Years | 946 (86.1%) | 975 (77.7%) |
| 65 to 74 Years | 940 (91.2%) | 905 (85.9%) |
| 75 Years and over | 651 (96.3%) | 820 (87.6%) |
| Total | 7,931 (88.1%) | 7,939 (86.6%) |
Income Below Poverty Among Married-Couple Families in Freestone County
The poverty statistics for married-couple families in Freestone County show that 3.4% or 113 of the total 3,317 families live below the poverty line. Families with 5 or more children have the highest poverty rate of 17.1%, comprising of 7 families. On the other hand, families with 1 or 2 children have the lowest poverty rate of 1.4%, which includes 13 families.
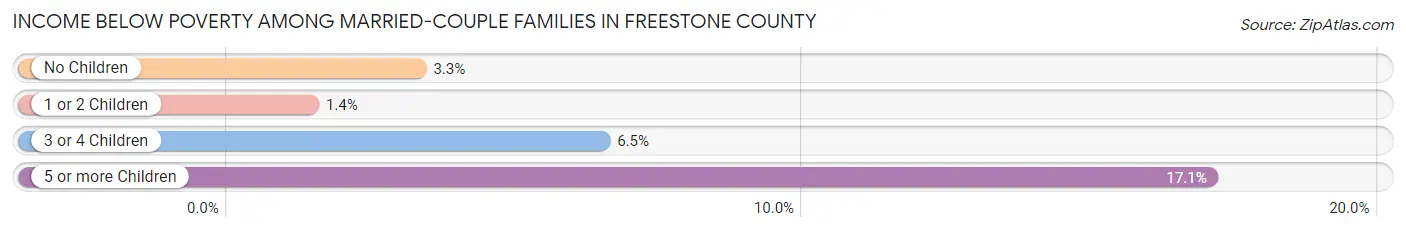
| Children | Above Poverty | Below Poverty |
| No Children | 1,801 (96.7%) | 61 (3.3%) |
| 1 or 2 Children | 907 (98.6%) | 13 (1.4%) |
| 3 or 4 Children | 462 (93.5%) | 32 (6.5%) |
| 5 or more Children | 34 (82.9%) | 7 (17.1%) |
| Total | 3,204 (96.6%) | 113 (3.4%) |
Income Below Poverty Among Single-Parent Households in Freestone County
According to the poverty data in Freestone County, 20.4% or 57 single-father households and 27.7% or 203 single-mother households are living below the poverty line. Among single-father households, those with 1 or 2 children have the highest poverty rate, with 57 households (54.3%) experiencing poverty. Likewise, among single-mother households, those with 3 or 4 children have the highest poverty rate, with 53 households (54.6%) falling below the poverty line.
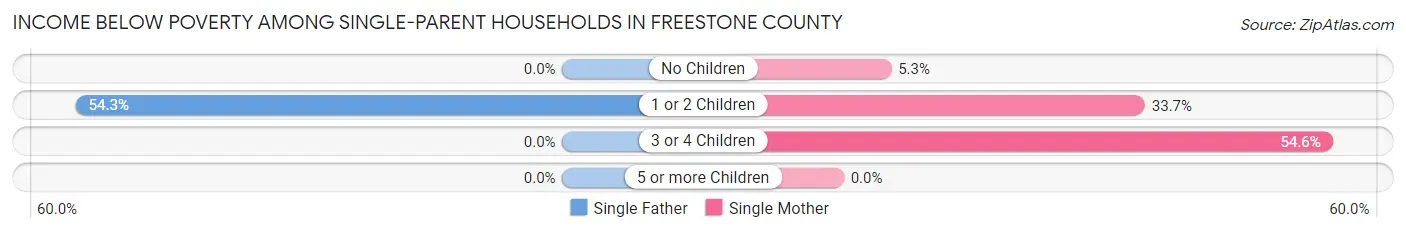
| Children | Single Father | Single Mother |
| No Children | 0 (0.0%) | 12 (5.3%) |
| 1 or 2 Children | 57 (54.3%) | 138 (33.7%) |
| 3 or 4 Children | 0 (0.0%) | 53 (54.6%) |
| 5 or more Children | 0 (0.0%) | 0 (0.0%) |
| Total | 57 (20.4%) | 203 (27.7%) |
Income Below Poverty Among Married-Couple vs Single-Parent Households in Freestone County
The poverty data for Freestone County shows that 113 of the married-couple family households (3.4%) and 260 of the single-parent households (25.7%) are living below the poverty level. Within the married-couple family households, those with 5 or more children have the highest poverty rate, with 7 households (17.1%) falling below the poverty line. Among the single-parent households, those with 3 or 4 children have the highest poverty rate, with 53 household (52.5%) living below poverty.
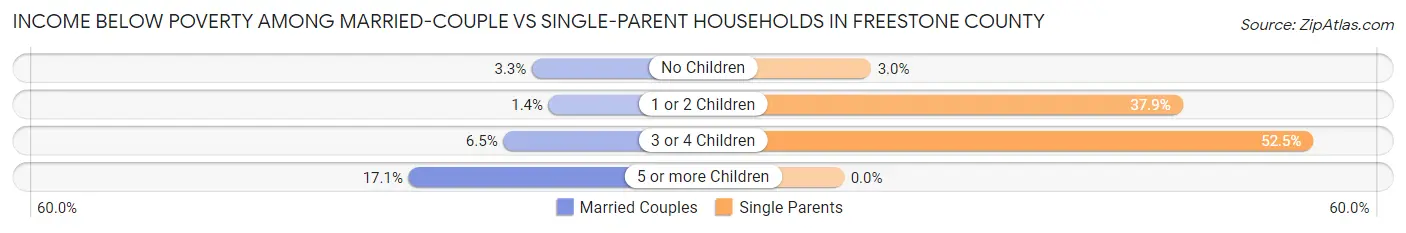
| Children | Married-Couple Families | Single-Parent Households |
| No Children | 61 (3.3%) | 12 (3.0%) |
| 1 or 2 Children | 13 (1.4%) | 195 (37.9%) |
| 3 or 4 Children | 32 (6.5%) | 53 (52.5%) |
| 5 or more Children | 7 (17.1%) | 0 (0.0%) |
| Total | 113 (3.4%) | 260 (25.7%) |
Race in Freestone County
The most populous races in Freestone County are White / Caucasian (13,839 | 70.6%), Hispanic or Latino (3,297 | 16.8%), and Black / African American (2,935 | 15.0%).
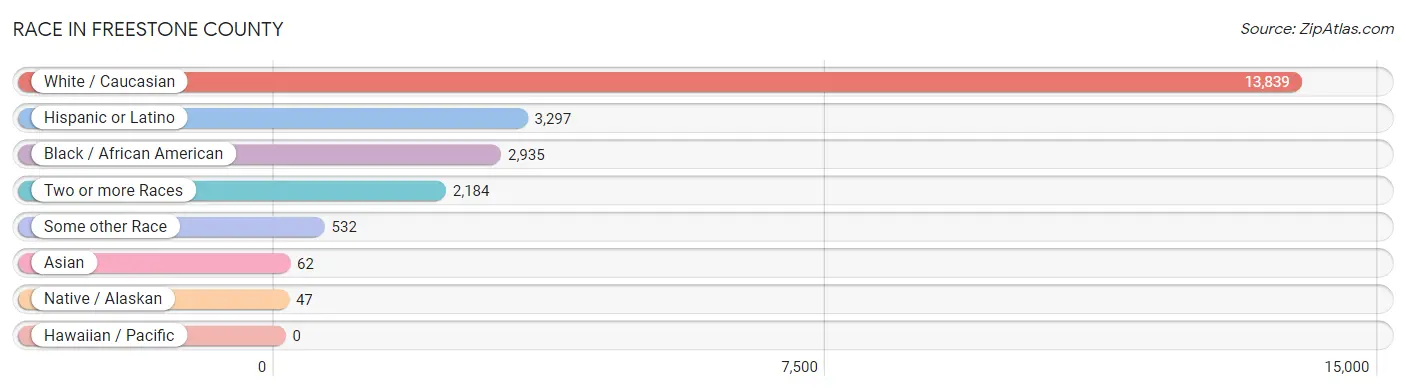
| Race | # Population | % Population |
| Asian | 62 | 0.3% |
| Black / African American | 2,935 | 15.0% |
| Hawaiian / Pacific | 0 | 0.0% |
| Hispanic or Latino | 3,297 | 16.8% |
| Native / Alaskan | 47 | 0.2% |
| White / Caucasian | 13,839 | 70.6% |
| Two or more Races | 2,184 | 11.1% |
| Some other Race | 532 | 2.7% |
| Total | 19,599 | 100.0% |
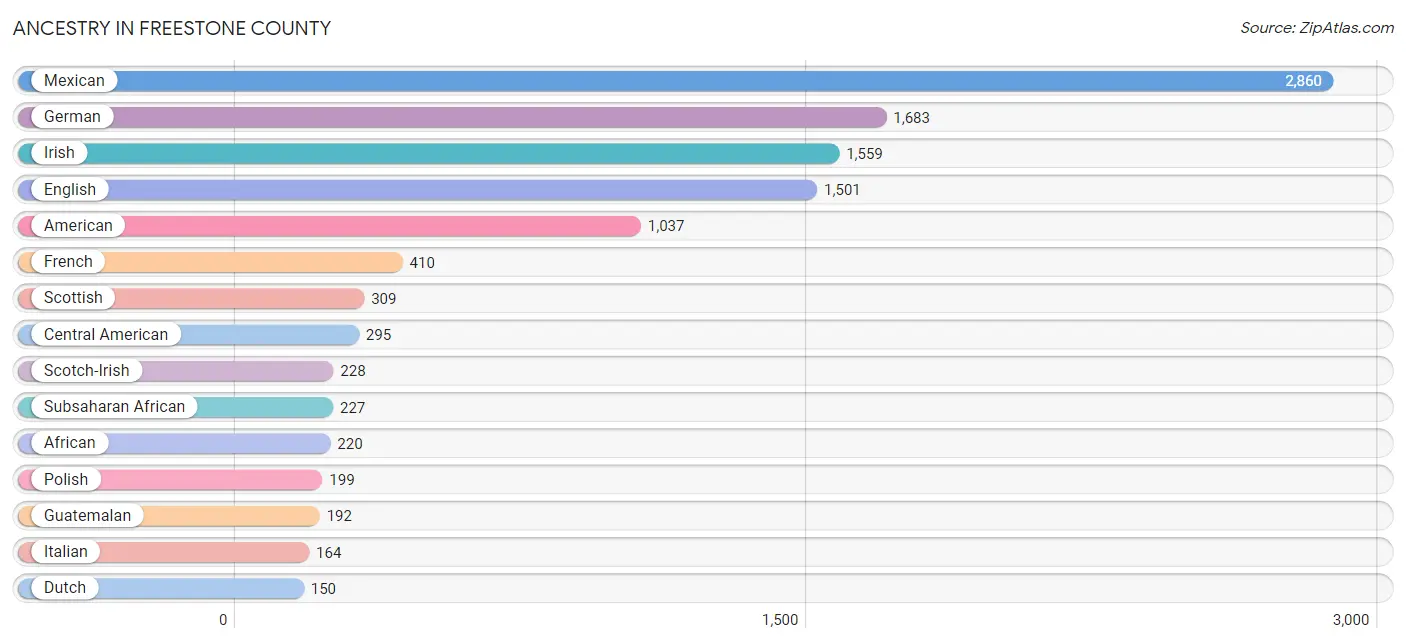
Ancestry in Freestone County
The most populous ancestries reported in Freestone County are Mexican (2,860 | 14.6%), German (1,683 | 8.6%), Irish (1,559 | 8.0%), English (1,501 | 7.7%), and American (1,037 | 5.3%), together accounting for 44.1% of all Freestone County residents.
| Ancestry | # Population | % Population |
| African | 220 | 1.1% |
| American | 1,037 | 5.3% |
| Arab | 7 | 0.0% |
| Austrian | 14 | 0.1% |
| Bahamian | 27 | 0.1% |
| Basque | 3 | 0.0% |
| Brazilian | 6 | 0.0% |
| British | 125 | 0.6% |
| Burmese | 12 | 0.1% |
| Cajun | 25 | 0.1% |
| Canadian | 19 | 0.1% |
| Central American | 295 | 1.5% |
| Cherokee | 31 | 0.2% |
| Choctaw | 16 | 0.1% |
| Croatian | 2 | 0.0% |
| Cuban | 25 | 0.1% |
| Czech | 55 | 0.3% |
| Czechoslovakian | 25 | 0.1% |
| Dutch | 150 | 0.8% |
| Dutch West Indian | 4 | 0.0% |
| Ecuadorian | 6 | 0.0% |
| English | 1,501 | 7.7% |
| European | 74 | 0.4% |
| French | 410 | 2.1% |
| French American Indian | 25 | 0.1% |
| French Canadian | 60 | 0.3% |
| German | 1,683 | 8.6% |
| Guatemalan | 192 | 1.0% |
| Honduran | 96 | 0.5% |
| Irish | 1,559 | 8.0% |
| Italian | 164 | 0.8% |
| Jamaican | 29 | 0.2% |
| Kenyan | 6 | 0.0% |
| Korean | 39 | 0.2% |
| Mexican | 2,860 | 14.6% |
| Native Hawaiian | 28 | 0.1% |
| New Zealander | 7 | 0.0% |
| Norwegian | 80 | 0.4% |
| Pakistani | 11 | 0.1% |
| Pennsylvania German | 3 | 0.0% |
| Polish | 199 | 1.0% |
| Portuguese | 31 | 0.2% |
| Puerto Rican | 34 | 0.2% |
| Romanian | 28 | 0.1% |
| Russian | 23 | 0.1% |
| Salvadoran | 7 | 0.0% |
| Scotch-Irish | 228 | 1.2% |
| Scottish | 309 | 1.6% |
| Slovak | 2 | 0.0% |
| South American | 6 | 0.0% |
| Spaniard | 36 | 0.2% |
| Spanish | 32 | 0.2% |
| Sri Lankan | 29 | 0.2% |
| Subsaharan African | 227 | 1.2% |
| Swedish | 69 | 0.4% |
| Swiss | 2 | 0.0% |
| Ukrainian | 21 | 0.1% |
| Welsh | 87 | 0.4% |
| West Indian | 23 | 0.1% | View All 59 Rows |
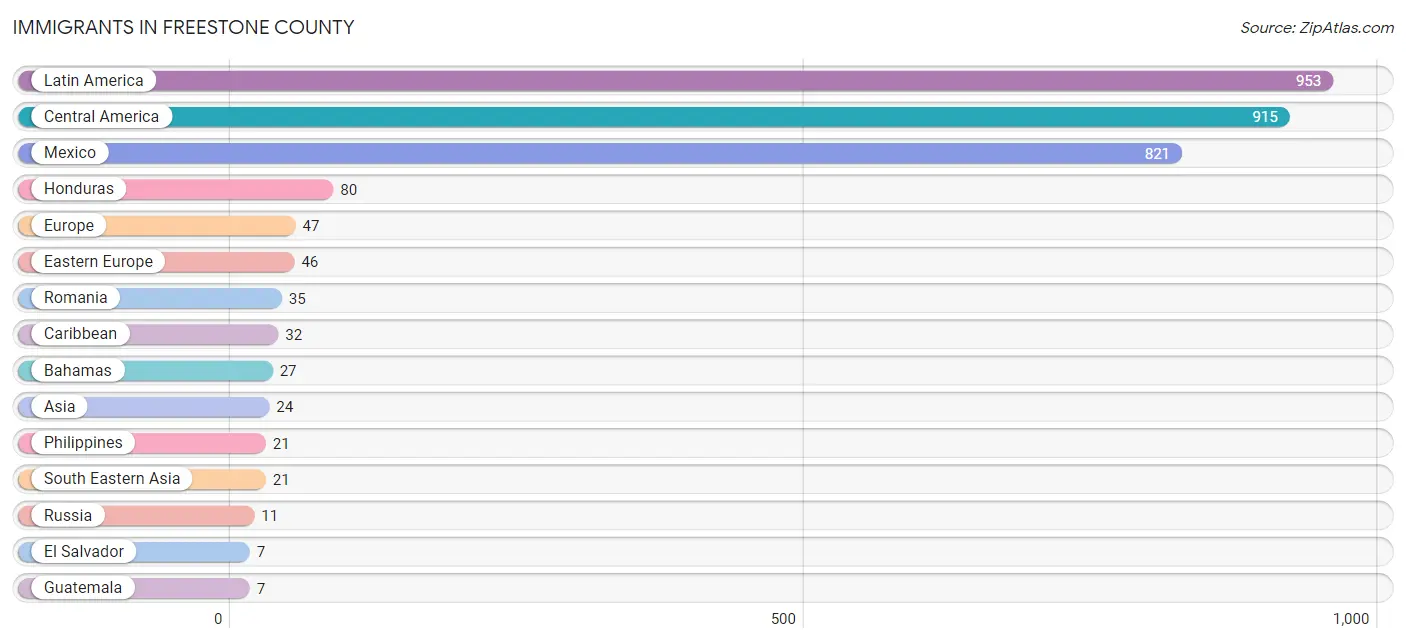
Immigrants in Freestone County
The most numerous immigrant groups reported in Freestone County came from Latin America (953 | 4.9%), Central America (915 | 4.7%), Mexico (821 | 4.2%), Honduras (80 | 0.4%), and Europe (47 | 0.2%), together accounting for 14.4% of all Freestone County residents.
| Immigration Origin | # Population | % Population |
| Africa | 6 | 0.0% |
| Asia | 24 | 0.1% |
| Bahamas | 27 | 0.1% |
| Caribbean | 32 | 0.2% |
| Central America | 915 | 4.7% |
| China | 3 | 0.0% |
| Cuba | 5 | 0.0% |
| Eastern Africa | 6 | 0.0% |
| Eastern Asia | 3 | 0.0% |
| Eastern Europe | 46 | 0.2% |
| Ecuador | 6 | 0.0% |
| El Salvador | 7 | 0.0% |
| England | 1 | 0.0% |
| Europe | 47 | 0.2% |
| Guatemala | 7 | 0.0% |
| Honduras | 80 | 0.4% |
| Kenya | 6 | 0.0% |
| Latin America | 953 | 4.9% |
| Mexico | 821 | 4.2% |
| Northern Europe | 1 | 0.0% |
| Philippines | 21 | 0.1% |
| Romania | 35 | 0.2% |
| Russia | 11 | 0.1% |
| South America | 6 | 0.0% |
| South Eastern Asia | 21 | 0.1% |
| Taiwan | 3 | 0.0% | View All 26 Rows |
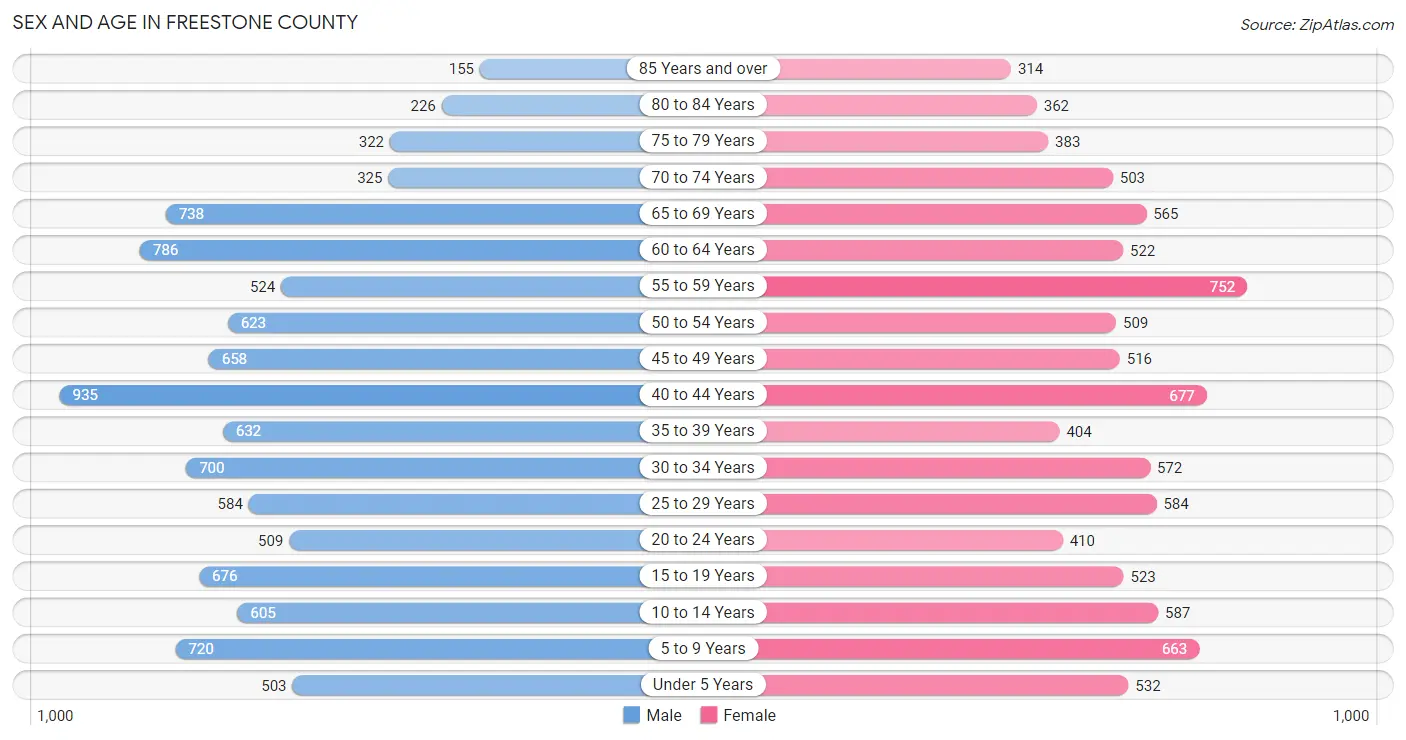
Sex and Age in Freestone County
Sex and Age in Freestone County
The most populous age groups in Freestone County are 40 to 44 Years (935 | 9.1%) for men and 55 to 59 Years (752 | 8.0%) for women.
| Age Bracket | Male | Female |
| Under 5 Years | 503 (4.9%) | 532 (5.7%) |
| 5 to 9 Years | 720 (7.0%) | 663 (7.1%) |
| 10 to 14 Years | 605 (5.9%) | 587 (6.3%) |
| 15 to 19 Years | 676 (6.6%) | 523 (5.6%) |
| 20 to 24 Years | 509 (5.0%) | 410 (4.4%) |
| 25 to 29 Years | 584 (5.7%) | 584 (6.2%) |
| 30 to 34 Years | 700 (6.9%) | 572 (6.1%) |
| 35 to 39 Years | 632 (6.2%) | 404 (4.3%) |
| 40 to 44 Years | 935 (9.1%) | 677 (7.2%) |
| 45 to 49 Years | 658 (6.4%) | 516 (5.5%) |
| 50 to 54 Years | 623 (6.1%) | 509 (5.4%) |
| 55 to 59 Years | 524 (5.1%) | 752 (8.0%) |
| 60 to 64 Years | 786 (7.7%) | 522 (5.6%) |
| 65 to 69 Years | 738 (7.2%) | 565 (6.0%) |
| 70 to 74 Years | 325 (3.2%) | 503 (5.4%) |
| 75 to 79 Years | 322 (3.2%) | 383 (4.1%) |
| 80 to 84 Years | 226 (2.2%) | 362 (3.9%) |
| 85 Years and over | 155 (1.5%) | 314 (3.4%) |
| Total | 10,221 (100.0%) | 9,378 (100.0%) |
Families and Households in Freestone County
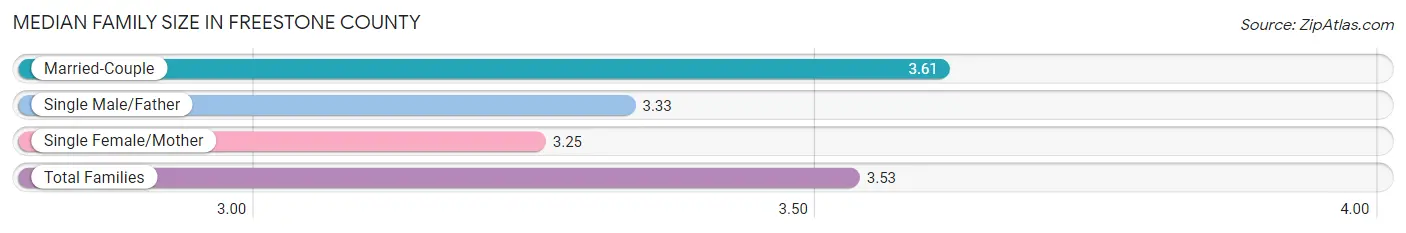
Median Family Size in Freestone County
The median family size in Freestone County is 3.53 persons per family, with married-couple families (3,317 | 76.6%) accounting for the largest median family size of 3.61 persons per family. On the other hand, single female/mother families (733 | 16.9%) represent the smallest median family size with 3.25 persons per family.
| Family Type | # Families | Family Size |
| Married-Couple | 3,317 (76.6%) | 3.61 |
| Single Male/Father | 280 (6.5%) | 3.33 |
| Single Female/Mother | 733 (16.9%) | 3.25 |
| Total Families | 4,330 (100.0%) | 3.53 |
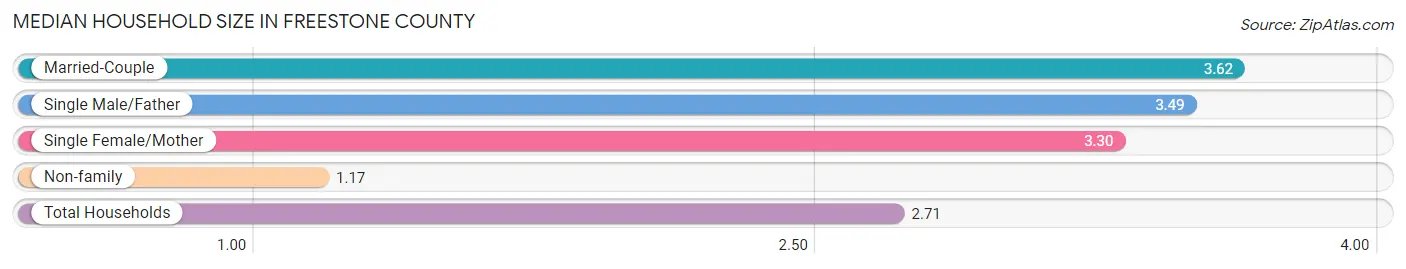
Median Household Size in Freestone County
The median household size in Freestone County is 2.71 persons per household, with married-couple households (3,317 | 49.5%) accounting for the largest median household size of 3.62 persons per household. non-family households (2,371 | 35.4%) represent the smallest median household size with 1.17 persons per household.
| Household Type | # Households | Household Size |
| Married-Couple | 3,317 (49.5%) | 3.62 |
| Single Male/Father | 280 (4.2%) | 3.49 |
| Single Female/Mother | 733 (10.9%) | 3.30 |
| Non-family | 2,371 (35.4%) | 1.17 |
| Total Households | 6,701 (100.0%) | 2.71 |
Household Size by Marriage Status in Freestone County
Out of a total of 6,701 households in Freestone County, 4,330 (64.6%) are family households, while 2,371 (35.4%) are nonfamily households. The most numerous type of family households are 2-person households, comprising 2,183, and the most common type of nonfamily households are 1-person households, comprising 2,172.
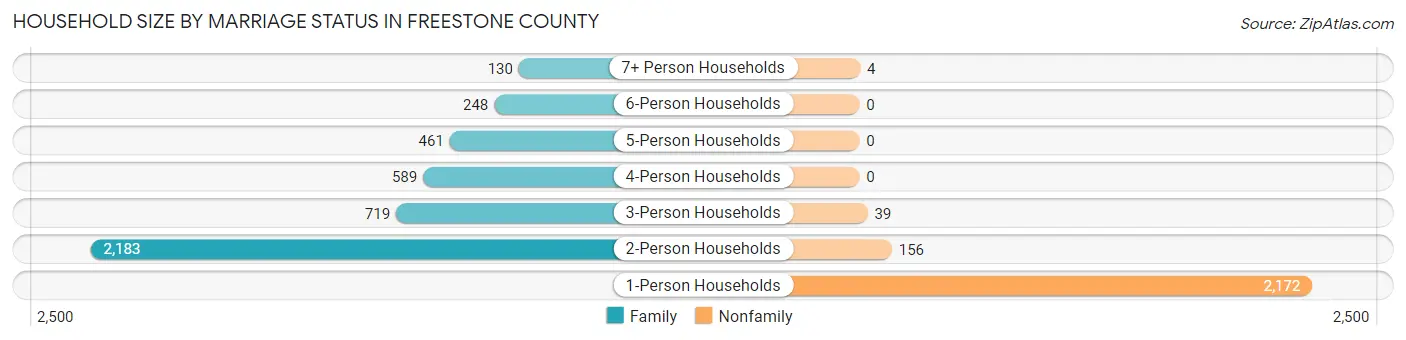
| Household Size | Family Households | Nonfamily Households |
| 1-Person Households | - | 2,172 (32.4%) |
| 2-Person Households | 2,183 (32.6%) | 156 (2.3%) |
| 3-Person Households | 719 (10.7%) | 39 (0.6%) |
| 4-Person Households | 589 (8.8%) | 0 (0.0%) |
| 5-Person Households | 461 (6.9%) | 0 (0.0%) |
| 6-Person Households | 248 (3.7%) | 0 (0.0%) |
| 7+ Person Households | 130 (1.9%) | 4 (0.1%) |
| Total | 4,330 (64.6%) | 2,371 (35.4%) |
Female Fertility in Freestone County
Fertility by Age in Freestone County
Average fertility rate in Freestone County is 60.0 births per 1,000 women. Women in the age bracket of 20 to 34 years have the highest fertility rate with 141.0 births per 1,000 women. Women in the age bracket of 20 to 34 years acount for 97.8% of all women with births.
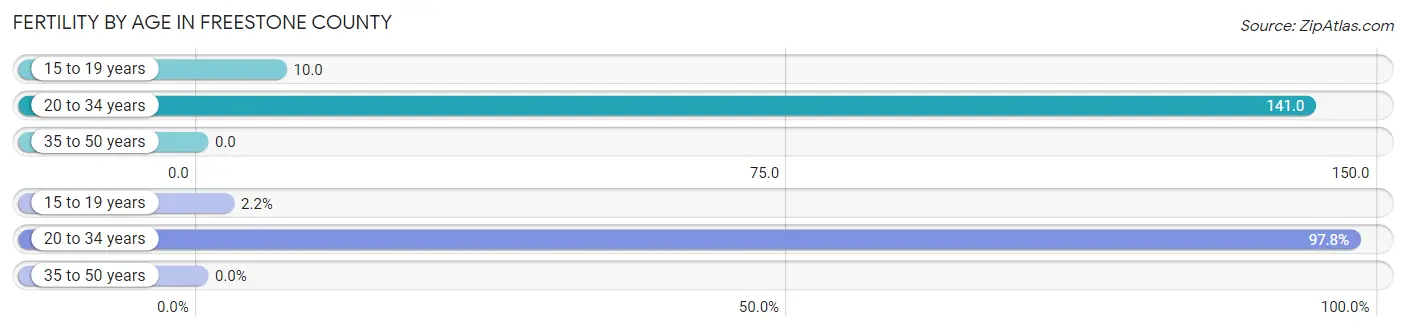
| Age Bracket | Women with Births | Births / 1,000 Women |
| 15 to 19 years | 5 (2.2%) | 10.0 |
| 20 to 34 years | 221 (97.8%) | 141.0 |
| 35 to 50 years | 0 (0.0%) | 0.0 |
| Total | 226 (100.0%) | 60.0 |
Fertility by Age by Marriage Status in Freestone County
84.1% of women with births (226) in Freestone County are married. The highest percentage of unmarried women with births falls into 15 to 19 years age bracket with 100.0% of them unmarried at the time of birth, while the lowest percentage of unmarried women with births belong to 20 to 34 years age bracket with 14.0% of them unmarried.
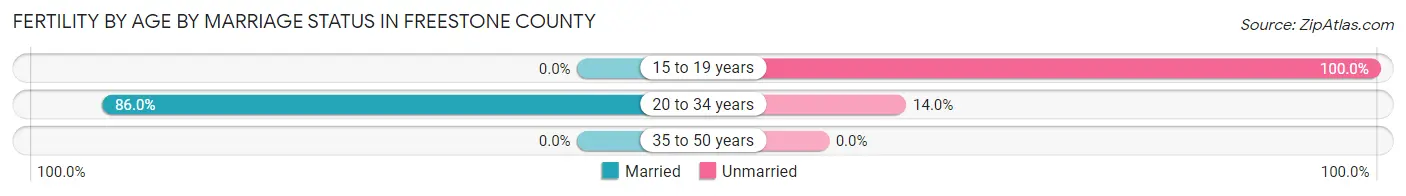
| Age Bracket | Married | Unmarried |
| 15 to 19 years | 0 (0.0%) | 5 (100.0%) |
| 20 to 34 years | 190 (86.0%) | 31 (14.0%) |
| 35 to 50 years | 0 (0.0%) | 0 (0.0%) |
| Total | 190 (84.1%) | 36 (15.9%) |
Fertility by Education in Freestone County
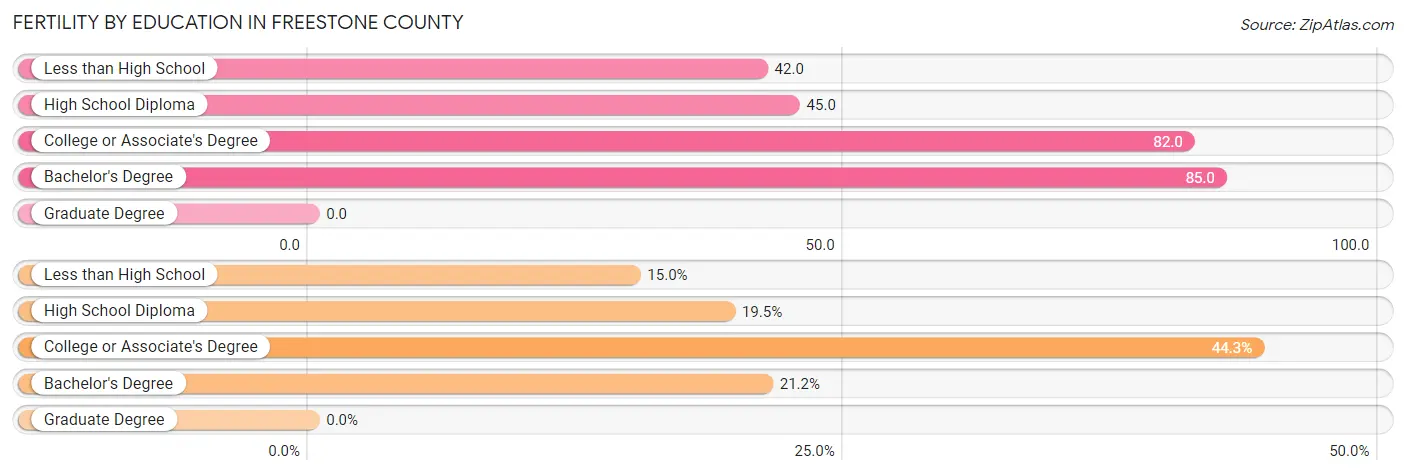
| Educational Attainment | Women with Births | Births / 1,000 Women |
| Less than High School | 34 (15.0%) | 42.0 |
| High School Diploma | 44 (19.5%) | 45.0 |
| College or Associate's Degree | 100 (44.3%) | 82.0 |
| Bachelor's Degree | 48 (21.2%) | 85.0 |
| Graduate Degree | 0 (0.0%) | 0.0 |
| Total | 226 (100.0%) | 60.0 |
Fertility by Education by Marriage Status in Freestone County
15.9% of women with births in Freestone County are unmarried. Women with the educational attainment of college or associate's degree are most likely to be married with 100.0% of them married at childbirth, while women with the educational attainment of less than high school are least likely to be married with 100.0% of them unmarried at childbirth.
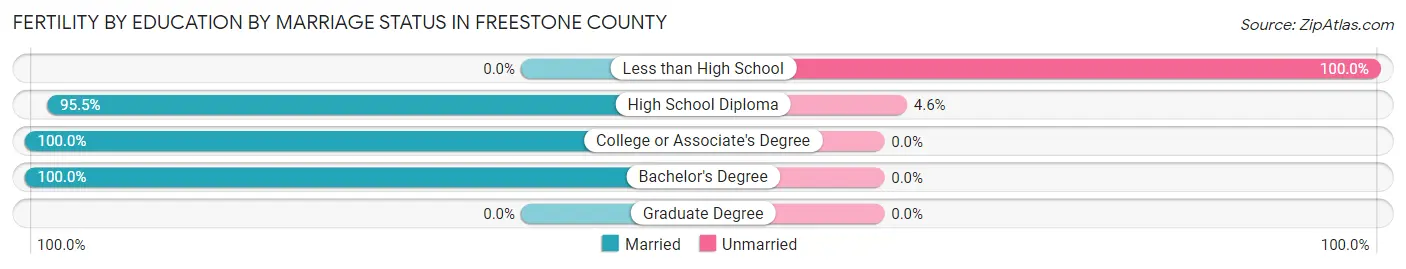
| Educational Attainment | Married | Unmarried |
| Less than High School | 0 (0.0%) | 34 (100.0%) |
| High School Diploma | 42 (95.5%) | 2 (4.5%) |
| College or Associate's Degree | 100 (100.0%) | 0 (0.0%) |
| Bachelor's Degree | 48 (100.0%) | 0 (0.0%) |
| Graduate Degree | 0 (0.0%) | 0 (0.0%) |
| Total | 190 (84.1%) | 36 (15.9%) |
Employment Characteristics in Freestone County
Employment by Class of Employer in Freestone County
Among the 7,065 employed individuals in Freestone County, private company employees (4,841 | 68.5%), state government employees (681 | 9.6%), and self-employed (not incorporated) (560 | 7.9%) make up the most common classes of employment.
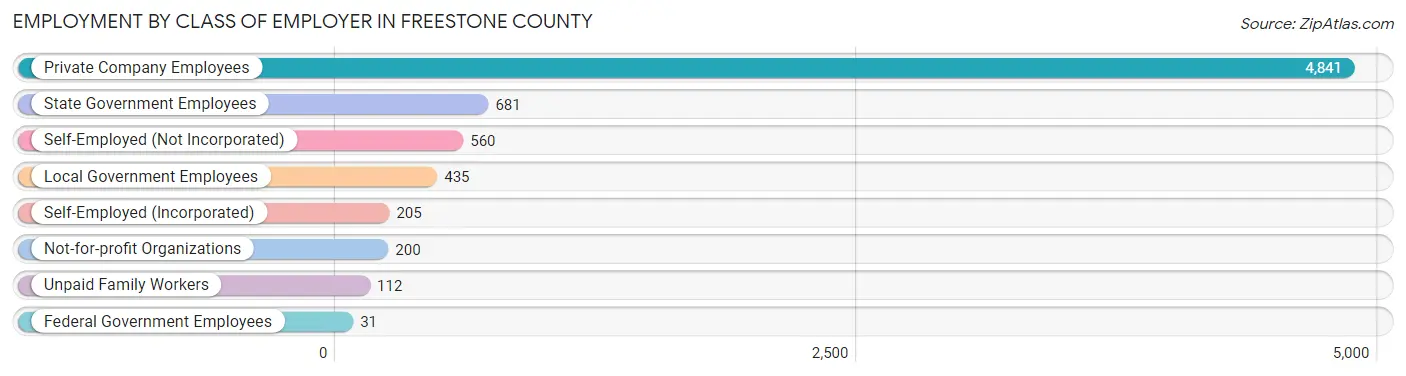
| Employer Class | # Employees | % Employees |
| Private Company Employees | 4,841 | 68.5% |
| Self-Employed (Incorporated) | 205 | 2.9% |
| Self-Employed (Not Incorporated) | 560 | 7.9% |
| Not-for-profit Organizations | 200 | 2.8% |
| Local Government Employees | 435 | 6.2% |
| State Government Employees | 681 | 9.6% |
| Federal Government Employees | 31 | 0.4% |
| Unpaid Family Workers | 112 | 1.6% |
| Total | 7,065 | 100.0% |
Employment Status by Age in Freestone County
According to the labor force statistics for Freestone County, out of the total population over 16 years of age (15,693), 47.1% or 7,391 individuals are in the labor force, with 3.5% or 259 of them unemployed. The age group with the highest labor force participation rate is 20 to 24 years, with 69.2% or 636 individuals in the labor force. Within the labor force, the 60 to 64 years age range has the highest percentage of unemployed individuals, with 6.3% or 29 of them being unemployed.
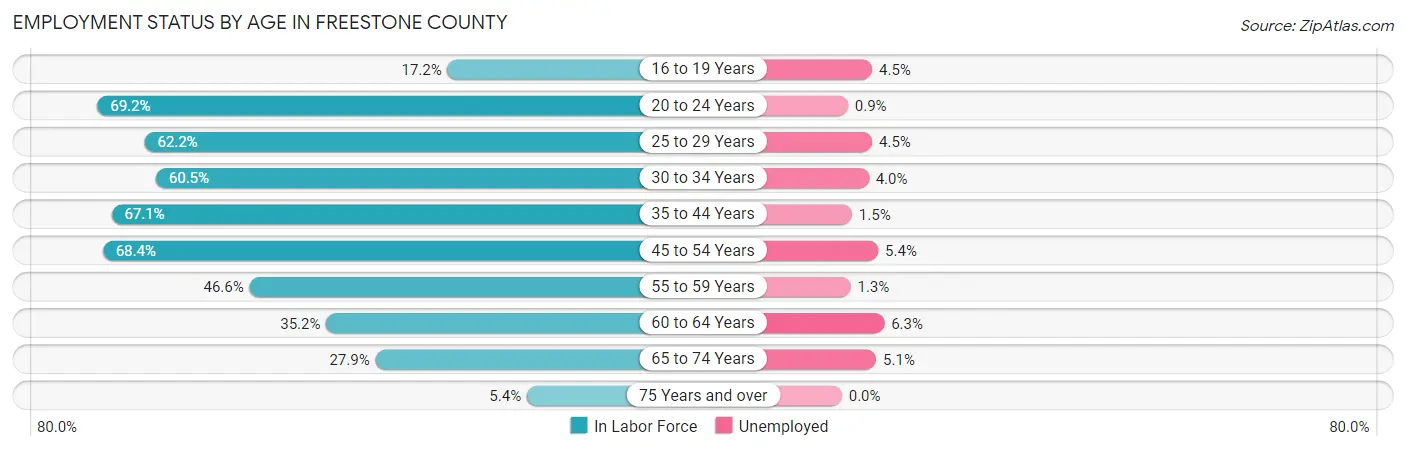
| Age Bracket | In Labor Force | Unemployed |
| 16 to 19 Years | 155 (17.2%) | 7 (4.5%) |
| 20 to 24 Years | 636 (69.2%) | 6 (0.9%) |
| 25 to 29 Years | 726 (62.2%) | 33 (4.5%) |
| 30 to 34 Years | 770 (60.5%) | 31 (4.0%) |
| 35 to 44 Years | 1,777 (67.1%) | 27 (1.5%) |
| 45 to 54 Years | 1,577 (68.4%) | 85 (5.4%) |
| 55 to 59 Years | 595 (46.6%) | 8 (1.3%) |
| 60 to 64 Years | 460 (35.2%) | 29 (6.3%) |
| 65 to 74 Years | 595 (27.9%) | 30 (5.1%) |
| 75 Years and over | 95 (5.4%) | 0 (0.0%) |
| Total | 7,391 (47.1%) | 259 (3.5%) |
Employment Status by Educational Attainment in Freestone County
According to labor force statistics for Freestone County, 59.2% of individuals (5,907) out of the total population between 25 and 64 years of age (9,978) are in the labor force, with 3.6% or 213 of them being unemployed. The group with the highest labor force participation rate are those with the educational attainment of bachelor's degree or higher, with 69.5% or 1,284 individuals in the labor force. Within the labor force, individuals with high school diploma education have the highest percentage of unemployment, with 7.1% or 128 of them being unemployed.
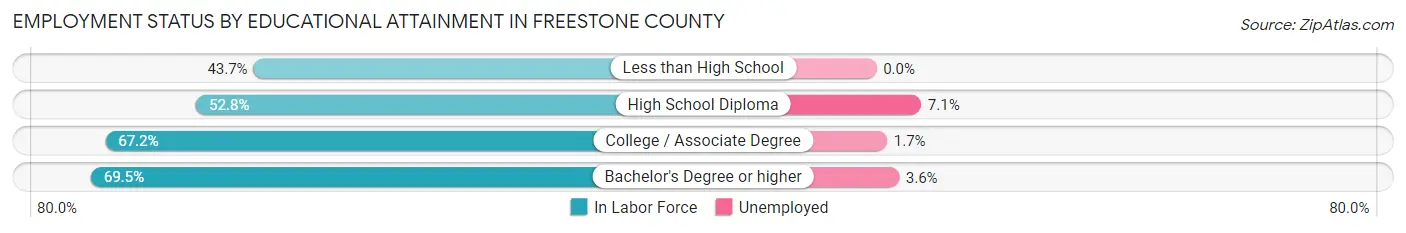
| Educational Attainment | In Labor Force | Unemployed |
| Less than High School | 642 (43.7%) | 0 (0.0%) |
| High School Diploma | 1,808 (52.8%) | 243 (7.1%) |
| College / Associate Degree | 2,175 (67.2%) | 55 (1.7%) |
| Bachelor's Degree or higher | 1,284 (69.5%) | 66 (3.6%) |
| Total | 5,907 (59.2%) | 359 (3.6%) |
Employment Occupations by Sex in Freestone County
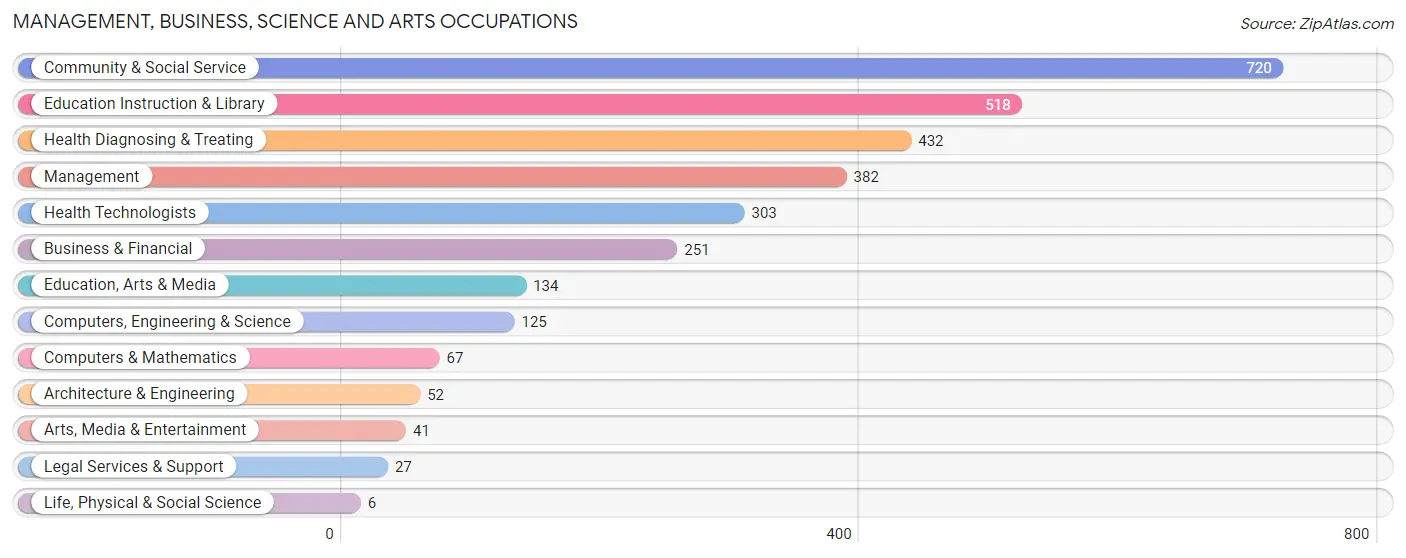
Management, Business, Science and Arts Occupations
The most common Management, Business, Science and Arts occupations in Freestone County are Community & Social Service (720 | 10.1%), Education Instruction & Library (518 | 7.3%), Health Diagnosing & Treating (432 | 6.1%), Management (382 | 5.4%), and Health Technologists (303 | 4.3%).
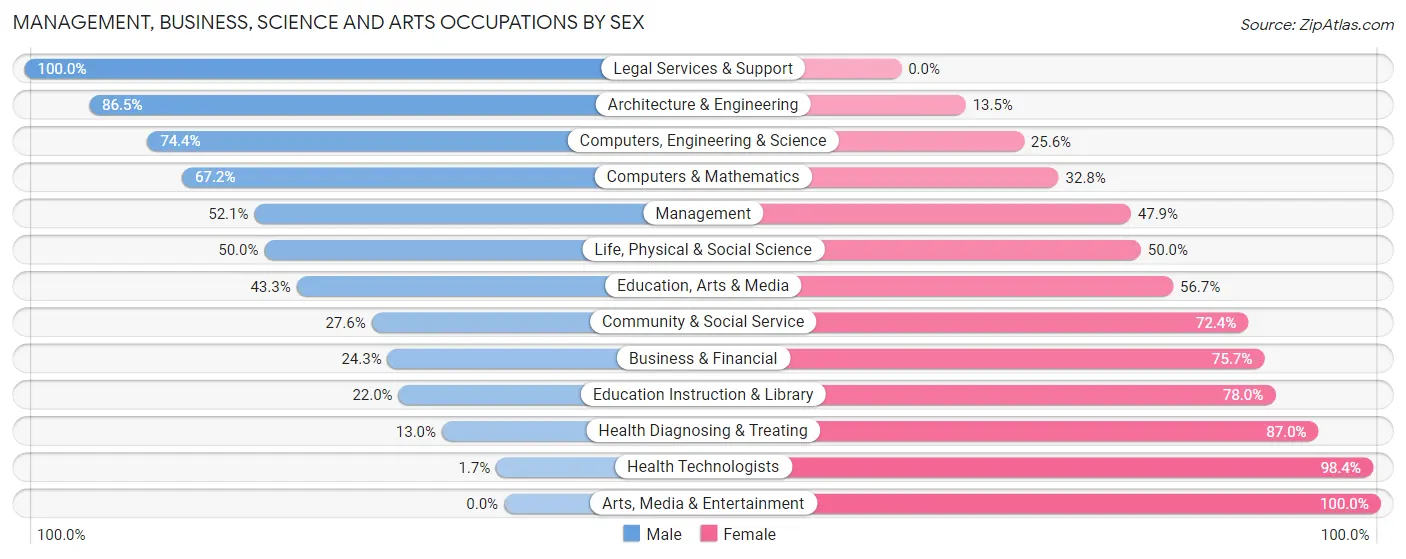
Management, Business, Science and Arts Occupations by Sex
Within the Management, Business, Science and Arts occupations in Freestone County, the most male-oriented occupations are Legal Services & Support (100.0%), Architecture & Engineering (86.5%), and Computers, Engineering & Science (74.4%), while the most female-oriented occupations are Arts, Media & Entertainment (100.0%), Health Technologists (98.4%), and Health Diagnosing & Treating (87.0%).
| Occupation | Male | Female |
| Management | 199 (52.1%) | 183 (47.9%) |
| Business & Financial | 61 (24.3%) | 190 (75.7%) |
| Computers, Engineering & Science | 93 (74.4%) | 32 (25.6%) |
| Computers & Mathematics | 45 (67.2%) | 22 (32.8%) |
| Architecture & Engineering | 45 (86.5%) | 7 (13.5%) |
| Life, Physical & Social Science | 3 (50.0%) | 3 (50.0%) |
| Community & Social Service | 199 (27.6%) | 521 (72.4%) |
| Education, Arts & Media | 58 (43.3%) | 76 (56.7%) |
| Legal Services & Support | 27 (100.0%) | 0 (0.0%) |
| Education Instruction & Library | 114 (22.0%) | 404 (78.0%) |
| Arts, Media & Entertainment | 0 (0.0%) | 41 (100.0%) |
| Health Diagnosing & Treating | 56 (13.0%) | 376 (87.0%) |
| Health Technologists | 5 (1.7%) | 298 (98.4%) |
| Total (Category) | 608 (31.8%) | 1,302 (68.2%) |
| Total (Overall) | 3,783 (53.0%) | 3,348 (46.9%) |
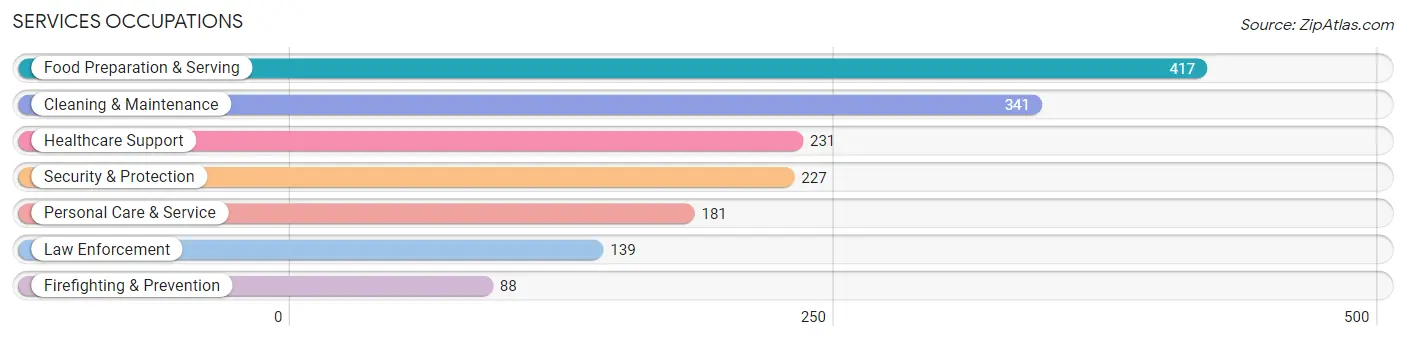
Services Occupations
The most common Services occupations in Freestone County are Food Preparation & Serving (417 | 5.9%), Cleaning & Maintenance (341 | 4.8%), Healthcare Support (231 | 3.2%), Security & Protection (227 | 3.2%), and Personal Care & Service (181 | 2.5%).
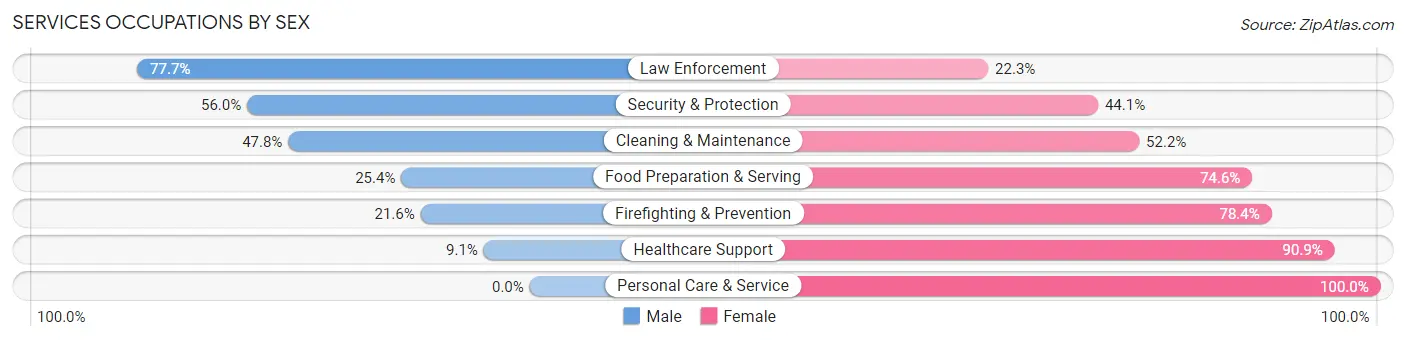
Services Occupations by Sex
Within the Services occupations in Freestone County, the most male-oriented occupations are Law Enforcement (77.7%), Security & Protection (55.9%), and Cleaning & Maintenance (47.8%), while the most female-oriented occupations are Personal Care & Service (100.0%), Healthcare Support (90.9%), and Firefighting & Prevention (78.4%).
| Occupation | Male | Female |
| Healthcare Support | 21 (9.1%) | 210 (90.9%) |
| Security & Protection | 127 (55.9%) | 100 (44.1%) |
| Firefighting & Prevention | 19 (21.6%) | 69 (78.4%) |
| Law Enforcement | 108 (77.7%) | 31 (22.3%) |
| Food Preparation & Serving | 106 (25.4%) | 311 (74.6%) |
| Cleaning & Maintenance | 163 (47.8%) | 178 (52.2%) |
| Personal Care & Service | 0 (0.0%) | 181 (100.0%) |
| Total (Category) | 417 (29.8%) | 980 (70.2%) |
| Total (Overall) | 3,783 (53.0%) | 3,348 (46.9%) |
Sales and Office Occupations
The most common Sales and Office occupations in Freestone County are Office & Administration (682 | 9.6%), and Sales & Related (662 | 9.3%).
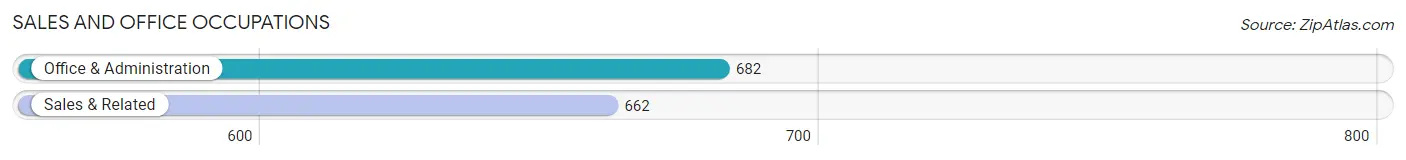
Sales and Office Occupations by Sex
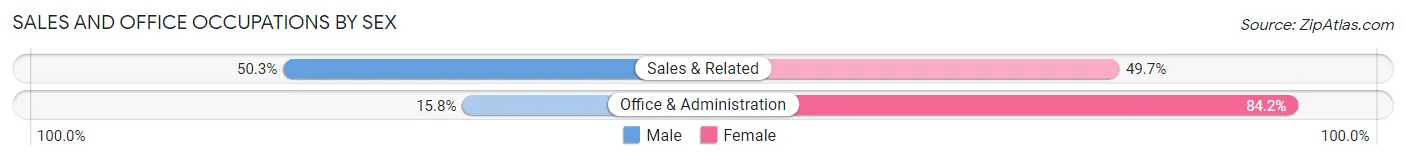
| Occupation | Male | Female |
| Sales & Related | 333 (50.3%) | 329 (49.7%) |
| Office & Administration | 108 (15.8%) | 574 (84.2%) |
| Total (Category) | 441 (32.8%) | 903 (67.2%) |
| Total (Overall) | 3,783 (53.0%) | 3,348 (46.9%) |
Natural Resources, Construction and Maintenance Occupations
The most common Natural Resources, Construction and Maintenance occupations in Freestone County are Construction & Extraction (641 | 9.0%), Installation, Maintenance & Repair (457 | 6.4%), and Farming, Fishing & Forestry (36 | 0.5%).
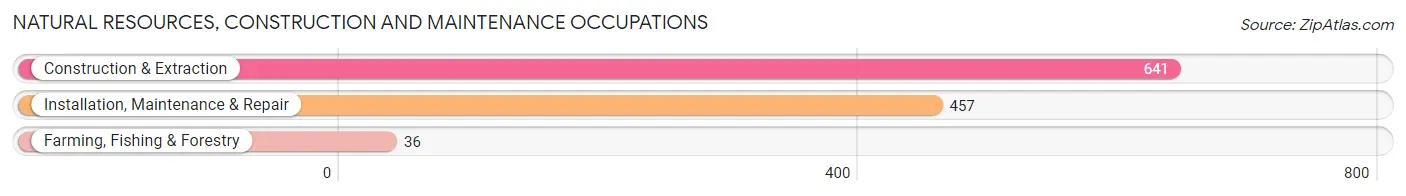
Natural Resources, Construction and Maintenance Occupations by Sex
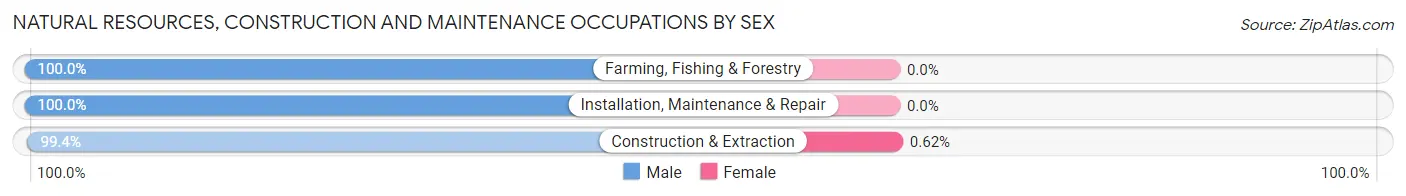
| Occupation | Male | Female |
| Farming, Fishing & Forestry | 36 (100.0%) | 0 (0.0%) |
| Construction & Extraction | 637 (99.4%) | 4 (0.6%) |
| Installation, Maintenance & Repair | 457 (100.0%) | 0 (0.0%) |
| Total (Category) | 1,130 (99.7%) | 4 (0.4%) |
| Total (Overall) | 3,783 (53.0%) | 3,348 (46.9%) |
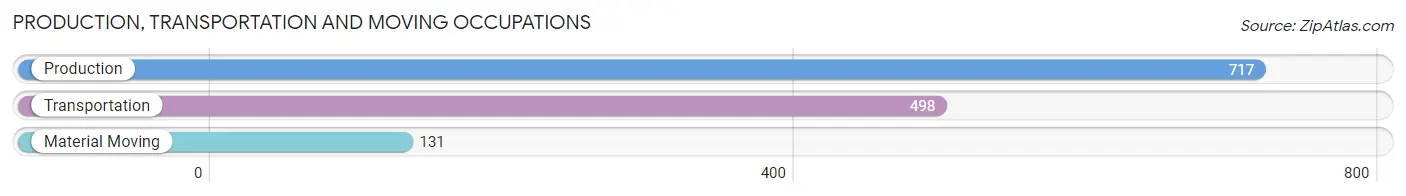
Production, Transportation and Moving Occupations
The most common Production, Transportation and Moving occupations in Freestone County are Production (717 | 10.1%), Transportation (498 | 7.0%), and Material Moving (131 | 1.8%).
Production, Transportation and Moving Occupations by Sex
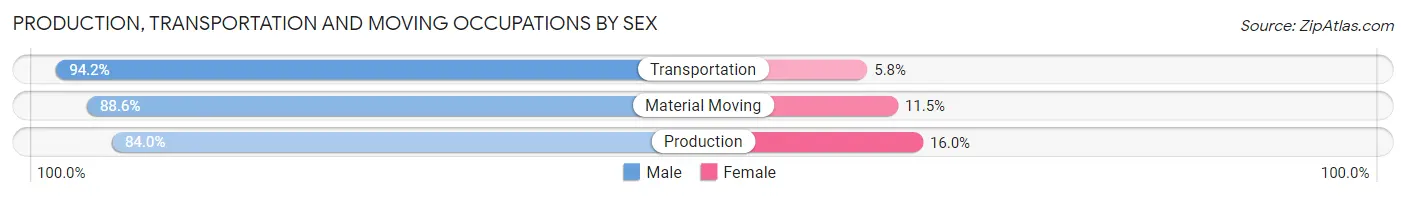
| Occupation | Male | Female |
| Production | 602 (84.0%) | 115 (16.0%) |
| Transportation | 469 (94.2%) | 29 (5.8%) |
| Material Moving | 116 (88.5%) | 15 (11.5%) |
| Total (Category) | 1,187 (88.2%) | 159 (11.8%) |
| Total (Overall) | 3,783 (53.0%) | 3,348 (46.9%) |
Employment Industries by Sex in Freestone County
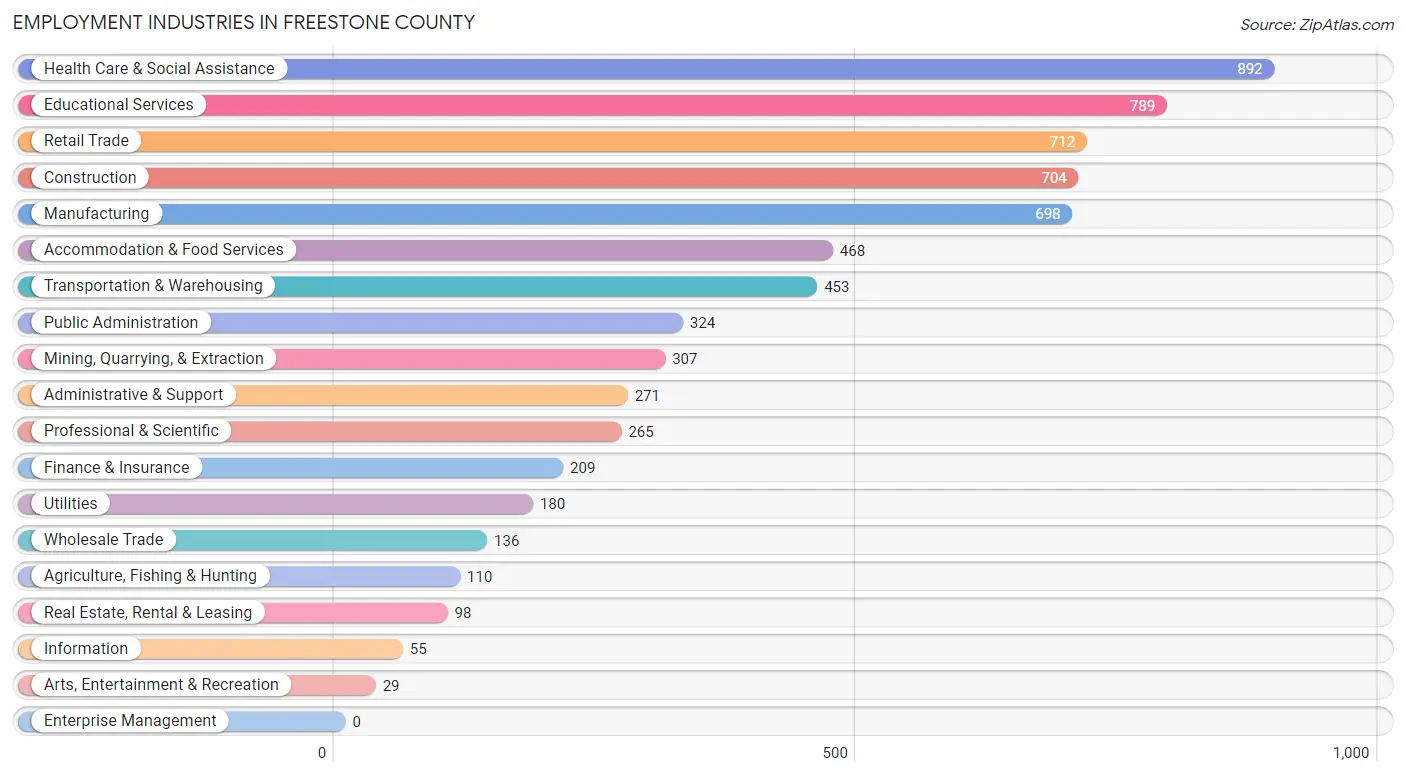
Employment Industries in Freestone County
The major employment industries in Freestone County include Health Care & Social Assistance (892 | 12.5%), Educational Services (789 | 11.1%), Retail Trade (712 | 10.0%), Construction (704 | 9.9%), and Manufacturing (698 | 9.8%).
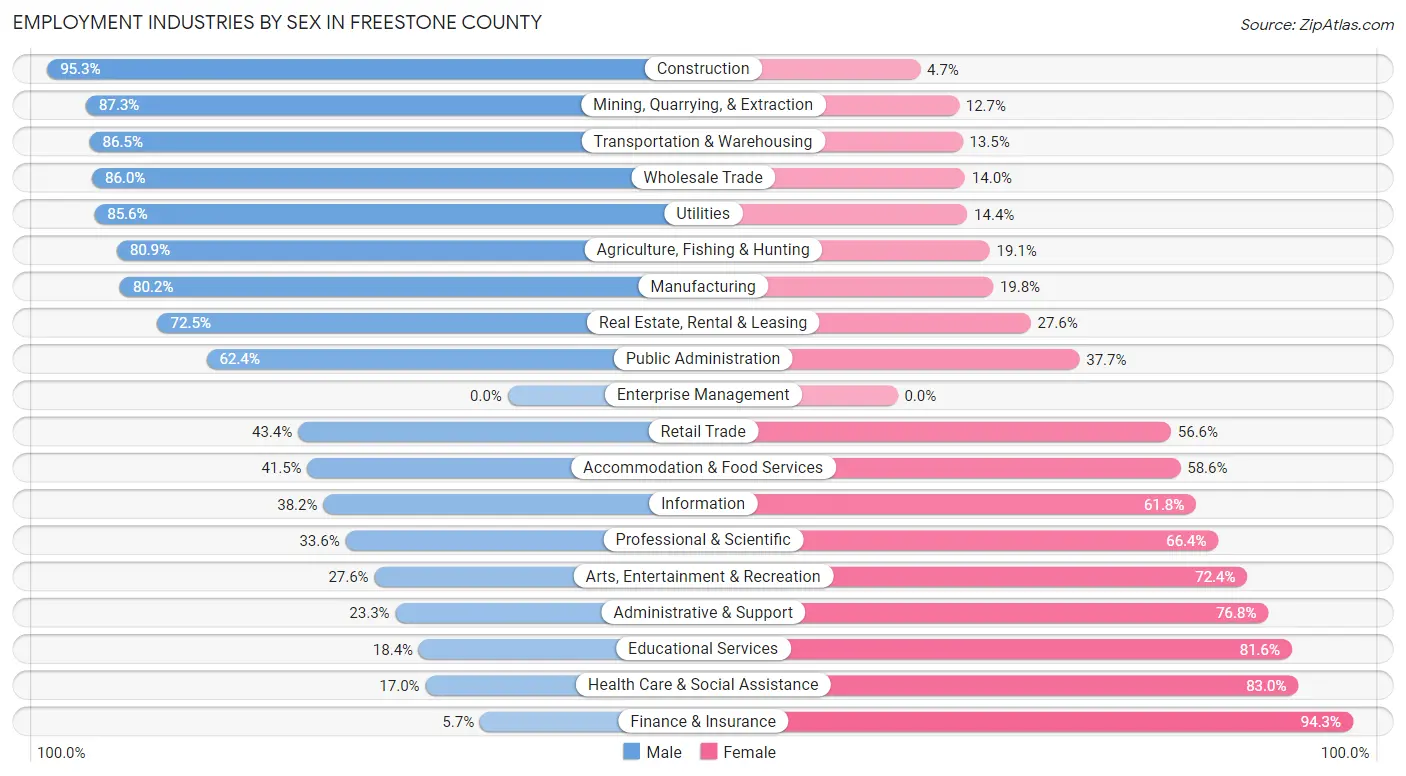
Employment Industries by Sex in Freestone County
The Freestone County industries that see more men than women are Construction (95.3%), Mining, Quarrying, & Extraction (87.3%), and Transportation & Warehousing (86.5%), whereas the industries that tend to have a higher number of women are Finance & Insurance (94.3%), Health Care & Social Assistance (83.0%), and Educational Services (81.6%).
| Industry | Male | Female |
| Agriculture, Fishing & Hunting | 89 (80.9%) | 21 (19.1%) |
| Mining, Quarrying, & Extraction | 268 (87.3%) | 39 (12.7%) |
| Construction | 671 (95.3%) | 33 (4.7%) |
| Manufacturing | 560 (80.2%) | 138 (19.8%) |
| Wholesale Trade | 117 (86.0%) | 19 (14.0%) |
| Retail Trade | 309 (43.4%) | 403 (56.6%) |
| Transportation & Warehousing | 392 (86.5%) | 61 (13.5%) |
| Utilities | 154 (85.6%) | 26 (14.4%) |
| Information | 21 (38.2%) | 34 (61.8%) |
| Finance & Insurance | 12 (5.7%) | 197 (94.3%) |
| Real Estate, Rental & Leasing | 71 (72.5%) | 27 (27.6%) |
| Professional & Scientific | 89 (33.6%) | 176 (66.4%) |
| Enterprise Management | 0 (0.0%) | 0 (0.0%) |
| Administrative & Support | 63 (23.3%) | 208 (76.7%) |
| Educational Services | 145 (18.4%) | 644 (81.6%) |
| Health Care & Social Assistance | 152 (17.0%) | 740 (83.0%) |
| Arts, Entertainment & Recreation | 8 (27.6%) | 21 (72.4%) |
| Accommodation & Food Services | 194 (41.4%) | 274 (58.6%) |
| Public Administration | 202 (62.4%) | 122 (37.7%) |
| Total | 3,783 (53.0%) | 3,348 (46.9%) |
Education in Freestone County
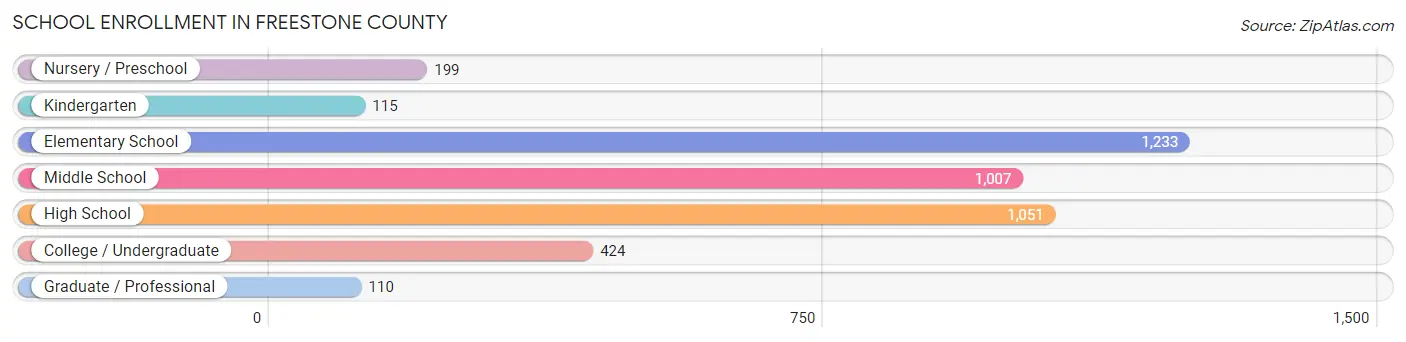
School Enrollment in Freestone County
The most common levels of schooling among the 4,139 students in Freestone County are elementary school (1,233 | 29.8%), high school (1,051 | 25.4%), and middle school (1,007 | 24.3%).
| School Level | # Students | % Students |
| Nursery / Preschool | 199 | 4.8% |
| Kindergarten | 115 | 2.8% |
| Elementary School | 1,233 | 29.8% |
| Middle School | 1,007 | 24.3% |
| High School | 1,051 | 25.4% |
| College / Undergraduate | 424 | 10.2% |
| Graduate / Professional | 110 | 2.7% |
| Total | 4,139 | 100.0% |
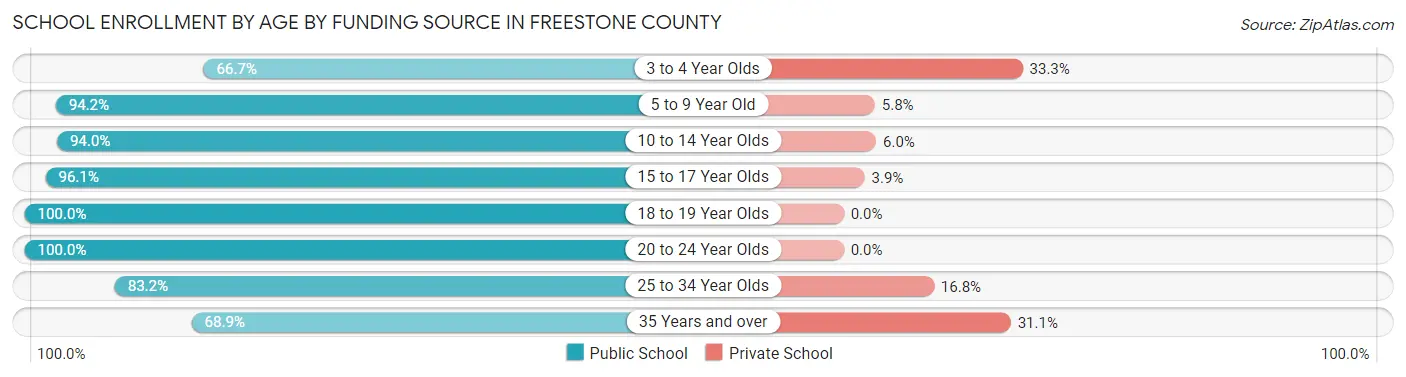
School Enrollment by Age by Funding Source in Freestone County
Out of a total of 4,139 students who are enrolled in schools in Freestone County, 306 (7.4%) attend a private institution, while the remaining 3,833 (92.6%) are enrolled in public schools. The age group of 3 to 4 year olds has the highest likelihood of being enrolled in private schools, with 36 (33.3% in the age bracket) enrolled. Conversely, the age group of 18 to 19 year olds has the lowest likelihood of being enrolled in a private school, with 265 (100.0% in the age bracket) attending a public institution.
| Age Bracket | Public School | Private School |
| 3 to 4 Year Olds | 72 (66.7%) | 36 (33.3%) |
| 5 to 9 Year Old | 1,233 (94.2%) | 76 (5.8%) |
| 10 to 14 Year Olds | 1,120 (94.0%) | 72 (6.0%) |
| 15 to 17 Year Olds | 739 (96.1%) | 30 (3.9%) |
| 18 to 19 Year Olds | 265 (100.0%) | 0 (0.0%) |
| 20 to 24 Year Olds | 142 (100.0%) | 0 (0.0%) |
| 25 to 34 Year Olds | 94 (83.2%) | 19 (16.8%) |
| 35 Years and over | 166 (68.9%) | 75 (31.1%) |
| Total | 3,833 (92.6%) | 306 (7.4%) |
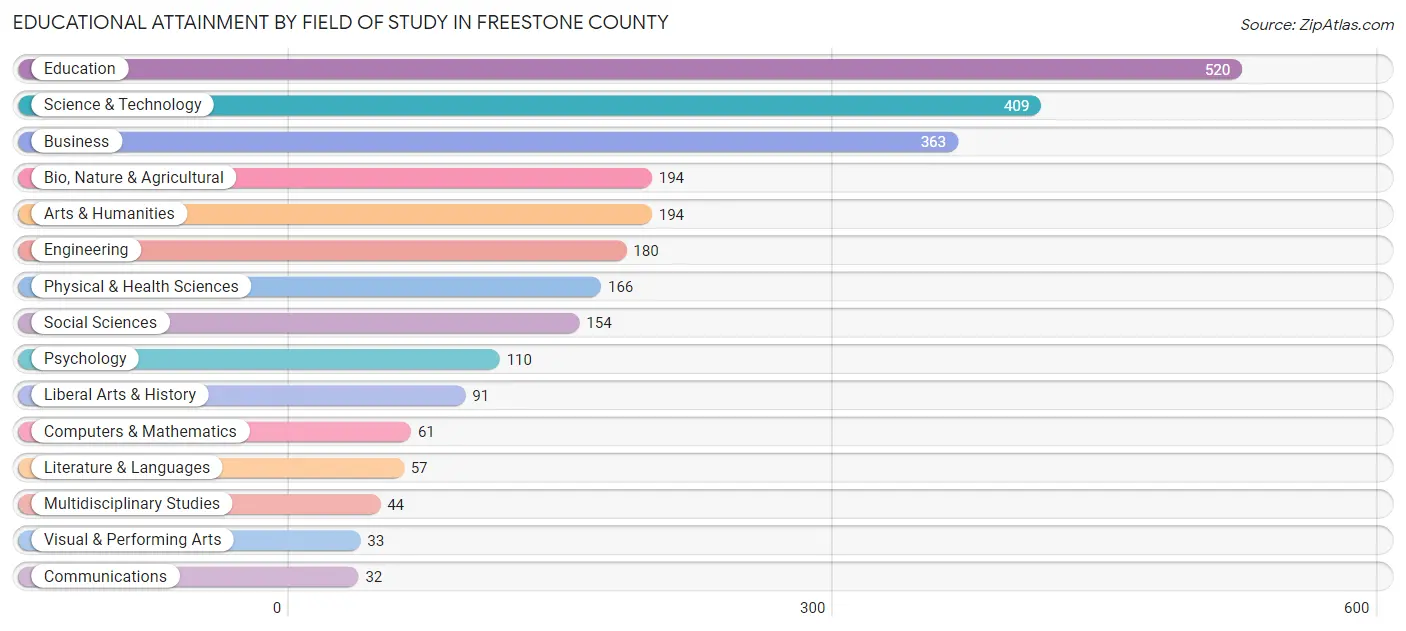
Educational Attainment by Field of Study in Freestone County
Education (520 | 19.9%), science & technology (409 | 15.7%), business (363 | 13.9%), bio, nature & agricultural (194 | 7.4%), and arts & humanities (194 | 7.4%) are the most common fields of study among 2,608 individuals in Freestone County who have obtained a bachelor's degree or higher.
| Field of Study | # Graduates | % Graduates |
| Computers & Mathematics | 61 | 2.3% |
| Bio, Nature & Agricultural | 194 | 7.4% |
| Physical & Health Sciences | 166 | 6.4% |
| Psychology | 110 | 4.2% |
| Social Sciences | 154 | 5.9% |
| Engineering | 180 | 6.9% |
| Multidisciplinary Studies | 44 | 1.7% |
| Science & Technology | 409 | 15.7% |
| Business | 363 | 13.9% |
| Education | 520 | 19.9% |
| Literature & Languages | 57 | 2.2% |
| Liberal Arts & History | 91 | 3.5% |
| Visual & Performing Arts | 33 | 1.3% |
| Communications | 32 | 1.2% |
| Arts & Humanities | 194 | 7.4% |
| Total | 2,608 | 100.0% |
Transportation & Commute in Freestone County
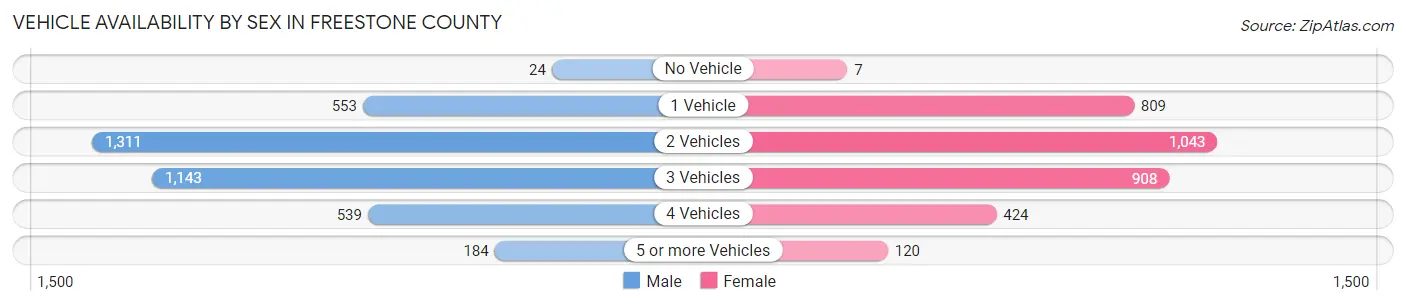
Vehicle Availability by Sex in Freestone County
The most prevalent vehicle ownership categories in Freestone County are males with 2 vehicles (1,311, accounting for 34.9%) and females with 2 vehicles (1,043, making up 39.6%).
| Vehicles Available | Male | Female |
| No Vehicle | 24 (0.6%) | 7 (0.2%) |
| 1 Vehicle | 553 (14.7%) | 809 (24.4%) |
| 2 Vehicles | 1,311 (34.9%) | 1,043 (31.5%) |
| 3 Vehicles | 1,143 (30.4%) | 908 (27.4%) |
| 4 Vehicles | 539 (14.4%) | 424 (12.8%) |
| 5 or more Vehicles | 184 (4.9%) | 120 (3.6%) |
| Total | 3,754 (100.0%) | 3,311 (100.0%) |
Commute Time in Freestone County
The most frequently occuring commute durations in Freestone County are 30 to 34 minutes (1,024 commuters, 15.2%), 10 to 14 minutes (964 commuters, 14.3%), and 5 to 9 minutes (851 commuters, 12.6%).
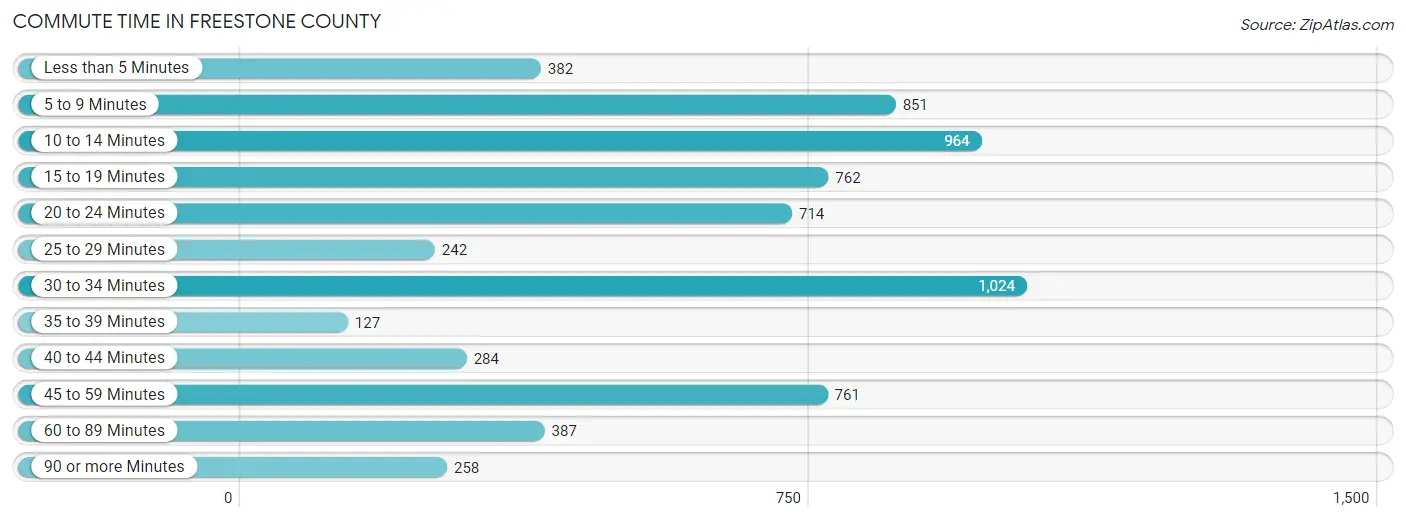
| Commute Time | # Commuters | % Commuters |
| Less than 5 Minutes | 382 | 5.7% |
| 5 to 9 Minutes | 851 | 12.6% |
| 10 to 14 Minutes | 964 | 14.3% |
| 15 to 19 Minutes | 762 | 11.3% |
| 20 to 24 Minutes | 714 | 10.6% |
| 25 to 29 Minutes | 242 | 3.6% |
| 30 to 34 Minutes | 1,024 | 15.2% |
| 35 to 39 Minutes | 127 | 1.9% |
| 40 to 44 Minutes | 284 | 4.2% |
| 45 to 59 Minutes | 761 | 11.3% |
| 60 to 89 Minutes | 387 | 5.7% |
| 90 or more Minutes | 258 | 3.8% |
Commute Time by Sex in Freestone County
The most common commute times in Freestone County are 30 to 34 minutes (654 commuters, 17.9%) for males and 10 to 14 minutes (588 commuters, 19.0%) for females.
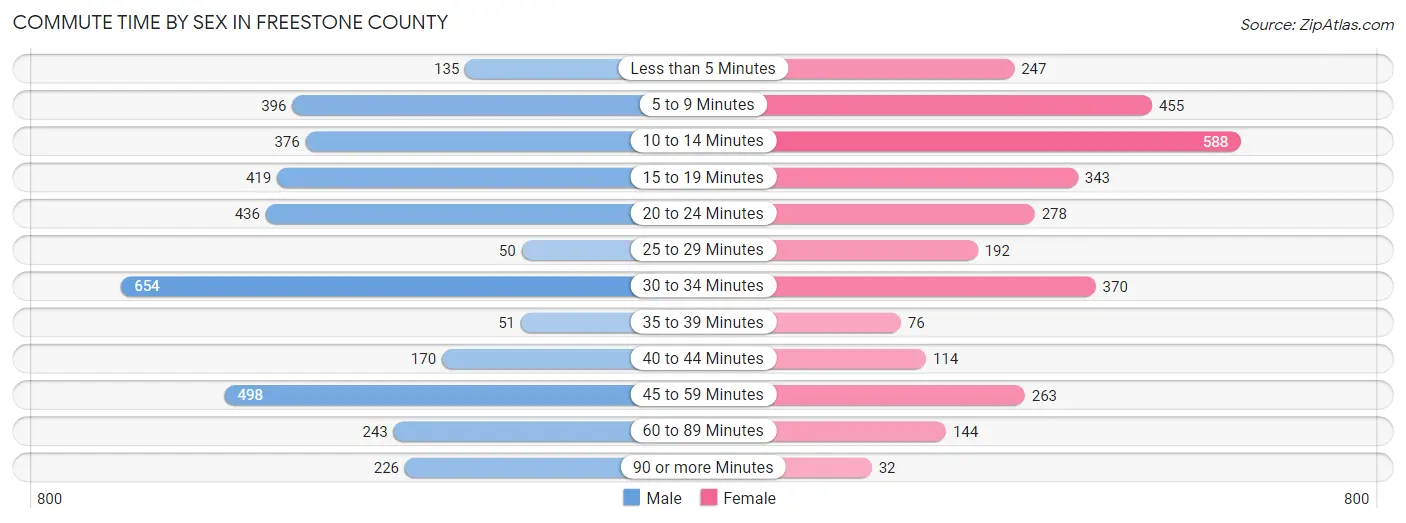
| Commute Time | Male | Female |
| Less than 5 Minutes | 135 (3.7%) | 247 (8.0%) |
| 5 to 9 Minutes | 396 (10.8%) | 455 (14.7%) |
| 10 to 14 Minutes | 376 (10.3%) | 588 (19.0%) |
| 15 to 19 Minutes | 419 (11.5%) | 343 (11.1%) |
| 20 to 24 Minutes | 436 (11.9%) | 278 (9.0%) |
| 25 to 29 Minutes | 50 (1.4%) | 192 (6.2%) |
| 30 to 34 Minutes | 654 (17.9%) | 370 (11.9%) |
| 35 to 39 Minutes | 51 (1.4%) | 76 (2.5%) |
| 40 to 44 Minutes | 170 (4.6%) | 114 (3.7%) |
| 45 to 59 Minutes | 498 (13.6%) | 263 (8.5%) |
| 60 to 89 Minutes | 243 (6.7%) | 144 (4.6%) |
| 90 or more Minutes | 226 (6.2%) | 32 (1.0%) |
Time of Departure to Work by Sex in Freestone County
The most frequent times of departure to work in Freestone County are 7:00 AM to 7:29 AM (562, 15.4%) for males and 7:00 AM to 7:29 AM (680, 21.9%) for females.
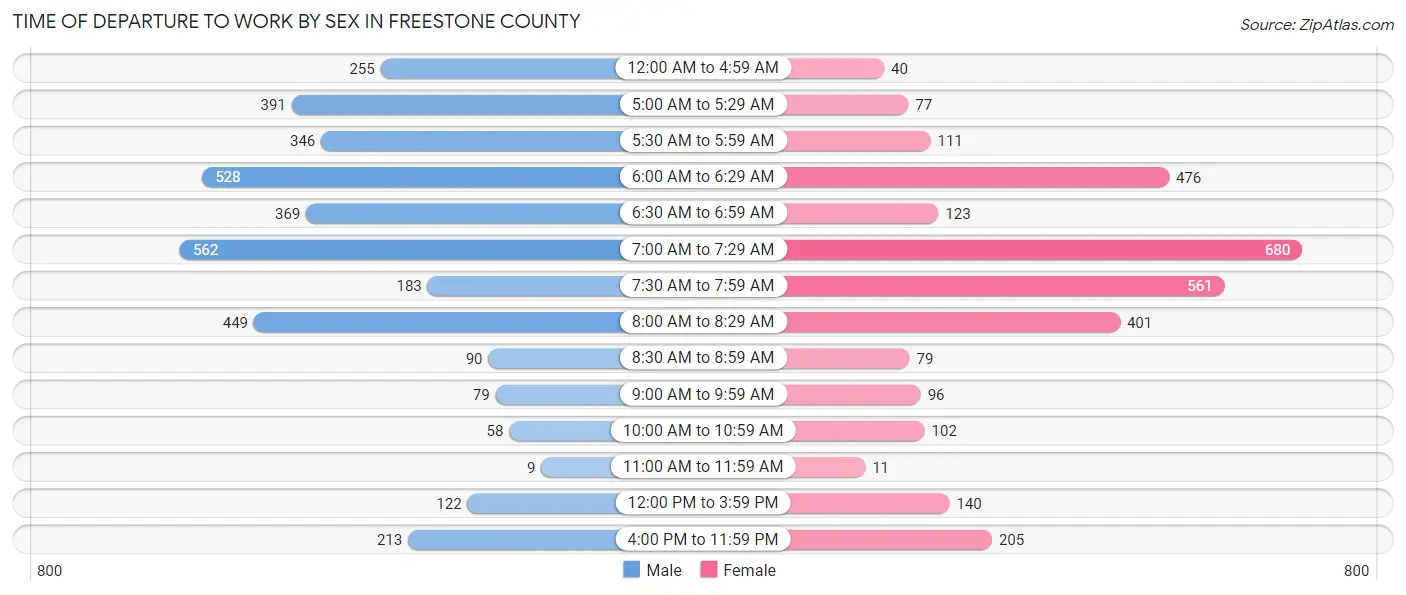
| Time of Departure | Male | Female |
| 12:00 AM to 4:59 AM | 255 (7.0%) | 40 (1.3%) |
| 5:00 AM to 5:29 AM | 391 (10.7%) | 77 (2.5%) |
| 5:30 AM to 5:59 AM | 346 (9.5%) | 111 (3.6%) |
| 6:00 AM to 6:29 AM | 528 (14.4%) | 476 (15.3%) |
| 6:30 AM to 6:59 AM | 369 (10.1%) | 123 (4.0%) |
| 7:00 AM to 7:29 AM | 562 (15.4%) | 680 (21.9%) |
| 7:30 AM to 7:59 AM | 183 (5.0%) | 561 (18.1%) |
| 8:00 AM to 8:29 AM | 449 (12.3%) | 401 (12.9%) |
| 8:30 AM to 8:59 AM | 90 (2.5%) | 79 (2.5%) |
| 9:00 AM to 9:59 AM | 79 (2.2%) | 96 (3.1%) |
| 10:00 AM to 10:59 AM | 58 (1.6%) | 102 (3.3%) |
| 11:00 AM to 11:59 AM | 9 (0.3%) | 11 (0.4%) |
| 12:00 PM to 3:59 PM | 122 (3.3%) | 140 (4.5%) |
| 4:00 PM to 11:59 PM | 213 (5.8%) | 205 (6.6%) |
| Total | 3,654 (100.0%) | 3,102 (100.0%) |
Housing Occupancy in Freestone County
Occupancy by Ownership in Freestone County
Of the total 6,701 dwellings in Freestone County, owner-occupied units account for 5,097 (76.1%), while renter-occupied units make up 1,604 (23.9%).
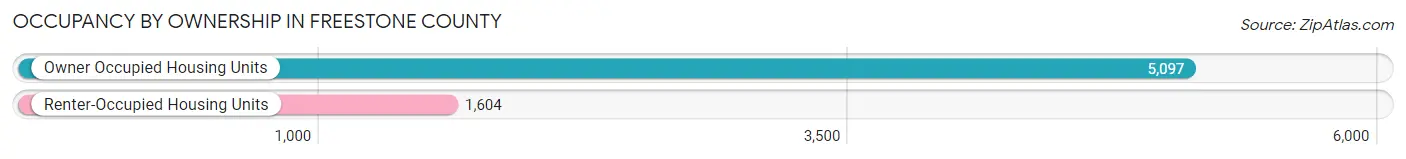
| Occupancy | # Housing Units | % Housing Units |
| Owner Occupied Housing Units | 5,097 | 76.1% |
| Renter-Occupied Housing Units | 1,604 | 23.9% |
| Total Occupied Housing Units | 6,701 | 100.0% |
Occupancy by Household Size in Freestone County
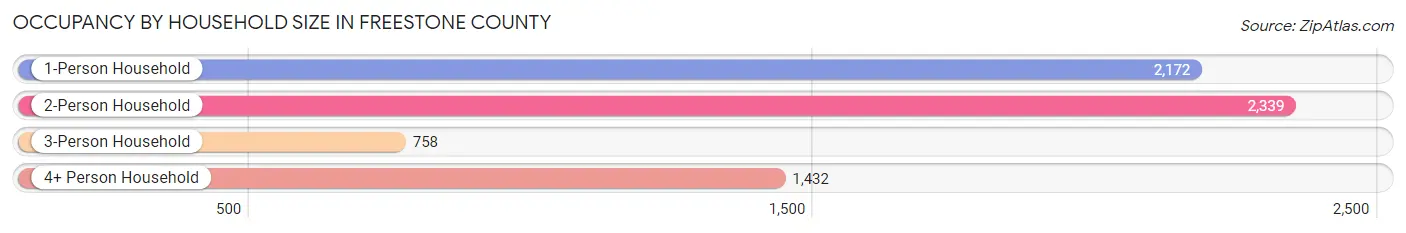
| Household Size | # Housing Units | % Housing Units |
| 1-Person Household | 2,172 | 32.4% |
| 2-Person Household | 2,339 | 34.9% |
| 3-Person Household | 758 | 11.3% |
| 4+ Person Household | 1,432 | 21.4% |
| Total Housing Units | 6,701 | 100.0% |
Occupancy by Ownership by Household Size in Freestone County
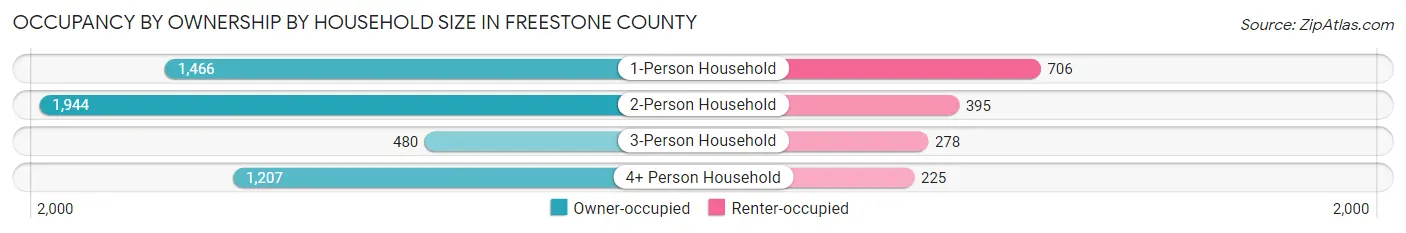
| Household Size | Owner-occupied | Renter-occupied |
| 1-Person Household | 1,466 (67.5%) | 706 (32.5%) |
| 2-Person Household | 1,944 (83.1%) | 395 (16.9%) |
| 3-Person Household | 480 (63.3%) | 278 (36.7%) |
| 4+ Person Household | 1,207 (84.3%) | 225 (15.7%) |
| Total Housing Units | 5,097 (76.1%) | 1,604 (23.9%) |
Occupancy by Educational Attainment in Freestone County
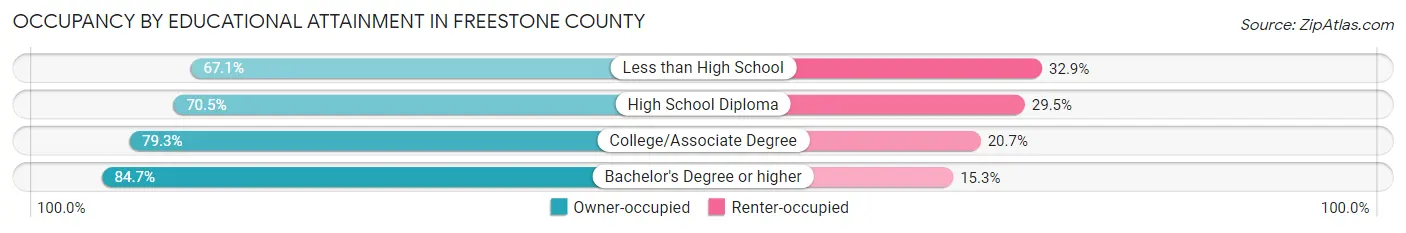
| Household Size | Owner-occupied | Renter-occupied |
| Less than High School | 624 (67.1%) | 306 (32.9%) |
| High School Diploma | 1,385 (70.5%) | 579 (29.5%) |
| College/Associate Degree | 1,996 (79.3%) | 522 (20.7%) |
| Bachelor's Degree or higher | 1,092 (84.7%) | 197 (15.3%) |
Occupancy by Age of Householder in Freestone County
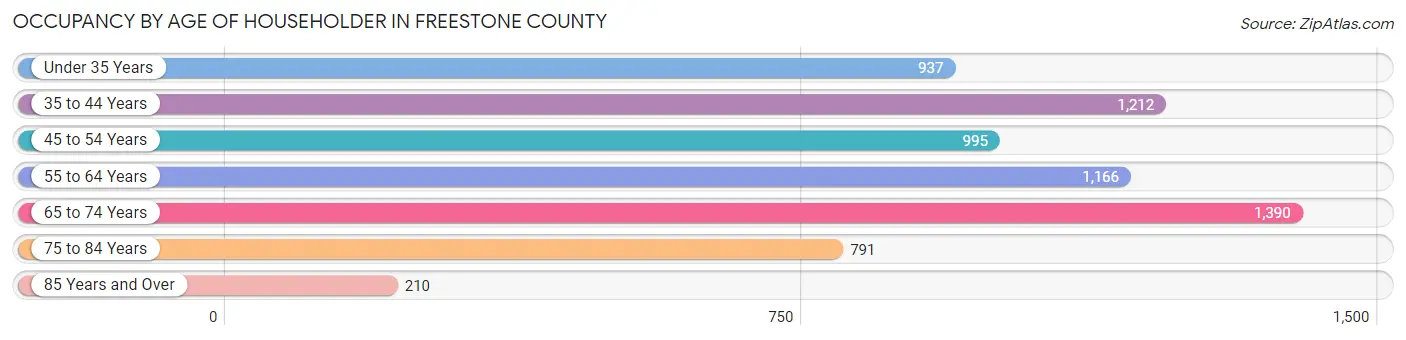
| Age Bracket | # Households | % Households |
| Under 35 Years | 937 | 14.0% |
| 35 to 44 Years | 1,212 | 18.1% |
| 45 to 54 Years | 995 | 14.8% |
| 55 to 64 Years | 1,166 | 17.4% |
| 65 to 74 Years | 1,390 | 20.7% |
| 75 to 84 Years | 791 | 11.8% |
| 85 Years and Over | 210 | 3.1% |
| Total | 6,701 | 100.0% |
Housing Finances in Freestone County
Median Income by Occupancy in Freestone County
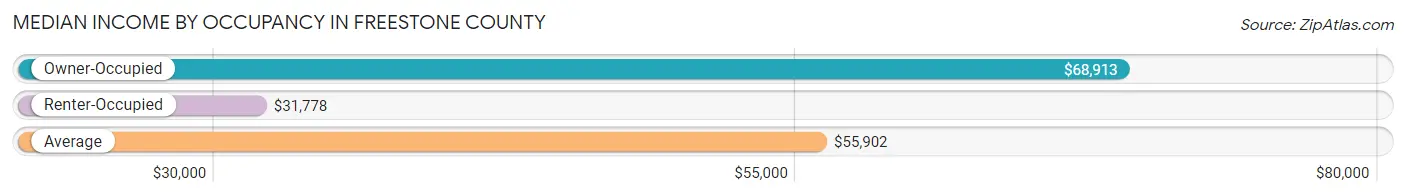
| Occupancy Type | # Households | Median Income |
| Owner-Occupied | 5,097 (76.1%) | $68,913 |
| Renter-Occupied | 1,604 (23.9%) | $31,778 |
| Average | 6,701 (100.0%) | $55,902 |
Occupancy by Householder Income Bracket in Freestone County
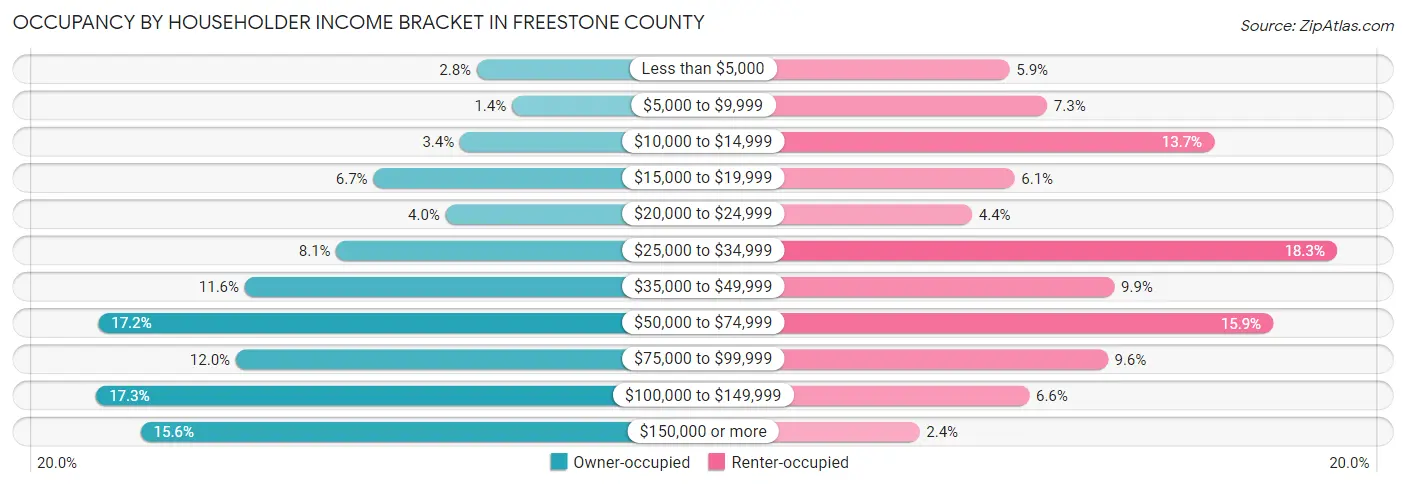
| Income Bracket | Owner-occupied | Renter-occupied |
| Less than $5,000 | 141 (2.8%) | 94 (5.9%) |
| $5,000 to $9,999 | 73 (1.4%) | 117 (7.3%) |
| $10,000 to $14,999 | 174 (3.4%) | 219 (13.7%) |
| $15,000 to $19,999 | 342 (6.7%) | 97 (6.0%) |
| $20,000 to $24,999 | 202 (4.0%) | 71 (4.4%) |
| $25,000 to $34,999 | 414 (8.1%) | 294 (18.3%) |
| $35,000 to $49,999 | 592 (11.6%) | 158 (9.9%) |
| $50,000 to $74,999 | 876 (17.2%) | 255 (15.9%) |
| $75,000 to $99,999 | 609 (11.9%) | 154 (9.6%) |
| $100,000 to $149,999 | 880 (17.3%) | 106 (6.6%) |
| $150,000 or more | 794 (15.6%) | 39 (2.4%) |
| Total | 5,097 (100.0%) | 1,604 (100.0%) |
Monthly Housing Cost Tiers in Freestone County
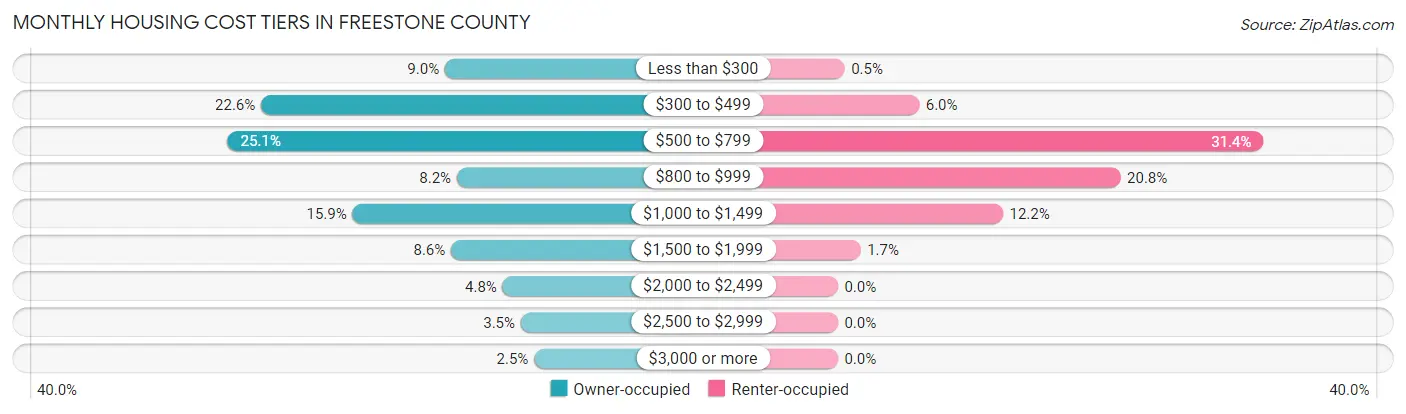
| Monthly Cost | Owner-occupied | Renter-occupied |
| Less than $300 | 461 (9.0%) | 8 (0.5%) |
| $300 to $499 | 1,151 (22.6%) | 96 (6.0%) |
| $500 to $799 | 1,277 (25.1%) | 503 (31.4%) |
| $800 to $999 | 416 (8.2%) | 334 (20.8%) |
| $1,000 to $1,499 | 808 (15.9%) | 195 (12.2%) |
| $1,500 to $1,999 | 438 (8.6%) | 27 (1.7%) |
| $2,000 to $2,499 | 244 (4.8%) | 0 (0.0%) |
| $2,500 to $2,999 | 176 (3.5%) | 0 (0.0%) |
| $3,000 or more | 126 (2.5%) | 0 (0.0%) |
| Total | 5,097 (100.0%) | 1,604 (100.0%) |
Physical Housing Characteristics in Freestone County
Housing Structures in Freestone County
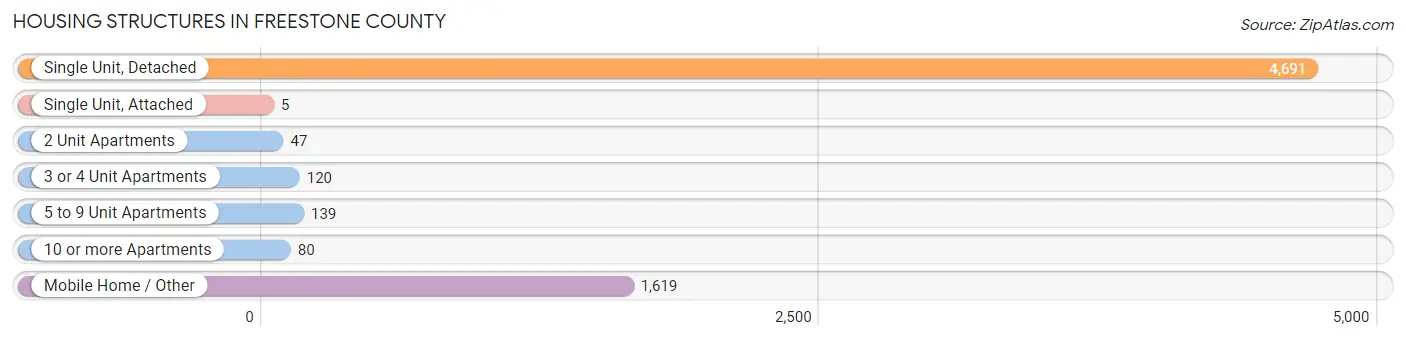
| Structure Type | # Housing Units | % Housing Units |
| Single Unit, Detached | 4,691 | 70.0% |
| Single Unit, Attached | 5 | 0.1% |
| 2 Unit Apartments | 47 | 0.7% |
| 3 or 4 Unit Apartments | 120 | 1.8% |
| 5 to 9 Unit Apartments | 139 | 2.1% |
| 10 or more Apartments | 80 | 1.2% |
| Mobile Home / Other | 1,619 | 24.2% |
| Total | 6,701 | 100.0% |
Housing Structures by Occupancy in Freestone County
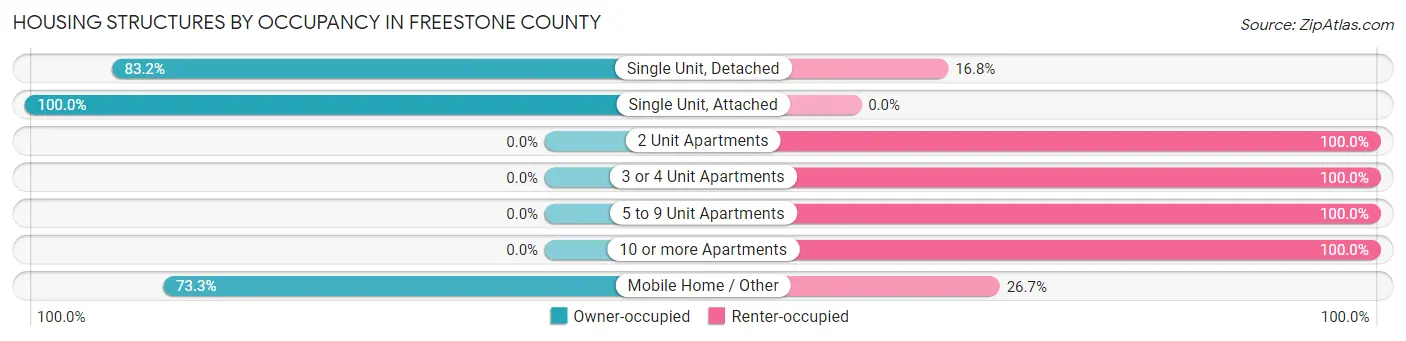
| Structure Type | Owner-occupied | Renter-occupied |
| Single Unit, Detached | 3,905 (83.2%) | 786 (16.8%) |
| Single Unit, Attached | 5 (100.0%) | 0 (0.0%) |
| 2 Unit Apartments | 0 (0.0%) | 47 (100.0%) |
| 3 or 4 Unit Apartments | 0 (0.0%) | 120 (100.0%) |
| 5 to 9 Unit Apartments | 0 (0.0%) | 139 (100.0%) |
| 10 or more Apartments | 0 (0.0%) | 80 (100.0%) |
| Mobile Home / Other | 1,187 (73.3%) | 432 (26.7%) |
| Total | 5,097 (76.1%) | 1,604 (23.9%) |
Housing Structures by Number of Rooms in Freestone County
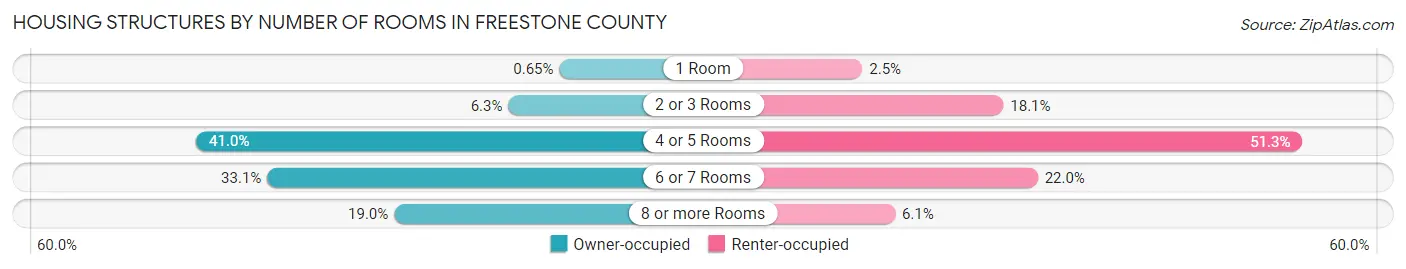
| Number of Rooms | Owner-occupied | Renter-occupied |
| 1 Room | 33 (0.6%) | 40 (2.5%) |
| 2 or 3 Rooms | 322 (6.3%) | 291 (18.1%) |
| 4 or 5 Rooms | 2,088 (41.0%) | 823 (51.3%) |
| 6 or 7 Rooms | 1,686 (33.1%) | 352 (22.0%) |
| 8 or more Rooms | 968 (19.0%) | 98 (6.1%) |
| Total | 5,097 (100.0%) | 1,604 (100.0%) |
Housing Structure by Heating Type in Freestone County
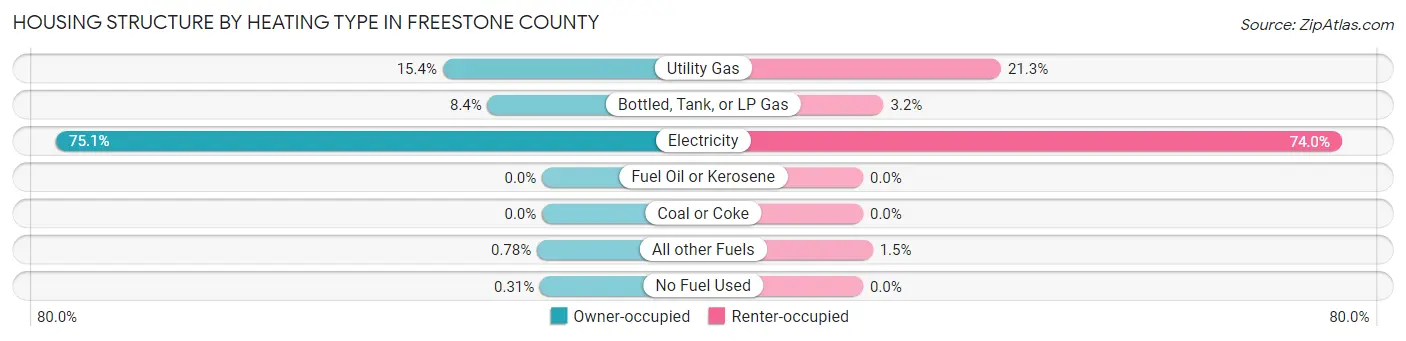
| Heating Type | Owner-occupied | Renter-occupied |
| Utility Gas | 783 (15.4%) | 342 (21.3%) |
| Bottled, Tank, or LP Gas | 429 (8.4%) | 51 (3.2%) |
| Electricity | 3,829 (75.1%) | 1,187 (74.0%) |
| Fuel Oil or Kerosene | 0 (0.0%) | 0 (0.0%) |
| Coal or Coke | 0 (0.0%) | 0 (0.0%) |
| All other Fuels | 40 (0.8%) | 24 (1.5%) |
| No Fuel Used | 16 (0.3%) | 0 (0.0%) |
| Total | 5,097 (100.0%) | 1,604 (100.0%) |
Household Vehicle Usage in Freestone County
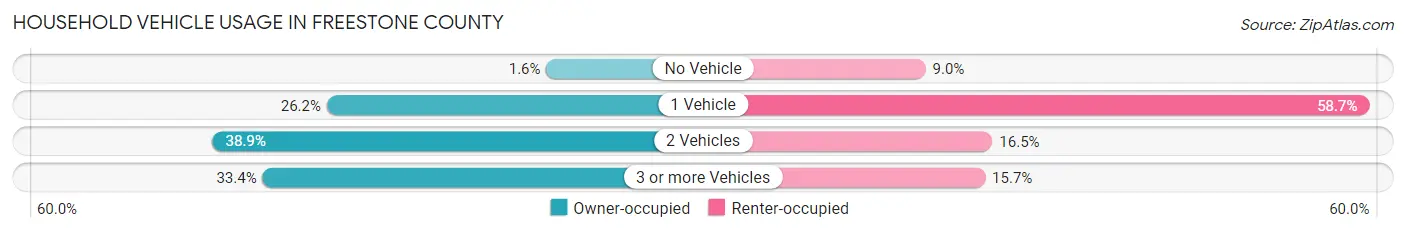
| Vehicles per Household | Owner-occupied | Renter-occupied |
| No Vehicle | 79 (1.5%) | 145 (9.0%) |
| 1 Vehicle | 1,333 (26.2%) | 942 (58.7%) |
| 2 Vehicles | 1,985 (38.9%) | 265 (16.5%) |
| 3 or more Vehicles | 1,700 (33.4%) | 252 (15.7%) |
| Total | 5,097 (100.0%) | 1,604 (100.0%) |
Real Estate & Mortgages in Freestone County
Real Estate and Mortgage Overview in Freestone County
| Characteristic | Without Mortgage | With Mortgage |
| Housing Units | 3,088 | 2,009 |
| Median Property Value | $153,700 | $157,200 |
| Median Household Income | $57,778 | $439 |
| Monthly Housing Costs | $493 | $97 |
| Real Estate Taxes | $1,316 | $64 |
Property Value by Mortgage Status in Freestone County
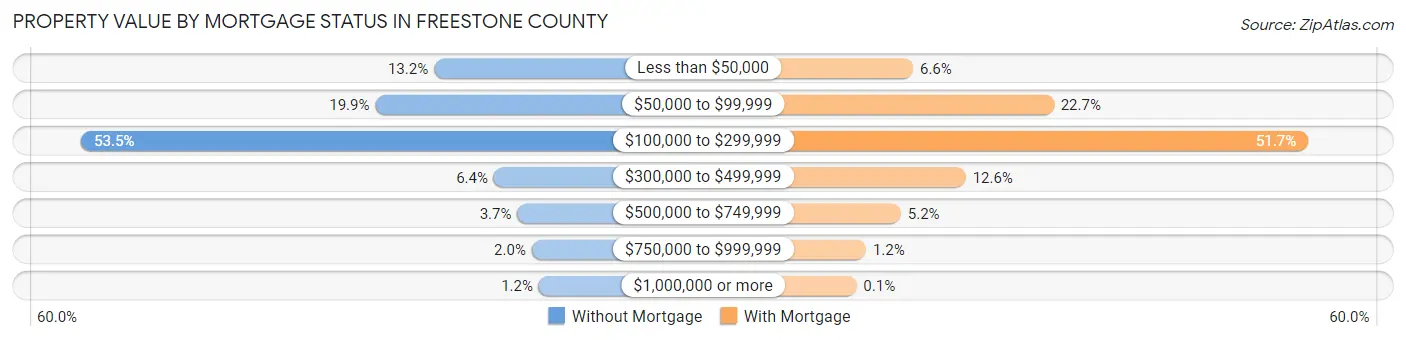
| Property Value | Without Mortgage | With Mortgage |
| Less than $50,000 | 408 (13.2%) | 132 (6.6%) |
| $50,000 to $99,999 | 615 (19.9%) | 455 (22.7%) |
| $100,000 to $299,999 | 1,653 (53.5%) | 1,039 (51.7%) |
| $300,000 to $499,999 | 197 (6.4%) | 253 (12.6%) |
| $500,000 to $749,999 | 114 (3.7%) | 104 (5.2%) |
| $750,000 to $999,999 | 63 (2.0%) | 24 (1.2%) |
| $1,000,000 or more | 38 (1.2%) | 2 (0.1%) |
| Total | 3,088 (100.0%) | 2,009 (100.0%) |
Household Income by Mortgage Status in Freestone County
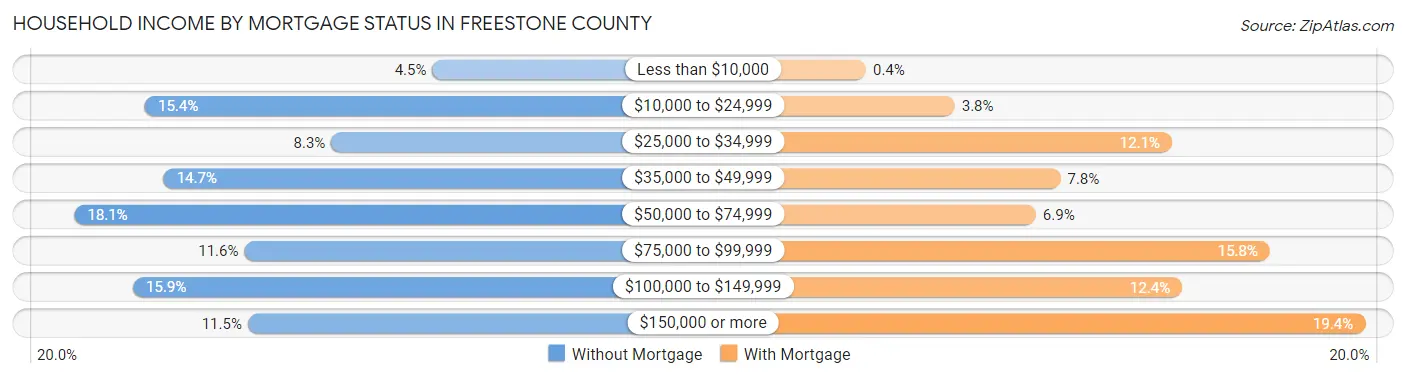
| Household Income | Without Mortgage | With Mortgage |
| Less than $10,000 | 138 (4.5%) | 8 (0.4%) |
| $10,000 to $24,999 | 476 (15.4%) | 76 (3.8%) |
| $25,000 to $34,999 | 257 (8.3%) | 242 (12.0%) |
| $35,000 to $49,999 | 454 (14.7%) | 157 (7.8%) |
| $50,000 to $74,999 | 559 (18.1%) | 138 (6.9%) |
| $75,000 to $99,999 | 359 (11.6%) | 317 (15.8%) |
| $100,000 to $149,999 | 490 (15.9%) | 250 (12.4%) |
| $150,000 or more | 355 (11.5%) | 390 (19.4%) |
| Total | 3,088 (100.0%) | 2,009 (100.0%) |
Property Value to Household Income Ratio in Freestone County
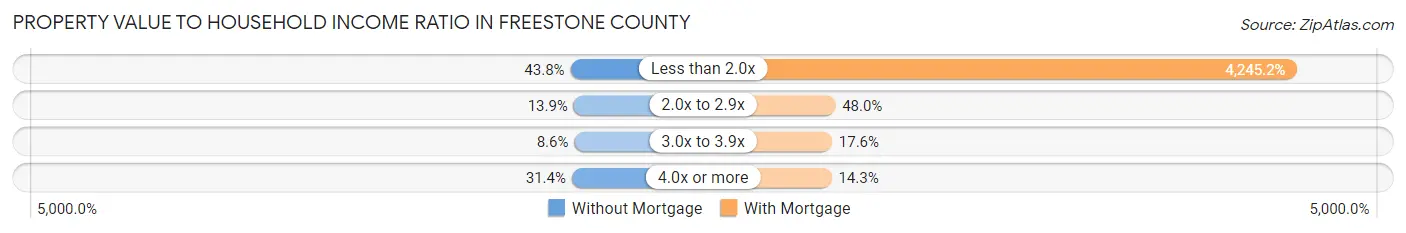
| Value-to-Income Ratio | Without Mortgage | With Mortgage |
| Less than 2.0x | 1,353 (43.8%) | 85,285 (4,245.2%) |
| 2.0x to 2.9x | 429 (13.9%) | 964 (48.0%) |
| 3.0x to 3.9x | 265 (8.6%) | 353 (17.6%) |
| 4.0x or more | 969 (31.4%) | 288 (14.3%) |
| Total | 3,088 (100.0%) | 2,009 (100.0%) |
Real Estate Taxes by Mortgage Status in Freestone County
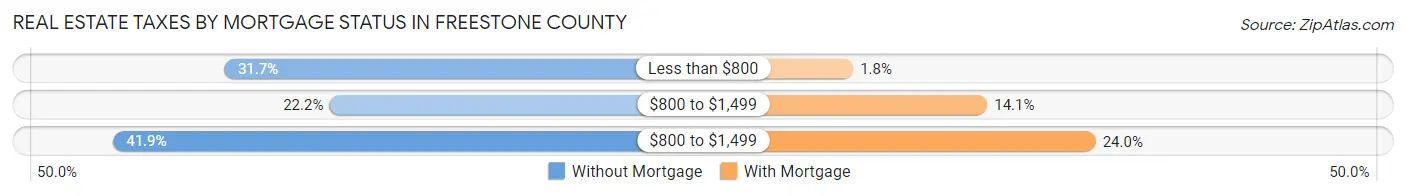
| Property Taxes | Without Mortgage | With Mortgage |
| Less than $800 | 979 (31.7%) | 37 (1.8%) |
| $800 to $1,499 | 685 (22.2%) | 283 (14.1%) |
| $800 to $1,499 | 1,294 (41.9%) | 482 (24.0%) |
| Total | 3,088 (100.0%) | 2,009 (100.0%) |
Health & Disability in Freestone County
Health Insurance Coverage by Age in Freestone County
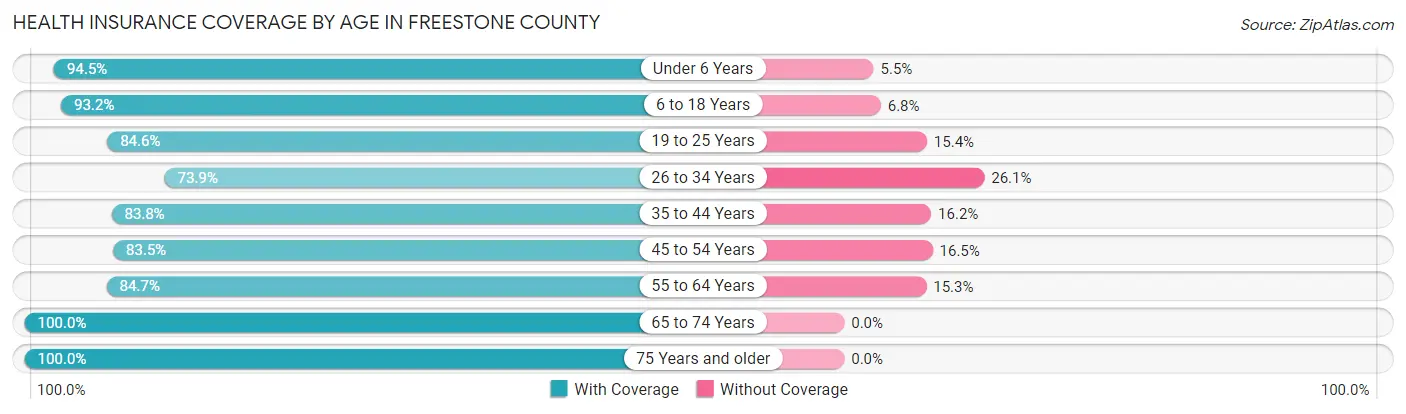
| Age Bracket | With Coverage | Without Coverage |
| Under 6 Years | 1,175 (94.5%) | 68 (5.5%) |
| 6 to 18 Years | 3,121 (93.2%) | 228 (6.8%) |
| 19 to 25 Years | 1,120 (84.6%) | 204 (15.4%) |
| 26 to 34 Years | 1,429 (73.9%) | 505 (26.1%) |
| 35 to 44 Years | 1,893 (83.8%) | 366 (16.2%) |
| 45 to 54 Years | 1,694 (83.5%) | 334 (16.5%) |
| 55 to 64 Years | 1,994 (84.7%) | 360 (15.3%) |
| 65 to 74 Years | 2,084 (100.0%) | 0 (0.0%) |
| 75 Years and older | 1,612 (100.0%) | 0 (0.0%) |
| Total | 16,122 (88.6%) | 2,065 (11.4%) |
Health Insurance Coverage by Citizenship Status in Freestone County
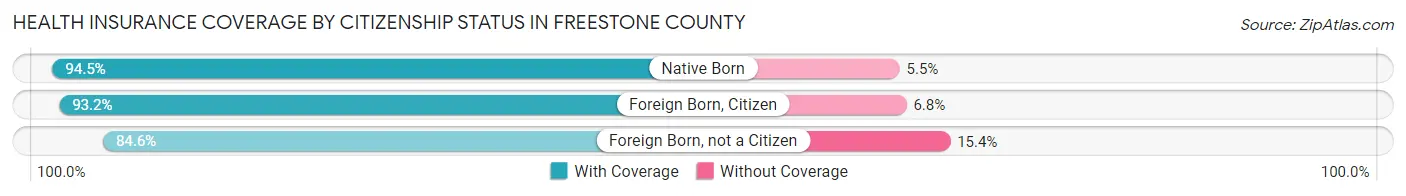
| Citizenship Status | With Coverage | Without Coverage |
| Native Born | 1,175 (94.5%) | 68 (5.5%) |
| Foreign Born, Citizen | 3,121 (93.2%) | 228 (6.8%) |
| Foreign Born, not a Citizen | 1,120 (84.6%) | 204 (15.4%) |
Health Insurance Coverage by Household Income in Freestone County
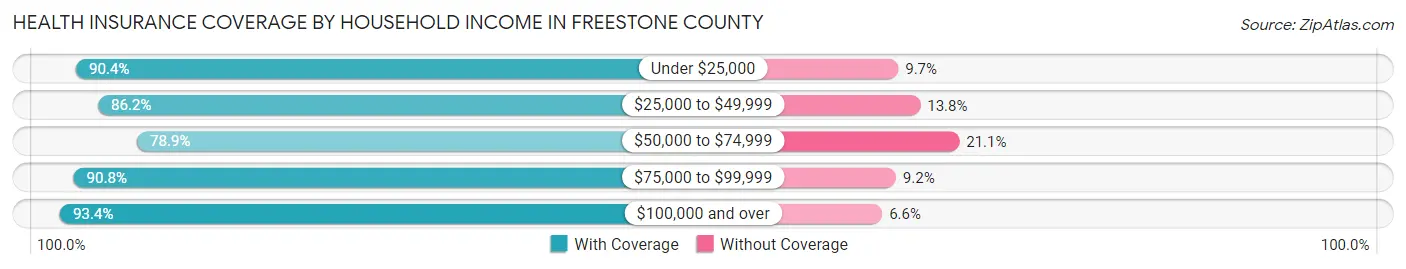
| Household Income | With Coverage | Without Coverage |
| Under $25,000 | 2,322 (90.3%) | 248 (9.7%) |
| $25,000 to $49,999 | 2,755 (86.2%) | 440 (13.8%) |
| $50,000 to $74,999 | 2,678 (78.9%) | 715 (21.1%) |
| $75,000 to $99,999 | 2,260 (90.8%) | 229 (9.2%) |
| $100,000 and over | 6,092 (93.4%) | 433 (6.6%) |
Public vs Private Health Insurance Coverage by Age in Freestone County
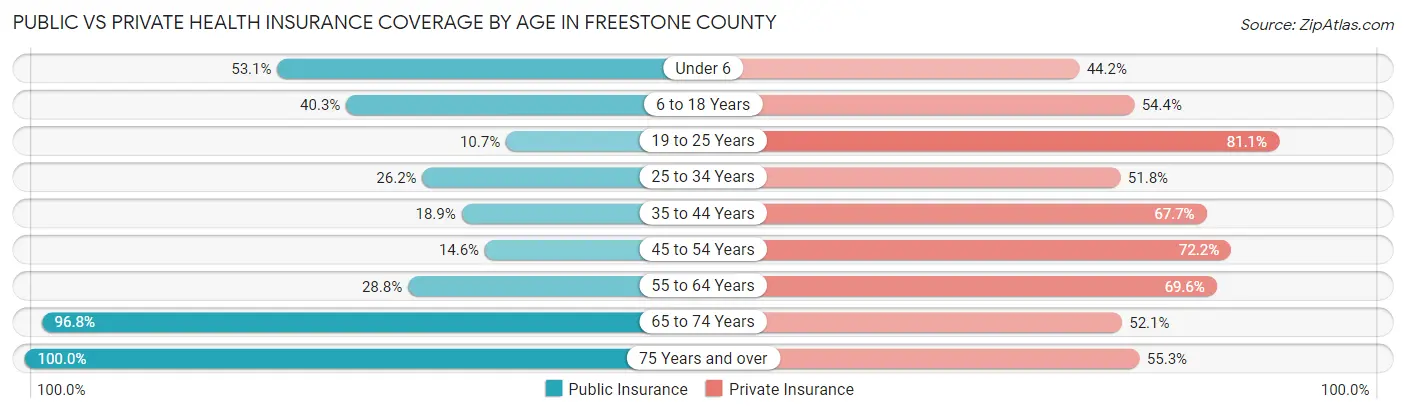
| Age Bracket | Public Insurance | Private Insurance |
| Under 6 | 660 (53.1%) | 549 (44.2%) |
| 6 to 18 Years | 1,350 (40.3%) | 1,821 (54.4%) |
| 19 to 25 Years | 141 (10.6%) | 1,074 (81.1%) |
| 25 to 34 Years | 506 (26.2%) | 1,002 (51.8%) |
| 35 to 44 Years | 427 (18.9%) | 1,529 (67.7%) |
| 45 to 54 Years | 295 (14.5%) | 1,465 (72.2%) |
| 55 to 64 Years | 679 (28.8%) | 1,638 (69.6%) |
| 65 to 74 Years | 2,018 (96.8%) | 1,085 (52.1%) |
| 75 Years and over | 1,612 (100.0%) | 892 (55.3%) |
| Total | 7,688 (42.3%) | 11,055 (60.8%) |
Disability Status by Sex by Age in Freestone County
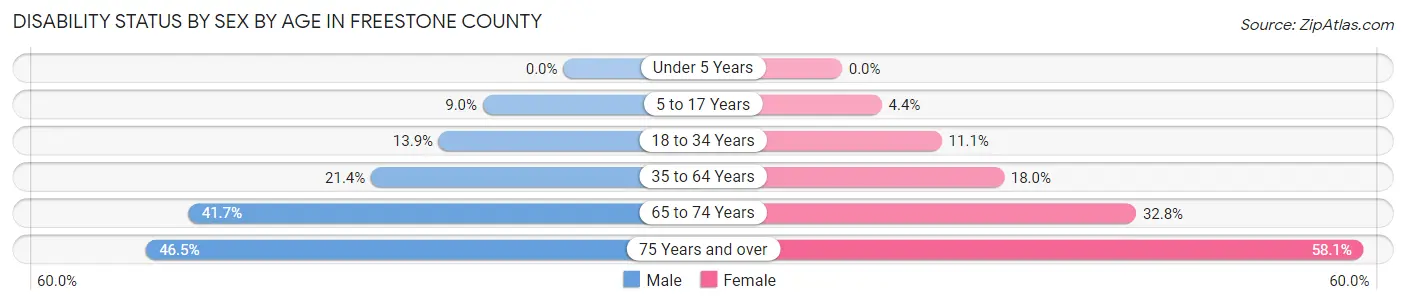
| Age Bracket | Male | Female |
| Under 5 Years | 0 (0.0%) | 0 (0.0%) |
| 5 to 17 Years | 158 (9.0%) | 71 (4.4%) |
| 18 to 34 Years | 239 (13.9%) | 192 (11.1%) |
| 35 to 64 Years | 711 (21.4%) | 599 (18.0%) |
| 65 to 74 Years | 430 (41.7%) | 345 (32.8%) |
| 75 Years and over | 314 (46.5%) | 544 (58.1%) |
Disability Class by Sex by Age in Freestone County
Disability Class: Hearing Difficulty
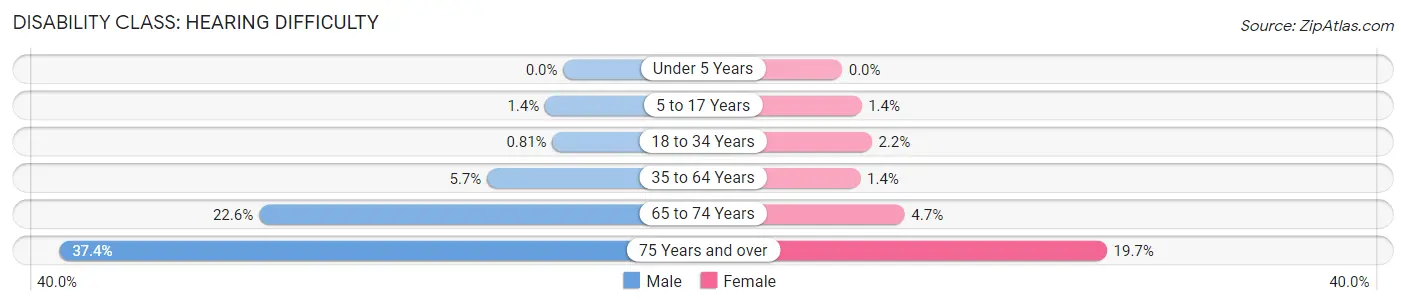
| Age Bracket | Male | Female |
| Under 5 Years | 0 (0.0%) | 0 (0.0%) |
| 5 to 17 Years | 24 (1.4%) | 23 (1.4%) |
| 18 to 34 Years | 14 (0.8%) | 38 (2.2%) |
| 35 to 64 Years | 188 (5.7%) | 45 (1.4%) |
| 65 to 74 Years | 233 (22.6%) | 49 (4.6%) |
| 75 Years and over | 253 (37.4%) | 184 (19.7%) |
Disability Class: Vision Difficulty
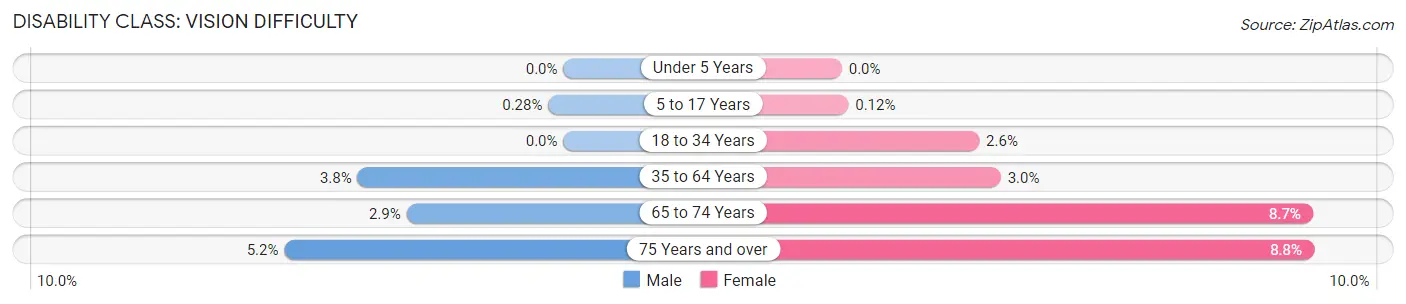
| Age Bracket | Male | Female |
| Under 5 Years | 0 (0.0%) | 0 (0.0%) |
| 5 to 17 Years | 5 (0.3%) | 2 (0.1%) |
| 18 to 34 Years | 0 (0.0%) | 44 (2.5%) |
| 35 to 64 Years | 127 (3.8%) | 98 (2.9%) |
| 65 to 74 Years | 30 (2.9%) | 92 (8.7%) |
| 75 Years and over | 35 (5.2%) | 82 (8.8%) |
Disability Class: Cognitive Difficulty
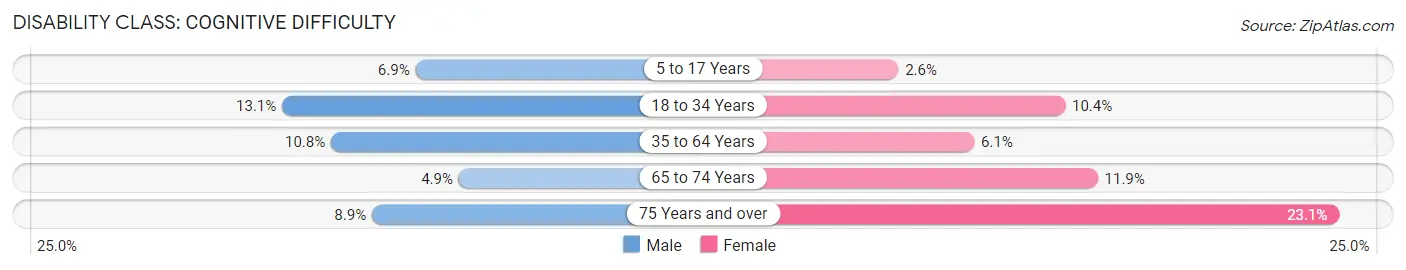
| Age Bracket | Male | Female |
| 5 to 17 Years | 121 (6.9%) | 42 (2.6%) |
| 18 to 34 Years | 225 (13.1%) | 179 (10.4%) |
| 35 to 64 Years | 358 (10.8%) | 204 (6.1%) |
| 65 to 74 Years | 50 (4.9%) | 125 (11.9%) |
| 75 Years and over | 60 (8.9%) | 216 (23.1%) |
Disability Class: Ambulatory Difficulty

| Age Bracket | Male | Female |
| 5 to 17 Years | 0 (0.0%) | 8 (0.5%) |
| 18 to 34 Years | 28 (1.6%) | 18 (1.0%) |
| 35 to 64 Years | 291 (8.8%) | 492 (14.8%) |
| 65 to 74 Years | 205 (19.9%) | 293 (27.8%) |
| 75 Years and over | 101 (14.9%) | 410 (43.8%) |
Disability Class: Self-Care Difficulty
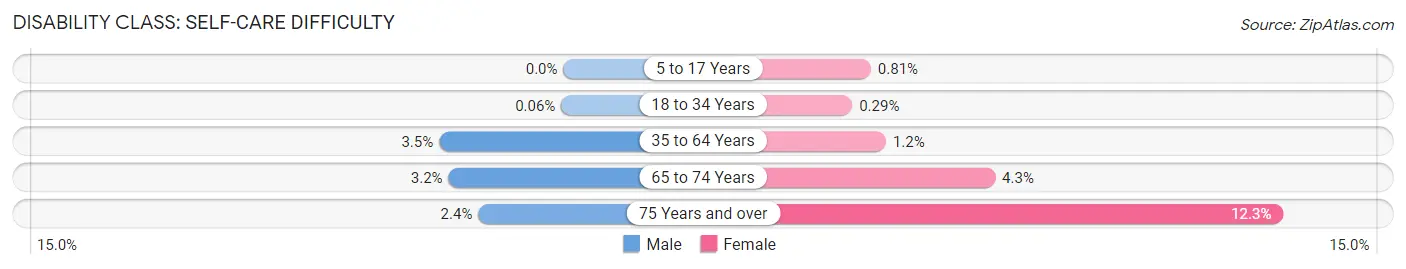
| Age Bracket | Male | Female |
| 5 to 17 Years | 0 (0.0%) | 13 (0.8%) |
| 18 to 34 Years | 1 (0.1%) | 5 (0.3%) |
| 35 to 64 Years | 115 (3.5%) | 41 (1.2%) |
| 65 to 74 Years | 33 (3.2%) | 45 (4.3%) |
| 75 Years and over | 16 (2.4%) | 115 (12.3%) |
Technology Access in Freestone County
Computing Device Access in Freestone County
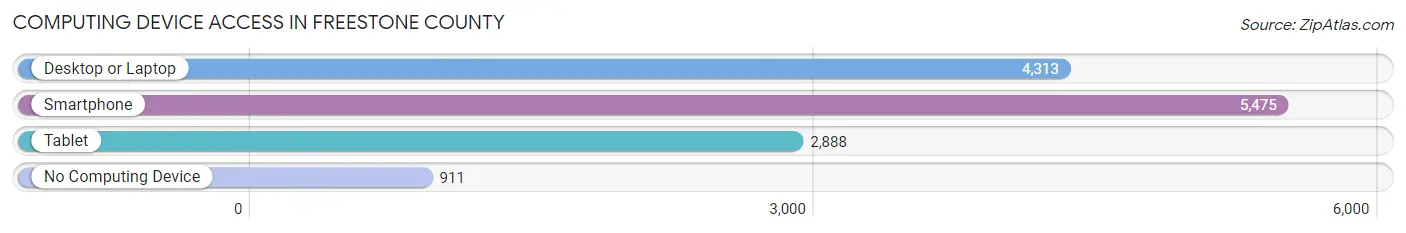
| Device Type | # Households | % Households |
| Desktop or Laptop | 4,313 | 64.4% |
| Smartphone | 5,475 | 81.7% |
| Tablet | 2,888 | 43.1% |
| No Computing Device | 911 | 13.6% |
| Total | 6,701 | 100.0% |
Internet Access in Freestone County
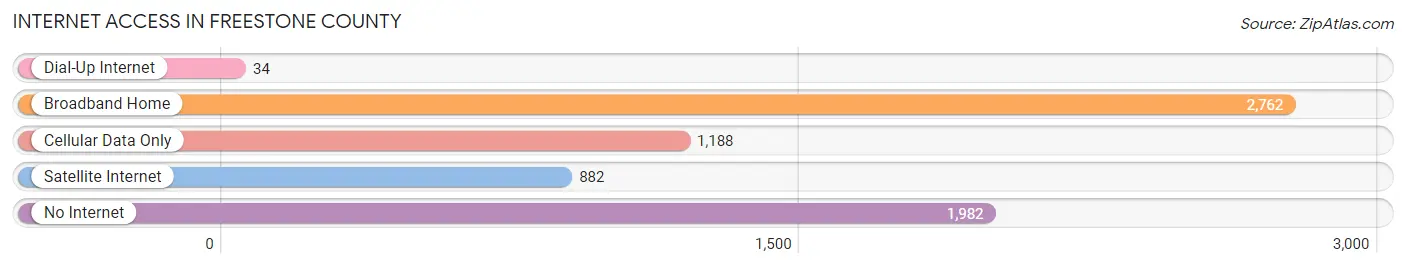
| Internet Type | # Households | % Households |
| Dial-Up Internet | 34 | 0.5% |
| Broadband Home | 2,762 | 41.2% |
| Cellular Data Only | 1,188 | 17.7% |
| Satellite Internet | 882 | 13.2% |
| No Internet | 1,982 | 29.6% |
| Total | 6,701 | 100.0% |
Freestone County Summary
Freestone County is located in the east-central part of Texas, and is part of the Central Texas region. It is bordered by Anderson County to the north, Leon County to the east, Limestone County to the south, and Navarro County to the west. The county seat is Fairfield, and the county has a total area of 890 square miles.
History
Freestone County was established in 1850 and was named for the abundance of limestone found in the area. The county was originally part of Robertson County, and was later divided into Freestone and Anderson counties. The first settlers in the area were primarily of German and Irish descent, and the county was largely agricultural.
In the late 19th century, the county experienced a population boom due to the discovery of oil and natural gas. This led to the development of several small towns, including Fairfield, which was established in 1873. The town quickly became the county seat and the center of commerce in the area.
Geography
Freestone County is located in the east-central part of Texas, and is part of the Central Texas region. It is bordered by Anderson County to the north, Leon County to the east, Limestone County to the south, and Navarro County to the west. The county has a total area of 890 square miles, and is mostly flat with rolling hills. The terrain is mostly covered in grasslands, with some areas of woodlands. The county is home to several creeks and rivers, including the Trinity River, which forms the western border of the county.
Economy
Freestone County has a diverse economy, with a mix of agriculture, manufacturing, and services. The county is home to several large employers, including the Freestone County Medical Center, the Freestone County Sheriff’s Office, and the Freestone County Courthouse.
Agriculture is the main economic driver in the county, with the majority of the land being used for farming and ranching. The county is home to several large farms, including the Freestone County Farm Bureau, which is the largest farm in the county. The county is also home to several large ranches, including the Freestone County Cattle Company.
Manufacturing is also an important part of the economy, with several large factories located in the county. The largest employer in the county is the Freestone County Manufacturing Company, which produces a variety of products, including furniture, clothing, and electronics.
Demographics
As of the 2010 census, Freestone County had a population of 19,816. The population is mostly white (83.3%), with a small percentage of African Americans (7.3%), Hispanics (7.2%), and Native Americans (1.2%). The median household income in the county is $41,945, and the median age is 38.
The county is home to several small towns, including Fairfield, which is the county seat. Other towns in the county include Teague, Streetman, and Wortham. The county is also home to several unincorporated communities, including Kirvin, Donie, and Oakwood.
Conclusion
Freestone County is a rural county located in the east-central part of Texas. The county has a diverse economy, with a mix of agriculture, manufacturing, and services. The population is mostly white, with a small percentage of African Americans, Hispanics, and Native Americans. The county is home to several small towns, including Fairfield, which is the county seat. Freestone County is a great place to live and work, and offers a variety of opportunities for those looking to make a home in the area.
Common Questions
What is Per Capita Income in Freestone County?
Per Capita income in Freestone County is $28,201.
What is the Median Family Income in Freestone County?
Median Family Income in Freestone County is $80,034.
What is the Median Household income in Freestone County?
Median Household Income in Freestone County is $55,902.
What is Income or Wage Gap in Freestone County?
Income or Wage Gap in Freestone County is 32.9%.
Women in Freestone County earn 67.1 cents for every dollar earned by a man.
What is Family Income Deficit in Freestone County?
Family Income Deficit in Freestone County is $12,432.
Families that are below poverty line in Freestone County earn $12,432 less on average than the poverty threshold level.
What is Inequality or Gini Index in Freestone County?
Inequality or Gini Index in Freestone County is 0.45.
What is the Total Population of Freestone County?
Total Population of Freestone County is 19,599.
What is the Total Male Population of Freestone County?
Total Male Population of Freestone County is 10,221.
What is the Total Female Population of Freestone County?
Total Female Population of Freestone County is 9,378.
What is the Ratio of Males per 100 Females in Freestone County?
There are 108.99 Males per 100 Females in Freestone County.
What is the Ratio of Females per 100 Males in Freestone County?
There are 91.75 Females per 100 Males in Freestone County.
What is the Median Population Age in Freestone County?
Median Population Age in Freestone County is 41.8 Years.
What is the Average Family Size in Freestone County
Average Family Size in Freestone County is 3.5 People.
What is the Average Household Size in Freestone County
Average Household Size in Freestone County is 2.7 People.
How Large is the Labor Force in Freestone County?
There are 7,391 People in the Labor Forcein in Freestone County.
What is the Percentage of People in the Labor Force in Freestone County?
47.1% of People are in the Labor Force in Freestone County.
What is the Unemployment Rate in Freestone County?
Unemployment Rate in Freestone County is 3.5%.