Floyd County, TX Map & Demographics
Floyd County Map
Floyd County Overview
$28,755
PER CAPITA INCOME
$57,854
AVG FAMILY INCOME
$49,321
AVG HOUSEHOLD INCOME
31.8%
WAGE / INCOME GAP [ % ]
68.2¢/ $1
WAGE / INCOME GAP [ $ ]
0.54
INEQUALITY / GINI INDEX
5,386
TOTAL POPULATION
2,644
MALE POPULATION
2,742
FEMALE POPULATION
96.43
MALES / 100 FEMALES
103.71
FEMALES / 100 MALES
35.7
MEDIAN AGE
3.3
AVG FAMILY SIZE
2.8
AVG HOUSEHOLD SIZE
2,335
LABOR FORCE [ PEOPLE ]
57.5%
PERCENT IN LABOR FORCE
4.1%
UNEMPLOYMENT RATE
Floyd County Area Codes
Income in Floyd County
Income Overview in Floyd County
Per Capita Income in Floyd County is $28,755, while median incomes of families and households are $57,854 and $49,321 respectively.
| Characteristic | Number | Measure |
| Per Capita Income | 5,386 | $28,755 |
| Median Family Income | 1,391 | $57,854 |
| Mean Family Income | 1,391 | $86,285 |
| Median Household Income | 1,938 | $49,321 |
| Mean Household Income | 1,938 | $75,402 |
| Income Deficit | 1,391 | $0 |
| Wage / Income Gap (%) | 5,386 | 31.77% |
| Wage / Income Gap ($) | 5,386 | 68.23¢ per $1 |
| Gini / Inequality Index | 5,386 | 0.54 |
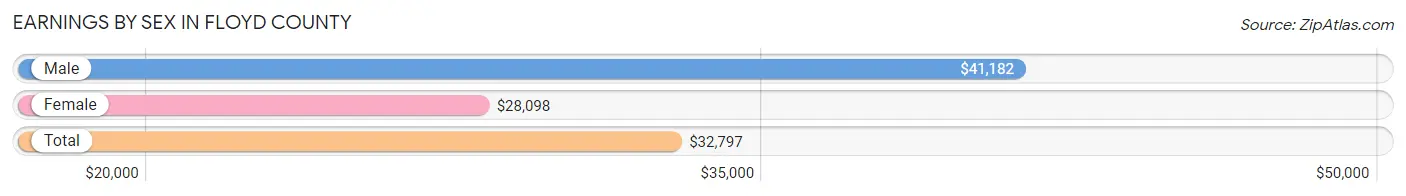
Earnings by Sex in Floyd County
Average Earnings in Floyd County are $32,797, $41,182 for men and $28,098 for women, a difference of 31.8%.
| Sex | Number | Average Earnings |
| Male | 1,195 (50.4%) | $41,182 |
| Female | 1,175 (49.6%) | $28,098 |
| Total | 2,370 (100.0%) | $32,797 |
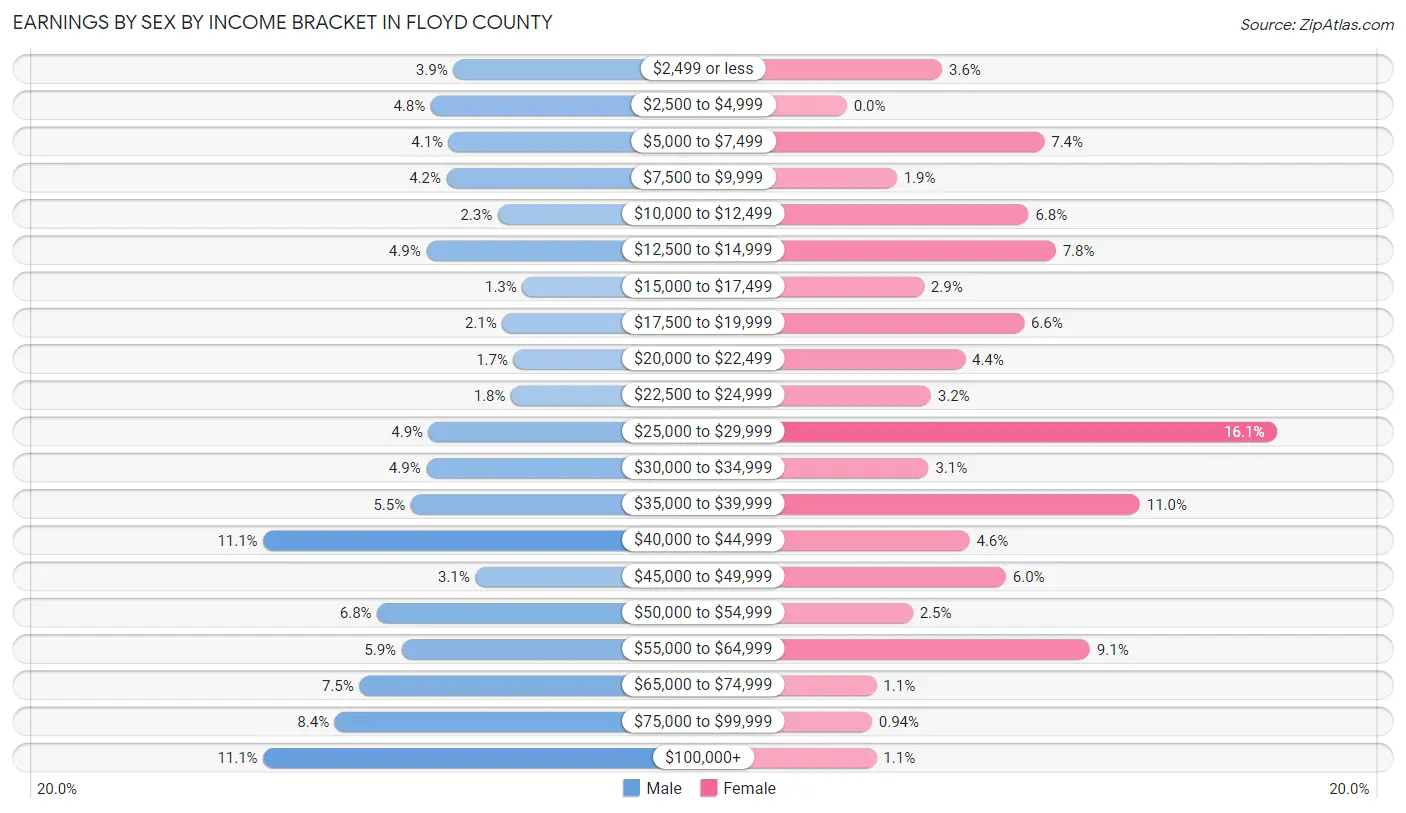
Earnings by Sex by Income Bracket in Floyd County
The most common earnings brackets in Floyd County are $40,000 to $44,999 for men (132 | 11.1%) and $25,000 to $29,999 for women (189 | 16.1%).
| Income | Male | Female |
| $2,499 or less | 47 (3.9%) | 42 (3.6%) |
| $2,500 to $4,999 | 57 (4.8%) | 0 (0.0%) |
| $5,000 to $7,499 | 49 (4.1%) | 87 (7.4%) |
| $7,500 to $9,999 | 50 (4.2%) | 22 (1.9%) |
| $10,000 to $12,499 | 27 (2.3%) | 80 (6.8%) |
| $12,500 to $14,999 | 59 (4.9%) | 92 (7.8%) |
| $15,000 to $17,499 | 16 (1.3%) | 34 (2.9%) |
| $17,500 to $19,999 | 25 (2.1%) | 78 (6.6%) |
| $20,000 to $22,499 | 20 (1.7%) | 52 (4.4%) |
| $22,500 to $24,999 | 21 (1.8%) | 37 (3.2%) |
| $25,000 to $29,999 | 58 (4.9%) | 189 (16.1%) |
| $30,000 to $34,999 | 59 (4.9%) | 36 (3.1%) |
| $35,000 to $39,999 | 66 (5.5%) | 129 (11.0%) |
| $40,000 to $44,999 | 132 (11.1%) | 54 (4.6%) |
| $45,000 to $49,999 | 37 (3.1%) | 70 (6.0%) |
| $50,000 to $54,999 | 81 (6.8%) | 29 (2.5%) |
| $55,000 to $64,999 | 70 (5.9%) | 107 (9.1%) |
| $65,000 to $74,999 | 89 (7.4%) | 13 (1.1%) |
| $75,000 to $99,999 | 100 (8.4%) | 11 (0.9%) |
| $100,000+ | 132 (11.1%) | 13 (1.1%) |
| Total | 1,195 (100.0%) | 1,175 (100.0%) |
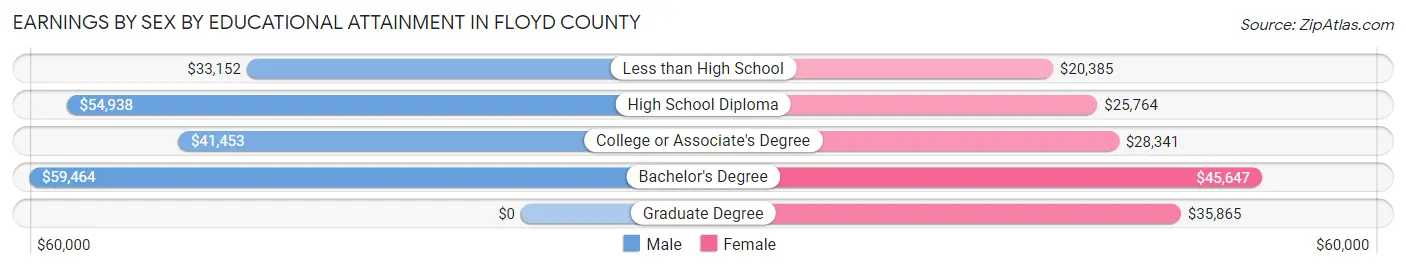
Earnings by Sex by Educational Attainment in Floyd County
Average earnings in Floyd County are $43,844 for men and $28,783 for women, a difference of 34.4%. Men with an educational attainment of bachelor's degree enjoy the highest average annual earnings of $59,464, while those with less than high school education earn the least with $33,152. Women with an educational attainment of bachelor's degree earn the most with the average annual earnings of $45,647, while those with less than high school education have the smallest earnings of $20,385.
| Educational Attainment | Male Income | Female Income |
| Less than High School | $33,152 | $20,385 |
| High School Diploma | $54,938 | $25,764 |
| College or Associate's Degree | $41,453 | $28,341 |
| Bachelor's Degree | $59,464 | $45,647 |
| Graduate Degree | - | - |
| Total | $43,844 | $28,783 |
Family Income in Floyd County
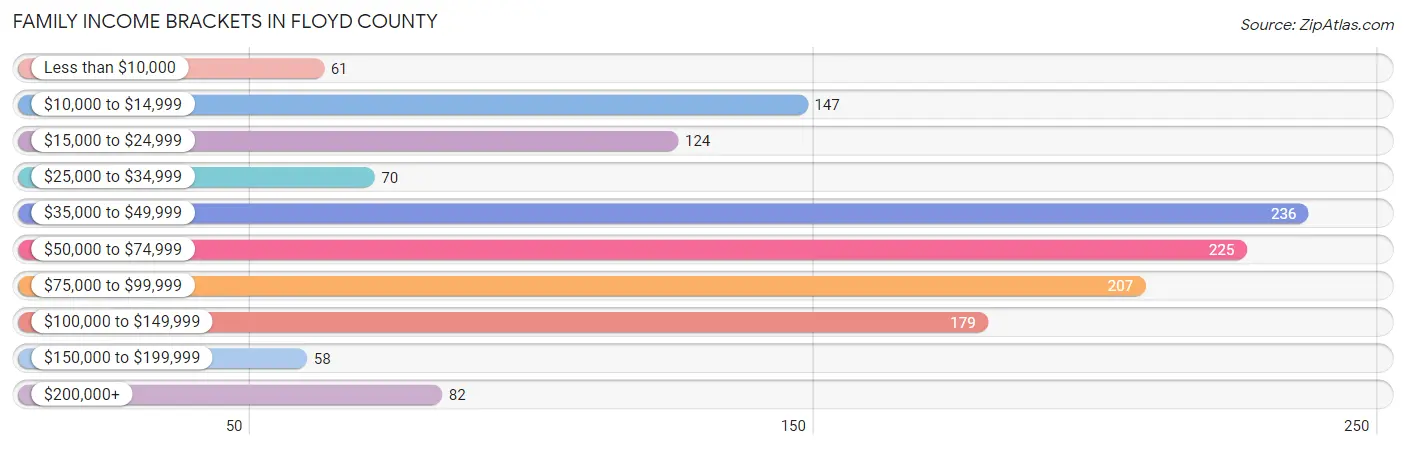
Family Income Brackets in Floyd County
According to the Floyd County family income data, there are 236 families falling into the $35,000 to $49,999 income range, which is the most common income bracket and makes up 17.0% of all families. Conversely, the $150,000 to $199,999 income bracket is the least frequent group with only 58 families (4.2%) belonging to this category.
| Income Bracket | # Families | % Families |
| Less than $10,000 | 61 | 4.4% |
| $10,000 to $14,999 | 147 | 10.6% |
| $15,000 to $24,999 | 124 | 8.9% |
| $25,000 to $34,999 | 70 | 5.0% |
| $35,000 to $49,999 | 236 | 17.0% |
| $50,000 to $74,999 | 225 | 16.2% |
| $75,000 to $99,999 | 207 | 14.9% |
| $100,000 to $149,999 | 179 | 12.9% |
| $150,000 to $199,999 | 58 | 4.2% |
| $200,000+ | 82 | 5.9% |
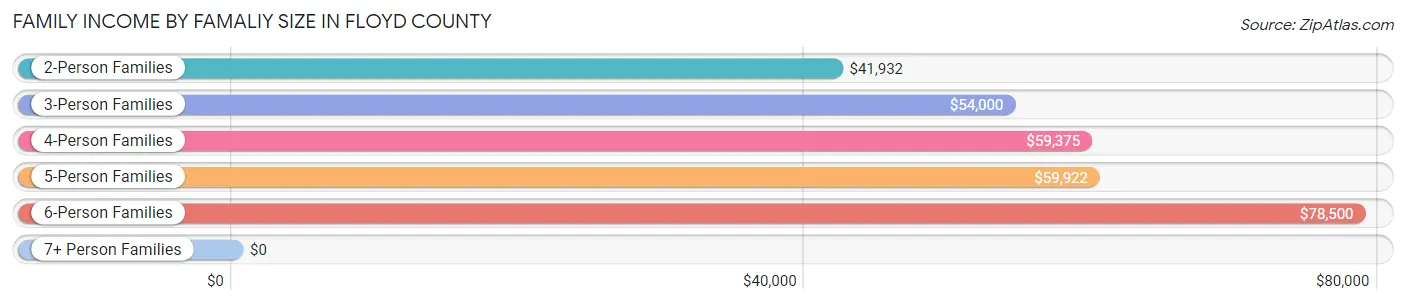
Family Income by Famaliy Size in Floyd County
6-person families (42 | 3.0%) account for the highest median family income in Floyd County with $78,500 per family, while 2-person families (664 | 47.7%) have the highest median income of $20,966 per family member.
| Income Bracket | # Families | Median Income |
| 2-Person Families | 664 (47.7%) | $41,932 |
| 3-Person Families | 320 (23.0%) | $54,000 |
| 4-Person Families | 200 (14.4%) | $59,375 |
| 5-Person Families | 147 (10.6%) | $59,922 |
| 6-Person Families | 42 (3.0%) | $78,500 |
| 7+ Person Families | 18 (1.3%) | $0 |
| Total | 1,391 (100.0%) | $57,854 |
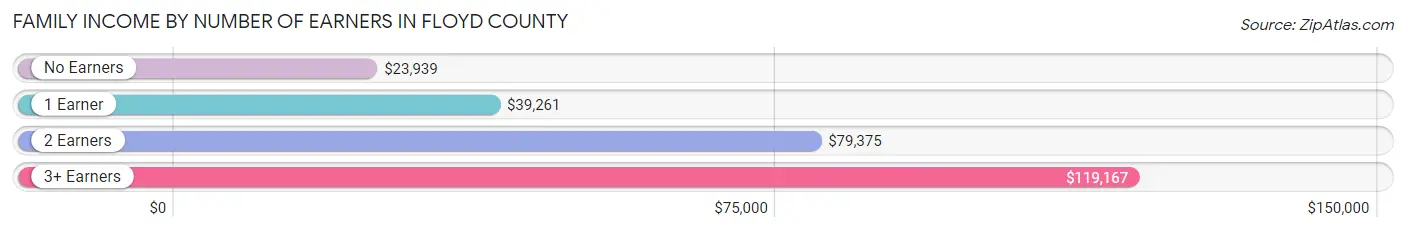
Family Income by Number of Earners in Floyd County
The median family income in Floyd County is $57,854, with families comprising 3+ earners (52) having the highest median family income of $119,167, while families with no earners (236) have the lowest median family income of $23,939, accounting for 3.7% and 17.0% of families, respectively.
| Number of Earners | # Families | Median Income |
| No Earners | 236 (17.0%) | $23,939 |
| 1 Earner | 553 (39.8%) | $39,261 |
| 2 Earners | 550 (39.5%) | $79,375 |
| 3+ Earners | 52 (3.7%) | $119,167 |
| Total | 1,391 (100.0%) | $57,854 |
Household Income in Floyd County
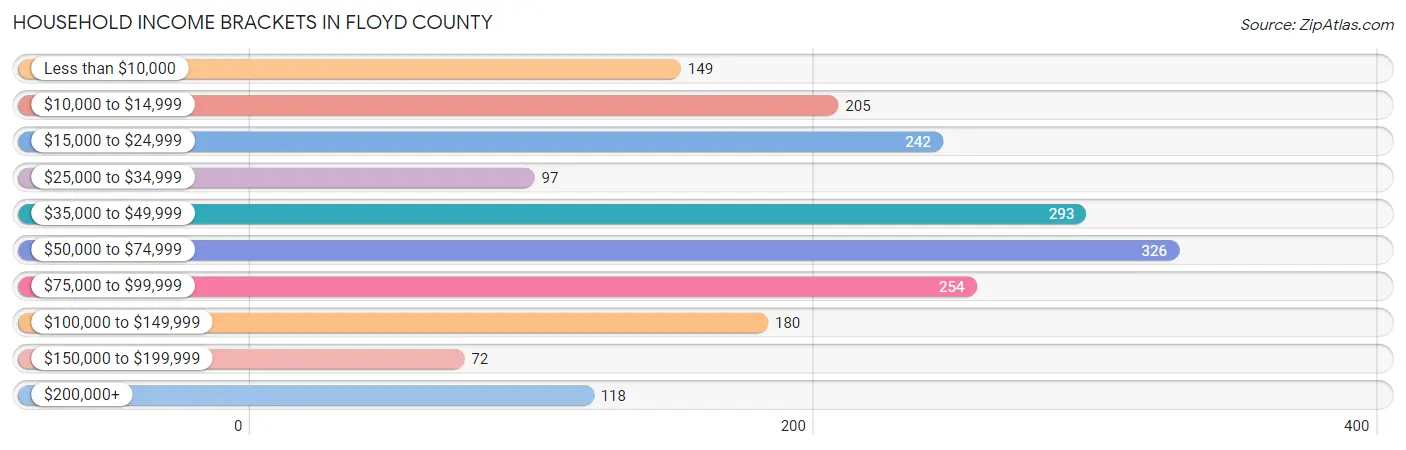
Household Income Brackets in Floyd County
With 326 households falling in the category, the $50,000 to $74,999 income range is the most frequent in Floyd County, accounting for 16.8% of all households. In contrast, only 72 households (3.7%) fall into the $150,000 to $199,999 income bracket, making it the least populous group.
| Income Bracket | # Households | % Households |
| Less than $10,000 | 149 | 7.7% |
| $10,000 to $14,999 | 205 | 10.6% |
| $15,000 to $24,999 | 242 | 12.5% |
| $25,000 to $34,999 | 97 | 5.0% |
| $35,000 to $49,999 | 293 | 15.1% |
| $50,000 to $74,999 | 326 | 16.8% |
| $75,000 to $99,999 | 254 | 13.1% |
| $100,000 to $149,999 | 180 | 9.3% |
| $150,000 to $199,999 | 72 | 3.7% |
| $200,000+ | 118 | 6.1% |
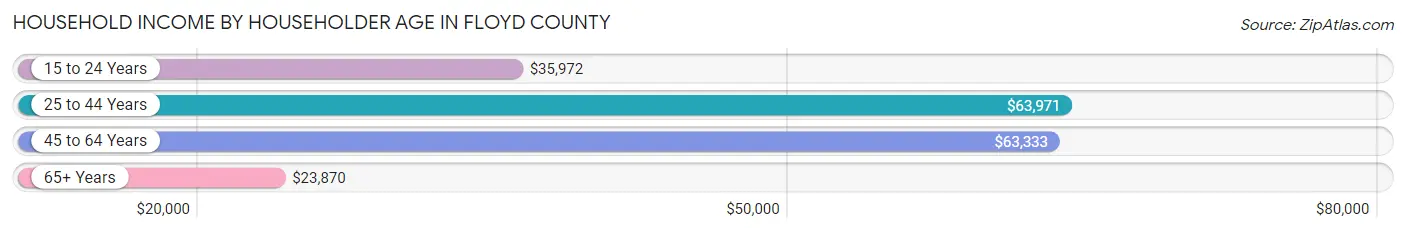
Household Income by Householder Age in Floyd County
The median household income in Floyd County is $49,321, with the highest median household income of $63,971 found in the 25 to 44 years age bracket for the primary householder. A total of 616 households (31.8%) fall into this category. Meanwhile, the 65+ years age bracket for the primary householder has the lowest median household income of $23,870, with 651 households (33.6%) in this group.
| Income Bracket | # Households | Median Income |
| 15 to 24 Years | 115 (5.9%) | $35,972 |
| 25 to 44 Years | 616 (31.8%) | $63,971 |
| 45 to 64 Years | 556 (28.7%) | $63,333 |
| 65+ Years | 651 (33.6%) | $23,870 |
| Total | 1,938 (100.0%) | $49,321 |
Poverty in Floyd County
Income Below Poverty by Sex and Age in Floyd County
With 16.2% poverty level for males and 21.8% for females among the residents of Floyd County, 18 to 24 year old males and under 5 year old females are the most vulnerable to poverty, with 112 males (54.1%) and 104 females (55.6%) in their respective age groups living below the poverty level.
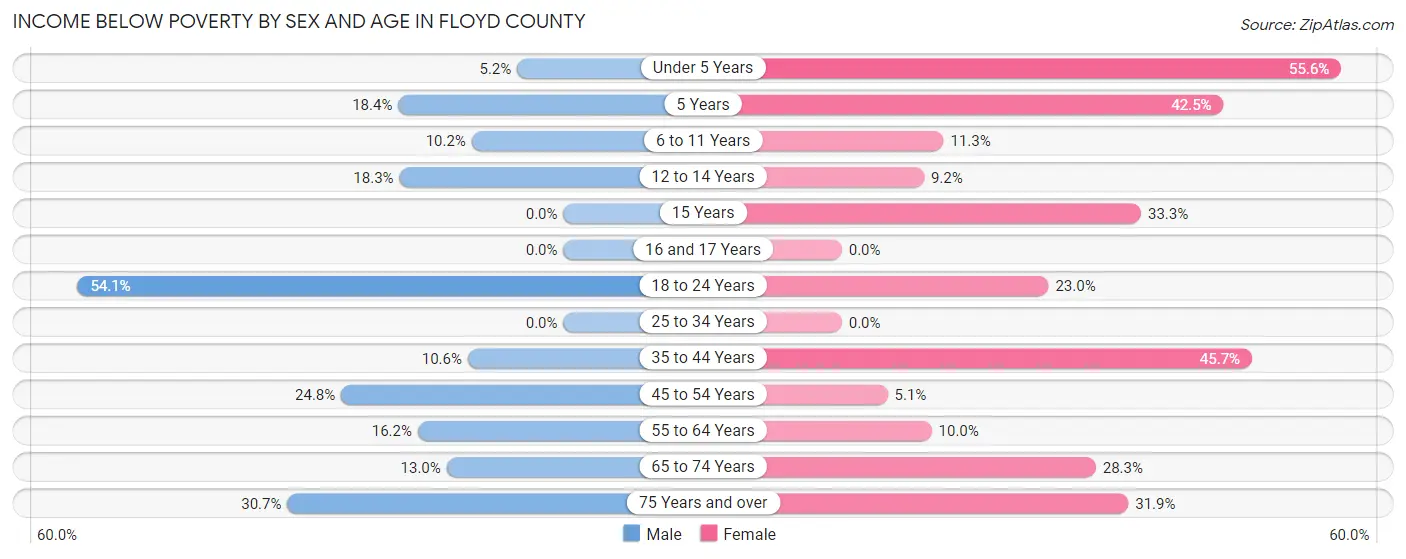
| Age Bracket | Male | Female |
| Under 5 Years | 7 (5.1%) | 104 (55.6%) |
| 5 Years | 16 (18.4%) | 17 (42.5%) |
| 6 to 11 Years | 24 (10.2%) | 23 (11.3%) |
| 12 to 14 Years | 21 (18.3%) | 13 (9.1%) |
| 15 Years | 0 (0.0%) | 35 (33.3%) |
| 16 and 17 Years | 0 (0.0%) | 0 (0.0%) |
| 18 to 24 Years | 112 (54.1%) | 64 (23.0%) |
| 25 to 34 Years | 0 (0.0%) | 0 (0.0%) |
| 35 to 44 Years | 38 (10.6%) | 137 (45.7%) |
| 45 to 54 Years | 50 (24.7%) | 13 (5.1%) |
| 55 to 64 Years | 53 (16.2%) | 33 (10.0%) |
| 65 to 74 Years | 26 (13.0%) | 73 (28.3%) |
| 75 Years and over | 75 (30.7%) | 82 (31.9%) |
| Total | 422 (16.2%) | 594 (21.8%) |
Income Above Poverty by Sex and Age in Floyd County
According to the poverty statistics in Floyd County, males aged 15 years and females aged 16 and 17 years are the age groups that are most secure financially, with 100.0% of males and 100.0% of females in these age groups living above the poverty line.
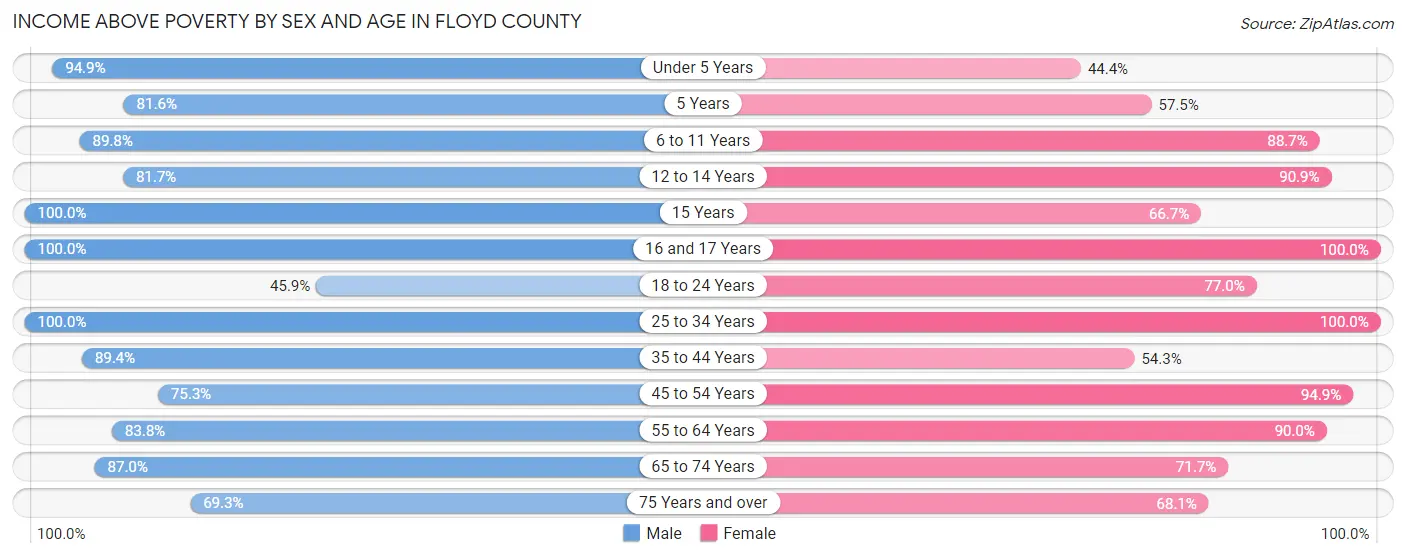
| Age Bracket | Male | Female |
| Under 5 Years | 129 (94.9%) | 83 (44.4%) |
| 5 Years | 71 (81.6%) | 23 (57.5%) |
| 6 to 11 Years | 211 (89.8%) | 180 (88.7%) |
| 12 to 14 Years | 94 (81.7%) | 129 (90.8%) |
| 15 Years | 59 (100.0%) | 70 (66.7%) |
| 16 and 17 Years | 73 (100.0%) | 15 (100.0%) |
| 18 to 24 Years | 95 (45.9%) | 214 (77.0%) |
| 25 to 34 Years | 371 (100.0%) | 357 (100.0%) |
| 35 to 44 Years | 319 (89.4%) | 163 (54.3%) |
| 45 to 54 Years | 152 (75.2%) | 242 (94.9%) |
| 55 to 64 Years | 274 (83.8%) | 297 (90.0%) |
| 65 to 74 Years | 174 (87.0%) | 185 (71.7%) |
| 75 Years and over | 169 (69.3%) | 175 (68.1%) |
| Total | 2,191 (83.9%) | 2,133 (78.2%) |
Income Below Poverty Among Married-Couple Families in Floyd County
The poverty statistics for married-couple families in Floyd County show that 10.3% or 105 of the total 1,015 families live below the poverty line. Families with 1 or 2 children have the highest poverty rate of 13.4%, comprising of 41 families. On the other hand, families with 3 or 4 children have the lowest poverty rate of 0.0%, which includes 0 families.
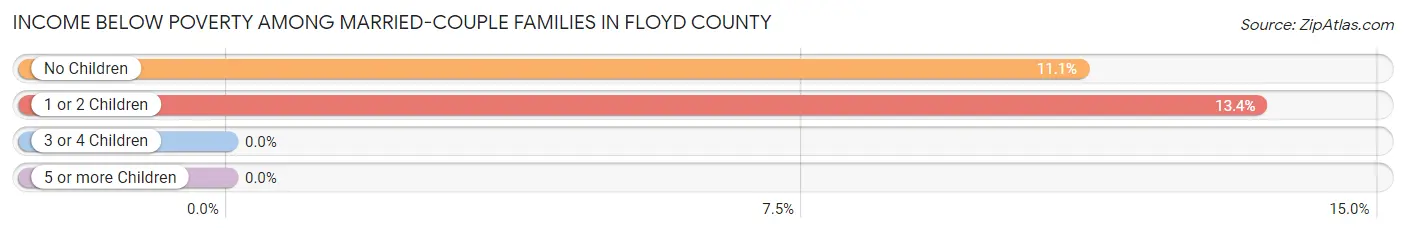
| Children | Above Poverty | Below Poverty |
| No Children | 512 (88.9%) | 64 (11.1%) |
| 1 or 2 Children | 264 (86.6%) | 41 (13.4%) |
| 3 or 4 Children | 116 (100.0%) | 0 (0.0%) |
| 5 or more Children | 18 (100.0%) | 0 (0.0%) |
| Total | 910 (89.7%) | 105 (10.3%) |
Income Below Poverty Among Single-Parent Households in Floyd County
According to the poverty data in Floyd County, 26.1% or 12 single-father households and 48.8% or 161 single-mother households are living below the poverty line. Among single-father households, those with 1 or 2 children have the highest poverty rate, with 8 households (53.3%) experiencing poverty. Likewise, among single-mother households, those with 1 or 2 children have the highest poverty rate, with 136 households (55.7%) falling below the poverty line.
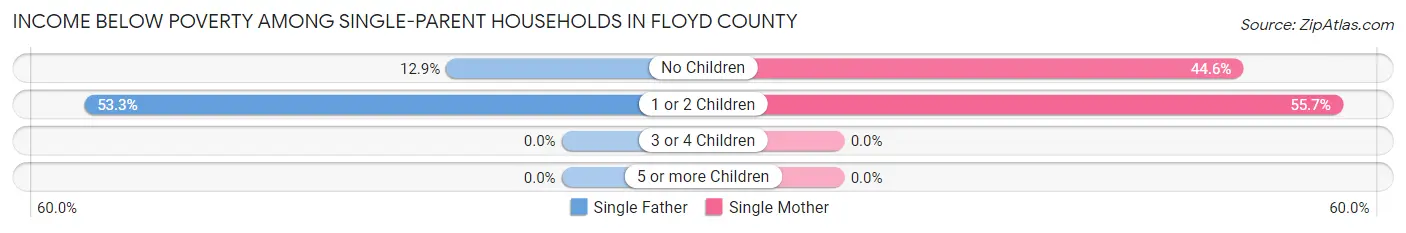
| Children | Single Father | Single Mother |
| No Children | 4 (12.9%) | 25 (44.6%) |
| 1 or 2 Children | 8 (53.3%) | 136 (55.7%) |
| 3 or 4 Children | 0 (0.0%) | 0 (0.0%) |
| 5 or more Children | 0 (0.0%) | 0 (0.0%) |
| Total | 12 (26.1%) | 161 (48.8%) |
Income Below Poverty Among Married-Couple vs Single-Parent Households in Floyd County
The poverty data for Floyd County shows that 105 of the married-couple family households (10.3%) and 173 of the single-parent households (46.0%) are living below the poverty level. Within the married-couple family households, those with 1 or 2 children have the highest poverty rate, with 41 households (13.4%) falling below the poverty line. Among the single-parent households, those with 1 or 2 children have the highest poverty rate, with 144 household (55.6%) living below poverty.
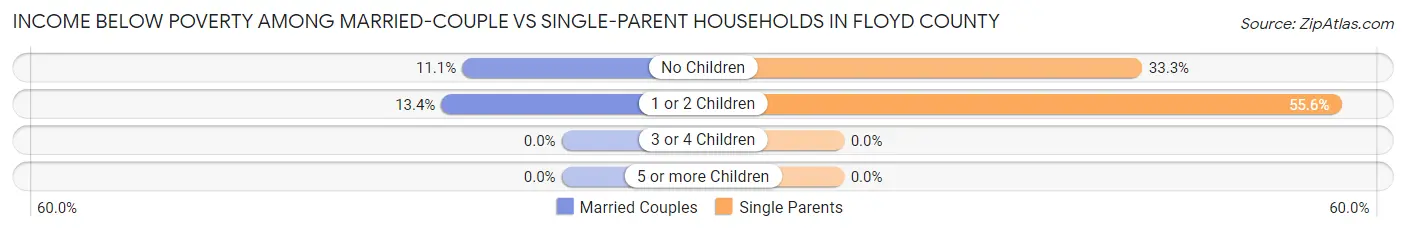
| Children | Married-Couple Families | Single-Parent Households |
| No Children | 64 (11.1%) | 29 (33.3%) |
| 1 or 2 Children | 41 (13.4%) | 144 (55.6%) |
| 3 or 4 Children | 0 (0.0%) | 0 (0.0%) |
| 5 or more Children | 0 (0.0%) | 0 (0.0%) |
| Total | 105 (10.3%) | 173 (46.0%) |
Race in Floyd County
The most populous races in Floyd County are White / Caucasian (4,233 | 78.6%), Hispanic or Latino (3,193 | 59.3%), and Two or more Races (511 | 9.5%).
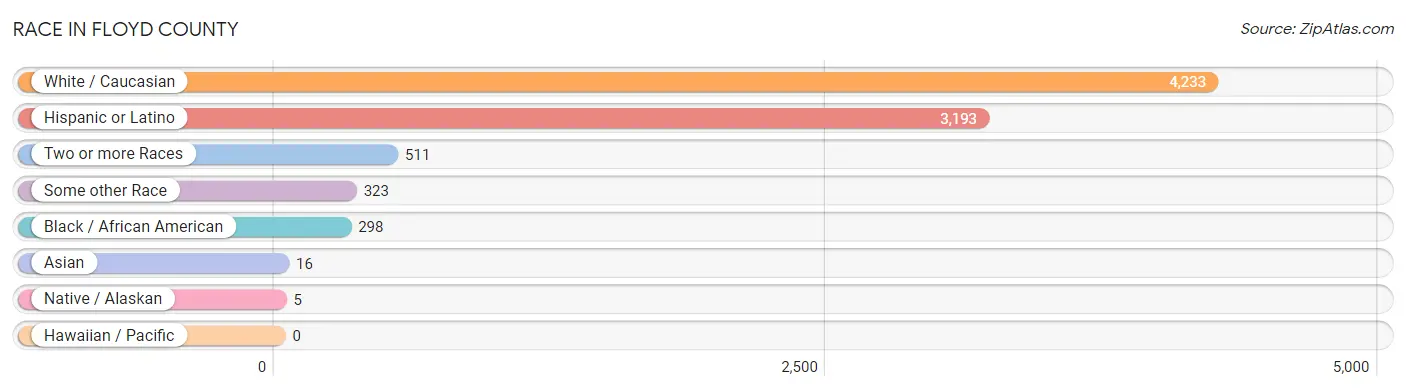
| Race | # Population | % Population |
| Asian | 16 | 0.3% |
| Black / African American | 298 | 5.5% |
| Hawaiian / Pacific | 0 | 0.0% |
| Hispanic or Latino | 3,193 | 59.3% |
| Native / Alaskan | 5 | 0.1% |
| White / Caucasian | 4,233 | 78.6% |
| Two or more Races | 511 | 9.5% |
| Some other Race | 323 | 6.0% |
| Total | 5,386 | 100.0% |
Ancestry in Floyd County
The most populous ancestries reported in Floyd County are Mexican (3,005 | 55.8%), Irish (272 | 5.1%), German (223 | 4.1%), English (177 | 3.3%), and European (158 | 2.9%), together accounting for 71.2% of all Floyd County residents.
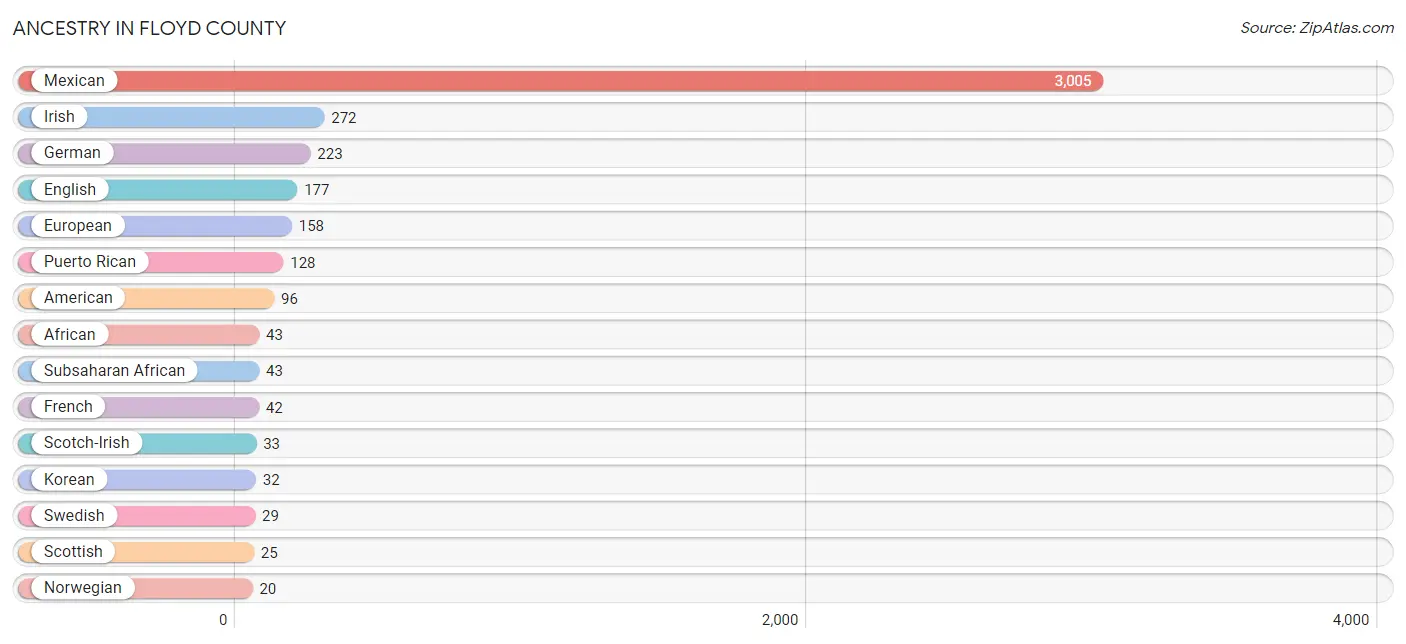
| Ancestry | # Population | % Population |
| African | 43 | 0.8% |
| American | 96 | 1.8% |
| British | 12 | 0.2% |
| Cherokee | 3 | 0.1% |
| Choctaw | 7 | 0.1% |
| Czech | 5 | 0.1% |
| Dutch | 5 | 0.1% |
| English | 177 | 3.3% |
| European | 158 | 2.9% |
| French | 42 | 0.8% |
| German | 223 | 4.1% |
| Irish | 272 | 5.1% |
| Italian | 11 | 0.2% |
| Korean | 32 | 0.6% |
| Mexican | 3,005 | 55.8% |
| Norwegian | 20 | 0.4% |
| Puerto Rican | 128 | 2.4% |
| Scotch-Irish | 33 | 0.6% |
| Scottish | 25 | 0.5% |
| Spaniard | 19 | 0.4% |
| Spanish | 4 | 0.1% |
| Subsaharan African | 43 | 0.8% |
| Swedish | 29 | 0.5% |
| Swiss | 8 | 0.2% |
| Welsh | 18 | 0.3% | View All 25 Rows |
Immigrants in Floyd County
The most numerous immigrant groups reported in Floyd County came from Central America (460 | 8.5%), Latin America (460 | 8.5%), Mexico (460 | 8.5%), Asia (16 | 0.3%), and Philippines (16 | 0.3%), together accounting for 26.2% of all Floyd County residents.
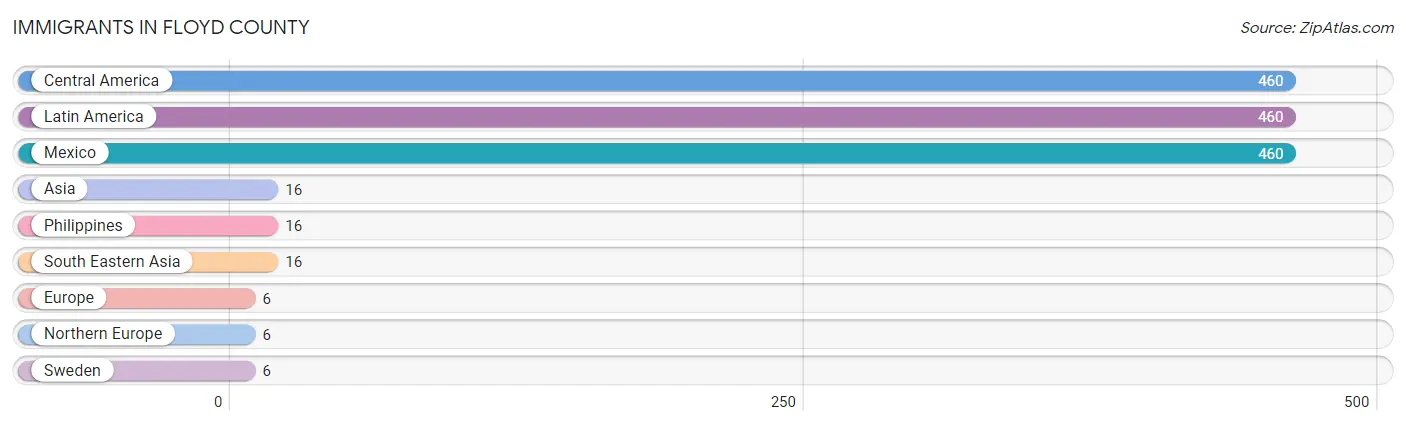
| Immigration Origin | # Population | % Population |
| Asia | 16 | 0.3% |
| Central America | 460 | 8.5% |
| Europe | 6 | 0.1% |
| Latin America | 460 | 8.5% |
| Mexico | 460 | 8.5% |
| Northern Europe | 6 | 0.1% |
| Philippines | 16 | 0.3% |
| South Eastern Asia | 16 | 0.3% |
| Sweden | 6 | 0.1% | View All 9 Rows |
Sex and Age in Floyd County
Sex and Age in Floyd County
The most populous age groups in Floyd County are 5 to 9 Years (262 | 9.9%) for men and 30 to 34 Years (233 | 8.5%) for women.
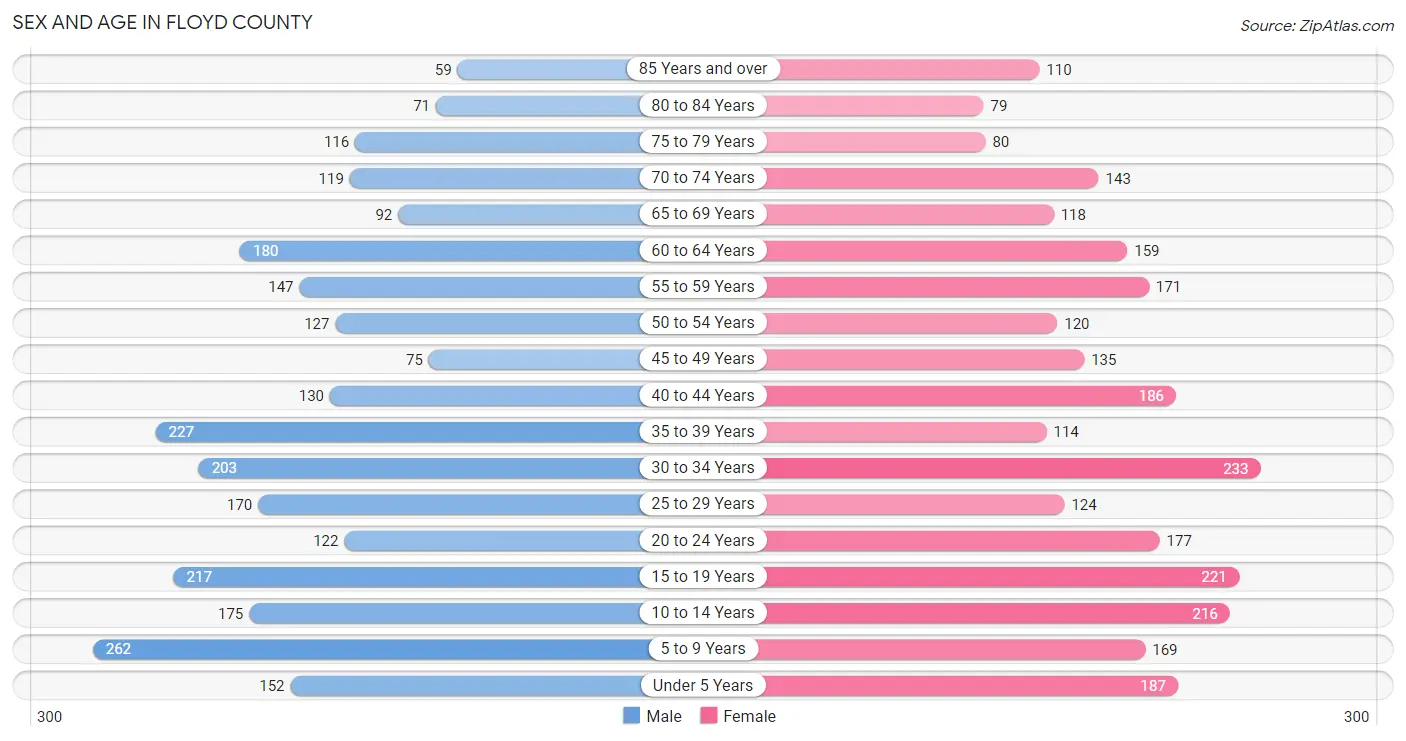
| Age Bracket | Male | Female |
| Under 5 Years | 152 (5.8%) | 187 (6.8%) |
| 5 to 9 Years | 262 (9.9%) | 169 (6.2%) |
| 10 to 14 Years | 175 (6.6%) | 216 (7.9%) |
| 15 to 19 Years | 217 (8.2%) | 221 (8.1%) |
| 20 to 24 Years | 122 (4.6%) | 177 (6.5%) |
| 25 to 29 Years | 170 (6.4%) | 124 (4.5%) |
| 30 to 34 Years | 203 (7.7%) | 233 (8.5%) |
| 35 to 39 Years | 227 (8.6%) | 114 (4.2%) |
| 40 to 44 Years | 130 (4.9%) | 186 (6.8%) |
| 45 to 49 Years | 75 (2.8%) | 135 (4.9%) |
| 50 to 54 Years | 127 (4.8%) | 120 (4.4%) |
| 55 to 59 Years | 147 (5.6%) | 171 (6.2%) |
| 60 to 64 Years | 180 (6.8%) | 159 (5.8%) |
| 65 to 69 Years | 92 (3.5%) | 118 (4.3%) |
| 70 to 74 Years | 119 (4.5%) | 143 (5.2%) |
| 75 to 79 Years | 116 (4.4%) | 80 (2.9%) |
| 80 to 84 Years | 71 (2.7%) | 79 (2.9%) |
| 85 Years and over | 59 (2.2%) | 110 (4.0%) |
| Total | 2,644 (100.0%) | 2,742 (100.0%) |
Families and Households in Floyd County
Median Family Size in Floyd County
The median family size in Floyd County is 3.34 persons per family, with single male/father families (46 | 3.3%) accounting for the largest median family size of 4 persons per family. On the other hand, single female/mother families (330 | 23.7%) represent the smallest median family size with 3.16 persons per family.
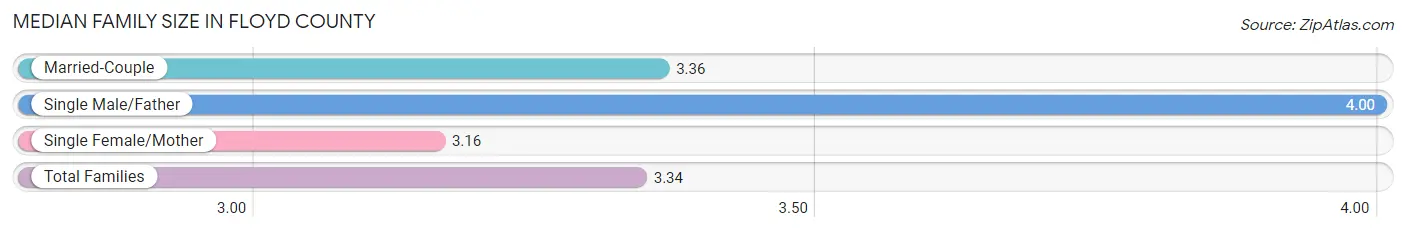
| Family Type | # Families | Family Size |
| Married-Couple | 1,015 (73.0%) | 3.36 |
| Single Male/Father | 46 (3.3%) | 4.00 |
| Single Female/Mother | 330 (23.7%) | 3.16 |
| Total Families | 1,391 (100.0%) | 3.34 |
Median Household Size in Floyd County
The median household size in Floyd County is 2.76 persons per household, with single male/father households (46 | 2.4%) accounting for the largest median household size of 4.35 persons per household. non-family households (547 | 28.2%) represent the smallest median household size with 1.17 persons per household.
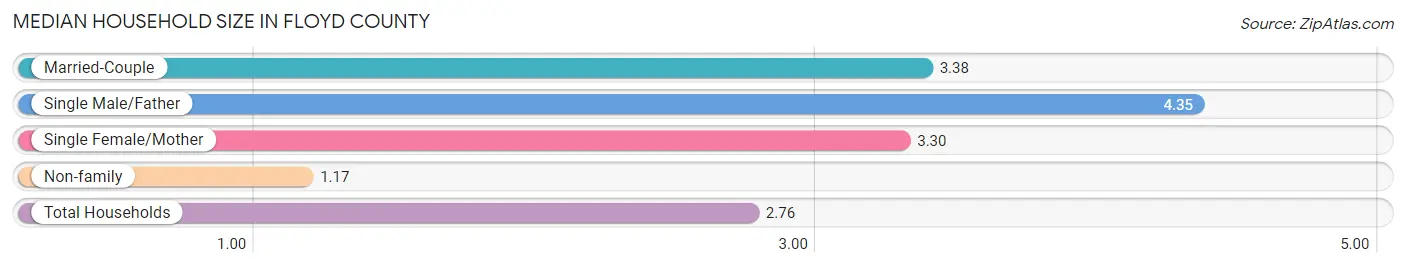
| Household Type | # Households | Household Size |
| Married-Couple | 1,015 (52.4%) | 3.38 |
| Single Male/Father | 46 (2.4%) | 4.35 |
| Single Female/Mother | 330 (17.0%) | 3.30 |
| Non-family | 547 (28.2%) | 1.17 |
| Total Households | 1,938 (100.0%) | 2.76 |
Household Size by Marriage Status in Floyd County
Out of a total of 1,938 households in Floyd County, 1,391 (71.8%) are family households, while 547 (28.2%) are nonfamily households. The most numerous type of family households are 2-person households, comprising 613, and the most common type of nonfamily households are 1-person households, comprising 506.
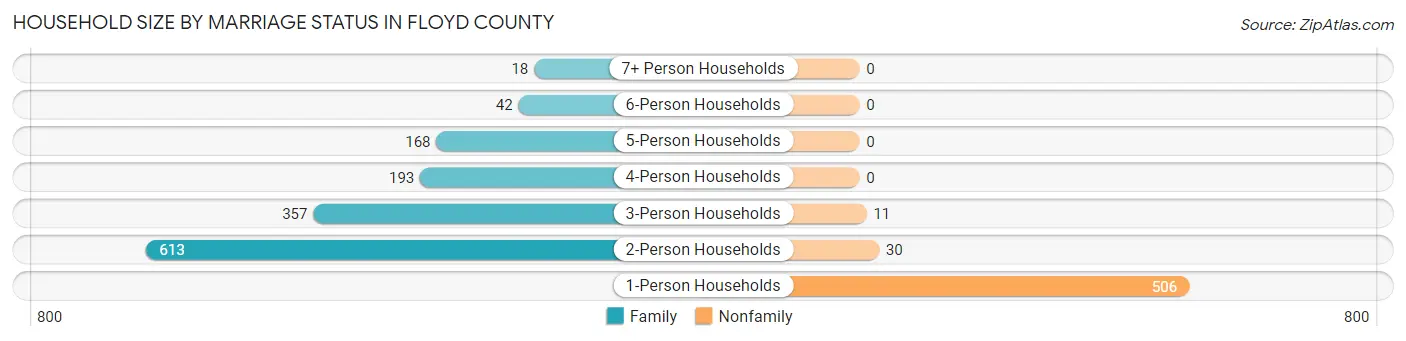
| Household Size | Family Households | Nonfamily Households |
| 1-Person Households | - | 506 (26.1%) |
| 2-Person Households | 613 (31.6%) | 30 (1.5%) |
| 3-Person Households | 357 (18.4%) | 11 (0.6%) |
| 4-Person Households | 193 (10.0%) | 0 (0.0%) |
| 5-Person Households | 168 (8.7%) | 0 (0.0%) |
| 6-Person Households | 42 (2.2%) | 0 (0.0%) |
| 7+ Person Households | 18 (0.9%) | 0 (0.0%) |
| Total | 1,391 (71.8%) | 547 (28.2%) |
Female Fertility in Floyd County
Fertility by Age in Floyd County
Average fertility rate in Floyd County is 84.0 births per 1,000 women. Women in the age bracket of 15 to 19 years have the highest fertility rate with 195.0 births per 1,000 women. Women in the age bracket of 15 to 19 years acount for 42.2% of all women with births.
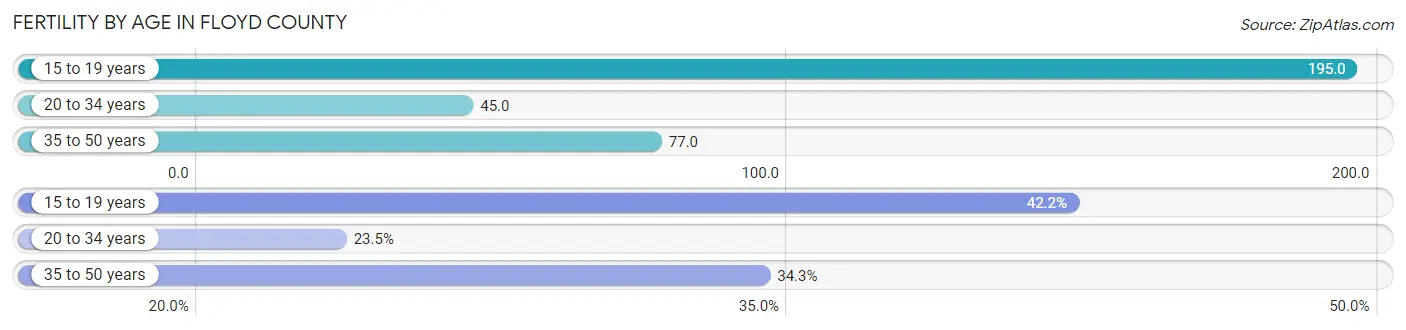
| Age Bracket | Women with Births | Births / 1,000 Women |
| 15 to 19 years | 43 (42.2%) | 195.0 |
| 20 to 34 years | 24 (23.5%) | 45.0 |
| 35 to 50 years | 35 (34.3%) | 77.0 |
| Total | 102 (100.0%) | 84.0 |
Fertility by Age by Marriage Status in Floyd County
23.5% of women with births (102) in Floyd County are married. The highest percentage of unmarried women with births falls into 15 to 19 years age bracket with 100.0% of them unmarried at the time of birth, while the lowest percentage of unmarried women with births belong to 20 to 34 years age bracket with 0.0% of them unmarried.
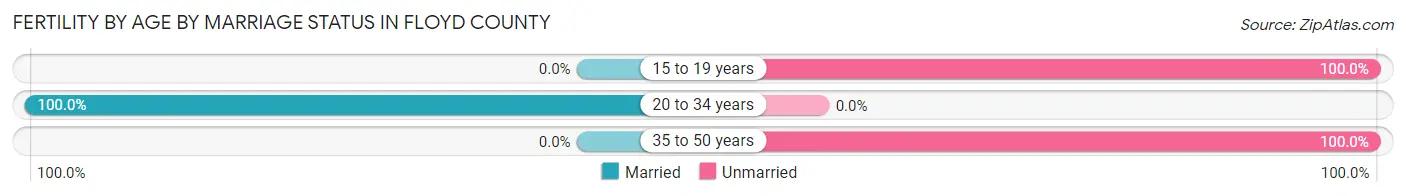
| Age Bracket | Married | Unmarried |
| 15 to 19 years | 0 (0.0%) | 43 (100.0%) |
| 20 to 34 years | 24 (100.0%) | 0 (0.0%) |
| 35 to 50 years | 0 (0.0%) | 35 (100.0%) |
| Total | 24 (23.5%) | 78 (76.5%) |
Fertility by Education in Floyd County
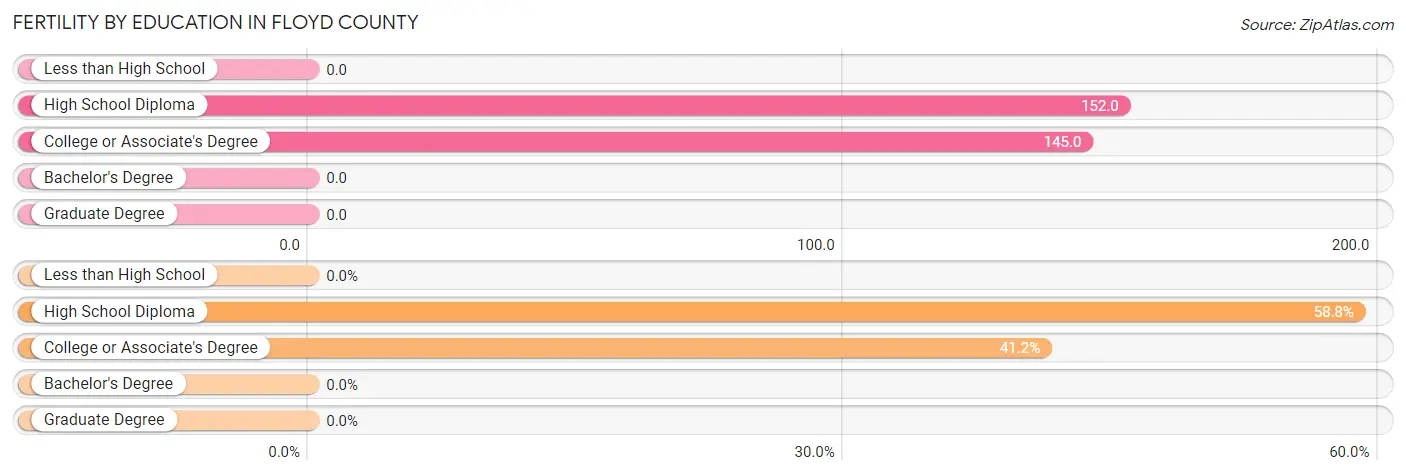
| Educational Attainment | Women with Births | Births / 1,000 Women |
| Less than High School | 0 (0.0%) | 0.0 |
| High School Diploma | 60 (58.8%) | 152.0 |
| College or Associate's Degree | 42 (41.2%) | 145.0 |
| Bachelor's Degree | 0 (0.0%) | 0.0 |
| Graduate Degree | 0 (0.0%) | 0.0 |
| Total | 102 (100.0%) | 84.0 |
Fertility by Education by Marriage Status in Floyd County
76.5% of women with births in Floyd County are unmarried. Women with the educational attainment of high school diploma are most likely to be married with 28.3% of them married at childbirth, while women with the educational attainment of college or associate's degree are least likely to be married with 83.3% of them unmarried at childbirth.
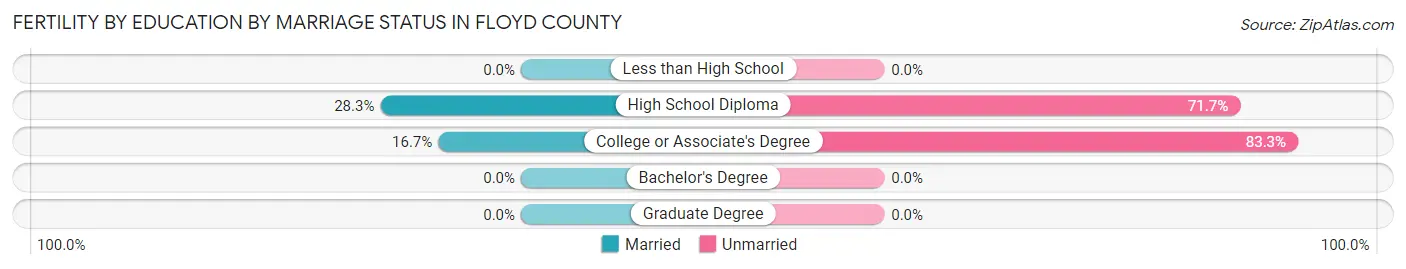
| Educational Attainment | Married | Unmarried |
| Less than High School | 0 (0.0%) | 0 (0.0%) |
| High School Diploma | 17 (28.3%) | 43 (71.7%) |
| College or Associate's Degree | 7 (16.7%) | 35 (83.3%) |
| Bachelor's Degree | 0 (0.0%) | 0 (0.0%) |
| Graduate Degree | 0 (0.0%) | 0 (0.0%) |
| Total | 24 (23.5%) | 78 (76.5%) |
Employment Characteristics in Floyd County
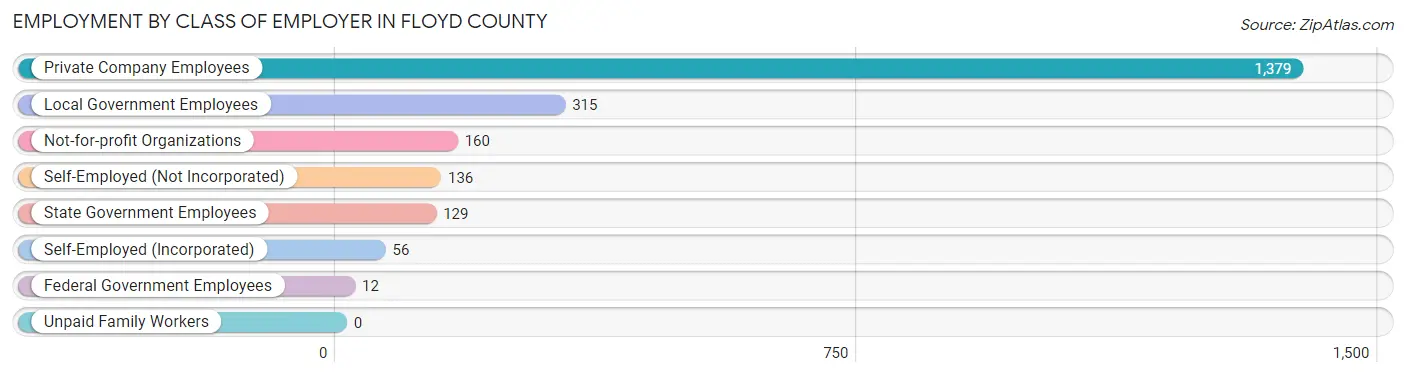
Employment by Class of Employer in Floyd County
Among the 2,187 employed individuals in Floyd County, private company employees (1,379 | 63.0%), local government employees (315 | 14.4%), and not-for-profit organizations (160 | 7.3%) make up the most common classes of employment.
| Employer Class | # Employees | % Employees |
| Private Company Employees | 1,379 | 63.0% |
| Self-Employed (Incorporated) | 56 | 2.6% |
| Self-Employed (Not Incorporated) | 136 | 6.2% |
| Not-for-profit Organizations | 160 | 7.3% |
| Local Government Employees | 315 | 14.4% |
| State Government Employees | 129 | 5.9% |
| Federal Government Employees | 12 | 0.5% |
| Unpaid Family Workers | 0 | 0.0% |
| Total | 2,187 | 100.0% |
Employment Status by Age in Floyd County
According to the labor force statistics for Floyd County, out of the total population over 16 years of age (4,061), 57.5% or 2,335 individuals are in the labor force, with 4.1% or 96 of them unemployed. The age group with the highest labor force participation rate is 30 to 34 years, with 87.6% or 382 individuals in the labor force. Within the labor force, the 16 to 19 years age range has the highest percentage of unemployed individuals, with 15.3% or 20 of them being unemployed.
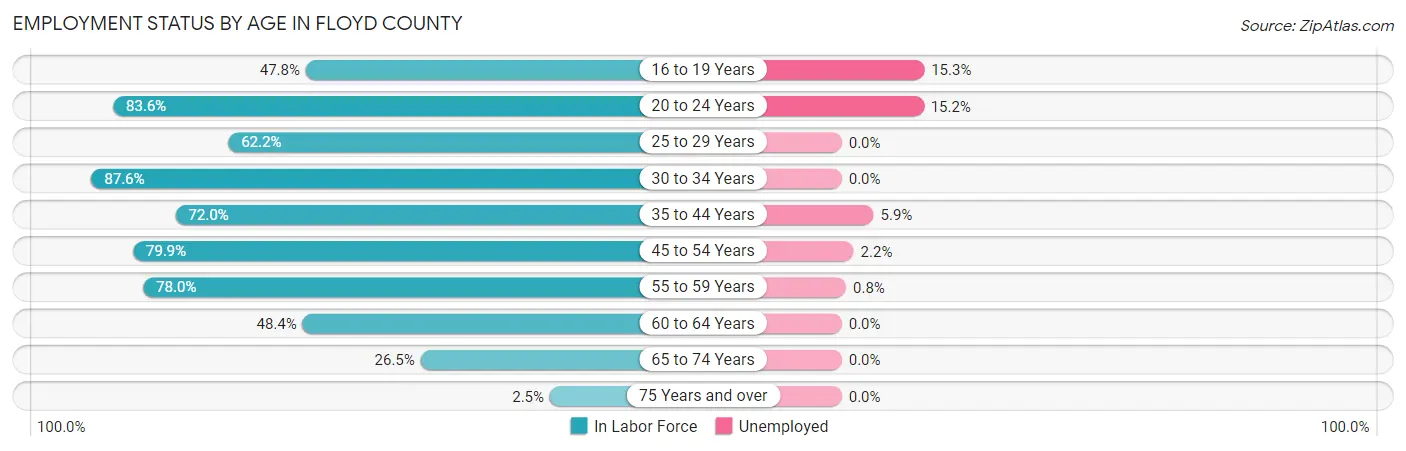
| Age Bracket | In Labor Force | Unemployed |
| 16 to 19 Years | 131 (47.8%) | 20 (15.3%) |
| 20 to 24 Years | 250 (83.6%) | 38 (15.2%) |
| 25 to 29 Years | 183 (62.2%) | 0 (0.0%) |
| 30 to 34 Years | 382 (87.6%) | 0 (0.0%) |
| 35 to 44 Years | 473 (72.0%) | 28 (5.9%) |
| 45 to 54 Years | 365 (79.9%) | 8 (2.2%) |
| 55 to 59 Years | 248 (78.0%) | 2 (0.8%) |
| 60 to 64 Years | 164 (48.4%) | 0 (0.0%) |
| 65 to 74 Years | 125 (26.5%) | 0 (0.0%) |
| 75 Years and over | 13 (2.5%) | 0 (0.0%) |
| Total | 2,335 (57.5%) | 96 (4.1%) |
Employment Status by Educational Attainment in Floyd County
According to labor force statistics for Floyd County, 72.6% of individuals (1,816) out of the total population between 25 and 64 years of age (2,501) are in the labor force, with 2.1% or 38 of them being unemployed. The group with the highest labor force participation rate are those with the educational attainment of bachelor's degree or higher, with 86.8% or 356 individuals in the labor force. Within the labor force, individuals with high school diploma education have the highest percentage of unemployment, with 5.9% or 28 of them being unemployed.
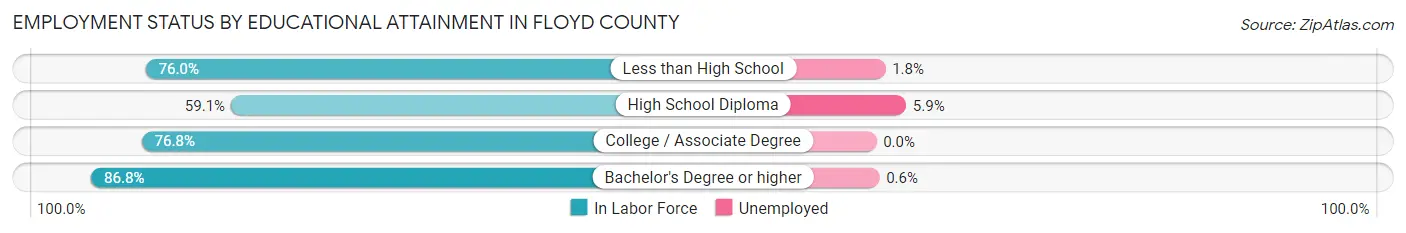
| Educational Attainment | In Labor Force | Unemployed |
| Less than High School | 455 (76.0%) | 11 (1.8%) |
| High School Diploma | 474 (59.1%) | 47 (5.9%) |
| College / Associate Degree | 530 (76.8%) | 0 (0.0%) |
| Bachelor's Degree or higher | 356 (86.8%) | 2 (0.6%) |
| Total | 1,816 (72.6%) | 53 (2.1%) |
Employment Occupations by Sex in Floyd County
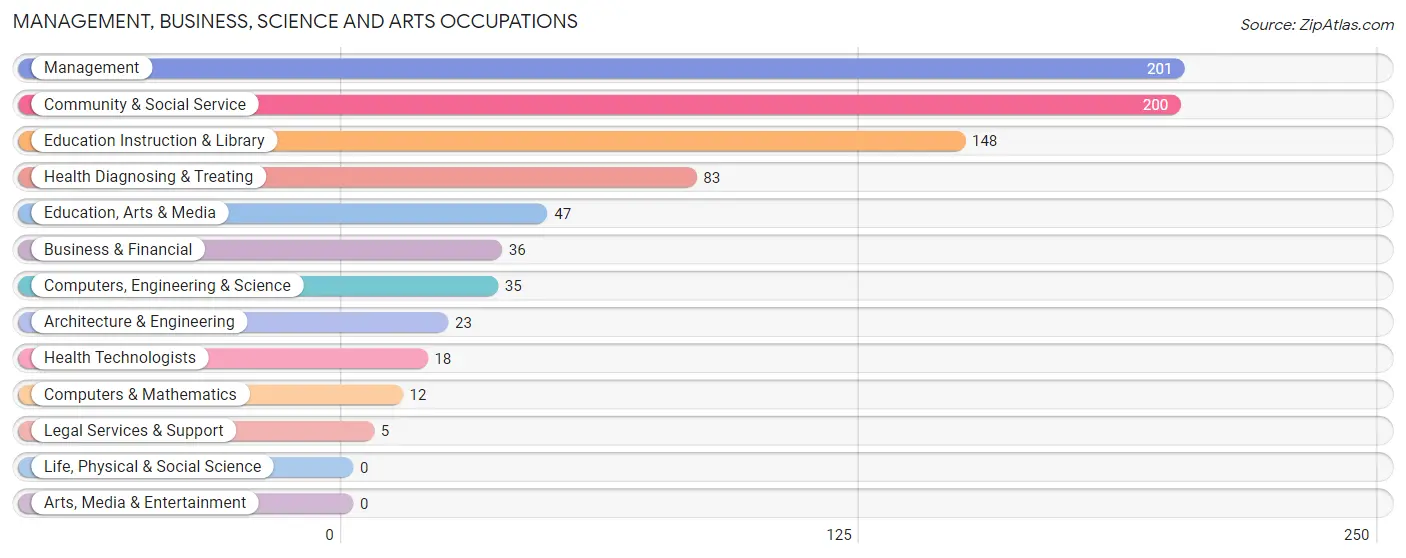
Management, Business, Science and Arts Occupations
The most common Management, Business, Science and Arts occupations in Floyd County are Management (201 | 9.0%), Community & Social Service (200 | 8.9%), Education Instruction & Library (148 | 6.6%), Health Diagnosing & Treating (83 | 3.7%), and Education, Arts & Media (47 | 2.1%).
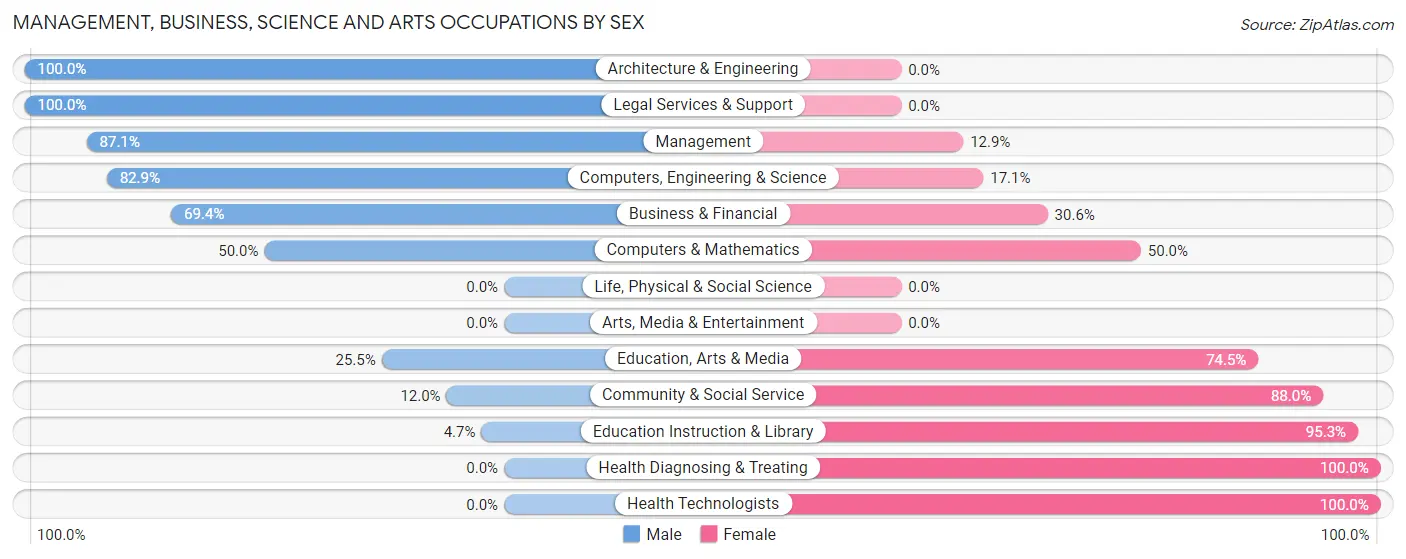
Management, Business, Science and Arts Occupations by Sex
Within the Management, Business, Science and Arts occupations in Floyd County, the most male-oriented occupations are Architecture & Engineering (100.0%), Legal Services & Support (100.0%), and Management (87.1%), while the most female-oriented occupations are Health Diagnosing & Treating (100.0%), Health Technologists (100.0%), and Education Instruction & Library (95.3%).
| Occupation | Male | Female |
| Management | 175 (87.1%) | 26 (12.9%) |
| Business & Financial | 25 (69.4%) | 11 (30.6%) |
| Computers, Engineering & Science | 29 (82.9%) | 6 (17.1%) |
| Computers & Mathematics | 6 (50.0%) | 6 (50.0%) |
| Architecture & Engineering | 23 (100.0%) | 0 (0.0%) |
| Life, Physical & Social Science | 0 (0.0%) | 0 (0.0%) |
| Community & Social Service | 24 (12.0%) | 176 (88.0%) |
| Education, Arts & Media | 12 (25.5%) | 35 (74.5%) |
| Legal Services & Support | 5 (100.0%) | 0 (0.0%) |
| Education Instruction & Library | 7 (4.7%) | 141 (95.3%) |
| Arts, Media & Entertainment | 0 (0.0%) | 0 (0.0%) |
| Health Diagnosing & Treating | 0 (0.0%) | 83 (100.0%) |
| Health Technologists | 0 (0.0%) | 18 (100.0%) |
| Total (Category) | 253 (45.6%) | 302 (54.4%) |
| Total (Overall) | 1,100 (49.1%) | 1,138 (50.8%) |
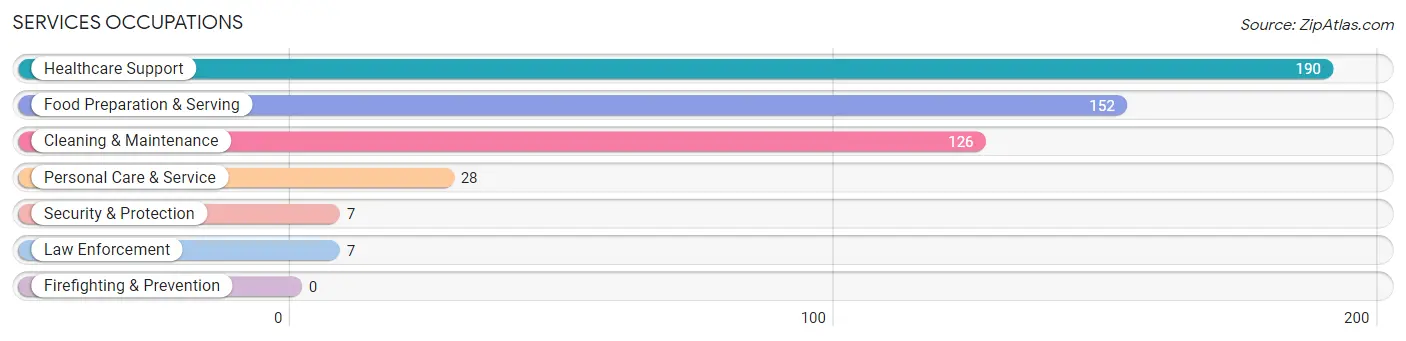
Services Occupations
The most common Services occupations in Floyd County are Healthcare Support (190 | 8.5%), Food Preparation & Serving (152 | 6.8%), Cleaning & Maintenance (126 | 5.6%), Personal Care & Service (28 | 1.3%), and Security & Protection (7 | 0.3%).
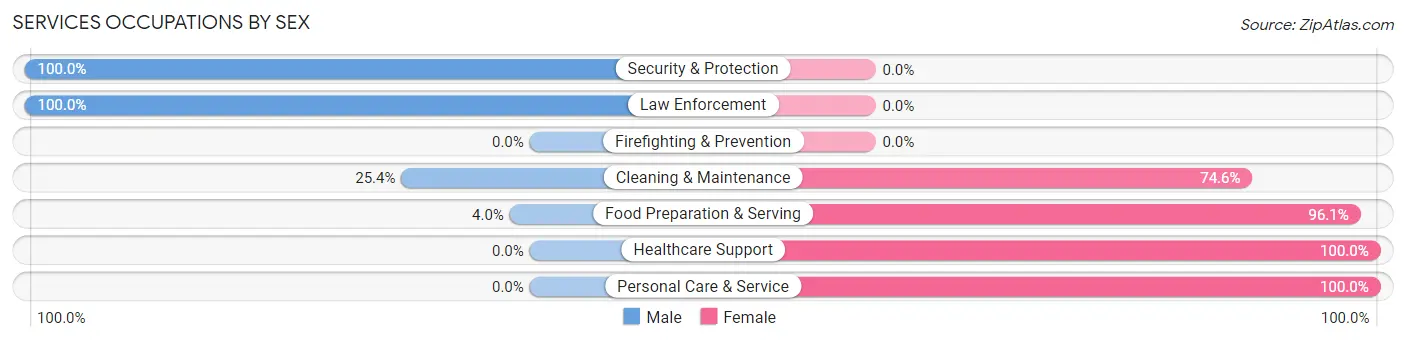
Services Occupations by Sex
Within the Services occupations in Floyd County, the most male-oriented occupations are Security & Protection (100.0%), Law Enforcement (100.0%), and Cleaning & Maintenance (25.4%), while the most female-oriented occupations are Healthcare Support (100.0%), Personal Care & Service (100.0%), and Food Preparation & Serving (96.1%).
| Occupation | Male | Female |
| Healthcare Support | 0 (0.0%) | 190 (100.0%) |
| Security & Protection | 7 (100.0%) | 0 (0.0%) |
| Firefighting & Prevention | 0 (0.0%) | 0 (0.0%) |
| Law Enforcement | 7 (100.0%) | 0 (0.0%) |
| Food Preparation & Serving | 6 (4.0%) | 146 (96.1%) |
| Cleaning & Maintenance | 32 (25.4%) | 94 (74.6%) |
| Personal Care & Service | 0 (0.0%) | 28 (100.0%) |
| Total (Category) | 45 (8.9%) | 458 (91.0%) |
| Total (Overall) | 1,100 (49.1%) | 1,138 (50.8%) |
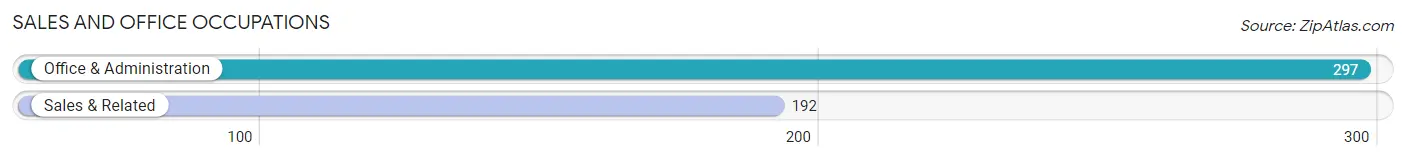
Sales and Office Occupations
The most common Sales and Office occupations in Floyd County are Office & Administration (297 | 13.3%), and Sales & Related (192 | 8.6%).
Sales and Office Occupations by Sex
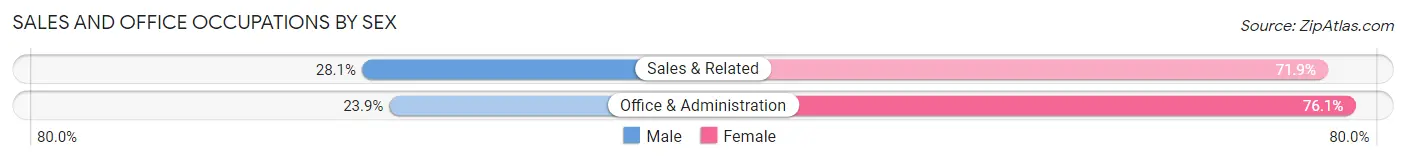
| Occupation | Male | Female |
| Sales & Related | 54 (28.1%) | 138 (71.9%) |
| Office & Administration | 71 (23.9%) | 226 (76.1%) |
| Total (Category) | 125 (25.6%) | 364 (74.4%) |
| Total (Overall) | 1,100 (49.1%) | 1,138 (50.8%) |
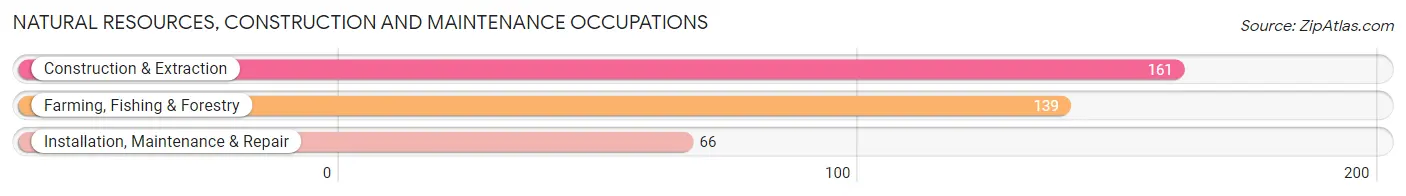
Natural Resources, Construction and Maintenance Occupations
The most common Natural Resources, Construction and Maintenance occupations in Floyd County are Construction & Extraction (161 | 7.2%), Farming, Fishing & Forestry (139 | 6.2%), and Installation, Maintenance & Repair (66 | 2.9%).
Natural Resources, Construction and Maintenance Occupations by Sex
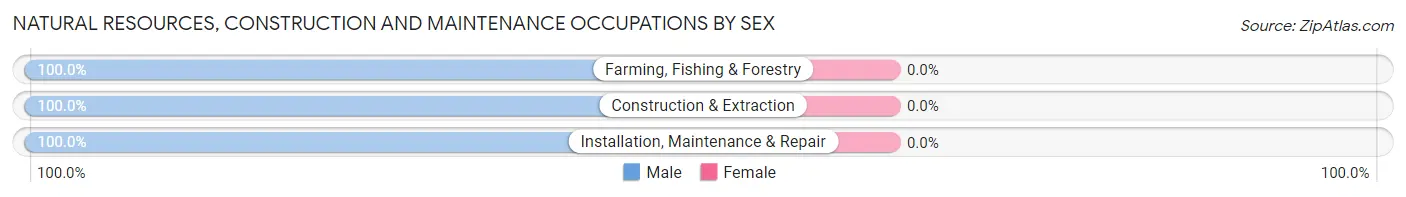
| Occupation | Male | Female |
| Farming, Fishing & Forestry | 139 (100.0%) | 0 (0.0%) |
| Construction & Extraction | 161 (100.0%) | 0 (0.0%) |
| Installation, Maintenance & Repair | 66 (100.0%) | 0 (0.0%) |
| Total (Category) | 366 (100.0%) | 0 (0.0%) |
| Total (Overall) | 1,100 (49.1%) | 1,138 (50.8%) |
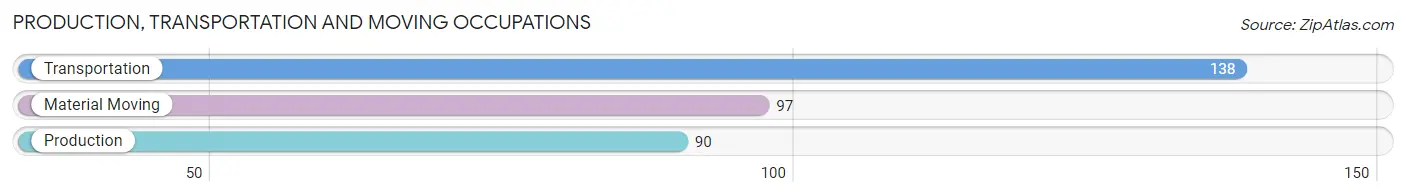
Production, Transportation and Moving Occupations
The most common Production, Transportation and Moving occupations in Floyd County are Transportation (138 | 6.2%), Material Moving (97 | 4.3%), and Production (90 | 4.0%).
Production, Transportation and Moving Occupations by Sex
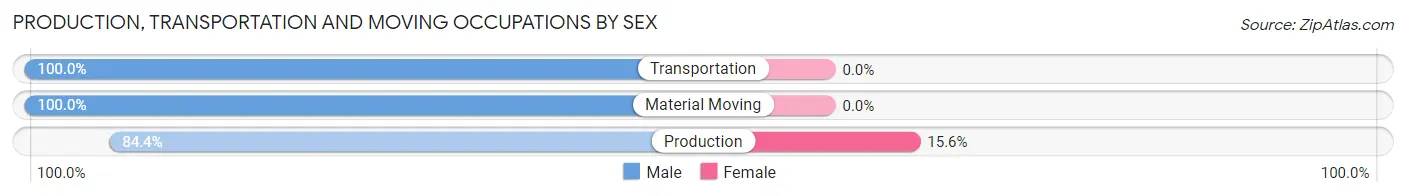
| Occupation | Male | Female |
| Production | 76 (84.4%) | 14 (15.6%) |
| Transportation | 138 (100.0%) | 0 (0.0%) |
| Material Moving | 97 (100.0%) | 0 (0.0%) |
| Total (Category) | 311 (95.7%) | 14 (4.3%) |
| Total (Overall) | 1,100 (49.1%) | 1,138 (50.8%) |
Employment Industries by Sex in Floyd County
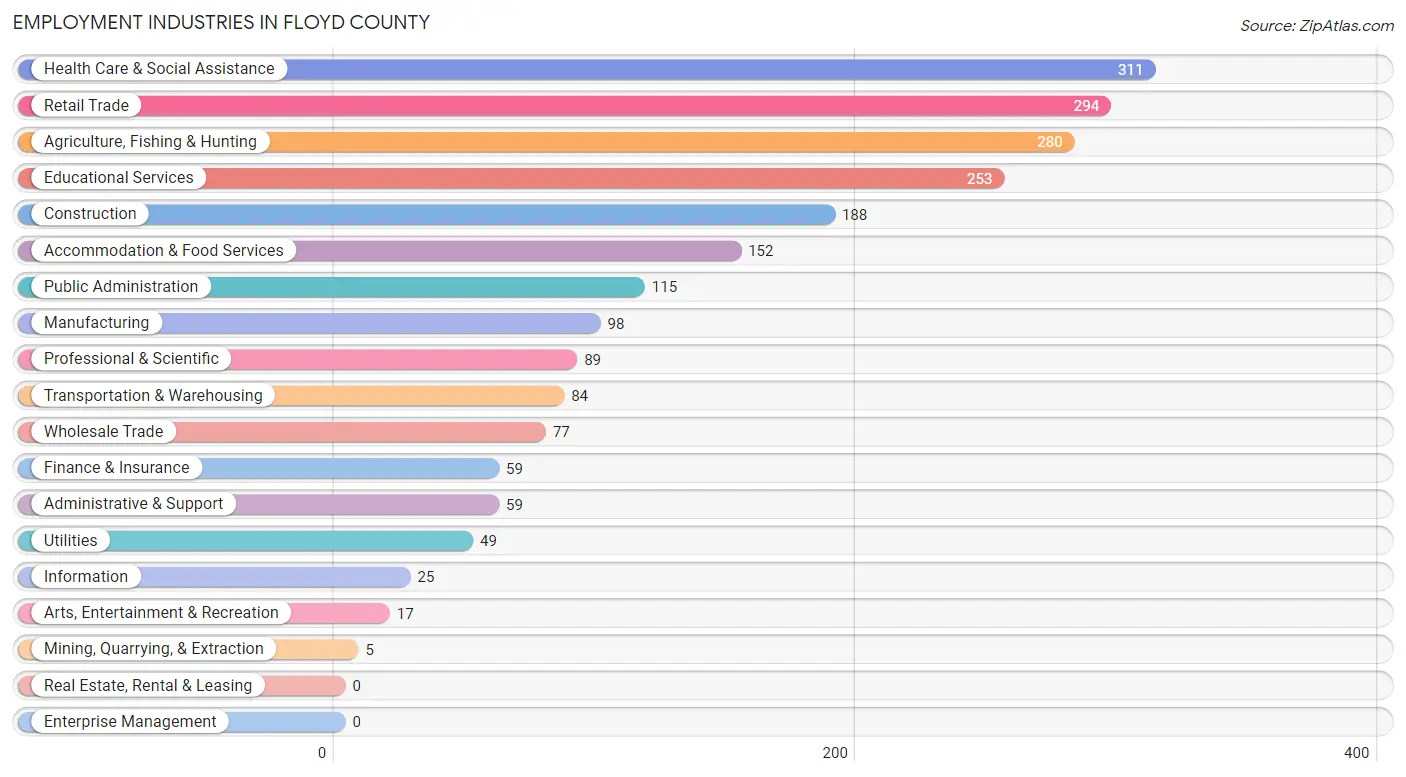
Employment Industries in Floyd County
The major employment industries in Floyd County include Health Care & Social Assistance (311 | 13.9%), Retail Trade (294 | 13.1%), Agriculture, Fishing & Hunting (280 | 12.5%), Educational Services (253 | 11.3%), and Construction (188 | 8.4%).
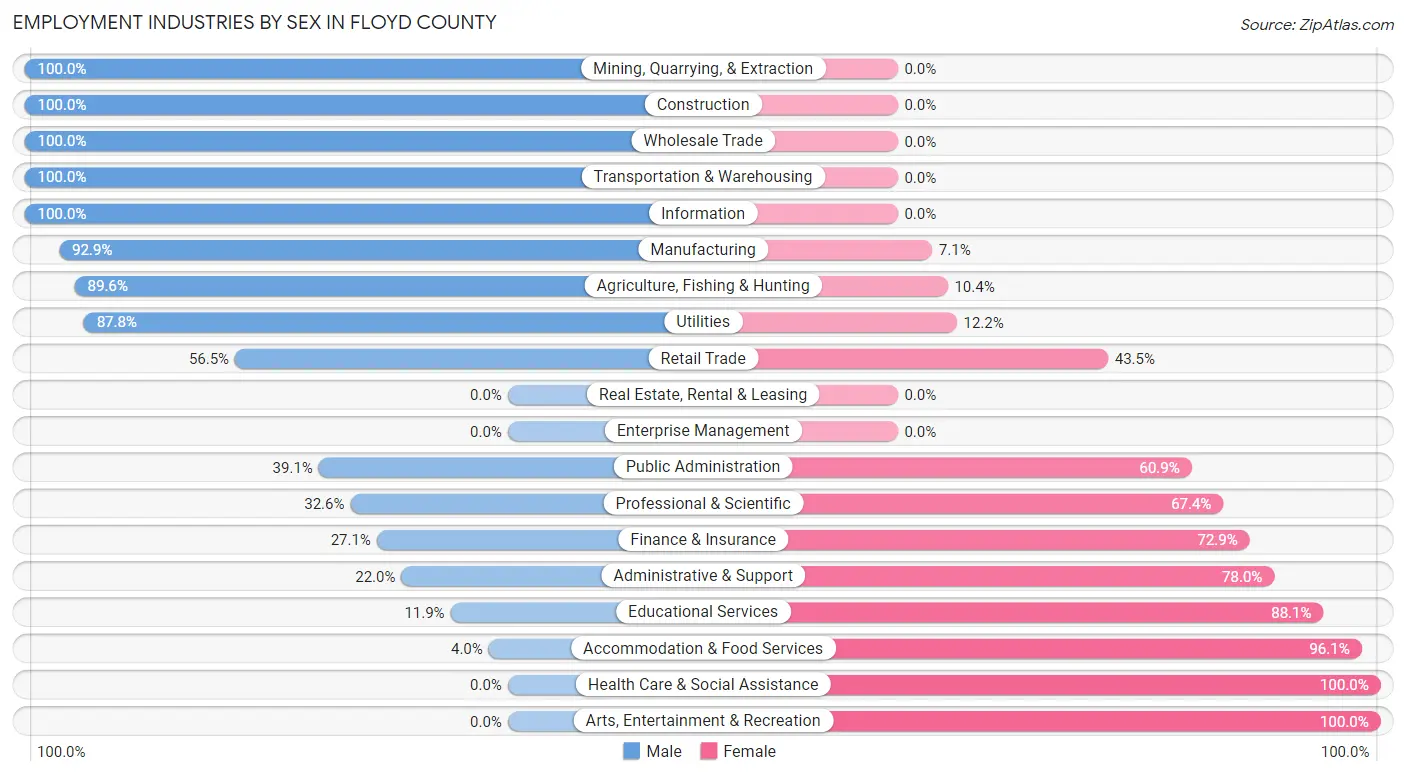
Employment Industries by Sex in Floyd County
The Floyd County industries that see more men than women are Mining, Quarrying, & Extraction (100.0%), Construction (100.0%), and Wholesale Trade (100.0%), whereas the industries that tend to have a higher number of women are Health Care & Social Assistance (100.0%), Arts, Entertainment & Recreation (100.0%), and Accommodation & Food Services (96.1%).
| Industry | Male | Female |
| Agriculture, Fishing & Hunting | 251 (89.6%) | 29 (10.4%) |
| Mining, Quarrying, & Extraction | 5 (100.0%) | 0 (0.0%) |
| Construction | 188 (100.0%) | 0 (0.0%) |
| Manufacturing | 91 (92.9%) | 7 (7.1%) |
| Wholesale Trade | 77 (100.0%) | 0 (0.0%) |
| Retail Trade | 166 (56.5%) | 128 (43.5%) |
| Transportation & Warehousing | 84 (100.0%) | 0 (0.0%) |
| Utilities | 43 (87.8%) | 6 (12.2%) |
| Information | 25 (100.0%) | 0 (0.0%) |
| Finance & Insurance | 16 (27.1%) | 43 (72.9%) |
| Real Estate, Rental & Leasing | 0 (0.0%) | 0 (0.0%) |
| Professional & Scientific | 29 (32.6%) | 60 (67.4%) |
| Enterprise Management | 0 (0.0%) | 0 (0.0%) |
| Administrative & Support | 13 (22.0%) | 46 (78.0%) |
| Educational Services | 30 (11.9%) | 223 (88.1%) |
| Health Care & Social Assistance | 0 (0.0%) | 311 (100.0%) |
| Arts, Entertainment & Recreation | 0 (0.0%) | 17 (100.0%) |
| Accommodation & Food Services | 6 (4.0%) | 146 (96.1%) |
| Public Administration | 45 (39.1%) | 70 (60.9%) |
| Total | 1,100 (49.1%) | 1,138 (50.8%) |
Education in Floyd County
School Enrollment in Floyd County
The most common levels of schooling among the 1,283 students in Floyd County are middle school (378 | 29.5%), elementary school (302 | 23.5%), and high school (198 | 15.4%).
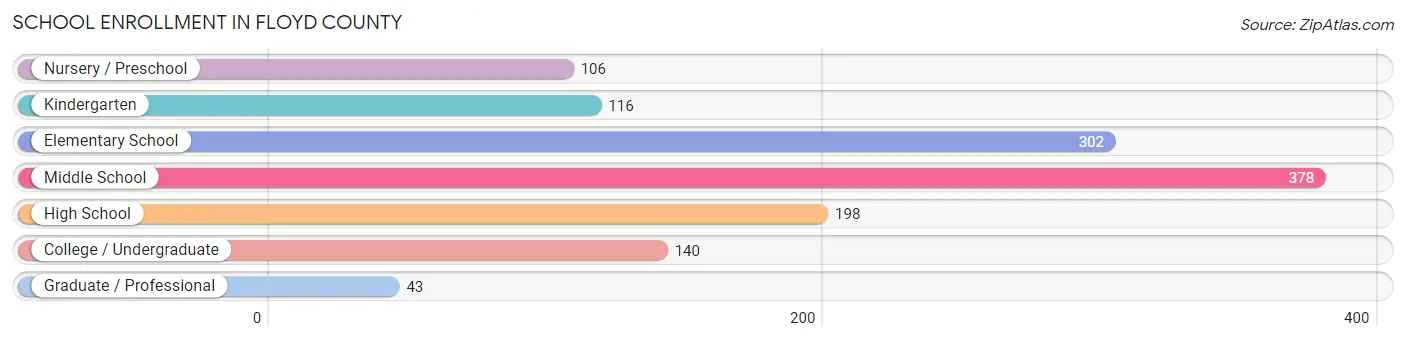
| School Level | # Students | % Students |
| Nursery / Preschool | 106 | 8.3% |
| Kindergarten | 116 | 9.0% |
| Elementary School | 302 | 23.5% |
| Middle School | 378 | 29.5% |
| High School | 198 | 15.4% |
| College / Undergraduate | 140 | 10.9% |
| Graduate / Professional | 43 | 3.4% |
| Total | 1,283 | 100.0% |
School Enrollment by Age by Funding Source in Floyd County
Out of a total of 1,283 students who are enrolled in schools in Floyd County, 185 (14.4%) attend a private institution, while the remaining 1,098 (85.6%) are enrolled in public schools. The age group of 35 years and over has the highest likelihood of being enrolled in private schools, with 19 (45.2% in the age bracket) enrolled. Conversely, the age group of 3 to 4 year olds has the lowest likelihood of being enrolled in a private school, with 71 (100.0% in the age bracket) attending a public institution.
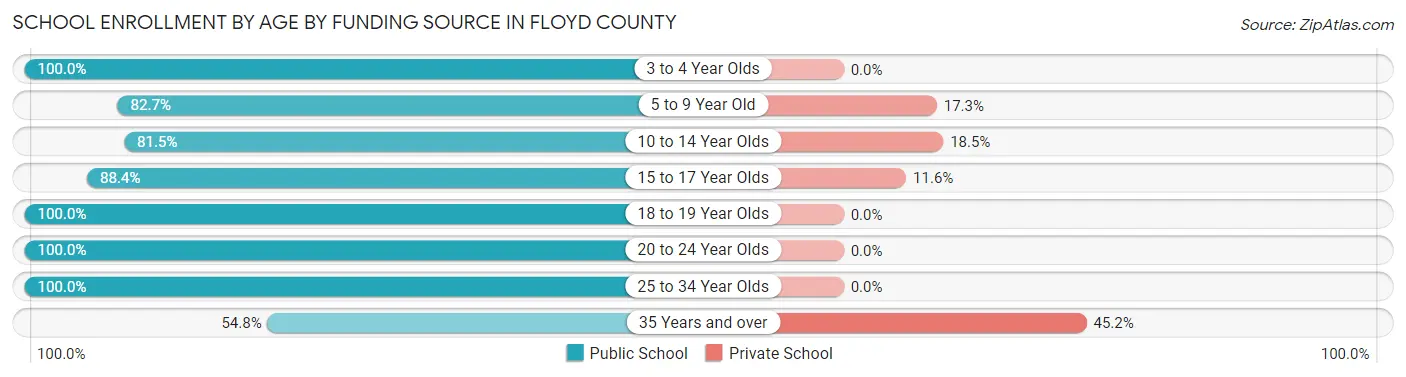
| Age Bracket | Public School | Private School |
| 3 to 4 Year Olds | 71 (100.0%) | 0 (0.0%) |
| 5 to 9 Year Old | 348 (82.7%) | 73 (17.3%) |
| 10 to 14 Year Olds | 312 (81.5%) | 71 (18.5%) |
| 15 to 17 Year Olds | 167 (88.4%) | 22 (11.6%) |
| 18 to 19 Year Olds | 95 (100.0%) | 0 (0.0%) |
| 20 to 24 Year Olds | 76 (100.0%) | 0 (0.0%) |
| 25 to 34 Year Olds | 6 (100.0%) | 0 (0.0%) |
| 35 Years and over | 23 (54.8%) | 19 (45.2%) |
| Total | 1,098 (85.6%) | 185 (14.4%) |
Educational Attainment by Field of Study in Floyd County
Education (120 | 20.5%), business (79 | 13.5%), arts & humanities (76 | 13.0%), bio, nature & agricultural (67 | 11.4%), and social sciences (56 | 9.6%) are the most common fields of study among 586 individuals in Floyd County who have obtained a bachelor's degree or higher.
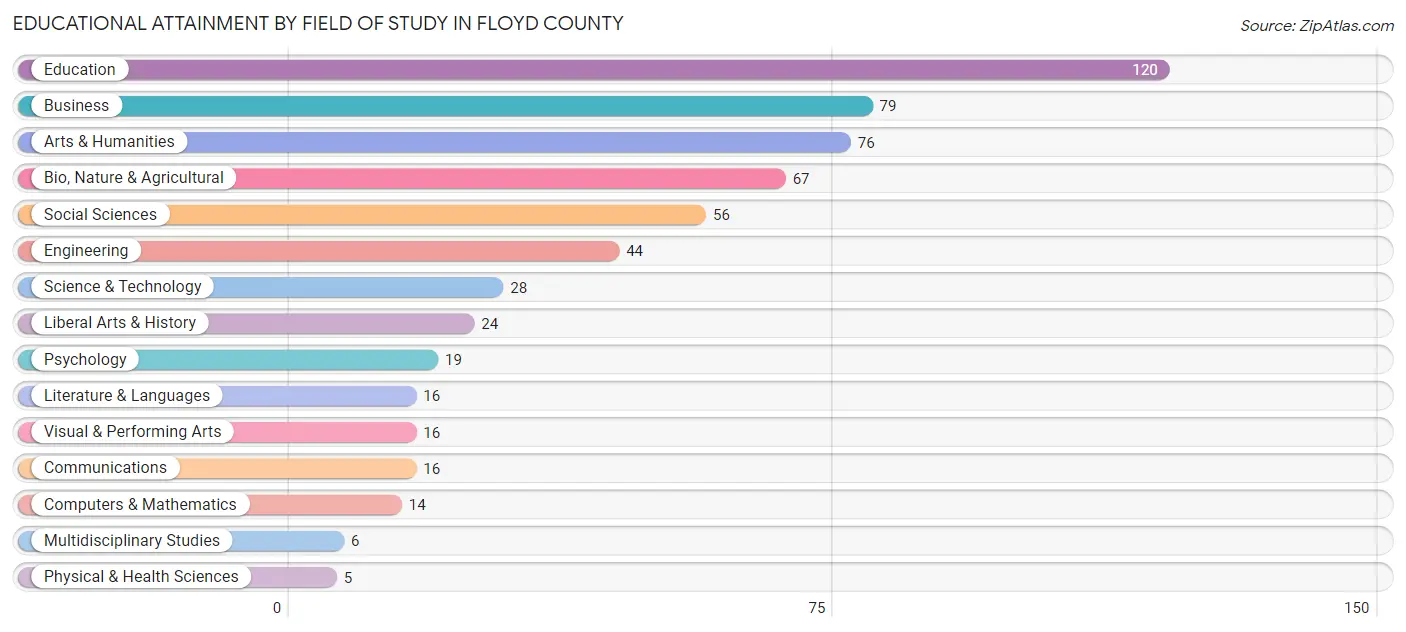
| Field of Study | # Graduates | % Graduates |
| Computers & Mathematics | 14 | 2.4% |
| Bio, Nature & Agricultural | 67 | 11.4% |
| Physical & Health Sciences | 5 | 0.9% |
| Psychology | 19 | 3.2% |
| Social Sciences | 56 | 9.6% |
| Engineering | 44 | 7.5% |
| Multidisciplinary Studies | 6 | 1.0% |
| Science & Technology | 28 | 4.8% |
| Business | 79 | 13.5% |
| Education | 120 | 20.5% |
| Literature & Languages | 16 | 2.7% |
| Liberal Arts & History | 24 | 4.1% |
| Visual & Performing Arts | 16 | 2.7% |
| Communications | 16 | 2.7% |
| Arts & Humanities | 76 | 13.0% |
| Total | 586 | 100.0% |
Transportation & Commute in Floyd County
Vehicle Availability by Sex in Floyd County
The most prevalent vehicle ownership categories in Floyd County are males with 3 vehicles (364, accounting for 34.1%) and females with 3 vehicles (342, making up 32.5%).
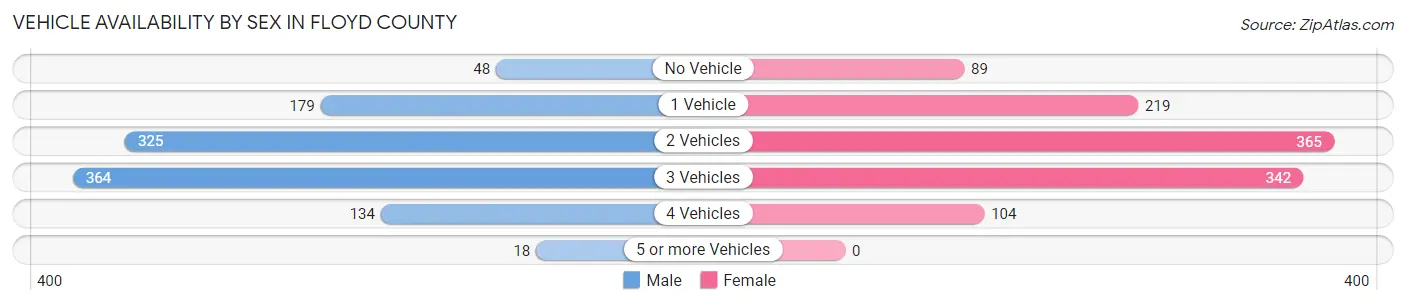
| Vehicles Available | Male | Female |
| No Vehicle | 48 (4.5%) | 89 (8.0%) |
| 1 Vehicle | 179 (16.8%) | 219 (19.6%) |
| 2 Vehicles | 325 (30.4%) | 365 (32.6%) |
| 3 Vehicles | 364 (34.1%) | 342 (30.6%) |
| 4 Vehicles | 134 (12.6%) | 104 (9.3%) |
| 5 or more Vehicles | 18 (1.7%) | 0 (0.0%) |
| Total | 1,068 (100.0%) | 1,119 (100.0%) |
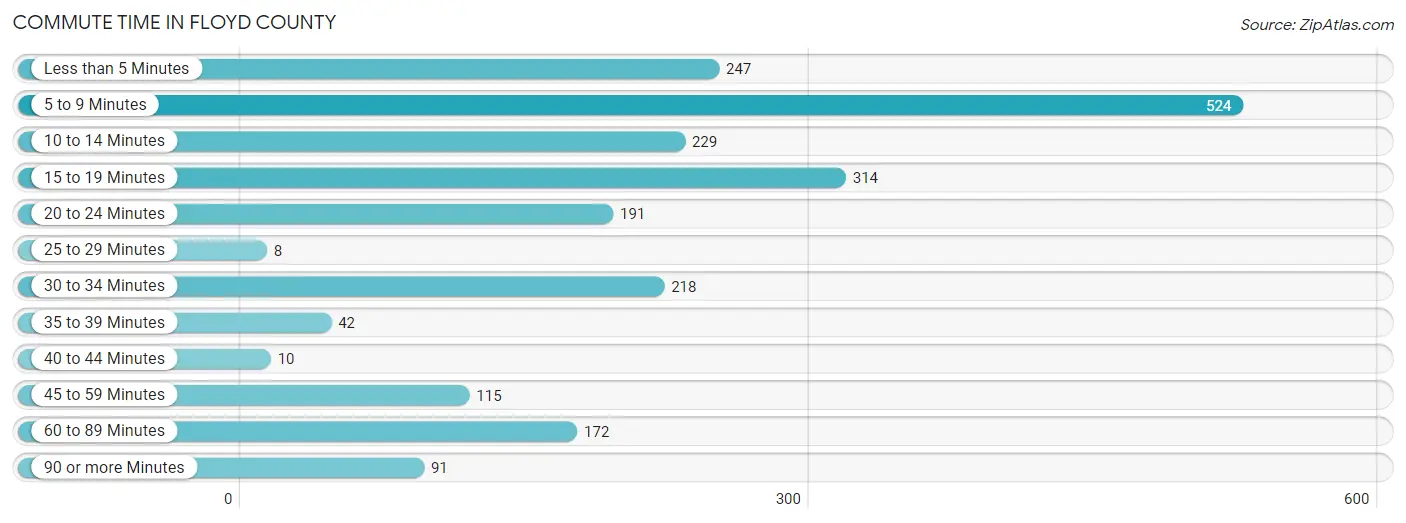
Commute Time in Floyd County
The most frequently occuring commute durations in Floyd County are 5 to 9 minutes (524 commuters, 24.2%), 15 to 19 minutes (314 commuters, 14.5%), and less than 5 minutes (247 commuters, 11.4%).
| Commute Time | # Commuters | % Commuters |
| Less than 5 Minutes | 247 | 11.4% |
| 5 to 9 Minutes | 524 | 24.2% |
| 10 to 14 Minutes | 229 | 10.6% |
| 15 to 19 Minutes | 314 | 14.5% |
| 20 to 24 Minutes | 191 | 8.8% |
| 25 to 29 Minutes | 8 | 0.4% |
| 30 to 34 Minutes | 218 | 10.1% |
| 35 to 39 Minutes | 42 | 1.9% |
| 40 to 44 Minutes | 10 | 0.5% |
| 45 to 59 Minutes | 115 | 5.3% |
| 60 to 89 Minutes | 172 | 8.0% |
| 90 or more Minutes | 91 | 4.2% |
Commute Time by Sex in Floyd County
The most common commute times in Floyd County are 5 to 9 minutes (229 commuters, 21.5%) for males and 5 to 9 minutes (295 commuters, 26.9%) for females.
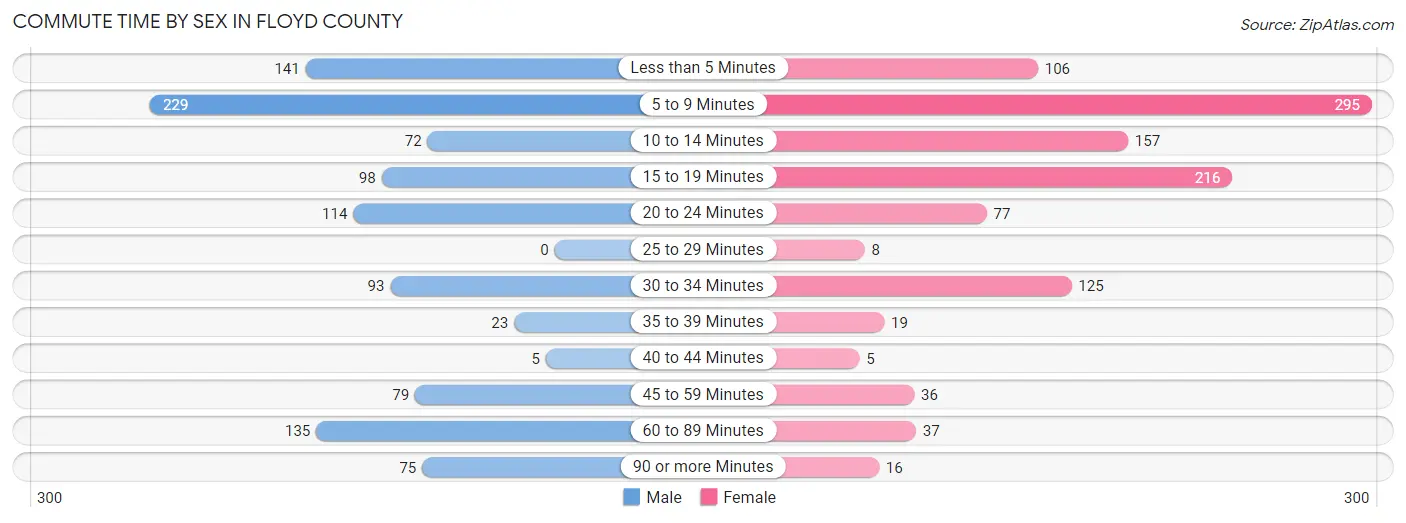
| Commute Time | Male | Female |
| Less than 5 Minutes | 141 (13.3%) | 106 (9.7%) |
| 5 to 9 Minutes | 229 (21.5%) | 295 (26.9%) |
| 10 to 14 Minutes | 72 (6.8%) | 157 (14.3%) |
| 15 to 19 Minutes | 98 (9.2%) | 216 (19.7%) |
| 20 to 24 Minutes | 114 (10.7%) | 77 (7.0%) |
| 25 to 29 Minutes | 0 (0.0%) | 8 (0.7%) |
| 30 to 34 Minutes | 93 (8.7%) | 125 (11.4%) |
| 35 to 39 Minutes | 23 (2.2%) | 19 (1.7%) |
| 40 to 44 Minutes | 5 (0.5%) | 5 (0.5%) |
| 45 to 59 Minutes | 79 (7.4%) | 36 (3.3%) |
| 60 to 89 Minutes | 135 (12.7%) | 37 (3.4%) |
| 90 or more Minutes | 75 (7.0%) | 16 (1.5%) |
Time of Departure to Work by Sex in Floyd County
The most frequent times of departure to work in Floyd County are 7:30 AM to 7:59 AM (190, 17.9%) for males and 7:30 AM to 7:59 AM (253, 23.1%) for females.
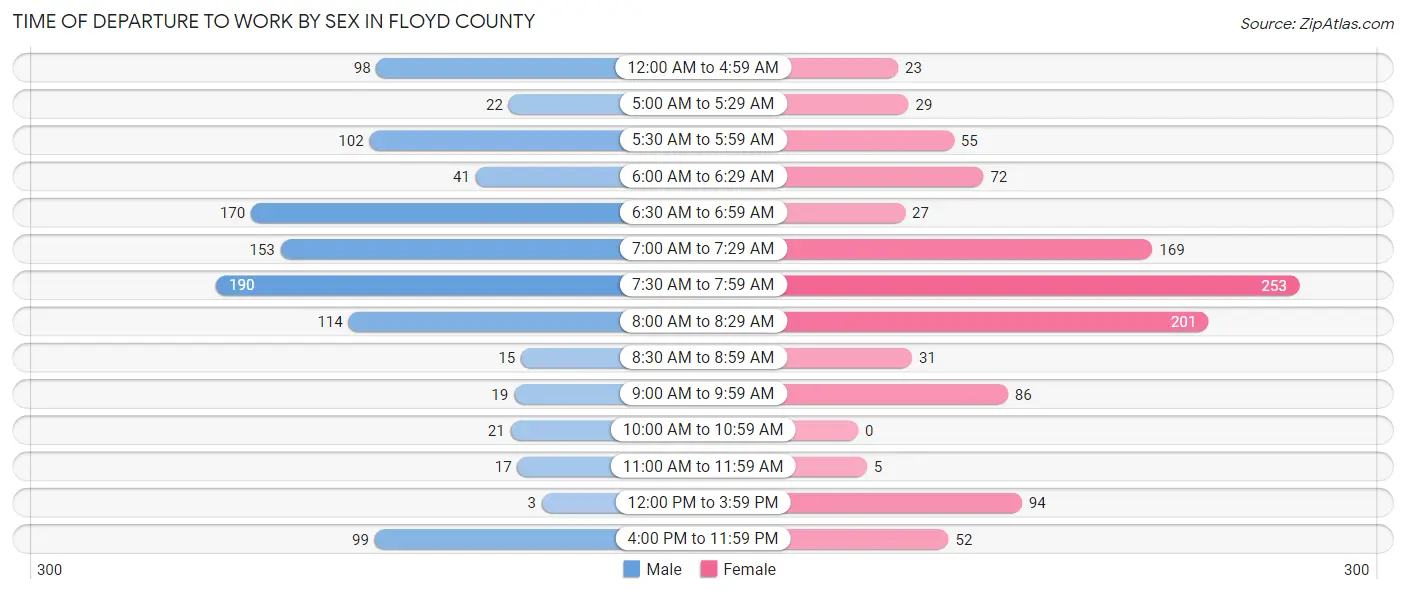
| Time of Departure | Male | Female |
| 12:00 AM to 4:59 AM | 98 (9.2%) | 23 (2.1%) |
| 5:00 AM to 5:29 AM | 22 (2.1%) | 29 (2.6%) |
| 5:30 AM to 5:59 AM | 102 (9.6%) | 55 (5.0%) |
| 6:00 AM to 6:29 AM | 41 (3.8%) | 72 (6.6%) |
| 6:30 AM to 6:59 AM | 170 (16.0%) | 27 (2.5%) |
| 7:00 AM to 7:29 AM | 153 (14.4%) | 169 (15.4%) |
| 7:30 AM to 7:59 AM | 190 (17.9%) | 253 (23.1%) |
| 8:00 AM to 8:29 AM | 114 (10.7%) | 201 (18.3%) |
| 8:30 AM to 8:59 AM | 15 (1.4%) | 31 (2.8%) |
| 9:00 AM to 9:59 AM | 19 (1.8%) | 86 (7.8%) |
| 10:00 AM to 10:59 AM | 21 (2.0%) | 0 (0.0%) |
| 11:00 AM to 11:59 AM | 17 (1.6%) | 5 (0.5%) |
| 12:00 PM to 3:59 PM | 3 (0.3%) | 94 (8.6%) |
| 4:00 PM to 11:59 PM | 99 (9.3%) | 52 (4.7%) |
| Total | 1,064 (100.0%) | 1,097 (100.0%) |
Housing Occupancy in Floyd County
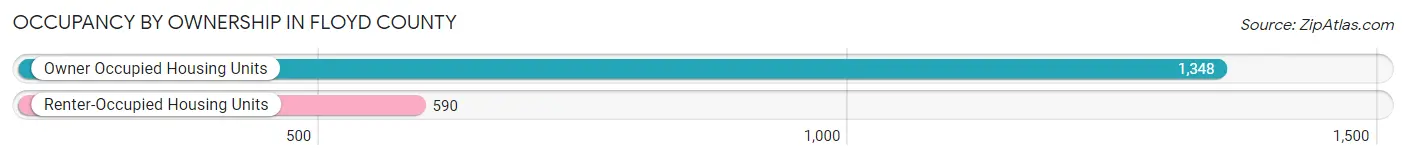
Occupancy by Ownership in Floyd County
Of the total 1,938 dwellings in Floyd County, owner-occupied units account for 1,348 (69.6%), while renter-occupied units make up 590 (30.4%).
| Occupancy | # Housing Units | % Housing Units |
| Owner Occupied Housing Units | 1,348 | 69.6% |
| Renter-Occupied Housing Units | 590 | 30.4% |
| Total Occupied Housing Units | 1,938 | 100.0% |
Occupancy by Household Size in Floyd County
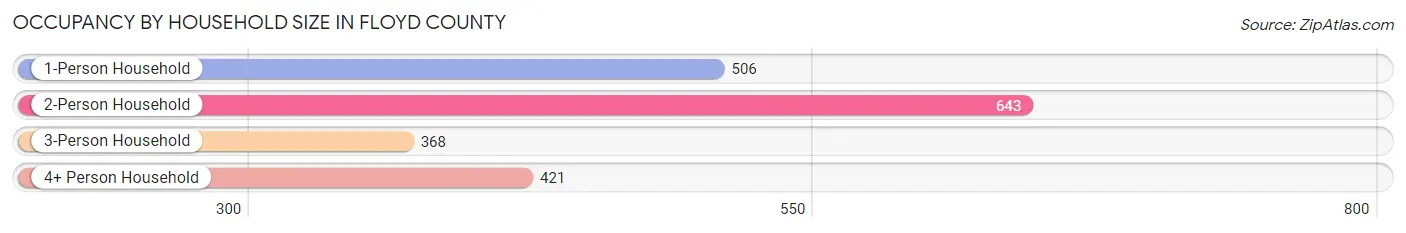
| Household Size | # Housing Units | % Housing Units |
| 1-Person Household | 506 | 26.1% |
| 2-Person Household | 643 | 33.2% |
| 3-Person Household | 368 | 19.0% |
| 4+ Person Household | 421 | 21.7% |
| Total Housing Units | 1,938 | 100.0% |
Occupancy by Ownership by Household Size in Floyd County
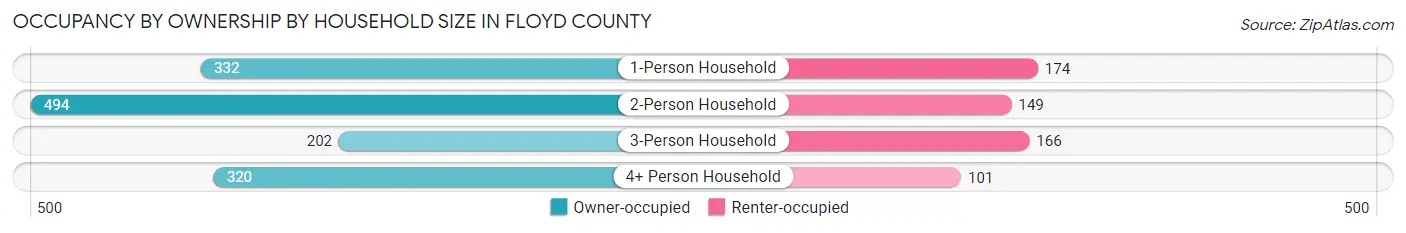
| Household Size | Owner-occupied | Renter-occupied |
| 1-Person Household | 332 (65.6%) | 174 (34.4%) |
| 2-Person Household | 494 (76.8%) | 149 (23.2%) |
| 3-Person Household | 202 (54.9%) | 166 (45.1%) |
| 4+ Person Household | 320 (76.0%) | 101 (24.0%) |
| Total Housing Units | 1,348 (69.6%) | 590 (30.4%) |
Occupancy by Educational Attainment in Floyd County
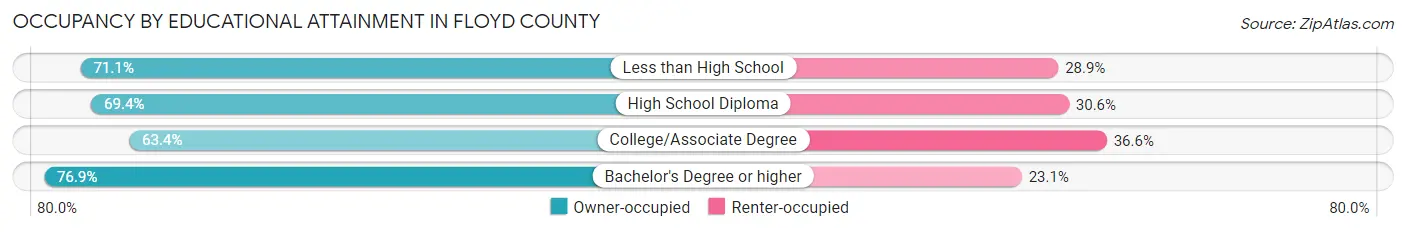
| Household Size | Owner-occupied | Renter-occupied |
| Less than High School | 340 (71.1%) | 138 (28.9%) |
| High School Diploma | 359 (69.4%) | 158 (30.6%) |
| College/Associate Degree | 359 (63.4%) | 207 (36.6%) |
| Bachelor's Degree or higher | 290 (76.9%) | 87 (23.1%) |
Occupancy by Age of Householder in Floyd County
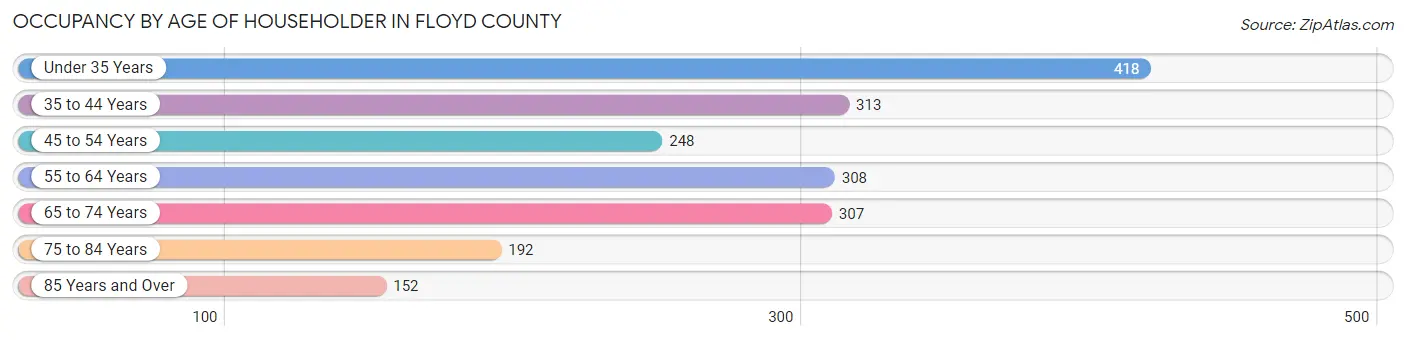
| Age Bracket | # Households | % Households |
| Under 35 Years | 418 | 21.6% |
| 35 to 44 Years | 313 | 16.2% |
| 45 to 54 Years | 248 | 12.8% |
| 55 to 64 Years | 308 | 15.9% |
| 65 to 74 Years | 307 | 15.8% |
| 75 to 84 Years | 192 | 9.9% |
| 85 Years and Over | 152 | 7.8% |
| Total | 1,938 | 100.0% |
Housing Finances in Floyd County
Median Income by Occupancy in Floyd County
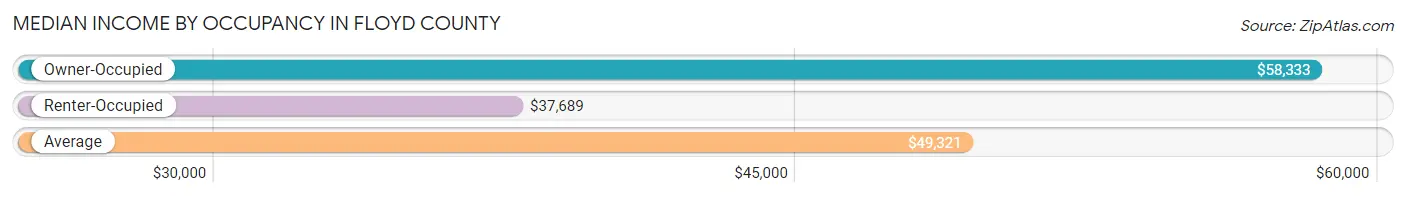
| Occupancy Type | # Households | Median Income |
| Owner-Occupied | 1,348 (69.6%) | $58,333 |
| Renter-Occupied | 590 (30.4%) | $37,689 |
| Average | 1,938 (100.0%) | $49,321 |
Occupancy by Householder Income Bracket in Floyd County
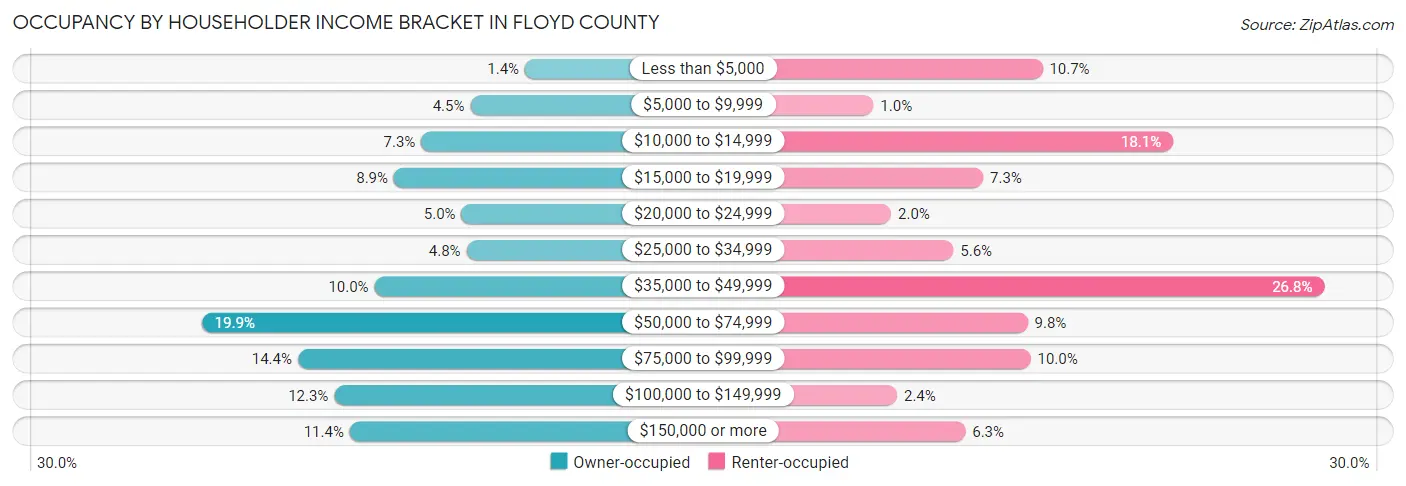
| Income Bracket | Owner-occupied | Renter-occupied |
| Less than $5,000 | 19 (1.4%) | 63 (10.7%) |
| $5,000 to $9,999 | 61 (4.5%) | 6 (1.0%) |
| $10,000 to $14,999 | 99 (7.3%) | 107 (18.1%) |
| $15,000 to $19,999 | 120 (8.9%) | 43 (7.3%) |
| $20,000 to $24,999 | 68 (5.0%) | 12 (2.0%) |
| $25,000 to $34,999 | 64 (4.8%) | 33 (5.6%) |
| $35,000 to $49,999 | 135 (10.0%) | 158 (26.8%) |
| $50,000 to $74,999 | 268 (19.9%) | 58 (9.8%) |
| $75,000 to $99,999 | 194 (14.4%) | 59 (10.0%) |
| $100,000 to $149,999 | 166 (12.3%) | 14 (2.4%) |
| $150,000 or more | 154 (11.4%) | 37 (6.3%) |
| Total | 1,348 (100.0%) | 590 (100.0%) |
Monthly Housing Cost Tiers in Floyd County
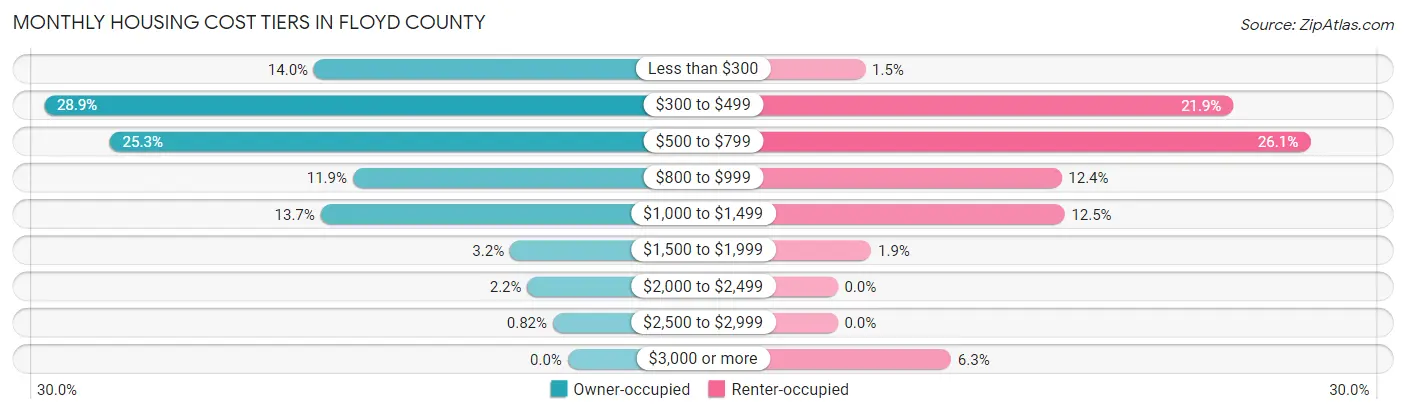
| Monthly Cost | Owner-occupied | Renter-occupied |
| Less than $300 | 189 (14.0%) | 9 (1.5%) |
| $300 to $499 | 390 (28.9%) | 129 (21.9%) |
| $500 to $799 | 341 (25.3%) | 154 (26.1%) |
| $800 to $999 | 160 (11.9%) | 73 (12.4%) |
| $1,000 to $1,499 | 184 (13.7%) | 74 (12.5%) |
| $1,500 to $1,999 | 43 (3.2%) | 11 (1.9%) |
| $2,000 to $2,499 | 30 (2.2%) | 0 (0.0%) |
| $2,500 to $2,999 | 11 (0.8%) | 0 (0.0%) |
| $3,000 or more | 0 (0.0%) | 37 (6.3%) |
| Total | 1,348 (100.0%) | 590 (100.0%) |
Physical Housing Characteristics in Floyd County
Housing Structures in Floyd County
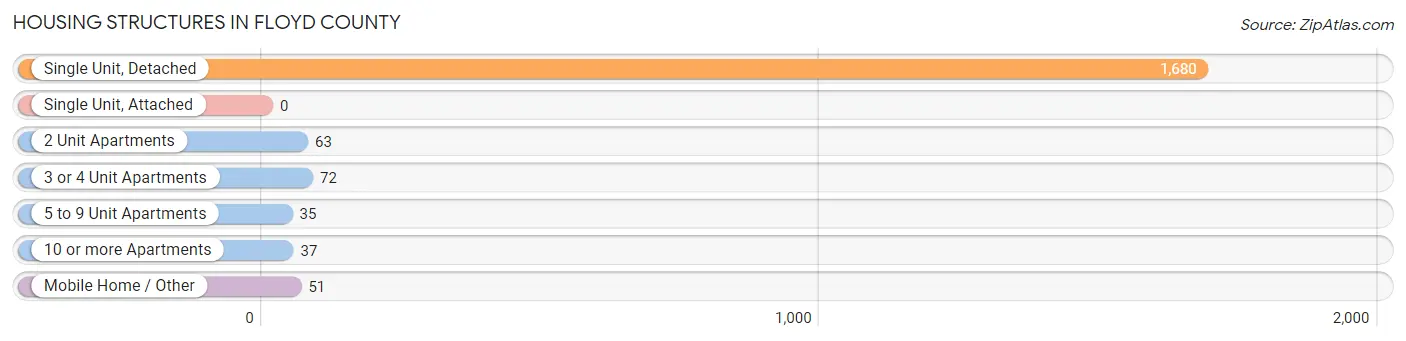
| Structure Type | # Housing Units | % Housing Units |
| Single Unit, Detached | 1,680 | 86.7% |
| Single Unit, Attached | 0 | 0.0% |
| 2 Unit Apartments | 63 | 3.3% |
| 3 or 4 Unit Apartments | 72 | 3.7% |
| 5 to 9 Unit Apartments | 35 | 1.8% |
| 10 or more Apartments | 37 | 1.9% |
| Mobile Home / Other | 51 | 2.6% |
| Total | 1,938 | 100.0% |
Housing Structures by Occupancy in Floyd County
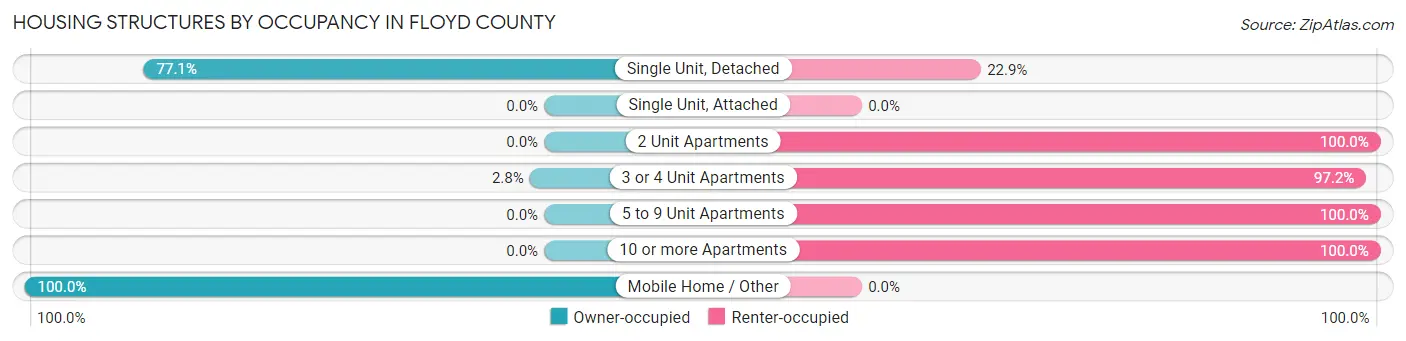
| Structure Type | Owner-occupied | Renter-occupied |
| Single Unit, Detached | 1,295 (77.1%) | 385 (22.9%) |
| Single Unit, Attached | 0 (0.0%) | 0 (0.0%) |
| 2 Unit Apartments | 0 (0.0%) | 63 (100.0%) |
| 3 or 4 Unit Apartments | 2 (2.8%) | 70 (97.2%) |
| 5 to 9 Unit Apartments | 0 (0.0%) | 35 (100.0%) |
| 10 or more Apartments | 0 (0.0%) | 37 (100.0%) |
| Mobile Home / Other | 51 (100.0%) | 0 (0.0%) |
| Total | 1,348 (69.6%) | 590 (30.4%) |
Housing Structures by Number of Rooms in Floyd County
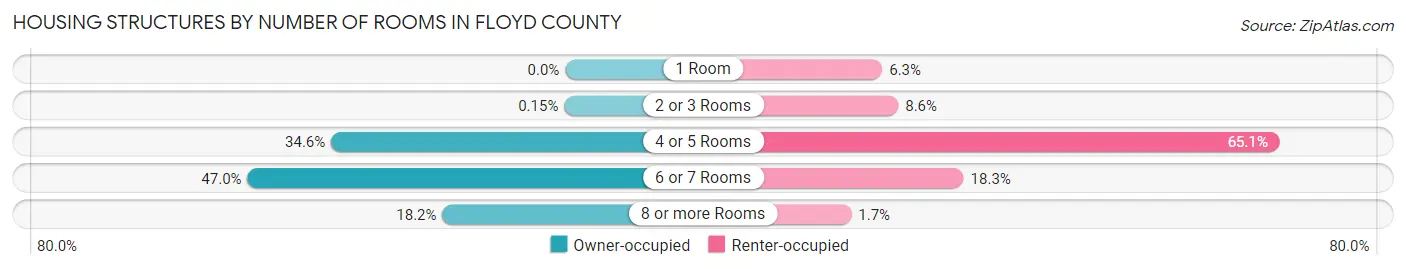
| Number of Rooms | Owner-occupied | Renter-occupied |
| 1 Room | 0 (0.0%) | 37 (6.3%) |
| 2 or 3 Rooms | 2 (0.2%) | 51 (8.6%) |
| 4 or 5 Rooms | 467 (34.6%) | 384 (65.1%) |
| 6 or 7 Rooms | 634 (47.0%) | 108 (18.3%) |
| 8 or more Rooms | 245 (18.2%) | 10 (1.7%) |
| Total | 1,348 (100.0%) | 590 (100.0%) |
Housing Structure by Heating Type in Floyd County
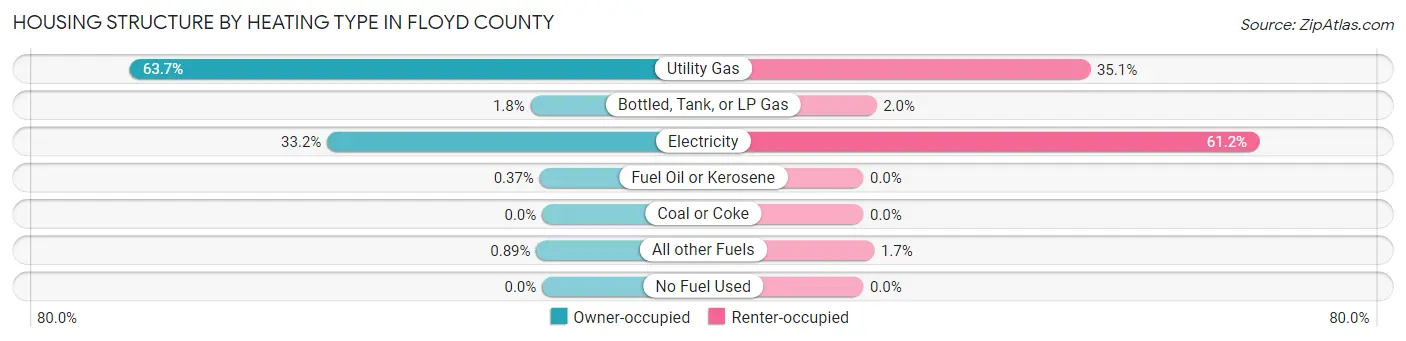
| Heating Type | Owner-occupied | Renter-occupied |
| Utility Gas | 859 (63.7%) | 207 (35.1%) |
| Bottled, Tank, or LP Gas | 24 (1.8%) | 12 (2.0%) |
| Electricity | 448 (33.2%) | 361 (61.2%) |
| Fuel Oil or Kerosene | 5 (0.4%) | 0 (0.0%) |
| Coal or Coke | 0 (0.0%) | 0 (0.0%) |
| All other Fuels | 12 (0.9%) | 10 (1.7%) |
| No Fuel Used | 0 (0.0%) | 0 (0.0%) |
| Total | 1,348 (100.0%) | 590 (100.0%) |
Household Vehicle Usage in Floyd County
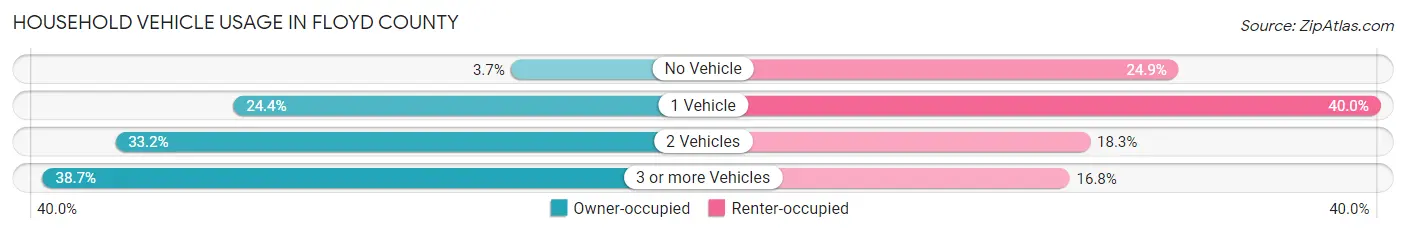
| Vehicles per Household | Owner-occupied | Renter-occupied |
| No Vehicle | 50 (3.7%) | 147 (24.9%) |
| 1 Vehicle | 329 (24.4%) | 236 (40.0%) |
| 2 Vehicles | 448 (33.2%) | 108 (18.3%) |
| 3 or more Vehicles | 521 (38.7%) | 99 (16.8%) |
| Total | 1,348 (100.0%) | 590 (100.0%) |
Real Estate & Mortgages in Floyd County
Real Estate and Mortgage Overview in Floyd County
| Characteristic | Without Mortgage | With Mortgage |
| Housing Units | 917 | 431 |
| Median Property Value | $81,300 | $98,200 |
| Median Household Income | $45,268 | $64 |
| Monthly Housing Costs | $434 | $0 |
| Real Estate Taxes | $970 | $66 |
Property Value by Mortgage Status in Floyd County
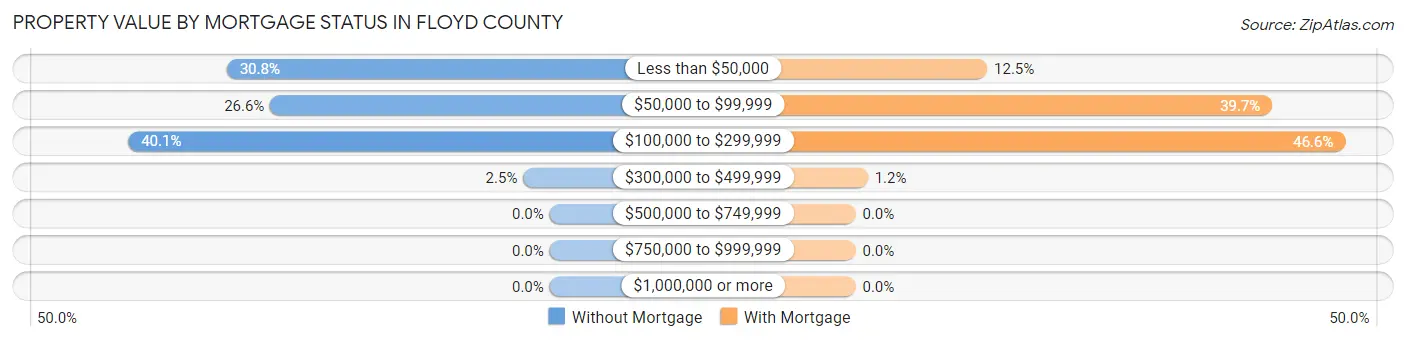
| Property Value | Without Mortgage | With Mortgage |
| Less than $50,000 | 282 (30.7%) | 54 (12.5%) |
| $50,000 to $99,999 | 244 (26.6%) | 171 (39.7%) |
| $100,000 to $299,999 | 368 (40.1%) | 201 (46.6%) |
| $300,000 to $499,999 | 23 (2.5%) | 5 (1.2%) |
| $500,000 to $749,999 | 0 (0.0%) | 0 (0.0%) |
| $750,000 to $999,999 | 0 (0.0%) | 0 (0.0%) |
| $1,000,000 or more | 0 (0.0%) | 0 (0.0%) |
| Total | 917 (100.0%) | 431 (100.0%) |
Household Income by Mortgage Status in Floyd County
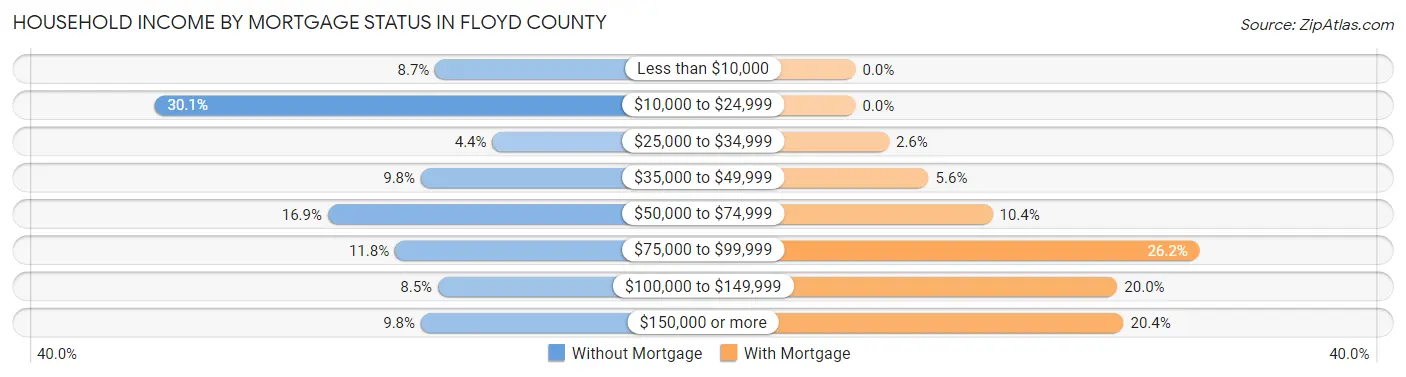
| Household Income | Without Mortgage | With Mortgage |
| Less than $10,000 | 80 (8.7%) | 0 (0.0%) |
| $10,000 to $24,999 | 276 (30.1%) | 0 (0.0%) |
| $25,000 to $34,999 | 40 (4.4%) | 11 (2.5%) |
| $35,000 to $49,999 | 90 (9.8%) | 24 (5.6%) |
| $50,000 to $74,999 | 155 (16.9%) | 45 (10.4%) |
| $75,000 to $99,999 | 108 (11.8%) | 113 (26.2%) |
| $100,000 to $149,999 | 78 (8.5%) | 86 (20.0%) |
| $150,000 or more | 90 (9.8%) | 88 (20.4%) |
| Total | 917 (100.0%) | 431 (100.0%) |
Property Value to Household Income Ratio in Floyd County
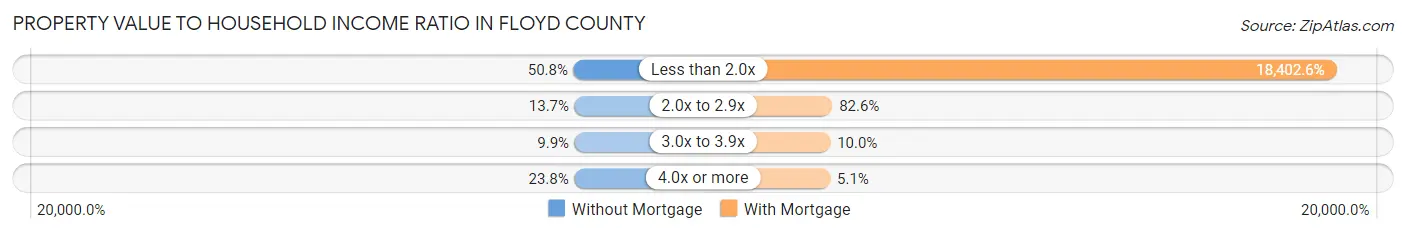
| Value-to-Income Ratio | Without Mortgage | With Mortgage |
| Less than 2.0x | 466 (50.8%) | 79,315 (18,402.5%) |
| 2.0x to 2.9x | 126 (13.7%) | 356 (82.6%) |
| 3.0x to 3.9x | 91 (9.9%) | 43 (10.0%) |
| 4.0x or more | 218 (23.8%) | 22 (5.1%) |
| Total | 917 (100.0%) | 431 (100.0%) |
Real Estate Taxes by Mortgage Status in Floyd County
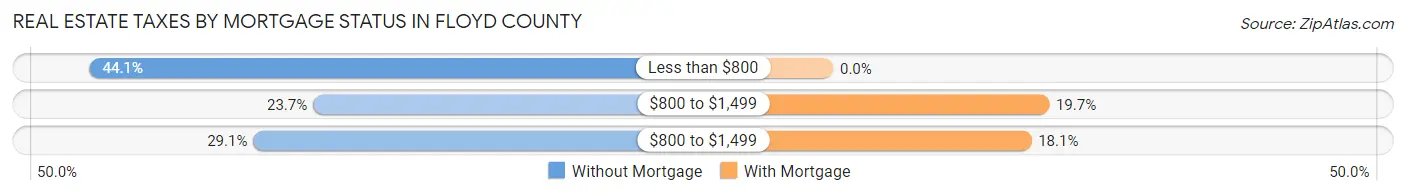
| Property Taxes | Without Mortgage | With Mortgage |
| Less than $800 | 404 (44.1%) | 0 (0.0%) |
| $800 to $1,499 | 217 (23.7%) | 85 (19.7%) |
| $800 to $1,499 | 267 (29.1%) | 78 (18.1%) |
| Total | 917 (100.0%) | 431 (100.0%) |
Health & Disability in Floyd County
Health Insurance Coverage by Age in Floyd County
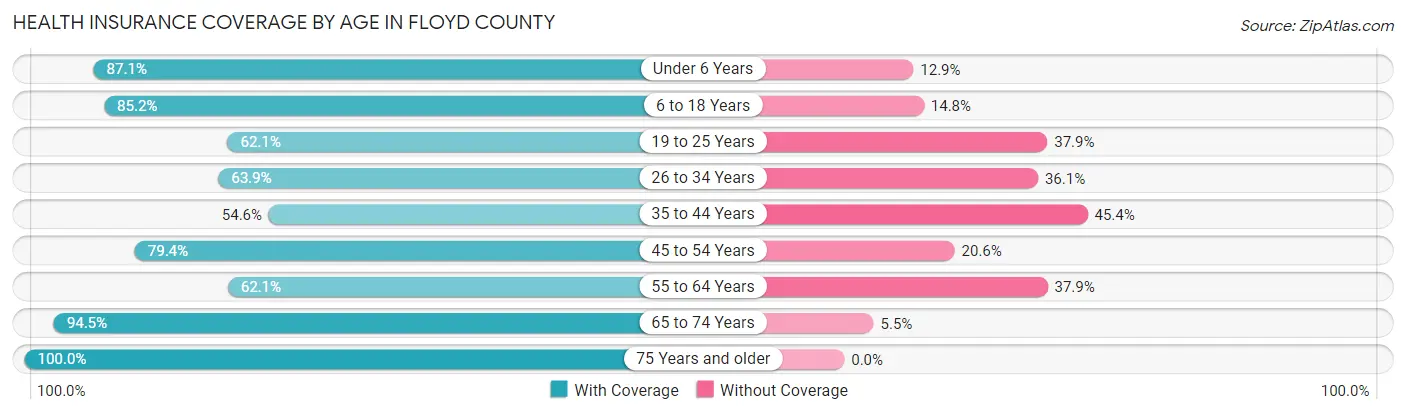
| Age Bracket | With Coverage | Without Coverage |
| Under 6 Years | 406 (87.1%) | 60 (12.9%) |
| 6 to 18 Years | 861 (85.2%) | 150 (14.8%) |
| 19 to 25 Years | 320 (62.1%) | 195 (37.9%) |
| 26 to 34 Years | 405 (63.9%) | 229 (36.1%) |
| 35 to 44 Years | 359 (54.6%) | 298 (45.4%) |
| 45 to 54 Years | 363 (79.4%) | 94 (20.6%) |
| 55 to 64 Years | 408 (62.1%) | 249 (37.9%) |
| 65 to 74 Years | 433 (94.5%) | 25 (5.5%) |
| 75 Years and older | 501 (100.0%) | 0 (0.0%) |
| Total | 4,056 (75.7%) | 1,300 (24.3%) |
Health Insurance Coverage by Citizenship Status in Floyd County
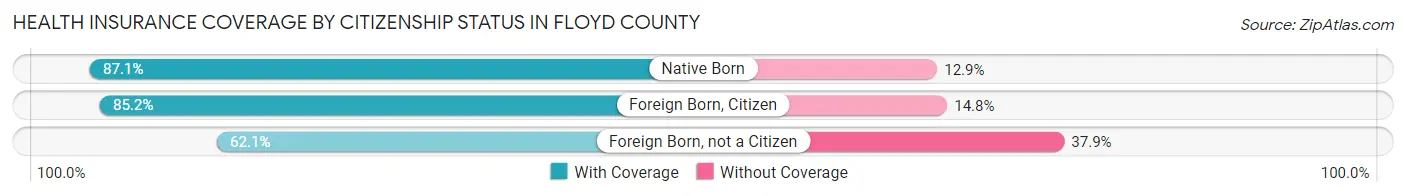
| Citizenship Status | With Coverage | Without Coverage |
| Native Born | 406 (87.1%) | 60 (12.9%) |
| Foreign Born, Citizen | 861 (85.2%) | 150 (14.8%) |
| Foreign Born, not a Citizen | 320 (62.1%) | 195 (37.9%) |
Health Insurance Coverage by Household Income in Floyd County
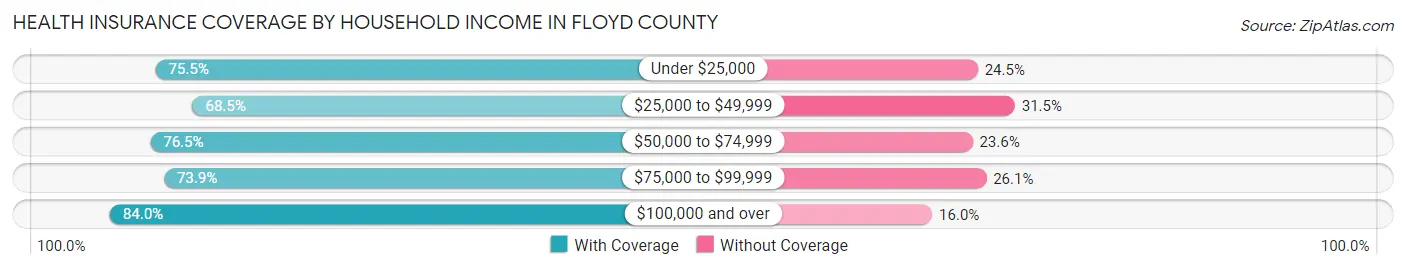
| Household Income | With Coverage | Without Coverage |
| Under $25,000 | 889 (75.5%) | 289 (24.5%) |
| $25,000 to $49,999 | 710 (68.5%) | 326 (31.5%) |
| $50,000 to $74,999 | 792 (76.4%) | 244 (23.5%) |
| $75,000 to $99,999 | 761 (73.9%) | 269 (26.1%) |
| $100,000 and over | 904 (84.0%) | 172 (16.0%) |
Public vs Private Health Insurance Coverage by Age in Floyd County
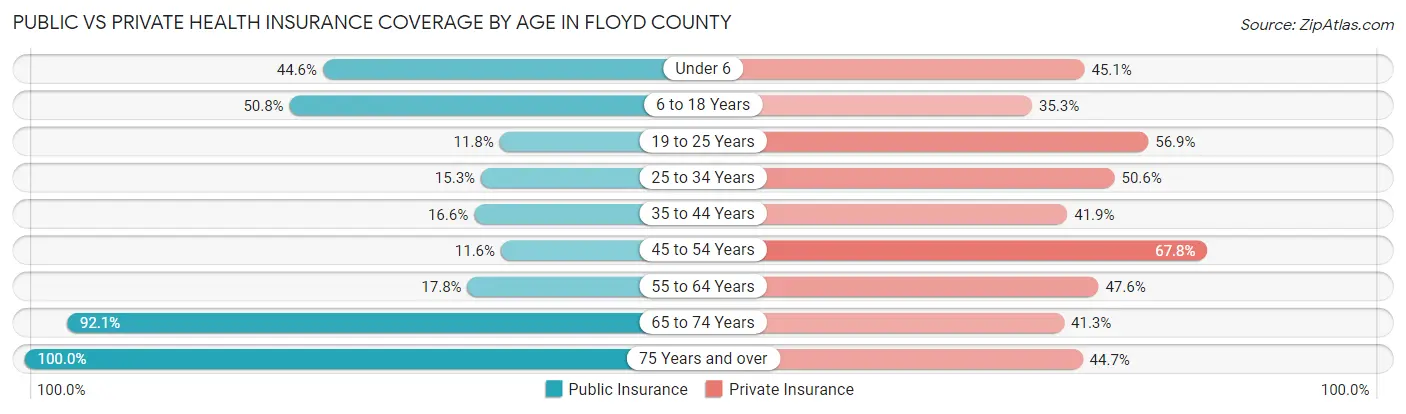
| Age Bracket | Public Insurance | Private Insurance |
| Under 6 | 208 (44.6%) | 210 (45.1%) |
| 6 to 18 Years | 514 (50.8%) | 357 (35.3%) |
| 19 to 25 Years | 61 (11.8%) | 293 (56.9%) |
| 25 to 34 Years | 97 (15.3%) | 321 (50.6%) |
| 35 to 44 Years | 109 (16.6%) | 275 (41.9%) |
| 45 to 54 Years | 53 (11.6%) | 310 (67.8%) |
| 55 to 64 Years | 117 (17.8%) | 313 (47.6%) |
| 65 to 74 Years | 422 (92.1%) | 189 (41.3%) |
| 75 Years and over | 501 (100.0%) | 224 (44.7%) |
| Total | 2,082 (38.9%) | 2,492 (46.5%) |
Disability Status by Sex by Age in Floyd County
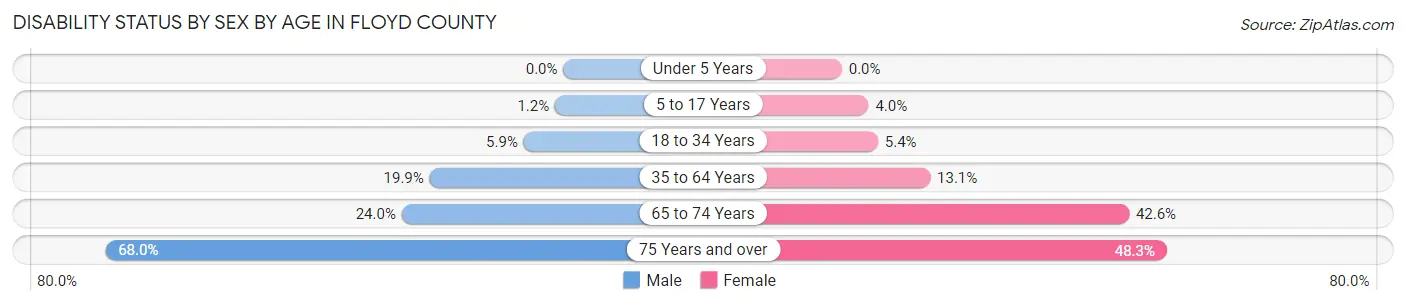
| Age Bracket | Male | Female |
| Under 5 Years | 0 (0.0%) | 0 (0.0%) |
| 5 to 17 Years | 7 (1.2%) | 20 (4.0%) |
| 18 to 34 Years | 34 (5.9%) | 34 (5.3%) |
| 35 to 64 Years | 176 (19.9%) | 116 (13.1%) |
| 65 to 74 Years | 48 (24.0%) | 110 (42.6%) |
| 75 Years and over | 166 (68.0%) | 124 (48.2%) |
Disability Class by Sex by Age in Floyd County
Disability Class: Hearing Difficulty
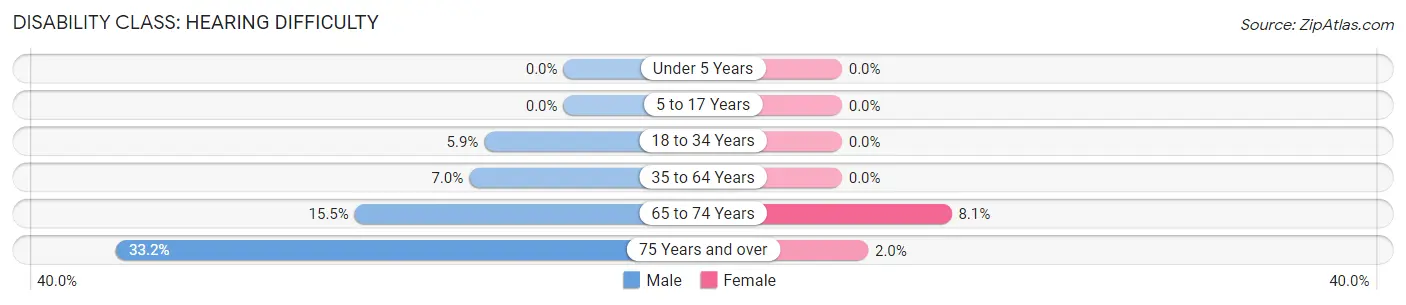
| Age Bracket | Male | Female |
| Under 5 Years | 0 (0.0%) | 0 (0.0%) |
| 5 to 17 Years | 0 (0.0%) | 0 (0.0%) |
| 18 to 34 Years | 34 (5.9%) | 0 (0.0%) |
| 35 to 64 Years | 62 (7.0%) | 0 (0.0%) |
| 65 to 74 Years | 31 (15.5%) | 21 (8.1%) |
| 75 Years and over | 81 (33.2%) | 5 (1.9%) |
Disability Class: Vision Difficulty
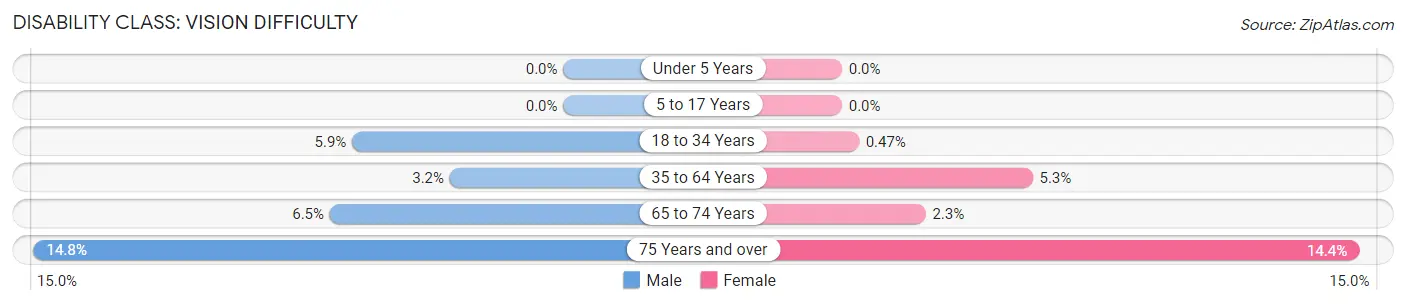
| Age Bracket | Male | Female |
| Under 5 Years | 0 (0.0%) | 0 (0.0%) |
| 5 to 17 Years | 0 (0.0%) | 0 (0.0%) |
| 18 to 34 Years | 34 (5.9%) | 3 (0.5%) |
| 35 to 64 Years | 28 (3.2%) | 47 (5.3%) |
| 65 to 74 Years | 13 (6.5%) | 6 (2.3%) |
| 75 Years and over | 36 (14.7%) | 37 (14.4%) |
Disability Class: Cognitive Difficulty
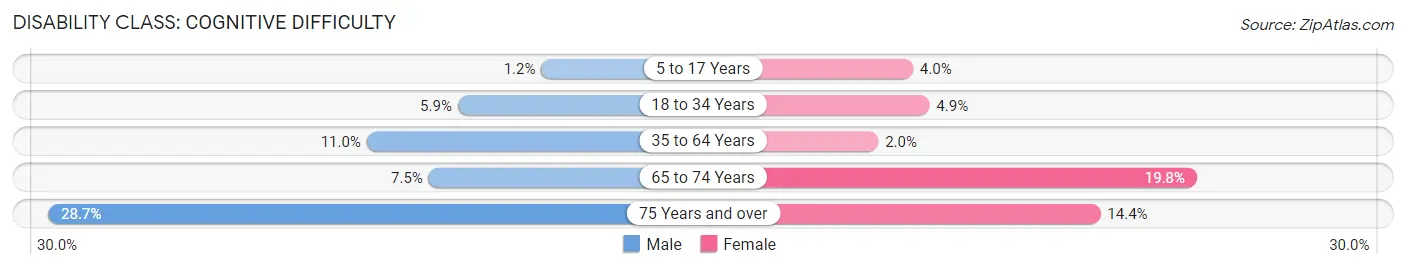
| Age Bracket | Male | Female |
| 5 to 17 Years | 7 (1.2%) | 20 (4.0%) |
| 18 to 34 Years | 34 (5.9%) | 31 (4.9%) |
| 35 to 64 Years | 97 (11.0%) | 18 (2.0%) |
| 65 to 74 Years | 15 (7.5%) | 51 (19.8%) |
| 75 Years and over | 70 (28.7%) | 37 (14.4%) |
Disability Class: Ambulatory Difficulty
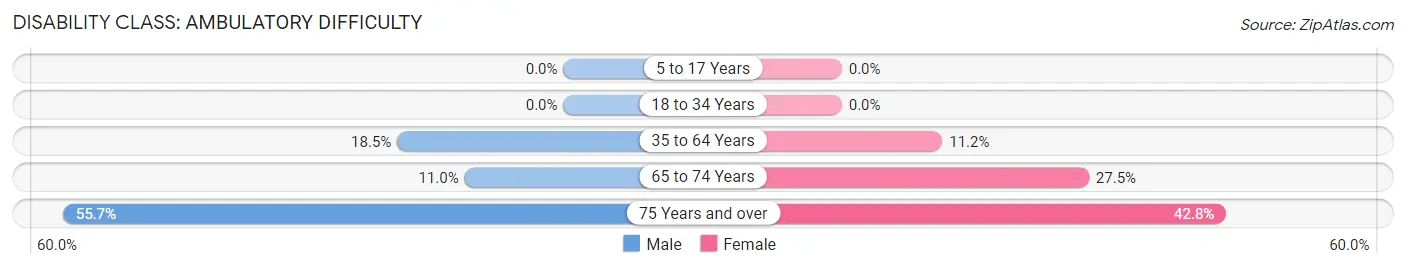
| Age Bracket | Male | Female |
| 5 to 17 Years | 0 (0.0%) | 0 (0.0%) |
| 18 to 34 Years | 0 (0.0%) | 0 (0.0%) |
| 35 to 64 Years | 164 (18.5%) | 99 (11.2%) |
| 65 to 74 Years | 22 (11.0%) | 71 (27.5%) |
| 75 Years and over | 136 (55.7%) | 110 (42.8%) |
Disability Class: Self-Care Difficulty
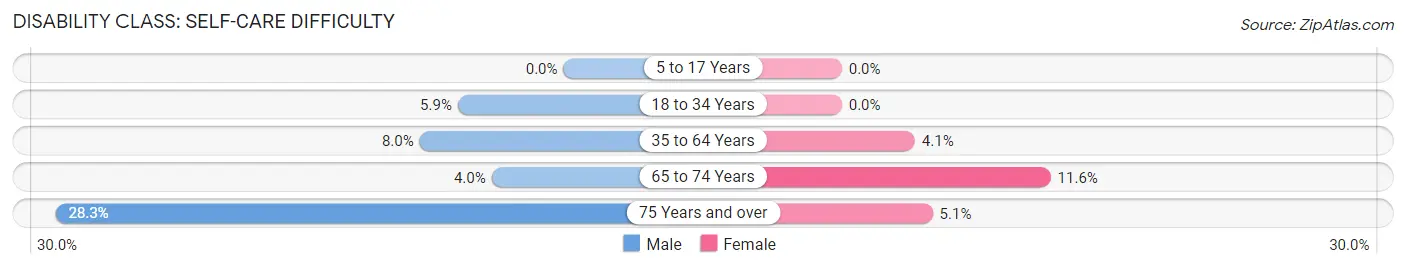
| Age Bracket | Male | Female |
| 5 to 17 Years | 0 (0.0%) | 0 (0.0%) |
| 18 to 34 Years | 34 (5.9%) | 0 (0.0%) |
| 35 to 64 Years | 71 (8.0%) | 36 (4.1%) |
| 65 to 74 Years | 8 (4.0%) | 30 (11.6%) |
| 75 Years and over | 69 (28.3%) | 13 (5.1%) |
Technology Access in Floyd County
Computing Device Access in Floyd County
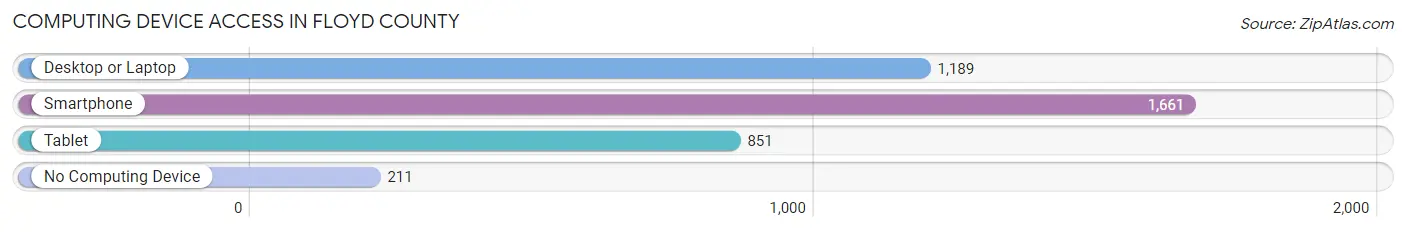
| Device Type | # Households | % Households |
| Desktop or Laptop | 1,189 | 61.4% |
| Smartphone | 1,661 | 85.7% |
| Tablet | 851 | 43.9% |
| No Computing Device | 211 | 10.9% |
| Total | 1,938 | 100.0% |
Internet Access in Floyd County
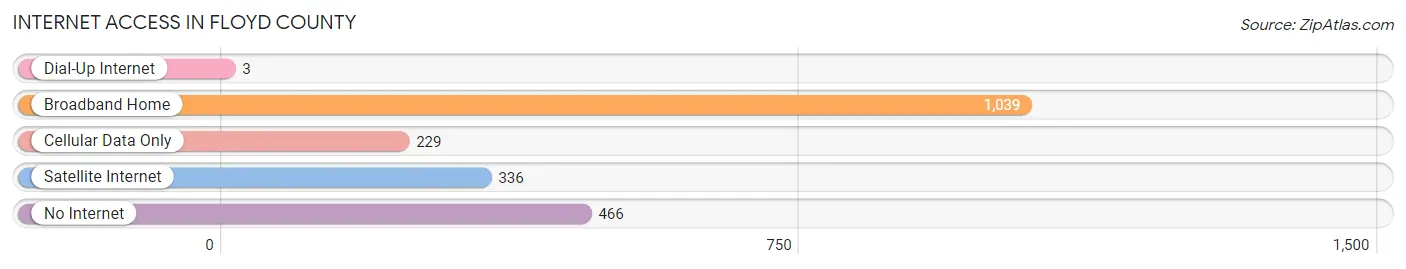
| Internet Type | # Households | % Households |
| Dial-Up Internet | 3 | 0.2% |
| Broadband Home | 1,039 | 53.6% |
| Cellular Data Only | 229 | 11.8% |
| Satellite Internet | 336 | 17.3% |
| No Internet | 466 | 24.0% |
| Total | 1,938 | 100.0% |
Floyd County Summary
Floyd County is located in the northern part of the state of Texas, in the United States. It is bordered by Motley County to the north, Hall County to the east, Crosby County to the south, and Briscoe County to the west. The county seat is Floydada, and the largest city is Lockney. The county was named for Davis Floyd, a signer of the Texas Declaration of Independence.
Geography
Floyd County covers an area of 902 square miles, making it the second-smallest county in Texas. The terrain is mostly flat, with some rolling hills in the western part of the county. The county is drained by the North Fork of the Double Mountain Fork of the Brazos River, which flows through the center of the county. The county is located in the High Plains region of Texas, and is characterized by dry, hot summers and cold winters. The average annual precipitation is 19.5 inches.
Demographics
As of the 2010 census, the population of Floyd County was 6,446, a decrease of 4.3% from the 2000 census. The population density was 7.1 people per square mile. The racial makeup of the county was 79.2% White, 0.7% African American, 0.5% Native American, 0.2% Asian, 16.7% from other races, and 2.7% from two or more races. Hispanic or Latino of any race were 33.2% of the population.
The median income for a household in the county was $31,944, and the median income for a family was $37,813. The per capita income for the county was $15,845. About 17.2% of families and 21.2% of the population were below the poverty line, including 28.2% of those under age 18 and 15.2% of those age 65 or over.
Economy
Agriculture is the main economic activity in Floyd County. The county is home to a variety of crops, including cotton, corn, wheat, sorghum, and hay. Cattle and sheep are also raised in the county.
The county is also home to several oil and gas fields, which provide jobs and revenue for the county. The county is served by the Floydada Independent School District, which provides educational services to the county's students.
History
Floyd County was established in 1876 from portions of Bexar and Young counties. The county was named for Davis Floyd, a signer of the Texas Declaration of Independence. The county seat was originally located in Lockney, but was moved to Floydada in 1891.
The county was largely agricultural until the discovery of oil and gas in the early 20th century. The discovery of oil and gas led to an economic boom in the county, and the population grew rapidly. The county continued to be an agricultural center, but the oil and gas industry provided a significant boost to the local economy.
In the late 20th century, the county experienced a decline in population as people moved away in search of better economic opportunities. The county has since seen a resurgence in population, as people have returned to take advantage of the county's agricultural and oil and gas industries.
Today, Floyd County is a rural county with a strong agricultural and oil and gas industry. The county is home to a variety of crops, cattle, and sheep, and is served by the Floydada Independent School District. The county is also home to several oil and gas fields, which provide jobs and revenue for the county.
Common Questions
What is Per Capita Income in Floyd County?
Per Capita income in Floyd County is $28,755.
What is the Median Family Income in Floyd County?
Median Family Income in Floyd County is $57,854.
What is the Median Household income in Floyd County?
Median Household Income in Floyd County is $49,321.
What is Income or Wage Gap in Floyd County?
Income or Wage Gap in Floyd County is 31.8%.
Women in Floyd County earn 68.2 cents for every dollar earned by a man.
What is Inequality or Gini Index in Floyd County?
Inequality or Gini Index in Floyd County is 0.54.
What is the Total Population of Floyd County?
Total Population of Floyd County is 5,386.
What is the Total Male Population of Floyd County?
Total Male Population of Floyd County is 2,644.
What is the Total Female Population of Floyd County?
Total Female Population of Floyd County is 2,742.
What is the Ratio of Males per 100 Females in Floyd County?
There are 96.43 Males per 100 Females in Floyd County.
What is the Ratio of Females per 100 Males in Floyd County?
There are 103.71 Females per 100 Males in Floyd County.
What is the Median Population Age in Floyd County?
Median Population Age in Floyd County is 35.7 Years.
What is the Average Family Size in Floyd County
Average Family Size in Floyd County is 3.3 People.
What is the Average Household Size in Floyd County
Average Household Size in Floyd County is 2.8 People.
How Large is the Labor Force in Floyd County?
There are 2,335 People in the Labor Forcein in Floyd County.
What is the Percentage of People in the Labor Force in Floyd County?
57.5% of People are in the Labor Force in Floyd County.
What is the Unemployment Rate in Floyd County?
Unemployment Rate in Floyd County is 4.1%.